Table of Contents
REGISTRATION STATEMENT PURSUANT TO SECTION 12(b) OR (g) OF THE SECURITIES EXCHANGE ACT OF 1934 |
ANNUAL REPORT PURSUANT TO SECTION 13 OR 15(d) OF THE SECURITIES EXCHANGE ACT OF 1934 |
TRANSITION REPORT PURSUANT TO SECTION 13 OR 15(d) OF THE SECURITIES EXCHANGE ACT OF 1934 |
SHELL COMPANY REPORT PURSUANT TO SECTION 13 OR 15(d) OF THE SECURITIES EXCHANGE ACT OF 1934 |
Title of each class |
Trading Symbol(s) |
Name of each exchange on which registered | ||
Ordinary Participation Certificates ( Certificados de Participación Ordinarios |
☒ |
Accelerated filer |
☐ |
Non-accelerated filer |
☐ | ||||||
Emerging growth company |
||||||||||
U.S. GAAP ☐ |
by the International Accounting Standards Board ☒ |
Other ☐ |
Table of Contents
Shaping the future together 20-F Report 2022
Table of Contents
TABLE OF CONTENTS
| PART I | ||||
| Item 1 — Identity of Directors, Senior Management and Advisors |
4 | |||
| 4 | ||||
| 4 | ||||
| 36 | ||||
| 146 | ||||
| 146 | ||||
| 243 | ||||
| 273 | ||||
| 275 | ||||
| 276 | ||||
| 278 | ||||
| Item 11 — Quantitative and Qualitative Disclosures About Market Risk |
292 | |||
| Item 12 — Description of Securities Other than Equity Securities |
292 | |||
| 292 | ||||
| 293 | ||||
| 293 | ||||
| 293 | ||||
| PART II | ||||
| 295 | ||||
| Item 14 — Material Modifications to the Rights of Security Holders and Use of Proceeds |
295 | |||
| 295 | ||||
| 296 | ||||
| 296 | ||||
| 296 | ||||
| 298 | ||||
| Item 16D — Exemptions from the Listing Standards for Audit Committees |
299 | |||
| Item 16E — Purchases of Equity Securities by the Issuer and Affiliated Purchasers |
299 | |||
| 299 | ||||
| 299 | ||||
| 302 | ||||
| Item 16I — Disclosure Regarding Foreign Jurisdictions that Prevent Inspections |
302 | |||
| PART III | ||||
| 303 | ||||
| 303 | ||||
| 303 | ||||
i
Table of Contents
INTRODUCTION
Cemex, S.A.B. de C.V. is incorporated as a publicly traded variable stock corporation (sociedad anónima bursátil de capital variable) organized under the laws of the United Mexican States (“Mexico”). Except as the context otherwise may require, references in this annual report to “Cemex,” the “Company,” “we,” “us” or “our” refer to Cemex, S.A.B. de C.V. and its consolidated entities. See note 1 to our 2022 audited consolidated financial statements included elsewhere in this annual report.
PRESENTATION OF FINANCIAL INFORMATION
The audited consolidated financial statements of Cemex, S.A.B. de C.V. included elsewhere in this annual report have been prepared in accordance with International Financial Reporting Standards (“IFRS”), as issued by the International Accounting Standards Board (“IASB”).
The regulations of the United States Securities and Exchange Commission (the “SEC”) do not require foreign private issuers that prepare their financial statements based on IFRS (as issued by the IASB) to reconcile such financial statements to United States Generally Accepted Accounting Principles (“U.S. GAAP”).
Unless otherwise indicated, references in this annual report to “$” and “Dollars” are to United States Dollars, references to “€” are to Euros, references to “£,” “Pounds Sterling” and “Pounds” are to British Pounds, and references to “Ps,” “Mexican Pesos” and “Pesos” are to Mexican Pesos. References to “billion” mean one thousand million. References in this annual report to “CPOs” are to Cemex, S.A.B. de C.V.’s Ordinary Participation Certificates (Certificados de Participación Ordinarios), each CPO represents two Series A shares (as defined below) and one Series B share (as defined below) of Cemex, S.A.B. de C.V. References to “ADSs” are to American Depositary Shares of Cemex, S.A.B. de C.V.; each ADS represents ten CPOs.
See notes 2.7, 17.1 and 17.2 to the 2022 audited consolidated financial statements of Cemex, S.A.B. de C.V. included elsewhere in this annual report for a detailed description of our debt and other financial obligations. Total debt plus other financial obligations differs from the calculation of debt under our main unsecured credit agreements, dated as of October 29, 2021, as amended and/or restated from time to time (the “2021 Credit Agreement”), dated as of December 23, 2021, as amended and/or restated from time to time (the “Mexican Peso Banorte Agreement”), and dated as of October 7, 2022, as amended and/or restated from time to time (the “2022 EUR Credit Agreement,” and collectively with the 2021 Credit Agreement and the Mexican Peso Banorte Agreement, the “Credit Agreements”). See “Item 5—Operating and Financial Review and Prospects—Liquidity and Capital Resources—Our Indebtedness” for more information.
During 2022, pursuant to tender offers and other market transactions, we partially repurchased different series of our notes for an aggregate notional amount of $1,172 million. The difference between the amount paid for such notes and the notional amount redeemed, net of transactional costs, generated a repurchase gain of $104 million, recognized in the statement of operations for the year ended December 31, 2022. On June 8, 2021, we issued $1,000 million of our 5.125% Subordinated Notes with no fixed maturity (the “5.125% Subordinated Notes”). Based on IFRS, the 5.125% Subordinated Notes qualify as equity instruments and are classified within controlling interest stockholders’ equity. See note 21.2 to the 2022 audited consolidated financial statements of Cemex, S.A.B. de C.V. included elsewhere in this annual report for a detailed description of the 5.125% Subordinated Notes.
We also refer in various places within this annual report to non-IFRS measures, including “Operating EBITDA,” “Operating EBITDA” equals operating earnings before other expenses, net, plus depreciation and amortization expenses, as more fully explained in “Item 5—Operating and Financial Review and Prospects—Results of Operations—Selected Consolidated Financial Information.” Additionally, we refer to “Operating EBITDA Margin,” which is calculated by dividing our “Operating EBITDA” by our revenues. The presentation
1
Table of Contents
of these non-IFRS measures is not meant to be considered in isolation or as a substitute for the 2022 audited consolidated financial results of Cemex, S.A.B. de C.V. prepared in accordance with IFRS as issued by the IASB.
We have approximated certain numbers in this annual report to their closest round numbers or a given number of decimal places. Due to rounding, figures shown as totals in tables may not be arithmetic aggregations of the figures preceding them.
2
Table of Contents
CERTAIN TECHNICAL TERMS
When used in this annual report, the terms set forth below mean the following:
| • | Aggregates are inert granular materials, such as stone, sand, and gravel, which are obtained from land- based sources (mainly mined from quarries) or by dredging marine deposits. They give ready-mix concrete its necessary volume and add to its overall strength. Under normal circumstances, one cubic meter of fresh concrete contains two tons of gravel and sand. |
| • | Cement is a binding agent which, when mixed with aggregates and water, produces either ready-mix concrete or mortar. |
| • | Cement mill (also called finish mill in the United States) is a piece of equipment used to reduce the size of the materials needed for cement production, usually to microns size (1 micron is equal to 0.001 millimeters). Traditionally, cement mills have adopted the form of ball mills. Vertical roller mills, which are more effective in terms of energy consumption compared to ball mills, are being gradually introduced to our operations in the United States, Mexico, the United Kingdom, the United Arab Emirates, and other regions in which we operate. |
| • | Clinker is an intermediate cement product made by sintering limestone, clay, and iron oxide in a kiln at around 1,450 degrees Celsius. One ton of clinker is used to make approximately 1.1 tons of gray portland cement. |
| • | Fly ash is a combustion residue from coal-fired power plants that can be used as a non-clinker cementitious material. |
| • | Gray Portland cement, used for construction purposes, is a hydraulic binding agent with a traditional composition by weight of approximately 95% clinker and up to 5% of a minor component (usually calcium sulfate). Blended portland cement has lower clinker factor, usually below 90%, which results in lower carbon dioxide (“CO2”) emissions. Both traditional and blended portland cement, when mixed with sand, stone or other aggregates and water, produce either concrete or mortar. |
| • | Petroleum coke or pet coke is a by-product of the oil refining coking process that can be incorporated into the cement production process as fuel, in substitution of fossil fuels such as natural gas or coal. |
| • | Ready-mix concrete is a mixture of cement, aggregates, admixtures and water. |
| • | Slag is the by-product of smelting ore to purify metals. |
| • | Tons means metric tons. One metric ton equals 1.102 short tons. |
| • | Urbanization Solutions is one of our four core businesses. It is a business that complements our value offering of products and solutions, looking to connect with the broader city ecosystem. It seeks to address urbanization challenges and provide means to all stakeholders in the construction value chain to enable sustainable urbanization by focusing on four market segments: performance materials, waste management, industrialized construction, and related services. |
| • | White cement is a specialty cement used primarily for decorative purposes. |
3
Table of Contents
PART I
Item 1 — Identity of Directors, Senior Management and Advisors
Not applicable.
Item 2 — Offer Statistics and Expected Timetable
Not applicable.
Item 3 — Key Information
Advancing our strategic priorities and being an industry leader
in the global transition to a lower-carbon and circular economy
During 2022, we made progress on our goal to optimize and rebalance our portfolio for growth by investing $474 million in strategic capital expenditures during 2022. Much of this investment was dedicated to our growth strategy of investing in bolt-on and margin enhancement projects as well as capacity additions. We estimate that our growth strategy resulted in a contribution of $100 million in incremental Operating EBITDA in 2022. Additionally, Operating EBITDA from our Urbanization Solutions core business was 21% higher in 2022 compared to 2021. In general, since 2020, we have invested more than $1 billion in strategic projects focused on accelerating growth. These investments are designed to allow us to achieve cost savings from operating efficiencies, advance our CO2 reduction goal, increase production capacity in supply-constrained markets, and drive growth in our Urbanization Solutions business. We plan to continue reorienting our portfolio more toward developed markets, particularly the U.S. and Europe, through the investments and strategic divestments we have executed, such as the divestment of our former operations in Costa Rica and El Salvador, among others.
In addition, to further fortify our balance sheet, we continue to focus mainly on the following three initiatives: (i) growing our Operating EBITDA through further cost-reduction efforts, operating efficiencies and customer-centric commercial strategies across all our core businesses; (ii) maximizing our free cash flow, which is expected to be used mainly for debt reduction and our bolt-on investments; and (iii) continuing to execute selective divestments by selling what we believe are non-essential assets, which would allow us to free up more free cash flow.
For the year ended December 31, 2022, we had net sales of $15.6 billion, which were higher than those for the year ended December 31, 2021, mainly driven by price increases across our products and services in all of the regions where we operate. During 2022, our pricing and cost mitigation efforts were able to offset much of the impact of inflation.
Strengthening our capital structure and deleveraging continues to be one of our top priorities. In response to significant market volatility, we also engaged in several liability management exercises, which included repurchasing some of our notes.
On April 13, 2022, Cemex consummated a cash tender offer and purchased $163,762,000 aggregate principal amount of the outstanding 5.200% Dollar-denominated Notes due 2030 (the “September 2030 Dollar Notes”), $108,648,000 aggregate principal amount of the outstanding 5.450% Dollar-denominated Notes due 2029 (the “November 2029 Dollar Notes”) and $156,178,000 aggregate principal amount of the outstanding 3.875% Dollar-denominated Notes due 2031 (the “July 2031 Dollar Notes”) validly tendered by holders of the tendered notes, and made a total payment of $419,293,717.35 (which included an early tender premium and accrued and unpaid interest) for such tendered notes, pursuant to the terms of an offer to purchase governing the tender offer.
4
Table of Contents
On April 27, 2022, Cemex, S.A.B. de C.V. consummated a cash tender offer and purchased $4,160,000 aggregate principal amount of the outstanding September 2030 Dollar Notes, $3,000,000 aggregate principal amount of the outstanding November 2029 Dollar Notes and $3,075,000 aggregate principal amount of the outstanding July 2031 Dollar Notes validly tendered by holders of the tendered notes after the early tender date and at or prior to the expiration date and made a total payment of $9,789,319.41 (which included accrued and unpaid interest) for such tendered notes, pursuant to the terms of an offer to purchase governing the tender offer.
On September 30, 2022, Cemex consummated a cash tender offer and purchased $291,177,000 aggregate principal amount of the July 2031 Dollar Notes, $81,944,000 aggregate principal amount of the September 2030 Dollar Notes and $94,955,000 of the November 2029 Dollar Notes validly tendered by holders of the tendered notes and made a total payment of $404,512,954.08 (which included an early tender premium and accrued and unpaid interest) for such tendered notes, pursuant to the terms of an offer to purchase and an offer to purchase supplement governing the tender offer.
On October 7, 2022, Cemex successfully closed the 2022 EUR Credit Agreement, a new €500 million three-year non-amortizing sustainability-linked term loan, the proceeds of which were used to repay other debt of the Company. The 2022 EUR Credit Agreement, which is denominated exclusively in Euros, has nearly identical terms and conditions as the other Credit Agreements, including guarantor structure, financial covenants and a parallel interest rate margin grid. The 2022 EUR Credit Agreement was issued under Cemex’s Sustainability-linked Financing Framework (the “Framework”), increasing the amount of debt that is linked to the company’s “Future in Action” program and its ultimate vision of a carbon-neutral economy. All sustainability-linked loans issued under the Framework have the same metrics and adjustments to the interest rate margin. In general, during 2022, we further aligned our funding strategy with our climate action roadmap through the 2022 EUR Credit Agreement and other financial efforts that we executed related thereto. As a result, as of the date of this report we have approximately 42% of our debt linked to sustainability key performance indicators (“KPIs”).
During 2022, we reduced total debt by $408 million and interest expenses by $45 million, compared to 2021. However, our leverage ratio, as calculated under the Credit Agreements, increased by 0.11x to 2.84x. As of December 31, 2022, we had decreased to $8,825 million (principal amount $8,870 million, excluding deferred issuance costs) our total debt plus other financial obligations in our statement of financial position (which does not include $1,000 million of 5.125% Subordinated Notes). As of December 31, 2022, 11% of our total debt plus other financial obligations was current (including current maturities of non-current debt) and 89% was non-current. As of December 31, 2022, 77% of our total debt plus other financial obligations was Dollar-denominated, 13% was Euro-denominated, 2% was Pound Sterling-denominated, 5% was Mexican Peso-denominated, 2% was Philippine Peso-denominated and 1% was denominated in other currencies. See notes 17.1 and 17.2 to our 2022 audited consolidated financial statements included elsewhere in this annual report.
In 2022, we also made significant advancements towards our climate action goals and our “Future in Action” program, focused on developing sustainable products and solutions, decarbonizing our operations, contributing to a circular economy, enhancing biodiversity, preserving water, and pursuing innovation and partnerships. Our 2030 climate action goals, which are aligned to CO2 reduction pathways in our industry, and our 2050 net-zero roadmap across the value chain were both validated by the Science Based Targets Initiative (“SBTi”) according to the 1.5°C scenario, during 2022. Most importantly, these goals should keep us on the right path to achieving our expected objective of delivering net-zero CO2 concrete globally by 2050. Also, during 2022, we enhanced the link between our executive compensation and our climate action goals. In order to meet our 2030 targets, yearly CO2 emission results will have an impact ranging from -10% to +10% on the total cash payout of the annual executive variable compensation of various of our executives eligible for variable compensation, including the Chief Executive Officer of the Company. See “Item 6—Directors, Senior Management and Employees—Board Practices—Variable Compensation Plan.”
As of 2022, we have reduced our specific net CO2 emissions by 30% as compared to our 1990 baseline, which we estimate puts us on track to achieve our goal of more than a 47% reduction by 2030.
5
Table of Contents
For 2022, our fuel mix consisted of 35% alternative fuels, a significant substitution rate for us. While our operations in Europe continue to lead with the highest substitution rate within our operations, we are moving to boost alternative fuel usage in all our other regions. Our operations in Mexico increased alternative fuel usage by 9% in 2022. This performance is supported by an increase of almost 6% in our use of alternative fuels and a reduction of 1.5% in our clinker factor during 2022.
Since 2019, we have used hydrogen injection to increase the use of alternative fuels and maximize thermal efficiency and, as of 2021, hydrogen is in use in all of our cement plants in Europe. At the end of 2022, approximately 44% of our clinker production used hydrogen injection technologies. We have also entered into partnerships to access new hydrogen injection technologies that should accelerate this strategy and allow us to further explore and scale the adoption of hydrogen in all of our operations while reducing the consumption of fossil fuels. Additionally, we have made progress in our clean electricity consumption strategy. As of the date of this annual report, 33% of our electricity supply is free of CO2 emissions, which we estimate should keep us on track to achieve our 2030 goal of having 65% of our electricity supply free of CO2 emissions.
Using biomass waste and non-recyclable materials to fuel our kilns is a key lever along our path to achieve our decarbonization goals. Not only does this activity benefit society by helping municipalities reduce waste going to landfills, but it also allows us to reduce our usage of expensive fossil fuels in our production processes. In 2022, our operations in Europe processed waste equivalent to the annual amount produced by a city the size of Madrid, achieving close to 70% alternative fuel substitution in the region, which is higher than the industry average. As of December 31, 2022, three of our cement plants were already producing cement with CO2 levels below 430 kg per ton, our new 2030 consolidated goal. As a result, our operations in Europe have achieved a 40% reduction in CO2 emissions as compared to our 1990 baseline. We are also boosting alternative fuel usage by injecting hydrogen into our cement kilns to optimize the process. After successfully implementing this technology in our plants in Europe, we have announced investments to implement hydrogen injection in four plants in Mexico in 2023, and expect to continue scaling its use in other operations worldwide.
In 2022, we launched Regenera, our new global waste management business, which is intended to further strengthen our capabilities and the circularity services we offer to our customers. Our aim is to increase by more than 50% the amount of waste and by-products we manage by 2030, with particular focus on (i) municipal and industrial waste; (ii) construction, demolition, and excavation waste; and (iii) other waste and industry by-products. Overall, in 2022, we estimate that we managed close to 27 million tons of waste, 67 times more than the non-recyclable waste we generated.
We believe that the success of our efforts will depend on the market’s reception to our lower-carbon products. Cemex estimates that, during 2022, Vertua-branded cement represented 41% of total cement volumes and Vertua-branded ready-mix represented 33% of total ready-mix volumes, a 14.8% and 16.1% year-over-year increase, respectively. Furthermore, we expanded our Vertua brand to include a comprehensive portfolio of products and solutions with sustainability attributes beyond a lower-carbon footprint, including water conservation, energy efficiency, recycled materials and efficient construction systems.
We also took significant steps in our innovation and partnership strategy, an important lever to reach our goal of net-zero CO2 by 2050. Among other initiatives, we are partnering with start-ups and leaders in the energy space on several carbon capture, utilization, and storage (“CCUS”) projects. We are also collaborating on transformative technologies for our industry, such as powering our kilns with solar heat or electricity and using CO2 for the production of value-added carbon nanomaterials, which are in growing demand in several traditional and high-tech industries. These partnerships, along with the capabilities of Cemex’s Global Research and Development, Cemex Ventures, and our internal “Smart Innovation” process, should be instrumental in developing our first net-zero CO2 plants by 2030.
6
Table of Contents
In 2022, we also advanced our social impact strategy, which allows us to contribute to the well-being of our communities in important areas such as affordable housing, education, employment capabilities, entrepreneurship, inclusion, environmental protection and community infrastructure. Overall, we have collaborated with over 26 million people globally, contributing to our goal of reaching 30 million community partners by 2030.
CEMEX Go, our end-to-end digital platform, is also an important enabler of our transition to a lower-carbon industry by better organizing supply chains, transitioning to a paperless industry, and increasing overall efficiency in the construction sector. CEMEX Go offers a digital customer experience to over 53,000 customers in 21 countries.
Furthermore, we continue to progress in our “Working Smarter” digital transformation initiative, through which Cemex is leveraging a combination of digital technologies, operative models and innovation from leading service suppliers in order to reshape its business management services.
7
Table of Contents
Risk Factors
We are subject to various risks mainly resulting from changing economic, environmental, political, industry, business, legal, regulatory, financial and climate conditions, as well as risks related to ongoing legal proceedings and investigations. The following risk factors are not the only risks we face, and any of the risk factors described below could significantly and adversely affect our business, liquidity, results of operations or financial condition, as well as, in certain instances, our reputation.
Risk Factor Summary
Risks Relating to Ownership of Our Securities
| • | Non-Mexicans may not hold Cemex, S.A.B. de C.V.’s Series A shares directly and must have them held in a trust at all times. |
| • | ADS holders may only vote the Series B shares represented by the CPOs deposited with the ADS depositary through the ADS depositary and are not entitled to vote the Series A shares represented by the CPOs deposited with the ADS depositary or to attend shareholders’ meetings. |
| • | Corporate rights may not be available to any person that acquires 2% or more of Cemex, S.A.B. de C.V.’s voting shares without the approval of Cemex, S.A.B. de C.V.’s Board of Directors. |
| • | Preemptive rights generally available under Mexican law may be unavailable to ADS holders. |
| • | The protections afforded to shareholders in Mexico are different from those in other countries and may be more difficult to enforce. |
Risks Relating to Our Business and Operations
| • | Economic conditions, including inflation, in countries where we operate and in other regions or countries have affected and may continue to adversely affect our business, financial condition, liquidity and results of operations. |
| • | The war between Russia and Ukraine may have a material adverse effect on our business, financial condition, liquidity and results of operation. |
| • | High energy and fuel costs have had and may continue to have a material adverse effect on our operating results. |
| • | We are subject to restrictions and reputational risks resulting from non-controlling interests held by third parties in our consolidated subsidiaries. As of the date of this annual report, we control three publicly listed companies, where this risk is heightened. |
| • | Our use of derivative financial instruments could negatively affect our net income and liquidity, especially in volatile and uncertain markets. |
| • | Political, social and geopolitical events, possible changes in public policies and other risks in some of the countries where we operate, which are inherent to the operations of an international company, could have a material adverse effect on our business, financial condition, liquidity and results of operations. |
| • | Complications in relationships with local communities may adversely affect our business continuity, reputation, liquidity and results of operations. |
| • | We are increasingly dependent on information technology and our systems and infrastructure, as well as those provided by third-party service providers, face certain risks, including cyber-security risks. |
| • | We may fail to secure certain materials required to run our business, which could have a material adverse effect on our business, financial condition, liquidity and results of operations. |
8
Table of Contents
| • | We may not be able to realize the expected benefits from any acquisitions or joint ventures, some of which may have a material impact on our business, financial condition, liquidity and results of operations. Any failure to realize expected benefits from the bolt-on acquisitions of our business strategy heightens this risk. |
| • | The introduction of or failure to introduce substitutes or alternative forms of cement, ready-mix concrete or aggregates into the market and the development of or failure to develop new construction techniques and technologies could have a material adverse effect on our business, financial condition, liquidity and results of operations. |
| • | We operate in highly competitive markets with numerous players employing different competitive strategies and if we do not compete effectively, our revenues, market share and results of operations may be affected. |
| • | A substantial amount of our total assets consists of intangible assets, including goodwill. We have recognized charges for goodwill impairment in the past and also in 2022, and if market or industry conditions deteriorate further, additional impairment charges may be recognized. |
| • | Activities in our business can be hazardous and can cause injury to people or damage to property in certain circumstances. |
| • | Our operations and ability to source products and materials can be affected by adverse weather conditions and natural disasters, including climate change, which could have a material adverse effect on our business, financial condition, liquidity and results of operations. |
| • | We could be adversely affected by any significant or prolonged disruption to our production facilities. |
| • | Labor activism and unrest, or failure to maintain satisfactory labor relations, could adversely affect our results of operations. |
| • | Our insurance coverage may not cover all the risks to which we may be exposed. |
| • | Our success depends on the leadership of Cemex, S.A.B. de C.V.’s Board of Directors and on key members of our executive management team and the availability of a specialized workforce. |
| • | Future pandemics and epidemics, such as the COVID-19 pandemic, could materially adversely affect our financial condition and results of operations. |
Risks Relating to Our Indebtedness and Certain Other Obligations
| • | The Credit Agreements, the indentures governing our outstanding 3.125% Euro-denominated notes due 2026 (the “March 2026 Euro Notes”), November 2029 Dollar notes, 7.375% Dollar-denominated notes due 2027 (the “June 2027 Dollar Notes”), September 2030 Dollar Notes and July 2031 Dollar Notes (collectively, the “Notes”) and our other debt agreements and/or instruments contain several restrictions and covenants. Our failure to comply with such restrictions and covenants or any inability to capitalize on business opportunities or refinance our debt resulting from them could have a material adverse effect on our business and financial conditions. |
| • | The elimination of the London Inter-Bank Offered Rate (“LIBOR”) after June 2023 may adversely affect our financial results. |
| • | We have a substantial amount of debt and other financial obligations. If we are unable to secure refinancing on favorable terms or at all, we may not be able to comply with our payment obligations upon their maturity. Our ability to comply with our principal maturities and financial covenants may depend on us implementing certain strategic initiatives, including, but not limited to, making asset sales, and there is no assurance that we will be able to implement any such initiatives or execute such sales, if needed, on terms favorable to us or at all. |
9
Table of Contents
| • | We may not be able to generate sufficient cash to service our indebtedness or satisfy our short-term liquidity needs, and we may be forced to take other actions to do so, which may not be successful. |
| • | Cemex, S.A.B. de C.V.’s ability to repay debt and pay dividends is highly dependent on our subsidiaries’ ability to transfer income and dividends to us. As of the date of this annual report, we control three publicly listed companies, where this risk is heightened. |
| • | We have to service part of our debt and other financial obligations denominated in Dollars and Euros with revenues generated in Mexican Pesos or other currencies, as we do not generate sufficient revenue in Dollars and Euros from our operations to service all our debt and other financial obligations denominated in Dollars and Euros. This could adversely affect our ability to service our obligations in the event of a devaluation or depreciation in the value of the Mexican Peso, or any of the other currencies of the countries in which we operate, compared to the Dollar and Euro. In addition, our consolidated reported results and outstanding indebtedness are significantly affected by fluctuations in exchange rates between the Dollar (our reporting currency) vis-à-vis the Mexican Peso and other significant currencies within our operations. |
| • | Increases in liabilities related to our pension plans could adversely affect our results of operations. |
Risks Relating to Regulatory and Legal Matters
| • | We are subject to the laws and regulations of the countries where we operate and do business and non-compliance, any material changes in such laws and regulations and/or any significant delays in assessing the impact and/or adapting to such changes in laws and regulations may have an adverse effect on our business, financial condition, liquidity and results of operations. |
| • | We or our third-party providers may fail to maintain, obtain, or renew or may experience material delays in obtaining requisite governmental or other approvals, licenses and permits for the conduct of our business. |
| • | We are subject to litigation proceedings, including, but not limited to, government investigations relating to corruption, antitrust and other proceedings, that could harm our business and our reputation. |
| • | We are subject to anti-corruption, anti-bribery, anti-money laundering, antitrust, anti-boycott, economic sanctions, trade embargoes, and export control laws and regulations in the countries in which we operate and do business, a considerable number of which are considered high and medium risk countries. Any violation of any such laws or regulations could have a material adverse impact on our reputation, results of operations and financial condition, as well as harm our reputation. |
| • | Certain tax matters may have a material adverse effect on our cash flow, financial condition and net income, as well as on our reputation. |
| • | Our operations are subject to environmental laws and regulations, including new and proposed reporting requirements, that are or could become increasingly stringent. |
| • | It may be difficult to enforce civil liabilities against us or the members of Cemex, S.A.B. de C.V.’s Board of Directors, our senior management and controlling persons. |
Risks Relating to Ownership of Our Securities
Non-Mexicans may not hold Cemex, S.A.B. de C.V.’s Series A shares directly and must have them held in a trust at all times.
Any person acquiring shares, CPOs or ADSs of Cemex, S.A.B. de C.V. should be aware that non-Mexican investors and Mexican companies without a foreign investment-exclusion clause in their by-laws may not directly hold the Series A shares underlying Cemex, S.A.B. de C.V.’s CPOs or ADSs, but may hold them indirectly through Cemex, S.A.B. de C.V.’s CPO trust. Upon the early termination or expiration of the term of
10
Table of Contents
Cemex, S.A.B. de C.V.’s CPO trust on September 6, 2029, the Series A shares underlying the CPOs held by non-Mexican investors or by Mexican companies without a foreign investment-exclusion clause in their by-laws must be placed into a new trust similar to the current CPO trust. We cannot guarantee that a trust similar to the CPO trust will exist or that the relevant authorization for the transfer of Cemex, S.A.B. de C.V.’s Series A shares to such a trust will be obtained. In that event, such investors might be required to sell their Series A shares to a Mexican individual or corporation that has a foreign investment-exclusion clause in its by-laws, which could expose shareholders to a loss in the sale of the corresponding Series A shares and may cause the price of Cemex, S.A.B. de C.V.’s CPOs and ADSs to decrease.
ADS holders may only vote the Series B shares represented by the CPOs deposited with the ADS depositary through the ADS depositary and are not entitled to vote the Series A shares represented by the CPOs deposited with the ADS depositary or to attend Cemex, S.A.B. de C.V.’s shareholders’ meetings.
Any person acquiring ADSs should be aware of the terms of the ADSs, the corresponding deposit agreement pursuant to which the ADSs are issued (the “Deposit Agreement”), the CPO Trust (as defined in the Deposit Agreement) and Cemex, S.A.B. de C.V.’s by-laws. Under such terms, in relation to shareholders’ meetings of Cemex, S.A.B. de C.V., a holder of an ADS has the right to instruct the ADS depositary to exercise voting rights only with respect to Series B shares represented by the CPOs deposited with the depositary, but not with respect to the Series A shares represented by the CPOs deposited with the depositary. ADS holders will not be able to directly exercise their right to vote unless they withdraw the CPOs underlying their ADSs (and, in the case of non-Mexican holders, even if they do so, they may not vote the Series A shares represented by the CPOs) and may not receive voting materials in time to ensure that they are able to instruct the depositary to vote the CPOs underlying their ADSs or receive sufficient notice of a shareholders’ meeting to permit them to withdraw their CPOs to allow them to cast their vote with respect to any specific matter. Holders of ADSs will not have the right to instruct the ADS depositary as to the exercise of voting rights in respect of Series A shares underlying CPOs held in the CPO Trust. Under the terms of the CPO Trust, Series A shares underlying CPOs held by non-Mexican nationals, including all Series A shares underlying CPOs represented by ADSs, will be voted by the Trustee (as defined in the Deposit Agreement), according to the majority of all Series A shares held by Mexican nationals and Series B shares voted at the meeting. In addition, the depositary and its agents may not be able to send out voting instructions on time or carry them out in the manner an ADS holder has instructed. As a result, ADS holders may not be able to exercise their right to vote and they may lack recourse if the CPOs underlying their ADSs are not voted as they requested. In addition, ADS holders are not entitled to attend shareholders’ meetings. ADS holders will also not be permitted to vote the CPOs underlying the ADSs directly at a shareholders’ meeting or to appoint a proxy to do so without withdrawing the CPOs. If the ADS depositary does not receive voting instructions from a holder of ADSs in a timely manner such holder will nevertheless be treated as having instructed the ADS depositary to give a proxy to a person we designate, or at our request, the corresponding CPO trust’s technical committee designates, to vote the Series B shares underlying the CPOs represented by the ADSs in his/her discretion. The ADS depositary or the custodian for the CPOs on deposit may represent the CPOs at any meeting of holders of CPOs even if no voting instructions have been received. The CPO trustee may represent the Series A shares and the Series B shares represented by the CPOs at any meeting of holders of Series A shares or Series B shares even if no voting instructions have been received. By so attending, the ADS depositary, the custodian or the CPO trustee, as applicable, may contribute to the establishment of a quorum at a meeting of holders of CPOs, Series A shares or Series B shares, as appropriate.
Corporate rights may not be available to any person that acquires 2% or more of Cemex, S.A.B. de C.V.’s voting shares without the approval of Cemex, S.A.B. de C.V.’s Board of Directors.
Cemex, S.A.B. de C.V.’s by-laws provide that its Board of Directors must authorize in advance any transfer of voting shares of its capital stock that would result in any persons, or groups acting in concert, becoming a holder of 2% or more of Cemex, S.A.B. de C.V.’s voting shares. In the event this requirement is not met, the persons acquiring such shares will not be entitled to any corporate rights with respect to such shares, such shares will not be taken into account for purposes of determining a quorum for shareholders’ meetings, Cemex, S.A.B.
11
Table of Contents
de C.V. will not record such persons as holders of such shares in its share registry and the registry undertaken by Indeval (as defined below) shall not have any effect.
Preemptive rights generally available under Mexican law may be unavailable to ADS holders.
ADS holders may be unable to exercise preemptive rights granted to Cemex, S.A.B. de C.V.’s shareholders, in which case ADS holders could be diluted following equity or equity-linked offerings. Under Mexican law, if Cemex, S.A.B. de C.V. issues new shares, Cemex, S.A.B. de C.V. would be generally required to grant preemptive rights to its shareholders, except in certain situations, including if such shares are issued in the context of a public offering or if such shares underlie convertible securities issued by Cemex, S.A.B. de C.V. However, ADS holders may not be able to exercise these preemptive rights to acquire new shares unless (i) Cemex, S.A.B. de C.V. files a registration statement with the SEC with respect to such shares or (ii) the offering of the shares qualifies for an exemption from registration under the U.S. Securities Act of 1933, as amended (the “Securities Act”). We cannot assure you that Cemex, S.A.B. de C.V. would file a registration statement in the United States that would allow holders of ADSs to participate in any preemptive rights offering. Under Mexican law, preemptive rights cannot be waived in advance or be assigned or be represented by an instrument that is negotiable separately from the corresponding shares. As a result of applicable United States securities laws, holders of ADSs may be restricted in their ability to exercise preemptive rights as provided in the Deposit Agreement with the ADSs depositary, as amended. Shares subject to a preemptive rights offering, with respect to which preemptive rights have not been exercised, may be sold by Cemex, S.A.B. de C.V. to third parties on the terms and conditions previously approved by Cemex, S.A.B. de C.V.’s shareholders or its Board of Directors. See “Item 10—Additional Information—Articles of Association and By-laws.”
The protections afforded to shareholders in Mexico are different from those in other countries and may be more difficult to enforce.
Under Mexican law, the protections afforded to shareholders are different from those in the United States and countries in continental Europe. In particular, the legal framework and case law pertaining to directors’ duties and disputes between shareholders and us, the members of Cemex, S.A.B. de C.V.’s Board of Directors or our officers are less protective of shareholders under Mexican law than under U.S. and continental European law. Mexican law only permits shareholder derivative suits (i.e., suits for our benefit as opposed to the direct benefit of our shareholders) and there are procedural requirements for bringing shareholder derivative lawsuits, such as minimum holdings, which differ from those in effect in other jurisdictions. There is also a substantially less active plaintiffs’ bar dedicated to the enforcement of shareholders’ rights in Mexico than in the United States or Europe. As a result, in practice it may be more difficult for our shareholders to initiate an action against us or our directors or obtain direct remedies than it would be for shareholders of a U.S. or European company.
Risks Relating to Our Business and Operations
Economic conditions, including inflation, in countries where we operate and in other regions or countries have affected and may continue to adversely affect our business, financial condition, liquidity and results of operations.
The economic conditions in some of the countries where we operate have had and may continue to have a material adverse effect on our business, financial condition, liquidity and results of operations worldwide. Our results of operations are highly dependent on the results of our operating subsidiaries worldwide, including those in the United States, Mexico, Europe, the Middle East, Africa and Asia (the “EMEAA”) region, and South America, Central America and the Caribbean (the “SCA&C”) region (as described in “Item 4—Information on the Company—Business Overview”).
For a geographic breakdown of our revenues for the year ended December 31, 2022, see “Item 4—Information on the Company—Geographic Breakdown of Revenues by Reportable Segment for the Year Ended December 31, 2022.”
12
Table of Contents
As of the date of this annual report, we believe that the main risk factors for the global economy and the countries where we operate include, but are not limited to: (i) monetary policies to reduce inflation could diverge from the optimal stance, increasing the risk of a recession or high inflation; (ii) policy paths in the largest economies could continue to diverge, leading to further Dollar appreciation with negative cross-border effects; (iii) energy and food price shocks might cause inflation to persist for longer and weigh on investment and productivity growth, raising additional roadblocks in the recovery path; (iv) global tightening of financing conditions could trigger widespread emerging market debt distress; (v) reduction in gas supplies from Russia or an escalation of the Russia-Ukraine war could depress output of gas in Europe; (vi) a resurgence in COVID-19 or any related COVID-19 strain, or new pandemics or epidemics, might further hinder growth; (vii) the rapid growth of cryptocurrencies without clear regulation could lead to financial instability with negative effects for the global economy; (viii) a worsening of China’s poverty sector crisis could spill over to the domestic banking sector and weigh heavily on the country’s growth, with negative cross-border effects; (ix) an increase in the spread and destructiveness of cyberattacks involving critical infrastructure could further delay the recovery of the global economy, particularly as teleworking and automation increase; (x) geopolitical risks like fragmentation could impede trade and capital flows, further hindering climate policy cooperation; and (xi) other geopolitical risks like the escalation of social unrest or more adverse climate shocks.
Since the beginning of 2022, inflation, as measured by the consumer price index has increased in advanced and emerging market economies, reached record highs in Europe and in the United States, driven mainly by supply chain issues (including input shortages, labor constrains, and rising commodity prices), an excess demand for goods and services and, since March 2022, a significant increase in energy and food prices, in part due to the war in Ukraine.
In this context, central banks worldwide have increased interest rates to try and reduce persistent high inflation, anchor inflation expectations and, in many cases, protect their own currencies from potential depreciation and market turmoil. Although inflation in 2023 is expected to be lower than in 2022, we cannot rule out other energy or food price shocks that could cause persistent inflation for longer. This environment of high inflation has caused, for the first time in years, a current account deficit in Europe, which could damage the value of the Euro if this situation persists.
High inflation can deteriorate economic conditions in the countries where we operate and has caused and may continue to cause a rise in the costs of manufacturing our products, as well as an increase in related expenses, such as freight related expenses. Furthermore, our operations, mainly those in the United States and Europe, have historically not experienced inflationary pressures, and thus there is no assurance that they will be well-prepared to cope with them. Inflation and its related effects could have a material adverse effect on our business, financial condition, liquidity, and results of operations. See “—High energy and fuel costs may have a material adverse effect on our operating results” for information on how energy and fuel costs affect the costs of manufacturing our products and related expenses.
On the other hand, central banks increasing interest rates to tighten monetary policy could fail to reduce inflation in the short term and be inclined to keep interest rates higher for longer, potentially causing deep damage to their economies (affecting the investment capacity of consumers and enterprises and damaging the purchasing power of consumers due to higher loan payments, causing governments to issue debt), enlarging and deepening a potential upcoming recession in Europe or the United States with potential spillovers worldwide. This global tightening of financing conditions could also trigger widespread emerging market debt distress, and could affect debt sustainability not only in emerging economies but also in developed countries with high debt levels. In addition, in Europe, the decision of the European Central Bank to reduce their balance sheet from March 2023 onwards could cause a credit spread crisis in the European periphery. This high interest rate environment could also limit our ability to access capital at reasonable terms or at all, and thus have a material adverse effect on our business, financial condition, liquidity, and results of operations.
Emerging markets and developing economies with significant foreign currency denominated-debt and financing needs could be particularly exposed and affected from the resulting effects of an environment of
13
Table of Contents
sustained higher interest rate such as capital outflows, exchange rate depreciations, shifts in investor sentiment and increasing borrowing costs, all of which lead to adverse growth outcomes. Similarly, large-scale corporate debt defaults or restructuring could reverberate widely. A substantial portion of our operations are located in developing countries which have shown to be negatively affected by capital outflows in the past and have volatile currency values. In the event that one or more of these risks materialize, demand for our products and services could decrease significantly due to a general deterioration in the economic conditions of these countries and/or our revenues and available resources in local currencies could depreciate significantly, which could limit our ability to satisfy our indebtedness and other obligations and/or incur expenditures and make investments in hard currency necessary to conduct our business, all of which could have a material adverse effect on our business, financial condition, liquidity, and results of operations. See “Geographic Breakdown of Revenues by Reportable Segment for the Year Ended December 31, 2022” and see “Item 5—Operating and Financial Review and Prospects—Liquidity and Capital Resources—Our Indebtedness.”
In the context of high inflation, high interest rates and low economic growth, social unrest could easily surge in countries where consumers’ purchasing power has been significantly damaged. Notwithstanding governmental plans to encourage economic growth, there is a risk that the lack of economic resources (like high debt, fiscal deficits and lack of access to financing), geopolitical tensions and political instability could make it difficult. Further intensification of social unrest could also damage economic sentiment and weigh on the economic recovery from the COVID-19 pandemic.
Climate change, one of the main causes of the more frequent and intense weather-related disasters, already has had visible immediate impacts, with effects beyond the regions where the disasters strike. Cross-border migration pressures, financial stresses (including among creditors and insurers in countries not directly impacted by a given event), and health care burdens may rise, with implications that persist long after the event itself. Disasters caused by climate change may pose further challenges to the global recovery.
Mexico’s economic recovery from the effects of the COVID-19 pandemic continued in 2022 mainly due to strong U.S. external demand, the remarkable remittance inflows and the “catch-up” momentum of domestic demand. Even though the Mexican economic activity reached its pre-pandemic levels in the third quarter of 2022, there are some sectors in which recovery is still lagging, such as the construction sector.
As of the date of this annual report, apart from the risks mentioned above, the Mexican economy faces other risks in the short term including, but not limited to: (i) a sharper than expected U.S. and global recession; (ii) monetary overtightening by the Mexican Central Bank due to a persistence of domestic inflationary pressures; (iii) higher pressures on public revenues and/or debt service costs might lead to the reallocation of budget funds and potential delays on non-priority infrastructure projects and housing programs; (iv) negative effects of the Mexican Peso’s abrupt depreciation on public and private debt trajectories; (v) a slowdown or pause of “nearshoring” dynamics; (vi) a possible downgrade of Petróleos Mexicanos’ (“PEMEX”) debt rating or further capital requirements to restructure PEMEX, which could negatively affect fiscal stability and Mexico’s sovereign debt rating; and (vii) the negative effects derived from uncertainty about institutional frameworks changes. Together or alone, these uncertainties and risks could have a material adverse impact on our financial condition, business and results of operations, particularly in Mexico.
In general, demand for our products and services is strongly related to construction levels and depends, in large part, on construction activity, as well as private and public infrastructure spending in the countries where we operate. Declines in the construction industry are usually correlated with declines in general economic conditions. As a result, the deterioration of economic conditions in the countries where we operate, could have a material adverse effect on our business, financial condition, liquidity and results of operations. There is no assurance that growth in gross domestic product (“GDP”) of the countries where we operate will translate into an increase in demand for our products. We are subject to the effects of general global economic and market conditions beyond our control. If these conditions are challenging or deteriorate, our business, financial condition, liquidity and results of operations could be adversely affected.
14
Table of Contents
The war between Russia and Ukraine may have a material adverse effect on our business, financial condition, liquidity and results of operation.
Global markets are experiencing volatility and disruption following the escalation of geopolitical tensions and the start of the war between Russia and Ukraine. In February 2022, Russia launched a full-scale military invasion of Ukraine. Although the length and impact of the ongoing military conflict is unpredictable, the conflict in Ukraine has created and could lead to further market disruptions, including significant volatility in commodity prices, credit and capital markets. After a year of conflict, hostilities continue to occur between Russia and Ukraine. As of the date of this annual report, comprehensive sanctions for Russian entities and officials have been enacted by the United States, the European Union (the “EU”), the United Kingdom, Switzerland, Japan, France, New Zealand, Australia, Canada, Germany and Poland, among others, mainly against Russia and Russian individuals and companies, including agreements to remove certain Russian financial institutions from the Society for Worldwide Interbank Financial Telecommunication payment system. A foreseeable peaceful resolution to this war is not expected to occur during 2023. The war is expected to have further global economic consequences, including, but not limited to, the possibility of severely diminished liquidity and credit availability, declines in consumer confidence, scarcity in certain raw materials and products, declines in economic growth, increases in inflation rates and uncertainty about economic and political stability. In addition, there is a risk that Russia and other countries supporting Russia in this conflict may launch cyber-attacks against the United States and its allies and other countries, their governments and businesses, including the infrastructure in such countries. Any of the foregoing consequences, including those we cannot yet predict, may have a material adverse effect on our business, financial condition, liquidity and results of operations.
High energy and fuel costs have had and may continue to have a material adverse effect on our operating results.
Energy and fuel costs represent an important part of our cost structure. The price and availability of energy and fuel are generally subject to market volatility and inflation, and have had, and may continue to have, an adverse impact on our costs and operating results. If third-party suppliers fail to provide to us the required amounts of energy or fuel under existing agreements, we may need to acquire energy or fuel at an increased cost from other suppliers to fulfill contractual commitments with third parties or for use in our operations. Governments in several countries in which we operate are working to reduce energy subsidies, introduce or tighten clean energy obligations or impose excise taxes and carbon emission caps, which could increase energy costs and have a material adverse effect on our business, financial condition, liquidity and results of operations.
Our commitment to transition to and increase the use of alternative energy sources and fuels may limit our flexibility to use energy sources and fuels that may be more cost-effective and require us to incur more in capital expenditures and investments than we currently have planned. However, if our efforts to increase our use of alternative fuels are unsuccessful, due to their limited availability, price volatility or otherwise, we would be required to use traditional fuels, which may be more expensive at any given time and increase our energy and fuel costs. Also, any such failure may cause us not to achieve the targets under our Future in Action climate action program and certain key performance indicators provided for in our sustainability-linked financing arrangements, which, among other adverse effects, would damage our reputation and give rise to an increase in our cost of capital. Any of this could have a material adverse effect on our business, financial condition, liquidity and results of operations. See “Item 4—Information on the Company—Regulatory Matters and Legal Proceedings—Environmental Matters—Mexico” and “Item 5—Operating and Financial Review and Prospects—Recent Developments—Recent Developments Relating to Our Regulatory Matters and Legal Proceedings—Environmental Matters—Mexico” for a description of certain changes in the laws and regulations governing the energy, electricity and hydrocarbons sectors which have been enacted or are undergoing constitutional challenges or approval procedures, and which may result in increased costs for our business, which may in turn have a material adverse effect on our business, financial condition, liquidity and results of operations. See “Item 3—Key Information—Risk Factors—Risks Relating to Our Business and Operations—Economic conditions, including inflation, in countries where we operate and in other regions or countries have affected and may continue to adversely affect our business, financial condition, liquidity and results of operations.” for more information on the current inflationary environment.
15
Table of Contents
The failure of any bank in which we deposit our funds could have an adverse effect on our financial condition.
We currently have cash and cash equivalents deposited in several financial institutions significantly in excess of federally insured levels. If any of the financial institutions in which we have deposited funds ultimately fails, we may lose our deposits over $250,000 at such financial institutions in the United States, or over different amounts in other countries in which we have bank accounts, and/or we may be required to move our accounts to another financial institution, which could cause operational difficulties, such as delays in making payments to our partners and employees, which could have an adverse effect on our business and financial condition.
We are subject to restrictions and reputational risks resulting from non-controlling interests held by third parties in our consolidated subsidiaries. As of the date of this annual report, we control three publicly listed companies, where this risk is heightened.
We conduct our business mostly through subsidiaries. In some cases, third-party shareholders hold non-controlling interests in these subsidiaries. Our most important subsidiaries in which third-party shareholders held non-controlling interests as of the date of this annual report are Cemex Holdings Philippines, Inc. (“CHP”), Trinidad Cement Limited (“TCL”) and Caribbean Cement Company Limited (“CCCL”), all of which are publicly listed companies. Various disadvantages may result from the participation of non-controlling shareholders whose interests may not be aligned with ours. Some of these disadvantages may, among other things, result in our inability to, or complicate our ability to, implement organizational efficiencies, divest or acquire assets, contribute capital to such publicly listed subsidiaries to achieve operational improvements, and transfer cash and assets from one subsidiary to another in order to allocate assets most effectively. In addition, we are also exposed to third-party shareholders initiating different actions or proceedings against us as controlling shareholders on corporate and corporate governance related matters, such as tender offer procedures, which could also harm our reputation and have an adverse effect on our business, liquidity, financial condition and results of operations.
Our use of derivative financial instruments could negatively affect our net income and liquidity, especially in volatile and uncertain markets.
We have used, and may continue to use, derivative financial instruments, mainly to manage the risk profile associated with interest rates and currency exposure of our debt, to reduce the volatility of our financing costs, to hedge the costs of fuel and other commodities and to hedge our net assets in certain currencies. However, we cannot assure you that our use of such instruments will allow us to achieve these objectives due to the inherent risks in any derivatives transaction or the risk that we will not continue to have access to such instruments at reasonable costs, or at all.
As of December 31, 2022, our derivative financial instruments consisted of Dollar/Mexican Peso foreign exchange forward and option contracts, both designated as a net investment hedge of Cemex’s net investment in Mexican Pesos. It also included interest rate swap instruments related to bank loans, Dollar/Mexican Peso call spread option contracts negotiated to maintain the value in Dollars over revenues generated in Mexican Pesos, as well as fuel price hedging derivatives, which had an impact on our financial position. Changes in the fair value of our derivative financial instruments, not specifically designated as hedges, are reflected in our statement of operations, which could introduce volatility in our controlling interest net income and other related ratios. As of December 31, 2021 and 2022, the aggregate notional amount under our outstanding derivative financial instruments was $2,911 million ($1,511 million of net investment hedge, $1,005 million of interest rate swaps, $250 million of foreign exchange options and $145 million of fuel price hedging) and $2,491 million ($837 million of net investment hedge, $1,018 million of interest rate swaps, $136 million of fuel price hedging and $500 million of foreign exchange options), respectively, with a mark-to-market valuation representing net assets of $21 million as of December 31, 2021 and net assets of $32 million as of December 31, 2022. See note 17.4 to Cemex, S.A.B. de C.V.’s 2022 audited consolidated financial statements included elsewhere in this
16
Table of Contents
annual report for a detailed description of our derivative financial instruments. As of December 31, 2022, Cemex’s risk of cash margin calls with respect to our existing financial derivatives is not material. However, if we enter into new derivative financial instruments, we may incur net losses and be subject to margin calls requiring a substantial amount of cash to be covered and may reduce the funds available to us for our operations or other capital needs. In addition, as with any derivative position, we assume the creditworthiness risk of the counterparty, including the risk that the counterparty may not honor its obligations to us. In addition, entering into new derivative financial instruments incurs costs, and we cannot assure you that any new derivative financial instrument that we enter into will be done so at reasonable costs or will be available to us at all.
Political, social and geopolitical events, possible changes in public policies and other risks in some of the countries where we operate, which are inherent to the operations of an international company, could have a material adverse effect on our business, financial condition, liquidity and results of operations.
As of December 31, 2022, our operations were mostly in Mexico, the United States, certain countries in the EMEAA region and the SCA&C region (as described in “Item 4—Information on the Company—Business Overview”). For a geographic breakdown of our revenues for the year ended December 31, 2022, see “Item 4—Information on the Company—Geographic Breakdown of Revenues by Reportable Segment for the Year Ended December 31, 2022.”
We are exposed to the circumstances prevalent in the countries in which we market our products and services. Like other companies with international operations, political, economic, geopolitical or social developments in the countries where we operate or elsewhere, such as elections, new governments, changes in public policy, economic circumstances, laws and/or regulations, trade policies, political agreements or disagreements, civil disturbances and a rise in violence or the perception of violence, could have a material adverse effect in the countries where we operate or on the global financial markets, and in turn on our business, financial condition, liquidity and results of operations.
Presidential, legislative, state and local elections took place in 2022 in several of the countries where we operate, including Mexico, France, Colombia, the United States, the Philippines and Barbados. In addition, future snap elections cannot be discarded. A change in federal or national government and the political party in control of the legislature in any of these countries could result in changes to the countries’ economic, political or social conditions, and in changes to laws, regulations and public policies, which may contribute to economic uncertainty or adverse business conditions and could also materially impact our business, financial condition, liquidity and results of operations. Similarly, if no political party wins a clear majority in the legislative bodies of these countries, legislative gridlock and political and economic uncertainty may continue or result.
Political events and social unrest have impacted the business and economic environment in the United States and beyond. The 2022 U.S. midterm elections resulted in changes to the controlling political party in the lower chamber of the U.S. Congress and, in turn, may result in potential changes to, and delays in, the U.S. federal government’s policy priorities and legislative endeavors. The new Congress could impose regulations and/or taxes reaching further than those currently in effect. We are not certain if any such regulations and/or taxes will be imposed or not; and, in the event they are imposed, if costs and expenses which may be incurred in order to comply with such regulations and/or taxes would have a material adverse effect on our business, financial condition, liquidity and results of operations. Additionally, the new Congress could suffer gridlock, for instance, in raising the U.S. government’s federal debt ceiling.
In Mexico, several laws, policies and regulations issued since the beginning of the current administration, as well as certain legislative proposals, differ substantially from those in effect in previous administrations. Additionally, emission caps per industrial sector in line with Mexico’s greenhouse gas emissions reduction targets are expected to come into effect in 2024. See “Item 4—Information on the Company—Regulatory Matters and Legal Proceedings—Environmental Matters—Mexico” and “Item 5—Operating and Financial Review and Prospects—Recent Developments—Recent Developments Relating to Our Regulatory Matters and
17
Table of Contents
Legal Proceedings—Environmental Matters—Mexico” for a description of such changes in the laws and regulations governing the energy, electricity and hydrocarbons sectors which have been enacted or are undergoing constitutional challenges, as well as a description of potential emission caps regulations in Mexico. We are not certain if such laws and regulations undergoing constitutional challenges will prevail. Additionally, an increase of “green” taxes in states where we operate is also expected. These and any other policies, laws and regulations which are further adopted could result in a deterioration of investment sentiment, political and economic uncertainty, and increased costs for our business, which may in turn have a material adverse effect on our business, financial condition, liquidity and results of operations.
In Europe, though Brexit has already materialized, there continues to be uncertainty regarding the United Kingdom’s future relationship with the European Union and other key partners around the world. This uncertainty could still have a material adverse effect on our business, financial condition, liquidity and results of operations, particularly in the United Kingdom. To mitigate any such risk, a “Brexit taskforce” has been implemented and continues to operate with the following objectives: (i) monitoring and sharing relevant public information, (ii) identifying ongoing and evolving risks and opportunities, (iii) assessing potential impacts and action plan to minimize them, (iv) following-up with affected areas, and (v) preparing an effective communication for different audiences. As of the date of this annual report, the Brexit taskforce has been working, aligned with United Kingdom government guidelines, on critical issues to potentially anticipate and avoid a business disruption resulting from Brexit. These issues include: (i) the new chemical regulations and the Registration, Evaluation, Authorization and Restriction of Chemicals registry requirements for imported products, (ii) identifying commercial products being placed on the market in Great Britain with the previously used “CE” (conformité européenne) marking that will require U.K. Conformity Assessed marking in 2022, (iii) complying with the specific tariffs on imported goods through a new Economic Operators’ Registration and Identification number applicable to all of our operation sites in the United Kingdom, and (iv) supporting our employees living in the United Kingdom which do not have citizenship status with the preparation and filing of their settlement scheme application. The United Kingdom and the European Union have reached agreements in several matters to continue diplomatic relations, such as trade and travel. The withdrawal from either party from any of the agreements may have a material adverse effect on our business, financial condition, liquidity and results of operations.
Our operations in Egypt, the UAE and Israel have experienced disruption as a result of, among other things, political instability, civil unrest, terrorism, extremism, deterioration of general diplomatic relations and changes in the geopolitical dynamics in the region. There can be no assurances that political turbulence in Israel, Egypt, Iran, Iraq, Syria, Libya, Yemen and other countries in Africa, the Middle East and Asia will abate in the future or that neighboring countries (e.g., the United Arab Emirates) will not be drawn further into conflict or experience instability. In addition, some of our operations are or may be subject to political risks, such as confiscation, expropriation and/or nationalization, as for example was the case of our past operations in Venezuela and is currently the case in Egypt. See “Item 4—Information on the Company—Regulatory Matters and Legal Proceedings—Other Legal Proceedings—Egypt Share Purchase Agreement.”
Our operations are also exposed to the Israeli-Palestinian conflict. Confrontations between the Israeli Defense Force and Palestinians in the Gaza Strip have continued generating events of violence in the region. Progress on peace remains stalled, despite efforts from third parties to reach an agreement. As of the date of this annual report, the parties continued to portray opposite views over the contested territory and neither side is expected to make concessions in the near future. If the conflict escalates, it could have a negative impact on the geopolitics and economy of the region, which in turn could adversely affect our operations, financial condition, liquidity and results of operations. In November 2022, Israel held legislative elections to constitute the 25th congress of Israel, marking the fifth general election held in the past three years. The previous election and successive negotiations resulted in the formation of a coalition government in June 2021. Nonetheless, a bill was introduced in June 2022 to dissolve the congress and call for a new election in November 2022. Political instability related to the governmental transition and disputes within the governing coalition could have an adverse effect on our business, financial condition, liquidity, and results of operations in Israel. Increased
18
Table of Contents
tensions in the Middle East could pose the risk of full military action and could have a material adverse effect on our business, financial condition, liquidity and results of operations, most importantly in Israel and the UAE.
In Asia, pro-democracy protests and demands, mainly in Hong Kong, ongoing disputes between North and South Korea, as well as territorial disputes among several Southeast Asian countries and China in the South China Sea continue to be a cause for social, economic and political uncertainty and instability in the region. A major outbreak of hostilities or political upheaval in China, Hong Kong, Taiwan, North Korea, South Korea or any other Asian nation could adversely affect the global economy, which could have a material adverse effect on our business, financial condition, liquidity or results of operations.
In Latin America, discontent with politicians, corruption, poverty, and inequality have been cause for numerous protests and general social unrest. Protests have sparked throughout the region in countries such as Haiti, Colombia, Guatemala, Costa Rica, Peru and others. Furthermore, the region continues to be affected by Venezuela’s economic and political crisis, which has had a major impact on the regional economy and poses an important economic, social and security risk.
Further geopolitical challenges, such as the conflict between the United States and China, could cause important disruptions in the global economic, financial markets and trade dynamics which could impact the markets in which we operate and materially and adversely affect our business, financial condition, liquidity and results of operations.
There have been terrorist attacks and ongoing threats of future terrorist attacks in countries in which we operate. We cannot assure you that there will not be new attacks or threats that will cause any damage to our operating units and facilities or locations, or harm any of our employees, including members of Cemex, S.A.B. de C.V.’s Board of Directors or senior management, or lead to an economic contraction, financial markets volatility or erection of material barriers to trade in any of our markets. An economic contraction in any of the markets where we operate could affect domestic demand for our products, which could have a material adverse effect on our business, financial condition, liquidity and results of operations.
As part of our risk governance approach, from time to time we evaluate the need to address the financial consequences of political or social risk through the purchase of insurance. As a result, we purchase certain types of political risk insurance policies for selected countries where we operate, and which are exposed to political turmoil, geopolitical issues or political uncertainty. These insurance policies are designed to offer some assistance to our financial flexibility to the extent that the specifics of a political incident could give rise to a financial liability. However, we cannot assure you that a given social or political event and possible changes in government policies will be covered by the political risk insurance policies we have in place, or that the amount of such insurance will be sufficient to offset the liability arising from such applicable events. Any such liability could have a material adverse effect on our business, financial condition, liquidity and results of operations.
These and other political, economic, social and geopolitical issues have the potential to materially and adversely impact the global economy, financial markets and the overall stability of the countries and regions in which we operate and, in turn, our business, financial condition, liquidity and results of operations.
Complications in relationships with local communities may adversely affect our business continuity, reputation, liquidity, and results of operations.
We make efforts to maintain good long-term relationships and continuous communication with local and neighboring communities where we operate; however, there can be no assurance that such communities will not have or will not develop interests or objectives which are different from, or even in conflict with, our objectives, which could result in legal or administrative proceedings, civil unrest, protests, negative media coverage, direct action or campaigns, including, but not limited to, requests for the government to revoke or deny our concessions, licenses or other permits to operate. Any such events could cause delays or disruptions in our
19
Table of Contents
operations, result in operational restrictions or higher costs, or cause reputational damage, which could materially and adversely affect our business, reputation, liquidity and results of operations. See “Item 4—Information on the Company—Regulatory Matters and Legal Proceedings—Environmental Matters—Philippines Environmental Class Action.”
We are increasingly dependent on information technology and our systems and infrastructure, as well as those provided by third-party service providers, face certain risks, including cyber-security risks.
We increasingly rely on a variety of information technology and cloud services, on a fully digital customer integration platform, such as CEMEX Go, and on automated operating systems to manage and support our operations, as well as to offer our products to our customers. The proper functioning of this technology and these systems is critical to the efficient operation and management of our business, as well as for the sales generated by our business. Our systems and technologies may require modifications or upgrades as a result of technological changes, growth in our business and to enhance our business security. These changes may be costly and disruptive to our operations and could impose substantial demands on our systems and increase system outage time. Our systems and technology, as well as those provided by our third-party service providers, such as International Business Machines Corporation (“IBM”), Microsoft and HCL Technologies, among others, may be vulnerable to damage, disruption or intrusion caused by circumstances beyond our control, such as physical or electronic break-ins, catastrophic events, power outages, natural disasters, computer system or network failures, security breaches, computer viruses and cyber-attacks, including malicious codes, worms, ransomware, phishing, denial of service attacks and unauthorized access. For example, our digital solutions to improve sales, customer experience, enhance our operations and increase our business efficiencies could be impeded by such damages, disruptions or intrusions. Furthermore, while we expect to further integrate digital technologies into our operations as part of our Working Smarter digital transformation initiative and believe this is likely to assist us in fulfilling our strategic priorities, these integration efforts and the engagement of additional technology service providers and systems in our operations as part of Working Smarter could increase our exposure to these risks. See “Item 4—Information on the Company—Our Strategic Priorities—Operational Improvements” for more information on Working Smarter and the related technologies, service providers and systems engaged as part of this digital transformation initiative. To try to minimize such risks, we safeguard our systems and electronic information through a set of cyber-security controls, processes, and a proactive monitoring service to attend to potential breaches. In addition, we also have disaster recovery plans in case of incidents that could cause major disruptions to our business. However, these measures may not be sufficient, and our systems have in the past been subject to certain minor intrusions that did not result in a material breach or material impact to the Company, including distributed denial of service attacks, unauthorized access attempts, brute force attacks and phishing. Although, as of the date of this annual report, we are certified under and compliant with International Organization for Standardization (“ISO”) 27001:2013 standards for information security management systems to preserve the confidentiality, integrity and availability of data and also are certified on the Payment Card Industry security standard which provides a trustful e-commerce mechanism for customers, and the majority of our cement plants received the ISO 27001 certification, we cannot assure that we will always be able to retain or renew this certification or that our systems will not be subject to certain intrusions. In a global business environment that relies on complex digital networks, cybercriminals are often outpacing a company’s ability to prevent and manage cyberthreats. The digitalization of global supply chains creates new risks as they increasingly rely on technology and other third parties.
During 2022, there was a global trend of an increase in security threats, including, but not limited to, phishing and malware/ransomware campaigns, exploitation of video collaboration vulnerabilities, among other things. Furthermore, the increase in employees working from home increased cyber risk due to inadequate security configurations of domestic (home) networks and use of non-corporate devices. As of the date of this annual report, we have implemented additional cybersecurity technology and controls designed to reduce such risks and mitigate the impact of such risks, but these may also not be sufficient, and we cannot assure you that intrusions will not occur.
20
Table of Contents
In relation to our overall operations, particularly due to our digital transformation efforts and the implementation of CEMEX Go, Cemex, S.A.B. de C.V.’s Audit Committee is informed of the cyber-security threats we face and is involved in approving general steps to try to mitigate any such cyber-security threats. As of December 31, 2022, CEMEX Go had more than 53,000 customers across the countries in which we do business, and through CEMEX Go we receive approximately 50% of our main product orders and process 60% of our total global sales. As of December 31, 2022, we have not detected, and our third-party service providers have not informed us of, any relevant event that has materially damaged, disrupted or resulted in an intrusion of our systems. Any significant information leakages or theft of information, or any unlawful processing of personal data, could affect our compliance with data privacy laws and make us subject to regulatory action, including substantial fines and private litigation with potentially large costs, and could damage our relationship with our employees, customers and suppliers, which could have a material adverse impact on our business, financial condition, liquidity, results of operations and prospects.
Furthermore, in June 2022, our insurance program was renewed for 12 additional months. This program includes insurance coverage that, subject to its terms and conditions, is intended to address certain costs associated with cyber incidents, network failures and data privacy-related concerns. Nevertheless, this insurance coverage may not, depending on the specific facts and circumstances surrounding an incident, cover all losses or types of claims that may arise from an incident or the damage to our reputation or brands that may result from an incident. However, any significant disruption to our systems could have a material adverse effect on our business, financial condition, liquidity and results of operations, and could also harm our reputation.
We may fail to secure certain materials required to run our business, which could have a material adverse effect on our business, financial condition, liquidity and results of operations.
We increasingly use in most of our business certain by-products of industrial processes produced by third parties, such as pet coke, fly ash, slag and synthetic gypsum, among others, as well as natural resources such as water. While we are not dependent on any particular suppliers, we try to secure the supply of the required materials, products or resources through long-term renewable contracts and framework agreements, which allow us to better manage supplies. Short-term contracts are entered into in certain countries where we operate. Should existing suppliers cease operations or reduce or eliminate production of these by-products, or should for any reason any suppliers not be able to deliver to us the contractual quantities, or should laws and/or regulations in any region or country limit the access to these materials, products, reserves or resources, sourcing costs for these materials could increase significantly or require us to find alternative sources for these materials, which could have a material adverse effect on our business, financial condition, liquidity, results of operations and prospects. In particular, scarcity and quality of natural resources (such as water and aggregates reserves) in some of the countries where we operate could have a material adverse effect on our operations, costs and results of operations.
We may not be able to realize the expected benefits from any acquisitions or joint ventures, some of which may have a material impact on our business, financial condition, liquidity and results of operations. Any failure to realize expected benefits from the bolt-on acquisitions of our business strategy heightens this risk.
Our ability to realize the expected benefits from any acquisitions, joint ventures, investments or partnerships depends, in large part, on our ability to integrate acquired operations with our existing operations in a timely and effective manner or on our ability to impact financial results or operations of or properly manage, together with any partners, any joint venture business, partnership or other business where we hold an investment. These efforts may not be successful. Although we have disposed of assets in the past and may continue to do so to reduce our overall leverage and rebalance our portfolio, certain of our debt instruments restrict our ability to acquire assets and enter into joint ventures. We may in the future acquire new operations or enter into joint ventures or investments and integrate such operations or assets into our existing operations, and some of such acquisitions, joint ventures or investments may have a material impact on our business, financial condition,
21
Table of Contents
liquidity and results of operations. We cannot assure you that we will be successful in identifying or acquiring suitable assets in the future, or that the terms under which we may acquire any assets or enter into joint ventures in the future would be favorable to us or that we will be able to find suitable partners for our joint ventures at all.
We may also fail to achieve any anticipated cost savings from any acquisitions, joint ventures or investments. We have announced that the portfolio optimization efforts to grow Operating EBITDA that are a part of our strategic priorities are expected to include a variety of bolt-on investments, divestments and acquisitions, which included acquisitions in different geographies like France, Spain and Texas in 2021 and divestments in geographies like Costa Rica and El Salvador in 2022, which we expect to continue in 2023. Failure to realize the expected benefits from these acquisitions, if at all made, would cause us to not achieve certain of our strategic goals and, in turn, our business, financial condition, liquidity and results of operations could be materially and adversely affected.
The introduction of or failure to introduce substitutes or alternative forms of cement, ready-mix concrete or aggregates into the market and the development of or failure to develop new construction techniques and technologies could have a material adverse effect on our business, financial condition, liquidity and results of operations.
Materials such as plastic, aluminum, ceramics, glass, wood and steel can be used in construction as a substitute for cement, ready-mix concrete or aggregates. In addition, other construction techniques, such as the use of dry wall, and the integration of new technologies in the construction industry, such as 3-D printing, mini-mills and mobile plants, and changes in housing preferences could adversely impact the demand and price for our cement, ready-mix concrete and/or aggregates. Furthermore, research aimed at developing new construction techniques and modern materials and digitalizing the construction industry may introduce new products and technologies in the future that could reduce the demand for and prices of our products. Our efforts to introduce new products or products with non-traditional compositions (such as our Vertua family of products and those with reduced cement or clinker content introduced in 2021) or to develop and market new construction techniques and technologies (such as those that are part of our Urbanization Solutions) are not only aimed at increasing our operating results, but are also relevant to achieve the targets of our Future in Action program and certain key performance indicators provided for in our sustainability-linked financing arrangements. Therefore, if our efforts to introduce these products and construction techniques and technologies are unsuccessful or unprofitable, among other adverse effects, this would damage our operating results, reputation and give rise to an increase in our cost of capital. Any of this, individually or in the aggregate, could have a material adverse effect on our business, financial condition, liquidity and results of operations.
We operate in highly competitive markets with numerous players employing different competitive strategies and if we do not compete effectively, our revenues, market share and results of operations may be affected.
The markets in which we operate are highly competitive and are served by a variety of established companies with recognized brand names, as well as new market entrants and increasing imports. Companies in these markets compete based on a variety of factors, often employing aggressive pricing strategies to gain market share. For example, in the relatively consolidated cement and ready-mix concrete industries, we generally compete based on quality, client segmentation, value proposition, and superior customer experience. In the more fragmented market for aggregates, we generally compete based on capacity, price for our products and our customer centric culture. In certain areas of the markets in which we compete, some of our competitors may be more established, benefit from greater brand recognition or have greater manufacturing and distribution channels and other resources than we do or offer a better customer experience than we do. In addition, if our competitors were to combine, they may be able to compete more effectively with us, and they may also dispose of assets, which could lead to new market entrants, increasing competition in our markets. In the last year, mergers and acquisitions transactions played an important role in the markets where we operate. For example, in 2022, HeidelbergCement sold its Southern Spain business, including its integrated cement plant in Malaga and several
22
Table of Contents
sites in Andalusia to Votorantim Cimentos. This divestment complements a series of divestments made by HeidelbergCement in Spain, which include Asturias, Balearics, and Catalonia, with the business in Spain announced to be divested during 2023. We have substantial operations in Spain and it is unclear how competitive dynamics will change in these or other regions of the Iberian country following this transaction. Even though we have generally been able to compete effectively in Spain, these shifts in market participants in the markets where we participate could be detrimental to our position. In the United States, in late 2022, Holcim announced the acquisition of Polymers Sealants North America (“PSNA”), a company focused on coating, adhesive and sealant solutions with a presence in California, Arizona, Texas, Georgia and other states. This acquisition enables Holcim to expand its solutions and products division, which will further diversify their product portfolio and their applications. Cemex has a presence in several of the states in which PSNA has a presence, effectively modifying competitive dynamics in these markets, which could be detrimental to our position. We believe that Elementia Materiales and Holcim, which have operations in Mexico, the United States and Latin America, offer products and services that could increase competition with our Urbanization Solutions business in those markets. In addition, if any of our major competitors divest assets in different parts of the world, this may lead to increased competition in the markets in which we operate. It is unclear how competitors that could potentially acquire those assets will compete in the markets in which we operate. Some may use aggressive competitive strategies based on imports and pricing that could be damaging to our industry’s profitability and, as a consequence, our results of operations. In addition, asset optimization by buyers of the disposed assets could result in an operational cost advantage. As a result, if we are not able to compete effectively, we may lose market share, potentially substantially, in the countries in which we operate, and our revenues could decline or grow at a slower rate and our business and results of operations would be harmed, which could have a material adverse effect on our business, financial condition, liquidity and results of operations.
A substantial amount of our total assets consists of intangible assets, including goodwill. We have recognized charges for goodwill impairment in the past and also in 2022, and if market or industry conditions deteriorate further, additional impairment charges may be recognized.
Our 2022 audited consolidated financial statements included elsewhere in this annual report, have been prepared in accordance with IFRS as issued by the IASB, under which goodwill is not amortized and is tested for impairment. Tests for impairment are carried out when indicators exist or at least once a year during the fourth quarter of each year and are performed by determining the value-in-use of its groups of cash-generating units (“CGUs”) to which goodwill balances have been allocated. The recoverable amount of CGUs consists of the higher of such groups of cash-generating units’ fair value, less cost to sell, and their corresponding value in use, represented by the discounted amount of estimated future cash flows expected to be generated by such groups of CGUs to which goodwill has been allocated. An impairment loss is recognized under IFRS if the recoverable amount is lower than the net book value of the groups of CGUs to which goodwill has been allocated within other expenses, net. We determine the discounted amount of estimated future cash flows over periods of five years. If the value in use of a group of CGUs to which goodwill has been allocated is lower than its corresponding carrying amount, we determine its corresponding fair value using methodologies generally accepted in the markets to determine the value of entities, such as multiples of Operating EBITDA and/or by reference to market transactions.
Impairment tests are significantly sensitive to, among other factors, the estimation of future prices of our products, in the development of operating expenses, local and international economic trends in the construction industry, the long-term growth expectations in the different markets, as well as the discount rates and the growth rates in perpetuity applied. For purposes of estimating future prices, we use, to the extent available, historical data plus the expected increase or decrease according to information issued by trusted external sources, such as national construction or cement producer chambers and/or in governmental economic expectations. Operating expenses are normally measured as a constant proportion of revenues, following experience. However, such operating expenses are also reviewed considering external information sources in respect of inputs that behave according to international prices, such as oil and gas. We use specific pre-tax discount rates for each group of CGUs to which goodwill is allocated, which are applied to pre-tax cash flows. The amounts of estimated
23
Table of Contents
undiscounted cash flows are significantly sensitive to the growth rates in perpetuity applied. The higher the growth rate in perpetuity applied, the higher the amount of undiscounted future cash flows by group of CGUs obtained. Moreover, the amounts of discounted future cash flows are significantly sensitive to the weighted average cost of capital (discount rate) applied. The higher the discount rate applied, the lower the amount of discounted estimated future cash flows by group of CGUs obtained. During the fourth quarter of 2022, as part of our yearly impairment test, we recognized a non-cash aggregate goodwill impairment charge of $365 million, of which $273 million related to our business in the United States and $92 million related to our business in Spain. In both cases, the related book value of the operating segment exceeded the corresponding value-in-use. The impairment losses in 2022 are mainly related to the significant increase in the discount rates as compared to 2021 and the resulting significant decrease in our projected cash flows in these segments considering the global high inflationary environment, which increased the risk-free rates, and the material increase in the funding cost observed in the industry during the period. See notes 7, 16.1 and 16.2 to Cemex, S.A.B. de C.V.’s 2022 audited consolidated financial statements included elsewhere in this annual report. Considering the important role that economic factors play in testing goodwill for impairment, we cannot assure that any downturn in the economies where we operate will not necessitate further impairment tests and a possible downward readjustment of our goodwill for impairment under IFRS. Such an impairment test could result in impairment charges which could be material to our financial statements, which could have a material adverse effect on our financial condition.
Activities in our business can be hazardous and can cause injury to people or damage to property in certain circumstances.
Most of our production facilities and units, as well as mineral extraction locations, require individuals to work with chemicals, equipment and other materials that have the potential to cause fatalities, harm and injury when used without due care. An accident or injury that occurs at our facilities could result in disruptions to our business and operations and could have legal and regulatory, as well as reputational, consequences. As a result, we may be required to compensate such individuals or incur other costs and liabilities, any and all of which could have a material adverse impact on our reputation, business, financial condition, liquidity, results of operations and prospects.
Additionally, cement production raises a number of health and safety issues. As is the case with other companies in our industry, some of our aggregate products contain varying amounts of crystalline silica, a common mineral. Also, some of our construction and material processing operations release, as dust, crystalline silica that is in the materials being handled. Excessive, prolonged inhalation of very small-sized particles of crystalline silica has allegedly been associated with respiratory disease (including silicosis). As part of our annual due diligence, we work with our stakeholders to verify that certain health and safety protocols are in place with regards to the management of silica and its health effects, as well as in relation to other substances and products. Nonetheless, any health issues related to cement and aggregates production can result in future claims related to exposure to these products or substances, which could have a material adverse impact on our reputation, business, financial condition, liquidity, results of operations and prospects.
Other health and safety issues related to our business include: burns arising from contact with hot cement kiln dust or dust on preheater systems; airborne hazards related to our aggregates mining activities; noise, including from chutes and hoppers, milling plants, exhaust fans and blowers; the potential for dioxin formation if chlorine-containing alternative fuels are introduced into kilns; plant cleaning and maintenance activities involving working at elevated heights or in confined or other awkward locations, and the storage and handling of coal, pet coke and certain alternative fuels, which, in their finely ground state, can pose a risk of fire or explosion; and health hazards associated with operating ready-mix concrete trucks. We may also be exposed to liability resulting from injuries or fatalities involving third-party service providers, such as drivers for our suppliers when delivering products or services to us. While we actively seek to minimize the risk posed by these issues, personal injury claims may be made, and substantial damages awarded, against us, which could have a material adverse impact on our reputation, business, financial condition, liquidity and results of operations. Additionally, we may also be required to change our operational practices, involving material capital expenditure.
24
Table of Contents
Our operations and ability to source products and materials can be affected by adverse weather conditions and natural disasters, including climate change, which could have a material adverse effect on our business, financial condition, liquidity and results of operations.
Construction activity, and thus demand for our products, decreases substantially during periods of cold weather, when it snows or when heavy or sustained rainfalls occur, or generally, in any rainy and snowy weather. Consequently, demand for our products is significantly lower during the winter or raining and snowing seasons in the countries in which we operate and do business. Generally, winter weather in our European and North American operations significantly reduces our first quarter sales volumes, and to a lesser extent our fourth quarter sales volumes. Sales volumes in these and similar markets generally increase during the second and third quarters because of normally better weather conditions. However, high levels of rainfall and/or snow can also adversely affect our operations during these periods, as well as our access to products and materials used in our operations (as was the case in 2018 with regard to our operations in the Philippines, which was exacerbated by a natural landslide that affected our operations in the country). Natural disasters throughout 2022, such as the floods in southeast Asia and South America, earthquakes in Asia, severe droughts in North America and Hurricane Ian in Florida, have had and in the future could have a negative impact on our sales volumes, which could also have a material adverse effect on our results of operations. Our operations in Florida and Texas, the Caribbean and certain parts of the Gulf of Mexico are particularly exposed to hurricanes and similar weather events. For the years ended December 31, 2022, 2021 and 2020, the Company’s other expenses, net, in the statement of operations, include expenses and losses associated with severe weather conditions of $1 million, $5 million and $1 million, respectively, mainly related with Hurricane Ian in 2022, storms in Texas in 2021 and Hurricanes Sally and Maria in 2020. These events generated incremental costs related to power and gas consumption costs and additional parts replacement, but these costs could be higher, including materially higher, in case the frequency and severity of any weather event increases, in particular as a result of climate change. In general, decreases in sales volumes because of weather events or natural disasters are usually counterbalanced by the increase in the demand for our products during the reconstruction phase, unless any of our operating units or facilities are impacted by the natural disaster, or if our access to our sources of raw materials and the general supply chain is also affected. Such adverse weather conditions and natural disasters can have a material adverse effect on our business, financial condition, liquidity and results of operations if they occur with unusual intensity, during abnormal periods, or last longer than usual in our major markets, or if they cause scarcity and increases in the cost of the products we need to run our business, especially during peak construction periods.
We could be adversely affected by any significant or prolonged disruption to our production facilities.
Any prolonged and/or significant disruption to our production facilities, whether due to repair, maintenance or servicing, governmental or administrative actions, regulatory issues, civil unrest, industrial accidents, unavailability or excessively high cost of raw materials such as energy to the point of making it inefficient to run our production facilities, mechanical equipment failure, human error, natural disaster, cyber-attack to our systems, public health threat or otherwise, could disrupt and adversely affect our operations. Additionally, any major or sustained disruptions in the supply of utilities such as water, gas or electricity or any fire, flood, earthquake, hurricane, volcanic eruption, landslide, blizzard or other natural calamities or communal unrest or acts of terrorism may disrupt our operations or damage our production facilities or inventories and could have a material adverse effect on our business, financial condition, liquidity and results of operations. We typically shut down our facilities to undertake maintenance and repair work at scheduled intervals. Although we schedule shutdowns such that not all our facilities are shut down at the same time, the unexpected shutdown or closure of any facility or the unexpected prolongation for unforeseen reasons of any scheduled shutdown or temporary closure, may nevertheless materially affect our business, financial condition, liquidity and results of operations from one period to another.
25
Table of Contents
Labor activism and unrest, or failure to maintain satisfactory labor relations, could adversely affect our results of operations.
Labor activism and unrest may adversely affect our operations and thereby adversely affect our business, financial condition, liquidity, results of operations and prospects. Although most of our significant operations have not been affected by any significant labor disputes in the past, we cannot assure you that we will not experience labor unrest, activism, disputes or actions in the future, including as a result of labor laws and regulations that have recently been enacted or that could come into effect in the future, some of which may be significant and could adversely affect our business, financial condition, liquidity, results of operations and prospects. For example, collective bargaining agreements in some of the countries in which we operate have expired in the past year and, as a result, several negotiations have taken place and are expected to continue into 2023. For a description of our most relevant collective bargaining agreements, see “Item 6—Directors, Senior Management and Employees—Employees.”
Our insurance coverage may not cover all the risks to which we may be exposed.
Among others, we face the risks of fatalities and injury of our employees and contractors, loss and damage to our products, property and machinery due to, among other things, public health threats, fire, theft and natural disasters such as floods, and also face risks related to cyber-security related matters. Such events may cause a disruption to, or cessation of, our operations and business. Our insurance coverage may not be sufficient to cover all of our potential losses and liabilities. In addition, our insurance coverage may not cover all the risks to which we may be exposed, such as all risks related to pandemics and/or epidemics (such as COVID-19), and political risk. If our losses exceed our insurance coverage, or if we are not covered by the insurance policies we have taken up, we may be liable to cover any shortfall or losses. Our insurance premiums may also increase substantially because of such claims. Such circumstances could have a material adverse effect on our business, liquidity, financial condition and results of operations.
Our success depends on the leadership of Cemex, S.A.B. de C.V.’s Board of Directors and on key members of our executive management team and the availability of a specialized workforce.
Our success depends largely on strategic vision and actions of Cemex, S.A.B. de C.V.’s Board of Directors and on key members of our executive management team. The loss of some or all of Cemex, S.A.B. de C.V.’s directors or our senior management could have a material adverse effect on our business, financial condition, liquidity and results of operations, as well as on our reputation. Although Cemex, S.A.B. de C.V.’s shareholders have appointed new Board of Directors members, including to replace outgoing board members, we cannot assure you that this will continue to occur nor that the current structure and composition of Cemex, S.A.B. de C.V.’s Board of Directors will be maintained, in particular within the framework of any corporate government enhancements that Cemex, S.A.B. de C.V. continues to implement.
The execution of our business strategy also depends on our ongoing ability to attract and retain highly skilled employees. For a variety of reasons, particularly due to the competitive environment and the limited availability of skilled labor, we may not be successful in attracting and retaining the personnel we require. In addition, the availability of trained and skilled transportation operators and drivers is at times lacking in certain countries in which we operate, including, but not limited to, in the United States. Consequently, the manufacturing and distribution of our products may be adversely affected if we are unable to hire or train persons to perform such tasks. If we are unable to hire, train and retain qualified employees at a reasonable cost, we may be unable to successfully operate our business or capitalize on growth opportunities and, as a result, our business, financial condition, liquidity and results of operations could be materially and adversely affected.
26
Table of Contents
Future pandemics and epidemics, such as the COVID-19 pandemic, could materially adversely affect our financial condition and results of operations.
Any future pandemics and epidemics, as well as a resurgence in cases of currently existing strains of COVID-19, may cause governments and health authorities around the world to re-implement measures attempting to contain and mitigate the spread and effects of a virus. Measures previously implemented in connection with past pandemics and epidemics have resulted, and may continue to result, in: (i) restrictions on, or suspended access to, or shutdown, or suspension or the halt of, our facilities, including our cement plants and grinding mills; (ii) staffing shortages, production slowdowns or stoppages and disruptions in our delivery systems; (iii) disruptions or delays in our supply chains, including shortages of materials, products and services on which we and our businesses depend; (iv) reduced availability of land and sea transport, including labor shortages, logistics constraints and increased border controls or closures; (v) increased cost of materials, products and services on which we and our businesses depend; (vi) reduced investor confidence and consumer spending in the regions where we operate and globally; (vii) a slowdown in economic activity, including in the construction industry, and a decrease in demand for our products and services and industry demand generally; (viii) constraints on the availability of financing, if available at all, including on access to credit lines and working capital facilities; (ix) inability to satisfy liquidity needs if our operating cash flow and funds received under receivables and inventory financing facilities decrease or if we are not able to obtain borrowings under credit facilities, proceeds of debt and equity offerings and/or proceeds from asset sales; (x) our inability to refinance our indebtedness on desired terms, if at all; or (xi) our inability to comply with, or receive waivers with respect to, restrictions and covenants under the agreements governing our indebtedness and financial obligations, including, but not limited to, maintenance covenants under our Credit Agreements. New pandemics and epidemics could cause governments to implement similar containment measures such as, but not limited to, those implemented during the COVID-19 pandemic. As to the effects and duration of the COVID-19 pandemic, there could still be significant adverse effects in the future mainly in connection with: (i) impairment of long-lived assets including goodwill; (ii) foreign exchange losses related to our obligations denominated in foreign currency; (iii) increases in estimated credit losses on trade accounts receivable; and (iv) further disruption in supply chains.
Risks Relating to Our Indebtedness and Certain Other Obligations
The Credit Agreements, the indentures governing our outstanding Notes and our other debt agreements and/or instruments contain several restrictions and covenants. Our failure to comply with such restrictions and covenants or any inability to capitalize on business opportunities or refinance our debt resulting from them could have a material adverse effect on our business and financial conditions.
Each Credit Agreement requires us to comply with financial ratios and tests, including (i) a minimum Consolidated Coverage Ratio of Consolidated EBITDA to Consolidated Interest Expense and (ii) a maximum Consolidated Leverage Ratio of Consolidated Net Debt to Consolidated EBITDA, in each case, as described in each Credit Agreement. The calculation and formulation of Consolidated EBITDA, Consolidated Interest Expense, Consolidated Net Debt, Consolidated Coverage Ratio and Consolidated Leverage Ratio are defined and set out in each Credit Agreement and may differ from the calculation and/or formulation of analogous terms in this annual report. Our ability to comply with these ratios may be affected by our results of operations, economic conditions and volatility in foreign exchange rates, by overall conditions in the financial and capital markets and the construction sector, and by any monetary penalties or fines we may have to pay as a result of any administrative or legal proceedings to which we may be exposed to. See “Item 4—Information on the Company—Regulatory Matters and Legal Proceedings” for more information. Additionally, each Credit Agreement requires us to comply with certain covenants and restrictions consistent with an investment grade capital structure. As of December 31, 2022, there were $3,730 million and €400 million aggregate principal amount of then-outstanding Notes under the indentures governing such notes. The indentures governing our Notes impose operating and financial restrictions on us, which are more stringent than those imposed by the Credit Agreements. These restrictions limit our ability, among other things, to: (i) incur debt, including restrictions on incurring debt at our subsidiaries, which are not parties to the indentures governing the Notes;
27
Table of Contents
(ii) pay dividends on stock; (iii) redeem stock or redeem subordinated debt; (iv) make investments; (v) guarantee indebtedness; and (vi) create or assume liens.
Most of the covenants and restrictions in the Credit Agreements and the indentures governing our Notes are subject to a number of exceptions and qualifications. Nevertheless, they still limit our ability to conduct business at our discretion and may, among other effects, potentially impede or restrict refinancing plans with respect to our debt limit, as well as our ability to seize opportunities for our business, particularly if we are unable to incur financing or make investments to take advantage of such opportunities. In addition, in connection with the entry into new financings or amendments to existing financing arrangements while our debt rating remains below investment grade, our financial and operational flexibility may be further reduced as a result of more restrictive covenants, requirements for security and other terms that are often imposed on sub-investment grade entities. The breach of any of these covenants could result in a default under the Credit Agreements and/or the indentures governing our outstanding Notes, as well as certain other existing debt obligations, as a result of cross-default provisions contained in the instruments governing such debt obligations. In the event of a default under any of the Credit Agreements and/or the indentures governing our outstanding Notes, lenders under the applicable Credit Agreement and holders of our outstanding Notes could seek to declare all amounts outstanding under such Credit Agreement and such Notes, together with accrued and unpaid interest, if any, to be immediately due and payable. If the indebtedness under the Credit Agreements, our outstanding Notes, or certain other existing debt obligations were to be accelerated, we cannot assure you that our assets would be sufficient to repay in full such accelerated indebtedness or our other indebtedness. We cannot guarantee that we will be able to comply with the covenants and limitations contained in the Credit Agreements or in the indentures governing our Notes, or that we will comply with other agreements which constitute financial indebtedness in excess of $50 million in which any non-compliance would trigger a cross-default. Our failure to comply with such covenants and limitations could result in an event of default, which could materially and adversely affect our business, financial condition, liquidity and results of operations.
We have historically, when needed, sought and obtained waivers and amendments to several of our debt instruments relating to a number of financial ratios, restrictions and covenants. Our ability to comply with these could be affected by global economic conditions, foreign exchange rates and the financial and capital markets, among other factors. We may need to seek waivers or amendments to debt agreements or debt instruments in the future. However, we cannot assure you that any such waivers or amendments will be obtained. If we are unable to comply with the provisions of our debt agreements or debt instruments, and are unable to obtain a waiver or amendment, the indebtedness outstanding under such debt agreements and/or instruments could be accelerated. Acceleration of these debt agreements and/or instruments would have a material adverse effect on our business, liquidity or financial condition.
The elimination of LIBOR after June 2023 may adversely affect our financial results.
On March 5, 2021, the United Kingdom Financial Conduct Authority (the “FCA”), which regulates LIBOR, announced that all LIBOR tenors relevant to the Company will cease to be published or will no longer be representative after June 30, 2023. The FCA’s announcement coincided with the March 5, 2021 announcement of LIBOR’s administrator, the ICE Benchmark Administration Limited (the “IBA”), indicating that, as a result of not having access to input data necessary to calculate LIBOR tenors relevant to the Company on a representative basis after June 30, 2023, IBA would cease publication of such LIBOR tenors immediately after the last publication on June 30, 2023. These announcements mean that any of our LIBOR-based borrowings that extend beyond June 30, 2023 will need to be converted to a replacement rate. For example, upon the occurrence of a Benchmark Transition Event (as defined in the 2021 Credit Agreement) in relation to the corresponding currency in place of the LIBOR benchmark interest rate, a benchmark replacement will replace the then-current benchmark in accordance with the “hardwired” replacement provisions of the 2021 Credit Agreement.
In the United States, the Alternative Reference Rates Committee (the “ARRC”), a committee of private sector entities with ex-officio official sector members convened by the Federal Reserve Board and the Federal
28
Table of Contents
Reserve Bank of New York, has recommended the Secured Overnight Financing Rate (“SOFR”) plus a recommended spread adjustment as LIBOR’s replacement. There are significant differences between LIBOR and SOFR, such as LIBOR being an unsecured lending rate while SOFR is a secured lending rate, and SOFR is an overnight rate while LIBOR reflects term rates at different maturities. As of December 31, 2022, 19% of our foreign currency-denominated non-current total debt including subordinated notes and leases bears floating rates at a weighted average interest rate of LIBOR plus 148 basis points. Additionally, as of December 31, 2022, 26% of our foreign currency-denominated non-current debt with a maturity beyond December 31, 2022 is referenced to LIBOR. The impending transition away from and/or changes to the LIBOR benchmark interest rate could adversely affect our business, financial condition, liquidity and results of operations. If our LIBOR-based borrowings are converted to SOFR, the differences between LIBOR and SOFR, plus the recommended spread adjustment, could result in interest costs that are higher than if LIBOR remained available, which could have an adverse effect on our operating results. Although SOFR is the ARRC’s recommended replacement rate, it is also possible that lenders may instead choose alternative replacement rates that may differ from LIBOR in ways similar to SOFR or in other ways that would result in higher interest costs for us. It is not yet possible to predict the magnitude of LIBOR’s end on our borrowing costs given the remaining uncertainty about which rates will replace LIBOR. See “Recent Developments—Recent Developments Relating to Our Indebtedness.”
We have a substantial amount of debt and other financial obligations. If we are unable to secure refinancing on favorable terms or at all, we may not be able to comply with our payment obligations upon their maturity. Our ability to comply with our principal maturities and financial covenants may depend on us implementing certain strategic initiatives, including, but not limited to, making asset sales, and there is no assurance that we will be able to implement any such initiatives or execute such sales, if needed, on terms favorable to us or at all.
As of December 31, 2022, our total debt plus other financial obligations was $8,825 million (principal amount $8,870 million, excluding deferred issuance costs). Of such total debt plus other financial obligations, $987 million (principal amount $987 million) matures during 2023; $579 million (principal amount $585 million) matures during 2024; $1,587 million (principal amount $1,599 million) matures during 2025; $1,598 million (principal amount $1,608 million) matures during 2026; and $4,074 million (principal amount $4,091 million) matures after 2026. If we are unable to comply with, or refinance or extend, maturities under certain of our indebtedness, substantially all of our debt could be accelerated. Acceleration of our debt would have a material adverse effect on our business, financial condition, liquidity and results of operations. As a result of the potential failure to achieve the targets under our strategic initiatives the restrictions under the Credit Agreements, the indentures that govern our outstanding Notes and other debt instruments, the current global economic environment, volatility in the credit and capital markets and uncertain market conditions, we may not be able to generate enough cash or, if needed to repay our indebtedness, raise debt, equity and/or equity-linked capital on favorable terms or at all. These circumstances could also prevent us from securing extensions from relevant creditors and undertaking alternative actions to refinance, such as the completion of asset sales on terms that are economically attractive or at all, and could significantly limit the availability of funds to potential acquiring parties. If we fail to secure funds to repay our indebtedness in these or any other manners and our cash flow or capital resources prove inadequate, we could face liquidity problems and may not be able to comply with financial covenants and payment obligations under our indebtedness, which would have a material adverse effect on our business, financial condition, liquidity and results of operations.
Also, there can be no assurance that we will be able to implement our business strategy and initiatives and improve our results and revenues, which could affect our ability to refinance and/or comply with our payment obligations under our debt agreements and instruments.
We may not be able to generate sufficient cash to service our indebtedness or satisfy our short-term liquidity needs, and we may be forced to take other actions to do so, which may not be successful.
Historically, we have addressed our liquidity needs, including funds required to make scheduled principal and interest payments, refinance debt, and fund working capital and planned capital expenditures, mostly with
29
Table of Contents
operating cash flow, borrowings under credit facilities and receivables and inventory financing facilities, proceeds of debt and equity offerings and proceeds from asset sales. As of December 31, 2022, we had $678 million funded under our securitization programs in Mexico, the United States, France and the United Kingdom. We cannot assure you that, going forward, we will be able to roll over or renew these programs or generate sufficient cash to service our indebtedness or satisfy our short-term liquidity needs through the means we have historically used. This could adversely affect our liquidity and force us to take other actions to service our indebtedness or satisfy our short-term liquidity needs, which may be unsuccessful.
Specifically, we have periodically resorted and may continue to resort to the capital markets to raise debt, equity and equity-linked capital as our principal alternative to the means to obtain liquidity described in the paragraph above. A wide variety of factors may have adverse effects on our operating results and negatively affect our credit rating and the market value of our CPOs and ADSs, or that of our publicly listed subsidiaries, CHP, TCL and CCCL. In such event, securities issued by us could be deemed undesirable in the capital markets, which could make traditional sources of capital unavailable to us on reasonable terms or at all. If the global economic environment deteriorates and our operating results worsen, if we are unable to complete divestitures and/or debt or equity offerings on favorable terms or at all and/or our cash flow or capital resources prove inadequate, we could face liquidity problems and may not be able to comply with our principal payments under our indebtedness or refinance our indebtedness.
Cemex, S.A.B. de C.V.’s ability to repay debt and pay dividends is highly dependent on our subsidiaries’ ability to transfer income and dividends to us. As of the date of this annual report, we control three publicly listed companies, where this risk is heightened.
Aside from its operations in Mexico, Cemex, S.A.B. de C.V. is a holding company that owns the stock of its direct subsidiaries and is the beneficial owner of the equity interests of its indirect subsidiaries and has holdings of cash and marketable securities. In general, Cemex, S.A.B. de C.V.’s ability to repay debt and pay dividends, as well as to make other payments, depends on the continued transfer to it of dividends and other income and funds from its subsidiaries. The ability of Cemex, S.A.B. de C.V.’s subsidiaries to pay dividends and make other transfers to Cemex, S.A.B. de C.V. is subject to various regulatory, contractual and legal constraints of the countries in which we operate, as well as our continued compliance with terms under our debt agreements and instruments under which certain covenants have been partially suspended.
The ability of Cemex, S.A.B. de C.V.’s subsidiaries to pay dividends and make loans and other transfers to it is generally subject to various regulatory, legal and economic limitations. Depending on the jurisdiction of organization of the relevant subsidiary, limitations may include solvency and legal reserve requirements, dividend payment restrictions based on interim financial results or minimum net worth and withholding taxes on loan interest payments. For example, our subsidiaries in Mexico may declare and pay dividends only out of the profits reflected in the year-end financial statements approved by its stockholders. In addition, such payment can be approved by stockholders only after the creation of a required legal reserve (equal to one fifth of the relevant company’s capital) and compensation or absorption of losses, if any, incurred by such corporation in previous fiscal years.
Cemex, S.A.B. de C.V. may also be subject to exchange controls on remittances by its subsidiaries from time to time in a number of jurisdictions. In addition, Cemex, S.A.B. de C.V.’s ability to receive funds from its subsidiaries may be restricted by the debt instruments and other contractual obligations of these entities. The jurisdictions of organization of Cemex, S.A.B. de C.V.’s current or future subsidiaries may impose additional and more restrictive regulatory, legal and/or economic limitations. In addition, Cemex, S.A.B. de C.V.’s subsidiaries may not be able to generate sufficient income to pay dividends or make loans or other transfers to it in the future, or may not have access to Dollars in their respective countries, which, as of the date of this annual report, would be the preferred currency to be received by Cemex, S.A.B. de C.V. Also, any decision to have any of Cemex, S.A.B. de C.V.’s not wholly-owned subsidiaries, such as CHP, TCL or CCCL, declare and pay dividends or
30
Table of Contents
make loans or other transfers to us is subject to any rights that non-controlling shareholders may have in the corresponding subsidiary. Additional or more restrictive limitations on our subsidiaries could adversely affect Cemex, S.A.B. de C.V.’s ability to service our debt, meet its other cash obligations and pay dividends to its shareholders.
We have to service part of our debt and other financial obligations denominated in Dollars and Euros with revenues generated in Mexican Pesos or other currencies, as we do not generate sufficient revenue in Dollars and Euros from our operations to service all our debt and other financial obligations denominated in Dollars and Euros. This could adversely affect our ability to service our obligations in the event of a devaluation or depreciation in the value of the Mexican Peso, or any of the other currencies of the countries in which we operate, compared to the Dollar and Euro. In addition, our consolidated reported results and outstanding indebtedness are significantly affected by fluctuations in exchange rates between the Dollar (our reporting currency) vis-à-vis the Mexican Peso and other significant currencies within our operations.
A substantial portion of our total debt plus other financial obligations is denominated in Dollars and Euros. As of December 31, 2022, our debt plus other financial obligations denominated in Dollars and Euros represented 77% and 13% of our total debt plus other financial obligations, respectively. Our Dollar-denominated and Euro-denominated debt must be serviced with funds generated to some extent by our direct and indirect subsidiaries’ operations outside the United States and Europe. Although we have substantial operations in the United States and Europe, we continue to rely to some extent on our non-U.S. assets and non-European assets to generate revenues to service our Dollar-denominated and Euro-denominated debt. Consequently, we have to use revenues generated in Mexican Pesos or other currencies to service our Dollar-denominated and Euro-denominated obligations. See “Item 5—Operating and Financial Review and Prospects—Quantitative and Qualitative Market Disclosure—Interest Rate Risk, Foreign Currency Risk and Equity Risk—Foreign Currency Risk.” A devaluation or depreciation in the value of the Mexican Peso, Pound Sterling, Colombian Peso, Philippine Peso or any of the other currencies of the countries in which we operate, compared to the Dollar and Euro, could adversely affect our ability to service our Dollar-denominated and Euro-denominated debt. In 2022, our operations in Mexico, the United Kingdom, France, Germany, Poland, Spain, the Philippines, Israel, the Rest of EMEAA (as defined below) segment, Colombia, Caribbean TCL (as defined below), the Dominican Republic and the Rest of SCA&C (as defined below) segment, which are our main non-Dollar denominated operations, together generated 56% of our total revenues in Dollar terms (21%, 5%, 4%, 3%, 2%, 2%, 2%, 5%, 4%, 2%, 2%, 2% and 2%, respectively) before eliminations resulting from consolidation. In 2022, 27% of our revenues in Dollar terms were generated from our operations in the United States before eliminations resulting from consolidation.
During 2022, the Mexican Peso appreciated 4.9% against the Dollar, the Euro depreciated 6.3% against the Dollar and the Pound Sterling depreciated 11.8% against the Dollar. Currency hedges that we may be a party to or may enter into in the future may not be effective in covering all our currency-related risks. Our consolidated reported results for any period and our outstanding indebtedness as of any date are significantly affected by fluctuations in exchange rates between the Dollar and other currencies, as those fluctuations influence the amount of our non-Dollar indebtedness when translated into Dollars and also result in foreign exchange gains and losses as well as gains and losses on derivative contracts, including those entered into to hedge our exchange rate exposure. For a description of these impacts, see “Item 3—Key Information—Risk Factors—Risks Relating to Our Business and Operations—Our use of derivative financial instruments could negatively affect our net income and liquidity, especially in volatile and uncertain markets.”
Increases in liabilities related to our pension plans could adversely affect our results of operations.
We have obligations under defined benefit pension and other benefit plans in certain countries in which we operate, mainly in North America and Europe. Our actual funding obligations will depend on benefit plan changes, government regulations and other factors, including changes in longevity and mortality statistics.
31
Table of Contents
Despite the fact that we support our projections with studies by external actuaries, it is difficult to predict pension liabilities and funding requirements due to the large number of variables and assumptions involved, which are difficult to predict because they change continuously as demographics evolve. We have a net projected liability recognized in our statement of financial position as of December 31, 2022 of $695 million. The future cash funding requirements for our defined benefit pension plans and other post-employment benefit plans could significantly differ from the amounts estimated as of December 31, 2022. If so, these funding requirements, as well as our possible inability to properly fund, and/or provide sufficient guarantees for, such pension plans if we are unable to deliver the cash or equivalent funding requirements, could have a material adverse effect on our business, financial condition, liquidity, results of operations and prospects. See note 19 to Cemex, S.A.B. de C.V.’s 2022 audited consolidated financial statements included elsewhere in this annual report for a detailed description of our pension obligations.
Risks Relating to Regulatory and Legal Matters
We are subject to the laws and regulations of the countries where we operate and do business and non-compliance, any material changes in such laws and regulations and/or any significant delays in assessing the impact and/or adapting to such changes in laws and regulations may have an adverse effect on our business, financial condition, liquidity and results of operations.
Our operations are subject to the laws and regulations of the countries where we operate and do business, and such laws and regulations, and/or governmental interpretations of such laws and regulations, may change. Because Cemex, S.A.B. de C.V. is organized under Mexican laws, and because of the considerable size of our operations in the United States, and the fact that the ADSs trade on the New York Stock Exchange (the “NYSE”), we have to comply with the laws and regulations, and/or governmental interpretations of such laws and regulations, of Mexico and, for certain matters, of the United States, whether or not we operate and do business through a subsidiary located in Mexico or the United States, also because of the size of our operations in EU countries, we, or most of our subsidiaries in the EU, are also required to comply with certain EU legislation.
Any change in such laws and regulations, and/or governmental interpretations of such laws and regulations, may have a material adverse effect on our business, financial condition, liquidity and results of operations. Furthermore, changes in laws and regulations, and/or governmental interpretations of such laws and regulations, may require us to devote a significant amount of time and resources to assess and, if required, to adjust our operations to any such changes, which could have a material adverse effect on our business, financial condition, liquidity and results of operations. In addition, any significant delays in assessing the impact and/or, if required, in adapting to changes in laws and regulations and/or governmental interpretations of such laws and regulations may also have a material adverse effect on our business, financial condition, liquidity, results of operations and prospects. For more information, see “Item 3—Key Information—Risk Factors—Risks Relating to Our Business and Operations—Economic conditions, including inflation, in countries where we operate and in other regions or countries have affected and may continue to adversely affect our business, financial condition, liquidity and results of operations,” “Item 3—Key Information—Risk Factors—Risks Relating to Our Business and Operations—Political, social and geopolitical events, possible changes in public policies and other risks in some of the countries where we operate, which are inherent to the operations of an international company, could have a material adverse effect on our business, financial condition, liquidity and results of operations,” and “Item 3—Key Information—Risk Factors—Risks Relating to Regulatory and Legal Matters—Our operations are subject to environmental laws and regulations, including new and proposed reporting requirements, that are or could become increasingly stringent.”
We or our third-party providers may fail to maintain, obtain, or renew or may experience material delays in obtaining requisite governmental or other approvals, licenses and permits for the conduct of our business.
We and our third-party providers of goods and services, as applicable, require various approvals, licenses, permits, concessions and certificates in the conduct of our business. We cannot assure you that we, or our third-
32
Table of Contents
party providers of goods and services, will not encounter significant problems in obtaining new or renewing existing approvals, licenses, permits, concessions and certificates required in the conduct of our business, or that we, or our third-party providers of good and services, will continue to satisfy the current or new conditions to such approvals, licenses, permits, concessions and certificates that we currently have or may be granted in the future. There may also be delays on the part of regulatory and administrative bodies in reviewing our applications and granting approvals, which have become increasingly common since the beginning of the COVID-19 pandemic due to closures and/or reduced operations of public offices. The implementation of new laws and regulations on environmental-related matters in the countries in which we operate or in the countries from which our third-party providers of goods and services source their deliverables to us, may create stricter requirements to comply with. This could delay our ability to obtain the related approvals, licenses, permits, concessions and certificates, or could result in us not being able to obtain them at all. If previously obtained approvals, licenses, permits and certificates are revoked and/or if we, or our third-party providers of goods and services, fail to obtain and/or maintain the necessary approvals, licenses, permits, concessions and certificates required for the conduct of our business, we may be required to incur substantial costs or temporarily suspend or alter the operation of one or more of our operating units, production facilities, mineral extraction locations or of any relevant component of them, which could affect the general production of these units, facilities or locations, which in turn could have a material adverse effect on our business, financial condition, liquidity, results of operations and prospects.
We are subject to litigation proceedings, including, but not limited to, government investigations relating to corruption, antitrust and other proceedings, that could harm our business and our reputation.
From time to time, we are and may become involved in litigation, investigations and other legal or administrative proceedings relating to claims arising from our operations, either in the normal course of business or not, or arising from violations or alleged violations of laws, regulations or acts. As described in, but not limited to, “Item 4—Information on the Company—Regulatory Matters and Legal Proceedings,” as of December 31, 2022, we were subject to a number of significant legal proceedings, including, but not limited to, an SEC investigation concerning a new cement plant being built by Cemex Colombia S.A. (“Cemex Colombia”) in the Municipality of Maceo in the department of Antioquia, Colombia (the “Maceo Plant”), as well as an investigation from the United States Department of Justice (the “DOJ”) mainly relating to our operations in Colombia and other jurisdictions, and are exposed to investigations in Colombia against former employees, and also to antitrust investigations in countries in which we operate or do business. Investigations and litigation, and in general any legal or administrative proceedings, are subject to inherent uncertainties and unfavorable rulings may occur. We cannot assure you that these or any of our other regulatory matters and legal proceedings, including any that may arise in the future, will not harm our reputation or materially affect our ability to conduct our business in the manner that we expect or otherwise materially adversely affect us should an unfavorable ruling occur, which could have a material adverse effect on our business, financial condition, liquidity and results of operations.
We are subject to anti-corruption, anti-bribery, anti-money laundering, antitrust, anti-boycott, economic sanctions, trade embargoes, and export control laws and regulations in the countries in which we operate and do business in, a considerable number of which are considered high and medium risk countries. Any violation of any such laws or regulations could have a material adverse impact on our reputation, results of operations and financial condition, as well as harm our reputation.
We are subject to anti-corruption, anti-bribery, anti-money laundering, antitrust and other international laws and regulations and are required to comply with the applicable laws and regulations of the countries in which we operate, some of which, including Mexico, Jamaica, Trinidad and Tobago, Guyana, Barbados, Colombia, Panama, Egypt, the Philippines, the Dominican Republic, Guatemala, Nicaragua, Croatia, the Czech Republic and Haiti, are considered medium and high-risk countries with regard to corruption-related matters. We also have operations and do business in countries considered medium-risk, such as Poland and Italy. In addition, we are subject to regulations on international trade that restrict dealings with certain sanctioned countries, individuals and entities, including regulations administered by the United States of America, the United Kingdom, the
33
Table of Contents
European Union, and the United Nations Security Council and other international organizations and governments, including export control regulations, economic sanctions and trade embargoes. Given the large number of contracts that we are a party to around the world, the geographic distribution of our operations and the great variety of actors that we interact with in the course of business, we are subject to the risk that our affiliates, employees, directors, officers, partners, agents and service providers may misappropriate our assets, manipulate our assets or information, make improper payments or engage in corruption, bribery, money laundering or other illegal activity; and, as a consequence, we may be held liable for such misconduct, even if we do not engage in or authorize such activities.
Although we have implemented policies and procedures, which include training certain groups of our employees, seeking compliance with anti-corruption and other applicable laws and regulations, there can be no assurance that our internal policies and procedures will be sufficient to prevent or detect all inappropriate practices, fraud or violations of law by our affiliates, employees, directors, officers, partners, agents and service providers or that any such persons will not take actions in violation of our policies and procedures. If we fail to fully comply with applicable laws and regulations, the relevant government authorities of the countries where we operate have the power and authority to investigate us and, if necessary, impose fines, penalties and remedies, which could cause us to lose clients, suppliers and access to debt and capital markets. Any violations by us, or the third parties we transact with, of anti-bribery, anti-corruption, anti-money laundering, antitrust, anti-boycott, economic sanctions, trade embargoes, and export control laws or regulations could have a material adverse effect on our business, liquidity, reputation, results of operations and financial condition. For further information regarding our ongoing proceedings with respect to anti-corruption laws, see “Item 3—Key Information—Risk Factors—Risks Relating to Regulatory and Legal Matters—We are subject to litigation proceedings, including, but not limited to, government investigations relating to corruption, antitrust and other proceedings, that could harm our business and our reputation” and “Item 4—Information on the Company—Regulatory Matters and Legal Proceedings.”
Certain tax matters may have a material adverse effect on our cash flow, financial condition and net income, as well as on our reputation.
We are subject to certain tax matters, mainly in Spain and Colombia, that, if adversely resolved, may have a material adverse effect on our operating results, liquidity and financial position, as well as on our reputation. See notes 2.14 and 20.4 to Cemex, S.A.B. de C.V.’s 2022 audited consolidated financial statements included elsewhere in this annual report, “Item 4—Information on the Company—Regulatory Matters and Legal Proceedings—Tax Matters—Colombia,” and “Item 4—Information on the Company—Regulatory Matters and Legal Proceedings—Tax Matters—Spain” for a description of the legal proceedings regarding these Colombian and Spanish tax matters, all included elsewhere in this annual report.
Our operations are subject to environmental laws and regulations, including new and proposed reporting requirements that are or could become increasingly stringent.
Our operations are subject to a broad range of environmental laws and regulations in each of the jurisdictions in which we operate. These laws and regulations impose stringent environmental protection standards, which in recent years have and in the future are expected to continue becoming progressively stricter regarding, among other things, air emissions (including greenhouse gas emissions), land use and biodiversity, use of alternative fuels, water availability, wastewater discharges, the use and handling of hazardous waste or materials, waste management practices and the remediation of environmental impacts from our operations. These laws and regulations expose us to the risk of substantial environmental costs and liabilities, including taxes, higher investment in equipment and technology, fines and other sanctions, the payment of compensation to third parties, remediation costs, business disruption and damage to reputation. Moreover, the enactment of stricter laws and regulations, stricter interpretation of existing laws or regulations or new enforcement initiatives, may impose new risks or costs on us or result in the need for additional investments, which could result in a material decline in our profitability. Such may be the case, for example, if policy derived from Executive Order 14008, Tackling
34
Table of Contents
the Climate Crisis at Home and Abroad, signed by U.S. President Joe Biden on January 27, 2021, results in new regulatory or legislative initiatives relating to climate change, the application of regulatory criteria in relation to environmental matters stricter than that currently being applied, or in preferential treatment regarding pricing, contracting, the granting of operational permits or other economic activities being given to entities which may have environmental standards that are stricter than ours.
In late 2010, the United States Environmental Protection Agency (“EPA”) issued the final Portland Cement National Emission Standard for Hazardous Air Pollutants (“Portland Cement NESHAP”) under the federal Clean Air Act (“CAA”). This rule required portland cement plants to limit mercury emissions, total hydrocarbons, hydrochloric acid and particulate matter by September 2013. The rule was challenged in federal court, and in December 2011, the D.C. Circuit Court of Appeals remanded the Portland Cement NESHAP to EPA and directed the agency to recompute the standards. In February 2013, EPA issued a revised final Portland Cement NESHAP rule that relaxed emissions limits for particulate matter and moved the compliance deadline to September 2015.
While we expect to meet all emissions standards imposed by the Portland Cement NESHAP, we estimate that we will continue to incur operating costs at each plant to comply and could incur penalties if we fail to do comply.
In February 2013, EPA issued revised final emissions standards under the CAA for commercial and industrial solid waste incinerators (the “CISWI rule”). If a material being used in a cement kiln as an alternative fuel is classified as a solid waste, the plant must comply with the CISWI rule. The CISWI rule covers nine pollutants and imposes potentially more stringent emissions limits on certain pollutants that also are regulated under the Portland Cement NESHAP. EPA received petitions to further reconsider certain provisions of the CISWI rule. EPA granted reconsideration on four specific issues and finalized the reconsideration of the CISWI rule in June 2016. The CISWI rule was also challenged by both industrial and environmental groups in federal court. In July 2016, the D.C. Circuit issued a ruling upholding most of the rule and remanding several portions to EPA for further consideration. EPA has not issued a revised final rule after remand, but the portions of the rule upheld on appeal are final and in effect. The final CISWI rule established a compliance date of February 2018, which was not impacted by the appeal. As of December 31, 2022, none of our kilns at Cemex plants in the United States have been determined to be CISWI kilns; but, if they are determined to be CISWI kilns due to the use of certain alternative fuels, the emissions standards imposed by the CISWI rule could have a material impact on our business operations.
Under certain environmental laws and regulations, liability associated with investigation or remediation of hazardous substances can arise at a broad range of properties, including properties currently or formerly owned or operated by Cemex, as well as facilities at which any hazardous substances or wastes generated by us were sent for treatment, storage or disposal, or any areas affected while any hazardous substances or wastes were transported. Such laws and regulations may apply without regard to fault, causation or knowledge of contamination. We occasionally evaluate various alternatives with respect to our facilities, including possible dispositions or closures. Investigations undertaken in connection with these activities (or ongoing operational or construction activities) may lead to hazardous substance releases or discoveries of historical contamination that must be remediated, and closures of facilities may trigger compliance requirements that are not applicable to operating facilities. While compliance with these laws and regulations has not materially adversely affected our operations in the past, we cannot assure you that these requirements will not change, and that compliance will not adversely affect our operations in the future. Furthermore, we cannot assure you that existing or future circumstances or developments with respect to the impact of our operations will not require us to make significant remediation or restoration expenditures, which could have a material adverse effect on our business, financial condition, liquidity and results of operations.
The cement manufacturing process requires the combustion of large amounts of fuel and creates CO2 as a by-product of the calcination process. Therefore, efforts to address climate change through federal, state, regional, EU and international laws and regulations requiring reductions in emissions of greenhouse gases (“GHGs”) can create economic risks and uncertainties for our business. Such risks could include the cost of purchasing allowances or credits to meet GHG emission caps, the cost of paying higher energy costs or new CO2-
35
Table of Contents
related taxes, the cost of installing equipment, adopting new technologies and employing non-clinker cementitious materials and other processes to reduce emissions to comply with GHG limits or required technological standards, decreased profits or losses arising from decreased demand for our goods and higher production costs resulting directly or indirectly from the imposition of legislative or regulatory controls. To the extent that financial markets view climate change and GHG emissions as a financial risk or that certain laws and regulations limit our access to the financial markets or financial products due to environmental considerations, this could have a material adverse effect on our cost of and access to capital. Given the uncertain nature of the actual or potential statutory and regulatory requirements for GHG emissions at the federal, state, regional, EU and international levels, we cannot predict the impact on our operations or financial condition or make a reasonable estimate of the potential costs to us that may result from such requirements. However, the impact of any such requirements, whether individually or cumulatively, could have a material economic impact on our operations in the United States, Europe, Mexico, United Kingdom and in other countries where we operate. In particular, rules and regulations that may come into effect to obtain the United States’ achievement of its Nationally Determined Contribution (as defined below) following its reentering to the Paris Agreement, an international treaty aiming to reduce the emission of greenhouse gases, the potential approval of the European Commission’s July 2021 proposal to implement measures to procure the fulfillment of the goals contained in the EU’s Green Deal (as defined below), the expected start of an emissions trading system in Mexico in 2024 and any further rules and regulations that may come into effect to complete the United Kingdom’s implementation of the UK ETS (as defined below) may cause these risks to be realized. For more information on certain laws and regulations addressing climate change that we are, or could become, subject to, and the impacts to our operations arising therefrom, see “Item 4—Information on the Company—Regulatory Matters and Legal Proceedings—Environmental Matters.”
As part of our insurance-risk governance approach, from time to time we evaluate the need to address the financial consequences of environmental laws and regulations through the purchase of insurance. As a result, we do arrange certain types of environmental impairment insurance policies for both site-specific, as well as multi- site locations. We also organize non-specific environmental impairment insurance as part of the provision of a broader corporate insurance strategy. These latter insurance policies are designed to offer some assistance to our financial flexibility to the extent that the specifics of an environmental incident could give rise to a financial liability. However, we cannot assure you that a given environmental incident will be covered by the environmental insurance we have in place, or that the amount of such insurance will be sufficient to offset the liability arising from the incident. Any such liability may be deemed to be material to us and could have a material adverse effect on our business, financial condition, liquidity, results of operations and reputation.
It may be difficult to enforce civil liabilities against us or the members of Cemex, S.A.B. de C.V.’s Board of Directors, our senior management and controlling persons.
Cemex, S.A.B. de C.V. is a publicly traded variable stock corporation (sociedad anónima bursátil de capital variable) organized under the laws of Mexico. Most of the members of Cemex, S.A.B. de C.V.’s Board of Directors and of our senior management reside in Mexico, and all or a significant portion of the assets of those persons may be, and a substantial part of our assets are, located outside the United States. As a result, it may not be possible for you to effect service of process within the United States upon such persons or to enforce against them or against us in U.S. courts judgments predicated upon the civil liability provisions of the federal securities laws of the United States. We have been advised by our General Counsel, Roger Saldaña Madero, that there is doubt as to the enforceability in Mexico, either in original actions or in actions for enforcement of judgments of U.S. courts, of civil liabilities predicated on the U.S. federal securities laws.
Item 4 — Information on the Company
Unless otherwise indicated, references in this annual report to our sales and assets, including percentages, for a country or region are calculated before eliminations resulting from consolidation, and thus include intercompany balances between countries and regions. These intercompany balances are eliminated when calculated on a consolidated basis.
36
Table of Contents
Business Overview
Cemex, S.A.B. de C.V. is a publicly traded variable stock corporation (sociedad anónima bursátil de capital variable) organized under the laws of Mexico, with its principal executive offices located at Avenida Ricardo Margáin Zozaya #325, Colonia Valle del Campestre, San Pedro Garza García, Nuevo León, 66265, Mexico. Cemex, S.A.B. de C.V.’s main phone number is +52 81 8888-8888.
Our website is located at www.cemex.com. The information on our website is not, and is not intended to be, part of this annual report and is not incorporated into this annual report by reference.
Cemex, S.A.B. de C.V. started doing business in 1906 and was registered with the Mercantile Section of the Public Registry of Property and Commerce in Monterrey, Nuevo León, Mexico, on June 11, 1920, which as of the date of this annual report is for an indefinite period. Beginning April 2006, Cemex, S.A.B. de C.V.’s full legal and commercial name is Cemex, Sociedad Anónima Bursátil de Capital Variable.
We are one of the largest cement companies in the world, based on annual installed cement production capacity. As of December 31, 2022, we had 89.2 million tons of annual installed cement production capacity and our cement sales volumes in 2022 were 63.4 million tons. We estimate we are one of the largest ready-mix concrete and aggregates companies in the world with annual sales volumes of 50.1 million cubic meters and 139.2 million tons, respectively, in each case, based on our annual sales volumes in 2022. In 2022, we traded 11.8 million tons of cementitious and non-cementitious materials, in 92 countries, including 9.6 million tons of cement and clinker and 2.3 million tons of cementitious and other materials. This information does not include discontinued operations. See note 4.2 to Cemex, S.A.B. de C.V.’s 2022 audited consolidated financial statements included elsewhere in this annual report. Cemex, S.A.B. de C.V. is an operating and a holding company engaged, directly or indirectly, through its operating subsidiaries, primarily in the production, distribution, marketing and sale of cement, ready-mix concrete, aggregates, clinker, other construction materials and urbanization solutions throughout the world. We also provide related services and reliable construction-related services to customers and communities and maintain business relationships in more than 50 countries throughout the world.
We operate in different parts of the world, with operations in Mexico, the United States, the EMEAA region and the SCA&C region. We had total assets of $26,447 million as of December 31, 2022, and an equity market capitalization of $8,795 million as of April 25, 2023.
As of December 31, 2022, our cement production facilities were located in Mexico, the United States, the United Kingdom, Germany, Spain, Poland, the Czech Republic, Croatia, Egypt, the Philippines, the UAE, Colombia, Panama, Nicaragua, Guatemala, the Dominican Republic, Puerto Rico, Trinidad and Tobago, Jamaica and Barbados. As of December 31, 2022, our assets (after eliminations), cement and grinding plants, and installed capacity were as set forth below on an unconsolidated basis by region. Installed capacity, which refers to theoretical annual production capacity, represents gray portland cement and white cement grinding capacity, and includes installed capacity of cement and grinding plants that have been temporarily closed. Installed capacity may vary due to product mix changes in our production facilities.
| As of December 31, 2022 | ||||||||||||
| Consolidated assets (in Millions of Dollars) |
Number of Cement and Grinding Plants |
Installed Cement Grinding Capacity (Millions of Tons Per Annum) |
||||||||||
| Mexico |
$ | 3,846 | 15 | 27.3 | ||||||||
| United States(1) |
12,623 | 10 | 14.1 | |||||||||
| EMEAA |
22 | 34.5 | ||||||||||
| United Kingdom(2) |
1,393 | 3 | 3.6 | |||||||||
| France |
952 | — | — | |||||||||
| Germany |
452 | 2 | 3.1 | |||||||||
| Poland |
341 | 3 | 3.8 | |||||||||
37
Table of Contents
| As of December 31, 2022 | ||||||||||||
| Consolidated assets (in Millions of Dollars) |
Number of Cement and Grinding Plants |
Installed Cement Grinding Capacity (Millions of Tons Per Annum) |
||||||||||
| Spain(3) |
616 | 6 | 7.7 | |||||||||
| Philippines |
792 | 2 | 5.7 | |||||||||
| Israel |
771 | — | — | |||||||||
| Rest of EMEAA(4) |
783 | 6 | 10.6 | |||||||||
| SCA&C |
13 | 13.2 | ||||||||||
| Colombia |
742 | 4 | 4.1 | |||||||||
| Panama |
302 | 1 | 1.2 | |||||||||
| Caribbean TCL(5) |
499 | 3 | 2.9 | |||||||||
| Dominican Republic |
232 | 1 | 2.4 | |||||||||
| Rest of SCA&C(6) |
268 | 4 | 2.6 | |||||||||
| Corporate and Other Operations |
1,767 | — | — | |||||||||
| Continuing Operations |
26,379 | 60 | 89.2 | |||||||||
| Assets held for sale |
68 | — | — | |||||||||
| Total |
26,447 | 60 | 89.2 | |||||||||
| “—” Not applicable |
||||||||||||
The above table excludes our proportional interest in the installed capacity of companies in which we hold a non-controlling interest and reflects our organizational structure as of December 31, 2022.
| (1) | “Number of cement and grinding plants” and “installed cement grinding capacity” include two cement plants that are temporarily inactive with an aggregate annual installed grinding capacity of 2.0 million tons of cement. |
| (2) | “Number of cement and grinding plants” and “installed cement grinding capacity” include one cement plant that is temporarily inactive with an annual installed capacity of 1.0 million tons of cement. |
| (3) | “Number of cement and grinding plants” and “installed cement grinding capacity” include two cement plants that are temporarily inactive with an annual installed grinding capacity of 1.4 million tons of cement. |
| (4) | “Rest of EMEAA” refers mainly to our operations in the Czech Republic, Croatia, Egypt and the UAE. |
| (5) | “Caribbean TCL” refers to TCL’s operations mainly in Trinidad and Tobago, Jamaica, Barbados and Guyana. |
| (6) | “Rest of SCA&C” refers mainly to our operations in Peru, Puerto Rico, Nicaragua, Jamaica, the Caribbean and Guatemala, excluding the operations of TCL. |
Beginning in the late 1980s, we embarked on a major geographic expansion program intended to diversify our cash flows and enter into markets whose economic cycles within the cement industry operate largely independently from Mexico and which, at the time, we believed offered long-term growth potential. We have also built an extensive network of marine and land-based distribution centers and terminals that give us marketing access around the world. As part of our strategy, we have undertaken and are undertaking actions designed to streamline and reposition our portfolio in order to enhance our diversification and achieve higher profitable growth. As such, we expect to rebalance our portfolio by focusing on the markets that we believe offer long-term growth potential and retaining those assets that we believe are best suited to grow, offering us long-term profitability. While these actions are being undertaken, we could continue to complement our strategy with organic, bolt-on investments, on a stand-alone basis or with other partners, using a metropolis-centric approach leveraging our related businesses and digital strategy. The following are our most significant acquisitions, divestitures and reconfigurations that we have announced or closed since 2020 through 2022:
| • | On January 29, 2020, CHP announced the results of its stock rights offering pursuant to which 8,293,831,169 common shares of CHP were issued and listed on the Philippine Stock Exchange on March 4, 2020. As of December 31, 2022, after giving effect to the stock rights offering, and other repurchased in the market over the last few years, our indirect ownership of CHP’s outstanding common shares had further increased to 77.90%. See “Item 5—Operating and Financial Review and Prospects—Recent Developments—Recent Developments Relating to Our Business and Operations.” |
38
Table of Contents
| • | During the first six months of 2020, one of our subsidiaries in Israel acquired a ready-mix concrete products business (“Netivei Noy”) from Ashtrom Industries for an amount in shekels equivalent to $33 million. After the conclusion of the purchase price allocation to the fair values of the assets acquired and liabilities assumed of this business, we determined goodwill of $2 million. |
| • | On March 6, 2020, we concluded the sale of our U.S. affiliate Kosmos Cement Company (“Kosmos”), a partnership with a subsidiary of Buzzi Unicem S.p.A. in which we held a 75% interest, to Eagle Materials Inc. for $665 million. The share of proceeds to us from this transaction was $499 million before transactional and other costs and expenses. The assets that were divested consisted of Kosmos’ cement plant in Louisville, Kentucky, as well as related assets which include seven distribution terminals and raw material reserves. The operations of these assets in the United States for the period from January 1, 2020 to March 6, 2020, which includes a gain on sale of $14 million, net of the proportional allocation of goodwill of $291 million, are presented in our statements of operations, net of income tax, as part of the single line item “Discontinued operations.” |
| • | On August 3, 2020, through an affiliate in the United Kingdom, we closed the sale of certain assets to Breedon Group plc (“Breedon”) for an amount in Pounds equivalent to $230 million, including $30 million of debt. The assets included 49 ready-mix plants, 28 aggregate quarries, four depots, one cement terminal, 14 asphalt plants, four concrete products operations, as well as a portion of our paving solutions business in the United Kingdom. After completion of this divestiture, we maintain a significant footprint in key operating geographies in the United Kingdom related to the production and sale of cement, ready-mix, aggregates, asphalt and paving solutions, among others. Our operations of these assets in the United Kingdom for the period from January 1, 2020 to August 3, 2020, which includes a loss on sale of $57 million net of the proportional allocation of goodwill of $47 million, are presented in our statements of operations, net of tax, as part of the single line item “Discontinued operations.” |
| • | During 2020, Cemex España, S.A. (“Cemex España”) made a cash tender offer for any and all outstanding ordinary shares of Cemex Latal Holdings, S.A. (“CLH”), then registered with the National Register of Securities and Issuers (Registro Nacional de Valores y Emisores) (“RNVE”) and the Colombian Securities Exchange (Bolsa de Valores de Colombia) (the “BVC”) (except for shares either owned by Cemex España or CLH) (the “2020 CLH Tender Offer”). As of December 31, 2022, considering the effects of the 2020 CLH Tender Offer and additionally including shares of CLH purchased by us in the secondary market, we indirectly own 95.30% of all outstanding shares of CLH (which excludes shares of CLH owned by CLH). See “Recent Developments—Recent Developments Relating to Our Business and Operations.” |
| • | In January 2021, one of our subsidiaries in Israel acquired two ready-mix concrete plants from Kinneret and Beton-He’Emek for an amount in shekels equivalent to $6 million. After the conclusion of the purchase price allocation to the fair values of the assets acquired and liabilities assumed of this business, we determined goodwill of $5 million. |
| • | On March 31, 2021, we sold 24 concrete plants and one aggregates quarry in France to LafargeHolcim for an amount in Euros equivalent to $44 million. These assets were located in the Rhône-Alpes region in the Southeast of France, east of our operations in Lyon, France. The operations related to these assets for the year ended December 31, 2020 and for the three-month period ended March 31, 2021 are presented in our statements of operations, net of income tax, as part of the single line item “Discontinued operations.” |
| • | On July 9, 2021, we announced that we concluded the sale agreed in March 2019 of our white cement business, except for Mexico and the U.S., to Çimsa Çimento Sanayi Ve Ticaret A.S¸ for a total consideration of $155 million. Assets sold included our Buñol cement plant in Spain and white cement customer list. Our operations of these assets in Spain for the year ended December 31, 2020 and for the period from January 1, 2021 to July 9, 2021 are reported in the statements of operations, net of income tax, as part of the single line item “Discontinued operations,” including in 2021 a loss on sale of $67 million net of the proportional allocation of goodwill of $41 million. |
39
Table of Contents
| • | On August 31, 2022, we announced that we, through certain of our subsidiaries, concluded the sale agreed in December 2021 of our operations in Costa Rica and El Salvador to affiliates of Cementos Progreso Holdings, S.L. for a total consideration of $325 million, related to our aggregate controlling interest. The divested assets consisted of one fully integrated cement plant, one grinding station, seven ready-mix plants, one aggregate quarry, as well as one distribution center in Costa Rica and one distribution center in El Salvador. As of December 31, 2021, the assets and liabilities related to our operations in Costa Rica and El Salvador were presented in the financial statements in the line items “Assets held for sale” and “Liabilities directly related to assets held for sale.” Our operations of these assets in Costa Rica and El Salvador for the years ended December 31, 2020 and 2021 and for the period from January 1, 2022 to August 31, 2022 are reported in the statements of operations, net of income tax, as part of the single line item “Discontinued operations,” including in 2022 a gain on sale of $240 million, which includes the reclassification of foreign currency translation effects accrued in equity until the disposal date. |
| • | On December 10, 2021, through a subsidiary in Mexico, we acquired Broquers Ambiental, a sustainable waste management company for a total consideration of $13 million. Broquers Ambiental assets include a plant for solid waste treatment for its use as alternate fuel. During 2022, considering the fair values of the assets acquired and liabilities assumed, we determined goodwill of $4 million. |
| • | On July 11, 2022, through a subsidiary in Germany, we completed the acquisition of a 53% stake in the German aggregates company ProStein for a total consideration of $21 million. The investment expands our aggregates business in the region and we estimate that it increases the life of aggregates reserves for our operations in Central Europe for at least the next 25 years. The majority stake in ProStein’s assets adds a full range of fine and hard aggregates to our aggregates portfolio. In addition to supplying the greater Berlin area, the additional capacity can supply several urban centers in Poland and the Czech Republic. ProStein’s assets include six active hardstone plants and six construction, demolition, and excavation waste (“CDEW”) recovery sites. As of December 31, 2022, based on the preliminary valuation of the fair values of the assets acquired and liabilities assumed, we have not determined any goodwill. |
| • | On October 25, 2022, we created a partnership with Advent International (“Advent”). As part of the partnership we sold to Advent a 65% stake in Neoris N.V. (“Neoris”) for a total consideration of $119 million. While surrendering control to Advent, we retain a 34.8% stake and remain as a key strategic partner and customer of Neoris. Our retained 34.8% stake in Neoris was remeasured at fair value at the date of loss of control, is subsequently accounted for under the equity method and is presented in the line item “Investments in associates and joint ventures.” Neoris’ results for the years ended December 31, 2020 and 2021 and for the period from January 1 to October 25, 2022 are reported in the statements of operations, net of income tax, in the single line item “Discontinued operations,” including in 2022 a gain on sale of $117 million, net of the reclassification of foreign currency translation effects accrued in equity until the date of loss of control. |
40
Table of Contents
Geographic Breakdown of Revenues by Reportable Segment for the Year Ended December 31, 2022
The following chart indicates the geographic breakdown of our revenues by reportable segment, before eliminations resulting from consolidation, for the year ended December 31, 2022:
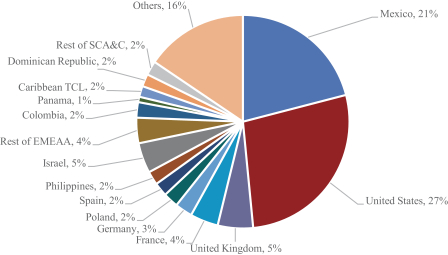
Breakdown of Revenues by Line of Business for the Year Ended December 31, 2022
The following chart indicates the breakdown of our revenues by line of business, before other revenues and eliminations resulting from consolidation, for the year ended December 31, 2022:
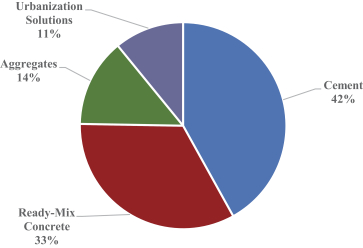
41
Table of Contents
Our Businesses
We strive to provide superior building solutions in the markets we serve. To this end, we tailor our products and services to suit customers’ specific needs, from home construction, improvement and renovation to infrastructure, commercial, industrial, agricultural and marine/hydraulic applications.
Cement
Cement is a binding agent, which, when mixed with sand, stone or other aggregates and water, produces either ready-mix concrete or mortar. Whether in bags or in bulk, we provide our customers with high-quality branded cement products and services. We use our professional knowledge and experience to develop customized products designed to satisfy our clients’ specific requirements and that also foster sustainable construction. In many of the countries where we have cement operations, a large proportion of cement sold is a bagged, branded product. We often deliver the product to a large number of distribution outlets such that our bagged, branded cement is available to the end users at a point of sale in close proximity to where the product will be used. We seek to develop brand identity and recognition in our bagged product.
We manufacture cement through a closely controlled chemical process, which begins with the mining and crushing of limestone and clay, and, in some instances, other raw materials. The clay and limestone are then pre-homogenized, a process which consists of combining different types of clay and limestone. The mix is typically dried, then fed into a grinder which grinds the various materials in preparation for the kiln. The raw materials are calcined, or processed, at a very high temperature in a kiln, to produce clinker. Clinker is the intermediate product used in the manufacture of cement. For limestone, clay and gypsum, requirements are based on chemical composition that, depending on the other materials available, matches the quality demanded by the production process. For cement limestone, clay and gypsum, we run chemical tests to prepare the mining plan of the quarry, to confirm material quality and reduce variations in the mineral content. We consider that limestone and clay quality of our cement raw materials quarries are adequate for the cement production process.
There are two primary processes used to manufacture cement: the dry process and the wet process. The dry process is more fuel efficient. As of December 31, 2022, 48 of our 50 operative cement production plants used the dry process and two used the wet process. Our operative production plants that use the wet process are in Nicaragua and Trinidad and Tobago. In the wet process, the raw materials are mixed with water to form slurry, which is fed into a kiln. Fuel costs are greater in the wet process than in the dry process because the water that is added to the raw materials to form slurry must be evaporated during the clinker manufacturing process. In the dry process, the addition of water and the formation of slurry are eliminated, and clinker is formed by calcining the dry raw materials. In the most modern application of this dry process technology, the raw materials are first blended in a homogenizing silo and processed through a pre-heater tower that utilizes exhaust heat generated by the kiln to pre-calcine the raw materials before they are calcined to produce clinker.
Clinker and gypsum are fed in pre-established proportions into a cement grinding mill where they are ground into an extremely fine powder to produce finished cement. We primarily cover our gypsum needs from third parties; however, we also operate gypsum quarries in the United States, Spain, the Dominican Republic and Egypt. Our main types of cement include the following:
Gray Portland Cement: Our gray portland cement is a high-quality, cost-effective building material, mainly composed of clinker, that meets applicable chemical and physical requirements and is widely used in all construction segments: residential, commercial, industrial, and public infrastructure.
White Cement: We manufacture this type of cement with limestone, low iron content kaolin clay, and gypsum. Customers use our white portland cement in architectural works requiring great brightness and artistic finishes, to create mosaics and artificial granite, and for sculptural casts and other applications where white prevails.
42
Table of Contents
Masonry or Mortar: Masonry or mortar is a portland cement that we mix with finely ground inert matter (limestone). Our customers use this type of cement for multiple purposes, including concrete blocks, templates, road surfaces, finishes, and brick work.
Oil-well Cement: Our oil-well cement is a specially designed variety of hydraulic cement produced with gray portland clinker. It usually forges slowly and is manageable at high temperatures and pressures. Produced in classes from A to H and J, our oil-well cement is applicable for different depth, chemical aggression, or pressure levels.
Blended Cement: Blended hydraulic cements are produced by inter-grinding or blending portland cement and supplementary cementitious materials such as ground granulated blast furnace slag, fly ash, silica fume, calcined clay, hydrated limestone, and other pozzolans. The use of blended cements in ready-mix concrete reduces mixing water and bleeding, improves workability and finishing, inhibits sulfate attack and the alkali- aggregate reaction, and reduces the heat of hydration. Cemex offers an array of blended cements which have a lower CO2 footprint resulting from their lower clinker content due to the addition of supplementary cementitious materials. The use of blended cements reinforces our dedication to sustainable practices and furthers our objective of offering an increasing range of more sustainable products.
Ready-Mix Concrete
Ready-mix concrete is a combination of cement, fine and coarse aggregates, admixtures (which control properties of the concrete including plasticity, pumpability, freeze-thaw resistance, strength and setting time), and water. We tailor our ready-mix concrete to fit our clients’ specific needs. By changing the proportion of water, aggregates, and cement in the mix, we modify our concrete’s resistance, manageability, and finish. We also use additives to customize our concrete consistent with the transportation time from our plant to the project, weather conditions at the construction site, and the project’s specifications. From our water-resistant to our self- compacting concrete, we produce a great variety of specially designed concrete to meet the many challenges of modern construction.
We develop solutions based on our thorough knowledge and application of ready-mix concrete technology. Leveraging years of experience, a global pool of knowledge, and state-of-the-art expertise about the different ready-mix concrete constituents and their interaction, we offer our customers tailor-designed concrete. Cemex ready-mix concrete technologists are able to modify the properties of concrete through the use of innovative chemical admixtures, combined with the proper proportions of the various concrete constituents. For example, depending on the type of application and jobsite requirements, we can design ready-mix concrete that is more fluid, stronger, develops strength faster, and also retains workability longer. Through the development of chemical admixtures solutions, our researchers design special concretes that fulfill the construction industry’s increasingly demanding performance requirements. Cemex offers a special ready-mix concrete portfolio, comprised of such products as ultra-rapid hardening concrete, crack-resistant/low shrinkage concrete, self- consolidating concrete, architectural concrete, pervious concrete, antibacterial concrete and a number of others.
We continuously work to improve the properties of ready-mix concrete that make it a key component of sustainable construction: durability, resistance to aggressive environments, light reflection, and capacity to store energy, among others. We also constantly work to develop innovative solutions that advance the sustainability of structures made with ready-mix concrete. This way, our customers can design sustainable buildings that can take advantage of the benefits of concrete in a wide range of applications. We offer engineered concrete for harbors and bridges with a special design of high-performance concrete that combines durability and low maintenance with resistance to aggressive environments, and for industrial applications which consists of concrete with high acid resistance which is robust and durable for such uses as cooling towers. We also offer concrete for building and housing used for structures such as self-compacting concrete that improves the strength and durability of building structures, while reducing energy use and noise due to concrete vibration, and envelope concrete such as structural lightweight concrete or insulating concrete forms which offer insulation solutions to improve energy
43
Table of Contents
efficiency in buildings, and concrete for building design that takes advantage of concrete’s capacity to store energy—its thermal mass—minimizing temperature fluctuations in a building over the course of the day, reducing the need for additional heating and cooling. We also offer ready-mix concrete for water and wastewater management and for roads and pavements.
The types of ready-mix concrete we offer our clients include, but are not limited to:
Standard Ready-Mix Concrete: Standard ready-mix concrete is the most common form of concrete. It is prepared for delivery at a concrete plant instead of mixed on the construction site.
Architectural and Decorative Concrete: This type of ready-mix concrete can provide a structural function, as well as an aesthetic or decorative finish. It can offer smooth or rough surfaces or textures, as well as a variety or range of colors.
Rapid-Setting Concrete: Designed to enhance early strength development, this type of ready-mix concrete allows fast formwork removal, accelerated construction sequencing, and rapid repair for such jobs as roads and airport runways. Typically used in low temperature (5-10°C) concreting during winter, this type of ready-mix concrete can also be used in buildings, railways, and precast applications. In addition to saving time, this type of ready-mix concrete technology offers improved durability and acid resistance.
Fiber-Reinforced Concrete: Ready-mix concrete designed with micro or macro fibers that can be used either for structural applications, where the fibers can potentially substitute for steel rebar reinforcement, or for reducing shrinkage, primarily early age shrinkage. Macro fibers can significantly increase the ductility of concrete, making it highly resistant to crack formation and propagation.
Fluid-Fill Concrete: Fluid mortar or ready-mix concrete simplifies the process of laying pipe and cable by surrounding the pipe or cable with a tightly packed shell that provides protection from the elements, prevents settling, and enables crews to work quickly.
Roller-Compacted Concrete: Compacted in place and cured, roller-compacted concrete is a zero-slump ready-mix concrete with the abrasion resistance to withstand high velocity water, making it the material of choice for spillways and other infrastructure subject to high flow conditions. It represents a competitive solution in terms of cost and durability when compared to asphalt.
Self-Consolidating Concrete: Self consolidating concrete has very high flow; therefore, it is self-leveling, eliminating the need for vibration. Due to the superplasticizers used, chemical admixtures that impart very high flow, self-consolidating concrete exhibits very high compaction as a result of its low air content. Consequently, self-consolidating concrete can have very high strengths, exceeding 50 megapascals.
Pervious Concrete: Because of its unique design mix, pervious concrete is a highly porous material that allows water, particularly rainwater, to filter through, reduces flooding and heat concentration by up to 4°C, and helps to prevent skidding on wet roads. This ready-mix concrete is ideally used in parking lots, footpaths, and swimming pool border applications.
Antibacterial Concrete: This type of ready-mix concrete helps to control bacteria growth and is used to help maintain clean environments in structures such as hospitals, laboratories, and farms.
Aggregates
We are one of the world’s largest suppliers of aggregates: primarily the crushed stone, sand, and gravel, used in virtually all forms of construction. Our customers use our aggregates for a wide array of applications: as a key component in the construction and maintenance of highways, walkways, parking lots, airport runways, and
44
Table of Contents
railways; for drainage, water filtration, purification, and erosion control; as fill material; for sand traps on golf courses, beaches, playing field surfaces, horse racing tracks, and related applications; and to build bridges, homes, and schools.
Aggregates are obtained from land-based sources such as sand and gravel pits and rock quarries or by dredging marine deposits.
Hard Rock Production. Rock quarries usually operate for at least 30 years and are developed in distinct benches or steps. A controlled explosion is normally used to release the rock from the working face. It is then transported by truck or conveyor to a crusher to go through a series of crushing and screening stages to produce a range of final sizes to suit customers’ needs. Dry stone is delivered by road, rail or water from the quarry.
Sand and Gravel Production. Sand and gravel quarries are much shallower than rock quarries and are usually worked and restored in progressive phases. Water can either be pumped out of the quarries allowing them to be worked dry or they can be operated as lakes with extraction below water. A conveyor draws the raw material into the processing plant where it is washed to remove unwanted clay and to separate sand. Sand separated during processing is dewatered and stockpiled. Gravel then passes over a series of screens that sieve the material into different sizes. Processing separates the gravel into stockpiles in a range of sizes for delivery.
Marine Aggregate Production. A significant proportion of the demand for aggregates is satisfied from rivers, lakes, and seabeds. Marine resources are increasingly important to the sustainable growth of the building materials industry. Marine aggregates also play an important role in replenishing beaches and protecting coastlines from erosion. At sea, satellite navigation is used to position a vessel precisely within its licensed dredging area. Vessels trail a pipe along the seabed and use powerful suction pumps to draw sand and gravel into the cargo hold. Dredged material is discharged at wharves, where it is processed, screened and washed for delivery.
Aggregates are an indispensable ingredient in ready-mix concrete, asphalt, and mortar. Accounting for 60% to 75% of ready-mix concrete’s volume, aggregates strongly influence concrete’s freshly mixed and hardened properties. Aggregates not only increase concrete’s strength, but also can make the mix more compact, enabling applications such as weatherproofing and heat retention. They can further contribute to concrete’s aesthetic qualities. For example, sand gives surface treatments their brightness.
The types of aggregates we offer our clients include, but are not limited to:
Crushed Stone and Manufactured Sand: These products are obtained by mining rock and breaking it down to a preferred size. In the case of manufactured sand, the product is obtained by crushing rock to the selected shape or texture, ensuring product and project specifications are met. Sources of crushed stone can be igneous, sedimentary, or metamorphic.
Gravel: Gravel deposits are produced through a natural process of weathering and erosion. It can be used for roads, for concrete manufacturing, or for decorative purposes.
Sand: Sand occurs naturally and is composed of fine rock material and mineral particles. Its composition is variable depending on the source. It can be used for roads, concrete manufacturing, or sanitation.
Recycled Concrete: Recycled concrete is created by breaking, removing, and crushing existing concrete to a preferred size. It is commonly used as a base layer for other construction materials because it compacts to form a firm surface.
45
Table of Contents
Urbanization Solutions
Urbanization Solutions is one of our four core businesses, a portfolio of related businesses that complements our value offering of products and solutions, looking to connect with the broader metropolis ecosystem, address urbanization challenges and provide means to all stakeholders in the construction value chain to enable sustainable urbanization by focusing on four key verticals:
Performance Materials.
Performance materials are used to modify or enhance the properties and usability of building materials and construction systems. Performance materials include admixtures, mortars & special mortars (e.g., tiling adhesives, renders & plasters, concrete repair, waterproofing) and asphalt. The following are examples of performance materials we offer to our customers:
| • | Admixtures ISOMILL 4000 Series grinding aids and cement enhancers provide significant carbon reduction, higher process efficiency and enhanced strength. |
| • | Admixtures ISOFLOW 6000 Series high-performance superplasticizer technology for ready-mixed concrete producers allows water and carbon reduction of up to 50% in concrete mix designs. |
| • | Cemex dry silo mortar provides an innovative and efficient solution to mortar delivery, particularly to larger sites. There is no need for mixing areas on site as all the material is contained in the silo. The guaranteed color, consistency and controlled workability are backed up by Cemex’s training and support. The dedicated Cemex dry silo team can support with silo placement and specification. |
| • | VIALOW is our low temperature asphalt, that allows the re-opening of a jobsite more quickly after completion of road works, as the asphalt reaches appropriate trafficking temperatures faster than conventional hot mix asphalt. VIALOW reduced carbon asphalt includes the option to offset residual CO2 to provide a CarbonNeutral® product, in accordance with The CarbonNeutral® Protocol. |
Industrialized Construction.
We manufacture finished building elements that are easy and safe to assemble and install on-site. Industrialized construction products range from precast components to complete structures, 2D panels, 3D modules, 3D structures, etc. The following are examples of industrialized construction products we offer to our customers:
| • | Precast elements for mobility and urban infrastructure: rail sleepers, box culverts, bridges, drainage basins, barriers and parking curbs. |
| • | High-end architectural concrete products with a range of styles for different building and urban landscaping projects: fully serviced façade panels, standard and architectural blocks, block paving and decorative paving solutions. |
| • | Social infrastructure solutions for rapid response: like the fully equipped COVID-19 hospital sections. |
Circularity.
We provide services that improve the circularity of the construction value chain by focusing on three waste streams:
| • | Municipal & Industrial Waste which is waste generated by households, commerce, and industrial activities. An example is our separation facilities in Mexico City that process around 25% of all the municipal waste the city generates, recovering from the waste stream what is recyclable and transforming most of the remaining waste to alternative fuels. Transforming municipal and industrial waste to alternative fuels replaces part of the fossil fuels used in our cement kilns, increasing the sustainability attributes of our products and reducing the carbon footprint in our processes. |
46
Table of Contents
| • | Construction, Demolition & Excavation Waste, which is waste generated specifically from the built environment. All debris, returned concrete, bricks, shingles, wood, excavation soil, etc., that can be reprocessed and reintegrated into the economy as raw materials. As an example, the Cemex Circularity Center in Gennevilliers, France, is a multiservice dock located in an industrial harbor in Paris offering a wide range of circular economy services to the construction industry. Gennevilliers receives a variety of materials, including construction waste, excavated material and inert soil, which it sorts, processes, and transforms into recycled aggregates or organic material used to restore quarries. |
| • | Alternative Raw Materials Waste, which is waste generated from other industries and by-products that can help Cemex preserve natural resources and reduce our CO2 footprint. Materials such as slag, fly ashes, pozzolans, calcined clays and other decarbonated raw materials can be used as substitutes for limestone and clinker in our production processes. |
Related Services.
We provide complementary services to offer integrated solutions through logistics and transportation, retail, pavement services and design and engineering, among others, that add value along the construction value chain. These services enable Cemex to provide value for our customers by offering building solutions for their construction needs. The following are examples of related services we offer to our customers:
| • | Logistics services provide multi-faceted transportation solutions like our New Line Transport business that serves the pneumatic tank, aggregate dump and flatbed markets promoting safety and providing a superior customer service through a centralized customer care dispatch center. |
| • | Retail services like ConstruramaSupply®, an eCommerce platform for construction materials such as steel, hardware, plumbing, finishes and electrical material that brings the Cemex product offer closer to the Construrama retail network. |
| • | Pavement services specialize in surface schemes from major highways and airfield surfacing to business parks, car parks, storage and materials handling depots where we offer a comprehensive range of paving solutions to both private and public sector clients. |
| • | Design and engineering services like Construhub, a Building Information Modeling (“BIM”) platform based on BIM methodology that reduces risks, improves quality and facilitates the delivery of projects on time and within budget for our clients. |
Services
We continuously communicate and interact with our customers to identify and implement effective ways to meet their toughest challenges. We recognize that customer loyalty happens by design, not by chance. To better serve our customers, we not only need to have a clear understanding of what they need, but also the means and passion to fulfill those needs.
In each market and locality in which we operate, we do our best to provide our customers with the most compelling integrated building solutions. For example, to solve infrastructure needs in major cities, we not only provide ready-mix concrete, but for some projects we also design the project, define the best technical solution, offer different financial schemes and execute the project in collaboration with local builders. Similarly, we work alongside our neighbors in small, less-affluent communities to help them solve their housing needs and pave their streets and sidewalks.
The following are examples of the different services offered to our customers throughout our operations, which may vary from location to location:
Enhanced Loading Experience: This service offers our customers flexibility and efficiency by applying technologies and solutions in the loading process in order to, among other results, minimize loading time and
47
Table of Contents
improve truck efficiency. These technologies and solutions include: ATM-like Bulk-Cement, fast lanes, real time loading status, License Plate Recognition, and Radio-Frequency Identification.
Customer-oriented Educational and Training Services: Webinars continue to be an effective channel to engage with existing and potential customers. In 2022, Cemex hosted over 160 webinars on several topics, including CEMEX Go trainings about new functionalities, new product releases, Vertua and sustainability.
Online Services: During 2022, we continued working on our customer-centricity and global business strategy, enhancing our customers’ experience while using CEMEX Go. We have successfully deployed the CEMEX Go digital platform by making it available in 21 countries and having 50% of our total recurring cement, ready-mix concrete, and aggregates customers conducting more than half of their purchases, or more than 60% of our global sales, through the platform.
We released the Online Connection, an online application enabled for cement and ready-mix, allowing our customers to receive an immediate response for a delivery request according to resources and capacity available for dispatch, allowing orders to be confirmed automatically and in real time since 2021. In 2022, we connected the Ready-Mix Go application to our online capabilities, so that users can place, view, schedule, confirm, and manage orders, as well as to track deliveries, configure notifications, and view order history from mobile and web devices. Moreover, we have been encouraging the digitalization of internal and customer processes to minimize the use of paper. Today, around 74% of our invoices are delivered in a fully digital manner, putting us on track to achieving our global paperless goal.
Service Centers: Our Service Centers globally play a key role in providing a superior customer experience to our customers. As part of our Service Delivery Model Transformation, we are evolving our Contact Centers to become Next Generation Service Centers, enabled by quality processes and state of the art technology. Our customers will live an omnichannel experience for all important touchpoints, from inquiring about product and services to placing and following up on orders and providing feedback for improvement.
Technical Support: We aim to provide our customers with top-level technical assistance through our state-of-the-art equipment and our highly professional, well-trained technical services staff. We strive to provide value above and beyond fulfilling our customers’ need for cement, aggregates, ready-mix concrete, and related products such as mortar.
These services do not produce revenues on a stand-alone basis but are part of our comprehensive value proposition.
Description of Our Raw Materials Resources and Reserves
We are a leading global provider of building materials and solutions, including cement, ready-mix concrete, aggregates and Urbanization Solutions. Our cement production process begins with the mining and crushing of limestone and clay, and, in some instances, other raw materials. We have access to limestone and clay quarries near most of our cement plant sites worldwide since these minerals are the main raw materials in the cement production process.
In addition, we are one of the world’s largest suppliers of aggregates, primarily hard rock, sand, and gravel, obtained from quarries, to be used in ready-mix concrete and other concrete-based products such as blocks and pipes.
Customers use our aggregates for a wide array of purposes, from key components in the construction and maintenance of highways, walkways, and railways to indispensable ingredients in concrete, asphalt and mortar. Aggregates can be used in their natural state or crushed into smaller size pieces.
48
Table of Contents
The types of mines mostly used to extract raw materials for aggregates and cement production are open pit or open cut, which relate to deposits of economically useful minerals or rocks that are found near the land surface. Open-pit mines that produce raw materials for our industry are commonly referred to as quarries.
Open-pit mines are typically enlarged until either the mineral resource is exhausted or an increasing ratio of overburden to exploitable material makes further mining uneconomic. In some cases, we also extract raw materials by dredging underwater deposits.
Raw materials for our own cement production processes are obtained mainly from our own sources. However, we may cover our aggregates and other raw materials needs through supply from third parties. For the year ended December 31, 2022, approximately 4.1% of our total raw material needs were supplied by third parties.
Mineral resources are defined as a concentration or occurrence of material of economic interest in or on the earth’s crust in such form, grade or quality, and quantity that there are reasonable prospects for its economic extraction. A mineral resource is a reasonable estimate of mineralization, taking into account relevant factors such as cut-off grade, likely mining dimensions, location or continuity, that, with the assumed and justifiable technical and economic conditions, is likely to, in whole or in part, become economically extractable.
Our resources estimates are prepared by Cemex’s engineers and geologists, some of which are considered qualified persons under sub-part 1300 of Regulation S-K of the Securities Act (“Regulation S-K 1300”), and such estimates are then analyzed and verified annually by other business units within the Company, jointly with the associated regional technical managers, once information is available. Our quarries must also be operated and maintained in accordance with applicable environmental permits and requirements (see “Item 4—Information on the Company—Regulatory Matters and Legal Proceedings—Environmental Matters” for details). In specific circumstances we have used the services of third-party geologists and/or engineers to validate our own estimates. The three categories of resources, in decreasing level of confidence, are the following:
1) A measured mineral resource is that part of a mineral resource for which quantity is estimated on the basis of conclusive geological evidence and sampling. A measured mineral resource has a higher level of confidence than the level of confidence of either an indicated mineral resource or an inferred mineral resource. It may be converted to a proven mineral reserve or to a probable mineral reserve.
2) An indicated resource is that part of a mineral resource for which quantity is estimated on the basis of adequate geological evidence and sampling. The level of geological certainty associated with an indicated mineral resource is sufficient to allow a qualified person to apply modifying factors in sufficient detail to support mine planning and evaluation of the economic viability of the deposit. An indicated mineral resource has a lower level of confidence than the level of confidence of a measured mineral resource and may only be converted to a probable mineral reserve.
3) An inferred mineral resource is that part of a mineral resource for which quantity is estimated on the basis of limited geological evidence and sampling. An inferred mineral resource has the lowest level of geological confidence of all mineral resources, which prevents the application of the modifying factors in a manner useful for evaluation of economic viability. An inferred mineral resource may not be converted to a mineral reserve.
Mineral reserves are defined as the economically mineable part of a measured or indicated mineral resource. Our reserves estimates are prepared by Cemex’s engineers and geologists, some of which are considered qualified persons under Regulation S-K 1300, and such estimates are then analyzed and verified annually by other business units within the Company, jointly with the regional technical managers associated, once information is available. Our quarries must also be operated and maintained in accordance with applicable environmental permits and requirements. See “Item 4—Information on the Company—Regulatory Matters and
49
Table of Contents
Legal Proceedings—Environmental Matters” for more information. In specific circumstances we have used the services of third-party geologists and/or engineers to validate our own estimates. The two categories of reserves, in decreasing level of confidence, are the following:
1) Proven reserves are for which (i) the quantity is computed from dimensions revealed by drill data, together with other direct and measurable observations such as outcrops, trenches and quarry faces; (ii) the grade and/or quality are computed from the results of detailed sampling; and (iii) the sampling and measurement data are spaced so closely and the geologic character is so well defined that size, shape, depth and mineral content of the reserves are well-established. Reserves are considered as proven when all legal and environmental conditions have been met and required permits and approvals have been obtained to allow for the extraction of the material.
2) Probable reserves are those for which quantity and grade and/or quality are computed from information similar to that used from proven reserves, but the sites for inspection, sampling and measurement are farther apart or are otherwise less adequately spaced. The degree of assurance, although lower than that for proven reserves, is high enough to assume continuity between points of observation.
Our reserves determination incorporates only materials meeting specific quality requirements. For aggregates used in ready-mix concrete, such requirements are based on hardness, shape and size. For cement raw materials (mainly limestone and clay), such requirements are based on a chemical composition that matches the quality demanded by the production process. In the case of cement raw materials, since chemical composition varies from production sites and even within the same site, we conduct geostatistical chemical tests and determine the best blending proportions to meet production quality criteria and to try to maintain an extraction ratio close to 100% of the reported reserves for such materials.
The main equipment utilized in our production sites consists of the following:
| • | In our cement facilities: drills, crushers, kilns, coolers, mills, packing/loading machines, pay loaders, excavators, off-road trucks and other material handling equipment. |
| • | In our ready-mix concrete facilities: batch plants, silos and mobile equipment and mixer trucks. |
| • | In our aggregates facilities: drills, crushers, screens, belt conveyors, pay loaders, excavators, trucks and other material handling equipment. |
Our estimates distinguish between owned and leased reserves, the latter being determined over the term of the lease contract, and including only those permitted reserves which are proven and probable. As of December 31, 2022, our total cement raw materials and aggregates resources and reserves were located in 409 sites, comprising a property surface of approximately 96,701 hectares. Of these sites, 211 are located on land owned by Cemex, 94 are on land leased by Cemex, and 104 are on land owned in part and leased in part. The following maps show our operating quarries’ locations as of December 31, 2022:
50
Table of Contents
Mexico, USA and SCA&C regions
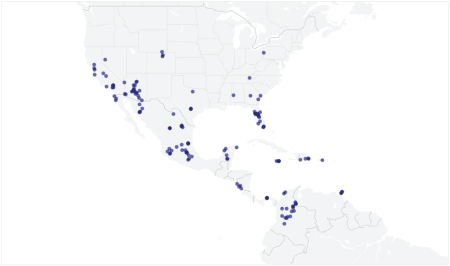
EMEAA region(1)
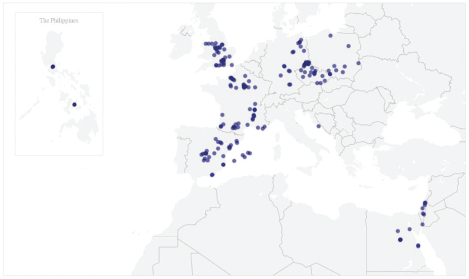
| (1) | Excludes 15 marine extraction sites in the United Kingdom. |
Our mining properties are classified as follows:
| (1) | Production Stage: Properties with reported proven or probable reserves where we have active mining operations, |
| (2) | Development Stage: Properties with reported proven or probable reserves where we do not have active mining operations, and |
| (3) | Exploration Stage: Properties with no reported reserves. |
As of December 31, 2022, we have 314 cement raw materials and aggregates properties in the production stage, 60 properties in the development stage and 35 properties in the exploration stage.
51
Table of Contents
As of December 31, 2022, we operated 144 cement raw materials quarries across our global operations, serving our facilities dedicated to cement production, which are commonly located at or near the cement plant facilities. Annualized production of cement raw materials totaled 67.4 million tons for 2022, 75.5 million tons for 2021, and 69.3 million tons for 2020. We estimate that our proven and probable cement raw material reserves, on a consolidated basis, have an average remaining life of approximately 75 years. Average remaining life, also known as years to depletion, is calculated based on total reserves divided by the average production of the five previous years; so, for the year ended December 31, 2022, total reserves are divided by the average annual cement raw materials production between the years ended December 31, 2018 and December 31, 2022. Immaterial volumes extracted from the quarry located in Maceo during its trial period and for the Maceo Plant road construction are excluded from this calculation. As of December 31, 2022, we operated substantially all of our cement raw materials quarries, some of which are jointly-operated with third parties.
The tables set forth below present our total measured, indicated and inferred cement raw materials resources (exclusive of proven and probable reserves) and permitted proven and probable cement raw materials reserves by geographic segment and material type extracted or produced in our cement raw materials quarries operations:
| As of December 31, 2022 | ||||||||||||||||||
| Resources (million tons)(4)(5)(6) | ||||||||||||||||||
| Location | Mineral | Measured (M) | Indicated (I) | Total(M) | Inferred | |||||||||||||
| Mexico(1) |
Limestone | 20 | 325 | 345 | 1,551 | |||||||||||||
| Clay | 7 | 0 | 7 | 105 | ||||||||||||||
| Others | 0 | 1 | 1 | 4 | ||||||||||||||
| United States(2) |
Limestone | 89 | 183 | 272 | 125 | |||||||||||||
| Clay | 0 | 0 | 0 | 0 | ||||||||||||||
| Others | 0 | 0 | 0 | 0 | ||||||||||||||
| EMEAA |
||||||||||||||||||
| United Kingdom |
Limestone | 0 | 25 | 25 | 0 | |||||||||||||
| Clay | 0 | 5 | 5 | 0 | ||||||||||||||
| Germany |
Limestone | 0 | 0 | 0 | 75 | |||||||||||||
| Poland |
Limestone | 0 | 0 | 0 | 174 | |||||||||||||
| Spain |
Limestone | 5 | 0 | 5 | 207 | |||||||||||||
| Clay | 0 | 0 | 0 | 2 | ||||||||||||||
| Others | 0 | 0 | 0 | 0 | ||||||||||||||
| Philippines(3) |
||||||||||||||||||
| Property that supplies Solid Cement |
||||||||||||||||||
| Plant |
Limestone | 494 | 394 | 888 | 0 | |||||||||||||
| Other properties |
Limestone | 195 | 190 | 385 | 0 | |||||||||||||
| Clay | 0 | 0 | 0 | 0 | ||||||||||||||
| Others | 0 | 0 | 0 | 0 | ||||||||||||||
| Rest of EMEAA |
Limestone | 270 | 0 | 270 | 89 | |||||||||||||
| Clay | 72 | 0 | 72 | 0 | ||||||||||||||
| Others | 2 | 0 | 2 | 1 | ||||||||||||||
| SCA&C |
||||||||||||||||||
| Colombia |
Limestone | 351 | 330 | 681 | 883 | |||||||||||||
| Clay | 16 | 1 | 18 | 3 | ||||||||||||||
| Others | 4 | 7 | 11 | 3 | ||||||||||||||
| Panama |
Limestone | 16 | 3 | 19 | 0 | |||||||||||||
| Clay | 1 | 1 | 2 | 0 | ||||||||||||||
| Caribbean TCL |
Limestone | 237 | 0 | 237 | 0 | |||||||||||||
| Clay | 0 | 0 | 0 | 0 | ||||||||||||||
| Others | 0 | 0 | 0 | 0 | ||||||||||||||
| Dominican Republic |
Limestone | 393 | 0 | 393 | 0 | |||||||||||||
| Clay | 4 | 0 | 4 | 0 | ||||||||||||||
| Others | 0 | 50 | 50 | 0 | ||||||||||||||
52
Table of Contents
| As of December 31, 2022 | ||||||||||||||||||
| Resources (million tons)(4)(5)(6) | ||||||||||||||||||
| Location | Mineral | Measured (M) | Indicated (I) | Total(M) | Inferred | |||||||||||||
| Rest of SCA&C(7) |
Limestone | 8 | 1 | 10 | 0 | |||||||||||||
| Clay | 0 | 0 | 0 | 0 | ||||||||||||||
| Others | 0 | 0 | 0 | 0 | ||||||||||||||
| Cemex Consolidated |
Limestone | 2,078 | 1,452 | 3,529 | 3,104 | |||||||||||||
| Clay | 101 | 7 | 108 | 110 | ||||||||||||||
| Others | 6 | 58 | 64 | 8 | ||||||||||||||
|
|
|
|
|
|
|
|
|
|||||||||||
| Totals | 2,185 | 1,517 | 3,702 | 3,222 | ||||||||||||||
|
|
|
|
|
|
|
|
|
|||||||||||
| As of December 31, 2022 | ||||||||||||||||||||||
| Reserves (Million tons)(4)(5)(6) | ||||||||||||||||||||||
| Location | Mineral | Number of quarries(8) |
Proven | Probable | Total | 2022 Annualized Production |
||||||||||||||||
| Mexico(1) |
Limestone | 15 | 1,254 | 1,376 | 2,630 | 20.8 | ||||||||||||||||
| Clay | 12 | 156 | 148 | 304 | 2.6 | |||||||||||||||||
| Others | 12 | 6 | 4 | 9 | 0.5 | |||||||||||||||||
| United States(2) |
Limestone | 21 | 469 | 92 | 561 | 10.5 | ||||||||||||||||
| Clay | 3 | 15 | 17 | 32 | 0.4 | |||||||||||||||||
| Others | 2 | 0 | 0 | 1 | 0.1 | |||||||||||||||||
| EMEAA |
||||||||||||||||||||||
| United Kingdom |
Limestone | 2 | 52 | 34 | 86 | 1.5 | ||||||||||||||||
| Clay | 3 | 21 | 0 | 21 | 0.5 | |||||||||||||||||
| Germany |
Limestone | 1 | 6 | 80 | 85 | 2.5 | ||||||||||||||||
| Poland |
Limestone | 2 | 114 | 84 | 198 | 3.3 | ||||||||||||||||
| Spain |
Limestone | 11 | 130 | 76 | 206 | 2.7 | ||||||||||||||||
| Clay | 4 | 4 | 3 | 7 | 0.2 | |||||||||||||||||
| Others | 2 | 0 | 15 | 15 | 0.0 | |||||||||||||||||
| Philippines(3) |
||||||||||||||||||||||
| Property that supplies Solid Cement Plant |
Limestone | 4 | 258 | 0 | 258 | 1.2 | ||||||||||||||||
| Other properties |
Limestone | 3 | 96 | 36 | 133 | 3.7 | ||||||||||||||||
| Clay | 1 | 1 | 2 | 3 | 0.0 | |||||||||||||||||
| Others | 2 | 5 | 0 | 5 | 0.3 | |||||||||||||||||
| Rest of EMEAA |
Limestone | 5 | 71 | 209 | 280 | 5.4 | ||||||||||||||||
| Clay | 2 | 1 | 19 | 20 | 0.7 | |||||||||||||||||
| Others | 4 | 1 | 0 | 1 | 0.1 | |||||||||||||||||
| SCA&C |
||||||||||||||||||||||
| Colombia |
Limestone | 11 | 70 | 127 | 198 | 3.3 | (7) | |||||||||||||||
| Clay | 2 | 4 | 1 | 5 | 0.0 | |||||||||||||||||
| Others | 2 | 1 | 4 | 5 | 0.1 | |||||||||||||||||
| Panama |
Limestone | 3 | 66 | 22 | 87 | 1.7 | ||||||||||||||||
| Clay | 2 | 5 | 1 | 6 | 0.2 | |||||||||||||||||
| Caribbean TCL |
Limestone | 4 | 2 | 23 | 25 | 2.4 | ||||||||||||||||
| Clay | 1 | 0 | 5 | 5 | 0.2 | |||||||||||||||||
| Others | 3 | 0 | 15 | 15 | 0.2 | |||||||||||||||||
| Dominican Republic |
Limestone | 1 | 88 | 0 | 88 | 2.0 | ||||||||||||||||
| Clay | 1 | 16 | 0 | 16 | 0.0 | |||||||||||||||||
| Others | 1 | 10 | 0 | 10 | 0.2 | |||||||||||||||||
53
Table of Contents
| As of December 31, 2022 | ||||||||||||||||||||||
| Reserves (Million tons)(4)(5)(6) | ||||||||||||||||||||||
| Location | Mineral | Number of quarries(8) |
Proven | Probable | Total | 2022 Annualized Production |
||||||||||||||||
| Rest of SCA&C |
Limestone | 2 | 1 | 4 | 5 | 0.3 | ||||||||||||||||
| Clay | 0 | 0 | 0 | 0 | 0.0 | |||||||||||||||||
| Others | 0 | 0 | 0 | 0 | 0.0 | |||||||||||||||||
| Cemex Consolidated |
Limestone | 85 | 2,677 | 2,164 | 4,841 | 61.3 | ||||||||||||||||
| Clay | 31 | 222 | 196 | 418 | 4.7 | |||||||||||||||||
| Others | 28 | 23 | 37 | 60 | 1.5 | |||||||||||||||||
|
|
|
|
|
|
|
|
|
|
|
|||||||||||||
| Totals | 144 | 2,921 | 2,398 | 5,318 | 67.4 | |||||||||||||||||
|
|
|
|
|
|
|
|
|
|
|
|||||||||||||
| (1) | Our cement raw materials operations in Mexico include three limestone quarries that also produce hard rock aggregates. |
| (2) | Our cement raw materials operations in the United States include one limestone quarry that also produces hard rock aggregates. |
| (3) | Although Cemex, S.A.B. de C.V. consolidates CHP into its consolidated financial statements under IFRS, as of December 31, 2022 we did not control the raw materials used in our operations in the Philippines. Such raw materials were primarily supplied by APO Land & Quarry Corporation (“ALQC”) and Island Quarry and Aggregates Corporation (“IQAC”). ALQC was wholly owned by Impact Assets Corporation, which is a corporation in which we owned a 40% equity interest. As of December 31, 2022, IQAC was wholly owned by Albatross Holdings, Inc. (“Albatross Holdings”), which is a corporation in which we owned a 40% equity interest. Values presented for properties in the Philippines have not been prorated by the 40% interest. |
| (4) | Figures for reserves and resources are rounded. |
| (5) | Our 2022 cement raw materials resources and reserves were estimated based on an average sales price during 2022 for cement of $114.30 per metric ton, excluding freight. This price is impacted by product mix, location and exchange rates. One ton of limestone is used to produce 1.08 tons of cement. |
| (6) | Resources and reserves are reported excluding expected wastes, meaning its best estimation of final usable/saleable material. |
| (7) | Immaterial volumes extracted from the quarry located in Maceo for the Maceo Plant road construction are excluded from this calculation. |
| (8) | The number of quarries may include sites in exploration stages. |
As of December 31, 2022, we operated approximately 265 aggregates quarries across our global operations, mostly dedicated to serving our ready-mix concrete and aggregates businesses. Annualized production of aggregates totaled 117.7 million tons for 2022, 116.1 million tons for 2021, and 113.5 million tons for 2020. We estimate that our proven and probable aggregates reserves, on a consolidated basis, have an average remaining life of 30 years. Average remaining life, also known as years to depletion, is calculated based on total reserves divided by the average production of the five previous years; so, for the year ended December 31, 2022, total reserves are divided by the average annual cement raw materials production between the years ended December 31, 2018 and December 31, 2022. As of December 31, 2022, we operated substantially all of our aggregates quarries, some of which are jointly-operated with third parties.
54
Table of Contents
The tables set forth below present our total measured, indicated, and inferred aggregates resources (exclusive of proven and probable reserves) and permitted proven and probable aggregates reserves by geographic segment and material type extracted or produced in our aggregates quarries operations. We note that the locations of our aggregates reserves differ from those of our cement reserves:
| As of December 31, 2022 | ||||||||||||||||||
| Resources (million tons)(9)(10)(11) | ||||||||||||||||||
| Location | Mineral | Measured (M) | Indicated (I) | Total (M) + (I) | Inferred | |||||||||||||
| Mexico |
Hardrock | 1 | 21 | 22 | 24 | |||||||||||||
| United States |
Hardrock | 78 | 208 | 286 | 876 | |||||||||||||
| Sand&Gravel | 32 | 354 | 387 | 47 | ||||||||||||||
| Others | 0 | 0 | 0 | 0 | ||||||||||||||
| EMEAA |
||||||||||||||||||
| United Kingdom |
Hardrock | 0 | 62 | 62 | 0 | |||||||||||||
| Sand&Gravel | 29 | 149 | 178 | 139 | ||||||||||||||
| France |
Hardrock | 0 | 0 | 0 | 49 | |||||||||||||
| Sand&Gravel | 0 | 24 | 24 | 50 | ||||||||||||||
| Germany |
Hardrock | 24 | 20 | 44 | 3 | |||||||||||||
| Sand&Gravel | 3 | 0 | 3 | 1 | ||||||||||||||
| Poland |
Hardrock | 0 | 0 | 0 | 0 | |||||||||||||
| Sand&Gravel | 8 | 12 | 20 | 0 | ||||||||||||||
| Spain |
Hardrock | 0 | 0 | 0 | 0 | |||||||||||||
| Sand&Gravel | 0 | 0 | 0 | 0 | ||||||||||||||
| Others | 0 | 0 | 0 | 0 | ||||||||||||||
| Philippines(8) |
Hardrock | 144 | 208 | 352 | 0 | |||||||||||||
| Israel |
Hardrock | 0 | 0 | 0 | 0 | |||||||||||||
| Sand&Gravel | 0 | 0 | 0 | 0 | ||||||||||||||
| Rest of EMEAA |
Hardrock | 0 | 0 | 1 | 0 | |||||||||||||
| Sand&Gravel | 6 | 6 | 12 | 6 | ||||||||||||||
| SCA&C |
||||||||||||||||||
| Colombia |
Sand&Gravel | 44 | 67 | 111 | 325 | |||||||||||||
| Panama |
Hardrock | 0 | 0 | 0 | 0 | |||||||||||||
| Others | 0 | 0 | 0 | 0 | ||||||||||||||
| Caribbean TCL |
Hardrock | 0 | 0 | 0 | 4,700 | |||||||||||||
| Sand&Gravel | 4 | 5 | 9 | 0 | ||||||||||||||
| Dominican Republic |
Hardrock | 0 | 0 | 0 | 0 | |||||||||||||
| Rest of SCA&C |
Sand&Gravel | 13 | 0 | 13 | 0 | |||||||||||||
| Cemex Consolidated |
Hardrock | 248 | 519 | 766 | 5,653 | |||||||||||||
| Sand&Gravel | 139 | 616 | 755 | 568 | ||||||||||||||
| Others | 0 | 0 | 0 | 0 | ||||||||||||||
|
|
|
|
|
|
|
|
|
|||||||||||
| Totals | 386 | 1,135 | 1,521 | 6,220 | ||||||||||||||
|
|
|
|
|
|
|
|
|
|||||||||||
| As of December 31, 2022 | ||||||||||||||||||||||
| Reserves (million tons)(9)(10)(11) | ||||||||||||||||||||||
| Location | Mineral | Number of quarries(13) |
Proven | Probable | Total | 2022 Annualized Production |
||||||||||||||||
| Mexico |
Hardrock | 13 | 233 | 394 | 627 | 11.1 | ||||||||||||||||
| United States |
Hardrock | 20 | 667 | 38 | 705 | 28.4 | ||||||||||||||||
| Sand&Gravel | 42 | 280 | 92 | 372 | 19.5 | |||||||||||||||||
| Others | 1 | 0 | 0 | 0 | 0.0 | |||||||||||||||||
| EMEAA |
||||||||||||||||||||||
| United Kingdom |
Hardrock | 3 | 269 | 0 | 269 | 6.0 | ||||||||||||||||
| Sand&Gravel | 44 | 161 | 52 | 213 | 9.4 | |||||||||||||||||
55
Table of Contents
| As of December 31, 2022 | ||||||||||||||||||||||
| Reserves (million tons)(9)(10)(11) | ||||||||||||||||||||||
| Location | Mineral | Number of quarries(13) |
Proven | Probable | Total | 2022 Annualized Production |
||||||||||||||||
| France |
Hardrock | 10 | 68 | 36 | 104 | 3.2 | ||||||||||||||||
| Sand&Gravel | 36 | 143 | 23 | 166 | 7.3 | |||||||||||||||||
| Germany |
Hardrock | 14 | 88 | 36 | 124 | 3.1 | ||||||||||||||||
| Sand&Gravel | 14 | 33 | 61 | 93 | 2.7 | |||||||||||||||||
| Poland |
Hardrock | 1 | 4 | 12 | 16 | 1.7 | ||||||||||||||||
| Sand&Gravel | 5 | 11 | 10 | 21 | 3.4 | |||||||||||||||||
| Spain |
Hardrock | 17 | 265 | 83 | 348 | 2.4 | ||||||||||||||||
| Sand&Gravel | 3 | 33 | 0 | 33 | 1.5 | |||||||||||||||||
| Others | 2 | 2 | 1 | 3 | 0.1 | |||||||||||||||||
| Philippines(9) |
Hardrock | 1 | 138 | 0 | 138 | 0.0 | ||||||||||||||||
| Israel |
Hardrock | 6 | 41 | 2 | 43 | 13.9 | ||||||||||||||||
| Sand&Gravel | 1 | 0 | 0 | 0 | 0.8 | |||||||||||||||||
| Rest of EMEAA |
Hardrock | 5 | 3 | 0 | 3 | 0.7 | ||||||||||||||||
| Sand&Gravel | 9 | 13 | 2 | 15 | 1.8 | |||||||||||||||||
| SCA&C |
||||||||||||||||||||||
| Colombia |
Sand&Gravel | 9 | 1 | 46 | 47 | 0.2 | ||||||||||||||||
| Panama |
Hardrock | 0 | 0 | 0 | 0 | 0.0 | ||||||||||||||||
| Others | 0 | 0 | 0 | 0 | 0.0 | |||||||||||||||||
| Caribbean TCL |
Hardrock | 2 | 8 | 0 | 8 | 0.1 | ||||||||||||||||
| Sand&Gravel | 2 | 0 | 4 | 4 | 0.5 | |||||||||||||||||
| Dominican Republic |
Hardrock | 1 | 18 | 0 | 18 | 0.0 | ||||||||||||||||
| Rest of SCA&C |
Sand&Gravel | 4 | 0 | 2 | 2 | 0.0 | ||||||||||||||||
| Cemex Consolidated |
Hardrock | 93 | 1,801 | 601 | 2,403 | 70.5 | ||||||||||||||||
| Sand&Gravel | 169 | 675 | 293 | 968 | 47.1 | |||||||||||||||||
| Others | 3 | 2 | 1 | 3 | 0.1 | |||||||||||||||||
|
|
|
|
|
|
|
|
|
|
|
|||||||||||||
| Totals | 265 | 2,478 | 895 | 3,373 | 117.7 | |||||||||||||||||
|
|
|
|
|
|
|
|
|
|
|
|||||||||||||
| (9) | Although Cemex, S.A.B. de C.V. consolidates CHP into its consolidated financial statements under IFRS, as of December 31, 2022, we did not control the raw materials used in our operations in the Philippines. Such raw materials were primarily supplied by ALQC and IQAC. ALQC was wholly owned by Impact Assets Corporation, which is a corporation in which we owned a 40% equity interest. As of December 31, 2022, IQAC was wholly owned by Albatross Holdings, which is a corporation in which we owned a 40% equity interest. Values presented for properties on the Philippines have not been prorated by the 40% interest. |
| (10) | Figures for Reserves and Resources are rounded. |
| (11) | Our 2022 aggregates resources and reserves were estimated based on an average sales price during 2022 for aggregates of $14.20 per ton, excluding freight. This price is impacted by product mix, location and exchange rates. |
| (12) | Resources and reserves are reported excluding expected wastes, meaning its best estimation of final usable/salable material. |
| (13) | The number of quarries may include sites in exploration stages. |
See “Item 4—Information on the Company—Our Corporate Structure” for further details on our processing plants, other available facilities and operations.
Internal Controls
Cemex has implemented controls and procedures designed for quality assurance and quality control on the Company’s production activities and associated information for the estimation of mineral resources and reserves.
56
Table of Contents
The quality assurance and quality control measures are applied to exploration, quarry production and cement plant processing activities. Cemex applies industry standards to evaluate the reliability of laboratory results that analyze exploration samples used in calculating mineral resource and reserve estimates, which are then analyzed and verified annually by other business units within the Company, jointly with the associated regional technical managers, once such information is available. Qualified persons and experts also verify the data resulting from analysis prior to using it in their work.
Additionally, Cemex has implemented internal controls designed for its mineral resources and reserves estimates to be compliant with Regulation S-K 1300 requirements, including the preparation of resources and reserve estimates by qualified persons and experts on the matter in the different locations where Cemex operates.
Our Strategic Priorities
Cemex has a general vision and value creation model comprised of the following six elements: (i) purpose, (ii) mission, (iii) values, (iv) strategic priorities, (v) operating model and (vi) stakeholders.
PURPOSE. We expect to build a better future for, among others, our employees, our customers, our shareholders, our investors, our suppliers and the communities where we live and work.
MISSION. We intend to create sustainable value by providing industry-leading products and solutions to satisfy the construction needs of our customers around the world.
VALUES. We intend to: (i) protect the safety of all our employees by being accountable to each other for our actions and behaviors and trying to be an industry leader by example; (ii) focus on our customers by aligning ourselves closely with their business and their needs and, following through with our commitments, resolving problems quickly and making it easy to do business with us; (iii) pursue excellence in all aspects of our business and interactions with customers by challenging ourselves to constantly improve and build upon our strong reputation around the world for quality and reliability; (iv) work as one Cemex by leveraging our collective strength and global knowledge to share best practices, replicate good ideas and collaborate across boundaries; and (v) act with integrity by remaining honest and transparent in all our interactions, complying with our code of ethics and laws and regulations, and caring for our people, communities and natural resources.
STRATEGIC PRIORITIES. To achieve our mission, our strategy is to create value by building and managing a global portfolio of integrated cement, ready-mix concrete, aggregates and Urbanization Solutions businesses. Our five strategic priorities, in no particular order, are (i) Health and Safety, (ii) Customer Centricity, (iii) Innovation, (iv) Sustainability and (v) Operating EBITDA Growth.
Implemented in 2018, our action plan “A Stronger Cemex,” was a transformational plan designed to fortify Cemex’s position as a leading global heavy building materials company, accelerate our path to investment grade, enhance our total shareholder return and generate long-term value for our stakeholders. Under said plan, Cemex: (i) divested $1.6 billion in assets by the end of 2020; (ii) achieved recurring operational improvements of $230 million by 2020; and (iii) accelerated our path to investment grade by further deleveraging Cemex by reducing our debt by $3.5 billion by the end of 2020.
In 2020, we implemented the “One Cemex” commercial model to improve our customers’ experience through customer centricity, aiming to provide a superior omnichannel experience, everywhere and every time. It was supported by digital platforms and the importance of minimizing financial risk, with an aim to maintain ample liquidity. In 2020, we developed “Operation Resilience,” our medium-term strategy for the following three years, a decisive action plan designed to maximize shareholder value and reposition us for higher Operating EBITDA growth on a risk-adjusted basis. “Operation Resilience” was not only about deleveraging but also about
57
Table of Contents
building a lower risk and faster growing business. Initially, “Operation Resilience” was aimed at (i) growing the profitability of our business to achieve a consolidated Operating EBITDA margin equal to or greater than 20% by 2023, considering our then current portfolio, through cost reduction measures and other commercial and operational initiatives; (ii) optimizing our portfolio for Operating EBITDA growth through the execution of strategic divestments and reinvestments, thereby constructing a portfolio more weighted towards the United States and Europe, after which we expect we will be a heavy building materials company with a large part of its footprint represented by the United States, Europe and Mexico, focusing on vertically integrated positions near growing metropolises and developing Urbanization Solutions as one of our four core businesses; (iii) de-risking our capital structure, reducing our cost of funding and ultimately achieving investment grade capital structure by targeting additional net debt paydowns and a leverage target equal to or below 3.0x for December 2023, among other initiatives, including extending our debt maturity profile, minimizing our cost of funding and raising funds in local currency to better align our Operating EBITDA and debt; and (iv) leveraging sustainability and digital platforms as a competitive advantage by moving forward on achieving our 2030 target to reduce our cement CO2 emissions by 35% compared to our 1990 baseline and our ambition to deliver net-zero CO2 concrete by 2050.
During 2022, we made progress on our “Operation Resilience” targets mainly by achieving (i) a consolidated Operating EBITDA margin of 17.2%, despite rising inflation; (ii) $600 million of closed asset sales, which includes our divestments in Costa Rica and El Salvador, as well as a controlling interest in Neoris, and additional fixed assets; (iii) growth investments of $474 million on strategic capital expenditures during 2022, which include bolt-on acquisitions in different geographies like Germany, Spain and Texas, leading to a solid 21% Operating EBITDA growth in our Urbanization Solutions core business; (iv) leverage of 2.84x, reaching two years in a row with a leverage ratio below our initial objective, with a total debt plus other financial obligations reduction of $332 million during 2022; and (v) as of December 31, 2022, a reduction in CO2 emissions of 30% compared to our 1990 baseline. As a result of the progress made, in addition to our previously existing “Operation Resilience” targets not yet achieved, we now look, as part of our strategic priorities, to maintain our investment grade capital structure and ultimately regain an investment grade rating, and also replaced our previously existing 2030 target to reduce our cement CO2 emissions by 35% compared to our 1990 baseline with a more ambitious 47% reduction goal.
During 2022, we repaid or refinanced $1.9 billion of debt, and by applying free cash flow and proceeds from asset sales, we reduced consolidated net debt, as defined in the Credit Agreements, by $300 million. Also during 2022, we reduced interest expenses by $45 million, or 8% compared to 2021. Most importantly, we increased the leverage ratio, as calculated under the Credit Agreements, by 0.11x to 2.84x.
In addition, to further fortify our balance sheet, we continue to be focused mainly on the following three initiatives, while at all times remaining committed to building a better world and helping alleviate some of the biggest challenges communities are facing today: (i) growing our Operating EBITDA through further cost- reduction efforts, operating efficiencies, customer-centric commercial strategies across all our core businesses and strategic growth investments; (ii) maximizing our free cash flow, which is expected to be used mainly for debt reduction and our bolt-on investments; and (iii) continuing to execute selective accretive divestments by selling what we believe are non-essential assets, which could allow us to free up more free cash flow.
Health and Safety
Health and Safety (“H&S”) remains our top value and priority. We are working towards developing a culture within which everyone in our organization embraces H&S. We believe that the health and safety of our employees, contractors and the people we interact with in our local communities on a day-to-day basis is of the utmost importance.
To help us meet our goals, four core principles guide our decisions and actions: (i) nothing comes before the health and safety of our employees, contractors, and communities; (ii) making health and safety a moral responsibility per employee by looking after ourselves and each other; (iii) looking to create safe workplaces; and (iv) maintaining accountability for health and safety practices.
58
Table of Contents
Our Global Health and Safety Policy is the cornerstone of our Health and Safety Management System (“HSMS”) and sets out clear expectations for our leaders and workforce to carry out their activities in a safe manner and to care for the well-being of our employees, contractors and other people with whom we interact. The HSMS is our main tool to establish performance requirements and goals for our operations by helping us assess potential risks and plan the measures needed to mitigate them in a coordinated manner. The HSMS is designed to empower our leaders to implement a successful health and safety strategy across our operations and guides us on how to adequately allocate resources to training programs for our employees. Furthermore, our line managers utilize our HSMS on an ongoing basis to make an annual review of further improvement opportunities and to formulate annual Health and Safety Improvement Plans.
We are constantly working towards our ultimate target of zero injuries worldwide, evidenced by our Zero4Life objective. In 2022, we maintained a low employee Lost-Time Injuries (“LTIs”) frequency rate of 0.5, and we are working toward reducing this rate to 0.3 and 0.2 by the end of 2023 and 2025, respectively. Our employee Total Recordable Injuries (“TRIs”) frequency rate improved to 2.3, and we also expect to reduce this rate by the end of 2023. While the number of contractor LTIs increased by six cases when compared to 2021, contractor TRIs decreased by 5.3% in 2022. In 2023, we continue to work on health-related actions to achieve a reduction in our employee sickness absence rate, which decreased by 10% in 2022.
We had 79% fewer overall fatalities in 2022 compared to 2021 when considering third-party, contractor and employee fatalities. However, the number of employee fatalities specifically increased from one to three. Our figures are aligned with the recently revised Global Cement & Concrete Association’s (“GCCA”) guidelines and guidance. We also continued to make progress in most countries, as 96% of our operations achieved zero fatalities and LTIs of employees and contractors.
We continue to pay particular attention to the avoidance of incidents involving moving vehicles. In an effort to eliminate such types of incidents, we continue to focus on specific initiatives ranging from innovative awareness campaigns and safety features to defensive driving training and workshops. In 2022, we took a step forward in digitalization to become one of the most advanced fleets in our industry. The digital vehicle safety features we employ include sensors, mobile apps, GPS tracking, camera systems and other types of safety equipment, such as artificial intelligence systems that managers review to give feedback to our drivers to highlight both risky behaviors and good driving performance. We will continue to work hard and drive forward with our initiatives so that our employees and contractors understand the importance of and become integral to our H&S culture.
The following table sets forth our performance indicators with respect to safety by geographic location, accurate at the time of reporting and in accordance with GCCA’s guidelines and guidance for the year ended December 31, 2022:
| Mexico | United States |
EMEAA | SCA&C | Total Cemex |
||||||||||||||||
| Total fatalities, employees, contractors and other third parties (#) |
1 | 1 | 0 | 1 | 3 | |||||||||||||||
| Fatalities employees (#) |
1 | 1 | 0 | 1 | 3 | |||||||||||||||
| Fatality rate employees(1) |
0.6 | 1.1 | 0 | 1.9 | 0.6 | |||||||||||||||
| Lost-Time injuries (LTI), employees (#) |
28 | 17 | 8 | 3 | 56 | |||||||||||||||
| Lost-Time injuries (LTI), contractors (#) |
22 | 7 | 12 | 8 | 49 | |||||||||||||||
| Lost-Time injury (LTI) frequency rate, employees per million hours worked(2) |
0.6 | 0.8 | 0.4 | 0.2 | 0.5 | |||||||||||||||
| (1) | Incidents per 10,000 employees in a year. |
| (2) | Working hours are directly measured and/or obtained using recognized industry methods. |
At Cemex, training is a key part of our strategy to achieve our Zero4Life commitment. We continuously revise and seek to improve our training programs and strive for all our employees to possess the correct knowledge, skills, and experience to perform their jobs safely.
59
Table of Contents
As part of our training program, executives, line managers, and supervisors must complete our Health and Safety Academy, designed to enhance their leadership skills in relation to our Health and Safety number one value and priority across our organization. The Health and Safety Academy was launched in 2016 with our Foundation Module, which prepares our line managers to lead by example and play a fundamental role in ensuring safety throughout our operations. Launched in 2017, Module 2 enables our line managers to utilize our HSMS tool to help achieve our Zero4Life commitment in their operations. Module 3, deployed in 2018, is designed to enhance the health and safety proficiency of our line managers in key topics.
In 2021, due to restrictions on face-to-face meetings, we strengthened our Health and Safety Academy training to address the new pandemic and epidemics element in our HSMS tool through Cemex University’s self-learning platform. During 2022, following our implementation of Behaviors That Save Lives, we restarted our in-person Health and Safety Academy sessions in EMEAA, Mexico, SCA&C and the USA covering an audience of over 2,000 learners. This effort focused not only on training employees but also on developing new trainers. To support this effort, we enhanced our 360-assessment, which is a crucial element of the Health and Safety Academy, and translated it into nine languages. We expect to deploy the 360-assessment across the regions in which we operate.
In 2022, we launched a new Cemex Wellbeing Model to serve as a common framework for all our operations worldwide. We expect the model will help us have a unified approach and a solid base to improve our wellbeing offering over the coming years. We have developed a gap analysis tool to assist our operation teams implementing the model. The initiative will be supported by medical professionals from our Global Health Forum of experts. Additionally, we developed a communications campaign to promote our Wellbeing Model focused on emotional health, physical health, financial fitness, and workforce experience. All activities included in the Cemex Wellbeing Model are designed to reduce the prevalence of health risks and encourage employees to live a healthy lifestyle both inside and outside the workplace.
Finally, we started the development of an online course focused on the principles of Visible Felt Leadership, which is the development of a constant, consistent and positive leadership approach towards Health and Safety in everything a manager does, starting with those at the very top of an organization. This learning experience will be deployed globally as an introductory module of the Health and Safety Academy, and as a tool to develop senior leadership with a focus on health and safety issues.
As part of our Contractor Health and Safety Verification Program, in 2022, we reached our goal of evaluating health and safety practices of at least 91% of our company’s procurement contractors spend. To achieve this goal, we engaged our operations in different countries and worked closely with our Health and Safety Functional Network made up of national health and safety specialists.
Customer Centricity
Cemex is dedicated to helping our customers succeed and our efforts are focused on what success means to them. We are passionate about finding new ways to inspire and satisfy them by innovating around their needs to surpass their expectations in every interaction. Through our “One Cemex” commercial model, we aim to provide our customers with a superior omnichannel experience everywhere and every time, and are creating new opportunities to serve them better. In 2022, we focused on four key efforts:
(1) An Integrated Service Delivery Model
Since 2021, we set on a path to provide our customers with a frictionless, consistent, and personalized omnichannel experience to deliver fast responses to their needs. Our Service Delivery Model aims to leverage cost efficiencies and unleash revenue growth potential, while improving our customers’ experience across geographies and within each of our customer segments.
60
Table of Contents
(2) A Robust Voice of The Customer Program
We have been using Bain & Co.’s Net Promoter System® to gather, manage, and act on customer feedback. The Net Promoter Score (“NPS”) is a key experience indicator used to measure our customers’ loyalty across all of our business units since 2018. In 2022, we maintained an outstanding annual global NPS result of 66, significantly above the Retently 2022 NPS benchmark of 45 for the construction and engineering industry and on track for our 2030 NPS target of 70, which we updated from 60 to 70 in 2021.
This Net Promoter System® allows us to transform our customers’ feedback into actionable improvements, leverage enhanced analytics to better understand them, and develop insights to design more targeted, data-based value propositions for them. Since 2021, as part of our Voice of the Customer program, we enabled new means to measure customer satisfaction at a transactional level throughout the entire customer journey and added advanced capabilities such as text analytics, sentiment analysis, and touchpoint correlation analysis.
(3) An Empowered Sales Force
Our employees are at the core of our ability to deliver a superior customer experience and we are committed on empowering them with the right skills, tools and technology to deliver on our customer-centricity promise. LEAP, Cemex’s global sales learning experience, received the Brandon Hall Excellence Bronze Award for the Best Sales Onboarding Program category in 2022, achieved a 91% adoption rate, and earned outstanding satisfaction rates of over 90%. LEAP will continue to evolve into six LEAP Masterclasses, fully focused on sustainable construction and the skills required to deploy Cemex’s products and solutions and reach the company’s goal of achieving net zero CO2 by 2050.
As part of our customer-centricity practice, we recognize excellence and best practices adopted across our business units that lead to a superior customer experience. In 2022, we celebrated our Company’s customer-centric culture and commitment toward our customers at Cemex’s second Customer Experience Day. We will continue working toward delivering such programs that are part of our most valued Cemex traditions.
(4) Cemex: A Digitally Driven Company
We view the creation of a digital organization as essential to our customer-centricity and global business strategy. The technological applications we develop are designed to strengthen our competitive advantage by boosting our customers’ productivity, positively impacting their bottom line and improving their experience when interacting with Cemex. Our digital solutions support our customers in seamlessly carrying out their work with promotional content about our Vertua brand to aid our customers in their transition toward more sustainable construction.
To continue with our digital evolution focused on our customers, we expanded Olivia, our artificial intelligence chatbot, into other markets and countries to help our Customer Service Centers provide responses to our customers’ most common questions. In 2022, Olivia was introduced in the UK in CEMEX Go, WhatsApp, and “ReadyMix2Go,” a professional self-builder’s website. We also launched Olivia in certain of our SCA&C countries, including Peru, Guatemala, the Dominical Republic, Panama, Nicaragua, and Puerto Rico, reaching a global presence in twelve geographies.
(4)(a) Leading the Industry’s Digital Transformation through CEMEX Go
CEMEX Go enables our customers to build more efficient operations and the use of our online store has grown remarkably since 2017. This innovative digital solution automates order-to-cash workflows, which looks to streamline customers’ ability to achieve real-time management, from ordering to tracking to fulfillment. Additionally, CEMEX Go is designed to enhance decision-making capabilities by offering ready access to detailed information and in-depth analytics to make more informed decisions and to save time and money. As of
61
Table of Contents
December 31, 2022, more than 53,000 customers across 21 countries, have been onboarded to our CEMEX Go Online Store, and we received approximately 50% of our main product orders and processed 60% of our total global sales through this platform.
We continue to develop next generation functionalities of our CEMEX Go Online Store. Since its release in 2021, we continued expanding the Online Connection in more business lines and more countries, so that orders are confirmed automatically and in real time. In 2022, we also connected the Ready-Mix Go application to our online capabilities so that customers can view, schedule, confirm, and manage their orders in real time, as well as track deliveries, configure notifications, and view order history from mobile and web devices.
Moreover, we have been encouraging the digitalization of internal and customer processes to minimize the use of paper. As of the date of this annual report, around 73% of our invoices are delivered in a fully digital manner, putting us on track to achieving our global paperless goal.
(4)(b) CEMEX Go Developer Center: New Digital Connections with Our Customers
Our CEMEX Go Developer Center is a platform that allows customers to interact directly with our systems via digital platforms and Application Programming Interfaces. Since 2022, the CEMEX Go Developer Center assists customers from the United States, Mexico, the United Kingdom, Germany, France, Spain, Poland and the Czech Republic creating their orders and receiving real-time status updates in their own management systems of the products they purchased and the services they requested.
(4)(c) CEMEX Go CRM: The Digital Ally for Customer Relationship Service
CEMEX Go Customer Relationship Manager (“CRM”) is present in Mexico, the United States, Colombia, and Cemex’s EMEAA region. CEMEX Go CRM for sales management helps commercial teams provide insightful data and save time in daily planning and managing activities across our global operations by personalizing daily follow-up activities with customers such as the creation of quotes and demand planning. Furthermore, CEMEX Go CRM for customer service is consolidating our core technological layer to strengthen our customer service center capabilities through an omnichannel experience.
(4)(d) Buying Construction Materials in the Digital Age
Construrama.com is the e-commerce solution boosting Construrama in Mexico, the largest construction materials distribution network in the country. Today, more than 100,000 online users can purchase from a wide catalog of products and construction materials.
Cemex Professional and Self Builders (“PSB”) platform offers a full e-commerce experience for self- builder customers through a simple and fast online solution that guides them to select the right concrete products, place orders and pay online. In 2022, we improved the PSB platform user experience and released version 2.0 in the United Kingdom, which we expect to make available in the United States in 2023. As of the date of this annual report, Cemex PSB is also available in Mexico and Colombia.
Innovation
Innovation is key to remaining at the forefront of our industry and advance in achieving our strategic goals as a forward-looking company. More importantly, it is one of the key levers in building a sustainable and profitable business in the new green economy.
Cemex’s innovation activities occur on two fronts: “Open Innovation” and Internal Research and Development (“R&D”). Open Innovation initiatives, led by Cemex Ventures, aim to monitor and identify the next generation of products and services, invest in high potential opportunities/technological breakthroughs, seek strategic collaborations accelerate technological developments with high potential and create an ecosystem of collaboration with partners. Internal innovation is led by our Global R&D team in Switzerland, and our experts work in close
62
Table of Contents
collaboration with Cemex Ventures to harness R&D knowledge and experience and bring value to the Open Innovation process, as well as develop novel and alternative paths to address climate change and sustainable construction needs. A key element of Cemex’s R&D is the engagement and close collaboration with key partners and stakeholders, whether that is start-ups, universities, companies or external and internal customers.
Our Global R&D team’s technological agenda is focused on addressing climate change to support Cemex’s Future in Action climate program, which is built on four pillars: (i) developing sustainable products and solutions; (ii) decarbonizing Cemex’s operations; (iii) innovations and partnerships; and (iv) promoting a green economy. As a result of these efforts, in 2021 we developed a range of low embodied CO2 cement and ready-mix products under the global brand Vertua, including Vertua Lower Carbon, a range of products in our portfolio that have a lower embodied CO2 compared to a corresponding reference. For cement, the reference is 822 net kg CO2/ton of gray cement, which is the GGCA default value for gray clinker emissions, based on the world weighted average for clinker net direct emissions. For ready-mix concrete, the reference is a concrete composed of 100% Ordinary Portland Cement fulfilling the average strength of the most standard structural concrete, which is 350 kg CO2/m3. On the sustainable products and solutions front, sales of Vertua Lower Carbon products have reached 40% for cement and 30% for ready-mix concrete in 2022. Also in 2022, the scope of Vertua has been extended beyond Lower Carbon, and currently includes the following attributes in its value proposition: energy efficiency, design optimization, water conservation, and recycled materials. Consequently, Cemex is well positioned to offer a portfolio of products and solutions addressing as well as promoting sustainable construction practices. As of the date of this annual report, Cemex estimates that, during 2022, Vertua-branded cement represented 41% of total cement volumes and Vertua-branded ready-mix represented 33% of total ready-mix volumes, a 14.8% and 16.1% year-over-year increase, respectively.
Our focus goes beyond products. We establish meaningful targets to de-carbonize our operations and drive our CO2 footprint of concrete to net zero. Some innovations in our pipeline include novel approaches to reduce clinker factor, value creation from CO2, CO2 utilization in mineralization (carbonation) of materials (e.g., recycle concrete), technologies to repurpose waste materials to enable their reuse and recycling, and the exploration of renewable energy sources to replace fossil fuels. In 2022, one of our projects provided an example of value creation from CO2 by demonstrating that it is possible to use CO2 directly as is from the flue gases to produce carbon nano materials, which in turn have several high-value uses in the automotive, electronic, and medical fields, among others. As we previously announced, Cemex is working on using Concentrated Solar Thermal energy to entirely drive the clinker production process with renewable energy. Recently, we produced the first-ever solar clinker. Furthermore, we are developing processes that can micronize materials that are potential clinker substitutes and we are finding that due to increased reactivity of these materials, we can expect to further decrease the clinker factor in our cement products. CCUS is another central focus of our research. We expect that approximately 30% of our total CO2 emissions may one day be reduced through CCUS. CCUS is an important part to achieve our net zero concrete strategy by 2050. We are diligently working to assess different technologies and pilot the most promising ones, always taking a targeted approach. Cemex is also competing for public funds. At least 50% of such publicly funded projects related to CCUS. Other publicly funded projects include electrification, renewable energy, waste heat recovery, circularity, and sustainable products. Additionally, through Global R&D, Cemex is actively participating in the GCCA’s innovation network Innovandi to develop pre-competitive knowledge on these very same key technologies for our industry. Collaboration among companies from different sectors of the industry is fundamental to address the challenge of climate change in unison. We have played an active role in GCCA’s Innovandi Open Innovation Challenge, which has resulted in the first six consortia between start-ups and GCCA member companies, which are formal working partnerships supported by the GCCA to accelerate groundbreaking technologies addressing CCUS. Innovation at Cemex is taking place on different fronts, processes, and initiatives that harness the most advanced knowledge and experience to support Cemex in achieving its strategic goals.
During 2022, we have been active in the integration of building information modeling technology into our interaction with customers, which provides our customers with tools that allow them to visualize the impact of our products on their projects as well as the potential time, energy, and CO2 savings from incorporating our
63
Table of Contents
technologies and construction solutions. By providing superior and sustainable products, solutions and services, we aim to grow from being a product-selling company to a comprehensive solutions provider.
To the best of our knowledge, as the only global building materials company that develops and manufactures its own chemical admixtures for cement, ready-mix concrete, and aggregates, we can design and develop novel, tailor-made product technologies with our proprietary chemicals. An increasing number of admixtures are being developed to enhance the performance and sustainable characteristics of our core products and solutions, such as increasing our cement strength and helping concrete to harden more rapidly, improve its flow, develop its self-curing properties and water repellency, and enable the recycling of returned concrete into aggregates. But beyond specific products or solutions, our value proposition is designed around a “Palette of Technologies” from which we can draw up new solutions based on each project’s specific and unique requirements. We expect our Urbanization Solutions core business to be well positioned to develop and grow in the performance materials market, and be competitive due to the growing range of admixture products. An important development from Cemex’s admixtures R&D efforts has been the development of the D.fab admixture family for the 3D Printing of ready-mix concrete—a true first. With Cemex’s D.fab technology it is possible to adopt locally sourced materials, instead of bagged and very specific as well as highly expensive mortar products, to produce actual concrete for 3D printing construction at one-sixth the price of mortars. Cemex and its 3D Printing partner COBOD, manufacturers of multifunctional construction robots based on 3D printing technology, have seen a very important adoption of the D.fab technology in 2022: 85% of the projects printed by COBOD.
Our Global R&D team supported the design, creation and launch of our new value-added aggregates brand, Neogem. These products are specialized high-quality aggregates, whose intrinsic properties are designed to meet the essential needs of five market sectors—Agricultural, Environmental, Industrial, Landscaping and Sports. Neogem covers an extensive range of premium minerals that can add value to our customers’ projects through particular functional or aesthetic features. Neogem products are innovative, carefully selected and tailor-made solutions designed to go beyond commonly known building materials. In 2023, we plan to continue the development of the Neogem brand.
Technologies developed by our Global R&D team are protected by more than 45 international patent families and over 70 trade secrets covering new types of cement, cementitious materials, concrete mix designs, admixtures formulations, construction systems and advanced manufacturing processes.
In addition, we have more than 40 core strategic trademarked software products, developed to enable new specific capabilities in Cemex’s Digital Commercial Model, which are protected by copyrights that primarily cover online stores and order-to-fulfillment in our cement, ready-mix and aggregates businesses. This software includes proprietary developments in machine learning and vectorized algorithms to reduce response time, reduce costs and honor commitments made with customers, providing Cemex with cutting edge competitive advantages.
Fostering Innovation and Enabling New Business Opportunities. Since its launch in 2017, our open innovation and corporate venture capital unit, Cemex Ventures, continues to engage with startups, entrepreneurs, universities, and other stakeholders to shape the construction ecosystem of tomorrow by tackling our industry’s toughest challenges.
Leveraging our knowledge of the industry and Cemex’s leading edge technologies and platforms, Cemex Ventures develops collaboration opportunities and targets innovating partnerships and investments in the following four target areas connected to the execution of our strategic priorities, which we further subdivide as set forth below:
| • | Green Construction—CO2 capture, utilization & storage; sustainable materials; circular economy; waste management & recycling; and new energy sources & solutions. |
| • | Construction Supply Chain—Materials, resourced procurement and marketplaces; logistic tools & materials tracking; fleet management & dispatching; last mile & delivery marketplaces; inventory management & on-site handling. |
64
Table of Contents
| • | Enhanced Productivity—Project design, specification and budgeting; planning & scheduling; project monitoring & control; document management; H&S compliance; project quality; and asset management & maintenance. |
| • | Construction’s Future is Now—Advanced building materials; 3D printing; industrialized construction (offsite, modular and precast); robotics & machine assisted applications; and smart cities & buildings. |
Jointly with the Cemex Global R&D and other functions, Cemex Ventures also promotes the expansion of our open innovation ecosystem in search of opportunities in new construction trends and technologies, including construction materials, decarbonization and processes evolution.
Cemex Ventures’ main role is to look for strategic partnerships and investment opportunities that go beyond our core businesses. It also aims to identify and assess emerging technologies to bring Cemex new ideas and perceptions of the construction ecosystem. To this end, Cemex Ventures allocates resources to search, incubate, and deploy innovative construction-related opportunities and solutions.
As of December 2022, Cemex Ventures has invested in 21 startups headquartered in nine countries and focused on developing the aforementioned target areas within the construction industry. During 2022, Cemex Ventures invested in three new startups and six follow-on investments in its portfolio companies. Additionally, Cemex Ventures held its 2022 Construction Startup Competition with other top industry partners, seeking entrepreneurs and startups to drive innovation in the construction industry. Almost 500 startups participated, closing the event with 8 winners (two in each of the four target areas).
A significant contribution of Cemex Ventures has been the establishment of strategic collaborations with external partners to contribute to Cemex’s strategic goals in Cemex’s Climate Action, Digitalization and Urbanization Solutions programs, strategy, and business, respectively. We have closed several agreements in collaboration with the relevant Cemex areas. Some examples are: 1) the evaluation of an offtake agreement to sell 450,000 tons of CO2 to be converted into sustainable fuels (e-methanol), 2) cooperation in the development and large-scale deployment of electrification technology for high-temperature heating in production sites of Cemex for low-CO2 clinker and cement production; 3) processing of waste (refuse-derived fuel) for the production of syngas as an energy source for our cement operations; and 4) introduction of the first 3D printer for concrete in Mexico.
In 2019, Cemex Ventures launched the “Smart Innovation” platform, aiming to bolster internal innovation at Cemex. A vehicle to foster innovation at all levels of the organization, the Smart Innovation platform seeks to challenge the status quo, promote a culture of innovation within Cemex and facilitate the execution of ideas. As of the date of this annual report, the Smart Innovation platform has more than 170 projects in the experimentation phase which we expect to have a direct impact on Cemex and the construction industry.
This platform, has enhanced the portfolio management process within the organization, ensuring initiatives are correctly managed, resources are assigned to experiment and scale up innovative solutions.
In addition, the Cemex Ventures’ Leaplab acceleration program was launched in the second semester of 2022. A fixed term collaboration scheme with early-stage startups aiming to catalyze their growth and boost innovation, by timely accessing promising solutions that can generate strategic value and business opportunities. In its first cohort, Leaplab launched pilots with five startups in six Cemex operations (Spain, Mexico, USA, Israel, the United Kingdom and Colombia) testing different technologies like energy harvesting solutions, machine learning and computer vision applications for Health and Safety matters, and digital solutions for concrete monitoring, production optimization and fleet maintenance. The program is also designed to expose and connect a key group of Cemex subject matter experts to Cemex Ventures open innovation platform and the wider entrepreneurial ecosystem.
65
Table of Contents
Sustainability
Our sustainability efforts begin with Cemex, S.A.B. de C.V.’s Board of Directors and are then facilitated across our entire organization. During 2022, Cemex, S.A.B. de C.V.’s Sustainability Committee (now named the Sustainability, Climate Action, Social Impact, and Diversity Committee) was comprised of four members of Cemex, S.A.B. de C.V.’s Board of Directors, including Cemex’s Chief Executive Officer. This committee reports directly to Cemex, S.A.B. de C.V.’s Board of Directors and is supported by our Corporate Sustainability function, which as of December 31, 2022, reported to the Executive Vice President of Sustainability, Commercial and Operations Development, who is also a member of our senior management. To help embed sustainability into our entire business strategy, we have coordinators representing each geographical region where we operate. In parallel, our Global Sustainability Functional Network works to implement our core sustainability initiatives across all our operating regions and business lines. The members of the committee as of the date of this annual report were elected at Cemex, S.A.B. de C.V.’s ordinary general shareholders’ meeting on March 23, 2023.
Our Climate Action Strategy. In 2020, we announced that we would move ahead with our Climate Action Strategy and continue advancing towards our vision of a carbon-neutral economy. At the time, we defined a 2030 reduction target of 35% of net CO2 emissions per ton of cementitious product compared with our 1990 baseline, established our ambition to deliver net-zero CO2 concrete globally to all our customers by 2050 and developed a detailed CO2 roadmap for each of our manufacturing plants aligned with a 2°C scenario.
In 2021, we announced our Future in Action climate action program focused on developing lower-carbon products, solutions and processes while increasing sustainability awareness and promoting a green economy. Under Future in Action, we are accelerating our short-term effort to reach our climate goals; our original intermediate goals were to (i) achieve a 35% reduction of CO2 emissions in cement compared to our 1990 baseline, increase our use of alternative fuels to 43% of our total fuel mix, reduce our clinker factor to less than 74% and reach approximately 40% in clean electricity consumption, all by 2025; and (ii) achieve a 35% reduction of CO2 emissions in cement compared to our 1990 baseline, achieve a 40% reduction of CO2 content in concrete compared to our 1990 baseline, increase our use of alternative fuels to more than 50% of our total fuel mix, reduce our clinker factor to 71% and reach 55% in clean electricity consumption, all by 2030.
As a result of our performance in 2021, as of the date of this annual report, we set the following more ambitious CO2 emissions reduction targets for 2030: (i) achieve a 47% reduction of CO2 emissions in cement as compared to our 1990 baseline, (ii) achieve a 41% reduction of CO2 content in concrete as compared to our 1990 baseline, (iii) increase our use of alternative fuels to more than 55% of our total fuel mix, (iv) reduce our clinker factor to 68%, and (v) reach 65% in clean electricity consumption. Also, in 2022, we validated our 2050 net-zero CO2 target and new 2030 decarbonization goals under SBTi’s 1.5ºC scenario methodology, becoming one of the first companies in the industry to do so. Most importantly, these goals should keep us on the right path to achieving our expected objective of net-zero emissions across the company by 2050. As of the end of 2022, we reduced our direct CO2 emissions to 562 kg CO2 per ton of cementitious product, which represents a 29.9% reduction compared to our 1990 baseline and is in line with how our industry measures progress on reducing net CO2 emissions.
Our 2030 goals and commitments are aligned and have been validated by the SBTi according to the 1.5°C scenario. To achieve our 2030 goals, we have updated our detailed CO2 roadmap for each of our manufacturing plants to accelerate the rollout of proven technologies worldwide. Our roadmap is mainly based on the following CO2 reduction levers: (i) accelerating the use of alternative fuels with high biomass content, (ii) optimizing thermal efficiency in our cement kilns, (iii) increasing the use of decarbonated raw materials in clinker, (iv) using novel clinkers such as low-temperature clinker and low CO2 clinker, (v) reducing clinker factor through blended cements and (vi) maximizing our clean electricity consumption. Additionally, during 2022, our targets for scope 2 and 3 emissions were validated by SBTi. We are currently working on our transport roadmap to reduce our transport-related emissions. Our roadmap, including our direct (Scope 1) greenhouse gas emissions and indirect electricity (Scope 2) emissions, has been validated by Carbon Trust, an internationally recognized consulting company that provides a rigorous third-party assessment of carbon reduction plans.
66
Table of Contents
As of December 31, 2022, Cemex reduced its clinker factor by 1.5% to 73.7%, at net CO2 emission levels of 562 kgs per ton of cementitious product. Additionally, as of December 31, 2022, 44% of our clinker production utilized hydrogen injection technology and we reached an alternative fuel substitution rate of 35%.
The technology for some of the main CO2 reduction levers on which our path to achieve our 2050 ambition will be based is still in the early stages of development, setting an open path for innovation that requires continuous work in our Research and Development Center, new investments by Cemex Ventures, the formation of strategic partnerships, and cross-industry collaboration. Nevertheless, we anticipate that the main levers that will lead us towards our 2050 ambition will be: (i) our 2030 CO2 reduction cement levers, (ii) carbon capture, utilization and storage, (iii) increasing clean electricity and energy efficiency, (iv) low-carbon transport, (v) extending circular economy principles, (vi) new concrete technologies, (vii) reforestation and carbon removal and (viii) concrete re-carbonation.
Improving Quality of Life and Well-being. As a company that looks to make a progressive positive impact through its innovative services and solutions, our ability to operate as a responsible business is fundamental to our business model. This enables us to understand stakeholders’ material issues, map social impacts, and identify risks and opportunities to create shared value for us and society.
Furthermore, to reinforce our commitment with climate action, we have signed the Business Ambition for 1.5°C commitment led by the We Mean Business Coalition in partnership with the SBTi and the U.N. Global Compact, joined the Race to Zero Campaign of the UNFCCC launched to mobilize net-zero commitments from cities, businesses, and investors ahead of the 2021 United Nations Climate Change Conference (“COP26”), joined the Corporate Leaders Group Europe convened by the Cambridge Institute for Sustainability Leadership in support of a climate neutral economy, and are founding members of both the First Movers Coalition launched at COP26 by the World Economic Forum and the U.S. State Department and of the United Nations Global Compact CFO Coalition for the Sustainable Development Goals, which provides a platform to interact with peers, investors, financial institutions, and the United Nations with the aim of attracting more capital towards sustainable development. During 2022, Cemex had a strong presence at the 2022 United Nations Climate Change Conference (“COP27”).
Our high impact social strategy directly contributes to our vision of seeking to build a better future and aims to create value, understand our stakeholders’ expectations by managing our impacts and contribute to the quality of life and well-being of the cities and communities where we operate through four focus areas:
| • | People—We provide community members with access to education and workplace training that enables inclusive long-term upward mobility. |
| • | Economy—We support organizations and individuals that contribute to boosting local economies by developing skills to foster entrepreneurship, enable a sustainable economy and lay the groundwork for a just transition. |
| • | Structures—We leverage our expertise and quality by building materials to improve the standards for livable housing and basic infrastructure in cities and communities. |
| • | Cities—We contribute to building green spaces and resilient communities, focusing on the natural and built environments. |
Although our social projects focus on our core business expertise to create value and well-being, we believe that we are also causing positive impacts on other global challenges. Thus, consistent with our commitment to the United Nations Sustainable Development Goals, we measure our progress and contributions to some of these goals.
Pursuing Excellence in Environmental Management. We believe the pursuit of excellent environmental practices benefits sustainable growth. In addition to Cemex, S.A.B. de C.V. Board of Directors’ Sustainability,
67
Table of Contents
Climate Action, Social Impact, and Diversity Committee, our primary environmental executives responsible for each of our operating regions, shares new trends, proposals and best practices to identify, inform, and tackle key environmental management concerns.
We are committed to contributing to climate change mitigation and its consequences. For years, as part of our carbon emissions reduction strategy, we have focused on using low-emission alternatives to traditional fossil fuels, decreasing our clinker factor, promoting clean energy and increasing energy efficiency across our operations. To this end, we have continuously sought to increase our use of low carbon alternative fuels, which represented 35% of our total fuel mix in 2022, and generated approximately $411 million in savings including fossil fuels costs and CO2 emissions avoided in carbon regulated markets.
As a result of our efforts, in 2022, we reduced our net CO2 emissions per ton of cementitious products by 29.9% compared to our 1990 baseline—equivalent to the annual emissions generated by 2.4 million passenger vehicles. We actively seek to develop new technologies to reduce our carbon footprint. Most notably, as of December 31, 2022, we are participating in more than 30 disruptive projects in the pipeline across our value chain to assess potential CO2 emissions reduction solutions as well as carbon capture, utilization and storage technologies. Furthermore, we explore alternatives to traditional clinker and cement chemistry that enable the production of less CO2-intensive cements.
To complement these technical measures, we participate in several forums and bilateral dialogues with key stakeholders. These activities are designed to disseminate knowledge about potential reduction measures in our sector and to promote a legislative framework that enables us to implement these measures. As an example, we have a long history of contributing our best practices through our work with the Cement Sustainable Initiative (“CSI”). The work done in CSI was transferred as of January 1, 2019 to the GCCA. The GCCA is an initiative of more than 39 major producers that actively promotes the use of concrete as an essential material for construction.
We have the expertise to responsibly source, process, store and recover energy from alternative fuels and we strongly believe that increasing co-processing residues from other sectors in our cement plants will further contribute to overcoming challenges such as climate change, waste management and fossil fuel depletion, while utilizing the principles of a circular economy.
Our key contribution to a circular economy is our transformation of waste streams from other sectors into valuable materials. In 2022, we managed approximately 27 million tons of waste in our business, including alternative fuels and raw materials, alternative/secondary aggregates, own recycled material in our main businesses and other waste managed by the company. This is close to 67 times the amount of waste we sent to landfills and equivalent to the waste produced by more than 33 million people in one year. Regarding our own waste, to reduce most of the waste generated from our processes, we maximize our reuse of clinker kiln dust in our production loop, largely avoiding landfill disposal.
To realize the financial and environmental benefits of waste, we monitor, minimize, reuse and recycle our waste, whenever possible. In 2022, 94% of the waste generated by our production processes was recovered, reused or recycled. The remaining material was sent to disposal sites.
Cemex Environmental Management System (“EMS”). We use EMS to evaluate and facilitate consistent and complete implementation of risk-based environmental management tools across our operations. The EMS consists of key mechanisms for environmental performance enhancement and impact assessment, stakeholder engagement and accident response based on input from a range of environmental and biodiversity specialists.
As of December 31, 2022, 92% of our operations had implemented either the EMS or equivalent programs. As we approach full implementation of our global EMS, our goal is for all of Cemex’s operational facilities to be 100% compliant with our internal environmental criteria.
68
Table of Contents
The release of nitrogen oxides, sulfur compounds and dust occurs during cement manufacturing. Other emissions, including dioxins, furans, volatile organic compounds and other heavy metals, are released in very small or negligible quantities. To control our stack emissions and assists us in remaining compliant with local and national regulations, we have steadily expanded emissions monitoring at our manufacturing operations even exceeding regulation requirements in many geographies.
Through our internal EMS and more specifically through our Atmospheric Emissions Global Procedure, we monitor major emissions which assists us with our compliance with local regulation limits. In 2020, we launched a new industry-benchmark online tool that allows operators and management teams to closely analyze major emissions, improve monitoring abilities from kilns with a Continuous Emissions Monitoring System installed, and strengthen emissions performance. To further improve upon these efforts, we have updated the minimum performance levels to fulfill annually for major emissions. In addition, we are working on establishing more stringent environmental standards for air emissions that are expected to be based on EU “Best Available Techniques.”
In 2022, we invested $170.8 million in sustainability related projects at our global operations, including projects to monitor and control our air emissions, increase our operations efficiency and mitigate our carbon footprint through alternative fuels and clinker substitution efforts.
Our Environmental Incidents Management. We consistently work to minimize our environmental impact, and we believe we are generally prepared to respond to emergencies that may pose a potential threat to our operations and local communities: (i) we work with our neighbors, law enforcement officials, public agencies, and other stakeholders to develop contingency plans at each of our sites; (ii) we created emergency response teams that are specifically trained to address environmental incidents and hold annual emergency drills; and (iii) we consistently record and report incidents at every level of our business to identify recurring root causes and to share corrective actions.
Our Global Environmental and Social Incident Reporting Process enables all our sites to maintain a proactive approach to respond to emergencies that could potentially impact our communities or our operations. The thorough application of this reporting procedure requires a timely registration of environmental and social impact events, identification and analysis of the root causes, and the implementation of corrective and preventive action plans as a first step toward avoiding their occurrence and reducing their severity. In 2022, our total reported incidents decreased by 7.7%, which is consistent with our permanent efforts for risks monitoring and transparency. There were no category 1 environmental events (major) registered in the year.
Preserving Land, Water and Biodiversity. The preservation of land, biodiversity and water plays a key role in our long-term resource management strategy.
To protect water and enable our business to succeed, we are increasing our water efficiency and minimizing our water waste through the implementation of our Corporate Water Policy. This policy includes standardization of our water measurement based on the water protocol developed in coordination with the International Union for Conservation of Nature. We also have the goal of developing a specific Water Action Plan (“WAP”) comprised of a customized set of response actions to maximize water use efficiency and mitigate specific water risks for each community by adopting recommendations based on the Water Risk Filter tool from the World Wildlife Foundation, for each one of more than 1,500 of our cement, ready-mix concrete and aggregates sites in water- stressed zones. Results indicate that 1% of our operations are in extremely high water-stressed zones and 15% are in high water-stressed zones. In line with our 2030 targets, we plan to develop a specific WAP and follow the implementation roadmap for each of these sites. In 2021, we completed the implementation of WAPs in 100% of the sites located in extremely high water-stressed zones and the first pilot for a site located in high water-stressed zones. During 2022, we completed the implementation of WAPs in 20% of our sites located in water-stressed zones including all the sites located in extremely high water stressed zones.
69
Table of Contents
Sustainable Finance. In September 2021, we launched the Framework that establishes our guiding principles when issuing new sustainability-linked financing instruments, including public bonds, private placements, loans, derivatives, working capital solutions, and other financing instruments. The Framework includes three sustainability-linked key performance indicators, including net CO2 emissions per ton of cementitious product, clean electricity consumption and alternative fuels rate. Additionally, Sustainalytics, a leading independent firm that specializes in providing environmental, social and governance research, ratings, and data to institutional investors and companies, validated the Framework’s alignment with the Sustainability- Linked Bond Principles, the International Capital Market Association’s Climate Transition Finance Handbook, and the Loan Market Association’s Sustainability-Linked Loan Principles. Furthermore, on November 8, 2021, we repaid in full all outstanding indebtedness under the facilities agreement, dated as of July 19, 2017, as amended on April 2, 2019, November 4, 2019, May 22, 2020 and October 13, 2020 (the “2017 Facilities Agreement”). The funds used to repay the 2017 Facilities Agreement were sourced from the 2021 Credit Agreement. The 2021 Credit Agreement is our first borrowing issued under the Framework, which is aligned to the company’s Future in Action climate action program and its ultimate vision of a carbon-neutral economy. The borrowings under the Mexican Peso Banorte Agreement and the 2022 EUR Credit Agreement are also issued under the Framework. The annual performance in respect of the three metrics referenced in the Credit Agreements, which are aligned with those provided for in the Framework, may result in an adjustment of the interest rate margin of up to plus or minus five basis points, in line with other sustainability-linked loans to investment grade rated borrowers. Further expanding our commitments to sustainable finance and building a more sustainable world, in June 2022, we launched the Green Financing Framework, which enables Cemex to issue green financing instruments aligned with the International Capital Market Association’s Green Bond Principles and the Loan Market Association Green Loan Principles. Under the Green Financing Framework, Cemex intends to allocate the net proceeds from the issuances to finance eligible green projects in areas such as CO2 emissions reduction, clean electricity and energy efficiency, clean transportation, water management, air quality, circular economy, and waste management. Sustainalytics issued a second party opinion confirming that the Cemex Green Financing Framework is credible and impactful and aligns with the Green Bond Principles 2021, the Green Loan Principles 2021 and the Transition Finance Handbook 2020.
Attracting and Retaining Talent. Our employees are our competitive advantage and the reason for our success. We aim to offer programs, benefits and a work environment that are designed to attract and retain talented employees. Our approach to talent management is founded on three pillars: (i) employ the right people, in the right place, at the right time to perform the right job to achieve our strategy; (ii) enable a high-performing and rewarding culture to deliver sustainable business value in a safe, ethical workplace and (iii) build and develop our workforce capabilities to confront challenges and pursue excellence.
As we transform and look to expand, one of our main objectives is to develop people with the potential to fill key leadership positions, increasing their experience and capabilities with the intention of having them succeed in increasingly challenging roles. Through this process, we make efforts to help our employees meet their career development expectations and prepare them for key roles as they face critical challenges in their professional development. Our succession management process enables us to build a talented pool of leaders with the skills and understanding of our business fundamentals required to continue the successful implementation of our strategy. Through ongoing training and development opportunities, our employees are taught new skills and their expertise is deepened in several critical areas, including H&S, customer-centric capabilities, environmental conservation and awareness, leadership development and stakeholder engagement.
We look to foster a dynamic, high-performance environment where open dialogue is encouraged and rewarded. Apart from competitive compensation, more than 82% of our global workforce receives health and life insurance benefits beyond those required by local law in their respective countries. Approximately 79% of our global workforce receives retirement provision benefits above local requirements and more than 82% of our operations receive additional funds for disability and invalidity coverage beyond what is required by local laws in their respective countries.
70
Table of Contents
In 2017, we introduced Cemex University, which aims to develop a digital continuous learning ecosystem for our employees and respond to our multi-region, multi-business learning needs. Cemex University leverages traditional in-person training with new digital learning platforms to embed a growth mindset throughout our organization and fulfill our employees’ potential. Today, Cemex University’s learning portfolio comprises of seven academies and a suite of leadership development programs.
Through our Health & Safety, Cement Operations, Culture & Values, Supply Chain, Commercial, Sustainability and Digital Academies, Cemex University develops, business capabilities among our people to support Cemex’s strategy. An example of this is our Award-Winning program LEAP, which in 2021 and 2022 released a total of thirteen modules and a podcast, to help Sales Advisors better understand successful commercial interactions and our new commercial model. During this time, Cemex University also introduced a new Sustainability Academy and three new modules for the Operations Academy providing in-depth perspectives of our production and maintenance processes, as well as our strategy to decarbonize our operation. We continue to develop continuous learning pathways on current topics such as cybersecurity and anticorruption and, during 2023, we plan to continue expanding our learning portfolio by adding new courses on ethics, inclusive leadership and sustainable construction, among others.
Our Human Rights Policy reflects our support and respect for the protection of internationally proclaimed human rights principles, as expressed in the International Bill of Human Rights and the International Labor Organization’s Declaration on Fundamental Principles and Rights at Work. In addition, it recognizes employees, communities, contractors, and suppliers as main areas of impact and reaffirms our commitment to the promotion of and respect for human rights throughout our worldwide operations, local communities, and supply chain. This includes providing a workplace that is free from harassment and discrimination on the basis of race, gender, national origin, sexual orientation, disability and membership in any political, religious or union organization and, as reaffirmed in our Global Recruitment Policy launched in 2020, offering equal opportunities for training, personal development, individual recognition and promotion on the basis of merit. Employees who believe that there may have been a violation of the principles laid down in our Human Rights Policy can report it through various channels, including local Human Resources departments, Ethics Committees and our secured ETHOS line internet website. Community members, contractors and suppliers are also encouraged to submit a report through the ETHOS line if they believe there may have been a violation of our Human Rights Policy or any other guideline as stated in our Code of Ethics and Business Conduct.
Our four Leadership Development Programs—CONNECT, THRIVE, IGNITE, and Leader-to-Leader—allow us to provide new managers, newly appointed directors, and top-tier executives the foundational knowledge and necessary tools to support a successful transition and development in their roles. In 2022, 364 leaders across all our regions and business units participated in these programs.
In order to comprehensively measure the positive net balance of our employee experience, we build on the Employee Net Promoter Score (“eNPS”) methodology, a straightforward statistic. When asked whether they would recommend Cemex as a good place to work, our employees’ responses generated an eNPS score of 45 in 2022, higher than the global benchmark score measured by our survey provider and above our recently updated 2030 annual goal of 43 points. We are using this indicator to identify areas for improvement and for structuring regional, local, and team-specific action plans to address employee concerns.
Additionally, our Workforce Experience Survey helps us better understand from the perspective of our employees what organizational, digital, physical and interpersonal elements of our company require strengthening or developing so we can provide a consistently positive work experience for our employees worldwide. In 2022, 83% of our employees worldwide participated in this anonymous engagement survey, which yielded many important findings. The survey was 100% digital to promote hygiene protocols. To allow for a faster and consistent follow-up to the insights, we not only digitized much of the survey process but also empowered our “X Force” teams, a select group of employees who lead our coordinated follow-up and implementation of action plans that have been derived from our survey results.
71
Table of Contents
Operating EBITDA Growth
We look to operate in markets where we can add value for our employees, our customers and our shareholders. We intend to focus on those markets that offer long-term profitability and Operating EBITDA growth potential, especially around high growth metropolitan areas, leveraging those assets that are best suited to achieve this. We believe that a geographically diverse portfolio of assets, in markets, regions or cities that we believe offer long-term profitability, provides us with the opportunity for significant value creation through profitable organic growth over the medium-to-long-term. Consequently, we intend to be selective and strategic about where we remain and where we operate. We believe our business portfolio should be particularly focused on high growth metropolitan areas that combine strong fundamentals, ranging from economic growth potential to strong construction investment, population growth, degree of urban development and political stability, all under the basis of sustainable urbanization. By identifying the needs of these markets and metropolises, we expect to be in a better position to offer a more complete value proposition of products and solutions to our clients and citizens of these markets and metropolises.
As of the date of this annual report, as part of our strategic priorities, we are undertaking actions that are designed to streamline and reposition our portfolio in order to enhance our diversification and achieve higher profitable growth. As such, we expect to rebalance our portfolio by focusing on the markets we believe offer long-term growth potential and retaining those assets that we believe are best suited to grow, offering us long-term profitability. While these actions are being undertaken, we could continue to complement our strategic priorities with organic, bolt-on investments, on a stand-alone basis or with other partners, using a metropolis-centric approach leveraging our related businesses and digital strategy.
We believe that by managing our core operations as one vertically integrated business, we capture a significant portion of the construction value chain and create value for our customers by offering comprehensive building products and solutions. Historically, this strategic focus has enabled us to grow our existing businesses, particularly in high-growth markets and with specialized, high-margin products.
In particular, as outlined in our strategic priorities, we believe that the United States, Europe and Mexico are well-suited for vertically integrated positions near growing metropolises; and, in addition to our traditional cement, aggregated and ready-mix concrete core businesses, these metropolises exhibit a need for a value proposition we’re well-positioned to deliver by means of our Urbanization Solutions, which has led us to consider it as a key component of our Operating EBITDA Growth strategic priority.
Urbanization Solutions. Urbanization Solutions is one of our four core businesses. It is a business that complements our value offering of products and solutions, looking to connect with the broader city ecosystem. It seeks to address urbanization challenges and provide means to all stakeholders in the construction value chain to enable sustainable urbanization by focusing on four market segments:
| • | Performance Materials. |
They are used to modify or enhance the properties and usability of building materials and construction systems. Performance materials include construction chemicals, building finishes, admixtures and additives, mortars and special mortars, cellular concrete, asphalt, pavement solutions, etc.
| • | Industrialized Construction. |
We manufacture finished building elements that are easy and safe to assemble and install on-site. Products of industrialized construction range from precast components to complete structures, 2D panels, 3D modules, 3D structures, etc.
| • | Circularity. |
Efficient management of resources to improve the circularity of the construction value chain, ranging from reducing and managing waste to its recycling into the construction lifecycle value chain.
72
Table of Contents
| • | Related Services. |
We provide certain services to offer integrated solutions through logistics and transportation, retail, pavement services, and design and engineering, among others, that add value along the construction value chain and complement our offering in performance materials, industrialized construction and waste management, while enabling Cemex to provide value for our customers by offering building solutions for their construction needs.
OPERATING MODEL. We aim to operate effectively and achieve the greatest possible value by leveraging our knowledge and scale to establish best practices and common practices worldwide. Our operating model consists of: (i) working with global networks to share operative best practices and market our products and solutions; (ii) providing modern support functions and technology to clients and customers; (iii) having clear and effective transactional functions at all levels of our business; and (iv) maintaining efficient governance controls.
STAKEHOLDERS. Our stakeholders include our people, customers, shareholders, investors, suppliers, communities, NGOs, academia, governments, policymakers and business associations.
We add value to our: (i) employees by having plans and other resources that we believe provide a great workplace that helps them grow and build skills, expertise and a strong sense of purpose; (ii) customers by tailoring our offerings to solve their construction needs while making it easy for them to work with us and by providing enhanced performance and reliability; (iii) shareholders and investors by focusing on plans designed to maximize revenue, reduce costs, optimize assets, reduce risk and enforce strong governance; and (iv) communities and suppliers by serving as an engine of economic growth, building more capable, inclusive and resilient communities, striving to reduce local air, water and waste and conserve biodiversity, encouraging the creation of innovative solutions to reduce costs while promoting sustainable goods and services, and being a reliable client throughout the value chain, adding a trustworthy reputation to the negotiation.
Environment and Biodiversity Partners. We work closely with several partners to protect the environment and biodiversity of the countries in which we operate by engaging in fruitful partnerships with global, national and local organizations.
Knowledge and Innovation Partners. We often leverage the knowledge and expertise of thought partners from varied perspectives such as consulting, research institutions, universities, and technology partners.
These collaborations enable the design, development, curation and delivery of relevant learning experiences aligned with our strategic capabilities and emerging practices.
Shared Value Partners. Collaborations and partnerships with multilateral or international organizations, the private sector, and academia allow us to build synergies to scale our contributions to build a better future, continue to contribute to the development of sustainable communities and to support the enablement of a just transition to a lower-carbon economy.
Some of the most relevant partners we collaborate or have collaborated with include UN Global Compact, Resilient Cities, and All4Youth. We leverage our partnerships to foster the creation and scaling of social impact programs through four focus areas: (i) People, to provide community members with access to education and workplace training that enables inclusive long-term societal resilience; (ii) Economy, to support organizations and individuals that contribute to boosting local economies by developing skills to foster entrepreneurship, enable a sustainable economy, and lay the groundwork for a just transition; (iii) Structures, to leverage our expertise and quality building materials to improve the standards of livable housing and basic infrastructure in cities and communities; and (iv) Cities, to contribute to building green spaces and resilient communities, focusing on the natural and built environments.
Business Associations. We actively participate in various global, regional and national business associations to develop partnerships and promote our products and solutions. Our active involvement in these associations
73
Table of Contents
provides us, alongside other companies in our industry, with a platform to advocate for and educate on important topics such as promoting the use of concrete as an essential material for sustainable construction and policies.
Regain our Investment Grade Rating
We remain committed to regaining our investment grade rating, which is one of our top priorities. We believe our strategic priorities should allow us to make progress in reaching this goal, as we expect that we should be able to increase our free cash flow, which would enable us to further reduce our debt, invest in our business and potentially return value to our shareholders.
As a result of implementing our “Operation Resilience” strategy, in June 2021, we reached our investment grade capital structure target of reducing our consolidated leverage ratio (as defined in the then-effective 2017 Facilities Agreement) below 3.0x. During 2022, we achieved a total debt plus other financial obligations reduction of $332 million.
Our financial strategy is designed to strengthen our capital structure by: (i) reducing refinancing risks, mainly by reducing short-term maturities and extending average life of debt, which reached 5.0 years as of the end of 2022; (ii) lowering our financial costs, using available free cash flow and divestments to reduce our liabilities and/or optimizing our funding sources by looking for opportunities to issue new securities while redeeming other securities with higher costs, as well as managing our interest rate mix between fixed and floating rates; and (iii) maintaining ample liquidity through the revolving credit facility under the 2021 Credit Agreement and access to short-term credit lines. We believe that our debt portfolio currency mix, mainly in Dollars and Euros, together with our financial derivatives strategy, allows us to balance exposures to currency fluctuations in our most important markets while allowing for optimization of our funding costs.
Also, we have been focusing, and expect to continue to focus, on optimizing our operations by looking to grow our market positions in the markets that we believe offer the highest growth potential, and our core businesses and implementing our pricing policies for our products, on strengthening our capital structure and regaining financial flexibility through reducing our debt and cost of debt, on improving cash flow generation and on extending maturities. Our efforts in lowering our interest expense and our effective management of working capital have allowed us to support our free cash flow. As of the date of this annual report, we plan to continue with these efforts.
We have also introduced a comprehensive pricing strategy for our products that we expect to more fully reflect and capture the high value-creating capability of our products and services. Our strategy focuses on value enhancement, optimizing gains in customer relationships and on generating sufficient returns that would allow us to reinvest in our business. Under this strategy, we are establishing internal procedures and guidelines that are expected to support our approach to pricing our different products and services.
In addition, we plan to maintain and grow our market positions in cement, ready-mix concrete, aggregates and Urbanization Solutions by being one of the most customer-centric companies in the industry. Among other actions, we also expect to implement pricing initiatives for our products and receive compensation through fees for the services we provide that should allow us to improve our overall profits, as well as to operate in the most capital and cost-efficient manner possible. We may also seek to expand our presence in businesses related to cement, ready-mix concrete, aggregates and Urbanization Solutions, and potentially also implement similar pricing strategies in the markets related to these businesses.
We continue to look to reduce our overall production related costs for all our products and regional and corporate overhead through disciplined cost management policies and through improving efficiencies by removing redundancies. We have implemented several worldwide standard platforms as part of this process and have also started different initiatives, such as a system designed to improve our operating processes worldwide and other digital-based solutions to achieve this. In addition, we implemented, and have been using, centralized
74
Table of Contents
management information systems throughout our operations, including administrative, accounting, purchasing, customer management, budget preparation and control systems, which have helped us achieve cost efficiencies. We also have agreements with several service providers expected to improve some of our business processes. We have also transferred key processes, such as procurement and trading, from a centralized model to a regional model and are simplifying and delayering our business to accelerate decision-making and maximize efficiency.
In a number of our core markets, such as Mexico, we launched initiatives aimed at reducing the use of fossil fuels, consequently looking to reduce our overall energy costs.
Furthermore, significant economies of scale in key markets at times allow us to obtain competitive freight contracts for key components of our cost structure, such as fuel and coal, among others.
Through a worldwide import and export strategy, we plan to continue to seek to optimize capacity utilization and maximize profitability by redirecting our products from countries experiencing economic downturns to target export markets where demand may be greater. Our global trading system enables us to coordinate our export activities globally to try and take advantage of demand opportunities. Should demand for our products in the United States improve, subject to any measures the current U.S. government could implement, we believe we are well-positioned to service this market through our established presence in the southern and southwestern regions of the country and our current ability to import into the United States.
Our industry relies heavily on natural resources and energy, and we use cutting-edge technology to increase energy efficiency, reduce CO2 emissions and optimize our use of raw materials and water. We are committed to measuring, monitoring and improving our environmental performance. In the last few years, we have implemented various procedures to improve the environmental impact of our activities as well as our overall product quality, such as a reduction of CO2 emissions, an increased use of alternative fuels to reduce our reliance on primary fuels, an increased number of sites with local environmental impact plans in place and the use of alternative raw materials in our cement.
Operational Improvements
As a key lever to achieve our Operating EBITDA growth objective, we are constantly looking for ways to implement reductions in our cost structure. Throughout the years, such global cost-reduction initiatives have encompassed different undertakings, including headcount reductions, capacity closures across the cement value chain and a general reduction in global operating expenses. During the past years, Cemex has launched company-wide programs aimed at enhancing competitiveness, providing a more agile and flexible organizational structure and supporting an increased focus on the Company’s markets and customers.
Our latest significant initiative with operational improvement and cost-reduction implications is our Working Smarter digital transformation initiative. With Working Smarter, we leverage a combination of digital technologies, operative models, and innovation from leading service suppliers to reshape our business management services. As part of this initiative, in the first quarter of 2022, we signed separate multi-year contracts that range from 5 to 7 years that in the aggregate total $500 million with six service providers in the fields of finance and accounting, information technology, and human resources. We estimate that the combination of these next-generation service contracts and its internal delivery transformation should materially contribute towards a $100 million annual savings goal we have set once implementation is complete.
As part of our strategic priorities, we have implemented initiatives that seek to improve our operational performance and expense rationalization, increasing our use of alternative fuels in several of the countries in which we operate, serving our customers better and at lower costs, optimizing our production and logistics supply chain models and optimizing our procurement strategy. Also, in connection with the implementation of our cost-reduction initiatives, since 2017, we have implemented a low-cost sourcing initiative which is designed to maintain the continuity of our operations, while looking to provide attractive costs without materially affecting
75
Table of Contents
the quality of the products and services we acquire by using a strategic sourcing process empowered by our people’s knowledge and quality management. This initiative is intended to reduce our cost of operations, while maintaining quality and timely delivery by acquiring goods and equipment from Mexico, India, Turkey and certain countries in Asia and Eastern Europe, among others.
Also, as part of these initiatives, at times we temporarily shut down (in some cases for a period of at least two months) some of our cement production lines in order to rationalize the use of our assets and reduce the accumulation of our inventories. In the past we have announced the permanent closure of some of our cement plants. Similar actions were taken in our ready-mix concrete and aggregates businesses. In the past, such rationalizations have included, among others, our operations in Mexico, the United States, including Puerto Rico, Spain, Croatia and the United Kingdom. As of December 31, 2022, we had four cement and grinding plants temporarily shut down (two cement plants in the United States, one cement plant in the United Kingdom, and two cement plants in Spain).
Furthermore, we intend to achieve energy cost-savings by actively managing our energy contracting and sourcing, and by increasing our use of alternative fuels. We believe that these cost-saving measures could better position us to quickly adapt to potential increases in demand and thereby benefit from the operating leverage we have built into our cost structure.
We also aim to better serve our customers at lower cost and to optimize our production and logistics supply chain models.
During different parts of the past years, we had reduced capital expenditures related to maintenance and expansion of our operations in response to weak demand for our products in some of the markets in which we do business. Such reductions were implemented with the intention of maximizing our free cash flow generation available for debt service and debt reduction, consistent with our ongoing efforts to strengthen our capital structure, improve our conversion of Operating EBITDA to free cash flow and regain our financial flexibility. During 2021 and 2022, our capital expenditures related to maintenance and expansion of our operations have been $1,094 million and $1,362 million, respectively, higher than the $795 million expended in 2020. Pursuant to the 2017 Facilities Agreement, until November 8, 2021, we were prohibited from making aggregate annual capital expenditures in excess of $1.5 billion (which were temporarily limited to $1.2 billion pursuant to the May 2020 Facilities Agreement Amendments (as defined below) for as long as we failed to report two consecutive quarters with a Consolidated Leverage Ratio of 5.25:1 or below) in any financial year (excluding certain capital expenditures, joint venture investments and acquisitions by each of CLH and CHP and their respective subsidiaries and those funded by Relevant Proceeds (as defined in the 2017 Facilities Agreement)), which capital expenditures, joint venture investments and acquisitions at any time then incurred were subject to a separate aggregate limit of (i) $500 million (or its equivalent) for CLH and its subsidiaries and (ii) $500 million (or its equivalent) for CHP and its subsidiaries. In addition, the amount which we and our subsidiaries were allowed to put towards permitted acquisitions and investments in joint ventures was restricted from exceeding certain thresholds as set forth in the 2017 Facilities Agreement. However, no similar restrictions apply pursuant to the Credit Agreements as long as we are in compliance with our financial covenants.
User Base
Cement is the primary building material in the industrial and residential construction sectors of the majority of markets in which we operate. We believe that the lack or shortage of available cement substitutes further enhances the marketability of our product. The primary end-users of cement in each region in which we operate vary but usually include, among others, wholesalers, ready-mix concrete producers, industrial customers and contractors in bulk. Additionally, sales of bagged cement to individuals for self-construction and other basic needs have traditionally been a significant component of the retail sector. The end-users of ready-mix concrete generally include homebuilders, commercial and industrial building contractors and road builders. Major
76
Table of Contents
end-users of aggregates include ready-mix concrete producers, mortar producers, general building contractors and those engaged in road building activity, asphalt producers and concrete product producers. Our Urbanization Solutions have a wide user base which includes, but is not limited to, contractors, builders and developers in general, ready-mix concrete, cement, mortars and special mortars producers, governments, paving companies, architects and civil engineers. In summary, because of their many favorable qualities, a considerable number of builders and other users worldwide use our cement, ready-mix concrete, aggregates and Urbanization Solutions for almost every kind of construction project, from hospitals and highways to factories and family homes.
As of December 31, 2022, we did not depend on any single existing customer to conduct our business and the loss of any of our existing customers individually would not have had a material adverse effect on our financial condition or results of operations. For the period ended December 31, 2022, none of our individual customers represented more than 10% of our consolidated revenues.
Our Corporate Structure
Cemex, S.A.B. de C.V. is an operating and a holding company that primarily operates its business through subsidiaries which, in turn, hold interests in Cemex’s cement, aggregates, ready-mix concrete and Urbanization Solutions operating companies, as well as other businesses. The following chart summarizes Cemex’s corporate structure as of December 31, 2022. The chart also shows for each company, unless otherwise indicated,
Cemex’s approximate direct or indirect, or consolidated, percentage equity ownership or economic interest. The chart has been simplified to show only some of Cemex’s major holding companies and/or operating companies in most of the main countries in which Cemex operates, and/or relevant companies in which Cemex holds a significant direct or indirect interest and does not include all of Cemex’s operating subsidiaries and its intermediate holding companies.
77
Table of Contents
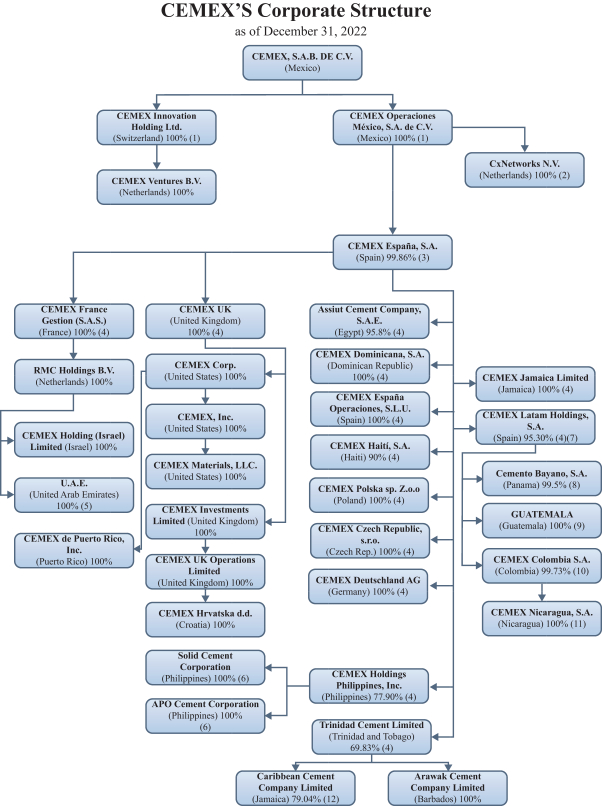
78
Table of Contents
| (1) | Includes Cemex’s direct or indirect, or consolidated, interest. |
| (2) | CxNetworks N.V. is the direct owner of 34.78% interest of the global business and Information Technology (“IT”) consulting entity Neoris N.V. |
| (3) | Includes Cemex Operaciones México, S.A. de C.V.´s (“COM”), Cemex Innovation Holding Ltd (“CIH”) and Cemex’s interest, as well as shares held in Cemex España’s treasury. |
| (4) | Includes Cemex España’s direct or indirect, or consolidated, interest. |
| (5) | Represents Cemex España’s indirect economic interest in three companies incorporated in the United Arab Emirates: Cemex Topmix LLC, Cemex Supermix LLC and Cemex Falcon LLC. Cemex España indirectly owns a 49% equity interest in each of these companies and indirectly holds the remaining 51% of the economic benefits through agreements with other shareholders. |
| (6) | Represents CHP’s direct and indirect equity interest. |
| (7) | Represents outstanding shares of CLH’s capital stock and excludes treasury stock. |
| (8) | Represents CLH’s 99.483% indirect interest in ordinary shares, which excludes a 0.516% interest held in Cemento Bayano, S.A.’s treasury. |
| (9) | Represents CLH’s direct and indirect interest in three companies incorporated in Guatemala: Cemex Guatemala, S.A., Global Concrete, S.A., and Cementos de Centroamérica, S.A. |
| (10) | Represents CLH’s direct and indirect interest in ordinary and preferred shares and includes shares held in Cemex Colombia’s treasury. |
| (11) | Includes Cemex Colombia’s 99% interest and Corporación Cementera Latinoamericana, S.L.U.’s 1% interest. |
| (12) | Includes TCL’s direct and indirect 74.08% interest and Cemex’s indirect 4.96% interest held through other subsidiaries. |
Our Operations in Mexico
Overview. For the year ended December 31, 2022, our operations in Mexico represented 21% of our revenues before eliminations resulting from consolidation in Dollar terms. As of December 31, 2022, our operations in Mexico represented 31% of our total installed cement capacity and 15% of our total assets, in Dollar terms.
As of December 31, 2022, Cemex, S.A.B. de C.V. was both a holding company for some of our operating companies in Mexico and was involved in the production, marketing, sale and distribution of cement, ready-mix concrete, aggregates and other construction materials and urbanization solutions in Mexico, as well as a construction materials and related products service provider. Cemex, S.A.B. de C.V., indirectly, is also the holding company of all our international operations. Cemex, S.A.B. de C.V. accounts for a substantial part of the revenues and operating income of our operations in Mexico.
Our Tepeaca cement plant in Puebla, Mexico, as of December 31, 2022, had a production capacity of 3.1 million tons of cement per year. In December 2014, we announced the restart of expansion project of the Tepeaca cement plant, consisting of the construction of a new kiln that is already in operation and a mill. Its total production capacity is expected to reach 4.6 million tons of cement per year by 2023 based on mill capacity. Additionally, we invested in the same region to increase our cement production capacity by 0.5 million tons of cement through a debottlenecking project for our operations in Huichapan. This project was completed during the first quarter of 2019. In May 2021, in order to generate enough supply to meet the increasing demand in the U.S. market and strengthen our position in the region, we resumed our operations in our CPN cement plant in Sonora, which has a production capacity of 1.9 million tons of cement per year.
In March 2022, following the successful restart of our operations in our CPN cement plant in Sonora, we announced the reactivation of our second CPN kiln in the Sonora plant to continue leveraging Cemex’s regional trading network to meet growing cement demand throughout the western United States. This project was
completed during the fourth quarter of 2022 serving customers across Arizona, California and Nevada.
79
Table of Contents
In 2001, we launched the Construrama program, a registered brand name for construction material stores. Through this program, we offer to an exclusive group of our Mexican distributors the opportunity to sell a variety of products under the Construrama brand name, a concept that includes the standardization of stores, image, marketing, products and services. As of December 31, 2022, 1,123 independent concessionaries with 2,389 stores were integrated into the Construrama program, with nationwide coverage.
Industry. For 2022, the National Institute of Statistics and Geography (Instituto Nacional de Estadística y Geografía) indicated that total construction activity in Mexico increased 0.4% as of December 2022 (seasonally adjusted figures). Such marginal increase has been attributed to the post-pandemic recovery of the formal construction industry, particularly in the industrial sector.
Cement in Mexico is sold mainly through distributors, with the remaining balance sold through ready-mix concrete producers, manufacturers of pre-cast concrete products and construction contractors. Cement sold through distributors is mixed with aggregates and water by the end user at the construction site to form concrete. Ready-mix concrete producers mix the ingredients in plants and deliver it to local construction sites in mixer trucks, which pour the concrete. Unlike more developed economies, where purchases of cement are concentrated in the commercial and industrial sectors, retail sales of cement through distributors in 2022 accounted for approximately 55% of Mexico’s demand (bagged presentation). Individuals who purchase bags of cement for self-construction and other basic construction needs are a significant component of the retail sector. We believe that this large retail sales base is a factor that significantly contributes to the overall performance of the cement market in Mexico.
The retail nature of the Mexican cement market also enables us to foster brand loyalty, which distinguishes us from other worldwide producers selling primarily in bulk. We own the registered trademarks for our brands in Mexico, such as “Tolteca,” “Monterrey,” “Maya,” “Anahuac,” “Campana,” “Gallo,” “Centenario,” as well as certain sub-brands, such as “Extra,” “Impercem” and “Optimo” for gray cements and mortar and, additionally, recently launched “Multiplast” for coatings. We believe that these brand names are important in Mexico since cement is principally sold in bags to retail customers who may develop brand loyalty based on differences in quality and service. We also have trademark registrations for our special concrete’s brands such as “Promptis,” “Resilia,” “Pervia,” “Insularis” and “Evolution.” In Mexico, we introduced “Vertua” as a value cement and concrete brand. “Vertua” is Cemex’s global brand for low carbon footprint products. In addition, we own the registered trademark for the “Construrama” brand name for construction material stores and for our new digital solution we have trademark registrations for “CEMEX Go” and “Olivia.”
Competition. In the early 1970s, the cement industry in Mexico was regionally fragmented. However, since that time, cement producers in Mexico have increased their production capacity and the cement industry in Mexico has consolidated into a national market, thus becoming increasingly competitive. As of December 31, 2022, the major cement producers in Mexico were Cemex; Holcim; Sociedad Cooperativa Cruz Azul, a Mexican operator; Cementos Moctezuma, an associate of Cements Molins and Buzzi-Unicem; and GCC, S.A.B. de C.V. (“GCC,” formerly named Grupo Cementos de Chihuahua, S.A.B. de C.V.), a Mexican operator in whose majority holder, Camcem, S.A. de C.V., we hold a minority interest. During 2013, a then-new cement producer, Elementia (now Fortaleza Materiales), entered the market and in 2014 acquired two cement plants from Lafarge (prior to the Lafarge-Holcim merger). As of December 31, 2022, the major ready-mix concrete producers in Mexico were Cemex, Holcim, Sociedad Cooperativa Cruz Azul and Cementos Moctezuma. In addition, as of December 31, 2022, the use of non-integrated ready-mixers has been increasing.
We believe potential entrants into the Mexican cement market face various barriers to entry, including, among other things: the time-consuming and expensive process of establishing a retail distribution network and developing the brand identification necessary to succeed in the retail market; the lack of port infrastructure and the high inland transportation costs resulting from the low value-to-weight ratio of cement; the distance from ports to major consumption centers and the presence of significant natural barriers, such as mountain ranges, which border Mexico’s east and west coasts; the strong brand recognition and the wide variety of special
80
Table of Contents
products with enhanced properties; the extensive capital expenditure requirements; and the length of time required for construction of new plants, which we estimate is approximately two years. Nevertheless, Fortaleza Materiales started a stand-alone cement mill in the Yucatán Peninsula during October 2020. Additionally, at the end of the first quarter of 2021, Holcim started operating a stand-alone cement mill located in the Yucatán Peninsula, aiming to strengthen its market position and supply cost in this region. During 2022, a new independent producer, Grupo Comercial AMORI, entered the market in the Yucatán Peninsula with a cement mill facility located in Progreso, Yucatán, under the brand “Cementos Jaguar.” This facility corresponds to the first new entry into the cement industry since Fortaleza’s incursion in 2013.
Urbanization Solutions. In Mexico, for the year ended December 31, 2022, in terms of relevant revenues, our Related Services and Circularity verticals were the main contributors. These businesses are located across Mexico.
Our Operating Network in Mexico
During 2022, we operated 15 cement plants and 108 cement distribution centers (including eight marine terminals) located throughout Mexico.
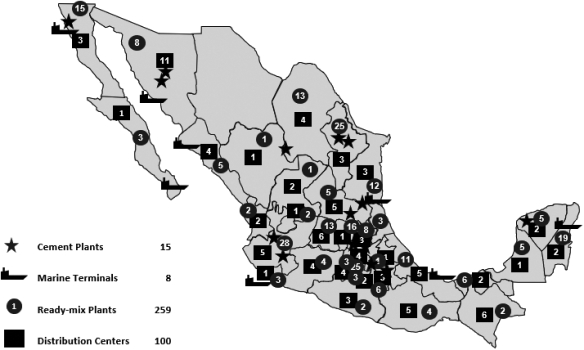
81
Table of Contents
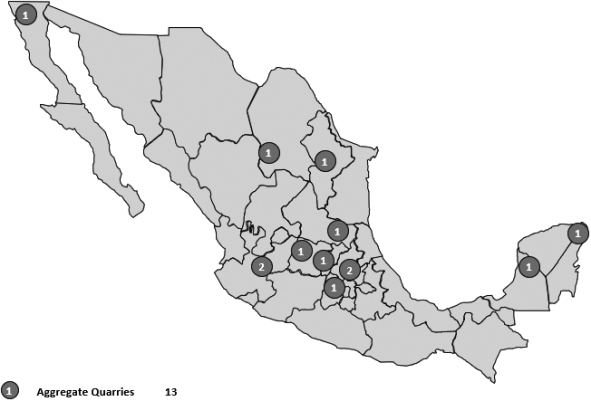
We operate cement plants on the Gulf of Mexico and Pacific coasts of Mexico, most of the time allowing us to take advantage of attractive transportation costs to export to the United States and the SCA&C region, when possible.
Products and Distribution Channels
Cement. For the year ended December 31, 2022, our cement operations represented 57% of revenues from our operations in Mexico before eliminations resulting from consolidation in Dollar terms and our domestic cement sales volume represented 89% of our total cement sales volume in Mexico. As a result of the retail nature of the Mexican market, our operations in Mexico are not dependent on a limited number of large customers. The total volume of the five most important distributors accounted for 12% of our total cement sales by volume in Mexico in 2022 (excluding our in-house channels).
Ready-Mix Concrete. For the year ended December 31, 2022, our ready-mix concrete operations represented 20% of revenues from our operations in Mexico before eliminations resulting from consolidation in Dollar terms. Our ready-mix concrete operations in Mexico purchase substantially all their cement requirements from our cement operations in Mexico. Ready-mix concrete is sold through our own internal sales force and facilities network.
Aggregates. For the year ended December 31, 2022, our aggregates operations represented 6% of revenues from our operations in Mexico before eliminations resulting from consolidation in Dollar terms.
Urbanization Solutions and Others: For the year ended December 31, 2022, our Urbanization Solutions and other businesses operations represented 17% of revenues from our operations in Mexico before eliminations resulting from consolidation in Dollar terms.
82
Table of Contents
Exports. Our operations in Mexico export a portion of their cement production, mainly in the form of cement and to a lesser extent in the form of clinker. Exports of cement by our operations in Mexico represented 14% of our total cement sales volume in Mexico for 2022. In 2022, 92% of our cement exports from Mexico were to the United States and 8% were to our Rest of SCA&C segment.
The cement and clinker exports by our operations in Mexico to the United States are mostly marketed through our trading network subsidiaries. Our cement and clinker transactions between Cemex and its subsidiaries, are conducted on an arm’s-length basis.
Production Costs. Our cement plants in Mexico primarily utilize pet coke and alternative fuels. Two 20-year pet coke supply contract agreements with PEMEX Madero refinery expired at the end of September 2022. The contracts were replaced by a 5-year supply agreement awarded in a tender for an estimated 30% of our pet coke consumption. By the end of October 2022, PEMEX unilaterally suspended deliveries from the Cadereyta refinery in two additional contracts. Cemex and PEMEX agreed on a new pricing methodology based on the current pet coke market for the remainder of the contract period. PEMEX is expected to open a tender for the Cadereyta refinery in June 2023. Cemex was also awarded a 2-year contract for the Minatitlan refinery in November 2022, which is equivalent to 11% of our cement plant consumption. In general, we have been able to purchase pet coke in the open market when needed to make up for any quantities not supplied by PEMEX. In addition, in 1992, our operations in Mexico began using alternative fuels to further reduce the consumption of residual fuel oil and natural gas. These alternative fuels represented 36% of the total fuel consumption for our cement plant operations in Mexico in 2022. For additional information, see “Item 5—Operating and Financial Review and Prospects—Summary of Material Contractual Obligations and Commercial Commitments—Cash Requirements.”
In 1999, we entered into an agreement with an international partnership, which financed, built and operated TEG, a 230 megawatt (“MW”) energy plant in Tamuín, San Luis Potosí, Mexico. We entered into this agreement in order to reduce the volatility of our energy costs. The power plant commenced commercial operations in April 2004. In 2007, the original operator was replaced and the agreement was extended to 2027. At the end of 2023, TEG is expected to migrate to the wholesale market to supply Cemex load points. For additional information, see “Item 5—Operating and Financial Review and Prospects—Summary of Material Contractual Obligations and Commercial Commitments—Cash Requirements.”
In 2006, in order to take advantage of the high wind potential in the “Tehuantepec Isthmus,” Cemex and the Spanish company ACCIONA, S.A. (“ACCIONA”), formed an alliance to develop a wind farm project for the generation of 250 MW in the Mexican state of Oaxaca. The installation of 167 wind turbines in the farm was finished on November 15, 2009. For additional information, see “Item 5—Operating and Financial Review and Prospects—Summary of Material Contractual Obligations and Commercial Commitments—Cash Requirements.”
In connection with the beginning of full commercial operations of Ventika, S.A.P.I. de C.V. and Ventika II S.A.P.I. de C.V. wind farms (jointly, “Ventikas”), located in the Mexican state of Nuevo León, with a combined generation capacity of 252 MW, we agreed to acquire a portion of the energy generated by Ventikas for our Mexican plants for a period of 20 years, which began in April 2016. During 2022, Ventikas supplied 8.5% of Cemex’s overall electricity needs in Mexico. This agreement is for Cemex’s own use and as of the date of this annual report, Cemex does not intend to engage in energy trading in Mexico.
On October 24, 2018, in order to take advantage of lower electric energy prices, we entered into agreements for a period of 20 years with Tuli Energía, S. de R.L. de C.V. (“Tuli Energía”) and Helios Generación, S. de R.L. de C.V. (“Helios Generación”) to acquire a portion of the energy generated by such solar projects. The solar plants located in the Mexican state of Zacatecas have a combined generation capacity of 300 MW. These solar plants started producing test energy in September 2019, and the effective commencement date of such agreements was December 21, 2019 for Tuli Energía and April 22, 2020 for Helios Generación.
83
Table of Contents
We have, from time to time, purchased hedges from third parties to reduce the effect of volatility in energy prices in Mexico. See “Item 5—Operating and Financial Review and Prospects—Summary of Material Contractual Obligations and Commercial Commitments—Cash Requirements.” Additionally, a Cemex subsidiary participated as a buyer in the third long-term power auction organized in 2017 by the National Center for Energy Control (Centro Nacional de Control de Energía) (“CENACE”) (the independent system operator) and has been allocated a 20-year contract, that started in November 2020. The contract is for 16,129 clean energy certificates per year for compliance with legal requirements and 14.9 GWh/a of electric power.
Description of Properties, Plants and Equipment. As of December 31, 2022, we had 15 wholly-owned cement plants (all of them active) with a cement installed capacity of 27.3 million tons per year and proportional interests through associates in three other cement plants located throughout Mexico. We have exclusive access to limestone quarries and clay reserves near each of our plant sites in Mexico. We estimate that, as of December 31, 2022, the limestone and clay permitted proven and probable reserves of our operations in Mexico had an average remaining life of 127 and 107 years, respectively, assuming 2018 to 2022 average annual production levels. As of December 31, 2022, all our producing plants in Mexico utilized the dry process.
As of December 31, 2022, we had a network of 100 land distribution centers in Mexico, which are supplied through a fleet of our own trucks and rail cars, as well as leased trucks and rail facilities, and operated eight marine terminals. In addition, we had 259 ready-mix concrete plants (31 were temporarily inactive) throughout 75 cities in Mexico, more than 2,200 ready-mix concrete delivery trucks and 13 aggregates quarries (one was temporarily inactive).
Capital Expenditures. We made capital expenditures of $144 million in 2020, $190 million in 2021, and $265 million 2022. As of December 31, 2022, we expected to make capital expenditures of over $186 million in our operations in Mexico during 2023.
Our Operations in the United States
Overview. For the year ended December 31, 2022, our operations in the United States represented 27% of our revenues before eliminations resulting from consolidation in Dollar terms. As of December 31, 2022, our operations in the United States represented 16% of our total installed cement capacity and 48% of our total assets, in Dollar terms. As of December 31, 2022, Cemex, Inc. was the main holding company of our operating subsidiaries in the United States.
On September 23, 2013, we and Concrete Supply Company, a leading producer of ready-mix concrete throughout North and South Carolina, entered into a joint venture agreement and formed a joint venture company named Concrete Supply Co. LLC, in which Concrete Supply Holdings Co. holds a majority ownership stake in and acts as the managing member. This joint venture is a leading concrete supplier in North and South Carolina with strong local management.
Industry. Demand for cement is derived from the demand for ready-mix concrete and concrete products which, in turn, is dependent on the demand for construction. The construction industry is composed of three major sectors: the residential, the industrial-and-commercial and the public sectors. The public sector is the most cement intensive sector, particularly for infrastructure projects such as streets, highways and bridges.
Prior to the impact of the COVID-19 pandemic, the construction industry had showed signs of a slow recovery from the financial crisis experienced during 2008 and 2009, which was the worst downturn in over 70 years. The construction industry was hit particularly hard during this financial crisis due to the collapse of the housing sector. Housing starts fell 73% from a peak of 2.1 million units in 2005 to only 554,000 units in 2009. The decline in housing and other construction activity resulted in a 45% decline in cement demand from 2005 to 2010. The economic recovery had proceeded at a relatively moderate pace, with real GDP average annual growth
84
Table of Contents
of 2.3% since 2011 through the end of 2019. With the economy growing again, the construction sector stabilized in 2010 and joined the economy-wide recovery in 2011. The excess vacant inventory in the housing sector has been absorbed and existing home inventories for sale have declined to below normal levels across the nation, which together have supported an increase in housing prices for 2017, 2018 and 2019 of about 16%. Housing starts increased by 223% from 554 thousand units in 2009 to 1.3 million units in 2019. Housing starts in 2019 increased by 3% from 2018 to 1.3 million units, which remains below the historical steady state level. The industrial-and-commercial sector had also been growing with nominal spending up 8% from 2014 to 2019. Industrial-and-commercial nominal spending decreased by 2% in 2019. The public sector, which has lagged compared to the other construction sectors in this recovery, recorded a spending increase of 9% in 2019. Cement demand had been increasing annually since 2014 with an estimated growth of 1.8% in 2022 after an increase of 15% from 2016 to 2022. As of December 31, 2022, the Portland Cement Association is forecasting a 3.5% decrease in cement demand in the United States for 2023, but as of the date of this annual report we are not able to assess whether the cement demand in the United States will decrease or not during 2023. See “Item 3—Key Information—Risk Factors—Risks Relating to Our Business and Operations—Future pandemics and epidemics, such as the COVID-19 pandemic, could materially adversely affect our financial condition and results of operations.” High mortgage rates resulting from Federal Reserve interest rate increases and quantitative tightening could result in lower than expected single family housing demand. See “Item 3—Key Information—Risk Factors—Risks Relating to Our Business and Operations.”
Competition. As of December 31, 2022, the cement industry in the United States was highly competitive, including national and regional cement producers in the United States. As of December 31, 2022, our principal competitors in the United States were Holcim, Buzzi-Unicem, HeidelbergCement AG (“Heidelberg”) and CRH.
As of December 31, 2022, the independent U.S. ready-mix concrete industry was highly fragmented. According to the National Ready Mixed Concrete Association (“NRMCA”), it is estimated that as of December 31, 2022 there were about 6,500 ready-mix concrete plants that produce ready-mix concrete in the United States and about 65,000 ready-mix concrete mixer trucks that delivered the concrete to the point of placement. The NRMCA estimates that, as of December 31, 2022, the value of ready-mix concrete produced by the industry was approximately $35 billion per year. Given that the concrete industry has historically consumed approximately 75% of all cement produced annually in the United States, many cement companies choose to develop concrete plant capabilities.
Aggregates are widely used throughout the United States for all types of construction because they are the most basic materials for building activity. The United States Geological Survey (“USGS”) estimates over 2.5 billion tons of aggregates were produced in 2022, an increase of about 1% over 2021. As of December 31, 2022, crushed stone accounted for 60% of aggregates consumed, sand & gravel for 39%, and slag for 1%. These products are produced in all 50 states and had a value of $32 billion as of December 31, 2022. The United States aggregates industry is highly fragmented and geographically dispersed. The top ten producing states represented more than 53% of all production as of year-end 2022. According to the USGS, during 2022, an estimated 3,300 companies operated 6,200 sand and gravel sites and 1,340 companies operated 3,290 crushed stone quarries in the 50 states.
Urbanization Solutions. In the United States, for the year ended December 31, 2022, in terms of relevant revenues, our Related Services and Industrialized Construction verticals were the main contributors. These businesses are located across the Sun Belt region of the United States.
85
Table of Contents
Our Operating Network in the United States
The maps below reflect the location of our operating assets, including our cement plants and cement terminals in the United States as of December 31, 2022.
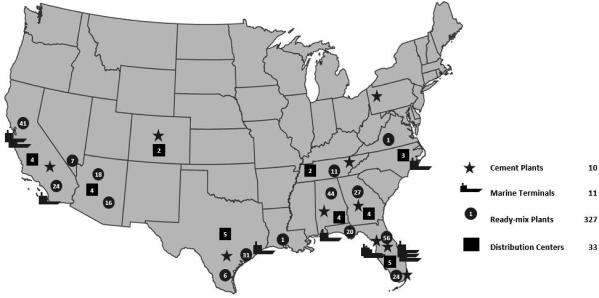
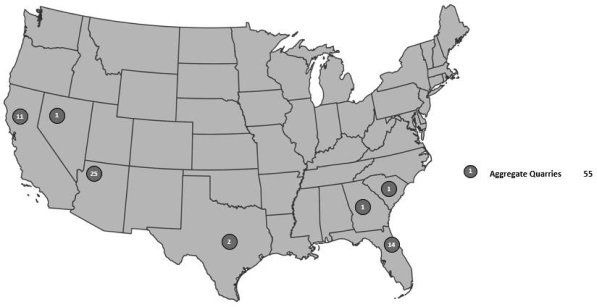
Products and Distribution Channels
Cement. For the year ended December 31, 2022, our cement operations represented 30% of revenues from our operations in the United States, before eliminations resulting from consolidation in Dollar terms. In the
86
Table of Contents
United States, we deliver a substantial portion of cement by rail, which occasionally goes directly to customers. Otherwise, shipments go to distribution terminals where customers pick up the product by truck or we deliver the product by truck. The majority of our cement sales in the United States are made directly to users of gray portland and masonry cements, generally within a radius of approximately 200 miles of each plant.
Ready-Mix Concrete. For the year ended December 31, 2022, our ready-mix concrete operations represented 42% of revenues from our operations in the United States, before eliminations resulting from consolidation in Dollar terms. Our ready-mix concrete operations in the United States purchase most of their cement aggregates requirements from our cement operations in the United States. Our ready-mix concrete products are mainly sold to residential, commercial and public contractors and to building companies.
Aggregates. For the year ended December 31, 2022, our aggregates operations represented 18% of revenues from our operations in the United States, before eliminations resulting from consolidation in Dollar terms. We estimate that, as of December 31, 2022, the hard rock quarries and sand and gravel pits permitted proven and probable reserves of our operations in the United States had an average remaining life of 26 and 20 years, respectively, assuming 2018 to 2022 average annual aggregates production levels. Our aggregates are consumed mainly by our internal operations and by our trade customers in the ready-mix, concrete products and asphalt industries.
Urbanization Solutions and Others: For the year ended December 31, 2022, our Urbanization Solutions and other businesses operations represented 10% of revenues from our operations in the United States before eliminations resulting from consolidation in Dollar terms.
Production Costs. The largest cost components of our plants are usually electricity and fuel. Fuel accounted for 12% of our total production costs of our cement operations in the United States in 2022. As of December 31, 2022, we had been implementing a program expected to gradually replace coal with more economic fuels, such as pet coke, tires and other alternative fuels, which has resulted in reduced energy costs. By retrofitting our cement plants to handle alternative energy fuels, we believe we have gained more flexibility in supplying our energy needs and have become less vulnerable to potential price spikes in energy. Power costs in 2022 represented 7% of the cash manufacturing cost of our cement operations in the United States, which represents production cost before depreciation. We aim to improve the efficiency of our electricity usage of our cement operations in the United States, concentrating our manufacturing activities in off-peak hours and negotiating lower rates with electricity suppliers.
Description of Properties, Plants and Equipment. As of December 31, 2022, we operated a geographically diverse base of 10 cement manufacturing plants in the United States (two were temporarily inactive) located in Alabama, California, Colorado, Florida, Georgia, Pennsylvania, Tennessee and Texas, and had a total installed cement capacity of 14.1 million tons per year. We estimate that, as of December 31, 2022, the limestone permitted proven and probable reserves of our operations in the United States had an average remaining life of 49 years, assuming 2018 to 2022 average annual production levels. As of December 31, 2022, we operated a distribution network of 33 cement terminals (four of which we distributed fly ash through) and 11 deep-water import terminals. All of our 10 cement production facilities in 2022 were wholly-owned by Cemex, Inc. As of December 31, 2022, Cemex, Inc. had 327 ready-mix concrete plants (36 were temporarily inactive) located in Alabama, Arizona, California, Florida, Georgia, Louisiana, Nevada, Tennessee, Texas and Virginia and operated a total of 55 aggregates quarries (14 were temporarily inactive) in Arizona, California, Florida, Georgia, Nevada, South Carolina and Texas. As of December 31, 2022, we had 16 concrete block facilities. Considering mainly the negative effects of the COVID-19 pandemic on certain idle assets that will remain closed for the foreseeable future in relation to the estimated sales volumes and our ability to supply demand by achieving efficiencies in other operating assets, during 2022, we recognized non-cash impairment losses related to fixed assets of $26 million in the United States.
In the United States, we have continued to take a number of actions to streamline our operations and improve productivity, including temporary capacity adjustments and rationalizations in some of our cement
87
Table of Contents
plants, and shutdowns of ready-mix concrete and block plants and aggregates quarries. As of December 31, 2022, we were utilizing approximately 89% of our ready-mix concrete plants, 75% of our block manufacturing plants and 73% of our aggregates quarries in the United States.
Capital Expenditures. We made capital expenditures of $284 million in 2020, $373 million in 2021 and $551 million in 2022 in our operations in the United States. As of December 31, 2022, we expected to make capital expenditures of $492 million in our operations in the United States during 2023.
EMEAA
For the year ended December 31, 2022, our business in the EMEAA region, which includes our operations in the EMEAA region and the Rest of EMEAA segment, as described below, represented 27% of our revenues before eliminations resulting from consolidation in Dollar terms. As of December 31, 2022, our operations in the EMEAA region represented 39% of our total installed capacity and 23% of our total assets, in Dollar terms.
Our Operations in the United Kingdom
Overview. For the year ended December 31, 2022, our operations in the United Kingdom represented 5% of our revenues, before eliminations resulting from consolidation in Dollar terms. As of December 31, 2022, our operations in the United Kingdom represented 5% of our total assets, in Dollar terms.
As of December 31, 2022, we were a leading provider of building materials in the United Kingdom with vertically integrated cement, ready-mix concrete, aggregates and asphalt operations, and we were also an important provider of concrete and precast materials solutions such as concrete blocks, concrete block paving, flooring systems and sleepers for rail infrastructure.
Industry. According to the United Kingdom Office for National Statistics (“ONS”), total construction output increased by 5.6% in 2022, which follows a record increase of 12.8% in 2021. The ONS also reported that construction orders increased by 3.8% year-over-year in 2022. This was driven by an 8.5% growth in new housing orders while industrial-commercial new construction rose by 7.4%. Industrial projects were particularly strong during the year, increasing by 42.5%, although they accounted for only about 6.1% of total new construction orders. Meanwhile, infrastructure decreased by 2.5% in 2022. As of December 31, 2022, the official data corresponding to 2022 has not been released by the Mineral Products Association, but as of the date of this annual report we estimate that domestic cement demand decreased at low single-digit rates in 2022 compared to 2021. Ready-mix concrete consumption in the full year 2022 decreased by 3.8%.
Competition. As of December 31, 2022, our primary competitors in the United Kingdom are: Tarmac (owned by CRH after divestments by Lafarge and Holcim during their merger), Hanson (a subsidiary of Heidelberg), Aggregate Industries (a subsidiary of Holcim) and Breedon, which acquired Hope Construction Materials (owned by Mittal Investments). In addition, during 2022 an estimated 3.4 million tons of cement were imported to the United Kingdom by various players including CRH, Holcim, Heidelberg and other independents, with products that compete with ours increasingly arriving from over-capacity markets including Ireland, Spain and Greece.
Urbanization Solutions. In the United Kingdom, for the year ended December 31, 2022, in terms of relevant revenues, our Urbanization Solutions business consisted primarily of asphalt, concrete block, mortars and admixtures, among others. These businesses are located across the United Kingdom.
88
Table of Contents
Our Operating Network in the United Kingdom
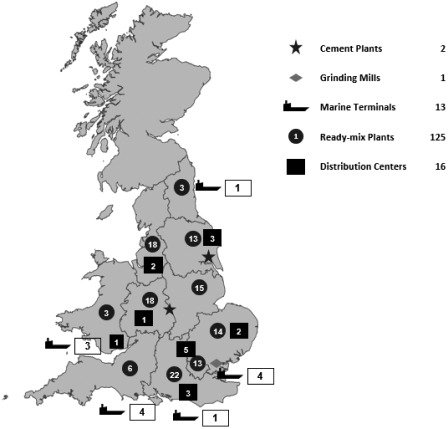
89
Table of Contents
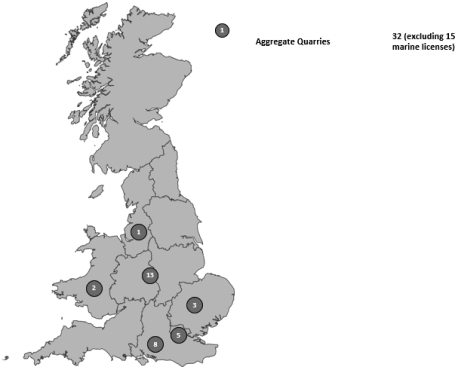
Products and Distribution Channels
Cement. For the year ended December 31, 2022, our cement operations represented 25% of revenues from our operations in the United Kingdom before eliminations resulting from consolidation in Dollar terms. About 83% of our United Kingdom cement sales were of bulk cement, with the remaining 17% in bags. Our bulk cement is mainly sold to ready-mix concrete, concrete block and pre-cast product customers and contractors. Our bagged cement is primarily sold to national builders’ merchants.
Ready-Mix Concrete. For the year ended December 31, 2022, our ready-mix concrete operations represented 26% of revenues from our operations in the United Kingdom before eliminations resulting from consolidation in Dollar terms. Special products, including self-compacting concrete, fiber-reinforced concrete, high strength concrete, flooring concrete and filling concrete, represented 27% of our 2022 United Kingdom sales volume. In 2022, our ready-mix concrete operations in the United Kingdom purchased 96% of its cement requirements from our cement operations in the United Kingdom and 82% of its aggregates requirements from our aggregates operations in the United Kingdom. Our ready-mix concrete products are mainly sold to public, commercial and residential contractors.
Aggregates. For the year ended December 31, 2022, our aggregates operations represented 30% of revenues from our operations in the United Kingdom before eliminations resulting from consolidation in Dollar terms. In 2022, our United Kingdom aggregates sales were divided as follows: 60% were sand and gravel, 39% were limestone, and 1% was hardstone. In 2022, 35% of our aggregates volumes were obtained from marine sources along the United Kingdom’s coast. In 2022, 31% of our United Kingdom aggregates production was consumed by our own ready-mix concrete operations as well as our asphalt, concrete block and precast operations. We also sell aggregates to major contractors to build roads and other infrastructure projects.
Urbanization Solutions and Others: For the year ended December 31, 2022, our Urbanization Solutions and other businesses operations represented 19% of revenues from our operations in the United Kingdom before eliminations resulting from consolidation in Dollar terms.
90
Table of Contents
Cement Production Costs. In 2022, fixed production costs increased by 6.5% driven by increased maintenance costs and significant inflationary pressures. Variable costs increased by 23% in absolute terms, primarily as a result of increased costs of energy and purchased cement and clinker. During 2022, we continued to implement our cost reduction programs through our use of alternative fuels.
Ready-Mix Concrete Production Costs. In 2022, fixed production costs increased by 10.9%, as compared to fixed production costs in 2021, due to increased maintenance spend following only essential spend during the COVID-19 pandemic.
Aggregates Production Costs. In 2022, fixed production costs increased by 5.6% as compared to 2021 fixed production costs due to a change in insurance allocation between U.K. businesses and increased spend on temporary labor and machine hire following restrictions resulting from the COVID-19 pandemic.
Description of Properties, Plants and Equipment. As of December 31, 2022, we had two cement plants (one was temporarily inactive) and one clinker grinding facility in the United Kingdom. Assets in operation at year-end 2022 represent an installed cement capacity of 3.6 million tons per year, the same level as 2021. We estimate that, as of December 31, 2022, the limestone and clay permitted proven and probable reserves of our operations in the United Kingdom had an average remaining life of 46 and 38 years, respectively, assuming 2018 to 2022 average annual production levels. As of December 31, 2022, we also owned three cement import terminals and operated 125 ready-mix concrete plants (25 were temporarily inactive), 32 aggregates quarries (11 were temporarily inactive), 15 marine licenses (all of them active), 16 distribution centers, and 13 marine terminals in the United Kingdom. In addition, we had operating units dedicated to the asphalt, concrete blocks, concrete block paving, sleepers and flooring businesses in the United Kingdom.
In order to have access to blended cements, which are more sustainable based on their reduced clinker factor and use of by-products from other industries, our grinding and blending facility at the Port of Tilbury, located on the Thames River east of London has an annual grinding capacity of 0.9 million tons, which allows us to have access to blended cements.
Capital Expenditures. We made capital expenditures of $55 million in 2020, $94 million in 2021 and $74 million in 2022 in our operations in the United Kingdom. As of December 31, 2022, we expected to make capital expenditures of $64 million in our operations in the United Kingdom during 2023.
Our Operations in France
Overview. As of December 31, 2022, we were a leading ready-mix concrete producer and a leading aggregates producer in France. For the year ended December 31, 2022, our ready-mix concrete operations represented 64%, aggregates represented 34% and Urbanization Solutions represented 2%, respectively, of revenues from our operations in France before eliminations resulting from consolidation in Dollar terms. We distribute most of our materials by road and a significant quantity by waterways, seeking to maximize the use of this efficient and sustainable alternative. For the year ended December 31, 2022, our operations in France represented 4% of our revenues before eliminations resulting from consolidation in Dollar terms. As of December 31, 2022, our operations in France represented 4% of our total assets, in Dollar terms.
Industry. According to the National Institute of Statistics and Economic Studies, housing starts in the residential sector decreased by 3.9% in 2022 compared to 2021. Non-residential starts (m2) increased by 6.5% in 2022 compared to 2021 and demand from the public works sector decreased by 7.4% over the same period. According to National Union of Quarrying and Building Materials Industries (French Association), ready-mix concrete consumption decreased by 4% in 2022.
Competition. As of December 31, 2022, our main competitors in the ready-mix concrete market in France included Holcim, Heidelberg, CRH and Vicat SA, and our main competitors in the aggregates market in France
91
Table of Contents
included Holcim, Heidelberg, Colas (Bouygues) and Eurovia (Vinci). In France, we rely on sourcing cement from third parties, while many of our major competitors in ready-mix concrete are subsidiaries of French cement producers.
Urbanization Solutions. In France, for the year ended December 31, 2022, our Urbanization Solutions business consisted of admixtures. This business is located across France.
Our Operating Network in France
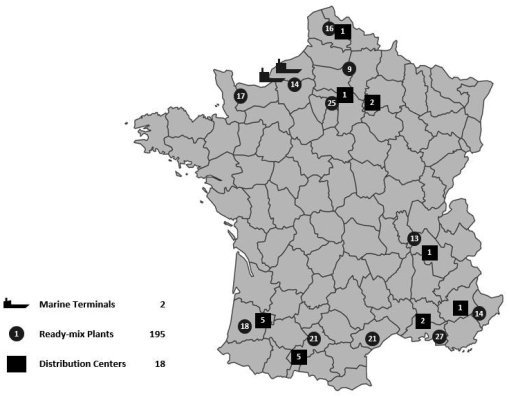
92
Table of Contents
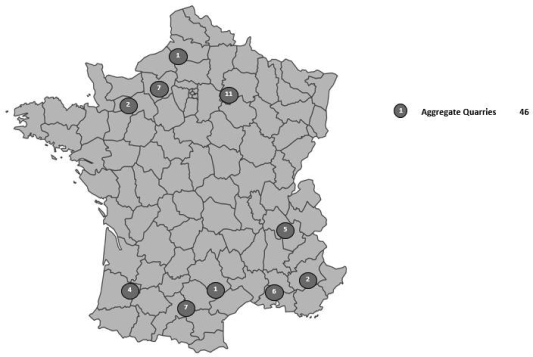
Description of Properties, Plants and Equipment. As of December 31, 2022, we operated 195 ready-mix concrete plants in France (five were temporarily inactive), two marine terminals located in Le Havre, on the northern coast of France, 18 land distribution centers, 46 aggregates quarries (five were temporarily inactive) and 11 river ports.
Capital Expenditures. We made capital expenditures of $62 million in 2020, $44 million in 2021, and $57 million in 2022 in our operations in France. As of December 31, 2022, we expected to make capital expenditures of $40 million in our operations in France during 2023.
Our Operations in Germany
Overview. For the year ended December 31, 2022, our operations in Germany represented 3% of our revenues, before eliminations resulting from consolidation in Dollar terms. As of December 31, 2022, our operations in Germany represented 2% of our total assets, in Dollar terms. For the year ended December 31, 2022, cement represented 37%, ready-mix concrete represented 32%, aggregates represented 14%, Urbanization Solutions and our other businesses represented 17%, respectively of revenues from our operations in Germany before eliminations resulting from consolidation in Dollar terms. As of December 31, 2022, we were a leading provider of building materials in Germany, with vertically integrated cement, ready-mix concrete and aggregates businesses.
Industry. Relatedly, according to DESTATIS, the German Federal Statistical Office, domestic sales volume decreased by 5.2% in 2022 compared to 2021. This coincided with a 20.9% increase in producer prices for cement during this same period.
Competition. As of December 31, 2022, our primary competitors in the cement market in Germany were Heidelberg, Dyckerhoff (a subsidiary of Buzzi-Unicem), Holcim, CRH and Schwenk, a local German competitor. These competitors, along with Cemex in Germany, represented a market share of above 95%, as estimated by us, for 2022. The ready-mix concrete and aggregates markets in Germany are fragmented and regionally heterogeneous, with many local competitors. The consolidation process in the ready-mix concrete and aggregates markets is moderate.
93
Table of Contents
Urbanization Solutions. In Germany, for the year ended December 31, 2022, our Urbanization Solutions business consisted of admixtures. This business is located mainly in the eastern and western regions of Germany.
Our Operating Network in Germany
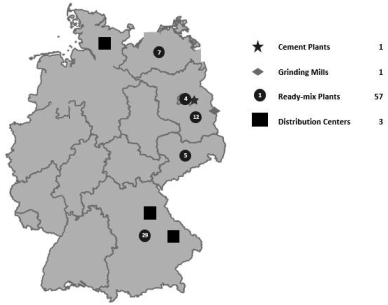
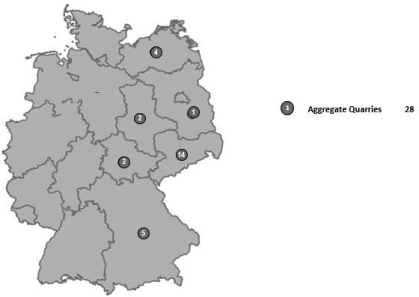
Description of Properties, Plants and Equipment. As of December 31, 2022, we operated one cement plant and one cement grinding mill in Germany and our installed cement capacity was 3.1 million tons per year. We estimate that, as of December 31, 2022, the limestone permitted proven and probable reserves of our operations in Germany had an average remaining life up to 33 years, assuming 2018 to 2022 average annual production levels. In July 2022, Cemex completed the acquisition of a 53% stake in ProStein, a German aggregates company. Our aggregate sales in Germany are expected to double as a result of the acquisition. ProStein’s assets
94
Table of Contents
include six active hardstone plants. As of December 31, 2022, our operations in Germany also included 57 ready-mix concrete plants (all of them active), 28 aggregates quarries (12 were temporarily inactive) and three land distribution centers.
Capital Expenditures. We made capital expenditures of $24 million in 2020, $29 million in 2021, and $33 million in 2022 in our operations in Germany. As of December 31, 2022, we expected to make capital expenditures of $38 million in our operations in Germany during 2023.
Our Operations in Poland
Overview. For the year ended December 31, 2022, our operations in Poland represented 2% of our revenues before eliminations resulting from consolidation in Dollar terms. As of December 31, 2022, our operating business in Poland represented 1% of our total assets, in Dollar terms. As of December 31, 2022, we were a leading provider of building materials in Poland, serving the cement, ready-mix concrete and aggregates markets. As of December 31, 2022, we operated two cement plants (all of them active) and one grinding mill with an installed cement capacity of 3.8 million tons per year. As of December 31, 2022, we also operated 44 ready-mix concrete plants (two were temporarily inactive), six aggregates quarries (all of them active), two distribution centers and two marine terminals in Poland. For the year ended December 31, 2022, cement represented 58%, ready-mix concrete represented 33%, aggregates represented 8% and Urbanization Solutions and our other businesses represented 1%, respectively of revenues from our operations in Poland before eliminations resulting from consolidation in Dollar terms.
Industry. Preliminary estimates suggest that total cement consumption in Poland decreased approximately 1% in 2022 from 2021.
Competition. As of December 31, 2022, our primary competitors in the cement, ready-mix concrete and aggregates markets in Poland were Heidelberg, Holcim, CRH, Dyckerhoff and Miebach.
Capital Expenditures. We made capital expenditures of $19 million in 2020, $29 million in 2021, and $33 million in 2022 in our operations in Poland. As of December 31, 2022, we expected to make capital expenditures of $41 million in our operations in Poland during 2023.
Urbanization Solutions. In Poland, for the year ended December 31, 2022, in terms of relevant revenues, our Urbanization Solutions business consisted primarily of admixtures and mortars. These businesses are located across Poland.
95
Table of Contents
Our Operations in Spain
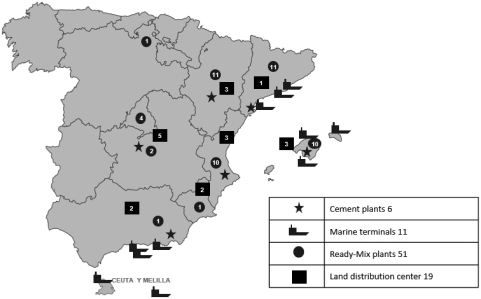
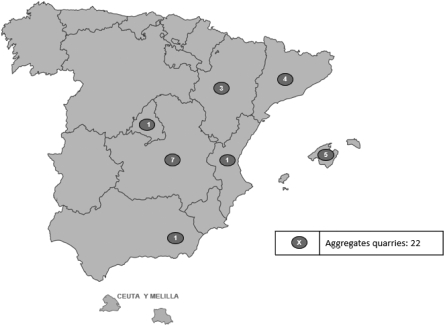
Overview. For the year ended December 31, 2022, our operations in Spain represented 2% of our revenues before eliminations resulting from consolidation in Dollar terms. As of December 31, 2022, our operating business in Spain represented 2% of our total assets, in Dollar terms.
Industry. According to the Spanish Ministry of Industry, total cement consumption in Spain decreased by 1% in 2022 compared to 2021. As of December 31, 2022, cement exports from Spain amounted to 4.1 million tons. In recent years, Spanish cement and clinker export volumes have fluctuated, reflecting the rapid changes in demand in the Mediterranean basin as well as the strength of the Euro and changes in the domestic market. According to the Spanish Ministry of Industry, these total export volumes remained flat in 2020, increased 25% in 2021 and decreased 2% in 2022 compared to 2021.
96
Table of Contents
Competition. According to our estimates, as of December 31, 2022, we were one of the top four producers of clinker and cement in Spain. Competition in the ready-mix concrete industry is intense in large urban areas. The overall high degree of competition in the Spanish ready-mix concrete industry is reflected in the multitude of offerings from a large number of concrete suppliers. We have focused on developing value-added products and attempting to differentiate ourselves in the marketplace. The distribution of ready-mix concrete remains a key component of our business strategy in Spain.
Urbanization Solutions. In Spain, for the year ended December 31, 2022, in terms of relevant revenues, our Urbanization Solutions business consisted primarily of mortars and admixtures. These businesses are located across Spain.
Products and Distribution Channels
Cement. For the year ended December 31, 2022, our cement operations represented 64% of revenues from our operations in Spain before eliminations resulting from consolidation in Dollar terms. We offer various types of cement in Spain, targeting specific products to specific markets and users. In 2022, 16% of the domestic sales volume of our main operating subsidiary in Spain consisted of bagged cement, and the remainder of its domestic sales volume consisted of bulk cement, primarily to ready-mix concrete operators, including sales to our other operations in Spain, as well as industrial customers that use cement in their production processes and construction companies.
Ready-Mix Concrete. For the year ended December 31, 2022, our ready-mix concrete operations represented 23% of revenues from our operations in Spain before eliminations resulting from consolidation in Dollar terms. Our ready-mix concrete operations in Spain in 2022 purchased 94% of their cement requirements from our cement operations in Spain and 63% of their aggregates requirements from our aggregates operations in Spain.
Aggregates. For the year ended December 31, 2022, our aggregates operations represented 8% of revenues from our operations in Spain before eliminations resulting from consolidation in Dollar terms.
Urbanization Solutions and Others: For the year ended December 31, 2022, our Urbanization Solutions and other businesses operations represented 5% of revenues from our operations in Spain before eliminations resulting from consolidation in Dollar terms.
Exports. Exports of cement and clinker by our operations in Spain, which represented 29% of our total cement sales volume in Spain for 2022, which increased 8% in 2022 compared to 2021. Of our total exports from Spain in 2022, 58% consisted of gray portland cement and 42% of clinker.
Production Costs. We have improved the efficiency of our operations in Spain by introducing technological improvements that have significantly reduced our energy costs, including the use of alternative fuels, in accordance with our cost reduction efforts. In 2022, we used organic waste, tires and plastics as fuel, achieving a 48% substitution rate for pet coke in our gray and white clinker kilns for the year.
Description of Properties, Plants and Equipment. As of December 31, 2022, our operations in Spain included six cement plants (two were temporarily inactive) located in Spain with an annual installed cement capacity of 7.7 million tons. As of that date, we also had 30 operative distribution centers, including 19 land and 11 marine terminals, 51 ready-mix concrete plants (15 were temporarily inactive), 22 aggregates quarries (eight were temporarily inactive), eight mortar plants and one admixture plant. We estimate that, as of December 31, 2022, the limestone and clay permitted proven and probable reserves of our operations in Spain had an average remaining life of 56 and 36 years, respectively, assuming 2018 to 2022 average annual production levels.
Capital Expenditures. We made capital expenditures of $22 million in 2020, $34 million in 2021, and $27 million in 2022 in our operations in Spain. As of December 31, 2022, we expected to make capital expenditures of $27 million in our operations in Spain during 2023.
97
Table of Contents
Our Operations in the Philippines
Overview. As of December 31, 2022, on a consolidated basis, Cemex España indirectly held 100% of Cemex Asian South East Corporation (“CASEC”), which in turn owned 77.9% of the outstanding share capital of CHP. As of December 31, 2022, CHP directly and indirectly owned 100% of our two principal operating subsidiaries in the Philippines, Solid Cement Corporation (“Solid Cement”) and APO Cement Corporation (“APO”). For the year ended December 31, 2022, our operations in the Philippines represented 2% of our revenues before eliminations resulting from consolidation in Dollar terms. As of December 31, 2022, our operations in the Philippines represented 3% of our total assets, in Dollar terms.
As of December 31, 2022, CHP was investing in a new 1.5 million ton integrated cement production line at the Solid Cement Plant located in Luzon, Philippines (the “Solid Cement Plant”) with an estimated total investment of $371.8 million. Upon completion, this new line should nearly double the capacity of the Solid Cement Plant and would represent a 26% increase in our cement capacity in the Philippines. In October 2018, we entered into principal project agreements with CBMI Construction Co., Ltd (“CBMI”), an affiliate of Sinoma International Engineering Co., Ltd., for the procurement, construction and installation of the new line. On April 25, 2019, Solid Cement held its ceremonial groundbreaking for the new line. Various work was already ongoing, including the mobilization of equipment and site development. The new rotary kiln was lifted into position in January 2021. On December 7, 2021, Solid Cement served a notice of termination with respect to the construction contract with CBMI, which covered the construction and installation of Solid Cement’s new line. Solid Cement’s notice of termination, which applies to one of the principal project agreements with CBMI, was issued due to the delay in construction and installation work. Solid Cement took measures to address contingencies which have arisen as a result of this termination, including engaging replacement contractors for the project. During the first quarter of 2022, Solid Cement entered into contracts with Atlantic Gulf and Pacific Company of Manila, Inc. and Betonbau Phil., Inc. to continue the construction and installation of Solid Cement’s new line. As of December 31, 2022, among the project components completed were the slip form works for the raw meal silo, clinker silos, and cement silos of the new line. CHP estimates that the construction of the new line should be completed by March 2024 and the start of its operations could commence in April 2024.
Industry. According to the Philippine Statistics Authority, gross fixed capital formation in construction in 2022 was still below pre-COVID-19 pandemic 2019 levels by 12.4%. Although the public sector saw a resilient performance with its 37.2% growth compared to 2019, the private sector, which accounts for more than 60% of gross fixed capital formation in construction, pulled down the overall industry as it was lower by 28.8% in 2022 compared to 2019.
Competition. As of December 31, 2022, our major competitors in the Philippine cement market were Holcim, Republic, Eagle, Northern, Goodfound, Taiheiyo, and Mabuhay.
Description of Properties, Plants and Equipment. As of December 31, 2022, our operations in the Philippines included two cement plants (all of them active) with an annual installed cement capacity of 5.7 million tons, exclusive access to four quarries to supply raw materials to our cement plants, one aggregate quarry (which was temporarily inactive), 19 land distribution centers and six marine distribution terminals. We estimate that, as of December 31, 2022, the limestone and clay permitted proven and probable reserves accessed by our operations in the Philippines had an average remaining life of 193 years for Solid Cement and 36 years for APO, assuming 2018 to 2022 average annual production levels.
Cement. For the year ended December 31, 2022, our cement operations represented 99% of revenues from our operations in the Philippines before eliminations resulting from consolidation in Dollar terms.
Urbanization Solutions and Others: For the year ended December 31, 2022, our Urbanization Solutions and other businesses operations represented 1% of revenues from our operations in Philippines before eliminations resulting from consolidation in Dollar terms.
98
Table of Contents
Capital Expenditures. We made capital expenditures of $82 million in 2020, $89 million in 2021, and $72 million in 2022 in our operations in the Philippines. As of December 31, 2022, we expected to make capital expenditures of $127 million in our operations in the Philippines during 2023.
Urbanization Solutions. In the Philippines, for the year ended December 31, 2022, in terms of relevant revenues, our Urbanization Solutions business consisted of admixtures. This business is located across the Philippines.
Our Operations in Israel
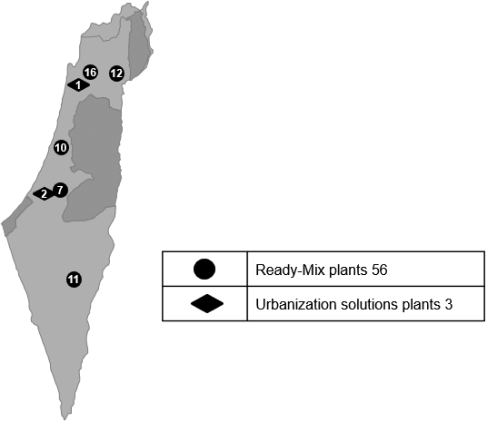
99
Table of Contents
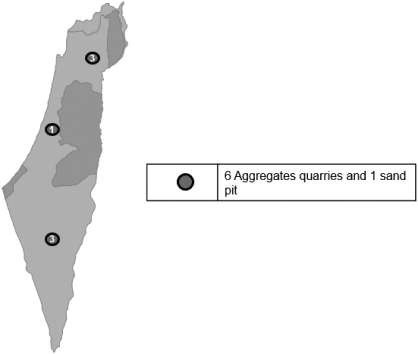
Overview. We are a leading producer and supplier of raw materials for the construction industry in Israel. In addition to ready-mix concrete and aggregates, we produce a diverse range of building materials and infrastructure products in Israel. As of December 31, 2022, as indicated in the above maps, we operated 56 ready-mix concrete plants (all of them active), seven aggregates quarries (all of them active), which includes one sand pit, two concrete products plants and one admixtures plants. For the year ended December 31, 2022, our operations in Israel represented 5% of our revenues before eliminations resulting from consolidation in Dollar terms and 3% of our total assets, in Dollar terms. For the year ended December 31, 2022, ready-mix concrete represented 68%, aggregates represented 21%, Urbanization Solutions and our other businesses represented 11%, respectively of revenues from our operations in Israel before eliminations resulting from consolidation in Dollar terms.
Capital Expenditures. We made capital expenditures of $28 million in 2020, $45 million in 2021, and $37 million in 2022 in our operations in Israel. As of December 31, 2022, we expected to make capital expenditures of $29 million in our operations in Israel during 2023.
Urbanization Solutions. In Israel, for the year ended December 31, 2022, in terms of relevant revenues, our Urbanization Solutions business consisted primarily of other concrete products and admixtures, among others. These businesses are located across Israel.
Rest of EMEAA
As of December 31, 2022, our operations in the Rest of EMEAA segment consisted primarily of our operations in the Czech Republic, Croatia, Egypt and the UAE. These operations represented 4% of our revenues, before eliminations resulting from consolidation in Dollar terms, for the year ended December 31, 2022, and 3% of our total assets as of December 31, 2022, in Dollar terms. As of December 31, 2022, we expected to make capital expenditures of $46 million in the Rest of EMEAA segment during 2023.
Our Operations in the Czech Republic
Overview. As of December 31, 2022, we were a leading producer of ready-mix concrete and aggregates in the Czech Republic. We also distribute cement in the Czech Republic. As of December 31, 2022, we operated
100
Table of Contents
one cement plant and one grinding mill with annual cement installed capacity of 1.7 million tons, one cement terminal and one admixtures plant in the Czech Republic. As of December 31, 2022, we also operated 71 ready-mix concrete plants (three of which were temporarily inactive), which include three mobile equipment producing concrete and 14 aggregates quarries in the Czech Republic (one was inactive).
Industry. According to the Czech Statistical Office, total construction output in the Czech Republic grew 2.5% year-over-year in 2022 as buildings construction increased by 2.8% while civil engineering was up by 1.7% year-over-year.
According to the Czech Cement Association, total cement consumption in the Czech Republic reached year- over-year growth of 2% in the first half of 2022. According to our estimates, in 2023, ready-mix concrete production in the Czech Republic is estimated to decrease slightly in comparison to 2022.
Competition. As of December 31, 2022, our main competitors in the cement, ready-mix concrete and aggregates markets in the Czech Republic were Heidelberg, Buzzi-Unicem, Holcim, Strabag and Skanska.
Capital Expenditures. We made capital expenditures of $17 million in 2020, $26 million in 2021 and $21 million in 2022, in our operations in the Czech Republic. As of December 31, 2022, we expected to make capital expenditures of $25 million in our operations in the Czech Republic during 2023.
Urbanization Solutions. In the Czech Republic, for the year ended December 31, 2022, in terms of relevant revenues, our Urbanization Solutions business consisted of admixtures. This business is located in the northeastern region of the Czech Republic.
Our Operations in Croatia
Overview. We were the largest cement producer in Croatia based on installed capacity as of December 31, 2022, according to our estimates. As of December 31, 2022, we had two cement plants (all of them active) in Croatia with an annual cement installed capacity of 2.2 million tons. In 2022, one cement plant was permanently shut down. As of December 31, 2022, we also operated 11 land distribution centers, two marine cement terminals in Croatia, Bosnia and Herzegovina, Serbia and Montenegro, seven ready-mix concrete facilities in Croatia and Bosnia and Herzegovina (all of them active), and one recycling yard in Croatia.
Industry. According to our estimates made as of the date of this annual report, total cement consumption in Croatia, Bosnia and Herzegovina and Montenegro increased by 1.2% in 2022 compared to 2021.
Competition. As of December 31, 2022, our primary competitors in the cement market in Croatia were Nexe and Holcim.
Capital Expenditures. We made capital expenditures of $8 million in 2020, $15 million in 2021, and $11 million in 2022 in our operations in Croatia. As of December 31, 2022, we expected to make capital expenditures of $6 million in our operations in Croatia during 2023.
Urbanization Solutions. In Croatia, during the 2022 calendar year, our Urbanization Solutions business for most of the year consisted of pavement services; however, as of December 31, 2022, such services were no longer being provided.
Our Operations in Egypt
Overview. As of December 31, 2022, we operated one cement plant in Egypt with an annual installed cement capacity of 5.4 million tons. This plant is located approximately 280 miles south of Cairo and serves the
101
Table of Contents
upper Nile region of Egypt, as well as Cairo and the Delta region, Egypt’s main cement market. We estimate that, as of December 31, 2022, the limestone and clay permitted proven and probable reserves of our operations in Egypt had an average remaining life of 22 and 22 years, respectively, assuming 2018 to 2022 average annual production levels. In addition, as of December 31, 2022, we had six ready-mix concrete plants (one was inactive) and three land distribution centers in Egypt, and one admixtures plant. See “Item 4—Information on the Company—Regulatory Matters and Legal Proceedings—Other Legal Proceedings—Egypt Share Purchase Agreement” for a description of certain legal proceedings relating to the share purchase agreement, signed in November 1999 between Cemex, S.A.B. de C.V. and state-owned Metallurgical Industries Company, pursuant to which Cemex, S.A.B. de C.V. acquired a controlling interest in ACC Limited (“ACC”).
Industry. According to the Ministry of Trade and Industry official figures and Cemex’s estimates, based on government data (local and imported cement), the Egyptian market cement consumption increased by 5.4% in 2022 compared to 2021, which was mainly attributed to the governmental construction ban in 2020. As of December 31, 2022, the cement industry in Egypt had a total of 18 cement producers, with an aggregate annual installed cement production capacity of approximately 91 million tons.
Competition. According to the Ministry of Investment official figures, during 2022, Holcim (Egyptian Cement Company), ACC and Heidelberg (Suez Cement, Torah Cement and Helwan Portland Cement) represented approximately 28% of the total cement production in Egypt. Other significant competitors in Egypt are Arabian (La Union), Titan (Alexandria Portland Cement and BeniSuef Cement), Amreyah (InterCement), Sinai (Vicat), South Valley, Nile Valley, El Seweedy, Arish Cement, National Company for Cement (Beni Suef plant), Aswan Medcom, Misr BeniSuef, Al Nahda and Misr Quena Cement Companies, Building Materials Industries Co. and ASEC Cement.
Capital Expenditures. We made capital expenditures of $8 million in 2020, $20 million in 2021 and $16 million in 2022 in our operations in Egypt. As of December 31, 2022, we expected to make capital expenditures of $11 million in our operations in Egypt during 2023.
Urbanization Solutions. In Egypt, for the year ended December 31, 2022, in terms of relevant revenues, our Urbanization Solutions business consisted primarily of admixtures and pavement services. These businesses are located across Egypt.
Our Operations in the UAE
Overview. As of December 31, 2022, Cemex España held a 49% equity interest (and a 100% economic interest) in all of our main UAE companies: Cemex Topmix LLC and Cemex Supermix LLC, ready-mix concrete manufacturing companies, and Cemex Falcon LLC, which specializes in the production of cement and slag. We are not permitted to have a controlling interest in these companies (UAE Commercial Companies Law requires 51% ownership by UAE nationals). However, through agreements with other shareholders in these companies, we have control over the remaining 51% of the economic benefits in each of the companies. As a result, we own a 100% economic interest in all three companies. As of December 31, 2022, we owned 12 ready-mix concrete plants (two were temporarily inactive), three pugmill plants, one admixture plant and one cement and slag grinding facility in the UAE with an annual installed cement capacity of 1.2 million tons, serving the markets of Dubai and Abu Dhabi as well as neighboring countries such as Oman.
Capital Expenditures. We made capital expenditures of $1 million in 2020, $5 million in 2021, and $7 million in 2022 in our operations in the UAE. As of December 31, 2022, we expected to make capital expenditures of $4 million in our operations in the UAE during 2023.
Urbanization Solutions. In the UAE, for the year ended December 31, 2023, in terms of relevant revenues, our Urbanization Solutions business consisted of admixtures. This business is located across the UAE.
102
Table of Contents
SCA&C
For the year ended December 31, 2022, our business in the SCA&C region, which included our operations in Colombia, Panama, Caribbean TCL, the Dominican Republic and the Rest of SCA&C segment, as described below, represented 9% of our revenues before eliminations resulting from consolidation in Dollar terms. As of December 31, 2022, our operations in the SCA&C region represented 15% of our total installed capacity and 8% of our total assets, in Dollar terms.
CLH is the main holding company for Cemex’s operations in Colombia, Panama, Guatemala and Nicaragua.
On August 31, 2022, through certain of our subsidiaries, we concluded the sale of our operations in Costa Rica and El Salvador with affiliates of Cementos Progreso Holdings, S.L., for a total consideration of $325 million, related to our aggregate controlling interest. Our operations of these assets in Costa Rica and El Salvador for the years ended December 31, 2020, 2021 and for the period from January 1, 2022 to August 31, 2022 are reported in the statements of operations, net of income tax, as part of the single line item “Discontinued operations,” including in 2022 a gain on sale of $240 million.
Our Operations in Colombia
Overview. As of December 31, 2022, Cemex Colombia was the second-largest cement producer in Colombia, based on installed cement capacity of 4.1 million tons per year as of December 31, 2022. For the year ended December 31, 2022, our operations in Colombia represented 2% of our revenues before eliminations resulting from consolidation in Dollar terms. As of December 31, 2022, our operating business in Colombia represented 3% of our total assets, in Dollar terms.
Cemex Colombia has a significant market share in the cement and ready-mix concrete market in the “Urban Triangle” of Colombia comprising the cities of Bogotá, Medellín and Cali. During 2022, these three metropolitan areas accounted for approximately 37.7% of Colombia’s cement consumption. Cemex Colombia’s Ibagué plant, which is strategically located in the Urban Triangle, is Cemex Colombia’s largest plant as of December 31, 2022. Cemex Colombia, through its Cúcuta plant and Clemencia grinding facility, is also an active participant in Colombia’s northeastern and coastal markets.
Industry. According to our estimates made as of the date of this annual report, the installed capacity for cement in Colombia was 21.2 million tons in 2022. According to the Colombian National Statistical Administrative Department (Departamento Administrativo Nacional de Estadística), total cement consumption in Colombia reached 13.5 million tons during 2022, an increase of 4% from 2021, while cement exports from Colombia during 2022 reached 1.05 million tons (according to the global trade and market research platform, SICEX). We estimate that as of December 31, 2022, close to 65% of cement in Colombia was consumed by the housing and self-construction sector, while the infrastructure sector accounted for approximately 28% of total cement consumption and has been growing in recent years up to December 31, 2022. The other construction segments in Colombia, including the formal housing and commercial sectors, account for the balance of cement consumption in Colombia.
Competition. As of December 31, 2022, our two largest competitors in Colombia were Cementos Argos, which has established a leading position in the Colombian Caribbean coast, Antioquia and Southwest region markets, and Holcim in the central region of the country. We estimate that as of December 31, 2022 there were 13 other local and regional competitors in Colombia.
The ready-mix concrete industry in Colombia was fairly consolidated with the top three producers accounting for approximately 66.3% of the market as of December 31, 2022. Cemex Colombia was the second-largest ready-mix concrete producer as of December 31, 2022. The first and third largest producers were Cementos Argos and Holcim Colombia, respectively.
103
Table of Contents
The aggregates market in Colombia is highly fragmented and is dominated by the informal market. Approximately 95% of the aggregates market in Colombia was comprised of small independent producers as of December 31, 2022.
Urbanization Solutions. In Colombia, for the year ended December 31, 2022, in terms of relevant revenues, our Urbanization Solutions business consisted primarily of energy, multiproducts and admixtures, among others. These businesses are located across Colombia.
Our Operating Network in Colombia
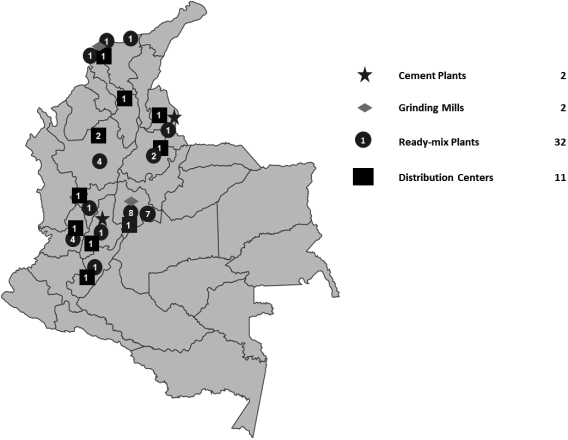
104
Table of Contents
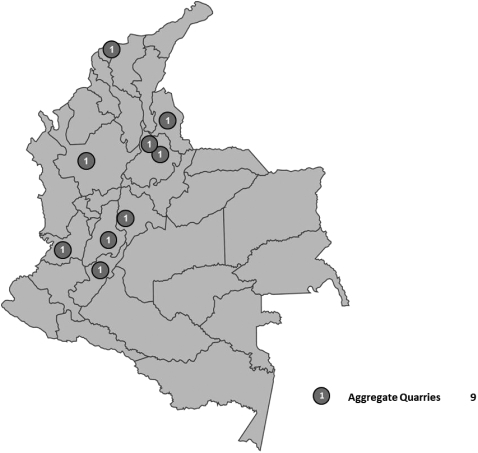
Products and Distribution Channels
Cement. For the year ended December 31, 2022, our cement operations represented 53% of revenues from our operations in Colombia before eliminations resulting from consolidation in Dollar terms.
Ready-Mix Concrete. For the year ended December 31, 2022, our ready-mix concrete operations represented 25% of revenues from our operations in Colombia before eliminations resulting from consolidation in Dollar terms.
Aggregates. For the year ended December 31, 2022, our aggregates operations represented 7% of revenues from our operations in Colombia before eliminations resulting from consolidation in Dollar terms.
Urbanization Solutions and Others: For the year ended December 31, 2022, our Urbanization Solutions and other businesses operations represented 15% of revenues from our operations in Colombia before eliminations resulting from consolidation in Dollar terms.
Description of Properties, Plants and Equipment. As of December 31, 2022, Cemex Colombia owned two operating cement plants and two cement grinding mills, having a total installed cement grinding capacity of 4.1 million tons. In 2022, we replaced 28.6% of our total fuel consumed in Cemex Colombia with alternative fuels, and we had an internal electricity generating capacity of approximately 37 MW as of December 31, 2022. We estimate that, as of December 31, 2022, the limestone and clay permitted proven and probable reserves of our operations in Colombia had an average remaining life of 60 and 261 years, respectively, assuming 2018 to 2022
105
Table of Contents
average annual production levels. The operating licenses for quarries in Colombia are renewed every 30 years; assuming renewal of such licenses, we estimate having sufficient cement raw materials reserves for our operations in Colombia for over 61 years assuming 2018 to 2022 average annual cement raw materials production levels. Immaterial volumes extracted from the quarry located in Maceo during its trial period and for the Maceo Plant road construction are excluded from this calculation. As of December 31, 2022, Cemex Colombia also operated 11 distribution centers, one mortar plant, one admixtures plant, 32 ready-mix concrete plants (all of them active), nine aggregates operations (eight were temporarily inactive) and one adhesives plant.
Cemex Colombia continues its progress on the Maceo Plant Project, with 90% and 26% of the plant and road portions completed as of the year ended December 31, 2022, respectively. We expect the Maceo Plant Project to enter into commission in the second half of 2023. See “Item 4—Information on the Company—Regulatory Matters and Legal Proceedings—Other Legal Proceedings—Maceo, Colombia—Legal Proceedings in Colombia” for the status of that project.
Capital Expenditures. We made capital expenditures of $14 million in 2020, $27 million in 2021 and $45 million in 2022 in our operations in Colombia. As of December 31, 2022, we expected to make capital expenditures of $77 million in our operations in Colombia during 2023.
Our Operations in Panama
Overview. For the year ended December 31, 2022, our operations in Panama represented 1% of our revenues before eliminations resulting from consolidation in Dollar terms. For the year ended December 31, 2022, cement represented 71%, ready-mix concrete represented 16%, aggregates represented 4%, Urbanization Solutions and other businesses represented 9%, respectively, of our revenues from our operations in Panama before eliminations resulting from consolidation in Dollar terms. As of December 31, 2022, our operating business in Panama represented 1% of our total assets, in Dollar terms.
Industry. As of the date of this annual report, we estimate that approximately 0.99 million cubic meters of ready-mix concrete were sold in Panama during 2022. Cement consumption in Panama increased 8% in 2022 compared to 2021, mainly due to increased consumption in the housing sector and due to the reactivation of the Subway Line 3 Project. However, cement consumption in Panama was still approximately 19% lower in 2022 when compared to 2019, mainly due to high residence inventories and an increasing level of unoccupied industrial and commercial buildings that have affected the organic growth of cement consumption.
Competition. As of December 31, 2022, the cement industry in Panama included three cement producers: Cemento Bayano, Argos Panamá, an affiliate of Cementos Argos, and Cemento Chagres, a company that started operations during the second half of 2020 and is 100% owned by Panamanian investors.
Description of Properties, Plants and Equipment. As of December 31, 2022, our operations in Panama through Cemento Bayano operated one cement plant in Panama, with an installed cement capacity of 1.2 million tons and clinker capacity of 1.6 million tons. As of that date, Cemento Bayano also operated six ready-mix concrete plants (one was temporarily inactive), one admixtures plant and three distribution centers, including one location at the cement plant.
Capital Expenditures. We made capital expenditures of $3 million in 2020, $9 million in 2021 and $19 million in 2022 in our operations in Panama. As of December 31, 2022, we expect to make capital expenditures of $8 million in our operations in Panama during 2023.
Urbanization Solutions. In Panama, for the year ended December 31, 2022, in terms of relevant revenues, our Urbanization Solutions business consisted primarily of admixtures, among others. These businesses are located across Panama.
106
Table of Contents
Our Operations in Caribbean TCL
As of December 31, 2022, Caribbean TCL was one of the leading producers and marketers of cement and ready-mix concrete products in the Caribbean’s construction sector, with operations strategically located in Jamaica, Trinidad and Tobago, Guyana and Barbados. For the year ended December 31, 2022, our operations in Caribbean TCL represented 2% of our revenues before eliminations resulting from consolidation in Dollar terms. As of December 31, 2022, our operations in Caribbean TCL represented 2% of our total assets, in Dollar terms. For the year ended December 31, 2022, cement represented 95%, ready-mix concrete represented 1%, aggregates represented 2%, Urbanization Solutions and our other businesses represented 2%, respectively, of our revenues from our operations in Caribbean TCL before eliminations resulting from consolidation in Dollar terms.
As of December 31, 2022, our focus with respect to Caribbean TCL will continue on attempting to maximize further synergies from TCL’s integration with us. As of December 31, 2022, we intended to improve the productivity and capacity of our Caribbean TCL’s cement plants, continue the vertical integration of Caribbean TCL’s business, invest in developing its employees and offer strong value products to our customers in the region and elsewhere.
Capital Expenditures. We made capital expenditures of $16 million in 2020, $22 million in 2021, and $16 million in 2022 in Caribbean TCL. As of December 31, 2022, we expected to make capital expenditures of $20 million during 2023 in Caribbean TCL.
Our Operations in Trinidad & Tobago
Description of Properties, Plants and Equipment. As of December 31, 2022, TCL operated 1 cement plant in Trinidad & Tobago, with a total annual cement installed capacity of 1.0 million tons. As of December 31, 2022, TCL had 2 operational ready-mix concrete plants (one was temporarily inactive), three aggregates quarries (all of them active), four land distribution centers and one marine terminal.
Urbanization Solutions. In Trinidad & Tobago, for the year ended December 31, 2022, in terms of relevant revenues, our Urbanization Solutions business consisted primarily of admixtures.
Our TCL Operations in Jamaica
Overview. As of December 31, 2022, we held an indirect controlling position mainly through TCL in CCCL.
Description of Properties, Plants and Equipment. As of December 31, 2022, CCCL operated one cement plant in Jamaica, with a total cement installed capacity of 1.5 million tons. As of December 31, 2022, CCCL had four land distribution centers, including one location at the cement plant, and one marine terminal.
Our Operations in Barbados
Overview. As of December 31, 2022, through TCL, we held an indirect controlling position in Arawak Cement Company Limited (“Arawak”) in Barbados.
Description of Properties, Plants and Equipment. As of December 31, 2022, Arawak operated one cement plant in Barbados, with a total cement installed capacity of 0.4 million tons. As of that date, Arawak had one ready-mix concrete plant (temporarily inactive), one land distribution center and one marine terminal.
Urbanization Solutions. In Barbados, for the year ended December 31, 2022, we did not have any Urbanization Solutions business.
Our Operations in the Dominican Republic
Overview. As of December 31, 2022, Cemex Dominicana, S.A.’s (“Cemex Dominicana”) sales network covered the country’s main consumption areas, which are Santo Domingo, Santiago de los Caballeros, La
107
Table of Contents
Altagracia, San Cristobal and San Pedro de Macoris. On May 8, 2000, Cemex Dominicana entered into a lease agreement with the government of the Dominican Republic related to the exploitation of a gypsum mine located at Las Salinas, Barahona, which has enabled Cemex Dominicana to supply local and regional gypsum requirements. The lease agreement expires on May 8, 2025 and may be extended by the parties. For the year ended December 31, 2022, our operations in the Dominican Republic represented 2% of our revenues before eliminations resulting from consolidation, in Dollar terms. As of December 31, 2022, our operations in the Dominican Republic represented 1% of our total assets, in Dollar terms. For the year ended December 31, 2022, cement represented 79%, ready-mix concrete represented 6%, Urbanization Solutions and other businesses represented 15%, respectively, of our revenues from our operations in the Dominican Republic before eliminations resulting from consolidation in Dollar terms.
Industry. According to figures from the Dominican Cement Producers Association (Asociación Dominicana de Productores de Cemento Portland), cement consumption in the Dominican Republic reached 5.5 million tons in 2022.
Competition. As of December 31, 2022, our principal competitors in the Dominican Republic were: Cementos Cibao, a local producer; Domicem, a mixed Italian/local cement producer; Cementos Argos, a grinding operation of a Colombian cement producer; Cementos Santo Domingo, a cement grinding partnership between a local investor and Cementos La Union from Spain; Cementos Panam, a local cement producer; and Cementos Andino, a grinding operation; and a partially constructed cement kiln of a Colombian cement producer, currently inactive.
Description of Properties, Plants and Equipment. As of December 31, 2022, Cemex Dominicana operated one cement plant in the Dominican Republic, with an installed cement capacity of 2.4 million tons per year. As of that date, Cemex Dominicana also owned five ready-mix concrete plants (one was temporarily inactive), one aggregates quarry (currently inactive), two land distribution centers and two leased marine terminals.
Capital Expenditures. We made capital expenditures of $2 million in 2020, $15 million in 2021, and $18 million in 2022 in our operations in the Dominican Republic. As of December 31, 2022, we expected to make capital expenditures of $15 million in our operations in the Dominican Republic during 2023.
Urbanization Solutions. In the Dominican Republic, for the year ended December 31, 2022, in terms of relevant revenues, our Urbanization Solutions business consisted primarily of multiproducts, among others. This business is located across the country.
Rest of SCA&C
As of December 31, 2022, our operations in the Rest of SCA&C segment consisted primarily of our operations and activities in Peru, Puerto Rico, Nicaragua, Jamaica, the Caribbean and Guatemala, excluding our Caribbean TCL segment. These operations represented 2% of our revenues, before eliminations resulting from consolidation in Dollar terms. As of December 31, 2022, our business in the Rest of SCA&C segment represented 1% of our total assets, in Dollar terms.
Our Operations in Puerto Rico
Overview. As of December 31, 2022, Cemex de Puerto Rico, Inc. (“Cemex Puerto Rico”) was our main subsidiary in Puerto Rico.
Industry. In 2022, cement consumption in Puerto Rico reached 0.6 million tons according to the Puerto Rico Economic Development Bank.
108
Table of Contents
Competition. The cement industry in Puerto Rico in 2022 was comprised of two cement companies: Cemex Puerto Rico and Cementos Argos (formerly Antilles Cement Co (Marine Terminal) and San Juan Cement Co (Cement Plant)).
Description of Properties, Plants and Equipment. As of December 31, 2022, Cemex Puerto Rico operated one grinding mill, with an installed cement capacity of 1.3 million tons per year. As of that date, Cemex Puerto Rico also operated four ready-mix concrete plants (three were temporarily inactive), two land distribution centers and one marine terminal used for fly ash. As of that date, Cemex Puerto Rico also owned one aggregates quarry, which is currently inactive.
Capital Expenditures. We made capital expenditures of $0.2 million in 2020, $2 million in 2021, and $3 million in 2022 in our operations in Puerto Rico. As of December 31, 2022, we expected to make capital expenditures of $3 million in our operations in Puerto Rico during 2023.
Urbanization Solutions. In Puerto Rico, for the year ended December 31, 2022, in terms of relevant revenues, our Urbanization Solutions business consisted primarily of lime, among others. These businesses are located across Puerto Rico.
Our Operations in Nicaragua
Overview. As of December 31, 2022, Cemex Colombia and Corporación Cementera Latinoamericana, S.L.U., both CLH subsidiaries, indirectly and directly owned 100% of Cemex Nicaragua, S.A. (“Cemex Nicaragua”), our operating subsidiary in Nicaragua.
Industry. We estimate that 0.89 million tons of cement, 0.14 million cubic meters of ready-mix concrete and 4.9 million tons of aggregates were sold in Nicaragua during 2022.
Competition. As of December 31, 2022, two market participants compete in the Nicaraguan cement industry, Cemex and Holcim.
Description of Properties, Plants and Equipment. As of December 31, 2022, we leased and operated one cement plant (currently active) and owned one grinding mill with a total installed cement capacity of 0.7 million tons, six ready-mix concrete plants (two were temporarily inactive) and two distribution centers in Nicaragua. We also had three aggregate quarries (all of them inactive). Since March 2003, Cemex Nicaragua has also leased a 100,000 tons milling plant in Managua, which has been used exclusively for pet coke milling.
Capital Expenditures. We made capital expenditures of $3 million in 2020, $5 million in 2021 and $4 million in 2022 in our operations in Nicaragua. As of December 31, 2022, we expected to make capital expenditures of $7 million in our operations in Nicaragua during 2023.
Urbanization Solutions. In Nicaragua, for the year ended December 31, 2022, in terms of relevant revenues, our Urbanization Solutions business consisted primarily of multiproducts. These businesses are located across Nicaragua.
Our Operations in Guatemala
Overview. As of December 31, 2022, CLH indirectly owned 100% of Cemex Guatemala, our main operating subsidiary in Guatemala.
Industry. We estimate that 5.01 million tons of cement, .099 million cubic meters of ready-mix concrete and 28.9 million tons of aggregate were sold in Guatemala during 2022. National cement consumption in Guatemala increased 2% against 2021, mainly driven by the reactivation of the formal construction section (e.g., vertical housing and industrial projects in metropolitan areas) and a steady consumption from the self-building sector.
109
Table of Contents
Competition. As of December 31, 2022, 11 market participants compete in the Guatemalan cement industry (Cemex, CEMPRO, REGIONAL, Wan Peng, Bonanza, Robusto, Mayacem, Stark, CEMGUA, Argos and Ultracem).
Description of Properties, Plants and Equipment. As of December 31, 2022, we owned and operated one cement grinding mill in Guatemala with an installed cement capacity of 0.6 million tons per year. As of that date, we also owned and operated five land distribution centers (including one location at the cement plant), one clinker dome close to our leased marine terminal in the southern part of the country and three ready-mix concrete plants (two were temporarily inactive).
Capital Expenditures. We made capital expenditures of $1 million in 2020, $3 million in 2021 and $10 million in 2022 in Guatemala. As of December 31, 2022, we expected to make capital expenditures of $16 million in our operations in Guatemala during 2023.
Urbanization Solutions. In Guatemala, for the year ended December 31, 2022, in terms of relevant revenues, our Urbanization Solutions business consisted primarily of multiproducts, among others. These businesses are located across Guatemala.
Our Operations in the Rest of SCA&C
Overview. As of December 31, 2022, we held a non-controlling position in National Cement Ltd. in the Cayman Islands, Maxcem Bermuda Ltd. in Bermuda and Societe des Ciments Antillais, a company with cement operations in Guadalupe and Martinique. As of December 31, 2022, Cemex España additionally indirectly held a 100% interest in Cemex Jamaica Limited, which operates one calcined limestone plant in Jamaica with a capacity of 120,000 tons per year and one hydrate line with a capacity of 4,800 tons per year.
As of December 31, 2022, we operated a network of five marine terminals in these countries, which facilitated exports from our operations in Mexico, the Dominican Republic and Puerto Rico. Three of our marine terminals are in the Bahamas. As of December 31, 2022, we also had a non-controlling interest in two other terminals, one in Bermuda and one in the Cayman Islands. We also had three distribution centers in Guyana, Haiti and Peru, and one ready-mix plant (temporarily inactive) in Guyana.
Capital Expenditures. In our operations in the Rest of SCA&C segment, we made capital expenditures of $3 million in 2020, $4 million in 2021 and $1 million in 2022. As of December 31, 2022, we expected to make capital expenditures of $4 million in our operations in other SCA&C countries during 2023.
Urbanization Solutions. In Jamaica, for the year ended December 31, 2022, in terms of relevant revenues, our Urbanization Solutions business consisted primarily of lime. This business serves specific customers.
Our Trading Operations
In 2022, we traded 11.8 million tons of cementitious and non-cementitious materials, in 92 countries, including 9.6 million tons of cement and clinker and 2.3 million tons of cementitious and other materials. In addition, we traded 4.1 million tons of coal and pet coke. Slightly more than 4.5 million tons of the traded cement and clinker consisted of exports from our operations in Mexico, Croatia, Spain, Germany, Trinidad and Tobago, Barbados, and Panama, among others. Slightly above 5.0 million tons remaining were purchased from third parties in countries such as Vietnam, Turkey, Saudi Arabia, Spain, Greece, and Algeria. In 2022, we traded 1.6 million tons of granulated blast furnace slag, a non-clinker cementitious material, and 0.6 million tons of other products. This information does not include discontinued operations. Our trading network enables us to maximize the capacity utilization of our facilities worldwide while reducing our exposure to the inherent cyclicality of the cement industry. We are generally able to distribute excess capacity to regions around the world
110
Table of Contents
where there is demand. In addition, we believe that our worldwide network of strategically located marine terminals allows us to coordinate maritime logistics on a global basis and minimize transportation expenses. Our trading operations also enable us to explore new markets without significant initial capital expenditure.
Freight rates, which account for a large share of the total import supply cost, have been subject to significant volatility in recent years. We estimate, however, that our trading operations have obtained significant savings by contracting maritime transportation in due time and by using our own and chartered fleets, which transported more than 66% of our coal, petcoke, cement and clinker traded volume during 2022.
In addition, we provide freight service to third parties, which allows us to generate additional revenues.
Our Cement and Grinding Plants
The following table provides a summary of our cement and grinding plants, including location, used capacity, including grinding mill production, and years of operation as of and for the year ended December 31, 2022:
| Location |
Used Capacity |
Years of Operation(1) | ||||||
| Mexico |
||||||||
| Atotonilco, Hidalgo |
1,273,451 | 64 | ||||||
| Barrientos, Estado de México |
684,659 | 78 | ||||||
| Ensenada, Baja California |
485,731 | 47 | ||||||
| Guadalajara, Jalisco |
724,113 | 49 | ||||||
| CPN, Sonora |
539,521 | 42 | ||||||
| Hidalgo, Nuevo León |
98,766 | 117 | ||||||
| Huichapan, Hidalgo |
3,197,390 | 38 | ||||||
| Mérida, Yucatán |
822,885 | 69 | ||||||
| Monterrey, Nuevo León |
1,380,789 | 103 | ||||||
| Tamuín, San Luis Potosí |
1,584,488 | 58 | ||||||
| Tepeaca, Puebla |
2,557,891 | 28 | ||||||
| Torreón, Coahuila |
1,064,470 | 56 | ||||||
| Valles, San Luis Potosí |
398,722 | 57 | ||||||
| Yaqui, Sonora |
2,064,966 | 33 | ||||||
| Zapotiltic, Jalisco |
1,645,254 | 55 | ||||||
| USA |
||||||||
| Balcones, TX |
1,684,912 | 42 | ||||||
| Brooksville, FL (North) |
0 | 47 | ||||||
| Brooksville, FL (South) |
1,135,269 | 35 | ||||||
| Clinchfield, GA |
579,409 | 48 | ||||||
| Demopolis, AL |
654,217 | 45 | ||||||
| Knoxville, TN |
593,332 | 43 | ||||||
| Miami, FL |
893,635 | 64 | ||||||
| Lyons, CO |
352,287 | 42 | ||||||
| Victorville, CA |
2,639,782 | 57 | ||||||
| Wampum, PA |
0 | 57 | ||||||
| United Kingdom |
||||||||
| Rugby |
1,204,643 | 23 | ||||||
| Ferriby |
0 | 56 | ||||||
| Tilbury |
538,261 | 14 | ||||||
| Germany |
||||||||
| Rudersdof |
2,054,731 | 56 | ||||||
| Eisenhüttenstadt |
255,153 | 70 | ||||||
111
Table of Contents
| Location |
Used Capacity |
Years of Operation(1) | ||||||
| Spain |
||||||||
| Alcanar |
787,064 | 54 | ||||||
| Castillejo |
493,128 | 111 | ||||||
| Lloseta |
0 | 55 | ||||||
| Morata |
370,140 | 90 | ||||||
| San Vicente |
832,228 | 47 | ||||||
| Gador |
0 | 46 | ||||||
| Poland |
||||||||
| Chelm |
1,480,797 | 62 | ||||||
| Rudniki |
803,916 | 57 | ||||||
| Gdynia |
193,308 | 22 | ||||||
| Czech Republic |
||||||||
| Prachovice |
867,886 | 68 | ||||||
| Detmarovice |
143,221 | 19 | ||||||
| Croatia |
||||||||
| Juraj |
1,073,112 | 110 | ||||||
| Kajo |
248,072 | 118 | ||||||
| Philippines |
||||||||
| APO |
3,148,538 | 24 | ||||||
| Solid Cement |
1,376,181 | 29 | ||||||
| Egypt |
||||||||
| Assiut |
3,876,686 | 36 | ||||||
| United Arab Emirates |
||||||||
| Falcon |
360,122 | 15 | ||||||
| Colombia |
||||||||
| Cucuta |
257,917 | 39 | ||||||
| Ibagué |
2,210,670 | 30 | ||||||
| Clemencia |
197,214 | 9 | ||||||
| Santa Rosa |
481,633 | 40 | ||||||
| Panama |
||||||||
| Calzada Larga |
589,084 | 45 | ||||||
| Trinidad and Tobago |
||||||||
| Claxton Bay |
707,088 | 69 | ||||||
| Jamaica |
||||||||
| Rockport |
960,519 | 71 | ||||||
| Barbados |
||||||||
| St. Lucy |
184,939 | 39 | ||||||
| Dominican Republic |
||||||||
| San Pedro de Macorís | 1,913,474 | 32 | ||||||
| Nicaragua |
||||||||
| San Rafael del Sur(2) | 373,308 | 80 | ||||||
| Managua | 205,093 | 7 | ||||||
| Puerto Rico |
||||||||
| Ponce | 296,908 | 32 | ||||||
| Guatemala |
||||||||
| Arizona | 564,333 | 17 | ||||||
| (1) | Approximate. |
| (2) | Leased. |
For the aggregate installed cement production capacity of our cement plants by region, see “Item 4—Information on the Company—Business Overview.”
112
Table of Contents
We have insurance coverage for our cement plants, which we believe is sufficient and in line with industry practices. However, in some instances, our insurance coverage may not be sufficient to cover all of our potential unforeseen losses and liabilities. In addition, our insurance coverage may not cover all the risks to which our cement plants may be exposed. See “Item 3—Key Information—Risk Factors—Risks Relating to Our Business and Operations—Our insurance coverage may not cover all the risks to which we may be exposed.”
Regulatory Matters and Legal Proceedings
A description of material regulatory matters and legal proceedings affecting us as of December 31, 2022 is provided below. Materiality is tested at a Cemex, S.A.B. de C.V. consolidated level. See “Item 5—Operating and Financial Review and Prospects—Recent Developments—Recent Developments Relating to Our Regulatory Matters and Legal Proceedings” for more information.
Antitrust Proceedings
Polish Antitrust Investigation
On January 2, 2007, Cemex Polska Sp. Z.O.O. (“Cemex Polska”) received a notification from the Polish Competition and Consumer Protection Office (the “Protection Office”) informing it of the formal initiation of an antitrust proceeding against all cement producers in Poland, including Cemex Polska and another of our indirect subsidiaries in Poland. The notification alleged that there was an agreement between all cement producers in Poland regarding prices and other sales conditions for cement, an agreed division of the market with respect to the sale and production of cement, and the exchange of confidential information, all of which limited competition in the Polish market with respect to the production and sale of cement. On December 9, 2009, the Protection Office delivered to Cemex Polska its decision against Polish cement producers related to an investigation which covered a period from 1998 to 2006. The decision-imposed fines on a number of Polish cement producers, including Cemex Polska. The fine imposed on Cemex Polska was Polish Zloty 115.56 million ($26.39 million as of December 31, 2022, based on an exchange rate of Polish Zloty 4.3795 to $1.00), which was 10% of Cemex Polska’s total revenue in 2008. Cemex Polska disagreed with the decision, denied that it committed the practices alleged by the Protection Office and, therefore, on December 23, 2009, Cemex Polska filed an appeal before the Polish Court of Competition and Consumer Protection in Warsaw (the “First Instance Court”). After a series of hearings, on December 13, 2013, the First Instance Court issued its judgment in regard to the appeals filed by Cemex Polska and other cement producers, which were previously combined into a joint appeal. The First Instance Court reduced the penalty imposed on Cemex Polska to Polish Zloty 93.89 million ($21.44 million as of December 31, 2022, based on an exchange rate of Polish Zloty 4.3795 to $1.00), which was equal to 8.125% of Cemex Polska’s revenue in 2008. On May 8, 2014, Cemex Polska filed an appeal against the First Instance Court judgment before the Appeals Court of Warsaw. On March 27, 2018, after different hearings, the Appeals Court of Warsaw issued its final judgment reducing the fine imposed upon Cemex Polska to Polish Zloty 69.4 million ($15.85 million as of December 31, 2022, based on an exchange rate of Polish Zloty 4.3795 to $1.00). This fine, which was equal to 6% of Cemex Polska’s revenue in 2008, was paid. On November 19, 2018, Cemex Polska filed before the Polish Supreme Court an extraordinary, narrow based cassation appeal against the Appeals Court of Warsaw’s judgment specifically seeking the reduction of the imposed fine. On July 29, 2020, the Polish Supreme Court rendered a judgment cancelling the Appeals Court of Warsaw’s decision with respect to the cement cartel process as it applied to Cemex Polska and four other cement producers. The cancelation was based on arguments raised in cassation regarding the calculation of penalties and the time at which the alleged agreement between the cement producers actually ended. Furthermore, the fine paid by Cemex Polska equal to Polish Zloty 69.4 million ($15.85 million as of December 31, 2022, based on an exchange rate of Polish Zloty 4.3795 to $1.00) was returned to Cemex Polska on January 7, 2021. On March 9, 2021, Cemex Polska requested the Protection Office to pay Cemex Polska interest over the amount of the fine returned to Cemex Polska, for the period going from April 9, 2018 (the date of payment of the fine) to January 7, 2021 (the date on which the fine was returned). The Protection Office has rejected to pay the interests in its response to Cemex Polska’s request.
113
Table of Contents
Following the judgment issued by the Polish Supreme Court, the proceeding was referred again to the Appeals Court of Warsaw. On July 29, 2020, the Appeals Court of Warsaw, due to procedural reasons, cancelled the judgment of the First Instance Court issued on December 13, 2013, against 5 producers, including Cemex Polska, and referred the case to re-examination by the District Court in Warsaw, which will now serve as the court of first instance. On January 10, 2022, an appeal with the Polish Supreme Court was filed by Cemex Polska against the May 21, 2021 judgment of the Appeals Court of Warsaw. The appeal of Cemex Polska concentrates on the wrongful appointment of judges of the Polish Supreme Court and selection of judges of the Appeals Court of Warsaw. The Protection Office has also filed an appeal with the Polish Supreme Court against the last judgment of the Appeals Court of Warsaw, demanding that it conduct further proceedings, instead of the District Court in Warsaw. The new trial case is expected to last three to five years, depending on the priority given to it by the courts adjudicating the case.
As of December 31, 2022, given that the case will be re-examined, at this stage we are not able to assess if Cemex Polska would receive an adverse resolution that could lead to any fines, penalties or remedies against our operations in Poland, but while we believe an adverse resolution is not probable, if adversely resolved, we do not expect that any fines, penalties or remedies would have a material adverse effect on our results of operations, liquidity or financial condition.
See “Item 5—Operating and Financial Review and Prospects—Recent Developments—Recent Developments Relating to Our Regulatory Matters and Legal Proceedings—Antitrust Proceedings—Polish Antitrust Investigation.”
Antitrust Cases in Georgia and South Carolina
On July 24, 2017, two ready-mix concrete producers filed a lawsuit in a U.S. Federal Court in the state of Georgia against certain subsidiaries of Cemex in the U.S. and other companies alleging customer allocation and price fixing in both the ready-mix concrete and cement markets in the coastal Georgia and southeastern coastal South Carolina areas. In addition, on January 22, 2020, new plaintiffs who were the prior owners of a ready-mix concrete producer, and the concrete producer, filed a lawsuit in the same court against the same subsidiaries of Cemex making substantially similar allegations as the suit filed on July 24, 2017. As Cemex does not participate in the ready-mix concrete market in these areas, the lawsuits do not allege any improper actions by Cemex with respect to ready-mix concrete. On October 2, 2017, Cemex filed a motion to dismiss the 2017 lawsuit. This motion to dismiss was denied on August 21, 2018, and, as a result, Cemex will continue to defend the allegations. In response to a request to stay the proceedings made in the first quarter of 2021 by the United States Department of Justice, the lawsuit filed on July 24, 2017, was administratively closed. On March 31, 2021, a motion to dismiss the lawsuit filed on January 22, 2020 was granted with leave to file an amended complaint by the concrete producer plaintiff within 21 days following entry of the order to dismiss. The claims of the prior owners were dismissed. In April 2021, the concrete producer in the January 2020 lawsuit voluntary dismissed its claims, which effectively terminated the lawsuit. On October 17, 2022, in respect to a motion by the plaintiffs, an order was entered in the July 2017 lawsuit, administratively reopening the July 2017 lawsuit to allow for limited discovery to proceed through February 17, 2023. As of December 31, 2022, at this stage of the July 2017 lawsuit, while we cannot assess with certainty the likelihood of an adverse result in this lawsuit, we believe a final adverse resolution to this lawsuit is not probable; and, if adversely resolved, we believe an adverse resolution should not have a material adverse impact on our results of operations, liquidity and financial condition.
Antitrust Investigation in Colombia
On September 5, 2013, Cemex Colombia was notified of Resolution No. 49141 dated August 21, 2013, issued by the Colombian Superintendency of Industry and Commerce (Superintendencia de Industria y Comercio) (“SIC”) pursuant to which the SIC opened an investigation and issued a statement of objections (pliego de cargos) against five cement companies and fourteen directors of those companies, including Cemex Colombia, for alleged anti-competitive practices. On December 11, 2017, the SIC’s Chief Superintendent decided to impose a sanction against Cemex Colombia, two other cement companies and six natural persons, for entering into an agreement to fix gray cement prices in Colombia. The fines imposed upon Cemex Colombia,
114
Table of Contents
which were paid on January 5, 2018, amounted to $73.77 billion Colombian Pesos ($15.23 million as of December 31, 2022, based on an exchange rate of 4,842.19 Colombian Pesos to $1.00). Cemex Colombia decided not to file a reconsideration request, and, instead, on June 7, 2018 it filed an annulment and reestablishment of right claim (acción de nulidad y restablecimiento de derecho) before the Administrative Court (Tribunal Contencioso Administrativo) requesting that the charges brought forth by the SIC be annulled and that the restitution is made to Cemex Colombia of the fine it had paid, with any applicable adjustments as provided by Colombian law. This claim could take up to six years to be resolved. As of December 31, 2022, we are not able to assess the likelihood of an adverse result of this matter, but if such matter is resolved adversely to us, and considering that the fines were paid in 2018, such adverse resolution should not have a material adverse impact on our results of operations, liquidity, and financial condition.
Colombian Class Action Lawsuit
On August 2020, a class action lawsuit (Acción Popular) (the “Colombian Class Action”) was filed with a Circuit Civil Court in Colombia against Cemex Colombia and other gray portland cement market participants (the “Colombian Class Action Defendants”). The lawsuit sought compensation for damages arising from alleged cartel actions for which the SIC fined the Colombian Class Action Defendants in December 2017. The lawsuit claimed that the Colombian Class Action Defendants caused damages to all consumers of gray portland cement in Colombia during the period of 2010 to 2012. The plaintiff’s lawsuit claimed that the Colombian Class Action Defendants should be ordered to pay damages due to the higher price set on gray portland cement. The plaintiff also claimed that this amount should be indexed since 2013. The plaintiff’s arbitrary calculation of the total alleged damages caused by the Colombian Class Action Defendants was $1.32 trillion Colombian Pesos ($272.6 million as of December 31, 2022, based on an exchange rate of 4,842.19 Colombian Pesos to $1.00). The Circuit Civil Court initially dismissed the Colombian Class Action, and the plaintiff filed an appeal, which, on April 9, 2021, was resolved by the Superior Court of Bogotá, reversing the decision by the Circuit Civil Court and ordering to review the admission of the claim again. On May 14, 2021, the Circuit Civil Court admitted the claim. Cemex Colombia subsequently filed an appeal against the admission of the claim, and on May 11, 2022, the Circuit Civil Court in Colombia issued a ruling in favor of Cemex Colombia, dismissing the proceeding. The plaintiff appealed this decision on May 16, 2022, and, on May 23, 2022, Cemex Colombia requested the Circuit Civil Court to ratify its decision to dismiss. Consequently, on July 11, 2022, the Circuit Civil Court ratified its decision to dismiss the case and subsequently sent the docket of the proceeding to the Superior Court of Bogota. The Superior Court of Bogota confirmed the dismissal on August 24, 2022. The plaintiff has six months since the confirmation of the dismissal to file a recourse (an Acción de Tutela) against the confirmation of the dismissal. As of December 31, 2022, we believe a final adverse resolution in this matter is not probable, but if such matter is resolved adversely to us, such adverse resolution should not have a material adverse impact on our results of operations, liquidity and financial condition.
Environmental Matters
In the ordinary course of business, we are subject to a broad range of environmental laws and regulations in each of the jurisdictions in which we operate. These laws and regulations impose increasingly stringent environmental protection standards regarding, among other things, air emissions, wastewater discharges, the use and handling of hazardous waste or materials, waste disposal practices and the remediation of environmental damage or contamination. These laws and regulations expose us to the risk of substantial environmental costs and liabilities, including liabilities associated with divested assets and past activities and, in some cases, the acts and omissions of the previous owners or operators of a property or facility that we own or operate. Furthermore, in some jurisdictions, certain environmental laws and regulations impose liability without regard to fault or the legality of the original activity at the time of the actions giving rise to liability. To prevent, control and remediate environmental problems and maintain compliance with regulatory requirements, in line with our global initiatives on environmental management, we maintain an environmental policy designed to monitor and control environmental matters. Our environmental policies require that each of our subsidiaries respect and comply with local laws and meet our own internal standards to minimize the use of non-renewable resources and the generation of hazardous and other wastes. We use processes that are designed to reduce the impact of our
115
Table of Contents
operations on the environment throughout all the production stages in all our operations worldwide. In addition, during 2012, we started the implementation of a global EMS at our operating sites that provides a framework to facilitate the consistent and systematic implementation of practical, risk-based environmental management at all sites. As of December 31, 2022, substantially all of our operating sites in Mexico, EMEAA, and SCA&C have completed the implementation of the EMS. The EMS is designed to be used to support sites and businesses across Cemex globally to document, maintain and continuously improve our environmental performance. We believe that, as of December 31, 2022, substantially all of our cement plants already have some kind of EMS (most of which have earned ISO 14000 certifications), with most of the remaining implementation efforts directed mainly towards our aggregates and ready-mix plants.
We regularly incur capital expenditures that have an environmental component or that are impacted by environmental regulations. However, we do not keep separate accounts for such mixed capital and environmental expenditures. Environmental expenditures that extend the life, increase the capacity, improve the safety or efficiency of assets, or are incurred to mitigate or prevent future environmental contamination may be capitalized. Other environmental costs are expensed when incurred. For the years ended December 31, 2020, 2021, and 2022, our sustainability-related capital expenditures (including our environmental expenditures and investments in alternative fuels and cementitious materials) were $78 million, $103 million, and $170.8 million, respectively.
The following is a discussion of environmental regulations and related matters in our major markets.
Mexico
We were one of the first industrial groups in Mexico to sign an agreement with the Mexican Ministry of Environment and Natural Resources (Secretaría del Medio Ambiente y Recursos Naturales) (“SEMARNAT”) to carry out voluntary environmental audits in our 15 Mexican cement plants under a government-run program. In 2001, the Mexican Environmental Protection Agency (Procuraduría Federal de Protección al Ambiente), which is part of SEMARNAT, completed the audit of our cement plants and awarded each of them a Clean Industry Certificate (Certificado de Industria Limpia) (“CICs”) certifying that our cement plants are in full compliance with applicable environmental laws. The CICs are subject to renewal every two years. As of December 31, 2022, our operating cement plants in Mexico had CICs or were in the process of renewing them.
For almost three decades, the technology for co-processing used alternative fuels into an energy source has been employed in our cement plants in Mexico. By the end of 2019, all our operating cement plants in Mexico were using alternative fuels. Overall, 25.8% of the total fuel used in our operating cement plants in Mexico during 2021 was comprised of alternative fuels. In January 2021, a modification to the General Waste Law was published in the Official Gazette to include co-processing as part of the industrial process, providing that authorizations granted by the SEMARNAT under federal licenses will remove the need for authorizations at the State level.
For the years ended December 31, 2020, 2021, and 2022 our operations in Mexico invested $7.58 million, $27.76 million, and $43.79 million, respectively, in the acquisition of environmental protection equipment and the implementation of the integrated management system (ISO 9001, 14001 and 4500), for a total of $228.03 million since 1999 as of December 31, 2022. The audit to obtain the renewal of the ISO 14001:2015 certification took place during 2020 and our then operating cement plants in Mexico obtained the renewal of the ISO 14001:2015 certification for environmental management systems, which is valid until February 2024. As of December 31, 2022, our cement plant in Hermosillo, Mexico has obtained its certification after having restarted production in 2021.
On June 6, 2012 the General Law on Climate Change (Ley General de Cambio Climático) (the “Climate Change Law”) was published in the Mexican Official Gazette. The Climate Change Law establishes a legal framework to regulate policies for climate change mitigation and adaptation. Important provisions of the Climate Change Law require the development of secondary legislation and depend on the publication of subsequent
116
Table of Contents
implementing regulations. For instance, the Climate Change Law provides, among other things, for (i) the elaboration of a registry of the emissions that are generated by fixed sources, (ii) companies to report their emissions, if required, and (iii) the application of fines to those companies that fail to report or that report false information. In this regard, on October 29, 2014, the regulations to the General Law on Climate Change Regarding the National Registry of Emissions (Reglamento de la Ley General de Cambio Climático en Materia del Registro Nacional de Emisiones) (the “Regulations”) became effective. As of December 31, 2022, Cemex has been granted the positive dictums on GHG emission by a certified and approved third party for all its required plants and has reported them to the Mexican environmental agency. The purpose of the Regulations is to govern the Climate Change Law regarding the National Registry of Emissions, identifying the sectors and subsectors, which include among others, the cement industry, that must file the corresponding reports before the National Registry of Emissions. We had previously reported our direct and indirect CO2 emissions to SEMARNAT under a voluntary scheme. The Climate Change Law also allows for the establishment of specific greenhouse gas reduction targets in accordance with the respective contribution of each economic sector to the national greenhouse gas emissions. A Special Tax on Production and Services (Impuesto Especial Sobre Producción y Servicios) on the sale and import of fossil fuels was included in the tax reform that became effective on January 1, 2014. As of December 31, 2022, petcoke, a primary fuel widely used in our kilns in Mexico is taxed at a rate of Ps21.8784 per ton ($1.12 per ton as of December 31, 2022, based on an exchange rate of Ps19.482 to $1.00). Effective as of January 1, 2023, petcoke will be taxed at a rate of Ps23.5827 per ton ($1.21 per ton as of December 31, 2022, based on an exchange rate of Ps19.482 to $1.00).
On August 12, 2014, a package of energy reform legislation became law in Mexico. The then newly enacted energy reform legislation, which included nine new laws, as well as amendments to existing laws, implemented the December 2013 constitutional energy reform and established a new legal framework for Mexico’s energy industry. One of the new laws that was enacted is the Electric Industry Law (Ley de la Industria Eléctrica) (the “Electric Industry Law”), which establishes a legal framework for electricity-related activities in Mexico and structurally changes the national electric industry, creating a wholesale energy market in which companies can acquire power and associated products, directly from privately owned suppliers, as opposed to only acquiring energy from the Federal Electricity Commission (Comisión Federal de Electricidad) (“CFE”). On October 31, 2014, certain rules and regulations related to the energy reform legislation, including the regulations of the Electric Industry Law, were published. As part of the Electric Industry Law, a system for tradable clean energy certificates was created and certain clean energy procurement obligations were imposed on consumers. The clean energy procurement obligations for 2018 to 2022 were announced by the Mexican Energy Regulatory Commission (Comisión Reguladora de Energía) (“CRE”) at 5%, 5.8%, 7.4%, 10.9% and 13.9%, respectively, and a requirement of 13.9% for 2023 was published on November 22, 2022. Further increases to this requirement are expected for future years. Cemex’s operations in Mexico have ongoing commitments to procure power from renewable projects operating under the “self-supply” framework of the former Electric Energy Public Service Law, and the energy supplied under these contracts is exempted from the clean energy obligation. Nonetheless, since 2018, we are required to acquire clean energy certificates to comply with the clean energy obligations for the fraction of energy supply that does not come from clean generators. Over time, according to the penalty levels set by the CRE, non-compliance with the clean energy procurement obligations could have a material adverse impact on our business or operations in Mexico, but as of December 31, 2022, we are not able to assess if any such impact would in turn have a material adverse impact on our liquidity and financial condition.
On September 8, 2015, the Electricity Market Rules (Bases del Mercado Eléctrico) (the “Rules”) were published in the Federal Official Gazette and became effective on September 9, 2015. The Rules, which are an important step forward in the implementation of the reforms enacted regarding Mexico’s energy industry, contain the design and operation principles of the different components of the wholesale electricity market (the “Electricity Market”) and, together with the Electric Industry Law and several administrative provisions and guidelines issued by CRE, regulate the possibility for consumers to enter into supply agreements with CFE or with private suppliers participating in the Electricity Market. As of December 31, 2022, we are authorized participants in the Electricity Market. Additionally, Cemex participated as a buyer in the third long-term power auction organized in 2017 by CENACE, the independent operator of Mexico’s national electric system (the
117
Table of Contents
“National Electic System”), through the clearinghouse in charge of the agreements awarded through the auctions, and was awarded a 20-year contract for 16,129 clean energy certificates per year for compliance starting in 2020 and 14.9 GWh/a of electric power.
During 2016, a new electrical standards code for the national grid’s operation was issued in Mexico (Código de Red) (the “Code”). The Code establishes new standards for electrical operation and safety that begun to be enforced in 2019 against consumers connected to the national grid, including Cemex and generators. On December 31, 2021, the CRE published a resolution in the Official Mexican Gazette (Diario Oficial de la Federación) through which it issued a revised version of the Code (the “2.0 Code”). The 2.0 Code came into force as of January 1, 2022 and, among other things, provides (i) the technical requirements applicable to load centers that are connected, or intend to connect, to the National Electric System at medium or high tension, in order to guarantee the efficiency, quality, reliability, continuity, safety and sustainability of the system, (ii) the obligation for renewable power plants to participate in primary frequency control, (iii) a procedure to execute
root cause assessments of disturbances in the National Electric System and (iv) a new procedure to reduce the generation of electric power upon the occurrence of extraordinary conditions in the National Electric System. As of December 31, 2022, we do not foresee that compliance with the 2.0 Code would require material investments across our operating assets in Mexico.
On October 2, 2019, SEMARNAT published the basis for a trial emissions trading program (Programa de prueba del sistema de comercio de emisiones). The trial program sets forth an initial 24-month pilot phase for the adoption of the program that started on January 1, 2020 and concluded on December 31, 2021, which is followed by a 12-month period to transition to the operative stage, which ended on December 31, 2022. The trial program will not have any economic consequences for the participants; but after December 2022, SEMARNAT should establish emission caps per industrial sector in line with Mexico’s greenhouse gas emissions reduction targets.
We will have to meet those caps through mitigation measures or acquire emission reduction certificates in the proposed market. As of December 31, 2022, we cannot anticipate the impact that this new cap-and-trade scheme and the mandatory emissions caps will have on our operations in Mexico, mainly due to the fact that the existing rules apply only to its current pilot phase, yet we are participating with various lobbying groups within different industrial sectors and chambers to address our concerns towards a fair and robust operative phase.
On April 29, 2020, CENACE issued a resolution providing for the implementation of several restrictive measures on output in privately-owned wind and photovoltaic plants, including, among other measures, the suspension of all tests required by such plants that were in construction at that moment, to reach commercial operation, among other measures to guarantee the efficiency, quality, reliability, continuity and security of the Mexican electrical system during the period of reduced power demand caused by the COVID-19 pandemic (the “NES Resolution”). Additionally, on May 15, 2020, the Mexican Ministry of Energy (Secretaría de Energía, the “SENER”) published in the Official Mexican Gazette a substantial revision to the Policy for the Reliability, Safety, Continuity and Quality of the Mexican Electrical System (the “SENER Policy,” and together with the NES Resolution, the “Energy Publications”). The Energy Publications entailed significant deviations from the current Rules, among other laws and regulations in Mexico.
The SENER Policy imposes additional restrictions and conditions on the issuance and modification of generation permits for solar and wind facilities. Additionally, among other changes, the SENER Policy expressly prioritizes reliability over economic efficiency in the dispatch of the electric grid, potentially affecting the production of solar and wind generation to the benefit of existing plants owned by CFE; transfers the value of the capacity recognized to the solar and wind plants to the load-serving entities; and mandates the creation of new ancillary services and infrastructure improvements, the costs of which are to be borne by wind and solar generators. Several private power generators and non-governmental organizations filed constitutional challenges against the Energy Publications claiming that such publications are unconstitutional and restrict constitutionally protected rights and interests, such as the right to a healthy environment. Moreover, on June 22, 2020, Mexico’s antitrust regulator (Comisión Federal de Competencia Económica) (“COFECE”) filed a legal controversy claim
118
Table of Contents
(controversia constitucional) with Mexico’s Supreme Court arguing that the SENER Policy violates several provisions of the Mexican Constitution and that it adversely affects the competitive nature of Mexico’s energy market. On February 3, 2021, Mexico’s Supreme Court issued a final ruling on the constitutional controversy claim filed by COFECE against the SENER Policy nullifying most of its provisions. Thereafter on March 4, 2021, SENER published in the Official Mexican Gazette a resolution abolishing the SENER Policy in its entirety. Additionally, a federal judge ruled the nonexistence of the NES Resolution, which was thereafter published by CENACE through its official information system on June 16, 2021, leaving the NES Resolution without effects.
Furthermore, on May 28, 2020, during an extraordinary meeting, the CRE approved two resolutions which call for increases to the transmission charges payable to the CFE by all electric power generators, with renewable and conventional power plants, operating under grandfathered interconnection agreements (“Grandfathered Generators”) which are subject to the laws and regulations that were applicable before the Mexican energy reform of 2013 to 2014 (the “CRE Resolutions”). Under the CRE Resolutions, these new wheeling charges for the transmission service constitute an exponential and immediate increase for Grandfathered Generators and were applied by CFE as of July 2020. While the entities legally obliged to pay for those transmission costs are Grandfathered Generators, the end-users must hold a minority participation in the Grandfathered Generators from whom they receive the power supply, thus depending on the structure agreed in the corresponding power supply agreements (which could consist of pass-through provisions for such transmission costs), end-users under the grandfathered “self-supply” scheme, including Cemex, may run the risk of transmission costs and be obligated to pay the relevant grandfathered projects for said incremental costs. In the case of the three wind farms in Mexico owned by Grandfathered Generators, in which Cemex has a minority participation and with which Cemex has entered into long-term arrangements to receive the power under the “self-supply” framework, the charges for transmission payable to CFE, in which Cemex has a minority participation, associated with the wind farms increased by four to six times. Furthermore, we expect the transmission charges to increase by about 80% in the case of the pet coke-fired self-supply thermal power plant in Tamuin, Mexico, owned by another Grandfathered Generator in which Cemex has a minority participation and with which Cemex has also entered into a long-term arrangement to receive power. As of December 31, 2022, the Grandfathered Generators that supply electric energy to our operations in Mexico have all obtained injunctions against the applicable CRE Resolutions and two of them have obtained favorable resolutions in their constitutional challenges, nullifying all the provisions and effects of the CRE Resolutions. These favorable resolutions are final and definitive as no further recourse is available. We are closely monitoring the progress of the remainder of the constitutional challenges filed by the other Grandfathered Generators that supply electric energy to our operations in Mexico, as certain arrangements with the Grandfathered Generators regarding wheeling charges are structured under a pass-through mechanism, which are typical of these types of “self-supply” projects, expose Cemex to the increases called for by the CRE Resolutions and would entail an increase in the electricity prices for our plants in Mexico. On August 28, 2020, we filed a constitutional challenge against the CRE resolution applicable to Grandfathered Generators operating conventional power plants and we were granted an injunction against such CRE Resolution, though as of December 31, 2022, no final ruling on the appeal filed by the CRE against such injunction had been issued. As of
December 31, 2022, we cannot assess with certainty the outcome of the legal challenges presented against the CRE Resolutions, or the impact that an adverse resolution on those could have on our business, operations and contractual obligations in Mexico.
On March 9, 2021, a decree amending several key provisions of the Electric Industry Law was published in the Official Mexican Gazette (the “Energy Industry Law Reform”). The Energy Industry Law Reform, among other consequences, (i) strengthens CFE’s powers in Mexico’s energy sector and grants its hydropower and conventional power plants preferential grid dispatch over privately-owned plants and priority on the use of transmission and distribution infrastructure over power plants owned by private parties relegating the current position private suppliers hold in the dispatch order; (ii) changes the economic dispatch in the Electricity Market from variable production costs to total unit costs; (iii) restricts the access to the national grid and general distribution network infrastructure by establishing new discretionary rules and restrictions on open access for interconnection requests to the national grid; (iv) subjects applications for power generation permits to new requirements for meeting certain planning criteria discretionarily established by SENER; (v) changes the
119
Table of Contents
methodology to determine the granting of clean energy certificates, allowing plants built before the publication of the Electric Industry Law to issue certificates; and (vi) allows the CRE to (x) unilaterally and retroactively revoke any power generation permits granted to Grandfathered Generators, if found to have been obtained fraudulently, and (y) allows CFE to renegotiate power purchase agreements entered with independent power producers, both of which are subject to the laws and regulations that were applicable before the Mexican energy reform of 2014. Shortly thereafter, federal judges granted injunctions under constitutional challenges filed by several private generators (including the Grandfathered Generators that supply electric energy to our operations in Mexico) and other participants in the Electricity Market affected by the amendments, temporarily suspending the effects of the Energy Industry Law Reform not only with respect to the parties that filed the constitutional challenges, but also on a general basis for all participants in the Electricity Market, though SENER filed appeals to challenge such rulings. By the end of the third quarter of 2021, several injunctions granted on a general basis had been revised by Federal Circuit Courts of Appeals to limit their protective effects exclusively to private generators that filed constitutional challenges against the Energy Industry Law Reform, including the Grandfathered Generators that supply electric energy to our operations in Mexico. On April 8, 2021, a group of Senators filed an unconstitutionality claim (acción de inconstitucionalidad) (the “Unconstitutionality Claim”) against the Energy Industry Law Reform. Moreover, on April 22, 2021, COFECE filed a legal controversy claim with Mexico’s Supreme Court arguing that the Energy Industry Law Reform adversely affects the competitive nature of Mexico’s energy market. Although on April 7, 2022, the Mexican Supreme Court dismissed the Unconstitutionality Claim as it did not reach the required votes to declare the unconstitutionality of any of the contested provisions of the Energy Industry Law Reform, it laid out several arguments in its decision that could form the basis for future resolutions to ongoing constitutional challenges in favor of declaring the unconstitutionality of the different provisions of such reforms. Additionally, COFECE’s controversy was dismissed by the Mexican Supreme Court on April 18, 2022. The Mexican Supreme Court’s dismissal of the Unconstitutionality Claim and COFECE’s controversy does not revoke the injunctions granted against the enforcement of the Energy Industry Law Reform (including those granted to Grandfathered Generators that supply electric energy to our operations in Mexico), and as of December 31, 2022, some of those injunctions are still in force, thus, the Energy Industry Law Reform will remain suspended until the last of those injunctions has been revoked or all claims have been resolved in favor of its constitutionality. As of December 31, 2022, we cannot anticipate the impact that the Energy Industry Law Reform could have on our business, operations, and contractual obligations in Mexico if the contested provisions contained in the Energy Industry Law Reform are deemed constitutional in final decisions to be issued on the injunctions granted to Grandfathered Generators that supply electric energy to our operations in Mexico, nor we can anticipate the impact that such reform could have on our business, operations and contractual obligations in Mexico. However, if the Energy Industry Law Reform were to limit the dispatch of renewable energy generators or impose new costs or charges to the renewable electric energy industry, and/or cause new regulatory burdens for participants in Mexico’s Wholesale Electricity Market, we could have an adverse effect on our business, operations and contractual obligations in Mexico, and our plans to reduce the use of fossil fuels and our CO2 reduction commitments could be affected.
On May 21, 2021, SENER published in the Federal Official Gazette the “Decree by means of which several provisions of the Hydrocarbons Law are added and amended” (Decreto por el que se reforman y adicionan diversas disposiciones de la Ley de Hidrocarburos or the “Hydrocarbons Law Reform”), imposing additional burdens to private parties who carry out activities related to petroleum, petroleum derivates and natural gas, to the benefit of CFE and PEMEX, and could potentially affect end-users, such as Cemex. The Hydrocarbons Law Reform entered into force on May 5, 2021, among other things, (i) increases requirements for obtaining new permits, (ii) imposes new conditions on existing permits and (iii) imposes new grounds for revocation of permits. We have not yet determined if the Hydrocarbons Law Reform could have a material adverse impact on our results of operations, liquidity or financial condition. Although several federal judges had originally issued injunctions against the Hydrocarbons Law Reform, which prevented its application on a general basis, as of December 31, 2022, some of the decisions of the federal judges granting such injunctions have been reversed by Federal Circuit Courts of Appeals, which have lifted some of the injunctions and dismissed some constitutional challenges filed by private parties against the Hydrocarbons Law Reform. However, the legal effects of the amendments introduced by the Hydrocarbons Law Reform will continue to be suspended until Federal Circuit Courts of Appeals revoke the last of the injunctions granted on a general basis.
120
Table of Contents
On September 30, 2021, a draft bill amending several articles of the Mexican Constitution in matters concerning the legal framework for Mexico’s energy industry (the “Energy Reform Bill”) was submitted by the Mexican federal executive branch to the House of Representatives of the Mexican congress. The Energy Reform Bill aimed to completely reverse the December 2013 constitutional energy reform in matters related to the electricity sector, although it also contemplates important changes for the oil & gas and the mining sectors, such as the disappearance of the National Hydrocarbons Commission (Comisión Nacional de Hidrocarburos), the elimination of all references to state productive enterprises conducting oil & gas exploration and production activities, and the prohibition to grant concessions for the exploitation of lithium. As for the regulatory
framework concerning the electricity sector, some of the main amendments proposed by the Energy Reform Bill were: (i) the generation, conduction, transformation, distribution, and supply of electric power, including the exploitation of natural resources and assets, would return to be a strategic area of the state; (ii) CENACE would be re-integrated back into CFE and the latter would operate as a single and autonomous governmental entity taking over the current functions of CENACE, and the responsibility of operating the electric grid, and would also be exclusively in charge of preserving energy security and sufficiency, as well as the supply of electric power to all the population; (iii) the CRE would disappear and SENER would assume the former’s functions; (iv) power generation permits, together with all power purchase agreements entered into with the private sector and all pending permit applications would be cancelled as of the date on which the amendments introduced by Energy Reform Bill become effective; (v) any new permits would have to be requested before SENER; and (vi) all clean energy certificates would be cancelled. As a result of the Energy Reform Bill, the existing legal framework on the sector, including the Electric Industry Law and the Hydrocarbons Law, would have to be amended or replaced. On April 17, 2022, the House of Representatives of the Mexican Congress voted on the Energy Reform Bill, which did not reach the two-thirds qualified majority necessary for its approval and was therefore dismissed.
See “Item 5—Operating and Financial Review and Prospects—Recent Developments—Recent Developments Relating to Our Regulatory Matters and Legal Proceedings—Environmental Matters—Mexico.”
United States
Our operating subsidiaries in the United States are subject to a wide range of U.S. federal, state and local laws, regulations and ordinances dealing with the protection of human health and the environment that are strictly enforced and can lead to significant monetary penalties for noncompliance. These laws and regulations expose us to the risk of substantial environmental costs and liabilities, including liabilities associated with divested assets and past activities and, in some cases, the acts and omissions of the previous owners or operators of a property or facility. These laws regulate, among other things, water discharges, noise, and air emissions, including dust, as well as the handling, use and disposal of hazardous and non-hazardous waste materials. Certain laws also create a shared liability scheme under which parties are held responsible for the cost of cleaning up releases to the environment of designated hazardous substances. We therefore may have to conduct environmental remediation associated with the disposal or release of hazardous substances at our various operating facilities, or at sites in the United States to which we sent hazardous waste for disposal. As of December 31, 2022, we believe that our current procedures and practices for handling and managing materials are generally consistent with industry standards and legal and regulatory requirements, and also believe that we take appropriate precautions designed to protect employees and others from harmful exposure to hazardous materials.
As of December 31, 2022, Cemex, Inc. and its subsidiaries had accrued liabilities specifically relating to environmental matters in the aggregate amount of $52.6 million. The environmental matters relate to (i) the disposal of various materials, in accordance with past industry practice, that might be categorized as hazardous substances or waste and (ii) the cleanup of hazardous substances or waste at sites used or operated by Cemex, Inc. and its subsidiaries including discontinued operations, either individually or jointly with other parties. Most of these matters are in the preliminary stages, and a final resolution might take several years. For purposes of recording the provision, Cemex, Inc. and its subsidiaries consider that it is probable that a liability has been incurred and the amount of the liability is reasonably estimable, whether or not claims have been asserted, and
121
Table of Contents
without giving effect to any possible future recoveries. Based on information developed as of December 31, 2022, Cemex, Inc. does not believe it will be required to spend significant sums on these matters, in excess of the amounts previously recorded. The ultimate cost that might be incurred to resolve these environmental issues cannot be assured until all environmental studies, investigations, remediation work, and negotiations with, or litigation against, potential sources of recovery have been completed.
In 2007, the EPA launched a CAA enforcement initiative against the U.S. cement industry. The primary goal of the initiative is to assess the industry’s historic compliance with the CAA’s New Source Review program and to reduce emissions from the industry through the installation of add-on controls. We have actively engaged with the EPA on its investigations, which involved multiple of our facilities in the United States, and have entered into four settlements involving a total of $6.1 million in civil penalties and a commitment to incur certain capital expenditures for pollution control equipment at our Victorville, California; Fairborn, Ohio (divested on February 10, 2017); Lyons, Colorado; Knoxville, Tennessee; Louisville, Kentucky (divested on March 6, 2020); Demopolis, Alabama; Odessa, Texas (divested on November 18, 2016); and New Braunfels, Texas plants. Based on our past experience with such matters and currently available information, as of December 31, 2022, we believe any further proceedings should not have a material adverse impact on our results of operations, liquidity and financial condition.
In 2002, Cemex Construction Materials Florida, LLC (formerly Rinker Materials of Florida, Inc.) (“Cemex Florida”), a subsidiary of Cemex, Inc., was granted a federal quarry permit and was the beneficiary of another federal quarry permit for the Lake Belt area in South Florida. The permit held by Cemex Florida covered Cemex Florida’s SCL and FEC quarries. Cemex Florida’s Kendall Krome quarry is operated under the permit of which it was a beneficiary. The FEC quarry is the largest of Cemex Florida’s quarries measured by volume of aggregates mined and sold. Cemex Florida’s Miami cement mill is located at the SCL quarry and is supplied by that quarry, while the FEC and Kendall Krome quarries have supplied aggregates to Cemex and third-party users. In response to litigation brought by environmental groups concerning the manner in which the federal quarry permits were granted, in January 2009, the U.S. District Court for the Southern District of Florida ordered the withdrawal of the federal quarry permits for Cemex Florida’s SCL, FEC and Kendall Krome quarries. The judge ruled that there were deficiencies in the procedures and analysis undertaken by the Army Corps of Engineers (“Corps”) in connection with the issuance of the permits. Upon appeal, on January 21, 2010, the Eleventh Circuit Court of Appeals affirmed the district court’s ruling withdrawing the federal quarry permits for the three Cemex Florida quarries as well as other third-party federal quarry permits subject to the litigation. On January 29, 2010, the Corps completed a multi-year review commenced as a result of this litigation and issued a Record of Decision (“ROD”) supporting the issuance of new federal quarry permits for the FEC and SCL quarries. Excavation of new aggregates was stopped at the FEC and SCL quarries from January 20, 2009 until new permits were issued. The FEC permit was issued on February 3, 2010, and the SCL permit on February 18, 2010. Furthermore, permits to extend the areas available to mine at the FEC and SCL quarries were received on May 7, 2020 and July 22, 2020, respectively. The ROD also indicated that a number of potential environmental impacts must be addressed at the wetlands located at the Kendall Krome site before a new federal quarry permit may be issued for mining at that quarry, meaning that no new aggregates would be quarried from wetland areas at Kendall Krome pending the resolution of the potential environmental issues, with the FEC and SCL quarries continuing to operate. On November 15, 2020, the Corps determined that the wetlands at the Kendall Krome quarry are not subject to the jurisdiction of the Clean Water Act. Therefore, Clean Water Act permits will not be required to resume mining at the Kendall Krome site. If Cemex Florida is unable to maintain the new Lake Belt permits, to the extent available, Cemex Florida would need to source aggregates from other locations in Florida or import aggregates. This would likely affect operating income from our operations in Florida. As of December 31, 2022, any adverse impacts on the Florida economy arising from the cessation or significant restriction of quarrying operations in the Lake Belt area could also have a material adverse impact on our results of operations, liquidity and financial condition.
In June 2010, the EPA proposed regulating Coal Combustion Residuals (“CCRs”) generated by electric utilities and independent power producers as a hazardous or special waste under the United States Resource Conservation and Recovery Act. On December 19, 2014, the EPA issued a final rule on the regulation of CCRs.
122
Table of Contents
In the United States, we no longer use CCRs as a raw material in our cement manufacturing process, nor as a supplemental cementitious material in our ready-mix concrete products.
Our operations in the United States are subject to a number of federal and state laws and regulations addressing climate change. On the federal side, EPA has promulgated a series of regulations pertaining to emissions of GHGs from industrial sources. EPA issued the Mandatory Reporting of Greenhouse Gases Rule, effective December 29, 2009, which requires certain covered sectors, including cement manufacturing, with GHG emissions above an established threshold to inventory and report their GHG emissions annually on a facility-by-facility basis. In 2010, EPA issued a final rule that establishes GHG thresholds for the New Source Review Prevention of Significant Deterioration (“PSD”) and Title V Operating Permit programs (“Title V”). The rule “tailors” the requirements of these CAA permitting programs to limit which facilities will be required to obtain PSD and Title V permits for GHG emissions. Cement production facilities are included within the categories of facilities required to obtain permits, provided that their GHG emissions exceed the thresholds in the tailoring rule. The PSD program requires new major sources of regulated pollutants and major modifications at existing major sources to secure pre-construction permits that establish, among other things, limits on pollutants based on Best Available Control Technology (“BACT”).
According to EPA’s rules, stationary sources, such as cement manufacturing, which are already regulated under the PSD program for non-GHG pollutants, need to apply for a PSD permit for any GHG emissions increases above 75,000 tons/year of CO2 equivalent (“CO2E”). Therefore, new cement plants and existing plants undergoing modification which are major sources for non-GHG pollutants regulated under the CAA need to acquire a PSD permit for construction or modification activities that increase CO2E by 75,000 or more tons/year, and would have to determine and install BACT controls for those emissions. Furthermore, any new source that emits 100,000 tons/year of CO2E or any existing source that emits 100,000 tons/year of CO2E and undergoes modifications that would increase CO2E emissions by at least 75,000 tons/year, must comply with PSD obligations. Complying with these PSD permitting requirements can involve significant costs and delay. As of December 31, 2022, the costs of future GHG-related regulation of our facilities through these efforts or others could have a material economic impact on our U.S. operations and the U.S. cement manufacturing industry, which in turn could have a material adverse impact in our results of operations, liquidity and financial condition.
With respect to state efforts to address climate change, in 2006, the State of California adopted the Global Warming Solutions Act (“AB32”) setting into law a goal to reduce the State’s CO2 emissions to 1990 levels by 2020. As part of the measures derived from AB32, the California Air Resources Board (“CARB”) developed a cap-and-trade program, enforced from 2013, that covers most industrial sources of greenhouse gas emissions in the State, including cement production facilities. The program involves allocating a number of allowances free of charge to covered installations, which must subsequently surrender back to the regulator a number of allowances or qualified offset credits matching their verified emissions during the compliance period. Based on the free allowances received, our Victorville cement plant met all of its compliance obligations for the second compliance period (2015 to 2017) without a material impact on its operating costs; and also met all of its compliance obligations for the third compliance period (2018 to 2020) without a material impact on its operating costs. Furthermore, as of December 31, 2022, for our operations in California, we are actively pursuing initiatives to substitute fossil fuels for lower carbon fuels, improve our energy efficiency and utilize renewable power in an effort to economically reduce our direct and indirect GHG emission intensities. However, even with these ongoing efforts and the expected distribution of free allowances, as of December 31, 2022, the measures corresponding to future compliance periods of AB32, which may eventually require us to purchase emission allowances at increased prices due to their reduced availability, and the resulting overall costs of complying with a cap-and-trade program, could have an impact on our operations in California, which in turn could have an adverse impact on the results of operations, liquidity and financial condition of our operations in the U.S., and consequently on us.
In 2007, CARB approved a regulation that requires California equipment owners/operators to reduce diesel particulate and nitrogen oxide emissions from in-use off-road diesel equipment and to meet progressively more restrictive emission targets. In 2008, CARB approved a similar regulation for in-use on-road diesel equipment. The emission targets require us to retrofit our California-based equipment with diesel emission control devices or replace equipment with new engine technology in accordance with certain deadlines. As of December 31, 2022,
123
Table of Contents
compliance with the CARB regulations has resulted in equipment related expenses or capital investments, including overhauling engines and purchases of new equipment related to the CARB regulations, in excess of $104.7 million. As of December 31, 2022, we estimate that we may continue to incur substantial expenditures to comply with these requirements.
In 2019, Colorado adopted the Climate Action Plan to Reduce Pollution (House Bill 19-1261) (“CCAP”). The CCAP sets into law a goal to reduce the state’s greenhouse gas pollution levels by 25% by 2025, 50% by 2030 and 90% by 2050 compared to 2005 levels. Rulemaking to implement CCAP is now ongoing by the Colorado Department of Public Health and Environment, Air Pollution Control Division, and the resulting rules and regulations might result in the requirement for additional emissions control technology and other changes in operating processes for cement manufacturers. Further, on October 22, 2021, the Colorado Air Quality Control Commission passed the Green Gas Emissions and Energy Management for Manufacturers in Colorado rule (the “GEMM”). The GEMM became effective on December 15, 2021. The GEMM intends to reduce air pollution, save energy, and improve air quality in communities near emitting facilities. It requires specific facilities in the state that produce 50,000 tons or more in GHG emissions, including our construction materials facility in Lyons, to, among other things, prepare and submit to the Air Pollution Control Division an energy and GHG audit demonstrating that they are using GHG BACT and energy best management practices. If the audit shows a facility is using GHG BACT and energy best management practices, it will still be required to reduce its GHG emissions by 5%. On the other hand, if a facility’s audit shows it is not using such best controls to save energy and reduce GHG emissions, it will need to reduce the same amount of emission that those best controls would achieve, plus reduce an additional 5% in total GHG emissions. Additionally, in July 2021, Colorado adopted the Environmental Justice Act (House Bill 21-1266) (the “EJA”), which requires Colorado’s manufacturing sector as a whole to reduce GHG emissions 20% by 2030, based on 2015 reported emissions. The regulations to implement the EJA are expected to be addresses in a second phase of the GEMM rulemaking in 2023. As of December 31, 2022, we were working to comply with the GEMM and following developments in any new regulations proposed to implement the EJA.
Europe
General overview of EU industrial regulation
As of December 31, 2022, the EU legal system operates differently compared to federal systems. The EU legal regime, referred to as supra-national law, sits above the legal systems of the different EU member states (“Member States”), which retain their independence subject to tight oversight from EU institutions, especially the Court of Justice and the European Commission. As such, EU law operates (in its many fields of application, including industrial regulation) in order to control and authoritatively interpret the legislation and implementation of law (EU and domestic) in those Member States. One of the key manifestations of this supra-national control are the inter-related doctrines of the supremacy of EU law and of conforming interpretation. Essentially, where an area of legal control in a Member State has its origin in EU legislation, the Member States must implement or transpose the EU law fully and effectively into their domestic law and every organ of the Member State, including its regulators and its courts, must interpret (and if necessary, change) domestic law in order to conform with the objectives and the letter of the relevant EU legislation. This is of relevance to the cement sector since almost every aspect of its environmental regulation has its origins in EU legislation.
In the EU, the cement sector is subject to a range of environmental laws at EU and national Member States levels. These laws can be very broadly categorized as (1) primary and direct controls placed upon their main operational activities and (2) more general legal regimes which protect different aspects of the environment across many sectors.
The primary examples of the first kind of control are the various laws governing the specific operational activities of the sector, through stringent permitting and emissions controls, which are further explained below; examples of the second, more general, legal controls are the EU Water Framework Directive (2000/60/EC) and the EU Waste Framework Directive (2008/98/EC) which impose various obligations in relation to protection of the surface and underground water environments and the recovery, disposal and overall management of waste. In practice, even these more general laws indirectly impact our industry through permitting emissions control systems.
124
Table of Contents
EU Industrial Permits and Emissions Controls
In the EU, the primary legal environmental controls applied to cement plants are those EU Directives which control operational activities and emissions from those activities. Initially, these controls were primarily derived from two EU Directives: (1) the so-called “IPPC Directives” (as described below) and (2) the Incineration Directive (as defined below).
The primary EU legislative control over the sector (until the transition to the IED, as described below) was the Directive on Integrated Pollution Prevention and Control (2008/1/EC) (“IPPC Directive”), which updated and consolidated an earlier Directive first promulgated in 1996. Since 1996, these IPPC Directives adopted an integrated approach to regulation of various sectors of industrial plants, including cement, by taking into account and controlling/regulating the whole environmental performance of the plant.
The second earlier Directive, which was applied in direct control of cement operations (until the transition to the IED, as described below), was the EU Waste Incineration Directive (2000/76/EC) (“Incineration Directive”) which regulated those parts of the cement operation that used recovered waste materials as substitute fuels in cement kilns. Its aim was to prevent or limit, as far as practicable, negative effects on the environment, in particular pollution by emissions in air, soil, surface water and groundwater and the resulting risks to human health, from incineration and co-incineration plants.
Cement and limestone kilns as a primary or secondary source of fuel fall within the definition of “co incineration plants.” The Incineration Directive sought to achieve its aim by setting and maintaining stringent operational conditions and technical requirements, as well as emission limit values for a range of pollutants including dust, nitrogen oxides, sulfur dioxide, hydrogen chloride, heavy metals and dioxins.
On January 6, 2011, the Industrial Emissions Directive (2010/75/EU) (“IED”) came into force. The IED recasts seven pieces of previously existing legislation into a single coherent legislative instrument, including the IPPC Directives and the Incineration Directive, both of which it repeals. With some exceptions, the IED retains the essential substance of the earlier Directives and tightens some of its provisions. The IED has applied to new industrial installations since January 7, 2013 and to existing industrial installations (other than large combustion plants) since January 7, 2014.
Since the adoption of the early IPPC Directives and under the IED, operators of industrial installations, including cement plants, are required to obtain an integrated permit from the relevant permitting authority in the Member States. Under the IED, as with the IPPC Directive, these permits contain emission limit values and other conditions based on the application of a legal and technical concept called “best available techniques” (“BAT”).
The concept of BAT is central to the system, and effectively imposes a legal obligation on plant operators to use and apply the best available techniques (as they develop from time to time) in order to prevent or, where this is not practicable, minimize emissions of pollutants likely to be emitted in significant quantities from the plant to air, water or land. Emission limit values, parameters or equivalent technical measures must be based on the best available techniques, without prescribing the use of one specific technique or technology and taking into consideration the technical characteristics of the installation concerned, their geographical location and local environmental conditions. In all cases, the permit conditions must procure a high level of protection for the environment as a whole and must address energy efficiency, waste minimization, prevention of accidental emissions and site restoration. Since the IPPC Directives were in effect, to assist the permitting authorities and companies in determining the BAT, the European Commission periodically organizes exchanges of information between experts from the Member States, industry and environmental organizations. This results in the adoption and publication by the European Commission of BAT Reference Documents (“BREFs”) for the industry sectors covered by the IED. A key element of the BREFs are the conclusions on BAT (“BAT conclusions”), which are used as a reference for setting permit conditions.
However, there is an important difference regarding BREFs between the IPPC Directive and the IED. Under the IPPC Directive, the BREFs were considered as guidance only. This is not the case under the IED. Where BAT conclusions specify emission levels, permitting authorities are required to set emission limit values that do not exceed these levels. They may derogate from this requirement only where the costs associated with the
125
Table of Contents
achievement of the emission levels associated with the BAT disproportionately outweigh the environmental benefits due to the geographical location, the local environmental conditions or the technical characteristics of the installation concerned. The permitting authorities must document the reasons for the derogation from the emission limit values in the permit, including the result of the cost-benefit assessment.
In April 2013, pursuant to European Commission Decision No. 2013/163/EU, the European Commission published new BAT conclusions under the IED for production of cement, lime and magnesium oxide, together with specific emission levels. This document sets out an extensive list of technical requirements for most aspects of the cement manufacturing process in the EU, with a view to prevention and minimization of all polluting emissions.
It is a new requirement under the IED that permitting authorities must review and, if necessary, update permit conditions within four years of the European Commission publishing decisions on BAT conclusions for a particular activity. The European Commission describes review of the BREFs as a continuing process due to ongoing technological advances and so updates may be expected. As of December 31, 2022, a total of 13 BREFs of the existing 32 are being rewritten, revised, or not published for the IED. As of December 31, 2022, this has the potential to require our operations in Europe to be adapted to conform to the latest BAT, which in turn could impact our operations.
As of December 31, 2022, we believe that our operations in Member States will be impacted given the change in regulatory approach heralded by the legislation and its ongoing revision and the fact that it will be key to the permitting of the cement industry in the EU. As of December 31, 2022, we are not able to assess the degree of impact that the future BAT conclusion requirements that come into effect under the IED will have on our operations in Member States.
EU Emissions Trading
In 1997, as part of the United Nations Framework Convention on Climate Change (the “UNFCCC”), the Kyoto Protocol was adopted to limit and reduce GHG emissions. The Kyoto Protocol set legally binding emission reduction targets for 37 industrialized countries and the EU. Under the Kyoto Protocol, industrialized countries agreed to reduce their collective GHG emissions by 5% against 1990 levels over the five-year period going from 2008 to 2012. In 2012, at the United Nations Climate Change Conference in Doha, Qatar, the Doha Amendment to the Kyoto Protocol was adopted. Certain parties, including the United Kingdom and the EU, committed to reduce GHG emissions by at least 18% below 1990 levels in the eight-year period going from 2013 to 2020 (“Second Commitment Period”). To compensate for the sting of binding targets, the Kyoto Protocol allowed three “flexibility” mechanisms to be used by parties in meeting their emission limitation commitments: The Clean Development Mechanism (“CDM”), Joint Implementation (“JI”) and International Emissions Trading.
In order to be able to maintain the international climate protection process after 2020, a new climate agreement was required. Negotiations were held in the framework of the yearly UNFCCC Climate Change Conferences on measures to be taken after the Second Commitment Period would end in 2020. This resulted in the adoption of an agreement known as the Paris Agreement in 2015, which is a separate instrument under the UNFCCC rather than an amendment of the Kyoto Protocol. Under the Paris Agreement, each country must determine, plan, and regularly report on the contribution that it undertakes to mitigate global warming (“Nationally Determined Contribution” or “NDC”). The Paris Agreement sets out a global framework to avoid dangerous climate change by limiting global warming to well below 2°C and pursuing efforts to limit it to 1.5°C. The EU’s NDC under the Paris Agreement is to reduce GHG emissions by at least 55% by 2030 compared to 1990.
Initially in order to implement the Kyoto Protocol, and now to implement the Paris Agreement, the EU established an emissions trading system (“ETS”) by means of Directive 2003/87/EC. Under the ETS, a cap or
126
Table of Contents
limit is set on the total amount of CO2 emissions that can be emitted by the power plants, energy-intensive installations (including cement plants) and commercial airlines that are covered by the system. As of December 31, 2022, our operations in the European Union are subject to the binding caps on CO2 emissions imposed pursuant to the ETS. The cap is reduced over time so that the total amount of emissions will decrease.
Within the cap, companies receive free allocation or buy emission allowances. These allowances are tradable so as to enable companies that manage to reduce their emissions, below their free allocation level, to sell their excess allowances to a secondary market or directly to other companies with allowance surrender obligations. After each year, a company must surrender enough carbon allowances to cover all its emissions. In general, failure to meet the emissions reporting and surrender obligations is subject to significant monetary penalties of €100 for each ton of CO2 emitted by the installation for which the operator has not surrendered allowances, whilst also having to surrender allowances to cover the initial under surrender.
The ETS consists of four trading phases: Phase I, which lasted from January 1, 2005 to December 31, 2007, Phase II, which lasted from January 1, 2007 to December 31, 2012, Phase III, which commenced on January 1, 2013 and ended on December 31, 2020, and Phase IV, which commenced on January 1, 2021 and will last until December 31, 2030. Prior to the commencement of each of ETS Phases I and II, each Member State was responsible for publishing its National Allocation Plan (“NAPs”), a document which set out a national cap on the total amount of carbon emissions by all installations during each relevant trading phase and the methodology by which the cap would be allocated to the different sectors in the ETS and their respective installations. Each Member State’s cap contributed to an overall EU cap on emissions, where one carbon allowance had to be surrendered to account for one metric ton of carbon emitted. The carbon allowances were mostly distributed for free by each Member State to its ETS installations, although some Member States also used a fraction of their material cap for auctioning, mainly to power generators. Under ETS Phase III, however, the system of NAPs was replaced by a single EU-wide, top-down, cap on CO2 emissions, with allocation for all installations made according to harmonized EU rules and set out in each Member State’s National Implementation Measures (“NIM”). Additional restrictions were introduced on the extent to which Kyoto Protocol units could be used to offset EU carbon emissions, and auctioning, not free allocation, became the default method for distributing allowances. During Phase IV of the ETS (2021 to 2030), the EU-wide overall cap on emission allowances will be reduced by 2.2% every year from 2021, benchmarks will be updated based on recent data twice during the 2021 to 2030 period, a more dynamic allocation based on recent production shall replace the “historical activity level” and less emission allowances will be available for auction due to their allocation to the EU’s Market Stability Reserve. As of December 31, 2022, it is not possible to predict with certainty how Cemex will be affected by the reform to the ETS in Phase IV and which regulations implementing the European Union’s NDC and Green Deal (as defined below) will be approved; however, we currently expect that the aggregate amount of allowances that will be annually allocated for free to Cemex in Phase IV, due to unused surplus from previous phases, should be sufficient for our operations in Europe until at least the end of 2025. If any emission allowances would need to be purchased, such emission allowances would likely be purchased at increased prices due to their reduced availability in auctions, since they would have been allocated to the Market Stability Reserve. If emission allowances for Phase IV were to be insufficient at some point which would trigger the need to purchase emission allowances, all of this could have a material impact on our results of operations, liquidity and financial condition.
EU policymakers have traditionally seen the free allocation of allowances as a principal way to reduce the risk of carbon leakage—that is either, increased imports from countries that do not have climate change control, or the risk that energy-intensive industries, facing higher costs because of the ETS, will move their facilities beyond the EU’s borders to these countries, thus resulting in a leakage of CO2 emissions without any environmental benefits.
A list of ETS sectors deemed to be at significant risk of carbon leakage is periodically adopted by the European Commission, following agreement by Member States and the European Parliament. The main factors taken into account in determining whether a sector is at significant risk of carbon leakage include the extent to which direct and indirect costs induced by the implementation of the ETS would increase production cost,
127
Table of Contents
calculated as a proportion of the gross value added and the sector’s trade intensity with non-EU countries (imports and exports). This list has historically included the cement production sector.
Sectors classified as deemed to be at significant risk of carbon leakage continued to receive 100% of their benchmark allocation of allowances free of charge during Phase III, adjusted by a cross-sectoral correction factor applied uniformly upon all participating facilities in Europe in order to reduce the amount of free allocation that each installation received so that the total sum would not exceed the authorized EU-wide cap for free allocation. By contrast, sectors not considered at risk of carbon leakage received 80% of their benchmark allowances for free in 2013, declining to 30% by 2020. The cement industry is included in the list of sectors at significant risk of carbon leakage for Phase IV of the ETS; and therefore receives, and should continue to receive, free allocation until at least 2025. Further to this, as of December 31, 2022, the EU Parliament’s environment committee is expected to vote on the revised ETS in February 2023. If progressed, a final vote in March 2023 will pave the way for the cement industry, among others, to have their free allocation period end over a nine-year period between 2026 and 2034. A future decision to end the free allocation period for the cement industry could have a material impact on our operations and our results of operations, liquidity and financial condition.
On April 27, 2011, the European Commission adopted Decision 2011/278/EU, which stated the rules, including the benchmarks of GHG emissions performance, to be used by the Member States in calculating the number of allowances to be annually allocated for free during Phase III of the ETS to industrial sectors (such as cement) deemed to be exposed to the risk of “carbon leakage.” The number of allowances to be allocated to installations for free was based on a combination of historic activity levels at that installation and an EU benchmark of carbon efficiency for the production of a particular product—for example, clinker. An installation’s historic activity level was calculated by taking the median of its annual production levels during the baseline period, either 2005 to 2008 or, where historic activity levels were higher, 2009 to 2010. The product benchmark was based on the average carbon emissions of the top 10% most “carbon efficient” EU installations for a particular product during 2007 and 2008, where carbon efficiency is measured by carbon intensity or carbon emission per metric ton of product. Preliminary allocation calculations based on the rules were carried out by each Member State and included in a NIM table which was sent for scrutiny to the European Commission. On September 5, 2013, the European Commission adopted Decision 2013/448/EU which approved the NIMs submitted by most Member States and which set the annual cross-sectoral correction factors for Phase III of the ETS. The cross-sectoral correction figure was used to adjust the levels of product benchmarks used to calculate the free allocation of allowances to each installation. This was so the total amount handed out for free did not exceed the maximum set in the ETS Directive. Each Member State was required to adjust its national allocation table of free allowances each year and submit this for approval to the European Commission prior to issuing allowances. The application of this cross-sectoral correction factor resulted in an important decrease in the quantity of allowances that our ETS-participant operations received for free in the 2013 to 2020 period. Also, during Phase III, if the activity level of a sub-installation and thus emissions therefrom decreased below a certain threshold than the activity level used to determine free allocation, rules known as the “partial cessation rules” would apply and the level of free allocation would be decreased. While the system for free allocation during Phase IV of the ETS doesn’t differ fundamentally from that of Phase III, free allocation during Phase IV of the ETS will focus on sectors at the highest risk of relocating their production outside of the EU, a considerable number of free allowances will be set aside in the Market Stability Reserve for new and growing installations, more flexible rules in place of the “partial cessation rules” have been set to better align the level of free allocation with actual production levels, allocation to individual installations may be adjusted annually to reflect relevant increases and decreases in production, the 54 benchmark values determining the level of free allocation to each installation will be updated twice in Phase IV to avoid windfall profits and reflect technological progress since 2008, and an annual reduction rate varying from 0.2% to 1.6% will be determined for each benchmark. Furthermore, the free allowance mechanism may be affected as a result of the potential adoption of certain measures as part of the CBAM (as defined below).
128
Table of Contents
In addition to carbon allowances, up to the end of its Phase III, the ETS allowed the use or exchange of Kyoto Protocol units by companies for compliance up to a certain limit to offset their carbon emissions in the EU: the Emission Reduction Unit, representing a metric ton of carbon saved by a project under the JI mechanism, and the Certified Emission Reduction unit (“CERs”) under the CDM. As of December 31, 2022, we have registered 19 CDM projects with a total potential to, according to our estimates, reduce 2.44 million tons of CO2E emissions per year. Since July 2014, we do not verify the actual reductions, so we do not generate CERs on an annual basis since then. As of December 31, 2022, we have already used the maximum allowed number of CERs in all EU operations. Under Phase IV, Emission Reduction Units and CERs will no longer be usable or exchangeable for compliance purposes.
Despite having sold a substantial amount of allowances during Phase II of the ETS, the aggregate amount of allowances that were annually allocated for free to Cemex in Phase III of the ETS (2013 to 2020) were sufficient to operate, which lead us to also sells a significant number of allowances that had been allocated to us in Phase III. This stems from various factors, notably our efforts to reduce emissions per unit of clinker produced and the stream of offset credits coming from our internal portfolio of CDM projects. As of December 31, 2022, we are taking measures intended to minimize our exposure to the ETS, while continuing to supply our products to our customers. As of December 31, 2022, it is not possible to predict with certainty how Cemex will be affected by the ETS in Phase IV; however, we currently expect that the aggregate amount of allowances that will be annually allocated for free to Cemex in Phase IV, due to unused surplus from previous phases, should be sufficient for our operations in Europe until at least the end of 2025. If purchasing any emission allowances is needed, such emission allowances would likely be purchased at increased prices due to their reduced availability in auctions, since they would have been allocated to the Market Stability Reserve. All of this could have a material impact on our results of operations, liquidity and financial condition. Also, although the cement industry is included in the list of leakage sectors which will receive free allocation of allowances during Phase IV of the ETS, a future decision that the cement industry should no longer be regarded at a significant risk of carbon leakage or the adoption of certain measures as part of the CBAM (as defined below) could have a material impact on our operations and our results of operations, liquidity and financial condition.
Furthermore, as a result of the 2019 United Nations Climate Change Conference, also known as “COP25” held in Madrid, Spain, the EU published its “Green Deal” setting out Europe’s strategy to achieve its current NDC and carbon neutrality by 2050. Among the measures that make up the European Union’s Green Deal, the following are expected to impact our industry in the coming years: (i) implementation of a carbon border adjustment to protect from imports, which may be an obstacle for our industry to preserve free allocation; (ii) stricter enforcement of the existing legislation on energy performance of buildings; (iii) extending the ETS to the maritime sector, and possibly also to other sectors, including those related to construction; (iv) implementation of measures to address pollution from industrial activities; (v) development of a new sustainable finance strategy; and (vi) a review of regulations that cover construction products, as well as other initiatives.
On July 14, 2021, the European Commission proposed the following in relation to the measures mentioned in the paragraph above to procure the fulfillment of the goals contained in its Green Deal, among others:
(i) The implementation of the Carbon Border Adjustment Mechanism (“CBAM”), which would equalize the price of carbon between EU domestic products and imports mainly by making EU importers buy carbon certificates corresponding to the carbon price that would have been paid, had the goods been produced under the EU’s carbon pricing rules. Conversely, once a non-EU producer can show that they have already paid a price for the carbon used in the production of the imported goods in a third country, the corresponding cost can be fully deducted for the EU importer. The CBAM should help reduce the risk of carbon leakage and is expected to eventually replace the ETS free allowances granted to EU producers. The initial CBAM proposal shortlisted clinker and portland cement, among others, as goods subject to the adjustment mechanism. According to the proposal, CBAM would be introduced progressively starting in 2023, having a transitional period consisting of data collection starting January 1, 2023, to and including December 31, 2025. The proposal envisions CBAM to be fully implemented in 2026 with the beginning of its definitive stage;
129
Table of Contents
(ii) A reduction of the overall emission cap and an increase in the overall annual rate of reduction of emissions under the ETS was proposed. The proposal also intends to reduce free allowances in the ETS for sectors covered by the CBAM at the rate of 10% per year from 2026 to 2035, when they would be completely eliminated;
(iii) The incorporation of the maritime sector, building sector relating to heating in buildings with outdated systems that use polluting fossil fuels, and road transport into the ETS;
(iv) The implementation of a separate emissions trading system for fuel distribution for road transport and buildings;
(v) The increase in the size of the EU’s Innovation and Modernization Funds, which are currently expected to be funded by the revenues from auctioning 450 million allowances from 2020 to 2030. If approved, this could potentially increase the amount of allowances to be auctioned, therefore reducing the price for such allowances; and
(vi) An increase in its target to produce the EU’s energy from renewable sources by 2030 from 32% to 40% of the total energy production.
As of December 31, 2022, none of the proposals described above has been approved, as they were still subject to consultation throughout the second half of 2022. As a result, as of December 31, 2022, we are not able to foresee the final form of these proposals or any future proposals to achieve the goals of the Green Deal; and, consequently, we are not able to assess if their approval and implementation would have a material adverse impact on our results of operations, liquidity, and financial condition.
As of January 1, 2021, an independent emissions trading system in the United Kingdom (the “UK ETS”) replaced the ETS in the United Kingdom. The United Kingdom has already issued regulations establishing the structure of the UK ETS, including a cap on emissions each year to 2030. With some exceptions, the UK ETS is similar to the ETS and provides continuity after the transition from the ETS. Among these exceptions are the following: (i) a tighter annual cap than under the ETS, at 5% below the Phase IV ETS cap; and (ii) greater fines to apply, as a charge of £100 would be imposed for each ton of emissions not covered by allowances, which is higher than the €100 fine under the ETS. The United Kingdom cap is set to be revised in 2024 to fully align with a net-zero trajectory. As of December 31, 2022, although the UK ETS provides continuity after the transition from the ETS, it is not possible to predict with certainty how Cemex will be affected by the UK ETS. As in Phase IV of the ETS and given the expected tighter caps and expected revision in 2024, the aggregate amount of allowances allocated to Cemex under the UK ETS could not be sufficient for our operations in the UK, and, therefore, Cemex could require to purchase emission allowances at some point in time. It could be necessary to purchase these emission allowances at increased prices due to potential insufficient liquidity and increased price volatility in the UK ETS compared to the ETS. All of this could have a material impact on our results of operations, liquidity and financial condition.
In furtherance of the Paris Agreement, countries are invited to deliver new NDCs every five years. During COP25, 41 countries, including the EU, representing 10.1% of global emissions committed to update their respective NDC during 2020. Furthermore, 80 countries signaled their intention to enhance ambition or action in an NDC by 2020, representing 10.5% of global emissions. Where satisfied, the aforementioned commitments and intentions were satisfied to varying degrees. All countries where Cemex has operations, except for the Mexico and the Philippines updated and/or enhanced their 2030 NDC targets during COP26 held in Glasgow in November 2021. In addition, more than 130 countries have now set or are considering a target of reducing emission to reaching carbon zero by 2050. As of December 31, 2022, it is uncertain if the delivery of new NDCs or these enhanced action plans for carbon reduction will lead to the implementation of any further regulations, and if any such implementation would have a material adverse impact on our results of operations, liquidity and financial condition.
130
Table of Contents
EU Taxonomy
Further to the European Union’s climate and energy targets and to reach the objectives of its Green Deal, the European Union has sought to establish a framework to facilitate sustainable development under a classification system that sets out a list of environmentally sustainable economic activities, which was published on March 9, 2020 (the “EU Taxonomy”) and Regulation (EU) 2020/852 (the “EU Taxonomy Regulation”), which was published in the Official Journal of the European Union on June 22, 2020 and entered into force on July 12, 2020. The EU Taxonomy Regulation established six environmental objectives: i) climate change mitigation, ii) climate change adaption, iii) sustainable use and protection of water and marine resources, iv) transition to a circular economy, v) pollution and prevention and control, and vi) protection and restoration of biodiversity and ecosystems.
Key provisions of the EU Taxonomy Regulation have been developed and adopted by delegated acts. A first delegated act on sustainable activities for climate change adaptation and mitigation was published in the Official Journal of the European Union on December 9, 2021 and entered into force on January 1, 2022 (the “EU Taxonomy Climate Delegated Act”). A second delegated act specifying the content and presentation of information to be disclosed by companies subject to Article 19a or 29a of Directive 2013/34/EU concerning environmentally sustainable economic activities was published in the Official Journal of the European Union on December 15, 2021 and also entered into force on January 1, 2022. A third delegated act on climate change mitigation and adaptation covering certain gas and nuclear activities was published in the Official Journal of the European Union on July 15, 2022 and entered into force on January 1, 2023 (the “Complementary Climate Delegated Act” and, together with the EU Taxonomy Climate Delegated Act, the “Climate Delegated Acts”).
As of December 31, 2022, only two of the six environmental objectives of the EU Taxonomy Regulation have been addressed by the Climate Delegated Acts. Further guidance on the remaining objectives of the EU Taxonomy Regulation and other related developments are expected to be issued during 2023 and 2024.
UK Taxonomy
Following the United Kingdom’s exit from the European Union Single Market and Customs Union in early 2021, the UK government is consulting on the adoption of a framework to facilitate sustainable development, which will be based on the EU Taxonomy Regulation to the extent that it forms part of domestic law by virtue of the European Union (Withdrawal) Act 2018 (the “UK Green Taxonomy”). The Green Technical Advisory Group is advising on the UK Green Taxonomy and the final report is yet to be published. In addition to imposing certain reporting obligations, the classification of a company’s activities under the UK Green Taxonomy could, among other things, influence a company’s ability to access funds for certain projects, the financial markets or financial products.
Great Britain Landfills
In Great Britain, future expenditure on closed and current landfill sites has been assessed and quantified over the period in which the sites are considered to have the potential to cause environmental harm, generally consistent with the regulatory view of up to 60 years from the date of closure. The assessed expenditure relates to the costs of monitoring the sites and the installation, repair and renewal of environmental infrastructure. The costs have been quantified on a net present value basis in the amount of £171,945,924.34 million ($208 million as of December 31, 2022, based on an exchange rate of £.8264 to $1.00) as of December 31, 2022, and we made an accounting provision for this amount.
Philippines Environmental Class Action
On September 20, 2018, a landslide occurred in Sitio Sindulan, Barangay Tina-an, Naga City, Cebu, Philippines (the “Landslide”), a site located within an area covered by mining rights of ALQC.
131
Table of Contents
We are an indirect minority shareholder in ALQC, the principal raw material supplier of one of our subsidiaries in the Philippines, APO.
On November 19, 2018, CHP and APO were served summons concerning an environmental class action lawsuit filed by 40 individuals and one legal entity (on behalf of 8,000 individuals allegedly affected by the Landslide) at the Regional Trial Court of Talisay, Cebu (the “Cebu Court”), against CHP, ALQC, APO, the Mines and Geosciences Bureau of the Department of Environment and Natural Resources, the City Government of Naga, and the Province of Cebu, for “Restitution of Damage of the Natural and Human Environment, Application for the Issuance of Environmental Protection Order against Quarry Operations in Cebu Island with Prayer for Temporary Protection Order, Writ of Continuing Mandamus for Determination of the Carrying Capacity of Cebu Island and Rehabilitation and Restoration of the Damaged Ecosystems.”
In the complaint, among other allegations, plaintiffs claim that the Landslide occurred as a result of the defendants’ gross negligence; and seek, among other relief, (i) monetary damages in the amount of 4.3 billion Philippine Pesos ($77.23 million as of December 31, 2022, based on an exchange rate of 55.67 Philippine Pesos to $1.00), (ii) the establishment of a 500 million Philippine Pesos ($8.98 million as of December 31, 2022, based on an exchange rate of 55.67 Philippine Pesos to $1.00) rehabilitation fund, and (iii) the issuance of a Temporary Environment Protection Order (“TEPO”) against ALQC aiming to prevent ALQC from performing further quarrying activities while the case is still pending.
As of December 31, 2022, among other defenses and based on a report by the Mines and Geosciences Bureau of the Department of Environment and Natural Resources, CHP, APO and ALQC (individually, each a “Private Defendant” and collectively, the “Private Defendants”) deny liability and hold the position that the Landslide occurred due to natural causes.
In an order dated August 16, 2019, the Cebu Court denied plaintiffs’ Application for a TEPO. Plaintiffs moved for reconsideration, but the Cebu Court also denied plaintiffs’ motion in an order dated September 30, 2019. Plaintiffs did not appeal this ruling, which became final as of December 5, 2020.
Likewise, in a separate order also dated September 30, 2019, the Cebu Court partially granted the affirmative defenses raised by Private Defendants in their respective answers, and ruled, among others, that the subject case against CHP and APO is dismissed for failure to state a cause of action. The Cebu Court also ruled that: (i) the 22 plaintiffs who failed to sign the verification and certification against forum shopping are dropped as party-plaintiffs; (ii) the subject case is not a proper class suit, and that the remaining 17 plaintiffs can only sue for their respective claims, but not as representatives of the more than 8,000 alleged victims of the landslide incident; (iii) plaintiffs’ cause of action against ALQC for violation of Section 19(a) of Republic Act No. 10121 is dismissed; (iv) there is a misjoinder of causes of action between the environmental suit and the damage suit; and (v) the damage suit of the remaining plaintiffs will proceed separately upon payment of the required docket fees within 30 days from receipt of order, otherwise, the case for damages will be dismissed. A motion for reconsideration was filed on November 26, 2019 by the plaintiffs. During the hearing of the plaintiff’s motion for reconsideration on September 11, 2020, the Province of Cebu was officially dropped as a defendant in the case. In another order dated November 17, 2021, the Cebu Court denied the plaintiff’s motion for reconsideration and also granted the motions of the Mines and Geosciences Bureau and the City Government of Naga, dismissing the case against them. On January 31, 2022, the plaintiffs appealed the Cebu Court’s latest order with the Court of Appeals. Defendants (including government defendants) opposed the plaintiff’s appeal, and, on April 28, 2022, the Court of Appeals rejected the plaintiff’s appeal and instructed the entry of judgment to issue the corresponding certificate of finality. As of December 31, 2022, the plaintiff has not filed a motion for reconsideration, and if the plaintiff fails to file a motion for reconsideration, the decision will become final, and the case would be closed. As of December 31, 2022, only ALQC remains as a private defendant of the case.
If the plaintiff files a motion for reconsideration and such motion is granted by the competent court, allowing the plaintiff’s appeal to proceed, and the other of September 30, 2019 is later on reversed on appeal by
132
Table of Contents
the Court of Appeals of the Philippines, and a final adverse resolution is issued in this matter after trial, plaintiffs will have the option to proceed against any one of ALQC, APO or CHP for satisfaction of the entirety of the potential judgment award, without the need to proceed against any other Private Defendant beforehand. Thus, ALQC’s, APO’s or CHP’s assets alone could be exposed to execution proceedings. As of December 31, 2022, at this stage of the overall proceedings and considering all possible defenses that could be available, while we cannot assess with certainty the likelihood of an adverse result in the overall proceedings, we believe a final adverse resolution in the overall proceeding is not probable, and, additionally, because we are not able to assess the outcome of the appeal filed by the plaintiffs to challenge the Cebu Court’s order of September 30, 2019, we are not able to determine if a final adverse resolution, if any, would have a material adverse impact on the Company’s consolidated results of operations, liquidity and financial condition.
See “Item 5—Operating and Financial Review and Prospects—Recent Developments—Recent Developments Relating to Our Regulatory Matters and Legal Proceedings—Environmental Matters—Philippines Environmental Class Action.”
Tariffs
The following is a discussion of tariffs on imported cement in some of the countries and regions in which we operate.
Mexico
Mexican tariffs on imported goods vary by product and have historically been as high as 100%. Over the years, import tariffs have been substantially reduced and currently range from none at all for raw materials to over 20% for finished products. As a result of North American Free Trade Agreement (“NAFTA”), starting January 1, 1998, the tariff on cement imported into Mexico from the United States or Canada was eliminated. A new agreement signed on November 30, 2019, called the United States-Mexico-Canada Agreement (“USMCA”), and which supersedes NAFTA, entered into force on July 1, 2020. The USMCA does not have any impact on tariffs on cement imported from the United States or Canada into Mexico.
While the lack of existence or reduction in tariffs could lead to increased competition from imports in the markets in Mexico in which we operate, it is possible that other factors, such as the cost of transportation incurred from most producers outside Mexico to central Mexico, traditionally the region of highest demand in Mexico, could be seen as a barrier to enter certain of the regions in Mexico in which we operate.
United States
In general, and aside from any other restrictions or prohibitions, as of December 31, 2022, any cement imported into the United States from Cuba and North Korea is subject to custom duties depending on the specific type of cement. Imports into the United States from Cuba and North Korea are generally prohibited due to the U.S. import/export controls and economic sanctions. In order to import cement and other products into the United States from Cuba or North Korea, an importer would be required to obtain a license from the U.S. government or otherwise establish the existence of a license exception.
On September 18, 2018, the United States Trade Representative released a list of $200 billion worth of Chinese imports that were to be subject to additional tariffs. This list included cement, clinker, slag cement, and granulated slag from the manufacture of iron or steel. These additional tariffs were effective starting September 24, 2018 and initially were in the amount of 10%. The U.S. was expected to increase the additional tariffs to 25% starting January 1, 2019, but this increase was postponed for 90 days starting on December 1, 2018, to allow time for the United States and China to negotiate their trade disputes. Accordingly, absent a resolution of the trade disputes, the rate of additional duty for the products covered by the September 2018 tariff action increased to 25% on May 10, 2019. On August 23, 2019, the United States announced that the current
133
Table of Contents
25% import tariff would be increased to 30% by October 1, 2019. On September 11, 2019, the United States announced that implementation of this increase would be delayed to October 15, 2019, however, the implementation of this increase has not yet occurred as of December 31, 2022, and the tariff remains at 25%.
Also, as of December 31, 2022, cement imports from countries other than Cuba, China and North Korea into the United States are currently duty free, however, certain individuals and entities on U.S. government lists of specially designated nationals and prohibited parties, may be subject to U.S. import/export controls and other sanctions that prohibit transactions (including import transactions) with such persons without a license.
Europe
Member countries of the EU are subject to the uniform EU commercial policy. There is no tariff on cement imported into a country that is a member of the EU from another member country or on cement exported from an EU country to another member country. As of December 31, 2022, for cement imported into a member country from a non-member country, the tariff was 1.7% of the customs value. Any country with preferential treatment with the EU is subject to the same tariffs as members of the EU. Most Eastern European producers exporting cement into EU countries currently pay no tariff.
United Kingdom
Following the United Kingdom’s exit from the European Union Single Market and Customs Union in early 2021, the United Kingdom is no longer required to abide by the European Union’s Common External Tariff and has introduced its own U.K. Global Tariff (“UKGT”) schedule, which determines duties and tariffs on goods on a “Most Favoured Nation” basis in line with World Trade Organization principles. Pursuant to the UKGT, tariffs of 1.7% to 2.7% have been removed on over 40 construction products, including portland cement, marble, granite, various other types of building stone and plaster boards.
The United Kingdom has also entered into a trade agreement with the European Union, known as the EU UK Trade and Cooperation Agreement, which provides for continued trade without the imposition of tariffs and quotas.
Asia
On August 27, 2019, the Department of Trade and Industry (“DTI”) of the Republic of the Philippines imposed a general safeguard measure on imported cement from various countries (Department Administrative Order 19-13 (“DAO”), Series of 2019) for a period of three years (October 2019 to October 2022). On December 5, 2020, this safeguard was updated in order to make cement imports of cement types 2523.29.90 and 2523.90.00 under ASEAN Harmonized Tariff Nomenclature from major exporting markets of China, Japan, Taiwan, Thailand and Vietnam, subject to a general safeguard duty of 245 Philippine Pesos per metric ton for the second year (i.e., from October 22, 2020 to October 21, 2021) of the aforementioned three-year period. On March 3, 2021, the DTI amended the DAO on cement safeguards, specifically removing certain countries from the list of developing countries and separate customs territories which are exempted from the safeguard measure that meet the de-minimis level of import volume share (less than 3%) to total cement importation. The countries that are no longer excluded from the imposition of the safeguard duty are Chile, Israel, Slovenia, Slovakia, Poland, Lithuania, Latvia, Hungary, Estonia, Czech Republic, Republic of Korea, and Indonesia. The general safeguard duty imposed under the DAO on cement safeguards for the final year of the aforementioned three-year period, which expired on October 20, 2022 was 200 Philippine Pesos per metric ton. The duty amount remains subject to regular review by the DTI.
Tax Matters
United States
As of December 31, 2022, the United States Internal Revenue Service (“IRS”) has concluded its audits for the years 2014 through 2018. The final findings did not alter the originally filed Cemex returns in the United
134
Table of Contents
States, which had no reserves set aside for any potential tax issues. On February 14, 2019, the IRS commenced its audits of the 2019 tax year under the compliance assurance process. As of December 31, 2022, we have not identified any material audit issues and, as such, no reserves are recorded for the 2019 tax year audit in our financial statements.
Colombia
On April 6, 2018, the Colombian Tax Authority (Dirección de Impuestos y Aduanas Nacionales) (“DIAN”) notified Cemex Colombia of a proceeding notice in which the DIAN rejected certain deductions taken by Cemex Colombia in its 2012 year-end income tax return. The DIAN assessed an increase in taxes to be paid by Cemex Colombia in the amount of 124.79 billion Colombian Pesos ($25.77 million as of December 31, 2022, based on an exchange rate of 4,842.19 Colombian Pesos to $1.00) and imposed a penalty in the amount of 124.79 billion Colombian Pesos ($25.77 million as of December 31, 2022, based on an exchange rate of 4,842.19 Colombian Pesos to $1.00). On June 22, 2018, Cemex Colombia responded to the proceeding notice; and, on December 28, 2018, Cemex Colombia was notified of the issuance of an official liquidation confirming the information in the proceeding notice. Cemex Colombia filed an appeal for reconsideration on February 21, 2019 within the legal term. On January 8, 2020, Cemex Colombia was notified that the DIAN had, in response to the appeal filed by Cemex Colombia, confirmed the DIAN’s assessment that Cemex Colombia is required to pay increased taxes and corresponding penalties, as previously notified on April 6, 2018. Cemex Colombia had four months to appeal this resolution in the corresponding administrative courts in Colombia; however, the terms for administrative and judicial proceedings were suspended as a result of the government’s measures in connection with the COVID-19 pandemic. On July 1, 2020, Cemex Colombia filed an appeal against the aforementioned resolution in the Administrative Court of Cundinamarca. The Administrative Court of Cundinamarca admitted the appeal on September 20, 2021. No amounts are required to be paid by Cemex Colombia until all available recourses have been filed and concluded. Additionally, on March 10, 2020, the DIAN issued a complementary administrative act “statement of objections” (pliego de cargos), in which the authority claims the payment of the credit balance that was originated in the tax declaration of the aforementioned year and that was offset by Cemex Colombia with taxes from subsequent years.
Cemex Colombia filed its response on June 2, 2020. On October 25, 2021, the DIAN issued a resolution in relation to the statement of objections confirming the imposed penalty due to inadmissible compensation. The aforementioned penalty comprises 56.82 billion Colombian Pesos ($11.74 million as of December 31, 2022, based on an exchange rate of 4,842.19 Colombian Pesos to $1.00) of the 124.79 billion Colombian Pesos ($25.77 million as of December 31, 2022, based on an exchange rate of 4,842.19 Colombian Pesos to $1.00) increase in taxes to be paid by Cemex Colombia assessed in 2018. Cemex Colombia filed the appeal before the Administrative Court of Cundinamarca on December 16, 2021. The Administrative Court of Cundinamarca has not responded to the filed appeal and it is estimated that the appeal procedure will last at least 2 years. Notwithstanding this resolution, as of December 31, 2022, Cemex considers that an adverse resolution after conclusion of all available defense procedures is not probable. However, it is difficult to assess with certainty the likelihood of an adverse result in the proceeding. If this proceeding is adversely resolved, Cemex believes this could have a material adverse impact on the operating results, liquidity, or financial position of Cemex.
On September 5, 2018, the DIAN notified Cemex Colombia of a proceeding notice in which the DIAN rejected certain deductions taken by Cemex Colombia in its 2011 year-end income tax return. The DIAN assessed an increase in taxes to be paid by Cemex Colombia in the amount of 85.17 billion Colombian Pesos ($17.59 million as of December 31, 2022, based on an exchange rate of 4,842.19 Colombian Pesos to $1.00) and imposed a penalty in the amount of 85.17 billion Colombian Pesos ($17.59 million as of December 31, 2022, based on an exchange rate of 4,842.19 Colombian Pesos to $1.00). On November 30, 2018, Cemex Colombia responded to the proceeding notice. On May 15, 2019, Cemex Colombia was notified of the issuance of a tax assessment maintaining the initial rejection of the deductions taken by Cemex Colombia in its 2011 year-end income tax return. Cemex Colombia filed an appeal on July 11, 2019. On July 6, 2020, Cemex Colombia was
135
Table of Contents
notified about a resolution confirming the official liquidation. On October 22, 2020, Cemex Colombia filed an appeal against such resolution in the Administrative Court of Cundinamarca. If a final adverse resolution to Cemex Colombia is reached in this matter, in addition to any amounts to be paid in confirmation of the official liquidation, Cemex Colombia would, as of the payment date, be required to pay interest on the amounts that would be declared due as of the dates they would have had to be paid. The Administrative Court of Cundinamarca admitted the appeal on September 13, 2021. Furthermore, on June 8, 2020, the DIAN issued a complementary administrative act statement of objections, in which the authority claims the payment of the credit balance that was originated in the tax declaration of the aforementioned year and that was offset by Cemex Colombia with taxes from subsequent years. On December 17, 2020, Cemex Colombia announced that the DIAN had archived such statement of objections, which means the DIAN issued an administrative act by which it closed the complementary statement of charges that had been issued within the income tax process for the fiscal year 2011 earlier in 2020. With the aforementioned administrative act, the complementary procedure within the income tax process for the fiscal year 2011 is concluded, since the amount claimed by the DIAN as credit balance under the 2011 year-end income tax return was included within the complementary process for the fiscal year 2012. As of December 31, 2022, the procedure relating to Cemex Colombia’s 2011 year-end income tax return is not yet resolved and at this stage of the proceeding and considering all possible defenses available, while we cannot assess with certainty the likelihood of an adverse result in this special proceeding, we believe a final adverse resolution to this special proceeding is not probable. However, if adversely resolved, we believe such adverse resolution could have a material adverse impact on our results of operations, liquidity and financial condition.
Spain
Tax Assessment for the years 2006 to 2009
On July 7, 2011, the tax authorities in Spain notified Cemex España of a tax audit process in Spain covering the tax years from and including 2006 to 2009. The tax authorities in Spain have challenged part of the tax losses reported by Cemex España for such years. Cemex España has been formally notified of fines in the aggregate amount of €456 million ($489 million as of December 31, 2022, based on an exchange rate of €0.9325 to $1.00) resulting from the July 7, 2011 tax audit process in Spain. The laws of Spain provide a number of appeals that can be filed against such fines without Cemex España having to make any payment until such appeals are finally resolved. On April 22, 2014, Cemex España filed appeals against such fines before the Tribunal Económico Administrativo Central (“TEAC”) of the Spanish tax authorities. On September 20, 2017, Cemex España was notified by the TEAC about an adverse resolution to such appeals. Cemex España filed a recourse against such resolution on November 6, 2017 before the National Court (Audiencia Nacional) and applied for the suspension of the payment of the fines. The National Court admitted the recourse; and, on January 31, 2018, it notified Cemex España of the granting of the suspension of the payment, subject to the provision of guarantees on or before April 2, 2018. In this regard, Cemex España provided the respective guarantees in the form of a combination of a liability insurance policy and a mortgage of several assets in Spain owned by its Spanish subsidiary Cemex España Operaciones, S.L.U. On November 6, 2018, the National Court confirmed the acceptance of the guarantees by the Spanish Tax Office, which suspends the obligation to effect the payment until the recourses are definitively resolved. On November 30, 2021, the National Court issued a judgment rejecting the appeal filed by Cemex España against the resolution of the TEAC, confirming the imposed fines. This adverse judgment was notified to Cemex España on November 30, 2021. On February 25, 2022, Cemex España filed with the Spanish Supreme Court a cassation appeal against the judgment issued by the National Court. On October 13, 2022, the Spanish Supreme Court determined not to admit the cassation appeal. Cemex España subsequently filed an appeal for the annulment of this determination. The appeal for the annulment of the Spanish Supreme Court’s decision was admitted in December 2022 and Cemex España currently awaits a decision on the appeal.
As of December 31, 2022, at this stage of the matter and considering all possible defenses available, while we cannot assess with certainty the likelihood of an adverse result in this matter, we believe a final adverse resolution to this matter is not probable. However, if adversely resolved, we believe such adverse resolution could have a material adverse impact on our results of operations, liquidity and financial condition.
136
Table of Contents
See “Item 5—Operating and Financial Review and Prospects—Recent Developments—Recent Developments Relating to Our Regulatory Matters and Legal Proceedings—Tax Matters—Spain—Tax Assessment for the years 2006 to 2009.”
Tax Assessment for the years 2010 to 2014
On March 26, 2021, the tax authorities in Spain notified Cemex España of an assessment for income taxes in an amount of €48 million ($51.47 million as of December 31, 2022, based on an exchange rate of €0.9325 to $1.00) plus late interest, derived from a tax audit process covering the tax years 2010 to 2014. This assessment was appealed before the TEAC on April 26, 2021. In order for the suspension of the payment of the tax assessment to be granted, Cemex España provided a payment guarantee which was approved by the Spanish tax authorities on May 12, 2021.
On November 30, 2021, the tax authorities in Spain notified Cemex España of a penalty for an amount of €68 million ($72.92 million as of December 31, 2022, based on an exchange rate of €0.9325 to $1.00) derived from the tax audit process covering the same period from 2010 to 2014. This assessment was appealed before the TEAC on December 31, 2021. Until this appeal is resolved, no payment will be due and Cemex España is not required to furnish a guarantee for the filing of the appeal.
As of December 31, 2022, at this stage of the matter and considering all possible defenses available, while we cannot assess with certainty the likelihood of an adverse result in this matter, we believe a final adverse resolution to this matter is not probable. However, if adversely resolved, we believe such adverse resolution should not have a material adverse impact on our results of operations, liquidity and financial condition.
Other Legal Proceedings
Colombian Construction Claims
On August 5, 2005, the Urban Development Institute (Instituto de Desarrollo Urbano) (“UDI”), and an individual filed a lawsuit in the Fourth Anti-Corruption Court of Bogotá (Fiscalía Cuarta Anticorrupción de Bogotá) against a subsidiary of Cemex Colombia claiming that it was liable, along with the other members of the Asociación Colombiana de Productores de Concreto (“ASOCRETO”), an association formed by the ready-mix concrete producers in Colombia, for the premature distress of the concrete slabs of the Autopista Norte trunk line of the TransMilenio bus rapid transit system of Bogotá in which ready-mix concrete and flowable fill supplied by Cemex Colombia and other ASOCRETO members was used. The plaintiffs alleged that the base material supplied for the road construction failed to meet the quality standards offered by Cemex Colombia and the other ASOCRETO members and/or that they provided insufficient or inaccurate information in connection with the product. The plaintiffs were seeking the repair of the concrete slabs in a manner which guarantees their service during the 20-year period for which they were originally designed, and estimate that the cost of such repair could have been 100 billion Colombian Pesos ($20.65 million as of December 31, 2022, based on an exchange rate of 4,842.19 Colombian Pesos to $1.00). The lawsuit was filed within the context of a criminal investigation against a former director and two officers of the UDI, the contractor, the inspector and two ASOCRETO officers. On January 21, 2008, a court issued an order, sequestering the El Tunjuelo quarry, as security for payment of a possible future money judgment against Cemex Colombia. The court determined that in order to lift this attachment and prevent further attachments, Cemex Colombia was required to deposit 337.8 billion Colombian Pesos ($69.76 million as of December 31, 2022, based on an exchange rate of 4,842.19 Colombian Pesos to $1.00) in cash instead of posting an insurance policy to secure such recovery. Cemex Colombia appealed this decision and the Superior Court of Bogotá (Tribunal Superior de Bogotá) allowed Cemex to present an insurance policy in the amount of 20 billion Colombian Pesos ($4.13 million as of December 31, 2022, based on an exchange rate of 4,842.19 Colombian Pesos to $1.00). Cemex gave the aforementioned security, and, on July 27, 2009, the court lifted the attachment on the quarry.
On October 10, 2012 the court issued a first instance judgment pursuant to which the accusation made against the ASOCRETO officers was nullified. The judgment also convicted a former UDI director, the
137
Table of Contents
contractor’s legal representatives and the inspector to a prison term of 85 months and a fine of 32 million Colombian Pesos ($6,608.58 as of December 31, 2022, based on an exchange rate of 4,842.19 Colombian Pesos to $1.00). As a consequence, of the nullification, the judge ordered a restart of the proceeding against the ASOCRETO officers. The UDI and other parties to the legal proceeding appealed the first instance judgment and on August 30, 2013 the Superior Court of Bogotá resolved to reduce the prison term imposed to the former UDI director and the UDI officers to 60 months and imposed a fine equivalent to 8.8 million Colombian Pesos ($1,817.36 as of December 31, 2022, based on an exchange rate of 4,842.19 Colombian Pesos to $1.00). Additionally, the UDI officers were sentenced to severally pay the amount of 108 billion Colombian Pesos ($22.30 million as of December 31, 2022, based on an exchange rate of 4,842.19 Colombian Pesos to $1.00) for the purported damages in the concrete slabs of the TransMilenio bus rapid transit system. Additionally, the Superior Court of Bogotá overturned the penalty imposed to the contractor’s legal representatives and inspector because the criminal action against them was barred due to the passage of time. Furthermore, the Superior Court of Bogotá revoked the annulment in favor of the ASOCRETO officers and ordered the first instance judge to render a judgment regarding the ASOCRETO officers’ liability or lack thereof. On June 25, 2014, the Supreme Court of Colombia’s Penal Cassation Chamber (Sala de Casación Penal de la Corte Suprema de Justicia de Colombia) dismissed the cassation claim filed by the former UDI director and the UDI officers against the Superior Court of Bogotá’s judgment. Dismissal of the cassation claim has no effect on Cemex Colombia’s or the ASOCRETO officers’ interests in these proceedings. On January 21, 2015, the Penal Circuit Court of Bogotá issued a resolution agreeing with the arguments presented by Cemex Colombia regarding the application of the statute of limitations to the criminal investigation against the ASOCRETO officers and acknowledging that the ASOCRETO officers were not public officers, and as a consequence, finalizing the process against the ASOCRETO officers and the civil responsibility claim against Cemex Colombia. On July 28, 2015, the Superior Court of Bogotá upheld this resolution and as such the action brought against Cemex Colombia for the premature distress of the concrete slabs of the Autopista Norte trunk line has ended.
Related to the premature distress of the concrete slabs of the Autopista Norte trunk line of the TransMilenio bus rapid transit system six legal actions were brought against Cemex Colombia. The Cundinamarca Administrative Court (Tribunal Administrativo de Cundinamarca) nullified five of these actions and, as of December 31, 2022, only one remains outstanding. On June 17, 2019, an administrative court, in the first instance, ruled against Cemex Colombia and other concrete producers, because the judge found that there was a violation of consumer rights, for alleged faults in the roads. Consequently, the judge ordered Cemex Colombia to issue a public statement acknowledging the alleged violation and a commit to not incur such violation in the future. This first instance decision did not contemplate any economic consequence for Cemex Colombia. Cemex Colombia jointly with thirteen of the defendants filed an appeal before the Administrative Tribunal of Cundinamarca. At this stage of the proceedings, as of December 31, 2022, regarding the remaining pending action filed before the Cundinamarca Administrative Court, if adversely resolved, we do not expect that such adverse resolution should have a material adverse impact on our results of operations, liquidity and financial condition.
Egypt Share Purchase Agreement
On April 7, 2011 and March 6, 2012, lawsuits seeking, among other things, the annulment of the share purchase agreement entered into by and between Cemex and state-owned Metallurgical Industries Company (the “Holding Company”) in November 1999 pursuant to which Cemex acquired a controlling interest in ACC (the “Share Purchase Agreement”), were filed by different plaintiffs, including 25 former employees of ACC, before the 7th and 8th Circuits of Cairo’s State Council Administrative Judiciary Court, respectively. In the 8th Circuit of Cairo’s State Council Administrative Judiciary Court’s session held on January 26, 2016, a ruling was issued for the dismissal of this case considering the plaintiff’s lack of standing. The plaintiff did not challenge this ruling; and, accordingly this ruling is final and definitive. At a session held on September 3, 2015, the 7th Circuit of Cairo’s State Council Administrative Judiciary Court ruled for staying the proceedings until the High Constitutional Court pronounces itself with regards to the challenges against the constitutionality of the Presidential Decree on Law 32 of 2014 (“Law 32/2014”). As of December 31, 2022, at this stage of the
138
Table of Contents
proceedings, we believe that the likelihood of an adverse result in this matter is not probable as we are not able to assess the likelihood of an adverse resolution regarding this lawsuit filed before the 7th Circuit of Cairo’s State Council Administrative Judiciary Court, but if adversely resolved, we do not believe the resolution in the first instance would have an immediate material adverse impact on our results of operations, liquidity and financial condition as there are different legal recourses that we could take. However, if we exhaust all legal recourses available to us, a final adverse resolution of this matter could have a material adverse impact on our operations, liquidity and financial condition.
Regarding a different lawsuit submitted to a First Instance Court in Assiut, Egypt and notified to ACC on May 23, 2011 (court case no. 670/2011), on September 13, 2012, the first instance court of Assiut, Egypt issued a judgment (the “First Instance Judgment”) to (i) annul the Share Purchase Agreement; and (ii) reinstate former employees to their former jobs at ACC. On October 18, 2012, ACC filed an appeal (appeal no. 1197/87) against the First Instance Judgment, which was followed by the Holding Company’s appeal filed on October 20, 2012 (appeal no. 1200/87) before the Appeal Court in Assiut, Egypt (the “Appeal Court”). At a November 17, 2013 hearing, the Appeal Court decided to join the appeals filed by ACC and the Holding Company and adjourned the session to January 20, 2014 to render judgment. On January 20, 2014, the Appeal Court issued a judgment (the “Appeal Judgment”) accepting both appeals, revoking the First Instance Judgment, ruling for non-qualitative jurisdiction of the first instance court to review the case and referred the matter to the administrative court in Assiut, Egypt (the “Assiut Administrative Court”) (registered at Assiut Administrative Court under case no. 11842/41).
On March 12, 2014, ACC filed a challenge before the Cassation Court against the Appeal Judgment invoking economic court’s jurisdiction and requested suspension of the Appeal Judgment execution until the Cassation Court renders its judgment (the “Cassation Challenge”). A hearing was held on April 12, 2016 in order to review the request to stay the execution the Appeal Judgment regarding the referral of the case to the Assiut Administrative Court. At this hearing, the Cassation Court rejected the summary request. ACC has been notified of a session before the Cassation Court, to be held on January 4, 2023, in order to rule on the subject matter of the Cassation Challenge.
On October 15, 2014, the Assiut Administrative Court ruled (in case no. 11842/41) for its non-jurisdiction to review the case and referred the case to the Assiut Administrative Judiciary Court (registered at administrative judiciary court under case no. 5580/26J). On December 11, 2014, ACC filed an appeal against the Assiut Administrative Court ruling (appeal no. 165/26—challenging the referral ruling in case 11842) (the “Appeal”), requesting that its enforcement be suspended until a judgment is issued on the Cassation Challenge. Additionally, another appeal substantially on the same terms as the Appeal was filed on March 10, 2014 by the Holding Company against the same ruling (administrative judiciary appeal no. 164/26—challenging the referral ruling in case 11842) (the “Parallel Appeal”).
In a session held on February 11, 2016 in order to review the Appeal, the Assiut Administrative Judiciary Court decided to refer the case to the First Circuit of Cairo’s State Council Administrative Judiciary Court, which in turn decided to refer the Appeal to the Assiut Administrative Judiciary Court. On August 27, 2018, the Assiut Administrative Judiciary Court decided to refer the Parallel Appeal to the Cairo Administrative Judiciary Court that decided lack of jurisdiction and to send the Parallel Appeal back to Assiut Administrative Judiciary Court.
On July 27, 2020, upon the request of ACC, Assiut Administrative Judiciary Court decided joinder of both the Appeal and the Parallel Appeal and to adjourn both to the hearing session of February 27, 2021, April 24, 2021, and then May 22, 2021, for submitting memos and documents.
The Assiut Administrative Judiciary Court held a hearing for the case (no. 5580/26) on February 24, 2016, in which it decided to refer the case to the First Circuit (formerly 7th Circuit) of “Economic and Investment Disputes” of Cairo’s State Council Administrative Judiciary Court (registered at Cairo’s State Council Administrative Judiciary under Case no. 16348/71J). On February 24, 2021, Cairo’s State Council
139
Table of Contents
Administrative Judiciary Court issued a judgment ruling for the dismissal of this case considering the plaintiff’s lack of standing. This judgment is final and definitive, as the plaintiff failed to challenge it within the legally prescribed term. On February 27, 2021, Assiut Administrative Judiciary Court adjourned the hearing (of joined Appeal and Parallel Appeal) to the session of March 27, 2021, and then to April 24, 2021, for the parties to submit an official copy of Cairo’s State Council Administrative Judiciary Court ruling of February 24, 2021, that dismissed the case considering the plaintiff’s lack of standing. On May 22, 2021, ACC submitted to the Assiut Administrative Judiciary Court a copy of Cairo’s State Council Administrative Judiciary Court ruling of February 24, 2021 (dismissing case no. 16348/71J). The court decided to set the joined Appeal and Parallel Appeal for adjudication at the session of June 29, 2021, but the session was adjourned for the sixth time to be held on February 28, 2022. On February 28, 2022, the court issued a judgment ruling for the dismissal of the Appeal and Parallel Appeal.
Also, on February 23, 2014, three plaintiffs filed a lawsuit before the Assiut Administrative Judiciary Court requesting the cancellation of the resolutions taken by the Holding Company’s shareholders during the extraordinary general shareholders’ meeting pursuant to which it was agreed to sell ACC’s shares and enter into the Share Purchase Agreement in 1999. A hearing held on May 17, 2014 was adjourned in order for the State Commissioner Authority (the “SCA”) to prepare a report to be submitted for the consideration of the Assiut Administrative Judiciary Court. On September 4, 2014, ACC received the report issued by the SCA which is non-binding to the Assiut Administrative Judiciary Court. On December 11, 2014, the Assiut Administrative Judiciary Court resolved to refer the case to the 7th Circuit of Cairo’s State Council Administrative Judiciary Court. The 7th Circuit of Cairo’s State Council Administrative Judiciary Court decided to adjourn to July 25, 2015 in order to review the parties’ pleadings. On this hearing held on July 25, 2015, the 7th Circuit of Cairo’s State Council Administrative Judiciary Court adjourned the case to September 3, 2015 for passing judgment. At the session held on September 3, 2015, the 7th Circuit of Cairo’s State Council Administrative Judiciary Court ruled for staying the proceedings until the High Constitutional Court pronounces itself with regards to the challenges against the constitutionality of Law 32/2014. As of December 31, 2022, we still do not have sufficient information to assess the likelihood of the 7th Circuit of Cairo’s State Council Administrative Judiciary Court cancelling the resolutions adopted by the Holding Company’s shareholders, or, if such shareholders’ resolutions are cancelled, how such cancellation would affect us. However, if adversely resolved, we do not believe the resolution in this first instance would have an immediate material adverse impact on our results of operations, liquidity and financial condition as there are different legal recourses that we could take. However, if we exhaust all legal recourses available to us, a final adverse resolution of this matter could have a material adverse impact on our operations, liquidity and financial condition.
On April 22, 2014, Law 32/2014, which regulates legal actions to challenge agreements entered into by the Egyptian State (including its ministries, departments, special budget entities, local administrative units, authorities and state-participated companies) and third parties, was published in the Official Gazette, becoming effective on April 23, 2014, subject to its presentation, discussion and approval by the House of Representatives 15 days after it holds its first session. As per the provisions of Law 32/2014, and considering certain exceptions, only the parties to these agreements have standing to challenge the validity of an agreement. During October and November 2015, parliamentary elections to the House of Representatives took place and the elected House of Representatives started to hold its sessions on January 10, 2016, as expected, and Law 32/2014 was discussed and ratified on January 20, 2016, as legally required. As of December 31, 2022, a constitutional challenge has been filed by a third party against Law 32/2014 before the High Constitutional Court. The High Constitutional Court scheduled a hearing for May 6, 2017 to proceed with the constitutional challenge that was filed against Law 32/2014 after the SCA had submitted its report with respect to the case. On May 6, 2017, the court decided to refer the case back to SCA to prepare and submit a complementary report on the merits. The SCA submitted its commentary report upholding the constitutionality of Law 32/2014 and a hearing was held before the High Constitutional Court on January 14, 2023. On January 14, 2023, the High Constitutional Court determined that Law 32/2014 is constitutionally compliant. This determination would allow Cemex to challenge the legal standing of all current lawsuits and protect Cemex’s investment in Egypt. As a result of the determination made by the High Constitutional Court, the two pending cases were resolved in favor of Cemex on February 23, 2023.
140
Table of Contents
The plaintiffs have 60 days from the date of the resolution to file an appeal. If the plaintiffs fail to appeal this resolution within the established deadline, these proceedings will be closed. If plaintiffs appeal and are successful in their appeal, this could adversely impact the ongoing matters regarding the Share Purchase Agreement, which could have a material adverse impact on our operations, liquidity and financial condition. See “Item 5—Operating and Financial Review and Prospects—Recent Developments—Recent Developments Relating to Our Regulatory Matters and Legal Proceedings—Other Legal Proceedings—Egypt Share Purchase Agreement.”
Maceo, Colombia—Legal Proceedings in Colombia
On August 28, 2012, Cemex Colombia entered into a memorandum of understanding (the “MOU”) with CI Calizas y Minerales S.A. (“CI Calizas”) to acquire land, a mining concession, an environmental license, free trade zone benefits and related assets necessary to carry out the construction by Cemex Colombia of a new integrated cement plant in the Antioquia department near the municipality of Maceo, Colombia (the “Maceo Project”). In connection with the MOU, CI Calizas was represented by a non-governmental individual (the “Representative”).
After the execution of the MOU, one of CI Calizas’ former shareholders was linked to a domain extinction by the Colombian Attorney General’s Office (the “Attorney General’s Office”) that, among other measures, suspended CI Calizas’ ability to transfer certain assets to Cemex Colombia as required by the MOU (the “Affected Assets”). To protect its interests in the Affected Assets, Cemex Colombia joined the domain extinction proceeding and cooperated with the Attorney General’s Office. Cemex Colombia also requested the dismissal of the domain extinction against the Affected Assets. On May 2, 2016, in order to collect further evidence, the Attorney General’s Office denied Cemex Colombia’s request for the dismissal of the domain extinction proceeding. The domain extinction is in its evidence stage and we expect that the Attorney General’s Office’s final decision as to whether it will proceed with the domain extinction with respect to the Affected Assets could take five to ten years.
In July 2013, Cemex Colombia entered into a five-year lease agreement (the “Lease Agreement”) with a depository that had been designated by the Colombian National Narcotics Directorate (Dirección Nacional de Estupefacientes) with respect to the Affected Assets. The Lease Agreement, along with an accompanying governmental mandate, authorized Cemex Colombia to continue the work necessary for the construction and operation of the Maceo Project during the domain extinction proceeding. The Lease Agreement expired on July 15, 2018. Notwithstanding the expiration of the Lease Agreement, Cemex Colombia was entitled to continue using the Affected Assets pursuant to the terms of the accompanying mandate.
On April 12, 2019, Cemex Colombia reached a conciliatory agreement with the Colombian Administrator of Special Assets (Sociedad de Activos Especiales S.A.S) (the “SAE”), CI Calizas and Zona Franca Especial Cementera Del Magdalena Medio SAS (“ZOMAM”) before the Public Prosecutor’s Office (Procuraduría General de la Nación) and signed a contract of Mining Operation, Manufacturing and Delivery Services and Leasing of Properties for Cement Production (the “New Lease Agreement”), allowing Cemex Colombia to operate the Maceo Plant. Cemex Colombia, under the terms of the New Lease Agreement, will lease the land portion of the Affected Assets for a term of 21 years, that can be extended by another 10 years. The New Lease Agreement will remain in full force and effect regardless of the outcome following the domain extinction proceeding over the Affected Assets unless the criminal judge grants Cemex Colombia (and one of its subsidiaries) the ownership rights related to the Affected Assets. In such case, the New Lease Agreement will be terminated given that Cemex Colombia and its subsidiary would be the owners of the Affected Assets and the New Lease Agreement would no longer be required to operate and manage them.
As of December 31, 2022, it is expected that the Maceo Plant will begin operating once the construction of the access road to the Maceo Plant is completed, for which certain permits are yet to be obtained.
Assuming that Cemex Colombia conducted itself in good faith and considering that its investments in the Maceo Project were incurred with the consent of the SAE and CI Calizas under the Lease Agreement and the
141
Table of Contents
accompanying mandate, we believe the value of such investments is protected by Colombian law. Colombian law provides that, if a person builds on another person’s property with the knowledge of such other person, the person that built on the property shall be compensated with the value of what was built or otherwise be transferred the property in the event the owner of the property decides to recover possession. We also believe that, during the term of the New Lease Agreement, Cemex Colombia may use the Affected Assets in order to operate the Maceo Project. In the event that Cemex Colombia’s right to the Affected Assets is extinguished in favor of the government of Colombia, which we believe is unlikely, the SAE may decide not to sell the Affected Assets to Cemex Colombia. In either case, under Colombian law, Cemex Colombia would be entitled to compensation for the value of the investments made in the Maceo Project. On November 18, 2021, Cemex filed a Letter of Intent requesting that the SAE commence the process of selling of ZOMAM, in which Cemex is interested in participating. If the SAE initiates the process, the sale will be carried out under objective parameters prescribed by law that apply to valuing entities undergoing domain extinction proceedings. As of December 31, 2022, the SAE has not responded to this request. As of December 31, 2022, at this stage of the proceedings, we believe that the likelihood of an adverse result in this matter is not probable, but we are not able to assess the likelihood of Cemex Colombia receiving an adverse decision relating to the domain extinction proceedings or if the ownership of the assets subject to the MOU will be extinguished in favor of the Republic of Colombia. However, as of December 31, 2022, we believe that an adverse resolution in which Cemex Colombia is not compensated for the value of its investments in the Maceo Project could have a material adverse effect on our results of operations, liquidity or financial condition.
On December 30, 2013, Cemex Colombia and the Representative entered into a different memorandum of understanding (the “Land MOU”), pursuant to which the Representative would represent Cemex Colombia in the acquisition of lands adjacent to the Maceo Project. In connection with the Maceo Project, Cemex Colombia conveyed to the Representative 43.8 billion Colombian Pesos, including cash payments and interest, ($9.04 million as of December 31, 2022, based on an exchange rate of 4,842.19 Colombian Pesos to $1.00). Due to the domain extinction proceeding against the Affected Assets described above, the acquisition of the Affected Assets was not finalized.
Also on September 23, 2016, CLH disclosed that it had identified irregularities in the process for the purchase of the land related to the Maceo Project and submitted a criminal complaint with the Attorney General’s Office. Further, on December 20, 2016, CLH enhanced such filing with additional information and findings obtained as of such date. On June 12, 2018, the Attorney General’s Office formally charged two former officers of CLH and Cemex Colombia and the Representative. One of the former officers of CLH and Cemex Colombia entered into a plea bargain and cooperation agreement with the Attorney General’s Office, which was approved by the Colombian criminal court in April of 2019. The hearings for the other two individuals continued during 2022. See “Item 5—Operating and Financial Review and Prospects—Recent Developments—Recent Developments Relating to Our Regulatory Matters and Legal Proceedings—Other Legal Proceedings—Maceo, Colombia—Legal Proceedings in Colombia.”
Also, on September 23, 2016, CLH and Cemex Colombia terminated the employment of the Vice President of Planning of CLH, who was also Cemex Colombia’s Director of Planning, and the Legal Counsel of CLH, who was also the General Counsel of Cemex Colombia. In addition, effective September 23, 2016, the Chief Executive Officer of CLH, who was also the President of Cemex Colombia, resigned from both positions. On October 4, 2016, in order to strengthen levels of leadership, management and corporate governance practices, the Board of Directors of CLH resolved to split the roles of Chairman of the Board of Directors of CLH, Chief Executive Officer of CLH and President of Cemex Colombia, and appointed a new Chairman of the Board of Directors of CLH, a new Chief Executive Officer of CLH, a new President of Cemex Colombia and a new Vice President of Planning of CLH and Cemex Colombia. A new legal counsel for CLH and Cemex Colombia was also appointed during the fourth quarter of 2016.
Additionally, pursuant to the requirements of Cemex, S.A.B. de C.V.’s and CLH’s audit committees, Cemex Colombia retained external counsel to assist CLH and Cemex Colombia to collaborate as necessary with the Attorney General’s Office, as well as to assist on other related matters. A forensic investigator in Colombia was also engaged.
142
Table of Contents
As of December 31, 2022, the Attorney General’s Office is investigating the irregularities in connection with the transactions conducted pursuant to the MOU and the Land MOU, as well as other matters regarding our business in Colombia. Such investigations are running their due course but have not been concluded, and, as such, we cannot predict what actions, if any, the Attorney General’s Office may implement. Any actions by the Attorney General’s Office and any actions taken by us in response to the aforementioned irregularities regarding the Maceo Project, including, but not limited to, the termination of employment and resignation of the aforementioned executives and further investigations in Colombia, could have a material adverse effect on our results of operations, liquidity or financial condition.
On December 7, 2020, CLH, acting as a shareholder of Cemex Colombia, filed a lawsuit before the Colombian Business Superintendency (Superintendencia de Sociedades de Colombia) requesting a determination of inefficacy and subsequent declaration of invalidity and nonexistence of the capitalization in kind made by Cemex Colombia to ZOMAM on December 11, 2015. The lawsuit is based on the argument that commercial law requirements applicable to a capitalization process were not complied with at the time of the capitalization. On December 6, 2022, the Colombian Business Superintendency denied the claims of the lawsuit, and therefore, on December 13, 2022, CLH filed an appeal for this decision to be reviewed. As of December 31, 2022, the decision on such appeal is pending. If a favorable final resolution is obtained, the aforementioned capitalization would be reversed, and the assets contributed to ZOMAM, which had a value of $43 million, would revert to Cemex Colombia in exchange for the shares in ZOMAM that had been issued as a result of this capitalization. These effects would only be reflected in Cemex Colombia’s financial statements if a final favorable resolution is obtained. Given ZOMAM’s consolidation, no effects in our consolidated financial statements would arise from a potential favorable resolution.
Investigations related to ongoing matters in Colombia and certain other countries
As discussed in “Item 4—Information on the Company—Regulatory Matters and Legal Proceedings—Other Legal Proceedings—Maceo, Colombia—Legal Proceedings in Colombia,” internal audits and investigations by Cemex, S.A.B. de C.V. and CLH had raised questions about payments relating to the Maceo Project. The payments made to the Representative in connection with the Maceo Project did not adhere to Cemex, S.A.B. de C.V.’s and CLH’s internal controls. As announced on September 23, 2016, the CLH and Cemex Colombia officers responsible for the implementation and execution of the above-referenced payments were terminated and the then Chief Executive Officer of CLH resigned. In December 2016, Cemex, S.A.B. de C.V. received subpoenas from the SEC seeking information to determine whether there have been any violations of the U.S. Foreign Corrupt Practices Act stemming from the Maceo Project. We had previously disclosed that it was possible that the DOJ and other investigatory entities in other jurisdictions could also open investigations into this matter. In this regard, on March 12, 2018, the DOJ issued a grand jury subpoena to Cemex, S.A.B. de C.V. relating to its operations in Colombia and other jurisdictions. These subpoenas do not mean that the SEC or DOJ have concluded that Cemex, S.A.B. de C.V. or any of its affiliates violated the law. Cemex, S.A.B. de C.V. has cooperated fully, and during 2020 produced to the SEC and DOJ all requested information and documentation and intends to continue to cooperate fully with the SEC, the DOJ, the Attorney General’s Office and any other investigatory entity in Colombia or in any other country. As of December 31, 2022, Cemex, S.A.B. de C.V. is unable to predict the duration, scope, or outcome of the SEC or DOJ investigations, or any other investigation that may arise in Colombia or in any other country, or, because of the current status of the SEC and DOJ investigations, the potential sanctions which could be imposed on Cemex, S.A.B. de C.V., or if such sanctions, if any, would have a material adverse impact on Cemex, S.A.B. de C.V.’s consolidated results of operations, liquidity or financial position.
Maceo, Colombia—Operational Matters
On October 27, 2016, CLH decided to postpone the commencement of operations of the Maceo Plant. This decision was mainly due to the fact that Cemex Colombia had not received the permits required to finalize road access to such cement plant. The only existing access to the Maceo Plant cannot guarantee safety or operations and could limit the capacity to transport products from the cement plant. As of December 31, 2022, the process to
143
Table of Contents
obtain the permits required to finalize the road access to the Maceo Plant is ongoing. Cemex Colombia has provided all of the information the authorities have requested in order to grant such permits, but Cemex Colombia is not able to assess if and when such permits will be received.
On May 21, 2021, Cemex Colombia and ZOMAM submitted a new request to expand the free trade zone that covers the Maceo Project in order to commission a new clinker line at such cement plant. On June 15, 2022, the corresponding authority issued the resolution by means of which the requested extension was granted, expanding the zone by 144,712.24 m2, for a total of 336,438.24 m2.
Cemex Colombia determined that the area covered by the environmental license related to the Maceo Project partially overlapped with a District of Integrated Management (Distrito de Manejo Integrado) (“DIM”), which could limit the granting of the environmental license modification. On October 9, 2017, Cemex Colombia filed a petition with the Regional Autonomous Corporation of Antioquia (“Corantioquia”) to subtract from the DIM the zoning area covered by the environmental license related to the construction by Cemex Colombia of the Maceo Project, in order to avoid any overlap between them.
On September 3, 2019, Cemex Colombia was notified of a favorable decision issued by the Corantioquia Board of Directors to approve subtracting from the DIM an area of 169.2 hectares of the municipality of Maceo. Cemex Colombia will be responsible for managing the execution of the environmental compensations requested by the Corantioquia Board of Directors, reaffirming its commitment to generate development, employment and community welfare, by preserving the ecosystem and the environment.
The mining concession and the environmental license related to the Maceo Project were held by different legal entities, which is contrary to typical procedure in Colombia. CI Calizas assigned the mining concession and the environmental license to Central de Mezclas S.A. (“Central de Mezclas”), a subsidiary of Cemex Colombia, in October 2012 and December 2013, respectively. However, in December 2013, the mining concession was assigned back to CI Calizas as a result of the revocation of such mining concession by the Mining Secretariat (Secretaría de Minas) of Antioquia. During the second half of 2016, Corantioquia, the regional environmental agency with jurisdiction over the Maceo Project, requested authorization and consent from Central de Mezclas to reverse the assignment of the environmental license back to CI Calizas.
On February 22, 2018, Central de Mezclas granted such authorization. Cemex Colombia had previously requested a modification to the environmental license to 950,000 tons of cement per annum, which Corantioquia denied. On July 17, 2020, Cemex Colombia submitted a new request to modify the environmental license to expand its production to 950,000 tons of cement per annum as initially planned. On February 2, 2021, Corantioquia issued a resolution authorizing CI Calizas’ request to modify the environmental license and CI Calizas challenged such determination to further clarify the details and extent of the license. Following this challenge, on February 12, 2021, Corantioquia resolved to modify the environmental license, allowing the extraction of up to 990,000 tons of minerals (clay and limestone) and up to 1,500,000 metric tons of cement annually. On October 22, 2021, a request for amendment of the environmental license of Maceo Plant was filed, by means of which Cemex Colombia requested to increase the scope of the production of exploding annually up to 1,300,000 tons of clay and limestone, among other requests.
On August 29, 2020, Cemex Colombia received a favorable opinion from Corantioquia and the relevant municipality, which deems the industrial and mining use of the land where the Maceo Project is located as suitable. Further requirements are still in process of being fulfilled.
Regarding the permits to complete the construction of various sections of the access road: (i) on November 10, 2020, the Mayor’s Office of Maceo issued the Road Infrastructure Intervention authorization and (ii) on December 11, 2020, the Mayor´s Office issued a decree declaring that the road project is of public utility. Therefore, we can now seek the necessary approvals to obtain the permits to acquire the required properties and build the remainder of the road. Additionally, in accordance with the Colombian Infrastructure Law (Ley de Infraestructura), it is also necessary to obtain the authorization from each of the owners of the land adjacent to the road. As of December 31, 2022, Cemex Colombia cannot determine with certainty the date when the access road will be completed.
144
Table of Contents
Cemex Colombia and Central de Mezclas plan to continue to work on solving the issues causing the postponement of the commissioning of the Maceo Plant in order to capture, as soon as reasonably possible, the full operating benefits of this facility in Colombia. Cemex Colombia believes some of these issues could be related to the domain extinction proceeding against the Affected Assets. As of December 31, 2022, we do not expect to suffer a material adverse impact to our results of operations, liquidity, or financial condition as a result of the Maceo Plant not being commissioned to operate pending resolution of these issues.
Quarry matter in France
One of our subsidiaries in France, Cemex Granulats Rhône Méditerranée (“Cemex Granulats”), is a party to a contract executed in 1990 (the “Quarry Contract”) with SCI La Quinoniere (“SCI”), pursuant to which Cemex Granulats has drilling rights to extract reserves and conduct quarry remediation at a quarry in the Rhône region of France. In 2012, SCI filed a claim against Cemex Granulats for breach of the Quarry Contract, requesting the rescission of the Quarry Contract and damages plus interest, totaling an aggregate amount of €55 million ($58.98 million as of December 31, 2022, based on an exchange rate of €0.9325 to $1.00), resulting from Cemex Granulats having partially filled the quarry allegedly in breach of the terms of the Quarry Contract. On May 18, 2016, Cemex Granulats was notified about an adverse judgment in this matter by the corresponding court in Lyon, France, primarily ordering the rescission of the Quarry Contract and damages plus interest, totaling an aggregate amount of €55 million ($58.98 million as of December 31, 2022, based on an exchange rate of €0.9325 to $1.00). This judgment is not enforceable. Cemex Granulats filed the notice of appeal with the appeal court in Lyon, France. SCI updated its claim for damages to an aggregate amount of €67 million ($71.85 million as of December 31, 2022, based on an exchange rate of €0.9325 to $1.00). The judgment of the appeal court was notified to Cemex Granulats on March 13, 2018. It overrules the first instance judgment but orders the rescission of the Quarry Contract. It also appoints a judicial expert to (i) determine the volume of both excavated materials and backfilling materials and (ii) give their opinion on the potential damages suffered by SCI. This judgment is enforceable. Cemex Granulats has filed the notice of appeal with the Court of Cassation. The decision was handed down on May 23, 2019, our appeal was dismissed, and the Court of Cassation declared that Cemex Granulats breached the Quarry Contract. In connection with this matter, judicial experts were appointed by the Lyon Court of Appeals to (i) determine the volume of both excavated materials and backfilling materials at issue and (ii) provide their assessment of the potential damages suffered by SCI. On November 25, 2020, the judicial expert appointed by the Lyon Court of Appeals issued his final report, concluding that the volume of excavated materials and external backfilling materials were calculated at 3.04 million cubic meters and 1.41 million cubic meters, respectively. Based on these volumes, the expert calculated the loss of profits at €0.65 million ($0.70 million as of December 31, 2022, based on an exchange rate of €0.9325 to $1.00) and the cost of excavation of the external backfilling materials at €12.35 million ($13.24 million as of December 31, 2022, based on an exchange rate of €0.9325 to $1.00). However, the judicial expert clearly states that in his opinion the damages suffered by SCI can only be set based on the loss of profits. SCI, within the proceedings on the merits of this case that have resumed before the Lyon Court of Appeals following the end of the expertise phase, has updated the amount of its claims to €27 million ($28.95 million as of December 31, 2022, based on an exchange rate of €0.9325 to $1.00) on the grounds of the excavation of the external backfilling materials. The decision handed down by the Lyon Court of Appeals on November 23, 2022, is in favor of Cemex Granulats, since the court confirmed the final report of the expert, ruling that the damages of the SCI shall (i) be based on the loss of profits, and (ii) be set at €0.65 million ($0.70 million as of December 31, 2022, based on an exchange rate of €0.9325 to $1.00). The SCI may file a notice of appeal before the Court of Cassation within two months of the notification, which took place on December 22, 2022. At this stage of the proceedings, as of December 31, 2022, we are not able to determine the final amount that we would pay in relation to this matter, but we expect that any amounts to be paid should not have a material adverse impact on our results of operations, liquidity and financial condition.
General
As of December 31, 2022, we are involved in various legal and administrative proceedings as well as investigations in some of the jurisdictions where we operate, involving, but not limited to, product warranty
145
Table of Contents
claims, commercial claims, criminal claims, environmental claims, claims regarding the procurement and supply of products and services, patent and copyright infringement claims, claims and disputes regarding the transportation of goods and services, indemnification claims relating to divestments and acquisitions and similar types of claims brought against us that have arisen in the ordinary course of business, some of which we have determined do not merit disclosure based on the stage in which any such investigation is at the time of this report, and that we would disclose once the investigation has finalized and based on the results of any such investigation. In addition, the administrative authorities in the countries in which we operate perform periodic audits on our operations, at times, as a result of those audits, we may receive notices to remedy (i.e., pay a fine, pay an interest, modify tax returns, adjust social security payments, cover balances, etc.) certain discrepancies found in the audits, some of which we have determined do not merit disclosure based on either the stage in which any audit is at the time of this report and/or because we believe, as of the date of this annual report, the corresponding remedy would not have a material adverse effect on our operations, financial position, and results of operations, or that we would disclose once the audit has finalized and based on the results of any such audit, if the results would have a material adverse effect on our operations, financial position, and results of operations. Also, as of December 31, 2022, we have been made aware of claims that have been filed against us that have been either dismissed or rejected that lead to a recourse, appeal or legal action under the applicable legislation has been filed by the party that presented the claim, and in relation to which, consequently, we have not been formally notified, and that are not included in this report. We, and different organizations or associations to which we belong, also receive various information requests from various governmental and administrative authorities when such authorities are conducting periodic or general reviews of the markets in which we operate. We believe we have made adequate provisions to cover both current and contemplated general and specific litigation risks, and we believe these matters will be resolved without any significant effect on our operations, financial position, and results of operations. We are sometimes able to make and disclose reasonable estimates of the expected loss or range of possible loss, as well as disclose any provision accrued for such loss. However, for a limited number of ongoing legal proceedings, we may not be able to make a reasonable estimate of the expected loss or range of possible loss or may be able to do so but believe that disclosure of such information on a case-by-case basis would seriously prejudice our position in the ongoing legal proceedings or in any related settlement discussions. Accordingly, in these cases, we have disclosed qualitative information with respect to the nature and characteristics of the contingency but have not disclosed the estimate of the range of potential loss.
Item 4A—Unresolved Staff Comments
Not applicable.
Item 5—Operating and Financial Review and Prospects
Cautionary Statement Regarding Forward-Looking Statements
This annual report contains, and the reports we will file or furnish in the future may contain, forward-looking statements within the meaning of the U.S. federal securities laws and the Mexican federal securities laws, as applicable. We intend these forward-looking statements to be covered by the safe harbor provisions for forward-looking statements within the meaning of the U.S. federal securities laws. In some cases, these statements can be identified by the use of forward-looking words such as “may,” “assume,” “might,” “should,” “could,” “continue,” “would,” “can,” “consider,” “anticipate,” “estimate,” “expect,” “envision,” “plan,” “believe,” “foresee,” “predict,” “potential,” “target,” “strategy,” “intend,” “aimed” or other similar terms. These forward-looking statements reflect, as of the date such forward-looking statements are made, or unless otherwise indicated, our current expectations and projections about future events based on our knowledge of present facts and circumstances and assumptions about future events. These statements necessarily involve risks and uncertainties that could cause actual results to differ materially from our expectations.
146
Table of Contents
Some of the risks, uncertainties and other important factors that could cause results to differ, or that otherwise could have an impact on us or our consolidated entities, include, but are not limited to:
| • | the impact of pandemics, epidemics or outbreaks of infectious diseases and the response of governments and other third parties, which could adversely affect, among other matters, the ability of our operating facilities to operate at full or any capacity, supply chains, international operations, availability of liquidity, investor confidence and consumer spending, as well as the availability of, and demand for, our products and services; |
| • | the cyclical activity of the construction sector; |
| • | our exposure to other sectors that impact our and our clients’ businesses, such as, but not limited to, the energy sector; |
| • | availability of raw materials and related fluctuating prices of raw materials, as well as of goods and services in general, in particular increases in prices as a result of inflation; |
| • | volatility in pension plan asset values and liabilities, which may require cash contributions to the pension plans; |
| • | the impact of environmental cleanup costs and other remedial actions, and other liabilities relating to existing and/or divested businesses; |
| • | our ability to secure and permit aggregates reserves in strategically located areas; |
| • | the timing and amount of federal, state and local funding for infrastructure; |
| • | changes in the level of spending for private residential and private nonresidential construction; |
| • | changes in our effective tax rate; |
| • | competition in the markets in which we offer our products and services; |
| • | general political, social, health, economic and business conditions in the markets in which we operate or that affect our operations and any significant economic, health, political or social developments in those markets, as well as any inherent risks to international operations; |
| • | the regulatory environment, including environmental, energy, tax, labor, antitrust, and acquisition- related rules and regulations; |
| • | our ability to satisfy our obligations under our material debt agreements, the indentures that govern our outstanding Notes and our other debt instruments and financial obligations, including our subordinated notes with no fixed maturity and other financial obligations; |
| • | the availability of short-term credit lines or working capital facilities, which can assist us in connection with market cycles; |
| • | the impact of our below investment grade debt rating on our cost of capital and on the cost of the products and services we purchase; |
| • | loss of reputation of our brands; |
| • | our ability to consummate asset sales, fully integrate newly acquired businesses, achieve cost-savings from our cost-reduction initiatives, implement our pricing initiatives for our products and generally meet our business strategy goals; |
| • | the increasing reliance on information technology infrastructure for our sales invoicing, procurement, financial statements and other processes that can adversely affect our sales and operations in the event that the infrastructure does not work as intended, experiences technical difficulties or is subjected to cyber-attacks; |
147
Table of Contents
| • | changes in the economy that affect demand for consumer goods, consequently affecting demand for our products and services; |
| • | climate change, in particular reflected in weather conditions, including, but not limited to, excessive rain and snow, and disasters such as earthquakes and floods, that could affect our facilities or the markets in which we offer our products and services or from where we source our raw materials; |
| • | trade barriers, including tariffs or import taxes and changes in existing trade policies or changes to, or withdrawals from, free trade agreements, including the United States-Mexico-Canada Agreement; |
| • | availability and cost of trucks, railcars, barges and ships, as well as their licensed operators and drivers, for transport of our materials; |
| • | labor shortages and constraints; |
| • | terrorist and organized criminal activities as well as geopolitical events, such as war and armed conflicts, including the current war between Russia and Ukraine; |
| • | declarations of insolvency or bankruptcy, or becoming subject to similar proceedings; |
| • | natural disasters and other unforeseen events (including global health hazards such as COVID-19); and |
| • | the other risks and uncertainties described under “Item 3—Key Information—Risk Factors” and elsewhere in this annual report. |
Readers are urged to read this annual report and carefully consider the risks, uncertainties and other factors that affect our business and operations. The information contained in this annual report is subject to change without notice, and we are not obligated to publicly update or revise forward-looking statements after the date hereof or to reflect the occurrence of anticipated or unanticipated events or circumstances. Readers should review future reports filed or furnished by us to the SEC.
This annual report also includes statistical data regarding, but not limited to, the production, distribution, marketing and sale of cement, ready-mix concrete, clinker and aggregates. We generated some of this data internally, and some was obtained from independent industry publications and reports, available as of the date of this annual report, that we believe to be reliable sources. We have not independently verified this nor sought the consent of any organizations to refer to their reports in this annual report.
Overview
The following discussion and analysis should be read in conjunction with, and are qualified in their entirety by reference to, our audited consolidated financial statements as of December 31, 2021 and 2022, and for each of the three years ended December 31, 2020, 2021 and 2022, included elsewhere in this annual report. Our financial statements have been prepared in accordance with IFRS as issued by IASB.
As previously described, our audited consolidated financial statements as of December 31, 2021 and 2022, and for each of the three years ended December 31, 2020, 2021 and 2022 included elsewhere in this annual report include our presentation of several incurred and projected sales of assets as discontinued operations, as applicable. As of December 31, 2022, there are no significant assets held for sale.
The regulations of the SEC do not require foreign private issuers that prepare their financial statements based on IFRS (as issued by IASB) to reconcile such financial statements to U.S. GAAP.
The percentage changes in cement sales volumes described in this annual report for our operations in a particular country or region include the number of tons of cement and/or the number of cubic meters of ready-mix concrete sold to our operations in other countries and regions. Likewise, unless otherwise indicated, the revenues financial information presented in this annual report for our operations in each country or region
148
Table of Contents
includes the Dollar amount of revenues derived from sales of cement and ready-mix concrete to our operations in other countries and regions, which have been eliminated in the preparation of our audited consolidated financial statements as of and for the year ended December 31, 2022 included elsewhere in this annual report.
The following table sets forth selected consolidated financial information as of December 31, 2021 and 2022 and for each of the three years ended December 31, 2020, 2021 and 2022 by principal geographic reporting segment expressed as a percentage of our total consolidated group. We operate in countries and regions with economies in different stages of development and structural reform and with different levels of fluctuation in exchange rates, inflation and interest rates. These economic factors may affect our results of operations, liquidity and financial condition, depending upon the depreciation or appreciation of the exchange rate of each country and region in which we operate compared to the Dollar and the rate of inflation of each of these countries and regions.
| Revenues For the Year Ended December 31, |
Operating Earnings Before Other Expenses, Net For the Year Ended December 31, |
Total Assets at December 31, |
||||||||||||||||||||||||||||||||||
| 2020(1) | 2021(1) | 2022(1) | 2020(2) | 2021(2) | 2022(2) | 2020(2) | 2021(2) | 2022(2) | ||||||||||||||||||||||||||||
| Mexico |
21 | % | 22 | % | 21 | % | 61 | % | 58 | % | 62 | % | 14 | % | 14 | % | 15 | % | ||||||||||||||||||
| United States |
30 | % | 27 | % | 27 | % | 24 | % | 18 | % | 20 | % | 46 | % | 48 | % | 48 | % | ||||||||||||||||||
| EMEAA |
||||||||||||||||||||||||||||||||||||
| United Kingdom |
5 | % | 6 | % | 5 | % | 2 | % | 4 | % | 9 | % | 6 | % | 6 | % | 5 | % | ||||||||||||||||||
| France |
6 | % | 5 | % | 4 | % | 2 | % | 3 | % | 1 | % | 4 | % | 4 | % | 4 | % | ||||||||||||||||||
| Germany |
4 | % | 3 | % | 3 | % | 3 | % | 2 | % | 1 | % | 2 | % | 2 | % | 2 | % | ||||||||||||||||||
| Poland |
3 | % | 3 | % | 2 | % | 4 | % | 3 | % | 3 | % | 1 | % | 1 | % | 1 | % | ||||||||||||||||||
| Spain |
2 | % | 2 | % | 2 | % | (1 | )% | (2 | )% | (1 | )% | 4 | % | 3 | % | 2 | % | ||||||||||||||||||
| Philippines |
3 | % | 3 | % | 2 | % | 6 | % | 4 | % | 3 | % | 3 | % | 3 | % | 3 | % | ||||||||||||||||||
| Israel |
6 | % | 5 | % | 5 | % | 7 | % | 4 | % | 4 | % | 3 | % | 3 | % | 3 | % | ||||||||||||||||||
| Rest of EMEAA |
4 | % | 4 | % | 4 | % | 1 | % | 2 | % | 3 | % | 3 | % | 3 | % | 3 | % | ||||||||||||||||||
| SCA&C |
||||||||||||||||||||||||||||||||||||
| Colombia |
3 | % | 3 | % | 2 | % | 5 | % | 4 | % | 2 | % | 4 | % | 4 | % | 3 | % | ||||||||||||||||||
| Panama |
1 | % | 1 | % | 1 | % | — | 1 | % | 1 | % | 1 | % | 1 | % | 1 | % | |||||||||||||||||||
| Caribbean TCL |
2 | % | 2 | % | 2 | % | 3 | % | 3 | % | 4 | % | 2 | % | 2 | % | 2 | % | ||||||||||||||||||
| Dominican Republic |
2 | % | 2 | % | 2 | % | 6 | % | 7 | % | 8 | % | 1 | % | 1 | % | 1 | % | ||||||||||||||||||
| Rest of SCA&C |
3 | % | 3 | % | 2 | % | 7 | % | 6 | % | 5 | % | 1 | % | 1 | % | 1 | % | ||||||||||||||||||
| Corporate and Other Operations |
5 | % | 9 | % | 16 | % | (30 | )% | (17 | )% | (25 | )% | 5 | % | 4 | % | 6 | % | ||||||||||||||||||
| Continuing operations |
13,371 | 15,914 | 18,326 | 1,292 | 1,719 | 1,561 | 27,238 | 26,509 | 26,379 | |||||||||||||||||||||||||||
| Assets held for sale |
— | — | — | — | — | — | 187 | 141 | 68 | |||||||||||||||||||||||||||
| Eliminations |
(702 | ) | (1,535 | ) | (2,749 | ) | — | — | — | — | — | — | ||||||||||||||||||||||||
|
|
|
|
|
|
|
|
|
|
|
|
|
|
|
|
|
|
|
|||||||||||||||||||
| Consolidated information |
12,669 | 14,379 | 15,577 | 1,292 | 1,719 | 1,561 | 27,425 | 26,650 | 26,447 | |||||||||||||||||||||||||||
|
|
|
|
|
|
|
|
|
|
|
|
|
|
|
|
|
|
|
|||||||||||||||||||
| (1) | Percentages by reporting segment are determined from continuing operations before eliminations resulting from consolidation. |
| (2) | Percentages by reporting segment are determined from continuing operations after eliminations resulting from consolidation. |
Critical Accounting Estimates
The preparation of financial statements in accordance with IFRS requires our management to make estimates and assumptions that affect the reported amounts of assets and liabilities and the disclosure of
149
Table of Contents
contingent assets and liabilities at the date of the financial statements, as well as the reported amounts of revenues and expenses during the period. These assumptions are reviewed on an ongoing basis using available information. Actual results could differ from these estimates.
The main items subject to significant estimates and assumptions by our management include lease accounting, impairment tests of long-lived assets, recognition of deferred income tax assets, the measurement of financial instruments at fair value, the assets and liabilities related to employee benefits, as well as the analyses of contingent liabilities. Significant judgment by our management is required to appropriately assess the amounts of these assets and liabilities.
As of December 31, 2021 and 2022, and for the years ended December 31, 2020, 2021 and 2022, identified below are the accounting policies we have applied under IFRS that are critical to understanding our overall financial reporting.
Deferred Income Taxes
Our operations are subject to taxation in many different jurisdictions throughout the world. The effects reflected in the statement of operations for income taxes include the amounts incurred during the period and the amounts of deferred income taxes, determined according to the income tax law applicable to each subsidiary, reflecting uncertainty in income tax treatments, if any. Consolidated deferred income taxes represent the addition of the amounts determined in each subsidiary by applying the enacted statutory income tax rate to the total temporary differences resulting from comparing the book and taxable values of assets and liabilities, considering tax loss carryforwards and other recoverable tax credits, to the extent that it is probable that future taxable profits will be available against which they can be utilized. The measurement of deferred income taxes at the reporting period reflects the tax consequences that follow the manner in which we expect to recover or settle the carrying amount of its assets and liabilities. Deferred income taxes for the period represent the difference between balances of deferred income taxes at the beginning and the end of the period. Deferred income tax assets and liabilities relating to different tax jurisdictions are not offset. According to IFRS, all items charged or credited directly in stockholders’ equity or as part of other comprehensive income or loss for the period are recognized net of their current and deferred income tax effects. The effect of a change in enacted statutory tax rates is recognized in the period in which the change is officially enacted. Our worldwide tax position is highly complex and subject to numerous laws that require interpretation and application and that are not consistent among the countries in which we operate. Significant judgment is required to appropriately assess the amounts of tax assets and liabilities.
Deferred tax assets, mainly related to tax loss carryforwards, are reviewed at each reporting date and are reduced when it is not deemed probable that the related tax benefit will be realized, considering the aggregate amount of self-determined tax loss carryforwards that we believe will not be rejected by the tax authorities based on available evidence and the likelihood of recovering them prior to their expiration through an analysis of estimated future taxable income. If it is probable that the tax authorities would reject a self-determined deferred tax asset, we would decrease such asset. When it is considered that a deferred tax asset will not be recovered before its expiration, we would not recognize such deferred tax asset. Both situations would result in additional income tax expense for the period in which such determination is made. In order to determine whether it is probable that deferred tax assets will ultimately be recovered, we take into consideration all available positive and negative evidence, including factors such as market conditions, industry analysis, expansion plans, projected taxable income, carryforward periods, current tax structure, potential changes or adjustments in tax structure, tax planning strategies and future reversals of existing temporary differences. Likewise, we analyze our actual results versus our estimates, and adjust, as necessary, our tax asset valuations. If actual results vary from our estimates, the deferred tax asset and/or valuations may be affected, in which case, necessary adjustments will be made based on relevant information in our statement of operations for such period.
Based on IFRIC 23, Uncertainty over income tax treatments, the income tax effects from an uncertain tax position are recognized when it is probable that the position will be sustained based on its technical merits and
150
Table of Contents
assuming that the tax authorities will examine each position and have full knowledge of all relevant information. The probability of each position has been considered on its own, regardless of its relation to any other broader tax settlement. The probability threshold represents a positive assertion by management that we are entitled to the economic benefits of a tax position. If it is improbable for a tax position to be sustained, no benefits of the position are recognized. Our policy is to recognize interest and penalties related to unrecognized tax benefits as part of the income tax in the consolidated statements of operations.
Our overall tax strategy is to structure our worldwide operations to reduce or defer the payment of income taxes on a consolidated basis. Many of the activities we undertake in pursuing this tax reduction strategy are highly complex and involve interpretations of tax laws and regulations in multiple jurisdictions and are subject to review by the relevant taxing authorities. It is possible that the taxing authorities could challenge our application of these regulations to our operations and transactions. The taxing authorities in the past have challenged interpretations that we have made and have assessed additional taxes. Although we have, from time to time, paid some of these additional assessments, in general, we believe that these assessments have not been material and that we have been successful in sustaining our positions. No assurance can be given, however, that we will continue to be as successful as we have been in the past or that pending appeals of current tax assessments will be judged in our favor.
Our current and deferred income tax amounts included in our consolidated statements of operations are highly variable and are subject, among other factors, to the amounts of taxable income determined in each jurisdiction in which we operate. Such amounts of taxable income depend on factors such as sale volumes and prices, costs and expenses, exchange rates fluctuations and interest on debt, among others, as well as on the estimated tax assets at the end of the period due to the expected future generation of taxable gains in each jurisdiction. See our discussion of operations included in “—Operating and Financial Review and Prospects.”
Financial instruments
Financial assets are classified as “Held to collect” and measured at amortized cost when they are not designated as at fair value through profit or loss and meet both of the following conditions: (a) are held within a business model whose objective is to hold assets to collect contractual cash flows and (b) its contractual terms give rise on specified dates to cash flows that are solely payments of principal and interest on the principal amount outstanding. Amortized cost represents the net present value of the consideration receivable or payable as of the transaction date. This classification of financial assets comprises the following captions:
| • | Cash and cash equivalents; |
| • | Trade receivables, other current accounts receivable and other current assets. Due to their short-term nature, we initially recognize these assets at the original invoiced or transaction amount minus expected credit losses, as explained below; |
| • | Trade receivables sold under securitization programs, in which certain residual interest in the trade receivables sold in case of recovery failure and continued involvement in such assets is maintained, do not qualify for derecognition and are maintained in the statement of financial position; and |
| • | Investments and non-current accounts receivable. Subsequent changes in effects from amortized cost are recognized in the income statement as part of “Financial income and other items, net.” |
Certain strategic investments are measured at fair value through other comprehensive income within “Other equity reserves.” We do not maintain financial assets “Held to collect and sell” whose business model has the objective the collection of contractual cash flows and the sale of those financial assets.
The financial assets that are not classified as “Held to collect” or that do not have strategic characteristics fall into the residual category of held at fair value through the income statement as part of “Financial income and other items, net.”
151
Table of Contents
Debt instruments and other financial obligations are classified as “Loans” and measured at amortized cost. Interest accrued on financial instruments is recognized within “Other accounts payable and accrued expenses” against financial expense. During the reported periods, we did not have financial liabilities voluntarily recognized at fair value or associated with fair value hedge strategies with derivative financial instruments.
Derivative financial instruments are recognized as assets or liabilities in the statement of financial position at their estimated fair values, and the changes in such fair values are recognized in the income statement within “Financial income and other items, net” for the period in which they occur, except in the case of hedging instruments as described below.
(a) Derivative financial instruments
In compliance with the guidelines established by our Risk Management Committee and the restrictions in our debt agreements and our hedging strategy, we use derivative financial instruments with the objectives of: (i) changing the risk profile or fixing the price of fuels; (ii) foreign exchange hedging; (iii) hedging forecasted transactions; (iv) changing the risk of changes in market interest rates; and (v) accomplishing other corporate objectives.
Derivative financial instruments are recognized as assets or liabilities in the balance sheet at their estimated fair values, and changes in such fair values are recognized in the statements of operations within “Financial income and other items, net” for the period in which they occur, except for changes in the fair value of derivative instruments associated with cash flow hedges, in which case, such changes in fair value are recognized in stockholders’ equity, and are reclassified to earnings as the interest expense of the related debt is accrued, in the case of interest rate swaps, or when the underlying products are consumed in the case of contracts on the price of raw materials, fuel and commodities. Likewise, in hedges of the net investment in foreign subsidiaries, changes in fair value are recognized in stockholders’ equity as part of the foreign currency translation result, which reversal to earnings would take place upon disposal of the foreign investment. During the reported periods, we have not designated any derivative instruments in fair value hedges. Derivative instruments are negotiated with institutions with significant financial capacity; therefore, we believe the risk of non-performance of the obligations agreed to by such counterparties to be minimal. See note 17.4 to Cemex, S.A.B. de C.V.’s 2022 audited consolidated financial statements included herein.
The estimated fair value under IFRS represents the price that would be received to sell an asset or paid to transfer a liability in an orderly transaction between market participants at the measurement date, considering the counterparty’s credit risk in the valuation, that is, an exit price or a market-based measurement.
In connection with hedge accounting under IFRS 9, Financial Instruments: classification and measurement (“IFRS 9”), among other changes, there is a relief for entities in performing: (a) the retrospective effectiveness test at inception of the hedging relationship and (b) the requirement to maintain a prospective effectiveness ratio between 0.8 and 1.25 at each reporting date for purposes of sustaining the hedging designation, both requirements under International Accounting Standard (“IAS”) 39, Financial instruments: recognition and measurement (“IAS 39”). Under IFRS 9, a hedging relationship can be established to the extent the entity considers, based on the analysis of the overall characteristics of the hedging and hedged items, that the hedge will be highly effective in the future and the hedge relationship at inception is aligned with the entity’s reported risk management strategy. IFRS 9 maintains the same hedge accounting categories of cash flow hedge, fair value hedge and hedge of a net investment established in IAS 39, as well as the requirement of recognizing the ineffective portion of a cash flow hedge immediately in the statement of operations.
The concept of exit value is premised on the existence of a market and market participants for the specific asset or liability. When there is no market and/or market participants willing to make a market, IFRS establishes a fair value hierarchy that prioritizes the inputs to valuation techniques used to measure fair value. The hierarchy gives the highest priority to unadjusted quoted prices in active markets for identical assets or liabilities (Level 1,
152
Table of Contents
as defined below, measurements) and the lowest priority to measurements involving significant unobservable inputs (Level 3, as defined below, measurements). The three levels of the fair value hierarchy are as follows:
| • | Level 1—represents quoted prices (unadjusted) in active markets for identical assets or liabilities that we can access at the measurement date. A quoted price in an active market provides the most reliable evidence of fair value and is used without adjustment to measure fair value whenever available. |
| • | Level 2—are inputs other than quoted prices in active markets that are observable for the asset or liability, either directly or indirectly, and are used mainly to determine the fair value of securities, investments or loans that are not actively traded. Level 2 inputs included equity prices, certain interest rates and yield curves, implied volatility and credit spreads, among others, as well as inputs extrapolated from other observable inputs. In the absence of Level 1 inputs, we determined fair values by iteration of the applicable Level 2 inputs, the number of securities and/or the other relevant terms of the contract, as applicable. |
| • | Level 3—inputs are unobservable inputs for the asset or liability. We use unobservable inputs to determine fair values, to the extent there are no Level 1 or Level 2 inputs, in valuation models such as Black-Scholes, binomial, discounted cash flows or multiples of Operating EBITDA, including risk assumptions consistent with what market participants would use to arrive at fair value. |
Critical judgment and estimates by management are required to appropriately identify the corresponding level of fair value applicable to each derivative financing transaction, as well as to assess the amounts of the resulting assets and liabilities, mainly in respect of Level 2 and Level 3 fair values, in order to account for the effects of derivative financial instruments in the financial statements. See note 17.4 to Cemex, S.A.B. de C.V.’s 2022 audited consolidated financial statements included elsewhere in this annual report.
(b) Impairment of financial assets
Impairment losses of financial assets, including trade accounts receivable, are recognized using the Expected Credit Loss model (“ECL”) for the entire lifetime of such financial assets on initial recognition, and at each subsequent reporting period, even in the absence of a credit event or if a loss has not yet been incurred, considering for their measurement past events and current conditions, as well as reasonable and supportable forecasts affecting collectability. For purposes of the ECL model, we segment our accounts receivable in a matrix by country, type of client or homogeneous credit risk and days past due and determine for each segment an average rate of ECL, considering actual credit loss experience generally over the last 12 months and analyses of future delinquency, that is applied to the balance of the accounts receivable. The average ECL rate increases in each segment of days past due until the rate is 100% for the segment of 365 days or more past due.
Impairment of long-lived assets and goodwill
Our statement of financial position reflects significant amounts of long-lived assets (including property, machinery and equipment, goodwill, intangible assets of definite life and other investments) associated with our operations throughout the world. Many of these amounts have resulted from past acquisitions, which have required us to reflect these assets at their fair market values at the dates of acquisition. According to their characteristics and the specific accounting rules related to them, we assess the recoverability of our long-lived assets at least once a year, normally during the fourth quarter, as is the case for goodwill, or whenever events or circumstances arise that we believe trigger a requirement to review such carrying values, as is the case with property, machinery and equipment and intangible assets of definite life.
Property, machinery and equipment, assets for the right-of-use, intangible assets of definite life and other investments are tested for impairment upon the occurrence of factors such as the occurrence of internal or external indicators of impairment, such as changes in our operating business model or in technology that affects the asset, as well as expectations of lower operating results for each cash generating unit, in order to determine
153
Table of Contents
whether their carrying amounts may not be recovered. In such cases, an impairment loss is recorded in the statements of operations for the period when such determination is made within “Other expenses, net.” The impairment loss of an asset results from the excess of the asset’s carrying amount over its recoverable amount, corresponding to the higher of the fair value of the asset, less costs to sell such asset, and the asset’s value in use, the latter represented by the net present value of estimated cash flows related to the use and eventual disposal of the asset.
During 2020, due to the COVID-19 pandemic, certain plants were closed. As a result of such closures, in relation to our estimated sales volumes and our ability to satisfy demand by achieving efficiencies in other operating assets, we recognized non-cash impairment losses for these assets for an aggregate amount of $306 million in 2020, of which $76 million relate to assets in the United States, mainly the North Brooksville plant, $189 million to assets in the EMEAA region, mainly the Lloseta and Gador plants in Spain and the South Ferriby plant in the United Kingdom and minor adjustments in other countries, and $39 million to assets in the SCA&C region mainly in connection with land in Puerto Rico and kiln 1 in Panama. During 2021 and 2022, we recognized non-cash impairment losses of fixed assets for an amount of $43 and $77 million, respectively, mainly in connection with reductions in estimated discounted future cash flows due to the increase in interest rates and assets held for sale. Moreover, during 2021 and 2022, there were no reversal of impairment charges of the COVID-19 pandemic related adjustments of 2020 as all related assets remain closed. Generally, for all reported periods, we conduct impairment tests on several CGUs considering certain triggering events, mainly: (a) the closing and/or reduction of operations of cement and ready-mix concrete plants resulting from adjusting the supply to current demand conditions; (b) change of operating model of certain assets or the transferring of installed capacity to more efficient plants; as well as (c) for certain equipment, remaining idle for several periods. Any resulting impairment losses are recognized within the line item of “Other expenses, net.” See note 15.1 to Cemex, S.A.B. de C.V.’s 2022 audited consolidated financial statements included elsewhere in this annual report.
During the years ended December 31, 2020, 2021 and 2022, the breakdown of impairment losses of fixed assets by country was as follows:
| For the Year Ended December 31, | ||||||||||||
| 2020 | 2021 | 2022 | ||||||||||
| (in millions of Dollars) | ||||||||||||
| United States |
$ | 76 | $ | 18 | $ | 26 | ||||||
| Spain |
135 | — | 23 | |||||||||
| Colombia |
2 | 10 | — | |||||||||
| Caribbean TCL |
— | — | 14 | |||||||||
| United Kingdom |
39 | 5 | 10 | |||||||||
| Puerto Rico |
20 | — | — | |||||||||
| Croatia |
13 | — | — | |||||||||
| Panama |
12 | — | — | |||||||||
| Others |
9 | 10 | 4 | |||||||||
|
|
|
|
|
|
|
|||||||
| $ | 306 | $ | 43 | $ | 77 | |||||||
|
|
|
|
|
|
|
|||||||
See note 15.1 to Cemex, S.A.B. de C.V.’s 2022 audited consolidated financial statements included elsewhere in this annual report.
We do not have intangible assets of indefinite life other than goodwill. As mentioned above, goodwill is tested for impairment when required due to significant adverse changes or at least once a year, during the last quarter of such year, by determining the recoverable amount of the group of CGUs to which goodwill balances have been allocated, which consists of the higher of such group of CGUs fair value, less cost to sell and its value in use, represented by the discounted amount of estimated future cash flows to be generated by such CGUs to which goodwill has been allocated. We determine discounted cash flows generally over periods of five years, plus a terminal value using risk-adjusted discount rates. If the value in use of a group of CGUs to which goodwill
154
Table of Contents
has been allocated is lower than its corresponding carrying amount, we determine the fair value of our reporting units using methodologies generally accepted in the market to determine the value of entities, such as multiples of Operating EBITDA and by reference to other market transactions, among others. We recognize an impairment loss of goodwill within other expenses, net, if the recoverable amount is lower than the net book value of the group of CGUs to which goodwill has been allocated. Impairment charges recognized on goodwill are not reversed in subsequent periods.
During 2022, as part of the mandatory impairment tests during the fourth quarter, we recognized within “Other expenses, net,” non-cash goodwill impairment losses for an aggregate amount of $365 million, of which $273 million corresponds to the operating segment in the United States and $92 million corresponds to the operating segment in Spain. See notes 7 and 16.2 to Cemex, S.A.B. de C.V.’s 2022 audited consolidated financial statements included elsewhere in this annual report. In both cases, the related book value of the operating segment exceeded the corresponding value-in-use. The impairment losses in 2022 are mainly related to the significant increase in the discount rates as compared to 2021 and the resulting significant decrease in our projected cash flows in these segments considering the global high inflationary environment, which increased the risk-free rates, and the material increase in the funding cost observed in the industry during the period. These negative effects more than offset the expected improvements in the estimated Operating EBITDA generation in both the United States and Spain.
In addition to the periodic goodwill impairment tests performed at year end 2020 and 2021, considering the negative effects on our operating results caused by the COVID-19 pandemic, as well as the high uncertainty and lack of visibility in relation to the duration and consequences in certain markets where we operate, management considered that impairment indicators occurred during the third quarter of 2021 and 2020 in our operating segments in Spain and UAE in 2021 and in the United States, Spain, Egypt and the UAE in 2020, and consequently carried out impairment analyses of goodwill as of September 30, 2021 and 2020, respectively.
As a result of these impairment analyses, in the third quarter of 2021 and 2020, we recognized within “Other expenses, net” in the statement of operations non-cash goodwill impairment losses for an amount of $440 million and $1,020 million, respectively, related, in 2021, to the operating segments in Spain of $317 million, UAE of $96 million, representing the entire goodwill allocated to UAE’s operating segment, as well as $27 million related to our information technology business, due to reorganization, and in 2020 in connection with our operating segment in the United States. See notes 7 and 16.2 to Cemex, S.A.B. de C.V.’s 2022 audited consolidated financial statements included elsewhere in this annual report. No other impairment test of goodwill as of September 30, 2021 and 2020 resulted in additional goodwill impairment losses. Moreover, we did not determine additional impairment losses in our goodwill impairment test as of December 31, 2020 and 2021 in any of the groups of CGUs to which goodwill balances have been allocated.
The impairment loss of 2021 in Spain and UAE referred, in both cases, in the aftermath of the COVID-19 pandemic, to disruptions in the supply chains that have generated increases in the estimated production and transportation costs that are considered will be sustained in the mid-term. These negative effects significantly reduced the value in use of the reporting segments in Spain and UAE as of September 30, 2021 as compared to the valuations determined as of December 31, 2020, entirely generated by reductions in the projected Operating EBITDA as a result of the aforementioned increases in costs, considering that discount rates and long-term growth rates remained unchanged, which were 7.7% and 1.5% in Spain, respectively, as well as 8.3% and 2.6% in UAE, respectively. Additionally, we recognized an impairment loss related to our information technology business due to reorganization.
The impairment loss in the United States in 2020 resulted from the high volatility, lack of visibility and reduced outlook associated with the effects of the COVID-19 pandemic which made us reduce our cash flows projections in the United States from seven to five years as well as reduce our long-term growth rate in the United States from 2.5% to 2%.
For the years ended December 31, 2020, 2021 and 2022, the reporting segments we presented in note 4.3 to our 2022 audited consolidated financial statements included elsewhere in this annual report represent our groups of CGUs to which goodwill has been allocated for purposes of testing goodwill for impairment. In arriving at this conclusion, we considered: (i) that after the acquisition, goodwill was allocated at the level of the reporting
155
Table of Contents
segment; (ii) that the operating components that comprise the reporting segment have similar economic characteristics; (iii) that the reporting segments are used by us to organize and evaluate its activities in its internal information system; (iv) the homogenous nature of the items produced and traded in each operative component, which are all used by the construction industry; (v) the vertical integration in the value chain of the products comprising each component; (vi) the type of clients, which are substantially similar in all components; (vii) the operative integration among components; and (viii) whether the compensation system of the specific country is based on the consolidated results of the reporting segment and not on the particular results of the components. In addition, the country level represents the lowest level within us at which goodwill is monitored for internal management purposes.
Significant judgment by management is required to appropriately assess the fair values and values in use of these assets. Impairment tests are significantly sensitive to, among other factors, the estimation of future prices of our products, the development of operating expenses, local and international economic trends in the construction industry, the long-term growth expectations in the different markets as well as the discount rates and the growth rates in perpetuity applied. For purposes of estimating future prices, we use, to the extent available, historical data plus the expected increase or decrease according to information issued by trusted external sources, such as national construction or cement producer chambers and/or in governmental economic expectations. Operating expenses are normally measured as a constant proportion of revenues, following past experience. However, such operating expenses are also reviewed considering external information sources in respect to inputs that behave according to international prices, such as gas and oil. We use specific pre-tax discount rates for each group of CGUs to which goodwill is allocated, which are applied to pre-tax cash flows. The discount rates are determined using the approach of the weighted average cost of capital (WACC formula). The amounts of estimated undiscounted cash flows are significantly sensitive to the growth rate in perpetuity applied. The higher the growth rate in perpetuity applied, the higher the amount obtained of undiscounted future cash flows by group of CGUs obtained. Moreover, the amounts of discounted estimated future cash flows are significantly sensitive to the weighted average cost of capital (discount rate) applied. The higher the discount rate applied, the lower the amount obtained of discounted estimated future cash flows by group of CGUs obtained. Additionally, we monitor the useful lives assigned to these long-lived assets for purposes of depreciation and amortization, when applicable. This determination is subjective and is integral to the determination of whether impairment has occurred.
Pre-tax discount rates and long-term growth rates used to determine the discounted cash flows in the group of CGUs with the main goodwill balances in 2020, 2021 and 2022 were as follows:
| Discount rates | Long-term growth rate | |||||||||||||||||||||||
| Groups of CGUs |
2020 | 2021 | 2022 | 2020 | 2021 | 2022 | ||||||||||||||||||
| United States |
7.3 | % | 7.2 | % | 9.1 | % | 2.0 | % | 2.0 | % | 2.0 | % | ||||||||||||
| Spain |
7.7 | % | 7.6 | % | 9.4 | % | 1.5 | % | 1.5 | % | 1.7 | % | ||||||||||||
| United Kingdom |
7.4 | % | 7.3 | % | 9.1 | % | 1.6 | % | 1.5 | % | 1.5 | % | ||||||||||||
| France |
7.4 | % | 7.3 | % | 9.2 | % | 1.7 | % | 1.4 | % | 1.4 | % | ||||||||||||
| Mexico |
8.3 | % | 8.4 | % | 10.3 | % | 1.1 | % | 1.0 | % | 1.1 | % | ||||||||||||
| Colombia |
8.4 | % | 8.5 | % | 10.9 | % | 2.5 | % | 3.5 | % | 3.3 | % | ||||||||||||
| United Arab Emirates |
8.3 | % | — | — | 2.6 | % | — | — | ||||||||||||||||
| Egypt |
10.2 | % | 10.7 | % | 13.6 | % | 5.6 | % | 3.0 | % | 3.0 | % | ||||||||||||
| Range of rates in other countries |
7.2% – 15.5 | % | 7.4% – 11.7 | % | 9.3% – 13.9 | % | (0.3)% – 6.5 | % | 1.7% – 6.0 | % | 1.5% – 6.0 | % | ||||||||||||
The discount rates used in our cash flows projections to determine the value in use of our operating segments as of December 31, 2022 increased as compared to 2021 by a weighted average of 2.0%, mainly considering the increase in the risk-free rate associated with us which changed from 1.82% in 2021 to 3.58% in 2022, as well as the increase in the funding cost observed in the industry which changed from 4.1% in 2021 to 6.7% in 2022, as well as the average increase of approximately 1.7% in 2022, in the cost of equity. The other variables remained relatively flat. In addition, as of December 31, 2022, we maintained certain reductions to the long-term growth rates used, mainly Mexico in 1.0% and Egypt in 2.85%.
156
Table of Contents
The discount rates used in our cash flows projections to determine the value in use of our operating segments as of December 31, 2021 changed slightly as compared to 2020 in a range of -0.1% up to 0.5%, mainly generated for the effect that significantly increases the discount rate of the weighing of debt in the calculation of the discount rates that decreased from 34.6% in 2020 to 26.9% in 2021, as well as the market risk premium which increased from 5.7% in 2020 to 5.8% in 2021. These increases were partially offset by the decrease in the risk-free rate associated with us changed from 2.2% in 2020 to 1.8% in 2021, as well by the decrease in the public comparable companies’ stock volatility (beta) that changed from 1.19 in 2020 to 1.12 in 2021. As of December 31, 2021, the funding cost observed in the industry of 4.1% remained flat against 2020, while the specific risk rates of each country experienced mixed non-significant changes in 2021 as compared to 2020 in the majority of the countries.
In addition, as preventive measure to consider the high uncertainty, volatility and reduced visibility related to the negative effects of the COVID-19 pandemic, we significantly reduced in certain countries our long-term growth rates used in their cash flows projections as of December 31, 2021 as compared to 2020 such as in Mexico in 1.0% and Egypt in 2.8%. These long-term growth rates will be revised upwards or downwards again in the future as new economic data is available.
As of December 31, 2022, except for the operating segments in the United States and Spain presented in the table below, none of the other sensitivity analyses indicated a potential impairment risk in our operating segments. We continually monitor the evolution of the group of CGUs to which goodwill has been allocated that have presented relative goodwill impairment risk in any of the reported periods and, if the relevant economic variables and the related value in use would be negatively affected, it may result in a goodwill impairment loss in the future. The table below shows the additional effects of the sensitivity analyses to the charges recognized from the changes in assumptions as of December 31, 2022.
| Operating segment |
Impairment losses recognized |
Discount rate +1% |
Long-term growth rate –1% |
|||||||||
| United States |
$ | 273 | 1,243 | 986 | ||||||||
| Spain |
92 | 59 | 47 | |||||||||
Employee benefits
The costs associated with our employees’ benefits for: (i) defined benefit pension plans and (ii) other post- employment benefits, primarily comprised of health care benefits, life insurance and seniority premiums, granted by us and/or pursuant to applicable law, are recognized as services rendered, based on actuarial estimations of the benefits’ present value with the advice of external actuaries. For certain pension plans, we have created irrevocable trust funds to cover future benefit payments (“plan assets”). These plan assets are valued at their estimated fair value at the statement of financial position date. The actuarial assumptions and accounting policy consider: (i) the use of nominal rates; (ii) a single rate is used for the determination of the expected return on plan assets and the discount of the benefits obligation to present value; (iii) a net interest is recognized on the net defined benefit liability (liability minus plan assets); and (iv) all actuarial gains and losses for the period, related to differences between the projected and real actuarial assumptions at the end of the period, as well as the difference between the expected and real return on plan assets, are recognized as part of “Other items of comprehensive income (loss), net” within stockholders’ equity.
The service cost, corresponding to the increase in the obligation for additional benefits earned by employees during the period, is recognized within operating costs and expenses. The net interest cost, resulting from the increase in obligations for changes in net present value and the change during the period in the estimated fair value of plan assets, is recognized within “Financial income and other items, net.”
The effects from modifications to the pension plans that affect the cost of past services are recognized within operating costs and expenses in the period in which such modifications become effective to the employees
157
Table of Contents
or without delay if changes are effective immediately. Likewise, the effects from curtailments and/or settlements of obligations occurring during the period, associated with events that significantly reduce the cost of future services and/or significantly reduce the population subject to pension benefits, respectively, are recognized within operating costs and expenses.
Contingent liabilities
Obligations or losses resulting from past events are recognized as liabilities in the statement of financial position only when present legal or constructive obligations exist, are probable to result in an outflow of resources and the amount can be measured reliably. We do not recognize a provision when a loss is less than probable or when it is considered probable, but it is not possible to estimate the amount of the outflow. In such cases, the entity discloses a contingent liability in the notes to the financial statements, unless the possibility of an outflow of resources is remote.
We conduct significant activities in all the countries we operate, and we are exposed to events that may create possible obligations that must be analyzed at each reporting period, in order to conclude whether we have a present obligation that could lead to an outflow of resources embodying economic benefits; or present obligations that do not meet the recognition criteria, according to IAS 37, Provisions, Contingent Liabilities and Contingent Assets.
We are involved in various legal proceedings that have arisen in the ordinary course of business. These proceedings include (1) antitrust proceedings; (2) product warranty claims; (3) claims for environmental damages; (4) indemnification claims relating to acquisitions or divestitures; (5) claims to revoke permits and/or concessions; (6) tax matters; and (7) other diverse civil, administrative, commercial and legal actions. Some of the cases require significant judgment and estimates from management to appropriately assess the likelihood of the outcomes and whether a present obligation exists. We maintain regional, country and centralized in-house legal departments which follow up on each of these cases and assist with the evaluation of the likelihood of the outcomes. In certain circumstances, external legal advice is also engaged.
We are sometimes able to make and disclose reasonable estimates of the expected loss or range of possible loss, as well as disclose any provision accrued for such loss. However, for a limited number of ongoing legal proceedings, we may not be able to make a reasonable estimate of the expected loss or range of possible loss, or may be able to do so but believe that disclosure of such information on a case-by-case basis would seriously prejudice our position in the ongoing legal proceedings or in any related settlement discussions. Accordingly, in such cases, we disclose qualitative information with respect to the nature and characteristics of the contingency but do not disclose our estimate of the range of potential loss.
Results of Operations
Selected Consolidated Financial Information
The financial data set forth below as of December 31, 2021 and 2022, and for each of the three years ended December 31, 2020, 2021 and 2022 have been derived from, and should be read in conjunction with, and are qualified in their entirety by reference to, our 2022 audited consolidated financial statements included elsewhere in this annual report.
Our 2022 audited consolidated financial statements included elsewhere in this annual report have been prepared in accordance with IFRS, which differ in significant respects from U.S. GAAP. The regulations of the SEC do not require foreign private issuers that prepare their financial statements on the basis of IFRS (as issued by the IASB) to reconcile such financial statements to U.S. GAAP.
During 2022, we reported a controlling interest net income of $858 million, which was 14% higher than 2021. This increase was driven by 8% higher revenues in 2022 compared to 2021, which was mainly due to a
158
Table of Contents
positive net contribution of price over cost although we had lower volumes of cement and significant increases in costs of sales items such as energy, fuels, raw materials and freight costs, among others, due to the global inflationary pressures resulting from the aftermath of the COVID-19 pandemic and the war in Ukraine and other factors. Our price strategy in all regions was able to offset these negative impacts. Our other expenses, net increased from an expense of $82 million in 2021 to an expense of $467 million in 2022, which was mainly due to a positive effect of $600 million in 2021 for the gain on sale of emission allowances and, during the fourth quarter of 2022, the recognition of non-cash goodwill impairment losses for an aggregate amount of $365 million, of which $273 million corresponds to our operating segment in the United States and $92 million corresponds to our operating segment in Spain. The non-cash goodwill impairment losses in 2022 were mainly related to the significant increase in the discount rates as compared to 2021 and the resulting significant decrease in our projected cash flows in these operating segments, considering the global inflationary environment, which increased the risk-free rates and the material increase in the funding costs observed in the industry during this period. These negative effects offset the expected improvements in estimated Operating EBITDA generation in both the United States and Spain.
In comparison to 2021, our financial expenses in 2022 show a decrease of 39%, which was mainly driven by a reduction in our interest expenses and gains of $104 million from debt tender offers and other market transactions reducing debt during the year. In this respect, we partially repurchased different series of our notes for an aggregate principal amount of $1,172 million. Additionally, our financial income and other items, net improve from an expense of $79 million to an income of $47 million, mainly due to a favorable foreign exchange result.
CEMEX, S.A.B. DE C.V. AND SUBSIDIARIES
Selected Consolidated Financial Information
| As of and for the Year Ended December 31, |
||||||||||||
| 2020 | 2021 | 2022 | ||||||||||
| (in millions of Dollars, except ratios and share and per share amounts) |
||||||||||||
| Statement of Operations Information: |
||||||||||||
| Revenues |
$ | 12,669 | $ | 14,379 | $ | 15,577 | ||||||
| Cost of sales(1) |
(8,586 | ) | (9,743 | ) | (10,755 | ) | ||||||
| Gross profit |
4,083 | 4,636 | 4,822 | |||||||||
| Operating expenses |
(2,791 | ) | (2,917 | ) | (3,261 | ) | ||||||
| Operating earnings before other expenses, net(2) |
1,292 | 1,719 | 1,561 | |||||||||
| Other expenses, net |
(1,763 | ) | (82 | ) | (467 | ) | ||||||
| Operating earnings (loss)(2) |
(471 | ) | 1,637 | 1,094 | ||||||||
| Financial items(3) |
(888 | ) | (737 | ) | (354 | ) | ||||||
| Share of profit of equity accounted investees |
49 | 54 | 30 | |||||||||
| Earnings (loss) before income tax |
(1,310 | ) | 954 | 770 | ||||||||
| Discontinued operations(4) |
(100 | ) | (39 | ) | 324 | |||||||
| Non-controlling interest net income |
21 | 25 | 27 | |||||||||
| Controlling interest net income (loss) |
(1,467 | ) | 753 | 858 | ||||||||
| Basic earnings (loss) per share(5)(6) |
(0.0332 | ) | 0.0171 | 0.0197 | ||||||||
| Diluted earnings (loss) per share(5)(6) |
(0.0332 | ) | 0.0168 | 0.0193 | ||||||||
| Basic earnings (loss) per share from continuing operations(5)(6) |
(0.0309 | ) | 0.0180 | 0.0123 | ||||||||
| Diluted earnings (loss) per share from continuing operations(5)(6) |
(0.0309 | ) | 0.0177 | 0.0120 | ||||||||
| Number of shares outstanding(5)(7)(8) |
44,870 | 44,853 | 44,348 | |||||||||
159
Table of Contents
| As of and for the Year Ended December 31, |
||||||||||||
| 2020 | 2021 | 2022 | ||||||||||
| (in millions of Dollars, except ratios and share and per share amounts) |
||||||||||||
| Statement of Financial Position Information: |
||||||||||||
| Cash and cash equivalents |
950 | 613 | 495 | |||||||||
| Assets held for sale and other current assets(9) |
304 | 272 | 183 | |||||||||
| Property, machinery and equipment, net and assets for the right-of-use, net(13) |
11,413 | 11,322 | 11,284 | |||||||||
| Total assets |
27,425 | 26,650 | 26,447 | |||||||||
| Current debt |
179 | 73 | 51 | |||||||||
| Non-current debt |
9,160 | 7,306 | 6,920 | |||||||||
| Liabilities directly related to assets held for sale |
6 | 39 | — | |||||||||
| Non-controlling interest and Perpetual Debentures(10) |
877 | 444 | 408 | |||||||||
| Total controlling interest |
8,075 | 9,827 | 10,501 | |||||||||
| Other Financial Information: |
||||||||||||
| Book value per share(5)(8)(11) |
0.1800 | 0.2191 | 0.2368 | |||||||||
| Operating margin before other expenses, net(14) |
10.2 | % | 12.0 | % | 10.0 | % | ||||||
| Operating EBITDA(12) |
2,397 | 2,839 | 2,681 | |||||||||
| Capital expenditures |
795 | 1,094 | 1,362 | |||||||||
| Depreciation and amortization of assets |
1,105 | 1,120 | 1,120 | |||||||||
| Cash flows provided by operating activities from continuing operations |
2,348 | 2,500 | 2,150 | |||||||||
| Basic earnings (loss) per CPO from continuing operations(5)(6) |
(0.0927 | ) | 0.0540 | 0.0369 | ||||||||
| Basic earnings (loss) per CPO(5)(6) |
(0.0996 | ) | 0.0513 | 0.0591 | ||||||||
| Total debt plus other financial obligations(13) |
11,185 | 9,157 | 8,825 | |||||||||
| (1) | Cost of sales includes depreciation, amortization and depletion of assets involved in production, expenses related to storage in production plants, freight expenses of raw materials in plants and delivery expenses of our ready-mix concrete business. Our cost of sales excludes (i) expenses related to personnel and equipment comprising our selling network and those expenses related to warehousing at the points of sale and (ii) freight expenses of finished products from our producing plants to our points of sale and from our points of sale to our customers’ locations, which are all included as part of the line item titled “Operating expenses.” |
| (2) | In the statements of operations, we include the line item titled “Operating earnings before other expenses, net” considering that is a subtotal relevant for the determination of Cemex’s “Operating EBITDA” as explained in note 2.1 to Cemex, S.A.B. de C.V.’s 2022 audited consolidated financial statements included elsewhere in this annual report. Under IFRS, while there are line items that are customarily included in the statements of operations, such as revenues, operating costs and expenses and financial revenues and expenses, among others, the inclusion of certain subtotals such as “Operating earnings before other expenses, net” and the display of such statements of operations varies significantly by industry and company according to specific needs. |
| (3) | Financial items include our financial expense and our financial income and other items, net, which includes net interest cost of pension liabilities, financial income, results from financial instruments, net (derivatives, fixed-income investments and other securities), foreign exchange results and effects of amortized cost on assets and liabilities and others, net. See notes 8.1 and 8.2 to Cemex, S.A.B. de C.V.’s 2022 audited consolidated financial statements included elsewhere in this annual report. |
| (4) | Considering the disposal of entire reporting segments as well as the sale of significant businesses, our statements of operations present as part of the single line item of “Discontinued operations,” net of income tax, the results of: (a) the digital solution business Neoris for the years ended December 31, 2020 and 2021 and for the period from January 1 to October 25, 2022; (b) the operating segment in Costa Rica and El Salvador for the years 2020, 2021 and for the period from January 1 to August 31, 2022; (c) the white cement business held for sale in Spain for the year ended December 31, 2020 and for the period from January 1 to July 9, 2021; (d) France assets related to Rhône-Alpes region for the year ended December 31, |
160
Table of Contents
| 2020 and for the period from January 1 to March 31, 2021; (e) the assets sold in the United Kingdom for the period from January 1 to August 3, 2020 and (f) Kosmos’ assets sold in the United States for the period from January 1 to March 6, 2020. See note 4.2 in Cemex, S.A.B. de C.V.’s 2022 audited consolidated financial statements included elsewhere in this annual report. |
| (5) | Cemex, S.A.B. de C.V.’s capital stock consists of Series A shares and Series B shares. Each CPO represents two Series A shares and one Series B share. As of December 31, 2022, 99.88% of Cemex, S.A.B. de C.V.’s outstanding share capital was represented by CPOs, with each ADS representing ten CPOs. During 2022, under the repurchase programs authorized at Cemex, S.A.B. de C.V.’s Ordinary General Shareholders’ Meeting held on March 25, 2021, and March 24, 2022, Cemex, S.A.B. de C.V. repurchased 220.6 million CPOs, at a weighted average price in Mexican Pesos equivalent to $0.5026 per CPO, which was equivalent to an amount of $110.9 million. The shares repurchased under such repurchase programs were proposed and subsequently approved for cancellation at the Cemex, S.A.B. de C.V. Annual Ordinary General Shareholders’ Meeting held on March 23, 2023. Thus, as of March 23, 2023, 99.73% of Cemex, S.A.B. de C.V.’s outstanding share capital was represented by CPOs, with each ADS representing ten CPOs. No CPOs were repurchased from March 25, 2021 to December 31, 2021 under the repurchase program authorized at Cemex, S.A.B. de C.V.’s Ordinary General Shareholders’ Meeting held on March 25, 2021. No shares were repurchased from March 25, 2021 to December 31, 2021. |
| (6) | Earnings per share is calculated based upon the weighted-average number of shares outstanding during the year, as described in note 23 to our 2022 audited consolidated financial statements included elsewhere in this annual report. Basic earnings per CPO is determined by multiplying the basic earnings per share for each period by three (the number of shares underlying each CPO). Basic earnings per CPO is presented solely for the convenience of the reader and does not represent a measure under IFRS. As shown in notes 4.2 and 23 to our 2022 audited consolidated financial statements included elsewhere in this annual report, and in connection with our discontinued operations mentioned above, for the year ended December 31, 2020, “Basic loss per share” and “Diluted loss per share” include ($0.0309) from “Continuing operations,” for the year ended December 31, 2021, “Basic earnings per share” and “Diluted earnings per share” include $0.0180 and $0.0177, respectively from “Continuing operations” and for the year ended December 31, 2022, “Basic earnings per share” and “Diluted earnings per share” include $0.0123 and $0.0120, respectively from “Continued operations.” In addition, for the year ended December 31, 2020, “Basic loss per share” and “Diluted loss per share” include ($0.0023) from “Discontinued operations,” for the year ended December 31, 2021, “Basic earnings per share” and “Diluted earnings per share” include ($0.0009) from “Discontinued operations” and for the year ended December 31, 2022, “Basic earnings per share” and “Diluted earnings per share” include $0.0074 and $0.0073, respectively from “Discontinued operations.” See note 23 to Cemex, S.A.B. de C.V.’s 2022 audited consolidated financial statements included elsewhere in this annual report. |
| (7) | Cemex, S.A.B. de C.V. did not declare a dividend for fiscal years 2020, 2021 and 2022. No recapitalization of retained earnings or cash dividend was proposed for Cemex, S.A.B. de C.V.’s annual ordinary general shareholders’ meeting held on March 26, 2020, March 25, 2021 and March 23, 2022. |
| (8) | Represents the weighted average number of shares diluted included in note 23 to our 2022 audited consolidated financial statements included elsewhere in this annual report. |
| (9) | In 2020, includes assets held for sale in connection with the white cement assets in Spain of $107 million. In 2021, includes assets held for sale in connection with the operating segments in Costa Rica and El Salvador for $77 million. Additionally, as for the years ended December 31, 2020, 2021 and 2022, included other assets held for sale for $80 million, $64 million and $69 million, respectively. |
| (10) | As of December 31, 2020, the line item of “Non-controlling interest and perpetual debentures” included $449 million that represents the nominal amounts of Perpetual Debentures, denominated in Dollars and Euros, issued by consolidated entities. In June 2021, Cemex redeemed all series of its outstanding Perpetual Debentures. In accordance with IFRS, these securities qualify as equity due to their perpetual nature and the option to defer the coupons. |
| (11) | Book value per share is calculated by dividing the total controlling interest by the number of shares outstanding. |
| (12) | “Operating EBITDA” equals operating earnings before other expenses, net, plus depreciation and amortization expenses. Operating EBITDA is calculated and presented because it is an indicator used by our management to review operating performance and for decision-making purposes and it is included in our Credit Agreements) as a financial indicator of our ability to internally fund capital expenditures and service |
161
Table of Contents
| or incur debt. See note 17.1 to Cemex, S.A.B. de C.V.’s 2022 audited consolidated financial statements included elsewhere in this annual report. Operating EBITDA is a non-IFRS measure and should not be considered a measure of financial performance, an alternative to cash flows or a measure of liquidity under IFRS. Our Operating EBITDA may not be comparable to similarly titled measures reported by other companies due to potential differences in the method of calculation. Operating EBITDA is reconciled below to operating earnings before other expenses, net, as reported in the statements of operations, and to cash flows provided by operating activities from continuing operations before financial expense, coupons on the 5.125% Subordinated Notes and Perpetual Debentures and income taxes, as reported in the statement of cash flows. Financial expense under IFRS does not include aggregate coupon payments of the Perpetual Debentures issued by consolidated entities and the 5.125% Subordinated Notes of $24 million in 2020, $41 million in 2021 and $54 million in 2022, as described in notes 21.2 and 21.4 to Cemex, S.A.B. de C.V.’s 2022 audited consolidated financial statements included elsewhere in this annual report. |
| (13) | From 2020 through 2022, other financial obligations include: (a) lease contracts as per IFRS 16; and (b) liabilities secured with accounts receivable. See notes 15.2 and 17.2 to Cemex, S.A.B. de C.V.’s 2022 audited consolidated financial statements included elsewhere in this annual report. |
| (14) | Operating Margin before other expenses, net is calculated by dividing Operating earnings before other expenses, net by Revenues. |
| For the Year Ended December 31, | ||||||||||||
| 2020 | 2021 | 2022 | ||||||||||
| (in millions of Dollars) | ||||||||||||
| Reconciliation of cash flows provided by operating activities from continuing operations to Operating EBITDA |
||||||||||||
| Cash flow provided by operating activities from continuing operations |
$ | 2,348 | $ | 2,500 | $ | 2,150 | ||||||
|
|
|
|
|
|
|
|||||||
| Plus/minus: |
||||||||||||
| Changes in working capital excluding income taxes |
(199 | ) | 143 | 390 | ||||||||
| Depreciation and amortization of assets |
(1,105 | ) | (1,120 | ) | (1,120 | ) | ||||||
| Other items, net |
248 | 196 | 141 | |||||||||
|
|
|
|
|
|
|
|||||||
| Operating earnings before other expenses, net |
1,292 | 1,719 | 1,561 | |||||||||
| Plus: |
||||||||||||
| Depreciation and amortization of assets |
1,105 | 1,120 | 1,120 | |||||||||
|
|
|
|
|
|
|
|||||||
| Operating EBITDA |
$ | 2,397 | $ | 2,839 | $ | 2,681 | ||||||
|
|
|
|
|
|
|
|||||||
Consolidation of Our Results of Operations
Our 2022 audited consolidated financial statements included elsewhere in this annual report include those subsidiaries in which we hold a controlling interest or which we otherwise control. Control exists, and consolidation is required, only when we have all of the following: (a) the power, directly or indirectly, to direct the relevant activities of an entity; (b) the exposure to variable returns from our involvement with such entity; and (c) the ability to use our power over such entity to affect its returns.
Investments in associates when we have significant influence, which is generally presumed with a minimum equity interest of 20% and/or joint venture arrangements, in which we and other third-party investors have joint control and have rights to the net assets of the arrangements, are accounted for by the equity method. Under the equity method, after acquisition, the investment’s original cost is adjusted for the proportional interest in the associate’s equity and earnings.
All balances and transactions between the group subsidiaries have been eliminated in consolidation.
Discontinued Operations
Considering the disposal of entire reporting segments as well as the sale of significant businesses, our statements of operations present as part of the single line item of “Discontinued operations” the results of
162
Table of Contents
operations, net of income tax, of the following transactions (as further described below): (a) Neoris operations for the years ended 2020 and 2021 and for the period from January 1 to October 25, 2022; (b) Costa Rica and El Salvador operations for the years ended December 31, 2020 and 2021 and for the period from January 1 to August 31, 2022; (c) the white cement business sold in Spain for the year ended December 31, 2020 and for the period from January 1 to July 9, 2021; (d) the France assets related to the Rhône-Alpes region for the year ended December 31, 2020 and for the period from January 1 to March 31, 2021; (e) the assets sold in the United Kingdom for the period from January 1 to August 3, 2020; and (f) Kosmos’ assets sold in the United States for the period from January 1 to March 6, 2020. As a result, the financial data for the years ended December 31, 2020 and 2021 previously reported was restated. See note 4.2 in Cemex, S.A.B. de C.V.’s 2022 audited consolidated financial statements included elsewhere in this annual report.
Acquisition of Operations
The operating results of newly acquired businesses are consolidated in our financial statements beginning on the acquisition date. Therefore, all periods presented do not include operating results corresponding to newly acquired businesses before we assumed control.
Significant Transactions
For the years ended December 31, 2020, 2021 and 2022, our consolidated results reflect the following transactions:
| • | On October 25, 2022, we created a partnership with Advent. As part of the partnership, we sold to Advent a 65% stake in Neoris for a total consideration of $119 million. While surrendering control to Advent, we retain a 34.8% stake and remain as a key strategic partner and customer of Neoris. Our retained 34.8% stake in Neoris was remeasured at fair value at the date of loss of control and is subsequently accounted for under the equity method and presented in the line item “Investments in associates and joint ventures.” Neoris’ results for the years ended December 31, 2020 and 2021 and for the period from January 1 to October 25, 2022 are reported in the statements of operations, net of income tax, in the single line item “Discontinued operations,” including a gain on sale of $117 million in 2022, net of the reclassification of foreign currency translation effects accrued in equity until the date of loss of control. |
| • | On August 31, 2022, we announced that we, through certain of our subsidiaries, concluded the sale agreed in December 2021 of our operations in Costa Rica and El Salvador to affiliates of Cementos Progreso Holdings, S.L. for a total consideration of $325 million, related to our aggregate controlling interest. The divested assets consisted of one fully integrated cement plant, one grinding station, seven ready-mix plants, one aggregate quarry, as well as one distribution center in Costa Rica and one distribution center in El Salvador. As of December 31, 2021, the assets and liabilities related to our operations in Costa Rica and El Salvador were presented in the financial statements in the line items “Assets held for sale” and “Liabilities directly related to assets held for sale.” Our operations of these assets in Costa Rica and El Salvador for the years ended December 31, 2020 and 2021 and for the period from January 1, 2022 to August 31, 2022 are reported in the statements of operations, net of income tax, as part of the single line item “Discontinued operations,” including in 2022 a gain on sale of $240 million, which includes the reclassification of foreign currency translation effects accrued in equity until the disposal date. |
| • | On December 10, 2021, through a subsidiary in Mexico, we acquired Broquers Ambiental, a sustainable waste management company for a total consideration of $13 million. Broquers Ambiental assets include a plant for solid waste treatment for its use as alternate fuel. During 2022, considering the fair values of the assets acquired and liabilities assumed, we determined goodwill of $4 million. |
| • | On July 11, 2022, through a subsidiary in Germany, we completed the acquisition of a 53% stake in the German aggregates company ProStein for a total consideration of $21 million. The investment expands |
163
Table of Contents
| our aggregates business in the region and we estimate that it increases the life of the aggregates’ reserves for our operations in Central Europe for at least the next 25 years. The majority stake in ProStein’s assets adds a full range of fine and hard aggregates to our aggregates portfolio. In addition to supplying the greater Berlin area, the additional capacity can supply several urban centers in Poland and the Czech Republic. ProStein’s assets include six active hardstone plants and six CDEW recovery sites. As of December 31, 2022, based on the preliminary valuation of the fair values of the assets acquired and liabilities assumed, we have not recorded any goodwill. |
| • | On July 9, 2021, we announced that we concluded the sale agreed in March 2019 of our white cement business, except for Mexico and the U.S., to Çimsa Çimento Sanayi Ve Ticaret A.S¸ for a total consideration of $155 million. Assets sold included our Buñol cement plant in Spain and white cement customer list. Our operations of these assets in Spain for the year ended December 31, 2020 and the period from January 1, 2021 to July 9, 2021 are reported in the statements of operations, net of income tax, as part of the single line item “Discontinued operations,” including in 2021 a loss on sale of $67 million net of the proportional allocation of goodwill of $41 million. |
| • | On March 31, 2021, we sold 24 concrete plants and one aggregates quarry in France to Holcim for an amount in Euros equivalent to $44 million. These assets were located in the Rhône-Alpes region in the Southeast of France, east of our operations in Lyon. We will retain our business in Lyon. The operations related to these assets for the year ended December 31, 2020 and the three-month period ended March 31, 2021 are presented in our statements of operations, net of income tax, as part of the single line item “Discontinued operations.” |
| • | In January 2021, one of our subsidiaries in Israel acquired two ready-mix concrete plants from Kinneret and Beton-He’Emek for an amount in shekels equivalent to $6 million. After the conclusion of the purchase price allocation to the fair values of the assets acquired and liabilities assumed of this business, we determined goodwill of $5 million. |
| • | During 2020, Cemex España made the 2020 CLH Tender Offer. As of December 31, 2022, considering the effects of the 2020 CLH Tender Offer and additionally including shares of CLH purchased by us in the secondary market, we indirectly own 95.30% of all outstanding shares of CLH (which excludes shares of CLH owned by CLH). See “Item 5—Operating and Financial Review and Prospects—Recent Developments—Recent Developments Relating to Our Business and Operations.” |
| • | On August 3, 2020, through an affiliate in the United Kingdom, we closed the sale of certain assets to Breedon for an amount in Pounds equivalent to $230 million, including $30 million of debt. The assets included 49 ready-mix plants, 28 aggregate quarries, four depots, one cement terminal, 14 asphalt plants, four concrete products operations, as well as a portion of our paving solutions business in the United Kingdom. After completion of this divestiture, we maintain a significant footprint in key operating geographies in the United Kingdom related to the production and sale of cement, ready-mix, aggregates, asphalt and paving solutions, among others. Our operations of these assets in the United Kingdom for the period from January 1 to August 3, 2020, which includes a loss on sale of $57 million net of the proportional allocation of goodwill of $47 million, are presented in our statements of operations, net of tax, as part of the single line item “Discontinued operations.” |
| • | On March 6, 2020, we concluded the sale of our U.S. affiliate Kosmos, a partnership with a subsidiary of Buzzi Unicem S.p.A. in which we held a 75% interest, to Eagle Materials Inc. for $665 million. The share of proceeds to us from this transaction was $499 million before transactional and other costs and expenses. The assets that were divested consisted of Kosmos’ cement plant in Louisville, Kentucky, as well as related assets which include seven distribution terminals and raw material reserves. The operations of these assets in the United States for the period from January 1 to March 6, 2020, which includes a gain on sale of $14 million, net of the proportional allocation of goodwill of $291 million, and are presented in our statements of operations, net of income tax, as part of the single line item “Discontinued operations.” |
| • | During the first six months of 2020, one of our subsidiaries in Israel acquired Netivei Noy from Ashtrom Industries for an amount in shekels equivalent to $33 million. After the conclusion of the |
164
Table of Contents
| purchase price allocation to the fair values of the assets acquired and liabilities assumed of this business, we determined goodwill of $2 million. |
| • | On January 29, 2020, CHP announced the results of its stock rights offering pursuant to which 8,293,831,169 common shares of CHP were issued and listed on the Philippine Stock Exchange on March 4, 2020. As of December 31, 2022, after giving effect to the stock rights offering, and other repurchased in the market over the last few years, our indirect ownership of CHP’s outstanding common shares had further increased to 77.90%. See “Item 5—Operating and Financial Review and Prospects—Recent Developments—Recent Developments Relating to Our Business and Operations.” |
See notes 4.1 and 4.2 to Cemex, S.A.B. de C.V.’s 2022 audited consolidated financial statements included elsewhere in this annual report.
Consolidated Statements of Operations Data
The following table sets forth our selected consolidated statements of operations data for each of the years ended December 31, 2020, 2021 and 2022 expressed as a percentage of revenues.
| Year Ended December 31, | ||||||||||||
| 2020 | 2021 | 2022 | ||||||||||
| Revenues |
100 | % | 100 | % | 100 | % | ||||||
| Cost of sales |
(67.8 | ) | (67.8 | ) | (69.0 | ) | ||||||
| Gross profit |
32.2 | 32.2 | 31.0 | |||||||||
| Operating expenses |
(22.0 | ) | (20.3 | ) | (20.9 | ) | ||||||
| Operating earnings before other expenses, net |
10.2 | 12.0 | 10.0 | |||||||||
| Other expenses, net |
(13.9 | ) | (0.6 | ) | (3.0 | ) | ||||||
| Operating earnings |
(3.7 | ) | 11.4 | 7.0 | ||||||||
| Financial expense |
(6.1 | ) | (4.6 | ) | (2.6 | ) | ||||||
| Financial income and other items, net |
(0.9 | ) | (0.5 | ) | 0.3 | |||||||
| Share of profit on equity accounted investees |
0.4 | 0.4 | 0.2 | |||||||||
| Earnings (loss) before income tax |
(10.3 | ) | 6.6 | 4.9 | ||||||||
| Income tax |
(0.3 | ) | (1.0 | ) | (1.3 | ) | ||||||
| Net income (loss) from continuing operations |
(10.6 | ) | 5.7 | 3.6 | ||||||||
| Discontinued operations |
(0.8 | ) | (0.3 | ) | 2.1 | |||||||
| Consolidated net income (loss) |
(11.4 | ) | 5.4 | 5.7 | ||||||||
| Non-controlling interest net income |
0.2 | 0.2 | 0.2 | |||||||||
| Controlling interest net income (loss) |
(11.6 | ) | 5.2 | 5.5 | ||||||||
Key Components of Results of Operations
Revenues
Revenues are primarily comprised of cement, ready-mix concrete, aggregates, and Urbanization Solutions, which accounted for 94%, 90% and 86% of consolidated revenues before eliminations resulting from consolidation for the years ended December 31, 2020, 2021 and 2022, respectively. We recognized revenues at a point in time or overtime in the amount of the price, before tax on sales, expected to be received for goods and services supplied because of ordinary activities, as contractual performance obligations are fulfilled, and control of goods and services passes to the customer. Revenues are decreased by any trade discounts or volume rebates granted to customers. Transactions between related parties are eliminated in consolidation. Variable consideration is recognized when it is highly probable that a significant reversal in the amount of cumulative revenue recognized for the contract will not occur and is measured using the expected value or the most likely amount method, whichever is expected to better predict the amount based on the terms and conditions of the contract.
165
Table of Contents
Cost of Sales
Cost of sales represents the production cost of goods sold, including raw materials and goods for resale, payroll related to the production phase, electricity, fuels, and other services, depreciation and amortization of assets involved in the production, maintenance, repairs and supplies, freight expenses of raw material in plants and delivery expenses of our ready-mix concrete business, among other production costs. Cost of sales does not include (i) expenses related to personnel, equipment and services involved in sales activities and storage of product at points of sales, which are included in administrative and selling expenses and (iii) freight expenses of finished products between plants and points of sale and freight expenses between points of sales and the customers’ facilities, which are included as part of distribution expenses. Administrative and selling expenses and distribution expenses are included in operating expenses. As a percentage of revenues, cost of sales represented 67.8%, 67.8% and 69.0% for the years ended December 31, 2020, 2021 and 2022, respectively.
Operating Expenses
Operating expenses comprise administrative and selling expenses and distribution and logistics expenses. Administrative expenses represent the expenses associated with personnel, services and equipment, including depreciation and amortization, related to managerial activities and back-office for our management. Sales expenses represent the expenses associated with personnel, services and equipment, including depreciation and amortization, involved specifically in sales activities. Distribution and logistics expenses refer to storage expenses at points of sales, including depreciation and amortization, freight expenses of finished products between plants and points of sale and freight expenses between points of sales and the customers’ facilities. As a percentage of revenues, operating expenses represented 22.0%, 20.3% and 20.9% for the years ended December 31, 2020, 2021 and 2022, respectively. The main operating expenses are comprised of transportation cost, payroll of personnel, depreciation and amortization of assets related to the operating expenses, as well as professional legal, accounting and advisory services and maintenance, repairs and supplies accounted for 96.2%, 96.4% and 96.1% of consolidated operating expenses for the years ended December 31, 2020, 2021 and 2022, respectively.
Other Expenses, Net
The line item Other expenses, net consists primarily of revenues and expenses not directly related to our main activities or which are of non-recurring nature, including impairment losses of long-lived assets, non-recurring sales of emission allowances, results on disposal of assets, which relates to sales of property plant and equipment, and restructuring costs, losses in connection with property damages and natural disasters and incremental costs and expenses related to COVID-19 pandemic, among others. For the years ended December 31, 2020, 2021 and 2022, Other expenses, net, amounted to $1,763 million, $82 million and $467 million, respectively. In 2020, 2021 and 2022, include impairment losses of goodwill of $1,020 million, $440 million and $365 million, respectively, and in 2020 and 2021, it included impairment losses of other intangible assets of $194 million and $53 million, respectively. As a percentage of revenues, Other expenses, net, represented 13.9%, 0.6% and 3.0% for the years ended December 31, 2020, 2021 and 2022, respectively.
Financial income and other items, net
Financial income and other items, net, includes (i) effects of amortized cost on assets and liabilities and others, net; (ii) net interest cost of pension liabilities; (iii) results from financial instruments, net; (iv) foreign exchange results, comprising foreign exchange gains and losses in connection with the effects of foreign exchange fluctuations on our assets and liabilities denominated in currencies other than the Dollar; (v) financial income, which relates to income in connection with deposits and investments; and (vi) others. As a percentage of revenues, financial income, and other items, net, represented 0.9%, 0.5% and 0.3% for the years ended December 31, 2020, 2021 and 2022, respectively.
166
Table of Contents
Income Tax
Income tax comprises current income taxes net of deferred income taxes. For the years ended December 31, 2020, 2021 and 2022, our statutory income tax rate was 30%, 30% and 30%, respectively. Our average effective tax rate equals the net amount of income tax revenue or expense divided by income or loss before income taxes, as these line items are reported in the statement of operations, was (2.7%), 14.4% and 27.1%, for the years ended December 31, 2020, 2021 and 2022, respectively. The effects reflected in the statement of operations for income taxes include the amounts incurred during the period and the amounts of deferred income taxes, determined according to the income tax law applicable to each subsidiary, reflecting uncertainty in income tax treatments. Consolidated deferred income taxes represent the addition of the amounts determined in each subsidiary by applying the enacted statutory income tax rate or substantively enacted by the end of the reporting period to the total temporary differences resulting from comparing the book and taxable values of assets and liabilities, considering tax assets such as loss carryforwards and other recoverable taxes, to the extent that it is probable that future taxable profits will be available against which they can be utilized. The measurement of deferred income taxes at the reporting period reflects the tax consequences that follow how we expect to recover or settle the carrying amount of its assets and liabilities. Deferred income taxes for the period represent the difference between balances of deferred income taxes at the beginning and the end of the period. Deferred income tax assets and liabilities relating to different tax jurisdictions are not offset. The effect of a change in enacted statutory tax rates is recognized in the period in which the change is officially enacted.
Year Ended December 31, 2022 Compared to Year Ended December 31, 2021
Summarized in the table below are the percentage (%) increases (+) and decreases (-) for the year ended December 31, 2022 compared to the year ended December 31, 2021 in our domestic cement and ready-mix concrete sales volumes, as well as export sales volumes of cement and domestic cement and ready-mix concrete average sales prices for each of our reporting segments.
Reporting segments represent the components of Cemex that engage in business activities from which we may earn revenues and incur expenses, whose operating results are regularly reviewed by the entity’s top management to make decisions about resources to be allocated to the segments and assess their performance, and for which discrete financial information is available. We operate geographically and by line of business on a regional basis. For the reported periods, the Company’s operations were organized in four geographical regions, each under the supervision of a regional president, as follows: 1) Mexico, 2) United States, 3) EMEAA and 4) SCA&C. The accounting policies applied to determine the financial information by reporting segment are consistent with those described in note 2 to our 2022 audited consolidated financial statements included elsewhere in this annual report.
As of December 31, 2022, considering similar regional and economic characteristics and/or materiality, certain countries have been aggregated and presented as single line items as follows: (i) “Rest of EMEAA” refers mainly to Cemex’s operations and activities in the Czech Republic, Croatia, Egypt and the UAE; (ii) “Rest of SCA&C” refers mainly to Cemex’s operations and activities in Puerto Rico, Nicaragua, Jamaica, the Caribbean and Guatemala, excluding the operations of TCL; and (iii) “Caribbean TCL” refers to TCL’s operations mainly in Trinidad and Tobago, Jamaica, Guyana and Barbados. The segment “Others” refers to: (1) cement trade maritime operations, (2) Cemex, S.A.B. de C.V., (3) other corporate entities and finance subsidiaries and (4) other minor subsidiaries with different lines of business.
167
Table of Contents
The table below and the other volume data presented by reporting segment in this “Item 5—Operating and Financial Review and Prospects—Results of Operations—Year Ended December 31, 2022 Compared to Year Ended December 31, 2021” section are presented before eliminations resulting from consolidation (including those shown in note 4.3 to Cemex, S.A.B. de C.V.’s 2022 audited consolidated financial statements included elsewhere in this annual report).
| Domestic Sales Volumes | Export Sales Volumes |
Average Domestic Sales Prices in Local Currency(1) |
||||||||||||||||||
| Reporting Segment |
Cement | Ready-Mix Concrete |
Cement | Cement | Ready-Mix Concrete |
|||||||||||||||
| Mexico |
-8 | % | +10 | % | +17 | % | +16 | % | +15 | % | ||||||||||
| United States |
+1 | % | FLAT | — | +16 | % | +15 | % | ||||||||||||
| EMEAA |
||||||||||||||||||||
| United Kingdom |
-5 | % | -9 | % | — | +37 | % | +30 | % | |||||||||||
| France |
— | -4 | % | — | — | +7 | % | |||||||||||||
| Germany |
+8 | % | -6 | % | -32 | % | +17 | % | +9 | % | ||||||||||
| Poland |
-4 | % | -3 | % | -13 | % | +24 | % | +22 | % | ||||||||||
| Spain |
FLAT | -3 | % | +8 | % | +30 | % | +23 | % | |||||||||||
| Philippines |
-10 | % | — | -35 | % | +9 | % | — | ||||||||||||
| Israel |
— | +4 | % | — | — | +10 | % | |||||||||||||
| Rest of EMEAA |
+8 | % | +3 | % | -34 | % | +27 | % | +22 | % | ||||||||||
| SCA&C |
||||||||||||||||||||
| Colombia |
-1 | % | +14 | % | — | +8 | % | +4 | % | |||||||||||
| Panama |
+7 | % | +44 | % | +16 | % | -4 | % | +4 | % | ||||||||||
| Caribbean TCL |
-2 | % | -35 | % | -8 | % | +13 | % | +8 | % | ||||||||||
| Dominican Republic |
-7 | % | +10 | % | -48 | % | +18 | % | +12 | % | ||||||||||
| Rest of SCA&C |
-19 | % | -33 | % | -35 | % | +13 | % | -8 | % | ||||||||||
“—” = Not Applicable
| (1) | Represents the average change in domestic cement and ready-mix concrete prices in local currency terms. For purposes of a reporting segment consisting of a region, the average prices in local currency terms for each individual country within the region are first translated into Dollar terms (except for the Rest of EMEAA segment, in which they are translated first into Euros) at the exchange rates in effect as of the end of the reporting period. Variations for a region represent the weighted average change of prices in Dollar terms (except for the Rest of EMEAA segment, in which they represent the weighted average change of prices in Euros) based on total sales volumes in the region. |
On a consolidated basis, our cement sales volumes decreased 5%, from 67.0 million tons in 2021 to 63.4 million tons in 2022, and our ready-mix concrete sales volumes increased 2%, from 49.2 million cubic meters in 2021 to 50.1 cubic meters in 2022. Our revenues increased 8%, from $14,379 million in 2021 to $15,577 million in 2022, and our operating earnings before other expenses, net decreased 9%, from $1,719 million in 2021 to $1,561 million in 2022. See the table below for a breakdown according to reporting segment.
168
Table of Contents
The following tables present selected financial information for revenues, operating earnings before other expenses, net and Operating EBITDA for each of our reporting segments for the years ended December 31, 2021 and 2022. The revenues information in the table below are presented before eliminations resulting from consolidation (including those shown in note 4.3 to Cemex, S.A.B. de C.V.’s 2022 audited consolidated financial statements included elsewhere in this annual report). Variations in revenues determined on the basis of Dollars include the appreciation or depreciation which occurred during the period between the local currencies of the countries in the regions vis-à-vis the Dollar; therefore, such variations differ substantially from those based solely on the countries’ local currencies:
| Variation in Local Currency(1) |
Approximate Currency Fluctuations |
Variation in Dollars |
Revenues For the Year Ended |
|||||||||||||||||
| Reporting Segment |
2021 | 2022 | ||||||||||||||||||
| (in millions of Dollars) | ||||||||||||||||||||
| Mexico |
+9 | % | +2 | % | +11 | % | $ | 3,466 | $ | 3,842 | ||||||||||
| United States |
+16 | % | — | +16 | % | 4,359 | 5,038 | |||||||||||||
| EMEAA |
||||||||||||||||||||
| United Kingdom |
+17 | % | -13 | % | +4 | % | 940 | 982 | ||||||||||||
| France |
+2 | % | -12 | % | -10 | % | 863 | 781 | ||||||||||||
| Germany |
+16 | % | -13 | % | +3 | % | 472 | 485 | ||||||||||||
| Poland |
+17 | % | -14 | % | +3 | % | 405 | 419 | ||||||||||||
| Spain |
+20 | % | -14 | % | +6 | % | 359 | 382 | ||||||||||||
| Philippines |
-2 | % | -9 | % | -11 | % | 424 | 379 | ||||||||||||
| Israel |
+12 | % | -5 | % | +7 | % | 785 | 840 | ||||||||||||
| Rest of EMEAA |
+29 | % | -15 | % | +14 | % | 618 | 707 | ||||||||||||
| SCA&C |
||||||||||||||||||||
| Colombia |
+11 | % | -13 | % | -2 | % | 437 | 429 | ||||||||||||
| Panama |
+23 | % | — | +23 | % | 121 | 149 | |||||||||||||
| Caribbean TCL |
+8 | % | FLAT | +8 | % | 280 | 302 | |||||||||||||
| Dominican Republic |
+12 | % | +4 | % | +16 | % | 299 | 348 | ||||||||||||
| Rest of SCA&C |
-15 | % | — | -15 | % | 465 | 394 | |||||||||||||
| Others |
+76 | % | — | +76 | % | 1,621 | 2,849 | |||||||||||||
|
|
|
|
|
|||||||||||||||||
| Revenues from continuing operations before eliminations resulting from consolidation |
+15 | % | $ | 15,914 | $ | 18,326 | ||||||||||||||
| Eliminations resulting from consolidation |
(1,535 | ) | (2,749 | ) | ||||||||||||||||
|
|
|
|
|
|||||||||||||||||
| Revenues from continuing operations |
+8 | % | $ | 14,379 | $ | 15,577 | ||||||||||||||
|
|
|
|
|
|||||||||||||||||
| Variation in Local Currency(1) |
Approximate Currency Fluctuations |
Variation in Dollars |
Operating Earnings Before Other Expenses, Net For the Year Ended December 31, |
|||||||||||||||||
| Reporting Segment |
2021 | 2022 | ||||||||||||||||||
| (in millions of Dollars) | ||||||||||||||||||||
| Mexico |
-6 | % | +2 | % | -4 | % | $ | 1,003 | $ | 961 | ||||||||||
| United States |
-2 | % | — | -2 | % | 314 | 307 | |||||||||||||
| EMEAA |
||||||||||||||||||||
| United Kingdom |
+110 | % | -22 | % | +88 | % | 72 | 135 | ||||||||||||
| France |
-68 | % | -2 | % | -70 | % | 43 | 13 | ||||||||||||
| Germany |
-64 | % | -7 | % | -71 | % | 41 | 12 | ||||||||||||
| Poland |
-1 | % | -12 | % | -13 | % | 48 | 42 | ||||||||||||
| Spain |
+38 | % | +6 | % | +44 | % | (39 | ) | (22 | ) | ||||||||||
| Philippines |
-31 | % | -5 | % | -36 | % | 74 | 47 | ||||||||||||
| Israel |
+16 | % | -20 | % | -4 | % | 69 | 66 | ||||||||||||
| Rest of EMEAA |
+123 | % | -26 | % | +97 | % | 31 | 61 | ||||||||||||
169
Table of Contents
| Variation in Local Currency(1) |
Approximate Currency Fluctuations |
Variation in Dollars |
Operating Earnings Before Other Expenses, Net For the Year Ended December 31, |
|||||||||||||||||
| Reporting Segment |
2021 | 2022 | ||||||||||||||||||
| (in millions of Dollars) | ||||||||||||||||||||
| SCA&C |
||||||||||||||||||||
| Colombia |
-31 | % | -8 | % | -39 | % | 61 | 37 | ||||||||||||
| Panama |
-20 | % | — | -20 | % | 15 | 12 | |||||||||||||
| Caribbean TCL |
+25 | % | -1 | % | +24 | % | 46 | 57 | ||||||||||||
| Dominican Republic |
Flat | +3 | % | +3 | % | 121 | 125 | |||||||||||||
| Rest of SCA&C |
-21 | % | — | -21 | % | 97 | 77 | |||||||||||||
| Others |
+33 | % | — | +33 | % | (277 | ) | (369 | ) | |||||||||||
|
|
|
|
|
|||||||||||||||||
| Operating earnings before other expenses, net from continuing operations |
-9 | % | $ | 1,719 | $ | 1,561 | ||||||||||||||
|
|
|
|
|
|||||||||||||||||
“—” = Not Applicable
| (1) | Represents the variation in local currency terms. For purposes of a reporting segment consisting of a region, the variation in local currency terms for each individual country within the region are first translated into Dollar terms (except for the Rest of EMEAA segment, in which they are translated first into Euros) at the exchange rates in effect as of the end of the reporting period. Variations for a region represent the change in Dollar terms (except for the Rest of EMEAA segment, in which they represent the change in Euros), net, in the region. |
| Operating Earnings Before Other Expenses, Net(1) For the Year Ended December 31, |
Plus: Depreciation and amortization |
Operating EBITDA(2) For the Year Ended December 31, |
||||||||||||||||||||||
| Reporting Segment |
2021 | 2022 | 2021 | 2022 | 2021 | 2022 | ||||||||||||||||||
| Mexico |
$ | 1,003 | $ | 961 | $ | 161 | $ | 172 | $ | 1,164 | $ | 1,133 | ||||||||||||
| United States |
314 | 307 | 464 | 455 | 778 | 762 | ||||||||||||||||||
| EMEAA |
||||||||||||||||||||||||
| United Kingdom |
72 | 135 | 69 | 60 | 141 | 195 | ||||||||||||||||||
| France |
43 | 13 | 50 | 50 | 93 | 63 | ||||||||||||||||||
| Germany |
41 | 12 | 28 | 28 | 69 | 40 | ||||||||||||||||||
| Poland |
48 | 42 | 25 | 22 | 73 | 64 | ||||||||||||||||||
| Spain |
(39 | ) | (22 | ) | 33 | 28 | (6 | ) | 6 | |||||||||||||||
| Philippines |
74 | 47 | 40 | 37 | 114 | 84 | ||||||||||||||||||
| Israel |
69 | 66 | 45 | 46 | 114 | 112 | ||||||||||||||||||
| Rest of EMEAA |
31 | 61 | 56 | 55 | 87 | 116 | ||||||||||||||||||
| SCA&C |
||||||||||||||||||||||||
| Colombia |
61 | 37 | 26 | 24 | 87 | 61 | ||||||||||||||||||
| Panama |
15 | 12 | 16 | 16 | 31 | 28 | ||||||||||||||||||
| Caribbean TCL |
46 | 57 | 19 | 17 | 65 | 74 | ||||||||||||||||||
| Dominican Republic |
121 | 125 | 7 | 8 | 128 | 133 | ||||||||||||||||||
| Rest of SCA&C |
97 | 77 | 13 | 13 | 110 | 90 | ||||||||||||||||||
| Others |
(277 | ) | (369 | ) | 68 | 89 | (209 | ) | (280 | ) | ||||||||||||||
|
|
|
|
|
|
|
|
|
|
|
|
|
|||||||||||||
| Continuing operations |
$ | 1,719 | $ | 1,561 | $ | 1,120 | $ | 1,120 | $ | 2,839 | $ | 2,681 | ||||||||||||
|
|
|
|
|
|
|
|
|
|
|
|
|
|||||||||||||
| (1) | We include the line item titled “Operating earnings before other expenses, net” in our Statements of Operations under IFRS considering that it is a subtotal relevant for the determination of Cemex’s “Operating EBITDA” (Operating earnings before other expenses, net plus depreciation and amortization) as described in note 2.1 to Cemex, S.A.B. de C.V.’s 2022 audited consolidated financial statements included elsewhere in this annual report. |
170
Table of Contents
| (2) | Operating EBITDA is a relevant measure used by Cemex’s management to review operating performance and for decision-making purposes, as well as an indicator used by our creditors of our ability to internally fund capital expenditures and to measure our ability to service or incur debt under our financing agreements, as described in notes 4.3 and 17 to Cemex, S.A.B. de C.V.’s 2022 audited consolidated financial statements included elsewhere in this annual report. Our Operating EBITDA is not a measure of financial performance, an alternative to cash flow or a measure of liquidity under IFRS. Moreover, Operating EBITDA may not be comparable to other similarly titled measures of other companies. |
Variances explained below in this section are based on Operating earnings before other expenses, net which are substantially the same variances as those shown in our Operating EBITDA.
Revenues. Our consolidated revenues increased 8%, from $14,379 million in 2021 to $15,577 million in 2022. The increase in our revenues was mainly attributable to the higher prices of our products in local currency across all regions and higher ready-mix and aggregates volumes. Set forth below is a quantitative and qualitative analysis of the various factors affecting our revenues on a reporting segment basis. The discussion of volume data and revenues information below is presented before eliminations resulting from consolidation as described in note 4.3 to our 2022 audited consolidated financial statements included elsewhere in this annual report.
Mexico
Our domestic cement sales volumes from our operations in Mexico decreased 8% in 2022 compared to 2021, and ready-mix concrete sales volumes increased 10% over the same period. Our revenues from our operations in Mexico represented 21% of our total revenues for the year ended December 31, 2022, in Dollar terms, before eliminations resulting from consolidation. During the year, bagged cement demand normalized from the pandemic peak related to home improvements and government social spending, as well as inflationary pressures impacting retail consumption. The country continues to experience a pickup in the formal economy, and bulk cement and ready-mix volumes benefited from nearshoring investments in border states and tourism construction. Our cement export volumes from our operations in Mexico, which represented 14% of our Mexican cement sales volumes for the year ended December 31, 2022, increased 17% in 2022 compared to 2021, mainly due to higher export volume to the United States. Of our total cement export volumes from our operations in Mexico during 2022, 92% was shipped to the United States and 8% to our SCA&C segment. Our average sales price of domestic cement from our operations in Mexico increased 16%, in Mexican Peso terms, in 2022 compared to 2021, and our average sales price of ready-mix concrete increased 15%, in Mexican Peso terms, over the same period.
The following chart indicates the breakdown of Mexico revenues by product, before others, intra sector eliminations within the segment and eliminations resulting from consolidation, as applicable for the year ended December 31, 2022:

171
Table of Contents
As a result of increases in domestic cement and ready-mix concrete sales prices, an increase in ready-mix concrete sales volumes and ready-mix concrete sales volumes, and an increase in cement exports sales, partially offset by a decrease in domestic cement sales volumes, our revenues in Mexico, in Mexican Peso terms, increased 9% in 2022 compared to 2021.
United States
Our domestic cement sales volumes from our operations in the United States increased 1% in 2022 compared to 2021, and ready-mix concrete sales volumes remained flat over the same period. The increase in domestic cement sales volumes were primarily attributable to strong demand momentum in a largely sold-out domestic market. Our operations in the United States represented 27% of our total revenues for the year ended December 31, 2022, in Dollar terms, before eliminations resulting from consolidation. Our average domestic cement sales prices of our operations in the United States increased 16%, in Dollar terms, in 2022 compared to 2021, and our average ready-mix concrete sales price increased 15%, in Dollar terms, over the same period.
The following chart indicates the breakdown of United States revenues by product, before others, intra sector eliminations within the segment and eliminations resulting from consolidation, as applicable for the year ended December 31, 2022:
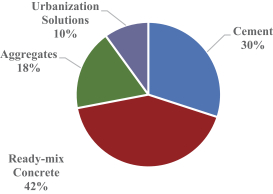
As a result of increases in domestic cement sales volumes and sales prices and ready-mix concrete sales prices, revenues from our operations in the United States, in Dollar terms, increased 16% in 2022 compared to 2021.
EMEAA
In 2022, our operations in the EMEAA region consisted of our operations in the United Kingdom, France, Germany, Poland, Spain, Philippines and Israel, which represent the most significant operations in this region, in addition to the Rest of EMEAA segment. Our revenues from our operations in the EMEAA region represented 27% of our total revenues for the year ended December 31, 2022, in Dollar terms, before eliminations resulting from consolidation. As of December 31, 2022, our operations in the EMEAA region represented 23% of our total assets in Dollar terms. Set forth below is a quantitative and qualitative analysis of the effects of the various factors affecting our revenues for our main operations in the EMEAA region.
172
Table of Contents
The following chart indicates the geographic breakdown of EMEAA region revenues by reporting segment, before others and eliminations resulting from consolidation, for the year ended December 31, 2022:
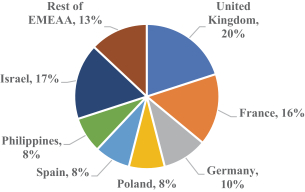
United Kingdom
Our domestic cement sales volumes from our operations in the United Kingdom decreased 5% in 2022 compared to 2021, and ready-mix concrete sales volumes decreased 9% over the same period. The decreases in domestic cement and ready-mix concrete sales volumes reflected a decline in the market activity for the second half of the year, as the United Kingdom economy weakened and suffered severe weather for the months of November and December. Our operations in the United Kingdom represented 5% of our total revenues for the year ended December 31, 2022, in Dollar terms, before eliminations resulting from consolidation. Our average sales price of domestic cement from our operations in the United Kingdom increased 37%, in Pound terms, in 2022 compared to 2021, and our average sales price of ready-mix concrete increased 30%, in Pound terms, over the same period.
The following chart indicates the breakdown of United Kingdom revenues by product, before others, intra sector eliminations within the segment and eliminations resulting from consolidation, as applicable for the year ended December 31, 2022:
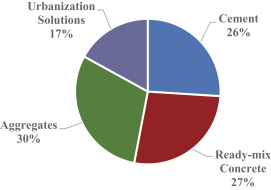
As a result of increases in domestic cement and ready-mix concrete sales prices, revenues from our operations in the United Kingdom, in Pound terms, increased 17% in 2022 compared to 2021.
France
Our ready-mix concrete sales volumes from our operations in France decreased 4% in 2022 compared to 2021. The decrease in volumes reflected a tight and dynamic supply and demand market. Our operations in
173
Table of Contents
France represented 4% of our total revenues for the year ended December 31, 2022, in Dollar terms, before eliminations resulting from consolidation. Our average sales price of ready-mix concrete of our operations in France increased 7%, in Euro terms, in 2022 compared to 2021.
The following chart indicates the breakdown of France revenues by product, before others, intra sector eliminations within the segment and eliminations resulting from consolidation, as applicable for the year ended December 31, 2022:
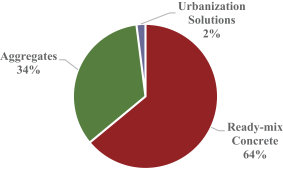
As a result of an increase in ready-mix concrete sales prices, partially offset by a decrease in ready-mix concrete sales volumes, revenues from our operations in France, in Euro terms, increased 2% in 2022 compared to 2021.
Germany
Our domestic cement sales volumes from our operations in Germany increased 8% in 2022 compared to 2021, and ready-mix concrete sales volumes decreased 6% over the same period. The increase in domestic cement sales volumes was mainly originated by an unfavorable weather condition in 2021 and the decrease in ready-mix concrete was mainly due to slowing demand in all markets. Our operations in Germany represented 3% of our total revenues for the year ended December 31, 2022, in Dollar terms, before eliminations resulting from consolidation. Our cement export volumes from our operations in Germany, which represented 20% of our Germany cement sales volumes for the year ended December 31, 2022 decreased 32% in 2022 compared to 2021, mainly due to lower volumes exported to Poland and Norway. All of our total cement export volumes from our operations in Germany during 2022 were to our EMEAA region. Our average sales price of domestic cement from our operations in Germany increased 17%, in Euro terms, in 2022 compared to 2021, and our average sales price of ready-mix concrete increased 9%, in Euro terms, over the same period.
174
Table of Contents
The following chart indicates the breakdown of Germany revenues by product, before others, intra sector eliminations within the segment and eliminations resulting from consolidation, as applicable for the year ended December 31, 2022:
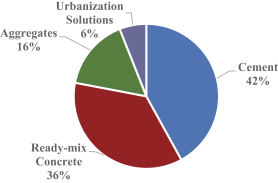
As a result of increases in domestic cement sales volumes and increases in sales prices, partially compensated by a decrease in ready-mix concrete sales volumes, revenues from our operations in Germany, in Euro terms, increased 16% in 2022 compared to 2021.
Poland
Our domestic cement sales volumes from our operations in Poland decreased 4% in 2022 compared to 2021, and ready-mix concrete sales volumes decreased 3% over the same period. The decrease in domestic cement and ready-mix concrete sales volumes were mainly due to price increases and project delays. Our operations in Poland represented 2% of our total revenues for the year ended December 31, 2022, in Dollar terms, before eliminations resulting from consolidation. Our cement export volumes from our operations in Poland, which represented 1% of our Poland cement sales volumes for the year ended December 31, 2022 decreased 13% in 2022 compared to 2021. All of our total cement export volumes from our operations in Poland during 2022, were to our Rest of EMEAA segment. Our average sales price of domestic cement from our operations in Poland increased 24%, in Euro terms, in 2022 compared to 2021, and our average sales price of ready-mix concrete increased 22%, in Euro terms, over the same period.
The following chart indicates the breakdown of Poland revenues by product, before others, intra sector eliminations within the segment and eliminations resulting from consolidation, as applicable for the year ended December 31, 2022:
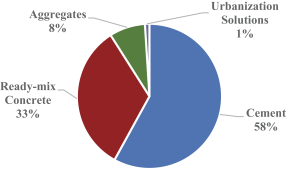
175
Table of Contents
As a result of increases in domestic cement and ready-mix concrete sales prices, partially offset by decreases in domestic cement and ready-mix concrete sales volumes, revenues from our operations in Poland, in Euro terms, increased 17% in 2022 compared to 2021.
Spain
Our domestic cement sales volumes from our operations in Spain remained flat in 2022 compared to 2021, while ready-mix concrete sales volumes decreased 3% over the same period. The decreases in ready-mix concrete sales volumes were mainly driven by lower construction activity in all regions. Our operations in Spain represented 2% of our total revenues for the year ended December 31, 2022, in Dollar terms, before eliminations resulting from consolidation. Our cement export volumes from our operations in Spain, which represented 29% of our Spain cement sales volumes for the year ended December 31, 2022, increased 8% in 2022 compared to 2021, due to higher export volumes to United Kingdom. Of our total cement export volumes from our operations in Spain during 2022, 99% were to the United Kingdom and 1% were to Rest of EMEAA region. Our average sales price of domestic cement of our operations in Spain increased 30%, in Euro terms, in 2022 compared to 2021, and our average sales price of ready-mix concrete increased 23%, in Euro terms, over the same period.
The following chart indicates the breakdown of Spain revenues by product, before others, intra sector eliminations within the segment and eliminations resulting from consolidation, as applicable for the year ended December 31, 2022:
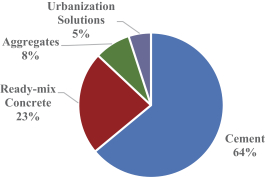
As a result of increases in domestic cement and ready-mix concrete sales prices, partially offset by a decrease in ready-mix concrete sales volume, revenues from our operations in Spain, in Euro terms, increased 20% in 2022 compared to 2021.
The Philippines
Our domestic cement sales volumes from our operations in the Philippines decreased 10% in 2022 compared to 2021. The decrease in domestic cement volumes was mainly due to public and private projects experiencing financial constraints due to the increasing cost of materials. Delays in government releasing additional funds and approvals of new public projects, as well as loss of volumes related to price increase in July. Our cement export volumes from our operations in the Philippines, which represented less than 1% of our Philippines’ cement sales volumes for the year ended December 31, 2022, decreased 35% in 2022 compared to 2021. All of our total cement exports from our operations in Philippines during 2022 were to the Rest of EMEAA segment. Our revenues from our operations in the Philippines represented 2% of our total revenues for the year ended December 31, 2022, in Dollar terms, before eliminations resulting from consolidation. Our average sales price of domestic cement from our operations in the Philippines increased 9%, in Philippine Peso terms, in 2022 compared to 2021.
176
Table of Contents
The following chart indicates the breakdown of Philippines revenues by product, before others, intra sector eliminations within the segment and eliminations resulting from consolidation, as applicable for the year ended December 31, 2022:
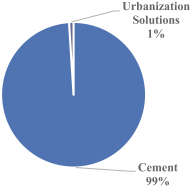
As a result of a decrease in domestic cement sales volumes, partially compensated by an increase in sales prices, revenues of our operations in the Philippines, in Philippine Peso terms, decreased 2% in 2022 compared to 2021.
Israel
Our ready-mix concrete sales volumes from our operations in Israel increased 4% in 2022 compared to 2021. Our operations in Israel represented 5% of our total revenues for the year ended December 31, 2022, in Dollar terms, before eliminations resulting from consolidation. Our average sales price of ready-mix concrete of our operations in Israel increased 10%, in Israeli New Shekel terms, in 2022 compared to 2021.
The following chart indicates the breakdown of Israel revenues by product, before others, intra sector eliminations within the segment and eliminations resulting from consolidation, as applicable for the year ended December 31, 2022:
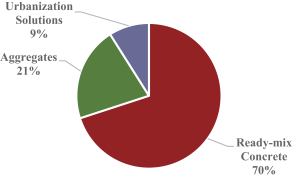
As a result of increases in ready-mix concrete sales volumes and prices, revenues from our operations in Israel, in Israeli New Shekel terms, increased 12% in 2022 compared to 2021.
Rest of EMEAA
Our domestic cement sales volumes from our operations in the Rest of EMEAA segment increased 8% in 2022 compared to 2021, and ready-mix concrete sales volumes increased 3% over the same period. Our cement
177
Table of Contents
export volumes from our operations in the Rest of EMEAA segment, which represented 6% of our Rest of EMEAA segment cement sales volumes for the year ended December 31, 2022, decreased 34% in 2022 compared to 2021. Of our total cement export volumes from our operations in the Rest of EMEAA segment during 2022, 99% were to countries in the EMEAA region and 1% were to Poland. Our revenues from our operations in the Rest of EMEAA segment represented 4% of our total revenues for the year ended December 31, 2022, in Dollar terms, before eliminations resulting from consolidation. Our average sales price of domestic cement from our operations in the Rest of EMEAA segment increased 27%, in Euro terms, in 2022 compared to 2021, and our average sales price of ready-mix concrete increased 22%, in Euro terms, over the same period.
The following chart indicates the breakdown of Rest of EMEAA revenues by product, before others, intra sector eliminations within the segment and eliminations resulting from consolidation, as applicable for the year ended December 31, 2022:
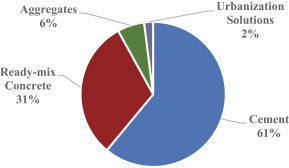
As a result of increases in domestic cement and ready-mix concrete sales volumes, as well, as increases in domestic cement and ready-mix concrete sales prices, revenues in the Rest of EMEAA segment, in Euro terms, increased 29%, in 2022 compared to 2021.
SCA&C
In 2022, our operations in the SCA&C region consisted of our operations in Colombia, Panama, the Dominican Republic, our Caribbean TCL operations, which represent our most significant operations in this region, and the Rest of SCA&C segment. Our revenues from our operations in the SCA&C region represented 9% of our total revenues for the year ended December 31, 2022, in Dollar terms, before eliminations resulting from consolidation. As of December 31, 2022, our operations in the SCA&C region represented 8% of our total assets, in Dollar terms. Set forth below is a quantitative and qualitative analysis of the effects of the various factors affecting our revenues for our main operations in the SCA&C region.
178
Table of Contents
The following chart indicates the geographic breakdown of SCA&C region revenues by reporting segment, before others and eliminations resulting from consolidation, for the year ended December 31, 2022:
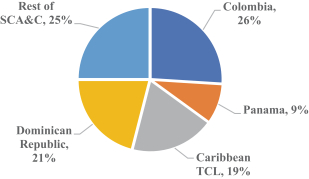
Colombia
Our domestic cement sales volumes from our operations in Colombia decreased 1% in 2022 compared to 2021, and ready-mix concrete sales volumes increased 14% over the same period. The decrease in cement sales volume in Colombia was mainly due to our prices increasing and our ready-mix concrete sales volume increasing in tandem due to the recovery of the concrete industry, mainly supported by formal sector demand, in industrial and residential. Our revenues from our operations in Colombia represented 2% of our total revenues for the year ended December 31, 2022, in Dollar terms, before eliminations resulting from consolidation. Our average sales price of domestic cement from our operations in Colombia increased 8%, in Colombian Peso terms, in 2022 compared to 2021, and our average sales price of ready-mix concrete increased 4%, in Colombian Peso terms, over the same period.
The following chart indicates the breakdown of Colombia revenues by product, before others, intra sector eliminations within the segment and eliminations resulting from consolidation, as applicable for the year ended December 31, 2022:
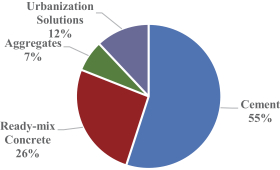
As a result of increases in ready-mix concrete sales volumes and increases in domestic cement and ready-mix concrete sales prices, partially offset by a decrease in domestic cement sales volume, revenues of our operations in Colombia, in Colombian Peso terms, increased 11% in 2022 compared to 2021.
179
Table of Contents
Panama
Our domestic cement sales volumes from our operations in Panama increased 7% in 2022 compared to 2021, and ready-mix concrete sales volumes increased 44% over the same period. The increases in domestic cement and ready-mix concrete sales volumes in Panama were mainly due to increased activity in the infrastructure sector, largely due to work related to a third metro line. Our cement export volumes from our operations in Panama, which represented 62% of our Panama cement sales volumes for the year ended December 31, 2022, increased 16% in 2022 compared to 2021. Our revenues from our operations in Panama represented 1% of our total revenues for the year ended December 31, 2022, in Dollar terms, before eliminations resulting from consolidation. Our average sales price of domestic cement from our operations in Panama decreased 4% in Dollar terms, in 2022 compared to 2021, and our average sales price of ready-mix concrete increased 4%, in Dollar terms, over the same period.
The following chart indicates the breakdown of Panama revenues by product, before others, intra sector eliminations within the segment and eliminations resulting from consolidation, as applicable for the year ended December 31, 2022:
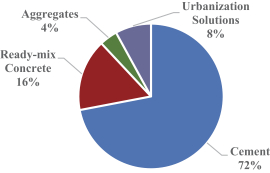
As a result of increases in domestic cement sales volumes and ready-mix concrete sales volumes and sales price, partially offset by a decrease in domestic cement sales price, revenues of our operations in Panama, in Dollar terms, increased 23% in 2022 compared to 2021.
Caribbean TCL
Our domestic cement sales volumes from our operations in Caribbean TCL decreased 2% in 2022 compared to 2021, and ready-mix concrete sales volumes decreased 35% over the same period. The decreases in cement and ready-mix sales volume came from lower demand. Our revenues from our operations in Caribbean TCL represented 2% of our total revenues for the year ended December 31, 2022, in Dollar terms, before eliminations resulting from consolidation. Our cement export volumes from our operations in Caribbean TCL segment represented 19% of our Caribbean TCL cement sales volumes for the year ended December 31, 2022, decreased 8% in 2022 compared to 2021. All of our total cement exports from our operations in Caribbean TCL during 2022 were to the Rest of SCA&C segment. Our average sales price of domestic cement of our operations in Caribbean TCL increased 13%, in Trinidad and Tobago Dollar terms, in 2022 compared to 2021, and our average sales price of ready-mix concrete increased 8%, in Trinidad and Tobago Dollar terms, over the same period.
180
Table of Contents
The following chart indicates the breakdown of Caribbean TCL revenues by product, before others, intra sector eliminations within the segment and eliminations resulting from consolidation, as applicable for the year ended December 31, 2022:
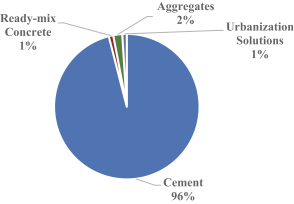
As a result of increases in domestic cement and ready-mix concrete sales prices, partially offset by decreases in domestic cement and ready-mix concrete sales volumes, revenues of our operations in Caribbean TCL, in Trinidad and Tobago Dollar terms, increased 8% in 2022 compared to 2021.
Dominican Republic
Our domestic cement sales volumes from our operations in the Dominican Republic decreased 7% in 2022 compared to 2021, while ready-mix concrete sales volumes increased 10% over the same period. The decrease in our domestic cement sales volumes in the Dominican Republic region was mainly due to a drop in retail cement demand, partially offset by higher bulk cement demand related to tourism projects. Domestic cement and ready-mix sales prices continued their positive trend. Our operations in the Dominican Republic represented 2% of our total revenues for the year ended December 31, 2022, in Dollar terms, before eliminations resulting from consolidation. Our cement export volumes from our operations in the Dominican Republic, which represented 3% of our Dominican Republic cement sales volumes for the year ended December 31, 2022, decreased 48% in 2022 compared to 2021. All of our total cement export volumes from our operations in the Dominican Republic during 2022, were to our Rest of SCA&C segment. Our average sales price of domestic cement of our operations in the Dominican Republic increased 18%, in Dominican Peso terms, in 2022 compared to 2021, and our average sales price of ready-mix concrete increased 12%, in Dominican Peso terms, over the same period.
The following chart indicates the breakdown of Dominican Republic revenues by product, before others, intra sector eliminations within the segment and eliminations resulting from consolidation, as applicable for the year ended December 31, 2022:
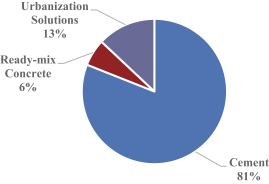
181
Table of Contents
As a result of increases in ready-mix concrete sales volume and domestic cement and ready-mix concrete sales prices, partially offset by a decrease in domestic cement sales volume, revenues from our operations in the Dominican Republic, in Dominican Peso terms, increased 12% in 2022 compared to 2021.
Rest of SCA&C
Our domestic cement volumes from our operations in the Rest of SCA&C segment decreased 19% in 2022 compared to 2021, and ready-mix concrete sales volumes decreased 33% over the same period. Our cement export volumes from our operations in the Rest of SCA&C segment, which represented less than 1% of our Rest of SCA&C segment cement sales volumes for the year ended December 31, 2022, decreased 35% in 2022 compared to 2021. All of our total cement export volumes from our operations in the Rest of SCA&C segment during 2022, were within the same region. Our revenues from our operations in the Rest of SCA&C segment represented 2% of our total revenues for the year ended December 31, 2022, in Dollar terms, before eliminations resulting from consolidation. Our average sales price of domestic cement from our operations in the Rest of SCA&C segment increased 13% in Dollar terms, in 2022 compared to 2021, and our average sales price of ready-mix concrete decreased 8%, in Dollar terms, over the same period.
The following chart indicates the breakdown of Rest of SCA&C revenues by product, before others, intra sector eliminations within the segment and eliminations resulting from consolidation, as applicable for the year ended December 31, 2022:
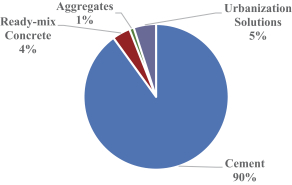
As a result of decreases in domestic cement and ready-mix concrete sales volumes and ready-mix concrete sales price, revenues of our operations in the Rest of SCA&C segment, in Dollar terms, decreased 15% in 2022 compared to 2021.
Others (Revenues)
Revenues from our Others segment increased 76% before intra-sector eliminations within the segment and before eliminations resulting from consolidation, as applicable, in 2022 compared to 2021, in Dollar terms. The increase resulted mainly from higher revenues in our trading operations. Our revenues from our Others segment represented 16% of our total revenues for the year ended December 31, 2022, in Dollar terms, before eliminations resulting from consolidation. For the year ended December 31, 2022, our trading operations represented 69% of our revenues in our Others segment, in Dollar terms.
Cost of Sales
Our cost of sales, including depreciation, increased 10%, from $9,743 million in 2021 to $10,755 million in 2022. As a percentage of revenues, cost of sales increased from 68% in 2021 to 69% in in 2022. Our cost of sales includes freight expenses of raw materials used in our producing plants.
182
Table of Contents
Gross Profit
For the reasons described above, our gross profit increased 4% from $4,636 million in 2021 to $4,822 million in 2022. As a percentage of revenues, gross profit decreased from 32% in 2021 to 31% in 2022. In addition, our gross profit may not be directly comparable to those of other entities that include all their freight expenses in cost of sales. As described below, we include freight expenses of finished products from our producing plants to our points of sale and from our points of sale to our customers’ locations within operating expenses as part of distribution and logistics expenses.
Operating expenses
Our operating expenses, which are represented by administrative, selling and distribution and logistics expenses, increased 12%, from $2,917 million in 2021 to $3,261 million in 2022. As a percentage of revenues, operating expenses increased from 20% in 2021 to 21% in 2022. The increase as a percentage of revenues resulted primarily from higher logistic and distribution expenses due to higher fuel costs. Our operating expenses include expenses related to personnel, equipment and services involved in sales activities and storage of product at points of sale, which are included as part of the operating expenses, as well as freight expenses of finished products between plants and points of sale and freight expenses between points of sale and the customers’ facilities, which are included as part of the line item “Distribution and logistics expenses.” For the years ended December 31, 2021 and 2022, selling expenses included as part of the line item “Operating expenses” amounted to $322 million and $363 million, respectively. As discussed above, we include freight expenses of finished products from our producing plants to our points of sale and from our points of sale to our customers’ locations within distribution and logistics expenses, which in the aggregate represented costs of $1,637 million in 2021 and $1,824 million in 2022. As a percentage of revenues, distribution and logistics expenses increased from 11% in 2021 to 12% in 2022.
Operating Earnings Before Other Expenses, Net
For the reasons described above, our operating earnings before other expenses, net decreased 9% from $1,719 million in 2021 to $1,561 million in 2022. As a percentage of revenues, operating earnings before other expenses, net decreased 2%, from 12% in 2021 to 10% in 2022. Additionally, set forth below is a quantitative and qualitative analysis of the effects of the various factors affecting our operating earnings before other expenses, net on a reporting segment basis.
Mexico
Our operating earnings before other expenses, net, from our operations in Mexico decreased 6% in 2022 compared to 2021, in Mexican Peso terms. Our operating earnings before other expenses, net from our operations in Mexico represented 62% of our total operating earnings before other expenses, net for the year ended December 31, 2022, in Dollar terms. The decrease resulted primarily from the increase in our cost of sales and operating expenses due to inflation, partially offset by an increase in revenues driven by home improvements and governmental social spending.
United States
Our operating earnings before other expenses, net, from our operations in the United States decreased 2% in 2022 compared to 2021, in Dollar terms. Our operating earnings before other expenses, net from our operations in the United States represented 20% of our total operating earnings before other expenses, net for the year ended December 31, 2022, in Dollar terms. The decrease resulted primarily from the increase in our cost of sales due to higher imports and higher costs of fuel and raw material, partially offset by an increase in our revenues in the United States segment.
183
Table of Contents
EMEAA
United Kingdom. Our operating earnings before other expenses, net, from our operations in the United Kingdom increased 110%, in Pound terms, in 2022 compared to 2021. Our operating earnings before other expenses, net from our operations in the United Kingdom represented 9% of our total operating earnings before other expenses, net for the year ended December 31, 2022, in Dollar terms. The increase resulted primarily from the increase in our revenues in the United Kingdom, partially offset by higher costs of sale, due to increase in imported clinker, purchase cement and higher electricity, fuel and raw material costs.
France. Our operating earnings before other expenses, net, from our operations in France decreased 68%, in Euro terms, in 2022 compared to 2021. Our operating earnings before other expenses, net from our operations in France represented 1% of our total operating earnings before other expenses, net for the year ended December 31, 2022, in Dollar terms. The decrease resulted primarily from the increase in our cost of sales, due to higher energy and raw material costs and higher distribution and logistics expenses.
Germany. Our operating earnings before other expenses, net, from our operations in Germany decreased 64%, in Euro terms, in 2022 compared to 2021. Our operating earnings before other expenses, net from our operations in Germany represented 1% of our total operating earnings before other expenses, net for the year ended December 31, 2022, in Dollar terms. The decrease resulted primarily from our cost of sales increase, mainly in energy, raw material and freight costs.
Poland. Our operating earnings before other expenses, net, from our operations in Poland decreased 1% in 2022 compared to 2021, in Euro terms. Our operating earnings before other expenses, net from our operations in Poland represented 3% of our total operating earnings before other expenses, net for the year ended December 31, 2022, in Dollar terms. The decrease resulted primarily from higher operational costs, such as energy and raw material costs, purchase clinker costs and higher freight costs due to fuel price increases.
Spain. Our operating loss before other expenses, net, from our operations in Spain decreased 38% in 2022 compared to 2021, in Euro terms. Our operating loss before other expenses, net from our operations in Spain represented a loss of $22 million, which was a negative impact of 1% of our total operating earnings before other expenses, net for the year ended December 31, 2022, in Dollar terms. The decrease resulted primarily from higher revenues due to price increases, which were partially offset by the higher cost of sales, mainly higher electric power, raw material and fuel costs.
The Philippines. Our operating earnings before other expenses, net, from our operations in the Philippines decreased 31% in 2022 compared to 2021, in Philippine Peso terms. Our operating earnings before other expenses, net from our operations in the Philippines represented 3% of our total operating earnings before other expenses, net for the year ended December 31, 2022, in Dollar terms. The decrease resulted primarily from the decrease in our revenues, as well as the higher cost of sales.
Israel. Our operating earnings before other expenses, net, from our operations in Israel increased 16% in 2022 compared to 2021, in Israeli New Shekel terms. Our operating earnings before other expenses, net from our operations in Israel represented 4% of our total operating earnings before other expenses, net for the year ended December 31, 2022, in Dollar terms. The increase in Israel operating earnings resulted primarily from the increase in our revenues.
Rest of EMEAA. Our operating earnings before other expenses, net, from our operations in the Rest of EMEAA segment increased 123% in 2022 compared to 2021, in Euro terms. Our operating earnings before other expenses, net from our operations in the Rest of EMEAA segment represented 3% of our total operating earnings before other expenses, net for the year ended December 31, 2022, in Dollar terms. This increase relates primarily to an increase in our revenues.
184
Table of Contents
SCA&C
Colombia. Our operating earnings before other expenses, net, from our operations in Colombia decreased 31% in 2022 compared to 2021, in Colombian Peso terms. Our operating earnings before other expenses, net from our operations in Colombia represented 2% of our total operating earnings before other expenses, net for the year ended December 31, 2022, in Dollar terms. The decrease resulted primarily from the increase in our cost of sales, mainly due to higher energy, fuel and raw material costs.
Panama. Our operating earnings before other expenses, net, from our operations in Panama decreased 20% in 2022 compared to 2021. Our operating earnings before other expenses, net from our operations in Panama represented 1% of our total operating earnings before other expenses, net for the year ended December 31, 2022, in Dollar terms. The decrease resulted primarily from the increase in our cost of sales, such as fuel and raw materials.
Caribbean TCL. Our operating earnings before other expenses, net, from our operations in Caribbean TCL increased 25% in 2022 compared to 2021, in Trinidad and Tobago Dollar terms. Our operating earnings before other expenses, net from our Caribbean TCL operations represented 4% of our total operating earnings before other expenses, net for the year ended December 31, 2022, in Dollar terms. The increase resulted primarily from an increase in our revenues.
Dominican Republic. Our operating earnings before other expenses, net, from our operations in the Dominican Republic remained flat in 2022 compared to 2021, in Dominican Peso terms. Our operating earnings before other expenses, net from our operations in the Dominican Republic represented 8% of our total operating earnings before other expenses, net for the year ended December 31, 2022, in Dollar terms. The increase in our revenues was offset by higher operating expenses and costs of sales.
Rest of SCA&C. Our operating earnings before other expenses, net, from our operations in the Rest of SCA&C segment decreased 21% in 2022 compared to 2021, in Dollar terms. Our operating earnings before other expenses, net from our operations in the Rest of SCA&C segment represented 5% of our total operating earnings before other expenses, net for the year ended December 31, 2022, in Dollar terms. The decrease resulted primarily from lower revenues.
Others. Our operating loss before other expenses, net, from our operations in our Others segment increased 33% in 2022 compared to 2021, in Dollar terms. The increase in the operating loss before other expenses resulted primarily from an increase in cost of sales, partially offset by higher revenues.
Other Expenses, Net. Our other expenses, net, increased significantly, in Dollar terms, from an expense of $82 million in 2021 to an expense of $467 million in 2022. The increase in our other expenses, net, in 2022 resulted primarily from an income in 2021 for the sale of 12.3 million emission allowances for a total of $600 million. In 2022, we had a reduction of non-cash impairment losses from $513 million in 2021 to $442 million in 2022. In 2022, impairment losses includes aggregate impairment losses of goodwill of $365 million related to the operating segments in the United States and Spain, as well as impairment losses of fixed assets of $77 million, while the aggregate non-cash impairment losses of 2021 included impairment losses of goodwill of $440 million related to the operating segments in Spain, the United Arab Emirates and the information technology business, impairment losses of internally developed software capitalized in prior years and other intangible assets of $53 million, as well as impairment losses of fixed assets of $43 million. Moreover, we had an increase in our restructuring cost in the year ended December 31, 2022 compared to the same period in 2021. See notes 15.1, 16.1 and 16.2 to Cemex, S.A.B. de C.V.’s 2022 audited consolidated financial statements included elsewhere in this annual report.
185
Table of Contents
The most significant items included under this caption for the years ended December 31, 2021 and 2022, are as follows:
| For the Years Ended December 31, |
||||||||
| 2021 | 2022 | |||||||
| (in millions of Dollars) | ||||||||
| Impairment losses |
$ | (513 | ) | $ | (442 | ) | ||
| Results from the sale of assets and others, net |
(126 | ) | 9 | |||||
| Incremental costs and expenses related to the COVID-19 pandemic |
(26 | ) | (14 | ) | ||||
| Restructuring costs |
(17 | ) | (20 | ) | ||||
| Sale of CO2 Allowances |
600 | — | ||||||
|
|
|
|
|
|||||
| $ | (82 | ) | $ | (467 | ) | |||
|
|
|
|
|
|||||
Financial expense. Our financial expense decreased 39%, from $658 million in 2021 to $401 million in 2022, primarily attributable to a decrease in our financial debt during 2022 compared to 2021 and gains of $104 million from debt tender offers and other market transactions reducing debt during the year. See note 17.1 to Cemex, S.A.B. de C.V.’s 2022 audited consolidated financial statements included elsewhere in this annual report.
Financial income and other items, net. Our financial income and other items, net, in Dollar terms, increased 159%, from an expense of $79 million in 2021 to an income of $47 million in 2022. The increase is mainly due to a gain in foreign exchange results in 2022 compared to a loss in 2021 that was mainly due to the fluctuation of the Mexican Peso against the Dollar and higher financial income, which was partially offset by an increase in effects of amortized cost of assets and liabilities. See notes 8.2 and 18.4 to Cemex, S.A.B. de C.V.’s 2022 audited consolidated financial statements included elsewhere in this annual report.
The most significant items included under this caption for the years ended December 31, 2021 and 2022 are as follows:
| For the Year Ended December 31, |
||||||||
| 2021 | 2022 | |||||||
| (in millions of Dollars) |
||||||||
| Financial income and other items, net: |
||||||||
| Effects of amortized cost on assets and liabilities and others, net |
$ | (28 | ) | $ | (32 | ) | ||
| Net interest cost of pension liabilities |
(25 | ) | (26 | ) | ||||
| Results from financial instruments, net |
(6 | ) | (5 | ) | ||||
| Foreign exchange results |
(35 | ) | 73 | |||||
| Financial income |
22 | 27 | ||||||
| Other |
(7 | ) | 10 | |||||
|
|
|
|
|
|||||
| $ | (79 | ) | $ | 47 | ||||
|
|
|
|
|
|||||
Income Taxes. Our income tax effect in the statements of operations, which is comprised of current income taxes plus deferred income taxes, increased from an expense of $137 million in 2021 to $209 million in 2022. Our current income tax expense decreased from $172 million in 2021 to $170 million in 2022, mainly as a result of a decrease in taxes in Spain, partially offset by increases in taxes in Colombia and the Philippines. Our deferred income tax income increased from a deferred income tax income of $35 million in 2021 to a deferred income tax expense of $39 million in 2022, mainly associated with the amortization of tax losses in Mexico and the United States in 2022. See notes 20.1, 20.2, 20.3 and 20.4 to Cemex, S.A.B. de C.V.’s 2022 audited consolidated financial statements included elsewhere in this annual report.
186
Table of Contents
For each of the years ended December 31, 2021 and 2022, our statutory income tax rate in Mexico was 30%. Considering a decrease in our earnings before income tax from a gain of $954 million in 2021 to earnings before income tax of $770 million in 2022, as well as differences between accounting and tax expenses, our average effective income tax rate increased from an effective income tax rate of 14.4% in 2021 to an effective income tax rate of 27.1% in 2022. Our average effective tax rate equals the net amount of income tax expense divided by earnings before income taxes, as these line items are reported in our consolidated statements of operations. See “Item 3—Key Information—Risk Factors—Risks Relating to Regulatory and Legal Matters—Certain tax matters may have a material adverse effect on our cash flow, financial condition and net income, as well as on our reputation” and note 20.3 to our 2022 audited consolidated financial statements included elsewhere in this annual report.
Net Income from continuing operations. For the reasons described above, our net income from continuing operations for 2022 decreased from a net income from continuing operations of $817 million in 2021 to a net income from continuing operations of $561 million in 2022. As a percentage of revenues, net income from continuing operations represented 6% for the year ended as of December 31, 2021, and a net income from continuing operations represented 4% for the year ended as of December 31, 2022.
Discontinued operations. For the years ended December 31, 2021 and 2022, our discontinued operations included in our consolidated statements of operations amounted to a net loss from discontinued operations of $39 million and a net income from discontinued operations of $324 million, respectively. As a percentage of revenues, loss of discontinued operations, net of tax, represented 0.3% for the year ended as of December 31, 2021 and the income of discontinued operations, net of tax, represented 2% for the year ended as of December 31, 2022. See note 4.2 to Cemex, S.A.B. de C.V.’s 2022 audited consolidated financial statements included elsewhere in this annual report.
Consolidated Net Income. For the reasons described above, our consolidated net income (before deducting the portion allocable to non-controlling interest) for 2022 increased from a consolidated net income of $778 million in 2021 to a consolidated net income of $885 million in 2022. As a percentage of revenues, consolidated net income represented 5% for the year ended as of December 31, 2021 and consolidated net income represented 6% for the year ended as of December 31, 2022.
Non-controlling Interest Net Income. Changes in non-controlling interest net income in any period reflect changes in the percentage of the stock of our subsidiaries held by non-associated third parties as of the end of each month during the relevant period and the consolidated net income attributable to those subsidiaries.
Non-controlling interest net income increased 8%, from an income of $25 million in 2021 to an income of $27 million in 2022, primarily attributable to an increase in the net income of the consolidated entities in which others have a non-controlling interest. See note 21.4 to Cemex, S.A.B. de C.V.’s 2022 audited consolidated financial statements included elsewhere in this annual report.
Controlling Interest Net Income. Controlling interest net income represents the difference between our consolidated net income and non-controlling interest net income, which is the portion of our consolidated net income attributable to those of our subsidiaries in which non-associated third parties hold interests. For the reasons described above, our controlling interest net income increased from a controlling interest net income of $753 million in 2021 to a controlling interest net income of $858 million in 2022. As a percentage of revenues, controlling interest net income, represented 5% for the year ended as of December 31, 2021 and controlling interest net income, represented 6% for the year ended as of December 31, 2022
Year Ended December 31, 2021 Compared to Year Ended December 31, 2020
Summarized in the table below are the percentage (%) increases (+) and decreases (-) for the year ended December 31, 2021, compared to the year ended December 31, 2020, in our domestic cement and ready-mix
187
Table of Contents
concrete sales volumes, as well as export sales volumes of cement and domestic cement and ready-mix concrete average sales prices for each of our reporting segments.
Reporting segments represent the components of Cemex that engage in business activities from which we may earn revenues and incur expenses, whose operating results are regularly reviewed by the entity’s top management to make decisions about resources to be allocated to the segments and assess their performance, and for which discrete financial information is available. We operate geographically and by line of business on a regional basis. For the reported periods, the Company’s operations were organized in four geographical regions, each under the supervision of a regional president, as follows: 1) Mexico, 2) United States, 3) EMEAA and 4) SCA&C. The accounting policies applied to determine the financial information by reporting segment are consistent with those described in note 2 to our 2022 audited consolidated financial statements included elsewhere in this annual report.
As of December 31, 2021, considering similar regional and economic characteristics and/or materiality, certain countries have been aggregated and presented as single line items as follows: (i) “Rest of EMEAA” refers mainly to Cemex’s operations and activities in the Czech Republic, Croatia, Egypt and the UAE; (ii) “Rest of SCA&C” refers mainly to Cemex’s operations and activities in Puerto Rico, Nicaragua, Jamaica, the Caribbean and Guatemala, excluding the operations of TCL; and (iii) “Caribbean TCL” refers to TCL’s operations mainly in Trinidad and Tobago, Jamaica, Guyana and Barbados. The segment “Others” refers to: (1) cement trade maritime operations, (2) Cemex, S.A.B. de C.V., (3) other corporate entities and finance subsidiaries and (4) other minor subsidiaries with different lines of business.
The table below and the other volume data presented by reporting segment in this “Item 5—Operating and Financial Review and Prospects—Results of Operations—Year Ended December 31, 2021 Compared to Year Ended December 31, 2020” section are presented before eliminations resulting from consolidation (including those shown in note 4.3 to Cemex, S.A.B. de C.V.’s 2022 audited consolidated financial statements included elsewhere in this annual report).
| Domestic Sales Volumes | Export Sales Volumes |
Average Domestic Sales Prices in Local Currency(1) |
||||||||||||||||||
| Reporting Segment |
Cement | Ready-Mix Concrete |
Cement | Cement | Ready-Mix Concrete |
|||||||||||||||
| Mexico |
+8 | % | +8 | % | -1 | % | +7 | % | +3 | % | ||||||||||
| United States |
+6 | % | +8 | % | — | +3 | % | +2 | % | |||||||||||
| EMEAA |
||||||||||||||||||||
| United Kingdom |
+19 | % | +3 | % | — | +7 | % | +7 | % | |||||||||||
| France |
— | +8 | % | — | — | +1 | % | |||||||||||||
| Germany |
-4 | % | -7 | % | +5 | % | +3 | % | +6 | % | ||||||||||
| Poland |
+5 | % | +9 | % | -54 | % | +5 | % | -1 | % | ||||||||||
| Spain |
+6 | % | +7 | % | +14 | % | -1 | % | +1 | % | ||||||||||
| Philippines |
+7 | % | — | -14 | % | -2 | % | — | ||||||||||||
| Israel |
— | FLAT | — | — | FLAT | |||||||||||||||
| Rest of EMEAA |
-11 | % | +2 | % | FLAT | +9 | % | FLAT | ||||||||||||
| SCA&C |
||||||||||||||||||||
| Colombia |
+8 | % | +11 | % | — | FLAT | +1 | % | ||||||||||||
| Panama |
+41 | % | +22 | % | >100 | % | -5 | % | -8 | % | ||||||||||
| Caribbean TCL |
+16 | % | -3 | % | -14 | % | FLAT | +1 | % | |||||||||||
| Dominican Republic |
+22 | % | -2 | % | -34 | % | +11 | % | +14 | % | ||||||||||
| Rest of SCA&C |
+9 | % | +3 | % | -42 | % | +4 | % | +17 | % | ||||||||||
“—” = Not Applicable
| (1) | Represents the average change in domestic cement and ready-mix concrete prices in local currency terms. For purposes of a reporting segment consisting of a region, the average prices in local currency terms for |
| each individual country within the region are first translated into Dollar terms (except for the Rest of EMEAA segment, in which they are translated first into Euros) at the exchange rates in effect as of the end |
188
Table of Contents
| of the reporting period. Variations for a region represent the weighted average change of prices in Dollar terms (except for the Rest of EMEAA segment, in which they represent the weighted average change of prices in Euros) based on total sales volumes in the region. |
On a consolidated basis, our cement sales volumes increased 6%, from 63.2 million tons in 2020 to 67.0 million tons in 2021, and our ready-mix concrete sales volumes increased 6%, from 46.7 million cubic meters in 2020 to 49.2 cubic meters in 2021. Our revenues increased 13% from $12,669 million in 2020 to $14,379 million in 2021, and our operating earnings before other expenses, net increased 33%, from $1,292 million in 2020 to $1,719 million in 2021. See the table below for a breakdown according to reporting segment.
The following tables present selected financial information for revenues, operating earnings before other expenses, net and Operating EBITDA for each of our reporting segments for the years ended December 31, 2020 and 2021. The revenues information in the table below are presented before eliminations resulting from consolidation (including those shown in note 4.3 to our 2022 audited consolidated financial statements included elsewhere in this annual report). Variations in revenues determined on the basis of Dollars include the appreciation or depreciation which occurred during the period between the local currencies of the countries in the regions vis-à-vis the Dollar; therefore, such variations differ substantially from those based solely on the countries’ local currencies:
| Reporting Segment |
Variation in Local Currency(1) |
Approximate Currency Fluctuations |
Variation in Dollars |
Revenues For the Year Ended |
||||||||||||||||
| 2020 | 2021 | |||||||||||||||||||
| (in millions of Dollars) | ||||||||||||||||||||
| Mexico |
+17 | % | +6 | % | +23 | % | $ | 2,812 | $ | 3,466 | ||||||||||
| United States |
+9 | % | — | +9 | % | 3,994 | 4,359 | |||||||||||||
| EMEAA |
||||||||||||||||||||
| United Kingdom |
+19 | % | +8 | % | +27 | % | 739 | 940 | ||||||||||||
| France |
+12 | % | +2 | % | +14 | % | 754 | 863 | ||||||||||||
| Germany |
-6 | % | +3 | % | -3 | % | 489 | 472 | ||||||||||||
| Poland |
+5 | % | +2 | % | +8 | % | 377 | 405 | ||||||||||||
| Spain |
+9 | % | +4 | % | +12 | % | 319 | 359 | ||||||||||||
| Philippines |
+6 | % | +1 | % | +7 | % | 398 | 424 | ||||||||||||
| Israel |
-2 | % | +6 | % | +4 | % | 754 | 785 | ||||||||||||
| Rest of EMEAA |
+3 | % | +3 | % | +6 | % | 582 | 618 | ||||||||||||
| SCA&C |
||||||||||||||||||||
| Colombia |
+11 | % | -3 | % | +8 | % | 404 | 437 | ||||||||||||
| Panama |
+51 | % | — | +51 | % | 80 | 121 | |||||||||||||
| Caribbean TCL |
+11 | % | +1 | % | +12 | % | 251 | 280 | ||||||||||||
| Dominican Republic |
+31 | % | -1 | % | +30 | % | 229 | 299 | ||||||||||||
| Rest of SCA&C |
+18 | % | — | +18 | % | 393 | 465 | |||||||||||||
| Others |
>+100 | % | — | >+100 | % | 796 | 1,621 | |||||||||||||
|
|
|
|
|
|||||||||||||||||
| Revenues from continuing operations before eliminations resulting from consolidation |
+19 | % | $ | 13,371 | $ | 15,914 | ||||||||||||||
| Eliminations resulting from consolidation |
(702 | ) | (1,535 | ) | ||||||||||||||||
|
|
|
|
|
|||||||||||||||||
| Revenues from continuing operations |
13 | % | $ | 12,669 | $ | 14,379 | ||||||||||||||
|
|
|
|
|
|
|
|||||||||||||||
189
Table of Contents
| Reporting Segment |
Variation in Local Currency(1) |
Approximate Currency Fluctuations |
Variation in Dollars |
Operating Earnings Before Other Expenses, Net For the Year Ended December 31, |
||||||||||||||||
| 2020 | 2021 | |||||||||||||||||||
| (in millions of Dollars) | ||||||||||||||||||||
| Mexico |
+22 | % | +6 | % | +28 | % | $ | 783 | $ | 1,003 | ||||||||||
| United States |
+2 | % | — | +2 | % | 307 | 314 | |||||||||||||
| EMEAA |
||||||||||||||||||||
| United Kingdom |
+230 | % | +13 | % | +243 | % | 21 | 72 | ||||||||||||
| France |
+88 | % | -1 | % | +87 | % | 23 | 43 | ||||||||||||
| Germany |
+4 | % | +1 | % | +5 | % | 39 | 41 | ||||||||||||
| Poland |
-5 | % | +3 | % | -2 | % | 49 | 48 | ||||||||||||
| Spain |
-157 | % | -22 | % | -179 | % | (14 | ) | (39 | ) | ||||||||||
| Philippines |
+2 | % | +1 | % | +3 | % | 72 | 74 | ||||||||||||
| Israel |
-35 | % | +14 | % | -21 | % | 87 | 69 | ||||||||||||
| Rest of EMEAA |
+60 | % | +3 | % | +63 | % | 19 | 31 | ||||||||||||
| SCA&C |
||||||||||||||||||||
| Colombia |
+2 | % | -2 | % | FLAT | 61 | 61 | |||||||||||||
| Panama |
+504 | % | — | +504 | % | (4 | ) | 15 | ||||||||||||
| Caribbean TCL |
+6 | % | +1 | % | +7 | % | 43 | 46 | ||||||||||||
| Dominican Republic |
+59 | % | FLAT | +59 | % | 76 | 121 | |||||||||||||
| Rest of SCA&C |
+14 | % | — | +14 | % | 85 | 97 | |||||||||||||
| Others |
+22 | % | — | +22 | % | (355 | ) | (277 | ) | |||||||||||
|
|
|
|
|
|||||||||||||||||
| Operating earnings before other expenses, net from continuing operations |
+33 | % | $ | 1,292 | $ | 1,719 | ||||||||||||||
|
|
|
|
|
|||||||||||||||||
“—” = Not Applicable
| (1) | Represents the variation in local currency terms. For purposes of a reporting segment consisting of a region, the variation in local currency terms for each individual country within the region are first translated into Dollar terms (except for the Rest of EMEAA segment, in which they are translated first into Euros) at the exchange rates in effect as of the end of the reporting period. Variations for a region represent the change in Dollar terms (except for the Rest of EMEAA segment, in which they represent the change in Euros), net, in the region. |
190
Table of Contents
| Operating Earnings Before Other Expenses, Net(1) For the Year Ended December 31, |
Plus: Depreciation and amortization |
Operating EBITDA(2) For the Year Ended December 31, |
||||||||||||||||||||||
| Reporting Segment |
2020 | 2021 | 2020 | 2021 | 2020 | 2021 | ||||||||||||||||||
| Mexico |
$ | 783 | $ | 1,003 | $ | 148 | $ | 161 | $ | 931 | $ | 1,164 | ||||||||||||
| United States |
307 | 314 | 440 | 464 | 747 | 778 | ||||||||||||||||||
| EMEAA |
||||||||||||||||||||||||
| United Kingdom |
21 | 72 | 67 | 69 | 88 | 141 | ||||||||||||||||||
| France |
23 | 43 | 48 | 50 | 71 | 93 | ||||||||||||||||||
| Germany |
39 | 41 | 28 | 28 | 67 | 69 | ||||||||||||||||||
| Poland |
49 | 48 | 25 | 25 | 74 | 73 | ||||||||||||||||||
| Spain |
(14 | ) | (39 | ) | 39 | 33 | 25 | (6 | ) | |||||||||||||||
| Philippines |
72 | 74 | 46 | 40 | 118 | 114 | ||||||||||||||||||
| Israel |
87 | 69 | 28 | 45 | 115 | 114 | ||||||||||||||||||
| Rest of EMEAA |
19 | 31 | 56 | 56 | 75 | 87 | ||||||||||||||||||
| SCA&C |
||||||||||||||||||||||||
| Colombia |
61 | 61 | 25 | 26 | 86 | 87 | ||||||||||||||||||
| Panama |
(4 | ) | 15 | 16 | 16 | 12 | 31 | |||||||||||||||||
| Caribbean TCL |
43 | 46 | 22 | 19 | 65 | 65 | ||||||||||||||||||
| Dominican Republic |
76 | 121 | 8 | 7 | 84 | 128 | ||||||||||||||||||
| Rest of SCA&C |
85 | 97 | 15 | 13 | 100 | 110 | ||||||||||||||||||
| Others |
(355 | ) | (277 | ) | 94 | 68 | (261 | ) | (209 | ) | ||||||||||||||
|
|
|
|
|
|
|
|
|
|
|
|
|
|||||||||||||
| Continuing operations |
$ | 1,292 | $ | 1,719 | $ | 1,105 | $ | 1,120 | $ | 2,397 | $ | 2,839 | ||||||||||||
|
|
|
|
|
|
|
|
|
|
|
|
|
|||||||||||||
| (1) | We include the line item titled “Operating earnings before other expenses, net” in our Statements of Operations under IFRS considering that it is a subtotal relevant for the determination of Cemex’s “Operating EBITDA” (Operating earnings before other expenses, net plus depreciation and amortization) as described in note 2.1 to Cemex, S.A.B. de C.V.’s 2022 audited consolidated financial statements included elsewhere in this annual report. |
| (2) | Operating EBITDA is a relevant measure used by Cemex’s management to review operating performance and for decision-making purposes, as well as an indicator used by our creditors of our ability to internally fund capital expenditures and to measure our ability to service or incur debt under our financing agreements, as described in notes 4.3 and 17 to Cemex, S.A.B. de C.V.’s 2022 audited consolidated financial statements included elsewhere in this annual report. Our Operating EBITDA is not a measure of financial performance, an alternative to cash flow or a measure of liquidity under IFRS. Moreover, Operating EBITDA may not be comparable to other similarly titled measures of other companies. |
Variances explained below in this section are based on Operating earnings before other expenses, net which are substantially the same variances as those shown in our Operating EBITDA.
Revenues. Our consolidated revenues increased 13% from $12,669 million in 2020 to $14,379 million in 2021. The increase in our revenues was mainly attributable to the higher volumes in most of our regions and higher prices of our products in local currency terms in all of our regions. Set forth below is a quantitative and qualitative analysis of the various factors affecting our revenues on a reporting segment basis. The discussion of volume data and revenues information below is presented before eliminations resulting from consolidation as described in note 4.3 to our 2022 audited consolidated financial statements included elsewhere in this annual report.
Mexico
Our domestic cement sales volumes from our operations in Mexico increased 8% in 2021 compared to 2020, and ready-mix concrete sales volumes increased 8% over the same period. Our revenues from our operations in
191
Table of Contents
Mexico represented 22% of our total revenues for the year ended December 31, 2021, in Dollar terms, before eliminations resulting from consolidation. During the year, bagged cement demand grew double digits supported by government social programs and record level remittances. The country continues to experience a pickup in the formal economy, and bulk cement and ready-mix volumes benefitted from higher formal housing and industrial activity. The latter was supported by growth in manufacturing and warehouses, onshoring, as well as the buildout of logistic networks. Our cement export volumes from our operations in Mexico, which represented 11% of our Mexican cement sales volumes for the year ended December 31, 2021, decreased 1% in 2021 compared to 2020, due to lower export volume. Of our total cement export volumes from our operations in Mexico during 2021, 83% was shipped to the United States and 17% to our SCA&C segment. Our average sales price of domestic cement from our operations in Mexico increased 7%, in Mexican Peso terms, in 2021 compared to 2020, and our average sales price of ready-mix concrete increased 3%, in Mexican Peso terms, over the same period.
The following chart indicates the breakdown of Mexico revenues by product, before others, intra sector eliminations within the segment and eliminations resulting from consolidation, as applicable for the year ended December 31, 2021:
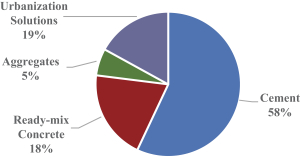
As a result of increases in domestic cement and ready-mix concrete sales volumes and sale prices, partially offset by a decrease in cement export sales, our revenues in Mexico, in Mexican Peso terms, increased 17% in 2021 compared to 2020.
United States
Our domestic cement sales volumes from our operations in the United States increased 6% in 2021 compared to 2020, and ready-mix concrete sales volumes increased 8% over the same period. The increase in domestic cement and ready-mix concrete sales volumes were primarily attributable to the strong demand momentum driven mainly by the residential sector. The region continued to enjoy strong demand across all products with most of our markets sold out. Our operations in the United States represented 27% of our total revenues for the year ended December 31, 2021, in Dollar terms, before eliminations resulting from consolidation. Our average domestic cement sales prices of our operations in the United States increased 3%, in Dollar terms, in 2021 compared to 2020, and our average ready-mix concrete sales price increased 2%, in Dollar terms, over the same period.
192
Table of Contents
The following chart indicates the breakdown of United States revenues by product, before others, intra sector eliminations within the segment and eliminations resulting from consolidation, as applicable for the year ended December 31, 2021:
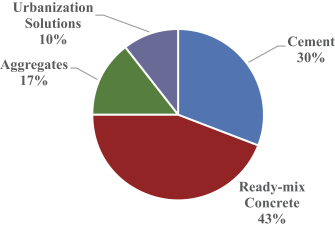
As a result of increases in domestic cement sales volumes and ready-mix concrete sales volumes and sales prices, revenues from our operations in the United States, in Dollar terms, increased 9% in 2021 compared to 2020.
EMEAA
In 2021, our operations in the EMEAA region consisted of our operations in the United Kingdom, France, Germany, Poland, Spain, Philippines and Israel, which represent the most significant operations in this region, in addition to the Rest of EMEAA segment. Our revenues from our operations in the EMEAA region represented 31% of our total revenues for the year ended December 31, 2021, in Dollar terms, before eliminations resulting from consolidation. As of December 31, 2021, our operations in the EMEAA region represented 25% of our total assets, in Dollar terms. Set forth below is a quantitative and qualitative analysis of the effects of the various factors affecting our revenues for our main operations in the EMEAA region.
The following chart indicates the geographic breakdown of EMEAA region revenues by reporting segment, before others and eliminations resulting from consolidation, for the year ended December 31, 2021:
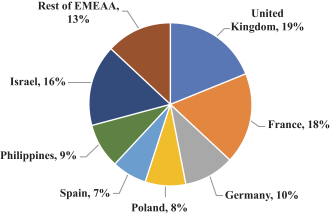
193
Table of Contents
United Kingdom
Our domestic cement sales volumes from our operations in the United Kingdom increased 19% in 2021 compared to 2020, and ready-mix concrete sales volumes increased 3% over the same period. The increases in domestic cement and ready-mix concrete sales volumes reflected a return to normality in construction activity as a result of the implementation of stringent measures during 2020 as a response to the COVID-19 pandemic. Our operations in the United Kingdom represented 6% of our total revenues for the year ended December 31, 2021, in Dollar terms, before eliminations resulting from consolidation. Our average sales price of domestic cement from our operations in the United Kingdom increased 7% in Pound terms, in 2021 compared to 2020, and our average sales price of ready-mix concrete increased 7%, in Pound terms, over the same period.
The following chart indicates the breakdown of United Kingdom revenues by product, before others, intra sector eliminations within the segment and eliminations resulting from consolidation, as applicable for the year ended December 31, 2021:
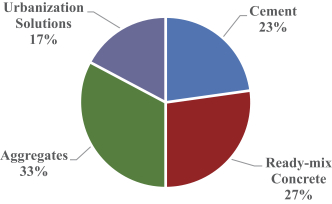
As a result of increases in domestic cement and ready-mix concrete sales volumes and sales prices, revenues from our operations in the United Kingdom, in Pound terms, increased 19% in 2021 compared to 2020.
France
Our ready-mix concrete sales volumes from our operations in France increased 8% in 2021 compared to 2020. The increase in volumes reflected a return to normality in construction activity as a result of the implementation of stringent measures during 2020 as a response to the COVID-19 pandemic. Our operations in France represented 5% of our total revenues for the year ended December 31, 2021, in Dollar terms, before eliminations resulting from consolidation. Our average sales price of ready-mix concrete of our operations in France increased 1%, in Euro terms, in 2021 compared to 2020.
194
Table of Contents
The following chart indicates the breakdown of France revenues by product, before others, intra sector eliminations within the segment and eliminations resulting from consolidation, as applicable for the year ended December 31, 2021:
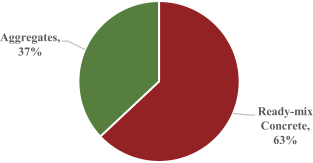
As a result of an increase in ready-mix concrete sales volumes and by increases in ready-mix concrete sales prices, revenues from our operations in France, in Euro terms, increased 12% in 2021 compared to 2020.
Germany
Our domestic cement sales volumes from our operations in Germany decreased 4% in 2021 compared to 2020, and ready-mix concrete sales volumes decreased 7% over the same period. The decreases in domestic cement and ready-mix concrete sales volumes was mainly originated by unfavorable weather condition in 2021. Our operations in Germany represented 3% of our total revenues for the year ended December 31, 2021, in Dollar terms, before eliminations resulting from consolidation. Our cement export volumes from our operations in Germany, which represented 31% of our Germany cement sales volumes for the year ended December 31, 2021 increased 5% in 2021 compared to 2020, mainly due to higher volumes exported to Poland. All of our total cement export volumes from our operations in Germany during 2021 were to our EMEAA region. Our average sales price of domestic cement from our operations in Germany increased 3%, in Euro terms, in 2021 compared to 2020, and our average sales price of ready-mix concrete increased 6%, in Euro terms, over the same period.
The following chart indicates the breakdown of Germany revenues by product, before others, intra sector eliminations within the segment and eliminations resulting from consolidation, as applicable for the year ended December 31, 2021:
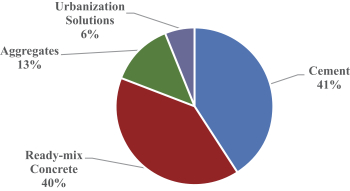
195
Table of Contents
As a result of decreases in domestic cement and in ready-mix concrete sales volumes, partially compensated by increases in sales prices, revenues from our operations in Germany, in Euro terms, decreased 6% in 2021 compared to 2020.
Poland
Our domestic cement sales volumes from our operations in Poland increased 5% in 2021 compared to 2020, and ready-mix concrete sales volumes increased 9% over the same period. The increases in domestic cement and ready-mix concrete sales volumes were mainly driven by higher infrastructure and residential activity. Our operations in Poland represented 3% of our total revenues for the year ended December 31, 2021, in Dollar terms, before eliminations resulting from consolidation. Our cement export volumes from our operations in Poland, which represented less than 1% of our Poland cement sales volumes for the year ended December 31, 2021 decreased 54% in 2021 compared to 2020. All of our total cement export volumes from our operations in Poland during 2021, were to our Rest of EMEAA segment. Our average sales price of domestic cement from our operations in Poland increased 5%, in Euro terms, in 2021 compared to 2020, and our average sales price of ready-mix concrete decreased 1%, in Euro terms, over the same period.
The following chart indicates the breakdown of Poland revenues by product, before others, intra sector eliminations within the segment and eliminations resulting from consolidation, as applicable for the year ended December 31, 2021:
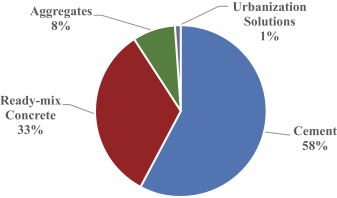
As a result of increases in domestic cement sales volumes and sales prices, and an increase in ready-mix concrete sales volumes, revenues from our operations in Poland, in Euro terms, increased 5% in 2021 compared to 2020.
Spain
Our domestic cement sales volumes from our operations in Spain increased 6% in 2021 compared to 2020, while ready-mix concrete sales volumes increased 7% over the same period. The increases in domestic cement and ready-mix concrete sales volumes were mainly driven by higher infrastructure and residential activity. Our operations in Spain represented 2% of our total revenues for the year ended December 31, 2021, in Dollar terms, before eliminations resulting from consolidation. Our cement export volumes from our operations in Spain, which represented 27% of our Spain cement sales volumes for the year ended December 31, 2021, increased 14% in 2021 compared to 2020, due to higher export volumes to United Kingdom. Of our total cement export volumes from our operations in Spain during 2021, 98% were to the United Kingdom and 2% were to the United States. Our average sales price of domestic cement of our operations in Spain decreased 1%, in Euro terms, in 2021 compared to 2020, and our average sales price of ready-mix concrete increased 1%, in Euro terms, over the same period.
196
Table of Contents
The following chart indicates the breakdown of Spain revenues by product, before others, intra sector eliminations within the segment and eliminations resulting from consolidation, as applicable for the year ended December 31, 2021:
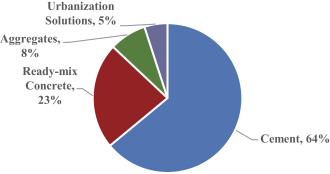
As a result of increases in domestic cement and ready-mix concrete sales volumes, partially offset by decreases in domestic cement sales prices, revenues from our operations in Spain, in Euro terms, increased 9% in 2021 compared to 2020.
The Philippines
Our domestic cement sales volumes from our operations in the Philippines increased 7% in 2021 compared to 2020. The increase in domestic cement volumes was mainly due to the implementation of stringent lock-down measures during 2020 as a response to the COVID-19 pandemic imposed by the Philippines government and by the closure of our Solid Cement Plant in Luzon for two months in 2020 and resumption of operations without such measures during 2021. Our cement export volumes from our operations in the Philippines, which represented less than 1% of our Philippines’ cement sales volumes for the year ended December 31, 2021, decreased 14% in 2021 compared to 2020. All of our total cement exports from our operations in Philippines during 2021 were to the Rest of EMEAA segment. Our revenues from our operations in the Philippines represented 3% of our total revenues for the year ended December 31, 2021, in Dollar terms, before eliminations resulting from consolidation. Our average sales price of domestic cement from our operations in the Philippines decreased 2%, in Philippine Peso terms, in 2021 compared to 2020.
The following chart indicates the breakdown of Philippines revenues by product, before others, intra sector eliminations within the segment and eliminations resulting from consolidation, as applicable for the year ended December 31, 2021:

197
Table of Contents
As a result of an increase in domestic cement sales volumes, partially compensated by a decrease in sales prices, revenues of our operations in the Philippines, in Philippine Peso terms, increased 6% in 2021 compared to 2020.
Israel
Our ready-mix concrete sales volumes from our operations in Israel decreased slightly in 2021 compared to 2020. Our operations in Israel represented 5% of our total revenues for the year ended December 31, 2021, in Dollar terms, before eliminations resulting from consolidation. Our average sales price of ready-mix concrete of our operations in Israel decreased slightly, in Israeli New Shekel terms, in 2021 compared to 2020.
The following chart indicates the breakdown of Israel revenues by product, before others, intra sector eliminations within the segment and eliminations resulting from consolidation, as applicable for the year ended December 31, 2021:
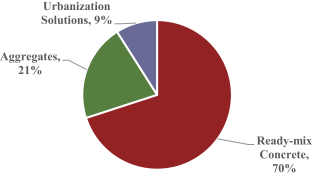
As a result of a small decrease in ready-mix concrete sales volumes and prices, revenues from our operations in Israel, in Israeli New Shekel terms, decreased 2% in 2021 compared to 2020.
Rest of EMEAA
Our domestic cement sales volumes from our operations in the Rest of EMEAA segment decreased 11% in 2021 compared to 2020, and ready-mix concrete sales volumes increased 2% over the same period. Our cement export volumes from our operations in the Rest of EMEAA segment, which represented 9% of our Rest of EMEAA segment cement sales volumes for the year ended December 31, 2021, remained flat in 2021 compared to 2020. Of our total cement export volumes from our operations in the Rest of EMEAA segment during 2021, 98% were to countries in the EMEAA region and 2% were to Poland. Our revenues from our operations in the Rest of EMEAA segment represented 4% of our total revenues for the year ended December 31, 2021, in Dollar terms, before eliminations resulting from consolidation. Our average sales price of domestic cement from our operations in the Rest of EMEAA segment increased 9%, in Euro terms, in 2021 compared to 2020, and our average sales price of ready-mix concrete remained flat, in Euro terms, over the same period.
198
Table of Contents
The following chart indicates the breakdown of Rest of EMEAA revenues by product, before others, intra sector eliminations within the segment and eliminations resulting from consolidation, as applicable for the year ended December 31, 2021:
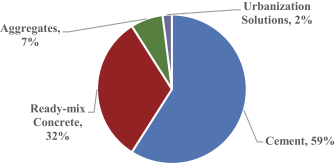
As a result of increases in ready-mix concrete sales volumes and sales prices, as well as increases in domestic cement sales prices, partially offset by a decrease in domestic cement sales volumes, revenues in the Rest of EMEAA segment, increased 3%, in Euro terms, in 2021 compared to 2020.
SCA&C
In 2021, our operations in the SCA&C region consisted of our operations in Colombia, Panama, the Dominican Republic, our Caribbean TCL operations, which represent our most significant operations in this region, and the Rest of SCA&C segment. Our revenues from our operations in the SCA&C region represented 11% of our total revenues for the year ended December 31, 2021, in Dollar terms, before eliminations resulting from consolidation. As of December 31, 2021, our operations in the SCA&C region represented 9% of our total assets, in Dollar terms. Set forth below is a quantitative and qualitative analysis of the effects of the various factors affecting our revenues for our main operations in the SCA&C region.
The following chart indicates the geographic breakdown of SCA&C region revenues by reporting segment, before others and eliminations resulting from consolidation, for the year ended December 31, 2021:
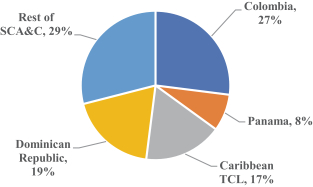
Colombia
Our domestic cement sales volumes from our operations in Colombia increased 8% in 2021 compared to 2020, and ready-mix concrete sales volumes increased 11% over the same period. The cement sales volume
199
Table of Contents
increase in Colombia was supported by housing, self-construction and infrastructure projects. Our revenues from our operations in Colombia represented 3% of our total revenues for the year ended December 31, 2021, in Dollar terms, before eliminations resulting from consolidation. Our average sales price of domestic cement from our operations in Colombia remained flat, in Colombian Peso terms, in 2021 compared to 2020, and our average sales price of ready-mix concrete increased 1%, in Colombian Peso terms, over the same period.
The following chart indicates the breakdown of Colombia revenues by product, before others, intra sector eliminations within the segment and eliminations resulting from consolidation, as applicable for the year ended December 31, 2021:
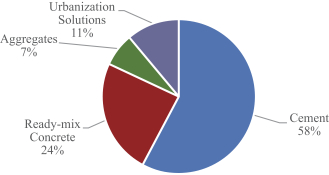
As a result of increases in domestic cement and ready-mix concrete sales volumes and an increase in ready-mix concrete sales prices, revenues of our operations in Colombia, in Colombian Peso terms, increased 11% in 2021 compared to 2020.
Panama
Our domestic cement sales volumes from our operations in Panama increased 41% in 2021 compared to 2020, and ready-mix concrete sales volumes increased 22% over the same period. The increases in domestic cement and ready-mix concrete sales volumes in Panama were mainly due to the reopening of the construction industry, after suspension in 2020 due to the COVID-19 pandemic. Our cement export volumes from our operations in Panama, which represented 57% of our Panama cement sales volumes for the year ended December 31, 2021, increased more than 100% in 2021 compared to 2020, as exports began at the end of 2020. Our revenues from our operations in Panama represented 1% of our total revenues for the year ended December 31, 2021, in Dollar terms, before eliminations resulting from consolidation. Our average sales price of domestic cement from our operations in Panama decreased 5% in Dollar terms, in 2021 compared to 2020, and our average sales price of ready-mix concrete decreased 8%, in Dollar terms, over the same period.
200
Table of Contents
The following chart indicates the breakdown of Panama revenues by product, before others, intra sector eliminations within the segment and eliminations resulting from consolidation, as applicable for the year ended December 31, 2021:
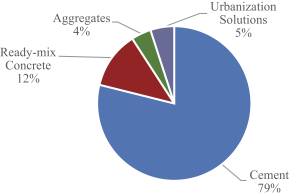
As a result of increases in domestic cement sales volumes and ready-mix concrete sales volumes, partially offset by a decrease in sales prices, revenues of our operations in Panama, in Dollar terms, increased 51% in 2021 compared to 2020.
Caribbean TCL
Our domestic cement sales volumes from our operations in Caribbean TCL increased 16% in 2021 compared to 2020, and ready-mix concrete sales volumes decreased 3% over the same period. The increase in cement sales volume came from a higher demand. Our revenues from our operations in Caribbean TCL represented 2% of our total revenues for the year ended December 31, 2021, in Dollar terms, before eliminations resulting from consolidation. Our cement export volumes from our operations in Caribbean TCL segment represented 20% of our Caribbean TCL cement sales volumes for the year ended December 31, 2021, decreased 14% in 2021 compared to 2020. All of our total cement exports from our operations in Caribbean TCL during 2021 were to the Rest of SCA&C segment. Our average sales price of domestic cement of our operations in Caribbean TCL remained flat, in Trinidad and Tobago Dollar terms, in 2021 compared to 2020, and our average sales price of ready-mix concrete increased 1%, in Trinidad and Tobago Dollar terms, over the same period.
The following chart indicates the breakdown of Caribbean TCL revenues by product, before others, intra sector eliminations within the segment and eliminations resulting from consolidation, as applicable for the year ended December 31, 2021:
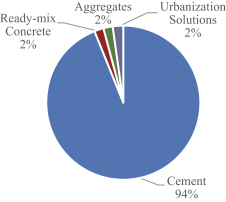
201
Table of Contents
As a result of increases in domestic cement sales volumes, partially offset by decreases in ready-mix concrete sales volumes and sales prices, revenues of our operations in Caribbean TCL, in Trinidad and Tobago Dollar terms, increased 11% in 2021 compared to 2020.
Dominican Republic
Our domestic cement sales volumes from our operations in the Dominican Republic increased 22% in 2021 compared to 2020, while ready-mix concrete sales volumes decreased 2% over the same period. The increase in our domestic cement sales volumes in the Dominican Republic region was mainly driven by a recovery of a dynamic self-construction sector and the reactivation of delayed tourism projects. Our operations in the Dominican Republic represented 2% of our total revenues for the year ended December 31, 2021, in Dollar terms, before eliminations resulting from consolidation. Our cement export volumes from our operations in the Dominican Republic, which represented 5% of our Dominican Republic cement sales volumes for the year ended December 31, 2021, decreased 34% in 2021 compared to 2020. All of our total cement export volumes from our operations in the Dominican Republic during 2022, were to our Rest of SCA&C segment. Our average sales price of domestic cement of our operations in the Dominican Republic increased 11%, in Dominican Peso terms, in 2021 compared to 2020, and our average sales price of ready-mix concrete increased 14%, in Dominican Peso terms, over the same period.
The following chart indicates the breakdown of Dominican Republic revenues by product, before others, intra sector eliminations within the segment and eliminations resulting from consolidation, as applicable for the year ended December 31, 2021:
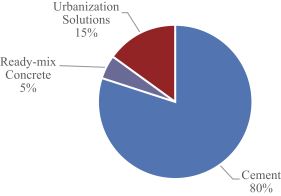
As a result of increases in domestic cement sales volumes and sales prices and ready-mix concrete sales prices, partially offset by a decrease in ready-mix concrete sales volume, revenues from our operations in the Dominican Republic, in Dominican Peso terms, increased 31% in 2021 compared to 2020.
Rest of SCA&C
Our domestic cement volumes from our operations in the Rest of SCA&C segment increased 9% in 2021 compared to 2020, and ready-mix concrete sales volumes increased 3% over the same period. Our cement export volumes from our operations in the Rest of SCA&C segment, which represented less than 1% of our Rest of SCA&C segment cement sales volumes for the year ended December 31, 2021, decreased 42% in 2021 compared to 2020. All of our total cement export volumes from our operations in the Rest of SCA&C segment during 2021, were within the same region. Our revenues from our operations in the Rest of SCA&C segment represented 3% of our total revenues for the year ended December 31, 2021, in Dollar terms, before eliminations resulting from consolidation. Our average sales price of domestic cement from our operations in the Rest of SCA&C segment increased 4% in Dollar terms, in 2021 compared to 2020, and our average sales price of ready-mix concrete increased 17%, in Dollar terms, over the same period.
202
Table of Contents
The following chart indicates the breakdown of Rest of SCA&C revenues by product, before others, intra sector eliminations within the segment and eliminations resulting from consolidation, as applicable for the year ended December 31, 2021:
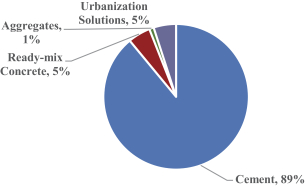
As a result of increases in domestic cement and ready-mix concrete sales volumes and sales price, revenues of our operations in the Rest of SCA&C segment, in Dollar terms, increased 18% in 2021 compared to 2020.
Others (Revenues)
Revenues from our Others segment increased 104% before intra-sector eliminations within the segment and before eliminations resulting from consolidation, as applicable, in 2021 compared to 2020, in Dollar terms. The increase resulted mainly from higher revenues in our trading operations. Our revenues from our Others segment represented 9% of our total revenues for the year ended December 31, 2021, in Dollar terms, before eliminations resulting from consolidation. For the year ended December 31, 2021, our trading operations represented 64% of our revenues in our Others segment, in Dollar terms.
Cost of Sales
Our cost of sales, including depreciation, increased 13%, from $8,586 million in 2020 to $9,743 million in 2021. As a percentage of revenues, cost of sales remained flat at 68% in 2020 and in 2021. Our cost of sales includes freight expenses of raw materials used in our producing plants.
Gross Profit
For the reasons described above, our gross profit increased 14% from $4,083 million in 2020 to $4,636 million in 2021. As a percentage of revenues, gross profit remained flat at 32% in 2020 and in 2021. In addition, our gross profit may not be directly comparable to those of other entities that include all their freight expenses in cost of sales. As described below, we include freight expenses of finished products from our producing plants to our points of sale and from our points of sale to our customers’ locations within operating expenses as part of distribution and logistics expenses.
Operating expenses
Our operating expenses, which are represented by administrative, selling and distribution and logistics expenses, increased 5%, from $2,791 million in 2020 to $2,917 million in 2021. As a percentage of revenues, operating expenses decreased from 22% in 2020 to 20% in 2021. The decrease as a percentage of revenues resulted primarily from lower administrative, sales, and corporate expenses. Our operating expenses include expenses related to personnel, equipment and services involved in sales activities and storage of product at points of sale, which are included as part of the operating expenses, as well as freight expenses of finished products
203
Table of Contents
between plants and points of sale and freight expenses between points of sale and the customers’ facilities, which are included as part of the line item “Distribution and logistics expenses.” For the years ended December 31, 2020 and 2021, selling expenses included as part of the line item “Operating expenses” amounted to $329 million and $322 million, respectively. As discussed above, we include freight expenses of finished products from our producing plants to our points of sale and from our points of sale to our customers’ locations within distribution and logistics expenses, which in the aggregate represented costs of $1,413 million in 2020 and $1,637 million in 2021. As a percentage of revenues, distribution and logistics expenses remained flat at 11% in 2020 and in 2021.
Operating Earnings Before Other Expenses, Net
For the reasons described above, our operating earnings before other expenses, net increased 33% from $1,292 million in 2020 to $1,719 million in 2021. As a percentage of revenues, operating earnings before other expenses, net increased 2%, from 10% in 2020 to 12% in 2021. Additionally, set forth below is a quantitative and qualitative analysis of the effects of the various factors affecting our operating earnings before other expenses, net on a reporting segment basis.
Mexico
Our operating earnings before other expenses, net, from our operations in Mexico increased 22% in 2021 compared to 2020, in Mexican Peso terms. Our operating earnings before other expenses, net from our operations in Mexico represented 58% of our total operating earnings before other expenses, net for the year ended December 31, 2021, in Dollar terms. The increase resulted primarily from the increase in our formal construction activity.
United States
Our operating earnings before other expenses, net, from our operations in the United States increased 2% in 2021 compared to 2020, in Dollar terms. Our operating earnings before other expenses, net from our operations in the United States represented 18% of our total operating earnings before other expenses, net for the year ended December 31, 2021, in Dollar terms. The increase resulted primarily from the increase in our revenues in the United States segment, partially compensated by increases in our cost of sales due to higher costs of purchased clinker and fuels.
EMEAA
United Kingdom. Our operating earnings before other expenses, net, from our operations in the United Kingdom increased 230% in Pound terms, in 2021 compared to 2020. Our operating earnings before other expenses, net from our operations in the United Kingdom represented 4% of our total operating earnings before other expenses, net for the year ended December 31, 2021, in Dollar terms. The increase resulted primarily from the increase in our revenues in the United Kingdom.
France. Our operating earnings before other expenses, net, from our operations in France increased 88%, in Euro terms, in 2021 compared to 2020. Our operating earnings before other expenses, net from our operations in France represented 3% of our total operating earnings before other expenses, net for the year ended December 31, 2021, in Dollar terms. The increase resulted primarily from the increase in our revenues.
Germany. Our operating earnings before other expenses, net, from our operations in Germany increased 4%, in Euro terms, in 2021 compared to 2020. Our operating earnings before other expenses, net from our operations in Germany represented 2% of our total operating earnings before other expenses, net for the year ended December 31, 2021, in Dollar terms. The increase resulted primarily from our cost of sales containment effort.
Poland. Our operating earnings before other expenses, net, from our operations in Poland decreased 5% in 2021 compared to 2020, in Euro terms. Our operating earnings before other expenses, net from our operations in
204
Table of Contents
Poland represented 3% of our total operating earnings before other expenses, net for the year ended December 31, 2021, in Dollar terms. The decrease resulting primarily from higher operational costs.
Spain. Our operating loss before other expenses, net, from our operations in Spain increased 157% in 2021 compared to 2020, in Euro terms. Our operating loss before other expenses, net from our operations in Spain represented a loss of $39 million, which was a negative impact of 2% of our total operating earnings before other expenses, net for the year ended December 31, 2021, in Dollar terms. The increase in loss resulted primarily from higher cost of sales, mainly higher electric power and fuel costs.
The Philippines. Our operating earnings before other expenses, net, from our operations in the Philippines increased 2% in 2021 compared to 2020, in Philippine Peso terms. Our operating earnings before other expenses, net from our operations in the Philippines represented 4% of our total operating earnings before other expenses, net for the year ended December 31, 2021, in Dollar terms. The increase resulted primarily from the increase in our revenues.
Israel. Our operating earnings before other expenses, net, from our operations in Israel decreased 35% in 2021 compared to 2020, in Israeli New Shekel terms. Our operating earnings before other expenses, net from our operations in Israel represented 4% of our total operating earnings before other expenses, net for the year ended December 31, 2021, in Dollar terms. The decrease in Israel operating earnings resulted primarily from the decrease in our revenues.
Rest of EMEAA. Our operating earnings before other expenses, net, from our operations in the Rest of EMEAA segment increased 60% in 2021 compared to 2020, in Euro terms. Our operating earnings before other expenses, net from our operations in the Rest of EMEAA segment represented 2% of our total operating earnings before other expenses, net for the year ended December 31, 2021, in Dollar terms. This increase relates primarily to an increase in our revenues.
SCA&C
Colombia. Our operating earnings before other expenses, net, from our operations in Colombia increased 2% in 2021 compared to 2020, in Colombian Peso terms. Our operating earnings before other expenses, net from our operations in Colombia represented 4% of our total operating earnings before other expenses, net for the year ended December 31, 2021, in Dollar terms. The increase resulted primarily from the increase in our revenues.
Panama. Our operating earnings before other expenses, net, from our operations in Panama increased significantly in 2021 compared to 2020, from an operating loss before other expenses, net of $4 million to an operating earnings before other expenses, net of $15 million. Our operating earnings before other expenses, net from our operations in Panama represented 1% of our total operating earnings before other expenses, net for the year ended December 31, 2021, in Dollar terms. The increase resulted primarily from the increase in our revenues.
Caribbean TCL. Our operating earnings before other expenses, net, from our operations in Caribbean TCL increased 6% in 2021 compared to 2020, in Trinidad and Tobago Dollar terms. Our operating earnings before other expenses, net from our Caribbean TCL operations represented 3% of our total operating earnings before other expenses, net for the year ended December 31, 2021, in Dollar terms. The increase resulted primarily from an increase in our revenues.
Dominican Republic. Our operating earnings before other expenses, net, from our operations in the Dominican Republic increased 59% in 2021 compared to 2020, in Dominican Peso terms. Our operating earnings before other expenses, net from our operations in the Dominican Republic represented 7% of our total operating earnings before other expenses, net for the year ended December 31, 2021, in Dollar terms. The increase resulted primarily from an increase in our revenues.
205
Table of Contents
Rest of SCA&C. Our operating earnings before other expenses, net, from our operations in the Rest of SCA&C segment increased 14% in 2021 compared to 2020, in Dollar terms. Our operating earnings before other expenses, net from our operations in the Rest of SCA&C segment represented 6% of our total operating earnings before other expenses, net for the year ended December 31, 2021, in Dollar terms. The increase resulted primarily from a benefit in Guatemala and Nicaragua derived mainly from higher sales, partially offset by an increase in cost of sales.
Others. Our operating loss before other expenses, net, from our operations in our Others segment decreased 22% in 2021 compared to 2020, in Dollar terms. The decrease in the operating loss before other expenses resulted primarily from an increase in our revenues.
Other Expenses, Net. Our other expenses, net, decreased significantly, in Dollar terms, from an expense of $1,763 million in 2020 to an expense of $82 million in 2021. The decrease in our other expenses, net, in 2021 resulted primarily from an income in 2021 for the sale of 12.3 million emission allowances for a total of $600 million and a reduction of non-cash impairment losses from $1,520 million in 2020, to $513 million in 2021. In 2021, impairment losses includes aggregate impairment losses of goodwill of $440 million related to the operating segments in Spain, the United Arab Emirates and the information technology business, impairment losses of internally developed software capitalized in prior years and other intangible assets of $53 million, as well as impairment losses of fixed assets of $43 million, while the aggregate non-cash impairment losses of 2020 included $1,020 million related to goodwill and $194 million in impairment loss of other intangible assets in our operating segment in the United States. In addition, during 2020, we recognized non-cash impairment losses of idle fixed assets for an aggregate amount of $306 million, mainly related to assets in the United States, Spain and the United Kingdom. Moreover, we had a decrease in our restructuring costs in the year ended December 31, 2021 compared to the same period in 2020. See notes 15.1, 16.1 and 16.2 to Cemex, S.A.B. de C.V.’s 2022 audited consolidated financial statements included elsewhere in this annual report.
The most significant items included under this caption for the years ended December 31, 2020 and 2021, are as follows:
| For the Years Ended December 31, |
||||||||
| 2020 | 2021 | |||||||
| (in millions of Dollars) | ||||||||
| Impairment losses |
$ | (1,520 | ) | $ | (513 | ) | ||
| Results from the sale of assets and others, net |
(114 | ) | (126 | ) | ||||
| Incremental costs and expenses related to the COVID-19 pandemic |
(48 | ) | (26 | ) | ||||
| Restructuring costs |
(81 | ) | (17 | ) | ||||
| Sale of CO2 Allowances |
— | 600 | ||||||
|
|
|
|
|
|||||
| $ | (1,763 | ) | $ | (82 | ) | |||
|
|
|
|
|
|||||
Financial expense. Our financial expense decreased 15%, from $773 million in 2020 to $658 million in 2021, primarily attributable to a decrease in our financial debt during 2021 compared to 2020 and lower interest rates on our financial debt. See note 17.1 to Cemex, S.A.B. de C.V.’s 2022 audited consolidated financial statements included elsewhere in this annual report.
Financial income and other items, net. Our financial income and other items, net, in Dollar terms, decreased 31%, from an expense of $115 million in 2020 to an expense of $79 million in 2021. The decrease was mainly due to a decrease in effects of amortized cost of assets and liabilities generated from a decrease in the discount rates utilized by us to determine its environmental remediation liabilities in the United Kingdom in 2020, which
206
Table of Contents
was partially offset by an increase in the loss due to the foreign exchange results, mainly due to the fluctuation of the Mexican Peso against the Dollar. See notes 8.2 and 17.4 to Cemex, S.A.B. de C.V.’s 2022 audited consolidated financial statements included elsewhere in this annual report.
The most significant items included under this caption for the years ended December 31, 2020 and 2021 are as follows:
| For the Year Ended December 31, |
||||||||
| 2020 | 2021 | |||||||
| (in millions of Dollars) |
||||||||
| Financial income and other items, net: |
||||||||
| Effects of amortized cost on assets and liabilities and others, net |
$ | (89 | ) | $ | (28 | ) | ||
| Net interest cost of pension liabilities |
(27 | ) | (25 | ) | ||||
| Results from financial instruments, net |
(17 | ) | (6 | ) | ||||
| Foreign exchange results |
(3 | ) | (35 | ) | ||||
| Financial income |
20 | 22 | ||||||
| Other |
1 | (7 | ) | |||||
|
|
|
|
|
|||||
| $ | (115 | ) | $ | (79 | ) | |||
|
|
|
|
|
|||||
Income Taxes. Our income tax effect in the statements of operations, which is comprised of current income taxes plus deferred income taxes, increased from an expense of $36 million in 2020 to $137 million in 2021. Our current income tax expense increased from $158 million in 2020 to $172 million in 2021, mainly as a result of increases in taxes in Spain and Mexico, partially offset by tax refunds received in Poland. Our deferred income tax income decreased from a deferred income tax income of $122 million in 2020 to a deferred income tax income of $35 million in 2021, mainly associated with the recognition of deferred tax assets in 2020 related to the impairments of fixed assets in the United States, the United Kingdom and Spain, among other countries, that generated an additional deferred income tax income in 2020 compared to 2021. See notes 20.1, 20.2, 20.3 and 20.4 to Cemex, S.A.B. de C.V.’s 2022 audited consolidated financial statements included elsewhere in this annual report.
For each of the years ended December 31, 2020 and 2021, our statutory income tax rate in Mexico was 30%. Considering an increase in our earnings before income tax from a loss of $1,310 million in 2020 to earnings before income tax of $954 million in 2021, as well as differences between accounting and tax expenses, our average effective income tax rate increased from a negative effective income tax rate of 2.7% in 2020 to an effective income tax rate of 14.4% in 2021. Our average effective tax rate equals the net amount of income tax expense divided by earnings before income taxes, as these line items are reported in our consolidated statements of operations. See “Item 3—Key Information—Risk Factors—Risks Relating to Regulatory and Legal Matters—Certain tax matters may have a material adverse effect on our cash flow, financial condition and net income, as well as on our reputation.” and note 20.3 to our 2022 audited consolidated financial statements included elsewhere in this annual report.
Net Income from continuing operations. For the reasons described above, our net income from continuing operations for 2021 increased from a net loss from continuing operations of $1,346 million in 2020 to a net income from continuing operations of $817 million in 2021. As a percentage of revenues, net loss from continuing operations represented 11% for the year ended as of December 31, 2020, and a net income from continuing operations represented 6% for the year ended as of December 31, 2021.
Discontinued operations. For the years ended December 31, 2020 and 2021, our discontinued operations included in our consolidated statements of operations amounted to a net loss from discontinued operations of $100 million and a net loss from discontinued operations of $39 million, respectively. As a percentage of
207
Table of Contents
revenues, loss of discontinued operations, net of tax, represented 0.8% for the year ended as of December 31, 2020, and the loss of discontinued operations, net of tax, represented 0.3% for the year ended as of December 31, 2021. See note 4.2 to Cemex, S.A.B. de C.V.’s 2022 audited consolidated financial statements included elsewhere in this annual report.
Consolidated Net Income. For the reasons described above, our consolidated net income (before deducting the portion allocable to non-controlling interest) for 2021 increased significantly from a consolidated net loss of $1,446 million in 2020 to a consolidated net income of $778 million in 2021. As a percentage of revenues, consolidated net loss represented 11% for the year ended as of December 31, 2020 and consolidated net income represented 5% for the year ended as of December 31, 2021.
Non-controlling Interest Net Income. Changes in non-controlling interest net income in any period reflect changes in the percentage of the stock of our subsidiaries held by non-associated third parties as of the end of each month during the relevant period and the consolidated net income attributable to those subsidiaries.
Non-controlling interest net income increased 19%, from an income of $21 million in 2020 to an income of $25 million in 2021, primarily attributable to an increase in the net income of the consolidated entities in which others have a non-controlling interest. See note 21.4 to Cemex, S.A.B. de C.V.’s 2022 audited consolidated financial statements included elsewhere in this annual report.
Controlling Interest Net Income. Controlling interest net income represents the difference between our consolidated net income and non-controlling interest net income, which is the portion of our consolidated net income attributable to those of our subsidiaries in which non-associated third parties hold interests. For the reasons described above, our controlling interest net income increased from a controlling interest net loss of $1,467 million in 2020 to a controlling interest net income of $753 million in 2021. As a percentage of revenues, controlling interest net loss, represented 12% for the year ended as of December 31, 2020 and controlling interest net income, represented 5% for the year ended as of December 31, 2021.
Liquidity and Capital Resources
Operating Activities
We have satisfied our operating liquidity needs primarily through the operation of our subsidiaries and expect to continue to do so for both the short and long-term. Although cash flow from our operations has historically met our overall liquidity needs for operations, servicing debt and funding capital expenditures and acquisitions, our subsidiaries are exposed to risks from changes in foreign currency exchange rates, price and currency controls, interest rates, inflation, governmental spending, social instability and other political, economic and/or social developments in the countries in which we operate, among other risks, any one of which may materially decrease our net income and cash from operations. Consequently, in order to meet our liquidity needs, we also rely on cost-cutting and operating improvements to optimize capacity utilization and maximize profitability, as well as borrowing under credit facilities, loans, proceeds of debt and equity offerings and proceeds from asset sales, including our account receivables securitizations. Our consolidated cash flows provided by operating activities from continuing operations were $2,348 million in 2020, $2,500 million in 2021 and $2,150 million in 2022. See our statements of cash flows included elsewhere in this annual report. Cemex management is of the opinion that working capital is sufficient for our current requirements.
208
Table of Contents
Sources and Uses of Cash
Our review of sources and uses of cash below refers to nominal amounts included in our consolidated statements of cash flows for years ended December 31, 2020, 2021 and 2022.
Our primary sources and uses of cash during the years ended December 31, 2020, 2021 and 2022 were as follows:
| Year Ended December 31, | ||||||||||||
| 2020 | 2021 | 2022 | ||||||||||
| (in millions of Dollars) | ||||||||||||
| Operating Activities |
||||||||||||
| Consolidated net income (loss) |
(1,446 | ) | 778 | 885 | ||||||||
| Discontinued operations |
(100 | ) | (39 | ) | 324 | |||||||
|
|
|
|
|
|
|
|||||||
| Net income (loss) from continuing operations |
(1,346 | ) | 817 | 561 | ||||||||
| Adjustments to the cash flow other than changes in working capital |
3,495 | 1,826 | 1,979 | |||||||||
| Changes in working capital, excluding income taxes |
199 | (143 | ) | (390 | ) | |||||||
|
|
|
|
|
|
|
|||||||
| Cash flows provided by operating activities from continuing operations |
2,348 | 2,500 | 2,150 | |||||||||
| Interest expense and income taxes paid |
(803 | ) | (694 | ) | (681 | ) | ||||||
|
|
|
|
|
|
|
|||||||
| Net cash flows provided by operating activities from continuing operations |
1,545 | 1,806 | 1,469 | |||||||||
| Net cash flows provided by operating activities from discontinued operations |
49 | 37 | 6 | |||||||||
|
|
|
|
|
|
|
|||||||
| Net cash flows provided by operating activities |
1,594 | 1,843 | 1,475 | |||||||||
| Investing Activities |
||||||||||||
| Purchase of property, machinery and equipment, net |
(538 | ) | (776 | ) | (909 | ) | ||||||
| Proceeds from disposal of subsidiaries and assets held for sale, net |
628 | 122 | 341 | |||||||||
| Proceed from the sale of emission allowances |
— | 600 | — | |||||||||
| Acquisition of intangible assets, net |
(53 | ) | (192 | ) | (151 | ) | ||||||
| Non-current assets and others, net |
50 | (10 | ) | (12 | ) | |||||||
|
|
|
|
|
|
|
|||||||
| Net cash flows provided by (used in) investing activities from continuing operations |
87 | (256 | ) | (731 | ) | |||||||
| Net cash flows provided by (used in) investing activities from discontinued operations |
— | (17 | ) | (1 | ) | |||||||
|
|
|
|
|
|
|
|||||||
| Net cash flows provided by (used in) investing activities |
87 | (273 | ) | (732 | ) | |||||||
209
Table of Contents
| Year Ended December 31, | ||||||||||||
| 2020 | 2021 | 2022 | ||||||||||
| (in millions of Dollars) | ||||||||||||
| Financing Activities |
||||||||||||
| Proceeds from new debt instruments |
4,210 | 3,960 | 2,006 | |||||||||
| Debt repayments |
(4,572 | ) | (5,897 | ) | (2,420 | ) | ||||||
| Issuance of 5.125% Subordinated Notes |
— | 994 | — | |||||||||
| Other financial obligations, net |
(820 | ) | (288 | ) | (197 | ) | ||||||
| Share repurchase program |
(83 | ) | — | (111 | ) | |||||||
| Share in trust for future deliveries under share-based compensation |
— | — | (36 | ) | ||||||||
| Changes in non-controlling interests and repayment of perpetual debentures |
(105 | ) | (447 | ) | (14 | ) | ||||||
| Derivative financial instruments |
12 | (41 | ) | 34 | ||||||||
| Coupons on perpetual debentures and subordinated notes |
(24 | ) | (24 | ) | (51 | ) | ||||||
|
|
|
|
|
|
|
|||||||
| Non-current liabilities, net |
(138 | ) | (109 | ) | (172 | ) | ||||||
|
|
|
|
|
|
|
|||||||
| Net cash flows used in financing activities |
(1,520 | ) | (1,852 | ) | (961 | ) | ||||||
| Increase (decrease) in cash and cash equivalents from continuing operations |
112 | (302 | ) | (223 | ) | |||||||
| Increase in cash and cash equivalents from discontinued operations |
49 | 20 | 5 | |||||||||
| Foreign currency translation effect on cash |
1 | (55 | ) | 100 | ||||||||
|
|
|
|
|
|
|
|||||||
| Cash and cash equivalents at beginning of period |
788 | 950 | 613 | |||||||||
|
|
|
|
|
|
|
|||||||
| Cash and cash equivalents at end of period |
950 | 613 | 495 | |||||||||
|
|
|
|
|
|
|
|||||||
Year ended December 31, 2022
During 2022, excluding the positive foreign currency effect of our balances of cash and cash equivalents generated during the period of $100 million, there was a decrease in cash and cash equivalents from continuing operations of $223 million. This decrease was the result of our net cash flows used in financing activities of $961 million and our net cash flows used in investing activities from continuing operations of $732 million, partially offset by our net cash flows provided by operating activities from continuing operations, which, after interest expense and income taxes paid in cash of $681 million, amounted to $1,469 million.
For the year ended December 31, 2022, our net cash flows provided by operating activities included cash flows applied in working capital, excluding income taxes, of $390 million, which was primarily comprised of trade receivables, inventories and other accounts receivables and other assets, for an aggregate amount of $695 million, partially offset by proceeds from trade payables and other accounts payables and accrued expenses for an aggregate amount of $305 million.
During 2022, the decrease in cash and cash equivalents was the result of (i) our net cash flows used in financing activities of $961 million, which include debt repayments, other financial obligations, net, changes in non-controlling interest, coupons on subordinated notes, share repurchase program, shares in trust for future deliveries under share-based compensation and non-current liabilities, net, for an aggregate amount of $3,001 million, partially offset by proceeds from new debt instruments and derivative financial instruments for an aggregate amount of $2,040 million; and (ii) our net cash flows used in investing activities from continuing activities of $731 million, which was primarily comprised of purchase of property, machinery and equipment, net, acquisition of intangible assets, and non-current assets and others, net, for an aggregate amount of $1,072 million partially offset by proceeds from disposal of subsidiaries and assets held for sale, net, for an amount of $341 million, partially offset by our net cash flows provided by operating activities from continuing operations after interest and income taxes paid in cash of $681 million, amounted to $1,469 million.
210
Table of Contents
Year ended December 31, 2021
During 2021, excluding the negative foreign currency effect of our balances of cash and cash equivalents generated during the period of $55 million, there was a decrease in cash and cash equivalents from continuing operations of $302 million. This decrease was the result of our net cash flows used in financing activities of $1,852 million and our net cash flows used in investing activities from continuing operations of $256 million, partially offset by our net cash flows provided by operating activities from continuing operations, which, after interest expense and income taxes paid in cash of $694 million, amounted to $1,806 million.
For the year ended December 31, 2021, our net cash flows provided by operating activities included cash flows applied in working capital, excluding income taxes, of $143 million, which was primarily comprised of trade receivables, inventories and other accounts payable and accrued expenses, for an aggregate amount of $527 million, partially offset by proceeds from other accounts receivable and other assets and trade payables for an aggregate amount of $384 million.
During 2021, the decrease in cash and cash equivalents was the result of (i) our net cash flows used in financing activities of $1,852 million, which include debt repayments, other financial obligations, net, changes in non-controlling interest and repayment of perpetual debentures, derivative financial instruments, coupons on Perpetual Debentures and subordinated notes, and non-current liabilities, net, for an aggregate amount of $6,806 million, partially offset by proceeds from new debt instruments and issuance of 5.125% Subordinated Notes for an aggregate amount of $4,954 million; and (ii) our net cash flows used in investing activities from continuing activities of $256 million, which was primarily comprised of purchase of property, machinery and equipment, net, acquisition of intangible assets, and non-current assets and others, net, for an aggregate amount of $978 million partially offset by proceeds from disposal of subsidiaries and assets held for sale, net, and sale of emission allowance for an aggregate amount of $722 million, partially offset by our net cash flows provided by operating activities from continuing operations after interest and income taxes paid in cash of $694 million, amounted to $1,806 million.
Year ended December 31, 2020
During 2020, excluding the positive foreign currency effect of our balances of cash and cash equivalents generated during the period of $1 million, there was an increase in cash and cash equivalents from continuing operations of $112 million. This increase was the result of our net cash flows provided by operating activities from continuing operations, which, after interest and income taxes paid in cash of $803 million, amounted to $1,545 million and by our net cash flows provided by investing activities of $87 million, partially offset by our net cash flows used in financing activities of $1,520 million.
For the year ended December 31, 2020, our net cash flows provided by operating activities included cash flows generated from changes in working capital, excluding income taxes, of $199 million, which was primarily comprised of trade receivables, inventories, trade payables and other accounts payable and accrued expenses, for an aggregate amount of $221 million, partially offset by other accounts receivable and other assets for an amount of $22 million.
During 2020, our net cash flows provided by (i) our operating activities from continuing operations after interest and income taxes paid in cash of $803 million, amounted to $1,545 million and (ii) our net cash flows provided by investing activities from continuing operations of $87 million, which was primarily comprised of proceeds from disposal of subsidiaries and assets held for sale, net and by non-current assets and others, net for an aggregate amount of $678 million, partially offset by purchase of property, machinery and equipment, net, and acquisition of intangible assets for an aggregate amount of $591 million, were disbursed in connection with our net cash flows used in financing activities of $1,520 million, which include debt repayments, other financial obligations, net, share repurchase program, changes in non-controlling interest, coupons on Perpetual Debentures and non-current liabilities, net, for an aggregate amount of $5,742 million, partially offset by proceeds from new debt instruments and derivative instruments for an aggregate amount of $4,222 million.
211
Table of Contents
As of December 31, 2022, we had the following lines of credit, of which the only committed portion refers to the revolving credit facility under the 2021 Credit Agreement, at annual interest rates ranging between 3.38% and 5.65%, depending on the negotiated currency:
| Lines of Credit |
Available | |||||||
| (in millions of Dollars) | ||||||||
| Other lines of credit in foreign subsidiaries |
364 | 204 | ||||||
| Other lines of credit from banks |
556 | 356 | ||||||
| Revolving credit facility 2021 Credit Agreement |
1,750 | 1,450 | ||||||
|
|
|
|
|
|||||
| 2,670 | 2,010 | |||||||
|
|
|
|
|
|||||
As of December 31, 2022, we had full availability in our committed revolving credit tranche under the 2021 Credit Agreement. In connection with other lines of credit from banks, such uncommitted amounts are subject to the lenders’ availability. We expect that this, in addition to our proven capacity to continually refinance and replace short-term obligations, will enable us to meet any liquidity risk in the short term.
We have in the past (see “Presentation of Financial Information,” Item 3—Key Information—Our General Evolution—Operation Resilience,” Item 5—Operating and Financial Review and Prospects—Results of Operations—Selected Consolidated Financial Information,” “Item 5—Operating and Financial Review and Prospects—Liquidity and Capital Resources—Relevant Transactions Related to Our Indebtedness in 2022,” and Item 5—Operating and Financial Review and Prospects—Recent Developments—Recent Developments Relating to Our Indebtedness”) and may from time to time in the future, subject to restrictions under our debt agreements and instruments, and depending upon market conditions and other factors our senior management deems relevant, refinance or repurchase our debt in privately negotiated or open market transactions, by tender offer or otherwise, at prices and on terms we deem appropriate (which may be at, above or below par), using cash generated from our operating activities or from the proceeds of asset sales or debt or capital transactions.
212
Table of Contents
Capital Expenditures
Our capital expenditures incurred for the years ended December 31, 2021 and 2022, and our expected capital expenditures during the year ended December 31, 2023, which include an allocation to 2023 of a portion of our total future committed amount, are as follows:
| Actual for the Year Ended December 31, Actual |
Estimated for the Year Ended December 31, 2023 |
|||||||||||
| 2021(1) | 2022 | |||||||||||
| (in millions of Dollars) | ||||||||||||
| Mexico |
190 | 265 | 186 | |||||||||
| United States |
373 | 551 | 492 | |||||||||
| EMEAA |
||||||||||||
| United Kingdom |
94 | 74 | 64 | |||||||||
| France |
44 | 57 | 40 | |||||||||
| Germany |
29 | 33 | 38 | |||||||||
| Poland |
29 | 33 | 41 | |||||||||
| Spain |
34 | 27 | 27 | |||||||||
| Philippines |
89 | 72 | 127 | |||||||||
| Israel |
45 | 37 | 29 | |||||||||
| Rest of EMEAA |
66 | 55 | 46 | |||||||||
| SCA&C |
||||||||||||
| Colombia |
27 | 45 | 77 | |||||||||
| Panama |
9 | 19 | 8 | |||||||||
| Caribbean TCL |
22 | 16 | 20 | |||||||||
| Dominican Republic |
15 | 18 | 15 | |||||||||
| Rest of SCA&C |
15 | 20 | 30 | |||||||||
| Others |
13 | 40 | 10 | |||||||||
|
|
|
|
|
|
|
|||||||
| Total consolidated |
1,094 | 1,362 | 1,250 | |||||||||
|
|
|
|
|
|
|
|||||||
| Of which: |
||||||||||||
| Expansion capital expenditures |
380 | 474 | 400 | |||||||||
|
|
|
|
|
|
|
|||||||
| Base capital expenditures |
714 | 888 | 850 | |||||||||
|
|
|
|
|
|
|
|||||||
| (1) | For the year ended as of December 31, 2021, the capital expenditures do not include our operations in Costa Rica and El Salvador, which are considered assets held for sale. See note 4.2 to Cemex, S.A.B. de C.V.’s 2022 audited consolidated financial statements included elsewhere in this annual report. |
For the years ended December 31, 2021 and 2022, we recognized $1,094 million and $1,362 million in capital expenditures from our continuing operations, respectively. As of December 31, 2022, in connection with our significant projects, we had capital expenditure commitments of $1,250 million, an amount that is expected to be incurred during 2023, based on the evolution of the related projects.
Our Indebtedness
As of December 31, 2022, we had $8,825 million (principal amount $8,870 million, excluding deferred issuance costs) of total debt plus other financial obligations in our statement of financial position, which does not include $1,000 million of 5.125% Subordinated Notes. Of our total debt plus other financial obligations, 11% was current (including current maturities of non-current debt) and 89% was non-current. As of December 31, 2022, 77% of our total debt plus other financial obligations was Dollar-denominated, 13% was Euro-denominated, 2% was Pound Sterling-denominated, 5% was Mexican Peso-denominated, 2% was Philippine Peso-denominated and 1% was denominated in other currencies. See notes 17.1 and 17.2 to Cemex, S.A.B. de C.V.’s 2022 audited consolidated financial statements included elsewhere in this annual report.
213
Table of Contents
On July 19, 2017, Cemex, S.A.B. de C.V. and certain of its subsidiaries entered into the 2017 Facilities Agreement for an amount in different currencies equivalent to $4.1 billion (in aggregate), the proceeds of which were used to refinance in full the indebtedness incurred under a credit agreement entered into with nine banks in 2014 and other debt repayment obligations, allowing us to increase the then average life of our syndicated bank debt to approximately 4.3 years with a final maturity in July 2022. The indebtedness incurred under the 2017 Facilities Agreement ranked equally in right of payment with certain of our other indebtedness, pursuant to the terms of an intercreditor agreement, dated September 17, 2012, among Cemex, S.A.B. de C.V. and certain of its subsidiaries named therein, Citibank Europe PLC, UK Branch (formerly Citibank International plc), as facility agent, the financial institutions, noteholders and other entities named therein and Wilmington Trust (London) Limited, as security agent (as amended and restated from time to time, the “Intercreditor Agreement”). At the time, Cemex, S.A.B. de C.V. and certain of its subsidiaries pledged collateral and all proceeds thereof to secure our payment obligations under the 2017 Facilities Agreement, our then-senior secured notes and under several other of our financing arrangements (the “Collateral”). The subsidiaries whose shares made up the Collateral collectively own, directly or indirectly, substantially all our operations worldwide. As of December 31, 2022, the Collateral has been released and the Intercreditor Agreement is no longer in effect, as described below.
On April 2, 2019, an amendment and restatement agreement to the 2017 Facilities Agreement was executed to, among other things, (i) extend the July 2020 and January 2021 repayment installments for a significant portion of the term loan tranches by three years; (ii) delay the scheduled tightening of the consolidated financial leverage ratio limit by one year; and (iii) make adjustments for the implementation of IFRS 16 and to compensate for its effects on certain financial ratios (together, the “April 2019 Facilities Agreement Amendments”).
On November 4, 2019, we amended and restated by an amendment and restatement agreement the 2017 Facilities Agreement. These amendments (together, the “November 2019 Facilities Agreement Amendments”) included: amendments providing for an additional basket of up to $500 million that can only be used for buy-backs of shares or securities that represent shares of Cemex, S.A.B. de C.V.; amendments providing for a new allowance for disposals of non-controlling interest in subsidiaries that are not obligors (as defined in the 2017 Facilities Agreement) under the 2017 Facilities Agreement of up to $100 million per calendar year; amendments relating to the implementation of corporate reorganizations in Mexico, Europe and in the Trinidad Cement Group (as defined in the 2017 Facilities Agreement); and amendments to the consolidated leverage ratio and the consolidated coverage ratio (as defined and calculated in the 2017 Facilities Agreement) to increase Cemex’s flexibility.
On May 22, 2020, we amended and restated by an amendment and restatement agreement the 2017 Facilities Agreement. These amendments (together, the “May 2020 Facilities Agreement Amendments”) included: (a) modifications to the limits of the consolidated coverage ratio and the consolidated leverage ratio; (b) modifications to the applicable margin over LIBOR, or EURIBOR in relation to any Euro loan, depending on the consolidated leverage ratio, to accommodate for the increased leverage limits; and (c) certain temporary or circumstance-based limitations on our ability to execute certain capital expenditures, acquisitions, share buybacks and the granting of loans to third parties.
On October 13, 2020, we further amended and restated by an amendment and restatement agreement the 2017 Facilities Agreement. As a result of these amendments (together, the “October 2020 Facilities Agreement Amendments”), we extended $1.1 billion of term loan maturities by three years, from 2022 to 2025, and $1.1 billion of commitments under the revolving credit facility by one year from 2022 to 2023. In addition, on October 15, 2020, we prepaid $530 million corresponding to the July 2021 amortization under the new term loan facilities created pursuant to the October 2020 Facilities Agreement Amendments.
Under the October 2020 Facilities Agreement Amendments, we also redenominated $313 million of previous Dollar exposure under the term loans that are part of the 2017 Facilities Agreement to Mexican Pesos, as well as $82 million to Euros. Aside from the new Mexican Pesos tranche that was created under the 2017 Facilities Agreement, which included a lower interest rate margin grid, pricing for all other tranches under the 2017 Facilities Agreement remained unchanged.
214
Table of Contents
Following the October 2020 Facilities Agreement Amendments, certain tranches under the 2017 Facilities Agreement amounting to $3.2 billion incorporated five sustainability-linked metrics, including reduction of net CO2 emissions and use of power from green energy, among other indicators. Annual performance with respect to these five metrics could result in a total adjustment of the interest rate margin under these tranches of up to plus or minus five basis points.
Along with other technical amendments, under the October 2020 Facilities Agreement Amendments, we also tightened our consolidated leverage ratio covenant under the 2017 Facilities Agreement from 7.00:1 to a limit of 6.25:1 for the periods ending on September 30, 2020, December 31, 2020 and March 31, 2021. In addition, on December 17, 2020, commitments were increased by $93 million and $43 million under the new term loan facilities and the new revolving credit facility created pursuant to the October 2020 Facilities Agreement Amendments, respectively. Subsequently, we cancelled commitments in those same amounts under the term loan facilities and the revolving credit facility already existing before the October 2020 Facilities Agreement Amendments. Following the aforementioned increase and cancellation, the amount of commitments under the 2017 Facilities Agreement remained effectively unchanged, but maturity of the aforementioned amounts were effectively extended from 2022 to 2025 (for the term loan facility commitments) and to 2023 (for the revolving credit facility commitments). Additionally, effective December 24, 2020, an additional $14 million of commitments under the revolving facility existing prior to the October 2020 Facilities Agreement Amendments were cancelled.
On October 5, 2021, we further amended by an amendment agreement the 2017 Facilities Agreement. As a result of these amendments (the “October 2021 Facilities Agreement Amendments” and, together with the October 2020 Facilities Agreement Amendments, the April 2019 Facilities Agreement Amendments, the November 2019 Facilities Agreement Amendments and the May 2020 Facilities Agreement Amendments, the “Facilities Agreement Amendments”), the 2017 Facilities Agreement was modified so that when at any time Cemex reported a Consolidated Leverage Ratio (as calculated pursuant to the Facilities Agreement Amendments) of 3.75x or less for two consecutive quarterly periods, the automatic release of the liens on the Collateral would be triggered. The terms of the indentures governing Cemex’s then-senior secured notes, which were also secured by liens on the Collateral, also contain an automatic release of such liens when the Collateral is released under the 2017 Facilities Agreement.
As Cemex reported a Consolidated Leverage Ratio of 3.75x or less for the quarterly periods ending on March 31, 2021 and June 30, 2021, Cemex complied with all requirements for the automatic release of the liens on the Collateral securing its indebtedness under the 2017 Facilities Agreement and, in turn, its then-senior secured notes that benefited from the same Collateral. The Collateral was released on October 6, 2021 and, at the time, consisted of the shares of COM, Cemex España and CIH. The then-senior secured notes that previously benefitted from the Collateral were the 2.750% Euro-denominated Notes due 2024, the March 2026 Euro Notes, the November 2029 Dollar Notes, the June 2027 Dollar Notes, the September 2030 Dollar Notes and the July 2031 Dollar Notes.
Additionally, the aforementioned Collateral release caused the automatic termination of the Intercreditor Agreement governing the rights of certain of Cemex and its subsidiaries’ creditors in accordance with its terms.
2021 Credit Agreement
On October 29, 2021, Cemex, S.A.B. de C.V. entered into the 2021 Credit Agreement for up to $3.25 billion to refinance indebtedness (including the 2017 Facilities Agreement) and general corporate purposes. On November 8, 2021, we fully repaid all outstanding indebtedness under the 2017 Facilities Agreement, which amounted to $1.9 billion in different currencies. Following this repayment, the 2017 Facilities Agreement is no longer in effect. The funds used to repay the 2017 Facilities Agreement were sourced from the 2021 Credit
215
Table of Contents
Agreement, which was closed with 21 financial institutions participating as lenders. The main terms and conditions of the 2021 Credit Agreement are summarized as follows:
| • | Final maturity in November 2026; |
| • | $1.5 billion in Term Loans (as defined in the 2021 Credit Agreement), amortizing in five equal semi-annual payments starting in November 2024; |
| • | $1.75 billion of commitments under a Revolving Facility (as defined in the 2021 Credit Agreement) maturing in November 2026; |
| • | All loans under the 2021 Credit Agreement bear interest at the same rate, including an applicable margin over the benchmark interest rate of between 100 and 175 basis points, depending on Cemex’s Consolidated Leverage Ratio (as defined in the 2021 Credit Agreement), with such margin being subject to positive or negative adjustments in an aggregate amount not to exceed five basis points, based on certain sustainability-linked performance metrics from the prior annual period; |
| • | Financial covenants consistent with an investment grade capital structure, with a maximum leverage ratio of 3.75x throughout the life of the loan, and a minimum interest coverage ratio of 2.75x; and |
| • | Guaranteed by Cemex Corp., Cemex Concretos, S.A. de C.V., COM and CIH, all of which are subsidiaries of Cemex (collectively, the “Refinancing Guarantors”). |
The 2021 Credit Agreement is denominated exclusively in Dollars and includes an interest rate margin grid that is about 25 basis points lower on average than that of the then existing 2017 Facilities Agreement. Furthermore, the 2021 Credit Agreement is the first debt to be issued under the Framework, which is aligned to the company’s Future in Action program and its ultimate vision of a carbon- neutral economy. The annual performance in respect of the three metrics referenced in the 2021 Credit Agreement, which are aligned with those provided for in the Framework, may result in an adjustment of the interest rate margin of up to plus or minus five basis points, in line with other sustainability-linked loans from investment grade rated borrowers.
As of December 31, 2022, we reported an aggregate amount of outstanding debt of $1,800 million under the 2021 Credit Agreement. As of December 31, 2022, we had $1,450 million of availability under the committed revolving credit tranche under the 2021 Credit Agreement.
Mexican Peso Banorte Agreement
On December 20, 2021, Cemex, S.A.B. de C.V. entered into the Mexican Peso Banorte Agreement under terms and conditions substantially similar to those of the 2021 Credit Agreement. As of December 31, 2022, we had drawn the entirety of the only term loan thereunder for the then Mexican Peso equivalent of $255 million. Furthermore, the borrowing under the Mexican Peso Banorte Agreement is also issued under the Framework.
2022 EUR Credit Agreement
On October 7, 2022, Cemex, S.A.B. de C.V. entered into the 2022 EUR Credit Agreement for €500 million under terms and conditions substantially similar to those of the 2021 Credit Agreement, for general corporate purposes (including to refinance indebtedness). The 2022 EUR Credit Agreement consists of a 3-year non-amortizing term loan facility. The 2022 EUR Credit Agreement has financial covenants consistent with an investment grade capital structure, with a maximum leverage ratio of 3.75x throughout the life of the facility, and a minimum interest coverage ratio of 2.75x. The 2022 EUR Credit Agreement is denominated exclusively in Euros, and the loans bear interest at a rate per annum equal to the EURIBOR rate plus a margin ranging from 115 basis points to 190 basis points, depending on our leverage ratio (subject to the sustainability-linked adjustments described below). Furthermore, the borrowing under the 2022 EUR Credit Agreement is also issued under the Framework. The annual performance in respect of the three metrics referenced in the 2022 EUR Credit Agreement, which are aligned with those provided for in the Framework, may result in an adjustment of the
216
Table of Contents
interest rate margin of up to plus or minus five basis points, in line with other sustainability-linked loans from investment grade rated borrowers. As of December 31, 2022, we had drawn the entirety of the only term loan under the 2022 EUR Credit Agreement for the then Euro equivalent of $498 million.
As of December 31, 2022, we reported an aggregate amount of outstanding debt of $535 million under the 2022 EUR Credit Agreement.
If we are unable to comply with our upcoming principal maturities under our indebtedness, or refinance or extend maturities of our indebtedness, our debt could be accelerated. Acceleration of our debt would have a material adverse effect on our financial condition. See “Item 3—Key Information—Risk Factors—Risks Relating to Our Indebtedness and Certain Other Obligations—We have a substantial amount of debt and other financial obligations. If we are unable to secure refinancing on favorable terms or at all, we may not be able to comply with our payment obligations upon their maturity. Our ability to comply with our principal maturities and financial covenants may depend on us implementing certain strategic initiatives, including, but not limited to, making asset sales, and there is no assurance that we will be able to implement any such initiatives or execute such sales, if needed, on terms favorable to us or at all.” Some of our subsidiaries have issued or provided guarantees of certain of our indebtedness, as indicated in the table below.
| The Notes | 2021 Credit Agreement |
2022 EUR Credit Agreement |
5.125% Subordinated Notes |
Mexican Peso Banorte Agreement |
||||||||||||||||
| $3,988 million (principal amount $4,006 million) |
$1,780 million (principal amount $1,800 million) |
$532 million (principal amount $535 million) |
$1,000 million (principal amount $1,000 million) |
$267 million (principal amount $268 million) |
||||||||||||||||
| Amount Outstanding as of December 31, 2022(1) |
||||||||||||||||||||
| Cemex, S.A.B. de C.V. |
✓ | ✓ | ✓ | ✓ | ✓ | |||||||||||||||
| Cemex Operaciones México, S.A. de C.V. |
✓ | ✓ | ✓ | ✓ | ||||||||||||||||
| Cemex Concretos, S.A. de C.V. |
✓ | ✓ | ✓ | ✓ | ||||||||||||||||
| Cemex Corp. |
✓ | ✓ | ✓ | ✓ | ||||||||||||||||
| Cemex Innovation Holding Ltd |
✓ | ✓ | ✓ | ✓ | ||||||||||||||||
| (1) | Includes Notes that have been repurchased and are held by Cemex. |
In addition, as of December 31, 2022, (i) Cemex Materials LLC was a borrower of $152 million (principal amount $152 million) under an indenture which is guaranteed by Cemex Corp. and (ii) several of our other operating subsidiaries were borrowers under debt facilities or debt arrangements aggregating $254 million.
Most of our current outstanding indebtedness was incurred to finance our acquisitions and to finance our capital expenditure programs. Historically, we have addressed our liquidity needs (including funds required to make scheduled principal and interest payments, refinance debt, and fund working capital and planned capital expenditures) with operating cash flow, securitizations, borrowings under credit facilities, proceeds of debt and equity offerings and proceeds from asset sales.
If (i) monetary policies to reduce inflation fail or induce a recession, (ii) policies in the largest economies diverge, resulting in Dollar appreciation with negative cross-border effects, (iii) energy and food price shocks cause inflation to persist for longer and weigh on investment and productivity growth, raising additional roadblocks in the recovery path, (iv) a global tightening of financial conditions triggers widespread emerging market debt distress, (v) a resurgence of the COVID-19 pandemic, or any related COVID-19 strain, or new pandemic or epidemic, hinders growth, further impacting financial institutions extending maturities to companies that have our credit rating or that are highly leveraged like us, which become more restrictive and our operating results worsen significantly, (vi) we are unable to complete debt or equity offerings, (vii) we are unable
217
Table of Contents
to consummate asset sales, (viii) the rapid growth of cryptocurrencies without clear regulation leads to financial instability with negative effects for the global economy, or (ix) the proceeds of any divestitures and/or our cash flow or capital resources prove inadequate, among other events, we could face liquidity problems and may not be able to comply with our upcoming principal payments under our indebtedness or refinance our indebtedness. If we are unable to comply with our upcoming principal maturities under our indebtedness, or refinance or extend maturities of our indebtedness, our debt could be accelerated. Acceleration of our debt would have a material adverse effect on our business and financial condition.
Historically, we and our subsidiaries have sought and obtained waivers and amendments to several of our debt instruments relating to a number of financial ratios. Our ability to comply with these ratios may be affected by current global economic conditions and volatility in foreign exchange rates and the financial and capital markets, including the effects of the COVID-19 pandemic and geopolitical risks, such as the conflict between Russia and Ukraine, on the financial sector and the ability of our lenders to grant waivers or amendments to companies that have our credit rating or that are highly leveraged like us. We may need to seek waivers or amendments in the future. However, we cannot assure you that any future waivers or amendments, if requested, will be obtained. If we or our subsidiaries are unable to comply with the provisions of our debt instruments and are unable to obtain a waiver or amendment, the indebtedness outstanding under such debt instruments could be accelerated. Acceleration of these debt instruments would have a material adverse effect on our financial condition.
Relevant Transactions Related to Our Indebtedness in 2022
The following is a description of our most important transactions related to our indebtedness in 2022:
| • | On April 13, 2022, we consummated a cash tender offer and purchased $163,762,000 aggregate principal amount of the outstanding September 2030 Dollar Notes, $108,648,000 aggregate principal amount of the outstanding November 2029 Dollar Notes and $156,178,000 aggregate principal amount of the outstanding July 2031 Dollar Notes validly tendered by holders of the tendered notes and made a total payment of $419,293,717.35 (which included an early tender premium and accrued and unpaid interest) for such tendered notes, pursuant to the terms of an offer to purchase governing the tender offer. |
| • | On April 27, 2022, we consummated a cash tender offer and purchased $4,160,000 aggregate principal amount of the outstanding September 2030 Dollar Notes, $3,000,000 aggregate principal amount of the outstanding November 2029 Dollar Notes and $3,075,000 aggregate principal amount of the outstanding July 2031 Dollar Notes validly tendered by holders of the tendered notes after the early tender date and at or prior to the expiration date and made a total payment of $9,789,319.41 (which included accrued and unpaid interest) for such tendered notes, pursuant to the terms of the offer to purchase governing the tender offer. |
| • | From May 2022 to August 2022, we repurchased $191,801,000 aggregate principal amount of the July 2031 Dollar Notes, $32,750,000 aggregate principal amount of the September 2030 Dollar Notes and $40,344,000 aggregate principal amount of the November 2029 Dollar Notes. |
| • | On September 30, 2022, we consummated a cash tender offer and purchased $291,177,000 aggregate principal amount of the outstanding July 2031 Dollar Notes, $81,944,000 aggregate principal amount of the outstanding September 2030 Dollar Notes and $94,955,000 of the outstanding November 2029 Dollar Notes validly tendered by holders of the tendered notes and made a total payment of $404,512,954.08 (which included an early tender premium and accrued and unpaid interest) for such tendered notes, pursuant to an offer to purchase governing the tender offer. |
| • | On October 7, 2022, we entered into the 2022 EUR Credit Agreement. |
During 2022, we borrowed the full amount of the 2022 EUR Credit Agreement. We used a substantial portion of the proceeds from these transactions to repay and refinance indebtedness, to improve our liquidity
218
Table of Contents
position and for general corporate purposes. For a description of the 2022 EUR Credit Agreement, see “Item 5—Operating and Financial Review and Prospects—Liquidity and Capital Resources—Our Indebtedness.”
Our Other Financial Obligations
Other financial obligations in the consolidated statement of financial position as of December 31, 2021 and 2022 are detailed as follows:
| 2021 | 2022 | |||||||||||||||||||||||
| Short- term |
Long- term |
Total | Short- term |
Long- term |
Total | |||||||||||||||||||
| (in millions of Dollars) | ||||||||||||||||||||||||
| Leases |
$ | 265 | $ | 911 | $ | 1,176 | $ | 258 | $ | 918 | $ | 1,176 | ||||||||||||
| Liabilities secured with accounts receivable |
602 | $ | — | 602 | 678 | — | 678 | |||||||||||||||||
|
|
|
|
|
|
|
|
|
|
|
|
|
|||||||||||||
| $ | 867 | $ | 911 | $ | 1,778 | $ | 936 | $ | 918 | $ | 1,854 | |||||||||||||
|
|
|
|
|
|
|
|
|
|
|
|
|
|||||||||||||
Leases
We have several operating and administrative assets under lease contracts. We apply the recognition exemption for short-term leases and leases of low-value assets. See notes 15.2 and 17.2 to Cemex, S.A.B. de C.V.’s 2022 audited consolidated financial statements included elsewhere in this annual report.
Changes in the balance of lease financial liabilities during 2020, 2021 and 2022 were as follows:
| (in millions of Dollars) | 2020 | 2021 | 2022 | |||||||||
| Lease financial liability at beginning of year |
$ | 1,306 | $ | 1,260 | $ | 1,176 | ||||||
| Additions from new leases |
213 | 227 | 296 | |||||||||
| Reductions from payments |
(276 | ) | (313 | ) | (276 | ) | ||||||
| Cancellations and liability remeasurements |
(9 | ) | 27 | 7 | ||||||||
| Foreign currency translation and accretion effects |
26 | (25 | ) | (27 | ) | |||||||
|
|
|
|
|
|
|
|||||||
| Lease financial liability at end of year |
$ | 1,260 | $ | 1,176 | $ | 1,176 | ||||||
|
|
|
|
|
|
|
|||||||
As of December 31, 2022, the maturities of non-current lease financial liabilities are as follows:
| (in millions of Dollars) | Total | |||
| 2024 |
$ | 194 | ||
| 2025 |
151 | |||
| 2026 |
109 | |||
| 2027 |
81 | |||
| 2028 and thereafter |
383 | |||
|
|
|
|||
| $ | 918 | |||
|
|
|
|||
Total cash outflows for leases including the interest expense portion as disclosed in note 8.1 to Cemex, S.A.B. de C.V.’s 2022 audited consolidated financial statements included elsewhere in this annual report in 2020, 2021 and 2022 were $350 million, $381 million and $342 million, respectively.
Our Receivables Financing Arrangements
Our subsidiaries in Mexico, the United States, France and the United Kingdom are parties to sales of trade accounts receivable programs with financial institutions, referred to as securitization programs. As of
219
Table of Contents
December 31, 2021 and 2022, trade accounts receivable included receivables of $727 million and $828 million, respectively. Under these programs, our subsidiaries effectively surrender control associated with the trade accounts receivable sold and there is no guarantee or obligation to reacquire the assets. Nonetheless, in such programs, our subsidiaries retain certain residual interest in the programs and/or maintain continuing involvement with the accounts receivable. Therefore, the trade accounts receivable sold were not removed from the statement of financial position, and the funded amounts were recognized within the line item “Other financial obligations” and the difference in each year against the trade receivables sold was maintained as reserves. Trade accounts receivable qualifying for sale exclude amounts over a certain number of days past due or concentrations over certain limits to any customer, according to the terms of the programs. The portion of the accounts receivable sold maintained as reserves amounted to $125 million and $150 million as of December 31, 2021 and 2022, respectively. Therefore, the funded amount to us was $602 million and $678 million as of December 31, 2021 and 2022, respectively. The discount granted to the acquirers of the trade accounts receivable is recorded as financial expense and amounted to $13 million in 2020, $11 million in 2021 and $24 million in 2022. Our securitization programs are usually negotiated for periods of one to two years and are usually renewed at their maturity. See notes 10 and 17.2 to our 2022 audited consolidated financial statements included elsewhere in this annual report. See “Item 5—Operating and Financial Review and Prospects—Recent Developments—Recent Developments Relating to Our Indebtedness.”
Perpetual Debentures
We defined the Perpetual Debentures, collectively, as the (i) Dollar-denominated 6.196% Fixed-to-Floating Rate Callable Perpetual Debentures issued by C5 Capital (SPV) Limited, (ii) Dollar-denominated 6.640% Fixed-to-Floating Rate Callable Perpetual Debentures issued by C8 Capital (SPV) Limited, (iii) Dollar- denominated 6.722% Fixed-to-Floating Rate Callable Perpetual Debentures issued by C10 Capital (SPV) Limited and (iv) Euro-denominated 6.277% Fixed-to-Floating Rate Callable Perpetual Debentures issued by C10-EUR Capital (SPV) Limited. Unless the context otherwise requires, when we refer to the Perpetual Debentures, we also include our dual-currency notes that underlie the Perpetual Debentures.
As of December 31, 2020, non-controlling interest stockholders’ equity included $449 million, representing the notional amount of Perpetual Debentures, which excluded any Perpetual Debentures held by our subsidiaries. The Perpetual Debentures had no fixed maturity date and there were no contractual obligations for us to exchange any series of its outstanding Perpetual Debentures for financial assets or financial liabilities. As a result, these debentures, issued by special purpose vehicles (“SPVs”), qualified as equity instruments under applicable IFRS and were classified within non-controlling interest as they were issued by consolidated entities. Subject to certain conditions, we had the unilateral right to defer indefinitely the payment of interest due on the debentures. The different SPVs were established solely for purposes of issuing the Perpetual Debentures and were included in Cemex’s consolidated financial statements.
In June 2021, considering the issuance of the 5.125% Subordinated Notes we redeemed all series of our outstanding Perpetual Debentures and, in each case, an equal aggregate amount of underlying dual-currency notes. See note 21.4 to Cemex, S.A.B. de C.V.’s 2022 audited consolidated financial statements included elsewhere in this annual report.
Issuance costs, as well as the interest expense, which is accrued based on the principal amount of the Perpetual Debentures, were included within “Other equity reserves” and represented expenses of $24 million and $11 million in 2020 and 2021, respectively.
Subordinated Notes
On June 8, 2021, we issued $1.0 billion aggregate principal amount of the 5.125% Subordinated Notes with no fixed maturity and subordinated to all senior obligations, and senior only to equity, in transactions exempt from registration pursuant to Rule 144A and Regulation S under the Securities Act. After issuance costs, we
220
Table of Contents
received $994 million. Considering that the 5.125% Subordinated Notes have no fixed maturity date, there is no contractual obligation for us to deliver cash or any other financial assets, the payment of principal and interest may be deferred indefinitely at the sole discretion of us and specific redemption events, are fully under our control, under applicable IFRS, the 5.125% Subordinated Notes qualify as equity instruments and are classified within controlling interest stockholders’ equity. We have a repurchase option on the fifth anniversary of the 5.125% Subordinated Notes. In the event of liquidation of us due to commercial bankruptcy, the 5.125% Subordinated Notes would come to the liquidation process according to their subordination after all liabilities. Coupon payments on the 5.125% Subordinated Notes for the years ended December 31, 2021 and 2022, were included within “Other equity reserves” and amounted to $30 million and $54 million, respectively.
Stock Repurchase Program
Under Mexican law, Cemex, S.A.B. de C.V.’s shareholders are the only ones authorized to approve the maximum amount of resources that can be allocated to the stock repurchase program at any annual ordinary general shareholders’ meeting. Unless otherwise instructed by Cemex, S.A.B. de C.V.’s shareholders, we are not required to purchase any minimum number of shares pursuant to any such program.
In connection with Cemex, S.A.B. de C.V.’s annual ordinary general shareholders’ meetings held on March 26, 2020, March 25, 2021 and March 24, 2022, proposals were approved to set the amount of $500 million or its equivalent in Mexican Pesos, each year and until the next ordinary shareholders’ meeting, as the maximum amount of resources that Cemex, S.A.B. de C.V. can use to repurchase its own shares or securities that represent such shares. Cemex, S.A.B. de C.V.’s Board of Directors approved the policy and procedures for the operation of any stock repurchase program, and is authorized to determine the basis on which the repurchase and placement of such shares is made, appoint the persons who will be authorized to make the decision of repurchasing or replacing such shares and appoint the persons responsible to make the transaction and furnish the corresponding notices to authorities. The Board of Directors of Cemex, S.A.B. de C.V. and/or attorneys-in-fact or delegates designated in turn, or the persons responsible for such transactions, will determine, in each case, if the repurchase is made with a charge to stockholders’ equity as long as the shares belong to Cemex, S.A.B. de C.V. or with a charge to share capital if it is resolved to convert the shares into non-subscribed shares to be held in treasury. See “Item 5—Operating and Financial Review and Prospects—Recent Developments—Recent Developments Relating to Cemex, S.A.B. de C.V.’s Shareholders’ Meetings.” We remain subject to certain restrictions regarding the repurchase of shares of our capital stock under the Credit Agreements and the indentures governing the outstanding Notes.
During 2019, we repurchased 157.7 million CPOs, which we cancelled at Cemex, S.A.B. de C.V.’s annual ordinary general shareholders’ meeting held on March 26, 2020.
From March 10, 2020 to March 24, 2020, under the repurchase program authorized at Cemex, S.A.B. de C.V.’s ordinary general shareholders’ meeting held on March 28, 2019, Cemex, S.A.B. de C.V. repurchased 378.2 million CPOs, at a weighted-average price in Mexican Pesos equivalent to $0.21 per CPO, which was equivalent to an amount of $83.2 million, excluding value-added tax. Cemex, S.A.B. de C.V. did not repurchase any additional CPOs after March 24, 2020. On April 8, 2020, Cemex, S.A.B. de C.V. announced that, to enhance our liquidity, it suspended its share repurchase program for the remainder of 2020. The shares repurchased during 2020 were cancelled at Cemex, S.A.B. de C.V.’s annual general ordinary shareholders’ meeting held on March 25, 2021.
During 2021, Cemex did not use the repurchase program authorized at Cemex, S.A.B. de C.V.’s ordinary general shareholders’ meeting held on March 26, 2020, and March 25, 2021. As a result, as no repurchases of CPOs took place during 2021, Cemex, S.A.B. de C.V.’s ordinary general shareholders’ meeting held on March 24, 2022, did not include on its agenda the cancellation of shares repurchased by Cemex, S.A.B. de C.V.
During 2022, under the repurchase programs authorized at Cemex, S.A.B. de C.V.’s ordinary general shareholders’ meeting held on March 25, 2021 and March 24, 2022, Cemex, S.A.B. de C.V. repurchased
221
Table of Contents
220.6 million CPOs, at a weighted average price in Mexican pesos equivalent to $0.5026 per CPO, which was equivalent to an amount of $110.9 million. The shares repurchased during 2022 under such repurchase programs were proposed and subsequently approved for cancellation at Cemex, S.A.B. de C.V.’s annual ordinary general shareholders’ meeting held on March 23, 2023.
Research and Development, Patents and Licenses, etc.
Headed by Cemex Global R&D, Research and Development is increasingly assuming a key role as it is recognized as an important element in creating value for our products, which is important to Cemex’s comprehensive pricing strategy for Cemex’s products. Through the development of innovative technologies, services, and commercial models, Cemex is leveraging its know-how-based assets to create an important differentiation in its offerings to customers in a broad range of markets with unique challenges. We focus on creating tangible value for our customers by creating products designed to make their business more profitable, but more importantly, as leaders in the industry, Cemex intends to elevate and accelerate the industry’s evolution in order to achieve greater sustainability, increase engagement in social responsibility and provoke an important leap in its technological advancement.
Cemex’s R&D initiatives are globally led, coordinated and managed by Cemex Global R&D, mainly based in Switzerland, which encompasses the areas of Global R&D, Intellectual Property Management, Cement Production Technology, Sustainability, Business Process & IT, Innovation, and Commercial & Logistics. We also have other laboratories and research locations in other parts of the world.
Cemex’s interaction and engagement with customers is growing and evolving through the exploration of novel interaction methodologies. Cemex’s R&D continues to develop and evolve in the area of customer centricity, but with complementary emphases on digitalization, development of digital-based business models, socio-urban dynamics, processes and technologies to mitigate CO2, and evaluating, adopting and proposing methodologies to engage specific types of customers who are the key decision makers in the very early stages of a construction project. Such methodologies are defining innovative approaches to involve and expose existing, potential, and future customers (e.g., Engineering & Architectural students) to our value-added products (cement, aggregates, ready-mix concrete, and admixtures) and constructions solutions. In other words, we aspire to create a unique customer experience in which the customer can see, touch, interact and even stimulate the modification of our technologies.
The areas of Global R&D, Cement Production Technology and Cemex Ventures are responsible for, among others, developing new products for our cement, ready-mix concrete, aggregate and admixture businesses as well as introduce novel and/or improved processing and manufacturing technology for all of Cemex’s core businesses. These areas also address energy efficiency of buildings, comfort, novel and more efficient construction systems. Additionally, the Global R&D and Sustainability areas collaborate to develop and propose construction solutions through consulting and the integration of the aforementioned technologies.
The Cement Production Technology and Sustainability areas are dedicated to, among others, operational efficiencies leading to cost reductions and enhancing our CO2 footprint and overall environmental impact through the usage of alternative or biomass fuels, the use of supplementary materials in substitution of clinker, as well as by managing our CO2 footprint, mitigating it and processing it in the context of a circular economy. For example, we have developed processes and products that allow us to reduce heat consumption in our kilns, which in turn reduces energy costs. Special emphasis is placed on defining parameters by which we communicate our efforts to preserve resources for the future, reduce our CO2 footprint and become more resilient with respect to our energy-related needs and potential supply constraints.
With respect to energy, the R&D team is focusing on energy storage, which represents the largest and most near-term opportunity to accelerate renewable energy deployments and bring us closer to replacing fossil fuels as
222
Table of Contents
the primary resource to meet the world’s continual growth in energy demand. Global products/brands have been conceptualized and engineered to positively impact the jobsite safety, promote efficient construction practices, sensibly preserve natural resources vital to life, lower carbon footprint and improve the quality of life in rapidly transforming cities.
Underlying Cemex’s R&D philosophy is a growing culture of global collaboration and coordination, where the innovation team identifies and promotes novel collaboration practices and mobilizes its adoption within Cemex. Getting closer and understanding our customers is a fundamental transformation within Cemex, and consequently the Commercial & Logistics area is carrying out research initiatives to better attend the needs of customers as well as identify key changes in our supply chain management that should enable us to bring products, solutions and services to our customers in the most cost-effective and efficient manner, using what we believe to be the best available technologies to design a new standard in digital commercial models. As of December 31, 2022, Cemex Global R&D actively participates in several research projects (ABSALT, LEILAC 2, DRIVE, FASTCARB, ECOCO2, REDOL, DESTINY, CO2OLHEAT and BIOFLEXGEN), funded by the EU under the H2020 program or other programs, to develop new technologies aimed at reducing Cemex’s carbon footprint in Europe and other countries in which Cemex operates.
There are nine laboratories supporting Cemex’s R&D efforts under a collaborative network. The laboratories are strategically located in close proximity to our plants and assist the operating subsidiaries with troubleshooting, optimization techniques and quality assurance methods. The laboratories located in Switzerland and Mexico are continually improving and consolidating our research and development efforts in the areas of cement, concrete, aggregates, admixtures, mortar and asphalt technology, sustainability and energy management. In addition, Cemex Global R&D actively generates and registers patents and pending applications in many of the countries in which Cemex operates. Patents and trade secrets are managed strategically to achieve important technology lock-ins associated with Cemex technology.
Our information technology divisions develop information management systems and software relating to cement and ready-mix concrete operational practices, automation and maintenance. These systems have helped us to better serve our clients with respect to purchasing, delivery and payment. More importantly, thanks to the activities of the Business Process and IT departments, Cemex is continuously improving and innovating its business processes to adapt them to the dynamically evolving markets to better serve Cemex’s needs. The launch of CEMEX Go and its deployment throughout our operations is a testament to our commitment to evolve our digital commercial model to better serve the market and our customers.
R&D activities comprise part of the daily routine of the aforementioned departments and divisions. Therefore, the costs associated with such activities are expensed as incurred. In 2020, 2021 and 2022, total combined expenses of these departments recognized within administrative expenses were $39 million, $44 million and $42 million, respectively. We capitalize the costs incurred in the development of software for internal use which are amortized in operating results over the estimated useful life of the software, which is approximately five years. Capitalized direct costs incurred in the development stage of internal-use software, such as professional fees, direct labor and related travel expenses amounted to $40 million in 2020, $132 million in 2021 and $136 million in 2022. See notes 6 and 16.1 to Cemex, S.A.B. de C.V.’s 2022 audited consolidated financial statements included elsewhere in this annual report.
Trend Information
Other than as disclosed elsewhere in this annual report, we are not aware of any trends, uncertainties, demands, commitments or events for the year ended December 31, 2022 that are reasonably likely to have a material and adverse effect on our revenues, income, profitability, liquidity or capital resources, or that would cause the disclosed financial information to be not necessarily indicative of future results of operations or financial conditions.
223
Table of Contents
Summary of Material Contractual Obligations and Commercial Commitments
2021 Credit Agreement
On October 29, 2021, Cemex, S.A.B. de C.V. entered into the 2021 Credit Agreement for up to $3.25 billion to refinance indebtedness (including the 2017 Facilities Agreement) and general corporate purposes. The 2021 Credit Agreement consists of a $1.5 billion 5-year amortizing term loan facility and a $1.75 billion 5-year committed revolving credit facility. The 2021 Credit Agreement has financial covenants consistent with an investment grade capital structure, with a maximum leverage ratio of 3.75x throughout the life of the facility, and a minimum interest coverage ratio of 2.75x. The 2021 Credit Agreement is denominated exclusively in Dollars and includes an interest rate margin grid that is about 25 basis points lower on average than that of the 2017 Facilities Agreement. Furthermore, the 2021 Credit Agreement is the first debt to be issued under the Framework, which is aligned to the company’s Future in Action program and its ultimate vision of a carbon-neutral economy. The annual performance in respect of the three metrics referenced in the 2021 Credit Agreement, which are aligned with those provided for in the Framework, may result in an adjustment of the interest rate margin of up to plus or minus five basis points, in line with other sustainability-linked loans from investment grade rated borrowers.
As of December 31, 2022, we reported an aggregate principal amount of outstanding debt of $1,800 million under the 2021 Credit Agreement. As of November 8, 2021, commitments initially available under the 2021 Credit Agreement included up to $3.25 billion, out of which $1,750 million were in the committed revolving credit tranche under the 2021 Credit Agreement. As of December 31, 2022, the Term Loans under the 2021 Credit Agreement had an amortization profile of $300 million in semi-annual principal payments (as such payments may be reduced as a result of prepayments) commencing in November 2024, plus any applicable interest, in accordance with the 2021 Credit Agreement. For a discussion of restrictions and covenants under the 2021 Credit Agreement, see “Item 3—Key Information—Risk Factors—Risks Relating to Our Indebtedness and Certain Other Obligations—The Credit Agreements, the indentures governing our Notes and our other debt agreements and/or instruments contain several restrictions and covenants. Our failure to comply with such restrictions and covenants or any inability to capitalize on business opportunities or refinance our debt resulting from them could have a material adverse effect on our business and financial conditions.”
Mexican Peso Banorte Agreement
On December 20, 2021, Cemex, S.A.B. de C.V. entered into the Mexican Peso Banorte Agreement under terms and conditions substantially similar to those of the 2021 Credit Agreement. As of December 31, 2022, we had drawn the entirety of the only term loan thereunder for the then-equivalent of $255 million Mexican Pesos. Furthermore, the borrowing under the Mexican Peso Banorte Agreement is also issued under the Sustainability-Linked Financing Framework.
2022 EUR Credit Agreement
On October 7, 2022, Cemex, S.A.B. de C.V. entered into the 2022 EUR Credit Agreement for €500 million under terms and conditions substantially similar to those of the 2021 Credit Agreement, for general corporate purposes (including to refinance indebtedness). The 2022 EUR Credit Agreement consists of a 3-year non-amortizing term loan facility. The 2022 EUR Credit Agreement has financial covenants consistent with an investment grade capital structure, with a maximum leverage ratio of 3.75x throughout the life of the facility, and a minimum interest coverage ratio of 2.75x. The 2022 EUR Credit Agreement is denominated exclusively in Euros, and the loans bear interest at a rate per annum equal to the EURIBOR rate plus a margin ranging from 115 basis points to 190 basis points, depending on our leverage ratio (subject to the sustainability-linked adjustments described below). Furthermore, the borrowing under the 2022 EUR Credit Agreement is also issued under the Framework. The annual performance in respect of the three metrics referenced in the 2022 EUR Credit Agreement, which are aligned with those provided for in the Framework, may result in an adjustment of the
224
Table of Contents
interest rate margin of up to plus or minus five basis points, in line with other sustainability-linked loans from investment grade rated borrowers. As of December 31, 2022 we had drawn the entirety of the only term loan under the 2022 EUR Credit Agreement for the then Euro equivalent of $498 million.
As of December 31, 2022, we reported an aggregate amount of outstanding debt of $535 million under the 2022 EUR Credit Agreement. For a discussion of restrictions and covenants under the 2022 EUR Credit Agreement, see “Item 3—Key Information—Risk Factors—Risks Relating to Our Indebtedness and Certain Other Obligations—The Credit Agreements, the indentures governing our Notes and our other debt agreements and/or instruments contain several restrictions and covenants. Our failure to comply with such restrictions and covenants or any inability to capitalize on business opportunities or refinance our debt resulting from them could have a material adverse effect on our business and financial conditions.”
Notes
The indentures governing our outstanding Notes impose operating and financial restrictions on us. These restrictions limit our ability, among other things, to: (i) incur debt, including restrictions on incurring debt at our subsidiaries, which are not parties to the indentures governing the Notes; (ii) pay dividends on stock; (iii) redeem stock or redeem subordinated debt; (iv) make investments; (v) guarantee indebtedness; and (vi) create or assume liens.
March 2026 Euro Notes. On March 19, 2019, Cemex, S.A.B. de C.V. issued €400 million aggregate principal amount of its March 2026 Euro Notes in transactions exempt from registration pursuant to Rule 144A and Regulation S under the Securities Act. The Refinancing Guarantors fully and unconditionally guarantee the performance of all obligations of Cemex, S.A.B. de C.V. under the March 2026 Euro Notes.
November 2029 Dollar Notes. On November 19, 2019, Cemex, S.A.B. de C.V. issued $1.0 billion aggregate principal amount of its November 2029 Dollar Notes in transactions exempt from registration pursuant to Rule 144A and Regulation S under the Securities Act. The Refinancing Guarantors fully and unconditionally guarantee the performance of all obligations of Cemex, S.A.B. de C.V. under the November 2029 Dollar Notes.
June 2027 Dollar Notes. On June 5, 2020, Cemex, S.A.B. de C.V. issued $1.0 billion aggregate principal amount of its June 2027 Dollar Notes in transactions exempt from registration pursuant to Rule 144A and Regulation S under the Securities Act. The Refinancing Guarantors fully and unconditionally guarantee the performance of all of our obligations under the June 2027 Dollar Notes.
September 2030 Dollar Notes. On September 17, 2020, Cemex, S.A.B. de C.V. issued $1.0 billion aggregate principal amount of its September 2030 Dollar Notes in transactions exempt from registration pursuant to Rule 144A and Regulation S under the Securities Act. The Refinancing Guarantors fully and unconditionally guarantee the performance of all of our obligations under the September 2030 Dollar Notes.
July 2031 Dollar Notes. On January 12, 2021, Cemex, S.A.B. de C.V. issued $1.75 billion aggregate principal amount of its July 2031 Dollar Notes in transactions exempt from registration pursuant to Rule 144A and Regulation S under the Securities Act. The Refinancing Guarantors fully and unconditionally guarantee the performance of all of our obligations under the July 2031 Dollar Notes.
On November 8, 2021, concurrently with funding under the 2021 Credit Agreement and in accordance with indentures that governed our then outstanding senior secured notes, Cemex entered into supplemental indentures to add COM and CIH as new guarantors to each of the Notes. Cemex Corp. and Cemex Concretos, S.A. de C.V. were already guarantors of the Notes. Also, concurrently with funding under the 2021 Credit Agreement and the full repayment of the 2017 Facilities Agreement, the provisions contained in the indentures governing the Notes that provide that any guarantor of the Notes shall be released of its guarantee obligations upon a refinancing of the 2017 Facilities Agreement with debt not guaranteed by the guarantor were triggered. As a result, both the Credit Agreements and the Notes are now guaranteed exclusively by the Refinancing Guarantors. The original
225
Table of Contents
note guarantors that are no longer guaranteeing the Notes are Cemex España, Cemex Asia B.V., Cemex Finance LLC, Cemex Africa & Middle East Investments B.V., Cemex France Gestion (S.A.S.), Cemex Research Group AG and Cemex UK.
Subordinated Notes
5.125% Subordinated Notes. On June 8, 2021, Cemex, S.A.B. de C.V. issued $1.0 billion aggregate principal amount of the 5.125% Subordinated Notes with no fixed maturity and subordinated to all senior obligations, and senior only to equity, in transactions exempt from registration pursuant to Rule 144A and Regulation S under the Securities Act.
Commercial Commitments
On July 27, 2012, we entered into a Master Professional Services Agreement with IBM (the “IBM 2012 MPSA”). The IBM 2012 MPSA provided the framework for certain ordinary course of business-related services on a global scale, including: information technology, application development and maintenance, finance and accounting services, and human resources administration. The term of the IBM 2012 MPSA expired on August 31, 2022.
On March 31, 2021, we signed an amendment to the IBM 2012 MPSA by which the finance and accounting services were removed from the scope of such agreement and, on the same date, we entered into a new Master Services Agreement with IBM for the provision of finance and accounting services previously provided under the IBM 2012 MPSA (the “IBM 2021 MSA”). On June 30, 2021, we signed an amendment to the IBM 2021 MSA by which advanced cybersecurity services were incorporated into the agreement. On September 30, 2021, we signed another amendment to the IBM 2021 MSA by which the finance and accounting services were modified to incorporate advanced order-to-cash services. The cybersecurity services under the IBM 2021 MSA will end on June 30, 2026 and the finance and accounting services under the IBM 2021 MSA will end on December 31, 2028, unless terminated earlier. In comparison with the IBM 2012 MPSA, the IBM 2021 MSA includes provisions for automation, as well as provisions for increased consumption flexibility and a reassessment of service level requirements. We may terminate the IBM 2021 MSA (or a portion of it) at our discretion and without cause at any time by providing at least six months’ notice to IBM and paying the corresponding termination charges. Other termination rights may be available to us for a termination charge that varies depending on the reason for termination. IBM may terminate the IBM 2021 MSA if we (i) fail to make payments when due or (ii) become bankrupt and do not pay in advance for the services. See note 24.2 to Cemex, S.A.B. de C.V.’s 2022 audited consolidated financial statements included elsewhere in this annual report.
On February 8, 2022, we announced that we renewed or entered into new agreements with six service providers in the fields of data processing services (back office) in finance, accounting and human resources; as well as IT infrastructure services, support and maintenance of IT applications in the countries in which we operate, for a tenure of five to seven years at an average annual cost of approximately $60 million. The services provided under these agreements replaced the services provided under the IBM 2012 MPSA which expired on August 31, 2022.
As of December 31, 2022, we did not depend on any single one of our suppliers of goods or services to conduct our business.
226
Table of Contents
Cash Requirements
As of December 31, 2022, we had material cash requirements as set forth in the table below.
| As of December 31, 2022 | ||||||||||||||||||||
| Obligations | Less than 1 year |
1-3 years | 3-5 years | More than 5 Years |
Total | |||||||||||||||
| Non-current debt |
$ | 45 | $ | 1,820 | $ | 2,567 | $ | 2,578 | $ | 7,010 | ||||||||||
| Leases(1) |
304 | 428 | 244 | 535 | 1,511 | |||||||||||||||
|
|
|
|
|
|
|
|
|
|
|
|||||||||||
| Total debt and other financial obligations(2) |
349 | 2,248 | 2,811 | 3,113 | 8,521 | |||||||||||||||
| Interest payments on debt(3) |
396 | 705 | 398 | 366 | 1,865 | |||||||||||||||
| Pension plans and other benefits(4) |
145 | 279 | 279 | 682 | 1,385 | |||||||||||||||
| Acquisition of property, plant and equipment(5) |
86 | 67 | 3 | — | 156 | |||||||||||||||
| Purchases of services, raw material, fuel and energy(6) |
785 | 837 | 695 | 645 | 2,962 | |||||||||||||||
|
|
|
|
|
|
|
|
|
|
|
|||||||||||
| Total cash requirements |
$ | 1,761 | $ | 4,136 | $ | 4,186 | $ | 4,806 | $ | 14,889 | ||||||||||
|
|
|
|
|
|
|
|
|
|
|
|||||||||||
| (1) | Represent nominal cash flows. As of December 31, 2022, the net present value of future payments under such leases was $1,075 million, of which, $368 million refers to payments from one to three years and $183 million refer to payments from three to five years. See note 24.1 to Cemex, S.A.B. de C.V.’s 2022 audited consolidated financial statements included elsewhere in this annual report. |
| (2) | The schedule of debt payments, which includes current maturities, does not consider the effect of any refinancing of debt that may occur during the following years. In the past, we have replaced our non-current obligations for others of a similar nature. |
| (3) | Estimated cash flows on floating rate denominated debt were determined using the floating interest rates in effect as of December 31, 2022. |
| (4) | Represents estimated annual payments under these benefits for the next 10 years (see note 19 to Cemex, S.A.B. de C.V.’s 2022 audited consolidated financial statements included elsewhere in this annual report), including the estimate of new retirees during such future years. |
| (5) | Refers mainly to the expansion of a cement-production line in the Philippines. |
| (6) | Future payments for the purchase of raw materials are presented on the basis of contractual nominal cash flows. Future nominal payments for energy were estimated for all contractual commitments on the basis of an aggregate average expected consumption per year using the future prices of energy established in the contracts for each period. Future payments also include our commitments for the purchase of fuel. In addition, this line item includes a contractual commitment with Neoris over a 5-year contract beginning in 2023 until 2027 for the acquisition of digitalization services and solutions for an annual amount of $55 million. Moreover, this line item includes our commitments with six vendors for back-office services for an average annual amount of $60 million. |
As of December 31, 2020, 2021 and 2022, in connection with the commitments for the purchase of fuel and energy included in the table above, a description of the most significant contracts is as follows:
On October 24, 2018, we entered into two fixed-for-floating energy financial hedge agreements in Mexico, for a period of 20 years starting in 2020 with the solar power plants Tuli Energía and Helios Generación.
Pursuant to these agreements, we fixed the megawatt-hour price (which increases at a fixed annual rate) over an electric energy volume per year and the differential between the agreed price and the market price is settled monthly. We consider these agreements to be a hedge for a portion of our aggregate consumption of electric energy in Mexico and recognize the result of the exchange of price differentials described previously in the statement of operations as a part of the costs of energy. During 2022, we received $3 million as a result of these hedges. We do not record these agreements at fair value because there is not a deep market for electric power in Mexico that would effectively allow for their valuation.
227
Table of Contents
In connection with the Ventikas, located in the Mexican state of Nuevo León with a combined generation capacity of 252 MW, we agreed to acquire a portion of the energy generated by Ventikas for our overall electricity needs in Mexico for a period of 20 years, which began in April 2016. As of December 31, 2022, the estimated annual cost of this agreement was $23 million, assuming energy generation at full capacity (energy supply from wind sources is variable in nature and final amounts can be determined only based on energy ultimately received at the agreed prices per unit).
Beginning in February 2010, for our overall electricity needs in Mexico, we reached an agreement with the EURUS Wind Farm (“EURUS”) for the purchase of a portion of the electric energy generated for a period of no less than 20 years. EURUS is a wind farm with an installed capacity of 250 MW operated by ACCIONA in the Mexican state of Oaxaca. The estimated annual cost of this agreement is $70 million assuming that we receive all our energy allocation. Energy supply from wind sources is variable in nature and final amounts can be determined only based on energy ultimately received at the agreed prices per unit.
We maintain a commitment initiated in April 2004 to purchase the energy generated by TEG until 2027 for our overall electricity needs in Mexico. The estimated annual cost of this agreement is $205 million assuming we receive all our energy allocation. Nonetheless, final amounts will be determined considering the final megawatt hour effectively received at the agreed prices per unit.
In connection with the above, we also committed to supply TEG and another third-party electrical energy generating plant adjacent to TEG all fuel necessary for their operations until the year 2027, equivalent to approximately 1.2 million tons of pet coke per year. We cover our commitments under this agreement by acquiring the aforementioned volume of fuel from sources in the international markets and Mexico.
Off-Balance Sheet Arrangements
We do not have any off-balance sheet arrangements that are reasonably likely to have a material effect on our financial condition, operating results and liquidity or capital resources.
Quantitative and Qualitative Market Disclosure
Our Derivative Financial Instruments
In the ordinary course of business, we are exposed to credit risk, interest rate risk, foreign exchange risk, equity risk, commodities risk and liquidity risk, considering the guidelines set forth by Cemex, S.A.B. de C.V.’s Board of Directors, which represent our risk management framework and are supervised by several of our committees. Our management establishes specific policies that determine strategies focused on obtaining natural hedges or risk diversification to the extent possible, such as avoiding customer concentration on a determined market or aligning the currencies portfolio in which we incur our debt with those in which we generate our cash flows. As of December 31, 2021 and 2022, these strategies were sometimes complemented by the use of derivative financial instruments. See notes 17.4 and 17.5 to Cemex, S.A.B. de C.V.’s 2022 audited consolidated financial statements included elsewhere in this annual report.
During the reported periods, in compliance with the guidelines established by our risk management committee, the restrictions set forth by our debt agreements and our hedging strategy, we held derivative instruments, with the objectives of, as the case may be: (a) changing the risk profile or fixing the price of fuels; (b) foreign exchange hedging; (c) hedge of forecasted transactions; and (d) other corporate purposes. See note 17.4 to Cemex, S.A.B. de C.V.’s 2022 audited consolidated financial statements included elsewhere in this annual report.
228
Table of Contents
As of December 31, 2021 and 2022 the notional amounts and fair values of our derivative instruments were as follows:
| At December 31, 2021 | At December 31, 2022 | |||||||||||||||||||
| (in millions of Dollars) | Notional Amount |
Estimated Fair value |
Notional Amount |
Estimated Fair value |
Maturity Date |
|||||||||||||||
| Net investment hedge |
1,511 | 3 | 837 | (48 | ) | June 2024 | ||||||||||||||
| Interest Rate Swaps |
1,005 | (18 | ) | 1,018 | 54 | November 2026 | ||||||||||||||
| Fuel price hedging |
145 | 30 | 136 | 8 | December 2023 | |||||||||||||||
| Foreign exchange options |
250 | 6 | 500 | 18 | December 2024 | |||||||||||||||
|
|
|
|
|
|
|
|
|
|
|
|||||||||||
| 2,911 | 21 | 2,491 | 32 | |||||||||||||||||
|
|
|
|
|
|
|
|
|
|||||||||||||
The caption “Financial income and other items, net” in the statement of operations includes gains and losses related to the recognition of changes in fair values of the derivative financial instruments during the applicable period, which represented net losses of $17 million in 2020, $6 million in 2021 and $5 million in 2022. As described below, changes in fair value of our net investment hedge are recognized in other comprehensive income for the period as part of our currency translation results. In addition, changes in fair value of our outstanding interest rate swaps related to debt are recognized as part of our financial expense in the statement of operations. Changes in fair value of our fuel price hedging derivatives are temporarily recognized through other comprehensive income and are allocated to operating expenses as the related fuel volumes are consumed.
Our Net Investment Hedge. As of December 31, 2021 and 2022, there are Dollar/Peso foreign exchange forward contracts with target tenor ranging from 1 to 18 months for a notional amount of $761 million and $738 million, respectively. We have designated this program as a hedge of our net investment in Pesos, pursuant to which changes in fair market value of these instruments are recognized as part of other comprehensive income in equity. For the years 2020, 2021 and 2022, these contracts generated gains of $53 million, losses of $4 million and losses of $96 million, respectively, which partially offset currency translation results in each year recognized in equity generated from our net assets denominated in Pesos due to the depreciation of the Peso in 2020 and 2021 and the appreciation of the Peso in 2022.
In addition, as of December 31, 2022, as part of our Peso net investment hedge strategy, there are additional Dollar/Peso capped forwards, structured with option contracts, for a notional amount of $98 million. These capped forwards contain limits on the gain that the instrument may generate. Any changes in fair market value of such capped forward contracts are also recognized as part of other comprehensive income in equity. For the year 2022, these contracts generated losses of $2 million, which partially offset currency translation results recognized in equity generated from our net assets denominated in Pesos, due to the appreciation of the Peso in 2022.
Moreover, as of December 31, 2021, there was Dollar/Euro cross currency swap contracts for a notional amount of $750 million, which were entered into in November 2021. During the year 2022, we unwound these instruments, fixing a settlement gain of $80 million. We designated the foreign exchange forward component of these instruments as a hedge of our net investment in Euros, pursuant to which changes in fair market of such forward contracts were recognized as part of other comprehensive income in equity, while changes in fair value of the interest rate swap component were recognized within “Financial income and other items, net.” For the years ended December 31, 2021 and 2022, these contracts generated respective gains of $10 million and $70 million, recognized in equity, which partially offset currency translation results recognized in equity generated from our net assets denominated in Euros due to the depreciation of the Euro in 2021 and 2022 against the Dollar, as well as losses in 2021 of $1 million and gains in 2022 of $8 million related to the exchange of interest rates in the statement of operations.
See note 17.4 to Cemex, S.A.B. de C.V.’s 2022 audited consolidated financial statements included elsewhere in this annual report.
Our Interest Rate Swaps. For accounting purposes under IFRS, Cemex designates interest rate swaps as cash flow hedges, to fix interest rate payments in relation to an equivalent amount of floating interest rate debt;
229
Table of Contents
therefore, changes in fair value of these contracts are initially recognized as part of other comprehensive income in equity and are subsequently reclassified to financial expense as the interest expense of the related floating interest rate debt is accrued in the statement of operations.
As of December 31, 2021 and 2022, we held interest rate swaps for a notional amount of $750 million, in both periods, with a fair market value representing liabilities of $30 million in 2021 and assets of $39 million in 2022, negotiated in June 2018 to fix interest payments of existing bank loans bearing Dollar floating rates. During September 2020, we amended one of the interest rate swap contracts to reduce the weighted average fixed rate from 3.05% to 2.56% paying $14 million and, in November 2021, we partially unwound its interest rate swap paying $5 million, recognized within “Financial income and other items, net” in the statement of operations. In November 2021, these contracts were extended, and they will mature in November 2026. For the years ended in 2020, 2021 and 2022, changes in fair value of these contracts generated losses of $9 million, gains of $23 million and gains of $69 million, respectively, recognized in other comprehensive income. Moreover, during the same periods, we recycled results from equity to the line item of “Financial expenses” representing an expense of $20 million in 2020, $22 million in 2021 and $2 million in 2022.
In addition, as of December 31, 2021 and 2022, we held interest rate swaps for a notional of $255 million and $268 million, respectively, negotiated to fix interest payments of existing bank loans referenced to Peso floating rates maturing in November 2023, which fair value represented an asset of $12 million in 2021 and $15 million in 2022. During December 2021, we partially unwound this interest rate swap receiving $3 million recognized within “Financial income and other items, net” in the statement of operations. We designated these contracts as cash flow hedges, pursuant to which, changes in fair value are initially recognized as part of other comprehensive income in equity and are subsequently allocated through financial expense as interest expense on the related bank loans is accrued. For the years ended December 31, 2020, 2021 and 2022 changes in fair value of these contracts generated losses of $3 million, gains of $15 million and gains of $3 million, respectively, recognized in other comprehensive income. Moreover, during the same periods, we recycled results from equity to the line item of “Financial expenses” representing expenses of $0.1 million in 2020, expenses of $0.3 million in 2021 and gains of $7 million in 2022.
In addition, during March 2022, as part of a forecasted debt issuance expected by mid-2023, we entered into interest rate swap lock contracts for a notional of $300 million. We designated these interest rate swap lock contracts as a cash flow hedge of the forecasted debt transaction. During 2022, changes in fair value of these contracts generated gains of $33 million recognized in other comprehensive income. During September 2022, we early settled these interest rate swap lock contracts and fixed the gain of $33 million, which will decrease the financial expense commencing when the debt is issued; otherwise, the amount will remain in equity.
Our Fuel Price Hedging Derivatives. As of December 31, 2021 and 2022, we maintained swap and option contracts negotiated to hedge the price of certain fuels, primarily diesel and gas, in several operations for aggregate notional amounts of $145 million and $136 million, respectively, with an estimated aggregate fair value representing assets of $30 million in 2021 and of $8 million in 2022. By means of these contracts, for its own consumption only, we either fixed the price of these fuels, or entered into option contracts to limit the prices to be paid for these fuels, over certain volumes representing a portion of the estimated consumption of such fuels in several operations. These contracts have been designated as cash flow hedges of diesel or gas consumption, and as such, changes in fair value are recognized temporarily through other comprehensive income and are recycled to operating expenses as the related fuel volumes are consumed. For the years 2020, 2021 and 2022, changes in fair value of these contracts recognized in other comprehensive income represented gains of $7 million, gains of $22 million and losses of $25 million, respectively. Moreover, during the same periods, we recycled results from equity to the line items “Cost of sales” and “Operating expenses,” as applicable, representing expenses of $24 million in 2020, gains of $36 million in 2021 and gains of $88 million in 2022.
Foreign Exchange Options. As of December 31, 2021 and 2022, we held Dollar/Peso call spread option contracts for a notional amount of $250 million and $500 million, respectively. Such contracts mature between
230
Table of Contents
September 2024 and December 2024 and were negotiated to maintain the value in Dollars over such notional amount over revenues generated in Pesos. Changes in the fair value of these instruments, generated losses of $5 million in 2021 and losses of $13 million in 2022, recognized within “Financial income and other items, net” in the statement of operations.
Other Derivative Financial Instruments. During 2020, we negotiated Dollar/Peso, Dollar/Euro and Dollar/ British Pound foreign exchange forward contracts to sell Dollars and Pesos and buy Euro and Pounds Sterling, negotiated in connection with the voluntary prepayment and currency exchanges under the 2017 Facilities Agreement, for a combined notional amount of $397 million. For the year 2020, the aggregate results from positions entered and settled, generated losses of $15 million recognized within “Financial income and other items, net” in the statements of operation. Additionally, during 2020, we negotiated Dollar/Euro foreign exchange forward contracts to sell Dollars and buy Euro, negotiated in connection with the redemption of the 4.625% Senior Secured Notes due 2024 previously issued by Cemex, S.A.B. de C.V. For the year 2020, the aggregate results of these instruments from positions entered and settled, generated gains of $3 million, recognized within “Financial income and other items, net” in the statement of operations.
Moreover, in connection with the proceeds from the sale of certain assets in the United Kingdom, we negotiated British Pound/Euro foreign exchange forward contracts to sell Pounds Sterling and buy Euro for a notional amount of $186 million. We settled such derivatives on August 5, 2020. During the year 2020, changes in the fair value of these instruments and their settlement generated gains of $9 million recognized within “Financial income and other items, net” in the statement of operations. See notes 4.2 and 17.4 to Cemex, S.A.B. de C.V.’s 2022 audited consolidated financial statements included elsewhere in this annual report.
With respect to our existing financial derivatives, we may incur net losses and be subject to margin calls that will require cash. Likewise, if we enter into new derivative financial instruments, we may incur net losses and be subject to margin calls. The cash required to cover the margin calls may be substantial and may reduce the funds available to us for our operations or other capital needs.
As with any derivative financial instrument, we assume the creditworthiness risk of the counterparty, including the risk that the counterparty may not honor its obligations to us. Before entering into any derivative financial instrument, we evaluate, by reviewing credit ratings and our business relationship according to our policies, the creditworthiness of the financial institutions and corporations that are prospective counterparties to our derivative financial instruments. We select our counterparties to the extent we believe that they have the financial capacity to meet their obligations in relation to these instruments. Under current financial conditions and volatility, we cannot assure that risk of non-compliance with the obligations agreed to with such counterparties is minimal. See notes 17.4 and 17.5 to Cemex, S.A.B. de C.V.’s 2022 audited consolidated financial statements included elsewhere in this annual report.
The fair value of derivative financial instruments is based on estimated settlement costs or quoted market prices and supported by confirmations of these values received from the counterparties to these financial instruments. The notional amounts of derivative financial instrument agreements are used to measure interest to be paid or received and do not represent the amount of exposure to credit loss.
231
Table of Contents
Interest Rate Risk, Foreign Currency Risk and Equity Risk
Interest Rate Risk. The table below presents tabular information of our fixed and floating rate non-current foreign currency-denominated debt as of December 31, 2022. Average floating interest rates are calculated based on forward rates in the yield curve as of December 31, 2022. Future cash flows represent contractual principal payments. The fair value of our floating rate non-current debt is determined by discounting future cash flows using borrowing rates available to us as of December 31, 2022 and is summarized as follows:
| Expected maturity dates as of December 31, 2022 | ||||||||||||||||||||||||||||
| Non-Current Debt(1) | 2023 | 2024 | 2025 | 2026 | After 2027 |
Total | Fair Value |
|||||||||||||||||||||
| (In millions of Dollars, except percentages) | ||||||||||||||||||||||||||||
| Variable rate |
0 | 174 | 878 | 653 | 45 | 1,750 | 1,788 | |||||||||||||||||||||
| Average interest rate |
3.17 | % | 4.96 | % | 4.00 | % | 5.24 | % | 5.40 | % | ||||||||||||||||||
| Fixed rate |
2 | 211 | 559 | 836 | 3,564 | 5,172 | 4,957 | |||||||||||||||||||||
| Average interest rate |
3.23 | % | 5.13 | % | 5.89 | % | 4.15 | % | 5.45 | % | ||||||||||||||||||
| (1) | The information above includes the current maturities of the non-current debt. Total non-current debt as of December 31, 2022 does not include our other financial obligations and the 5.125% Subordinated Notes for an aggregate amount of $2,854 million issued by consolidated entities. See notes 17.2 and 21.4 to Cemex, S.A.B. de C.V.’s 2022 audited consolidated financial statements included elsewhere in this annual report. |
As of December 31, 2022, we were subject to the volatility of floating interest rates, which, if such rates were to increase, may adversely affect our financing cost and our net income. As of December 31, 2020, 17% of our long-term debt bore floating rates at a weighted average interest rate of LIBOR plus 294 basis points. As of December 31, 2021, 10% of our long-term debt bore floating rates at a weighted average interest rate of LIBOR plus 150 basis points. As of December 31, 2022, 21% of our long-term debt bore floating rates at a weighted average interest rate of LIBOR plus 148 basis points. As of December 31, 2020, 2021 and 2022, if interest rates at that date had been 0.5% higher, with all other variables held constant, our net income for 2020, 2021 and 2022 would have been reduced by $17 million, $7 million and $13 million, respectively, as a result of higher interest expense on variable-rate debt. However, this analysis does not include the interest rate swaps held by us during 2020, 2021 and 2022. See notes 17.4 and 17.5 to Cemex, S.A.B. de C.V.’s 2022 audited consolidated financial statements included elsewhere in this annual report.
Foreign Currency Risk. Due to our geographic diversification, our revenues are generated in various countries and settled in different currencies. However, some of our production costs, including fuel and energy, and some of our cement prices, are periodically adjusted to take into account fluctuations between the Dollar and the other currencies in which we operate. For the year ended December 31, 2022, 21% of our revenues, before eliminations resulting from consolidation, were generated in Mexico, 27% in the United States, 5% in the United Kingdom, 4% in France, 3% in Germany, 2% in Poland, 2% in Spain, 2% in Philippines, 5% in Israel, 4% in the Rest of EMEAA segment, 2% in Colombia, 1% in Panama, 2% in Caribbean TCL, 2% in the Dominican Republic, 2% in the Rest of SCA&C segment and 16% from our Other operations.
Foreign exchange gains and losses occur by monetary assets or liabilities in a currency different from its functional currency and are recorded in the consolidated statements of operations, except for exchange fluctuations associated with foreign currency indebtedness directly related to the acquisition of foreign entities and related parties’ long-term balances denominated in foreign currency, for which the resulting gains or losses are reported in other comprehensive income. As of December 31, 2021 and 2022, excluding from the sensitivity analysis the impact of translating the net assets of foreign operations into our reporting currency and considering a hypothetical 10% strengthening of the Dollar against the Mexican Peso, with all other variables held constant, our net income for 2021 and 2022 would have decreased by $9 million and decreased $42 million, respectively, as a result of higher foreign exchange losses on our Dollar-denominated net monetary liabilities held in consolidated entities with other functional currencies. Conversely, a hypothetical 10% weakening of the Dollar against the Mexican Peso would have had the opposite effect.
232
Table of Contents
As of December 31, 2022, 77% of our total debt plus other financial obligations was Dollar-denominated, 13% was Euro-denominated, 2% was Pound Sterling-denominated, 5% was Mexican Peso-denominated, 2% was Philippine Peso-denominated, and 1% was denominated in other currencies. Therefore, we had a foreign currency exposure arising from the debt plus other financial obligations denominated in Dollars and the debt and other financial obligations denominated in Euros versus the currencies in which our revenues are settled in most countries in which we operate. We cannot guarantee that we will generate sufficient revenues in Dollars and Euros from our operations to service these obligations. As of December 31, 2022, we had implemented a derivative financing hedging strategy using foreign exchange options for a notional amount of $500 million to hedge the value in Dollar terms of revenues generated in Pesos to partially address this foreign currency risk. See notes 17.4 and 17.5 to Cemex, S.A.B. de C.V.’s 2022 audited consolidated financial statements included elsewhere in this annual report. Complementarily, we may negotiate other derivative financing hedging strategies in the future if either of our debt portfolio currency mix, interest rate mix, market conditions and/or expectations changes.
In addition, considering that Cemex S.A.B. de C.V.’s functional currency for all assets, liabilities and transactions associated with its financial and holding company activities is the Dollar, there is foreign currency risk associated with the translation of subsidiaries’ net assets denominated in different currencies (Mexican Peso, Euro, Pound Sterling and other currencies) into Dollars. When the Dollar appreciates, the value of Cemex S.A.B. de C.V.’s net assets denominated in other currencies decreases in terms of Dollars, generating negative foreign currency translation and reducing stockholders’ equity. Conversely, when the Dollar depreciates, the value of Cemex S.A.B. de C.V.’s net assets denominated in other currencies would increase in terms of Dollars generating the opposite effect. As mentioned above in our derivative financial instruments section, we have implemented a Dollar/Mexican Peso foreign exchange forward contract program to hedge foreign currency translation in connection with our net assets denominated in Mexican Pesos. See notes 2.5 and 17.5 to Cemex, S.A.B. de C.V.’s 2022 audited consolidated financial statements included elsewhere in this annual report.
Equity Risk. Equity risk represents the risk that the fair value of future cash flows of a financial instrument will fluctuate because of changes in the market price of Cemex, S.A.B. de C.V.’s and/or a third party’s shares.
Considering specific objectives, we have negotiated equity forward contracts on third-party shares. Under these equity derivative instruments, there is a direct relationship from the change in the fair value of the derivative with the change in price of the underlying share. All changes in fair value of such derivative instruments are recognized in the statement of operations as part of “Financial income and other items, net.” During the reported periods effects were not significant. As of December 31, 2022, we do not have derivative financial instruments based on the price of the parent company’s shares or any third-party’s shares. See notes 17.4 to Cemex, S.A.B. de C.V.’s 2022 audited consolidated financial statements included elsewhere in this annual report.
Liquidity Risk. Liquidity risk represents the risk that we will not have sufficient funds available to meet our obligations. In addition to cash flows provided by our operating activities, in order to meet our overall liquidity needs for operations, servicing debt and funding capital expenditures and acquisitions, we rely on cost-cutting and operating improvements to optimize capacity utilization and maximize profitability, as well as borrowing under credit facilities, proceeds of debt and equity offerings, and proceeds from asset sales. We are exposed to risks from changes in foreign currency exchange rates, prices and currency controls, interest rates, inflation, governmental spending, social instability and other political, economic and/or social developments in the countries in which we operate, any one of which may materially affect our results and reduce cash from operations. As of December 31, 2022, we had $1,450 million available under the committed revolving credit tranche under the 2021 Credit Agreement.
As of December 31, 2022, current liabilities, which included $987 million of current maturities of debt and other financial obligations, exceeded current assets by $1,020 million. It is noted that as part of our operating strategy implemented by our management, we operate with a negative working capital balance. For the year
233
Table of Contents
ended December 31, 2022, we generated net cash flows provided by operating activities of $1,475 million. In addition, as of December 31, 2022, we had $1,450 million available under the committed revolving credit facility under the 2021 Credit Agreement and had $560 million under other uncommitted lines of credit subject to the lenders’ availability. See notes 17.1, 17.2, 17.5 and 24.1 to Cemex, S.A.B. de C.V.’s 2022 audited consolidated financial statements included elsewhere in this annual report.
Investments, Acquisitions and Divestitures
The transactions described below represent our principal investments, acquisitions and divestitures completed during 2020, 2021 and 2022.
Investments and Acquisitions
On July 11, 2022, through a subsidiary in Germany, we completed the acquisition of a 53% stake in the German aggregates company ProStein for a total consideration of $21 million. The investment expands our aggregates business in the region and we estimate that it increases the life of the aggregates reserves for our operations in Central Europe for at least the next 25 years. The majority stake in ProStein’s assets adds a full range of fine and hard aggregates to our aggregates portfolio. In addition to supplying the greater Berlin area, the additional capacity can supply several urban centers in Poland the Czech Republic. ProStein’s assets include six active hardstone plants and six CDEW recovery sites. As of December 31, 2022, based on the preliminary valuation of the fair values of the assets acquired and liabilities assumed, we have not determined any goodwill.
On December 10, 2021, through a subsidiary in Mexico, we acquired Broquers Ambiental, a sustainable waste management company, for a total consideration of $13 million. Broquers Ambiental assets include a plant for solid waste treatment for its use as alternative fuel. During 2022, considering the fair values of the assets acquired and liabilities assumed, we determined goodwill of $4 million.
On October 4, 2021, we announced that we signed an agreement to acquire from HeidelbergCement a limestone quarry with a waste management operation near the Madrid metropolitan area and 3 concrete plants in the Balearic Islands.
On April 12, 2021, we announced that we signed an agreement to acquire from Eqiom Granulats two aggregates quarries and one rail-enabled platform in the North Paris Metropolitan area.
On February 16, 2021, we announced that we acquired the ready-mix assets of Beck Readymix Concrete Co. LTD., including three ready-mix concrete plants and one portable plant to service the San Antonio, Texas metropolitan area and surrounding areas.
In January 2021, one of our subsidiaries in Israel acquired two ready-mix concrete plants from Kinneret and Beton-He’Emek for an amount in shekels equivalent to $6 million. As of December 31, 2021, based on the preliminary valuation of the fair values of the assets acquired and liabilities assumed, we determined goodwill in the amount of $5 million.
During 2020, Cemex España made the 2020 CLH Tender Offer. As of December 31, 2022, considering the effects of the 2020 CLH Tender Offer and additionally including shares of CLH purchased by us in the secondary market, we indirectly own 95.30% of all outstanding shares of CLH (which excludes shares of CLH owned by CLH). See “Item 5—Operating and Financial Review and Prospects—Recent Developments—Recent Developments Relating to Our Business and Operations.”
From March 10, 2020 to March 24, 2020, under the repurchase program authorized at Cemex, S.A.B. de C.V.’s ordinary general shareholders’ meeting held on March 28, 2019, Cemex, S.A.B. de C.V. repurchased
234
Table of Contents
378.2 million CPOs, which represented 2.5% of Cemex, S.A.B. de C.V.’s outstanding share capital as of December 31, 2019, at a weighted-average price of 5.01 Mexican Pesos per CPO, which was equivalent to an amount of $83.2 million, excluding value-added tax. On April 8, 2020, we announced that, to enhance our liquidity, we suspended the Cemex, S.A.B. de C.V. share repurchase program for the remainder of 2020.
On January 29, 2020, CHP announced the results of its stock rights offering pursuant to which 8,293,831,169 common shares of CHP were issued and listed on the Philippine Stock Exchange on March 4, 2020. As of December 31, 2022, after giving effect to the stock rights offering, and other repurchased in the market over the last few years, our indirect ownership of CHP’s outstanding common shares had further increased to 77.90%. See “Item 5—Operating and Financial Review and Prospects—Recent Developments—Recent Developments Relating to Our Business and Operations.”
During the first six months of 2020, one of our subsidiaries in Israel acquired Netivei Noy from Ashtrom Industries for an amount in shekels equivalent to $33 million. After the conclusion of the purchase price allocation to the fair values of the assets acquired and liabilities assumed of this business, we determined goodwill of $2 million.
Divestitures
During 2020, 2021 and 2022, we made divestitures of $722 million, $211 million and $569 million, respectively (which included fixed assets of $44 million, $62 million and $155 million, respectively).
On October 25, 2022, we created a partnership with Advent. As part of the partnership we sold to Advent a 65% stake in Neoris for a total consideration of $119 million. While surrendering control to Advent, we retained a 34.8% stake and remained a key strategic partner and customer of Neoris. Our retained 34.8% stake in Neoris was remeasured at fair value at the date of loss of control, and is subsequently accounted for under the equity method and is presented in the line item “Investments in associates and joint ventures.” Neoris’ results for the years ended December 31, 2020 and 2021 and for the period from January 1 to October 25, 2022, and are reported in the statements of operations, net of income tax, in the single line item “Discontinued operations,” including in 2022 as a gain on sale of $117 million, net of the reclassification of foreign currency translation effects accrued in equity until the date of loss of control.
On August 31, 2022, we announced that we, through certain of our subsidiaries, concluded the sale agreed in December 2021 of our operations in Costa Rica and El Salvador to affiliates of Cementos Progreso Holdings, S.L. for a total consideration of $325 million, related to our aggregate controlling interest. The divested assets consisted of one fully integrated cement plant, one grinding station, seven ready-mix plants, one aggregate quarry, as well as one distribution center in Costa Rica and one distribution center in El Salvador. As of December 31, 2021, the assets and liabilities related to our operations in Costa Rica and El Salvador were presented in the financial statements in the line items “Assets held for sale” and “Liabilities directly related to assets held for sale.” Our operations of these assets in Costa Rica and El Salvador for the years ended December 31, 2020 and 2021 and for the period from January 1, 2022 to August 31, 2022 are reported in the statements of operations, net of income tax, as part of the single line item “Discontinued operations,” including in 2022 a gain on sale of $240 million, which includes the reclassification of foreign currency translation effects accrued in equity until the disposal date.
On July 9, 2021, we announced that we concluded the sale agreed in March 2019 of our white cement business, except for Mexico and the U.S., to Çimsa Çimento Sanayi Ve Ticaret A.S¸ for a total consideration of $155 million. Assets sold included our Buñol cement plant in Spain and white cement customer list. Our operations of these assets in Spain for the year ended December 31, 2020 and for the period from January 1, 2021 to July 9, 2021 are reported in the statements of operations, net of income tax, as part of the single line item “Discontinued operations,” including in 2021 a loss on sale of $67 million net of the proportional allocation of goodwill of $41 million.
235
Table of Contents
On March 31, 2021, we sold 24 concrete plants and one aggregates quarry in France to Holcim for an amount in Euros equivalent to $44 million. These assets are located in the Rhône-Alpes region in the Southeast of France, east of our operations in Lyon. We will retain our business in Lyon. The operations related to these assets for the year ended December 31, 2020 and for the three-month period ended March 31, 2021 are presented in our statements of operations, net of income tax, as part of the single line item “Discontinued operations.”
On August 3, 2020, through an affiliate in the United Kingdom, we closed the sale of certain assets to Breedon for an amount in Pounds equivalent to $230 million, including $30 million of debt. The assets included 49 ready-mix plants, 28 aggregate quarries, four depots, one cement terminal, 14 asphalt plants, four concrete products operations, as well as a portion of our paving solutions business in the United Kingdom. After completion of this divestiture, we maintain a significant footprint in key operating geographies in the United Kingdom related to the production and sale of cement, ready-mix concrete, aggregates, asphalt and paving solutions, among others. Our operations of these assets in the United Kingdom for the period from January 1, 2020 to August 3, 2020, which includes a loss on sale of $57 million net of the proportional allocation of goodwill of $47 million, is presented in our statements of operations, net of tax, as part of the single line item “Discontinued operations.”
On March 6, 2020, we concluded the sale of our U.S. affiliate Kosmos, a partnership with a subsidiary of Buzzi Unicem S.p.A. in which we held a 75% interest, to Eagle Materials Inc. for $665 million. The share of proceeds to us from this transaction was $499 million before transactional and other costs and expenses. The assets that were divested consisted of Kosmos’ cement plant in Louisville, Kentucky, as well as related assets which include seven distribution terminals and raw material reserves. The operations of these assets in the United States for the period from January 1, 2020 to March 6, 2020, which includes a gain on sale of $14 million, net of the proportional allocation of goodwill of $291 million, is presented in our statements of operations, net of income tax, as part of the single line item “Discontinued operations.”
Recent Developments
Recent Developments Relating to Our Indebtedness
| • | On April 21, 2023, Cemex, S.A.B. de C.V. informed the Mexican Stock Exchange (Bolsa Mexicana de Valores) (the “BMV” or “MSE”) that it issued a notice of full redemption with respect to the June 2027 Dollar Notes. The aggregate principal amount of the June 2027 Dollar Notes being redeemed is U.S. $933,260,000.00, which represents the total aggregate principal amount of the June 2027 Dollar Notes outstanding as of April 21, 2023. The June 2027 Dollar Notes are expected to be fully redeemed on June 5, 2023 (the “Redemption Date”) at a redemption price equal to 103.688% of the principal amount of the June 2027 Dollar Notes, plus accrued and unpaid interest, if any, to, but excluding, the Redemption Date. |
| • | During April 2023, Cemex amended its Credit Agreement to trigger a fallback from Dollar LIBOR to the Benchmark Replacement, which is based on the Secured Overnight Finance Rate (the “SOFR”). |
| • | In March 2023, Cemex amended its Dollar interest rate swap contracts with a notional amount of $750 million to fix interest payments of existing bank loans bearing Dollar floating rates, to replace 3-month Dollar LIBOR with 3-month Term SOFR. |
| • | As part of the temporary use of proceeds of the 9.125% Subordinated Notes, on March 17, 2023, Cemex repaid in full the balance outstanding under the revolving credit facility of its 2021 Credit Agreement described in note 17.1 to Cemex, S.A.B. de C.V.’s 2022 audited consolidated financial statements included elsewhere in this annual report. As a result, the available committed revolving credit facility increased to $1,750. Also, during March 2023, we repurchased $66.74 million aggregate principal amount of our June 2027 Dollar Notes. The remaining amount was used for general corporate purposes. |
| • | On March 14, 2023, Cemex, S.A.B. de C.V. issued $1.0 billion aggregate principal amount of the 9.125% Subordinated Notes with no fixed maturity and subordinated to all senior obligations, and |
236
Table of Contents
| senior only to equity, in transactions exempt from registration pursuant to Rule 144A and Regulation S under the Securities Act (the “9.125% Subordinated Notes”). Cemex intends to allocate an amount equal to the net proceeds from the offering of the 9.125% Subordinated Notes to finance or refinance, in whole or in part, one or more new or existing eligible projects related to eligible green projects, which include capital, operating and research and development expenditures related to pollution prevention and control, renewable energy, energy efficiency, clean transportation, sustainable water and wastewater management, and eco-efficient and/or circular economy adapted products, production technologies and processes. |
| • | On February 8, 2023, Cemex announced that all our Receivables Financing Agreements are now linked to the Framework, which is aligned to our sustainability goals. The Framework references three climate action key performance indicators: (i) net CO2 emissions per ton of cementitious material; (ii) power consumption from clean energy sources in cement; and (iii) the alternative fuels rate. The annual performance in these metrics may result in an adjustment of the interest rate margin paid under these programs. |
Recent Developments Relating to Cemex, S.A.B. de C.V.’s Shareholders’ Meetings
On February 13, 2023, Cemex, S.A.B. de C.V. filed with the SEC and the BMV the notice and agenda, and supplemental information for its 2023 Ordinary General Shareholders’ Meeting (the “AGM”), which took place in the city of Monterrey, Nuevo Leon, Mexico on March 23, 2023. The aforementioned documents described the topics to be discussed and voted during the AGM, providing additional context for the items in the agenda.
On February 23, 2023, Cemex, S.A.B. de C.V. filed with the SEC and the BMV the list of documents to be proposed for approval by its shareholders at the AGM. The list of documents includes, among others: (i) the proposal for the appointment of the members of Cemex, S.A.B. de C.V.’s Board of Directors, which will be voted on an individual basis; (ii) the proposal for the appointment of the members of the Audit Committee, the Corporate Practices and Finance Committee and the Sustainability, Climate Action, Social Impact, and Diversity Committee, as well as their respective presidents and secretaries, which will be voted on an individual basis, as opposed to on a “group slate” basis as it occurred in previous meetings; (iii) the proposal to set, from March 23, 2023 to the date of the next Cemex, S.A.B. de C.V. ordinary general shareholders’ meeting, the compensation, as honoraria, for each appointed member of Cemex, S.A.B. de C.V.’s Board of Directors for each meeting they attend, and the compensation, as honoraria, for each member of the Audit Committee, the Corporate Practices and Finance Committee, and the Sustainability, Climate Action, Social Impact, and Diversity Committee, for each committee meeting they attend; and (iv) the proposal to set the amount of $500 million or its equivalent in Mexican Pesos as the maximum amount of resources that during fiscal year 2023 (until the next ordinary general shareholders’ meeting of Cemex, S.A.B. de C.V. is held in 2024), Cemex, S.A.B. de C.V. may use for the acquisition of its own shares directly or through securities that represent such shares. No declaration and payment of dividends by Cemex, S.A.B. de C.V. was included in the call notice and agenda for the AGM.
On March 24, 2023, Cemex, S.A.B. de C.V. filed with the SEC and the BMV the resolutions adopted at the AGM. The most significant items that were approved by the shareholders at the AGM were: (i) the appointment of the members of Cemex, S.A.B. de C.V.’s Board of Directors, on an individual basis; (ii) the appointment of the members of the Audit Committee, the Corporate Practices and Finance Committee and the Sustainability, Climate Action, Social Impact, and Diversity Committee, on an individual basis; (iii) setting the compensation, as honoraria, for each member of Cemex, S.A.B. de C.V.’s Board of Directors for each meeting they attend, and the compensation, as honoraria, for each member of the Audit Committee, the Corporate Practices and Finance Committee, and the Sustainability, Climate Action, Social Impact, and Diversity Committee, for each Committee meeting they attend, from March 23, 2023 to the date of the next Cemex, S.A.B. de C.V. ordinary general shareholders’ meeting in 2024; and (iv) setting the amount of $500 million, or its equivalent in Mexican Pesos, as the maximum amount of resources that Cemex, S.A.B. de C.V. may use for the acquisition of its own shares or securities that represent such shares, during fiscal year 2023 (until the next ordinary general shareholders’ meeting of Cemex, S.A.B. de C.V. is held in 2024).
237
Table of Contents
As a result of the AGM, as of March 23, 2023, (i) the Board of Directors is comprised of 13 members, with the addition of María de Lourdes Melgar Palacios to Cemex, S.A.B. de C.V.’s Board of Directors, resulting in the proportion of members of the Board of Directors considered independent under Mexican Securities Market Law (as defined below) criteria increasing to 77%; (ii) Rogelio Zambrano Lozano (Chairman), Fernando A. González Olivieri, Marcelo Zambrano Lozano, Armando J. García Segovia, Rodolfo García Muriel, Francisco Javier Fernández Carbajal, Armando Garza Sada, David Martínez Guzmán, Everardo Elizondo Almaguer, Ramiro Gerardo Villarreal Morales, Gabriel Jaramillo Sanint, Isabel María Aguilera Navarro, and María de Lourdes Melgar Palacios are the members of the Cemex, S.A.B. de C.V.’s Board of Directors; (iii) Everardo Elizondo Almaguer (President), Francisco Javier Fernández Carbajal, and Gabriel Jaramillo Sanint are the members of the Audit Committee of Cemex, S.A.B. de C.V.’s Board of Directors; (iv) Francisco Javier Fernández Carbajal (President), Armando Garza Sada, and Rodolfo García Muriel are the members of the Corporate Practices and Finance Committee of Cemex, S.A.B. de C.V.’s Board of Directors; (v) Armando J. García Segovia (President), Marcelo Zambrano Lozano, Isabel María Aguilera Navarro, and María de Lourdes Melgar Palacios are the members of the Sustainability, Climate Action, Social Impact, and Diversity Committee of Cemex, S.A.B. de C.V. Board of Directors; (vi) the compensation amount, as honoraria, for each of the 13 members of Cemex, S.A.B. de C.V.’s Board of Directors was set at Ps519,000.00 for each meeting they attend; (vii) the compensation amount, as honoraria, for each of the three members of the Audit Committee, each of the three members of the Corporate Practices and Finance Committee, and each of the four members of the Sustainability, Climate Action, Social Impact, and Diversity Committee was set at Ps125,000.00 for each Committee meeting they attend; and (viii) the 661.9 million shares repurchased during 2022 under the repurchase programs were proposed and subsequently approved for cancellation, thus, as of March 23, 2023, 99.73% of Cemex, S.A.B. de C.V.’s outstanding share capital was represented by CPOs, which consists of two Series A shares and one Series B share, and each ADS represented by ten CPOs.
Regarding item (i) of the resolutions adopted during the AGM held on March 23, 2023, the biography of Mrs. Melgar Palacios is as follows:
| Name: | Marĺa de Lourdes Melgar Palacios. | |
| Age as of December 31, 2022: | 60. | |
| Citizenship: | Mexican. | |
| Nationality: | Mexican and Spanish. | |
| Type of Board Member: | Independent. | |
| Tenure on CEMEX’s Board of Directors: | Since March 23, 2023. | |
| Board Memberships at Listed Entities: | She is a member of the Board of Directors of Smurfit Kappa Group PLC, an Irish conglomerate listed in Ireland, and Banco Santander México, S.A., Institución de Banca Múltiple, Grupo Financiero Santander México, which is currently listed in Mexico and expects to be delisted in 2023. | |
| Other Current Roles: | She is a researcher affiliated with the Center of Collective Intelligence at the Massachusetts Institute of Technology (MIT) and non-resident researcher at the Baker Institute Center for Energy Studies. She is a member of the board of directors of Mount Holyoke College (academic institution). Additionally, she is a member of the board of directors of the following non-profit organizations: Global Energy Alliance for People and Planet, the Natural Resource Governance Institute, Phius, and Chapter Zero Mexico, an organization focused on energy efficiency in buildings. Mrs. Melgar | |
238
Table of Contents
| Palacios is a member of the International Women’s Forum, having chaired the Mexican Local Forum from 2016 to 2018. | ||
| Experience: | From 1997 to 2005, Mrs. Melgar Palacios was part of the Mexican Foreign Service. From 1998 to 2002, she served as the General Director of the Office of International Affairs of the Ministry of Energy, having participated in the strategy and negotiation to stabilize the international oil market, and led the energy sector in the Continental Shelf Delimitation Treaty with the United States in the Western Gulf of Mexico (Doughnut Hole). From 2005 to 2007, she served as Minister at the Mexican permanent mission to the Organization for Economic Co-Operation and Development (OECD), being in charge of coordinating of various topics and representing Mexico in meetings regarding matters such as corporate governance, anticorruption, sustainable development, among others. Subsequently, she served as Undersecretary of Electricity from December 2012 to February 2014 and as Undersecretary of Hydrocarbons from February 2014 to July 2016, at the Ministry of Energy of Mexico. Mrs. Melgar Palacios also held the Robert E. Wilhelm chair at the Massachusetts Institute of Technology (MIT).
Her academic and professional experience, as well as her experience in non-profit organizations and matters related to energy, sustainability, climate action, and corporate governance, provides the Board of Directors with a unique perspective on said matters, all of which are key components in the Company’s future. | |
As of March 23, 2023, the composition of Cemex, S.A.B. de C.V.’s Board of Directors was as follows:
Snapshot of the Board of Directors as of March 23, 2023
| Name |
Director Since |
Independence | Committee Memberships | Participation in Boards of Other Public Companies |
||||||||||||||||||||
| AC | CPFC | SCASIDC | ||||||||||||||||||||||
|
|
1987 | — | 1 | |||||||||||||||||||||
| Fernando Ángel González Olivieri |
2015 | — | 2 | |||||||||||||||||||||
| Marcelo Zambrano Lozano |
2017 | — | • | 2 | ||||||||||||||||||||
| Armando J. García Segovia |
1983 | ✓ |

|
2 | ||||||||||||||||||||
| Rodolfo García Muriel |
1985 | ✓ | • | — | ||||||||||||||||||||
| Francisco Javier Fernández Carbajal |
2012 | ✓ | • |
|
3 | |||||||||||||||||||
| David Martínez Guzmán |
2015 | ✓ | 3 | |||||||||||||||||||||
| Armando Garza Sada |
2015 | ✓ | • | 6 | ||||||||||||||||||||
| Everardo Elizondo Almaguer |
2016 | ✓ |

|
3 | ||||||||||||||||||||
| Ramiro Villarreal Morales |
2017 | ✓ | 3 | |||||||||||||||||||||
| Gabriel Jaramillo Sanint |
2018 | ✓ | • | 1 | ||||||||||||||||||||
| Isabel María Aguilera Navarro |
2019 | ✓ | • | 4 | ||||||||||||||||||||
| María de Lourdes Melgar Palacios |
2023 | ✓ | • | 2 | ||||||||||||||||||||
| AC = Audit Committee |
 Chairman of the Board of Directors
 |
|||||||||||||||||||||||
| CPFC = Corporate Practices and Finance Committee |
President of the Committee • Member |
|||||||||||||||||||||||
| SCASIDC = Sustainability, Climate Action, Social Impact, and Diversity Committee |
||||||||||||||||||||||||
 Rogelio Zambrano Lozano
239
Table of Contents
Gender
As of March 23, 2023, Cemex, S.A.B. de C.V.’s Board of Directors was comprised of 13 members, of which 85% were men and 15% were women.
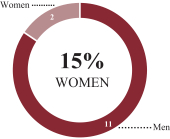
Tenure (in years as a member of the Board of Directors)
As of March 23, 2023, Cemex, S.A.B. de C.V.’s Board of Directors’ average tenure was 14 years.
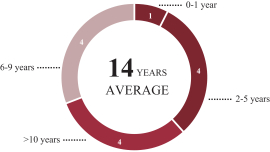
Independence
As of March 23, 2023, Cemex, S.A.B. de C.V.’s Board of Directors was comprised of 13 members, of which 23% were considered to be non-independent and 77% were considered to be independent under Mexican Securities Market Law (as defined below).
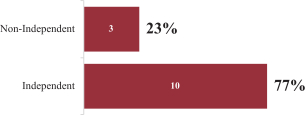
Recent Developments Relating to our Stock Repurchase Program
From January 1, 2023 to March 31, 2023, Cemex, S.A.B. de C.V. did not repurchase any CPOs under any stock repurchase program. During 2022, under the repurchase programs authorized at Cemex, S.A.B. de C.V.’s ordinary general shareholders’ meetings held on March 25, 2021, and March 24, 2022, Cemex, S.A.B. de C.V. repurchased 220.6 million CPOs, at a weighted average price in Mexican pesos equivalent to $0.5026 per CPO, which was equivalent to an amount of $110.9 million. The shares repurchased under share buyback program in fiscal year 2022 were proposed and subsequently approved for cancellation at Cemex, S.A.B. de C.V.’s Annual Ordinary General Shareholders’ Meeting held on March 23, 2023. Thus, as of March 23, 2023, 99.73% of Cemex, S.A.B. de C.V.’s outstanding share capital was represented by CPOs, with each ADS representing ten CPOs. No shares were repurchased from March 25, 2021 to December 31, 2021.
240
Table of Contents
Recent Developments Relating to Our Business and Operations
| • | On January 24, 2023, through a subsidiary of ours, we signed a definitive agreement for the purchase of the assets of Atlantic Minerals Limited in Newfoundland, Canada, consisting of a construction and chemical aggregates quarry and port operations for a price of $75 million. Subject to the consummation of the asset purchase, with this investment, we intend to secure a new long-term aggregates reserve mainly for our extensive Florida operations and the U.S. east coast, as well as a source for chemical-grade stone serving a broader geographic footprint. The closing of this transaction is subject to the satisfaction of certain customary conditions, including consent from government agencies. We expect to finalize this acquisition at the end of the first quarter of 2023 or soon thereafter. |
| • | On January 25, 2023, in Manila, Philippines, CASEC, an indirect subsidiary of Cemex, filed a Tender Offer Report on Form 19-1 with the Securities and Exchange Commission of the Philippines and the Philippine Stock Exchange, pursuant to Rule 19 of the Securities Regulation Code of the Philippines, in connection with its intention to conduct a voluntary tender offer (the “CHP Tender Offer”) to acquire a minimum of one and a maximum of 1,614,000,000 common shares of CHP, which, if successful, would not cause CASEC to own 90% or more of CHP’s outstanding common shares. The tender offer period commenced on February 16, 2023 and lasted for a period of 20 business days, ending on March 16, 2023. Payment of the net proceeds of the validly tendered shares took place on March 30, 2023. As part of the CHP Tender Offer, CASEC acquired 1,614,000,000 common shares of CHP, resulting in CASEC owning 89.86% of the outstanding common shares of CHP, with a calculated paid consideration of 1.30 Philippine Pesos per share, an equivalent of 2,098.20 million Philippine Pesos ($38.65 million as of March 31, 2023, based on an exchange rate of 54.29 Philippine Pesos to $1.00) for all the acquired shares. |
| • | On January 30, 2023, through a subsidiary of ours, we acquired a 51% ownership interest in Israel-based SHTANG Recycle LTD, a CDEW recycling company, for $13 million. As of the date of this report, Cemex believes that the acquisition aligns with our strategy to strengthen our business in developed markets through bolt-on acquisitions in businesses with strong circular and sustainable attributes. SHTANG has been awarded a 13-year license to build and operate a state-of-the-art CDEW recycling facility that is expected to be capable of processing approximately 600,000 tons of waste per year. The CDEW will be used by our Regenera business as raw materials for aggregate production. |
| • | On February 3, 2023, the Colombian Financial Superintendency (Superintendencia Financiera de Colombia) authorized Cemex España to commence a public delisting tender offer (the “Delisting CLH Offer”) to acquire a minimum of one ordinary share and a maximum of 26,281,913 ordinary shares of CLH registered with the RNVE and the BVC. The period to tender CLH shares under the Delisting CLH Offer concluded on February 28, 2023, with the final results of the Delisting CLH Offer being confirmed on March 3, 2023. As a result of the Delisting CLH Offer, we increased our interest to 99.46% of CLH (excluding shares owned by CLH) and delisted CLH’s shares from the BVC. We currently expect the registry of CLH in the RNVE to be canceled during the first half of 2023. The total consideration that we paid as a result of the acquisition of the validly tendered shares amounted to 4,735 Colombian Pesos per share, totaling 110,007,999,310 Colombian Pesos ($23.64 million as of March 31, 2023, based on an exchange rate of 4,654.42 Colombian Pesos to $1.00). Additionally, we expect legal actions from minority shareholders of CLH that believe the Delisting CLH Offer breached their rights. However, as of the date of this report, Cemex believes any such legal actions would not be adversely resolved against us, but if adversely resolved, we believe this would not have a material adverse impact on our operating results, liquidity or financial position. For more information, see “Item 3—Key Information—Risk Factors—Risks Relating to Our Business and Operations—We are subject to restrictions and reputational risks resulting from non-controlling interests held by third parties in our consolidated subsidiaries. As of the date of this annual report, we control three publicly listed companies, where this risk is heightened.” |
241
Table of Contents
| • | On March 1, 2023, we announced that on February 28, 2023, Sustainalytics updated its second-party opinion to Cemex’s Green Financing Framework (as described herein), confirming that it aligns with Green Bond Principles 2021, the Green Loan Principles 2021, and the Transition Finance Handbook 2020. |
| • | On April 21, 2023, we announced that Juan Romero Torres, current Executive Vice President of Sustainability, Commercial and Operational Development of Cemex, S.A.B. de C.V. had decided to retire effective as of June 1, 2023. Mr. Romero’s current responsibilities will be allocated to other members of Cemex’s Executive Committee. |
Recent Developments Relating to Our Regulatory Matters and Legal Proceedings
Environmental Matters
Mexico
The trial period of the Emissions Trading System, in which Cemex participated, ended on December 31, 2022. During a conference on climate change, the Mexican government presented the contribution determinations, increasing the national greenhouse gas reduction goal from 22% to 35% in 2030, with respect to its baseline. The Emissions Trading System in Mexico is expected to begin as soon as 2024.
Tax Matters
Spain
Tax Assessment for the years 2006 to 2009
On January 18, 2023, the Spanish Supreme Court, considering the annulment recourse accepted in December 2022, reversed its decision and resolved to admit the filing of Cemex España’s cassation appeal. On March 27, 2023, Cemex España filed the cessation appeal before the Spanish Supreme Court. See “Item 4—Information on the Company—Regulatory Matters and Legal Proceedings—Tax Matters—Spain—Tax Assessment for the years 2006 to 2009.”
Other Legal Proceedings
Egypt Share Purchase Agreement
On February 14, 2023, the High Constitutional Court determined that Law 32/2014 is constitutionally compliant. This determination would allow Cemex to challenge the legal standing of all current lawsuits and protect Cemex’s investment in Egypt. As a result of the determination made by the High Constitutional Court, the two pending cases were resolved in favor of Cemex on February 25, 2023. The plaintiffs have 60 days from the date of the resolution to file an appeal. If the plaintiffs fail to appeal this resolution within the established deadline, these proceedings will be closed. See “Item 4—Information on the Company—Regulatory Matters and Legal Proceedings—Other Legal Proceedings—Egypt Share Purchase Agreement” for more information.
Maceo, Colombia – Legal Proceedings in Colombia
On March 29, 2023, the former Vice President of Planning of CLH, who was also Cemex Colombia’s Director of Planning, and the Representative were found guilty by the first instance judge. The former Vice President of Planning of CLH was found guilty of unfair administration, illicit enrichment, and forgery of private documents, and was sentenced to 15 years in prison and approximately $7.4 million. The Representative was found guilty of illicit enrichment, forgery of private documents, and money laundering, and was sentenced to 21 years in prison and approximately $7.6 million. Both individuals filed an appeal against the ruling on March 29, 2023. See “Item 4—Information on the Company—Regulatory Matters and Legal Proceedings—Other Legal Proceedings—Maceo, Colombia—Legal Proceedings in Colombia” for more information.
242
Table of Contents
Recent Developments Relating to Our Major Shareholders
On February 9, 2023, Blackrock filed with the SEC Amendment No. 14 to a statement on Schedule 13G, stating that, as of their calculations made as of January 31, 2023, Blackrock beneficially owned 1,534,821,421 CPOs, representing 10.1% of Cemex, S.A.B. de C.V.’s outstanding capital stock. BlackRock does not have voting rights different from our other non-Mexican holders of CPOs. As required by Cemex, S.A.B. de C.V.’s by-laws, Cemex, S.A.B. de C.V.’s Board of Directors is required to approve BlackRock’s beneficial ownership of Cemex, S.A.B. de C.V.’s outstanding capital stock. Pursuant to the authorizations by Cemex, S.A.B. de C.V.’s Board of Directors, BlackRock is authorized to acquire up to 13% of Cemex, S.A.B. de C.V.’s capital stock with voting rights.
On March 3, 2023, Baillie Gifford filed with the SEC Amendment No. 1 to a statement on Schedule 13G, stating that, as of their calculations made as of February 28, 2023, Baillie Gifford beneficially owned 752,914,110 CPOs, representing 4.97% of Cemex, S.A.B. de C.V.’s outstanding capital stock. Baillie Gifford does not have voting rights different from our other non-Mexican holders of CPOs.
Item 6—Directors, Senior Management and Employees
Senior Management and Directors
Senior Management
Set forth below is the name, position, and experience of each member of our senior management team as of December 31, 2022. The terms of office of the senior managers are indefinite.
| Name: | Fernando A. González Olivieri. | |
| Age as of December 31, 2022: | 68. | |
| Citizenship: | Mexican. | |
| Nationality: | Mexican. | |
| Title: | Chief Executive Officer. | |
| Seniority: | Since 1989 | |
| Tenure as Cemex’s Chief Executive Officer: | Since 2014. | |
| Type of Board Member: | Non-Independent. | |
| Tenure on Cemex’s Board of Directors: | Since 2015. | |
| Tenure on Cemex’s Sustainability Committee: | Since 2022. | |
| Board Membership at Listed Entities: | Mr. González Olivieri is a member of the board of directors of GCC, S.A.B. de C.V. (formerly Grupo Cementos de Chihuahua, S.A.B. de C.V.), and of Axtel, S.A.B. de C.V. | |
| Experience at Cemex and Other Relevant Experience: | Mr. González Olivieri joined Cemex in 1989 and held various positions in the Strategic Planning, Business Development and Human Resources departments through 1998. From 1998 through 2009, Mr. González Olivieri led various regions of Cemex, including SCA&C, Europe, Asia and Oceania. He was appointed as Cemex’s Executive Vice President of Planning and Development in May 2009, and he was appointed Cemex’s Chief Financial Officer in 2011. Mr. González Olivieri held these positions until he was named Chief Executive Officer in 2014. | |
243
Table of Contents
| With his comprehensive knowledge of Cemex’s organization and the markets where the company operates around the world, Mr. González Olivieri brings to Cemex’s Board of Directors and Senior Management a unique global perspective and innovative leadership, that directly contributes to formulating and implementing a results-oriented business strategy. With over 30 years of direct involvement in top management positions, and a detailed understanding of Cemex’s four main businesses (cement production, ready-mix concrete, aggregates and Urbanization Solutions), he has given particular attention to constantly improving Cemex’s Health and Safety policies, and to implementing a sustainability strategy aimed at achieving Net Zero Carbon growth and development.
Mr. González Olivieri is a member of the Board of Trustees of Tecmilenio University, which forms part of the Instituto Tecnológico y de Estudios Superiores de Monterrey (a Mexican academic institution). | ||
| Education: | He holds a B.A. degree in Business Administration, and an M.B.A. from the Instituto Tecnológico y de Estudios Superiores de Monterrey. | |
| Name: | Jaime Muguiro Domínguez. | |
| Age as of December 31, 2022: | 54. | |
| Citizenship: | Spanish. | |
| Nationality: | Spanish. | |
| Title: | President of Cemex USA. | |
| Seniority: | Since 1996. | |
| Tenure as President of Cemex USA: | Since 2019. | |
| Experience at Cemex and Other Relevant Experience: | Mr. Muguiro Domínguez has held several executive positions in the Strategic Planning, Business Development, Ready-Mix Concrete, Aggregates and Human Resources areas. He headed Cemex’s operations in Egypt, our former Mediterranean Region operations, and more recently, our operations in the South, Central America, and the Caribbean region. | |
| Education: | He holds a B.A. degree in Management from San Pablo CEU University in Spain, a Law degree from the Universidad Complutense de Madrid, and an MBA from the Massachusetts Institute of Technology. | |
| Name: | Ricardo Naya Barba. | |
| Age as of December 31, 2022: | 50. | |
| Citizenship: | Mexican. | |
| Nationality: | Mexican. | |
| Title: | President of Cemex Mexico. | |
| Seniority: | Since 1996. | |
244
Table of Contents
| Tenure as President of Cemex México: | Since 2019. | |
| Experience at Cemex and Other Relevant Experience: | Mr. Naya Barba has held several executive positions, including Vice President of Strategic Planning for the South, Central America and the Caribbean region, Vice President of Strategic Planning for the Europe, Middle East, Africa and Asia region, President of Cemex Poland and the Czech Republic, Vice President of Strategic Planning for the United States, Vice President of Commercial and Marketing in Mexico, Vice President of Distribution Segment Sales in Mexico, and most recently, President of Cemex Colombia. | |
| Education: | He holds a B.A. degree in Economics from the Instituto Tecnológico y de Estudios Superiores de Monterrey and an M.B.A. from the Massachusetts Institute of Technology. | |
| Name: | Sergio Mauricio Menéndez Medina. | |
| Age as of December 31, 2022: | 52. | |
| Citizenship: | Mexican. | |
| Nationality: | Mexican. | |
| Title: | President of Cemex Europe, Middle East, Africa & Asia. | |
| Seniority: | Since 1993. | |
| Tenure as President of Cemex Europe, Middle East, Africa & Asia: | Since 2020. | |
| Experience at Cemex and Other Relevant Experience: | Mr. Menéndez Medina has held several executive positions, including Director of Planning and Logistics in Asia, Corporate Director of Commercial Development, President of Cemex Philippines, Vice President of Strategic Planning for the Europe, Middle East, Africa and Asia region, President of Cemex Egypt, Vice President of Infrastructure Segment and Government Sales in Mexico, and most recently, as Vice President of Distribution Segment Sales in Mexico. | |
| Education: | He holds a B.S. degree in Industrial Engineering from the Instituto Tecnológico y de Estudios Superiores de Monterrey and an M.B.A. from Stanford University. | |
| Name: | José Antonio González Flores. | |
| Age as of December 31, 2022: | 52. | |
| Citizenship: | Mexican and Spanish. | |
| Nationality: | Mexican. | |
| Title: | Executive Vice President of Strategic Planning and Business Development. | |
| Seniority: | Since 1998. | |
| Tenure as Executive Vice President of Strategic Planning and Business Development: | Since 2020. | |
245
Table of Contents
| Experience at Cemex and Other Relevant Experience: | Mr. González Flores has held executive positions in the Finance, Strategic Planning, and Corporate Communications and Public Affairs areas, and, prior to his current role, was our Executive Vice President of Finance and Administration (CFO). | |
| Additionally, Mr. González Flores is a member of the board of directors of GCC (formerly Grupo Cementos de Chihuahua, S.A.B. de C.V.) and is an alternate director of the board of directors of Axtel, S.A.B. de C.V. | ||
| Education: | He holds a B.S. degree in Industrial Engineering from the Instituto Tecnológico y de Estudios Superiores de Monterrey and an M.B.A. from Stanford University. | |
| Name: | Luis Hernández Echávez. | |
| Age as of December 31, 2022: | 59. | |
| Citizenship: | Mexican. | |
| Nationality: | Mexican. | |
| Title: | Executive Vice President of Digital and Organization Development. | |
| Seniority: | Since 1996. | |
| Tenure as Executive Vice President of Digital and Organization Development: | Since 2020. | |
| Experience at Cemex and Other Relevant Experience: | Mr. Hernández Echávez has held senior management positions in Strategic Planning and Human Resources. In his current position, he heads the areas of Organization and Human Resources, Information Technology, Digital Innovation, as well as Cemex Ventures. | |
| Education: | He holds a B.S. degree in Civil Engineering from the Instituto Tecnológico y de Estudios Superiores de Monterrey, a Master’s degree in Civil Engineering, and an MBA from the University of Texas at Austin.
| |
| Name: | Maher Al-Haffar. | |
| Age as of December 31, 2022: | 64. | |
| Citizenship: | American. | |
| Nationality: | American. | |
| Title: | Executive Vice President of Finance and Administration and Chief Financial Officer. | |
| Seniority: | Since 2000. | |
| Tenure as Executive Vice President of Finance and Administration and Chief Financial Officer: | Since 2020. | |
| Experience at Cemex and Other Relevant Experience: | Mr. Al-Haffar has held several executive positions, including Managing Director of Finance, Head of Investor Relations, and most recently, Executive Vice President of Investor Relations, Corporate Communications and Public Affairs. | |
246
Table of Contents
| Additionally, he is a member of the UN Global Compact CFO Coalition for the SDGs. Mr. Al-Haffar was a member of the NYSE Advisory Board and, before joining Cemex, he spent nineteen years with Citicorp Securities Inc. and with Santander Investment Securities as an investment banker and capital markets professional. | ||
| Education: | He holds a B.S. degree in Economics from the University of Texas and a Master’s degree in International Relations and Finance from Georgetown University. | |
| Name: | Mauricio Doehner Cobián. | |
| Age as of December 31, 2022: | 48. | |
| Citizenship: | Mexican and German. | |
| Nationality: | Mexican. | |
| Title: | Executive Vice President of Corporate Affairs, Enterprise Risk Management and Social Impact. | |
| Seniority: | Since 1996. | |
| Tenure as Executive Vice President of Corporate Affairs, Enterprise Risk Management and Social Impact: | Since 2021. | |
| Experience at Cemex and Other Relevant Experience: | Mr. Doehner Cobián has held several executive positions in areas such as Strategic Planning and Enterprise Risk Management for Europe, Asia, the Middle East, South America and Mexico, and most recently Executive Vice President of Corporate Affairs and Enterprise Risk Management. | |
| Additionally, he has also worked in the public sector within the office of the Mexican Presidency. Mr. Doehner was president of the Mexican National Cement Chamber (Cámara Nacional del Cemento) between 2017 and 2019, Vice President of the Transformation Industry Chamber (CAINTRA – Cámara de la Industria de Transformación) between 2012 and 2013. He’s currently Vice President of Social Responsibility and Vertebration of the Mexican Employers Confederation (COPARMEX – Confederación Patronal de la República Mexicana), and member of the board of directors of Vista Oil & Gas, S.A.B. de C.V., Trust for the Americas and Museo de Arte Contemporáneo de Monterrey, A.C. | ||
| Education: | He holds a B.A. degree in Economics from the Instituto Tecnológico y de Estudios Superiores de Monterrey, an M.B.A. from Instituto Panamericano de Alta Dirección de Empresas (IPADE) and IESE Business School of the University of Navarra in Madrid, and a Master’s in Public Administration from Harvard University. | |
| Name: | Juan Romero Torres. | |
| Age as of December 31, 2022: | 65. | |
| Citizenship: | Spanish. | |
| Nationality: | Spanish. | |
247
Table of Contents
| Title: | Executive Vice President of Sustainability, Commercial and Operations Development. | |
| Seniority: | Since 1989. | |
| Tenure as Executive Vice President of Sustainability, Commercial and Operations Development: | Since 2019. | |
| Experience at Cemex and Other Relevant Experience: | Mr. Romero Torres has held several senior positions, including head of operations in Colombia and Mexico, President of Cemex’s South America and the Caribbean Region, President of our Europe, Middle East, Africa and Asia Region, and, most recently, President of Cemex México. He also assumed the Global Supply Chain Development functions at Cemex effective as of October 1, 2020, and currently leads our Digital Marketing function as well. | |
| Additionally, Mr. Romero was appointed Vice President and representative of the board of directors of the National Chamber of Cement (Cámara Nacional del Cemento) in June 2011 and is also a member of the board of directors of GCC, S.A.B. de C.V. (formerly Grupo Cementos de Chihuahua, S.A.B. de C.V.). | ||
| Education: | He holds a Law degree and a B.S. degree in Economics and Business Administration, both from the University of Comillas in Spain. | |
| Name: | Jesús Vicente González Herrera. | |
| Age as of December 31, 2022: | 57. | |
| Citizenship: | American. | |
| Nationality: | Spanish. | |
| Title: | President of Cemex South, Central America and the Caribbean. | |
| Seniority: | Since 1998. | |
| Tenure as President of Cemex South, Central America and the Caribbean: | Since 2019. | |
| Experience at Cemex and Other Relevant Experience: | Mr. González Herrera has held several senior positions, including Corporate Director of Strategic Planning, Vice President of Strategic Planning in Cemex USA, President of Cemex Central America, President of Cemex UK and, more recently, Executive Vice President of Sustainability and Operations Development.
Additionally, he is Cemex Latam Holdings, S.A.’s Chairman and member of the board of directors, as well as its Chief Executive Officer. | |
| Education: | He holds a B.S. and an M.Sc. in Naval Engineering, both from the Polytechnic University of Madrid and an M.B.A. from IESE—University of Navarra, Barcelona. | |
| Name: | Louisa (Lucy) P. Rodriguez. | |
| Age as of December 31, 2022: | 63. | |
| Citizenship: | American. | |
248
Table of Contents
| Nationality: | American. | |
| Title: | Executive Vice President of Investor Relations, Corporate Communications and Public Affairs. | |
| Seniority: | Since 2006. | |
| Tenure as Executive Vice President of Investor Relations, Corporate Communications and Public Affairs: | Since 2021. | |
| Experience at Cemex and Other Relevant Experience: | Ms. Rodriguez has held several executive positions including Head of Investor Relations. She has over 25 years of experience in international finance and capital markets. | |
| Prior to Cemex, Ms. Rodríguez spent 15 years at Citibank and Santander where she was a capital markets professional in Emerging Markets and held various senior management roles. In her early career, she also worked for KPMG, and she was previously a Certified Public Accountant. | ||
| Education: | She holds a B.A. degree in Economics from Trinity College (Hartford, CT.), an M.B.A. from New York University, and a Master’s from Columbia University School of International and Public Affairs. | |
| Name: | Rafael Garza Lozano. | |
| Age as of December 31, 2022: | 59. | |
| Citizenship: | Mexican. | |
| Nationality: | Mexican. | |
| Title: | Vice President of Comptrollership. | |
| Seniority: | Since 1985. | |
| Tenure as Vice President of Comptrollership: | Since 1999. | |
| Experience at Cemex and Other Relevant Experience: | Mr. Garza Lozano is a member of the board of directors of the Mexican Council for Research and Development of Financial Reporting Standards (Consejo Mexicano para la Investigación y Desarrollo de Normas de Información Financiera) and an alternate member of the board of directors of GCC, S.A.B. de C.V. (formerly Grupo Cementos de Chihuahua, S.A.B. de C.V.) | |
| Mr. Garza Lozano is a certified public accountant. | ||
| Education: | He has a Master’s degree in Administration and Finance from the Instituto Tecnológico y de Estudios Superiores de Monterrey. He also attended executive programs at Instituto Tecnológico Autónomo de México (ITAM), Instituto Panamericano de Alta Dirección de Empresas (IPADE) and Harvard University. | |
| Name: | Roger Saldaña Madero. | |
| Age as of December 31, 2022: | 54. | |
| Citizenship: | Mexican. | |
249
Table of Contents
| Nationality: | Mexican. | |
| Title: | Senior Vice President of Legal. | |
| Seniority: | Since 2000. | |
| Tenure as Senior Vice President of Legal: | Since 2017. | |
| Experience at Cemex and Other Relevant Experience: | Mr. Saldaña joined Cemex in 2000 and served as Legal Counsel of Cemex and, from 2001 to 2011, as General Counsel of NEORIS, a Cemex subsidiary specialized in providing information technology services. From 2005 and until 2017, Mr. Saldaña was Senior Corporate Counsel of Cemex, and was responsible for, among other matters, corporate finance legal affairs and, since June 1, 2017, has served as Cemex’s Senior Vice President of Legal. On March 30, 2017, Mr. Saldaña was appointed Secretary of the Board of Directors of Cemex, S.A.B. de C.V. and the committees to such Board of Directors. Prior to joining Cemex, he served as Legal Counsel in Cydsa, S.A.B. de C.V. from 1995 to 2000 in the city of Monterrey, Nuevo León, Mexico, was a foreign associate in the law firm Fried, Frank, Harris, Shriver & Jacobson, in New York, N.Y., USA from 1994 until 1995 and previously was Chief of the Double Taxation Department in Mexico’s Ministry of Finance and Public Credit (Secretaría de Hacienda y Crédito Público) in Mexico City, Mexico. | |
| Education: | Mr. Saldaña is a graduate of the Universidad de Monterrey, A.C. (UDEM) with a degree in Law, holds a Master’s degree in Law (LL.M.) from Harvard University, and a diploma from Harvard University’s International Tax Program. | |
Senior Management Skill Matrix
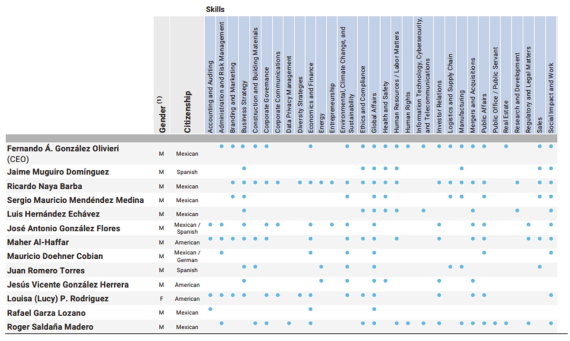
| (1) | M = Male, F = Female |
250
Table of Contents
Snapshot of the Board of Directors as of December 31, 2022
| Name |
Director Since |
Independence | Committee Memberships | Participation in Boards of Other Public Companies |
||||||||||||||||||
| AC | CPFC | SC | ||||||||||||||||||||
|
|
1987 | — | 1 | |||||||||||||||||||
| Fernando Ángel González Olivieri |
2015 | — | • | 2 | ||||||||||||||||||
| Marcelo Zambrano Lozano |
2017 | — | • | 2 | ||||||||||||||||||
| Armando J. García Segovia |
1983 | ✓ |
|
2 | ||||||||||||||||||
| Rodolfo García Muriel |
1985 | ✓ | • | • | — | |||||||||||||||||
| Francisco Javier Fernández Carbajal |
2012 | ✓ | • |
|
• | 3 | ||||||||||||||||
| David Martínez Guzmán |
2015 | ✓ | 3 | |||||||||||||||||||
| Armando Garza Sada |
2015 | ✓ | • | 6 | ||||||||||||||||||
| Everardo Elizondo Almaguer |
2016 | ✓ |
|
3 | ||||||||||||||||||
| Ramiro Villarreal Morales |
2017 | ✓ | 3 | |||||||||||||||||||
| Gabriel Jaramillo Sanint |
2018 | ✓ | 1 | |||||||||||||||||||
| Isabel María Aguilera Navarro |
2019 | ✓ | 4 | |||||||||||||||||||
| AC = Audit Committee |
Chairman of the Board of Directors |
|||||||||||||||||||||
| CPFC = Corporate Practices and Finance Committee |
President of the Committee • Member |
|||||||||||||||||||||
| SC = Sustainability Committee |
||||||||||||||||||||||
Board of Directors
Set forth below are the names, positions, and experiences of the members of Cemex, S.A.B. de C.V.’s Board of Directors as of December 31, 2022. For information regarding the individuals that were appointed as members of Cemex, S.A.B. de C.V.’s Board of Directors at Cemex, S.A.B. de C.V.’s annual ordinary general shareholders’ meeting held on March 24, 2023, see “Item 5—Operating and Financial Review and Prospects—Recent Developments Relating to Cemex, S.A.B. de C.V.’s Shareholders’ Meetings.”
No alternate directors were elected at Cemex, S.A.B. de C.V.’s annual ordinary general shareholders’ meeting that took place on March 23, 2022. Members of Cemex, S.A.B. de C.V.’s Board of Directors serve for one-year terms.
| Name: | Rogelio Zambrano Lozano. | |
| Age as of December 31, 2022: | 66. | |
| Citizenship: | Mexican. | |
| Nationality: | Mexican. | |
| Type of Board Member: | Non-Independent. | |
| Role within Cemex’s Board of Directors: | Chairman. | |
| Tenure on Cemex’s Board of Directors: | Member since 1987, and Chairman since 2014. | |
| Board Memberships at Listed Entities: | Mr. Zambrano Lozano is an alternate member of the Board of Directors of Banco Santander México, S.A. (a Mexican financial institution listed in Mexico and on the New York Stock Exchange), which is expected to be delisted from both exchanges in 2023. | |
| Other Current Roles: | He is a member of the Regional Council of Banco de México (Mexico’s central bank), a member of the Mexican Business Council (Consejo Mexicano de Negocios) and he is also a member of the Board of Trustees of the Instituto Tecnológico y de Estudios | |
251
Table of Contents
| Superiores de Monterrey, as well as a visiting professor at this same University. | ||
| Experience: | He was President of Cemex’s Finance Committee from 2009 until March 2015. | |
| Mr. Zambrano Lozano has been involved in the construction and building materials industries for over 40 years, as well as in various entrepreneurship matters in Mexico and the United States, after founding and serving as Chief Executive Officer of Carza, S.A.P.I. de C.V., a leading real estate development company. With his vast experience and proven leadership, since his appointment as Chairman, Mr. Zambrano Lozano has been responsible for guiding the company’s global business strategy, particularly focusing on strengthening best corporate governance practices, based on a commitment to create lasting value for all Cemex’s stakeholders. | ||
| Education: | He holds a B.S. degree in Industrial and Systems Engineering from the Instituto Tecnológico y de Estudios Superiores de Monterrey, and an M.B.A. from the Wharton Business School of the University of Pennsylvania. | |
| Name: | Fernando A. González Olivieri. | |
| Age as of December 31, 2022: | 68. | |
| Citizenship: | Mexican. | |
| Nationality: | Mexican. | |
| Type of Board Member: | Non-Independent. | |
| Tenure on Cemex’s Board of Directors: | Since 2015. | |
| Tenure on Cemex’s Sustainability Committee: | Since 2022. | |
| Board Membership at Listed Entities: | Mr. González Olivieri is a member of the board of directors of GCC, S.A.B. de C.V. (formerly Grupo Cementos de Chihuahua, S.A.B. de C.V.), and of Axtel, S.A.B. de C.V. (both Mexican corporations listed in Mexico). | |
| Experience and Education: | See “Item 6—Directors, Senior Management and Employees—Senior Management and Directors—Senior Management.” | |
| Name: | Marcelo Zambrano Lozano. | |
| Age as of December 31, 2022: | 67. | |
| Citizenship: | Mexican. | |
| Nationality: | Mexican. | |
| Type of Board Member: | Non-Independent. | |
| Tenure on Cemex’s Board of Directors: | Since 2017. | |
| Tenure on Cemex’s Sustainability Committee: | Since 2017. | |
| Board Memberships at Listed Entities: | He is a member of the Technical Committee of one of Go Proyectos, S.A. de C.V.’s development trusts, known by its ticker | |
252
Table of Contents
| symbol as CARZACK 18, which is listed in Mexico. He is a member of Technical Committee of Fibra Inn, a Real Estate Investment Trust listed in Mexico. | ||
| Other Current Roles: | He is a founding partner and Executive Chairman of the board of directors of Carza, S.A.P.I. de C.V., a recognized real estate development non-public corporation in the residential, commercial and industrial sectors. He is a member of the board of directors of Grupo Vigia, S.A. de C.V. (a Mexican non-public corporation dedicated to distribution of gas, fuel, and other oil derivatives), and of GreenPaper (Productora de Papel, S.A. de C.V.) (a Mexican non-public corporation dedicated to the fabrication and distribution of paper). He is also a member of the General Board of Universidad de Monterrey, A.C., a Mexican academic institution (UDEM), and of the General Board of Teléfonos de México, S.A.B. de C.V. (a Mexican non-public corporation). | |
| Experience: | His ample knowledge of the real estate and construction industries in Mexico and the United States provides the Board of Directors with an insightful view of major trends shaping the sector globally, particularly in key areas such as logistics and supply-chain development, thus helping Cemex to anticipate the evolving needs of its customers in the aforementioned markets. | |
| Education: | He holds a B.A. degree in Marketing from the Instituto Tecnológico y de Estudios Superiores de Monterrey. | |
| Name: | Armando J. García Segovia. | |
| Age as of December 31, 2022: | 70. | |
| Citizenship: | Mexican. | |
| Nationality: | Mexican and Spanish. | |
| Type of Board Member: | Independent. | |
| Tenure on Cemex’s Board of Directors: | Since 1983. | |
| Tenure on Cemex’s Sustainability Committee: | Member since 2014 and President since 2014. | |
| Board Memberships at Listed Entities: | He is a member of the board of directors of Hoteles City Express, S.A.B. de C.V., and an independent member of the board of directors of GCC, S.A.B. de C.V. (formerly Grupo Cementos de Chihuahua, S.A.B. de C.V.), both of which are listed corporations in Mexico. | |
| Other Current Roles: | He is a member of the board of directors of Innovación y Conveniencia, S.A. de C.V. (a Mexican non-public corporation) and of the board of directors of Universidad de Monterrey, A.C. (UDEM). He serves as Vice President of the Patronato del Museo de la Fauna y Ciencias Naturales, A.B.P. and he is a member of the Consejo de Participación Ciudadana de Parques y Vida Silvestre de Nuevo León, two not-for-profit entities with a sustainability agenda. Mr. García Segovia is the founder and Chairman of the board of directors of Comenzar de Nuevo, A.C., a non-profit organization focused on the treatment, education, prevention, and research of eating behavior disorders and related diseases. Mr. García Segovia also serves as honorary consul in Monterrey of the Kingdom of Denmark. | |
253
Table of Contents
| Experience: | He worked at Cydsa, S.A.B. de C.V. (a Mexican listed corporation) and Conek, S.A. de C.V. (a Mexican non-public corporation). From 1985 to 2010, he held several positions at Cemex, including Director of Operations and Strategic Planning, Corporate Services, and Business Development, as well as Executive Vice President of Development, Technology, Energy and Sustainability. He was also Vice President of the Mexican Employers’ Association (COPARMEX), Chairman of the Private Sector Center for Sustainable Development Studies (CESPEDES), and a member of the board of directors of the World Environmental Center (a non-profit organization). | |
| He brings to the Board of Directors a broad knowledge of the technical and production aspects of the global building-materials industry, along with a deep commitment to sustainability, climate action and nature conservancy, that provides valuable leadership to Cemex’s sustainability and climate action strategy, a core component to the company’s long-term value creation objective. | ||
| Education: | He holds a B.S. degree in Mechanical Engineering and Administration from the Instituto Tecnológico y de Estudios Superiores de Monterrey, and an M.B.A. from the University of Texas. | |
| Name: | Rodolfo García Muriel. | |
| Age as of December 31, 2022: | 77. | |
| Citizenship: | Mexican. | |
| Nationality: | Mexican. | |
| Type of Board Member: | Independent. | |
| Tenure on Cemex’s Board of Directors: | Since 1985. | |
| Tenure on Cemex’s Corporate Practices and Finance Committee: | Since 2015. | |
| Tenure on Cemex’s Audit Committee: | Since 2016. | |
| Board Memberships at Listed Entities: | N/A | |
| Other Current Roles: | He is the chief executive officer of Compañía Industrial de Parras, S.A. de C.V., chairman of the board of directors of Grupo Romacarel, S.A.P.I de C.V., (both are non-public corporations) and a member of the regional board of directors of Grupo Financiero Citibanamex (a non-public corporation). | |
| Experience: | He was a member of Cemex’s Finance Committee from 2009 until March 2015. | |
| Mr. García Muriel is a Mexican business leader with decades of experience and an outstanding record as founder, director and president of major companies in the manufacturing, construction, transport and communications industries. His vast business experience brings to the Board of Directors useful knowledge in critical areas such as logistics and manufacturing as well as macroeconomic and market trends. | ||
254
Table of Contents
| Education: | He holds a B.S. degree in Electric Mechanical Engineering from the Universidad Iberoamericana and completed specialized programs in Business Administration at both Harvard University, and the Anderson School of the University of California in Los Angeles (UCLA). | |
| Name: | Francisco Javier Fernández Carbajal. | |
| Age as of December 31, 2022: | 67. | |
| Citizenship: | Mexican. | |
| Nationality: | Mexican. | |
| Type of Board Member: | Independent. | |
| Tenure on Cemex’s Board of Directors: | Since 2012. | |
| Tenure on Cemex’s Audit Committee: | Since 2015. | |
| Tenure on Cemex’s Sustainability Committee: | Since 2016. | |
| Tenure on Cemex’s Corporate Practices and Finance Committee: | Member since 2015 and President since 2019. | |
| Board Memberships at Listed Entities: | He is a member of the board of directors of Alfa, S.A.B. de C.V., a listed corporation in Mexico and of two public corporations listed on the New York Stock Exchange: Fomento Económico Mexicano, S.A.B. de C.V. (also a listed corporation in Mexico), and VISA, Inc. | |
| Other Current Roles: | Mr. Fernández Carbajal is the Chief Executive Officer of Servicios Administrativos Country, S.A. de C.V. (a Mexican non-public corporation). | |
| Experience: | Previously, he held positions at Grupo Financiero BBVA Bancomer, including Deputy President of Strategic Planning, President of Systems and Operations, Chief Financial Officer, and Chief Executive Officer. | |
| With a 40-year business career and in-depth knowledge of specialized areas like payment systems and complex financial services worldwide, Mr. Fernández Carbajal brings to the Board of Directors relevant insights in strategic planning and risk management, as well as in essential business functions, including financial reporting and competitive compensation mechanisms, which are central to attracting and retaining talent. | ||
| Education: | He holds a B.S. degree in Electric Mechanical Engineering from the Instituto Tecnológico y de Estudios Superiores de Monterrey, and an M.B.A. from the Harvard Business School. | |
| Name: | Armando Garza Sada. | |
| Age as of December 31, 2022: | 65. | |
| Citizenship: | Mexican. | |
| Nationality: | Mexican. | |
| Type of Board Member: | Independent. | |
| Tenure on Cemex’s Board of Directors: | Since 2015. | |
255
Table of Contents
| Tenure on Cemex’s Corporate Practices and Finance Committee: | Since 2015. | |
| Board Memberships at Listed Entities: | Mr. Garza Sada is the Chairman of the board of directors of Alfa, S.A.B. de C.V., a listed corporation in Mexico with operations in 23 countries, and a business portfolio that includes petrochemicals, refrigerated food, telecommunications, IT and energy. He is also Chairman of the board of directors of Alpek, S.A.B. de C.V., and of Nemak, S.A.B. de C.V., a member of the board of directors of Axtel, S.A.B. de C.V., El Puerto de Liverpool, S.A.B. de C.V., and Grupo Lamosa, S.A.B. de C.V., all of which are listed corporations in Mexico. | |
| Other Current Roles: | He is an alternate member of the board of directors of Grupo Financiero BBVA México, S.A. de C.V. (a non-public corporation). He is also a member of the Board of Trustees of the Instituto Tecnológico y de Estudios Superiores de Monterrey. | |
| Experience: | Mr. Garza Sada’s decades of experience at the highest corporate level in top-ranked companies provides the Board of Directors with a unique insight on the global economic landscape, and a hands-on experience to best align the company’s business strategy with its day-to-day operations. | |
| Education: | Mr. Garza Sada holds a B.S. degree in Industrial Engineering from the Massachusetts Institute of Technology and an M.B.A. from Stanford University. | |
| Name: | David Martínez Guzmán. | |
| Age as of December 31, 2022: | 65. | |
| Citizenship: | British. | |
| Nationality: | British. | |
| Type of Board Member: | Independent. | |
| Tenure on Cemex’s Board of Directors: | Since 2015. | |
| Board Memberships at Listed Entities: | He serves on the board of directors of Alfa, S.A.B. de C.V. and of Vitro, S.A.B. de C.V., both of which are listed corporations in Mexico, and of Sabadell Bank, a listed corporation in Spain. | |
| Other Current Roles: | He is the founder and Principal of Fintech Advisory Inc., as well as Managing Director of its London subsidiary, Fintech Advisory, Ltd., and member of the board of directors of ICA Tenedora, S.A. de C.V. | |
| Experience: | Mr. Martínez Guzmán is the Principal of Fintech Advisory Inc., which he founded in 1987. From 1984 to 1986, Mr. Martínez worked as Vice-President, Latin America Sovereign Restructuring unit of Citibank, N.A. in New York, where he helped coordinate the 1984 Argentina Financing Plan. Since founding Fintech, Mr. Martínez Guzmán has participated, at times as the largest creditor, in most of the sovereign debt restructurings around the world, historically approaching sovereign restructurings with a collaborative approach to governments. Mr. Martínez Guzman also has a strong track record of successful involvement in corporate restructurings and debt exchanges, most often working with companies to ensure long-term viability and business continuity as | |
256
Table of Contents
| a value-recovering proposition. More recently, Mr. Martínez Guzmán has allocated a significant portion of Fintech’s position to private equity investments, successfully investing across multiple jurisdictions in Latin America, Asia, and Europe, and across a wide range of sectors, including telecom and media, utilities, industrials, infrastructure, construction, oil and gas, and financial institutions.
Mr. Martínez Guzmán brings a renowned worldwide expertise in the financial sector and global markets to the Board of Directors, providing significant guidance on Cemex’s proactive financial management for deleveraging and achieving an investment grade credit rating, as well as the company’s sustainable growth strategy. | ||
| Education: | He holds a B.S. degree in Mechanical and Electrical Engineering from the Universidad Nacional Autónoma de México (UNAM), a B.A. degree in Philosophy from the Universitas Gregoriana in Rome, Italy, and an M.B.A. from Harvard Business School. | |
| Name: | Everardo Elizondo Almaguer. | |
| Age as of December 31, 2022: | 79. | |
| Citizenship: | Mexican. | |
| Nationality: | Mexican. | |
| Type of Board Member: | Independent. | |
| Tenure on Cemex’s Board of Directors: | Since 2016. | |
| Tenure on Cemex’s Audit Committee: | Member since 2018 and President since 2019. | |
| Board Memberships at Listed Entities: | He is a member of the board of directors of Grupo Financiero Banorte, S.A.B. de C.V., of Compañía Minera Autlán, S.A.B. de C.V., and of Gruma, S.A.B. de C.V., all of which are listed corporations in Mexico. | |
| Other Current Roles: | Mr. Elizondo is a professor of Macroeconomics at EGADE Business School of the Instituto Tecnológico y de Estudios Superiores de Monterrey, and at the School of Economics of the Universidad Autónoma de Nuevo León (UANL). He is also a member of the board of directors of Afore XXI-Banorte, S.A., and of Rassini, S.A.B. de C.V. (these two are non-public corporations). | |
| Experience: | Mr. Elizondo Almaguer qualifies as a “financial expert” for purposes related to the Sarbanes-Oxley Act. | |
| He served as deputy governor of the Banco de México (Mexico’s central bank) from 1998 to 2008. Before that, he was the director for Economic Studies at Alfa, S.A.B. de C.V. (a Mexican listed company), and at Grupo Financiero BBVA Bancomer, S.A. de C.V. (a listed financial institution). He founded and was the director of the Graduate School of Economics of the UANL. | ||
| With a distinguished professional career as a financial analyst, exemplary public official and academic scholar, Mr. Elizondo Almaguer brings to the Board of Directors extensive knowledge of the financial system and the international macroeconomic environment, providing insights to ensure the Company’s full observance of best corporate practices, and identify new business opportunities. | ||
257
Table of Contents
| Education: | Mr. Elizondo Almaguer holds a B.A. degree in Economics from the Universidad Autónoma de Nuevo León, a Master’s in Economics from the University of Wisconsin-Madison, a certificate from Harvard University’s International Tax Program and a Honoris Causa Doctorate from the Universidad Autónoma de Nuevo León. | |
| Name: | Ramiro Gerardo Villarreal Morales. | |
| Age as of December 31, 2022: | 75. | |
| Citizenship: | Mexican. | |
| Nationality: | Mexican and Spanish. | |
| Type of Board Member: | Independent. | |
| Tenure on Cemex’s Board of Directors: | Since 2017. | |
| Board Memberships at Listed Entities: | He is a member of the board of directors of Andean Precious Metals, which is a company listed on the Toronto Stock Exchange, and of two public corporations listed on the Mexican Stock Exchange: GCC, S.A.B. de C.V. (formerly Grupo Cementos de Chihuahua, S.A.B. de C.V.) and Vinte Viviendas Integrales, S.A.B. de C.V. | |
| Other Current Roles: | Mr. Villarreal Morales is a member of the advisory board of Arendal (a non-public corporation in the construction industry). | |
| Experience: | He joined Cemex in 1987 as General Legal Director, and subsequently served in various positions, including Executive Vice President of Legal and Advisor to the Chairman of the Board of Directors and the Chief Executive Officer until December 2017. Previously, he served as General Director of the regional bank division of Banpaís, where he was responsible for the operation of the bank’s 121 branches, and, until February 2012, he was the Secretary of the board of directors of Enseñanza e Investigación Superior, A.C., a non-profit managed by the Instituto Tecnológico y de Estudios Superiores de Monterrey. | |
| He served as Secretary of Cemex’s Board of Directors from 1995 to March 30, 2017. | ||
| With over 50 years of professional experience in different countries where Cemex has operations, Mr. Villarreal Morales provides the Board of Directors with key guidance around regulatory and legal matters, as well as international financial transactions, helping to ensure strict observance of all applicable laws. | ||
| Education: | He holds a B.A. degree in Law from the Universidad Autónoma de Nuevo León, and a Master’s in Finance from the University of Wisconsin-Madison. | |
| Name: | Gabriel Jaramillo Sanint. | |
| Age as of December 31, 2022: | 73. | |
| Citizenship: | Brazilian. | |
| Nationality: | Colombian. | |
| Type of Board Member: | Independent. | |
258
Table of Contents
| Tenure on Cemex’s Board of Directors: | Since 2018. | |
| Board Memberships at Listed Entities: | He is a member of the board of directors of Minerva Foods, a listed corporation in Brazil. | |
| Other Current Roles: | Mr. Jaramillo Sanint is the founder and director of a sustainable economic development program in the Orinoco Basin in Colombia. He is also a member of the board of directors of Centro Hospitalario Tatama (Colombia) (a non-profit organization), Medicines For Malaria Ventures (a non-profit organization) based in Geneva, Switzerland and the Colombian branch of BTG Pactual Bank. | |
| Experience: | Previously, he served as Chairman of the board of directors and chief executive officer of Santander USA (formerly Sovereign Bank), Banco Santander Brasil, and Banco Santander Colombia, and as CEO of Citibank Mexico, and Citibank Colombia. Since retiring, he has focused on health-related philanthropic work, leading the transformation of the Global Fund to Fight AIDS, Tuberculosis and Malaria, which raised $13 billion from 2017 to 2020. | |
| From October 2012 to April 2018, he was a member of the board of directors and president of the audit committee of Cemex Latam Holdings, S.A., a company listed on the Colombian Securities Exchange.
With an outstanding 35-year career in South America, Mexico and the United States, Mr. Jaramillo Sanint not only brings to Cemex’s Board of Directors extensive experience in complex financial matters, but also in sustainability, health and safety, as well as corporate social responsibility, a pillar of Cemex’s global strategy to achieve sustainable growth and create lasting value. | ||
| Education: | Mr. Jaramillo Sanint holds a B.A. degree in Marketing and an M.B.A. from California State University. In 2015, Mr. Jaramillo Sanint received honorary degrees from the Universidad Autónoma de Manizales in Colombia and Northeastern University. | |
| Name: | Isabel María Aguilera Navarro. | |
| Age as of December 31, 2022: | 62. | |
| Citizenship: | Spanish. | |
| Nationality: | Spanish. | |
| Type of Board Member: | Independent. | |
| Tenure on Cemex’s Board of Directors: | Since 2019. | |
| Board Memberships at Listed Entities: | She is a member of the board of directors of Oryzon Genomics, S.A., Lar España Real Estate SOCIMI, S.A., and Clínica Baviera, all of which are listed corporations in Spain. | |
| Other Current Roles: | She is an independent consultant and an associate professor at the ESADE Business School in Barcelona. She is a member of the board of directors of the Spanish multinational state-owned entity Canal de Isabel II, which manages the water supply infrastructure of Madrid, Spain and has operations in South America. She is also a member of the board of directors of Making Science, a company listed on the BME Growth market. | |
259
Table of Contents
| Experience: | Mrs. Aguilera Navarro was President of General Electric Spain and Portugal from 2008 to 2009, General Manager of Google Inc. (now Alphabet) Spain and Portugal from 2006 to 2008, Operations Director of NH Hotel Group SA from May 2002 to June 2005, and General Director of Dell Computer Corporation for Spain, Italy and Portugal from March 1997 to May 2002. She has also served as an adviser to various Spanish non-profit organizations, including the Companies Institute (Instituto de Empresa), and the Association for Management Progress (Asociación para el Progreso de la Gestión). She was a member of the Advisory Board of Farmaindustria, Ikor, and Pelayo Mutua de Seguros, and a business entrepreneur from 2009 to 2012 at Twindocs International. Previously, she was a board member of Banca Farmafactoring S.p.A. and Hightech Payment System SA. | |
| With her experience in multinational corporations in Europe, Mrs. Aguilera Navarro brings to the Board of Directors guidance on the overall global business landscape and an informed view on innovation, entrepreneurship, technological and digitalization issues, from customer-centric platforms to organizational processes and essential corporate functions, a key element of the Company’s digital strategy. In addition, she brings important insights in urban planning and a critical customer influencer, architects. | ||
| Education: | Mrs. Aguilera Navarro holds a B.A. degree in Architecture and Urban Planning from the Escuela Técnica Superior de Arquitectura de Sevilla (ETSA), an M.B.A. from the IE Business School, and has a Specialization Diploma in the Metaverse from The Valley Digital Business School in Madrid. | |
Board of Directors Skill Matrix
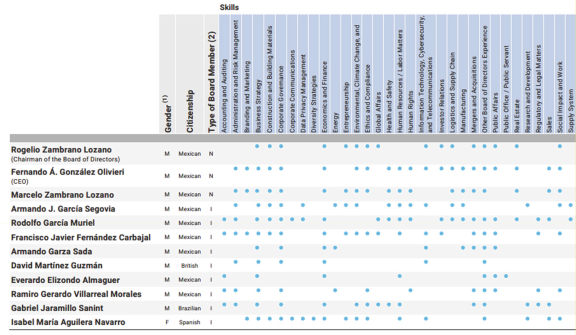
| (1) | M = Male, F = Female |
| (2) | N = Non-independent, I = Independent |
260
Table of Contents
Familial relationships among members of Cemex, S.A.B. de C.V.’s Board of Directors
| • | Rogelio Zambrano Lozano |
Mr. Rogelio Zambrano Lozano (Chairman of Cemex’s Board of Directors) has a familial relationship with Mr. Marcelo Zambrano Lozano.
| • | Marcelo Zambrano Lozano |
Mr. Marcelo Zambrano Lozano has a familial relationship with Mr. Rogelio Zambrano Lozano (Chairman of Cemex’s Board of Directors).
| • | Armando J. García Segovia |
Mr. Armando J. García Segovia has a familial relationship with Mr. Rodolfo García Muriel.
| • | Rodolfo García Muriel |
Mr. Rodolfo García Muriel has a familial relationship with Mr. Armando J. García Segovia.
Senior Management and Board Composition
The composition of our Senior Management and Board of Directors, as well as certain information regarding the areas of expertise and seniority of their members as of December 31, 2022, is addressed in this section.
Senior Management
Gender
As of December 31, 2022, our senior management was comprised of 13 members, of which 92% were men and 8% were women.
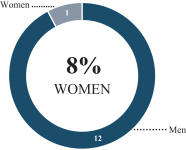
Seniority (in years at the Company)
As of December 31, 2022, our senior management’s average years at the Company was 27 years.
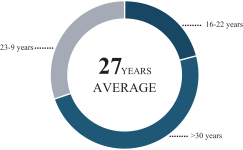
261
Table of Contents
Board of Directors
Gender
As of December 31, 2022, our Board of Directors was comprised of 12 members, of which 92% were men and 8% were women.
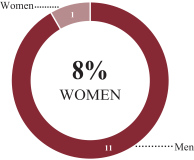
Tenure (in years as a member of the Board of Directors)
As of December 31, 2022, our Board of Directors’ average tenure was 14 years.
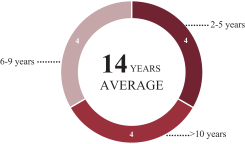
Independence
As of December 31, 2022, our Board of Directors was comprised of 12 members, of which 25% were considered to be non-independent and 75% were considered to be independent.
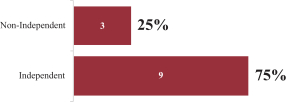
As of December 31, 2022, there were no alternate members of Cemex, S.A.B. de C.V.’s Board of Directors.
262
Table of Contents
Board Practices
Pursuant to the Mexican securities market law (Ley del Mercado de Valores) (the “Mexican Securities Market Law”), Cemex, S.A.B. de C.V.’s management is the responsibility of its Board of Directors and its chief executive officer. The Mexican Securities Market Law and Cemex, S.A.B. de C.V.’s by-laws (estatutos sociales) together set forth the fiduciary duties of the members of Cemex, S.A.B. de C.V.’s Board of Directors, who are required:
| • | to perform their duties in a value-creating manner for the benefit of Cemex without favoring a specific shareholder or group of shareholders; |
| • | to act diligently and in good faith by adopting informed decisions; |
| • | to maintain the confidentiality of the information and matters of which they become aware in their capacity as directors, when such information or matters are not of public knowledge; |
| • | to abstain from discussions and voting relating to matters in which they have an interest; and |
| • | to abstain from engaging in illicit acts or activities; and to act in a manner consistent with the duty of care and the duty of loyalty. |
The Mexican Securities Market Law also specifies that the duties of surveillance over our business are the responsibility of the board of directors, which are fulfilled by the Corporate Practices and Finance Committee and the Audit Committee, as well as through the external auditor who audits the entity’s financial statements, each within its professional role.
Pursuant to the Mexican Securities Market Law and Cemex, S.A.B. de C.V.’s by-laws, at least 25% of its directors must qualify as independent directors. As of December 31, 2022, Cemex, S.A.B. de C.V.’s Board of Directors was comprised of 12 members, of which 9 were independent and 3 were non-independent under the standards of the Mexican Securities Market Law.
Other than any contractual arrangements entered into with any member of Cemex, S.A.B. de C.V.’s Board of Directors while employed by us, which provide or may provide for retirement and pension benefits or other compensation upon termination of employment, Cemex, S.A.B. de C.V. has not entered into any contracts with its directors that provide for benefits upon termination of their directorship.
The Audit Committee, the Corporate Practices and Finance Committee and Other Committees
The Mexican Securities Market Law requires Cemex, S.A.B. de C.V.’s Board of Directors to have an audit committee and a corporate practices committee comprised entirely of independent directors. In compliance with such requirement, Cemex, S.A.B. de C.V. has an Audit Committee and a Corporate Practices and Finance Committee.
Cemex, S.A.B. de C.V.’s Audit Committee is responsible for:
| • | Evaluating internal controls and procedures and identifying deficiencies; |
| • | Following up with corrective and preventive measures in response to any non-compliance with operation and accounting guidelines and policies; |
| • | Evaluating the performance of external auditors and analyzing the reports, opinions and other information issued by such external auditors; |
| • | Describing and valuing non-audit services performed by external auditors; |
| • | Reviewing financial statements and determining if their approval should be recommended to the Board of Directors; |
263
Table of Contents
| • | Informing the Board of Directors of the state of the company’s internal controls, internal audit and accounting systems, including any breaches detected; |
| • | Supporting the Board of Directors in producing different reports submitted to the shareholders; |
| • | Assessing the effects of any modifications to the accounting policies approved during any fiscal year; |
| • | Overseeing measures adopted as a result of any observations made by shareholders, directors, executive officers, employees or any third parties with respect to accounting, internal controls and internal and external audit, as well as any complaints regarding management irregularities; |
| • | Supervising complaints raised by employees, third parties and other stakeholders to report ethical, corruption, and/or compliance matters utilizing confidential methods and other whistleblowing mechanisms; |
| • | Ensuring compliance by the Chief Executive Officer with the resolutions adopted by the shareholders and Board of Directors; and |
| • | Analyzing the risks identified by independent auditors, accounting, internal control and process assessment areas. |
Cemex, S.A.B. de C.V.’s Corporate Practices and Finance Committee is responsible for:
| • | Performing the role of a nomination and compensation committee, mainly by: |
| • | Evaluating the employment and compensation of the Chief Executive Officer and the Chairman of the Board; |
| • | Reviewing the hiring and compensation policies for executive officers; |
| • | Reviewing related party transactions and any conflicts of interest; |
| • | Reviewing policies regarding use of corporate assets; |
| • | Reviewing unusual or material transactions; |
| • | Evaluating waivers granted to directors or executive officers regarding participation and benefiting of corporate opportunities; |
| • | Identification, evaluation and follow up on the main risks affecting the company and its subsidiaries; |
| • | Evaluating financial plans; |
| • | Reviewing the financial strategy and its implementation; and |
| • | Evaluating merger and acquisitions opportunities as well as asset sales, including financial and related transactions. |
Under Cemex, S.A.B. de C.V.’s by-laws and the Mexican Securities Market Law, all members of the Audit Committee and the Corporate Practices and Finance Committee, including their respective presidents, are required to be independent directors. The President of the Audit Committee and the Corporate Practices and Finance Committee shall be appointed and removed from his or her position only by a resolution of the shareholders adopted at a duly convened general shareholders’ meeting, and the rest of the members may only be appointed or removed by a resolution of the shareholders adopted at a duly convened general shareholders’ meeting or by resolution of the Board of Directors, following a recommendation from the President of the respective committee.
Set forth below are the names of the members of Cemex, S.A.B. de C.V.’s Audit Committee and Corporate Practices and Finance Committee as of December 31, 2022. For information regarding the individuals that were appointed as members of Cemex’ S.A.B. de C.V.’s Audit Committee and Corporate Practices and Finance Committee at Cemex, S.A.B. de C.V.’s annual ordinary general shareholders’ meeting held on March 24, 2022,
264
Table of Contents
see “Item 5—Operating and Financial Review and Prospects—Recent Developments Relating to Cemex, S.A.B. de C.V.’s Shareholders’ Meetings.” Each member of the committees is an independent director. The terms of the members of the Committees are indefinite. Everardo Elizondo Almaguer qualifies, as an “audit committee financial expert” for purposes of the Sarbanes Oxley Act of 2002. See “Item 16A—Audit Committee Financial Expert.”
AUDIT COMMITTEE:
| Everardo Elizondo Almaguer |
President |
|||
| Rodolfo García Muriel |
Member |
|||
| Francisco Javier Fernández Carbajal |
Member |
|
CORPORATE PRACTICES AND FINANCE COMMITTEE:
| Francisco Javier Fernández Carbajal |
President | |||
| Rodolfo García Muriel |
Member | |||
| Armando Garza Sada |
Member |
In addition, Cemex, S.A.B. de C.V. has had a Sustainability Committee since 2014. On March 26, 2020, Cemex, S.A.B. de C.V. held an ordinary general shareholders’ meeting in which the shareholders for the first time approved the appointment of the members of the Sustainability Committee. Since then, the appointment of the members of the Sustainability Committee (now the Sustainability, Climate Action, Social Impact, and Diversity Committee) has been approved annually at Cemex, S.A.B. de C.V.’s ordinary general shareholders’ meeting.
Cemex, S.A.B. de C.V.’s Sustainability, Climate Action, Social Impact, and Diversity Committee is responsible for:
| • | Overseeing sustainability and social responsibility policies, strategies and programs; |
| • | Overseeing climate action goals and evaluating progress against those goals; |
| • | Evaluating the effectiveness of sustainability programs and initiatives; |
| • | Providing assistance to the Chief Executive Officer and senior management team regarding the strategic direction on sustainability and social responsibilities model; |
| • | Identifying the main risks concerning sustainability-related matters and overseeing mitigating actions; and |
| • | Endorsing a model of sustainability, priorities, and key indicators. |
Set forth below are the names of the members of Cemex, S.A.B. de C.V.’s Sustainability, Climate Action, Social Impact, and Diversity Committee as of December 31, 2022. For information regarding the individuals that were appointed as members of Cemex, S.A.B. de C.V.’s Sustainability, Climate Action, Social Impact, and Diversity Committee at Cemex, S.A.B. de C.V.’s annual ordinary general shareholders’ meeting held on March 24, 2022, see “Item 5—Operating and Financial Review and Prospects—Recent Developments Relating to Cemex, S.A.B. de C.V.’s Shareholders’ Meetings.” The terms of the members of the Committee are indefinite.
SUSTAINABILITY COMMITTEE:
| Armando J. García Segovia |
President |
| ||
| Francisco Javier Fernández Carbajal |
Member |
|||
| Marcelo Zambrano Lozano |
Member |
|||
| Fernando A. González Olivieri |
Member |
265
Table of Contents
Compensation of Cemex, S.A.B. de C.V.’s Directors and Members of Our Senior Management
For the year ended December 31, 2022, the aggregate amount of compensation we paid, or our subsidiaries paid, to all members of Cemex, S.A.B. de C.V.’s management was $44 million, which amount includes the salaries paid to the members of our Board of Directors, including its Chairman, and the salaries of our senior management, including of our Chief Executive Officer. Of the $44 million that we paid to members of Cemex, S.A.B. de C.V.’s management, $29 million was paid as base compensation and cash-based performance bonuses, including pension and post-employment benefits, and $15 million corresponds to stock-based long-term compensation. During 2022, we purchased 101 million CPOs to fund current and future requirements of the Restricted Stock Incentive Plan (“RSIP”) described below under “Item 6—Directors, Senior Management and Employees—Compensation of Cemex, S.A.B. de C.V.’s Directors and Members of Our Senior Management—Restricted Stock Incentive Plan.”
The following table discloses the amount of compensation paid to our Senior Management for the years ended December 31, 2022, 2021 and 2020:
| Year |
Average Total Compensation paid to our Senior Management(1)(2) |
Average Adjusted Compensation paid to our Senior Management(1)(3) |
Consolidated Net Income (Loss) (Millions of Dollars) |
Most significant financial measure | ||||
| 2022 |
3.1 million | 3.4 million | 885 | CVA | ||||
| 2021 |
3.5 million | 5.1 million | 778 | CVA | ||||
| 2020 |
2.5 million | 4.3 million | (1,446) | CVA |
| (1) | Our Senior Management includes our Executive Committee members, our Vice President of Comptrollership and our Senior Vice President of Legal. |
| (2) | The amount of “Average Total Compensation” paid to our Senior Management, either by us or our subsidiaries, includes paid salary, bonuses, stock awards, (including, but not limited to, our Key Value Positions Plan (“KVP Plan”) and the Performance Plan, as defined below), our Variable Compensation Plan (“VCP”), and other compensation benefits. |
| (3) | The “Average Adjusted Compensation” paid to our Senior Management is the Average Total Compensation paid to our Senior Management, adjusted to consider the addition or subtraction, as applicable, of equity award value as follows: (i) for awards granted in the covered fiscal year which are outstanding and unvested at year end, the fair value as of the end of the applicable year; (ii) for awards granted in prior fiscal years that are outstanding and unvested at the end of the applicable year, the amount equal to the change in fair value as of the end of the applicable year (from the end of the prior year); (iii) for awards granted in the applicable year that vest in the year of the grant, the fair value as of the vesting date; and (iv) for awards granted in prior years that vest during the applicable year, the amount equal to the change in fair value as of the vesting date (from the end of the year). |
To calculate the correlation between the compensation paid to our Senior Management and Cemex, S.A.B. de C.V.’s performance for the year ended December 31, 2022, we used the following financial and other measures: (i) cash value added (“CVA”); (ii) total shareholder return (“TSR”); and (iii) our CO2 Emissions Component (as defined below). For the years ended December 31, 2022, 2021, and 2020, CVA was the most significant financial measure that we used to determine the compensation paid to our Senior Management. For more information on our CVA and CO2 Emissions Component, see “Item 6—Directors, Senior Management and Employees—Compensation of Cemex, S.A.B. de C.V.’s Directors and Members of Our Senior Management—Variable Compensation Plan (“VCP”).”
266
Table of Contents
Variable Compensation Plan (“VCP”)
Our VCP is a non-equity incentive compensation plan available to our senior management. The terms of the VCP are based on CVA, which is calculated by subtracting depreciation and capital charge from our operating cash flow. A positive CVA means that revenues were greater than costs, including our cost of capital, whereas a negative CVA means that revenues were not sufficient to cover such costs. Members of Senior Management who achieve a positive CVA result with respect to our specific annual target goals will generally receive higher compensation under the VCP.
Additionally, the terms of our VCP consider performance metrics that include a combination of the employee’s business unit, regional and consolidated global results as compared to our specific annual target goals, including certain health and safety and sustainability-related factors. Moreover, the evaluation process considers each member of senior management’s individual performance assessment, along with his or her supervisor’s input. Since 2022, our VCP includes a new variable related to carbon reduction goals that could have an impact ranging from -10% to +10% in the total cash payout of the annual VCP (the “CO2 Emissions Component”). Furthermore, in March 2022 we expanded our VCP to cover more than 4,500 executives.
Each senior management position has a target variable compensation payout of his or her budgeted compensation, which is expressed as a percentage of such executive’s annual base pay. This target variable compensation amount varies according to the executive’s level in the Company.
Every year, specific annual target goals are set after considering local business expectations and the volatility of each of our operations. This allows us to maintain an objective criteria across our operations. Depending on our results and executives’ performance as compared to our objectives and specific annual target goals, the annual target variable compensation incentive can range from 0% for poor results and performance to up to a maximum of 200% for exceptional results and performance.
In 2022, Consolidated CVA resulted in a VCP payout of 164%.
Restricted Stock Incentive Plan
Under the terms of the RSIP, eligible employees are allocated a specific number of restricted CPOs as variable compensation to be vested over a four-year period. CPOs to cover the RSIP are issued or purchased in the secondary market, in each case, pursuant to the corresponding approvals from the Cemex, S.A.B. de C.V. ordinary general shareholders’ meetings. The CPOs are held in an individual account with a third-party supplier. At the end of each year during such four-year period, the restrictions lapse with respect to 25% of the allocated CPOs and such CPOs become freely transferable and subject to withdrawal from the trust. The RSIP has been applied to applicable participants since 2009, and it constitutes a further development to the variable remuneration plan that we implemented in 2005.
As of the date of this annual report, we have four compensation programs that conform the RSIP: the “Ordinary Plan,” the “KVP Plan,” the “Performance Plan,” and the “Extraordinary Management Grant.” Only our most senior executives in key value positions participate in the KVP Plan and the Performance Plan.
As of the date of this annual report, approximately 500 of our employees participate in the Ordinary Plan. The annual award under the Ordinary Plan is calculated based on the result of the gross annual guaranteed compensation of the participants in Dollars as of May 31 of each calendar year, times a management factor, that, depending on the level of the participant, ranges from 12% to 28% and divided by the last 90-day average closing price, converted into Dollars, of CPOs as of June 30 of such calendar year. No member of our senior management participated in the Ordinary Plan.
267
Table of Contents
Our KVP Plan establishes nonqualified deferred compensation earnings. As of December 31, 2022, the KVP Plan included approximately 60 participants, all of which are executives in key value positions. The annual award under the KVP Plan is based on the result of the cash variable compensation bonus in Dollars paid in April 2022 to these participants and divided by the last 90-day average closing price, converted into Dollars, of CPOs as of April 15 of each calendar year. As of December 31, 2022, all members of our senior management participated in the KVP Plan.
The total number of CPOs granted for the Ordinary Plan and the KVP Plan during 2022 were 46 million and 47 million, respectively, of which 28 million were related to our senior management. In 2022, 30 million net CPOs of the Ordinary Plan and 22 million net CPOs of the KVP Plan were purchased in the secondary market, representing the first 25% of the 2022 compensation program, the second 25% of the 2021 compensation program, the third 25% of the 2020 compensation program and the final 25% of the 2019 compensation program. Of these 52 million CPOs, 13 million CPOs corresponded to our senior management.
As of December 31, 2022, 48 employees participate in the Extraordinary Management Grant. The Extraordinary Management Grant entails granting a specific number of CPOs for each of the participants. The CPOs awarded under the Extraordinary Management Grant were calculated based on the result of the gross annual guaranteed compensation of the participants in Dollars as of May 31, 2022, times a management factor, and divided by the last 90-day average closing price, converted into Dollars, of CPOs as of June 30, 2022.
Our Extraordinary Management Grant is a retention program offered at the Company’s sole discretion to a selected number of employees that do not participate in the Ordinary Plan, KVP Plan or the Performance Plan. Under the Extraordinary Management Grant vesting occurs at the end of three years in a single 100% block, at which time the resulting number of CPOs become unrestricted immediately. Since the Extraordinary Management Grant came into effect in 2022 and there is a three-year vesting period, there have not been any CPOs awarded under the Extraordinary Management Grant, as of December 31, 2022.
Finally, our executives in key value positions participate in an additional RSIP program known as the Performance Plan. The Performance Plan replaced the Ordinary Plan in 2017 in order to align long-term compensation of our most senior executives with those of our investors. The Performance Plan entails granting a specific target of CPOs for each plan participant. The final payout can range from 0% to 200% of the target of CPOs based on Cemex, S.A.B. de C.V.’s three-year total shareholder return relative to two market references. The first market reference is comprised of seven public companies from the global construction and materials industry. The second market reference is the Morgan Stanley Capital International (MSCI) of Emerging Markets—LATAM Industry Index, which is compromised of 100 companies.
Under the Performance Plan, the vesting period occurs at the end of three years in a single 100% block, at which time the resultant number of CPOs become unrestricted immediately. Approximately 24 million CPOs were granted during 2022 under the Performance Plan, out of which 13 million CPOs were granted to our senior management, with an estimated fair value of 148.60%, which are expected to vest on July 1, 2025. During 2021 and 2022, 12 million and 16 million CPOs, respectively, were vested to our senior management. Since the Performance Plan only came into effect in 2017 and there is a three-year vesting period, prior to 2020 there were no CPOs awarded under the Performance Plan. As of December 31, 2022, the Performance Plan had 54 participants.
For further information, see note 22 to Cemex, S.A.B. de C.V.’s 2022 audited consolidated financial statements included elsewhere in this annual report.
268
Table of Contents
CLH Employee Stock-Ownership Plan
To better align CLH’s executives’ interests with those of its stockholders, on January 16, 2013, CLH’s board of directors approved, effective as of January 1, 2013, a long-term incentive plan available to eligible executives of CLH, which consists of an annual compensation plan based on CLH shares. The underlying shares in this long-term incentive plan, which are held in CLH’s treasury and subject to certain restrictions, are delivered fully vested under each annual program over a service period of four years. During 2022, 2021 and 2020, CLH delivered 813,980 shares, 713,927 shares and 1,383,518 shares, respectively, corresponding to the vested portion of prior years’ grants, which were subscribed and held in CLH’s treasury. As of December 31, 2022, there are 2,662,885 shares of CLH associated with these annual programs that are expected to be delivered in the following years as the executives render services.
Cemex Holdings Philippines Employee Restricted Stock Incentive Plan
Starting in 2018, a CHP compensation plan was granted to Philippines eligible participants. While this plan replaced their ordinary CPO plan, the mechanics of the plan remain the same. As of December 31, 2022 and 2021, there were eight eligible participants with a total award of 22 million and 16 million CHP shares, respectively.
Compensation of Cemex, S.A.B. de C.V.’s Chief Executive Officer and Senior Management
| Full Year 2022—Chief Executive Officer | % | |||
| Salary |
20 | % | ||
| Short-Term Performance Bonus (Cash) |
20 | % | ||
| Long-Term Performance Bonus (Restricted Stock) |
40 | % | ||
| Long-Term Performance Shares |
20 | % | ||
|
|
|
|||
| 100 | % | |||
| Full Year 2022—Senior Management | % | |||
| Salary |
42 | % | ||
| Short-Term Performance Bonus (Cash) |
22 | % | ||
| Long-Term Performance Bonus (Restricted Stock) |
22 | % | ||
| Long-Term Performance Shares |
14 | % | ||
|
|
|
|||
| 100 | % | |||
For our Chief Executive Officer and our senior management, the short-term variable performance bonus is paid in cash. Long-term restricted shares and the long-term variable performance bonus are paid in the form of restricted shares. As mentioned above, we use CVA to measure short-term performance bonus.
Additionally, all members of our Executive Committee have entered into change of control agreements that have been previously approved by the Corporate Practices and Finance Committee and the Board of Directors. Under these agreements, if during the term of the change of control agreement and while the executive remains an employee of Cemex, we shall be subject to a change in control and (i) within one (1) year following such change in control Cemex terminates the employment of the executive involuntarily and without business reasons or (ii) within six (6) months following such change in control the executive provides notice of intent to resign from employment with Cemex, then the executive should receive the executive’s salary and vacation accrued unpaid through his or her termination date, a lump sum equal to two times the executive’s annual salary, a lump sum equal to the executive’s target cash payout opportunity under the annual incentive bonus plan for which the executive is eligible, and vesting of all outstanding restricted stock plans and other equity arrangements subject to vesting and held by the executive through his or her termination date.
269
Table of Contents
The post-employment benefits that our senior management receive are aligned to the local practices in the countries where they are based.
The competitiveness of our executive compensation structure, as well as the mix between base and variable, as well as short- and long-term compensation, is reviewed every two years. This analysis measures competitiveness versus similar size firms in both U.S. and European markets. The most recent review was performed in October 2021 by WTW (formerly Willis, Towers, Watson), a firm specialized in multinational risk management, insurance brokerage and company advisory.
Cemex, S.A.B. de C.V.’s Board of Directors, other than its Chairman, is compensated in a fixed manner based on participation in board meetings. The compensation of the board of directors is approved each year at Cemex, S.A.B. de C.V.’s general ordinary shareholders’ meeting. In 2022, the amount approved by our shareholders was $24,600 per each board meeting attended and $6,000 per each committee meeting attended, and the actual amount paid for attendance to these meetings was approximately $1.7 million.
The Chairman of Cemex, S.A.B. de C.V.’s Board of Directors is compensated in a similar manner as Cemex, S.A.B. de C.V.’s senior management, including through the long-term performance plan based on Cemex’s total shareholder return versus peer groups. The base salary of the Chairman of Cemex, S.A.B. de C.V.’s board of directors is 27% fixed and the remaining 73% is variable compensation.
The total compensation (including fixed and variable compensation) of the Chairman of Cemex, S.A.B. de C.V.’s Board of Directors and the Chief Executive Officer is approved every year by the Corporate Practices and Finance Committee of the Board of Directors, which is integrated by three independent directors. The Corporate Practices and Finance Committee of the Board of Directors also reviews and approves the annual variable compensation of all members of senior management, key value position participants, and corporate and regional executives who are entitled to this benefit.
Employees
As of December 31, 2022, we had 43,853 employees worldwide, which represented a decrease of approximately 5% from the total number of employees we had as of December 31, 2021. The following table sets forth the number of our employees and a breakdown of their geographic location as of December 31, 2020, 2021 and 2022:
| Location |
2020 | 2021 | 2022 | |||||||||
| Mexico |
14,248 | 18,166 | 17,671 | |||||||||
| United States |
8,555 | 9,031 | 8,968 | |||||||||
| EMEAA |
12,679 | 12,483 | 11,877 | |||||||||
| United Kingdom |
1,961 | 1,933 | 1,901 | |||||||||
| France |
1,813 | 1,768 | 1,784 | |||||||||
| Germany |
1,117 | 1,117 | 1,237 | |||||||||
| Spain |
1,823 | 1,774 | 1,155 | |||||||||
| Poland |
1,066 | 1,070 | 1,092 | |||||||||
| Egypt |
509 | 505 | 513 | |||||||||
| Philippines |
777 | 775 | 757 | |||||||||
| Rest of EMEAA |
3,613 | 3,541 | 3,438 | |||||||||
| SCA&C |
6,181 | 6,530 | 5,337 | |||||||||
| Colombia |
2,675 | 2,974 | 2,850 | |||||||||
| Panama |
395 | 389 | 456 | |||||||||
| Costa Rica |
295 | 325 | 0 | |||||||||
| Caribbean TCL |
766 | 707 | 870 | |||||||||
| Rest of SCA&C |
2,050 | 2,135 | 1,161 | |||||||||
|
|
|
|
|
|
|
|||||||
| Total |
41,663 | 46,210 | 43,853 | |||||||||
270
Table of Contents
In Mexico, as of December 31, 2022, we have entered into collective bargaining agreements on a plant-by-plant basis, and such collective bargaining agreements are renewable on an annual basis with respect to salaries and on a biannual basis with respect to benefits. During 2022, we renewed approximately 102 contracts with different labor unions in Mexico. Our labor unions have taken important actions to implement the new labor laws, including, but not limited to, voting collective contracts in Mexico and informing employees about the terms and conditions of the collective agreements.
In the United States, as of December 31, 2022, approximately 27% of our employees were represented by unions, with the largest number being members of the International Brotherhood of Teamsters, the Laborers’ International Union of North America, United Steelworkers, International Union of Operating Engineers, and the International Brotherhood of Boilermakers. We have entered into or are in the process of negotiating various collective bargaining agreements at many of our U.S. plants, which collective bargaining agreements have various expiration dates through July 1, 2027.
As of December 31, 2022, our subsidiaries in Spain had 1,162 employees with collective bargaining agreements. Additionally, 682 of them, corresponding to employees in the cement business, had a company- specific collective bargaining agreement that has been renewed until December 31, 2023. The remaining 480, corresponding to the ready-mix concrete, mortar, aggregates and transport sectors, as well as non-cement office- based employees, have industry-specific collective bargaining agreements and are employees of different subsidiaries of ours in the country.
In the United Kingdom, as of December 31, 2022, our cement manufacturing and cement supply chain operations had collective bargaining agreements with Unite the Union. The rest of our operations in the United Kingdom are not part of collective bargaining agreements. However, there are local agreements for consultations and employees can be represented by a trade union official at specific types of meetings.
In Germany, as of December 31, 2022, most of our employees are working under collective bargaining agreements with the Industriegewerkschaft Bauen Agrar Umwelt—IG B.A.U. union. Most employees are subject to the in-house bargaining agreement with the IG B.A.U., which means salaries are negotiated between the applicable company and the trade union IG B.A.U. Collective bargaining agreement negotiations for cement operations employees occurred between employers’ associations Arbeitgeberverband Zement e.V. and IG B.A.U. during the third quarter of 2021. Both negotiations led to the execution of agreements. The period of both agreements will end in 2023. Agreed salary increases are in line with our budget assumptions. In addition, there are internal company agreements, negotiated between the works council and the company itself. The next works council elections for most areas will take place during 2026.
In France, as of December 31, 2022, less than 1% of our employees were members of four of the five main unions. At least one representative from one of the five main unions was represented in the following legal entities: Cemex Granulats (one representative), Cemex Bétons Ile de France (two representatives), Cemex Bétons Sud-Ouest (one representative), and Cemex Granulats Sud-Ouest (one representative). All agreements are negotiated with unions and non-union representatives elected in the local workers council (Comité social et économique) for periods of four years. The current agreements will expire on December 31, 2025.
In Israel, as of December 31, 2022, our aggregates manufacturing and lime manufacturing operations had existing special collective bargaining agreements with the Histadrut—the largest employee organization in Israel (“Histadrut”). In addition, our concrete product landscape plant, Netivei Noy, has an existing special collective bargaining agreement with Histadrut that applies to the plant’s employees and will expire on December 31, 2026. The rest of our operations in Israel are not part of collective bargaining agreements.
In the Philippines, as of December 31, 2022, approximately 62% and 23.5% of the non-managerial employees of our cement business were members of, and were represented by, labor unions in Solid Cement and APO, respectively. Their labor conditions including wages and benefits are governed by collective bargaining
271
Table of Contents
agreements negotiated at the plant level. The Solid Cement Plant has two unions and the collective bargaining agreements for these unions will expire on December 31, 2027 and February 28, 2023, respectively. APO Cement Plant also has two unions and the collective bargaining agreements for both these unions will expire on December 31, 2026.
In Egypt, as of December 31, 2022, the majority of our eligible employees were represented by the Assiut Cement Labor Union and the General Building Materials Union. The collective bargaining agreement, of which our employees are party to, governs annual profit share and productivity bonus payments. Such agreement will expire on December 31, 2024.
In Panama, as of December 31, 2022, approximately 59% of our workforce were members of the Sindicato de Trabajadores de Cemento Bayano, a union which is a legal entity registered before the Panamanian Ministry of Labor. The union’s board of directors is elected every two to four years through a general voting process. The collective bargaining agreement that is in full force and effect since January 2020 expires in December 2023.
In Colombia, as of December 31, 2022, there were 5 regional sectionals of a single industry union that represents our employees at the Caracolito, Clemencia, Bucaramanga, Cúcuta and Maceo cement plants and mills, and a minority part of the logistics operations at the national level. As of the date of this annual report, the Bucaramanga and Clemencia regional sectionals are undergoing a dissolution process. Another two unions represented a minority of the employees in the ready-mix concrete operations. There were also collective agreements with non-union workers at the Santa Rosa cement plant, all aggregates operations and the majority of the logistics and ready-mix concrete operations in Colombia. We consider our relationships with labor unions representing our employees in Colombia to be satisfactory.
In Caribbean TCL, as of December 31, 2022, the majority of our employees are party to collective bargaining agreements with the exception of those in the Guyana operations. Collective bargaining agreements in Trinidad have expired, however negotiations are currently ongoing with the Oilfields Workers’ Trade Union. In Barbados, during 2022, new agreements were executed with the Barbados’ Workers Union and the National Union of Public Workers. These new agreements will expire on December 31, 2023. In Jamaica, as of December 31, 2022, approximately 55% of our employees were represented by unions, with the largest number being members of the Union of Clerical And Supervisory Employees (“UCASE”) representing the hourly paid employees (46%), UCASE representing the monthly paid technicians and operators (28%) and STAFF Association representing the coordinators and administrative assistants (26%). Negotiations were finalized with the UCASE representing the hourly and monthly paid employees and STAFF Association, and the collective bargaining agreement with these groups will end in June and December 2024, respectively.
Share Ownership
As of December 31, 2022, to the best of our knowledge, the members of the Board of Directors of Cemex, S.A.B. de C.V. and our Senior Management, including their immediate families, owned, collectively, approximately 1.457% of Cemex, S.A.B. de C.V.’s outstanding shares, including shares underlying stock options and restricted CPOs under our RSIP. This percentage does not include shares held by the extended families of members of our senior management and directors, since, to the best of our knowledge, no voting arrangements or other agreements exist with respect to those shares. As of December 31, 2022, to the best of our knowledge, no individual member of the Board of Directors of Cemex, S.A.B. de C.V. or individual member of our senior management beneficially owned one percent or more of any class of Cemex, S.A.B. de C.V.’s outstanding capital stock and each such individual’s share ownership has not been previously disclosed to shareholders or otherwise made public.
272
Table of Contents
Item 7—Major Shareholders and Related Party Transactions
Major Shareholders
The information contained in Amendment No. 13 to a statement on Schedule 13G, filed with the SEC on February 1, 2023, stated that as of their calculations made as of January 31, 2023, BlackRock, Inc. (“Blackock”) beneficially owned 1,480,156,672 CPOs, representing 9.8% of Cemex, S.A.B. de C.V.’s outstanding capital stock. BlackRock does not have voting rights different from our other non-Mexican holders of CPOs. As required by Cemex, S.A.B. de C.V.’s by-laws, Cemex, S.A.B. de C.V.’s Board of Directors is required to approve BlackRock’s beneficial ownership of Cemex, S.A.B. de C.V.’s outstanding capital stock. Pursuant to the authorizations by Cemex, S.A.B. de C.V.’s Board of Directors, BlackRock is authorized to acquire up to 13% of Cemex, S.A.B. de C.V.’s capital stock with voting rights.
The information contained in Schedule 13G, filed with the SEC on January 30, 2023, stated that as of their calculations made as of February 28, 2023, Baillie Gifford & Co (“Baillie Gifford”) beneficially owned 805,408,010 CPOs, representing 5.32% of Cemex, S.A.B. de C.V.’s outstanding capital stock. Baillie Gifford does not have voting rights different from our other non-Mexican holders of CPOs.
The information contained in Schedule 13G, filed with the SEC on February 9, 2023, stated that as of their calculations made as of December 30, 2022, FMR beneficially owned 2,211,385,650 CPOs, representing 5.087% of Cemex, S.A.B. de C.V.’s outstanding capital stock. FMR does not have voting rights different from our other non-Mexican holders of CPOs.
As of December 31, 2022, Cemex, S.A.B. de C.V.’s outstanding capital stock consisted of 29,457,941,452 Series A shares and 14,728,970,726 Series B shares, in each case including shares held by our subsidiaries. These numbers are based on our records, which may differ from those recorded by Indeval (as defined below).
As of December 31, 2022, 99.88% of Series A shares and 99.88% of Series B shares outstanding were held by the CPO trust. Each CPO represents two Series A shares and one Series B share. A portion of the CPOs is represented by ADSs. As set forth in the Deposit Agreement, holders of ADSs do not have the right to instruct the depositary as to the exercise of voting rights in respect of Series A shares underlying CPOs held in the CPO trust. Under the terms of the CPO trust agreement, Series A shares underlying CPOs held by non-Mexican nationals, including all Series A shares underlying CPOs represented by ADSs, will be voted by the trustee according to the majority of all Series A shares held by Mexican nationals and Series B shares voted at the meeting. However, holders of ADSs will have the right to instruct the depositary to exercise the voting rights of the Series B shares underlying the CPOs represented by ADSs. Voting instructions may be given only with respect to ADSs representing an integral number of Series B shares. If the depositary shall not have received voting instructions from a holder of ADSs on or prior to the ADS voting instructions deadline, such holder shall be deemed, and the depositary and Cemex, S.A.B. de C.V. shall deem such holder, subject to the terms of the Deposit Agreement, to have instructed the depositary to give a discretionary proxy to a person designated by Cemex, S.A.B. de C.V. (or, if requested by Cemex, S.A.B. de C.V., a person designated by the technical committee appointed pursuant to the CPO trust agreement) to vote the Series B shares underlying the CPOs represented by such holder’s ADSs in his or her discretion. The Series B shares underlying the CPOs represented by ADSs for which no actual or deemed voting instructions have been received will be voted by the trustee for the CPO trust in cooperation with, and under the direction of, a technical committee appointed pursuant to the terms of the CPO trust agreement.
Other than BlackRock, Baillie Gifford, FMR and the CPO trust, we are not aware of any person that is the beneficial owner of five percent or more of any class of Cemex, S.A.B. de C.V.’s voting securities.
As of December 31, 2022, through Cemex, S.A.B. de C.V.’s subsidiaries, we owned approximately 20.5 million CPOs, representing approximately 0.0142% of Cemex, S.A.B. de C.V.’s outstanding voting stock. These CPOs are voted at the direction of our management. Cemex, S.A.B. de C.V.’s voting rights, through our subsidiaries that own
273
Table of Contents
those CPOs, over those CPOs are the same as those of any other CPO holder. As of the same date, we did not hold any CPOs in derivative instruments hedging expected cash flows of stock options exercises.
Cemex, S.A.B. de C.V.’s by-laws provide that its Board of Directors must authorize in advance any transfer of voting shares of its capital stock that would result in any persons, or groups acting in concert, becoming a holder of 2% or more of Cemex, S.A.B. de C.V.’s voting shares. In the event this requirement is not met, the persons acquiring such shares will not be entitled to any corporate rights with respect to such shares, such shares will not be taken into account for purposes of determining a quorum for shareholders’ meetings, Cemex, S.A.B. de C.V. will not record such persons as holders of such shares in its share registry and the registry undertaken by Indeval (as defined below) shall not have any effect.
Mexican securities regulations provide that our majority-owned subsidiaries may neither directly nor indirectly invest in Cemex, S.A.B. de C.V.’s CPOs nor other securities representing Cemex, S.A.B. de C.V.’s capital stock. The Mexican securities authority could require any disposition of the CPOs or of other securities representing our capital stock so owned and/or impose fines on us if it were to determine that the ownership of Cemex, S.A.B. de C.V.’s CPOs or of other securities representing Cemex, S.A.B. de C.V.’s capital stock by Cemex, S.A.B. de C.V.’s subsidiaries, in most cases, negatively affects the interests of Cemex, S.A.B. de C.V.’s shareholders. Notwithstanding the foregoing, the exercise of all rights pertaining to Cemex, S.A.B. de C.V.’s CPOs or to other securities representing our capital stock in accordance with the instructions of Cemex, S.A.B. de C.V.’s subsidiaries does not violate any provisions of Cemex, S.A.B. de C.V.’s by-laws or the by-laws of its subsidiaries. The holders of these CPOs or of other securities representing Cemex, S.A.B. de C.V.’s capital stock are entitled to exercise the same rights relating to their CPOs or their other securities representing Cemex, S.A.B. de C.V.’s capital stock, including all voting rights, as any other holder of the same series.
As of December 31, 2022, we had 494 ADS holders of record, holding 538,983,750 ADRs, representing 5,389,837,500 CPOs, or approximately 36.63% of Cemex, S.A.B. de C.V.’s outstanding capital stock as of such date.
Related Party Transactions
From January 1, 2022 through December 31, 2022, there were no transactions or proposed transactions that were material to either Cemex, S.A.B. de C.V. or, to the best of our knowledge, any related party, nor were there any transactions with any related party that were unusual in their nature or conditions. During the same period, we did not have any outstanding loans to any of Cemex, S.A.B. de C.V.’s Directors or members of Senior Management. For the purposes of this report, particularly for this analysis, the following transactions were excluded: (i) the sale and purchase of goods between subsidiaries of Cemex, S.A.B. de C.V.; (ii) the sale and/or acquisition of subsidiaries’ shares within subsidiaries of Cemex, S.A.B. de C.V.; (iii) the invoicing of administrative services, rentals, trademarks, and commercial name rights, royalties and other services rendered between two subsidiaries; and (iv) loans between related parties. When market prices and/or market conditions are not readily available, we conduct transfer pricing studies in the countries in which we operate, aiming to comply with regulations applicable to transactions between related parties.
The term “related parties” includes entities or individuals not affiliated with, or under the control of, Cemex, which, due to their relationship with Cemex, may take advantage of being in a privileged situation. Likewise, this applies to cases in which Cemex may take advantage of such relationships and obtain benefits in its financial position or operating results.
For the years ended December 31, 2022, 2021 and 2020, in the ordinary course of business, Cemex has entered into transactions with related parties for the sale and/or purchase of products, sale and/or purchase of services, or the lease of assets, all of which are not significant for Cemex and, to the best of Cemex’s knowledge, are not significant to the related party, and are incurred for non-significant amounts for Cemex and are executed
274
Table of Contents
under conditions following the same authorizations applied to other third parties. These identified transactions, which involved members of Cemex, S.A.B. de C.V.’s Board of Directors and Senior Management, as applicable, are reviewed by Cemex, S.A.B. de C.V.’s Board of Directors Corporate Practices and Finance Committee, and approved or ratified at least annually by Cemex, S.A.B. de C.V.’s Board of Directors. Cemex also enters into transactions with affiliates it controls, such as Trinidad Cement Limited, Caribbean Cement Company Limited, CLH, and CLH’s consolidated companies, and CHP and CHP’s consolidated entities; with other companies in which Cemex has a non-controlling position, such as GCC, Lehigh White Cement Company, and Neoris; with companies in which Cemex, S.A.B. de C.V.’s Board of Director members are members of such company’s board of directors, like FEMSA, S.A.B. de C.V., Carza, S.A.P.I. de C.V., Nemak, S.A.B. de C.V., NEG Natural, S.A. de C.V.; and with companies at which members of Cemex’s Senior Management have family members, such as HSBC México, S.A. Institución de Banca Múltiple, Grupo Financiero HSBC, and Cementos Españoles de Bombeo, S. de R.L. de C.V., all of which are also reviewed by Cemex, S.A.B. de C.V.’s Board of Directors Corporate Practices and Finance Committee, and approved or ratified at least annually by Cemex, S.A.B. de C.V.’s Board of Directors. For Cemex, none of these transactions are material to be disclosed separately.
Item 8—Financial Information
Consolidated Financial Statements and Other Financial Information
See “Item 18—Financial Statements.”
Legal Proceedings
See “Item 4—Information on the Company—Regulatory Matters and Legal Proceedings.”
Dividends
A declaration of any dividend can be made by Cemex, S.A.B. de C.V.’s shareholders at any ordinary general shareholders’ meeting. Any dividend declaration is usually based upon the recommendation of Cemex, S.A.B. de C.V.’s Board of Directors. However, Cemex, S.A.B. de C.V.’s shareholders are not obligated to approve the board’s recommendation. Cemex, S.A.B. de C.V. may only pay dividends from retained earnings included in financial statements that have been approved by Cemex, S.A.B. de C.V.’s shareholders and after all losses have been paid for, at least 5% of annual earnings have been set aside in a legal reserve until such reserve equals 20% of its paid-in capital and Cemex, S.A.B. de C.V.’s shareholders have approved the relevant dividend payment. See “Item 10—Additional Information—Taxation—Mexican Tax Considerations—General.” Since Cemex, S.A.B. de C.V. conducts its operations mainly through its subsidiaries, its most significant assets are its investments in those subsidiaries. Consequently, Cemex, S.A.B. de C.V.’s ability to pay dividends to its shareholders is largely dependent upon its ability to receive funds from its subsidiaries in the form of dividends, management fees or otherwise. The Credit Agreements and the indentures governing our outstanding Notes effectively limit Cemex, S.A.B. de C.V.’s ability to declare and pay cash dividends or make other cash distributions to its shareholders. See “Item 3—Key Information—Risk Factors—Risks Relating to Our Indebtedness and Certain Other Obligations—Cemex, S.A.B. de C.V.’s ability to repay debt and pay dividends is highly dependent on our subsidiaries’ ability to transfer income and dividends to us. As of the date of this annual report, we control three publicly listed companies, where this risk is heightened.”
The recommendation of Cemex, S.A.B. de C.V.’s Board of Directors as to whether to pay and the amount of any annual dividends has been, and will continue to be, in absence of contractual restrictions to pay or declare dividends, based upon, among other things, earnings, cash flow, capital requirements, contractual restrictions, and our financial condition and other relevant factors.
275
Table of Contents
Owners of ADSs on the applicable record date will be entitled to receive any dividends payable in respect of the Series A shares and the Series B shares underlying the CPOs represented by those ADSs. However, as permitted by the Deposit Agreement, Cemex, S.A.B. de C.V. may instruct the ADS depositary not to extend the option to elect to receive cash in lieu of the stock dividend to the holders of ADSs. The ADS depositary will fix a record date for the holders of ADSs with respect to each dividend distribution. Unless otherwise stated, the ADS depositary has agreed to convert cash dividends received by it with respect to the Series A shares and the Series B shares underlying the CPOs represented by ADSs from Mexican Pesos into Dollars and, after deduction or after payment of expenses of the ADS depositary, to pay those dividends to holders of ADSs in Dollars. Cemex, S.A.B. de C.V. cannot assure holders of its ADSs that the ADS depositary will be able to convert dividends received in Mexican Pesos into Dollars or that any such conversion would be made using any particular exchange rate.
Cemex, S.A.B. de C.V. did not declare a dividend for fiscal years 2020, 2021 or 2022.
Significant Changes
Except as described herein, no significant change has occurred since the date of our 2022 consolidated financial statements included elsewhere in this annual report.
Item 9—Offer and Listing
Listing Details
Cemex, S.A.B. de C.V.’s CPOs are listed on the MSE and trade under the symbol “CEMEX.CPO.” Cemex, S.A.B. de C.V.’s ADSs, each of which currently represents ten CPOs, are listed on the NYSE and trade under the symbol “CX.”
Other Securities: Regarding our reporting obligations, we present quarterly and annual financial reports, as well as corporate information and events relevant to the regulatory authorities of Mexico and the United States simultaneously and with the periodicity and comparisons established in the applicable legislation. Throughout the last three fiscal years, we have presented reports on relevant events in a complete and timely manner, as well as other financial and legal information that we are obliged to present periodically in accordance with the applicable laws in Mexico and the United States.
276
Table of Contents
Stock Performance in the Securities Market
The following table sets forth, for the periods indicated, the reported high and low market quotations in Pesos for the CPOs on the Mexican Stock Exchange and the Mexican Institutional Stock Exchange (“BIVA”), and the high and low sales prices in Dollars for the ADSs on the NYSE.
| CPOs(1)(2) | ADSs | |||||||||||||||||||||||
| Calendar Period |
High | Low | Closing | High | Low | Closing | ||||||||||||||||||
| Annual |
||||||||||||||||||||||||
| 2018 |
15.80 | 8.94 | 9.49 | 8.51 | 4.47 | 4.82 | ||||||||||||||||||
| 2019 |
10.78 | 5.53 | 7.08 | 5.63 | 2.82 | 3.78 | ||||||||||||||||||
| 2020 |
11.6 | 4.21 | 10.27 | 5.63 | 1.63 | 5.17 | ||||||||||||||||||
| 2021 |
17.64 | 10.39 | 13.99 | 8.89 | 5.16 | 6.78 | ||||||||||||||||||
| 2022 |
13.96 | 6.52 | 7.88 | 6.82 | 3.20 | 4.05 | ||||||||||||||||||
| Quarterly |
||||||||||||||||||||||||
| 2021 |
||||||||||||||||||||||||
| First quarter |
15.20 | 10.39 | 14.42 | 7.38 | 5.16 | 6.97 | ||||||||||||||||||
| Second quarter |
17.64 | 13.96 | 16.82 | 8.89 | 6.85 | 8.40 | ||||||||||||||||||
| Third quarter |
16.97 | 14.19 | 14.89 | 8.55 | 7.03 | 7.17 | ||||||||||||||||||
| Fourth quarter |
14.72 | 12.64 | 13.99 | 7.17 | 5.85 | 6.78 | ||||||||||||||||||
| 2022 |
||||||||||||||||||||||||
| First quarter |
13.96 | 9.54 | 10.69 | 6.82 | 4.43 | 5.29 | ||||||||||||||||||
| Second quarter |
10.58 | 6.82 | 7.83 | 5.29 | 3.32 | 3.92 | ||||||||||||||||||
| Third quarter |
9.21 | 6.74 | 6.94 | 4.66 | 3.28 | 3.43 | ||||||||||||||||||
| Fourth quarter |
8.98 | 6.52 | 7.88 | 4.59 | 3.2 | 4.05 | ||||||||||||||||||
| Monthly |
||||||||||||||||||||||||
| 2023 |
||||||||||||||||||||||||
| January |
10.06 | 7.96 | 10.04 | 5.37 | 4.12 | 5.34 | ||||||||||||||||||
| February |
10.28 | 8.89 | 9.16 | 5.52 | 4.85 | 4.98 | ||||||||||||||||||
| March |
10.13 | 9.18 | 9.89 | 5.67 | 4.83 | 5.53 | ||||||||||||||||||
| April(3) |
10.84 | 9.58 | 10.65 | 6.02 | 5.24 | 5.93 | ||||||||||||||||||
Source: Based on information from the BMV, BIVA, and NYSE.
| (1) | As of December 31, 2022, the 99.88% of Cemex, S.A.B. de C.V.’s outstanding share capital was represented by CPOs. |
| (2) | Takes into consideration the highest and lowest market quotations either on the BMV or the BIVA, as applicable. |
| (3) | CPO and ADS prices are as of April 18, 2023. |
277
Table of Contents
The following table sets forth, for the periods indicated, the total traded volume of CPOs on the BMV and the BIVA and ADSs on the NYSE.
| Calendar Period |
CPOs(1)(2) | ADSs(1) | ||||||
| Annual |
||||||||
| 2018 |
8,562 | 2,214 | ||||||
| 2019 |
9,022 | 1,749 | ||||||
| 2020 |
9,342 | 2,301 | ||||||
| 2021 |
8,231 | 2,203 | ||||||
| 2022 |
8,987 | 1,587 | ||||||
| Quarterly |
||||||||
| 2021 |
||||||||
| First quarter |
2,465 | 723 | ||||||
| Second quarter |
1,788 | 523 | ||||||
| Third quarter |
1,780 | 436 | ||||||
| Fourth quarter |
2,198 | 520 | ||||||
| 2022 |
||||||||
| First quarter |
2,738 | 582 | ||||||
| Second quarter |
2,551 | 500 | ||||||
| Third quarter |
1,767 | 237 | ||||||
| Fourth quarter |
1,932 | 268 | ||||||
| Monthly |
||||||||
| 2023 |
||||||||
| January |
616 | 111 | ||||||
| February |
788 | 120 | ||||||
| March |
1,051 | 179 | ||||||
| April(3) |
344 | 74 | ||||||
Source: Based on information from the BMV, BIVA, and NYSE.
| (1) | Amounts in millions. |
| (2) | Amounts include trading volumes on the BMV and on the BIVA |
| (3) | CPO and ADS prices are as of April 18, 2023. |
Item 10—Additional Information
Articles of Association and By-laws
General
Pursuant to the requirements of Mexican corporation law, Cemex, S.A.B. de C.V.’s articles of association and by-laws (estatutos sociales) have been registered with the Mercantile Section of the Public Registry of Property and Commerce in Monterrey, Nuevo León, Mexico, under entry number 21, since June 11, 1920.
Cemex, S.A.B. de C.V. is an operating and a holding company engaged directly or indirectly, through its operating subsidiaries, primarily in the production, distribution, marketing and sale of cement, ready-mix concrete, aggregates, clinker and other construction materials, and Urbanization Solutions throughout the world. Cemex, S.A.B. de C.V.’s corporate purpose can be found in Article 2 of Cemex, S.A.B. de C.V.’s by-laws.
Cemex, S.A.B. de C.V. has two series of common stock, the Series A common stock, with no par value (“Series A shares”), which can only be owned by Mexican nationals, and the Series B common stock, with no par value (“Series B shares”), which can be owned by both Mexican and non-Mexican nationals. Cemex, S.A.B. de
278
Table of Contents
C.V.’s by-laws state that the Series A shares may not be held by non-Mexican individuals, corporations, groups, units, trusts, associations or governments that are foreign or have participation by foreign governments or their agencies. Cemex, S.A.B. de C.V.’s by-laws also state that the Series A shares shall at all times account for a minimum of 64% of Cemex, S.A.B. de C.V.’s total outstanding voting stock and that the Series B shares shall at all times account for a minimum of 36% of Cemex, S.A.B. de C.V.’s total outstanding voting stock. Other than as described herein, holders of the Series A shares and the Series B shares have the same rights and obligations.
On March 28, 2019, Cemex, S.A.B. de C.V. held an extraordinary shareholders’ meeting, at which its shareholders approved, among other items, changes to Articles 2 and 28 of Cemex, S.A.B. de C.V.’s by-laws, incorporating additional provisions and removing some restrictions. The changes, among other items, are the following: broadening Cemex, S.A.B. de C.V.’s corporate purpose, which would permit Cemex to transport goods; amending the provision regarding seaport related services for its marine terminals; the manufacture and commercialization of cement bags, etc.; and clarifying that Cemex, S.A.B. de C.V.’s Relevant Executives (as defined under the laws of Mexico) are entitled to indemnification and liability protection only for liability arising from the lack of diligence when acting in good faith and pursuant to our best interests.
On March 25, 2021, Cemex, S.A.B. de C.V. held an extraordinary shareholders’ meeting, at which its shareholders approved changes to Article 2 of Cemex, S.A.B. de C.V.’s by-laws to further broaden Cemex, S.A.B. de C.V.’s corporate purpose. The changes, among other things, adjust our written corporate purpose in order to allow us to conduct certain activities, directly or indirectly through third parties, in line with our current needs and corporate vision.
Lastly, on March 24, 2022, Cemex, S.A.B. de C.V. held an extraordinary shareholders’ meeting, in which its shareholders approved changes to Article 2 of Cemex, S.A.B. de C.V.’s by-laws to detail Cemex, S.A.B. de C.V.’s corporate purpose so that it will list only those activities it currently carries out, and cease contemplating those activities it does not perform or that are already included in another part of the by-laws. For more information, see “Item 5—Operating and Financial Review and Prospects—Recent Developments—Recent Developments Relating to Cemex, S.A.B. de C.V.’s Shareholders’ Meetings.”
Changes in Capital Stock and Preemptive Rights
Subject to certain exceptions discussed below, Cemex, S.A.B. de C.V.’s by-laws allow for a decrease or increase in its capital stock if it is approved by its shareholders at a shareholders’ meeting. Additional shares of Cemex, S.A.B. de C.V.’s capital stock, having no voting rights or limited voting rights, are authorized by its by-laws and may be issued upon the approval of its shareholders at a shareholders’ meeting, with the prior approval of the Mexican securities authority. Cemex, S.A.B. de C.V.’s by-laws provide that, subject to certain exceptions, shareholders have preemptive rights with respect to the class and in proportion to the number of shares of our capital stock they hold, in connection with any capital increase in the number of outstanding Series A shares, Series B shares or any other existing series of shares, as the case may be. Subject to certain requirements: (i) under article 53 of the Mexican Securities Market Law, this preemptive right to subscribe is not applicable to increases of Cemex, S.A.B. de C.V.’s capital through public offers and (ii) under article 210-bis of the General Law of Negotiable Instruments and Credit Operations (Ley General de Títulos y Operaciones de Crédito), this preemptive right to subscribe is not applicable when issuing shares under convertible notes. Preemptive rights give shareholders the right, upon any issuance of shares by us, to purchase a sufficient number of shares to maintain their existing ownership percentages. Preemptive rights must be exercised within the period and under the conditions established for that purpose by the shareholders, and Cemex, S.A.B. de C.V.’s by-laws and applicable law provide that this period must be 15 days following the publication of the notice of the capital increase through the electronic system established by the Ministry of Economy (Secretaría de Economía) or, in its absence, in the Official Gazette of the State of Nuevo León (Periódico Oficial del Estado de Nuevo León) or in any major newspaper published and distributed in the city of Monterrey, Nuevo León, Mexico.
Holders of ADSs that are U.S. persons or are located in the United States may be restricted in their ability to participate in the exercise of such preemptive rights. See “Item 3—Key Information—Risk Factors—Risks Relating to
279
Table of Contents
Ownership of our Securities—Preemptive rights generally available under Mexican law may be unavailable to ADS holders.”
Pursuant to Cemex, S.A.B. de C.V.’s by-laws, significant acquisitions of shares of Cemex, S.A.B. de C.V.’s capital stock and changes of control of Cemex, S.A.B. de C.V. require prior approval from Cemex, S.A.B. de C.V.’s Board of Directors. Cemex, S.A.B. de C.V.’s Board of Directors must authorize in advance any transfer of, or creation of any encumbrance or lien on, voting shares of Cemex, S.A.B. de C.V.’s capital stock that would result in any person or group becoming a holder of 2% or more of Cemex, S.A.B. de C.V.´s shares. Cemex, S.A.B. de C.V.’s Board of Directors shall consider the following when determining whether to authorize such transfer of voting shares: a) the type of investors involved; b) if stock prices may be affected or if the number of Cemex, S.A.B. de C.V.’s shares outstanding would be reduced in such way that marketability may be affected; c) whether the acquisition would result in the potential acquirer exercising a significant influence or being able to obtain control; d) whether all applicable rules and Cemex, S.A.B. de C.V.’s by-laws have been observed by the potential acquirer; e) whether the potential acquirers are our competitors or are persons or legal entities participating in companies, entities or persons that are our competitors and whether there is a risk of affecting market competition, or the potential acquirers could have access to confidential and privileged information; f) the morality and economic solvency of the potential acquirers; g) the protection of minority rights and the rights of our employees; and h) whether an adequate base of investors would be maintained. If Cemex, S.A.B. de C.V.’s Board of Directors denies the authorization, or the transfer had been authorized on the basis of false or incorrect information or information had been withheld or the requirements established in Cemex, S.A.B. de C.V.’s by-laws are not complied with, the persons involved in the transfer shall not be entitled to exercise the voting rights corresponding to the transferred shares, such shares shall not be taken into account for the determination of the quorums of attendance and voting at shareholders’ meetings and the transfers shall not be recorded or have any effect in our share registry and the registry undertaken by S.D. Indeval, Institución para el Depósito de Valores, S.A. de C.V. (“Indeval”), the Mexican securities depositary.
Any acquisition of shares of Cemex, S.A.B. de C.V.’s capital stock representing 30% or more of its capital stock by a person or group of persons requires prior approval from Cemex, S.A.B. de C.V.’s Board of Directors and, in the event approval is granted, the acquirer has an obligation to make a public offer to purchase all of the outstanding shares of Cemex, S.A.B. de C.V.’s capital stock.
In the event the requirements for significant acquisitions of shares of Cemex, S.A.B. de C.V.’s capital stock are not met, the persons acquiring such shares will not be entitled to any corporate rights with respect to such shares, such shares will not be taken into account for purposes of determining a quorum for shareholders’ meetings, Cemex, S.A.B. de C.V. will not record such persons as holders of such shares in its share registry and the registry undertaken by Indeval shall not have any effect. Cemex, S.A.B. de C.V.’s by-laws require the stock certificates representing shares of its capital stock to make reference to the provisions in its by-laws relating to the prior approval of the Cemex, S.A.B. de C.V. Board of Directors for significant share transfers and the requirements for recording share transfers in its share registry. In addition, shareholders are responsible for informing Cemex, S.A.B. de C.V. within five business days whenever their shareholdings exceed 5%, 10%, 15%, 20%, 25% and 30% of Cemex, S.A.B. de C.V.’s capital stock. If a person acquires beneficial ownership (within the meaning of Rule 13d-3 promulgated by the SEC under the U.S. Securities Exchange Act of 1934 (“Exchange Act”)) of 20% or more in voting power of the outstanding voting stock of Cemex, S.A.B. de C.V., a change of control will be deemed to have occurred under the Credit Agreements and other debt agreements of Cemex.
Cemex, S.A.B. de C.V. is required to maintain a share registry to record the names, nationalities and domiciles of all significant shareholders, and any shareholder that meets or exceeds these thresholds must be recorded in this registry if such shareholder is to be recognized or represented at any shareholders’ meeting. If a shareholder fails to inform Cemex, S.A.B. de C.V. of its shareholdings reaching a threshold as described above, we will not record the transactions that cause such threshold to be met or exceeded in Cemex, S.A.B. de C.V.’s share registry, and such transaction will have no legal effect and will not be binding on us.
Cemex, S.A.B. de C.V.’s by-laws also require that its shareholders comply with legal provisions regarding acquisitions of securities and certain shareholders’ agreements that require disclosure to the public.
280
Table of Contents
Repurchase Obligation
In accordance with Mexican securities regulations, Cemex, S.A.B. de C.V. is obligated to make a public offer for the purchase of stock to its shareholders if Cemex, S.A.B. de C.V.’s registration with the Mexican securities registry is canceled, either by resolution of its shareholders or by an order of the Mexican securities authority. The minimum price at which we must purchase the stock is the higher of:
| • | the weighted average price per share based on the weighted average trading price of Cemex, S.A.B. de C.V.’s CPOs on the MSE during the latest period of 30 trading days preceding the date of the offer, for a period not to exceed six months; or |
| • | the book value per share, as reflected in the last quarterly report filed with the Mexican securities authority and the MSE before the date of the offer. |
Cemex, S.A.B. de C.V.’s Board of Directors shall prepare and disclose to the public through the MSE, within ten business days after the day the public offer begins, and after consulting the Corporate Practices and Finance Committee, its opinion regarding the price of the offer and any conflicts of interests that each of its members may have regarding such offer. This opinion may be accompanied by an additional opinion issued by an independent expert that we may hire.
Following the cancelation of Cemex, S.A.B. de C.V.’s registration with the Mexican securities registry, it must place in a trust set up for that purpose for a six-month period an amount equal to that required to purchase the remaining shares held by investors who did not participate in the offer.
Shareholders’ Meetings and Voting Rights
Shareholders’ meetings may be called by:
| • | Cemex, S.A.B. de C.V.’s Board of Directors or the Corporate Practices and Finance Committee and Audit Committee; |
| • | shareholders representing at least 10% of outstanding and fully paid shares, by making a request to the Chairman of Cemex, S.A.B. de C.V.’s Board of Directors or Cemex, S.A.B. de C.V.’s Corporate Practices and Finance Committee and Audit Committee; or |
| • | any shareholder (i) if no meeting has been held for two consecutive years or when the matters referred to in Article 181 of the Mexican corporations law have not been dealt with or (ii) when, for any reason, the required quorum for valid sessions of the Corporate Practices and Finance Committee and Audit Committee was not reached and the board of directors failed to make the appropriate provisional appointments; or a Mexican court of competent jurisdiction, in the event Cemex, S.A.B. de C.V.’s Board of Directors or the Corporate Practices and Finance Committee and Audit Committee do not comply with the valid shareholders’ request described above. |
Notice of shareholders’ meetings must be published through the electronic system established by the Ministry of Economy (Secretaría de Economía) or, in its absence, in the Official Gazette of the State of Nuevo León (Periódico Oficial del Estado de Nuevo León), Mexico or in any major newspaper published and distributed in the city of Monterrey, Nuevo León, Mexico. The notice must be published at least 15 days prior to the date of any shareholders’ meeting. Consistent with Mexican law, Cemex, S.A.B. de C.V.’s by-laws further require that all information and documents relating to the shareholders’ meeting be available to shareholders from the date the notice of the meeting is published.
General shareholders’ meetings can be ordinary or extraordinary. At every general shareholders’ meeting, each qualified holder of Series A shares and Series B shares is entitled to one vote per share. Shareholders may vote by proxy duly appointed in writing. Under the CPO trust agreement, holders of CPOs who are not Mexican nationals cannot exercise voting rights corresponding to the Series A shares represented by their CPOs, in which case, the CPO trustee will vote the underlying Series A shares in the same manner as the holders of the majority of the voting shares.
281
Table of Contents
An annual ordinary general shareholders’ meeting must be held during the first four months after the end of each of Cemex, S.A.B. de C.V.’s fiscal year to consider the approval of a report of its Board of Directors regarding Cemex, S.A.B. de C.V.’s performance and its financial statements for the preceding fiscal year and to determine the allocation of profits from the preceding year. In addition, Cemex, S.A.B. de C.V.’s annual ordinary general shareholders’ meeting must:
| • | review the annual reports of Cemex, S.A.B. de C.V.’s Corporate Practices and Finance Committee and Audit Committee, its Chief Executive Officer, and its Board of Directors; |
| • | elect, remove, or substitute the members of Cemex, S.A.B. de C.V.’s Board of Directors, which are voted on an individual basis; |
| • | determine the level of independence of the members of Cemex, S.A.B. de C.V.’s Board of Directors; |
| • | elect or remove the Chairman of Cemex, S.A.B. de C.V.’s Corporate Practices and Finance Committee and the Audit Committee; |
| • | approve any transaction that represents 20% or more of Cemex, S.A.B. de C.V.’s consolidated assets; and |
| • | resolve any issues not reserved for extraordinary shareholders’ meetings. |
A general extraordinary shareholders’ meeting may be called at any time to deal with any of the matters specified by Article 182 of the Mexican corporations law, which include, among other things:
| • | extending Cemex, S.A.B. de C.V.’s corporate existence; |
| • | Cemex, S.A.B. de C.V.’s voluntary dissolution; |
| • | increasing or reducing Cemex, S.A.B. de C.V.’s fixed capital stock; |
| • | changing Cemex, S.A.B. de C.V.’s corporate purpose; |
| • | changing Cemex, S.A.B. de C.V.’s country of incorporation; |
| • | changing Cemex, S.A.B. de C.V.’s form of organization; |
| • | a proposed merger; |
| • | issuing preferred shares; |
| • | redeeming Cemex, S.A.B. de C.V.’s own shares; |
| • | any amendment to Cemex, S.A.B. de C.V.’s by-laws; and |
| • | issuing bonds to be registered in the Mexican National Securities Registry; and any other matter for which a special quorum is required by law or by Cemex, S.A.B. de C.V.’s by-laws. |
In order to vote at a meeting of shareholders, shareholders must (i) appear on the list that Indeval and Indeval participants holding shares on behalf of the shareholders prepare prior to the meeting, or (ii) prior to the meeting, deposit the certificates representing their shares at Cemex, S.A.B. de C.V.’s offices or in a Mexican credit institution or brokerage house that operates in accordance with applicable laws in Mexico. The certificate of deposit with respect to the share certificates must be presented to Cemex, S.A.B. de C.V.’s company secretary at least 48 hours before a meeting of shareholders. Cemex, S.A.B. de C.V.’s company secretary verifies that the person in whose favor any certificate of deposit was issued is named in Cemex, S.A.B. de C.V.’s share registry and issues an admission pass authorizing that person’s attendance at the meeting of shareholders.
Cemex, S.A.B. de C.V.’s by-laws provide that a shareholder may only be represented by proxy in a shareholders’ meeting with a duly completed form provided by Cemex, S.A.B. de C.V. authorizing the proxy’s presence. In addition, Cemex, S.A.B. de C.V.’s by-laws require that the secretary acting at the shareholders’ meeting publicly affirm the compliance by all proxies with this requirement. A shareholders’ resolution is required to take action on any matter presented at a shareholders’ meeting.
282
Table of Contents
At an ordinary shareholders’ meeting, the affirmative vote of the holders of a majority of the shares present at the meeting is required to adopt a shareholders’ resolution. At an extraordinary meeting of shareholders, the affirmative vote of at least 50% of the capital stock is required to adopt a shareholders’ resolution, except that when amending Article 7 (with respect to measures limiting shareholding ownership), Article 10 (relating to the register of shares and significant participations) or Article 22 (specifying the impediments to being appointed a member of Cemex, S.A.B. de C.V.’s Board of Directors) of Cemex, S.A.B. de C.V.’s by-laws, the affirmative vote of at least 75% of the voting stock is required.
The attendance quorum for an ordinary general shareholders’ meeting upon the first call is 50% of Cemex, S.A.B. de C.V.’s outstanding and fully paid shares and, for the second call, is any number of Cemex, S.A.B. de C.V.’s outstanding and fully paid shares. If the quorum is not met upon the first call, a subsequent meeting may be called and the quorum for the second ordinary shareholders’ meeting is any number of Cemex, S.A.B. de C.V.’s outstanding and fully paid shares represented at the meeting. The attendance quorum for the extraordinary shareholders’ meeting upon the first call is 75% of Cemex, S.A.B. de C.V.’s outstanding and fully paid shares and, upon the second and subsequent calls, is 50% of Cemex, S.A.B. de C.V.’s outstanding and fully paid shares.
Rights of Minority Shareholders
At Cemex, S.A.B. de C.V.’s annual ordinary general shareholders’ meeting, any shareholder or group of shareholders representing 10% or more of its voting stock has the right to appoint or remove one member of Cemex, S.A.B. de C.V.’s Board of Directors, in addition to the directors appointed by the majority. Such appointment may only be revoked by other shareholders when the appointment of all other directors is also revoked. Cemex, S.A.B. de C.V.’s by-laws provide that holders of at least 10% of its outstanding capital stock are entitled to demand the postponement of the voting on any resolution of which they deem they have not been sufficiently informed.
Under Mexican law, holders of at least 20% of Cemex, S.A.B. de C.V.’s outstanding capital stock entitled to vote on a particular matter may oppose any resolution reached at a shareholders’ meeting by filing a petition with a court of law for a court order to suspend the resolution temporarily within 15 days after the adjournment of the meeting at which that action was taken and showing that the challenged action violates Mexican law or Cemex, S.A.B. de C.V.’s by-laws, provided the opposing shareholders deliver a bond to the court to secure payment of any damages that we suffer as a result of suspending the resolution in the event that the court ultimately rules against the opposing shareholders. Relief under these provisions is only available to holders who were entitled to vote on, or whose rights as shareholders were adversely affected by, the challenged shareholder action and whose shares were not represented when the action was taken or, if represented, voted against it.
Under Mexican law, an action for civil liabilities against directors may be initiated by a shareholders’ resolution for violation of their duty of loyalty to shareholders. In the event shareholders decide to bring an action of this type, the persons against whom that action is brought will immediately cease to be directors. Additionally, shareholders representing not less than 33% of the outstanding shares may directly exercise that action against the directors; provided that:
| • | those shareholders shall not have voted against exercising such action at the relevant shareholders’ meeting; and |
| • | the claim covers all of the damage alleged to have been caused to us and not merely the damage suffered by the plaintiffs. |
Under Cemex, S.A.B. de C.V.’s by-laws, shareholders representing 5% or more of its outstanding capital stock may initiate actions exclusively on behalf of Cemex, S.A.B. de C.V. against members of its Board of Directors, its Corporate Practices and Finance Committee and Audit Committee, its Chief Executive Officer, or any relevant executives, for breach of their duty of care or duty of loyalty to shareholders or for committing illicit acts or activities. The only requirement is that the claim covers all of the damage alleged to have been caused to
283
Table of Contents
us or any entities on which we have a significant influence and not merely the damage suffered by the plaintiffs. Actions initiated on these grounds have a five-year statute of limitations from the day of the act or action that caused the damage.
Any recovery of damages with respect to these actions will be for Cemex, S.A.B. de C.V.’s benefit and not that of the shareholders bringing the action.
Registration and Transfer
Cemex, S.A.B. de C.V.’s common stock is evidenced by share certificates in registered form with registered dividend coupons attached. Shareholders who have not deposited their shares into the CPO trust may hold their shares in the form of physical certificates or through institutions that have accounts with Indeval. Accounts may be maintained at Indeval by brokers, banks and other entities approved by the Mexican securities authority. Cemex, S.A.B. de C.V. maintains a stock registry, and, in accordance with Mexican law, only those holders listed in Cemex, S.A.B. de C.V.’s stock registry and those holding certificates issued by Indeval and by Indeval participants indicating ownership are recognized as Cemex, S.A.B. de C.V. shareholders.
Pursuant to Mexican law, any transfer of shares must be registered in Cemex, S.A.B. de C.V.’s stock registry, if effected physically, or through book entries that may be tracked back from Cemex, S.A.B. de C.V.’s stock registry to the records of Indeval.
Redemption
Cemex, S.A.B. de C.V.’s capital stock is subject to redemption upon approval of our shareholders at an extraordinary shareholders’ meeting.
Share Repurchases
If approved by Cemex, S.A.B. de C.V.’s shareholders at a general shareholders’ meeting, we may purchase Cemex, S.A.B. de C.V.’s outstanding shares. The economic and voting rights corresponding to repurchased shares cannot be exercised during the period the shares are owned by us and the shares will be deemed outstanding for purposes of calculating any quorum or vote at any shareholders’ meeting. We may also repurchase our equity securities on the MSE at the then prevailing market prices in accordance with Mexican Securities Market Law. If we intend to repurchase shares representing more than 1% of Cemex, S.A.B. de C.V.’s outstanding shares at a single trading session, we must inform the public of such intention at least ten minutes before submitting our bid. If we intend to repurchase shares representing 3% or more of Cemex, S.A.B. de C.V.’s outstanding shares during a period of 20 trading days, we are required to conduct a public tender offer for such shares. We must conduct share repurchases as per the framework authorized by Cemex, S.A.B. de C.V.’s Board of Directors and through the person or persons approved by Cemex, S.A.B. de C.V.’s Board of Directors, through a single broker dealer during the relevant trading session and without submitting bids during the first and the last 30 minutes of each trading session. We must inform the MSE of the results of any share repurchase no later than the business day following any such share repurchase.
Directors’ and Shareholders’ Conflict of Interest
Under Mexican law, any shareholder who has a conflict of interest with Cemex, S.A.B. de C.V. with respect to any transaction is obligated to disclose such conflict and is prohibited from voting on that transaction. A shareholder who violates this prohibition may be liable for damages if the relevant transaction would not have been approved without that shareholder’s vote.
Under Mexican law, any director who has a conflict of interest with Cemex, S.A.B. de C.V. in any transaction must disclose that fact to the other directors and is prohibited from participating and being present
284
Table of Contents
during the deliberations and voting on that transaction. A director who violates this prohibition will be liable for damages and lost profits. Additionally, Cemex, S.A.B. de C.V.’s directors may not represent shareholders in our shareholders’ meetings.
Withdrawal Rights
Whenever Cemex, S.A.B. de C.V.’s shareholders approve a change of corporate purpose, change of nationality or transformation from one form of corporate organization to another, Mexican law provides that any shareholder entitled to vote on that change who has voted against it may withdraw from Cemex, S.A.B. de C.V. and receive an amount equal to the book value (in accordance with the latest statement of financial position approved by the annual ordinary general shareholders’ meeting) attributable to such shareholder’s shares; provided that such shareholder exercises that right within 15 days following the meeting at which the change was approved.
Dividends
At each annual ordinary general shareholders’ meeting, Cemex, S.A.B. de C.V.’s Board of Directors submits, for approval by its shareholders, its financial statements together with a report on them prepared by its Board of Directors and the statutory auditors. Cemex, S.A.B. de C.V.’s shareholders, once they have approved the financial statements, determine the allocation of our net income, after provision for income taxes, legal reserve and statutory employee profit sharing payments, for the preceding year. All shares of Cemex, S.A.B. de C.V.’s capital stock outstanding at the time a dividend or other distribution is declared are entitled to share equally in that dividend or other distribution.
Liquidation Rights
In the event Cemex, S.A.B. de C.V. is liquidated, the surplus assets remaining after payment of all its creditors will be divided among Cemex, S.A.B. de C.V.’s shareholders in proportion to the respective shares held by them. The liquidator may, with the approval of Cemex, S.A.B. de C.V.’s shareholders, distribute the surplus assets in kind among Cemex, S.A.B. de C.V.’s shareholders, sell the surplus assets and divide the proceeds among Cemex, S.A.B. de C.V.’s shareholders or put the surplus assets to any other uses agreed to by a majority of Cemex, S.A.B. de C.V.’s shareholders voting at an extraordinary shareholders’ meeting.
Differences Between Our Corporate Governance Practices and NYSE Standards for Domestic
Companies
For a description of significant ways in which Cemex, S.A.B. de C.V.’s corporate governance practices differ from those required of domestic companies under NYSE standards, see “Item 16G—Corporate Governance.”
You may find additional information in the corporate governance section of our website www.cemex.com, or you may contact our investment relations team, by writing to or telephoning us as follows:
Cemex, S.A.B. de C.V. Avenida Ricardo Margáin Zozaya #325
Colonia Valle del Campestre
San Pedro Garza García, Nuevo León, 66265, México
Attn: Louisa P. Rodriguez–Investor Relations
Telephone: +1 (212) 317-6011
Email: ir@cemex.com
The information on our website is not, and is not intended to be, part of this annual report and is not incorporated into this annual report by reference.
285
Table of Contents
Capital Stock
On April 5, 2018, we approved (a) an increase of our capital stock, in its variable part, for the amount of Ps2,082,457.50 through the issuance of up to 750,000,000 ordinary shares, nominative and without par value, of which up to 500,000,000 would be Series A shares, and up to 250,000,000 would be Series B shares, with the same characteristics and with the same rights as those currently outstanding, and which shares would be kept in treasury to be subscribed and exhibited under the terms and conditions of the RSIP; and (b) an increase of the authorized capital stock, in its variable part, for the amount of Ps1,258,407.08, through the issuance of 453,217,080 common shares, nominative and without par value, of which 302,144,720 would be Series A shares and 151,072,360 would be Series B shares, with the same rights and obligations as those currently outstanding, to be subscribed and issued through a public offering or private subscription, both in Mexico and abroad, and/or through the issuance of convertible securities into shares. The capital stock increases were made at a theoretical value of Ps0.00277661 per share.
At the annual ordinary general shareholders’ meeting of Cemex, S.A.B. de C.V., held on March 28, 2019, Cemex, S.A.B. de C.V. declared a cash dividend payment in the amount of Ps150 million, paid in two equal installments, in June 2019 and December 2019. On March 28, 2019, Cemex, S.A.B. de C.V. approved (a) a decrease of our capital stock, in its variable part, for the amount of Ps5,477,536.94, through the cancellation of 1,972,742,640 ordinary treasury shares, nominative and without par value, of which 1,315,161,760 were Series A shares and 657,580,880 were Series B shares, which supported the issuance of convertible debentures issued in March 2011 and that matured in March 2018; (b) a decrease of our capital stock, in its variable part, for the amount of Ps1,279,493.15, through the cancellation of 460,811,259 shares of our own common stock, ordinary, nominative and without par value, of which 307,207,506 were Series A shares and 153,603,753 were Series B shares, which were acquired through the repurchase program in the fiscal year 2018; and (c) an increase of our capital stock, in its variable part, for the amount of Ps416,491.50, through the issuance of 150,000,000 ordinary shares, nominative and without par value, of which 100,000,000 would be Series A shares and 50,000,000 would be Series B shares, with the same characteristics and the same rights as those currently outstanding, in order to preserve the rights of the holders of the debentures pursuant to the convertible debentures issuance acts. The capital stock decreases and increases were made at a theoretical value of Ps0.00277661 per share.
On March 26, 2020, we approved (a) a decrease in our capital stock, in its variable part, for the amount of Ps1,313,614.19, through the cancellation of 473,100,000 shares of common stock, ordinary, nominative and without par value, of which 315,400,000 would be Series A shares and 157,700,000 would be Series B shares, which were acquired through the repurchase program for the fiscal year 2019; (b) a decrease in our capital stock, in its variable part, for the amount of Ps82,708.48, through the cancellation of 29,787,576 treasury shares, common, nominative and without par value, of which 19,858,384 were Series A shares and 9,929,192 were Series B shares, which supported the issuance of the November 2019 Mandatory Convertible Mexican Peso Notes, and which remain in treasury after their settlement at maturity; and (c) a decrease in our capital stock, in its variable part, for the amount of Ps3,546,912.00, through the cancellation of 1,277,425,350 treasury shares, common, nominative and without par value, of which 851,616,900 are Series A shares and 425,808,450 are Series B shares, which supported the issuance of the convertible notes issued in March 2015, with an aggregate principal amount of $521 million, that matured on March 15, 2020, and which as of December 31, 2020, remained in treasury after their liquidation at maturity. Decreases in capital stock were made at a theoretical value of Ps0.00277661 per share.
At our annual ordinary general shareholders’ meeting held on March 25, 2021, we approved (a) a decrease in our capital stock, in its variable part, for the amount of Ps3,150,021.51, through the cancellation of 1,134,484,680 shares owned, ordinary, nominative and without par value, of which 756,323,120 were Series A shares and 378,161,560 were Series B shares, which were acquired through the repurchase program for the fiscal year 2020; and (b) a decrease in our capital stock, in its variable part, for the amount of Ps9,466,882.27, through the cancellation of 3,409,510,974 treasury shares, common, nominative and without par value, of which 2,273,007,316 were Series A shares and 1,136,503,658 were Series B shares, which supported new issues of
286
Table of Contents
convertible securities and/or to be subscribed and issued through public offering or private subscription, both in Mexico and abroad. The capital stock reductions were made at a theoretical value of Ps0.00277661 per share.
During 2021, Cemex did not use the repurchase program authorized at Cemex, S.A.B. de C.V.’s ordinary general shareholders’ meeting held on March 26, 2020 and March 25, 2021. As a result, as no repurchases of CPOs took place during 2021, Cemex, S.A.B. de C.V.’s ordinary general shareholders’ meeting held on March 24, 2022 did not include on its agenda the cancellation of shares repurchased by Cemex, S.A.B. de C.V.
During 2022, under the repurchase programs authorized at Cemex, S.A.B. de C.V.’s ordinary general shareholders’ meeting held on March 25, 2021 and March 24, 2022, Cemex, S.A.B. de C.V. repurchased 220.6 million CPOs, at a weighted average price in Mexican pesos equivalent to $0.5026 per CPO, which was equivalent to an amount of $110.9 million. The shares repurchased during 2022 under such repurchase programs were proposed and subsequently approved for cancellation at Cemex, S.A.B. de C.V.’s annual ordinary general shareholders’ meeting held on March 23, 2023.
Cemex, S.A.B. de C.V. did not declare a dividend for fiscal years 2021 or 2022. See “Item 8—Financial Information—Dividends” for a description of Cemex, S.A.B. de C.V.’s policy on dividend distributions and dividend restrictions. As of December 31, 2022, Cemex, S.A.B. de C.V.’s common stock was represented as follows:
| 2022 | ||||||||
| Shares(1) |
Series A(2) | Series B(2) | ||||||
| Subscribed and paid shares |
29,016,656,496 | 14,508,328,248 | ||||||
| Unissued shares authorized for stock compensation programs |
881,442,830 | 440,721,415 | ||||||
|
|
|
|
|
|||||
| 29,898,099,326 | 14,949,049,663 | |||||||
| (1) | As of December 31, 2022, 13,068,000,000 shares correspond to the fixed portion, and 32,441,076,423 shares correspond to the variable portion. |
| (2) | Series A or Mexican shares must represent at least 64% of Cemex, S.A.B. de C.V.’s capital stock and Series B or free subscription shares must represent at most 36% of Cemex, S.A.B. de C.V.’s capital stock. |
Material Contracts
For a description of the material terms relating to the Notes, see “Item 5—Operating and Financial Review and Prospects—Summary of Material Contractual Obligations and Commercial Commitments—Notes.”
For a description of the material terms relating to the 2022 EUR Credit Agreement, see “Item 5—Operating and Financial Review and Prospects —Summary of Material Contractual Obligations and Commercial Commitments—2022 EUR Credit Agreement.”
For a description of the material terms relating to the 5.125% Subordinated Notes, see “Item 5—Operating and Financial Review and Prospects—Summary of Material Contractual Obligations and Commercial Commitments—Subordinated Notes.”
Exchange Controls
Not applicable.
287
Table of Contents
Taxation
Mexican Tax Considerations
General
The following is a summary of certain Mexican federal income tax considerations relating to the ownership and disposition of Cemex, S.A.B. de C.V.’s CPOs or ADSs.
This summary is based on provisions of the Mexican Federal Income Tax Law (Ley del impuesto Sobre la Renta, or the “Mexican Income Tax Law”) in effect on the date hereof, which is subject to change (possibly with retroactive effect) or to new or different interpretations, which could affect the continued validity or correctness of this summary. This summary is limited to non-residents of Mexico, as defined below, who own Cemex, S.A.B. de C.V.’s CPOs or ADSs. This summary does not constitute tax advice and does not address all aspects of Mexican Income Tax Law. This summary does not describe any tax consequences arising under the laws, rules or regulations of any state or municipality of Mexico. Holders should consult their tax counsel as to the tax consequences that the purchase, ownership and disposition of Cemex, S.A.B. de C.V.’s CPOs or ADSs may have.
Tax residency is a highly technical definition that involves the application of a number of factors that are specified in the Mexican Tax Code (Código Fiscal de la Federación). An individual is a resident of Mexico if he or she has established his or her home in Mexico. If the individual also has a home in another country, he or she will be considered a resident of Mexico if his or her center of vital interests is in Mexico. Under Mexican law, an individual’s center of vital interests is in Mexico if, among other things:
| • | more than 50% of the individual’s total income in the calendar year comes from Mexican sources; or |
| • | the individual’s main center of professional activities is in Mexico. |
A Mexican national that is employed by the Mexican government is deemed resident of Mexico, even if his or her center of vital interests is located outside of Mexico. Unless otherwise proven, Mexican nationals are deemed residents of Mexico for tax purposes.
A legal entity is a resident of Mexico if it is organized under the laws of Mexico or if it maintains the principal administration of its business or the effective location of its management in Mexico. A Mexican citizen is presumed to be a resident of Mexico for tax purposes unless such person can demonstrate otherwise. If a legal entity or an individual is deemed to have a permanent establishment in Mexico for tax purposes, all income attributable to such permanent establishment will be subject to Mexican taxes, in accordance with relevant tax provisions.
A non-resident of Mexico is a legal entity or individual that does not satisfy the requirements to be considered a resident of Mexico for Mexican tax purposes.
Taxation of Dividends
Dividends from earnings generated before January 1, 2014, either in cash or in any other form, paid to non-residents of Mexico with respect to Series A shares or Series B shares represented by the CPOs (or in the case of holders who hold CPOs represented by ADSs), will not be subject to withholding tax in Mexico.
As a result of the enactment of certain tax provisions in Mexico, as of January 1, 2014, dividends in cash from identified pre-tax retained earnings generated after January 1, 2014 will be subject to a 10% withholding tax. This tax is considered as a definitive payment.
288
Table of Contents
Disposition of CPOs or ADSs
As a result of the enactment of certain tax provisions in Mexico, as of January 1, 2014, in the case of Mexican individuals, capital gains on the sale or other disposition of shares issued by Mexican companies on the MSE will be subject to a 10% withholding tax, which will be withheld by the intermediary acting as a withholding agent.
Under Mexican tax law, gains on the sale or disposition of CPOs or ADSs by a holder who is a non-resident of Mexico will not be subject to Mexican income tax, to the extent such sale is carried out through the MSE or other recognized securities market, as determined by Mexican tax authorities, and the non-resident’s country of tax residency has a tax treaty in force with Mexico. An affidavit stating that the non-resident of Mexico is entitled to tax treaty benefits should be delivered to the intermediary operating the disposition. Gains realized on sales or other dispositions of CPOs or ADSs by non-residents of Mexico made in other circumstances would be subject to a 10% capital gain withholding tax.
In addition, under the terms of the Convention Between the United States and Mexico for Avoidance of Double Taxation and Prevention of Fiscal Evasion with Respect to Income Taxes, and a protocol thereto (together, the “Tax Treaty”), gains obtained by a U.S. Holder (as defined below) eligible for benefits under the Tax Treaty on the disposition of CPOs or ADSs will generally not be subject to Mexican tax; provided that such gains are not attributable to a permanent establishment of such U.S. Holder in Mexico and that the eligible U.S. Holder did not own, directly or indirectly, 25% or more of our outstanding stock during the 12-month period preceding the disposition. Furthermore, in the case of non-residents of Mexico eligible for the benefits of a tax treaty, gains derived from the disposition of ADSs or CPOs may also be exempt, in whole or in part, from Mexican taxation under a treaty to which Mexico is a party.
The term “U.S. Holder” shall have the same meaning ascribed below under the section “Item 10—Additional Information—U.S. Federal Income Tax Considerations.”
As of January 1, 2022, transfers of shares issued by Mexican entities between non-residents of Mexico should be informed to the Mexican Tax Authorities by the Mexican issuer entity within the following month of the transaction. However, this new obligation is not applicable to shares or CPOs traded in the MSE.
Estate and Gift Taxes
There are no Mexican inheritance or succession taxes applicable to the ownership, transfer or disposition of ADSs or CPOs by holders that are non-residents of Mexico, although gratuitous transfers of CPOs may, in some circumstances, cause a Mexican federal tax to be imposed upon a recipient. There are no Mexican stamp, issue, registration or similar taxes or duties payable by holders of ADSs or CPOs.
U.S. Federal Income Tax Considerations
General
The following is a summary of U.S. federal income tax considerations generally applicable to the ownership and disposition of Cemex, S.A.B. de C.V.’s CPOs and ADSs.
This summary is limited to U.S. Holders who hold CPOs or ADSs as “capital assets” (generally, property held for investment) for U.S. federal income tax purposes. This summary is based on the U.S. Internal Revenue Code of 1986, as amended, U.S. Treasury Regulations promulgated thereunder (“Treasury Regulations”), administrative pronouncements, judicial decisions and other relevant authorities, all as in effect as of the date thereof and all of which are subject to change, possibly with retroactive effect.
This summary does not address U.S. federal estate, gift or other non-income tax considerations, the alternative minimum tax, the Medicare tax on certain net investment income, or any state, local or non-U.S. tax
289
Table of Contents
considerations, relating to the ownership or disposition of CPOs or ADSs, nor does it address all aspects of U.S. federal income taxation that may be relevant to a particular U.S. Holder in light of its particular circumstances or that may be relevant to U.S. Holders subject to special rules under U.S. federal income tax law, such as banks and other financial institutions, real estate investment trusts, regulated investment companies, insurance companies, dealers in securities or currencies, traders in securities that elect to use a mark-to-market method of accounting, former citizens or long-term residents of the United States, tax-exempt entities, persons who actively or constructively own 10% or more of our voting stock (by vote or value), persons that acquire CPOs or ADSs pursuant to any employee share option or otherwise as compensation, persons that hold CPOs or ADSs as part of a straddle, hedge, conversion, constructive sale or other integrated transaction, or persons whose functional currency is not the Dollar.
For purposes of this summary, a “U.S. Holder” means a beneficial owner of CPOs or ADSs, that is, for U.S. federal income tax purposes:
| • | a citizen or individual resident of the United States.; |
| • | a corporation (or other entity treated as a corporation for U.S. federal income tax purposes) that is created or organized in or under the laws of United States, any state thereof of the District of Columbia; |
| • | an estate the income of which is subject to U.S. federal income tax regardless of its source; or |
| • | a trust if (i) a U.S. court is able to exercise primary supervision over its administration and one or more U.S. persons have the authority to control all of its substantial decisions or (ii) it has a valid election in effect under applicable Treasury Regulations to be treated as a U.S. person. |
If a partnership (including any entity or arrangement treated as a partnership for U.S. federal income tax purposes) is the beneficial owner of CPOs or ADSs, the U.S. federal income tax treatment of a partner in such partnership will generally depend upon the status of the partner and the activities of the partnership. Partnerships that hold CPOs or ADSs and their partners should consult their tax advisors regardingan investment in CPOs or ADSs.
Prospective investors should consult their tax advisors with respect to the U.S. federal, state, local and non-U.S. income and other tax considerations relevant to the ownership and disposition of CPOs or ADSs in light of their particular circumstances.
Ownership of CPOs or ADSs
In general, for U.S. federal income tax purposes, U.S. Holders who own ADSs will be treated as the beneficial owners of the CPOs represented by those ADSs, and each CPO will represent a beneficial interest in two Series A shares and one Series B share.
Distributions
The gross amount of any distribution with respect to the Series A shares or Series B shares represented by CPOs, including CPOs represented by ADSs (without reduction for Mexican withholding tax) will generally be subject to tax as ordinary dividend income to the extent paid out of our current or accumulated earnings and profits, as determined under U.S. federal income tax principles, and will be includible in the gross income of a U.S. Holder on the day actually or constructively received. Distributions in excess of our current or accumulated earnings and profits will first be treated as a tax-free return of capital to the extent of the U.S. Holder’s adjusted tax basis in the CPOs or ADSs, as applicable, and thereafter generally as capital gain. Any such dividend will not be eligible for the dividends-received deduction allowed to corporate U.S. Holders. Because we don’t intend to determine our earnings and profits on the basis of U.S. federal income tax principles, any distributions we pay will generally be treated as dividends for U.S. federal income tax purposes.
290
Table of Contents
The gross amount of any dividends paid in Mexican Pesos will be includible in the income of a U.S. Holder in a Dollar amount calculated by reference to the exchange rate in effect the day the Mexican Pesos are actually or constructively received by the CPO trustee or successor thereof whether or not the Mexican Pesos are converted into Dollars on that day. Generally, any gain or loss resulting from currency exchange fluctuations during the period from the date the dividend payment is includible in income to the date such payment is converted into Dollars will be treated as ordinary income or loss. Such gain or loss will generally be income from sources within the United States for foreign tax credit limitation purposes.
A non-corporate U.S. Holder will generally be subject to tax on dividend income received on the CPOs or ADSs at the lower capital gains tax rate applicable to “qualified dividend income,” provided that certain holding period requirements are met. “Qualified dividend income” includes dividends paid on shares of “qualified foreign corporations” if, among other things: (i) the shares of the foreign corporation are readily tradable on an established securities market in the United States, or (ii) the foreign corporation is eligible with respect to substantially all of its income for the benefits of a comprehensive income tax treaty (the “Treaty”) with the United States which contains an exchange of information program.
We believe that we are a “qualified foreign corporation” because (i) the ADSs trade on the New York Stock Exchange and (ii) we are eligible for the benefits of the Treaty, which constitutes a comprehensive income tax treaty with the United States which includes an exchange of information program. Accordingly, we believe that any dividends we pay should constitute “qualified dividend income” for U.S. federal income tax purposes. However, we cannot assure you that we will continue to be considered a “qualified foreign corporation” or that our dividends will continue to be “qualified dividend income.”
For U.S. foreign tax credit purposes, dividends received on CPOs or ADSs shares will generally be treated as income from foreign sources and will generally constitute passive category income. Depending on the U.S. Holder’s individual facts and circumstances and subject to certain conditions and limitations, a Treaty-eligible U.S. Holder may be eligible to claim a foreign tax credit in respect of any Mexican income taxes pair or withheld with respect to dividends on CPOs or ADSs to the extent such taxes are nonrefundable under the Treaty. Alternatively, a U.S. Holder may elect to deduct such taxes in computing its taxable income for U.S. federal income tax purposes. A U.S. Holder’s election to deduct foreign taxes instead of claiming foreign tax credits applies to all creditable foreign income taxes paid or accrued in the relevant taxable year. The rules regarding foreign tax credits and the deductibility of foreign taxes are complex. U.S. Holders should consult their tax advisors regarding the availability of foreign tax credits and the deductibility of foreign taxes in light of their particular circumstances.
Sale or Other Disposition of CPOs or ADSs
A U.S. Holder will generally recognize gain or loss on the sale or other disposition of CPOs or ADSs in an amount equal to the difference between the amount realized on the disposition and the U.S. Holder’s adjusted tax basis in the CPOs or ADSs. Any such gain or loss will generally be long-term capital gain or loss if the U.S. Holder’s holding period for the CPOs or ADSs exceeds one year at the time of the disposition. Long-term capital gains of individuals and certain other non-corporate U.S. Holders are generally eligible for a reduced rate of taxation. The deductibility of capital losses may be subject to limitations.
Gain recognized by a U.S. Holder on the sale or other disposition of CPOs or ADSs will generally be treated as from sources within the United States for U.S. foreign tax credit purposes. Consequently, a U.S. Holder may not be able to claim a credit for any Mexican or other non-U.S. tax imposed on such gain unless the credit can be applied (subject to applicable limitations) against tax due on other income treated as derived from foreign sources. In addition, under recently issued Treasury Regulations, it is possible that a U.S. Holder may not be entitled to claim a U.S. foreign tax credit with respect to any Mexican withholding tax imposed on gain recognized on a sale or other disposition of CPOs or ADSs unless the U.S. Holder is eligible for, and properly claims, the benefits of the Tax Treaty, pursuant to which the U.S. Holder may treat such gain as Mexican source
291
Table of Contents
for U.S. foreign tax credit limitation purposes. The rules governing the U.S. foreign tax credit are complex and the application thereof depends in large part on the U.S. Holder’s individual facts and circumstances. Accordingly, U.S. Holders should consult their tax advisors regarding the availability of the U.S. foreign tax credit (or a deduction in lieu of the U.S. foreign tax credit) in their particular circumstances, as well as their eligibility for benefits under the Tax Treaty and the effects of the recently issued Treasury Regulations.
THE PRECEDING SUMMARY OF U.S. FEDERAL INCOME TAX CONSIDERATIONS IS INTENDED FOR GENERAL INFORMATION ONLY AND DOES NOT CONSTITUTE TAX ADVICE. U.S. HOLDERS SHOULD CONSULT THEIR TAX ADVISORS AS TO THE U.S. FEDERAL, STATE, LOCAL, AND NON-U.S. TAX CONSIDERATIONS GENERALLY APPLICABLE TO THE OWNERSHIP AND DISPOSITION OF OUR CPOs OR ADSs IN LIGHT OF THEIR PARTICULAR CIRCUMSTANCES.
Documents on Display
We are subject to the informational requirements of the Exchange Act and, in accordance with these requirements, file reports and information statements and other information with the SEC. These reports and information statements and other information filed by us with the SEC are available at the SEC’s website www.sec.gov.
In reviewing the agreements included as exhibits to this annual report, please remember they are included to provide you with information regarding their terms and are not intended to provide any other factual or disclosure information about us or the other parties to the agreements.
The agreements may contain representations and warranties by each of the parties to the applicable agreement. These representations and warranties have been made solely for the benefit of the other parties to the applicable agreement and:
| • | should not in all instances be treated as categorical statements of fact, but rather as a way of allocating the risk to one of the parties if those statements prove to be inaccurate; |
| • | have been qualified by disclosures that were made to the other party in connection with the negotiation of the applicable agreement, which disclosures are not necessarily reflected in the agreement; and |
| • | may apply standards of materiality in a way that is different from what may be viewed as material to you or other investors; |
| • | and were made only as of the date of the applicable agreement or such other date or dates as may be specified in the agreement and are subject to more recent developments. |
Accordingly, these representations and warranties may not describe the actual state of affairs as of the date they were made or at any other time.
Item 11—Quantitative and Qualitative Disclosures About Market Risk
See “Item 5—Operating and Financial Review and Prospects—Quantitative and Qualitative Market Disclosure.”
Item 12—Description of Securities Other than Equity Securities
Item 12A—Debt Securities
Not applicable.
292
Table of Contents
Item 12B—Warrants and Rights
Not applicable.
Item 12C—Other Securities
Not applicable.
Item 12D—American Depositary Shares
293
Table of Contents
Depositary Fees and Charges
Under the terms of the Deposit Agreement for Cemex, S.A.B. de C.V.’s ADSs, an ADS holder may have to pay the following service fees to the depositary:
| Services |
Fees | |
| Issuance of ADSs upon deposit of eligible securities |
Up to 5¢ per ADS issued. | |
| Surrender of ADSs for cancelation and withdrawal of deposited securities |
Up to 5¢ per ADS surrendered. | |
| Exercise of rights to purchase additional ADSs |
Up to 5¢ per ADS issued. | |
| Distribution of cash (i.e., upon sale of rights and other entitlements) |
Up to 2¢ per ADS held. |
An ADS holder also is responsible to pay fees and expenses incurred by the ADS depositary and taxes and governmental charges including, but not limited to:
| • | transfer and registration fees charged by the registrar and transfer agent for eligible and deposited securities, such as upon deposit of eligible securities and withdrawal of deposited securities; |
| • | expenses incurred for converting foreign currency into Dollars; |
| • | expenses for cable, telex and fax transmissions and for delivery of securities; |
| • | expenses incurred in connection with compliance with exchange control regulations and other applicable regulatory requirements; |
| • | fees and expenses incurred in connection with the delivery of deposited securities; and |
| • | taxes and duties upon the transfer of securities, such as when eligible securities are deposited or withdrawn from deposit. |
We have agreed to pay some of the other charges and expenses of the ADS depositary. Note that the fees and charges that a holder of ADSs is required to pay may vary over time and may be changed by us and by the ADS depositary. ADS holders will receive notice of the changes. The fees described above may be amended from time to time.
Depositary Payments for the Year Ended December 31, 2022
In 2022, we received $2,203,506.62 (after applicable U.S. taxes and including payments to third parties) from our Depositary Bank, Citibank, N.A., to reimburse us for contributions towards our investor relations activities (including but not limited to investor meetings, conferences and fees to investor relations service vendors) and other miscellaneous expenses related to the listing of our ADSs on the NYSE.
294
Table of Contents
PART II
Item 13—Defaults, Dividend Arrearages and Delinquencies
None.
Item 14—Material Modifications to the Rights of Security Holders and Use of Proceeds
None.
Item 15—Controls and Procedures
Disclosure Controls and Procedures
Our management has evaluated, with the participation of Cemex, S.A.B. de C.V.’s CEO and CFO, the effectiveness of our disclosure controls and procedures (as defined in Rule 13a-15(e) under the Exchange Act) as of the end of the period covered by this annual report, and has concluded that our disclosure controls and procedures were effective as of December 31, 2022.
Management’s Annual Report on Internal Control Over Financial Reporting
Our management is responsible for establishing and maintaining adequate internal control over financial reporting (as defined in Rule 13a-15(f) under the Exchange Act). Internal control over financial reporting refers to a process designed by, or under the supervision of, the CEO and CFO and effected by Cemex, S.A.B. de C.V.’s Board of Directors and our management to provide reasonable assurance regarding the reliability of financial reporting and the preparation of financial statements for external purposes in accordance with generally accepted accounting principles and includes those policies and procedures that:
| • | pertain to the maintenance of records that in reasonable detail accurately and fairly reflect the transactions and dispositions of our assets; |
| • | provide reasonable assurance that transactions are recorded as necessary to permit preparation of financial statements in accordance with generally accepted accounting principles, and that our receipts and expenditures are being made only in accordance with authorizations of our management and members of Cemex, S.A.B. de C.V.’s Board of Directors; and |
| • | provide reasonable assurance regarding prevention or timely detection of unauthorized acquisition, use or disposition of our assets that could have a material effect on our financial statements. |
Under the supervision and with the participation of our management, including the CEO and CFO and principal financial and accounting officers, we conducted an evaluation of the effectiveness of our internal control over financial reporting as of December 31, 2022, using the criteria established in “Internal Control—Integrated Framework (2013)” issued by the Committee of Sponsoring Organizations of the Treadway Commission (COSO). Based on this evaluation, our management has concluded that our internal control over financial reporting was effective as of December 31, 2022.
Attestation Report of the Independent Registered Public Accounting Firm
The report on the audit of the effectiveness of our internal control over financial reporting issued by KPMG Cárdenas Dosal, S.C., a registered public accounting firm appears on page F-110 of this annual report.
295
Table of Contents
Changes in Internal Control Over Financial Reporting
We have not identified changes in our internal control over financial reporting during 2022 that have materially affected, or are reasonably likely to materially affect, our internal control over financial reporting.
Item 16—RESERVED
Item 16A—Audit Committee Financial Expert
Cemex, S.A.B. de C.V.’s Board of Directors has determined that it has at least one “audit committee financial expert” (as defined in Item 16A of Form 20-F) serving on its Audit Committee. Mr. Everardo Elizondo Almaguer meets the requisite qualifications.
Item 16B — Code of Ethics
We have adopted a written code of ethics that applies to all board members, employees, including our principal executive officer, principal financial officer and principal accounting officer, third parties (including but not limited to customers, suppliers, and contractors) and other stakeholders. All of our employees are expected to comply with this code in their daily interactions.
Our code of ethics provides the following main guidelines:
| (i) | Our purpose and scope: we look to act with integrity in our day-to-day work. This is important for Cemex’s sustained success and to create a workplace in which our people can thrive. Our code of ethics aims to provide guidance on what is expected from all of us as part of Cemex; |
| (ii) | Our people: we believe our people are our competitive advantage and the reason for our success. Therefore, we aim to provide a great place to work, we encourage an atmosphere of openness, courage, generosity and respect, so that all employees feel free to come forward with their questions, ideas, and concerns; |
| (iii) | Health and safety in the workplace: we plan to prevent incidents and safeguard the health and safety of our workforce and are committed to carrying out our business activities in a safe and efficient manner to care for the well-being of all those on our sites and those who may be impacted by our activities; |
| (iv) | Human rights: we look to support and respect the protection of internationally proclaimed human rights principles and we do not tolerate any violation of human rights in our business, our supply chain or partnerships; |
| (v) | Harassment and workplace respect: we look to foster an environment of mutual respect, and we promote supporting and encouraging each other; |
| (vi) | Diversity and inclusion: we seek to support differences and provide an inclusive work environment for everyone. Recruitment, promotion, training, compensation and benefits should be based on ability, career experience and alignment with our values; |
| (vii) | Customer relations: we work to be our customers’ best option and aim to conduct our business dealings fairly, professionally and with integrity. We expect our customers to act with the same integrity; |
| (viii) | Supplier relations: we look to manage our supplier relationships with honesty, respect and integrity, offering equal opportunities for all parties; |
| (ix) | Government relations: our operations require a wide range of interactions with government agencies in many countries; these agencies may act as regulators, customers, suppliers, stockholders and/or promoters. We seek to always conduct our interactions with these agencies in a manner consistent with our values, with a particular emphasis on integrity; |
296
Table of Contents
| (x) | Community relations: we are committed to promoting and contributing to the development of our communities by preserving the environment, fostering mutually beneficial relationships and maintaining open lines of communication. When considering Cemex’s participation in economic, social, and environmental programs, we should always comply with the law; |
| (xi) | Environment: our business should be carried out in an environmentally responsible and sustainable manner, aiming to mitigate the environmental and social impacts of our business; |
| (xii) | Antitrust compliance: we operate in many countries and are subject to different antitrust laws and regulations. Therefore, we are committed to conducting our business activities in compliance with local laws and regulations, and our policies; |
| (xiii) | Anti-corruption: we forbid our personnel from promising or providing anything of value to government officials or any third parties to secure any undue advantage or unduly influence any decisions; |
| (xiv) | Preventing money laundering: in order to prevent money laundering, we must recognize the signs of money laundering and procure that we do not facilitate or support the process of covering up the source of illicit funds of criminal activities through our legitimate business; |
| (xv) | Conflicts of interest and corporate opportunities: our employees, officers and directors have an obligation to conduct themselves in an honest and ethical manner and to act in our best interest. Our employees, officers and directors should not engage in situations that present or could present a potential or actual conflict between their personal interests and our interests; |
| (xvi) | Gifts and hospitalities: we avoid accepting or giving hospitalities of any kind that may influence, or appear to compromise, decision-making on current or future negotiations. We should never seek or structure a negotiation on the basis of any gift, service or hospitality from a customer, supplier, consultant, service provider or other third-party; |
| (xvii) | Use of Cemex’s assets: employees should never use Cemex assets for their own benefit, and seek that the Company’s assets are not misused by others, stolen or damaged. When using company devices it is prohibited for employees to create, view, store, request or distribute anything of an offensive, illegal or inappropriate nature; |
| (xviii) | Political activities: we acknowledge and respect the right of our employees to participate in activities external to the company, such as politics; provided that they are legal in their jurisdiction. Employees are not allowed to conduct political activities at company facilities, use company resources for these activities or engage in these activities on company time. We can make political contributions as long as the contributions are allowed by local law and pre-approved internally; |
| (xix) | Data privacy and protection: we are committed to protecting the confidentiality and integrity of personal data to foster trustworthy business relationships. We aim to process personal data fairly and lawfully and provide access to such data within our organization only on a need-to- know basis; |
| (xx) | Insider trading: we should never transact with Cemex securities while in possession of material non-public information about the company. We should never “tip” others or share material non-public information even if we do not intend to obtain profits for ourselves or others; |
| (xxi) | Intellectual property: we seek the protection of Cemex’s intellectual property and capture innovation to achieve added value and freedom to operate. Cemex recognizes and respects the intellectual property of third parties and intends to prevent and avoid consequences of potential infringement of third parties’ rights; |
| (xxii) | Accurate records: we look to provide our stakeholders with correct and complete information in a timely manner. Anyone responsible for financial records, or any other Cemex records or reporting, must seek that those records accurately reflect our business activities, are supported by evidence, and are complete, accurate, and timely; and |
297
Table of Contents
| (xxiii) | Communication and use of social media: we should not make any statements outside of Cemex about company performance, initiatives or any other internal matters. We look to keep all confidential matters safe. |
We promote awareness and enforcement of our code of ethics through our ethics committees, training programs and secured internal communications channels. We periodically evaluate and update the provisions of our code of ethics.
You may view our code of ethics in the corporate governance section of our website (www.cemex.com), or you may request a copy of our code of ethics, at no cost, by writing to or calling us at:
Cemex, S.A.B. de C.V. Avenida Ricardo Margáin Zozaya #325
Colonia Valle del Campestre
San Pedro Garza García, Nuevo León, 66265, México
Attn: Luis Hernández Echávez
Telephone: +52 81 8888-8888
Item 16C—Principal Accountant Fees and Services
Audit Fees: KPMG Cárdenas Dosal, S.C. in Mexico and KPMG firms worldwide charged us $15 million in fiscal year 2022 in connection with the professional services rendered for the audit of our annual financial statements and services normally provided by them relating to statutory and regulatory filings or engagements. In fiscal year 2021, KPMG Cárdenas Dosal, S.C. in Mexico and KPMG firms worldwide charged us $14 million for these services.
Audit-Related Fees: KPMG Cárdenas Dosal, S.C. in Mexico and KPMG firms worldwide charged us $1 million in fiscal year 2022 for assurance and related services reasonably related to the performance of our audit. In fiscal year 2021, KPMG Cárdenas Dosal, S.C. in Mexico and KPMG firms worldwide charged us $1 million for audit-related services.
Tax Fees: KPMG Cárdenas Dosal, S.C. in Mexico and KPMG firms worldwide charged us $1 million in fiscal year 2022 for tax compliance, tax advice and tax planning. In fiscal year 2021, KPMG Cárdenas Dosal, S.C. in Mexico and KPMG firms worldwide charged us $1 million for tax-related services.
All other fees: KPMG Cárdenas Dosal, S.C. in Mexico and KPMG firms worldwide charged us $1 million in fiscal year 2022 for products and services other than those comprising audit fees, audit-related fees and tax fees. In fiscal year 2021, KPMG Cárdenas Dosal, S.C. in Mexico and KPMG firms worldwide charged us $1 million for products and services in this category. These fees relate mainly to services provided by KPMG to us with respect to our sustainability report assurance, technical accounting matters and other services.
Audit Committee Pre-Approval Policies and Procedures
Our Audit Committee is responsible for, among other things, the appointment, compensation and oversight of our independent external auditors. To assure the independence of our independent external auditors, our Audit Committee pre-approves annually a catalog of specific audit and non-audit services in the categories Audit Services, Audit-Related Services, Tax-Related Services and Other Services that may be performed by our auditors, as well as the budgeted fee levels for each of these categories. All other permitted services must receive a specific approval from our Audit Committee. Our external auditor periodically provides a report to our Audit Committee in order for our Audit Committee to review the services that our external auditor is providing, as well as the status and cost of those services.
During 2022, there were no services provided to us by our external auditors that were performed pursuant to the de minimis exception.
298
Table of Contents
Item 16D—Exemptions from the Listing Standards for Audit Committees
Not applicable.
Item 16E—Purchases of Equity Securities by the Issuer and Affiliated Purchasers
Not applicable.
Item 16F—Change in Registrant’s Certifying Accountant
Not applicable.
Item 16G—Corporate Governance
Section 303A.11 of the NYSE Listed Company Manual (“LCM”) requires that listed foreign private issuers, such as Cemex, disclose any significant ways in which their corporate governance practices differ from those followed by U.S. companies under NYSE listing standards.
Cemex’s corporate governance practices are governed by its by-laws, by the corporate governance provisions set forth in the Mexican Securities Market Law (Ley del Mercado de Valores), the Mexican Regulation for Issuers (Disposiciones de Carácter General aplicables a las Emisoras de Valores y a otros Participantes del Mercado de Valores) issued by the Mexican Banking and Securities Commission (Comisión Nacional Bancaria y de Valores) and the MSE Rules (Reglamento Interior de la Bolsa Mexicana de Valores) and by applicable U.S. securities laws. Cemex is also subject to the rules of the NYSE to the extent they apply to foreign private issuers. Except for those specific rules, foreign private issuers are permitted to follow home country practice in lieu of the provisions of Section 303A of the LCM.
Cemex, on a voluntary basis, also complies with the Mexican Code of Best Corporate Practices (Código de Mejores Prácticas Corporativas) which, as indicated below, was promulgated by a committee established by the Mexican Corporate Coordination Board (Consejo Coordinador Empresarial). The Mexican Corporate Coordination Board provides recommendations for better corporate governance practices for listed companies in Mexico, and the Mexican Code of Best Corporate Practices has been endorsed by the Mexican Banking and Securities Commission.
The following is a summary of significant ways in which our corporate governance practices differ from those required to be followed by U.S. domestic companies under the NYSE’s listing standards.
| NYSE LISTING STANDARDS | CEMEX CORPORATE GOVERNANCE PRACTICE | |
| 303A.01 |
||
| Listed companies must have a majority of independent directors. | Pursuant to the Mexican Securities Market Law, Cemex, S.A.B. de C.V. is required to have a board of directors with a maximum of 21 members, 25% of whom must be independent. Determination as to the independence of Cemex, S.A.B. de C.V.’s directors is made upon their election by Cemex, S.A.B. de C.V.’s shareholders at the corresponding meeting. As of December 31, 2022, Cemex, S.A.B. de C.V.’s Board of Directors had 12 members, of which 75% are independent under the Mexican Securities Market Law. As of the date of this annual report, Cemex, S.A.B. de C.V.’s Board of Directors has 13 members, of which 77% are independent under the Mexican Securities Market Law. | |
299
Table of Contents
| NYSE LISTING STANDARDS | CEMEX CORPORATE GOVERNANCE PRACTICE | |
| 303A.02 | ||
| A listed company’s board of directors must perform director independence tests and affirmatively determine a director has no material relationship with the listed company after broadly considering all relevant facts and circumstances. | The Mexican Securities Market Law sets forth, in article 26, the definition of “independence,” which differs from the one set forth in Section 303A.02 of the LCM. Generally, under the Mexican Securities Market Law, a director is not independent if such director is an employee or officer of the company or its subsidiaries; an individual that has significant influence over the company or its subsidiaries; a shareholder that is part of a group that controls the company; or, if there exist certain relationships between a company and a director, entities with which the director is associated or family members of the director. | |
| 303A.03 |
||
| Non-management directors must meet at regularly scheduled executive sessions without management. | Under Cemex, S.A.B. de C.V.’s by-laws and Mexican laws and regulations, our non-management and independent directors are not required to meet in executive sessions. Cemex, S.A.B. de C.V.’s Board of Directors must meet at least once every three months. | |
| 303A.04 | ||
| Listed companies must have a nominating/ corporate governance committee composed of independent directors. | Under Cemex, S.A.B. de C.V.’s by-laws and Mexican laws and regulations, we are not required to have and do not have a nominating/corporate governance committee. However, Cemex, S.A.B. de C.V.’s Corporate Practices and Finance Committee performs substantially similar functions as would be performed by a nominating/ corporate governance committee.
Cemex, S.A.B. de C.V.’s Corporate Practices and Finance Committee operates pursuant to the provisions of the Mexican Securities Market Law and Cemex, S.A.B. de C.V.’s by-laws. Cemex, S.A.B. de C.V.’s Corporate Practices and Finance Committee is composed of three independent directors.
Cemex, S.A.B. de C.V.’s Corporate Practices and Finance Committee is responsible for performing the role of a nomination and compensation committee, mainly by (1) evaluating the employment and compensation of the Chief Executive Officer and the Chairman of the Board of Directors and (2) reviewing the hiring and compensation policies for executive officers; reviewing related party transactions and any conflicts of interest; reviewing policies regarding use of corporate assets; reviewing unusual or material transactions; evaluating waivers granted to directors or executive officers regarding participation and benefitting of corporate opportunities; identification, evaluation and follow up on the main risks affecting the company and its subsidiaries; evaluating financial plans; reviewing the financial strategy and its implementation; evaluating merger and acquisitions opportunities as well as asset sales, including financial and related transactions; and carrying out other activities described under Mexican law. Cemex, S.A.B. de C.V.’s Corporate Practices and Finance Committee meets as required by Cemex, S.A.B. de C.V.’s by-laws and by Mexican laws and regulations. For more information on our Corporate Practices and Finance Committee, see “Item 6—Directors, Senior Management and Employees—Board Practices—The Audit Committee, the Corporate Practices and Finance Committee and Other Committees.” | |
300
Table of Contents
| NYSE LISTING STANDARDS | CEMEX CORPORATE GOVERNANCE PRACTICE | |
| 303A.05 | ||
| Listed companies must have a compensation committee composed of independent directors. | Under Cemex, S.A.B. de C.V.’s by-laws and Mexican laws and regulations, we are not required to have and do not have a compensation committee. However, Cemex, S.A.B. de C.V.’s Corporate Practices and Finance Committee performs substantially similar functions as would be performed by a compensation committee. For more information on Cemex, S.A.B. de C.V.’s Corporate Practices and Finance Committee, see “Item 6—Directors, Senior Management and Employees—Board Practices—The Audit Committee, the Corporate Practices and Finance Committee and Other Committees.” | |
| Compensation committee members must satisfy additional independence requirements specific to compensation committee membership. | See above. | |
| Listed companies must have an audit committee that satisfies the requirements of Rule 10A-3 under the Exchange Act. | Cemex, S.A.B. de C.V.’s Audit Committee operates pursuant to the provisions of the Mexican Securities Market Law and Cemex, S.A.B. de C.V.’s by-laws.
Cemex, S.A.B. de C.V.’s Audit Committee is composed of three independent members. According to Cemex, S.A.B. de C.V.’s by-laws and the Mexican Securities Market Law, all of the members must be independent.
Cemex, S.A.B. de C.V.’s Audit Committee is responsible for evaluating internal controls and procedures and identifying deficiencies; following up with corrective and preventive measures in response to any non-compliance with operation and accounting guidelines and policies; evaluating the performance of external auditors and analyzing the reports, opinions and other information issued by such external auditors; describing and valuing non-audit services performed by external auditors; reviewing financial statements and determining if their approval should be recommended to the Board of Directors; informing the Board of Directors of the state of the company’s internal controls, internal audit and accounting systems, including any breaches detected; supporting the Board of Directors in producing different reports submitted to the shareholders; assessing the effects of any modifications to the accounting policies approved during any fiscal year; overseeing measures adopted as a result of any observations made by shareholders, directors, executive officers, employees or any third parties with respect to accounting, internal controls and internal and external audit, as well as any complaints regarding management irregularities; supervising complaints raised by employees, third parties and other stakeholders to report ethical, corruption, and/or compliance matters utilizing confidential methods and other whistleblowing mechanisms; ensuring compliance by the Chief Executive Officer with the resolutions adopted by the shareholders and Board of Directors; and analyzing the risks identified by independent auditors, accounting, internal control and process assessment areas. | |
301
Table of Contents
| NYSE LISTING STANDARDS | CEMEX CORPORATE GOVERNANCE PRACTICE | |
| Cemex, S.A.B. de C.V.’s Board of Directors has determined that it has an “audit committee financial expert,” for purposes of the Sarbanes-Oxley Act of 2002, serving on its Audit Committee.
Cemex, S.A.B. de C.V.’s Audit Committee meets as required by Cemex, S.A.B. de C.V.’s by-laws and by Mexican laws and regulations. | ||
| 303A.09 | ||
| Listed companies must adopt and disclose corporate governance guidelines. | Under Cemex, S.A.B. de C.V.’s by-laws and Mexican laws and regulations, we are not required to adopt corporate governance guidelines, but, on an annual basis, we file a report with the MSE regarding our compliance with the Mexican Code of Best Corporate Practices. | |
| 303A.10 | ||
| Listed companies must adopt and disclose a code of business conduct and ethics for directors, officers and employees, and promptly disclose any waivers of the code for directors or executive officers. | Cemex, S.A.B. de C.V. has adopted and disclosed a written code of business conduct and ethics that applies to all of our directors, officers and employees. | |
| Equity compensation plans Equity compensation plans require shareholder approval, subject to limited exemptions. | Shareholder approval is not expressly required under Cemex, S.A.B. de C.V.’s by-laws for the adoption and amendment of an equity compensation plan. However, at our annual shareholders’ meeting held on April 5, 2018, Cemex, S.A.B. de C.V.’s shareholders resolved to extend our current stock program for our employees, officers and administrators until December 31, 2023. | |
Item 16H—Mine Safety Disclosure
The information concerning mine safety violations and other regulatory matters required by Section 1503(a) of the Dodd-Frank Wall Street Reform and Consumer Protection Act is included in Exhibit 15.1 to this annual report.
Item 16I—Disclosure Regarding Foreign Jurisdictions that Prevent Inspections
Not applicable.
302
Table of Contents
PART III
Item 17—Financial Statements
Not applicable.
Item 18—Financial Statements
See pages F-1 through F-106, incorporated herein by reference.
Item 19—Exhibits
303
Table of Contents
304
Table of Contents
| (a) | Incorporated by reference to the Registration Statement on Form F-4 of Cemex, S.A.B. de C.V. (Registration No. 333-10682), filed with the SEC on August 10, 1999. |
305
Table of Contents
| (b) | Incorporated by reference to the 2009 annual report on Form 20-F of Cemex, S.A.B. de C.V. filed with the SEC on June 30, 2010. |
| (c) | Incorporated by reference to the Registration Statement on Form F-6 of Cemex, S.A.B. de C.V. (Registration No. 333-174743), filed with the SEC on June 6, 2011. |
| (d) | Incorporated by reference to the 2014 annual report on Form 20-F of Cemex, S.A.B. de C.V. filed with the SEC on April 27, 2015. |
| (e) | Incorporated by reference to the 2015 annual report on Form 20-F of Cemex, S.A.B. de C.V. filed with the SEC on April 22, 2016. |
| (f) | Incorporated by reference to the 2016 annual report on Form 20-F of Cemex, S.A.B. de C.V. filed with the SEC on April 28, 2017. |
| (g) | Incorporated by reference to the 2018 annual report on Form 20-F of Cemex, S.A.B. de C. V. filed with the SEC on April 25, 2019. |
| (h) | Incorporated by reference to the 2019 annual report on Form 20-F of Cemex, S.A.B. de C. V. filed with the SEC on April 29, 2020. |
| (i) | Incorporated by reference to the 2020 annual report on Form 20-F of Cemex, S.A.B. de C. V. filed with the SEC on April 23, 2021. |
| (j) | Incorporated by reference to the 2021 annual report on Form 20-F of Cemex, S.A.B. de C. V. filed with the SEC on April 29, 2022. |
| (k) | Filed herewith. |
| (l) | This was a paper filing, and it is not available on the SEC website. |
In reviewing the agreements included as exhibits to this annual report, please remember they are included to provide you with information regarding their terms and are not intended to provide any other factual or disclosure information about us or the other parties to the agreements.
The agreements may contain representations and warranties by each of the parties to the applicable agreement. These representations and warranties have been made solely for the benefit of the other parties to the applicable agreement and:
| • | should not in all instances be treated as categorical statements of fact, but rather as a way of allocating the risk to one of the parties if those statements prove to be inaccurate; |
| • | have been qualified by disclosures that were made to the other party in connection with the negotiation of the applicable agreement, which disclosures are not necessarily reflected in the agreement; |
| • | may apply standards of materiality in a way that is different from what may be viewed as material to you or other investors; and |
| • | were made only as of the date of the applicable agreement or such other date or dates as may be specified in the agreement and are subject to more recent developments. |
Accordingly, these representations and warranties may not describe the actual state of affairs as of the date they were made or at any other time.
306
Table of Contents
SIGNATURES
Cemex, S.A.B. de C.V. hereby certifies that it meets all of the requirements for filing on Form 20-F and that it has duly caused and authorized the undersigned to sign this annual report on its behalf.
| Cemex, S.A.B. de C.V. | ||
| By: | /s/ Fernando Ángel González Olivieri | |
| Name: | Fernando Ángel González Olivieri | |
| Title: | Chief Executive Officer | |
Date: April 28, 2023
Table of Contents
CEMEX, S.A.B. de C.V. and Subsidiaries: |
||||
| F-2 | ||||
| F-3 | ||||
| F-4 | ||||
| F-5 | ||||
| F-6 | ||||
| F-7 | ||||
| F-107 | ||||
| F-110 |
Years ended December 31, |
||||||||||||||||
Notes |
2022 |
2021 |
2020 |
|||||||||||||
Revenues |
3 |
$ | ||||||||||||||
Cost of sales |
2.17, 5 |
( |
) | ( |
) | ( |
) | |||||||||
Gross profit |
||||||||||||||||
Operating expenses |
2.17, 6 |
( |
) | ( |
) | ( |
) | |||||||||
Operating earnings before other expenses, net |
2.1 |
|||||||||||||||
Other expenses, net |
7 |
( |
) | ( |
) | ( |
) | |||||||||
Operating earnings (loss) |
( |
) | ||||||||||||||
Financial expense |
8.1, 17 |
( |
) | ( |
) | ( |
) | |||||||||
Financial income and other items, net |
8.2 |
( |
) | ( |
) | |||||||||||
Share of profit of equity accounted investees |
14.1 |
|||||||||||||||
Earnings (loss) before income tax |
( |
) | ||||||||||||||
Income tax |
20 |
( |
) | ( |
) | ( |
) | |||||||||
Net income (loss) from continuing operations |
( |
) | ||||||||||||||
Discontinued operations |
4.2 |
( |
) | ( |
) | |||||||||||
CONSOLIDATED NET INCOME (LOSS) |
( |
) | ||||||||||||||
Non-controlling interest net income |
||||||||||||||||
CONTROLLING INTEREST NET INCOME (LOSS) |
$ |
( |
) | |||||||||||||
Basic earnings (loss) per share |
23 |
$ | ( |
) | ||||||||||||
Basic earnings (loss) per share from continuing operations |
23 |
$ | ( |
) | ||||||||||||
Diluted earnings (loss) per share |
23 |
$ | ( |
) | ||||||||||||
Diluted earnings (loss) per share from continuing operations |
23 |
$ | ( |
) | ||||||||||||
Years ended December 31, |
||||||||||||||||
Notes |
2022 |
2021 |
2020 |
|||||||||||||
CONSOLIDATED NET INCOME (LOSS) |
$ |
( |
) | |||||||||||||
Items that will not be reclassified subsequently to the statement of operations |
||||||||||||||||
Net actuarial gains (losses) from remeasurements of defined benefit pension plans |
19 |
( |
) | |||||||||||||
Effects from strategic equity investments |
14.2 |
( |
) | ( |
) | ( |
) | |||||||||
Income tax income (expense) recognized directly in other comprehensive income |
20 |
( |
) | ( |
) | |||||||||||
| ( |
) | |||||||||||||||
Items that are or may be reclassified subsequently to the statement of operations |
||||||||||||||||
Results from derivative financial instruments designated as cash flow hedges |
17.4 |
( |
) | |||||||||||||
Currency translation results of foreign subsidiaries |
21.2 |
( |
) | ( |
) | ( |
) | |||||||||
Income tax income (expense) recognized directly in other comprehensive income |
20 |
|||||||||||||||
| ( |
) | ( |
) | ( |
) | |||||||||||
Total items of other comprehensive income (loss), net |
( |
) | ( |
) | ( |
) | ||||||||||
TOTAL COMPREHENSIVE INCOME (LOSS) |
( |
) | ||||||||||||||
Non-controlling interest comprehensive income (loss) |
( |
) | ( |
) | ||||||||||||
CONTROLLING INTEREST COMPREHENSIVE INCOME (LOSS) |
$ |
( |
) | |||||||||||||
December 31, |
||||||||||||
Notes |
2022 |
2021 |
||||||||||
ASSETS |
||||||||||||
CURRENT ASSETS |
||||||||||||
Cash and cash equivalents |
9 |
$ | ||||||||||
Trade accounts receivable |
10 |
|||||||||||
Other accounts receivable |
11 |
|||||||||||
Inventories |
12 |
|||||||||||
Assets held for sale and other current assets |
13 |
|||||||||||
Total current assets |
||||||||||||
NON-CURRENT ASSETS |
||||||||||||
Investments in associates and joint ventures |
14.1 |
|||||||||||
Other investments and non-current accounts receivable |
14.2 |
|||||||||||
Property, machinery and equipment, net and assets for the right-of-use, |
15 |
|||||||||||
Goodwill and intangible assets, net |
16 |
|||||||||||
Deferred income tax assets |
20.2 |
|||||||||||
Total non-current assets |
||||||||||||
TOTAL ASSETS |
$ |
|||||||||||
LIABILITIES AND STOCKHOLDERS’ EQUITY |
||||||||||||
CURRENT LIABILITIES |
||||||||||||
Current debt |
17.1 |
$ | ||||||||||
Other current financial obligations |
17.2 |
|||||||||||
Trade payables |
||||||||||||
Income tax payable |
||||||||||||
Other current liabilities |
18.1 |
|||||||||||
Liabilities directly related to assets held for sale |
13 |
|||||||||||
Total current liabilities |
||||||||||||
NON-CURRENT LIABILITIES |
||||||||||||
Non-current debt |
17.1 |
|||||||||||
Other non-current financial obligations |
17.2 |
|||||||||||
Pensions and other post-employment benefits |
19 |
|||||||||||
Deferred income tax liabilities |
20.2 |
|||||||||||
Other non-current liabilities |
18.2 |
|||||||||||
Total non-current liabilities |
||||||||||||
TOTAL LIABILITIES |
||||||||||||
STOCKHOLDERS’ EQUITY |
||||||||||||
Controlling interest: |
||||||||||||
Common stock and additional paid-in capital |
21.1 |
|||||||||||
Other equity reserves and subordinated notes |
21.2 |
( |
) | ( |
) | |||||||
Retained earnings |
21.3 |
|||||||||||
Total controlling interest |
||||||||||||
Non-controlling interest |
21.4 |
|||||||||||
TOTAL STOCKHOLDERS’ EQUITY |
||||||||||||
TOTAL LIABILITIES AND STOCKHOLDERS’ EQUITY |
$ |
|||||||||||
Years ended December 31, |
||||||||||||||||
Notes |
2022 |
2021 |
2020 |
|||||||||||||
OPERATING ACTIVITIES |
||||||||||||||||
Consolidated net income (loss) |
$ |
( |
) | |||||||||||||
Discontinued operations |
( |
) | ( |
) | ||||||||||||
Net income (loss) from continuing operations |
( |
) | ||||||||||||||
Adjustments for: |
||||||||||||||||
Gain on sale of emission allowances |
2.19, 7 |
( |
) | |||||||||||||
Depreciation and amortization of assets |
5, 6 |
|||||||||||||||
Impairment losses of longed-lived assets |
7 |
|||||||||||||||
Share of profit of equity accounted investees |
14.1 |
( |
) | ( |
) | ( |
) | |||||||||
Results on sale of subsidiaries, other disposal groups and others |
( |
) | ( |
) | ( |
) | ||||||||||
Financial expense, financial income and other items, net |
||||||||||||||||
Income taxes |
20 |
|||||||||||||||
Changes in working capital, excluding income taxes |
( |
) | ( |
) | ||||||||||||
Cash flows provided by operating activities from continuing operations |
||||||||||||||||
Interest paid |
( |
) | ( |
) | ( |
) | ||||||||||
Income taxes paid |
( |
) | ( |
) | ( |
) | ||||||||||
Net cash flows provided by operating activities from continuing operations |
||||||||||||||||
Net cash flows provided by operating activities from discontinued operations |
||||||||||||||||
Net cash flows provided by operating activities |
||||||||||||||||
INVESTING ACTIVITIES |
||||||||||||||||
Purchase of property, machinery and equipment, net |
15 |
( |
) | ( |
) | ( |
) | |||||||||
Proceeds from disposal of subsidiaries and assets held for sale, net |
4, 14.1 |
|||||||||||||||
Proceeds from the sale of emission allowances |
2.19, 7 |
|||||||||||||||
Acquisition of intangible assets, net |
16.1 |
( |
) | ( |
) | ( |
) | |||||||||
Non-current assets and others, net |
( |
) | ( |
) | ||||||||||||
Cash flows provided by (used in) investing activities from continuing operations |
( |
) | ( |
) | ||||||||||||
Net cash flows provided by (used in) investing activities from discontinued operations |
( |
) | ( |
) | ||||||||||||
Net cash flows provided by (used in) investing activities |
( |
) |
( |
) |
||||||||||||
FINANCING ACTIVITIES |
||||||||||||||||
Proceeds from new debt instruments |
17.1 |
|||||||||||||||
Debt repayments |
17.1 |
( |
) | ( |
) | ( |
) | |||||||||
Issuance of subordinated notes |
21.2 |
|||||||||||||||
Other financial obligations, net |
17.2 |
( |
) | ( |
) | ( |
) | |||||||||
Share repurchase program |
21.1 |
( |
) | ( |
) | |||||||||||
Shares in trust for future deliveries under share-based compensation |
22 |
( |
) | |||||||||||||
Changes in non-controlling interests and repayment of perpetual debentures |
21.4 |
( |
) | ( |
) | ( |
) | |||||||||
Derivative financial instruments |
17.4 |
( |
) | |||||||||||||
Coupons on perpetual debentures and subordinated notes |
21.2, 21.4 |
( |
) | ( |
) | ( |
) | |||||||||
Non-current liabilities, net |
( |
) | ( |
) | ( |
) | ||||||||||
Net cash flows used in financing activities |
( |
) |
( |
) |
( |
) | ||||||||||
Increase (decrease) in cash and cash equivalents from continuing operations |
( |
) | ( |
) | ||||||||||||
Increase in cash and cash equivalents from discontinued operations |
||||||||||||||||
Foreign currency translation effect on cash |
( |
) | ||||||||||||||
Cash and cash equivalents at beginning of period |
||||||||||||||||
CASH AND CASH EQUIVALENTS AT END OF PERIOD |
9 |
$ |
||||||||||||||
Changes in working capital, excluding income taxes: |
||||||||||||||||
Trade receivables |
$ | ( |
) | ( |
) | |||||||||||
Other accounts receivable and other assets |
( |
) | ( |
) | ||||||||||||
Inventories |
( |
) | ( |
) | ||||||||||||
Trade payables |
||||||||||||||||
Other accounts payable and accrued expenses |
( |
) | ||||||||||||||
Changes in working capital, excluding income taxes |
$ |
( |
) |
( |
) |
|||||||||||
Notes |
Common stock |
Additional paid-in capital |
Other equity reserves and subordinated notes |
Retained earnings |
Total controlling interest |
Non-controlling interest |
Total stockholders’ equity |
|||||||||||||||||||||||
Balance as of December 31, 2019 |
$ |
( |
) |
|||||||||||||||||||||||||||
Net loss for the period |
— | — | — | ( |
) | ( |
) | ( |
) | |||||||||||||||||||||
Other comprehensive income (loss) for the period |
— | — | ( |
) | — | ( |
) | ( |
) | ( |
) | |||||||||||||||||||
Total of other comprehensive income (loss) for the period |
21.2 |
— | — | ( |
) | ( |
) | ( |
) | ( |
) | ( |
) | |||||||||||||||||
Own shares purchased under shares repurchase program |
21.1 |
— | ( |
) | ( |
) | — | ( |
) | — | ( |
) | ||||||||||||||||||
Restitution of retained earnings |
21.3 |
— | ( |
) | — | — | — | — | ||||||||||||||||||||||
Changes in non-controlling interest |
21.4 |
— | — | — | ( |
) | — | |||||||||||||||||||||||
Share-based compensation |
22 |
— | — | — | ||||||||||||||||||||||||||
Coupons paid on perpetual debentures |
21.4 |
— | — | ( |
) | — | ( |
) | — | ( |
) | |||||||||||||||||||
Balance as of December 31, 2020 |
( |
) |
||||||||||||||||||||||||||||
Net income for the period |
— | — | — | |||||||||||||||||||||||||||
Other comprehensive income (loss) for the period |
— | — | ( |
) | — | ( |
) | ( |
) | ( |
) | |||||||||||||||||||
Total of other comprehensive income (loss) for the period |
21.2 |
— | — | ( |
) | |||||||||||||||||||||||||
Own shares purchased under shares repurchase program |
21.1 |
— | ( |
) | — | — | ||||||||||||||||||||||||
Issuance of subordinated notes |
21.2 |
— | — | — | — | |||||||||||||||||||||||||
Changes in non-controlling interest and repayment of perpetual debentures |
21.4 |
— | — | — | — | — | ( |
) | ( |
) | ||||||||||||||||||||
Share-based compensation |
22 |
— | — | — | — | |||||||||||||||||||||||||
Coupons paid on perpetual debentures and subordinated notes |
21.2, 21.4 |
— | — | ( |
) | — | ( |
) | — | ( |
) | |||||||||||||||||||
Balance as of December 31, 2021 |
( |
) |
||||||||||||||||||||||||||||
Net income for the period |
— | — | — | |||||||||||||||||||||||||||
Other comprehensive income (loss) for the period |
— | — | ( |
) | — | ( |
) | ( |
) | ( |
) | |||||||||||||||||||
Total of other comprehensive income (loss) for the period |
21.2 |
— | — | ( |
) | ( |
) | |||||||||||||||||||||||
Own shares purchased under shares repurchase program |
21.1 |
— | ( |
) | — | ( |
) | — | ( |
) | ||||||||||||||||||||
Shares in trust for future deliveries under share-based compensation |
22 |
— | — | ( |
) | — | ( |
) | — | ( |
) | |||||||||||||||||||
Changes in non-controlling interest |
21.4 |
— | — | — | — | |||||||||||||||||||||||||
Share-based compensation |
22 |
— | — | — | — | |||||||||||||||||||||||||
Coupons paid on subordinated notes |
21.2, 21.4 |
— | — | ( |
) | — | ( |
) | — | ( |
) | |||||||||||||||||||
Balance as of December 31, 2022 |
$ |
( |
) |
|||||||||||||||||||||||||||
1) |
DESCRIPTION OF BUSINESS |
2) |
SIGNIFICANT ACCOUNTING POLICIES |
2.1) |
BASIS OF PRESENTATION AND DISCLOSURE |
2) |
SIGNIFICANT ACCOUNTING POLICIES — continued |
2.1) |
BASIS OF PRESENTATION AND DISCLOSURE — continued |
| • | In 2022, 2021 and 2020, the increases in other financing obligations in connection with lease contracts negotiated during the year for $ |
2) |
SIGNIFICANT ACCOUNTING POLICIES — continued |
2.1) |
BASIS OF PRESENTATION AND DISCLOSURE — continued |
| • | In 2022, 2021 and 2020, in connection with the leases negotiated during the year, the increases in assets for the right-of-use |
Standard |
Main topic | |
| Amendment to IAS 37, Provisions, Contingent Liabilities and Contingent Assets |
Clarifies that the ‘cost of fulfilling’ a contract comprises the ‘costs that relate directly to the contract’. Costs that relate directly to a contract can either be incremental costs of fulfilling that contract or an allocation of other costs that relate directly to fulfilling contracts. | |
| Amendments to IAS 16, Property, Plant and Equipment |
Clarifies the standard to prohibit deducting from the cost of an item of property, plant and equipment any proceeds from selling items produced while bringing that asset to the location and condition necessary for it to be capable of operating in the manner intended by management. | |
| Annual improvements (2018-2020 cycle): IFRS 1 , First-time Adoption of IFRS |
The amendment permits a subsidiary to measure cumulative translation differences using the amounts reported by its parent, based on the parent’s date of transition to IFRSs. | |
| Annual improvements (2018-2020 cycle): IFRS 9, Financial Instruments |
The amendment clarifies which fees an entity includes when it applies the ‘10 per cent’ test in assessing whether to derecognize a financial liability. An entity includes only fees paid or received between the entity (the borrower) and the lender, including fees paid or received by either the entity or the lender on the other’s behalf. | |
| Amendments to IFRS 3, Business Combinations |
Update a reference in IFRS 3 to the Conceptual Framework for Financial Reporting without changing the accounting requirements for business combinations. | |
2.2) |
PRINCIPLES OF CONSOLIDATION |
2) |
SIGNIFICANT ACCOUNTING POLICIES — continued |
2.2) |
PRINCIPLES OF CONSOLIDATION — continued |
2.3) |
USE OF ESTIMATES AND CRITICAL ASSUMPTIONS |
2.4) |
CLIMATE CHANGE AND COMMITMENTS FOR THE REDUCTION OF CARBON DIOXIDE (“CO 2 ”) EMISSIONS (unaudited) |
2) |
SIGNIFICANT ACCOUNTING POLICIES — continued |
2.4) |
CLIMATE CHANGE AND COMMITMENTS FOR THE REDUCTION OF CARBON DIOXIDE (“CO 2 ”) EMISSIONS (unaudited) — continued |
2.5) |
FOREIGN CURRENCY TRANSACTIONS AND TRANSLATION OF FOREIGN CURRENCY FINANCIAL STATEMENTS |
2) |
SIGNIFICANT ACCOUNTING POLICIES — continued |
2.5) |
FOREIGN CURRENCY TRANSACTIONS AND TRANSLATION OF FOREIGN CURRENCY FINANCIAL STATEMENTS — continued |
2022 |
2021 |
2020 |
||||||||||||||||||||||
Currency |
Closing |
Average |
Closing |
Average |
Closing |
Average |
||||||||||||||||||
Peso |
||||||||||||||||||||||||
Euro |
||||||||||||||||||||||||
British Pound Sterling |
||||||||||||||||||||||||
Colombian Peso |
||||||||||||||||||||||||
2.6) |
CASH AND CASH EQUIVALENTS (note 9) |
2) |
SIGNIFICANT ACCOUNTING POLICIES — continued |
2.7) |
FINANCIAL INSTRUMENTS |
| • | Cash and cash equivalents (notes 2.6 and 9). |
| • | Trade receivables, other current accounts receivable and other current assets (notes 10 and 11). Due to their short-term nature, CEMEX initially recognizes these assets at the original invoiced or transaction amount less expected credit losses, as explained below. |
| • | Trade receivables sold under securitization programs, in which certain residual interest in the trade receivables sold in case of recovery failure and continued involvement in such assets is maintained, do not qualify for derecognition and are maintained in the statement of financial position (notes 10 and 17.2). |
| • | Investments and non-current accounts receivable (note 14.2). Subsequent changes in effects from amortized cost are recognized in the income statement as part of “Financial income and other items, net”. |
2) |
SIGNIFICANT ACCOUNTING POLICIES — continued |
2.7) |
FINANCIAL INSTRUMENTS — continued |
2) |
SIGNIFICANT ACCOUNTING POLICIES — continued |
2.7) |
FINANCIAL INSTRUMENTS — continued |
2) |
SIGNIFICANT ACCOUNTING POLICIES — continued |
2.7) |
FINANCIAL INSTRUMENTS — continued |
| • | Level 1.- represent quoted prices (unadjusted) in active markets for identical assets or liabilities that CEMEX can access at the measurement date. A quoted price in an active market provides the most reliable evidence of fair value and is used without adjustment to measure fair value whenever available. |
| • | Level 2.- are inputs other than quoted prices in active markets that are observable for the asset or liability, either directly or indirectly, and are used mainly to determine the fair value of securities, investments or loans that are not actively traded. Level 2 inputs included equity prices, certain interest rates and yield curves, implied volatility and credit spreads, among others, as well as inputs extrapolated from other observable inputs. In the absence of Level 1 inputs, CEMEX determined fair values by iteration of the applicable Level 2 inputs, the number of securities and/or the other relevant terms of the contract, as applicable. |
| • | Level 3.- inputs are unobservable inputs for the asset or liability. CEMEX used unobservable inputs to determine fair values, to the extent there are no Level 1 or Level 2 inputs, in valuation models such as Black-Scholes, binomial, discounted cash flows or multiples of Operating EBITDA, including risk assumptions consistent with what market participants would use to arrive at fair value. |
2.8) |
INVENTORIES (note 12) |
2.9) |
PROPERTY, MACHINERY AND EQUIPMENT AND ASSETS FOR THE RIGHT-OF-USE |
2) |
SIGNIFICANT ACCOUNTING POLICIES — continued |
2.9) |
PROPERTY, MACHINERY AND EQUIPMENT AND ASSETS FOR THE RIGHT-OF-USE |
Years |
||||
Administrative buildings |
||||
Industrial buildings |
||||
Machinery and equipment in plant |
||||
Ready-mix trucks and motor vehicles |
||||
Office equipment and other assets |
||||
2.10) |
BUSINESS COMBINATIONS, GOODWILL AND OTHER INTANGIBLE ASSETS (notes 4.1 and 16) |
2) |
SIGNIFICANT ACCOUNTING POLICIES — continued |
2.10) |
BUSINESS COMBINATIONS, GOODWILL AND OTHER INTANGIBLE ASSETS (notes 4.1 and 16) — continued |
2.11) |
IMPAIRMENT OF LONG-LIVED ASSETS (notes 15 and 16) |
2) |
SIGNIFICANT ACCOUNTING POLICIES — continued |
2.11) |
IMPAIRMENT OF LONG-LIVED ASSETS (notes 15 and 16) — continued |
2) |
SIGNIFICANT ACCOUNTING POLICIES — continued |
2.11) |
IMPAIRMENT OF LONG-LIVED ASSETS (notes 15 and 16) — continued |
2.12) |
PROVISIONS |
2) |
SIGNIFICANT ACCOUNTING POLICIES — continued |
2.12) |
PROVISIONS — continued |
2.13) |
PENSIONS AND OTHER POST-EMPLOYMENT BENEFITS (note 19) |
2) |
SIGNIFICANT ACCOUNTING POLICIES — continued |
2.13) |
PENSIONS AND OTHER POST-EMPLOYMENT BENEFITS (note 19) — continued |
2.14) |
INCOME TAXES (note 20) |
2) |
SIGNIFICANT ACCOUNTING POLICIES — continued |
2.14) |
INCOME TAXES (note 20) — continued |
Country |
2022 |
2021 |
2020 | |||
Mexico |
||||||
United States |
||||||
United Kingdom |
||||||
France |
||||||
Germany |
||||||
Spain |
||||||
Philippines |
||||||
Israel |
||||||
Colombia |
||||||
Others |
2) |
SIGNIFICANT ACCOUNTING POLICIES — continued |
2.14) |
INCOME TAXES (note 20) — continued |
2.15) |
STOCKHOLDERS’ EQUITY |
| • | Currency translation effects from the translation of foreign subsidiaries, net of: a) exchange results from foreign currency debt directly related to the acquisition of foreign subsidiaries; and b) exchange results from foreign currency related parties’ balances that are of a non-current investment class (note 2.5); |
| • | The effective portion of the valuation and liquidation effects from derivative financial instruments under cash flow hedging relationships, which are recorded temporarily in stockholders’ equity (note 2.7); |
| • | Changes in fair value of other investments in strategic securities (note 2.7); and |
| • | Current and deferred income taxes during the period arising from items whose effects are directly recognized in stockholders’ equity. |
| • | Effects related to controlling stockholders’ equity for changes or transactions affecting non-controlling interest stockholders in CEMEX’s consolidated subsidiaries; |
2) |
SIGNIFICANT ACCOUNTING POLICIES — continued |
2.15) |
STOCKHOLDERS’ EQUITY — continued |
| • | Effects attributable to controlling stockholders’ equity for financial instruments issued by consolidated subsidiaries that qualify for accounting purposes as equity instruments, such as the interest expense paid on perpetual debentures; |
| • | The balance of subordinated notes with no fixed maturity and any interest accrued thereof; and |
| • | The cancellation of the Parent Company’s shares held by consolidated entities. |
2.16) |
REVENUE RECOGNITION (note 3) |
2) |
SIGNIFICANT ACCOUNTING POLICIES — continued |
2.16) |
REVENUE RECOGNITION (note 3) — continued |
2.17) |
COST OF SALES AND OPERATING EXPENSES (notes 5 and 6) |
2.18) |
EXECUTIVE SHARE-BASED COMPENSATION (note 22) |
2.19) |
ALLOWANCES RELATED TO EMISSIONS OF CO 2 |
2) |
SIGNIFICANT ACCOUNTING POLICIES — continued |
2.19) |
ALLOWANCES RELATED TO EMISSIONS OF CO 2 — continued |
| • | Certificates received through government grants for no consideration paid are recognized at zero cost in the statement of financial position. |
| • | Revenues received from the sale of excess Allowances are recognized in the statement of operations in the period in which they occur. |
| • | Allowances that would be acquired to hedge exceeding CO 2 emissions would be recognized as intangible assets at cost and would be further amortized to cost of sales during the compliance period. |
| • | CEMEX would accrue a provision at market value against cost of sales when current emissions of CO 2 would exceed the number of emission rights on hand and the required additional Allowances would not be yet acquired in the market. |
| • | In addition, in certain countries, the environmental authorities impose levies per ton of CO 2 or other greenhouse gases released. Such expenses are recognized as part of cost of sales as incurred. |
2.20) |
CONCENTRATION OF CREDIT |
2) |
SIGNIFICANT ACCOUNTING POLICIES — continued |
2.21) |
NEWLY ISSUED IFRS NOT YET ADOPTED |
Standard |
Main topic |
Effective date | ||
| Amendments to IFRS 10, Consolidated financial statements |
Clarify the recognition of gains or losses in the Parent’s financial statements for the sale or contribution of assets between an investor and its associate or joint venture | Has yet to be set | ||
| Amendments to IAS 1, Presentation of Financial Statements Non-current |
Clarifies the requirements to be applied in classifying liabilities as current and non-current. |
January 1, 2023 | ||
| Amendments to IAS 8, Definition of Accounting Estimates |
The amendment makes a distinction between how an entity should present and disclose different types of accounting changes in its financial statements. Changes in accounting policies must be applied retrospectively while changes in accounting estimates are accounted for prospectively. | January 1, 2023 | ||
| Amendments to IAS 1 and IFRS Practice Statement 2, Disclosure of Accounting Policies |
The amendment requires entities to disclose their material accounting policies rather than their significant accounting policies. To support this amendment the Board has also developed guidance and examples to explain and demonstrate the application of the ‘four-step materiality process’ described in IFRS Practice Statement 2 Making Materiality Judgements to accounting policy disclosures |
January 1, 2023 | ||
| Amendments to IAS 12, Income Taxes |
The amendment clarifies that companies should account for deferred tax assets and liabilities on transactions such as leases and decommissioning obligations. CEMEX has always applied these criteria. | January 1, 2023 | ||
| IFRS 17, Insurance Contracts |
The new Standard establishes the principles for the recognition, measurement, presentation and disclosure of insurance contracts and supersedes IFRS 4, Insurance contracts |
January 1, 2023 | ||
2) |
SIGNIFICANT ACCOUNTING POLICIES — continued |
2.21) |
NEWLY ISSUED IFRS NOT YET ADOPTED — continued |
Standard |
Main topic |
Effective date | ||
| Amendments to IFRS 16, Leases |
The amendments mentioned that on initial recognition, the seller-lessee would include variable payments when it measures a lease liability arising from a sale-and-leaseback |
January 1, 2024 |
3) |
REVENUES |
2022 |
2021 |
2020 |
||||||||||
From the sale of goods associated to CEMEX’s main activities 1 |
$ | |||||||||||
From the sale of other goods and services 2 |
||||||||||||
| $ | ||||||||||||
1 |
Include in each period immaterial amounts of revenue generated under construction contracts. |
2 |
Refers mainly to revenues generated by subsidiaries not individually significant operating in different lines of business. |
3) |
REVENUES — continued |
2022 |
2021 |
2020 |
||||||||||
Opening balance of contract liabilities with customers |
$ | |||||||||||
Increase during the period for new transactions |
||||||||||||
Decrease during the period for exercise or expiration of incentives |
( |
) | ( |
) | ( |
) | ||||||
Currency translation effects |
||||||||||||
Closing balance of contract liabilities with customers |
$ | |||||||||||
4) |
BUSINESS COMBINATIONS, DISCONTINUED OPERATIONS AND SELECTED FINANCIAL INFORMATION BY REPORTABLE SEGMENT AND LINE OF BUSINESS |
4.1) |
BUSINESS COMBINATIONS |
4) |
BUSINESS COMBINATIONS, DISCONTINUED OPERATIONS AND SELECTED FINANCIAL INFORMATION BY REPORTABLE SEGMENT AND LINE OF BUSINESS — continued |
4.2) |
DISCONTINUED OPERATIONS |
4) |
BUSINESS COMBINATIONS, DISCONTINUED OPERATIONS AND SELECTED FINANCIAL INFORMATION BY REPORTABLE SEGMENT AND LINE OF BUSINESS — continued |
4.2) |
DISCONTINUED OPERATIONS — continued |
2021 |
||||
Current assets |
$ | |||
Non-current assets |
||||
Total assets held for sale |
||||
Current liabilities |
||||
Non-current liabilities |
||||
Total liabilities directly related to assets held for sale |
||||
Total net assets held for sale |
$ | |||
2022 |
2021 |
2020 |
||||||||||
Revenues |
$ | |||||||||||
Cost of sales and operating expenses |
( |
) | ( |
) | ( |
) | ||||||
Other income (expenses), net |
( |
) | ( |
) | ( |
) | ||||||
Financial expenses, net and others |
||||||||||||
Earnings before income tax |
||||||||||||
Income tax |
( |
) | ( |
) | ( |
) | ||||||
Result of discontinued operations |
( |
) | ( |
) | ||||||||
Net disposal result |
( |
) | ( |
) | ||||||||
Net result of discontinued operations |
$ | ( |
) | ( |
) | |||||||
4.3) |
SELECTED FINANCIAL INFORMATION BY REPORTABLE SEGMENT AND LINE OF BUSINESS |
4) |
BUSINESS COMBINATIONS, DISCONTINUED OPERATIONS AND SELECTED FINANCIAL INFORMATION BY REPORTABLE SEGMENT AND LINE OF BUSINESS — continued |
4.3) |
SELECTED FINANCIAL INFORMATION BY REPORTABLE SEGMENT AND LINE OF BUSINESS — continued |
2022 |
Revenues (including intragroup transactions) |
Less: Intragroup transactions |
Revenues |
Operating EBITDA |
Less: Depreciation and amortization |
Operating earnings before other expenses, net |
Other expenses, net |
Financial expense |
Other financing items, net |
|||||||||||||||||||||||||||
Mexico |
$ | ( |
) | ( |
) | ( |
) | |||||||||||||||||||||||||||||
United States |
( |
) | ( |
) | ( |
) | ( |
) | ||||||||||||||||||||||||||||
EMEAA |
||||||||||||||||||||||||||||||||||||
United Kingdom |
— | ( |
) | ( |
) | ( |
) | |||||||||||||||||||||||||||||
France |
— | ( |
) | |||||||||||||||||||||||||||||||||
Germany |
( |
) | ( |
) | ( |
) | ||||||||||||||||||||||||||||||
Poland |
( |
) | ( |
) | ||||||||||||||||||||||||||||||||
Spain |
( |
) | ( |
) | ( |
) | ( |
) | ||||||||||||||||||||||||||||
Philippines 1 |
— | ( |
) | ( |
) | |||||||||||||||||||||||||||||||
Israel |
— | ( |
) | |||||||||||||||||||||||||||||||||
Rest of EMEAA |
( |
) | ( |
) | ( |
) | ||||||||||||||||||||||||||||||
SCA&C |
||||||||||||||||||||||||||||||||||||
Colombia 2 |
— | ( |
) | |||||||||||||||||||||||||||||||||
Panama 2 |
( |
) | ( |
) | — | — | ||||||||||||||||||||||||||||||
Caribbean TCL 3 |
( |
) | ( |
) | ( |
) | ( |
) | ||||||||||||||||||||||||||||
Dominican Republic |
( |
) | ( |
) | ( |
) | ( |
) | ||||||||||||||||||||||||||||
Rest of SCA&C 2 |
( |
) | ( |
) | ( |
) | ( |
) | ||||||||||||||||||||||||||||
Others |
( |
) | ( |
) | ( |
) | ( |
) | ( |
) | ||||||||||||||||||||||||||
Continuing operations |
( |
) | ( |
) | ( |
) | ||||||||||||||||||||||||||||||
Discontinued operations |
— | ( |
) | ( |
) | |||||||||||||||||||||||||||||||
Total |
$ | ( |
) | ( |
) | ( |
) | |||||||||||||||||||||||||||||
4) |
BUSINESS COMBINATIONS, DISCONTINUED OPERATIONS AND SELECTED FINANCIAL INFORMATION BY REPORTABLE SEGMENT AND LINE OF BUSINESS — continued |
4.3) |
SELECTED FINANCIAL INFORMATION BY REPORTABLE SEGMENT AND LINE OF BUSINESS — continued |
2021 |
Revenues (including intragroup transactions) |
Less: Intragroup transactions |
Revenues |
Operating EBITDA |
Less: Depreciation and amortization |
Operating earnings before other expenses, net |
Other expenses, net |
Financial expense |
Other financing items, net |
|||||||||||||||||||||||||||
Mexico |
$ | ( |
) | ( |
) | ( |
) | |||||||||||||||||||||||||||||
United States |
( |
) | ( |
) | ( |
) | ( |
) | ||||||||||||||||||||||||||||
EMEAA |
||||||||||||||||||||||||||||||||||||
United Kingdom |
— | ( |
) | ( |
) | ( |
) | |||||||||||||||||||||||||||||
France |
— | ( |
) | ( |
) | — | ||||||||||||||||||||||||||||||
Germany |
( |
) | — | ( |
) | ( |
) | |||||||||||||||||||||||||||||
Poland |
( |
) | ( |
) | ( |
) | ||||||||||||||||||||||||||||||
Spain |
( |
) | ( |
) | ( |
) | ( |
) | ( |
) | ||||||||||||||||||||||||||
Philippines 1 |
— | ( |
) | ( |
) | |||||||||||||||||||||||||||||||
Israel |
— | ( |
) | ( |
) | |||||||||||||||||||||||||||||||
Rest of EMEAA |
( |
) | ( |
) | ( |
) | ||||||||||||||||||||||||||||||
SCA&C |
||||||||||||||||||||||||||||||||||||
Colombia 2 |
— | ( |
) | ( |
) | ( |
) | |||||||||||||||||||||||||||||
Panama 2 |
( |
) | ( |
) | — | — | ||||||||||||||||||||||||||||||
Caribbean TCL 3 |
( |
) | ( |
) | ( |
) | ( |
) | ||||||||||||||||||||||||||||
Dominican Republic |
( |
) | — | ( |
) | |||||||||||||||||||||||||||||||
Rest of SCA&C 2 |
( |
) | ( |
) | ( |
) | ( |
) | ||||||||||||||||||||||||||||
Others |
( |
) | ( |
) | ( |
) | ( |
) | ( |
) | ||||||||||||||||||||||||||
Continuing operations |
( |
) | ( |
) | ( |
) | ( |
) | ||||||||||||||||||||||||||||
Discontinued operations |
— | ( |
) | ( |
) | |||||||||||||||||||||||||||||||
Total |
$ | ( |
) | ( |
) | ( |
) | ( |
) | |||||||||||||||||||||||||||
2020 |
Revenues (including intragroup transactions) |
Less: Intragroup transactions |
Revenues |
Operating EBITDA |
Less: Depreciation and amortization |
Operating earnings before other expenses, net |
Other expenses, net |
Financial expense |
Other financing items, net |
|||||||||||||||||||||||||||
Mexico |
$ | ( |
) | ( |
) | ( |
) | ( |
) | |||||||||||||||||||||||||||
United States |
( |
) | ( |
) | ( |
) | ( |
) | ||||||||||||||||||||||||||||
EMEAA |
||||||||||||||||||||||||||||||||||||
United Kingdom |
— | ( |
) | ( |
) | ( |
) | |||||||||||||||||||||||||||||
France |
— | ( |
) | ( |
) | |||||||||||||||||||||||||||||||
Germany |
( |
) | ( |
) | ( |
) | ( |
) | ||||||||||||||||||||||||||||
Poland |
( |
) | ( |
) | ( |
) | ||||||||||||||||||||||||||||||
Spain |
( |
) | ( |
) | ( |
) | ( |
) | ( |
) | ||||||||||||||||||||||||||
Philippines 1 |
— | ( |
) | |||||||||||||||||||||||||||||||||
Israel |
— | — | ( |
) | ||||||||||||||||||||||||||||||||
Rest of EMEAA |
( |
) | ( |
) | ( |
) | ( |
) | ||||||||||||||||||||||||||||
SCA&C |
||||||||||||||||||||||||||||||||||||
Colombia 2 |
— | ( |
) | ( |
) | ( |
) | |||||||||||||||||||||||||||||
Panama 2 |
( |
) | ( |
) | ( |
) | ( |
) | ||||||||||||||||||||||||||||
Caribbean TCL 3 |
( |
) | ( |
) | ( |
) | ( |
) | ||||||||||||||||||||||||||||
Dominican Republic |
( |
) | ( |
) | ( |
) | ||||||||||||||||||||||||||||||
Rest of SCA&C 2 |
( |
) | ( |
) | ( |
) | ||||||||||||||||||||||||||||||
Others |
( |
) | ( |
) | ( |
) | ( |
) | ||||||||||||||||||||||||||||
Continuing operations |
( |
) | ( |
) | ( |
) | ( |
) | ||||||||||||||||||||||||||||
Discontinued operations |
( |
) | ( |
) | ( |
) | ||||||||||||||||||||||||||||||
Total |
$ | ( |
) | ( |
) | ( |
) | ( |
) | |||||||||||||||||||||||||||
4) |
BUSINESS COMBINATIONS, DISCONTINUED OPERATIONS AND SELECTED FINANCIAL INFORMATION BY REPORTABLE SEGMENT AND LINE OF BUSINESS — continued |
4.3) |
SELECTED FINANCIAL INFORMATION BY REPORTABLE SEGMENT AND LINE OF BUSINESS — continued |
1 |
CEMEX’s operations in the Philippines are mainly conducted through CEMEX Holdings Philippines, Inc. (“CHP”), a Philippine company whose shares trade on the Philippines Stock Exchange. As of December 31, 2022 and 2021, there is a non-controlling interest in CHP of |
2 |
CEMEX Latam Holdings, S.A. (“CLH”), a company incorporated in Spain, trades its ordinary shares on the Colombian Stock Exchange. CLH is the indirect holding company of CEMEX’s operations in Colombia, Panama, Guatemala and Nicaragua, and until August 31, 2022, of the operations in Costa Rica and El Salvador. At year end 2022 and 2021, there is a non-controlling interest in CLH of |
3 |
The shares of TCL trade on the Trinidad and Tobago Stock Exchange. As of December 31, 2022 and 2021, there is a non-controlling interest in TCL of |
2022 |
Associates and joint ventures |
Other segment assets |
Total assets |
Total liabilities |
Net assets by segment |
Additions to fixed assets 1 |
||||||||||||||||||
Mexico |
$ | — | ||||||||||||||||||||||
United States |
||||||||||||||||||||||||
EMEAA |
||||||||||||||||||||||||
United Kingdom |
||||||||||||||||||||||||
France |
||||||||||||||||||||||||
Germany |
||||||||||||||||||||||||
Poland |
— | |||||||||||||||||||||||
Spain |
— | |||||||||||||||||||||||
Philippines |
— | |||||||||||||||||||||||
Israel |
— | |||||||||||||||||||||||
Rest of EMEAA |
||||||||||||||||||||||||
SCA&C |
||||||||||||||||||||||||
Colombia |
— | |||||||||||||||||||||||
Panama |
— | |||||||||||||||||||||||
Caribbean TCL |
— | |||||||||||||||||||||||
Dominican Republic |
— | |||||||||||||||||||||||
Rest of SCA&C |
— | |||||||||||||||||||||||
Others |
( |
) | ||||||||||||||||||||||
Total |
||||||||||||||||||||||||
Assets held for sale and related liabilities (note 13) |
— | — | — | |||||||||||||||||||||
Total consolidated |
$ | |||||||||||||||||||||||
4) |
BUSINESS COMBINATIONS, DISCONTINUED OPERATIONS AND SELECTED FINANCIAL INFORMATION BY REPORTABLE SEGMENT AND LINE OF BUSINESS — continued |
4.3) |
SELECTED FINANCIAL INFORMATION BY REPORTABLE SEGMENT AND LINE OF BUSINESS — continued |
2021 |
Associates and joint ventures |
Other segment assets |
Total assets |
Total liabilities |
Net assets by segment |
Additions to fixed assets 1 |
||||||||||||||||||
Mexico |
$ | — | ||||||||||||||||||||||
United States |
||||||||||||||||||||||||
EMEAA |
||||||||||||||||||||||||
United Kingdom |
||||||||||||||||||||||||
France |
||||||||||||||||||||||||
Germany |
||||||||||||||||||||||||
Poland |
||||||||||||||||||||||||
Spain |
— | |||||||||||||||||||||||
Philippines |
— | |||||||||||||||||||||||
Israel |
— | |||||||||||||||||||||||
Rest of EMEAA |
||||||||||||||||||||||||
SCA&C |
||||||||||||||||||||||||
Colombia |
— | |||||||||||||||||||||||
Panama |
— | |||||||||||||||||||||||
Caribbean TCL |
— | |||||||||||||||||||||||
Dominican Republic |
— | |||||||||||||||||||||||
Rest of SCA&C |
— | |||||||||||||||||||||||
Others |
( |
) | ||||||||||||||||||||||
Total |
||||||||||||||||||||||||
Assets held for sale and related liabilities (note 13) |
— | |||||||||||||||||||||||
Total consolidated |
$ | |||||||||||||||||||||||
1 |
In 2022 and 2021, the column “Additions to fixed assets” includes capital expenditures, which comprises acquisitions of property, machinery and equipment as well as additions of assets for the right-of-use, |
4) |
BUSINESS COMBINATIONS, DISCONTINUED OPERATIONS AND SELECTED FINANCIAL INFORMATION BY REPORTABLE SEGMENT AND LINE OF BUSINESS — continued |
4.3) |
SELECTED FINANCIAL INFORMATION BY REPORTABLE SEGMENT AND LINE OF BUSINESS — continued |
2022 |
Cement |
Concrete |
Aggregates |
Urbanization solutions |
Others |
Eliminations |
Revenues |
|||||||||||||||||||||
Mexico |
$ | ( |
) | |||||||||||||||||||||||||
United States |
( |
) | ||||||||||||||||||||||||||
EMEAA |
||||||||||||||||||||||||||||
United Kingdom |
( |
) | ||||||||||||||||||||||||||
France |
— | ( |
) | |||||||||||||||||||||||||
Germany |
( |
) | ||||||||||||||||||||||||||
Poland |
( |
) | ||||||||||||||||||||||||||
Spain |
( |
) | ||||||||||||||||||||||||||
Philippines |
— | — | ( |
) | ||||||||||||||||||||||||
Israel |
— | ( |
) | |||||||||||||||||||||||||
Rest of EMEAA |
( |
) | ||||||||||||||||||||||||||
SCA&C |
||||||||||||||||||||||||||||
Colombia |
( |
) | ||||||||||||||||||||||||||
Panama |
( |
) | ||||||||||||||||||||||||||
Caribbean TCL |
( |
) | ||||||||||||||||||||||||||
Dominican Republic |
( |
) | ||||||||||||||||||||||||||
Rest of SCA&C |
( |
) | ||||||||||||||||||||||||||
Others |
— | — | — | — | ( |
) | ||||||||||||||||||||||
Continuing operations |
( |
) | ||||||||||||||||||||||||||
Discontinued operations |
( |
) | ||||||||||||||||||||||||||
Total |
$ | ( |
) | |||||||||||||||||||||||||
4) |
BUSINESS COMBINATIONS, DISCONTINUED OPERATIONS AND SELECTED FINANCIAL INFORMATION BY REPORTABLE SEGMENT AND LINE OF BUSINESS — continued |
4.3) |
SELECTED FINANCIAL INFORMATION BY REPORTABLE SEGMENT AND LINE OF BUSINESS — continued |
2021 |
Cement |
Concrete |
Aggregates |
Urbanization solutions |
Others |
Eliminations |
Revenues |
|||||||||||||||||||||
Mexico |
$ | ( |
) | |||||||||||||||||||||||||
United States |
( |
) | ||||||||||||||||||||||||||
EMEAA |
||||||||||||||||||||||||||||
United Kingdom |
( |
) | ||||||||||||||||||||||||||
France |
— | ( |
) | |||||||||||||||||||||||||
Germany |
( |
) | ||||||||||||||||||||||||||
Poland |
( |
) | ||||||||||||||||||||||||||
Spain |
( |
) | ||||||||||||||||||||||||||
Philippines |
— | — | ( |
) | ||||||||||||||||||||||||
Israel |
— | ( |
) | |||||||||||||||||||||||||
Rest of EMEAA |
( |
) | ||||||||||||||||||||||||||
SCA&C |
||||||||||||||||||||||||||||
Colombia |
( |
) | ||||||||||||||||||||||||||
Panama |
( |
) | ||||||||||||||||||||||||||
Caribbean TCL |
( |
) | ||||||||||||||||||||||||||
Dominican Republic |
( |
) | ||||||||||||||||||||||||||
Rest of SCA&C |
( |
) | ||||||||||||||||||||||||||
Others |
— | — | — | — | ( |
) | ||||||||||||||||||||||
Continuing operations |
( |
) | ||||||||||||||||||||||||||
Discontinued operations |
( |
) | ||||||||||||||||||||||||||
Total |
$ | ( |
) | |||||||||||||||||||||||||
4) |
BUSINESS COMBINATIONS, DISCONTINUED OPERATIONS AND SELECTED FINANCIAL INFORMATION BY REPORTABLE SEGMENT AND LINE OF BUSINESS — continued |
4.3) |
SELECTED FINANCIAL INFORMATION BY REPORTABLE SEGMENT AND LINE OF BUSINESS — continued |
2020 |
Cement |
Concrete |
Aggregates |
Urbanization solutions |
Others |
Eliminations |
Revenues |
|||||||||||||||||||||
Mexico |
$ | ( |
) | |||||||||||||||||||||||||
United States |
( |
) | ||||||||||||||||||||||||||
EMEAA |
||||||||||||||||||||||||||||
United Kingdom |
( |
) | ||||||||||||||||||||||||||
France |
— | — | — | ( |
) | |||||||||||||||||||||||
Germany |
( |
) | ||||||||||||||||||||||||||
Poland |
( |
) | ||||||||||||||||||||||||||
Spain |
— | ( |
) | |||||||||||||||||||||||||
Philippines |
— | — | ( |
) | ||||||||||||||||||||||||
Israel |
— | ( |
) | |||||||||||||||||||||||||
Rest of EMEAA |
( |
) | ||||||||||||||||||||||||||
SCA&C |
||||||||||||||||||||||||||||
Colombia |
( |
) | ||||||||||||||||||||||||||
Panama |
( |
) | ||||||||||||||||||||||||||
Caribbean TCL |
( |
) | ||||||||||||||||||||||||||
Dominican Republic |
( |
) | ||||||||||||||||||||||||||
Rest of SCA&C |
||||||||||||||||||||||||||||
Others |
— | — | — | — | ( |
) | ||||||||||||||||||||||
Continuing operations |
( |
) | ||||||||||||||||||||||||||
Discontinued operations |
( |
) | ||||||||||||||||||||||||||
Total |
$ | ( |
) | |||||||||||||||||||||||||
5) |
COST OF SALES |
2022 |
2021 |
2020 |
||||||||||
Raw materials and goods for resale |
$ | |||||||||||
Payroll |
||||||||||||
Electricity, fuels and other services |
||||||||||||
Depreciation and amortization |
||||||||||||
Maintenance, repairs and supplies |
||||||||||||
Transportation costs |
||||||||||||
Other production costs |
||||||||||||
Change in inventory |
( |
) | ( |
) | ( |
) | ||||||
| $ | ||||||||||||
6) |
OPERATING EXPENSES |
2022 |
2021 |
2020 |
||||||||||
Administrative expenses 1, 2 |
$ | |||||||||||
Selling expenses 2 |
||||||||||||
Total administrative and selling expenses |
||||||||||||
Distribution and logistics expenses |
||||||||||||
Total operating expenses |
$ | |||||||||||
1 |
All significant R&D activities are executed by several internal areas of CEMEX as part of their daily activities. In 2022, 2021 and 2020, total combined expenses of these departments recognized within administrative expenses were $ |
2 |
In 2022, 2021 and 2020, administrative expenses include depreciation and amortization of $ |
2022 |
2021 |
2020 |
||||||||||
Transportation costs |
$ | |||||||||||
Payroll |
||||||||||||
Depreciation and amortization |
||||||||||||
Professional legal, accounting and advisory services |
||||||||||||
Maintenance, repairs and supplies |
||||||||||||
Other operating expenses |
||||||||||||
| $ | ||||||||||||
7) |
OTHER EXPENSES, NET |
2022 |
2021 |
2020 |
||||||||||
Impairment losses (notes 15.1, 16.1 and 16.2) |
$ | ( |
) | ( |
) | ( |
) | |||||
Results from the sale of assets and others 1 |
( |
) | ( |
) | ||||||||
Incremental costs and expenses related to the COVID-19 Pandemic 2 |
( |
) | ( |
) | ( |
) | ||||||
Restructuring costs 3 |
( |
) | ( |
) | ( |
) | ||||||
Sale of CO 2 Allowances (note 2.19) 4 |
||||||||||||
| $ | ( |
) | ( |
) | ( |
) | ||||||
1 |
7) |
OTHER EXPENSES, NET — continued |
2 |
SARS-CoV-2 “COVID-19 Pandemic”). From the beginning of the COVID-19 Pandemic and attending official dispositions of the authorities in the countries in which CEMEX operates, the Company implemented strict hygiene, sanitary and security protocols in all its operations and modified its manufacturing, selling and distribution processes to implement physical distancing, aiming to protect the health and safety of its employees and their families, customers and communities. |
3 |
|
4 |
2 Allowances under the EU ETS, during March 2021, considering CEMEX’s targets for the reduction of CO2 emissions (note 2.4), as well as the innovative technologies and considerable capital investments that have to be deployed to achieve such goals, CEMEX sold |
8) |
FINANCIAL ITEMS |
8.1) |
FINANCIAL EXPENSE |
8.2) |
FINANCIAL INCOME AND OTHER ITEMS, NET |
2022 |
2021 |
2020 |
||||||||||
| Effects of amortized cost on assets and liabilities and others, net |
$ | ( |
) | ( |
) | ( |
) | |||||
| Net interest cost of pension liabilities (note 19) |
( |
) | ( |
) | ( |
) | ||||||
| Results from financial instruments, net (notes 14.2 and 17.4) |
( |
) | ( |
) | ( |
) | ||||||
| Foreign exchange results |
( |
) | ( |
) | ||||||||
| Financial income |
||||||||||||
| Others |
( |
) | ||||||||||
| |
|
|
|
|
|
|||||||
| $ | ( |
) | ( |
) | ||||||||
| |
|
|
|
|
|
|||||||
9) |
CASH AND CASH EQUIVALENTS |
2022 |
2021 |
|||||||
| Cash and bank accounts |
$ | |||||||
| Fixed-income securities and other cash equivalents |
||||||||
| |
|
|
|
|||||
| $ | ||||||||
| |
|
|
|
|||||
9) |
CASH AND CASH EQUIVALENTS — continued |
10) |
TRADE ACCOUNTS RECEIVABLE |
2022 |
2021 |
|||||||
| Trade accounts receivable |
$ | |||||||
| Allowances for expected credit losses |
( |
) | ( |
) | ||||
| |
|
|
|
|||||
| $ | ||||||||
| |
|
|
|
|||||
Accounts receivable |
ECL allowance |
ECL average rate |
||||||||||
| Mexico |
$ | % | ||||||||||
| United States |
% | |||||||||||
| Europe, Middle East, Africa and Asia |
% | |||||||||||
| South, Central America and the Caribbean |
% | |||||||||||
| Others |
||||||||||||
| |
|
|
|
|||||||||
| $ | ||||||||||||
| |
|
|
|
|||||||||
10) |
TRADE ACCOUNTS RECEIVABLE — continued |
2022 |
2021 |
2020 |
||||||||||
| Allowances for expected credit losses at beginning of period |
$ | |||||||||||
| Charged to selling expenses |
||||||||||||
| Deductions |
( |
) | ( |
) | ( |
) | ||||||
| Reclassification to assets held for sale (note 4.2) |
— | ( |
) | — | ||||||||
| Foreign currency translation effects |
( |
) | ||||||||||
| |
|
|
|
|
|
|||||||
| Allowances for expected credit losses at end of period |
$ | |||||||||||
| |
|
|
|
|
|
|||||||
11) |
OTHER ACCOUNTS RECEIVABLE |
2022 |
2021 |
|||||||
| Advances of income taxes and other refundable taxes |
$ | |||||||
| Non-trade accounts receivable1 |
||||||||
| Interest and notes receivable |
||||||||
| Current portion of valuation of derivative financial instruments |
||||||||
| Loans to employees and others |
||||||||
| |
|
|
|
|||||
| $ | ||||||||
| |
|
|
|
|||||
1 |
Non-trade accounts receivable are mainly attributable to the sale of assets. |
12) |
INVENTORIES |
2022 |
2021 |
|||||||
| Materials and spare parts |
$ | |||||||
| Finished goods |
||||||||
| Raw materials |
||||||||
| Work-in-process |
||||||||
| Inventory in transit |
||||||||
| |
|
|
|
|||||
| $ | ||||||||
| |
|
|
|
|||||
12) |
INVENTORIES — continued |
13) |
ASSETS HELD FOR SALE AND OTHER CURRENT ASSETS |
2022 |
2021 |
|||||||
| Assets held for sale |
$ | |||||||
| Other current assets |
||||||||
| |
|
|
|
|||||
| $ | ||||||||
| |
|
|
|
|||||
2022 |
2021 |
|||||||||||||||||||||||
Assets |
Liabilities |
Net assets |
Assets |
Liabilities |
Net assets |
|||||||||||||||||||
| Other assets held for sale |
$ | — | $ | — | ||||||||||||||||||||
| Costa Rica and El Salvador (note 4.2) |
— | — | — | |||||||||||||||||||||
| |
|
|
|
|
|
|
|
|
|
|
|
|||||||||||||
| $ | — | $ | ||||||||||||||||||||||
| |
|
|
|
|
|
|
|
|
|
|
|
|||||||||||||
14) |
INVESTMENTS IN ASSOCIATES AND JOINT VENTURES, OTHER INVESTMENTS AND NON-CURRENT ACCOUNTS RECEIVABLE |
14.1) |
INVESTMENTS IN ASSOCIATES AND JOINT VENTURES |
Activity |
Country |
% |
2022 |
2021 |
||||||||||||||||
| $ | ||||||||||||||||||||
| — | ||||||||||||||||||||
| — | — | — | ||||||||||||||||||
| |
|
|
|
|||||||||||||||||
| $ | ||||||||||||||||||||
| |
|
|
|
|||||||||||||||||
| Out of which: |
||||||||||||||||||||
| Acquisition cost |
|
$ | ||||||||||||||||||
| Equity method recognition |
|
$ | ||||||||||||||||||
| |
|
|
|
|||||||||||||||||
14) |
INVESTMENTS IN ASSOCIATES AND JOINT VENTURES, OTHER INVESTMENTS AND NON-CURRENT ACCOUNTS RECEIVABLE — continued |
14.1) |
INVESTMENTS IN ASSOCIATES AND JOINT VENTURES — continued |
1 |
On October 25, 2022, in connection with the sale of Neoris’ |
2022 |
2021 |
|||||||
Current assets |
$ | |||||||
Non-current assets |
||||||||
Total assets |
||||||||
Current liabilities |
||||||||
Non-current liabilities |
||||||||
Total liabilities |
||||||||
Total net assets |
$ | |||||||
2022 |
2021 |
2020 |
||||||||||
Revenues |
$ | |||||||||||
Operating earnings |
||||||||||||
Income before income tax |
||||||||||||
Net income |
||||||||||||
2022 |
2021 |
2020 |
||||||||||
Mexico |
$ | |||||||||||
United States |
||||||||||||
EMEAA |
||||||||||||
Corporate and others |
( |
) | ( |
) | ||||||||
| $ | ||||||||||||
14) |
INVESTMENTS IN ASSOCIATES AND JOINT VENTURES, OTHER INVESTMENTS AND NON-CURRENT ACCOUNTS RECEIVABLE — continued |
14.2) |
OTHER INVESTMENTS AND NON-CURRENT ACCOUNTS RECEIVABLE |
2022 |
2021 |
|||||||
Non-current accounts receivable1 |
$ | |||||||
Investments in strategic equity securities 2 |
||||||||
Non-current portion of valuation of derivative financial instruments (note 17.4) |
||||||||
Investments at fair value through the income statement 3 |
||||||||
| $ | ||||||||
1 |
Includes, among other items: a) accounts receivable from investees and joint ventures of $ |
2 |
These investments are recognized at fair value through other comprehensive income. |
3 |
Refers to investments in private funds. In 2022 and 2021, no contributions were made to such private funds. |
15) |
PROPERTY, MACHINERY AND EQUIPMENT, NET AND ASSETS FOR THE RIGHT-OF-USE, |
2022 |
2021 |
|||||||
Property, machinery and equipment, net |
$ | |||||||
Assets for the right-of-use, |
||||||||
| $ | ||||||||
15) |
PROPERTY, MACHINERY AND EQUIPMENT, NET AND ASSETS FOR THE RIGHT-OF-USE, |
15.1) |
PROPERTY, MACHINERY AND EQUIPMENT, NET |
2022 |
||||||||||||||||||||
Land and mineral reserves |
Building |
Machinery and equipment |
Construction in progress 1 |
Total |
||||||||||||||||
Cost at beginning of period |
$ | |||||||||||||||||||
Accumulated depreciation and depletion |
( |
) | ( |
) | ( |
) | — | ( |
) | |||||||||||
Net book value at beginning of period |
||||||||||||||||||||
Capital expenditures |
||||||||||||||||||||
Stripping costs |
— | — | — | |||||||||||||||||
Total capital expenditures |
||||||||||||||||||||
Disposals 2 |
( |
) | ( |
) | ( |
) | — | ( |
) | |||||||||||
Business combinations (note 4.1) |
||||||||||||||||||||
Depreciation and depletion for the period |
( |
) | ( |
) | ( |
) | — | ( |
) | |||||||||||
Impairment losses (note 7) |
( |
) | ( |
) | ( |
) | ( |
) | ( |
) | ||||||||||
Foreign currency translation effects |
( |
) | ( |
) | ( |
) | ( |
) | ( |
) | ||||||||||
Cost at end of period |
||||||||||||||||||||
Accumulated depreciation and depletion |
( |
) | ( |
) | ( |
) | — | ( |
) | |||||||||||
Net book value at end of period |
$ | |||||||||||||||||||
2021 |
||||||||||||||||||||||||
Land and mineral reserves |
Building |
Machinery and equipment |
Construction in progress 1 |
Total |
2020 1 |
|||||||||||||||||||
Cost at beginning of period |
$ | |||||||||||||||||||||||
Accumulated depreciation and depletion |
( |
) | ( |
) | ( |
) | — | ( |
) | ( |
) | |||||||||||||
Net book value at beginning of period |
||||||||||||||||||||||||
Capital expenditures |
— | |||||||||||||||||||||||
Stripping costs |
— | — | — | |||||||||||||||||||||
Total capital expenditures |
— | |||||||||||||||||||||||
Disposals 2 |
( |
) | ( |
) | ( |
) | — | ( |
) | ( |
) | |||||||||||||
Reclassifications 3 |
( |
) | ( |
) | ( |
) | ( |
) | ( |
) | ( |
) | ||||||||||||
Business combinations (note 4.1) |
— | — | — | — | — | |||||||||||||||||||
Depreciation and depletion for the period |
( |
) | ( |
) | ( |
) | — | ( |
) | ( |
) | |||||||||||||
Impairment losses (note 7) |
( |
) | ( |
) | ( |
) | ( |
) | ( |
) | ( |
) | ||||||||||||
Foreign currency translation effects |
( |
) | ||||||||||||||||||||||
Cost at end of period |
||||||||||||||||||||||||
Accumulated depreciation and depletion |
( |
) | ( |
) | ( |
) | — | ( |
) | ( |
) | |||||||||||||
Net book value at end of period |
$ | |||||||||||||||||||||||
15) |
PROPERTY, MACHINERY AND EQUIPMENT, NET AND ASSETS FOR THE RIGHT-OF-USE, |
15.1) |
PROPERTY, MACHINERY AND EQUIPMENT, NET — continued |
1 |
As of December 31, 2022, the Maceo plant in Colombia, finalized significantly in 2017, with an annual capacity of approximately |
2 |
In 2022 includes sales of non-strategic fixed assets in the United States and the United Kingdom for $non-strategic fixed assets in Spain, the United States and the United Kingdom for $non-strategic fixed assets in the United Kingdom and the United States for $ |
3 |
In 2021, refers to the reclassification to held-for-sale |
2022 |
2021 |
2020 |
||||||||||
United States |
$ | |||||||||||
Spain |
||||||||||||
Colombia |
||||||||||||
Caribbean TCL |
— | — | ||||||||||
United Kingdom |
||||||||||||
Puerto Rico |
— | |||||||||||
Croatia |
— | |||||||||||
Panama |
— | |||||||||||
Others |
||||||||||||
| $ | ||||||||||||
15) |
PROPERTY, MACHINERY AND EQUIPMENT, NET AND ASSETS FOR THE RIGHT-OF-USE, |
15.2) |
ASSETS FOR THE RIGHT-OF-USE, |
2022 |
||||||||||||||||||||
Land |
Buildings |
Machinery and equipment |
Others |
Total |
||||||||||||||||
Assets for the right-of-use |
$ | |||||||||||||||||||
Accumulated depreciation |
( |
) | ( |
) | ( |
) | ( |
) | ( |
) | ||||||||||
Net book value at beginning of period |
||||||||||||||||||||
Additions of new leases |
||||||||||||||||||||
Cancellations and remeasurements |
( |
) | ( |
) | ( |
) | ( |
) | ( |
) | ||||||||||
Depreciation |
( |
) | ( |
) | ( |
) | ( |
) | ( |
) | ||||||||||
Foreign currency translation effects |
||||||||||||||||||||
Assets for the right-of-use |
||||||||||||||||||||
Accumulated depreciation |
( |
) | ( |
) | ( |
) | ( |
) | ( |
) | ||||||||||
Net book value at end of period |
$ | |||||||||||||||||||
2021 |
||||||||||||||||||||||||
Land |
Buildings |
Machinery and equipment |
Others |
Total |
2020 |
|||||||||||||||||||
Assets for the right-of-use |
$ | |||||||||||||||||||||||
Accumulated depreciation |
( |
) | ( |
) | ( |
) | ( |
) | ( |
) | ( |
) | ||||||||||||
Net book value at beginning of period |
||||||||||||||||||||||||
Additions of new leases |
||||||||||||||||||||||||
Cancellations and remeasurements |
( |
) | ( |
) | ( |
) | — | ( |
) | ( |
) | |||||||||||||
Business combinations (note 4.1) |
— | — | — | — | — | |||||||||||||||||||
Depreciation |
( |
) | ( |
) | ( |
) | ( |
) | ( |
) | ( |
) | ||||||||||||
Foreign currency translation effects |
( |
) | ( |
) | ||||||||||||||||||||
Assets for the right-of-use |
||||||||||||||||||||||||
Accumulated depreciation |
( |
) | ( |
) | ( |
) | ( |
) | ( |
) | ( |
) | ||||||||||||
Net book value at end of period |
$ | |||||||||||||||||||||||
16) |
GOODWILL AND INTANGIBLE ASSETS, NET |
16.1) |
BALANCES AND CHANGES DURING THE PERIOD |
2022 |
2021 |
|||||||||||||||||||||||
Cost |
Accumulated amortization |
Carrying amount |
Cost |
Accumulated amortization |
Carrying amount |
|||||||||||||||||||
Intangible assets of indefinite useful life: |
||||||||||||||||||||||||
Goodwill |
$ | — | $ | — | ||||||||||||||||||||
Intangible assets of definite useful life: |
||||||||||||||||||||||||
Extraction rights |
( |
) | ( |
) | ||||||||||||||||||||
Industrial property and trademarks |
( |
) | ( |
) | ||||||||||||||||||||
Customer relationships |
( |
) | — | ( |
) | — | ||||||||||||||||||
Mining projects |
( |
) | ( |
) | ||||||||||||||||||||
Internally developed software |
( |
) | ( |
) | ||||||||||||||||||||
Other intangible assets |
( |
) | ( |
) | ||||||||||||||||||||
| $ | ( |
) | $ | ( |
) | |||||||||||||||||||
2022 |
2021 |
2020 |
||||||||||
Balance at beginning of period |
$ | |||||||||||
Impairment losses (notes 7 and 16.2) |
( |
) | ( |
) | ( |
) | ||||||
Business combinations (note 4.1) |
||||||||||||
Reclassification to assets held for sale (notes 4.2 and 13) |
( |
) | ( |
) | ||||||||
Foreign currency translation effects |
( |
) | ( |
) | ( |
) | ||||||
Balance at end of period |
$ | |||||||||||
2022 |
||||||||||||||||||||||||
Extraction rights |
Industrial property and trademarks |
Mining projects |
Internally developed software 1 |
Others |
Total |
|||||||||||||||||||
Balance at beginning of period |
$ | |||||||||||||||||||||||
Amortization for the period |
( |
) | ( |
) | ( |
) | ( |
) | ( |
) | ( |
) | ||||||||||||
Additions (decreases), net 1 |
( |
) | — | ( |
) | |||||||||||||||||||
Foreign currency translation effects |
( |
) | ( |
) | ( |
) | ( |
) | ( |
) | ||||||||||||||
Balance at the end of period |
$ | |||||||||||||||||||||||
16) |
GOODWILL AND INTANGIBLE ASSETS, NET — continued |
16.1) |
BALANCES AND CHANGES DURING THE PERIOD — continued |
2021 |
||||||||||||||||||||||||||||
Extraction rights |
Industrial property and trademarks |
Mining projects |
Internally developed software 1 |
Others |
Total |
2020 |
||||||||||||||||||||||
Balance at beginning of period |
$ | |||||||||||||||||||||||||||
Impairment losses (note 7) |
— | — | ( |
) | ( |
) | ( |
) | ( |
) | ||||||||||||||||||
Amortization for the period |
( |
) | ( |
) | ( |
) | ( |
) | ( |
) | ( |
) | ( |
) | ||||||||||||||
Additions (decreases), net 1 |
— | |||||||||||||||||||||||||||
Business combinations (note 4.1) |
— | — | — | — | — | — | ||||||||||||||||||||||
Foreign currency translation effects |
( |
) | ( |
) | ||||||||||||||||||||||||
Balance at the end of period |
$ | |||||||||||||||||||||||||||
1 |
Includes the capitalized direct costs incurred in the development stage of internal-use software, such as professional fees, direct labor and related travel expenses. The capitalized amounts are amortized to the statement of operations over a period ranging from |
16.2) |
ANALYSIS OF GOODWILL IMPAIRMENT |
16) |
GOODWILL AND INTANGIBLE ASSETS, NET — continued |
16.2) |
ANALYSIS OF GOODWILL IMPAIRMENT — continued |
16) |
GOODWILL AND INTANGIBLE ASSETS, NET — continued |
16.2) |
ANALYSIS OF GOODWILL IMPAIRMENT — continued |
2022 |
2021 |
|||||||
Mexico |
$ | |||||||
United States |
||||||||
EMEAA |
||||||||
United Kingdom |
||||||||
France |
||||||||
Spain |
||||||||
Philippines |
||||||||
Rest of EMEAA 1 |
||||||||
SCA&C |
||||||||
Colombia |
||||||||
Caribbean TCL |
||||||||
Rest of SCA&C 2 |
||||||||
| $ | ||||||||
1 |
This caption refers to the operating segments in Israel, the Czech Republic and Egypt. |
2 |
This caption refers to the operating segments in the Dominican Republic, the Caribbean and Panama. |
Discount rates |
Long-term growth rates 1 | |||||||||||
Groups of CGUs |
2022 |
2021 |
2020 |
2022 |
2021 |
2020 | ||||||
United States |
||||||||||||
Spain |
||||||||||||
United Kingdom |
||||||||||||
France |
||||||||||||
Mexico |
||||||||||||
Colombia |
||||||||||||
United Arab Emirates |
— | — | — | — | ||||||||
Egypt |
||||||||||||
Range of rates in other countries |
( | |||||||||||
1 |
The long-term growth rates are generally based on projections issued by the International Monetary Fund (“IMF”). |
16) |
GOODWILL AND INTANGIBLE ASSETS, NET — continued |
16.2) |
ANALYSIS OF GOODWILL IMPAIRMENT — continued |
16) |
GOODWILL AND INTANGIBLE ASSETS, NET — continued |
16.2) |
ANALYSIS OF GOODWILL IMPAIRMENT — continued |
Additional effects to the impairment losses recognized from the sensitivity analyses to changes in assumptions as of December 31, 2022 |
||||||||||||||||
Operating segment |
Impairment losses recognized |
Discount rate + |
Long-term growth rate - |
Multiples Operating EBITDA |
||||||||||||
United States |
$ | ( |
) | ( |
) | ( |
) | — | ||||||||
Spain |
( |
) | ( |
) | ( |
) | — | |||||||||
17) |
FINANCIAL INSTRUMENTS |
17.1) |
CURRENT AND NON-CURRENT DEBT |
2022 |
2021 |
|||||||||||||||||||||||
Current |
Non-current |
Total 1, 2 |
Current |
Non-current |
Total 1, 2 |
|||||||||||||||||||
Floating rate debt |
$ | $ | ||||||||||||||||||||||
Fixed rate debt |
||||||||||||||||||||||||
| $ | $ | |||||||||||||||||||||||
Effective rate 3 |
||||||||||||||||||||||||
Floating rate |
% | % | % | % | ||||||||||||||||||||
Fixed rate |
% | % | % | % | ||||||||||||||||||||
17) |
FINANCIAL INSTRUMENTS — continued |
17.1) |
CURRENT AND NON-CURRENT DEBT — continued |
2022 |
2021 |
|||||||||||||||||||||||||||||||
Currency |
Current |
Non-current |
Total |
Effective rate 3 |
Current |
Non-current |
Total |
Effective rate 3 |
||||||||||||||||||||||||
Dollars |
$ | % | $ | % | ||||||||||||||||||||||||||||
Euros |
% | % | ||||||||||||||||||||||||||||||
Pesos |
% | % | ||||||||||||||||||||||||||||||
Philippine Pesos |
% | % | ||||||||||||||||||||||||||||||
Other currencies |
% | % | ||||||||||||||||||||||||||||||
| $ | $ | |||||||||||||||||||||||||||||||
1 |
As of December 31, 2022 and 2021, from total debt of $ |
2 |
As of December 31, 2022 and 2021, cumulative discounts, fees and other direct costs incurred in CEMEX’s outstanding debt borrowings and the issuance of notes payable (jointly “Issuance Costs”) for $ |
3 |
In 2022 and 2021, represents the weighted-average nominal interest rate of the related debt agreements determined at the end of each period. |
2022 |
Current |
Non-current |
2021 |
Current |
Non-current |
|||||||||||||
Bank loans |
Bank loans |
|||||||||||||||||
Loans in foreign countries, |
$ | Loans in foreign countries, |
$ | |||||||||||||||
Syndicated loans, |
— | Syndicated loans, |
— | |||||||||||||||
Notes payable |
Notes payable |
|||||||||||||||||
Medium-term notes, |
— | Medium-term notes, |
— | |||||||||||||||
Other notes payable, |
Other notes payable, |
|||||||||||||||||
Total bank loans and notes payable |
Total bank loans and notes payable |
|||||||||||||||||
Current maturities |
( |
) | Current maturities |
( |
) | |||||||||||||
| $ | $ | |||||||||||||||||
17) |
FINANCIAL INSTRUMENTS — continued |
17.1) |
CURRENT AND NON-CURRENT DEBT — continued |
2022 |
2021 |
2020 |
||||||||||
Debt at beginning of year |
$ | |||||||||||
Proceeds from new debt instruments |
||||||||||||
Debt repayments |
( |
) | ( |
) | ( |
) | ||||||
Foreign currency translation and accretion effects |
( |
) | ||||||||||
Debt at end of year |
$ | |||||||||||
Description |
Date of issuance |
Issuer 1 |
Currency |
Principal amount |
Rate |
Maturity date |
Redeemed amount 2 $ |
Outstanding amount 2 $ |
2022 |
2021 |
||||||||||||||||||||||||||
July 2031 Notes 3 |
% | ( |
) | $ | ||||||||||||||||||||||||||||||||
September 2030 Notes 3 |
% | ( |
) | |||||||||||||||||||||||||||||||||
November 2029 Notes 3 |
% | ( |
) | |||||||||||||||||||||||||||||||||
June 2027 Notes |
% | — | ||||||||||||||||||||||||||||||||||
March 2026 Notes |
% | — | ||||||||||||||||||||||||||||||||||
July 2025 Notes |
% | — | ||||||||||||||||||||||||||||||||||
Other notes payable |
||||||||||||||||||||||||||||||||||||
| $ | ||||||||||||||||||||||||||||||||||||
1 |
As of December 31, 2021, after closing the 2021 Credit Agreement, these issued notes are fully and unconditionally guaranteed by CEMEX Concretos, S.A. de C.V., CEMEX Operaciones México, S.A. de C.V., Cemex Innovation Holding Ltd. and CEMEX Corp. |
17) |
FINANCIAL INSTRUMENTS — continued |
17.1) |
CURRENT AND NON-CURRENT DEBT — continued |
2 |
Presented net of all notes repurchased by CEMEX. As of December 31, 2022, all repurchased notes have been canceled. |
3 |
During 2022, pursuant to tender offers and other market transactions, CEMEX partially repurchased different series of its notes for an aggregate notional amount of $ |
Bank loans |
Notes payable |
Total |
||||||||||
2024 |
$ | |||||||||||
2025 |
||||||||||||
2026 |
||||||||||||
2027 |
||||||||||||
2028 and thereafter |
— | |||||||||||
| $ | ||||||||||||
Lines of credit |
Available |
|||||||
Other lines of credit in foreign subsidiaries 1 |
$ | |||||||
Other lines of credit from banks 1 |
||||||||
Revolving credit facility 2021 Credit Agreement |
||||||||
| $ | ||||||||
1 |
Uncommitted amounts subject to the banks’ availability. |
17) |
FINANCIAL INSTRUMENTS — continued |
17.1) |
CURRENT AND NON-CURRENT DEBT — continued |
17) |
FINANCIAL INSTRUMENTS — continued |
17.1) |
CURRENT AND NON-CURRENT DEBT — continued |
1 |
The London Inter-Bank Offered Rate (“LIBOR”) represent the variable rate used in international markets for debt denominated in Dollars. As of December 31, 2022 and 2021, 3-Month LIBOR rate was |
2 |
The Euro Inter-Bank Offered Rate (“EURIBOR”) represent the variable rate used in international markets for debt denominated in Euros. The Tasa de Inter é s Interbancaria de Equilibrio 3-Month EURIBOR rate was - respectively. As of December 31, 2022 and 2021, 28-day TIIE rate was |
| • | Under the 2021 Credit Agreement, the ratio is calculated dividing “Consolidated Net Debt” by “Consolidated EBITDA” for the last twelve months as of the calculation date. Consolidated Net Debt equals debt, as reported in the statement of financial position, net of cash and cash equivalents, excluding any existing or future obligations under any securitization program, and any subordinated debt of CEMEX, adjusted for net mark-to-market |
17) |
FINANCIAL INSTRUMENTS — continued |
17.1) |
CURRENT AND NON-CURRENT DEBT — continued |
| • | Under the 2017 Facilities Agreement, the ratio was calculated dividing “Funded Debt” by pro forma Operating EBITDA for the last twelve months as of the calculation date including a permanent fixed adjustment from the adoption of IFRS 16. Funded Debt equals debt, as reported in the statement of financial position, net of cash and cash equivalents, excluding components of liability of convertible subordinated notes, plus lease liabilities, perpetual debentures and guarantees, plus or minus the fair value of derivative financial instruments, as applicable, among other adjustments for business acquisitions or disposals. |
| • | Under the 2021 Credit Agreement, the ratio is calculated by dividing Consolidated EBITDA by the financial expense for the last twelve months as of the calculation date. |
| • | Under the 2017 Facilities Agreement, the ratio was calculated by dividing pro forma Operating EBITDA by the financial expense for the last twelve months as of the calculation date, both including IFRS 16 effects. Financial expense included coupons accrued on the perpetual debentures. |
Consolidated financial ratios |
Refers to the compliance limits and calculations that were effective on each date |
|||||||||||||
2022 |
2021 |
2020 |
||||||||||||
Leverage ratio |
Limit |
<= |
<= |
<= |
||||||||||
Calculation |
||||||||||||||
Coverage ratio |
Limit |
>= |
>= |
>= |
||||||||||
Calculation |
||||||||||||||
17) |
FINANCIAL INSTRUMENTS — continued |
17.1) |
CURRENT AND NON-CURRENT DEBT — continued |
17.2) |
OTHER FINANCIAL OBLIGATIONS |
2022 |
2021 |
|||||||||||||||||||||||
Current |
Non-current |
Total |
Current |
Non-current |
Total |
|||||||||||||||||||
I. Leases |
$ | $ | ||||||||||||||||||||||
II. Liabilities secured with accounts receivable |
— | — | ||||||||||||||||||||||
| $ | $ | |||||||||||||||||||||||
I. |
Leases (notes 2.7, 8.1, 15.2 and 24.1) |
2022 |
2021 |
2020 |
||||||||||
Lease financial liability at beginning of year |
$ | |||||||||||
Additions from new leases |
||||||||||||
Reductions from payments |
( |
) | ( |
) | ( |
) | ||||||
Cancellations and liability remeasurements |
( |
) | ||||||||||
Foreign currency translation and accretion effects |
( |
) | ( |
) | ||||||||
Lease financial liability at end of year |
$ | |||||||||||
17) |
FINANCIAL INSTRUMENTS — continued |
17.2) |
OTHER FINANCIAL OBLIGATIONS — continued |
Total |
||||
2024 |
$ | |||
2025 |
||||
2026 |
||||
2027 |
||||
2028 and thereafter |
||||
| $ | ||||
II. |
Liabilities secured with accounts receivable |
17.3) |
FAIR VALUE OF FINANCIAL INSTRUMENTS |
17) |
FINANCIAL INSTRUMENTS — continued |
17.3) |
FAIR VALUE OF FINANCIAL INSTRUMENTS — continued |
2022 |
2021 |
|||||||||||||||
Carrying amount |
Fair value |
Carrying amount |
Fair value |
|||||||||||||
Financial assets |
||||||||||||||||
Derivative financial instruments (notes 14.2 and 17.4) |
$ | $ | ||||||||||||||
Other investments and non-current accounts receivable (note 14.2) |
||||||||||||||||
| $ | $ | |||||||||||||||
Financial liabilities |
||||||||||||||||
Long-term debt (note 17.1) |
$ | $ | ||||||||||||||
Other financial obligations (note 17.2) |
||||||||||||||||
Derivative financial instruments (notes 17.4 and 18.2) |
||||||||||||||||
| $ | $ | |||||||||||||||
2022 |
Level 1 |
Level 2 |
Level 3 |
Total |
||||||||||||
Assets measured at fair value |
||||||||||||||||
Derivative financial instruments (notes 14.2 and 17.4) |
$ | — | — | |||||||||||||
Investments in strategic equity securities (note 14.2) |
— | — | ||||||||||||||
Other investments at fair value through earnings (note 14.2) |
— | — | ||||||||||||||
| $ | — | |||||||||||||||
Liabilities measured at fair value |
||||||||||||||||
Derivative financial instruments (notes 17.4 and 18.2) |
$ | — | — | |||||||||||||
17) |
FINANCIAL INSTRUMENTS — continued |
17.3) |
FAIR VALUE OF FINANCIAL INSTRUMENTS — continued |
2021 |
Level 1 |
Level 2 |
Level 3 |
Total |
||||||||||||
Assets measured at fair value |
||||||||||||||||
Derivative financial instruments (notes 14.2 and 17.4) |
$ | — | — | |||||||||||||
Investments in strategic equity securities (note 14.2) |
— | — | ||||||||||||||
Other investments at fair value through earnings (note 14.2) |
— | — | ||||||||||||||
| $ | — | |||||||||||||||
Liabilities measured at fair value |
||||||||||||||||
Derivative financial instruments (notes 17.4 and 18.2) |
$ | — | — | |||||||||||||
17.4) |
DERIVATIVE FINANCIAL INSTRUMENTS |
2022 |
2021 |
|||||||||||||||
Notional amount |
Fair value |
Notional amount |
Fair value |
|||||||||||||
I. Net investment hedges |
$ | ( |
) | |||||||||||||
II. Interest rate swaps |
( |
) | ||||||||||||||
III. Fuel price hedging |
||||||||||||||||
IV. Foreign exchange options |
||||||||||||||||
| $ | ||||||||||||||||
I. |
Net investment hedges |
17) |
FINANCIAL INSTRUMENTS — continued |
17.4) |
DERIVATIVE FINANCIAL INSTRUMENTS — continued |
II. |
Interest rate swap contracts |
17) |
FINANCIAL INSTRUMENTS — continued |
17.4) |
DERIVATIVE FINANCIAL INSTRUMENTS — continued |
III. |
Fuel price hedging |
IV. |
Foreign exchange options |
17) |
FINANCIAL INSTRUMENTS — continued |
17.4) |
DERIVATIVE FINANCIAL INSTRUMENTS — continued |
17.5) |
RISK MANAGEMENT |
17) |
FINANCIAL INSTRUMENTS — continued |
17.5) |
RISK MANAGEMENT — continued |
17) |
FINANCIAL INSTRUMENTS — continued |
17.5) |
RISK MANAGEMENT — continued |
17) |
FINANCIAL INSTRUMENTS — continued |
17.5) |
RISK MANAGEMENT — continued |
2022 |
||||||||||||||||||||||||
Mexico |
United States |
EMEAA |
SCA&C |
Others 1 |
Total |
|||||||||||||||||||
Monetary assets |
$ | |||||||||||||||||||||||
Monetary liabilities |
||||||||||||||||||||||||
Net monetary assets (liabilities) |
$ | ( |
) | ( |
) | ( |
) | ( |
) | ( |
) | ( |
) | |||||||||||
Out of which: |
||||||||||||||||||||||||
Dollars |
$ | ( |
) | ( |
) | ( |
) | ( |
) | |||||||||||||||
Pesos |
( |
) | — | — | — | ( |
) | ( |
) | |||||||||||||||
Euros |
— | — | ( |
) | ( |
) | ( |
) | ||||||||||||||||
Pounds |
— | — | ( |
) | — | ( |
) | |||||||||||||||||
Other currencies |
— | ( |
) | ( |
) | ( |
) | ( |
) | |||||||||||||||
| $ | ( |
) | ( |
) | ( |
) | ( |
) | ( |
) | ( |
) | ||||||||||||
2021 |
||||||||||||||||||||||||
Mexico |
United States |
EMEAA |
SCA&C |
Others 1 |
Total |
|||||||||||||||||||
Monetary assets |
$ | |||||||||||||||||||||||
Monetary liabilities |
||||||||||||||||||||||||
Net monetary assets (liabilities) |
$ | ( |
) | ( |
) | ( |
) | ( |
) | ( |
) | ( |
) | |||||||||||
Out of which: |
||||||||||||||||||||||||
Dollars |
$ | ( |
) | ( |
) | ( |
) | ( |
) | ( |
) | |||||||||||||
Pesos |
( |
) | — | — | — | ( |
) | ( |
) | |||||||||||||||
Euros |
— | — | ( |
) | ( |
) | ( |
) | ||||||||||||||||
Pounds |
— | — | ( |
) | — | ( |
) | |||||||||||||||||
Other currencies |
( |
) | — | ( |
) | ( |
) | ( |
) | ( |
) | |||||||||||||
| $ | ( |
) | ( |
) | ( |
) | ( |
) | ( |
) | ( |
) | ||||||||||||
1 |
Includes the Parent Company, CEMEX’s financing subsidiaries, among other entities. |
17) |
FINANCIAL INSTRUMENTS — continued |
17.5) |
RISK MANAGEMENT — continued |
18) |
OTHER CURRENT AND NON-CURRENT LIABILITIES |
18.1) |
OTHER CURRENT LIABILITIES |
2022 |
2021 |
|||||||
Provisions 1 |
$ | |||||||
Interest payable |
||||||||
Other accounts payable and accrued expenses 2 |
||||||||
Contract liabilities with customers (note 3) 3 |
||||||||
| $ | ||||||||
1 |
Current provisions primarily consist of accrued employee benefits, insurance payments, accruals for legal assessments and others. These amounts are revolving in nature and are expected to be settled and replaced by similar amounts within the next 12 months. |
2 |
As of December 31, 2022 and 2021, includes $ |
3 |
As of December 31, 2022 and 2021, contract liabilities with customers included $ |
18.2) |
OTHER NON-CURRENT LIABILITIES |
2022 |
2021 |
|||||||
Asset retirement obligations 1 |
$ | |||||||
Accruals for legal assessments and other responsibilities 2 |
||||||||
Non-current liabilities for valuation of derivative instruments |
||||||||
Environmental liabilities 3 |
||||||||
Other non-current liabilities and provisions4, 5 |
||||||||
| $ | ||||||||
1 |
2 |
3 |
4 |
non-current porti on of taxes payable in Mexico. |
5 |
18) |
OTHER CURRENT AND NON-CURRENT LIABILITIES — continued |
18.2) |
OTHER NON-CURRENT LIABILITIES — continued |
2022 |
||||||||||||||||||||||||||||
Asset retirement obligations |
Environmental liabilities |
Accruals for legal proceedings |
Valuation of derivative instruments |
Other liabilities and provisions |
Total |
2021 |
||||||||||||||||||||||
Balance at beginning of period |
$ | |||||||||||||||||||||||||||
Additions or increase in estimates |
||||||||||||||||||||||||||||
Releases or decrease in estimates |
( |
) | ( |
) | ( |
) | ( |
) | ( |
) | ( |
) | ( |
) | ||||||||||||||
Business combinations |
||||||||||||||||||||||||||||
Reclassifications |
— | — | ( |
) | ||||||||||||||||||||||||
Accretion expense |
( |
) | — | ( |
) | — | ( |
) | ( |
) | ( |
) | ||||||||||||||||
Foreign currency translation |
( |
) | ( |
) | ( |
) | ||||||||||||||||||||||
Balance at end of period |
$ | |||||||||||||||||||||||||||
Out of which: |
||||||||||||||||||||||||||||
Current provisions |
$ | — | — | — | ||||||||||||||||||||||||
Pensions |
Other benefits |
Total |
||||||||||||||||||||||||||||||||||
Net period cost (income): |
2022 |
2021 |
2020 |
2022 |
2021 |
2020 |
2022 |
2021 |
2020 |
|||||||||||||||||||||||||||
Recorded in operating costs and expenses |
||||||||||||||||||||||||||||||||||||
Service cost |
$ | |||||||||||||||||||||||||||||||||||
Past service cost |
( |
) | ( |
) | ||||||||||||||||||||||||||||||||
Settlements and curtailments |
( |
) | ( |
) | ( |
) | ( |
) | ( |
) | ||||||||||||||||||||||||||
Recorded in other financial expenses |
||||||||||||||||||||||||||||||||||||
Net interest cost |
||||||||||||||||||||||||||||||||||||
Recorded in other comprehensive income |
||||||||||||||||||||||||||||||||||||
Actuarial (gains) losses for the period |
( |
) | ( |
) | ( |
) | ( |
) | ( |
) | ( |
) | ||||||||||||||||||||||||
| $ | ( |
) | ( |
) | ( |
) | ( |
) | ||||||||||||||||||||||||||||
Pensions |
Other benefits |
Total |
||||||||||||||||||||||
2022 |
2021 |
2022 |
2021 |
2022 |
2021 |
|||||||||||||||||||
Change in benefits obligation: |
||||||||||||||||||||||||
Projected benefit obligation at beginning of the period |
$ | |||||||||||||||||||||||
Service cost |
||||||||||||||||||||||||
Interest cost |
||||||||||||||||||||||||
Actuarial gains |
( |
) | ( |
) | ( |
) | ( |
) | ( |
) | ( |
) | ||||||||||||
Initial valuation from new plan |
||||||||||||||||||||||||
Reduction from disposal of assets 1 |
( |
) | ( |
) | ||||||||||||||||||||
Settlements and curtailments |
( |
) | ( |
) | ( |
) | ||||||||||||||||||
Plan amendments |
||||||||||||||||||||||||
Benefits paid |
( |
) | ( |
) | ( |
) | ( |
) | ( |
) | ( |
) | ||||||||||||
Foreign currency translation |
( |
) | ( |
) | ( |
) | ( |
) | ( |
) | ||||||||||||||
Projected benefit obligation at end of the period |
||||||||||||||||||||||||
Change in plan assets: |
||||||||||||||||||||||||
Fair value of plan assets at beginning of the period |
||||||||||||||||||||||||
Return on plan assets |
— | — | ||||||||||||||||||||||
Actuarial (losses) gains |
( |
) | — | — | ( |
) | ||||||||||||||||||
Employer contributions |
||||||||||||||||||||||||
Initial valuation from new plan |
||||||||||||||||||||||||
Benefits paid |
( |
) | ( |
) | ( |
) | ( |
) | ( |
) | ( |
) | ||||||||||||
Foreign currency translation |
( |
) | ( |
) | — | — | ( |
) | ( |
) | ||||||||||||||
Fair value of plan assets at end of the period |
||||||||||||||||||||||||
Net projected liability in the statement of financial position |
$ | |||||||||||||||||||||||
1 |
In connection with the sale of Neoris’ |
2022 |
2021 |
2020 |
||||||||||
Actuarial (gains) losses due to experience |
$ | ( |
) | |||||||||
Actuarial (gains) losses due to demographic assumptions |
( |
) | ||||||||||
Actuarial (gains) losses due financial assumptions |
( |
) | ( |
) | ||||||||
| $ | ( |
) | ( |
) | ||||||||
2022 |
2021 |
|||||||||||||||||||||||||||||||
Level 1 |
Level 2 |
Level 3 |
Total |
Level 1 |
Level 2 |
Level 3 |
Total |
|||||||||||||||||||||||||
Cash |
$ | — | — | $ | — | — | ||||||||||||||||||||||||||
Investments in corporate bonds |
— | — | ||||||||||||||||||||||||||||||
Investments in government bonds |
— | — | ||||||||||||||||||||||||||||||
Total fixed-income securities |
— | — | ||||||||||||||||||||||||||||||
Investment in marketable securities |
— | — | ||||||||||||||||||||||||||||||
Other investments and private funds |
||||||||||||||||||||||||||||||||
Total variable-income securities |
||||||||||||||||||||||||||||||||
Total plan assets |
$ | $ | ||||||||||||||||||||||||||||||
2022 |
2021 |
|||||||||||||||||||||||||||||
Mexico |
United States |
United Kingdom |
Range of rates in other countries |
Mexico |
United States |
United Kingdom |
Rates ranges in other countries |
|||||||||||||||||||||||
Discount rates |
% | % | % | % | % | % | ||||||||||||||||||||||||
Rate of return on plan assets |
% | % | % | % | % | % | ||||||||||||||||||||||||
Rate of salary increases |
% | — | % | % | — | % | ||||||||||||||||||||||||
Estimated payments |
||||
2023 |
$ | |||
2024 |
||||
2025 |
||||
2026 |
||||
2027 – 2032 |
||||
2022 |
2021 |
|||||||||||||||||||||||
PBO |
Assets |
Deficit |
PBO |
Assets |
Deficit |
|||||||||||||||||||
Mexico |
$ | $ | ||||||||||||||||||||||
United States |
||||||||||||||||||||||||
United Kingdom 1 |
||||||||||||||||||||||||
Germany |
||||||||||||||||||||||||
Other countries |
||||||||||||||||||||||||
| $ | $ | |||||||||||||||||||||||
1 |
Applicable regulation in the United Kingdom requires to maintain plan assets at a level similar to that of the obligations. Beginning in 2012, the pension fund started to receive annual dividends from a limited partnership (the “Partnership”), whose assets, transferred by CEMEX UK of an approximate value of $ |
Pensions |
Other benefits |
Total |
||||||||||||||||||||||
Assumptions: |
+50 bps |
-50 bps |
+50 bps |
-50 bps |
+50 bps |
-50 bps |
||||||||||||||||||
Discount Rate Sensitivity |
$ | ( |
) | ( |
) | ( |
) | |||||||||||||||||
Salary Increase Rate Sensitivity |
( |
) | ( |
) | ( |
) | ||||||||||||||||||
Pension Increase Rate Sensitivity |
( |
) | — | — | ( |
) | ||||||||||||||||||
20) |
INCOME TAXES |
20.1) |
INCOME TAXES FOR THE PERIOD |
2022 |
2021 |
2020 |
||||||||||
Current income tax expense |
$ | |||||||||||
Deferred income tax expense (income) |
( |
) | ( |
) | ||||||||
| $ | ||||||||||||
20) |
INCOME TAXES — continued |
20.2) |
DEFERRED INCOME TAXES |
2022 |
2021 |
|||||||
Deferred tax assets: |
||||||||
Tax loss carryforwards and other tax credits |
$ | |||||||
Accounts payable and accrued expenses |
||||||||
Intangible assets, net |
||||||||
Total deferred tax assets, gross |
||||||||
Presentation of net position by same legal entity |
( |
) | ( |
) | ||||
Deferred tax liabilities: |
||||||||
Property, machinery and equipment and right-of-use |
( |
) | ( |
) | ||||
Investments and other assets |
( |
) | ( |
) | ||||
Total deferred tax liabilities, gross |
( |
) | ( |
) | ||||
Presentation of net position by same legal entity |
||||||||
Total deferred tax liabilities, net in the statement of financial position |
( |
) | ( |
) | ||||
Net deferred tax assets (liabilities) |
$ | |||||||
Out of which: |
||||||||
Net deferred tax liabilities in Mexican entities 1 |
$ | ( |
) | ( |
) | |||
Net deferred tax assets in foreign entities 2 |
||||||||
Net deferred tax assets |
$ | |||||||
1 |
Net deferred tax liabilities in Mexico at the reporting date mainly refer to a temporary difference resulting when comparing the carrying amount of property, machinery and equipment, against their corresponding tax values (remaining tax-deductible amount), partially offset by certain deferred tax assets from tax loss carryforwards that are expected to be recovered in the future against taxable income. When the book value is greater than the related tax value results in a deferred tax liability. In 2011, upon transition to IFRS, CEMEX elected to measure its fixed assets at fair value, which resulted in a significant increase in book value, mainly associated with the revaluation of mineral reserves. Such restated amounts are depleted to the income statement in a period close to tax-deductible; hence the temporary difference will gradually reverse over time but does not represent a payment obligation to the tax authority at the reporting date. |
2 |
Net deferred tax assets in foreign entities in 2022 and 2021 are mainly related to tax loss carryforwards recognized in prior years, mainly in the United States, that are expected to be recovered in the future against taxable income. |
20) |
INCOME TAXES — continued |
20.2) |
DEFERRED INCOME TAXES — continued |
2022 |
2021 |
|||||||||||||||||||||||
Assets |
Liabilities |
Net |
Assets |
Liabilities |
Net |
|||||||||||||||||||
Mexican entities |
$ | ( |
) | ( |
) | $ | ( |
) | ( |
) | ||||||||||||||
Foreign entities |
( |
) | ( |
) | ||||||||||||||||||||
| $ | ( |
) | $ | ( |
) | |||||||||||||||||||
2022 |
2021 |
2020 |
||||||||||
Deferred income tax expense (income) in the income statement |
$ | ( |
) | ( |
) | |||||||
Deferred income tax expense (income) in stockholders’ equity |
( |
) | ( |
) | ||||||||
Reclassifications 1 |
( |
) | ||||||||||
Change in deferred income tax during the period |
$ | ( |
) | |||||||||
1 |
In 2022, 2021 and 2020, refers to the effects of the reclassification of balances to assets held for sale and related liabilities (note 4.2). |
2022 |
2021 |
2020 |
||||||||||
Revenue related to foreign exchange fluctuations from intercompany balances (note 21.2) |
$ | ( |
) | ( |
) | |||||||
Expense (revenue) associated to actuarial results (note 21.2) |
( |
) | ||||||||||
Revenue related to derivative financial instruments (note 17.4) |
( |
) | ( |
) | ||||||||
Expense (revenue) from foreign currency translation and other effects |
( |
) | ( |
) | ||||||||
| $ | ( |
) | ( |
) | ||||||||
Amount of carryforwards |
Amount of unrecognized carryforwards |
Amount of recognized carryforwards |
||||||||||
2023 |
$ | |||||||||||
2024 |
||||||||||||
2025 |
||||||||||||
2026 |
||||||||||||
2027 and thereafter |
||||||||||||
| $ | ||||||||||||
20) |
INCOME TAXES — continued |
20.2) |
DEFERRED INCOME TAXES — continued |
20.3) |
RECONCILIATION OF EFFECTIVE INCOME TAX RATE |
2022 |
2021 |
2020 |
||||||||||
| Earnings (loss) before income tax |
$ | ( |
) | |||||||||
| Income tax expense |
( |
) | ( |
) | ( |
) | ||||||
| |
|
|
|
|
|
|||||||
| Effective consolidated income tax expense rate 1 |
% | % | ( |
)% | ||||||||
| |
|
|
|
|
|
|||||||
1 |
The average effective tax rate equals the net amount of income tax revenue or expense divided by income or loss before income taxes, as these line items are reported in the income statement. |
20) |
INCOME TAXES — continued |
20.3) |
RECONCILIATION OF EFFECTIVE INCOME TAX RATE — continued |
2022 |
2021 |
2020 |
||||||||||||||||||||||
% |
$ |
% |
$ |
% |
$ |
|||||||||||||||||||
| Mexican statutory tax rate |
( |
) | ||||||||||||||||||||||
| Difference between accounting and tax expenses, net 1 |
( |
) | ||||||||||||||||||||||
| Non-taxable sale of equity securities and fixed assets |
( |
) | ( |
) | ( |
) | ||||||||||||||||||
| Difference between book and tax inflation |
( |
) | ||||||||||||||||||||||
| Differences in the income tax rates in the countries where CEMEX operates 2 |
( |
) | ( |
) | ( |
) | ||||||||||||||||||
| Changes in deferred tax assets 3 |
( |
) | ( |
) | ( |
) | ( |
) | ( |
) | ||||||||||||||
| Changes in provisions for uncertain tax positions |
( |
) | ( |
) | ( |
) | ||||||||||||||||||
| Others |
( |
) | ||||||||||||||||||||||
| |
|
|
|
|
|
|
|
|
|
|
|
|||||||||||||
| Effective consolidated income tax expense rate |
( |
) | ||||||||||||||||||||||
| |
|
|
|
|
|
|
|
|
|
|
|
|||||||||||||
1 |
In 2022 includes $ non-deductible (note 7). |
2 |
Refers mainly to the effects of the differences between the statutory income tax rate in Mexico of |
3 |
Refers to the effects in the effective income tax rate associated with changes during the period in the amount of deferred income tax assets related to CEMEX’s tax loss carryforwards. |
2022 |
2021 |
|||||||||||||||
Changes in the statement of financial position |
Amounts in reconciliation |
Changes in the statement of financial position |
Amounts in reconciliation |
|||||||||||||
| Tax loss carryforwards generated and not recognized during the year |
$ | — | — | |||||||||||||
| Derecognition related to tax loss carryforwards recognized in prior years |
( |
) | — | ( |
) | |||||||||||
| Recognition related to unrecognized tax loss carryforwards |
( |
) | ( |
) | ||||||||||||
| Foreign currency translation and other effects |
( |
) | ( |
) | ||||||||||||
| |
|
|
|
|
|
|
|
|||||||||
| Changes in deferred tax assets |
$ | ( |
) | ( |
) | ( |
) | ( |
) | |||||||
| |
|
|
|
|
|
|
|
|||||||||
20) |
INCOME TAXES — continued |
20.4) |
UNCERTAIN TAX POSITIONS AND SIGNIFICANT TAX PROCEEDINGS |
2022 |
2021 |
2020 |
||||||||||
Balance of tax positions at beginning of the period |
$ | |||||||||||
Additions for tax positions of prior periods |
— | |||||||||||
Additions for tax positions of current period |
||||||||||||
Reductions for tax positions related to prior periods and other items |
( |
) | ( |
) | ( |
) | ||||||
Settlements and reclassifications |
( |
) | ( |
) | ( |
) | ||||||
Expiration of the statute of limitations |
( |
) | ( |
) | ( |
) | ||||||
Foreign currency translation effects |
( |
) | ||||||||||
Balance of tax positions at end of the period |
$ | |||||||||||
| • | The tax authorities in Spain (“the Spanish Tax Authorities”) challenged part of the tax loss carryforwards reported by CEMEX España covering the tax years from and including 2006 to 2009. During 2013, the Spanish Tax Authorities notified CEMEX España of fines in the aggregate amount of $ Tribunal Económico Administrativo Central |
20) |
INCOME TAXES — continued |
20.4) |
UNCERTAIN TAX POSITIONS AND SIGNIFICANT TAX PROCEEDINGS — continued |
resolution in November 2017 before the National Court ( Audiencia Nacional |
| • | On March 26, 2021, the Spanish Tax Authorities notified CEMEX España of an assessment for Income Taxes in an amount in Euros equivalent to $ |
| • | During April, 2018, CEMEX Colombia received a special proceeding from the Colombian Tax Authority (the “Tax Authority”), where certain deductions included in the 2012 income tax return were rejected. The Tax Authority assessed an increase in the income tax payable by CEMEX Colombia and imposed an inaccuracy penalty for amounts in Colombian Pesos equivalent to $26 of income tax and $ |
20) |
INCOME TAXES — continued |
20.4) |
UNCERTAIN TAX POSITIONS AND SIGNIFICANT TAX PROCEEDINGS — continued |
amounts include in the taxes payable, the adjustment of refunding to the Tax Authority credit balances for the year in question, which were used to offset taxes payable for subsequent years. If the proceeding is adversely resolved in the final stage, CEMEX Colombia must pay the amounts determined in the official settlement plus interest accrued on the amount of the income tax adjustment until the payment date. As of December 31, 2022, at this stage of the proceeding, CEMEX considers that an adverse resolution in this proceeding after conclusion of all available defense procedures is not probable, however, it is difficult to assess with certainty the likelihood of an adverse result in the proceeding; if adversely resolved, CEMEX believes this proceeding could have a material adverse impact on the operating results, liquidity or financial position of CEMEX. |
| • | In September 2012, the Tax Authority requested CEMEX Colombia to amend its income tax return for the year 2011 in connection with several deductible expenses including the amortization of goodwill. CEMEX Colombia rejected the arguments of the ordinary request and filed a motion requesting the case to be closed. The 2011 income tax return was under audit of the Tax Authority from August 2013 until September 5, 2018, when the Tax Authority notified CEMEX Colombia of a special proceeding in which it rejected certain deductions included in the 2011 tax return and determined an increase in the income tax payable and imposed a penalty for amounts in Colombian Pesos equivalent to $ |
21) |
STOCKHOLDERS’ EQUITY |
21) |
STOCKHOLDERS’ EQUITY — continued |
As of December 31, 2022 |
||||||||
Consolidated |
Parent Company |
|||||||
Common stock and additional paid-in capital1 |
$ | |||||||
Other equity reserves 1, 2 |
( |
) | ||||||
Retained earnings 2 |
||||||||
Total controlling interest |
$ | |||||||
1 |
The difference relates to the method of accruing Dollars using the historical exchange rates to translate each common stock and additional paid-in capital transaction denominated in Pesos to Dollars. The cumulative effect from these changes in exchange rates is recognized against other equity reserves. |
2 |
The difference relates with the method of accruing Dollars using the exchange rates of each month during the period for income statement purposes. The cumulative effect from these changes in exchange rates is recognized against other equity reserves. |
21.1) |
COMMON STOCK AND ADDITIONAL PAID-IN CAPITAL |
2022 |
2021 |
|||||||
Common stock |
$ | |||||||
Additional paid-in capital |
||||||||
| $ | ||||||||
21) |
STOCKHOLDERS’ EQUITY — continued |
21.1) |
COMMON STOCK AND ADDITIONAL PAID-IN CAPITAL — continued |
2022 |
2021 |
|||||||||||||||
Shares 1 |
Series A 2 |
Series B 2 |
Series A 2 |
Series B 2 |
||||||||||||
Subscribed and paid shares |
||||||||||||||||
Unissued shares authorized for executives’ stock compensation programs |
||||||||||||||||
Repurchased shares 3 |
||||||||||||||||
1 |
As of December 31, 2022 and 2021, |
2 |
Series “A” or Mexican shares must represent at least |
3 |
Shares repurchased under the share repurchase program authorized by the Company’s shareholders (note 21.2). |
21) |
STOCKHOLDERS’ EQUITY — continued |
21.1) |
COMMON STOCK AND ADDITIONAL PAID-IN CAPITAL — continued |
21.2) |
OTHER EQUITY RESERVES AND SUBORDINATED NOTES |
2022 |
2021 |
|||||||
Other equity reserves |
$ | ( |
) | ( |
) | |||
Subordinated notes |
||||||||
| $ | ( |
) | ( |
) | ||||
2022 |
2021 |
|||||||
Cumulative translation effect, net of effects from deferred income taxes recognized directly in equity (note 20.2) and derivative financial instruments designated as cash flow hedges |
$ | ( |
) | ( |
) | |||
Cumulative actuarial losses |
( |
) | ( |
) | ||||
Cumulative coupon payments under perpetual debentures (note 21.4) |
( |
) | ( |
) | ||||
Treasury shares repurchased under share repurchase program (note 21.1) |
( |
) | ||||||
Cumulative coupon payments under subordinated notes 1 |
( |
) | ( |
) | ||||
Treasury shares held by subsidiaries |
( |
) | ( |
) | ||||
| $ | ( |
) | ( |
) | ||||
1 |
Interest accrued under the Parent Company’s subordinated notes described below are recognized as part of other equity reserves. |
21) |
STOCKHOLDERS’ EQUITY — continued |
21.2) |
OTHER EQUITY RESERVES AND SUBORDINATED NOTES — continued |
2022 |
2021 |
2020 |
||||||||||
Foreign currency translation result 1 |
$ | ( |
) | ( |
) | |||||||
Foreign exchange fluctuations from debt 2 |
( |
) | ( |
) | ||||||||
Foreign exchange fluctuations from intercompany balances 3 |
( |
) | ( |
) | ( |
) | ||||||
| $ | ( |
) | ( |
) | ( |
) | ||||||
1 |
These effects refer to the result from the translation of the financial statements of foreign subsidiaries and include the changes in fair value of foreign exchange forward contracts designated as hedge of a net investment (note 17.4). |
2 |
Generated by foreign exchange fluctuations over a notional amount of debt in CEMEX, S.A.B. de C.V., associated with the acquisition of foreign subsidiaries and designated as a hedge of the net investment in foreign subsidiaries (note 2.4). |
3 |
Refers to foreign exchange fluctuations arising from balances with related parties in foreign currencies that are of a long-term investment nature considering that their liquidation is not anticipated in the foreseeable future and foreign exchange fluctuations over a notional amount of debt of a subsidiary of CEMEX España identified and designated as a hedge of the net investment in foreign subsidiaries. |
21.3) |
RETAINED EARNINGS |
21) |
STOCKHOLDERS’ EQUITY — continued |
21.4) |
NON-CONTROLLING INTEREST AND PERPETUAL DEBENTURES |
| • | In February 2017, CEMEX acquired a controlling interest in TCL, whose shares trade in the Trinidad and Tobago Stock Exchange. As of December 31, 2022 and 2021, there is a non-controlling interest in TCL of |
| • | In July 2016, CHP closed its initial offering of non-controlling interest in CHP from |
| • | In November 2012, CLH, a direct subsidiary of CEMEX España, concluded its initial offering of common shares. CLH’s assets include substantially all of CEMEX’s assets in Colombia, Panama, Guatemala and until August 31, 2022, operations in Costa Rica and El Salvador. In December 2020, by means of a public share tender offer, CEMEX España increased its ownership in CLH by acquiring 108,337,613 shares of CLH in exchange of $103. As of December 31, 2022 and 2021, there is a non-controlling interest in CLH of |
22) |
EXECUTIVE SHARE-BASED COMPENSATION |
23) |
EARNINGS (LOSS) PER SHARE |
2022 |
2021 |
2020 |
||||||||||
Denominator (thousands of shares) |
||||||||||||
Weighted-average number of shares outstanding – basic |
||||||||||||
Effect of dilutive instruments – share-based compensation (note 22) 1 |
||||||||||||
Weighted-average number of shares – diluted |
||||||||||||
Numerator |
||||||||||||
Net income (loss) from continuing operations |
$ | ( |
) | |||||||||
Less: non-controlling interest net income (loss) |
||||||||||||
Controlling interest net income (loss) from continuing operations – for basic earnings per share calculations |
( |
) | ||||||||||
Plus: after tax interest expense on optionally convertible securities |
||||||||||||
Controlling interest net income (loss) from continuing operations – for diluted earnings per share calculations |
$ | ( |
) | |||||||||
Net income (loss) from discontinued operations |
$ | ( |
) | ( |
) | |||||||
Basic earnings per share |
||||||||||||
Controlling interest basic earnings (loss) per share |
$ | ( |
) | |||||||||
Controlling interest basic earnings (loss) per share from continuing operations |
( |
) | ||||||||||
Controlling interest basic earnings (loss) per share from discontinued operations |
( |
) | ( |
) | ||||||||
Controlling interest diluted earnings per share 2 |
||||||||||||
Controlling interest diluted earnings (loss) per share |
$ | ( |
) | |||||||||
Controlling interest diluted earnings (loss) per share |
( |
) | ||||||||||
Controlling interest diluted earnings (loss) per share |
( |
) | ( |
) | ||||||||
23) |
EARNINGS (LOSS) PER SHARE — continued |
1 |
The number of Parent Company CPOs to be issued under the executive share-based compensation programs, as well as the total amount of Parent Company CPOs committed for issuance in the future under the mandatorily and optionally convertible securities, are computed from the beginning of the reporting period. The number of shares resulting from the executives’ stock-based compensation programs is determined under the inverse treasury method. |
2 |
For 2020, the effects on the denominator and numerator of potential dilutive shares generate antidilution; therefore, there is no change between the reported basic earnings per share and diluted earnings per share. |
24) |
COMMITMENTS |
24.1) |
CONTRACTUAL OBLIGATIONS |
2022 |
||||||||||||||||||||
Obligations |
Less than 1 year |
1-3 years |
3-5 years |
More than 5 years |
Total |
|||||||||||||||
Long-term debt |
$ | |||||||||||||||||||
Leases 1 |
||||||||||||||||||||
Total debt and other financial obligations 2 |
||||||||||||||||||||
Interest payments on debt 3 |
||||||||||||||||||||
Pension plans and other benefits 4 |
||||||||||||||||||||
Acquisition of property, plant and equipment 5 |
||||||||||||||||||||
Purchases of services, raw materials, 6 |
||||||||||||||||||||
Total contractual obligations |
$ | |||||||||||||||||||
1 |
Represent nominal cash flows. As of December 31, 2022, the NPV of future payments under such leases was $ |
2 |
The schedule of debt payments, which includes current maturities, does not consider the effect of any refinancing of debt that may occur during the following years. In the past, CEMEX has replaced its long-term obligations for others of a similar nature. |
3 |
Estimated cash flows on floating rate denominated debt were determined using the floating interest rates in effect as of December 31, 2022. |
4 |
Represents estimated annual payments under these benefits for the |
5 |
Refers mainly to the expansion of a cement-production line in the Philippines. |
6 |
Future payments for the purchase of raw materials are presented based on contractual nominal cash flows. Future nominal payments for energy were estimated for all contractual commitments based on an aggregate average expected consumption per year using the future prices of energy established in the contracts for each period. Future payments also include CEMEX’s commitments for the purchase of fuel. In addition, includes a contractual commitment with Neoris over a 5-year contract beginning in 2023 until 2027 for the acquisition by CEMEX of digitalization services and solutions for an annual amount of $ |
24) |
COMMITMENTS — continued |
24.2) |
OTHER COMMITMENTS |
| • | On February 8, 2022, CEMEX renewed or entered into new agreements with six service providers in the fields of data processing services (back office) in finance, accounting and human resources; as well as Information Technology (“IT”) infrastructure services, support and maintenance of IT applications in the countries in which CEMEX operates, for a tenure of five to seven years at an average annual cost of $ |
| • | Beginning in April 2016, in connection with the Ventika S.A.P.I. de C.V. and the Ventika II S.A.P.I. de C.V. wind farms (jointly “Ventikas”) located in the Mexican state of Nuevo Leon with a combined generation capacity of |
| • | Beginning in February 2010, for its overall electricity needs in Mexico CEMEX agreed with EURUS the purchase a portion of the electric energy generated for a period of no less than |
| • | CEMEX maintains a commitment initiated in April 2004 to purchase the energy generated by Termoeléctrica del Golfo (“TEG”) until 2027 for its overall electricity needs in Mexico. The estimated annual cost of this agreement is $ |
| • | In regards with the above, CEMEX also committed to supply TEG and another third-party electrical energy generating plant adjacent to TEG all fuel necessary for their operations until the year 2027, equivalent to approximately |
| • | On October 24, 2018, CEMEX, S.A.B. de C.V. entered into an energy financial hedge agreement in Mexico, commencing October 1, 2019 and for a period of |
24) |
COMMITMENTS — continued |
24.3) |
COMMITMENTS FROM EMPLOYEE BENEFITS |
25) |
LEGAL PROCEEDINGS |
25.1) |
PROVISIONS RESULTING FROM LEGAL PROCEEDINGS |
| • | As of December 31, 2022, CEMEX accrued environmental remediation liabilities through its subsidiaries in the United Kingdom pertaining to closed and current landfill sites for the confinement of waste, representing the NPV of such obligations for an amount in Pounds sterling equivalent to $ |
| • | As of December 31, 2022, CEMEX accrued environmental remediation liabilities through its subsidiaries in the United States for $ |
| • | In 2012, in connection with a contract entered into in 1990 (the “Quarry Contract”) by CEMEX Granulats Rhône Méditerranée (“CEMEX GRM”), one of CEMEX’s subsidiaries in France, with SCI La Quinoniere (“SCI”) pursuant to which CEMEX GRM had drilling rights to extract reserves and do quarry remediation at a quarry in the Rhône region of France, SCI filed a claim against CEMEX GRM for breach of the Quarry Contract, requesting the rescission of such contract and damages plus interest for a revised amount in Euros equivalent to $ |
25) |
LEGAL PROCEEDINGS — continued |
25.1) |
PROVISIONS RESULTING FROM LEGAL PROCEEDINGS — continued |
the Quarry Contract. After many hearings, resolutions and appeals over the years, on November 25, 2020, the expert appointed by the court of appeals determined an amount of loss of profits of $ |
25.2) |
CONTINGENCIES FROM LEGAL PROCEEDINGS |
| • | In July 2020, an individual filed a class action lawsuit ( Acción de Grupo |
| • | On September 20, 2018, triggered by heavy rainfall, a landslide causing damages and fatalities (the “Landslide”) occurred in a site located within an area covered by mining rights of APO Land & Quarry Corporation (“ALQC”) in Naga City, Cebu, Philippines. ALQC is a principal raw material supplier of APO Cement Corporation (“APO”), a wholly owned subsidiary of CHP. CEMEX indirectly owns a minority |
25) |
LEGAL PROCEEDINGS — continued |
25.2) |
CONTINGENCIES FROM LEGAL PROCEEDINGS — continued |
Cebu. Plaintiffs claim that the Landslide occurred because of the defendants’ gross negligence and seek, among other relief, (a) damages for an amount in Philippine Pesos equivalent to $ |
| • | In December 2016, the Parent Company received subpoenas from the SEC seeking information to determine whether there have been any violations of the U.S. Foreign Corrupt Practices Act stemming from the Maceo Project. These subpoenas do not mean that the SEC has concluded that the Parent Company or any of its affiliates violated the law. The DOJ also opened an investigation into this matter. In this regard, on March 12, 2018, the DOJ issued a grand jury subpoena to the Parent Company relating to its operations in Colombia and other jurisdictions. The Parent Company intends to continue to cooperate fully with the SEC, the DOJ and any other investigatory entity. As of December 31, 2022, the Parent Company is unable to predict the duration, scope, or outcome of either the SEC investigation or the DOJ investigation, or any other investigation that may arise, or, because of the current status of the SEC investigation and the preliminary nature of the DOJ investigation, the potential sanctions which could be borne by the Parent Company, or if such sanctions, if any, would have a material adverse impact on CEMEX results of operations, liquidity or financial position. |
| • | In February 2014, the Egyptian Tax Authority requested Assiut Cement Company (“ACC”), a subsidiary of CEMEX in Egypt, the payment of a development levy on clay used in the Egyptian cement industry for the period from May 5, 2008 to November 30, 2011. In March 2014, ACC appealed the levy and on September 2014 it was notified that it obtained a favorable resolution from the Ministerial Committee for Resolution of Investment Disputes, which instructed the Egyptian Tax Authority to cease claiming from ACC the payment of the levy on clay. It was further decided that the levy on clay should not be imposed on imported clinker. Nonetheless, in May 2016, the Egyptian Tax Authority challenged ACC´s right to cancel the levy on clay before the North Cairo Court, which referred the cases to Cairo’s Administrative Judiciary Court. These cases have been adjourned by the Commissioners of the Cairo Administrative Judiciary Court, which on November 2, 2020 referred the cases to the Court and established a first hearing session for February 15, 2021 and was adjourned to the May 31, 2021 session. During the session held on May 31, 2021, the Court that is hearing the case decided to refer the case to another Chamber within the same Court considering the nature of the subject. On October 28, 2021 ACC held the first hearing session before the new Chamber. On this session, the court postponed the hearing to the session of January 20, 2022 for ACC lawyers to submit a power of attorney allowing the withdrawal of the court case. CEMEX does not expect that such referral will prejudice ACC’s favorable legal position in this dispute. On February 24, 2022, this case was dismissed by the relevant court and this matter has ended. |
25) |
LEGAL PROCEEDINGS — continued |
25.2) |
CONTINGENCIES FROM LEGAL PROCEEDINGS — continued |
| • | In September 2012, in connection with a lawsuit submitted to a first instance court in Assiut, Egypt in 2011, the first instance court of Assiut issued a resolution to nullify the Share Purchase Agreement (the “SPA”) pursuant to which CEMEX acquired in 1999 a controlling interest in Assiut Cement Company. In addition, during 2011 and 2012, lawsuits seeking, among other things, the annulment of the SPA were filed by different plaintiffs, including th Circuit State Council Administrative Judiciary Court awaiting the High Constitutional Court to pronounce regarding the challenges against the constitutionality of Law 32/2014 filed by the plaintiffs, which protects CEMEX’s investments in Egypt. These matters are complex and take several years to be resolved. As of December 31, 2022, CEMEX is not able to assess the likelihood of an adverse resolution regarding these lawsuits nor is able to assess if the Constitutional Court will dismiss Law 32/2014, but, regarding the lawsuits, if adversely resolved, CEMEX does not believe the resolutions in the first instance would have an immediate material adverse impact on CEMEX’s operations, liquidity and financial condition. However, if CEMEX exhausts all legal recourses available, a final adverse resolution of these lawsuits, or if the Constitutional Court dismisses Law 32/2014, this could adversely impact the ongoing matters regarding the SPA, which could have a material adverse impact on CEMEX’s operations, liquidity and financial condition. (see note 27 for Subsequent Events). |
25.3) |
OTHER SIGNIFICANT PROCESSES |
| • | In August 2012, CEMEX Colombia signed a memorandum of understanding (the “MOU”) with the representative of CI Calizas y Minerales S.A. (“CI Calizas”), for the acquisition and transfer of assets |
25) |
LEGAL PROCEEDINGS — continued |
25.3) |
OTHER SIGNIFICANT PROCESSES — continued |
mainly comprising land, the mining concession, environmental license and the shares of Zona Franca Especial Cementera del Magdalena Medio S.A.S. (“Zomam”) (holder of the free trade zone concession). In addition, in December 2013, CEMEX Colombia engaged the same representative of CI Calizas to also represent in the name and on behalf of CEMEX Colombia in the acquisition of certain land plots adjacent to the plant, signing another memorandum of understanding (the “Land MOU”). Under the MOU and the Land MOU, CEMEX Colombia made cash advances to this representative for amounts in Colombian Pesos equivalent to $ |
| • | In December 2012 after signing of the MDE, a former shareholder of CI Calizas, who presumptively transferred its shares of CI Calizas two years before the signing of the MOU, was linked to a process of expiration of property initiated by the Attorney General. Amongst other measures, the Attorney General suspended the sale and ordered the seizure of the assets subject to the MOU, including the shares of Zomam acquired by CEMEX Colombia before the beginning of such process. As a third party acting in good faith and free of guilt, CEMEX Colombia joined the expiration of property process cooperating with the Attorney General. The expiration process continues which has not progressed since February, 2020, CEMEX is not able to make a reasonable estimate of the duration. As of December 31, 2022, pursuant to the expiration of property process of the assets subject to the MOU and the failures to formalize the purchases under the Land MOU, CEMEX Colombia does not have the legal representation of Zomam, is not the rightful owner of the land and is not the assigned entity of the mining concession. |
| • | In addition, there is an ongoing criminal investigation that resulted in a legal resolution by means of which an indictment was issued to two of the Company’s former officers and to CI Calizas’ representative. CEMEX is not able to anticipate the actions that criminal judges may impose against these people. Moreover, CEMEX Colombia filed a legal recourse for accountability against the representative, in connection with the responsibilities agreed under the Land MOU for the acquisition of certain land plots adjacent to the plant. This legal recourse finalized in 2021 with a definitive resolution favorable to CEMEX Colombia in which it was ordered the transfer to CEMEX Colombia of those land plots acquired by the representative, as well as the return of unused cash advances, equivalent to $ |
25) |
LEGAL PROCEEDINGS — continued |
25.3) |
OTHER SIGNIFICANT PROCESSES — continued |
| • | On December 7, 2020, the Parent Company, acting as shareholder of CEMEX Colombia, filed a lawsuit before the Business Superintendency of Colombia ( Superintendencia de Sociedades de Colombia in-kind carried out by CEMEX Colombia to Zomam on December 11, 2015. In the event of a favorable resolution, all the effects of the equity contribution would roll back. As a consequence, the assets contributed to Zomam, which had a value of $ |
| • | In July 2013, CEMEX Colombia signed with the provisional depository designated by the former Drugs National Department (then depository of the assets subject to the expiration of property process), which functions after its liquidation were assumed by the Administrator of Special Assets ( Sociedad de Activos Especiales S.A.S. |
| • | On April 12, 2019, CEMEX Colombia, CCL and another of its subsidiaries reached a conciliatory agreement with the SAE and CI Calizas before the Attorney General’s Office and signed a contract of Mining Operation, Manufacturing and Delivery Services and Leasing of Properties for Cement Production (the “Operation Contract”), which will allow CEMEX Colombia to continue using the assets subject to the aforementioned expiration of property process for an initial term of one-time initial payments in Colombian Pesos equivalent to $ |
| • | Once the Maceo Plant begins commercial operations, CEMEX Colombia and/or a subsidiary will pay on a quarterly basis: a) |
| • | The Operation Contract will continue in force regardless of the result in the expiration of property process, except that the applicable criminal judge would recognize ownership rights of the assets under |
25) |
LEGAL PROCEEDINGS — continued |
25.3) |
OTHER SIGNIFICANT PROCESSES — continued |
expiration of property to CEMEX Colombia and its subsidiary, in which case the Operation Contract would no longer be needed and would be early terminated. |
| • | Under the presumption that CEMEX Colombia conducted itself in good faith, CEMEX considers that it will be able to keep ownership of the plant, and that the rest of its investments are protected by Colombian law, under which, if a person builds on the property of a third party, with full knowledge of such third party, this third party may: a) take ownership of the plant, provided a corresponding indemnity to CEMEX Colombia, or otherwise, b) oblige CEMEX Colombia to purchase the land. Nonetheless, had this not be the case, CEMEX Colombia would take all necessary actions to safeguard its rights. If the expiration of property over the assets subject to the MOU is ordered in favor of the State, if the assets were adjudicated to a third party in a public tender offer, considering the signing of the Operation Contract, such third party would have to subrogate to the Operation Contract. As of December 31, 2022, CEMEX is not able to estimate whether the expiration of property over the assets subject to the MOU will be ordered in favor of the State, or, if applicable, if the assets would be adjudicated to a third party in a public tender offer. |
| • | On September 3, 2019, the Corantioquia’s Directive Council, the regional environmental authority (“Corantioquia”), approved the subtraction of a portion of the plant from the IMD. In addition, in February, 2021, Corantioquia notified CI Calizas of the modification of the environmental license allowing the extraction of up to |
| • | Regarding the permits to conclude the construction of several sections of the access road, on November 10, 2020, Maceo’s municipality issued the approval of the Road Infrastructure Intervention project and, on December 11, 2020, issued a decree establishing the public utility of the access road, required authorizations for both, to obtain the permits to acquire the required land and build the remainder of the road. In respect to the modification of the permitted land use where the project is located, CEMEX Colombia received favorable criteria from Corantioquia regarding the change of land use because of the approval for the subtraction from the IMD, which was endorsed by the municipality of Maceo on August 29, 2020, which allows for an industrial and mining use compatible with the project. |
25) |
LEGAL PROCEEDINGS — continued |
25.3) |
OTHER SIGNIFICANT PROCESSES — continued |
| • | Moreover, in another significant progress, on June 15, 2022, the Ministry of Commerce, Industry and Tourism granted Zomam the extension of the free trade zone area, which now includes the full extension of the plant. |
| • | The obtention of the modification in the environmental license, which means a significant progress for future operation of Maceo Plant, the beginning of commercial operations is subject mainly to the construction of the access road and the authorization required from the owners of land plots adjacent to the plant, as well as the extension of environmental and mining permits that allow the production of up to |
26) |
RELATED PARTIES |
26) |
RELATED PARTIES — continued |
27) |
SUBSEQUENT EVENTS |
27) |
SUBSEQUENT EVENTS — continued |
28) |
PRINCIPAL SUBSIDIARIES |
28) |
PRINCIPAL SUBSIDIARIES — continued |
% Interest |
||||||||||
Subsidiary |
Country |
2022 |
2021 |
|||||||
1 |
||||||||||
2 |
||||||||||
3 |
||||||||||
4 |
||||||||||
5 |
||||||||||
6 |
||||||||||
7 |
||||||||||
8 |
||||||||||
9 |
||||||||||
9 |
||||||||||
10 |
||||||||||
11 |
||||||||||
12 |
||||||||||
13 |
||||||||||
1 |
CEMEX España is the direct or indirect holding company of most of CEMEX’s international operations. |
2 |
The interest reported excludes own shares held in CLH’s treasury. CLH, incorporated in Spain, trades its ordinary shares in the Colombian Stock Exchange under the symbol CLH, and is the indirect holding company of CEMEX’s operations in Colombia, Panama, Guatemala, Nicaragua and until August 31, 2022, operations in Costa Rica and El Salvador (note 21.4). |
3 |
The sale of its indirect interest in CEMEX (Costa Rica), S.A. was closed on August 31, 2022. |
4 |
Represents CEMEX Colombia, S.A.’s |
5 |
Represents CLH’s direct and indirect interest in ordinary and preferred shares, including own shares held in CEMEX Colombia, S.A.’s treasury. |
6 |
Represents CLH’s |
7 |
Represents the aggregate ownership interest of CEMEX in this entity of |
28) |
PRINCIPAL SUBSIDIARIES — continued |
8 |
CEMEX’s operations in the Philippines are conducted through CHP, a subsidiary incorporated in the Philippines which since July 2016 trades its ordinary shares on the Philippines Stock Exchange under the symbol CHP (note 21.4) |
9 |
Represents CHP´s direct and indirect interest. |
10 |
CEMEX España indirectly owns a |
11 |
On October 25, 2022, CEMEX closed the sale of a |
12 |
CEMEX International Trading LLC is involved in the international trading of CEMEX’s products. |
13 |
Sunbulk Shipping Limited is involved mainly in maritime and land transportation and/or shipping of goods worldwide and the handling, administration, hiring of shipments and cargo at ports, terminals and other loading and unloading destinations worldwide, as well as the offering and contracting of services in relation thereto for CEMEX’s trading entities and operations. |