UNITED STATES
SECURITIES AND EXCHANGE COMMISSION
Washington, D.C. 20549
FORM 10-K
(Mark One)
| Annual Report Pursuant to Section 13 or 15(d) of the Securities Exchange Act of 1934 | |||||
For the fiscal year ended December 31 , 2023
OR
| Transition Report Pursuant to Section 13 or 15(d) of the Securities Exchange Act of 1934 | |||||
For the transition period from _________to_________.
Commission file number 001-39916
___________________________________________

(Exact name of registrant as specified in its charter)
| (State or other jurisdiction of incorporation or organization) | (I.R.S. Employer Identification No.) | |||||||
| (Address of principal executive offices) | (Zip code) | |||||||
( | ||
| (Registrant’s Telephone Number, Including Area Code) | ||
___________________________________________
Securities registered pursuant to Section 12(b) of the Act:
| Title of each class | Trading symbol(s) | Name of each exchange on which registered | ||||||
Securities registered pursuant to Section 12(g) of the Act: None
___________________________________________
Indicate by check mark if the registrant is a well-known seasoned issuer, as defined in Rule 405 of the Securities Act. Yes o No x
Indicate by check mark if the registrant is not required to file reports pursuant to Section 13 or Section 15(d) of the Act. Yes o No x
Indicate by check mark whether the registrant (1) has filed all reports required to be filed by Section 13 or 15(d) of the Securities Exchange Act of 1934 during the preceding 12 months (or for such shorter period that the registrant was required to file such reports), and (2) has been subject to such filing requirements for the past 90 days. Yes x No o
Indicate by check mark whether the registrant has submitted electronically every Interactive Data File required to be submitted pursuant to Rule 405 of Regulation S-T (§ 232.405 of this chapter) during the preceding 12 months (or for such shorter period that the registrant was required to submit such files). Yes x No o
Indicate by check mark whether the registrant is a large accelerated filer, an accelerated filer, a non-accelerated filer, a smaller reporting company, or an emerging growth company. See the definitions of “large accelerated filer,” “accelerated filer,” “smaller reporting company,” and “emerging growth company” in Rule 12b-2 of the Exchange Act.
| Large accelerated filer | o | x | |||||||||
| Non-accelerated filer | o | Smaller reporting company | |||||||||
| Emerging growth company | |||||||||||
If an emerging growth company, indicate by check mark if the registrant has elected not to use the extended transition period for complying with any new or revised financial accounting standards provided pursuant to Section 13(a) of the Exchange Act. o
Indicate by check mark whether the registrant has filed a report on and attestation to its management’s assessment of the effectiveness of its internal control over financial reporting under Section 404(b) of the Sarbanes-Oxley Act (15 U.S.C. 7262(b)) by the registered public accounting firm that prepared or issued its audit report. x
If securities are registered pursuant to Section 12(b) of the Act, indicate by check mark whether the financial statements of the registrant included in the filing reflect the correction of an error to previously issued financial statements. o
Indicate by check mark whether any of those error corrections are restatements that required a recovery analysis of incentive-based compensation received by any of the registrant’s executive officers during the relevant recovery period pursuant to §240.10D-1(b). o
Indicate by check mark whether the registrant is a shell company (as defined in Rule 12b-2 of the Exchange Act). Yes o No x
The aggregate market value of the registrant’s Class A common stock held by non-affiliates of the registrant as of June 30, 2023, based on the closing stock price per share as reported by the New York Stock Exchange on such date, was approximately $447.8 million.
As of February 29, 2024, there were 34,040,169 shares of the registrant’s Class A common stock, par value $0.01 per share, issued and outstanding and 59,226,153 shares of the registrant’s Class B common stock, par value $0.01 per share, issued and outstanding.
Documents Incorporated by Reference
Portions of the registrant’s Proxy Statement for the 2024 Annual Meeting of Stockholders are incorporated herein by reference in Part III of this Annual Report on Form 10-K.
DREAM FINDERS HOMES, INC.
2023 FORM 10-K ANNUAL REPORT
Table of Contents
| Page | ||||||||
| PART I | ||||||||
Item 1C. | ||||||||
| PART II | ||||||||
| PART III | ||||||||
| PART IV | ||||||||
i
PART I
Explanatory Note
Unless otherwise indicated or the context requires, “DFH,” “Dream Finders Homes,” “Dream Finders,” the “Company,” “we,” “our” and “us” refer collectively to Dream Finders Homes, Inc. and its subsidiaries.
ITEM 1. BUSINESS
Company Overview
We design, build and sell homes in high-growth markets using our asset-light lot acquisition strategy. Our primary focus is on constructing and selling single-family homes across entry-level, first-time move-up, second-time move-up homes, and active adult homes. Our home offerings are marketed under various brands, including Dream Finders Homes, DF Luxury, Craft Homes, and Coventry Homes.
To fully serve our homebuyers and capture ancillary business opportunities, we have financial services operations that offer title insurance primarily through DF Title, LLC, doing business as Golden Dog Title & Trust or Golden Dog Title (“DF Title”) and mortgage banking solutions primarily through our mortgage banking joint venture, Jet HomeLoans, LP (“Jet HomeLoans”).
Since breaking ground on our first home on January 1, 2009, we have closed over 29,500 homes through December 31, 2023 and have been profitable every year since inception.
The following is a summary of our history:
2009 – Began homebuilding operations in the Jacksonville, Florida market
2013 – Entered the Savannah, Georgia market
2014 – Entered the Denver, Colorado market
2015 – Entered the Austin, Texas and Orlando, Florida markets
2017 – Entered the Washington D.C. metropolitan area, with a particular focus on the Northern Virginia and Maryland markets (“DC Metro”)
2019 – Entered the Hilton Head and Bluffton, South Carolina markets with our acquisition of Village Park Homes, LLC
2020 – Entered the Charlotte, Fayetteville, Raleigh, Piedmont Triad (consisting of Greensboro, High Point and Winston-Salem, North Carolina), Wilmington, North Carolina and Myrtle Beach, South Carolina markets with our acquisition of the homebuilding business of H&H Constructors of Fayetteville, LLC, a North Carolina limited liability company (“H&H”)
January 2021 – Expanded our presence in the Orlando, Florida market with our acquisition of Century Homes Florida, LLC
October 2021 – Significantly increased our operations in the Austin, Texas metro area and expanded into the Houston, Dallas and San Antonio, Texas markets with our acquisition of McGuyer Homebuilders, Inc. (“MHI”)
October 2023 – Entered the Tampa, Florida market
February 2024 – Entered the Charleston and Greenville, South Carolina and Nashville, Tennessee markets with our acquisition of the majority of the homebuilding assets of Crescent Ventures, LLC (“Crescent Homes”)
1
Markets
We select the geographic markets in which we operate our homebuilding business through a rigorous selection process based on our evaluation of positive population and employment growth trends, favorable migration patterns, attractive housing affordability, low state and local income taxes and desirable lifestyle and weather characteristics.
As a result of our acquisitive and organic growth, and our overall strategy to maintain agility, the management of our homebuilding operations changed from a divisional level to a regional level during the third quarter of 2023. Our operations are now organized into four reportable segments: Southeast, Mid-Atlantic, Midwest and Financial Services. Our Southeast segment consists of the homebuilding operations in Jacksonville, Orlando, and Tampa, Florida; Savannah, Georgia; Hilton Head and Bluffton, South Carolina; and our Active Adult and Custom Homes homebuilding operations in northeast Florida. Our Mid-Atlantic segment consists of our North Carolina homebuilding operations in Charlotte, Fayetteville, Raleigh, Wilmington and the Triad (consisting of Greensboro, High Point and Winston-Salem) (together, “The Carolinas”) and DC Metro. Our Midwest segment consists of our Texas homebuilding operations in Austin, Dallas, Houston and San Antonio, and our Colorado homebuilding operations in Denver. Our Financial Services segment consists of our mortgage banking and title services operations, which primarily consist of Jet HomeLoans and Golden Dog Title and Trust. The homebuilding operations of Crescent Homes will be included in our Mid-Atlantic segment in 2024. Refer to Note 9, Segment Reporting to our consolidated financial statements for more information.
Asset-Light Business Strategy
We operate an asset-light and capital-efficient lot acquisition strategy to meet our growth objectives. We generally seek to avoid engaging in land development, which requires significant capital expenditures, and can take several years to realize returns on the investment. Our asset-light lot acquisition strategy generally enables us to purchase land in a “just-in-time” manner in both new and existing markets with reduced up-front capital commitments, and, in turn, allows us to increase our inventory turnover rate, enhance our return on equity and contributes to our growth. Our strategy is intended to avoid the financial commitments and risks associated with direct land ownership and land development by allowing us to increase optionality and control a significant number of lots for a relatively low capital cost. We believe our asset-light business model reduces our balance sheet risk relative to homebuilders that own a higher percentage of their land supply. Refer to “—Land Acquisition and Development Process” and Note 6, Variable Interest Entities to our consolidated financial statements for further information.
Land Acquisition and Development Process
Locating and analyzing attractive land positions is a critical challenge for any homebuilder. We remain focused on controlling as many quality land positions as possible while minimizing up-front capital outlay. Our land selection process begins with key economic drivers, such as demographic trends and employment growth. We typically pursue opportunities more aggressively in our markets that generate the greatest returns, while proceeding more cautiously in our markets where we have plans in process to improve our operational efficiencies.
While our land selection process is driven mainly by the local division and regional leadership, the land sourcing process, including final approval to move forward with a project, is a collaboration involving corporate leadership, including our President and Chief Executive Officer. Our multilevel cooperation allows us to remain flexible to react quickly to changing markets or project-specific conditions and maximize the potential of each new land opportunity. We believe our experience, top-down emphasis on relationship-building with land market participants and collaborative involvement of local, regional and corporate management in the land sourcing and acquisition process enable us to identify the ideal developers and efficiently source and secure options to control and close acquisitions of lots to meet our growth needs while mitigating risk.
We primarily employ two variations of our asset-light strategy—finished lot option contracts and land bank option contracts—pursuant to which we secure the right to purchase finished lots at predetermined fixed contractual pricing from various land developers, land sellers and land bank partners. When a land seller desires to sell finished lots in bulk or does not wish to develop finished lots, we often enter into land bank option contracts with land bank partners who fund any required land acquisition and land development costs and sell the finished lots to us over a period of time.
2
These option contracts generally allow us, at our option, to forfeit our right to purchase the lots controlled for any reason, and our sole legal obligation and economic loss as a result of such forfeitures is limited to the amount of the deposits paid pursuant to such option contracts and, in the case of land bank option contracts, our loss is limited to the related lot option fees paid to the land bank partner, and for certain land bank option contracts, any potential performance obligations, management of the land development to completion and any cost overruns relative to the project. We provide lot deposits typically averaging 10% of the land purchase price. Lot option fees are based on the outstanding capital balance held by the land banker and often are reflective of provisions under which delays in land development and/or longer land takedown periods result in additional costs.
As of December 31, 2023, our lot deposits for finished lot option and land bank option contracts were $247 million. As of December 31, 2023, we controlled 29,748 lots under finished lot option and land bank option contracts.
In the past, we have supplemented our lot option acquisition strategies by entering into joint venture agreements with external investors to acquire, develop and control lots. Due to the profit sharing requirements of the joint venture agreements, we have transitioned from these joint venture arrangements in favor of the more profitable option contract strategies described above. Refer to Note 6, Variable Interest Entities to our consolidated financial statements for the disclosure of our remaining equity interests in these joint ventures.
Owned and Controlled Lots
The following table presents our owned finished lots purchased just-in-time for production and controlled lots through option contracts by homebuilding segment as of December 31, 2023 and 2022:
| As of December 31, | |||||||||||||||||||||||||||||
| 2023 | 2022 | ||||||||||||||||||||||||||||
Segment(1) | Owned(2)(3) | Controlled | Total(4) | Owned(3) | Controlled | Total | % Change | ||||||||||||||||||||||
| Southeast | 3,057 | 13,063 | 16,120 | 2,939 | 16,255 | 19,194 | -16 | % | |||||||||||||||||||||
| Mid-Atlantic | 1,802 | 4,795 | 6,597 | 1,766 | 14,891 | 16,657 | -60 | % | |||||||||||||||||||||
| Midwest | 2,070 | 11,890 | 13,960 | 1,238 | 6,469 | 7,707 | 81 | % | |||||||||||||||||||||
| Grand Total | 6,929 | 29,748 | 36,677 | 5,943 | 37,615 | 43,558 | -16 | % | |||||||||||||||||||||
(1)Refer to Note 9, Segment Reporting to the consolidated financial statements for further explanation of our reportable segments.
(2)As of December 31, 2023, the Company had 6,929 owned lots, of which 4,133 were included in construction in process (“CIP”) and finished homes within the Consolidated Balance Sheet. Of the 4,133 owned lots included in CIP and finished homes, 3,632 were under construction, 391 were completed spec homes and 110 were model homes. The remaining owned lots were purchased just-in-time to start construction through existing lot option contracts.
(3)As of December 31, 2023 and 2022, owned land and lots, inclusive of lot option fees, property taxes, and due diligence costs, represented 13% and 17%, respectively, of total inventories.
(4)As of December 31, 2023, the Company had 1,782 owned lots and 1,413 controlled lots under built-for-rent contracts (see “—Sales and Backlog” for a definition of built-for-rent contracts).
DF Capital Management, LLC
Controlling a sufficient supply of finished lots is an important component of our asset-light strategy. Our land team routinely underwrites potential lot acquisitions that meet our capital allocation criteria. Once our land acquisition committee approves a transaction that requires financing and meets our internal model, we will seek a land bank partner. Our primary operating subsidiary, Dream Finders Homes LLC, periodically enters into land bank arrangements with DF Capital Management, LLC, a Florida limited liability company (“DF Capital”). The Company owns a 49% membership interest in DF Capital, and a non-affiliated third party owns the remaining 51% of the membership interests in DF Capital. Refer to Note 11, Related Party Transactions to the consolidated financial statements for more information.
3
Sales and Backlog
A new order (“new sale”) is reported when a customer has received preliminary mortgage approval and the sales contract has been signed by the customer, approved by us and secured by a deposit, which generally averages approximately 9% of the purchase price of the home. These deposits are typically nonrefundable, but each customer situation is evaluated individually. Sales to third-party investors that intend to lease the homes (“built-for-rent contracts”) are reported when the Company has received a nonrefundable deposit.
Net new orders are sales of homes during the period less cancellations of existing sales contracts during the period. Our cancellation rate for a given period is calculated as the total number of new sales contracts cancelled during the period, divided by the total number of new sales contracts entered into during the period. When a cancellation occurs, we generally retain the customer deposit and resell the home to a new customer. Cancellations can occur for various reasons outside of our control, including customer credit issues or changes in other personal circumstances.
Our backlog consists of homes under contract that have not yet been delivered to a homebuyer or third-party investor. Ending backlog represents the number of homes in backlog from the previous period, plus sales of homes during the current period less cancellations of existing sales contracts during the period (“net sales”), minus the number of home closings during the current period. Our backlog at any given time will be affected by cancellations and the number of our active communities.
Homes in backlog are generally closed within one to nine months. Sustained supply chain challenges during 2022 and early 2023 have contributed to temporarily elongated cycle times impacting the Company’s backlog turnover rate. In addition, certain circumstances may impact our backlog conversion, such as built-for-rent contracts, which are customarily delivered over a longer period of time, as well as pre-sales in new communities. The Company’s backlog may be impacted by customer cancellations for various reasons that are beyond our control, and, in light of our minimal required deposit, there is little negative impact to the potential homebuyer from the cancellation of the purchase contract.
As of December 31, 2023 and 2022, ending backlog was 3,978 homes and 5,548 homes, valued at approximately $2 billion and $3 billion, respectively, based on average sales price. Homes in ending backlog are typically converted to closings in the subsequent year.
Refer to “Management’s Discussion and Analysis of Financial Condition and Results of Operations—Net Sales, Backlog and Closings” for additional information.
Products, Communities and Construction
Homes, Homebuyers and Active Communities
We offer a range of single-family homes in each of our markets, placing a primary emphasis on entry-level and first-time move-up homes. We also provide second-time move-up homes and homes in the active adult market. Price points are tailored to each of these levels. Our homebuilding business is driven by our commitment to building high-quality homes at affordable prices in attractive locations while delivering excellent customer service. Our customers enjoy the flexibility of personalizing our desirable open floor plans with a wide array of finishes and upgrades to best fit their distinctive tastes and unique needs.
A community becomes active once the model is completed or the community has its fifth net new order. A community becomes inactive when it has fewer than five units remaining to sell. Active community count is an important metric to forecast future net new orders for our business. As of December 31, 2023, we had 221 active communities, an increase of 15 communities, or 7%, when compared to 206 active communities as of December 31, 2022.
Our active community count excludes communities under the Company's built-for-rent contracts, as all sales to third-party investors occur at one point in time and these communities would have no homesites remaining to sell. As of December 31, 2023, the Company had 15 communities delivering closings under built-for-rent contracts.
4
Construction and Materials
When constructing our homes, we are dependent upon building material suppliers to provide a continuous flow of raw materials. It typically takes us between 150 and 240 days to construct a single-family home. The construction period for our custom homes is typically longer.
We have extensive experience managing construction processes without employing subcontractors directly. Instead, we rely on local and regional builder associations to identify and contract with reputable tradespeople. This approach also eliminates the need for equipment investment, as we do not employ our own construction base. Each division is led by a construction director, manager, or vice president who oversees area managers. Communities have dedicated superintendents supervising the work performed by the subcontractors. We use enterprise resource planning and integrated scheduling software for close construction progress monitoring and timely issue identification. Our software also enables our superintendents to monitor the completion of work, which, in turn, expedites payments to the subcontractors.
Our materials procurement strategy focuses on maximizing efficiency across local, regional, and national levels through established contracts and standard products from multiple suppliers, resulting in cost savings, streamlined offerings, and pre-negotiated rebates. We leverage our national presence and volume to secure better prices with manufacturers.
Our cost of sales includes the acquisition and finance costs of homesites or lots, municipality fees, the costs associated with obtaining building permits, materials and labor to construct the home, interest costs for construction loans, internal and external realtor commissions and other miscellaneous closing costs. Homesite costs range from 25-30% of the average cost of a home. Building materials range from 35-40% of the average cost to build the home, labor ranges from 25-30% of the average cost to build the home, and interest, commissions and closing costs range from 4-10% of the average cost to build the home.
Our materials are subject to price fluctuations. Once construction of a home begins, prices for the materials utilized in the construction of that particular home are generally locked via purchase orders, but fluctuations may occur as a result of market conditions. Price fluctuations may be caused by several factors, including seasonal variation in availability of materials, labor and supply chain disruptions, international trade disputes and resulting tariffs, and changes in demand for materials as a result of the housing market conditions where we operate. The price changes that most significantly influence our operations are price increases in commodities. Significant price increases of these materials may negatively impact our cost of sales and, in turn, our net income.
Customer Relations, Quality Control and Warranty Program
In our construction process, we prioritize product design, material quality, and subcontractor standards to minimize deficiencies and warranty costs. We enforce work quality standards through onboarding processes, require insurance from vendors, and conduct regular inspections. Our customer service team ensures quality assurance and positive experiences for customers from pre-sale to post-closing, utilizing feedback to enhance our standards.
We maintain professional staff dedicated to delivering excellent customer experiences, including pre-sale, construction, closing, and after-sales service. We utilize customer feedback and comprehensive home tours before closing to improve quality and satisfaction. We highly value customers' willingness to refer us, which influences our team's compensation and quality control efforts.
We provide each homeowner with product warranties covering workmanship and materials for one year from the time of home closing, and warranties covering structural systems for eight to ten years from the time of closing. Where possible, we utilize our subcontractors to repair the homes in accordance with our subcontractor agreements and as required by law. We believe our warranty program meets or exceeds terms customarily offered in the homebuilding industry.
Financial Services
By providing comprehensive mortgage and title services in markets where we operate, our Financial Services segment serves as a valuable resource to customers navigating the homebuying process and, in turn, enhances our efficiency in converting our backlog into home closings.
5
Our mortgage banking joint venture, Jet HomeLoans, offers conforming and non-conforming mortgage financing to our homebuyers. We own a 60% interest in Jet HomeLoans, and our joint venture partner, FBC Mortgage, LLC, an Orlando-based mortgage lender, owns the remaining 40% interest and performs a number of back-office functions, such as accounting, compliance and secondary marketing activities. Our interest in Jet HomeLoans is accounted for under the equity method and is not consolidated in our consolidated financial statements, as we do not control and are not deemed the primary beneficiary of the variable interest entity (“VIE”). Refer to Note 1, Nature of Business and Significant Accounting Policies, to our consolidated financial statements for a discussion of accounting treatment of VIEs.
Our wholly owned subsidiary, DF Title, is a title insurance agency licensed in multiple states that provides closing, escrow and title insurance services. DF Title primarily closes residential real estate transactions, including new home construction, resale and refinance, and commercial real estate transactions. DF Title operates in Colorado, Florida, Georgia, North Carolina, South Carolina and Texas. DF Title’s staff includes attorneys, state licensed title agents, escrow officers and experienced support staff with hundreds of years of collective closing experience. Closing, escrow and title insurance is primarily regulated at a state level, requiring that transactions be conducted by skilled attorneys and/or licensed title insurance agents. Expansion of title operations into our markets is ongoing and consideration of further expansion in our markets is driven by unit volume, average sales price for homes sold and state-level legal considerations.
Marketing and Sales
We seek to ensure that each customer’s experience exceeds their expectations by focusing on customer satisfaction and providing a unique buying experience. We provide attentive one-on-one customer service throughout the home buying process, empowering our customers with flexibility to personalize their homes, and actively soliciting feedback from all of our customers. The willingness of our customers to refer friends and family to us as homebuyers is a direct result of customer satisfaction, and we strive to ensure that each of our customers will make such referrals.
While we occasionally utilize traditional printed media to advertise directly to potential homebuyers, digital marketing is the primary component of our marketing strategy, and we have refined our digital sales efforts in recent years through the work of our dedicated digital sales coordinators. We believe our online marketing efforts have become a key strength of our business, allowing us to reach a broad range of potential homebuyers at a relatively low expense compared to traditional advertising platforms. The digital marketing methods that we employ include strategic e-marketing efforts to our current database of potential customers, internet advertising enhanced by search engine marketing and search engine optimization, and campaigns and promotions across an array of social media platforms.
We also strategically open communities in high-visibility areas that allow us to take advantage of local traffic patterns. Model homes play a significant role in our marketing efforts by not only creating an attractive atmosphere, but by also displaying options and upgrades. As the Official Homebuilder of the Jacksonville Jaguars, we maintain a fully decorated model home at the team’s stadium, which attracts thousands of fans each game day.
We are also the Official Homebuilder of the PGA TOUR. This strategic alliance provides a national marketing footprint in regions where we operate and where high-profile, annual PGA TOUR golf tournaments are held.
We sell our homes through our own sales representatives and through independent real estate brokers. We continuously work to maintain good relationships with independent real estate brokers in our markets and offer competitive programs to reward these brokers for selling our homes. Our in-house sales force typically works from sales offices located in model homes close to or in each community. Sales representatives assist potential homebuyers by providing them with floor plans, price information, development and construction timetables, tours of model homes and the home customization options that we offer. Sales representatives are trained by us and generally have prior experience selling new homes in the local market.
We believe that every home is as important as the next, regardless of price point, and that everyone deserves the ability to purchase a home that suits their needs. Accordingly, we are able to offer a range of optionality within the homebuilding process, from move-in-ready inventory homes to homes that can be tailored with additional features, including structural modifications. While most of our customers opt for inventory homes, for those seeking more options, we are able to provide access to a diverse range of materials and upgrades to cater to their specific preferences. Our architectural design team continually adapts floor plans in response to customer buying trends in various markets and collaborates with our land team to secure suitable lots for these customized plans.
6
Competition and Market Factors
The homebuilding industry is highly competitive and is characterized by relatively low barriers to entry. In the United States, we rank among the top 14 homebuilders based on both homebuilding revenues and closings, as published in the 2023 Builder 100 List reported by Builder Magazine. We compete for, among other things, homebuyers, desirable lots, financing, raw materials and skilled labor. Increased competition may prevent us from acquiring attractive lots on which to build homes or make such acquisitions more expensive, hinder our market share expansion or lead to pricing pressures on our homes that may adversely impact our margins and revenues. Our competitors may independently develop land and construct housing units that are superior or substantially similar to our products. Because our competitors are or may be significantly larger, have a longer operating history and/or have greater resources or lower cost of capital than us, they may be able to compete more effectively in one or more of the markets in which we operate or may operate in the future. We also compete with other homebuilders that have longstanding relationships with subcontractors and suppliers in the markets in which we operate or may operate in the future, and we compete for sales with individual resales of existing homes and with available rental housing.
The housing industry is cyclical and is affected by consumer confidence levels, prevailing economic conditions and interest rates. Other factors that affect the housing industry and the demand for new homes include: the availability and the cost of land, labor and materials; changes in consumer preferences; demographic trends; inflation; and the availability and interest rates of mortgage finance programs. Refer to “Risk Factors—Industry, Economic and Regulatory Risks” for additional information.
We are dependent upon building material suppliers for a continuous flow of raw materials. Whenever possible, we attempt to utilize standard products available from multiple sources. Such raw materials have been generally available to us in adequate supply.
Seasonality
In all of our markets, we have historically experienced similar variability in our results of operations and capital requirements from quarter to quarter due to the seasonal nature of the homebuilding industry. We generally sell more homes in the first and second quarters and close more homes in our third and fourth quarters. As a result, our revenue may fluctuate on a quarterly basis. Additionally, we generally have higher capital requirements in our second and third quarters in order to maintain our inventory levels. As a result of seasonal activity, our quarterly financial positions and results of operations are not necessarily representative of the financial position or results of operations we expect as of and for the respective full year-end. We expect this seasonal pattern to continue in the long-term.
Governmental Regulation and Environmental Matters
We are subject to numerous local, state, federal and other statutes, ordinances, rules and regulations concerning zoning, development, building design, construction and similar matters, which impose restrictive zoning and density requirements in order to limit the number of homes that can eventually be built within the boundaries of a particular area. Projects that are not entitled (held by our land bank financing partners), may be subjected to periodic delays, changes in use, less intensive development or elimination of development in certain specific areas due to government regulations. Local and state governments also have broad discretion regarding the imposition of development fees for projects in their jurisdiction. Projects for which we have received land use and development entitlements or approvals may still require a variety of other governmental approvals and permits during the development process and can also be impacted adversely by unforeseen health, safety and welfare issues, which can further delay these projects or prevent their development.
We are also subject to a variety of local, state, federal and other statutes, ordinances, rules and regulations concerning the environment, health and safety. Environmental requirements that apply to any given homebuilding site vary according to the location, environmental conditions, the presence or absence of endangered plants or species or sensitive habitats and the present and former uses of the site, as well as nearby or adjoining properties.
7
Our operations that provide mortgage and title services within our Financial Services segment are subject to various local, state and federal laws, statutes, ordinances, administrative rules and other regulations, including requirements for participants in programs offered by FHA, VA, USDA, Government National Mortgage Association, Federal National Mortgage Association (“Fannie Mae”) and Federal Home Loan Mortgage Corporation (“Freddie Mac”). Our title services’ practices regarding closing, escrow and issuance of title insurance are subject to rules established, in part, by state insurance regulators and underwriter guidelines. Both industries are affected by rules mandated by the Consumer Financial Protection Bureau, such as the Truth in Lending Act and the Real Estate Settlement Procedures Act Integrated Disclosure, governing matters like loan applications, disclosures and loan materials, closing, funding and issuance of title insurance policies.
Refer to “Risk Factors” for further discussion on risks related to governmental regulation and environmental matters.
Environmental, Social, and Corporate Governance (“ESG”)
During 2023, under the oversight of our Nominating and Governance Committee, we continued to prioritize our ESG focus areas. Among other things, this included collecting data from leadership within the Company regarding our home energy efficiency efforts, goals and achievements, providing increased incentives to promote home affordability, enhancing employee benefits and increasing communication with our Board of Directors regarding ESG initiatives. We are formalizing processes for measurement, mitigation, monitoring and reporting of our ESG efforts.
Human Capital Resources
As of December 31, 2023, we had 1,236 full-time employees. Of our full-time employees, 115 worked in our corporate office, 29 in divisional management and 283 in sales. None of our employees are represented by a labor union or covered under a collective bargaining agreement, and we have not experienced any strikes or work stoppages.
Our human capital resource objectives include identifying, recruiting, retaining, incentivizing and integrating our existing and new employees. We believe that investing in finding and retaining exceptional people is the most important part of our business. We believe that our connection with our employees is positive and well-regarded. We value our employees and believe that employee loyalty and enthusiasm are key elements of our operating performance. We utilize subcontractors and tradespeople to perform the construction of our homes. We value our network of subcontractors and tradespeople and believe our relationships with them are excellent.
We offer our employees compensation and an array of company-paid benefits, which we believe are competitive relative to others in our industry. Additionally, we offer retirement savings in the form of a 401(k) plan. The 401(k) plan includes matching safe harbor contributions equal to 100% of the first one percent of eligible compensation and 50% of the next five percent of eligible compensation. The Company may also make additional discretionary contributions.
The health and safety of our employees and subcontractors is our top priority. We are committed to continuously evaluating and implementing health and safety guidelines throughout the entirety of our operations to ensure the well-being of all. We provide an easily accessible safety manual to all employees, and promote an open environment for employees to report any concerns that may impact their health or safety.
Employees of the Company are required to comply with the Standards of Conduct set forth by the Company, including policies related to anti-harassment and anti-discrimination. The Company has made an ethics hotline available to all associates of the Company where they are able to report any violations of the Standards of Conduct, including violations related to the harassment or discrimination of any associate.
Available Information
We make available, as soon as reasonably practicable, on our website, www.dreamfindershomes.com, all of our reports required to be filed with the Securities and Exchange Commission (“SEC”). These reports can be found on the “Investor Relations” page of our website under “Financials & Filings—SEC Filings” free of charge and include our annual and quarterly reports on Form 10-K and 10-Q, respectively (including related filings in XBRL format), current reports on Form 8-K, beneficial ownership reports on Forms 3, 4, and 5, proxy statements and amendments to such reports. Our SEC filings are also available to the public on the SEC’s website at www.sec.gov.
We are a Delaware corporation that was incorporated on September 11, 2020. Our principal executive offices are located at 14701 Philips Highway, Suite 300, Jacksonville, Florida 32256, and our telephone number is (904)-644-7670.
8
Leadership Team and Board of Directors
Executive Officers
The following table sets forth information regarding our executive officers as of February 29, 2024:
Name | Age | Position | ||||||
Patrick O. Zalupski | 43 | President, Chief Executive Officer and Chairman of the Board of Directors | ||||||
Doug Moran | 52 | Senior Vice President and Chief Operations Officer | ||||||
L. Anabel Fernandez | 42 | Senior Vice President and Chief Financial Officer | ||||||
Executive Employees
Patrick O. Zalupski—President, Chief Executive Officer and Chairman of the Board of Directors
Patrick Zalupski has served as our President, Chief Executive Officer and has served as Chairman of the Board of Directors since 2021. He has served as the Chief Executive Officer of our primary operating subsidiary, Dream Finders Homes LLC, a Florida limited liability company (“DFH LLC”), since forming the company in December 2008, and as the Chief Executive Officer and a member of the board of managers of DFH LLC since its formation in 2014. He is responsible for our overall operations and management and is heavily involved in the origination, underwriting and structuring of all land investment activities. Under Mr. Zalupski’s leadership, we have grown from closing 27 homes in Jacksonville, Florida during our inaugural year in 2009 to establishing operations in markets across the state of Texas and the Southeast, Mid-Atlantic and Mountain Regions of the United States and closing over 29,500 homes since our inception through the end of 2023. Prior to founding DFH LLC, Mr. Zalupski was a Financial Auditor for FedEx Corporation’s Internal Audit Department in Memphis, Tennessee and worked in the real estate sales and construction industry as Managing Partner of Bay Street Condominiums, LLC from 2006 to 2008. He has served on the investment committee of DF Capital Management, LLC, a Florida limited liability company (“DF Capital”), an investment manager focused on investments in land banks and land development joint ventures to deliver finished lots to us and other homebuilders for the construction of new homes, since April 2018 and on the board of directors for our mortgage banking joint venture, Jet HomeLoans, LLC, a Florida limited liability company, since December 2017. Mr. Zalupski received a B.A in Finance from Stetson University.
J. Douglas Moran—Senior Vice President and Chief Operations Officer
Doug Moran has served as our Senior Vice President and Chief Operations Officer since our formation in September 2020, and has served as the Chief Operations Officer of DFH LLC since January 2017. He joined Dream Finders as the Division President in Northeast Florida in August 2015 while also overseeing the management and growth of our business in other markets. Mr. Moran is responsible for sales, marketing, land acquisition and development, home construction, operations and purchasing. Mr. Moran has over 20 years of broad industry experience in all aspects of operating a real estate company, including as an executive with publicly traded homebuilders and has overseen the construction of over 22,200 homes throughout his career. He previously worked at Richmond American Homes (“RAH”), a subsidiary of M.D.C. Holdings, Inc. (NYSE: MDC), from 2012 to 2015, where he served as Regional President for Florida. Prior to joining RAH, Mr. Moran worked at KB Home (NYSE: KBH) from 2007 to 2012, where he served as DC Metro Division President. Prior to joining KB Home, Mr. Moran served his first of two stints at RAH from 1997 to 2007, where he joined as a member of the Mergers & Acquisitions team that acquired two homebuilders in Florida, before ascending the ranks to become RAH’s Southeast Regional Division President. Mr. Moran received a B.S. in Business from the University of Maryland.
9
L. Anabel Fernandez—Senior Vice President and Chief Financial Officer
Anabel Fernandez joined us in 2018, serving in the position of Treasurer and Vice President and as a member of the Asset Management Committee and was appointed Interim Chief Financial Officer on October 6, 2021 and promoted to Chief Financial Officer and Senior Vice President on April 1, 2022. Ms. Fernandez has been responsible for balance sheet management, capital allocation, cash forecasting and overall supervision of our accounting and treasury functions, including overall management of our debt, compliance, and reporting for lenders, investors and shareholders. Post-IPO, Ms. Fernandez developed the Company’s Investor Relations function. Prior to joining us, Ms. Fernandez served as the Vice President of Finance for the Americas region at Macquarie Group Limited, an Australian multinational independent investment bank and financial services company, from April 2016 to May 2018, overseeing financial and internal tax reporting for over 200 U.S. legal entities in the energy, capital and credit markets space and subsequently managing the financial audit process for Macquarie Group Limited’s aircraft leasing business. Prior to joining Macquarie Group Limited, Ms. Fernandez served as the Corporate Accounting Manager at Fidelity National Financial, a provider of title insurance and settlement services to the real estate and mortgage industries, in the title insurance business from 2014 to April 2016. Ms. Fernandez started her career at Aeroflex Incorporated (NASDAQ: ARX INC), a publicly listed aerospace and defense electronics manufacturer, where she worked from 2002 to 2014. Ms. Fernandez is a Certified Public Accountant. Ms. Fernandez received a B.B.A in Accounting, Financial Economics and Economics from Lincoln Memorial University.
Board of Directors
Patrick O. Zalupski–President and Chief Executive Officer of Dream Finders Homes, Inc. and serves as Chairman of the Board of Directors.
W. Radford Lovett II–Founder, Chairman and Chief Executive Officer of TowerCom, Ltd, an owner and developer of broadcast communication towers, and TowerCom Development, LP, a developer of wireless communications infrastructure.
Megha H. Parekh–Senior Vice President and Chief Legal Officer of the Jacksonville Jaguars, a National Football League franchise.
Leonard M. Sturm–Retired audit partner of KPMG LLP (“KPMG”) after a thirty-seven year career conducting financial statement audits of primarily public companies and audits of internal controls under Section 404 of the Sarbanes-Oxley Act.
Justin Udelhofen–Private investor and former founder and Principal of Durant Partners, LLC, an investment fund that focuses on small-to-mid-capitalization equities.
William W. Weatherford–Managing partner of Weatherford Capital, which he co-founded in 2015.
ITEM 1A. RISK FACTORS
Discussions of our business and operations included in this Annual Report on Form 10-K should be read together with the risk factors set forth below. These risk factors describe various material risks and uncertainties we are or may become subject to, many of which are difficult to predict or are beyond our control. These risks and uncertainties, together with other factors described elsewhere in this Annual Report on Form 10-K, have the potential to affect our business, financial condition, results of operations, cash flows, strategies or prospects in a material and adverse manner.
The risk factors described below are those that we think may be material with regard to an investment in us, as well as certain risk factors that may be generally applicable to all business enterprises, but not all general risk factors. We are subject to the many risks that affect all or most business enterprises in the United States and our business or financial condition could be materially affected by those risks.
10
Industry, Economic and Regulatory Risks
Inflation could adversely affect our business and financial results.
The United States continues to experience inflationary conditions, which, at times, has resulted in increasing costs of land, raw materials and labor needed to operate our business. If our markets have an oversupply of homes relative to demand, we may be unable to offset any such increases in costs with corresponding higher sales prices for our homes. Inflation may also continue to accompany higher interest rates, which could adversely impact potential customers’ ability to obtain financing on favorable terms, thereby further decreasing demand. If we are unable to raise the prices of our homes to offset the increasing costs of our operations, our margins could decrease. Furthermore, if we need to lower the price of our homes to create demand, the value of our land inventory may decrease. Inflation can also raise our costs of capital and decrease our purchasing power, making it more difficult and/or more expensive to maintain sufficient funds to operate our business. Our operations may be negatively impacted by inflation due to increasing construction costs, labor and materials, as well as land acquisition financing costs. The Federal Reserve materially raised interest rates in 2022 and into the summer of 2023 (and may continue to increase interest rates in the future to further combat inflation). The elevated interest rate environment that persisted into late 2023 negatively impacted our financing costs, and in turn our gross margin.
The tightening of mortgage lending standards and mortgage financing requirements, untimely or incomplete mortgage loan originations for our homebuyers and rising mortgage interest rates could adversely affect the availability of mortgage loans for potential purchasers of our homes and thereby materially and adversely affect our business, prospects, liquidity, financial condition and results of operations.
Almost all of our customers finance their home purchases through lenders that provide mortgage financing. Mortgage interest rates have generally trended downward for the last several decades and reached historic lows in 2021, which —during that period— made the homes we sell more affordable. Mortgage interest rates increased substantially during 2022 and 2023 in response to the Federal Reserve’s actions to combat inflationary pressures, which negatively impacted consumer affordability. We cannot predict future mortgage interest rates, and, if mortgage interest rates continue to increase or remain at elevated levels for an extended period of time, whether as a result of additional action by the Federal Reserve or otherwise, the ability of prospective homebuyers to finance home purchases may be adversely affected, and, as a result, our operating results may be significantly impacted. Our homebuilding activities are dependent upon the availability of mortgage financing to homebuyers, which is expected to be impacted by continued regulatory changes and fluctuations in the risk appetites of lenders. The financial documentation, down payment amounts and income to debt ratio requirements are subject to change and could become more restrictive.
The federal government has a significant role in supporting mortgage lending through its conservatorship of Fannie Mae and Freddie Mac, both of which purchase or insure mortgage loans and mortgage loan-backed securities, and its insurance of mortgage loans through or in connection with the FHA, the VA and the USDA. FHA and VA backing of mortgage loans has been particularly important to the mortgage finance industry and to our business. Increased lending volume and losses insured by the FHA have resulted in a reduction of the FHA insurance fund. If either the FHA or VA raised their down payment requirements or lowered maximum loan amounts, our business could be materially affected. In addition, changes in governmental regulation with respect to mortgage lenders could adversely affect demand for housing.
The availability and affordability of mortgage loans, including mortgage interest rates for such loans, could also be adversely affected by a scaling back or termination of the federal government’s mortgage loan-related programs or policies.
Fannie Mae, Freddie Mac, FHA, USDA and VA backed mortgage loans have been an important factor in marketing and selling many of our homes. Given that a majority of our customers’ mortgages conform with terms established by Freddie Mac, Fannie Mae and FHA, any limitations or restrictions in the availability of, or higher consumer costs for, such government-backed financing could adversely affect our business, prospects, liquidity, financial condition and results of operations. The elimination or curtailment of state bonds to assist homebuyers could materially and adversely affect our business, prospects, liquidity, financial condition and results of operations.
11
In addition, certain current regulations impose, and future regulations may strengthen or impose new standards and requirements relating to the origination, securitization and servicing of residential consumer mortgage loans, which could further restrict the availability and affordability of mortgage loans and the demand for such loans by financial intermediaries and, as a result, adversely affect our home sales, financial condition and results of operations. Further, if, due to credit or consumer lending market conditions, reduced liquidity, increased risk retention or minimum capital level obligations and/or regulatory restrictions related to certain regulations, laws or other factors or business decisions, these lenders refuse or are unable to provide mortgage loans to our homebuyers, or increase the costs to borrowers to obtain such loans, the number of homes we close and our business, prospects, liquidity, financial condition and results of operations may be materially adversely affected.
Entry-level and first-time move-up homebuyers are the primary sources of demand for our new homes. Entry-level homebuyers are generally more affected by the availability of mortgage financing than other potential homebuyers and many of our potential move-up homebuyers must sell their existing homes in order to buy a home from us. A limited availability of suitable mortgage financing could prevent customers from buying our homes and could prevent buyers of our customers’ homes from obtaining mortgages they need to complete such purchases, either of which could result in potential customers’ inability to buy a home from us, which could have a material adverse effect on our sales, profitability, cash flows and ability to service our debt obligations.
Our industry is cyclical and adverse changes in general and local economic conditions could reduce the demand for homes and, as a result, could have a material adverse effect on us.
Our business can be substantially affected by adverse changes in general economic or business conditions that are outside of our control, including changes in short-term and long-term interest rates; employment levels and job and personal income growth; housing demand from population growth, household formation and other demographic factors; availability and pricing of mortgage financing for homebuyers; consumer confidence generally and the confidence of potential homebuyers in particular; consumer spending; financial system and credit market stability; private party and government mortgage loan programs (including changes in FHA, USDA, VA, Fannie Mae and Freddie Mac conforming mortgage loan limits, credit risk/mortgage loan insurance premiums and/or other fees, down payment requirements and underwriting standards), and federal and state regulation, oversight and legal action regarding lending, appraisal, foreclosure and short sale practices; federal and state personal income tax rates and provisions, including provisions for the deduction of mortgage loan interest payments, real estate taxes and other expenses; supply of and prices for available new or resale homes (including lender-owned homes) and other housing alternatives, such as apartments, single-family rentals and other rental housing; homebuyer interest in our current or new product designs and new home community locations; general consumer interest in purchasing a home compared to choosing other housing alternatives; interest of financial institutions or other businesses in purchasing wholesale homes; and real estate taxes. Adverse changes in these conditions may affect our business nationally or may be more prevalent or concentrated in particular submarkets in which we operate. Inclement weather, natural disasters (such as earthquakes, hurricanes, tornadoes, floods, prolonged periods of precipitation, droughts and fires), other calamities and other environmental conditions can delay the delivery of our homes and/or increase our costs. Civil unrest or acts of terrorism can also have a negative effect on our business. If the homebuilding industry experiences a significant or sustained downturn, it would materially adversely affect our business and results of operations in future years.
The potential difficulties described above can cause demand and prices for our homes to fall or cause us to take longer and incur more costs to develop the land and build our homes. We may not be able to recover these increased costs by raising prices because of market conditions. The potential difficulties described above could also lead some homebuyers to cancel or refuse to honor their home purchase contracts altogether.
Regional factors affecting the homebuilding industry in our current markets could materially and adversely affect us.
Our business strategy is focused on the acquisition of suitable land and the design, construction and sale of primarily single-family homes in residential subdivisions, including planned communities, in Florida, Texas, Tennessee, North Carolina, South Carolina, Georgia, Colorado, and the Washington, D.C. metropolitan area, which comprises Northern Virginia and Maryland. In addition, we have lot purchase contracts for the right to purchase lots at a future point in time in all of these areas. A prolonged economic downturn in the future in one or more of these areas, or a particular industry that is fundamental to one or more of these areas, particularly within Florida and Texas, our largest markets, could have a material adverse effect on our business, prospects, liquidity, financial condition and results of operations.
12
To the extent the oil and gas industry, which can be very volatile, is negatively impacted by declining commodity prices, climate change, legislation or other factors, it could result in a reduction in employment or other negative economic consequences, which could adversely impact our homebuilding revenues and activities in our Texas markets.
Moreover, certain insurance companies doing business in Florida and Texas have restricted, curtailed or suspended the issuance of homeowners’ insurance policies on single-family homes. This has both reduced the availability of hurricane and other types of natural disaster insurance in Florida and Texas, in general, and increased the cost of such insurance to prospective purchasers of homes in Florida and Texas. Mortgage financing for a new home is conditioned, among other things, on the availability of adequate homeowners’ insurance. There can be no assurance that homeowners’ insurance will be available or affordable to prospective purchasers of our homes in the Florida and Texas markets. Long-term restrictions on, or unavailability of, homeowners’ insurance in the Florida and Texas markets could have an adverse effect on the homebuilding industry in such markets in general, and on our business within such markets in particular. Additionally, the availability of permits for new homes in new and existing developments could be adversely affected by the significantly limited capacity of the schools, roads and other infrastructure in such markets.
If adverse conditions in these markets develop in the future, it could have a material adverse effect on our business, prospects, liquidity, financial condition and results of operations. Furthermore, if buyer demand for new homes in these markets decreases, home prices could decline, which would have a material adverse effect on our business.
The homebuilding industry is highly competitive and, if our competitors are more successful or offer better value to our customers, our business could decline.
We operate in a very competitive environment that is characterized by competition from a number of other homebuilders and land developers in each market in which we operate. Additionally, there are relatively low barriers to entry into our business. We compete with large national and regional homebuilding companies, some of which have greater financial and operational resources than us, and with smaller local homebuilders and land developers, some of which may have lower administrative costs than us. We may be at a disadvantage with regard to certain of our large national and regional homebuilding competitors whose operations are more geographically diversified than ours, as these competitors may be better able to withstand any future regional downturns in the housing market. Furthermore, our market share in certain of our markets may be lower as compared to some of our competitors. Many of our competitors also have longer operating histories and longstanding relationships with subcontractors and suppliers in the markets in which we operate or to which we may expand. This may give our competitors an advantage in marketing their products, securing materials and labor at lower prices and allowing their homes to be delivered to customers more quickly and at more favorable prices. We compete for homebuyers, desirable land parcels, financing, raw materials, skilled management and other labor resources, among other things. Our competitors may independently develop land and construct homes that are substantially similar to our products.
Increased competition could hurt our business, as it could prevent us from acquiring attractive land parcels on which to build homes or make such acquisitions more expensive, hinder our market share expansion and cause us to increase our selling incentives and reduce our prices. An oversupply of homes available for sale or discounting of home prices could periodically adversely affect demand for our homes in certain markets and could adversely affect pricing for homes in the markets in which we operate.
If we are unable to compete effectively in our markets, our business could decline disproportionately to our competitors, and our results of operations and financial condition could be adversely affected. We can provide no assurance that we will be able to continue to compete successfully in any of our markets.
Our inability to continue to compete successfully in any of our markets could have a material adverse effect on our business, prospects, liquidity, financial condition and results of operations.
13
Natural disasters, severe weather and adverse geologic conditions may increase costs, cause project delays and reduce consumer demand for housing, all of which could materially and adversely affect us.
Our homebuilding operations are located in many areas that are subject to natural disasters, severe weather or adverse geologic conditions. These include, but are not limited to, hurricanes, tornadoes, droughts, floods, brush fires, wildfires, prolonged periods of precipitation, landslides, soil subsidence, earthquakes and other natural disasters. For example, we operate in a number of locations in the Mid-Atlantic and Southeast that are periodically impacted by severe weather conditions and hurricanes. As a result, our operations in certain areas of Florida, Georgia and South Carolina could experience temporary disruptions and delays. Additionally, our corporate headquarters are located in Jacksonville, Florida, an area that is often impacted by severe weather events, and our operations may be substantially disrupted if our corporate headquarters are forced to close. The occurrence of any of these events could damage our land parcels and projects, cause delays in completion of our projects, reduce consumer demand for housing and cause shortages and price increases in labor or raw materials, any of which could affect our sales and profitability.
In addition to directly damaging our land or projects, many of these natural events could damage roads and highways providing access to our assets or affect the desirability of our land or projects, thereby adversely affecting our ability to market and sell homes in those areas and possibly increasing the costs of homebuilding. Furthermore, the occurrence of natural disasters, severe weather and other adverse geologic conditions has increased in recent years due to climate change and may continue to increase in the future. Climate change may have the effect of making the risks described above occur more frequently and more severely, which could amplify the adverse impact on our business, prospects, liquidity, financial condition and results of operations.
There are some risks of loss for which we may be unable to purchase insurance coverage. For example, losses associated with hurricanes, landslides, prolonged periods of precipitation, earthquakes and other weather-related and geologic events may not be insurable and other losses, such as those arising from terrorism, may not be economically insurable. A sizeable uninsured loss could materially and adversely affect our business, prospects, liquidity, financial condition and results of operations.
A major health and safety incident relating to our business could be costly in terms of potential liabilities and reputational damage.
Building sites are inherently dangerous, and operating in the homebuilding and land development industry poses certain inherent health and safety risks. Due to health and safety regulatory requirements and the number of projects we work on, health and safety performance is critical to the success of all areas of our business.
Any failure in health and safety performance may result in penalties for non-compliance with relevant regulatory requirements or litigation, and a failure that results in a major or significant health and safety incident is likely to be costly in terms of potential liabilities incurred as a result. Such a failure could generate significant negative publicity and have a corresponding impact on our reputation and our relationships with relevant regulatory agencies, governmental authorities and local communities, which in turn could have a material adverse effect on our business, prospects, liquidity, financial condition and results of operations.
Our geographic concentration could materially and adversely affect us if the homebuilding industry in our current markets should decline.
Our business strategy is focused on the design, construction and sale of single-family detached and attached homes. We do have some geographic concentration present in our operations. For instance, a significant portion of our homebuilding operations are concentrated within Florida and Texas. A prolonged economic downturn in one or more of the areas in which we operate could have a material adverse effect on our business, prospects, liquidity, financial condition and results of operations, and a disproportionately greater impact on us than other homebuilders with larger scale and more diversified operations and geographic footprint.
14
Difficulties with appraisal valuations in relation to the proposed sales price of our homes could force us to reduce the price of our homes for sale.
Each of our home sales may require an appraisal of the home’s value before closing. These appraisals are professional judgments of the market value of the property and are based on a variety of market factors. If our internal valuations of the market and pricing do not line up with the appraisal valuations, and appraisals are not at or near the agreed upon sales price, we may be forced to reduce the sales price of the home to complete the sale. These appraisal issues could have a material adverse effect on our business and results of operations.
If the market value of our inventory or controlled lot position declines, our profits could decrease and we may incur losses.
Inventory risk can be substantial for homebuilders. The market value of building lots and housing inventories can fluctuate significantly as a result of changing market conditions. In addition, inventory carrying costs can be significant and can result in losses in a poorly performing community or market. We may be required to write-down the book value of our real estate assets in accordance with accounting principles generally accepted in the United States (“GAAP”), and some of those write-downs could be material. Any material write-downs of assets could have a material adverse effect on our business, prospects, liquidity, financial condition and results of operations.
Additionally, we must continuously seek and make acquisitions of lots for expansion into new markets, as well as for replacement and expansion within our current markets, which we generally accomplish by entering into finished lot option contracts or land bank option contracts. In the event of adverse changes in economic, market or community conditions, we may cease further building activities in certain communities, restructure existing land purchase option contracts or elect not to exercise our land purchase options. Such actions would result in our forfeiture of some or all of any deposits, fees or investments paid or made in respect of such arrangements. The forfeiture of land contract deposits or inventory impairments may result in a loss that could have a material adverse effect on our profitability, stock performance, ability to service our debt obligations and future cash flows.
We are subject to warranty and liability claims arising in the ordinary course of business that can be significant.
As a homebuilder, we are subject to construction defects, product liability and home and other warranty claims, including moisture intrusion and related claims, arising in the ordinary course of business. These claims are common to the homebuilding industry and can be costly. There can be no assurance that any developments we undertake will be free from defects once completed, and any defects attributable to us may lead to significant contractual or other liabilities. Although we provide subcontractors with detailed specifications and perform quality control procedures, subcontractors may, in some cases, use improper construction processes or defective materials. Defective products used in the construction of our homes can result in the need to perform extensive repairs.
When we discover these issues, we utilize our subcontractors to repair the homes in accordance with our subcontractor agreements, our new home warranty and as required by law. We maintain and require our subcontractors to maintain general liability insurance (including construction defect and bodily injury coverage) naming the Company as an additional insured and workers’ compensation insurance and generally seek to require our subcontractors to provide a warranty to us and to defend and indemnify us for liabilities arising from their work. Therefore, any claims relating to workmanship and materials are generally the subcontractors’ responsibility.
While these indemnities and insurance policies, subject to deductibles and other coverage limits, protect us against a portion of our risk of loss from claims related to our land development and homebuilding activities, we cannot provide assurance that these indemnities and insurance policies will be adequate to address all of our home and other warranty, product liability and construction defect claims in the future, or that any potential inadequacies will not have an adverse effect on our business, financial condition or results of operations. The cost of performing such repairs (not covered by subcontractor warranty or indemnities) or litigation arising out of such issues, may be significant if we are unable to recover certain costs from subcontractors, suppliers and/or insurers. Warranty and construction defect matters can also result in negative publicity, including on social media platforms, which could damage our reputation and negatively affect our ability to sell homes.
15
Further, the coverage offered by, and the availability of, general liability insurance for completed operations and construction defects are currently limited and costly. While the Company records an estimate of warranty expense based on historical warranty costs, we cannot provide assurance that coverage will not become costlier and/or be further restricted, increasing our risks and financial exposure to claims.
Competing effectively within the mortgage banking and title service sectors may be difficult.
The competitors of our mortgage banking business include title companies and mortgage lenders, including national, regional and local mortgage banks and other financial institutions. Some of these competitors are subject to fewer governmental regulations and have greater access to capital than we do, and some of them may operate with different criteria than we do. These competitors may offer a broader or more attractive array of financing and other products and services to potential customers than we do. For these reasons, we may not be able to compete effectively in the mortgage banking and title service businesses.
Any limitation on, or reduction or elimination of, tax benefits associated with homeownership would have an adverse effect upon the demand for homes, which could be material to our business.
While tax laws generally permit significant expenses associated with homeownership, primarily mortgage interest expense and real estate taxes, to be deducted for the purpose of calculating an individual’s federal and, in many cases, state taxable income, the ability to deduct mortgage interest expense and real estate taxes for federal income tax purposes is limited. The federal government or a state government may change its income tax laws by eliminating, limiting or substantially reducing these income tax benefits without offsetting provisions, which may increase the after-tax cost of owning a new home for many of our potential homebuyers. For example, the Tax Cuts and Jobs Act, which became effective January 1, 2018, contained substantial changes to the Internal Revenue Code of 1986, as amended (the “Code”), including (i) limitations on the ability of our homebuyers to deduct property taxes, (ii) limitations on the ability of our homebuyers to deduct mortgage interest and (iii) limitations on the ability of our homebuyers to deduct state and local income taxes. Any similar future changes could also have a material adverse impact on our business, prospects, liquidity, financial condition and results of operations.
Federal income tax credits currently available to certain builders of energy-efficient new homes may not be extended by future legislation.
On August 12, 2022, the U.S. Congress passed the Inflation Reduction Act of 2022, which was signed into law on August 16, 2022. Such act extended the availability of the Code Section 45L credit for energy-efficient new homes (the “Federal Energy Credits”), which provides a tax credit of $2,000 per qualifying home ($1,600 after the benefit is deducted from cost of sales as required by the IRS) to eligible homebuilders, and made the Federal Energy Credits available for homes delivered through December 31, 2022. Additionally, the Inflation Reduction Act of 2022 also expanded the credit to eligible homebuilders, resulting in an increase from $2,000 to either $2,500 or $5,000 per qualifying home, depending on which specified energy efficiency standards are achieved, effective January 1, 2023 through December 31, 2032.
For the year ended December 31, 2022, we claimed $11 million of Federal Energy Credits. For the year ended December 31, 2023, we have estimated $3 million of Federal Energy Credits within our income tax provision. The decrease in the amount of expected Federal Energy Credits in 2023 compared to the amount claimed in 2022 was primarily due to homes delivered in 2023 that were already under construction around the time of the change in the eligibility criteria, for which modifications to fully qualify under the new standards were deemed impractical. Generally, in a given year, the Company aims to build as many energy-efficient new homes as possible.
If legislation to extend the Federal Energy Credits for periods after December 31, 2032, is not adopted, our effective income tax rates thereafter may increase and could potentially be material.
16
New and existing laws and regulations or other governmental actions may increase our expenses, limit the number of homes that we can build or delay completion of our projects.
We are subject to numerous local, state, federal and other statutes, ordinances, rules and regulations concerning zoning, development, building design, construction, accessibility, anti-discrimination and other matters, which, among other things, impose restrictive zoning and density requirements, the result of which is to limit the number of homes that can be built within the boundaries of a particular area. We may encounter issues with entitlement, not identify all entitlement requirements during the pre-development review of a project site or encounter zoning changes that impact our operations. Projects for which we have not received land use and development entitlements or approvals may be subjected to periodic delays, changes in use, less intensive development or elimination of development in certain specific areas due to government regulations. We may also be subject to periodic delays or may be precluded entirely from developing in certain communities due to building moratoriums or zoning changes. Such moratoriums generally relate to insufficient water supplies, sewage facilities, delays in utility hook-ups or inadequate road capacity within specific market areas or subdivisions. Local governments also have broad discretion regarding the imposition of development fees for projects in their jurisdiction. Projects for which we have received land use and development entitlements or approvals may still require a variety of other governmental approvals and permits during the development process and can also be impacted adversely by unforeseen health, safety and welfare issues, which can further delay these projects or prevent their development. As a result of any of these statutes, ordinances, rules or regulations, the timing of our home sales could be delayed, the number of our home sales could decline and/or our costs could increase, which could have a material adverse effect on our business, prospects, liquidity, financial condition and results of operations.
Changes in U.S. trade policies and retaliatory responses from other countries may significantly increase the costs or limit supplies of building materials and products used in our homes.
The state of relationships between other countries and the U.S. with respect to trade policies, taxes, government relations and tariffs may impact our business. For example, the federal government has in the past imposed new or increased tariffs or duties on an array of imported materials and goods that are used in connection with the construction and delivery of our homes, including steel, aluminum, lumber, solar panels and washing machines, raising our costs for these items (or products made with them), which resulted in foreign governments, including China and Canada, and the European Union responding by imposing or increasing tariffs, duties and/or trade restrictions on U.S. goods, and may consider other measures. Such trading conflicts and related escalating governmental actions that result in additional tariffs, duties and/or trade restrictions could increase our construction costs further, cause disruptions or shortages in our supply chains and/or negatively impact the U.S., regional or local economies, and, individually or in the aggregate, materially and adversely affect our business and our operating results.
We and our subcontractors are subject to environmental, health and safety laws and regulations, which may increase our costs, result in liabilities, limit the areas in which we can build homes and delay completion of our projects.
We and our subcontractors are subject to a variety of local, state, federal and other environmental, health and safety laws, statutes, ordinances, rules and regulations, including those governing storm water and surface water management, discharge and releases of pollutants and hazardous materials into the environment, including air, groundwater, subsurface and soil, remediation activities, handling of hazardous materials such as asbestos, lead paint and mold, protection of wetlands, endangered plants and species and sensitive habitats and human health and safety.
The particular environmental requirements that apply to any given site vary according to multiple factors, including the site’s location and present and former uses, its environmental conditions, the presence or absence of endangered plants or species or sensitive habitats and environmental conditions at nearby or adjoining properties.
There is no guarantee that we will be able to identify all of these considerations during any pre-acquisition or pre-development review of project sites or that such factors will not develop during our development and homebuilding activities. Environmental requirements and conditions may result in delays, may cause us to incur substantial compliance, remediation and other costs and can prohibit or severely restrict development and homebuilding activity in certain areas, including environmentally sensitive regions or areas contaminated by others before we commenced development. In addition, in those cases where an endangered or threatened plant or species is involved and agency rulemaking and litigation are ongoing, the outcome of such rulemaking and litigation can be unpredictable and, at any time, can result in unplanned or unforeseeable restrictions on, or the prohibition of development in, identified environmentally sensitive areas. In some instances, regulators from different governmental agencies do not concur on development, remedial standards or property use restrictions for a project, and the resulting delays or additional costs can be material for a given project.
17
Certain environmental laws and regulations also impose strict joint and several liability on former and current owners and operators of real property and in connection with third-party sites where parties have sent waste. As a result, we may be held liable for environmental conditions we did not create on properties we currently or formerly owned or operated, including properties we have developed, or where we sent waste. In addition, due to our wide range of historic and current ownership, operation, development, homebuilding and construction activities, we could be liable for future claims for damages as a result of the past or present use of hazardous materials, including building materials or fixtures known or suspected to contain hazardous materials, such as asbestos, lead paint and mold. A mitigation plan may be implemented during the construction of a home if a cleanup does not remove all contaminants of concern or to address a naturally occurring condition such as methane or radon. Some homebuyers may not want to purchase a home that is, or that may have been, subjected to a mitigation plan. In addition, we do not maintain separate insurance policies for claims related to hazardous materials, and insurance coverage for such claims under our general commercial liability insurance may be limited or nonexistent.
Pursuant to such environmental, health and safety laws, statutes, ordinances, rules and regulations, we are generally required to obtain permits and other approvals from applicable authorities to commence and conduct our development and homebuilding activities. These permits and other approvals may contain restrictions that are costly or difficult to comply with, or may be opposed or challenged by local governments, environmental advocacy groups, neighboring property owners or other interested parties, which may result in delays, additional costs and non-approval of our activities.
From time to time, the EPA and similar federal, state or local agencies review land developers’ and homebuilders’ compliance with environmental, health and safety laws, statutes, ordinance, rules and regulations, including those relating to the control of storm water discharges during construction. Failure to comply with such laws, statutes, ordinances, rules and regulations may result in civil and criminal fines and penalties, injunctions, suspension of our activities, remedial obligations, costs or liabilities, third-party claims for property or natural resource damages or personal injury, enforcement actions or other sanctions or additional requirements for future compliance as a result of past failures. Any such actions taken with respect to us may increase our costs and result in project delays. We expect that increasingly stringent requirements will be imposed on land developers and homebuilders in the future. We cannot assure you that environmental, health and safety laws will not change or become more stringent in the future in a manner that would not have a material adverse effect on our business, prospects, liquidity, financial condition and results of operations.
We have provided environmental indemnities to certain lenders and other parties. These indemnities obligate us to reimburse the indemnified parties for damages related to environmental matters, and, generally, there is no term or damage limitations on these indemnities.
Environmental laws and regulations relating to climate change and energy can have an adverse impact on our activities, operations and profitability and on the availability and price of certain raw materials, such as lumber, steel and concrete.
There is a growing concern from advocacy groups and the general public that the emissions of greenhouse gases and other human activities have caused, and will continue to cause, significant changes in weather patterns and temperatures and the frequency and severity of natural disasters.
Government mandates, standards and regulations enacted in response to these projected climate change impacts and concerns could result in restrictions on land development in certain areas or increased energy, transportation and raw material costs. On February 19, 2021 the United States rejoined the Paris Agreement, which requires countries to review and “represent a progression” in their intended nationally determined contributions, which set greenhouse gas emission reduction goals, every five years. A variety of new legislation may be enacted or considered for enactment at the federal, state and local levels relating to climate change and energy, including in response to the United States’ reentry into the Paris Agreement. This legislation could relate to, for example, matters such as greenhouse gas emissions control and building and other codes that impose energy efficiency standards or require energy saving construction materials. New building or other code requirements that impose stricter energy efficiency standards or requirements for building materials could significantly increase our cost to construct homes. As climate change concerns continue to grow, legislation, regulations, mandates, standards and other requirements of this nature are expected to continue to be enacted and become costlier for us to comply with.
18
Additionally, certain areas in the United States either have enacted or are considering a ban on the use of natural gas appliances and/or natural gas hookups, in new construction. Such bans, if enacted in areas in which we operate, could affect our cost to construct homes. Similarly, energy-related initiatives affect a wide variety of companies throughout the United States, and because our operations are heavily dependent on significant amounts of raw materials, such as lumber, steel and concrete, these initiatives could have an adverse impact on our operations and profitability to the extent the manufacturers and suppliers of our materials are burdened with expensive cap and trade or similar energy-related regulations or requirements.
Our mortgage banking and title services businesses may be adversely affected by changes in governmental regulation.
Changes in governmental regulation with respect to mortgage lenders and title service providers could adversely affect the financial results of this portion of our business. Our financial services businesses are subject to numerous federal, state and local laws and regulations, which, among other things: prohibit discrimination and establish underwriting guidelines; provide for audits and inspections; require appraisals and/or credit reports on prospective borrowers and disclosure of certain information concerning credit and settlement costs; establish maximum loan amounts; prohibit predatory lending practices; and regulate the referral of business to affiliated entities. In addition, our title insurance operations are also subject to applicable insurance and banking laws and regulations as well as government audits, examinations and investigations, all of which may limit our ability to provide title services to potential purchasers.
The regulatory environment for mortgage lending is complex and ever changing and has led to an increase in the number of audits, examinations and investigations in the industry. The 2008 housing downturn resulted in numerous changes in the regulatory framework of the financial services industry. More recently, in response to COVID-19, federal agencies, state governments and private lenders are proactively providing relief to borrowers in the housing market by, subject to requirements, suspending home foreclosures and granting payment forbearance, among other things. These relief measures are temporary, but these changes and others could become incorporated into the current regulatory framework. Any changes or new enactments could result in more stringent compliance standards, which could adversely affect our financial condition and results of operations and the market perception of our business. Additionally, if we are unable to originate mortgages for any reason going forward, our customers may experience significant mortgage loan funding issues, which could have a material impact on our homebuilding business and our consolidated financial statements.
Operational Risks
Our inability to successfully identify, secure and control an adequate inventory of lots at reasonable prices could adversely impact our operations.
The results of our homebuilding operations depend in part upon our continuing ability to successfully identify, control and acquire an adequate number of homebuilding lots in desirable locations. There can be no assurance that an adequate supply of homebuilding lots will continue to be available to us on terms similar to those available in the past, or that we will not be required to devote a greater amount of capital to controlling homebuilding lots than we have historically. In addition, because we employ an asset-light business model, we may have access to fewer and less attractive homebuilding lots than if we owned lots outright, like some of our competitors who do not operate under an asset-light model.
An insufficient supply of homebuilding lots in one or more of our markets, an inability of our developers to deliver finished lots in a timely fashion due to their inability to finance development activities, delays in recording deeds, conveying controlled lots as a result of government shut downs, or for other reasons, or our inability to purchase or finance homebuilding lots on reasonable terms could have a material adverse effect on our sales, profitability, ability to service our debt obligations and future cash flows. Any land shortages or any decrease in the supply of suitable land at reasonable prices could limit our ability to develop new communities or result in increased lot deposit requirements or land costs. We may not be able to pass any increased land costs to our customers, which could adversely impact our revenues, earnings and margins.
Although when the fair market value of controlled lots deviates from that of which the option contracts were originally executed, we attempt to renegotiate the terms of the option contracts to ensure that the yields are aligned with current market conditions, there is no guarantee our renegotiating efforts will be successful.
19
Increases in our cancellation rate could have a negative impact on our homebuilding revenues and gross margins.
Our backlog reflects sales contracts with customers for homes that have not yet been delivered. We have received a deposit from a homebuyer for most homes reflected in our backlog, and, generally, we have the right to retain the deposit if the homebuyer fails to comply with his or her obligations under the sales contract, subject to certain exceptions or contingencies, including as a result of state and local law, the homebuyer’s inability to sell his or her current home or, in certain circumstances, the homebuyer’s inability to obtain suitable financing. Cancellations negatively impact the number of closed homes, net new orders, homebuilding revenues and results of operations, as well as the backlog. In addition to the contingencies noted above, cancellations can result from declines or slow appreciation in the market value of homes, increases in the supply of homes available to be purchased, increased competition, higher mortgage interest rates, and adverse changes in economic conditions. Beginning in the fourth quarter of 2022 and continuing into 2023, demand further tightened in response to additional increases in mortgage rates caused by the Federal Reserve raising interest rates in response to inflationary conditions. The market's reaction to the interest rate environment negatively affected net new orders and continues to have a negative impact on the cancellation rate for the Company. Any continued increase in the level of our cancellations would have a negative impact on our business, prospects, liquidity, financial condition and results of operations. Refer to “Management’s Discussion and Analysis of Financial Condition and Results of Operations—Business Overview and Outlook” for more information.
Our business and results of operations are dependent on the availability, skill and performance of subcontractors.
We engage subcontractors to perform the construction of our homes and, in many cases, to obtain the raw materials used in constructing our homes. Accordingly, the timing and quality of our construction depend on the availability and skill of our subcontractors. While we anticipate being able to obtain sufficient materials and reliable subcontractors and believe that our relationships with subcontractors are good, we do not have long-term contractual commitments with any subcontractors, and we can provide no assurance that skilled subcontractors will continue to be available at reasonable rates and in our markets. In addition, as we expand into new markets, we typically must develop new relationships with subcontractors in such markets, and there can be no assurance that we will be able to do so in a cost-effective and timely manner, or at all. The sustained labor shortage in the United States has continued to make the engagement of subcontractors difficult. The inability to contract with skilled subcontractors at reasonable rates on a timely basis could have a material adverse effect on our business, prospects, liquidity, financial condition and results of operations.
A continued shortage of building materials or labor, or continued increases in materials or labor costs, could delay or increase the cost of home construction, which could materially and adversely affect us.
The residential construction industry experiences labor and raw material shortages from time to time, including shortages in qualified subcontractors, tradespeople and supplies of insulation, drywall, cement, steel and lumber. These labor and raw material shortages can be more severe during periods of strong demand for housing, during periods following natural disasters that have a significant impact on existing residential and commercial structures or a result of broader economic disruptions. We continue to experience labor shortages. It is uncertain whether these shortages will continue as is, improve or worsen. Further, pricing for labor and raw materials could be affected by the factors discussed above and various other national, regional, local, economic and political factors, including changes in immigration laws and trends in labor migration and tariffs. For instance, in 2023, Florida enacted legislation that will impose more stringent immigration eligibility requirements that could cause our labor shortage to worsen.
Our success in recently entered markets or those we may choose to enter in the future depends substantially on our ability to source labor and local materials on terms that are favorable to us. Our markets may exhibit a reduced level of skilled labor relative to increased homebuilding demand in these markets. In the event of shortages in labor or raw materials in such markets, local subcontractors, tradespeople and suppliers may choose to allocate their resources to homebuilders with an established presence in the market and with whom they have longer-standing relationships. Labor and raw material shortages and price increases for labor and raw materials could cause delays in and increase our costs of home construction, which in turn could have a material adverse effect on our business, prospects, liquidity, financial condition and results of operations.
20
If we are unable to develop our communities successfully or within expected time-frames, our results of operations could be adversely affected.
Although our preference is to acquire finished lots, from time to time, we may also acquire property that requires further development before we can begin building homes. When a community requires additional developments, we devote substantial time and capital in order to obtain development approvals, acquire land and construct significant portions of project infrastructure and amenities before the community generates any revenue. In addition, our land bank option contracts often include provisions under which delays in land development and/or longer land takedown periods cause us to incur additional cost. It can take several years from the time we acquire control of an undeveloped property to the time we make our first home sale on the site. Delays in the development of communities, including delays associated with subcontractors performing the development activities or entitlements, expose us to the risk of changes in market conditions for homes. A decline in our ability to develop and market one of our new undeveloped communities successfully and to generate positive cash flow from these operations in a timely manner could have a material adverse effect on our business and results of operations and on our ability to service our debt and to meet our working capital requirements. In addition, higher than expected absorption rates in existing communities may result in lower than expected inventory levels until the development for replacement communities is completed.
We may be unable to obtain suitable bonding for the development of our communities.
We are often required to provide bonds, letters of credit or guarantees to governmental authorities and others to ensure the completion of our communities. As a result of market conditions, some municipalities and governmental authorities have been reluctant to accept surety bonds and instead require credit enhancements, such as cash deposits or letters of credit, in order to maintain existing bonds or to issue new bonds. If we are unable to obtain required bonds in the future for our communities, or if we are required to provide credit enhancements with respect to our current or future bonds or in place of bonds, our business, prospects, liquidity, financial condition and results of operations could be materially and adversely affected.
We may suffer significant financial harm and loss of reputation if we do not comply, cannot comply or are alleged to have not complied with applicable laws, rules and regulations concerning our classification and compensation practices for independent contractors.
Each of our divisions retains various independent contractors, either directly or indirectly through third-party entities formed by these independent contractors for their business purposes, including, without limitation, some of our sales agents. With respect to these independent contractors, we are subject to the Internal Revenue Service (the “IRS”) regulations and applicable state law guidelines regarding independent contractor classification. These regulations and guidelines are subject to judicial and agency interpretation, and it might be determined that the independent contractor classification is inapplicable to any sales agents, vendors or any other entity characterized as an independent contractor. Further, if legal standards for the classification of independent contractors change or appear to be changing, we may need to modify our compensation and benefits structure for such independent contractors, including by paying additional compensation or reimbursing expenses.
There can be no assurance that legislative, judicial, administrative or regulatory (including tax) authorities will not introduce proposals or assert interpretations of existing rules and regulations that would change the independent contractor classification of any individual or vendor currently characterized as independent contractors doing business with us. Although management believes that there are no proposals currently pending that would significantly change the independent contractor classification, potential changes, if any, with respect to such classification could have a significant effect on our operating model. Further, the costs associated with any such potential changes could have a significant effect on our results of operations and financial condition if we were unable to pass through an increase in price corresponding to such increased costs to our customers. Additionally, we could incur substantial costs, penalties and damages, including back pay, unpaid benefits, taxes, expense reimbursement and attorneys’ fees in defending future challenges to our employment classification or compensation practices.
We could be adversely affected by efforts to impose joint employer liability on us for labor law violations committed by our subcontractors.
Our homes are constructed by employees of subcontractors and other third parties. We do not have the ability to control what these parties pay their employees or the rules they impose on their employees.
21
However, various governmental agencies have taken actions to hold parties like us responsible for violations of wage and hour laws and other labor laws by subcontractors. Governmental rulings that hold us responsible for labor practices by our subcontractors could create substantial exposures for us under our subcontractor relationships, which could have a material adverse impact on our business, prospects, liquidity, financial condition and results of operations.
Poor relations with the residents of our communities could negatively impact sales, which could cause our revenues or results of operations to decline.
Residents of communities we develop rely on us to resolve issues or disputes that may arise in connection with the operation or development of their communities. Efforts made by us to resolve these issues or disputes could be deemed unsatisfactory by the affected residents, and subsequent actions by these residents could adversely affect our sales or our reputation. In addition, we could be required to make material expenditures related to the settlement of such issues or disputes or to modify our community development plans, which could adversely affect our results of operations.
Strategic and Financial Risks
Our future success depends upon our ability to successfully adapt our business strategy to changing home buying patterns and trends.
Future home buying patterns and trends could reduce the demand for our homes and, as a result, could have a material adverse effect on our business and results of operations. Part of our business strategy is to offer homes that appeal to a broad range of entry-level and move-up homebuyers based in each local market in which we operate. However, given the significant increases in average home sales prices across our markets and the anticipated increased demand for more affordable homes due to generational shifts, changing demographics and other factors, we have increased our focus on offering more affordable housing options in our markets. We believe that, due to anticipated generational shifts, changing demographics and other factors, the demand for more affordable homes will increase.
We cannot make any assurances that our growth or expansion strategies will be successful, and we may incur a variety of costs to engage in such strategies, including through targeted acquisitions, and the anticipated benefits may never be realized.
We have expanded our business through selected investments in new geographic markets and by diversifying our products in certain markets. Investments in land, developed lots and home inventories can expose us to risks of economic loss and inventory impairments if housing conditions weaken or we are unsuccessful in implementing our growth strategies. Our long-term success and growth strategies depend in part upon continued availability of suitable land at acceptable prices. The availability of land, lots and home inventories for purchase at favorable prices depends on a number of factors outside of our control. We may compete for available land with entities that possess significantly greater financial, marketing and other resources. In addition, some state and local governments in markets where we operate have approved, and others may approve, slow-growth or no-growth initiatives and other ballot measures that could negatively impact the availability of land and building opportunities within those areas. Approval of these initiatives could adversely affect our ability to build and sell homes in the affected markets and/or could require the satisfaction of additional administrative and regulatory requirements, which could result in slowing the progress or increasing the costs of our homebuilding operations in these markets. Finally, our ability to begin new projects could be negatively impacted if we elect not to purchase land under our land banking option contracts.
We intend to grow our operations in existing markets, and we may expand into new markets or pursue opportunistic purchases of other homebuilders on attractive terms as such opportunities arise. We may be unable to achieve the anticipated benefits of any such growth or expansion, including through targeted acquisitions or through efficiencies that we may be unable to achieve, the anticipated benefits may take longer to realize than expected, or we may incur greater costs than expected in attempting to achieve the anticipated benefits. In such cases, we will likely need to employ additional personnel or consultants that are knowledgeable about such markets. There can be no assurance that we will be able to employ or retain the necessary personnel to successfully implement a disciplined management process and culture with local management, that our expansion operations will be successful or that we will be able to successfully integrate any acquired homebuilder. This could disrupt our ongoing operations and divert management resources that would otherwise focus on developing our existing business.
22
We may develop more communities in which we build townhomes in addition to single-family homes or sell homes to investors or portfolio management companies under built-for-rent or other purposes. We can give no assurance that we will be able to successfully identify, acquire or implement these new strategies in the future. Accordingly, any such expansion, including through acquisitions, could expose us to significant risks beyond those associated with operating our existing business and may adversely affect our business, prospects, liquidity, financial condition and results of operations.
We may not be able to complete or successfully integrate our recent acquisitions or any potential future acquisitions or experience challenges in realizing the expected benefits of each such acquisition.
From time-to-time, we acquire other businesses to expand our presence in new and existing geographic markets. We may not be able to successfully finance or integrate any businesses that we acquire. Furthermore, the integration of any acquisition may divert management’s time and resources from our core business and disrupt our operations. Moreover, even if we were successful in integrating newly acquired businesses or assets, expected synergies or cost savings may not materialize, resulting in lower than expected benefits to us from such transactions. We may spend time and money on projects that do not increase our revenue. Additionally, when making acquisitions, it may not be possible for us to conduct a detailed investigation of the nature of the business or assets being acquired, for instance, due to time constraints in making the decision and other factors. We may become responsible for additional liabilities or obligations not foreseen at the time of an acquisition. To the extent we pay the purchase price of an acquisition in cash, such an acquisition would reduce our cash reserves, and, to the extent the purchase price of an acquisition is paid with our stock, such an acquisition could be dilutive to our stockholders. To the extent we pay the purchase price of an acquisition with proceeds from incurring debt, such an acquisition would increase our level of indebtedness and interest expense and could negatively affect our liquidity and restrict our operations.
Further, to the extent that a portion of the purchase price of an acquisition is paid in the form of an earn out on future financial results, the success of such an acquisition will not be fully realized by us for a period of time as it is shared with the sellers. In addition, changes to the fair value of estimated earn out payments could significantly impact our results of operations. All of the above risks could have a material adverse effect on our business, prospects, liquidity, financial condition and results of operations.
Our joint venture investments could be adversely affected by our lack of sole decision-making authority, our reliance on the financial condition of our joint venture partners and disputes between us and our joint venture partners.
We have in the past, and may in the future, co-invest with third parties through partnerships, joint ventures or other entities, acquiring noncontrolling interests in, or sharing responsibility for managing the affairs of, a land acquisition and/or a development. In this event, we would not be in a position to exercise sole decision-making authority regarding the acquisition and/or development, and our investment may be illiquid due to our lack of control. Investments in partnerships, joint ventures or other entities may, under certain circumstances, involve incremental risks from involving a third party, including the possibility that our joint venture partners might become bankrupt, fail to fund their share of required capital contributions, make poor business decisions or block or delay necessary decisions. Our joint venture partners may have economic or other business interests or goals that are inconsistent with our business interests or goals and may be in a position to take actions contrary to our policies or objectives. Such investments may also have the potential risk of impasses on decisions, such as a sale, because neither we nor our joint venture partners would have full control over the land acquisition or development. Disputes between us and our joint venture partners may result in litigation or arbitration that would increase our expenses and prevent our officers and/or directors from focusing their time and effort on our business. In addition, we may be liable for the actions of our joint venture partners in certain circumstances.
23
There are various potential conflicts of interest in our relationship with DF Capital and certain of its managed funds, including with certain of our executive officers and directors who are investors in certain funds managed by DF Capital, which could result in decisions that are not in the best interest of our stockholders.
Conflicts of interest may exist or could arise in the future with DF Capital and certain of its managed funds, including with certain of our executive officers and directors who are also investors in certain funds managed by DF Capital. Once a potential lot acquisition that requires a significant upfront commitment of capital is approved by our land acquisition committee, we seek a land bank partner. Historically, we have provided, and we expect to continue to provide DF Capital with the opportunity to have one of its managed funds participate in transactions that require additional funding. Such transactions may not be on terms that are as attractive as those we might be able to achieve if we sought other partners. If DF Capital does not wish to participate in and finance the transaction, we turn to other potential financing sources. Conflicts with DF Capital and certain of its managed funds may include, without limitation: conflicts arising from the enforcement of agreements between us and DF Capital and/or certain of its managed funds; conflicts in determining whether to offer DF Capital the opportunity to participate in a potential lot acquisition financing; if DF Capital does participate, conflicts in determining the terms of the financing; and conflicts in future transactions that we may pursue with DF Capital and/or one of its managed funds.
Interest expense on debt we incur may limit our cash available to fund our growth strategies.
If our operations do not generate sufficient cash from operations at levels currently anticipated, we may seek additional capital in the form of debt financing. Our current indebtedness includes, and any additional indebtedness we subsequently incur may have, a floating rate of interest.
Higher interest rates could increase debt service requirements on our current floating rate indebtedness, and on any floating rate indebtedness we subsequently incur, and could reduce funds available for operations, future business opportunities or other purposes. If we need to repay existing indebtedness during periods of rising interest rates, we could be required to refinance our then-existing indebtedness on unfavorable terms or liquidate one or more of our assets to repay such indebtedness at times that may not permit realization of the maximum return on such assets and could result in a loss. The occurrence of either such event or both could materially and adversely affect our cash flows and results of operations.
Our ability to access and obtain capital in the future could be adversely affected as a result of a downgrade in any of our credit ratings.
Our ability to access and obtain financing on favorable terms is a key component of the Company’s operating capacity. If negative rating actions, including downgrades, were to occur for either the Company’s corporate credit rating or the credit ratings for our senior unsecured notes, it could impact our access to new debt or result in less-than-favorable terms for any future debt obtained, such as harsher covenants, increased cost to obtain new debt and higher interest rates. Either scenario could result in a material adverse effect on liquidity, financial condition and results of operations, which could serve to further compound negative rating actions and their effects on our business.
Our current financing arrangements contain, and our future financing arrangements likely will contain, restrictive covenants.
Our current financing agreements contain, and the financing arrangements we enter into in the future likely will contain, covenants that limit our ability to do certain things. For instance, our credit agreement requires the Company to meet certain financial ratios and comply with covenants, such as a maximum debt to capitalization ratio, minimum interest coverage ratios and minimum liquidity ratios. Furthermore, the Company issued senior unsecured notes in August 2023 which were issued pursuant to an indenture (the “Indenture”). In addition to customary events of default, the Indenture contains certain restrictive covenants that, among other things, limit our ability to incur or guarantee certain indebtedness, issue certain equity interests or engage in certain capital stock transactions, and impose constraints concerning mergers, consolidations, and asset transfers.
If we fail to meet or satisfy any of these provisions, we would be in default under such financing agreement and our lenders could elect to declare outstanding amounts due and payable and terminate their commitments. A default also could significantly limit our financing alternatives, which could cause us to curtail our investment activities and/or dispose of assets when we otherwise would not choose to do so. In addition, future indebtedness we obtain may contain financial covenants limiting our ability to, for example, incur additional indebtedness, make certain investments, reduce liquidity below certain levels and pay dividends to our stockholders and otherwise affect our operating policies.
24
If we default on one or more of our debt agreements, it could have a material adverse effect on our business, prospects, liquidity, financial condition and results of operations.
Adverse developments affecting financial institutions, including bank failures, could adversely affect our liquidity and financial performance.
We have undrawn committed funding from numerous financial institutions under our syndicated revolving line of credit. Additionally, we may hold domestic cash deposits in Federal Deposit Insurance Corporation (“FDIC”) insured banks which exceed the FDIC insurance limits. Bank failures, events involving limited liquidity, defaults, non-performance, or other adverse developments that affect financial institutions, or concerns or rumors about such events, may lead to liquidity constraints. The failure of banks, or other adverse conditions in the financial or credit markets impacting financial institutions at which we maintain balances, or have undrawn commitments under our revolving line of credit, could adversely impact our liquidity and financial performance. There can be no assurance other financial institutions would provide replacement commitments under our line of credit or that our deposits in excess of the FDIC or other comparable insurance limits will be backstopped by the U.S. or that any bank or financial institution with which we do business will be able to obtain needed liquidity from other banks, government institutions, or by acquisition in the event of a failure or liquidity crisis. Adverse developments affecting financial institutions, including bank failures, could adversely affect our liquidity and financial performance.
Volatility in the credit and capital markets may impact our cost of capital and our ability to access necessary financing and the difficulty in obtaining sufficient capital could prevent us from acquiring lots for construction or increase costs and delays in the completion of our homes under construction.
If we require working capital greater than that provided by our operations and our credit facilities, we may be required to increase the amount available under the facilities or to seek alternative financing, which might not be available on terms that are favorable or acceptable or at all. If we are required to seek financing to fund our working capital requirements, volatility in credit or capital markets may restrict our flexibility to successfully obtain additional financing on terms acceptable to us, or at all. If we are at any time unsuccessful in obtaining sufficient capital to fund our planned homebuilding expenditures, we may experience a substantial delay in the completion of homes then under construction, or we may be unable to control or purchase finished lots. Any delay could result in cost increases and could have a material adverse effect on our sales, profitability, stock performance, cash flows and ability to service our debt obligations. We have access to the committed funds under our Credit Agreement, which is a senior unsecured revolving credit facility. Another source of liquidity includes our ability to use letters of credit and surety bonds. These letters of credit and surety bonds relate to certain performance-related obligations and serve as security for certain land option contracts. The majority of these letters of credit and surety bonds are in support of our land development and construction obligations to various municipalities, other government agencies and utility companies related to the construction of roads, sewers and other infrastructure. As of December 31, 2023, we had outstanding letters of credit and surety bonds totaling $1 million and $195 million, respectively. These letters of credit and surety bonds are generally subject to certain financial covenants and other limitations.
If we are unable to obtain letters of credit or surety bonds when required, or the conditions imposed by issuers increase significantly, our liquidity and results of operations could be adversely affected.
Access to financing sources may not be available on favorable terms, or at all, especially in light of current market conditions, which could adversely affect our ability to maximize our returns.
Our access to additional third-party sources of financing will depend, in part, on:
•general market conditions;
•the current interest rates;
•the market’s perception of our growth potential;
•with respect to land acquisition and/or development financing, the market’s perception of the value of the land parcels to be acquired and/or developed;
•our current debt levels;
25
•our current and expected future earnings;
•our cash flow; and
•the market price per share of our common stock.
The global credit and equity markets and the overall economy can be extremely volatile, which could have a number of adverse effects on our operations and capital requirements. For the past decade, the domestic financial markets have experienced a high degree of volatility, uncertainty and, during certain periods, tightening of liquidity in both the high yield debt and equity capital markets, resulting in certain periods when new capital has been both more difficult and more expensive to access. If we are unable to access the credit markets, we could be required to defer or eliminate important business strategies and growth opportunities in the future. In addition, if there is prolonged volatility and weakness in the capital and credit markets, potential lenders may be unwilling or unable to provide us with financing that is attractive to us or may increase collateral requirements or may charge us prohibitively high fees in order to obtain financing. Consequently, our ability to access the credit market in order to attract financing on reasonable terms may be adversely affected. Investment returns on our assets and our ability to make acquisitions could be adversely affected by our inability to secure additional financing on reasonable terms, if at all.
Depending on market conditions at the relevant time, we may have to rely more heavily on additional equity financings or on less efficient forms of debt financing that require a larger portion of our cash flow from operations, thereby reducing funds available for our operations, future business opportunities and other purposes. We may not have access to such equity or debt capital on favorable terms at the desired times, or at all.
Risks Related to Our Organization and Structure
We depend on key management personnel and other experienced employees.
Our success depends to a significant degree upon the contributions of certain key management personnel, including, but not limited to, Patrick Zalupski, our founder, President, Chief Executive Officer and Chairman of the Board of Directors, our Senior Vice President and Chief Operating Officer, Doug Moran, and our Senior Vice President and Chief Financial Officer, Anabel Fernandez. Although we have entered into employment agreements with Mr. Zalupski, Mr. Moran and Ms. Fernandez, there is no guarantee that Mr. Zalupski, Mr. Moran or Ms. Fernandez will remain employed by us. Our ability to retain our key management personnel or to attract suitable replacements should any members of our management team leave is dependent on the competitive nature of the employment market. The loss of services from key management personnel or a limitation in their availability could materially and adversely impact our business, prospects, liquidity, financial condition and results of operations. Further, such a loss could be negatively perceived in the capital markets. We have obtained key man life insurance that would provide us with proceeds in the event of the death or disability of the Chief Executive Officer and/or the Chief Operating Officer.
Experienced employees in the homebuilding, land acquisition, development and construction industries are fundamental to our ability to generate, obtain and manage opportunities. In particular, local knowledge and relationships are critical to our ability to source attractive land acquisition opportunities. Experienced employees working in the homebuilding, development and construction industries are highly sought after. Failure to attract and retain such personnel or to ensure that their experience and knowledge is not lost when they leave the business through retirement, redundancy or otherwise may adversely affect the standards of our service and may have an adverse impact on our business, prospects, liquidity, financial condition and results of operations.
Mr. Zalupski owns a significant amount of our stock and his interests may conflict with those of our other stockholders.
Our common stock consists of two classes: Class A and Class B. Holders of Class A common stock are entitled to one vote per share, and holders of Class B common stock are entitled to three votes per share. Holders of Class A common stock and Class B common stock vote together as a single class on all matters presented to our stockholders for their vote or approval, except as otherwise required by applicable law or our certificate of incorporation. Mr. Zalupski, our founder, President, Chief Executive Officer and Chairman of the Board of Directors, owns, through personal holdings and an entity that he controls, 100% of our Class B common stock (representing approximately 85% of the total combined voting power of our Class A and Class B common stock as of December 31, 2023).
26
As a result, Mr. Zalupski is able to control matters requiring stockholder approval, including the election and removal of directors, changes to our organizational documents and significant corporate transactions, including any merger, consolidation or sale of all or substantially all of our assets. This concentration of ownership makes it unlikely that any holder or group of holders of our Class A common stock will be able to affect the way we are managed or the direction of our business. The interests of Mr. Zalupski with respect to matters potentially or actually involving or affecting us, such as future acquisitions, financings and other corporate opportunities and attempts to acquire us, may conflict with the interests of our other stockholders. Mr. Zalupski would have to approve any potential acquisition of us. The existence of significant stockholders may have the effect of deterring hostile takeovers, delaying or preventing changes in control or changes in management or limiting the ability of our other stockholders to approve transactions that they may deem to be in our best interests. Mr. Zalupski’s concentration of stock ownership may also adversely affect the trading price of our Class A common stock to the extent investors perceive a disadvantage in owning stock of a company with significant stockholders.
Sales of shares pledged for margin loans by our directors and officers could cause our stock price to decrease.
Under the Dream Finders Homes, Inc. Insider Trading Policy (“our Insider Trading Policy”), our directors, officers and employees can pledge shares of our common stock as collateral for a loan or hold shares of our common stock in a margin account if the value of Company securities held in one or more margin accounts does not exceed 30% of the total value of all of the Company securities owned by the shareholder at the time such loan or loans (individually or in the aggregate) are originated and the director, officer or employee obtains pre-clearance from the designated compliance officer. As of December 31, 2023, Mr. Zalupski had 17,500,000 shares of our Class B common stock pledged as security for a margin loan. In the event that such margin loan (or any other margin loan by an officer or director) were to be called and the shares of common stock were sold on the open market by the lender, the price of our common stock would likely decline materially.
Certain of our directors have significant duties with, and spend significant time serving, entities that may compete with us in seeking acquisitions and business opportunities and, accordingly, may have conflicts of interest in pursuing business opportunities.
Certain of our directors hold positions of responsibility with other entities whose businesses are involved in certain aspects of the real estate industry, including in DF Capital, with which we partner for certain land banking opportunities. These directors may become aware of business opportunities that may be appropriate for presentation to us, as well as to the other entities with which they are or may become affiliated. Due to these existing and potential future affiliations, they may present potential business opportunities to other entities prior to presenting them to us, which could cause additional conflicts of interest. They may also decide that certain opportunities are more appropriate for other entities with which they are affiliated, and, as a result, they may elect not to present those opportunities to us. These conflicts of interest may not be resolved in our favor.
Our amended and restated certificate of incorporation designates the Court of Chancery of the State of Delaware as the sole and exclusive forum for certain types of actions and proceedings that may be initiated by our stockholders, which could limit our stockholders’ ability to obtain a favorable judicial forum for disputes with us or our directors, officers, employees or agents.
Our amended and restated certificate of incorporation provides that, unless we consent in writing to the selection of an alternative forum, the Court of Chancery of the State of Delaware will, to the fullest extent permitted by applicable law, be the sole and exclusive forum for (i) any derivative action or proceeding brought on our behalf, (ii) any action asserting a claim of breach of a fiduciary duty owed by any of our directors, officers, employees or agents to us or our stockholders, (iii) any action asserting a claim arising pursuant to any provision of the Delaware General Corporation Law, our amended and restated certificate of incorporation or our bylaws or (iv) any action asserting a claim against us that is governed by the internal affairs doctrine, in each such case subject to such Court of Chancery having personal jurisdiction over the indispensable parties named as defendants therein. Any person or entity that purchases or otherwise acquires any interest in shares of our capital stock are deemed to have notice of, and consented to, the provisions of our amended and restated certificate of incorporation described in the preceding sentence. This choice of forum provision may limit a stockholders’ ability to bring a claim in a judicial forum that it finds favorable for disputes with us or our directors, officers, employees or agents, which may discourage such lawsuits against us and such persons.
27
Alternatively, if a court were to find these provisions of our amended and restated certificate of incorporation inapplicable to, or unenforceable in respect of, one or more of the specified types of actions or proceedings, we may incur additional costs associated with resolving such matters in other jurisdictions, which could adversely affect our business, financial condition or results of operations.
Provisions in our charter documents or Delaware law, as well as Mr. Zalupski’s beneficial ownership of all of our outstanding Class B common stock, could discourage acquisition bids or merger proposals, which may adversely affect the market price of our Class A common stock.
Some provisions of our amended and restated certificate of incorporation and amended and restated bylaws could make it more difficult for a third party to acquire control of us, even if the change of control would be beneficial to our stockholders, including:
•providing that the Board of Directors is expressly authorized to determine the size of our Board of Directors;
•limiting the ability of our stockholders to call special meetings;
•establishing advance notice provisions for stockholder proposals and nominations for elections to the Board of Directors to be acted upon at meetings of stockholders;
•providing that the Board of Directors is expressly authorized to adopt, or to alter or repeal, our bylaws; and
•establishing advance notice and certain information requirements for nominations for election to our Board of Directors or for proposing matters that can be acted upon by stockholders at stockholder meetings.
Mr. Zalupski, through his beneficial ownership of all of our outstanding Class B common stock as of December 31, 2023, controls approximately 85% of the total combined voting power of our outstanding Class A and Class B common stock, which gives him the ability to prevent a potential takeover of our company. If a change of control or change in management is delayed or prevented, the market price of our Class A common stock could decline.
In addition, some of the restrictive covenants contained in our various financing agreements may delay or prevent a change in control.
We are a “controlled company” within the meaning of the New York Stock Exchange rules, which allows us to rely on exemptions from certain corporate governance requirements.
Mr. Zalupski beneficially owns a majority of our outstanding voting interests. As a result, we are a “controlled company” within the meaning of the New York Stock Exchange (“NYSE”) corporate governance standards. Under the NYSE rules, a company of which more than 50% of the voting power is held by another person or group of persons acting together is a “controlled company” and may elect not to comply with certain NYSE corporate governance requirements, including the requirements that:
•a majority of such company’s board of directors consist of independent directors;
•such company have a nominating and governance committee that is composed entirely of independent directors;
•such company have a compensation committee that is composed entirely of independent directors; and
•such company conduct an annual performance evaluation of the nominating and governance and compensation committees.
These requirements will not apply to us as long as we remain a controlled company. Accordingly, the same protections afforded to stockholders of companies that are subject to all of the NYSE corporate governance requirements are not afforded to our Class A common stockholders.
28
The dual class structure of our common stock may adversely affect the trading market for our Class A common stock.
We cannot predict whether our dual class structure, combined with the concentrated control of Mr. Zalupski, will result in a lower or more volatile market price of our Class A common stock, or in adverse publicity or other adverse consequences. In the past, some index providers have announced restrictions on including companies with multiple class share structures in certain of their indices, although in some instances, those restrictions have been reversed. For example, in April 2023, S&P Down Jones Indices announced that companies with multiple share class structures will be considered eligible for certain indices.
While other indices have also reversed course on multi-class stock restrictions and/or bans, we cannot predict whether indices will reinstate or announce such policies in the future, making us ineligible for inclusion in certain indices. Given the sustained flow of investment funds into passive strategies that seek to track certain indices, exclusion from certain stock indices would likely preclude investment by many of these funds and would make our Class A common stock less attractive to other investors. As a result, the trading price and volume of our Class A common stock could be adversely affected.
We have not declared or paid cash dividends on our Class A common stock and we cannot assure that cash dividends will be paid.
Consequently, a return may only be achieved on an investment if the price of the Class A common stock appreciates and the Class A common stock is sold at a price greater than what was paid for it. There is no guarantee that the price of the Class A common stock that will prevail in the market will ever exceed the price that was paid.
If securities or industry analysts do not publish research or reports about our business, they adversely change their recommendations regarding our Class A common stock or our operating results do not meet their expectations, our stock price could decline.
The trading market for our Class A common stock will be influenced by the research and reports that industry or securities analysts publish about us or our business. If one or more of these analysts cease coverage of our company or fail to publish reports on us regularly, we could lose visibility in the financial markets, which in turn could cause our stock price or trading volume to decline. Moreover, if one or more of the analysts who cover our company downgrades our Class A common stock, or if our operating results do not meet their expectations, our stock price could decline.
Our share buyback program that was approved by the Board in June 2023 could affect our stock price and increase its volatility, and may reduce the market liquidity for our stock. The share buyback program may also materially impact the Company’s liquidity.
Repurchases pursuant to the share buyback program entered into in June 2023, or any other share buyback program we adopt in the future, could affect our stock price and increase its volatility and may reduce the market liquidity for our stock. The existence of a share buyback program could also cause our stock price to be higher than it would be in the absence of such a program. Additionally, these repurchases will diminish our cash and may subject us to additional taxes, which could impact our ability to pursue possible future strategic opportunities and acquisitions and would result in lower overall returns on our cash balances. There can be no assurance that any share repurchases will, in fact, occur, or, if they occur, that they will enhance stockholder value. Although share buyback programs are intended to enhance long-term stockholder value, short-term stock price fluctuations could reduce the effectiveness of these repurchases.
29
Our Class A and B common stock rank junior to our convertible preferred stock with respect to dividends and amounts payable in the event of our liquidation, dissolution or winding-up of our affairs.
On September 29, 2021, we sold 150,000 shares of convertible preferred stock with an initial liquidation preference of $1,000 per share, for an aggregate purchase price of $150 million. Our Class A and B common stock rank junior to our convertible preferred stock, with respect to the payment of dividends and amounts payable in the event of our liquidation, dissolution or winding-up of our affairs. Upon our liquidation, dissolution or winding up, each share of convertible preferred stock will be entitled to receive an amount per share equal to the initial liquidation preference of $1,000 per share, subject to adjustment, plus all accrued and unpaid dividends thereon, which dividends accrue at a rate of 9% per annum. No distribution of our assets may be made to holders of our Class A and B common stock until we have paid to holders of our convertible preferred stock such liquidation preference. In addition, as a holding company, we are dependent on cash distributions from Dream Finders Homes Holdings, LLC (“DFH LLC”) and, thus, our ability to cover our expenses, all applicable taxes payable and dividends, if any, declared by us depends on DFH LLC’s ability first to satisfy its obligations to its creditors and make distributions to holders of the Series B preferred units of DFH LLC and then to us.
Shares of our convertible preferred stock are convertible into shares of our Class A common stock in certain circumstances and, upon conversion, will dilute common stock shareholders’ percentage of ownership.
Subsequent to the fifth anniversary of its issuance (or earlier in the event of our non-compliance with a protective covenant), a holder can convert the convertible preferred stock into shares of Class A common stock at a conversion price that will be based on the average of the last reported sales price of the Company’s Class A common stock for the ninety trading days immediately preceding but not including the date of the Optional Conversion Notice (as defined in the certificate of designations for the convertible preferred stock), less 20% of the aforementioned average (increasing to 25% in the event of non-compliance with a protective covenant) and subject to a floor conversion price of $4.00. Although we intend to call the shares of convertible preferred stock for redemption prior to their conversion, in the event the shares of convertible preferred stock are converted into shares of Class A common stock, such issuance will cause substantial dilution to the holders of our common stock.
Certain rights of the holders of the convertible preferred stock could delay or prevent an otherwise beneficial takeover or takeover attempt of us.
Certain rights of the holders of the convertible preferred stock could make it more difficult or more expensive for a third party to acquire us. If we undergo a Change of Control (as defined in the certificate of designations for the convertible preferred stock), we must redeem all of the shares of convertible preferred stock for cash consideration equal to the initial liquidation preference of $1,000 per share, subject to adjustment, plus all accrued and unpaid dividends thereon, plus if the Change of Control occurs before the fourth anniversary of the date of issuance, a premium equal to the dividends that would have accumulated on such share from and after the date of the Change of Control and through the fourth anniversary of the date of issuance of the convertible preferred stock.
If we fail to maintain an effective system of internal controls, we may not be able to accurately determine our financial results or prevent fraud. As a result, our stockholders could lose confidence in our financial results, which could materially and adversely affect us.
Effective internal controls are necessary for us to provide reliable financial reports and effectively prevent fraud. There is no assurance that material weaknesses or significant deficiencies in internal controls will not be identified in the future or that we will be successful in adequately remediating any such material weaknesses and significant deficiencies. We may in the future discover areas of our internal controls that need improvement. We have had material weaknesses in our internal controls in the past and we cannot be certain that we will be successful in maintaining adequate internal control over our financial reporting and financial processes in the future. Furthermore, as we grow our business, including through acquisitions, our internal controls will become more complex, and we will require significantly more resources to ensure our internal controls remain effective. The existence of any material weakness or significant deficiency would require management to devote significant time and incur significant expense to remediate any such material weaknesses or significant deficiencies, and management may not be able to remediate any such material weaknesses or significant deficiencies in a timely manner. The existence of any material weakness in our internal control over financial reporting could also result in errors in our financial statements that could require us to restate our financial statements, cause us to fail to meet our reporting obligations, subject us to investigations from regulatory authorities or cause stockholders to lose confidence in our reported financial information, all of which could materially and adversely affect us.
30
General Risk Factors
Information system failures, cyber incidents or breaches in security could adversely affect us.
We rely on accounting, financial, operational, management and other information systems to conduct our operations. Our information systems are subject to damage or interruption from power outages, computer and telecommunication failures, computer viruses, security breaches, including malware and phishing, cyberattacks, natural disasters, usage errors by our employees and other related risks. Any cyber incident or attack or other disruption or failure in these information systems, or other systems or infrastructure upon which they rely, could adversely affect our ability to conduct our business and could have a material adverse effect on our business, prospects, liquidity, financial condition and results of operations. Furthermore, any failure or security breach of information systems or data could result in a violation of applicable privacy and other laws, significant legal and financial exposure, damage to our reputation or a loss of confidence in our security measures, which could harm our business and could have a material adverse effect on our business, prospects, liquidity, financial condition and results of operations. Although we have implemented systems and processes intended to secure our information systems, there can be no assurance that our efforts to maintain the security and integrity of our information systems will be effective or that future attempted security breaches or disruptions would not be successful or damaging.
Presently, we employ a limited array of both traditional and generative artificial intelligence (“AI”) solutions for specific sales, administrative, and operational functions, including aiding in the drafting of disclosures subject to management review. It is conceivable that we might integrate further AI solutions into our information systems in the future, potentially assuming a more critical role in our operations over time. The continuous advancement and utilization of technology, encompassing cloud-based computing and AI, introduce possibilities for the inadvertent exposure or misuse of the personal data integral to our business operations, as well as the unintentional disclosure or deliberate destruction of confidential information stored within our systems or those of our third-party providers, via portable media or storage devices. Such occurrences may lead to considerable increases in operational and security expenses, tarnished reputation, regulatory penalties, or expenses related to legal defense. AI programs can incur significant costs and demand substantial expertise for development, pose challenges in setup and management, and necessitate periodic updates.
Competitors or other entities may integrate AI into their information systems and business operations more swiftly or effectively than us, potentially impairing our competitive edge and negatively impacting our financial performance.
Furthermore, our information technology infrastructure requires sustained allocation of substantial resources for the upkeep, safeguarding, and enhancement of existing systems, as well as for the development of new systems. This ensures our ability to keep abreast of ongoing advancements in information processing technology, evolving legal and regulatory standards, the growing imperative to safeguard employee and customer data, shifts in unauthorized data access methods, and the evolving IT demands tied to our expanding product portfolio. There is no guarantee that our endeavors, encompassing system consolidation, fortification, upgrades, and expansion, along with embedding security into the architecture of our information systems, and the development of new systems to match the pace of technological evolution, including generative AI platforms, will yield the desired outcomes or prevent the emergence of additional system-related challenges in the future.
Our business is subject to complex and evolving U.S. laws and regulations regarding privacy and data protection.
As part of our normal business activities, we collect and store certain information, including information specific to homebuyers, customers, employees, vendors and suppliers. We may share some of this information with third parties who assist us with certain aspects of our business. The regulatory environment surrounding data privacy and protection is constantly evolving and can be subject to significant change. Laws and regulations governing data privacy and the unauthorized disclosure of confidential information pose increasingly complex compliance challenges and potentially elevate our costs. Any failure, or perceived failure, by us to comply with applicable data protection laws could result in proceedings or actions against us by governmental entities or others, subject us to significant fines, penalties, judgments and negative publicity, require us to change our business practices, increase the costs and complexity of compliance and adversely affect our business. As noted above, we are also subject to the possibility of cyber incidents or attacks, which themselves may result in a violation of these laws. Additionally, if we acquire a company that has violated or is not in compliance with applicable data protection laws, we may incur significant liabilities and penalties as a result.
31
Increasing attention to environmental, social and governance matters may impact our business, financial results or stock price.
In recent years, increasing attention has been given to corporate activities related to ESG matters in public discourse and in the investment community. A number of advocacy groups, both domestically and internationally, have campaigned for governmental and private action to promote change at public companies related to ESG matters, including through the investment and voting practices of investment advisers, public pension funds, universities and other members of the investing community.
These activities include increasing attention and demands for action related to climate change and promoting the use of energy saving building materials. A failure to comply with investor or customer expectations and standards, which are evolving, or if we are perceived to not have responded appropriately to the growing concern for ESG issues, regardless of whether there is a legal requirement to do so, could also cause reputational harm to our business and could have a material adverse effect on us. In addition, organizations that provide information to investors on corporate governance and related matters have developed ratings systems for evaluating companies on their approach to ESG matters. These ratings are used by some investors to assist in forming their investment and voting decisions. Unfavorable ESG ratings may lead to increased negative investor sentiment toward us and our industry and to the diversion of investment to other industries, which could have a negative impact on our stock price and our access to and costs of capital.
Acts of war or terrorism may seriously harm our business.
Acts of war, any outbreak or escalation of hostilities between the United States and any foreign power or acts of terrorism may cause disruption to the U.S. economy, or the local economies of the markets in which we operate, cause shortages of building materials, increase costs associated with obtaining building materials, result in building code changes that could increase costs of construction, result in uninsured losses, affect job growth and consumer confidence or cause economic changes that we cannot anticipate, all of which could reduce demand for our homes and adversely impact our business, prospects, liquidity, financial condition and results of operations.
Negative publicity could adversely affect our reputation as well as our business, financial results and stock price.
Our business success is dependent upon the reputation of the Dream Finders brand and its association with quality and integrity. If we are unable to maintain the position of our brand, our business may be adversely affected, which could result in lower sales and earnings. Unfavorable media related to our industry, company, brands, marketing, personnel, operations, business performance or prospects may affect our stock price and the performance of our business, regardless of its accuracy or inaccuracy. The speed at which negative publicity can be disseminated has increased dramatically with the capabilities of electronic communication, including social media outlets, websites, blogs, newsletters and other digital platforms. Our success in maintaining, extending and expanding our brand image depends on our ability to adapt to this rapidly changing media environment. Adverse publicity or negative commentary from any media outlets could damage our reputation and reduce the demand for our homes, which would adversely affect our business.
Changes in accounting rules, assumptions and/or judgments could materially and adversely affect us.
Accounting rules and interpretations for certain aspects of our financial reporting are highly complex and involve significant assumptions and judgment. These complexities could lead to a delay in the preparation and dissemination of our financial statements. Furthermore, changes in accounting rules and interpretations or in our accounting assumptions and/or judgments, such as those related to asset impairments, could significantly impact our financial statements. In some cases, we could be required to apply a new or revised standard retroactively, resulting in restating prior period financial statements. Any of these circumstances could have a material adverse effect on our business, prospects, liquidity, financial condition and results of operations.
32
Global economic and political instability and conflicts could adversely affect our business, financial condition or results of operations.
Our business could be adversely affected by unstable economic and political conditions within the United States and foreign jurisdictions and geopolitical conflicts, including the continued conflicts between Israel and Hamas and Ukraine and Russia. While we do not have any customer or direct supplier relationships in either country, the current military conflict, and related sanctions, as well as export controls or actions that may be initiated by nations (e.g., potential cyberattacks, disruption of energy flows, etc.) and other potential uncertainties could adversely affect our supply chain by causing shortages or increases in costs for materials necessary to construct homes and/or increases to the price of gasoline and other fuels. In addition, such events could cause higher interest rates, inflation or general economic uncertainty, which could negatively impact our business partners, employees or customers or otherwise adversely impact our business.
Our business could be materially and adversely disrupted by an epidemic or pandemic, or similar public threat, or fear of such an event, and the measures that federal, state and local governments and other authorities implement to address it.
An epidemic, pandemic or similar serious public health issue and the measures undertaken by governmental authorities to address it, could significantly disrupt or prevent us from operating our business in the ordinary course for an extended period, and thereby, along with any associated economic and social instability or distress, have a material adverse impact on our business, prospects, liquidity, financial condition and results of operations.
Global and U.S. agencies declared the end of the related emergency from the COVID-19 pandemic in May 2023. This health crisis had far-reaching adverse effects on the global economy, financial markets, and various stakeholders including our employees, customers, suppliers, and other business associates. There is no guarantee that a future outbreak of this or any other widespread epidemics or pandemics will not occur, or that the U.S. economy will fully recover, either of which could materially and adversely affect our business.
Any future government shutdowns or slowdowns may materially adversely affect our business or financial results.
Any future government shutdowns or slowdowns may materially adversely affect our business or financial results. We can make no assurances that potential home closings affected by any such shutdown or slowdown will occur after the shutdown or slowdown has ended.
Cautionary Statement about Forward-Looking Statements and Risk Factor Summary
The information in this Annual Report on Form 10-K includes “forward-looking statements.” Many statements included in this Annual Report on Form 10-K are not statements of historical fact, including statements concerning our expectations, beliefs, plans, objectives, goals, strategies, future events or performance and underlying assumptions. These statements are “forward-looking statements” within the meaning of the Private Securities Litigation Reform Act of 1995. Actual results may differ materially from those expressed or implied by these statements. Forward-looking statements are inherently subject to risks and uncertainties, some of which cannot be predicted or quantified. Certain, but not necessarily all, of such forward-looking statements can be identified by the use of forward-looking terminology, such as “anticipate,” “believe,” “continue,” “could,” “estimate,” “expect,” “forecast,” “goal,” “intend,” “may,” “objective,” “plan,” “predict,” “projection,” “should” or “will” or the negative thereof or other comparable terminology. These forward-looking statements include, but are not limited to, statements about:
•our market opportunity and the potential growth of that market;
•trends with respect to interest rates and cancellation rates;
•our strategy, expected outcomes and growth prospects;
•trends in our operations, industry and markets;
•our future profitability, indebtedness, liquidity, access to capital and financial condition; and
•our integration of companies that we have acquired into our operations.
33
We have based these forward-looking statements on our current expectations and assumptions about future events based on information available to our management at the time the statements were made. While our management considers these expectations and assumptions to be reasonable, they are inherently subject to significant business, economic, competitive, regulatory and other risks, contingencies and uncertainties, most of which are difficult to predict and many of which are beyond our control. Therefore, we cannot assure you that actual results will not differ materially from those expressed or implied by our forward-looking statements. The following summary risk factors, may cause actual results to differ materially from those expressed or implied in our forward-looking statements:
•the negative impact of an increase in cancellation rates affecting our closing, backlog and sales revenues as a result of rising interest rates and inflationary pressures;
•a continued shortage of building materials or labor, or continued increases in costs that delay or increase the cost of home construction;
•the impact from global economic and political instability and conflicts could adversely affect our business, financial condition or results of operations;
•a slowdown in the homebuilding industry or changes in population growth rates in our markets;
•volatility and uncertainty in the credit markets and broader financial markets;
•our future operating results and financial condition;
•adverse effects of major epidemics or pandemics, such as COVID-19, on the economy, our business, financial condition and results of operations;
•the success of our operations in new markets and our ability to expand into additional new markets;
•our ability to continue to leverage our asset-light and capital-efficient lot acquisition strategy;
•our ability to develop our projects successfully or within expected timeframes;
•our ability to identify potential acquisition targets and close such acquisitions;
•our ability to successfully integrate acquired businesses with our existing operations;
•availability of land to acquire and our ability to acquire such land on favorable terms, or at all;
•availability, terms and deployment of capital and ability to meet our ongoing liquidity needs;
•restrictions in our debt agreements that limit our flexibility in operating our business;
•disruption in the terms or availability of mortgage financing or an increase in the number of foreclosures in our markets;
•decline in the market value of our inventory or controlled lot positions;
•shortages of, or increased prices for, labor, land or raw materials used in land development and housing construction, including due to changes in trade policies;
•delays in land development or home construction resulting from natural disasters, adverse weather conditions or other events outside our control;
•uninsured losses in excess of insurance limits;
•the cost and availability of insurance and surety bonds;
34
•changes in liabilities under, or the failure or inability to comply with, governmental laws and regulations, including environmental laws and regulations;
•the timing of receipt of regulatory approvals and the opening of projects;
•the degree and nature of our competition;
•decline in the financial performance of our interests, our lack of sole decision-making authority thereof and maintenance of relationships with our partners;
•negative publicity or poor relations with the residents of our projects;
•existing and future warranty and liability claims;
•existing and future litigation, arbitration or other claims;
•availability of qualified personnel and third-party contractors and subcontractors;
•information system failures, cyber incidents or breaches in security;
•our ability to retain our key personnel;
•our ability to maintain an effective system of internal control and produce timely and accurate financial statements or comply with applicable regulations;
•our leverage and future debt service obligations;
•the impact on our business of any future government shutdown;
•the impact on our business of acts of war or terrorism;
•other risks and uncertainties inherent in our business; and
•other factors we discuss under the section entitled “Risk Factors.”
We caution you that these forward-looking statements are subject to all of the risks and uncertainties, most of which are difficult to predict and many of which are beyond our control, incident to the operation of our business. These risks include, but are not limited to, the risks described under “Risk Factors” in this Annual Report on Form 10-K. Should one or more of the risks or uncertainties described in this Annual Report on Form 10-K occur, or should underlying assumptions prove incorrect, our actual results and plans could differ materially from those expressed in any forward-looking statements.
All forward-looking statements, expressed or implied, included in this Annual Report on Form 10-K are expressly qualified in their entirety by this cautionary statement. This cautionary statement should also be considered in connection with any subsequent written or oral forward-looking statements that we or persons acting on our behalf may issue.
Except as otherwise required by applicable law, we disclaim any duty to update any forward-looking statements, all of which are expressly qualified by the statements in this section, to reflect events or circumstances after the date of this Annual Report on Form 10-K.
ITEM 1B. UNRESOLVED STAFF COMMENTS
None.
35
ITEM 1C. CYBERSECURITY
The Company’s cybersecurity risk management program is integrated into our overall enterprise risk management process and is based on the National Institute of Standards and Technology Cybersecurity Framework (“NIST Framework”). The program is comprised of a comprehensive set of policies and procedures designed to protect and identify threats to our Information Technology (“IT”) systems and data, including those employed by our third-party service providers. Our dedicated cybersecurity team collaborates with business operations personnel as well as certain third parties, as applicable, to provide a comprehensive suite of cybersecurity services, encompassing network security, anti-malware solutions, email security measures, endpoint security, detection systems, application security, data safeguards, access management protocols, cybersecurity awareness initiatives, incident response strategies, threat intelligence, IT risk assessment and vulnerability management. We also maintain insurance coverage for cybersecurity incidents.
The Company also engages third parties to perform periodic assessments of certain aspects of our cybersecurity measures, including vulnerability assessments and audits and independent reviews of our information security control environment and operating effectiveness. The results of such assessments, audits and reviews are reported to the Nominating and Governance Committee and the Board of Directors, and the Company adjusts its cybersecurity policies, standards, processes and practices as necessary based on the information provided by these assessments, audits and reviews.
Our Board of Directors has delegated oversight of cybersecurity risks to our Nominating and Governance Committee. Executive management, inclusive of our Vice President of IT (“VP of IT”) in conjunction with our National Vice President of Finance (“NVP of Finance”), provides regular updates to the Nominating and Governance Committee including any updates to our program in response to new or changed cybersecurity risks, as well as ongoing metrics around the effectiveness of our existing cybersecurity strategies.
The VP of IT and the NVP of Finance work in coordination with the Cybersecurity Response Committee, which also includes our Chief Financial Officer (“CFO”) and representatives from legal, internal audit and SEC reporting functions. In the event of a cyber incident, the Cybersecurity Response Committee utilizes a formal incident response plan based on the NIST Framework to assess and manage cybersecurity threats. The incident response plan encompasses the containment, eradication, recovery, and resolution processes for the incident, while also detailing the individuals and groups that need to be notified.
The VP of IT has served in various roles in information technology and information security for over 24 years, including serving as the Chief Information Security Officer of a healthcare company and a member of the cyber emergency response team at several companies. The VP of IT holds undergraduate and graduate degrees in computer science and has attained various professional certifications in cybersecurity. The NVP of Finance and the rest of the Cybersecurity Response Committee hold undergraduate and graduate degrees in their respective fields, and have over 50 years of collective experience managing enterprise risks at the Company and at similar companies, including risks arising from cybersecurity threats.
Cybersecurity threats have not materially affected the Company, including our business strategy, results of operations or financial condition, to date. Risks relating to cybersecurity threats and potential impacts to our business strategy, results of operations or financial condition are discussed in “Risk Factors” herein.
ITEM 2. PROPERTIES
We lease approximately 45,000 square feet of office space in Jacksonville, Florida for our corporate headquarters; this lease expires in 2033, with potential renewal options. We also lease offices in other markets where we conduct business, although none of these properties are material to the operation of our business. All facilities are in good condition, adequately utilized, and sufficient to meet our present operating needs.
Refer to “Business—Land Acquisition and Development Process” for a summary of the other properties that we owned or controlled as of December 31, 2023.
36
ITEM 3. LEGAL PROCEEDINGS
Legal Proceedings
From time to time, we are a party to ongoing legal proceedings in the ordinary course of business. Refer to Note 5, Commitments and Contingencies— Legal Proceedings to our consolidated financial statements for additional information.
ITEM 4. MINE SAFETY DISCLOSURES
Not applicable.
37
PART II
ITEM 5. MARKET FOR REGISTRANT’S COMMON EQUITY, RELATED STOCKHOLDER MATTERS AND ISSUER PURCHASES OF EQUITY SECURITIES
Our Class A common stock is listed on the NYSE under the symbol “DFH.” As of February 22, 2024 the closing price of our Class A common stock on the NYSE was $34.41, and we had 14 stockholders of record, including Cede & Co. as nominee of The Depository Trust Company.
Dividends
We have not previously declared or paid any cash dividends on our Class A common stock. Any future determination to pay dividends will be at the discretion of our Board of Directors (the “Board of Directors” or the “Company’s Board of Directors”) and will depend on our financial condition, results of operations, capital requirements, restrictions contained in any of our financing arrangements and such other factors as our Board of Directors may deem relevant.
Stock Performance Graph
The performance graph below compares the cumulative total return of our Class A common stock since our initial public offering on January 21, 2021, with the Standard and Poor’s 500 Companies Stock Index (“S&P 500 Index”) and the Standard & Poor’s Homebuilders Select Industry Index (“S&P Homebuilders Index”) for the same period. The comparison assumes that $100 was invested in DFH, the S&P 500 Index, and the S&P Homebuilders Index on January 21, 2021. The stock performance graph should not be deemed filed or incorporated by reference into any other filing made by us under the Securities Act of 1933 or the Securities Exchange Act of 1934, except to the extent that we specifically incorporate the stock performance graph by reference in another filing.
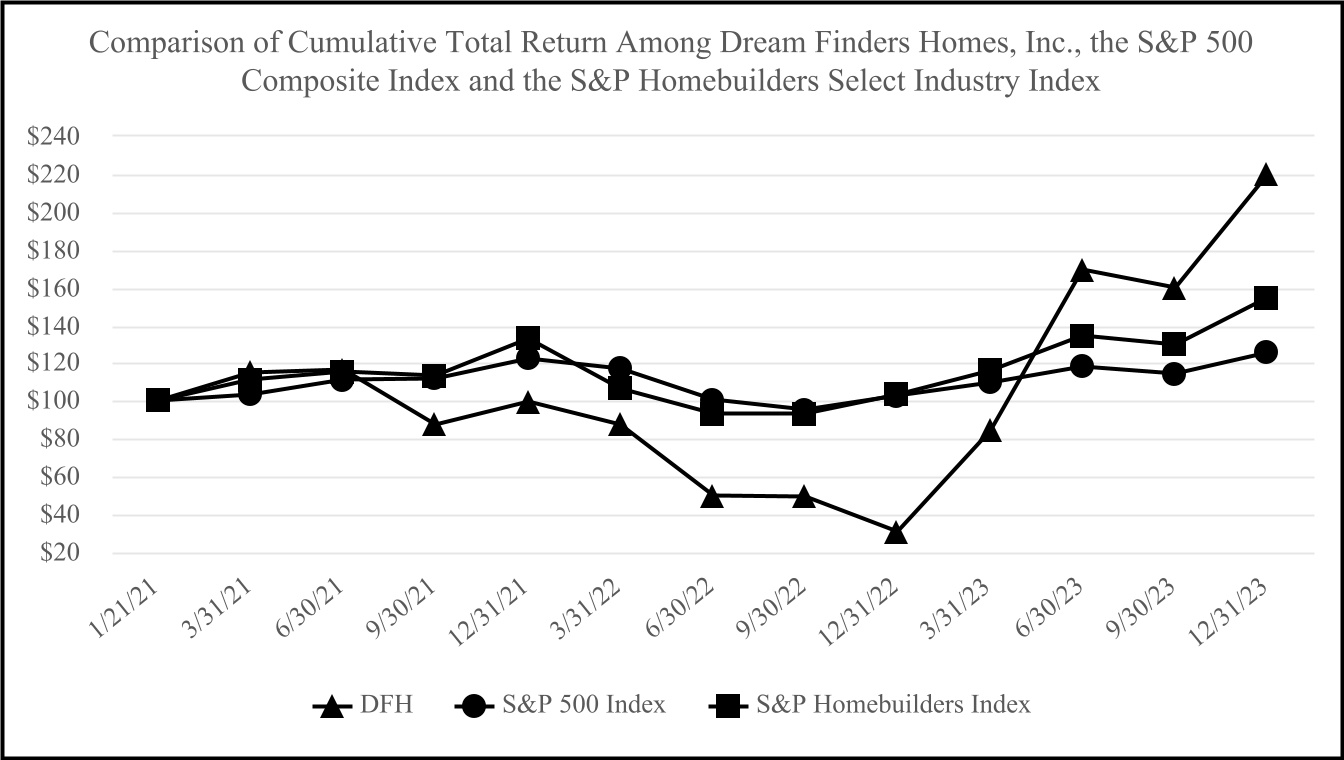
38
Share Buyback Program
In June 2023, the Company’s Board of Directors approved a share buyback program (the “Share Buyback Program”) under which the Company can repurchase up to $25.0 million of its Class A common stock through June 30, 2026 in open market purchases, privately negotiated transactions, or otherwise in compliance with Rule 10b-18 under the Securities Exchange Act of 1934, as amended.
We expect to execute any transactions under the Share Buyback Program through a combination of Rule 10b5-1 trading plans and transactions made in compliance with Rule 10b-18. The actual timing, number and value of shares repurchased under the Share Buyback Program will depend on a number of factors, including constraints specified in any price, general business and market conditions, and alternative investment opportunities. The Share Buyback Program does not obligate the Company to acquire any specific number of shares in any period, and may be expanded, extended, modified or discontinued at any time. As of February 29, 2024, we have not executed any repurchases under the Share Buyback Program.
ITEM 6. RESERVED
ITEM 7. MANAGEMENT’S DISCUSSION AND ANALYSIS OF FINANCIAL CONDITION AND RESULTS OF OPERATIONS
The following discussion and analysis of our financial condition and results of operations should be read in conjunction with the accompanying financial statements and related notes thereto. Unless the context otherwise requires, the terms “Dream Finders,” “DFH,” “the Company,” “we,” “us” and “our” refer to Dream Finders Homes, Inc. and its subsidiaries.
The following discussion and analysis of our financial condition and results of operations is intended to help the reader understand our business, operations and present business environment and is provided as a supplement to, and should be read together with the sections entitled “Risk Factors,” and the financial statements and the accompanying notes included elsewhere in this Form 10-K. In addition, the statements in this discussion and analysis regarding outlook, our expectations regarding the performance of our business, anticipated financial results and liquidity are forward-looking statements. These forward-looking statements are subject to numerous risks and uncertainties, including, but not limited to, the risks and uncertainties described in “Forward-Looking Statements” and in “Risk Factors” above. Our actual results may differ materially from those contained in or implied by any forward-looking statements."
Business Overview and Outlook
We design, build and sell homes in high-growth markets using our asset-light lot acquisition strategy. Our primary focus is on constructing and selling single-family homes across entry-level, first-time move-up, second-time move-up, and active adult markets. To fully serve our homebuyers and capture ancillary business opportunities, we have financial services operations that offer title insurance and mortgage banking solutions.
The easing of mortgage interest rates toward the end of 2023 resulted in accelerated demand for homebuilders heading into the spring selling season. Although macroeconomic indicators suggest that interest rates will continue to fall moderately in 2024, which, if those indicators come to fruition, should have a consistent positive impact on demand, we remain cautious and committed to our goals to deliver affordability and value to our homebuyers. We continue to strategically release quick move-in homes in our communities at competitive price points and we offer flexible sales incentives aimed at reducing our homebuyers’ monthly mortgage payments and closings costs. This strategy has served us well during 2023, and we believe it will continue to effectively generate new sales and faster inventory turnover in 2024.
Inflation in the United States materially increased during the year ended December 31, 2022, and has remained elevated throughout 2023. Despite this fact, the homebuilding industry has shown consistent growth in 2023, driven by constrained housing supply dynamics that favor new home sales as the resale home market continues to face inventory shortages. If interest rates start to decline in 2024, increased demand for homes is likely to follow.
Through our close monitoring of net new orders and community-level traffic, we are able to respond promptly to changes in local market conditions. As needed, we are able to strategically renegotiate lot option takedowns to match sales pace, which exemplifies how advantageous our asset-light strategy can be. Excluding built-for-rent deals that occurred in 2022 that did not repeat in 2023, the Company had an increase in net new orders of 43% when compared to the prior year.
39
These focused efforts by management not only drove our strong performance this year, but also showcase our ability to navigate a challenging macroeconomic environment.
Key Results
Key financial results for the year ended December 31, 2023, as compared to the year ended December 31, 2022 (unless otherwise noted) were as follows:
•Revenues increased 12% to $3.7 billion from $3.3 billion
•Home closings increased 6% to 7,314 from 6,878
•Average sales price of homes (“ASP”) closed increased 7% to $505,764 from $474,292
•Net new orders decreased 5% to 5,744 from 6,045
•Gross margin as a percentage of homebuilding revenues increased 100 basis points (“bps”) to 19.4% from 18.4%
•Adjusted gross margin (non-GAAP) as a percentage of homebuilding revenues increased 260 bps to 27.2% from 24.6%
•Income before taxes increased 14% to $404 million from $356 million
•Net and comprehensive income attributable to DFH increased 13% to $296 million from $262 million
•Basic earnings per share (“EPS”) was $3.03 and diluted EPS was $2.79, compared to $2.67 and $2.45, respectively
•EBITDA (non-GAAP) as a percentage of total revenues increased 130 bps to 13.9% from 12.6%
•Active community count increased to 221 from 206
•Backlog of sold homes decreased 28% to 3,978 from 5,548, and the value of backlog decreased 25% to $1.9 billion from $2.5 billion
•Return on participating equity was 36.3%, compared to 49.1%
•Issuance of $300 million in aggregate principal amount of 8.25% senior unsecured notes used to repay a portion of the outstanding balance under the revolving credit facility
•Net debt to net capitalization of 23.3% as of December 31, 2023, compared to 42.9% as of December 31, 2022
•Total liquidity, comprised of cash and cash equivalents, and availability under the revolving credit facility, increased to $828 million as of December 31, 2023, compared to $487 million as of December 31, 2022
For reconciliations of the non-GAAP financial measures, including adjusted gross margin and EBITDA, to the most directly comparable GAAP financial measures, see “—Non-GAAP Financial Measures .”
Recent Developments
Crescent Homes Acquisition
On February 1, 2024, we acquired the majority of the homebuilding assets of Crescent Ventures, LLC (“Crescent Homes”), expanding our operations into the Charleston and Greenville, South Carolina and Nashville, Tennessee markets. Refer to Note 15, Subsequent Events to our consolidated financial statements for more information.
Expansion in the Southeast Segment
In 2023, we expanded into the Tampa, Florida market. As of December 31, 2023, we owned 12 lots and controlled 623 lots in Tampa. We opened for sales in Tampa in January 2024.
40
Results of Operations
Year Ended December 31, 2023 Compared to Year Ended December 31, 2022
The following table sets forth our results of operations and balance sheet data (in thousands, except per share and share amounts) for the periods indicated:
Year Ended December 31, | ||||||||||||||||||||||||||
| 2023 | 2022 | Amount Change | % Change | |||||||||||||||||||||||
| Revenues: | ||||||||||||||||||||||||||
| Homebuilding | $ | 3,738,888 | $ | 3,334,559 | $ | 404,329 | 12 | % | ||||||||||||||||||
| Other | 9,698 | 7,776 | 1,922 | 25 | % | |||||||||||||||||||||
| Total revenues | 3,748,586 | 3,342,335 | 406,251 | 12 | % | |||||||||||||||||||||
| Homebuilding cost of sales | 3,011,813 | 2,722,139 | 289,674 | 11 | % | |||||||||||||||||||||
| Selling, general and administrative expense | 308,795 | 271,040 | 37,755 | 14 | % | |||||||||||||||||||||
| Income from unconsolidated entities | (18,075) | (16,122) | (1,953) | 12 | % | |||||||||||||||||||||
| Contingent consideration revaluation | 46,590 | 11,053 | 35,537 | 322 | % | |||||||||||||||||||||
| Other income, net | (4,962) | (1,931) | (3,031) | 157 | % | |||||||||||||||||||||
Income before taxes | 404,425 | 356,156 | 48,269 | 14 | % | |||||||||||||||||||||
Income tax expense | (96,483) | (81,859) | (14,624) | 18 | % | |||||||||||||||||||||
| Net and comprehensive income | 307,942 | 274,297 | 33,645 | 12 | % | |||||||||||||||||||||
| Net and comprehensive income attributable to noncontrolling interests | (12,042) | (11,984) | (58) | — | % | |||||||||||||||||||||
| Net and comprehensive income attributable to Dream Finders Homes, Inc. | $ | 295,900 | $ | 262,313 | $ | 33,587 | 13 | % | ||||||||||||||||||
Earnings per share(1) | ||||||||||||||||||||||||||
| Basic | $ | 3.03 | $ | 2.67 | $ | 0.36 | 13 | % | ||||||||||||||||||
| Diluted | $ | 2.79 | $ | 2.45 | $ | 0.34 | 14 | % | ||||||||||||||||||
| Weighted-average number of shares | ||||||||||||||||||||||||||
| Basic | 93,066,564 | 92,745,781 | 320,783 | — | % | |||||||||||||||||||||
| Diluted | 106,027,548 | 106,691,248 | (663,700) | (1) | % | |||||||||||||||||||||
| Consolidated Balance Sheets Data (as of period end): | ||||||||||||||||||||||||||
| Cash and cash equivalents | $ | 494,145 | $ | 364,531 | $ | 129,614 | 36 | % | ||||||||||||||||||
| Total assets | $ | 2,562,439 | $ | 2,371,137 | $ | 191,302 | 8 | % | ||||||||||||||||||
| Total debt | $ | 824,302 | $ | 966,248 | $ | (141,946) | (15) | % | ||||||||||||||||||
| Total mezzanine and stockholders’ equity | $ | 1,086,150 | $ | 800,693 | $ | 285,457 | 36 | % | ||||||||||||||||||
| Other Financial and Operating Data | ||||||||||||||||||||||||||
Active communities as of period-end(2) | 221 | 206 | 15 | 7 | % | |||||||||||||||||||||
| Home closings | 7,314 | 6,878 | 436 | 6 | % | |||||||||||||||||||||
Average sales price of homes closed(3) | $ | 505,764 | $ | 474,292 | $ | 31,472 | 7 | % | ||||||||||||||||||
| Net new orders | 5,744 | 6,045 | (301) | (5) | % | |||||||||||||||||||||
| Cancellation rate | 18.3 | % | 21.5 | % | (3.2) | % | (15) | % | ||||||||||||||||||
| Ending backlog - homes | 3,978 | 5,548 | (1,570) | (28) | % | |||||||||||||||||||||
| Ending backlog - value (in thousands) | $ | 1,887,368 | $ | 2,502,564 | $ | (615,196) | (25) | % | ||||||||||||||||||
Return on participating equity(4) | 36.3 | % | 49.1 | % | (12.8) | % | (26) | % | ||||||||||||||||||
Net debt to net capitalization(5) | 23.3 | % | 42.9 | % | (19.6) | % | (46) | % | ||||||||||||||||||
Gross margin (in thousands)(6) | $ | 727,075 | $ | 612,420 | $ | 114,655 | 19 | % | ||||||||||||||||||
Gross margin %(7) | 19.4 | % | 18.4 | % | 1.0 | % | 5 | % | ||||||||||||||||||
Adjusted gross margin (in thousands)(8) | $ | 1,015,624 | $ | 820,158 | $ | 195,466 | 24 | % | ||||||||||||||||||
Adjusted gross margin %(7)(8) | 27.2 | % | 24.6 | % | 2.6 | % | 11 | % | ||||||||||||||||||
EBITDA (in thousands)(8) | $ | 521,495 | $ | 422,582 | $ | 98,913 | 23 | % | ||||||||||||||||||
EBITDA margin %(8)(9) | 13.9 | % | 12.6 | % | 1.3 | % | 10 | % | ||||||||||||||||||
Adjusted EBITDA (in thousands)(8) | $ | 535,593 | $ | 429,378 | $ | 106,215 | 25 | % | ||||||||||||||||||
Adjusted EBITDA margin %(8)(9) | 14.3 | % | 12.8 | % | 1.5 | % | 12 | % | ||||||||||||||||||
41
(1)Refer to Note 14, Earnings Per Share to the consolidated financial statements for disclosures related to the calculation of EPS. Diluted shares were calculated by using the treasury stock method for stock grants and the if-converted method for the convertible preferred stock and the associated preferred dividends.
(2)A community becomes active once the model is completed or the community has its fifth net sale. A community becomes inactive when it has fewer than five homesites remaining to sell.
(3)Average sales price of homes closed is calculated based on homebuilding revenues, adjusted for the impact of percentage of completion revenues, and excluding deposit forfeitures and land sales, over homes closed.
(4)Return on participating equity is calculated as net income attributable to DFH, less redeemable preferred stock distributions, dividends and redemptions, divided by average beginning and ending participating equity. Participating equity is stockholders’ equity excluding noncontrolling interests.
(5)Net debt to net capitalization is defined as the sum of the senior unsecured notes, net, and construction lines of credit, less cash and cash equivalents (“net debt”), divided by the sum of net debt and total mezzanine and stockholders’ equity.
(6)Gross margin is homebuilding revenues less homebuilding cost of sales.
(7)Calculated as a percentage of homebuilding revenues.
(8)Adjusted gross margin, EBITDA and adjusted EBITDA are non-GAAP financial measures. For definitions of these non-GAAP financial measures and a reconciliation to our most directly comparable financial measures calculated and presented in accordance with GAAP, see “—Non-GAAP Financial Measures.”
(9)Calculated as a percentage of total revenues.
The following tables summarize homes closings, and ASP of homes closed by homebuilding segment for the years ended December 31, 2023 and 2022, as well as active communities as of December 31, 2023 and 2022:
| Year Ended December 31, 2023 | As of December 31, 2023 | |||||||||||||||||||
| Segment | Home Closings | ASP | Active Communities | |||||||||||||||||
| Southeast | 3,170 | $ | 470,405 | 57 | ||||||||||||||||
| Mid-Atlantic | 1,597 | 396,462 | 44 | |||||||||||||||||
| Midwest | 2,547 | 618,306 | 120 | |||||||||||||||||
| Total | 7,314 | $ | 505,764 | 221 | ||||||||||||||||
| Year Ended December 31, 2022 | As of December 31, 2022 | |||||||||||||||||||
| Segment | Home Closings | ASP | Active Communities | |||||||||||||||||
| Southeast | 2,722 | $ | 439,150 | 57 | ||||||||||||||||
| Mid-Atlantic | 1,562 | 358,548 | 37 | |||||||||||||||||
| Midwest | 2,594 | 580,865 | 112 | |||||||||||||||||
| Total | 6,878 | $ | 474,292 | 206 | ||||||||||||||||
The following table presents income before taxes (in thousands), and homebuilding gross margin percentage by segment for the years ended December 31, 2023 and 2022:
| Year Ended December 31, | ||||||||||||||||||||||||||
| 2023 | 2022 | |||||||||||||||||||||||||
| Segment | Income Before Taxes | Gross Margin % | Income Before Taxes | Gross Margin % | ||||||||||||||||||||||
| Southeast | $ | 183,537 | 18.9 | % | $ | 165,367 | 19.4 | % | ||||||||||||||||||
| Mid-Atlantic | 54,646 | 17.9 | % | 40,028 | 14.1 | % | ||||||||||||||||||||
| Midwest | 168,115 | 20.6 | % | 164,377 | 19.1 | % | ||||||||||||||||||||
| Total | $ | 406,298 | 19.4 | % | $ | 369,772 | 18.4 | % | ||||||||||||||||||
42
Revenues. Revenues for the year ended December 31, 2023 were $3.7 billion, an increase of $0.4 billion, or 12%, from $3.3 billion for the year ended December 31, 2022. The increase in revenues was attributable to home closings of 7,314 for the year ended December 31, 2023, an increase of 436 homes, or 6%, from 6,878 for the year ended December 31, 2022. Also contributing to the increase was the average sales price of homes closed for the year ended December 31, 2023 was $505,764, an increase of $31,472, or 7%, from $474,292 for the year ended December 31, 2022. The increase was due to overall price appreciation, as well as product mix.
Homebuilding Cost of Sales and Gross Margin. Homebuilding cost of sales for the year ended December 31, 2023 was $3.0 billion, an increase of $0.3 billion, or 11%, from $2.7 billion for the year ended December 31, 2022. Homebuilding gross margin for the year ended December 31, 2023 was $727 million, an increase of $115 million, or 19%, from $612 million for the year ended December 31, 2022. Homebuilding gross margin percentage was 19.4% for the year ended December 31, 2023, an increase of 100 bps, or 5%, from 18.4% for the year ended December 31, 2022. The increase in gross margin percentage was primarily a result of continued cost management and cycle time improvement efforts. The increase was partially offset by higher financing and closing costs. To facilitate home closings, we provided closing cost incentives, which, among other options, could be used by the customer to buy down their mortgage interest rate.
Adjusted Gross Margin. Adjusted gross margin for the year ended December 31, 2023 was $1.0 billion, an increase of $196 million, or 24%, from $820 million for the year ended December 31, 2022. Adjusted gross margin as a percentage of homebuilding revenues for the year ended December 31, 2023 was 27.2%, an increase of 260 bps, or 11%, from 24.6% for the year ended December 31, 2022. The adjusted gross margin percentage increased due to effective cost management strategies, partially offset by higher closing costs. Adjusted gross margin is a non-GAAP financial measure. For the definition of adjusted gross margin and a reconciliation to our most directly comparable financial measure calculated and presented in accordance with GAAP, see “—Non-GAAP Financial Measures.”
Southeast. Our Southeast segment total revenues for the year ended December 31, 2023 were $1.5 billion, an increase of $0.3 billion, or 23%, from $1.2 billion for the year ended December 31, 2022. This revenue growth was primarily driven by an increase in home closings of 448, or 16%. Additionally, the ASP of homes closed of $470,405 for the year ended 2023, reflected an increase of 7% when compared to 2022, a result of price appreciation and product mix. Homebuilding gross margin percentage was 18.9% for the year ended December 31, 2023, representing a decrease of 50 bps, or 0.5%, when compared to the year ended December 31, 2022. The reduction in gross margin percentage was primarily attributed to higher financing and closing costs.
Mid-Atlantic. Our Mid-Atlantic segment total revenues for the year ended December 31, 2023 were $633 million, an increase of $66 million, or 12%, from $567 million for the year ended December 31, 2022. This revenue growth was primarily driven by an increase in ASP of homes closed of 11% to $396,462. The increase in ASP of homes closed was largely influenced by changes in product mix. Additionally, there was an increase in home closings of 35, or 2%, for the year ended December 31, 2023 compared to 2022. Homebuilding gross margin percentage was 17.9% for the year ended December 31, 2023, representing an increase of 380 bps, or 3.8%, when compared to the year ended December 31, 2022. The improvement in gross margin percentage was primarily due to cost management efforts, including cycle time reductions, partially offset by higher financing costs.
Midwest. Our Midwest segment total revenues for the year ended December 31, 2023 were $1.6 billion, an increase of $0.1 billion, or 4%, from $1.5 billion for the year ended December 31, 2022. This additional revenue was due to an ASP of homes closed of $618,306 for the year ended 2023, an increase of 6% when compared to 2022, partially offset by a decrease in home closings of 47, or 2%. Homebuilding gross margin percentage was 20.6% for the year ended December 31, 2023, representing an increase of 150 bps, or 1.5%, when compared to the year ended December 31, 2022. The growth in gross margin percentage year over year is due to effective cost management including impacts from overall cycle time reduction, partially offset by higher financing and closing costs.
Selling, General and Administrative Expense. Selling, general and administrative expense (“SG&A”) for the year ended December 31, 2023 was $309 million, an increase of $38 million, or 14%, from $271 million for the year ended December 31, 2022. SG&A as a percentage of homebuilding revenues for the year ended December 31, 2023 increased 20 bps to 8.3% compared to 8.1% for the year ended December 31, 2022. For the year ended December 31, 2023, SG&A included $28 million of costs related to mortgage forward commitment programs, allowing our homebuyers to lock their interest rates on home loans at the point of sale, which were not incurred in 2022. We expense these costs as incurred.
43
Income from Unconsolidated Entities. Income from unconsolidated entities for the year ended December 31, 2023 was $18 million, an increase of $2 million, or 12%, from $16 million for the year ended December 31, 2022. The increase in income from unconsolidated entities is primarily attributable to increased income from Jet HomeLoans, partially offset by fewer distributions of profits from DF Capital funds, as Fund I is nearing its final stage, and as Fund II is still in its investment period.
Contingent Consideration Revaluation. Contingent consideration revaluation expense (“contingent consideration expense”) for the year ended December 31, 2023 was $47 million, an increase of $36 million, or 322%, from $11 million for the year ended December 31, 2022. The increase in contingent consideration expense was primarily due to actual 2023 pre-tax earnings of previously acquired entities, primarily MHI, being better than projected as well as revised projections for the MHI operations.
Contingent consideration liabilities are impacted by various inputs and estimates in addition to the fair value accretion, including: (i) updates to the applied discount rate, (ii) changes to current year inputs based on year to date actual results, (iii) changes to future year’s forecast assumptions, which are affected by macro-economic conditions and local market conditions, as well as management actions including capital allocation, growth plans, and restructuring, and (iv) contractual modifications that may merit additional adjustments to final pre-tax income prior to the calculation of the annual earn out payments. The change in estimates used to calculate the contingent consideration revaluation adjustment could be material at times and could potentially fluctuate between expense and income. Our policy is to separately disclose the impact of contingent consideration revaluation adjustments within the Consolidated Statements of Comprehensive Income.
Other Income, Net. Other income, net for the year ended December 31, 2023 was $5 million, an increase of $3 million, or 157%, from $2 million in other income, net for the year ended December 31, 2022. The additional income was primarily due to increased interest income from our cash deposits with financial institutions.
Net and Comprehensive Income. Net and comprehensive income for the year ended December 31, 2023 was $308 million, an increase of $34 million, or 12%, from $274 million for the year ended December 31, 2022. The increase in net and comprehensive income was primarily attributable to an increase in gross margin on homes closed of $115 million, or 19%, during the year ended December 31, 2023 as compared to the year ended December 31, 2022. This increase was partially offset by an increase in contingent consideration expense of $36 million, primarily related to the MHI acquisition, and forward commitment program costs, both discussed above. The net and comprehensive income for the year ended December 31, 2023 includes income tax expense of $96 million, an increase of $14 million, or 18%, from $82 million of income tax expense for the year ended December 31, 2022. This increase is primarily due to the increase in income before taxes and to a lesser extent the effective income tax rate increase of 0.9%. The changes in net and comprehensive income attributable to Dream Finders Homes, Inc. were consistent with the changes in net and comprehensive income as there were no significant changes in noncontrolling interests for the period.
Refer to the Form 10-K for the year ended December 31, 2022 filed on March 2, 2023 for the results of operations and related discussion for December 31, 2022 compared to the year ended December 31, 2021.
Financial Services
Income before taxes for the year ended December 31, 2023 for our Financial Services segment, net of reconciling items from equity method investments, was $19 million, an increase of $4 million, or 27%, from $15 million for the year ended December 31, 2022. The increase in income before taxes for the Financial Services segment was primarily attributed to increased loans originated by Jet HomeLoans.
For the year ended December 31, 2023, Jet HomeLoans originated and funded 3,189 home loans with an aggregate principal amount of approximately $1.3 billion as compared to 2,370 home loans with an aggregate principal amount of approximately $879 million for the year ended December 31, 2022. For the years ended December 31, 2023 and 2022, respectively, Jet HomeLoans had net income of approximately $20 million and $12 million. Our interest in Jet HomeLoans is accounted for under the equity method and is not consolidated in our consolidated financial statements, as we do not control and are not deemed the primary beneficiary of the VIE. Refer to Note 1, Nature of Business and Significant Accounting Policies, to our consolidated financial statements for a discussion of accounting treatment of VIEs.
44
For the year ended December 31, 2023, our wholly owned subsidiary, DF Title, had income before taxes of $4 million, an increase of $1 million, or 33%, from $3 million for the year ended December 31, 2022. The increase in income before taxes was driven by the increase in home closings and ASP of homes closed, as well as effective cost management.
Net Sales, Backlog and Closings
The following table presents information concerning our net new orders (“net sales”), starts and closings in each of our homebuilding segments for the periods set forth below:
| Year Ended December 31, | Period Over Period Percent Change | ||||||||||||||||||||||||||||||||||
| 2023 | 2022 | ||||||||||||||||||||||||||||||||||
| Segment | Net Sales(1) | Starts | Closings | Net Sales(1) | Starts | Closings | Net Sales | Starts | Closings | ||||||||||||||||||||||||||
| Southeast | 1,822 | 2,693 | 3,170 | 3,113 | 3,034 | 2,722 | -41 | % | -11 | % | 16 | % | |||||||||||||||||||||||
| Mid-Atlantic | 1,360 | 1,627 | 1,597 | 1,151 | 1,224 | 1,562 | 18 | % | 33 | % | 2 | % | |||||||||||||||||||||||
| Midwest | 2,562 | 2,551 | 2,547 | 1,781 | 2,343 | 2,594 | 44 | % | 9 | % | -2 | % | |||||||||||||||||||||||
| Total | 5,744 | 6,871 | 7,314 | 6,045 | 6,601 | 6,878 | -5 | % | 4 | % | 6 | % | |||||||||||||||||||||||
(1) Net sales are sales of homes during the period, less cancellations of existing sales contracts during the period. Excluding net sales under built-for-rent contracts, 2023 net sales in the Southeast segment increased 19% when compared to 2022.
The following table presents information concerning our ending backlog in number of homes, ASP and aggregate value (in thousands) for our homebuilding segments as of the dates set forth below:
| As of December 31, | |||||||||||||||||||||||
| 2023 | 2022 | ||||||||||||||||||||||
| Segment | Homes(1) | ASP | Value | Homes(1) | ASP | Value | |||||||||||||||||
| Southeast | 2,234 | $ | 393,356 | $ | 878,757 | 3,582 | $ | 398,246 | $ | 1,426,517 | |||||||||||||
| Mid-Atlantic | 599 | 427,593 | 256,128 | 836 | 335,642 | 280,597 | |||||||||||||||||
| Midwest | 1,145 | 657,190 | 752,483 | 1,130 | 703,938 | 795,450 | |||||||||||||||||
| Total | 3,978 | $ | 474,451 | $ | 1,887,368 | 5,548 | $ | 451,075 | $ | 2,502,564 | |||||||||||||
(1) Ending backlog represents the number of homes in backlog from the previous period, plus net sales during the period, minus the number of home closings during the current period.
Backlog of sold homes as of December 31, 2023 was 3,978 homes valued at approximately $1.9 billion based on ASP, a decrease of 1,570 homes and $0.6 billion in value, or 28% and 25%, respectively, from 5,548 homes valued at approximately $2.5 billion as of December 31, 2022. The overall decrease in backlog is reflective of an increase in sales of move-in ready spec homes relative to pre-order sales. Spec homes typically result in quicker closings and turnover of the backlog. Approximately 704 of the homes in our backlog are expected to be delivered in 2025 and beyond.
Southeast. Backlog for the Southeast segment as of December 31, 2023 was 2,234 homes, a decrease of 1,348 from 3,582 homes as of December 31, 2022. The decrease was primarily attributable to an increase in sales of move-in ready spec homes relative to pre-order sales and to a lesser extent built-for-rent sales in 2022 backlog that did not repeat in 2023.
Mid-Atlantic. Backlog for the Mid-Atlantic segment as of December 31, 2023 was 599 homes, a decrease of 237 from 836 homes as of December 31, 2022. The decrease in backlog was attributable to the increase in spec inventory sales relative to pre-order sales and to a lesser extent fewer sales under built-for-rent contracts in 2023 relative to 2022.
Midwest. Backlog for the Midwest segment as of December 31, 2023 was 1,145 homes, an increase of 15 from 1,130 homes as of December 31, 2022. The modest increase was primarily attributable to the higher net sales relative to closings in 2023, when compared to 2022.
45
The following table presents information concerning our cancellation rates for each of our homebuilding segments for the periods set forth below:
Year Ended December 31, | |||||||||||
| Segment | 2023 | 2022 | |||||||||
| Southeast | 21.5 | % | 16.0 | % | |||||||
| Mid-Atlantic | 14.4 | % | 31.0 | % | |||||||
| Midwest | 17.8 | % | 27.0 | % | |||||||
Total(1) | 18.3 | % | 21.5 | % | |||||||
(1) Our cancellation rate for a given period is calculated as the total number of new sales contracts cancelled during the period, divided by the total number of new home sales contracts entered into during the period.
Our cancellation rate for the year ended December 31, 2023 was 18.3%, an improvement of 320 basis points when compared to the 21.5% cancellation rate for the year ended December 31, 2022. The reduction in the overall cancellation rate was primarily a result of significant improvement in the cancellation rates for the Mid-Atlantic and Midwest segments, driven by improved homebuyer sentiments in 2023 following a sharp spike in interest rates that occurred in the latter half of 2022. This was partially offset by a higher proportion of 2022 gross sales under built-for-rent contracts for the Southeast segment relative to 2023. Built-for-rent sales have a lower cancellation rate than retail sales. The Southeast cancellation rate remained in line with the Company’s historical cancellation rates.
Non-GAAP Financial Measures
Adjusted Gross Margin
Adjusted gross margin is a non-GAAP financial measure used by management as a supplemental measure in evaluating operating performance. We define adjusted gross margin as gross margin excluding the effects of capitalized interest, lot option fees, amortization included in homebuilding cost of sales (adjustments resulting from the application of purchase accounting in connection with acquisitions) and commission expense. Our management believes this information is meaningful because it isolates the impact that these excluded items have on gross margin. We include internal and external commission expense in homebuilding cost of sales, not selling, general and administrative expense, and therefore commission expense is taken into account in gross margin.
As a result, in order to provide a meaningful comparison to the public company homebuilders that include commission expense below the gross margin line in selling, general and administrative expense, we have excluded commission expense from adjusted gross margin. However, because adjusted gross margin information excludes capitalized interest, lot option fees, purchase accounting amortization and commission expense, which have real economic effects and could impact our results of operations, the utility of adjusted gross margin information as a measure of our operating performance may be limited.
In addition, other companies may not calculate adjusted gross margin information in the same manner that we do. Accordingly, adjusted gross margin information should be considered only as a supplement to gross margin information as a measure of our performance.
46
The following table presents a reconciliation of adjusted gross margin to the GAAP financial measure of gross margin for each of the periods indicated (unaudited and in thousands, except percentages):
| Year Ended December 31, | |||||||||||||||||
| 2023 | 2022 | 2021 | |||||||||||||||
Gross margin(1) | $ | 727,075 | $ | 612,420 | $ | 306,969 | |||||||||||
Interest charged to homebuilding cost of sales(2) | 122,759 | 60,595 | 32,508 | ||||||||||||||
Amortization in homebuilding cost of sales(3) | — | 6,701 | 9,873 | ||||||||||||||
| Commission expense | 165,790 | 140,442 | 67,032 | ||||||||||||||
| Adjusted gross margin | $ | 1,015,624 | $ | 820,158 | $ | 416,382 | |||||||||||
Gross margin %(4) | 19.4 | % | 18.4 | % | 16.0 | % | |||||||||||
Adjusted gross margin %(4) | 27.2 | % | 24.6 | % | 21.7 | % | |||||||||||
(1)Gross margin is homebuilding revenues less homebuilding cost of sales.
(2)Includes interest charged to homebuilding cost of sales related to our construction lines of credit and senior unsecured notes, net, as well as lot option fees.
(3)Represents amortization of purchase accounting adjustments from the Company’s prior acquisitions.
(4)Calculated as a percentage of homebuilding revenues.
EBITDA and Adjusted EBITDA
EBITDA and adjusted EBITDA are not measures of net income as determined by GAAP. EBITDA and adjusted EBITDA are supplemental non-GAAP financial measures used by management and external users of our consolidated financial statements, such as industry analysts, investors, lenders and rating agencies. We define EBITDA as net income before (i) interest income, (ii) capitalized interest charged in homebuilding cost of sales, (iii) interest expense, (iv) income tax expense and (v) depreciation and amortization. We define adjusted EBITDA as EBITDA before stock-based compensation.
Management believes EBITDA and adjusted EBITDA are useful because they allow management to more effectively evaluate our operating performance and compare our results of operations from period to period without regard to our financing methods or capital structure or other items that impact the comparability of financial results from period to period. EBITDA and adjusted EBITDA should not be considered as alternatives to, or more meaningful than, net income or any other measure as determined in accordance with GAAP. Our computations of EBITDA and adjusted EBITDA may not be comparable to EBITDA or adjusted EBITDA of other companies. We present EBITDA and adjusted EBITDA because we believe they provide useful information regarding the factors and trends affecting our business. EBITDA and adjusted EBITDA information should be considered only as a supplement to net income information as a measure of our performance.
47
The following table presents a reconciliation of EBITDA and adjusted EBITDA to the GAAP financial measure of net income for each of the periods indicated (unaudited and in thousands, except percentages):
| Year Ended December 31, | |||||||||||||||||
| 2023 | 2022 | 2021 | |||||||||||||||
| Net and comprehensive income attributable to Dream Finders Homes, Inc. | $ | 295,900 | $ | 262,313 | $ | 121,133 | |||||||||||
| Interest income | (4,299) | (169) | (6) | ||||||||||||||
Interest charged to homebuilding cost of sales(1) | 122,759 | 60,595 | 32,508 | ||||||||||||||
| Interest expense | 1 | 32 | 672 | ||||||||||||||
| Income tax expense | 96,483 | 81,859 | 27,455 | ||||||||||||||
Depreciation and amortization(2) | 10,651 | 17,952 | 13,205 | ||||||||||||||
| EBITDA | $ | 521,495 | $ | 422,582 | $ | 194,967 | |||||||||||
| Stock-based compensation | 14,098 | 6,796 | 5,233 | ||||||||||||||
| Adjusted EBITDA | $ | 535,593 | $ | 429,378 | $ | 200,200 | |||||||||||
EBITDA margin %(3) | 13.9% | 12.6% | 10.1% | ||||||||||||||
Adjusted EBITDA margin %(3) | 14.3% | 12.8% | 10.4% | ||||||||||||||
(1)Includes interest charged to homebuilding cost of sales related to our construction lines of credit and senior unsecured notes, net, as well as lot option fees.
(2)Includes amortization of purchase accounting adjustments from prior acquisitions of $7 million and $10 million for the years ended December 31, 2022 and 2021, respectively, which is included in homebuilding cost of sales reported on the Consolidated Statements of Comprehensive Income. For the year ended December 31, 2023, there was no such amortization of fair value adjustments of inventory.
(3)Calculated as a percentage of total revenues.
Liquidity and Capital Resources
Overview
We generate cash from the sale of our inventory and we intend to re-deploy the net cash generated from the sale of inventory to acquire and control land and further grow our operations year over year. We believe that our sources of liquidity are sufficient to satisfy our current commitments. Our liquidity comes from a variety of sources, including cash, borrowings under a credit agreement (the “Credit Agreement”), and net proceeds from the senior unsecured notes (“2028 Notes”).
As of December 31, 2023, we had $494 million in cash and cash equivalents, excluding $54 million of restricted cash.
The Credit Agreement had an aggregate commitment of up to $1.2 billion and $1.1 billion, and outstanding borrowings of $530 million and $965 million as of December 31, 2023 and 2022, respectively. The Company had $334 million of availability under the Credit Agreement with a borrowing base of $1.2 billion as of December 31, 2023.
On August 22, 2023, the Company issued the 8.25% 2028 Notes with $300 million in aggregate principal amount. The Company used the net proceeds from the issuance of the 2028 Notes to repay a portion of the then outstanding borrowings under the Credit Agreement.
Total liquidity as of year-end was $828 million, inclusive of reduced availability under the Credit Agreement for the 2028 Notes, which are permitted unsecured indebtedness. The Credit Agreement will mature on July 17, 2026. Certain of our subsidiaries guaranteed the Company’s obligations under the Credit Agreement and the 2028 Notes.
As of December 31, 2023, we were in compliance with the covenants set forth in our Credit Agreement and under the indenture related to the 2028 Notes. See below and refer to Note 2, Debt to our consolidated financial statements for more information on the Credit Agreement and the 2028 Notes.
48
We continue to evaluate our capital structure and explore options to strengthen our balance sheet. We will remain opportunistic while assessing available capital in the debt and equity markets.
Our principal uses of capital are for lot deposits, lot purchases just-in-time for construction, vertical home construction, operating expenses and the payment of routine liabilities.
Cash flows generated by our projects can differ materially from our results of operations, as these depend upon the stage in the life cycle of each project. The majority of our projects begin at the land acquisition stage when we enter into finished lot option contracts by placing a deposit with a land seller, banker or developer. Our lot deposits are an asset on our balance sheets and these cash outflows are not recognized in our results of operations. Early stages in our communities require material cash outflows relating to finished rolling option lot purchases, entitlements and permitting, construction and furnishing of model homes, roads, utilities, general landscaping and other amenities, as well as ongoing association fees and property taxes. Except for furnishings of model homes, these costs are capitalized within our real estate inventory and are not recognized in our operating income until a home sale closes. As such, we incur significant cash outflows prior to the recognition of revenues.
In later stages of the life cycle of a community, cash inflows could significantly exceed our results of operations, as the cash outflows associated with land purchase and home construction and other expenses were previously incurred.
We actively enter into finished lot option contracts by placing deposits with land sellers based on the aggregate purchase price of the finished lots. When entering into these contracts, we also agree to purchase finished lots at predetermined prices, time frames, and quantities that match our expected selling pace in the community. We also enter into land development arrangements with land sellers, land developers and land bankers. Furthermore, to satisfy performance-related obligations in connection with certain land option agreements, we enter into surety bonds and letters of credit arrangements. Refer to “—Off-Balance Sheet Arrangements” for additional information.
The above cash strategies allow us to maintain adequate lot supply in our existing markets and support ongoing growth and profitability. Although currently there is economic uncertainty that is impacting the homebuilding industry, we continue to operate in geographic regions with consistent increases in demand for new homes and constrained lot and inventory supply compared to population and job growth trends. We intend to continue to reinvest our earnings into our business and focus on expanding our operations. In addition, as the opportunity to purchase finished lots in desired locations becomes increasingly more limited and competitive, we are committed to allocating additional liquidity to land bank deposits on land development projects, as this strategy mitigates the risks associated with holding undeveloped land on our balance sheet, while allowing us to control adequate lot supply in our key markets to support forecasted growth.
Senior Unsecured Notes
On August 22, 2023, the Company issued $300 million in aggregate principal amount of 8.25% senior unsecured notes due August 15, 2028, which were issued pursuant to an indenture (the “Indenture”). Interest on the 2028 Notes is payable in arrears semiannually on each February 15 and August 15. The 2028 Notes are fully and unconditionally guaranteed on a joint and several senior unsecured basis by certain of the Company’s subsidiaries.
The Company received net proceeds from the issuance and sale of the 2028 Notes of $294 million after unamortized debt issuance costs of $7 million, which reduce the carrying value of the 2028 Notes reported on the Consolidated Balance Sheets. The net proceeds from the 2028 Notes were used to repay a portion of the then outstanding balance under the Company’s Credit Agreement.
The 2028 Notes are redeemable by the Company prior to August 15, 2025 through the payment of the principal amount due, which can be accomplished through the issuance of certain restricted equity offerings for specified portions of principal notes outstanding, plus specified rates and accrued and unpaid interest, and a make-whole premium in the event 100% of the principal amount is redeemed. On or after August 15, 2025, the 2028 Notes are redeemable at specified rates equal to 104.1% of the principal balance, plus accrued and unpaid interest, and periodically decrease to 100% on August 15, 2027. Upon the occurrence of a Change of Control (as defined in the Indenture), the holders of the 2028 Notes will have the right to require the Company to repurchase all or a portion of the 2028 Notes at a price equal to 101% of the aggregate principal amount of the 2028 Notes, plus any accrued and unpaid interest.
The Indenture includes customary events of default. Subject to specified exceptions, the Indenture contains certain restrictive covenants that, among other things, limit our ability to incur or guarantee certain indebtedness, issue certain equity interests or engage in certain capital stock transactions. In addition, the Indenture contains certain limitations related to mergers, consolidations, and transfers of assets.
49
Credit Agreement
On July 19, 2023, the Company entered into amendments to its existing credit agreement. As amended, the Credit Agreement provides for a senior unsecured revolving credit facility with a syndicate of lenders with Bank of America, N.A. acting as administrative agent. The Credit Agreement provides for aggregate commitments of $1,240 million, which includes a $25 million letter of credit sublimit, is subject to a borrowing base, and has an accordion feature which allows the facility to expand up to $1,625 million. The maturity date for lenders with $1,085 million worth of commitments is July 17, 2026. The remaining lenders have a maturity date of June 2, 2025, but such lenders have the option, with the Company’s consent, to extend their applicable maturity date to July 17, 2026.
Outstanding borrowings under the Credit Agreement are subject to, among other things, a borrowing base. The borrowing base includes, among other things, (a) 90% of the net book value of presold housing units, (b) 85% of the net book value of model housing units, (c) 85% of the net book value of speculative housing units, (d) 70% of the net book value of finished lots, (e) 85% of the net book value of certain built-for-rent units, and (f) 75% of the net book value of other built-for-rent units, in each case subject to certain exceptions and limitations set forth in the Credit Agreement. The borrowing base availability is reduced dollar-for-dollar for any outstanding unsecured indebtedness permitted under the Credit Agreement.
Under the Credit Agreement, the Company has the option to draw “Term SOFR Rate Loans” or “Daily Simple SOFR Rate Loans”. Term SOFR Rate Loans bear interest based on Term SOFR rates for one, three or six-month interest periods, which include SOFR adjustments of 10, 15 and 25 basis points for each interest period, respectively. Daily Simple SOFR Rate Loans bear interest based on Daily Simple SOFR rates and include a SOFR adjustment of 10 basis points. Interest under Term SOFR Rate Loans and Daily Simple SOFR Rate Loans also include an “applicable rate margin” determined based on the Company’s net debt to capitalization ratio, equivalent to credit spreads of 2.5% to 3.3%.
The Credit Agreement contains covenants that, among other things, require that we (i) maintain a maximum debt to capitalization ratio, as of the last day of each fiscal quarter, of 60.0%; (ii) maintain an interest coverage ratio, as of the last day of each fiscal quarter, of not less than 2.0 to 1.0; (iii) maintain a liquidity ratio, as of the last day of each fiscal quarter, of not less than 1.0 to 1.0; (iv) maintain tangible net worth of not less than the sum of (A) $607 million, (B) 50.0% of net income earned in each fiscal quarter after March 31, 3023 and (C) 50.0% of the aggregate increases in shareholders’ equity of the consolidated group after March 31, 2023 by reason of the issuance and sale of equity interests of the members of the consolidated group; (v) maintain a risk assets ratio (defined as (A) the sum of the GAAP net book value for all finished lots, lots under development and land held for future development or disposition to (B) tangible net worth), as of the last day of each fiscal quarter, of no more than 1.0 to 1.0; (vi) not allow aggregate investments in unconsolidated affiliates to exceed 15.0% of tangible net worth, as of the last day of any fiscal quarter; and (vii) not incur indebtedness other than, among other things, (A) the obligations under the Credit Agreement, (B) non-recourse indebtedness in an amount not to exceed 15.0% of tangible net worth, as of the last day of each fiscal quarter, (C) operating lease liabilities, finance lease liabilities and purchase money obligations for fixed or capital assets not to exceed $5 million in the aggregate, (D) indebtedness of financial services subsidiaries and variable interest entities, (E) indebtedness under hedge contracts entered into for purposes other than for speculative purposes, and (F) permitted unsecured indebtedness (including the 2028 Notes). The Company was in compliance with all debt covenants as of December 31, 2023 and 2022. The Company expects to remain in compliance with all debt covenants over the next 12 months.
The Company had capitalized debt issuance costs, net of amortization, related to construction lines of credit totaling $7 million as of both December 31, 2023 and 2022, which were included in other assets on the Consolidated Balance Sheets. Debt issuance costs that are recorded to capitalized interest are expensed in cost of sales as the homes close.
Contingent Consideration
Based on the terms of the purchase agreement, at the time of an acquisition, the Company may record a contingent consideration liability based on the expected fair value of any future earn out payments due to the acquiree for a typical period of up to five years post-acquisition. This liability is remeasured to fair value quarterly and the adjustment is recorded in contingent consideration revaluation in the Consolidated Statements of Comprehensive Income. As of December 31, 2023, the contingent consideration liability totaled $117 million, with approximately $50 million payable within 12 months. Further information regarding our contingent consideration liability is provided in Note 1, Nature of Business and Significant Accounting Policies to our consolidated financial statements.
50
Leases
The Company has operating leases primarily associated with office space that is used by divisions outside of the Jacksonville area, model home sale-leasebacks and a corporate office building sale-leaseback. The Company also has finance leases for corporate office furniture. As of December 31, 2023, the future minimum lease payments required under these leases totaled $25 million, with $7 million payable within 12 months. Further information regarding our leases is provided in Note 5, Commitments and Contingencies to our consolidated financial statements.
Series B Preferred Units
On August 31, 2023, the Company redeemed all of its previously outstanding Series B preferred units. The Company made an aggregate cash payment to the Series B holders of $11 million, which included $7 million in principal plus cumulative undistributed earnings, less a negotiated discount on that date. Following the redemption, no Series B preferred units remain outstanding. Refer to Note 12, Mezzanine and Stockholders’ Equity to the consolidated financial statements for disclosure related to the redemption.
Convertible Preferred Stock
On September 29, 2021, we sold 150,000 shares of newly-created convertible preferred stock with an initial liquidation preference of $1,000 per share and a par value $0.01 per share, for an aggregate purchase price of $150 million. We used the proceeds from the sale of the convertible preferred stock to partially fund the MHI acquisition and for general corporate purposes. Pursuant to the Certificate of Designations, the convertible preferred stock ranks senior to the Class A and B common stock with respect to dividends and distributions on liquidation, winding-up and dissolution. Accordingly, upon a liquidation, dissolution or winding up of the Company, each share of convertible preferred stock is entitled to receive the initial liquidation preference of $1,000 per share, subject to adjustment, plus all accrued and unpaid dividends thereon. In addition, the convertible preferred stock has the following terms:
•Cumulative Dividends: The convertible preferred stock accumulates cumulative dividends at a rate per annum equal to 9% payable quarterly in arrears.
•Duration: The convertible preferred stock is perpetual with call and conversion rights. The convertible preferred stock is not convertible by the Purchasers in the first five years following issuance, with the exception of the acceleration of the Conversion Right (as defined below) upon breach of the protective covenants (described below). We can call the outstanding convertible preferred stock at any time for one-hundred and two percent (102%) of its liquidation preference during the fourth year following its issuance and for one-hundred and one percent (101%) of its liquidation preference during the fifth year following its issuance, plus accrued but unpaid dividends, if any. Subsequent to the fifth anniversary of its issuance, a purchaser can convert the convertible preferred stock into Class A common stock (the “Conversion Right”). The conversion price will be based on the average of the ninety trading days for the Class A common stock immediately preceding but not including the date of the optional conversion notice (as defined in the certificate of designations for the convertible preferred stock), less 20% of the average and subject to a floor conversion price of $4.00 (the “Conversion Discount”).
•Protective Covenants: The protective covenants of the convertible preferred stock require us to maintain compliance with all covenants related to (i) the Credit Agreement, as may be further amended from time to time; provided that any amendment, restatement, modification or waiver of the Credit Agreement that would adversely and materially affect the rights of the Purchasers will require the written consent of holders of a majority of the then-outstanding shares of convertible preferred stock; and (ii) any agreement between the Company and any Purchaser (the covenants referred to in clauses (i) and (ii), collectively, the “Protective Covenants”). Non-compliance beyond any applicable cure period with the Protective Covenants (in the case of the Protective Covenants related to the Credit Agreement) will accelerate the Conversion Right, and in the event of such acceleration that occurs before the fifth anniversary following the issuance of the convertible preferred stock, the Conversion Discount shall be increased from 20% to 25%.
•Voting Rights: Except as may be expressly required by Delaware law, the shares of convertible preferred stock have no voting rights.
51
•Redemption in a Change of Control: The convertible preferred stock will be redeemed, contingent upon and concurrently with the consummation of a change of control of the Company. Shares of convertible preferred stock will be redeemed in a change of control of the Company at a price, in cash, equal to the liquidation preference, subject to adjustment, plus all accumulated and unpaid dividends, plus, if the change of control occurs before the fourth anniversary of the date of issuance of the convertible preferred stock, a premium equal to the dividends that would have accumulated on such share of convertible preferred stock from and after the change of control redemption date and through the fourth anniversary of the issuance of the convertible preferred stock.
Pursuant to the terms of the Certificate of Designations, unless and until approval of the Company’s stockholders is obtained, no shares of Class A common stock will be issued or delivered upon conversion of any convertible preferred stock to the extent that such issuance would (i) result in the holder beneficially owning in excess of 19.99% of the outstanding Class A common stock as of the date of the Certificate of Designations or (ii) exceed 19.99% of the outstanding shares of Class A and Class B common stock combined as of the date of the Certificate of Designations.
Cash Flows
The following table summarizes our cash flows for the periods indicated (in thousands):
| Year Ended December 31, | ||||||||||||||||||||
| 2023 | 2022 | 2021 | ||||||||||||||||||
| Net cash provided by/(used in) operating activities | $ | 374,234 | $ | (27,623) | $ | 64,972 | ||||||||||||||
| Net cash used in investing activities | (4,484) | (5,524) | (523,043) | |||||||||||||||||
| Net cash (used in)/provided by financing activities | (216,424) | 146,955 | 646,020 | |||||||||||||||||
Year Ended December 31, 2023 Compared to Year Ended December 31, 2022
Net cash provided by operating activities was $374 million for the year ended December 31, 2023, compared to $28 million of net cash used in operating activities for the year ended December 31, 2022. The change in net cash provided by operating activities was primarily driven by a lower increase in inventories when compared to the prior year of $250 million, as well as higher net income in 2023, largely driven by an increase in home closings when compared to 2022. There was also a decrease in lot deposits in 2023, compared to an increase in lot deposits in 2022. Customer deposits also increased versus a decrease in customer deposits in the prior year.
Net cash used in investing activities was $4 million for the year ended December 31, 2023, compared to $6 million of cash used in investing activities for the year ended December 31, 2022, primarily attributable to higher purchases of property and equipment during the year ended December 31, 2022.
Net cash used in financing activities was $216 million for the year ended December 31, 2023, as compared to $147 million of cash provided by financing activities for the year ended December 31, 2022. The change in net cash used in financing activities was primarily attributable to higher net payments on the construction lines of credit of $436 million in 2023 compared to $203 million of net proceeds in 2022, and to a lesser extent, a one-time payment related to the redemption of the Series B preferred units during the year ended December 31, 2023. The full net proceeds from the issuance of unsecured senior notes of $300 million during the year were used to pay down a portion of the outstanding balance under the Credit Agreement.
Refer to the Form 10-K for the year ended December 31, 2022 filed on March 2, 2023 for the cash flows and related discussion for December 31, 2022 compared to year ended December 31, 2021.
52
Off-Balance Sheet Arrangements
Asset-Light Lot Acquisition Strategy
We employ an asset-light and cost-effective lot acquisition strategy to achieve our growth goals. This strategy involves two key approaches: finished lot option contracts and land bank option contracts. These contracts grant us the right to purchase finished lots at predetermined fixed prices from various land developers, sellers, and land bank partners. Our sole legal obligation and economic loss as a result of such forfeitures is limited to the amount of the deposits paid pursuant to such option contracts and, in the case of land bank option contracts, our loss is limited to the related lot option fees paid to the land bank partner, any potential performance obligations, management of the land development to completion and any cost overruns relative to the project.
As of December 31, 2023, our lot deposits for finished lot option and land bank option contracts that are within the Consolidated Balance Sheets were $247 million. As of December 31, 2023, we controlled 29,748 lots under finished lot option and land bank option contracts.
Refer to “Item 1. Business—Land Acquisition and Development Process” for more information.
Surety Bonds, Letters of Credit and Financial Guarantees
We enter into surety bonds and letters of credit arrangements with local municipalities, government agencies and land developers. These arrangements relate to certain performance-related obligations and serve as security for certain land option agreements.
As of December 31, 2023, we had outstanding surety bonds and letters of credit totaling $195 million and $1 million, respectively. We believe we will fulfill our obligations under the related arrangements and do not anticipate any material losses under these surety bonds and letters of credit.
Critical Accounting Policies and Estimates
We prepare our consolidated financial statements in accordance with GAAP. Our critical accounting policies are those that we believe have the most significant impact to the presentation of our financial position and results of operations and that require the most difficult, subjective or complex judgments. In many cases, the accounting treatment of a transaction is specifically dictated by GAAP without the need for the application of judgment.
In certain circumstances, however, the preparation of consolidated financial statements in conformity with GAAP requires us to make certain estimates, judgments and assumptions that affect the reported amounts of assets and liabilities and disclosure of contingent assets and liabilities as of the date of the consolidated financial statements, as well as the reported amounts of revenues and expenses during the reporting period.
While our significant accounting policies are more fully described in Note 1, Nature of Business and Significant Accounting Policies to our consolidated financial statements, we believe the following topics reflect our critical accounting policies and our more significant judgment and estimates used in the preparation of our consolidated financial statements.
Revenue Recognition
We recognize revenue in two ways in accordance with Accounting Standards Codification (“ASC”) 606. This includes revenues from home sales with respect to homes that we construct on homesites to which we own title that are recorded at the time each home sale is closed and title and possession are transferred to the buyer, or upon delivery of homes sold to third-party investors intending to lease the homes, as well as revenues from home sales in which the buyer retains title to the homesite while we build the home that are recognized based on the percentage of completion of the home construction, which is measured on a quarterly basis. We determine the percentage of completion based on the number of days of construction completed to the total estimated number of days to construct the home.
53
Real Estate Inventory and Homebuilding Cost of Sales
Inventories include the cost of direct land acquisition, land development, construction, capitalized interest, lot option fees, real estate taxes and direct overhead costs incurred related to land acquisition and development and home construction. Indirect overhead costs are charged to selling, general and administrative expense as incurred.
Land and development costs are typically allocated to individual residential lots on a pro rata basis based on the number of lots in the development, and the costs of residential lots are transferred to construction work in progress when home construction begins. Sold units are expensed on a specific identification basis as homebuilding cost of sales. Homebuilding cost of sales for homes closed includes the specific construction costs of each home and all applicable land acquisition, land development and related costs allocated to each residential lot.
Inventories are carried at the lower of accumulated cost or net realizable value. We periodically review the performance and outlook of our inventories for indicators of potential impairment.
Business Combinations and Valuation of Contingent Consideration
The Company accounts for business combinations using the acquisition method. Under ASC 805 a business combination occurs when an entity obtains control of a “business.” The Company determines whether or not the gross assets acquired meet the definition of a business. If they meet this criteria, the Company accounts for the transaction as a stock purchase. If they do not meet this criteria the transaction is accounted for as an asset purchase. The consideration transferred in the acquisition is generally measured at fair value, as are the identifiable net assets acquired. Any goodwill that arises is tested annually for impairment. Any gain on a bargain purchase is recognized in profit or loss immediately. Transaction costs are expensed as incurred, except if related to the issuance of debt or equity securities. Any contingent consideration is measured at fair value at the date of acquisition and is based on expected cash flow of the acquisition target discounted over time using an observable market discount rate. The Company generally utilizes outside valuation experts to determine the amount of contingent consideration. Contingent consideration is remeasured at fair value at each reporting date and subsequent changes in the fair value of the contingent consideration are recognized in other income or other expense in the Consolidated Statements of Comprehensive Income.
Recent Accounting Pronouncements
Refer to Note 1, Nature of Business and Significant Accounting Policies to our consolidated financial statements.
ITEM 7A. QUANTITATIVE AND QUALITATIVE DISCLOSURES ABOUT MARKET RISK
Our operations are interest-rate sensitive. As overall housing demand is adversely affected by increases in interest rates, a significant increase in interest rates may negatively affect the ability of homebuyers to secure adequate financing. Higher interest rates could adversely affect our revenues, gross margins and net income. We do not enter into, nor do we intend to enter into in the future, derivative financial instruments for trading or speculative purposes to hedge against interest rate fluctuations.
Quantitative and Qualitative Disclosures About Interest Rate Risk
Market risk is the risk of loss arising from adverse changes in market prices and interest rates. Our market risk arises from interest rate risk inherent in our financial instruments and debt obligations. Interest rate risk results from the possibility that changes in interest rates will cause unfavorable changes in net income or in the value of interest rate sensitive assets, liabilities and commitments. Lower interest rates tend to increase demand for mortgage loans for home purchasers, while higher interest rates make it more difficult for potential borrowers to purchase residential properties and to qualify for mortgage loans. We have no market rate-sensitive instruments held for speculative or trading purposes.
Under the Credit Agreement, the Company has the option to draw “Term SOFR Rate Loans” or “Daily Simple SOFR Rate Loans”. Term SOFR Rate Loans bear interest based on Term SOFR rates for one, three or six-month interest periods, which include SOFR adjustments of 10, 15 and 25 basis points for each interest period, respectively. Daily Simple SOFR Rate Loans bear interest based on Daily Simple SOFR rates and include a SOFR adjustment of 10 basis points. Interest under Term SOFR Rate Loans and Daily Simple SOFR Rate Loans also include an “applicable rate margin” determined based on the Company’s net debt to capitalization ratio, equivalent to credit spreads of 2.5% to 3.3%.
54
Interest on Base Rate or Daily Simple SOFR Rate advances borrowed under the Credit Agreement are payable in arrears on a monthly basis. Interest on Term SOFR rate advances borrowed under the Credit Agreement are payable in arrears at the end of the interest period applicable to such advance, or, if less than such interest period, three months after the beginning of such interest period. The Company pays the lenders a commitment fee on the amount of the unused commitments on a quarterly basis at a rate per annum that will vary from 0.20% to 0.30% depending on the Company’s debt to capitalization ratio.
Outstanding borrowings under the Credit Agreement are subject to, among other things, a borrowing base. The borrowing base includes, among other things, (a) 90% of the net book value of presold housing units, (b) 85% of the net book value of model housing units, (c) 85% of the net book value of speculative housing units, (d) 70% of the net book value of finished lots, (e) 85% of the net book value of certain built-for-rent units, and (f) 75% of the net book value of other built-for-rent units, in each case subject to certain exceptions and limitations set forth in the Credit Agreement. The borrowing base availability is reduced dollar-for-dollar for any outstanding unsecured indebtedness permitted under the Credit Agreement.
Our mortgage banking joint venture, Jet HomeLoans, is exposed to interest rate risk as it relates to its lending activities. Jet HomeLoans underwrites and originates mortgage loans, which are sold through either optional or mandatory forward delivery contracts into the secondary markets. The loan portfolio of Jet HomeLoans is held for sale and subject to forward sale commitments. Jet HomeLoans also sells all of its mortgages held for sale on a servicing released basis.
55
ITEM 8. FINANCIAL STATEMENTS AND SUPPLEMENTARY DATA
Dream Finders Homes, Inc. and Subsidiaries
Index
56
Report of Independent Registered Public Accounting Firm
To the Board of Directors and Stockholders of Dream Finders Homes, Inc.
Opinions on the Financial Statements and Internal Control over Financial Reporting
We have audited the accompanying consolidated balance sheets of Dream Finders Homes, Inc. and its subsidiaries (the “Company”) as of December 31, 2023 and 2022, and the related consolidated statements of comprehensive income, of equity and of cash flows for each of the three years in the period ended December 31, 2023, including the related notes (collectively referred to as the “consolidated financial statements”). We also have audited the Company's internal control over financial reporting as of December 31, 2023, based on criteria established in Internal Control - Integrated Framework (2013) issued by the Committee of Sponsoring Organizations of the Treadway Commission (COSO).
In our opinion, the consolidated financial statements referred to above present fairly, in all material respects, the financial position of the Company as of December 31, 2023 and 2022, and the results of its operations and its cash flows for each of the three years in the period ended December 31, 2023 in conformity with accounting principles generally accepted in the United States of America. Also in our opinion, the Company maintained, in all material respects, effective internal control over financial reporting as of December 31, 2023, based on criteria established in Internal Control - Integrated Framework (2013) issued by the COSO.
Basis for Opinions
The Company's management is responsible for these consolidated financial statements, for maintaining effective internal control over financial reporting, and for its assessment of the effectiveness of internal control over financial reporting, included in Management’s Annual Report on Internal Control over Financial Reporting appearing under Item 9A. Our responsibility is to express opinions on the Company’s consolidated financial statements and on the Company's internal control over financial reporting based on our audits. We are a public accounting firm registered with the Public Company Accounting Oversight Board (United States) (PCAOB) and are required to be independent with respect to the Company in accordance with the U.S. federal securities laws and the applicable rules and regulations of the Securities and Exchange Commission and the PCAOB.
We conducted our audits in accordance with the standards of the PCAOB. Those standards require that we plan and perform the audits to obtain reasonable assurance about whether the consolidated financial statements are free of material misstatement, whether due to error or fraud, and whether effective internal control over financial reporting was maintained in all material respects.
Our audits of the consolidated financial statements included performing procedures to assess the risks of material misstatement of the consolidated financial statements, whether due to error or fraud, and performing procedures that respond to those risks. Such procedures included examining, on a test basis, evidence regarding the amounts and disclosures in the consolidated financial statements. Our audits also included evaluating the accounting principles used and significant estimates made by management, as well as evaluating the overall presentation of the consolidated financial statements. Our audit of internal control over financial reporting included obtaining an understanding of internal control over financial reporting, assessing the risk that a material weakness exists, and testing and evaluating the design and operating effectiveness of internal control based on the assessed risk. Our audits also included performing such other procedures as we considered necessary in the circumstances. We believe that our audits provide a reasonable basis for our opinions.
Definition and Limitations of Internal Control over Financial Reporting
A company’s internal control over financial reporting is a process designed to provide reasonable assurance regarding the reliability of financial reporting and the preparation of financial statements for external purposes in accordance with generally accepted accounting principles. A company’s internal control over financial reporting includes those policies and procedures that (i) pertain to the maintenance of records that, in reasonable detail, accurately and fairly reflect the transactions and dispositions of the assets of the company; (ii) provide reasonable assurance that transactions are recorded as necessary to permit preparation of financial statements in accordance with generally accepted accounting principles, and that receipts and expenditures of the company are being made only in accordance with authorizations of management and directors of the company; and (iii) provide reasonable assurance regarding prevention or timely detection of unauthorized acquisition, use, or disposition of the company’s assets that could have a material effect on the financial statements.
57
Because of its inherent limitations, internal control over financial reporting may not prevent or detect misstatements. Also, projections of any evaluation of effectiveness to future periods are subject to the risk that controls may become inadequate because of changes in conditions, or that the degree of compliance with the policies or procedures may deteriorate.
Critical Audit Matters
The critical audit matter communicated below is a matter arising from the current period audit of the consolidated financial statements that was communicated or required to be communicated to the audit committee and that (i) relates to accounts or disclosures that are material to the consolidated financial statements and (ii) involved our especially challenging, subjective, or complex judgments. The communication of critical audit matters does not alter in any way our opinion on the consolidated financial statements, taken as a whole, and we are not, by communicating the critical audit matter below, providing a separate opinion on the critical audit matter or on the accounts or disclosures to which it relates.
Valuation of Contingent Consideration
As described in Note 1 to the consolidated financial statements, the Company has recorded contingent consideration related to the acquisition of McGuyer Homebuilders, Inc. in 2021. Management recorded the fair value of the contingent consideration as a liability on the acquisition date. The estimated earn-out payments are subsequently remeasured to fair value at each reporting date based on the estimated future earnings of the acquired entity and the reassessment of risk-adjusted discount rates. The measurement of contingent consideration was based on projected cash flows such as revenues, gross margin, overhead expenses, and pre-tax income and discounted to present value using the discounted cash flow method. As of December 31, 2023, the liability for contingent consideration was $116.8 million.
The principal considerations for our determination that performing procedures relating to the valuation of contingent consideration is a critical audit matter are (i) the significant judgment by management when estimating the fair value of contingent consideration; (ii) a high degree of auditor judgment, subjectivity, and effort in performing procedures and evaluating management’s significant assumptions related to projected revenue, gross margin and pre-tax income; and (iii) the audit effort involved the use of professionals with specialized skill and knowledge.
Addressing the matter involved performing procedures and evaluating audit evidence in connection with forming our overall opinion on the consolidated financial statements. These procedures included testing the effectiveness of controls relating to management’s remeasurement of the contingent consideration, including controls over the projected revenue, gross margin and pre-tax income applied in the contingent consideration valuation calculation. These procedures also included, among others, testing management’s process for estimating the fair value of contingent consideration, which included evaluating the appropriateness of the discounted cash flow method, testing the completeness and accuracy of data used in the method, and evaluating the reasonableness of management’s significant assumptions related to projected revenue, gross margin and pre-tax income. Evaluating the reasonableness of the projected revenue, gross margin and pre-tax income involved considering the past performance of the acquired business, as well as economic and industry forecasts. Professionals with specialized skill and knowledge were used to assist in the evaluation of the appropriateness of the discounted cash flow method.
/s/ PricewaterhouseCoopers LLP
February 29, 2024
We have served as the Company’s auditor since 2019, which includes periods before the Company became subject to SEC reporting requirements.
58
DREAM FINDERS HOMES, INC.
CONSOLIDATED BALANCE SHEETS
(In thousands, except per share and share amounts)
| December 31, 2023 | December 31, 2022 | ||||||||||
| Assets | |||||||||||
| Cash and cash equivalents | $ | $ | |||||||||
| Restricted cash | |||||||||||
| Accounts receivable | |||||||||||
| Inventories | |||||||||||
| Lot deposits | |||||||||||
| Other assets | |||||||||||
| Investments in unconsolidated entities | |||||||||||
| Property and equipment, net | |||||||||||
| Right-of-use assets | |||||||||||
| Goodwill | |||||||||||
| Total assets | $ | $ | |||||||||
| Liabilities | |||||||||||
| Accounts payable | $ | $ | |||||||||
| Accrued expenses | |||||||||||
| Customer deposits | |||||||||||
| Construction lines of credit | |||||||||||
| Senior unsecured notes, net | |||||||||||
| Lease liabilities | |||||||||||
| Contingent consideration | |||||||||||
| Total liabilities | |||||||||||
Commitments and contingencies (Note 5) | |||||||||||
| Mezzanine Equity | |||||||||||
| Preferred mezzanine equity | |||||||||||
| Stockholders’ Equity | |||||||||||
Class A common stock, $ | |||||||||||
Class B common stock, $ | |||||||||||
| Additional paid-in capital | |||||||||||
| Retained earnings | |||||||||||
| Noncontrolling interests | |||||||||||
| Total mezzanine and stockholders’ equity | |||||||||||
| Total liabilities, mezzanine equity and stockholders’ equity | $ | $ | |||||||||
The accompanying notes are an integral part of these consolidated financial statements.
59
DREAM FINDERS HOMES, INC.
CONSOLIDATED STATEMENTS OF COMPREHENSIVE INCOME
(In thousands, except per share and share amounts)
| Year Ended December 31, | |||||||||||||||||
| 2023 | 2022 | 2021 | |||||||||||||||
| Revenues: | |||||||||||||||||
| Homebuilding | $ | $ | $ | ||||||||||||||
| Other | |||||||||||||||||
| Total revenues | |||||||||||||||||
| Homebuilding cost of sales | |||||||||||||||||
| Selling, general and administrative expense | |||||||||||||||||
| Income from unconsolidated entities | ( | ( | ( | ||||||||||||||
| Contingent consideration revaluation | |||||||||||||||||
| Other income, net | ( | ( | ( | ||||||||||||||
Income before taxes | |||||||||||||||||
Income tax expense | ( | ( | ( | ||||||||||||||
| Net and comprehensive income | $ | $ | $ | ||||||||||||||
| Net and comprehensive income attributable to noncontrolling interests | ( | ( | ( | ||||||||||||||
| Net and comprehensive income attributable to Dream Finders Homes, Inc. | $ | $ | $ | ||||||||||||||
| Earnings per share | |||||||||||||||||
| Basic | $ | $ | $ | ||||||||||||||
| Diluted | $ | $ | $ | ||||||||||||||
| Weighted-average number of shares | |||||||||||||||||
| Basic | |||||||||||||||||
| Diluted | |||||||||||||||||
The accompanying notes are an integral part of these consolidated financial statements.
60
DREAM FINDERS HOMES, INC.
CONSOLIDATED STATEMENTS OF EQUITY
(In thousands, except share amounts)
| Redeemable Preferred Units/Stock Mezzanine | Redeemable Common Units Mezzanine | Common Units Members’ | Common Stock - Class A | Common Stock - Class B | Additional Paid-in Capital | Retained Earnings | Total Non- Controlling Interests | Total Equity | |||||||||||||||||||||||||||||||||||||||||||||||||||||||||||||||||||||||||||
| Units | Amount | Units | Amount | Units | Amount | Shares | Amount | Shares | Amount | ||||||||||||||||||||||||||||||||||||||||||||||||||||||||||||||||||||||||||
| Balance as of December 31, 2020 | $ | $ | $ | $ | $ | $ | $ | $ | $ | ||||||||||||||||||||||||||||||||||||||||||||||||||||||||||||||||||||||||||
| Reorganization transactions | ( | ( | ( | ( | ( | ( | — | — | |||||||||||||||||||||||||||||||||||||||||||||||||||||||||||||||||||||||||||
| Issuance of common stock, net | — | — | — | — | — | — | — | — | — | — | |||||||||||||||||||||||||||||||||||||||||||||||||||||||||||||||||||||||||
| Issuance of convertible preferred stock | — | — | — | — | — | — | — | — | — | — | — | ||||||||||||||||||||||||||||||||||||||||||||||||||||||||||||||||||||||||
| Stock-based compensation | — | — | — | — | — | — | — | — | — | — | — | — | |||||||||||||||||||||||||||||||||||||||||||||||||||||||||||||||||||||||
| Contributions | — | — | — | — | — | — | — | — | — | — | — | — | |||||||||||||||||||||||||||||||||||||||||||||||||||||||||||||||||||||||
| Redemptions | ( | ( | — | — | — | — | — | — | — | — | — | — | — | ( | |||||||||||||||||||||||||||||||||||||||||||||||||||||||||||||||||||||
| Distributions | — | ( | — | ( | — | ( | — | — | — | — | — | ( | ( | ( | |||||||||||||||||||||||||||||||||||||||||||||||||||||||||||||||||||||
| Preferred stock dividends declared | — | — | — | — | — | — | — | — | — | — | — | ( | — | ( | |||||||||||||||||||||||||||||||||||||||||||||||||||||||||||||||||||||
| Net income and comprehensive income | — | — | ( | — | ( | — | — | — | — | — | |||||||||||||||||||||||||||||||||||||||||||||||||||||||||||||||||||||||||
| Balance as of December 31, 2021 | $ | $ | $ | $ | $ | $ | $ | $ | $ | ||||||||||||||||||||||||||||||||||||||||||||||||||||||||||||||||||||||||||
| Stock-based compensation | — | — | — | — | — | — | — | — | — | — | |||||||||||||||||||||||||||||||||||||||||||||||||||||||||||||||||||||||||
| Distributions | — | — | — | — | — | — | — | — | — | — | — | — | ( | ( | |||||||||||||||||||||||||||||||||||||||||||||||||||||||||||||||||||||
| Preferred stock dividends declared | — | — | — | — | — | — | — | — | — | — | — | ( | — | ( | |||||||||||||||||||||||||||||||||||||||||||||||||||||||||||||||||||||
| Net income and comprehensive income | — | — | — | — | — | — | — | — | — | — | |||||||||||||||||||||||||||||||||||||||||||||||||||||||||||||||||||||||||
| Balance as of December 31, 2022 | $ | $ | $ | $ | $ | $ | $ | $ | $ | ||||||||||||||||||||||||||||||||||||||||||||||||||||||||||||||||||||||||||
| Stock-based compensation | — | — | — | — | — | — | — | — | — | — | — | — | |||||||||||||||||||||||||||||||||||||||||||||||||||||||||||||||||||||||
| Vesting of stock-based compensation | — | — | — | — | — | — | — | — | ( | — | — | ||||||||||||||||||||||||||||||||||||||||||||||||||||||||||||||||||||||||
| Withholding of common stock for taxes | — | — | — | — | — | — | ( | — | — | — | ( | — | — | ( | |||||||||||||||||||||||||||||||||||||||||||||||||||||||||||||||||||||
| Distributions | — | — | — | — | — | — | — | — | — | — | — | — | ( | ( | |||||||||||||||||||||||||||||||||||||||||||||||||||||||||||||||||||||
| Redemption of Series B preferred units | ( | ( | — | — | — | — | — | — | — | — | ( | — | ( | ||||||||||||||||||||||||||||||||||||||||||||||||||||||||||||||||||||||
| Preferred stock dividends declared | — | — | — | — | — | — | — | — | — | — | — | ( | — | ( | |||||||||||||||||||||||||||||||||||||||||||||||||||||||||||||||||||||
| Net income and comprehensive income | — | — | — | — | — | — | — | — | — | — | |||||||||||||||||||||||||||||||||||||||||||||||||||||||||||||||||||||||||
| Balance as of December 31, 2023 | $ | $ | $ | $ | $ | $ | $ | $ | $ | ||||||||||||||||||||||||||||||||||||||||||||||||||||||||||||||||||||||||||
The accompanying notes are an integral part of these consolidated financial statements.
61
DREAM FINDERS HOMES, INC.
CONSOLIDATED STATEMENTS OF CASH FLOWS
(In thousands)
| Year Ended December 31, | |||||||||||||||||
| 2023 | 2022 | 2021 | |||||||||||||||
| Cash Flows from Operating Activities | |||||||||||||||||
| Net and comprehensive income | $ | $ | $ | ||||||||||||||
| Adjustments to reconcile net and comprehensive income to net cash provided by/(used in) operating activities | |||||||||||||||||
| Depreciation and amortization | |||||||||||||||||
| Gain on sale of property and equipment | ( | ( | ( | ||||||||||||||
| Extinguishment of unamortized debt issuance costs | |||||||||||||||||
| Amortization of lease right-of-use assets | |||||||||||||||||
| Stock-based compensation | |||||||||||||||||
| Income from Paycheck Protection Program | |||||||||||||||||
| Deferred income tax benefit | ( | ( | ( | ||||||||||||||
| Return on investments, net of income from unconsolidated entities | ( | ( | |||||||||||||||
| Contingent consideration revaluation | |||||||||||||||||
| Payments of contingent consideration | ( | ( | |||||||||||||||
| Changes in Operating Assets and Liabilities | |||||||||||||||||
| Accounts receivable | ( | ( | |||||||||||||||
| Inventories | ( | ( | ( | ||||||||||||||
| Lot deposits | ( | ( | |||||||||||||||
| Other assets | ( | ( | ( | ||||||||||||||
| Accounts payable and accrued expenses | |||||||||||||||||
| Customer deposits | ( | ||||||||||||||||
| Lease liabilities | ( | ( | ( | ||||||||||||||
| Net cash provided by/(used in) operating activities | ( | ||||||||||||||||
| Cash Flows from Investing Activities | |||||||||||||||||
| Purchase of property and equipment | ( | ( | ( | ||||||||||||||
| Proceeds from disposal of property and equipment | |||||||||||||||||
| Investments in unconsolidated entities | ( | ( | ( | ||||||||||||||
| Return of investments from unconsolidated entities | |||||||||||||||||
| Business combinations, net of cash acquired | ( | ( | |||||||||||||||
| Net cash used in investing activities | ( | ( | ( | ||||||||||||||
| Cash Flows from Financing Activities | |||||||||||||||||
| Proceeds from senior unsecured notes | |||||||||||||||||
| Proceeds from construction lines of credit | |||||||||||||||||
| Repayments on construction lines of credit | ( | ( | ( | ||||||||||||||
| Payments of debt issuance costs | ( | ( | ( | ||||||||||||||
| Proceeds from common stock issuance | |||||||||||||||||
| Proceeds from issuance of convertible preferred stock | |||||||||||||||||
| Payments of equity issuance costs | ( | ||||||||||||||||
| Payments of preferred stock dividends | ( | ( | |||||||||||||||
| Payments for common stock withheld for taxes | ( | ||||||||||||||||
Conversion of LLC units | ( | ||||||||||||||||
| Contributions | |||||||||||||||||
| Distributions | ( | ( | ( | ||||||||||||||
| Redemptions of preferred units | ( | ( | |||||||||||||||
| Payments of contingent consideration | ( | ( | ( | ||||||||||||||
| Net cash (used in)/provided by financing activities | ( | ||||||||||||||||
| Net increase in cash, cash equivalents and restricted cash | |||||||||||||||||
Cash, cash equivalents and restricted cash at beginning of period | |||||||||||||||||
Cash, cash equivalents and restricted cash at end of period | $ | $ | $ | ||||||||||||||
62
DREAM FINDERS HOMES, INC.
CONSOLIDATED STATEMENTS OF CASH FLOWS (Continued)
(In thousands)
| Year Ended December 31, | |||||||||||||||||
| 2023 | 2022 | 2021 | |||||||||||||||
| Reconciliation of cash, cash equivalents and restricted cash | |||||||||||||||||
| Cash and cash equivalents | $ | $ | $ | ||||||||||||||
| Restricted cash | |||||||||||||||||
| Total cash, cash equivalents and restricted cash | $ | $ | $ | ||||||||||||||
| Supplemental disclosures of cash payments: | |||||||||||||||||
| Cash paid for interest | $ | $ | $ | ||||||||||||||
| Cash paid for income taxes, net of refunds | |||||||||||||||||
| Supplemental disclosures of noncash activities: | |||||||||||||||||
| Noncash Financing Activities | |||||||||||||||||
| Contingent consideration | ( | ||||||||||||||||
| Financed land payments to seller | |||||||||||||||||
| Total noncash financing activities | $ | $ | ( | $ | |||||||||||||
The accompanying notes are an integral part of these consolidated financial statements.
63
DREAM FINDERS HOMES, INC.
NOTES TO THE CONSOLIDATED FINANCIAL STATEMENTS
1. Nature of Business and Significant Accounting Policies
Nature of Business
Principles of Consolidation
The accompanying consolidated financial statements include the accounts of DFH, Inc., its wholly owned subsidiaries and its investments that qualify for consolidation treatment (Note 6, Variable Interest Entities). The noncontrolling interests represent equity interests held by others in certain of our subsidiaries. All intercompany accounts and transactions have been eliminated in consolidation. There are no other components of comprehensive income not already reflected in net and comprehensive income on our Consolidated Statements of Comprehensive Income.
Use of Estimates
Cash and Cash Equivalents and Concentration Risk
Cash and cash equivalents consist of highly liquid instruments, with original maturities of three months or less. Cash and cash equivalents include cash proceeds from home closings in-transit from or held by third-party title company escrow accounts for the benefit of the Company, typically for less than five days.
At various times throughout the year, the Company may have cash deposited with financial institutions that exceed the federally insured deposit amount. The Company has entered into insured cash sweep account agreements that protect material deposit balances with certain financial institutions. In addition, management reviews the financial viability of these financial institutions on a periodic basis and does not anticipate that any potential nonperformance by the financial institutions would have a material impact to the Company’s results of operations or cash flows.
Restricted Cash
Inventories and Cost of Sales
Inventories include the costs of direct land acquisition, land development, construction, capitalized interest on qualifying assets, lot option fees, real estate taxes and direct overhead costs incurred related to land acquisition and development, home construction, and sales commissions. Indirect overhead costs are charged to selling, general, and administrative expenses as incurred.
Land and development costs are typically allocated to individual residential lots on a pro rata basis based on the number of lots in the development. The costs of residential lots are transferred to construction in process when home construction begins and are expensed on a specific identification basis as homebuilding cost of sales as the homes close. Homebuilding cost of sales for homes closed includes the specific construction costs of each home and all applicable land acquisition, land development and related costs allocated to each residential lot, as well as interest and sales commissions.
64
Debt Issuance Costs
Debt issuance costs that are recorded to capitalized interest are amortized to interest expense over the estimated economic life of the underlying debt instrument using the straight-line method, which approximates the effective interest method. Portions of this amortization are evaluated for capitalization as inventories and subsequently expensed through cost of sales at the home closing.
Lot Deposits
Variable Interest Entities and Investments in Unconsolidated Entities
Pursuant to Accounting Standards Codification (“ASC”) 810 and subtopics related to the consolidation of variable interest entities (“VIEs”), management analyzes the Company’s investments first under the variable interest model to determine if they are VIEs and, if so, whether the Company is the primary beneficiary. Management determines whether the Company is the primary beneficiary of a VIE at the time it becomes involved with a VIE and reconsiders that conclusion if changes to the Company’s involvement arise. To make this determination, management considers factors such as whether the Company could direct finance, determine or limit the scope of the entity, sell or transfer property, direct development or direct other operating decisions. The primary beneficiary is defined as the entity having both of the following characteristics: 1) the power to direct the activities that most significantly impact the VIE’s performance, and 2) the obligation to absorb losses and rights to receive the returns from the VIE that would be potentially significant to the VIE. Management consolidates the entity if the Company is the primary beneficiary or if a standalone primary beneficiary does not exist and the Company and its related parties collectively meet the definition of a primary beneficiary. If the investment does not qualify as a VIE under the variable interest model, management then evaluates the entity under the voting interest model to assess if consolidation is appropriate.
Refer to Note 6, Variable Interest Entities, for a description of the Company’s interests, including which entities were determined to be VIEs.
Accounting for Unconsolidated VIEs
Investments for which the Company is not identified as the primary beneficiary, but the Company has significant influence are accounted for as equity method investments.
Investments for which the Company does not have significant influence are accounted for at cost under the cost method. Equity and cost method investments are classified as investments in unconsolidated entities on the Consolidated Balance Sheets.
65
For equity method investments, the Company shares in the earnings (losses) of these unconsolidated entities generally in accordance with its respective equity interests. In some instances, the Company recognizes earnings (losses) that differ from its equity interest in the unconsolidated entity.
For distributions received from equity method investments, the Company has elected to use the cumulative earnings approach for the Consolidated Statements of Cash Flows. Under the cumulative earnings approach, distributions up to the amount of cumulative equity in earnings recognized are treated as returns on investment within operating cash flows and those in excess of that amount are treated as returns of investment within investing cash flows.
Leases
The Company determines if an arrangement is, or contains, a lease at inception. We recognize leases when the contract provides us the right to use an identified asset for a period of time in exchange for consideration. Leases are included in right-of-use (“ROU”) assets and lease liabilities in the Consolidated Balance Sheets.
ROU assets represent the Company’s right to use an underlying asset for the lease term and lease liabilities represent the Company’s obligation to make lease payments arising from the lease. ROU assets and liabilities are recognized at the commencement date based on the present value of lease payments over the lease term. As most of the Company’s leases do not provide an explicit rate, management uses the Company’s incremental borrowing rate based on the information available at the commencement date in determining the present value of lease payments. An explicit rate is used when readily determinable. The ROU assets also include any lease payments made, reduced by any lease incentives. Lease terms may include options to extend or terminate the lease when it is reasonably certain that the Company will exercise that option. Lease expense for operating leases is recognized on a straight-line basis over the lease term. The Company applies the practical expedient to combine lease and nonlease components when accounting for the ROU assets and liabilities for all asset classes. Variable lease costs are expensed as incurred. Leases with an initial term of 12 months or less are not recorded in the Consolidated Balance Sheets.
Goodwill
Goodwill represents the excess of purchase price over the fair value of the assets acquired less the liabilities assumed in a business combination. Refer to Note 7, Contingent Consideration, for details on recent acquisitions. The Company tests for impairment at least annually as of October 1, but the Company tests for impairment more frequently if a triggering event occurs. This test assesses qualitative factors to determine if it is more likely than not that the fair value of the reporting units is less than their carrying value. These qualitative factors include, but are not limited to, economic conditions, industry and market considerations, cost factors, overall performance of the reporting unit and other entity and reporting unit specific events. If the qualitative assessment indicates a stable fair value, no further testing is required. However, if the qualitative assessment indicates that the fair value of a reporting unit has declined past its carrying value, the Company will then calculate the fair value of the reporting unit based on discounted future cash flows. An impairment loss is recorded if this assessment concludes that the fair value of the reporting unit is less than its current carrying value. The Company completed its most recent goodwill impairment test as of October 1, 2023 and determined that the fair value of each of the reporting units was not less than carrying value. No
Intangible Assets
The Company has intangible assets that consist of trade names that are recorded in connection with acquisitions at their fair value based on the results of valuation analyses. Trademarks acquired in business combinations are generally valued using the relief-from-royalty method, which is a Level 3-type measurement. Trademarks with finite lives are amortized over no more than five-year periods.
66
Property and Equipment
Property and equipment are stated at cost less accumulated depreciation. Maintenance and repairs are charged to expense as incurred and betterments are capitalized. When items of property and equipment are sold or otherwise disposed, the asset and related accumulated depreciation accounts are eliminated and any gain or loss is included in operations. Depreciation expense is included within SG&A on the Consolidated Statements of Comprehensive Income.
Depreciation of property and equipment is calculated using the straight-line method over the estimated useful lives of the assets as follows:
| Asset Class | Useful Life Years | |||||||
| Furniture and fixtures | ||||||||
| Office equipment | ||||||||
| Software | ||||||||
| Vehicles | ||||||||
| Buildings | ||||||||
Business Combinations and Contingent Consideration
Business combinations are evaluated and accounted for in accordance with guidance set forth in ASC 805. Once a business combination has been identified, all material assets and liabilities of the business are recognized at fair value as of the acquisition date. Any residual amount remaining of the purchase price in excess of the fair value of the net assets is recognized as goodwill.
In connection with applicable business combinations, the Company records the fair value of contingent consideration as a liability on the acquisition date as prescribed by the underlying agreement. The initial measurement of contingent consideration is based on projected cash flows such as revenues, gross margin, overhead expenses and pre-tax income of the acquired business and is discounted to present value using the discounted cash flow method. Subsequently, the future estimated contingent consideration payments are remeasured to fair value at each reporting date based on the estimated future pre-tax income of the acquired entities and the re-assessment of risk-adjusted discount rates that reflect current market conditions. The adjustments made as a result of the remeasurements at each reporting date are included in contingent consideration revaluation on the Consolidated Statements of Comprehensive Income.
Contingent consideration payments are included within cash flows from financing on the Consolidated Statements of Cash Flows to the extent these payments do not exceed the initial liability recorded at the acquisition date for each arrangement. Payments exceeding the initial contingent consideration liability estimated at acquisition are classified as cash used in operating activities.
Maximum potential exposure for the contingent consideration payments is not estimable based on the contractual terms, as the contingent consideration arrangements allow a percentage payout based on a potentially unlimited range of pre-tax net income.
Customer Deposits
Customer deposits are amounts collected from customers in conjunction with the execution of the home sale contract, and are recorded as a liability when cash is received. Customer deposits are applied against the final settlement due at the home closing. In the event of contract cancellation, the customer deposit is contractually forfeited and recognized as homebuilding revenue.
Warranty Reserve
The Company provides a limited warranty for its homes for a period of one year . The Company’s standard warranty requires the Company or its subcontractors to repair or replace defective construction during such warranty period at no cost to the homebuyer.
67
At the time a home is sold, the Company records an estimate of warranty expense based on historical warranty costs. An analysis of the warranty reserve is performed quarterly to ensure the reserve’s adequacy. The warranty reserve is classified on the Consolidated Balance Sheets as an accrued expense.
Revenue Recognition
The Company recognizes revenue in accordance with ASC 606, which requires an entity to recognize revenue when it transfers promised goods or services to customers in an amount that reflects the consideration to which the entity expects to be entitled in exchange for those goods or services. We recognize revenue by following the five-step model: (i) identifying the contract(s) with the customer, (ii) identifying the separate performance obligations in the contract, (iii) determining the transaction price, (iv) allocating the transaction price to the separate performance obligations, and (v) recognizing revenue when each performance obligation is satisfied.
The Company’s revenues consist primarily of home sales in the United States, which is its principal market. Home sale transactions are made pursuant to contracts under which the Company typically has a single performance obligation to deliver a completed home to the homebuyer when closing conditions are met. The Company generally determines the selling price per home based on the expected cost-plus margin. The Company has performed an assessment and its contracts do not contain significant financing terms. A large portion of the Company’s contracts with customers and the related performance obligations have an original expected duration of one year or less. For the majority of contracts, performance obligations are satisfied and revenue is recognized at the point in time when control of the asset is transferred to the customer, which is generally when title to and possession of the home and the risks and rewards of ownership are transferred to the homebuyer on the closing date. Under home sale contracts, the Company typically receives an initial cash deposit from the homebuyer at the time the sales contract is executed and receives the remaining consideration to which the Company is entitled, through an escrow agent, at closing.
In certain contracts, the customer controls the underlying land upon which the home is constructed. For these specific contracts, the performance obligation is satisfied over time, as the Company’s performance creates or enhances an asset that the customer controls. The Company recognizes revenue for these contracts based on the percentage of completion of the project, determined by the number of days of construction completed compared to the total estimated number of days to construct the home. Typically, the Company has two types of percentage of completion contracts. The first type is with individual customers for which the Company acts as a general contractor on land owned by the homebuyer. The second is with institutional buyers for which the Company acts as a general contractor on land owned by the institution. Individual customers generally have construction-to-permanent loans that are taken out by the customer. During the underwriting process for our individual and institutional customers, a draw schedule is agreed upon by the bank, the customer, and the Company. Funds are disbursed for labor and materials that have been completed or installed. These both result in a contract asset as work is being completed prior to receiving funds. A contract liability would be recorded in cases where we have received funds in excess of costs incurred. As of December 31, 2023 and 2022, the contract asset related to percentage of completion contracts was $13.7 million and $20.7 million, respectively, and is included in other assets on the Consolidated Balance Sheets. As of December 31, 2023 and 2022, the contract liability related to percentage of completion contracts was $1.2 million and $2.2 million, respectively, and is included in accrued expenses on the Consolidated Balance Sheets.
Revenues include forfeited deposits, which occur when home sale or land sale contracts that include a nonrefundable deposit are cancelled. Sales incentives in the form of price concessions on the selling price of a home are recorded as a reduction of revenues. The cost of sales incentives in the form of free or discounted products or services provided to homebuyers, including option upgrades, are reflected in land and development costs because such incentives are identified in home sale contracts with homebuyers as an intrinsic part of the Company’s single performance obligation to deliver and transfer title to the home for the transaction price stated in the contracts.
Refer to Note 9, Segment Reporting for a more detailed disaggregation of our revenues by reportable segments.
Stock-Based Compensation
The Company records expense for restricted stock units awarded to employees in return for employee service. The cost is measured as of the grant-date fair value of the restricted stock units and recognized as stock-based compensation on a straight-line basis over the employee service period, which is normally the vesting period. We recognize forfeitures of restricted stock units as a reduction to stock-based compensation in the period in which they occur. Stock-based compensation is included within SG&A on the Consolidated Statements of Comprehensive Income.
68
Income Taxes
Reclassifications
Certain reclassifications have been made in the 2022 and 2021 consolidated financial statements to conform to the classifications used in 2023.
Recent Accounting Pronouncements
In December 2023, the Financial Accounting Standards Board (“FASB”) issued Accounting Standards Update (“ASU”) Number 2023-09, “Income Taxes (Topic 740): Improvements to Income Tax Disclosures” (“ASU 2023-09”). ASU 2023-09 requires more disaggregated income tax disclosures, including additional information in the rate reconciliation and additional disclosures about income taxes paid. ASU 2023-09 will become effective for us for the fiscal year ending December 31, 2025. Early adoption is permitted, and guidance should be applied prospectively, with an option to apply guidance retrospectively. We are currently evaluating the impact of the adoption of ASU 2023-09 on our consolidated financial statements.
In November 2023, the FASB issued ASU Number 2023-07, “Segment Reporting (Topic 280): Improvements to Reportable Segment Disclosures” (“ASU 2023-07”). ASU 2023-07 requires disclosure of significant segment expenses that are regularly provided to the chief operating decision maker(s) that are included within each reported measure of segment profit or loss. The guidance also expands disclosure requirements for interim periods, as well as requires disclosure of other segment items, including the title and position of the entity’s chief operations decision maker(s). ASU 2023-07 will become effective for us for the fiscal year ending December 31, 2024, and for interim periods starting in our first quarter of 2025. Early adoption is permitted, and guidance is required to be applied retrospectively. We are currently evaluating the impact of the adoption of ASU 2023-07 on our consolidated financial statements.
2. Debt
Senior Unsecured Notes
On August 22, 2023, the Company issued $300.0 million in aggregate principal amount of 8.25 % senior unsecured notes due August 15, 2028 (the “2028 Notes”), which were issued pursuant to an indenture (the “Indenture”). Interest on the 2028 Notes is payable in arrears semiannually on each February 15 and August 15, beginning February 15, 2024. The 2028 Notes are fully and unconditionally guaranteed on a joint and several senior unsecured basis by certain of the Company’s subsidiaries.
The Company received net proceeds from the issuance and sale of the 2028 Notes of $293.5 million after unamortized debt issuance costs of $6.5 million, which reduce the carrying value of the 2028 Notes reported on the Consolidated Balance Sheets. The net proceeds from the 2028 Notes were used to repay a portion of the then outstanding balance under the Company’s Credit Agreement. As of December 31, 2023, unamortized debt issuance costs were $6.1 million.
69
The 2028 Notes are redeemable by the Company prior to August 15, 2025 through the payment of the principal amount due, which can be accomplished through the issuance of certain restricted equity offerings for specified portions of principal notes outstanding, plus specified rates and accrued and unpaid interest, and a make-whole premium in the event 100 % of the principal amount is redeemed. On or after August 15, 2025, the 2028 Notes are redeemable at specified rates equal to 104.1 % of the principal balance, plus accrued and unpaid interest, and periodically decrease to 100 % on August 15, 2027. Upon the occurrence of a Change of Control (as defined in the Indenture), the holders of the 2028 Notes will have the right to require the Company to repurchase all or a portion of the 2028 Notes at a price equal to 101 % of the aggregate principal amount of the 2028 Notes, plus any accrued and unpaid interest.
The Indenture includes customary events of default. Subject to specified exceptions, the Indenture contains certain restrictive covenants that, among other things, limit our ability to incur or guarantee certain indebtedness, issue certain equity interests or engage in certain capital stock transactions. In addition, the Indenture contains certain limitations related to mergers, consolidations, and transfers of assets.
Credit Agreement
On July 19, 2023, the Company entered into amendments to its existing credit agreement (as amended, the “Credit Agreement”). The amendments, among other things, (i) provide for an increase in the aggregate commitments under the revolving credit facility to $1.2 billion, subject to a borrowing base; (ii) extend the maturity date from June 2, 2025 to July 17, 2026 for certain new and existing lenders comprising $1.1 billion of the $1.2 billion of aggregate commitments under the Credit Agreement; (iii) authorize the non-extending lenders to extend their maturity dates to July 17, 2026, with the consent of the Company; (iv) provide the Company with the ability to incur certain additional unsecured debt; and (v) reference a Secured Overnight Financing Rate (“SOFR”) based rate, as described below. Certain of our subsidiaries guaranteed the Company’s obligations under the Credit Agreement. The amendments also updated the Company’s minimum tangible net worth covenant which resulted in an increase to the base component of such covenant from $385.0 million to $607.0 million. The Credit Agreement retains an accordion feature that allows the aggregate commitments to increase up to $1.6 billion, subject to a borrowing base.
Under the Credit Agreement, the Company has the option to draw “Term SOFR Rate Loans” or “Daily Simple SOFR Rate Loans”. Term SOFR Rate Loans bear interest based on Term SOFR rates for one, three or six-month interest periods, which include SOFR adjustments of 10 , 15 and 25 basis points for each interest period, respectively. Daily Simple SOFR Rate Loans bear interest based on Daily Simple SOFR rates and include a SOFR adjustment of 10 basis points. Interest under Term SOFR Rate Loans and Daily Simple SOFR Rate Loans also include an “applicable rate margin” determined based on the Company’s net debt to capitalization ratio, equivalent to credit spreads of 2.5 % to 3.3 %.
As of December 31, 2023 and 2022, the outstanding balance under the Credit Agreement was $530.0 million and $965.0 million, respectively. Under the Credit Agreement, the funds available are unsecured and availability under the borrowing base is calculated based on specific advance rates for each of finished lots, construction in process, and finished homes inventory on the Consolidated Balance Sheets, and reduced for any outstanding unsecured indebtedness permitted under the Credit Agreement, including the 2028 Notes. The Company had capitalized debt issuance costs related to construction lines of credit, net of amortization, of $7.0 million and $7.3 million as of December 31, 2023 and 2022, respectively, which were included in other assets on the Consolidated Balance Sheets.
3. Inventories
Inventories consist of owned land and finished lots, and construction in process (“CIP”) and finished homes, including capitalized interest costs incurred under our debt obligations discussed in Note 2. In addition, preconstruction costs related to finished lots or land under development held by third-party land bank partners incurred prior to the Company’s purchase of the land, including lot option fees, property taxes and due diligence costs are capitalized into owned land and lots. Finished lots are generally purchased just-in-time for construction, whether for speculative (“spec”) or sold homes, and are included within owned land and lots in the table below until construction begins when the finished lot cost is transferred to CIP. CIP represents homes under construction or completed, including sold, spec and model homes. CIP includes the cost of finished lots and all direct costs incurred to build homes. The cost of homes is expensed on a specific identification basis when the home is delivered to the customer.
70
Inventories consisted of the following as of December 31, 2023 and 2022 (in thousands):
| As of December 31, | |||||||||||
| 2023 | 2022 | ||||||||||
| Construction in process and finished homes | $ | $ | |||||||||
| Owned land and lots | |||||||||||
| Inventories | $ | $ | |||||||||
Capitalized interest activity related to our construction lines of credit and senior unsecured notes, net is summarized in the table below for the years ended December 31, 2023 and 2022 (in thousands):
| Year Ended December 31, | |||||||||||
| 2023 | 2022 | ||||||||||
| Capitalized interest as of beginning of the period | $ | $ | |||||||||
| Interest incurred | |||||||||||
| Interest expensed | ( | ( | |||||||||
| Interest charged to homebuilding cost of sales | ( | ( | |||||||||
| Capitalized interest as of end of the period | $ | $ | |||||||||
4. Property and Equipment
Property and equipment, net consisted of the following as of December 31, 2023 and 2022 (in thousands):
| As of December 31, | ||||||||||||||
| 2023 | 2022 | |||||||||||||
| Furniture and fixtures | $ | $ | ||||||||||||
| Buildings | ||||||||||||||
| Land | ||||||||||||||
| Vehicles | ||||||||||||||
| Office equipment and software | ||||||||||||||
| Total property and equipment | ||||||||||||||
| Less: Accumulated depreciation | ( | ( | ||||||||||||
| Property and equipment, net | $ | $ | ||||||||||||
Depreciation expense was $4.8 million, $5.0 million and $3.7 million for the years ended December 31, 2023, 2022 and 2021, respectively.
5. Commitments and Contingencies
Legal Proceedings
We are party to legal matters from time to time that typically are derived from the Company’s general business practices, primarily related to the construction of homes. The Company believes that if a claim has merit, parties other than the Company would be, at least in part, liable for the claim, and the eventual outcome of the claim would not have a material adverse effect upon our consolidated financial statements. When we believe that a loss is probable and estimable, we record the estimated contingency loss in our Consolidated Statements of Comprehensive Income.
We do not believe that any future outcomes of any claims or lawsuits currently outstanding will have a material adverse effect upon our consolidated financial statements.
71
Leases
The Company has operating leases primarily associated with office space that is used by our divisions, model home sale-leasebacks and a corporate office building sale-leaseback in Jacksonville, Florida. This corporate office building lease has a remaining lease term of 11 years with potential renewal options. There are no significant operating or finance leases that have not yet commenced as of December 31, 2023.
The following table shows the operating lease costs for the years ended December 31, 2023, 2022 and 2021 (in thousands):
| Year Ended December 31, | ||||||||||||||||||||||||||
| Lease Cost | Classification | 2023 | 2022 | 2021 | ||||||||||||||||||||||
Operating lease cost(1) | Selling, general and administrative expense | $ | $ | $ | ||||||||||||||||||||||
(1)Includes short-term leases and variable lease costs which are immaterial.
Supplemental disclosure of noncash activities related to leases was as follows (in thousands):
| Year Ended December 31, | ||||||||||||||||||||
| 2023 | 2022 | 2021 | ||||||||||||||||||
| Leased assets obtained in exchange for new operating lease liabilities | $ | $ | $ | |||||||||||||||||
During the year ended December 31, 2023, there have been no material changes in our lease liabilities for the next five years.
| As of December 31, | ||||||||||||||
| 2023 | 2022 | |||||||||||||
| Weighted average remaining lease term | ||||||||||||||
| Operating leases | ||||||||||||||
| Weighted average discount rate | ||||||||||||||
| Operating leases | ||||||||||||||
The following table shows the maturities of our lease liabilities as of December 31, 2023 (in thousands):
| Maturity of Lease Liabilities | Operating Leases(1) | |||||||
| 2024 | $ | |||||||
| 2025 | ||||||||
| 2026 | ||||||||
| 2027 | ||||||||
| 2028 | ||||||||
| Thereafter | ||||||||
| Total lease payments | ||||||||
| Less: Interest | ||||||||
| Present value of lease liabilities | $ | |||||||
(1)We use our incremental borrowing rate based on the information available at the commencement date in determining the present value of lease payments.
72
6. Variable Interest Entities
The Company holds investments in certain limited partnerships and similar entities that conduct land acquisition, land development and/or other homebuilding activities in various markets where our homebuilding operations are located, which are considered variable interests.
The Company’s investments create a variable interest in a VIE, depending on the contractual terms of the arrangement. Additionally, the Company, in the ordinary course of business, enters into option contracts with third parties and unconsolidated entities for the ability to acquire rights to finished lots for the construction of homes. Under these contracts, the Company typically makes a specified earnest money deposit in consideration for the right to purchase finished lots in the future, usually at a predetermined price.
The VIEs are funded by initial capital contributions from the Company, as well as its other partners, and generally do not have significant debt. In some cases, an unrelated third party is the general partner or managing member and, in others, the general partner or managing member is a related party.
The primary risk of loss associated with the Company’s involvement in these VIEs is limited to the Company’s initial capital contributions due to bankruptcy or insolvency of the VIE; however, management has deemed the likelihood of this as remote. The maximum exposure to loss related to the VIEs is disclosed below for both consolidated and unconsolidated VIEs, which equals the Company’s capital investment in each entity.
For VIEs that the Company does consolidate, management has the power to direct the activities that most significantly impact the VIEs’ economic performance. The Company typically serves as the party with homebuilding expertise in the VIE. The Company does not guarantee the debts of the VIEs, and creditors of the VIEs have no recourse against the Company. For VIEs that the Company does not consolidate, the Company does not hold the power to direct the activities that most significantly impact the VIEs’ economic performance. The Company’s maximum exposure to loss is limited to its investment in the entities because the Company is not obligated to provide them any additional capital and does not guarantee any of the unconsolidated VIEs’ debt or other liabilities.
The tables below display the carrying amounts of the assets and liabilities related to the consolidated VIEs, as well as the Company’s investments in unconsolidated VIEs (in thousands):
As of December 31, | ||||||||||||||
| Consolidated | 2023 | 2022 | ||||||||||||
| Assets | $ | $ | ||||||||||||
| Liabilities | ||||||||||||||
As of December 31, | ||||||||||||||
| Unconsolidated | 2023 | 2022 | ||||||||||||
Jet HomeLoans(1) | $ | $ | ||||||||||||
| Other unconsolidated VIEs | ||||||||||||||
| Total investment in unconsolidated VIEs | $ | $ | ||||||||||||
Lot Option Contracts
The Company generally does not engage in the land development business. Instead, the Company employs an asset-light land financing strategy, providing us optionality to purchase lots on a ‘‘just-in-time’’ basis for construction and affording us flexibility to acquire lots at a rate that matches the expected sales pace in a given community.
73
The Company primarily employs two variations of our asset-light land financing strategy—finished lot option contracts and land bank option contracts—pursuant to which the Company secures the right to purchase finished lots at predetermined market prices from various land sellers and land bank partners, by paying deposits based on the aggregate purchase price of the finished lots. These option contracts generally allow us, at our option, to forfeit our right to purchase the lots controlled for any reason, and our sole legal obligation and economic loss as a result of such forfeitures is limited to the amount of the deposits paid pursuant to such option contracts and, in the case of land bank option contracts, our loss is limited to the related lot option fees paid to the land bank partner, and for certain land bank option contracts, any potential performance obligations, management of the land development to completion and any cost overruns relative to the project.
None of the creditors of any of the land bank entities with which the Company enters into lot option contracts have recourse to our general credit. The Company generally does not have any specific performance obligations to purchase any of the lots or guarantee any of the land bankers’ liabilities. The Company is not involved in the design or creation of the land bank entities from which the Company purchases lots under lot option contracts. The land bankers’ equity holders have the power to direct 100 % of the operating activities of the land bank entity and the Company has no voting rights. The sole purpose of the land bank entity’s activities is to generate returns for such entity’s equity holders. Further, the Company does not share in any of the profit or loss generated by the project’s development. The profits and losses are passed directly to the land bankers’ equity holders.
The deposit placed by us pursuant to the lot option contracts is deemed to be a variable interest in the respective land bank entities. Certain of those land bank entities are deemed to be VIEs. Therefore, the land bank entities with which the Company enters into lot option contracts are evaluated for possible consolidation by the Company.
The Company believes the activities that most significantly impact a land bank entity’s economic performance are the operating activities of the land bank entity. In the case of development projects, unless and until a land bank entity delivers finished lots for sale, the land bank entity’s equity investors bear the risk of land ownership and do not earn any revenues, except for lot option fees paid by the Company. The operating development activities are directed by the land bank entity’s equity investors.
Dream Finders possesses no more than limited protective legal rights through the lot option contracts in the specific finished lots that are purchased, and possesses no participative rights in the land bank entities. Accordingly, the Company does not have the power to direct the activities of a land bank entity that most significantly impact its economic performance. For the aforementioned reasons, the Company concluded that it is not the primary beneficiary of the land bank entities with which it enters into lot option contracts, and therefore the Company does not consolidate any of these VIEs. The Company’s risk of loss related to finished lot option and land bank option deposits and related fees was $328.0 million and $461.6 million as of December 31, 2023 and 2022, respectively.
7. Contingent Consideration
As of December 31, 2023 and 2022, the Company remeasured the fair value of contingent consideration related to the 2020 acquisition of H&H Constructors of Fayetteville, LLC and adjusted the liability to $11.7 million and $11.6 million, respectively, based on actual results achieved, revised pre-tax income forecasts and revised discount rates as of the balance sheet date and from accretion of the liability. The Company recorded contingent consideration adjustments resulting in $2.9 million of expense, $2.0 million of income, and $4.6 million of expense for the years ended December 31, 2023, 2022 and 2021, respectively. As of December 31, 2023, there were 9 months remaining under the contingent consideration agreement.
As of December 31, 2023 and 2022, the Company remeasured the fair value of contingent consideration related to the September 2021 acquisition of McGuyer Homebuilders, Inc. (“MHI”) and adjusted the liability to $105.1 million and $102.1 million, respectively, based on actual results achieved, revised pre-tax income forecasts and revised discount rates as of the balance sheet date and from accretion of the liability. The Company recorded contingent consideration adjustments resulting in expense of $43.3 million, $12.4 million, and $2.2 million for the year ended December 31, 2023, 2022 and 2021, respectively. As of December 31, 2023, there were 21 months remaining under the contingent consideration agreement.
Refer to Note 10, Fair Value Disclosures for the fair value measurement for contingent consideration.
74
8. Income Taxes
The Company is a corporation subject to U.S. federal income taxes, in addition to state and local income taxes. Income tax expense for the years ended December 31, 2023, 2022 and 2021, consists of the following (in thousands):
| Year Ended December 31, | |||||||||||||||||
| 2023 | 2022 | 2021 | |||||||||||||||
| Current: | |||||||||||||||||
| Federal | $ | $ | $ | ||||||||||||||
| State | |||||||||||||||||
| Total current | |||||||||||||||||
| Deferred: | |||||||||||||||||
| Federal | ( | ( | |||||||||||||||
| State | ( | ( | ( | ||||||||||||||
| Total deferred | ( | ( | ( | ||||||||||||||
| Total income tax expense | $ | $ | $ | ||||||||||||||
The following table reconciles the statutory federal income tax rate to the effective income tax rate:
| Year Ended December 31, | |||||||||||||||||
| 2023 | 2022 | 2021 | |||||||||||||||
| Income taxes at federal statutory rate | % | % | % | ||||||||||||||
| State and local income taxes, net of federal tax | |||||||||||||||||
| Federal tax credits | ( | ( | ( | ||||||||||||||
| Non-deductible executive compensation | |||||||||||||||||
| Other | ( | ||||||||||||||||
| Effective tax rate | % | % | % | ||||||||||||||
The significant components of deferred income tax assets and liabilities as of December 31, 2023 and 2022, consist of the following (in thousands):
| As of December 31, | |||||||||||
| 2023 | 2022 | ||||||||||
| Deferred tax assets: | |||||||||||
| Contingent consideration | $ | $ | |||||||||
| Incentive compensation plans | |||||||||||
| Lease liabilities | |||||||||||
| Other | |||||||||||
| Total deferred tax asset | |||||||||||
| Deferred tax liabilities: | |||||||||||
| Right-of-use assets | ( | ( | |||||||||
| Other | ( | ( | |||||||||
| Total deferred tax liabilities | ( | ( | |||||||||
| Net deferred tax asset | $ | $ | |||||||||
75
Management believes that we will have sufficient future taxable income to make it more likely than not that the net deferred tax assets will be realized.
9. Segment Reporting
The Company primarily operates in the homebuilding business and is organized and reported primarily by region. During the third quarter of 2023, organization of the homebuilding segments for making operating decisions and assessing performance changed from divisional to regional. There are now four reportable segments, which are comprised of the following:
•Southeast (Jacksonville, Orlando, and Tampa, Florida; Savannah, Georgia; Hilton Head and Bluffton, South Carolina; Active Adult and Custom Homes operations in northeast Florida)
•Mid-Atlantic (The Carolinas and DC Metro)
•Midwest (Austin, Dallas, Houston and San Antonio, Texas and Denver, Colorado)
•Financial Services (primarily Jet HomeLoans and Golden Dog Title and Trust)
The corporate component, which is not considered an operating segment, is reported separately as “Corporate”.
In accordance with ASC 280, operating segments are defined as components of an enterprise for which separate financial information is available that is evaluated regularly by the chief operating decision-makers (“CODM”) in deciding how to allocate resources and in assessing performance. The Company’s CODM primarily evaluate performance based on the number of homes closed, average sales price and financial results. Segment profitability is primarily measured by income before taxes.
The following tables summarize revenues and net and comprehensive income by segment for the years ended December 31, 2023, 2022 and 2021 as well as total assets and goodwill by segment as of December 31, 2023 and 2022 (in thousands):
| Year Ended December 31, | ||||||||||||||||||||
| Revenues: | 2023 | 2022 | 2021 | |||||||||||||||||
| Southeast | $ | $ | $ | |||||||||||||||||
| Mid-Atlantic | ||||||||||||||||||||
| Midwest | ||||||||||||||||||||
| Financial Services | ||||||||||||||||||||
| Total segment revenues | ||||||||||||||||||||
| Reconciling items from equity method investments | ( | ( | ( | |||||||||||||||||
| Consolidated revenues | $ | $ | $ | |||||||||||||||||
| Year Ended December 31, | ||||||||||||||||||||
| Income before taxes | 2023 | 2022 | 2021 | |||||||||||||||||
| Southeast | $ | $ | $ | |||||||||||||||||
| Mid-Atlantic | ||||||||||||||||||||
| Midwest | ||||||||||||||||||||
| Financial Services | ||||||||||||||||||||
Corporate(1) | ( | ( | ( | |||||||||||||||||
| Total segment income before taxes | ||||||||||||||||||||
| Reconciling items from equity method investments | ( | ( | ( | |||||||||||||||||
| Consolidated income before taxes | $ | $ | $ | |||||||||||||||||
76
| Assets: | Goodwill: | |||||||||||||||||||||||||
| December 31, | December 31, | |||||||||||||||||||||||||
| 2023 | 2022 | 2023 | 2022 | |||||||||||||||||||||||
| Southeast | $ | $ | $ | $ | ||||||||||||||||||||||
| Mid-Atlantic | ||||||||||||||||||||||||||
| Midwest | ||||||||||||||||||||||||||
| Financial Services | ||||||||||||||||||||||||||
Corporate(1) | ||||||||||||||||||||||||||
| Total segments | ||||||||||||||||||||||||||
| Reconciling items from equity method investments | ( | ( | ||||||||||||||||||||||||
| Consolidated | $ | $ | $ | $ | ||||||||||||||||||||||
10. Fair Value Disclosures
Fair value represents the amount that would be received for selling an asset or paid to transfer a liability in an orderly transaction between market participants at the measurement date. The fair values are determined using a fair value hierarchy based on the inputs used to measure fair value. Level 1 inputs are unadjusted quoted prices in active markets for identical assets and liabilities. Level 2 inputs are inputs other than quoted market prices that are observable for the asset or liability, either directly or indirectly. Level 3 inputs are unobservable and significant to the fair value.
The following table presents a summary of the change in fair value measurement of contingent consideration, which is based on Level 3 inputs and is the only asset or liability measured at fair value on a recurring basis (in thousands):
| Beginning balance, December 31, 2022 | $ | ||||
| Contingent consideration payments | ( | ||||
| Ending balance, December 31, 2023 | $ | ||||
Fair value measurements may also be utilized on a nonrecurring basis, such as for the impairment of long-lived assets and inventory. The fair value of financial instruments, including cash and cash equivalents, accounts receivable, accounts payable, notes payable and customer deposits, approximate their carrying amounts due to the short-term nature of these instruments. The fair value of the construction lines of credit approximate their carrying amounts since they are subject to short-term floating interest rates that reflect current market rates. The senior unsecured notes are Level 2 financial instruments. The estimated fair value of the 2028 Notes as of December 31, 2023 is $318.2 million, based on recent trades or quoted market prices for debt of similar terms, including maturity, to achieve comparable yields.
11. Related Party Transactions
The Company enters into or participates in related party transactions. The majority of these transactions are entered into to secure finished lots for the construction of new homes.
DF Capital Management, LLC Funds
DF Capital Management, LLC (“DF Capital”) organizes real estate investment funds to acquire land and develop and sell finished lots. DF Capital is the investment manager of the funds. The Company owns a 49 % membership interest in DF Capital. DF Capital is controlled by unaffiliated parties. DF Residential I, LP (“Fund I”), the first of such investment vehicles was fully committed in 2019 with total capital commitments of $36.7 million. Dream Finders Homes LLC and DFH Investors LLC, collectively, invested $1.4 million or 3.8 % of the total committed capital of Fund I. Fund I is nearing its final stage in which residual earnings are distributed.
77
DF Residential II, LP (“Fund II”) was organized in 2021. DF Management GP II, LLC, serves as the general partner of Fund II (the “General Partner”). The Company indirectly owns 72.0 % of the membership interests in the General Partner and receives 72.0 % of the economic interests. The General Partner is controlled by unaffiliated parties. Fund II was fully committed as of January 2022 with total capital commitments of $322.1 million. The Company invested $3.0 million or 0.9 % of the total committed capital of Fund II.
Certain directors, executive officers and members of management invested as limited partners in Fund II in an aggregate amount of $33.9 million or 10.5 % of the total committed capital. In addition, Rockpoint Group, LLC, an affiliate of a former director of the Company invested $100.0 million in Fund II.
On March 11, 2021, the Company entered into land bank financing arrangements and a Memorandum of Right of First Offer with Fund II, under which Fund II has an exclusive right of first offer on any land bank financing projects that meet its investment criteria and are undertaken by the Company during Fund II’s investment period.
DF Capital raised additional commitments from limited partners through deals other than Fund I and Fund II, which provided land bank financing for specific projects. One of the Company’s officers invested $0.2 million in one of these funds managed by DF Capital as a limited partner in 2019. The Company continues to purchase lots controlled by these funds.
As of December 31, 2023 and 2022, the Company had $48.5 million and $58.6 million, respectively, in outstanding lot deposits primarily related to Fund II and other land bank transaction deals in relation to DF Capital projects, controlling approximately 4,028 lots.
Aircraft Agreement
In November 2023, the Company entered into an aircraft dry lease agreement with a company owned by Patrick Zalupski, DFH’s President, Chief Executive Officer, and Chairman of the Board (the “Aircraft Agreement”). The Aircraft Agreement provides the Company access to an airplane owned by Mr. Zalupski on a non-exclusive basis at a fixed monthly rate for an annually set number of hours. The Aircraft Agreement has an eight-year term, which is automatically extended for up to two successive one-year periods unless terminated by either party. The Company and Mr. Zalupski have separately contracted with a non-affiliated aviation management entity to provide aircraft-related services. The Company incurred $1.3 million in expense related to the use of the airplane during the year ended December 31, 2023, inclusive of one-time set-up and other costs incurred prior to the commencement of the Aircraft Agreement, included in selling, general and administrative expense on the Consolidated Statement of Comprehensive Income.
Transactions with Rockpoint Group, LLC and affiliates
From time to time, the Company enters into land bank option contracts with Rockpoint Group, LLC (“Rockpoint”) or its affiliates in connection with the Company’s acquisition and development of land. Rockpoint or its affiliate provides the funding for the land acquisition and the Company secures the right to purchase finished lots at market prices by paying deposits based on the aggregate purchase price of the finished lots and any related fees, similar to land bank option contracts with third-party land bankers. William H. Walton III is the founding principal and chief executive officer of Rockpoint. Mr. Walton served as a member of the Board through May 21, 2023. During the year ended December 31, 2023, no transactions were entered into between Rockpoint and the Company.
Jet HomeLoans LP, formerly Jet HomeLoans LLC
Jet HomeLoans performs mortgage origination activities for the Company, including underwriting and originating home mortgages for Company customers and non-Company customers. On September 30, 2023, the Company entered into a limited partnership agreement with the partners of Jet HomeLoans LLC to convert the venture into Jet HomeLoans LP. As part of the limited partnership agreement, the Company’s ownership percentage changed from 49.9 % to 60.0 %, but the Company is not the primary beneficiary. The change in ownership was effectuated through a distribution to the partners in exchange for the additional 10.1 % ownership. Jet HomeLoans is accounted for under the equity method and is a related party of the Company. Jet HomeLoans is included within the Financial Services segment (Note 9, Segment Reporting).
78
12. Mezzanine and Stockholders’ Equity
Series B Preferred Units
On August 31, 2023, the Company redeemed all of its previously 7,143 outstanding Series B preferred units. The Company made an aggregate cash payment to the Series B holders of $11.1 million, which included $7.1 million in principal plus cumulative undistributed earnings, less a negotiated discount on that date. Following the redemption, no Series B preferred units remain outstanding. The difference between the carrying amount and the cash redemption was reclassified to retained earnings as it reflects a return from the Series B unit holders and resulted in a one-time, non-cash increase to net income available to common stockholders of $0.3 million utilized in the computations of basic and diluted earnings per share for the year ended December 31, 2023.
Share Buyback Program
In June 2023, the Company’s Board of Directors (the “Board”) approved a share buyback program under which the Company can repurchase up to $25.0 million of its Class A common stock through June 30, 2026 in open market purchases, privately negotiated transactions, or otherwise in compliance with Rule 10b-18 under the Securities Exchange Act of 1934, as amended.
The actual timing, number and value of shares repurchased under the share buyback program will depend on a number of factors, including constraints specified in relation to price, general business and market conditions, and alternative investment opportunities. The share buyback program does not obligate the Company to acquire any specific number of shares in any period, and may be expanded, extended, modified or discontinued at any time. As of February 29, 2024, we have not executed any repurchases under our share buyback program.
Series A Convertible Preferred Stock
On September 29, 2021, the Company filed a Certificate of Designations with the State of Delaware establishing 150,000 shares of Series A convertible preferred stock with an initial liquidation preference of $1,000 per share and a par value $0.01 per share (the “convertible preferred stock”) and sold 150,000 shares of convertible preferred stock for an aggregate purchase price of $150.0 million. The Company used the proceeds from the sale of the convertible preferred stock to fund a portion of the MHI acquisition (Note 7, Contingent Consideration). Pursuant to the Certificate of Designations, the convertible preferred stock ranks senior to the Company’s Class A and B common stock with respect to dividends and distributions on liquidation, winding-up and dissolution. Upon a liquidation, dissolution or winding up of the Company, each share of convertible preferred stock will be entitled to receive the initial liquidation preference of $1,000 per share, subject to adjustment, plus all accrued and unpaid dividends thereon. In addition, the convertible preferred stock has the following terms:
•Cumulative Dividends: The convertible preferred stock accumulates cumulative dividends at a rate per annum equal to 9 % payable quarterly in arrears.
•Duration: The convertible preferred stock is perpetual with call and conversion rights. The convertible preferred stock is not convertible by the Purchasers in the first five years following issuance, with the exception of the acceleration of the Conversion Right (as defined below) upon breach of the protective covenants (described below). The Company can call the outstanding convertible preferred stock at any time for one-hundred and two percent (102 %) of its liquidation preference during the fourth year following its issuance and for one-hundred and one percent (101 %) of its liquidation preference during the fifth year following its issuance, plus accrued but unpaid dividends, if any. Subsequent to the fifth anniversary of its issuance, a Purchaser can convert the convertible preferred stock into Class A common stock of the Company (the “Conversion Right”). The conversion price will be based on the average of the trailing 90 days’ closing price of Class A common stock of the Company, less 20 % of the average and subject to a floor conversion price of $4.00 (the “Conversion Discount”).
79
•Protective Covenants: The protective covenants of the convertible preferred stock require the Company to maintain compliance with all covenants related to (i) the Credit Agreement, as may be further amended from time to time; provided that any amendment, restatement, modification or waiver of the Credit Agreement that would adversely and materially affect the rights of the Purchasers will require the written consent of holders of a majority of the then-outstanding shares of convertible preferred stock; and (ii) any agreement between the Company and any Purchaser (the covenants referred to in clauses (i) and (ii), collectively, the “Protective Covenants”). Non-compliance beyond any applicable cure period only with the Protective Covenants related to the Credit Agreement will accelerate the Conversion Right, and in the event of such acceleration that occurs before the fifth anniversary following the issuance of the convertible preferred stock, the Conversion Discount shall be increased from 20 % to 25 %.
•Voting Rights: Except as may be expressly required by Delaware law, the shares of convertible preferred stock have no voting rights.
•Redemption in a Change of Control: The convertible preferred stock will be redeemed, contingent upon and concurrently with the consummation of a change of control of the Company. Shares of convertible preferred stock will be redeemed in a change of control of the Company at a price, in cash, equal to the liquidation preference, subject to adjustment, plus all accumulated and unpaid dividends, plus, if the change of control occurs before the fourth anniversary of the date of issuance of the convertible preferred stock, a premium equal to the dividends that would have accumulated on such share of convertible preferred stock from and after the change of control redemption date and through the fourth anniversary of the issuance of the convertible preferred stock.
Pursuant to the terms of the Certificate of Designations, unless and until approval of the Company’s stockholders is obtained, no shares of Class A common stock will be issued or delivered upon conversion of any convertible preferred stock to the extent that such issuance would (i) result in the holder beneficially owning in excess of 19.99 % of the outstanding Class A common stock as of the date of the Certificate of Designations or (ii) exceed 19.99 % of the outstanding shares of Class A and Class B common stock combined as of the date of the Certificate of Designations.
In addition, in connection with the sale of the convertible preferred stock, on September 29, 2021, the Company and the Purchasers entered into a Registration Rights Agreement (the “Registration Rights Agreement”) pursuant to which, among other things, the Company granted the Purchasers certain registration rights. Under the Registration Rights Agreement, the Company is required to register the convertible preferred stock owned by the Purchasers and the shares of Class A common stock issuable upon conversion of such shares equal to 19.99 % of the outstanding shares of Class A common stock for resale, which registration statement was filed and declared effective during March 2022.
13. Stock-Based Compensation
The Company is authorized to grant up to an aggregate of 9.1 million of Class A common stock under the 2021 Equity Incentive Plan (the “2021 Plan”), which is administered by the Compensation Committee of the Board of Directors. The Company grants restricted stock to certain executives, directors and members of management, primarily as incentive awards. These stock grants typically vest over a period of to five years of continuous service, commencing on the date of the grant and vesting ratably, in approximately one-third or one-fifth increments, at the end of each year of the term. The fair value of these grants is derived by using the closing stock price on the date of the grant. Expense, net of forfeitures related to stock-based compensation under the 2021 Plan was $14.1 million, $6.8 million and $5.2 million for the years ended December 31, 2023, 2022 and 2021, respectively.
As of December 31, 2023 and 2022, the total unrecognized stock-based compensation under the 2021 Plan was $20.3 million and $11.3 million, respectively. The unrecognized stock-based compensation will be recognized over a weighted-average period of two years .
80
The Company’s restricted stock units as of December 31, 2023 and changes during the year then ended are presented below (in thousands, except share amounts):
| Shares | Weighted Average Grant Date Fair Value | ||||||||||
Balance as of December 31, 2022 | $ | ||||||||||
| Granted | $ | ||||||||||
| Forfeited | ( | $ | |||||||||
| Vested | ( | $ | |||||||||
Balance as of December 31, 2023 | $ | ||||||||||
14. Earnings Per Share
The following weighted-average shares and share equivalents were used to calculate basic and diluted earnings per share (“EPS”) for the years ended December 31, 2023, 2022 and 2021 (in thousands, except share amounts):
| Year Ended December 31, | |||||||||||||||||
| 2023 | 2022 | 2021 | |||||||||||||||
| Numerator | |||||||||||||||||
| Net and comprehensive income attributable to Dream Finders Homes, Inc. | $ | $ | $ | ||||||||||||||
Less: Preferred dividends, net(1) | |||||||||||||||||
| Add: Loss prior to reorganization attributable to DFH LLC members | |||||||||||||||||
Net and comprehensive income available to common stockholders(2) | $ | $ | $ | ||||||||||||||
| Denominator | |||||||||||||||||
| Weighted-average number of common shares outstanding - basic | |||||||||||||||||
Add: Common stock equivalent shares(3) | |||||||||||||||||
| Weighted-average number of shares outstanding - diluted | |||||||||||||||||
(1)Includes a one-time increase of $0.3 million to the numerator of the computations of basic and diluted EPS for the year ended December 31, 2023 for the excess of the carrying amount over the redemption amount of the Series B preferred units. Refer to Note 12, Mezzanine and Stockholders’ Equity.
(2)For the diluted EPS calculation, $13.2 million, $13.7 million and $3.5 million in preferred dividends associated with convertible preferred stock that are assumed to be converted have been added back to the numerator for the years ended December 31, 2023, 2022 and 2021, respectively.
(3)Since the conversion price of the Company’s convertible preferred stock is based on an average of the closing price of Class A common stock for the 90 trading days immediately preceding the end of the current period, changes in the price of the Class A common stock may significantly affect the number of additional assumed common shares outstanding under the if-converted method for diluted EPS, even when the number of convertible preferred stock shares outstanding is unchanged. Stock-based compensation awards are excluded from the calculation of diluted EPS in the event they are antidilutive. There were 0.6 million, 0.8 million, and 0.2 million of common stock equivalent shares excluded from the diluted earnings per share calculation during the years ended December 31, 2023, 2022 and 2021, respectively, related to unvested restricted stock that were antidilutive.
81
15. Subsequent Events
Crescent Homes Acquisition
On February 1, 2024, the Company completed the acquisition of certain assets and assumed certain liabilities, comprising of the majority of the homebuilding business of Crescent Ventures, LLC (“Crescent Homes”) through DFH subsidiaries, Dream Finders Holdings LLC, and DFH Crescent, LLC (“DFH Crescent”), a newly formed entity for purposes of consummating this transaction. This acquisition allows us to expand into the markets of Charleston and Greenville, South Carolina, and Nashville, Tennessee. The consideration given for the Crescent Homes acquisition was cash in the amount of $185 million, subject to customary post-closing adjustments based on the closing date net asset value of the purchased assets and assumed liabilities. As part of the transaction, the former owner of Crescent Homes received a 10 % non-controlling ownership in DFH Crescent and contractual rights to a portion of its future earnings according to the terms of the agreement. The Company has not yet completed its evaluation and determination of consideration paid and certain assets and liabilities acquired in accordance with ASC 805.
ITEM 9. CHANGES IN AND DISAGREEMENTS WITH ACCOUNTANTS ON ACCOUNTING AND FINANCIAL DISCLOSURE
None.
ITEM 9A. CONTROLS AND PROCEDURES
Disclosure Controls and Procedures
Under the supervision and with the participation of our Chief Executive Officer (“CEO”) and Chief Financial Officer (“CFO”), management evaluated the effectiveness of the design and operation of our disclosure controls and procedures (as defined in Rules 13a-15(e) or 15d-15(e) of the Securities Exchange Act of 1934) as of December 31, 2023. Based on that evaluation, the CEO and CFO concluded that the Company’s disclosure controls and procedures as of December 31, 2023 were effective in providing reasonable assurance that information required to be disclosed in the reports the Company files, furnishes, submits or otherwise provides the SEC under the Exchange Act is recorded, processed, summarized and reported, within the time periods specified in the SEC’s rules and forms, and that information required to be disclosed in reports filed by the Company under the Exchange Act is accumulated and communicated to the Company’s management, including the CEO and CFO, in such a manner as to allow timely decisions regarding the required disclosure
Management's Annual Report on Internal Control over Financial Reporting
Our management is responsible for establishing and maintaining adequate internal control over financial reporting, as such term is defined in Exchange Act Rules 13a-15(f) and 15d-15(f). Under the supervision and with the participation of our management, including our CEO and CFO, we conducted an evaluation of the effectiveness of our internal control over financial reporting based on the framework Internal Control - Integrated Framework (2013) issued by the Committee of Sponsoring Organizations of the Treadway Commission. Because of its inherent limitations, internal control over financial reporting may not prevent or detect misstatements.
Also, projections of any evaluation of effectiveness to future periods are subject to the risk that controls may become inadequate because of changes in conditions, or that the degree of compliance with the policies and procedures may deteriorate.
Based on our evaluation under the framework, our management concluded that our internal control over financial reporting was effective as of December 31, 2023. The effectiveness of the Company’s internal control over financial reporting as of December 31, 2023 has been audited by PricewaterhouseCoopers LLC, an independent registered public accounting firm, as stated in its report that appears in this Annual Report on Form 10-K.
Changes in Internal Control over Financial Reporting
There was no change in our internal control over financial reporting as such term is defined in Exchange Act Rule 13a-15(f) that occurred during the quarter ended December 31, 2023 that has materially affected, or is reasonably likely to materially affect, our internal control over financial reporting.
82
ITEM 9B. OTHER INFORMATION
Rule 10b5-1 Trading Plans and Insider Trading Policies and Procedures
Directors and Executive Officers. Our directors and executive officers may purchase or sell shares of our common stock in the market from time to time, including pursuant to equity trading plans adopted in accordance with Rule 10b5-1 under the Exchange Act (“Rule 10b5-1”) and in compliance with guidelines specified by the Company. In accordance with Rule 10b5-1 and the Company’s insider trading policy (which is attached as Exhibit 19.1), directors, officers and certain employees who, at such time, are not in possession of material non-public information about the Company are permitted to enter into written plans that pre-establish amounts, prices and dates (or formula for determining the amounts, prices and dates) of future purchases or sales of the Company’s stock, including shares acquired pursuant to the Company’s equity plans (“Rule 10b5-1 Trading Plans”). Under a Rule 10b5-1 Trading Plan, a broker executes trades pursuant to parameters established by the director or executive officer when entering into the plan, without further direction from them.
None of the Company’s directors or officers adopted terminated
The Company. On November 11, 2023, the Company adopted a new Rule 10b5-1 Trading Plan to replace its previous Rule 10b5-1 Trading Plan, which expired on November 6, 2023. The Company entered into the new Rule 10b5-1 plan to execute repurchases of its Class A common stock under its share buyback program. Under the Company’s Rule 10b5-1 Trading Plan, a broker will execute purchases pursuant to parameters and prices pre-established by the Company without further direction. The Company’s Rule 10b5-1 Trading Plan has a scheduled expiration date of May 5, 2024 and includes an aggregate amount of $25 million of Class A common stock.
ITEM 9C. DISCLOSURE REGARDING FOREIGN JURISDICTIONS THAT PREVENT INSPECTIONS.
Not applicable.
83
PART III
Item 10. Directors, Executive Officers and Corporate Governance
The information called for by Item 10, to the extent not set forth in “Business—Executive Officers” in Item 1, will be set forth in the definitive proxy statement relating to the 2024 Annual Meeting of Stockholders of Dream Finders Homes, Inc. (the “2024 Annual Meeting of Stockholders”) pursuant to SEC Regulation 14A. Such definitive proxy statement relates to a meeting of stockholders involving the election of directors and the portions thereof called for by Item 10 are incorporated herein by reference pursuant to Instruction G to Form 10-K.
Code of Business Conduct and Ethics
All of our employees, officers and directors, including those responsible for financial reporting, operate under a written Code of Business Conduct and Ethics. All employees are required, upon their initial employment with the Company and annually thereafter, to affirm in writing their receipt and review of the Code of Business Conduct and Ethics and their compliance with its provisions. Additionally, the Corporate Governance Guidelines prohibit directors and executive officers from entering into any form of hedging or other monetization transaction involving shares of our common stock.
The Code of Business Conduct and Ethics was adopted in January 2021 and can be accessed under the “Investor Relations—Governance” link on our website at www.dreamfindershomes.com. We intend to satisfy any disclosure requirements pursuant to Item 5.05 of Form 8-K and the NYSE rules regarding any amendment to, or waiver from, certain provisions of the Code of Business Conduct and Ethics by posting such information on our website.
Item 11. Executive Compensation
The information called for by Item 11 will be set forth in the definitive proxy statement relating to the 2024 Annual Meeting of Stockholders pursuant to SEC Regulation 14A. Such definitive proxy statement relates to a meeting of stockholders involving the election of directors and the portions thereof called for by Item 11 are incorporated herein by reference pursuant to Instruction G to Form 10-K.
Item 12. Security Ownership of Certain Beneficial Owners and Management and Related Stockholder Matters
The information called for by Item 12 will be set forth in the definitive proxy statement relating to the 2024 Annual Meeting of Stockholders pursuant to SEC Regulation 14A. Such definitive proxy statement relates to a meeting of stockholders involving the election of directors and the portions thereof called for by Item 12 are incorporated herein by reference pursuant to Instruction G to Form 10-K.
Item 13. Certain Relationships and Related Transactions, and Director Independence
The information called for by Item 13 will be set forth in the definitive proxy statement relating to the 2024 Annual Meeting of Stockholders pursuant to SEC Regulation 14A. Such definitive proxy statement relates to a meeting of stockholders involving the election of directors and the portions thereof called for by Item 13 are incorporated herein by reference pursuant to Instruction G to Form 10-K.
Item 14. Principal Accountant Fees and Services
The information called for by Item 14 will be set forth in the definitive proxy statement relating to the 2024 Annual Meeting of Stockholders pursuant to SEC Regulation 14A. Such definitive proxy statement relates to a meeting of stockholders involving the election of directors and the portions thereof called for by Item 14 are incorporated herein by reference pursuant to Instruction G to Form 10-K.
84
PART IV
ITEM 15. EXHIBITS AND FINANCIAL STATEMENT SCHEDULES
(1)The following consolidated financial statements as set forth in Item 8 of this report are filed herein.
Dream Finders Homes, Inc.
Report of Independent Registered Public Accounting Firm
Consolidated Balance Sheets
Consolidated Statements of Comprehensive Income
Consolidated Statements of Equity
Consolidated Statements of Cash Flows
Notes to the Consolidated Financial Statements
(2)Financial Statement Schedules.
All schedules are omitted because the required information is not applicable, not material, or because the required information is included in the consolidated financial statements and related notes thereto.
(3)Exhibits.
The exhibits filed or furnished as part of this Annual Report on Form 10-K are listed in the Index to Exhibits, which Index includes the management contracts or compensatory plans or arrangements required to be filed as exhibits to this Annual Report on Form 10-K by Item 601(b)(10)(iii) of Regulation S-K and is incorporated in this Item by reference.
| Exhibit No. | Description | |||||||
| Membership Interest Purchase Agreement, dated as of January 29, 2020, by and between Dream Finders Holdings LLC and H&H Constructors, Inc. (incorporated herein by reference to Exhibit 2.1 to the Registration Statement on Form S-1 (File No. 333-251612) of Dream Finders Homes, Inc. filed with the SEC on December 22, 2020). | ||||||||
| First Amendment to Membership Interest Purchase Agreement, dated as of March 17, 2020, by and between Dream Finders Holdings LLC and H&H Constructors, Inc. (incorporated herein by reference to Exhibit 2.2 to the Registration Statement on Form S-1 (File No. 333-251612) of Dream Finders Homes, Inc. filed with the SEC on December 22, 2020). | ||||||||
| Second Amendment to Membership Interest Purchase Agreement, dated as of April 30, 2020, by and between Dream Finders Holdings LLC and H&H Constructors, Inc. (incorporated herein by reference to Exhibit 2.3 to the Registration Statement on Form S-1 (File No. 333-251612) of Dream Finders Homes, Inc. filed with the SEC on December 22, 2020). | ||||||||
| Third Amendment to Membership Interest Purchase Agreement, dated as of June 30, 2020, by and between Dream Finders Holdings LLC and H&H Constructors, Inc. (incorporated herein by reference to Exhibit 2.4 to the Registration Statement on Form S-1 (File No. 333-251612) of Dream Finders Homes, Inc. filed with the SEC on December 22, 2020). | ||||||||
| Fourth Amendment to Membership Interest Purchase Agreement, dated as of August 18, 2020, by and between Dream Finders Holdings LLC and H&H Constructors, Inc. (incorporated herein by reference to Exhibit 2.5 to the Registration Statement on Form S-1 (File No. 333-251612) of Dream Finders Homes, Inc. filed with the SEC on December 22, 2020). | ||||||||
85
| Fifth Amendment to Membership Interest Purchase Agreement, dated as of August 31, 2020, by and between Dream Finders Holdings LLC and H&H Constructors, Inc. (incorporated herein by reference to Exhibit 2.6 to the Registration Statement on Form S-1 (File No. 333-251612) of Dream Finders Homes, Inc. filed with the SEC on December 22, 2020). | ||||||||
| Sixth Amendment to Membership Interest Purchase Agreement, dated as of September 18, 2020, by and between Dream Finders Holdings LLC and H&H Constructors, Inc. (incorporated herein by reference to Exhibit 2.7 to the Registration Statement on Form S-1 (File No. 333-251612) of Dream Finders Homes, Inc. filed with the SEC on December 22, 2020). | ||||||||
| Seventh Amendment to Membership Interest Purchase Agreement, dated as of September 22, 2020, by and between Dream Finders Holdings LLC and H&H Constructors, Inc. (incorporated herein by reference to Exhibit 2.8 to the Registration Statement on Form S-1 (File No. 333-251612) of Dream Finders Homes, Inc. filed with the SEC on December 22, 2020). | ||||||||
| Eighth Amendment to Membership Interest Purchase Agreement, dated as of October 2, 2020, by and between Dream Finders Holdings LLC and H&H Constructors, Inc. (incorporated herein by reference to Exhibit 2.9 to the Registration Statement on Form S-1 (File No. 333-251612) of Dream Finders Homes, Inc. filed with the SEC on December 22, 2020). | ||||||||
| Membership Interest Purchase Agreement, effective as of January 31, 2021, by and between Dream Finders Holdings LLC and Four Seventeen, LLC (incorporated herein by reference to Exhibit 2.11 to the Form 10-K of Dream Finders Homes, Inc. filed with the SEC on March 30, 2021). | ||||||||
| Purchase and Sale Agreement, dated as of June 17, 2021, among Dream Finders Holdings LLC, MHI Partnership, Ltd., MHI Models, Ltd., McGuyer Homebuilders, Inc., FMR IP, LLC, HomeCo Purchasing Company, Ltd., 2019 Sonoma, LLC, Frank B. McGuyer and McGuyer Interests, Ltd. (incorporated herein by reference to Exhibit 2.1 to the Current Report on Form 8-K (File No. 001-39916) of Dream Finders Homes, Inc. filed with the SEC on September 13, 2021). | ||||||||
| First Amendment to Purchase and Sale Agreement, dated as of August 31, 2021, among Dream Finders Holdings LLC, MHI Partnership, Ltd., MHI Models, Ltd., McGuyer Homebuilders, Inc., FMR IP, LLC, HomeCo Purchasing Company, Ltd., 2019 Sonoma, LLC, Frank B. McGuyer and McGuyer Interests, Ltd. (incorporated herein by reference to Exhibit 2.2 to the Current Report on Form 8-K (File No. 001-39916) of Dream Finders Homes, Inc. filed with the SEC on September 13, 2021). | ||||||||
| Second Amendment to Purchase and Sale Agreement, dated as of September 7, 2021, among Dream Finders Holdings LLC, DFH Coventry, LLC, MHI Partnership, Ltd., MHI Models, Ltd., McGuyer Homebuilders, Inc., FMR IP, LLC, HomeCo Purchasing Company, Ltd., 2019 Sonoma, LLC, Frank B. McGuyer and McGuyer Interests, Ltd. (incorporated herein by reference to Exhibit 2.3 to the Current Report on Form 8-K (File No. 001-39916) of Dream Finders Homes, Inc. filed with the SEC on September 13, 2021). | ||||||||
| Amended and Restated Certificate of Incorporation of Dream Finders Homes, Inc. (incorporated herein by reference to Exhibit 3.1 to the Current Report on Form 8-K (File No. 001-39916) of Dream Finders Homes, Inc. filed with the SEC on January 25, 2021). | ||||||||
| Amended and Restated Bylaws of Dream Finders Homes, Inc. (incorporated herein by reference to Exhibit 3.2 to the Current Report on Form 8-K (File No. 001-39916) of Dream Finders Homes, Inc. filed with the SEC on January 25, 2021). | ||||||||
| Certificate of Designations of Dream Finders Homes, Inc., dated September 29, 2021 (incorporated herein by reference to Exhibit 3.1 to the Current Report on Form 8-K (File No. 001-39916) of Dream Finders Homes, Inc. filed with the SEC on October 5, 2021). | ||||||||
86
| Description of Securities Registered Pursuant to Section 12 of the Securities Exchange Act of 1934 (incorporated by reference hereto Exhibit 4.1 to Form 10-K filed with the SEC on March 16, 2022). | ||||||||
| Registration Rights Agreement, dated January 25, 2021, by and among Dream Finders Homes, Inc. and certain stockholders party thereto (incorporated herein by reference to Exhibit 4.1 to the Current Report on Form 8-K (File No. 001-39916) of Dream Finders Homes, Inc. filed with the SEC on January 25, 2021). | ||||||||
Indenture, dated as of August 22, 2023, by and among the Company, the Guarantors and U.S. Bank Trust Company, National Association, as trustee (incorporated herein by reference to Exhibit 4.1 to the Current Report on Form 8-K (File No. 001-39916) of Dream Finders Homes, Inc. filed with the SEC on August 22, 2023). | ||||||||
| Amended and Restated Credit Agreement, dated as of June 2, 2022, among Dream Finders Homes, Inc., Bank of America, N.A., as administrative agent, collateral agent and issuing bank, and the lenders named therein as parties thereto (incorporated herein by reference to Exhibit 10.1 to the Current Report on Form 8-K (File No. 001-39916) of Dream Finders Homes, Inc. filed with the SEC on June 8, 2022). | ||||||||
Second Amendment to Amended and Restated Credit Agreement, dated as of July 19, 2023, among Dream Finders Homes, Inc., Bank of America, N.A., as administrative agent, collateral agent and issuing bank, and the lenders named therein as parties thereto (incorporated herein by reference to Exhibit 10.1 to Form 10-Q (File No. 001-39916) of Dream Finders Homes, Inc. filed with the SEC on November 2, 2023). | ||||||||
Third Amendment to Amended and Restated Credit Agreement, dated as of July 19, 2023, among Dream Finders Homes, Inc., Bank of America, N.A., as administrative agent, collateral agent and issuing bank, and the lenders named therein as parties thereto (incorporated herein by reference to Exhibit 10.2 to the Form 10-Q (File No. 001-39916) of Dream Finders Homes, Inc. filed with the SEC on November 2, 2023). | ||||||||
| Dream Finders Homes, Inc. 2021 Equity Incentive Plan. (incorporated herein by reference to Exhibit 10.3 to the Current Report on Form 8-K (File No. 001-39916) of Dream Finders Homes, Inc. filed with the SEC on January 25, 2021). | ||||||||
| Form of Restricted Stock Grant Notice and Restricted Stock Agreement under the 2021 Equity Incentive Plan (incorporated herein by reference to Exhibit 10.6 to the Registration Statement on Form S-1 (File No. 333-251612) of Dream Finders Homes, Inc. filed with the SEC on January 11, 2021). | ||||||||
| Form of Stock Option Grant Notice and Stock Option Agreement under the 2021 Equity Incentive Plan (incorporated herein by reference to Exhibit 10.7 to the Registration Statement on Form S-1 (File No. 333-251612) of Dream Finders Homes, Inc. filed with the SEC on January 14, 2021). | ||||||||
| Form of Director and Employee Indemnification Agreement (incorporated herein by reference to Exhibit 10.8 to the Registration Statement on Form S-1 (File No. 333-251612) of Dream Finders Homes, Inc. filed with the SEC on January 11, 2021). | ||||||||
Amended and Restated Employment Agreement, effective as of November 1, 2023, by and between Dream Finders Homes, Inc. and Patrick Zalupski (incorporated herein by reference to Exhibit 10.3 to Form 10-Q (File No. 001-39916) of Dream Finders Homes, Inc. filed with the SEC on November 2, 2023). | ||||||||
| Amended and Restated Employment Agreement, effective as of November 1, 2023, by and between Dream Finders Homes, Inc. and L. Anabel Fernandez (incorporated herein by reference to Exhibit 10.3 to Form 10-Q (File No. 001-39916) of Dream Finders Homes, Inc. filed with the SEC on November 2, 2023). | ||||||||
Amended and Restated Employment Agreement, effective as of November 1, 2023, by and between Dream Finders Homes, Inc. and Douglas Moran (incorporated herein by reference to Exhibit 10.3 to Form 10-Q (File No. 001-39916) of Dream Finders Homes, Inc. filed with the SEC on November 2, 2023). | ||||||||
87
| Form of Restricted Stock Grant Notice and Restricted Stock Agreement, by and between Dream Finders Homes, Inc. and Patrick Zalupski (incorporated herein by reference to Exhibit 10.12 to the Registration Statement on Form S-1 (File No. 333-251612) of Dream Finders Homes, Inc. filed with the SEC on January 14, 2021). | ||||||||
| Registration Rights Agreement, dated September 29, 2021, by and among Dream Finders Homes, Inc. and the Purchasers listed thereto (incorporated herein by reference to Exhibit 10.2 to the Current Report on Form 8-K (File No. 001-39916) of Dream Finders Homes, Inc. filed with the SEC on October 5, 2021). | ||||||||
| Subscription Agreement, dated September 8, 2021, by and between Dream Finders Homes, Inc. and the Purchasers listed thereto (incorporated herein by reference to Exhibit 10.2 to the Current Report on Form 8-K (File No. 001-39916) of Dream Finders Homes, Inc. filed with the SEC on September 13, 2021). | ||||||||
| Dream Finders Homes, Inc. Insider Trading Policy | ||||||||
| List of Subsidiaries of Dream Finders Homes, Inc. | ||||||||
| Consent of Independent Registered Public Accounting Firm | ||||||||
| CEO Certification, Pursuant to Section 302 of the Sarbanes-Oxley Act of 2002 | ||||||||
| CFO Certification, Pursuant to Section 302 of the Sarbanes-Oxley Act of 2002 | ||||||||
| Certification Pursuant to 18 U.S.C. Section 1350, as adopted Pursuant to Section 906 of the Sarbanes-Oxley Act of 2002 | ||||||||
| Certification Pursuant to 18 U.S.C. Section 1350, as adopted Pursuant to Section 906 of the Sarbanes-Oxley Act of 2002 | ||||||||
| Dream Finders Homes, Inc. Compensation Recovery Policy | ||||||||
| 101.INS | Inline XBRL Instance Document (the instance document does not appear in the Interactive Data File because its XBRL tags are embedded within the Inline XBRL document). | |||||||
| 101.SCH | Inline XBRL Taxonomy Extension Schema Document. | |||||||
| 101.CAL | Inline XBRL Taxonomy Extension Calculation Linkbase Document. | |||||||
| 101.DEF | Inline XBRL Taxonomy Extension Definition Linkbase Document. | |||||||
| 101.LAB | Inline XBRL Taxonomy Extension Label Linkbase Document. | |||||||
| 101.PRE | Inline XBRL Taxonomy Extension Presentation Linkbase Document. | |||||||
| 104 | Cover Page Interactive Data File (formatted as inline XBRL and contained in Exhibit 101). | |||||||
* Filed or furnished herewith.
† Management contract or compensatory plan or arrangement required to be filed as an exhibit to this Form 10-K.
88
+ Certain schedules and similar attachments have been omitted pursuant to Item 601(a)(5) of Regulation S-K. The registrant undertakes to furnish supplemental copies of any of the omitted schedules upon request by the SEC.
ITEM 16. FORM 10-K SUMMARY
None.
89
SIGNATURES
Pursuant to the requirements of Section 13 or 15(d) of the Securities Exchange Act of 1934, the registrant has duly caused this report to be signed on its behalf by the undersigned, thereunto duly authorized.
| Dream Finders Homes, Inc. | ||||||||
| Date: | February 29, 2024 | /s/ Patrick O. Zalupski | ||||||
| Patrick O. Zalupski | ||||||||
| President, Chief Executive Officer and Chairman of the Board of Directors | ||||||||
Pursuant to the requirements of the Securities Exchange Act of 1934, this report has been signed below by the following persons on behalf of the registrant and in the capacities and on the dates indicated.
| Signature | Title | Date | ||||||||||||
| /s/ Patrick O. Zalupski | President, Chief Executive Officer and Chairman of the Board of Directors | February 29, 2024 | ||||||||||||
| Patrick O. Zalupski | (Principal Executive Officer) | |||||||||||||
| /s/ L. Anabel Fernandez | Senior Vice President and Chief Financial Officer | February 29, 2024 | ||||||||||||
| L. Anabel Fernandez | (Principal Financial and Accounting Officer) | |||||||||||||
| /s/ W. Radford Lovett II | Director | February 29, 2024 | ||||||||||||
| W. Radford Lovett II | ||||||||||||||
| /s/ Megha H. Parekh | Director | February 29, 2024 | ||||||||||||
| Megha H. Parekh | ||||||||||||||
| /s/ Leonard M. Sturm | Director | February 29, 2024 | ||||||||||||
| Leonard M. Sturm | ||||||||||||||
| /s/ Justin W. Udelhofen | Director | February 29, 2024 | ||||||||||||
| Justin W. Udelhofen | ||||||||||||||
| /s/ William W. Weatherford | Director | February 29, 2024 | ||||||||||||
| William W. Weatherford | ||||||||||||||
90