UNITED STATES
SECURITIES AND EXCHANGE COMMISSION
WASHINGTON, D.C. 20549
______________________________________________
FORM 10-K
______________________________________________
(Mark One)
| ANNUAL REPORT PURSUANT TO SECTION 13 OR 15(d) OF THE SECURITIES EXCHANGE ACT OF 1934 | |||||
For the fiscal year ended December 31 , 2023
______________________________________________
OR
| TRANSITION PERIOD PURSUANT TO SECTION 13 OR 15(d) OF THE SECURITIES EXCHANGE ACT OF 1934 | |||||
FOR THE TRANSITION PERIOD FROM TO
Commission File Number: 001-33584
______________________________________________
(Exact name of Registrant as specified in its Charter)
______________________________________________
| (State or other jurisdiction of incorporation or organization) | (I.R.S. Employer Identification No.) | |||||||
| (Address of principal executive offices) | (Zip Code) | |||||||
(212 ) 448-6605
(Registrant’s telephone number, including area code)
Securities registered pursuant to Section 12(b) of the Act:
| Title of each class | Trading Symbol(s) | Name of each exchange on which registered | ||||||
Securities registered pursuant to Section 12(g) of the Act:
None
______________________________________________
Indicate by check mark if the registrant is a well-known seasoned issuer, as defined in Rule 405 of the Securities Act. Yes ☐ No ☑
Indicate by check mark if the registrant is not required to file reports pursuant to Section 13 or Section 15(d) of the Act. Yes ☐ No ☑
Indicate by check mark whether the registrant (1) has filed all reports required to be filed by Section 13 or 15(d) of the Securities Exchange Act of 1934 during the preceding 12 months (or for such shorter period that the registrant was required to file such reports), and (2) has been subject to such filing requirements for the past 90 days. Yes ☑ No ☐
Indicate by check mark whether the registrant has submitted electronically every Interactive Data File required to be submitted pursuant to Rule 405 of Regulation S-T (§ 232.405 of this chapter) during the preceding 12 months (or for such shorter period that the registrant was required to submit such files). Yes ☑ No ☐
Indicate by check mark whether the registrant is a large accelerated filer, an accelerated filer, a non-accelerated filer, a smaller reporting company or an emerging growth company. See definition of “large accelerated filer,” “accelerated filer,” “smaller reporting company" and “emerging growth company” in Rule 12b-2 of the Exchange Act.
Large accelerated filer ☐ Accelerated filer ☑ Non-accelerated filer ☐ Smaller Reporting Company ☑
Emerging Growth Company ☐
If an emerging growth company, indicate by check mark if the registrant has elected not to use the extended transition period for complying with any new or revised financial accounting standards provided pursuant to Section 13(a) of the Exchange Act. ☐
Indicate by check mark whether the registrant has filed a report on and attestation to its management's assessment of the effectiveness of its internal control over financial reporting under Section 404(b) of the Sarbanes-Oxley Act (15 U.S.C. 7262(b) by the registered public accounting firm that prepared or issued its audit report. ☑
If securities are registered pursuant to Section 12(b) of the Act, indicate by check mark whether the financial statements of the registrant included in the filing reflect the correction of an error to previously issued financial statements. ☐
Indicate by check mark whether any of those error corrections are restatements that required a recovery analysis of incentive-based compensation received by any of the registrant’s executive officers during the relevant recovery period pursuant to §240.10D-1(b). ☐
Indicate by check mark whether the registrant is a shell company (as defined in Rule 12b-2 of the Exchange Act). Yes ☐ No ☑
The aggregate market value of common stock held by non-affiliates of the registrant was approximately $159,000,000 as of June 30, 2023, the last business day of the registrant’s second fiscal quarter of 2023. For the purpose of the foregoing calculation only, all directors and executive officers of the registrant and owners, if any, of more than 10% of the registrant’s common stock are assumed to be affiliates of the registrant. This determination of affiliate status is not necessarily conclusive for any other purpose.
As of February 5, 2024, there were 48,032,487 shares of the registrant’s common stock, par value $0.01 per share, outstanding.
DOCUMENTS INCORPORATED BY REFERENCE
Part III incorporates information from certain portions of the registrant’s definitive proxy statement to be filed with the Securities and Exchange Commission within 120 days after the fiscal year end of December 31, 2023.
DHI GROUP, INC.
TABLE OF CONTENTS
| Page | |||||||||||
| PART I. | |||||||||||
| Item 1. | |||||||||||
| Item 1A. | |||||||||||
| Item 1B. | |||||||||||
| Item 1C. | |||||||||||
| Item 2. | |||||||||||
| Item 3. | |||||||||||
| Item 4. | |||||||||||
| PART II. | |||||||||||
| Item 5. | |||||||||||
| Item 6. | |||||||||||
| Item 7. | |||||||||||
| Item 7A. | |||||||||||
| Item 8. | |||||||||||
| Item 9. | |||||||||||
| Item 9A. | |||||||||||
| Item 9B. | |||||||||||
| Item 9C. | |||||||||||
| PART III. | |||||||||||
| Item 10. | |||||||||||
| Item 11. | |||||||||||
| Item 12. | |||||||||||
| Item 13. | |||||||||||
| Item 14. | |||||||||||
| PART IV. | |||||||||||
| Item 15. | |||||||||||
| Item 16. | |||||||||||
1
NOTE CONCERNING FORWARD-LOOKING STATEMENTS
Information contained herein contains forward-looking statements within the meaning of the Private Securities Litigation Reform Act of 1995, Section 27A of the Securities Act of 1933, as amended (the “Securities Act”), and Section 21E of the Securities Exchange Act of 1934, as amended (the “Exchange Act”). You should not place undue reliance on those statements because they are subject to numerous uncertainties and factors relating to our operations and business environment, all of which are difficult to predict and many of which are beyond our control. Forward-looking statements include information concerning our possible or assumed future financial condition, liquidity and results of operations, including expectations (financial or otherwise), our strategy, plans, objectives, expectations (financial or otherwise) and intentions, and growth potential. These statements often include words such as “may,” “will,” “should,” “believe,” “expect,” “anticipate,” “intend,” “plan,” “estimate” or similar expressions. These statements are based on assumptions that we have made in light of our experience in the industry as well as our perceptions of historical trends, current conditions, expected future developments and other factors we believe are appropriate under the circumstances. Although we believe that these forward-looking statements are based on reasonable assumptions, you should be aware that many factors could affect our actual financial results or results of operations and could cause actual results to differ materially from those in the forward-looking statements. These factors include, but are not limited to:
•our ability to execute our tech-focused strategy;
•write-offs of goodwill, tradename and intangible assets;
•competition from existing and future competitors;
•changes in the recruiting and career services business and technologies, and the development of new products and services;
•failure to develop and maintain our reputation and brand recognition;
•failure to increase or maintain the number of customers who purchase recruitment packages;
•failure to attract qualified professionals or grow the number of qualified professionals who use our websites;
•inability to successfully integrate future acquisitions or identify and consummate future acquisitions;
•misappropriation or misuse of our intellectual property, claims against us for intellectual property infringement or the failure to enforce our ownership or use of intellectual property;
•failure of our businesses to attract, retain and engage users;
•unfavorable decisions in proceedings related to future tax assessments;
•taxation risks in various jurisdictions for past or future sales;
•significant downturn not immediately reflected in our operating results;
•our indebtedness and the potential inability to borrow funds under our Credit Agreement (as defined below);
•our ability to incur additional debt;
•covenants in our Credit Agreement;
•the development and use of artificial intelligence;
•failure to timely and efficiently scale and adapt our existing technology and network infrastructure;
•capacity constraints, systems failures or breaches of network security;
•the usefulness of our candidate profiles;
•decrease in user engagement;
•Internet search engine methodologies and their impact on our search result rankings;
•failure to halt the operations of websites that aggregate our data, as well as data from other companies;
•our reliance on third-party data hosting facilities;
•compliance with laws and regulations concerning collection, storage and use of professionals’ personal and career related information;
•U.S. regulation of the internet;
•loss of key executives and technical personnel and our ability to attract and retain key executives, including our CEO;
•increases in the unemployment rate, cyclicality or downturns in the United States or worldwide economies or the industries we serve, labor shortages, or job shortages;
•litigation related to infringement or other claims regarding our services or content;
•our ability to defend ownership of our intellectual property;
•global climate change;
•compliance with changing corporate governance requirements and costs incurred in connection with being a public company;
•the impact of public health issues, such as COVID-19, could have on our business and financial condition and the economy in general
•compliance with the continued listing standards of the New York Stock Exchange (the “NYSE”);
•volatility in our stock price;
•failure to maintain internal controls over financial reporting;
2
•results of operations fluctuating on a quarterly and annual basis; and
•disruption resulting from unsolicited offers to purchase the company.
Summary Risk Factors
Our business is subject to a number of risks that may prevent us from achieving our objectives, or may adversely affect our business, financial condition, operations, cash flows, and prospects. These risks are outlined and discussed more fully below and include:
Risks Related to Our Business
•our ability to execute our tech-focused strategy in a competitive business environment that is constantly changing;
•a write-off of all or a part of our goodwill and intangible assets may hurt our operating results;
•our backlog may not accurately represent future revenue;
•our ability to successfully compete against existing and future competitors;
•our ability to adapt our business model to keep pace with changes in the recruiting and career services business;
•our ability to develop and maintain our brand, attract customers and recruit new qualified users;
•our ability to increase or maintain the number of customers who purchase recruitment packages;
•our ability to attract qualified professionals to our websites or grow the number of qualified professionals who use our websites;
•acquisitions and our ability to successfully integrate acquisitions;
•misappropriation or misuse of our intellectual property, claims against us for intellectual property infringement or failure to enforce our ownership of our intellectual property;
•our ability to attract and retain users who create and post original content on our web properties;
•taxation risks in various jurisdictions and the potential for unfavorable decisions related to tax assessments;
•taxation risks impacting liability for past sales and ability to make future sales;
•a significant downturn in our customers' businesses;
Risks Related to Our Indebtedness
•our indebtedness and our ability to borrow in case of adverse changes within the credit market;
•the covenants set forth in our Credit Agreement;
•we may be able to incur more debt, which could increase the risks to our financial condition;
Risks Related to Our Technology
•the development and use of artificial intelligence;
•our ability to scale, adapt and maintain our technology and infrastructure;
•capacity constraints, systems failures or breaches of our network security;
•the usefulness of our candidate profiles to our customers;
•any decrease in our user engagement;
•changes in search engines’ methodologies resulting in a decline in our page rankings or user engagement;
•our ability to halt operations of third-party websites that aggregate our data;
•our reliance on third-party hosting facilities;
Regulatory Risks
•our compliance with laws and regulations concerning the collection, storage and use of professional and personal information, including the CPRA (as defined below);
•U.S. government regulation of the Internet and taxation;
Risks Related to Ownership of Our Securities
•compliance with the listing standards of the NYSE;
•the volatility of our stock price;
•our ability to maintain internal controls over financial reporting;
•the estimates and assumptions on which our financial projections are based;
•the results of our operations fluctuate on a quarterly and annual basis; and
•disruption resulting from unsolicited offers to purchase the Company.
3
General Risk Factors
•our ability to attract or retain key executives and personnel;
•our ability to navigate the cyclicality or downturns of the U.S. and worldwide economies;
•litigation related to infringement or other claims regarding our services or content;
•our ability to defend ownership of our intellectual property;
•global climate change;
•the impacts of public health issues like COVID-19 that may arise;
NON-GAAP FINANCIAL MEASURES
Information contained herein contains certain non-GAAP financial measures. These measures are not in accordance with, or an alternative for, generally accepted accounting principles in the United States (“GAAP”). Such measures presented herein include Adjusted EBITDA and Adjusted EBITDA Margin (each as defined herein). See Item 7 “Management’s Discussion and Analysis of Financial Condition and Results of Operations, Non-GAAP Financial Measures,” for definitions of these measures as well as reconciliations to the comparable GAAP measures.
4
PART I
Item 1. Business
Introduction and Summary
This section provides an overview of DHI Group, Inc. (“DHI,” the "Company," "we," "us," or "our"). Please see our consolidated financial statements included elsewhere in this report for additional discussion regarding our results of operations for the year ended December 31, 2023.
| (in thousands) | FY 2023 | FY 2022 | Change | |||||||||||||||||
| Revenues | $ | 151,878 | $ | 149,680 | 1 | % | ||||||||||||||
| Operating income | $ | 6,288 | $ | 5,560 | 13 | % | ||||||||||||||
| Income before income taxes | $ | 3,622 | $ | 3,597 | 1 | % | ||||||||||||||
Net income(1) | $ | 3,491 | $ | 4,176 | (16) | % | ||||||||||||||
Diluted earnings per share(1) | $ | 0.08 | $ | 0.09 | (11) | % | ||||||||||||||
| Net cash flows from operating activities | $ | 21,345 | $ | 36,035 | (41) | % | ||||||||||||||
Adjusted EBITDA (2) | $ | 36,254 | $ | 30,950 | 17 | % | ||||||||||||||
Adjusted EBITDA Margin (2) | 24 | % | 21 | % | n.m. | |||||||||||||||
| (1) For the year ended December 31, 2023, net income and diluted earnings per share includes the net negative impact of impairment of investment, severance and related costs, gain on investment and restructuring, all net of tax, and discrete tax items of $0.9 million, or $0.02 per diluted share. Net income and diluted earnings per share for the year ended December 31, 2022 includes the net positive impact of income from investments, proceeds from settlement, impairments and severance and related costs, all net of tax, and discrete tax items of $1.9 million, or $0.04 per share. | ||||||||||||||||||||
| (2) For a description of these non-GAAP measures and reasons why management believes they provide useful information to investors, please see Item 7 “Management’s Discussion and Analysis of Financial Condition and Results of Operations, Non-GAAP Financial Measures” located elsewhere in this report. | ||||||||||||||||||||
5
2023 Highlights | In 2023, DHI focused its efforts on operating effectively and efficiently while continuing to strengthen its industry-leading product offerings expertly helping employers find, attract and hire top tech talent, and assisting technology professionals with managing their careers amidst ongoing uncertainty in the economy impacting tech hiring. Despite the weak demand environment, DHI continued to grow revenue, albeit at a reduced 1% rate. More importantly, DHI managed expenses carefully, which drove Adjusted EBITDA margin from 21% in 2022 to 24% in 2023. Dice delivered multiple product releases enhancing the client and technologist experience and ClearanceJobs added the community engagement features of a social network for its security cleared professionals to create even higher levels of engagement. DHI also won several employer branding awards, demonstrating its commitment to a vibrant and engaged culture. | |||||||
Stable Financial Performance | Despite the over 40% down shift in tech job postings this past year due to the uncertain economic environment, DHI achieved 1% year over year revenue growth. We believe that as the demand for technology professionals normalizes, DHI will return to a higher growth rate, especially given the interest in Artificial Intelligence (AI) skills that are expected to define this decade. Dice and ClearanceJobs 2023 revenue renewal rates remained strong at 85% and 95%, respectively, while retention rates for the year were 101% for Dice and 111% for ClearanceJobs, demonstrating larger more stable clients continue to find value in our services. Our churn continued to be isolated to smaller clients with less than $10,000 in annual spend. DHI also improved its Adjusted EBITDA Margin to 24% while continuing to invest in future growth for when the economy stabilizes. Recognizing the continued risks inherent in the economy, the company is favoring lower debt in the current environment. Cash was $4.2 million at the end of 2023 and total debt was $38.0 million under our $100 million facility. | |||||||
Leading Engagement for Tech/Cleared Candidates | Dice’s Match AI algorithms continued to improve this year, driven by years of training on job postings and candidate profiles to validate a tech professional's skills and experience. Dice’s new Connections feature encourages technology candidates and recruiters to form connections through respective profiles and view these connections in a network dashboard, helping recruiters build a pipeline of relevant candidates and allowing tech professionals to engage with companies of interest. Both Dice and ClearanceJobs released the “Expressed Interest” feature allowing candidates to show interest in a job posting short of filling out a lengthy job application. This feature has already been used hundreds of thousands of times since it launched in March 2023. ClearanceJobs released its first native mobile app allowing candidates to engage in their search process on a smartphone device. | |||||||
| Inspired and Respected Place to Work | We firmly believe that the success of our company starts with our culture and ability to attract and retain great team members. For the second time, DHI was certified as Great Place to Work®, it ranked 47th on Newsweek’s list of Top 100 Most Loved Workplaces for 2023 and was named as a Fast Company Best Workplace for Innovators in 2023. Additionally, the Company re-opened a larger office in New York City to support its vibrant sales team and recently moved to a new modern office space in Des Moines, Iowa to further establish its hybrid work environment and foster its culture of collaboration. | |||||||
6
Company Profile
DHI was incorporated in Delaware on June 28, 2005 and is a leading provider of artificial intelligence-powered software products, online tools and services to deliver career marketplaces to candidates and employers globally. DHI's brands — Dice and ClearanceJobs — enable recruiters and hiring managers to efficiently search, match and connect with highly skilled technologists in specialized fields, particularly technology and those with active government security clearances. Our mission is to empower technology professionals and organizations that hire them to compete and win through expert insights and relevant employment connections by delivering three key value propositions:
•Providing the best search and match solution for recruiters and employers through software services;
•Delivering the most relevant and personalized technology career related content; and
•Aggregating and analyzing workforce intelligence data to deliver specialized insights.
The majority of our revenues in 2023 were generated through the sale of recruitment packages, which allow customers to promote jobs on our websites and source candidates through our resume databases. Recruitment packages are typically provided through contractual arrangements with annual, quarterly or monthly payment terms.
Our Products and Services
We help organizations find the best talent, and we help technology and security cleared professionals find the best jobs to advance their careers. Through our software solutions, our vision is to create indispensable career marketplaces that match the highest quality candidates with the right career opportunities. Our solutions are available individually or bundled in packages, including:
•Talent profiles. Each of our brands provides access to relevant candidate profiles, resumes, and social and web profiles creating a broader pool of talent for our clients. We help clients quickly find and connect with top talent to make their recruiting efforts more efficient.
•Job postings. Our job platforms are focused on specific verticals tailored to technology and security-cleared individuals, making it easier for professionals to search for relevant jobs. In turn, the applications received by clients are more likely to be relevant and qualified compared to applications received on generalist sites. Providing professionals with the most relevant job postings benefits both the talent and the recruiting organization.
•Employer Branding. Each of our brands has a suite of offerings that help clients amplify their brand to reach more professionals. Solutions include display advertising, email, enhanced job postings or company profiles, and social targeting.
•Other Services. In connection with our Dice and ClearanceJobs brands, DHI offers other services such as: 1) virtual and live career events; 2) sourcing services, which is a premium service delivering sourced and screened candidates to recruiters and employers; and 3) content and data services that provides tailored content to help professionals manage their careers and provide employers insight into recruiting strategies and trends.
Industry and Skill Focused Brands
During 2023 we offered our talent acquisition and career development products and tools through the following brands:
| Service | Yrs. in Operation | Specialized Focus | Primary Source of Revenues | ||||||||
Dice1 | 33 | Technology and engineering in the U.S. | Recruitment packages2 and career events | ||||||||
| ClearanceJobs | 21 | Security-cleared professionals | Recruitment packages2 | ||||||||
1 Includes Career Events | |||||||||||
2 Recruitment packages are subscription based products that provide access to our candidate profiles and/or the ability to post jobs. | |||||||||||
Dice has been a go-to destination for technology and engineering talent in the United States for over 30 years. The job postings available on Dice, from both technology and non-technology companies across many industries, include positions for software engineers, big data professionals, systems administrators, database specialists, project managers, and a variety of other technology and engineering professionals. Dice had approximately 48,000 job postings as of December 31, 2023 and during 2023, Dice had, on average, approximately 1.3 million monthly users.
7
Customers can purchase recruitment packages, job postings or advertisements. Recruitment packages offer our customers the ability to access candidate profiles and post jobs. Candidate Match and Search on Dice is powered by IntelliSearch, a proprietary machine-learning technology that is foundational to many Dice products and services. Approximately 90% of Dice revenue was derived from recruitment packages in 2023.
Dice offers tools, advice and support to help U.S. tech professionals registered on the platform find relevant jobs, evaluate companies and connect with recruiters. Within the platform, tech professionals can build profiles, post resumes, search jobs and access career-related content, tech career and hiring news and tools. To help make their job search more efficient, Dice job alerts deliver personalized opportunities to candidates through features like IntelliSearch job recommendations and Dice Match capabilities. Professionals can also learn more about a company’s tech culture, tech stack and what it’s like to work on the tech team through company profiles, then connect and chat with recruiters and hiring teams to talk directly about fit.
ClearanceJobs ClearanceJobs is the leading online career community dedicated to connecting security-cleared professionals with employers in a secure and private environment to fill the jobs that safeguard our nation. Authorized U.S. government contractors, federal agencies, national laboratories and universities utilize ClearanceJobs to quickly and easily find candidates with specific, active or current security clearance requirements in a range of disciplines. The platform provides opportunities for employers and candidates to engage in real-time through messaging and live video, and for employers to promote differentiators through a multitude of branding products and features. The majority of candidates with resumes on our site have high-level security clearance. ClearanceJobs had approximately 55,000 job postings as of December 31, 2023 and during 2023, ClearanceJobs had, on average, 750,000 monthly users.
Our Industry
We primarily operate in the talent discovery and acquisition segment of the broader market for human capital management services through career sites for technology professionals. There is a shortage of skilled professionals worldwide and we believe that the overall demand for talent acquisition and career development products and services has significant long-term growth potential.
We also believe that certain industries that employ highly-skilled and highly-paid professionals will experience particularly strong demand for effective recruiting solutions due to the scarcity of such professionals. For example, as of December 2023, the seasonally unadjusted U.S. unemployment rate was 2.3% for computer-related occupations as compared to the overall national average of 3.7%, seasonally adjusted. We believe that there are five major trends that will continue to shape demand for talent acquisition services:
•Greater competition for professional talent. The candidate-employer relationship has changed, with the balance of power shifting towards the candidates. As more companies leverage technology to advance their business, employers will increasingly need to hire tech talent to compete. According to analysis from the U.S. Bureau of Labor Statistics, computer and technology occupations are projected to grow faster than average due to the need to replace workers who leave and driven by overall demand for these skillsets.
•Continued professional interest in career brands specific to industry and skills. Our services focus on domains or industries that require specialized skills and knowledge and, thus, customized content, profiles and search parameters. In addition, the technology professionals often share a sense of personal identity and community that goes beyond the confines of their careers. We believe that both specialized skills and the sense of personal identity and community lead professionals in our verticals to prefer specialized career brands over generalist ones.
•Talent attraction and retention becoming more of a strategic priority for companies. McKinsey & Company reports a fundamental mismatch between companies' demand for talent and the number of workers willing to supply it, driven by more workers reevaluating what they want from a job and opting for nontraditional employment such as gig, temporary or part-time. Hiring skilled technologists is a key driver to moving digital innovation forward.
•Increased use of data and analytics in human capital management and increased need for insights. As many companies prove the power of analytics in marketing and other business domains, organizations are seeking to gain a competitive advantage by applying data-driven insights to improve their hiring, retention and leadership capabilities.
•Artificial intelligence ("AI") is reshaping the way companies identify, attract and retain top talent. AI has changed the landscape of talent acquisition. With the advent of AI technologies, recruiters can leverage advanced algorithms and machine learning to sift through vast amounts of data, identifying suitable candidates more efficiently. Automated screening processes can analyze resumes, assess skills, and predict candidate success, streamlining the initial stages of recruitment. Additionally, AI allows faster screening of applicants while reducing bias in the recruitment process.
8
In this environment, we believe there is an opportunity for career management and talent acquisition tools that leverage the common interests, goals and skills of select professional communities. We believe that a focus on professional communities allows organizations to more efficiently identify talent, with more complete data and insights about that talent.
Our Value Proposition
We are a leading provider of data, insights and employment connections through specialized online professional communities organized around common professional interests and skill sets powered by technology. This specialized approach provides technology professionals with more relevant career related information and opportunities, enhancing their ability to maximize their careers. Through engaging with professionals, we are able to build rich and unique data sets around valuable talent pools. The combination of our focused online professional websites and rich data sets allows organizations to find and hire professional talent more efficiently and effectively, and therefore incentivizes them to source talent through our online professional communities. The benefits our services provide to both professionals and recruiting customers create a robust marketplace.
Benefits we provide to Professionals
Relevant employment connections. When professionals post their resumes or apply for jobs on our websites, they can make valuable connections with organizations who prize their skills and expertise. Professionals can avoid having to “sort through the clutter” on generalist career sites and get the most out of their time by using our more focused services.
Skills/industry-specific career management tools, information and insights. We provide professionals with targeted and relevant career development tools, content and news. For example, Dice and ClearanceJobs provide professionals with market and salary information and local market trends. In addition, the Salary Predictor allows professionals to evaluate their market value and map out which skills will increase their value. We believe our career development services and tools provide professionals with the insights they need to propel their careers forward, and thus increase the engagement of professionals with our sites.
Benefits we provide to our Customers
Large pools of qualified and hard-to-reach professionals. We seek to improve the efficiency of the recruiting process for our customers by providing efficient access to large pools of highly qualified and hard-to-reach professionals. Because the communities of professionals who visit our websites are highly-skilled and specialized within specific industries, we believe our customers who post jobs receive applications from candidates who are better qualified for the positions, and that they receive fewer irrelevant applications than when using generalist sites. In addition, since our resume data and resume search functions are highly tailored by specialty, we believe that our customers can more efficiently identify talent using our resume databases than by using broader services.
Relevant information on prospective candidates. We believe that the specialized nature of our job posting and resume search products makes them inherently more relevant and efficient for recruiting. Using all of these products together gives our customers the most complete view of a prospective candidate, and allows them to not only identify the best talent but also tailor their recruiting approach to each individual.
Hyper-targeted candidate outreach and employer branding. We offer recruiters and employers the ability to target hard-to-find professionals with messages in the online forums they frequent. Our social targeting service leverages our social aggregation capabilities to assemble candidate target lists based on specific factors like skill sets, work experience, location, or interests; then executes hyper-targeted employer branding or job search campaigns in online forums where specific potential candidates spend time.
Our Strategic Goals
The Company continues to focus on building upon its legacy as a market leader in technology talent acquisition by delivering best-in-class candidate quality and match capabilities through its career marketplaces. As more employers use the subscription-based offerings to find, attract, engage and hire the highest quality tech professionals, the Company continues to invest in product and marketing to expand the technologist community and create an ideal onboarding experience for tech talent. The Company continues to evolve to a solution selling business, coupled with its goal of maintaining strong Adjusted EBITDA margins to maximize profitability.
9
Delivering best-in-class candidate quality and match capabilities for technology roles. We believe candidate quality is the essential foundation of success in our industry and we intend to differentiate our business by leading in this respect. We have dramatically improved the quality of our Dice candidates to a level we believe is best-in-class and plan continued vigilance and innovation to drive continued improvements. We are also building on our unique legacy and intellectual property in the technology jobs space to create match capabilities for both candidates and clients that are reducing the time and effort required in job searching and talent acquisition. Our proprietary and patented machine-learning technology including IntelliSearch, powers many Dice and ClearanceJobs products and is foundational to providing relevant job opportunities for candidates and efficient search and match solutions for clients.
Building indispensable tech-focused career marketplaces. ClearanceJobs has established a unique franchise in the market for cleared professionals, many with tech experience. Built on a unique cohort of candidates and specialized employer and recruiter tools together, ClearanceJobs is a highly interactive two-sided marketplace environment. These attributes provide clear and measurable return on investment for clients and has contributed to ClearanceJobs more than doubling its revenue over the past five years. With over 20 years in the market, we believe ClearanceJobs is an indispensable and valuable business. We continue to transform our Dice brand into a similar career marketplace customized for the needs of its unique candidate and client communities. We officially launched all elements of the career marketplace features for Dice in 2021 and focused 2022 on landing launches and driving adoption with customers while launching new products to create efficiency in the recruiting process. In 2023, Dice released a number of features to expand the marketplace and create higher engagement between employers and tech candidates on the platform. We expect these changes to transform the way our stakeholders use Dice and to drive results as adoption increases.
Investing in functional excellence and product innovation. Since joining DHI in 2018, CEO Art Zeile has built a leadership team capable of driving growth and supporting a culture of high performance. The leadership team continually advances their functional areas to drive results in the business, working towards the common goal of launching and landing innovative products in the market. Specifically, in 2023 the Company released a number of products to help employers find tech candidates and to help technologists further their careers. At Dice these products include: Premium Enhanced Company Profile, Dice Remote and Company Preferences, Dice Invite to Apply, Dice Matchscore on Jobs, Dice Connections, SMS Notifications, and Company Search. At ClearanceJobs these products include: Comments, ClearanceJobs Expressed Interest, ClearanceJobs Enhanced Employer Profile, ClearanceJobs Mobile App, and ClearanceJobs Live Stream.
We are investing to further increase the pace of innovation by organizing talent on our technology team, centered around a development model to increase the quality and speed of product delivery. Our marketing team is focused on delivering results at lower cost in terms of driving traffic to Dice, increasing marketing qualified leads, growing visible profiles and applications with less spend and with more to come as we leverage new capabilities in customer relationship management (CRM), product marketing, and digital analytics, among others.
Transforming our sales and customer success efforts to drive growth. As early leaders in online talent acquisition, DHI’s brands have a legacy of strong recurring clients and revenue and, as a result, renewals have historically provided the majority of the Company’s revenues. We believe there is significant opportunity to grow our customer base and expand to new revenue opportunities, particularly with commercial accounts, or clients who recruit for their own needs, with an expanded and better enabled sales force and at ClearanceJobs by growing relationships directly with government agencies. Our customer success team executed new strategies to drive proactive external engagement and report real-time feedback to better include the customer voice to influence our product roadmap. We plan to continue growing our sales team as opportunities arise.
Marketing and Sales
DHI Group’s brands are built on providing value to both sides of a thriving career marketplace. Technologists join and engage to find jobs and develop their careers, and customers (staffing firms, recruiting firms and companies hiring professionals in our areas of expertise) use our platforms and support to find the right talent for their open roles.
Our consumer marketing focuses on growing the number of professionals who engage with our content, visit our websites and become members, as the more active and interested consumers we have within our platforms, the more attractive our products and services are to our customers. These efforts include digital advertising, search engine marketing, content marketing, email marketing, social media and influencer marketing. We measure success through goals related to brand awareness, consideration and product usage, traffic, new and updated consumer profiles, and applications to job postings.
10
For customers, our marketing and sales teams work in lockstep to develop new customer relationships and maintain high customer satisfaction. Customer marketing efforts range from creating and capturing demand to retention-focused activities. Marketing supports the entire customer journey, from problem and brand/product awareness to affinity and consideration, intent and purchase, and onboarding. Marketing initiatives include advertising, thought leadership, content marketing, media relations, social media, email campaigns and participation in industry events. We measure success through lead volume and quality, lead-to-revenue metrics, brand awareness, consideration and product usage, traffic and content engagement.
We sell our products and services primarily through our direct sales force and agency partner channel. Our sales team is organized by brand, market segment, and geography and targets Fortune 1000 companies, large staffing and recruiting firms and other large and mid-size commercial businesses. Our strategy in 2023 focused on continuing to execute against our solution-oriented sales approach. In addition, we continued to focus on customer engagement to drive best-in-class customer satisfaction scores. As of December 31, 2023, we employed 177 sales and support personnel in the United States.
We also invest in fraud detection initiatives and maintain teams of account managers and customer support specialists who work to ensure customers get the most from our products and services by providing training and assistance. In addition to technologies we leverage for fraud detection, our customer support departments perform some compliance functions, such as reviewing the websites for false or inaccurate job postings.
Customers
We currently serve a diversified customer base consisting of approximately 8,200 customers in total. No one customer accounted for more than 10% of our revenues in 2023. Our customers include small, mid-sized and large direct employers, staffing companies, recruiting agencies, consulting firms and marketing departments of companies. As of December 31, 2023 notable customers of the Dice and ClearanceJobs businesses included AT&T, Adecco, CACI, Cisco, Disney, Edward Jones, General Dynamics, Kforce, Microsoft, Northrop Grumman, Bank of America and DISH Network.
Technology
We use a variety of open source and proprietary technologies to support our website services. Our websites provide a multitenancy technology platform with multiple application services developed to perform at scale. We primarily utilize Amazon Web Services (AWS) as our cloud infrastructure platform, which enables us to scale our computer network and storage capacity on an as-needed basis. Our application services and data connections are continually monitored 24/7 for performance and stability. Our application and infrastructure architecture enable us to ensure global reach, as well as advantages in resiliency and cloud delivery. Job seekers and customers can access our websites with any standard web browser, mobile web browsers, and iOS and Android applications. Our websites also utilize AWS disaster recovery, redundancy, and resiliency services, including multi-availability zone, multi-region, redundant storage and networking solutions, and self-healing capabilities.
Competition
The market for talent acquisition services is highly competitive with multiple online and offline competitors. With the evolution of the online recruiting model, there has been an increasing need to provide ease-of-use and relevance to professionals, as well as an efficient and cost-effective recruitment method for direct employers, recruiters and staffing companies. Additionally, further technological advancements and evolution of social networks increasing the interaction between candidates and potential employers have made it easier for new competitors to emerge, and advertisers have many alternatives available to reach their target audiences. Our ability to maintain our existing customer base and generate new customers depends to a significant degree on the quality of our candidate databases and audiences, the quality of our services, our ability to enhance our websites and the underlying technology of our websites to meet the needs of a rapidly-evolving marketplace, our pricing strategy and ability to introduce value-added products and services, contracting alternatives such as subscription or consumption based models, and our reputation among our candidates and our customers and potential customers, who are increasingly sophisticated and demanding. Our competitors include:
•social and professional networking sites, such as LinkedIn, Facebook, X and Google;
•niche or specialist professional networking sites such as GitHub and Stack Overflow;
•generalist job boards, some of which have substantially greater resources and brand recognition than we do, such as CareerBuilder, Monster, and Seek which, unlike specialized job boards, permit customers to enter into a single
11
contract to find professionals across multiple occupational categories and attempt to fill all of their hiring needs through a single website;
•aggregators and distributors of job postings and profiles, including Indeed (owned by Recruit), TalentBin (owned by Monster Worldwide), Entelo, ZipRecruiter, and Google;
•career-focused community sites such as Glassdoor;
•newspaper and magazine publishers, national and regional advertising agencies, executive search firms and search and selection firms that carry classified advertising, many of whom have developed, begun developing or acquired new media capabilities, such as recruitment websites, or have partnered with generalist job boards;
•specialized services focused specifically on the industries we service, such as Upwork;
•new and emerging competitors with new business models and products;
•our customers, who seek to recruit candidates directly by using their own resources, including corporate websites; and
•general business sites and print publications, as well as technology news and information community sites, such as Google News, Digg.com and Reddit.com.
The principal elements of competition in our markets include brand awareness and reputation, product functionality, design, price, customer service, market share and marketing. We believe that our unique product offerings position us well in the marketplace. However, a number of companies in the industry have greater financial resources, more comprehensive product lines, broader market presence, longer standing relationships with customers, longer operating histories, stronger brand recognition, and greater marketing resources than we have.
Intellectual Property
We seek to protect our intellectual property through a combination of service marks, trademarks, copyrights and other methods of restricting disclosure of our proprietary or confidential information. As we continue to develop and improve our technology, patents may become a more significant part of our intellectual property in the foreseeable future. We generally enter into confidentiality agreements with our employees, consultants and vendors. We also seek to control access to and distribution of our technology, documentation and other proprietary information.
We generally pursue the registration of the material service marks we own in the United States and internationally, as applicable. We own a number of registered, applied for and/or unregistered trademarks and service marks that we use in connection with our businesses. Our trademarks and registered trademarks in the United States include DICE, and the stylized designs for CLEARANCEJOBS.COM as well as DHI. Registration for the plain usage of "clearancejobs.com," the stylized "Dice" logo as well as our social media "D" logo have also been filed, further protecting our intellectual property. Registrations for trademarks may be maintained indefinitely, as long as the trademark owner continues to use and police the trademarks and timely renews registrations with the applicable governmental office. Although we generally pursue the registration of our material service marks and other material intellectual property we own, where applicable, we have trademarks and/or service marks that have not been registered in the United States and/or other jurisdictions. We have not registered the copyrights in the content of our websites and do not intend to register such copyrights.
The steps we have taken to protect our copyrights, trademarks, service marks and other intellectual property may not be adequate, and third parties could infringe, misappropriate or misuse our intellectual property. If this were to occur, it could harm our reputation and affect our competitive position. See Item 1A. “Risk Factors—Misappropriation or misuse of our intellectual property could harm our reputation, affect our competitive position and cost us money.”
Investments
DHI has made no significant investments through acquisitions during the past five years. See also Note 7 of the notes to consolidated financial statements.
Regulation and Legislation
User Privacy
We collect, store and use a variety of information about both professionals and customers on our website properties. Within the websites, the information that is collected, stored, and used has been provided by the professionals or customers with the intent of making it publicly available. We do not ask professionals or customers to supply social security numbers. Our business data
12
is separated from website operations by a variety of security layers including network segmentation, physical and logical access controls, firewalls, and many industry-accepted, best-practice information security controls.
We post our privacy policies on our websites so that our users can access and understand the terms and conditions applicable to the collection, storage, and use of information collected from users. Our privacy policies also disclose the types of information we gather, how we use it and how a user can correct or change their information. Our privacy policies also explain the circumstances under which we share this information and with whom. Professionals who register for our websites have the option of indicating specific areas of interest in which they are willing to receive offers via email. These offers contain content created either by us or our third-party partners. To protect confidential information and to comply with our obligations to our users, we impose constraints on our customers to whom we provide user data, which are consistent with our commitments to our users. Additionally, when we provide lists to third parties, including to our advertiser customers, it is under contractual terms that are consistent with our obligations to our users and with applicable laws and regulations.
See Item 1A. Risk Factors “We may be liable with respect to the collection, storage, and use of the personal and professional information of the professionals who use our websites and our current practices may not be in compliance with proposed new laws and regulations” and “Our business is subject to U.S. government regulation of the Internet and taxation, which may have a material adverse effect on our business.”
U.S. Government Regulation
We are subject to a number of government regulations that regulate our products and online service offerings, including content, copyright infringement, user privacy, advertising and promotional activities, taxation, access charges, liability for third-party activities, and jurisdiction. In addition, federal, state, and local governmental organizations have enacted and also are considering, and may consider in the future, other legislative and regulatory proposals that would regulate the Internet. Areas of potential regulation include, but are not limited to, libel, electronic contracting, pricing, quality of products and services, and intellectual property ownership.
There are a number of U.S. laws and regulations that affect companies conducting business online. Certain laws regulate commercial electronic messages. Such laws frequently provide a right on the part of the recipient to request the sender to stop sending messages, and establish penalties for the sending of email messages that are not compliant with such laws, including messages that are intended to deceive the recipient as to source or content or that do not provide an electronic method of informing the sender of the recipient’s decision not to receive further commercial emails.
We are subject to federal, state and local laws and regulations regarding privacy and protection of data. Our privacy policies and terms of use agreements describe our practices concerning the use, storage, transmission and disclosure of user data. Any failure by us to comply with our privacy policies or terms of use agreements, or privacy-related laws and regulations, could result in proceedings against us by governmental authorities or others, which could harm our business. The interpretation of these privacy and data protection laws and various regulators’ approach to their enforcement, as well as our products and services, continue to evolve over time. We face the risk that these laws may be interpreted and applied in conflicting ways in different jurisdictions or in a manner that is not consistent with our current data protection practices, or that new and unclear laws will be enacted. There currently are a number of proposals pending before federal, state, and local legislative and regulatory bodies. There are laws as well as a number of legislative proposals in the United States, at both the federal and state level, that impose obligations in areas affecting our business, or may do so in the future. For example, California adopted the California Consumer Privacy Act of 2018, or CCPA, which became effective on January 1, 2020. The CCPA has been characterized as the first privacy statute of its kind to be enacted in the United States as it includes significant penalties for non-compliance, as well as creating the right for consumers to bring a private action in certain circumstances. More recently, on November 3, 2020, California enacted the California Privacy Rights Act ("CPRA"). The CPRA, which went into effect on January 1, 2023, expands upon the protections provided by the CCPA, including new limitations on the sale or sharing of consumers’ personal information, and the creation of a new state agency to enforce the CPRA’s protections. In addition, numerous state legislatures have passed, or are contemplating passing legislation similar in nature to the CPRA. To the extent these laws differ from existing laws, our compliance efforts will be further complicated.
Complying with these varying requirements could cause us to incur additional costs and change our business practices. Further, any failure by us to adequately protect our users’ privacy and data could result in a loss of confidence in our products and services and, ultimately, in a loss of customers, which could have an adverse effect on our business, and could subject the Company to penalties or liability.
13
Furthermore, favorable laws may change, including, for example, in the United States where the FCC voted to repeal net neutrality regulations. Given uncertainty around these rules, including changing interpretations, amendments or repeal, coupled with potentially significant political and economic power of local network operators, we could experience discriminatory or anti-competitive practices that could impede our growth, cause us to incur additional expense, or otherwise negatively affect our business.
The application of laws and regulations affecting online business to our products and services is often unclear, and these laws and how various jurisdictions interpret these laws continue to evolve. Compliance with these laws may be expensive and could harm our business. Any failure by the Company to comply with these laws and regulations could result in actions against us by governmental authorities or other entities, which could harm our business, including governmental or court orders that we cease certain activities.
See Item 1A. Risk Factors “Our business is subject to U.S. government regulation of the Internet and taxation, which may have a material adverse effect on our business” and “Capacity constraints, systems failures or breaches of our network security could materially and adversely affect our business. If we fail to manage our technical operations infrastructure, our existing customers may experience services outages, and our new customers may experience delays in the deployment of our solution.”
Human Capital Disclosures
Employees
As of December 31, 2023, we had approximately 460 employees. Our employees are not represented by any union and are not the subject of a collective bargaining agreement. We believe that we have a good relationship with our employees and experienced strong engagement among team members during the year as evidenced by results from our annual engagement survey and below average turnover rate. We offer flexible work schedules, abbreviated hours on Fridays, flexible paid time off and remote working opportunities for all team members to promote work/life balance. We have made it a priority to support our employees as they work from home, including increased flexibility surrounding personal and family commitments and a quarterly work from home stipend. The Company budgets for professional development training by both functional group and at the individual level each year. Professional development could include attending an online class to learn a new skillset, attending a conference or finding opportunities within the organization to grow skillsets. Additionally the Company has a tuition reimbursement program designed to provide employees with financial assistance in continuing their education.
Diversity
Inclusion and diversity remain key priorities for the Company. The diverse backgrounds, skills and experiences of executive officers, board members, and employees are important to both our values and performance. We believe that a diverse board, management team and workforce that is reflective of our diverse customer base will position us to better understand customers’ wants and needs, which we believe drives our ability to deliver superior customer value and successfully innovate. Diverse perspectives amongst our management team and board allows them to evaluate issues through different experiences and perspectives and help guide the Company in a thoughtful way. The Company’s internal Diversity, Equity and Inclusion program is based on promoting a culture of inclusivity, and includes Allyship training and Unconscious Bias training, which teaches team members how to better support marginalized groups. Additionally all team members participated in leadership and communication training in 2023. The Company has employee resource groups led by employees of underrepresented populations to share experiences and have a shared space. The internal policies of the Company encourage hiring diverse candidates and our culture is inclusive, ensuring that all team members are treated fairly and equally, amongst other things. In 2021, the Company introduced inclusive fertility benefits which support all paths to parenthood and in 2022 expanded benefits to cover travel expenses related to women's health.
Information Availability
Our Annual Report on Form 10-K, Quarterly Reports on Form 10-Q, Current Reports on Form 8-K, proxy and information statements and other material information concerning us are available, as soon as reasonably practicable after we electronically file or furnish such information to the Securities and Exchange Commission (the "SEC"), free of charge on the Investors page of our website at www.dhigroupinc.com. Our reports filed with the SEC are also available free of charge by visiting http://www.sec.gov.
14
Item 1A. Risk Factors
Risks Related to Our Business
We may not be successful in executing our tech-focused strategy which could have a material adverse effect on our results of operations.
We may not be successful in pursing our tech-focused strategy, which includes narrowing priorities to initiatives related to connecting technology professionals with employers across all industries. There can be no assurance that the allocation of resources behind our tech-focused business and sales and marketing efforts will result in the strengthening of our competitive position, the failure of which could have a material adverse effect on our financial condition and results of operations. As a result of our strategic focus on technology professionals and the divesting of our businesses operating in and focused on different professions, we have an increased dependence on the demand for technology-focused professionals and may not have the mitigating benefits of exposure to a portfolio of diverse professions in the event of a downturn in the demand for such technology professionals. For example, in 2022 and 2023 several large technology companies underwent planned layoffs. If the need for technology professionals decreases, whether because there is reduced demand for technologists by our customers, as a result of macroeconomic conditions affecting their businesses, the aforementioned layoffs, reductions in hiring or otherwise, our ability to sell recruitment packages to our customers may be adversely impacted.
A write-off of all or a part of our goodwill and intangible assets would hurt our operating results.
We have significant intangible assets and goodwill. As of December 31, 2023, we had $128.1 million and $23.8 million of goodwill and acquired intangible assets, respectively, on our balance sheet, which represented approximately 57% and 11%, respectively, of our total assets. We do not amortize goodwill or our indefinite-lived acquired intangible asset, which is the Dice trademarks and brand name, under U.S. GAAP and instead are required to review them at least annually for impairment. The annual impairment test for the Dice trademarks and brand name is performed on October 1 of each year. DHI has experienced impairment charges in the past. Most recently, during the first and third quarters of 2020, because of the impacts of the COVID-19 pandemic and its potential impact on future earnings and cash flows for the tech-focused reporting unit and those that are attributable to the Dice trademarks and brand name, the Company recorded impairment charges totaling $37.8 million. In the event an impairment is identified again in the future, a charge to earnings would be recorded. Although it would not affect our cash flow or liquidity position, a write-off in future periods of all or a part of our goodwill or intangible asset would have a material adverse effect on our overall results of operations. See Item 7. “Management’s Discussion and Analysis of Financial Condition and Results of Operations—Critical Accounting Estimates—Goodwill and Indefinite-Lived Acquired Intangible Assets.”
Our backlog may not accurately represent future revenue.
Backlog consists of deferred revenue plus customer contractual commitments not invoiced, representing the value of future services to be rendered under committed contracts. Our contracts are subject to delay or default and contracts in the Company's backlog are subject to changes in the scope of services to be provided as well as adjustments to the costs relating to the applicable contracts. Backlog may also be affected by, among other things, external market and economic factors beyond our control. Accordingly, there is no assurance that the entirety of our backlog will be realized. The timing of new contracts and the mix of services can significantly affect backlog. Backlog at any given point in time may not accurately represent the future revenue that may be realized and should not be relied upon as a stand-alone indicator of future revenues.
We operate in a highly competitive developing market and we may be unable to compete successfully against existing and future competitors.
The market for career services is highly competitive and barriers to entry in the market are relatively low. There are multiple generalist job boards, as well as a number of existing and emerging alternative business models seeking to compete in our target markets. We do not own any patented technology that would expressly preclude or inhibit competitors from entering the recruiting and career development services market. We compete with other companies that direct all or portions of their websites toward certain segments or sub-segments of the industries we serve. We compete with generalist job boards, some of which have substantially greater resources and brand recognition than we do, such as CareerBuilder, Monster.com, Indeed, ZipRecruiter, and Seek, which, unlike specialist job boards, permit customers to enter into a single contract to find professionals across multiple occupational categories and attempt to fill all of their hiring needs through a single website, as well as job
15
boards focused specifically on the industries we service, such as Stack Overflow and Upwork. We also may compete with newspaper and magazine publishers, as well as national and regional advertising agencies, executive search firms and search and selection firms that carry classified advertising, many of whom have developed, begun developing or acquired new media capabilities, such as recruitment websites, or have recently partnered with generalist job boards. We also compete with general business sites and print publications, as well as technology news and information community sites, such as Google News, Digg.com and Reddit.com. In addition, we face competition from aggregators of classified advertising, including TalentBin, Entelo, JobDiva, Daxtra, CEIPAL, and Google. Social and professional networking sites, such as LinkedIn, Facebook, Twitter and Google compete with us in providing professional services. We also compete with new competitors, including career-focused community sites such as Glassdoor and talent relationship management software providers such as Avature and Symphony Talent, and emerging competitors with new business models and products that customers are more willing to trial during periods when talent is scarce.
Some of our competitors have longer operating histories, larger client bases, longer relationships with clients, greater brand or name recognition, or significantly greater financial, technical, marketing and public relations resources than we do. As a result, they may be in a position to respond more quickly to new or emerging technologies and changes in customer requirements, and to develop and promote their products and services more effectively than we can. We may not be able to adapt to such technological changes or offer new products on a timely or cost-effective basis or establish or maintain competitive positions. If we are unable to develop and introduce new products and services, or enhancements to existing products and services, in a timely and successful manner, our business, results of operations, financial condition and liquidity could be materially and adversely affected, and the market price of our common stock would likely fall.
We must adapt our business model to keep pace with rapid changes in the recruiting and career services business, including rapidly changing technologies and the development of new products and services.
Providing online recruiting and career development services is a rapidly evolving business, and we will not be successful if our business model does not keep pace with new trends and developments. The adoption of new recruiting and job seeking techniques, particularly among those who have historically relied on traditional recruiting methods, requires acceptance of a new way of conducting business, exchanging information and applying for jobs. If we are unable to adapt our business model to keep pace with changes in the recruiting business, or if we are unable to continue to demonstrate the value of our online services to our customers, our business, results of operations, financial condition and liquidity could be materially adversely affected. Our success is also dependent on our ability to adapt to rapidly changing technology and to make investments to develop new products and services. Accordingly, to maintain our competitive position and our revenue base, we must continually modernize and improve the features, reliability and functionality of our service offerings and related products in response to our competitors. Future technological advances in the career services industry may result in the availability of new recruiting and career development offerings. Some of our competitors have longer operating histories, larger client bases, longer relationships with clients, greater brand or name recognition, or significantly greater financial, technical, marketing and public relations resources than we do. As a result, they may be in a position to respond more quickly to new or emerging technologies and changes in customer requirements, and to develop and promote their products and services more effectively than we can. We may not be able to adapt to such technological changes or offer new products on a timely or cost-effective basis or establish or maintain competitive positions. If we are unable to develop and introduce new products and services, or enhancements to existing products and services, in a timely and successful manner, our business, results of operations, financial condition and liquidity could be materially and adversely affected, which could result in a decline in the market price of our common stock.
Trends that could have a critical impact on our success include: rapidly changing technology in online recruiting, evolving industry standards relating to online recruiting, developments and changes relating to the Internet and mobile devices, evolving government regulations, competing products and services that offer increased functionality, changes in requirements for customers and professionals, and privacy protection concerning data available and transactions conducted over the Internet.
If we fail to develop and maintain our reputation and brand recognition our business could be adversely affected.
We believe that establishing and maintaining the identity of our brands, Dice and ClearanceJobs, is critical in attracting and maintaining the number of professionals and customers using our services, and that the importance of brand recognition will increase due to the growing number of services similar to ours and relatively low barriers to entry. Promotion and enhancement of our brands will depend largely on our success in continuing to provide high quality recruiting and career development services. If users do not perceive our existing career and recruiting services to be of high quality, or if we introduce new services or enter into new ventures that are not favorably received by users, the uniqueness of our brands could be diminished
16
and accordingly the attractiveness of our websites to professionals and customers could be reduced. We may also find it necessary to increase substantially our financial commitment to creating and maintaining a distinct brand loyalty among users. If we cannot provide high quality career services, fail to protect, promote and maintain our brands or incur excessive expenses in an attempt to improve our career services or promote or maintain our brands, our business, results of operations, financial condition and liquidity could be materially adversely affected.
Our business is largely based on customers who purchase recruitment packages. Any failure to increase or maintain the number of customers who purchase recruitment packages could adversely impact our revenues.
Our customers typically include recruiters, staffing firms, consulting firms and direct hiring companies. Customers can choose to purchase recruitment packages, classified postings, advertisements, or career fair and recruitment event booth rentals. Most of our revenues are generated by the fees we earn from our customers who purchase recruitment packages. Our growth depends on our ability to retain our existing recruitment package customers and to increase the number of customers who purchase recruitment packages, as well as introduce new pricing options. Any of our customers may decide not to continue to use our services in favor of alternate services, lack of need, or because of budgetary constraints or other reasons. We cannot guarantee that we will be successful in continuing to attract new customers or retaining existing customers or that our future sales efforts in general will be effective. If our existing customers choose not to use our services, decrease their use of our services, or change from being recruitment package customers to purchasing individual classified postings, our services, job postings and resumes posted on our websites could be reduced, search activity on our websites could decline, the usefulness of our services to customers could be diminished, and we could experience declining revenues and/or incur significant expenses. Dice recruitment package customers at December 31, 2023, 2022, and 2021 were 5,492, 6,311, and 6,004, respectively, while ClearanceJobs recruitment package customers at December 31, 2023, 2022, and 2021 were 2,055, 2,064, and 1,878, respectively.
If we fail to attract qualified professionals to our websites or grow the number of qualified professionals who use our websites, our revenues could decline.
The value of our websites to our customers is dependent on our ability to continuously attract professionals with the experience, education and skill-sets our customers seek. For example, the professionals who post their resumes on Dice.com are generally highly educated, have extensive work experience, and the majority are currently employed. To grow our businesses, we must continue to convince qualified professionals that our services will assist them in finding employment, so that customers will choose to use our services to find employees. If we are unable to increase the number of professionals using our websites, or if the professionals who use our websites are viewed as unattractive by our customers, our customers could seek to list jobs and search for professionals elsewhere, which could cause our revenues to decline.
If we are not able to successfully identify or integrate future acquisitions our management’s attention could be diverted, and our efforts to integrate future acquisitions could consume significant resources.
An important component of our tech-focused strategy is developing new capabilities that strengthen and expand our position in the U.S. technology talent acquisition market and broaden the talent solutions through the acquisition of other complementary businesses and technologies. Our further growth may depend in part on our ability to identify additional suitable acquisition opportunities or consummate such acquisitions on terms that are beneficial to us. We may not be able to identify suitable acquisition opportunities or consummate such acquisitions on favorable terms or at all. In addition, the anticipated results or operational benefits of any businesses we acquire may not be realized and we may not be successful in integrating other acquired businesses into our operations. Failure to manage and successfully integrate acquired businesses could harm our business. Even if we are successful in making an acquisition, we may encounter numerous risks, including the following:
•expenses, delays and difficulties in integrating the operations, technologies and products of acquired companies;
•potential disruption of our ongoing operations;
•diversion of management’s attention from normal daily operations of our business;
•inability to maintain key business relationships and the reputations of acquired businesses;
•the difficulty of integrating acquired technology and rights into our services and unanticipated expenses related to such integration;
•the impairment of relationships with customers and partners of the acquired companies or our customers and partners as a result of the integration of acquired operations;
17
•the impairment of relationships with employees of the acquired companies or our employees as a result of integration of new management personnel;
•entry into markets in which we have limited or no prior experience and in which our competitors have stronger market positions;
•dependence on unfamiliar employees, affiliates and partners;
•the amortization of acquired companies’ intangible assets;
•insufficient revenues to offset increased expenses associated with the acquisition;
•inability to maintain our internal standards, controls, procedures and policies;
•reduction or replacement of the sales of existing services by sales of products and services from acquired business lines;
•potential loss of key employees of the acquired companies;
•difficulties integrating the personnel and cultures of the acquired companies into our operations; and
•the impact of potential liabilities or unknown liabilities of the acquired businesses.
If any of these risks materialize, they could have a material adverse effect on our business, results of operations, financial condition and liquidity. In addition, any acquisition of other businesses or technologies may require us to seek debt or equity financing. Such financing might not be available to us on acceptable terms or at all. Market disruption and volatility, and poor economic conditions in the capital markets and global economy could adversely impact our ability to obtain additional financing on favorable terms or at all.
Misappropriation or misuse of our intellectual property could harm our reputation, affect our competitive position and lower our revenue.
Our success and ability to compete are dependent in part on the strength of our intellectual property rights, the content included on our websites, the goodwill associated with our patent, trademarks, trade names and service marks, and on our ability to use U.S. and foreign laws (if necessary) to protect them. Our intellectual property includes, among other things, the content included on our websites, our logos, brands, domain names, a patent, the technology that we use to deliver our products and services, the various databases of information that we maintain and make available and the appearance of our websites. We claim common law protection on certain names and marks that we have used in connection with our business activities and the content included on our websites. We also own a number of registered or applied-for trademarks and service marks that we use in connection with our business, including both plain text and stylized DICE and CLEARANCEJOBS.COM as well as stylized DHI, and the stylized "D" utilized on Dice social media. Although we generally pursue the registration of material service marks and other material intellectual property we own, where applicable, we have copyrights, trademarks and/or service marks that have not been registered in the United States and/or other jurisdictions. We generally enter into confidentiality and work-for-hire agreements with our employees, consultants, and vendors to protect our intellectual property rights. We also seek to control access to and distribution of our technology, documentation and other proprietary information as well as proprietary information licensed from third parties. Policing our intellectual property rights worldwide is a difficult task, and we may not be able to identify infringing users. The steps we have taken to protect our proprietary rights may not be adequate, and third parties could infringe, misappropriate or misuse our intellectual property rights. If this were to occur, it could harm our reputation and affect our competitive position. It could also require us to spend significant time and money in litigation. In addition, the laws of foreign countries do not necessarily protect intellectual property rights to the same extent as the laws of the United States. We have licensed in the past (on a royalty free basis), and may license in the future, various elements of our distinctive trademarks, service marks, trade dress, content and similar proprietary rights to third parties. We may enter into strategic marketing arrangements with certain third parties pursuant to which we license our trademarks, service marks and content to such third parties in order to promote our brands and services and to generate leads for our businesses. While we attempt to ensure that the quality of our brands is maintained by these licensees, we cannot assure you that third-party licensees of our proprietary rights will always take actions to protect the value of our intellectual property and reputation, and if they fail to do so, such failure could adversely affect our business and reputation.
If our business fails to attract and retain users, particularly users who create and post original content on our web properties, our financial results will be adversely affected.
Our reliance upon user-generated content requires that we develop and maintain tools and services designed to facilitate creation of user-generated content, participation in discussion surrounding such user-generated content, evaluation of user-generated content, and distribution of user-generated content. If our development efforts fail to facilitate such activities on our web properties, the level of user engagement and interaction will not increase and may decline. Even if we succeed in
18
facilitating such activities on our sites, there can be no assurance that such improvements will be deployed in a timely or cost-effective manner. If we fail to increase user engagement and interaction on our web properties, we will not attract and retain a loyal user base or the advertisers who desire to reach them, which will adversely affect our business and our ability to maintain or grow our revenue.
We may be impacted by unfavorable decisions in proceedings related to future tax assessments.
We operate in a number of jurisdictions and are from time to time subject to audits and reviews by various taxation authorities with respect to income, payroll, sales and use, and other taxes for current and past periods. We may become subject to future tax assessments by various authorities. The determination of our provision for income taxes and current and deferred tax assets and liabilities requires judgment and estimation. There are many transactions and calculations where the ultimate tax determination is uncertain. Although we believe our tax estimates are reasonable, the ultimate tax outcome may differ materially from the tax amounts recorded in our consolidated financial statements. Any amount we might be required to pay in connection with an ongoing audit or review or a future tax assessment may have a material adverse effect on our financial position, cash flows or overall results of operations.
Taxation risks could subject us to liability for past sales and cause our future sales to decrease.
We do not collect sales or use tax in certain jurisdictions on the services we provide. Our operations, and any future expansion of them, along with other aspects of our evolving business, may result in additional sales or use tax obligations.
Currently, the individual states’ laws and regulations determine which services performed over the Internet are subject to sales tax. A number of states have adopted initiatives that impose sales tax on certain services delivered electronically. Additionally, many states have implemented laws or regulations requiring out-of-state vendors to collect sales tax, which has increased our tax filing obligations. Also, a state may take the position that certain services we provide are subject to sales tax under existing regulations. The imposition by state and local governments of various taxes upon certain services delivered over the Internet could create administrative burdens for us, put us at a competitive disadvantage if they do not impose similar obligations on all of our online competitors and potentially decrease our future sales.
Because we recognize most of our revenue from our contracts over the term of the agreement, a significant downturn in these businesses may not be immediately reflected in our operating results.
We primarily recognize revenue from sales of our recruiting contracts over the terms of the agreements, which, on average, is approximately 12 months, meaning a significant portion of the revenue we report in each quarter is generated from agreements entered into during previous quarters. Consequently, a decline in new or renewed agreements in any one quarter may not significantly impact our revenue in that quarter but may, instead, negatively affect our revenue in future quarters. In addition, we may be unable to adjust our fixed costs in response to reduced revenue. Accordingly, the effect of significant declines in the sales of these offerings may not be reflected in our short-term results of operations.
Risks Related to Our Indebtedness
We have indebtedness which could affect our financial condition, and, if adverse changes in the credit markets occur, we may not be able to borrow funds under our revolving credit facility or refinance our indebtedness.
As of December 31, 2023, we had $38.0 million of outstanding indebtedness under our credit agreement dated June 10, 2022 (the “Credit Agreement”) and the facility provides capacity for us to borrow an additional $62.0 million, subject to the terms of the Credit Agreement. If we cannot generate sufficient cash flow from operations to service our debt, we may need to further refinance our debt, dispose of assets or issue equity to obtain necessary funds. We do not know whether we will be able to take any of these actions, if necessary, on a timely basis or on terms satisfactory to us or at all.
Our Credit Agreement consists of a revolving facility and matures in June 2027. The funding of the revolving facility is dependent on a number of financial institutions. It is possible that one or more of the lenders will refuse or be unable to satisfy their commitment to lend to us should we need to borrow funds under the revolving credit facility. If borrowings are unavailable to us and we cannot generate sufficient revenues to fund our operations, our business will be adversely affected. In addition, the inability to borrow could hinder growth if we need funds to complete an acquisition. Our indebtedness could limit
19
our ability to: obtain necessary additional financing for working capital, capital expenditures or other purposes in the future; plan for, or react to, changes in our business and the industries in which we operate; make future acquisitions or pursue other business opportunities; or react in an extended economic downturn.
The terms of our Credit Agreement may restrict our current and future operations, which would adversely affect our ability to respond to changes in our business and to manage our operations.
Our Credit Agreement contains, and any future indebtedness of ours would likely contain, a number of restrictive covenants that impose significant operating and financial restrictions on us, including restrictions on our ability to, among other things:
•incur additional debt;
•pay dividends and make other restricted payments;
•repurchase our own shares;
•create liens;
•make investments and acquisitions;
•engage in sales of assets and subsidiary stock;
•enter into sale-leaseback transactions;
•enter into transactions with affiliates;
•transfer all or substantially all of our assets or enter into merger or consolidation transactions; and
•make capital expenditures.
Our Credit Agreement also requires us to maintain certain financial ratios. A failure by us to comply with the covenants or financial ratios contained in our Credit Agreement could result in an event of default under our Credit Agreement which could adversely affect our ability to respond to changes in our business and manage our operations. In the event of any default under our Credit Agreement, the lenders under our Credit Agreement will not be required to lend any additional amounts to us. Our lenders also could elect to declare all amounts outstanding to be due and payable and require us to apply all of our available cash to repay these amounts. If the indebtedness under our Credit Agreement were to be accelerated, there can be no assurance that our assets would be sufficient to repay this indebtedness in full.
Despite our current level of indebtedness, we may be able to incur substantially more debt, which could increase the risks to our financial condition described above.
We may be able to incur substantial additional indebtedness in the future. Although the Credit Agreement contains restrictions on the incurrence of additional indebtedness and entering into certain types of other transactions, these restrictions are subject to a number of qualifications and exceptions, including compliance with various financial conditions. Additional indebtedness incurred in compliance with our existing debt could be substantial. To the extent new debt is added to our current debt levels, the substantial leverage risks described in the immediately preceding risk factors would increase. As of December 31, 2023, we had $38.0 million in total indebtedness with additional borrowing capacity of $62.0 million, subject to certain availability limits including our consolidated leverage ratio, which generally limits borrowings to 2.5 times annual Adjusted EBITDA levels, as defined in the Credit Agreement.
Risks Related to Our Technology
Issues in the development and use of artificial intelligence ("AI") may result in reputational harm or liability.
We continue to incorporate AI into our offerings when appropriate and beneficial. This AI may be developed by the Company or others. We expect these elements of our business to grow. We envision a future in which AI's incorporation into our products helps our customers be more productive in their work. As with many innovations, AI presents risks and challenges that could affect its adoption, and therefore our business. AI algorithms may be flawed. Datasets may be insufficient or contain biased information. Content generated by AI systems may be offensive, illegal, or otherwise harmful. Ineffective or inadequate AI development or deployment practices by the Company or others could result in incidents that impair the acceptance of AI solutions or cause harm to individuals or society. These deficiencies and other failures of AI systems could subject us to competitive harm, regulatory action, legal liability, and brand or reputational harm. Some AI scenarios present ethical issues or may have broad impacts on society. If we enable or offer AI solutions that have unintended consequences or are controversial
20
because of their impact on human rights, privacy, employment, or other social, economic, or political issues, we may experience brand or reputational harm.
For example, perceived or actual technical, legal, compliance, privacy, security, ethical or other issues relating to the use of AI may cause public confidence in AI to be undermined, which could slow our customers’ adoption of our products and services that use AI. In addition, litigation or government regulation related to the use of AI may also adversely impact our and others’ abilities to develop and offer products that use AI, as well as increase the cost and complexity of doing so. Developing, testing and deploying third-party AI systems may also increase the cost profile of our product offerings due to the nature of the computing costs involved in such systems, which could impact our project margin and adversely affect our business and operating results. Our business may be disrupted if any of the third-party AI services we use become unavailable due to extended outages or interruptions or because they are no longer available on commercially reasonable terms or prices. Further, market demand and acceptance of AI technologies are uncertain, and we may be unsuccessful in our product development efforts.
We may not timely and effectively scale and adapt our existing technology and network infrastructure to ensure that our websites are accessible within an acceptable load time.
A key element to our continued growth is the ability of our users (whom we define as anyone who visits our website, regardless of whether or not they are a customer), enterprises and professional organizations in all geographies to access our website within acceptable load times. We call this “website performance.” We have experienced, and may in the future experience, website disruptions, outages and other performance problems due to a variety of factors, including infrastructure changes, human or software errors, capacity constraints due to an overwhelming number of users accessing our website simultaneously, and denial of service or fraud or security attacks. In some instances, we may not be able to identify the cause or causes of these website performance problems within an acceptable period of time. It may become increasingly difficult to maintain and improve our website performance, especially during peak usage times and as our solutions become more complex and our user traffic increases. If our websites are unavailable when users attempt to access them or do not load as quickly as they expect, users may seek other websites to obtain the information for which they are looking, and may not return to our websites as often in the future, or at all. This would negatively impact our ability to attract customers, enterprises and professional organizations and may decrease engagement on our websites. We expect to continue to make significant investments to maintain and improve website performance and to enable rapid releases of new features and products. To the extent that we do not effectively address capacity constraints, upgrade our systems as needed and continually develop our technology and network architecture to accommodate actual and anticipated changes in technology, our business and operating results may be harmed.
Capacity constraints, systems failures or breaches of our network security could materially and adversely affect our business. If we fail to manage our technical operations infrastructure, our existing customers may experience services outages, and our new customers may experience delays in the deployment of our solution.
We derive almost all of our revenues from the purchase of recruitment products, packages, services and employment advertising offered on our Dice and ClearanceJobs websites. As a result, our operations depend on our ability to maintain and protect our website services, most of which are housed within AWS. System failures, including network, software or hardware failures, which cause interruption or an increase in response time of our services, could substantially decrease usage of our services and could reduce the attractiveness of our services to both our customers and professionals. An increase in the volume of queries conducted through our services could strain the capacity of the software or hardware we employ. This could lead to slower response times or system failures and prevent users from accessing our websites for extended periods of time, thereby decreasing usage and attractiveness of our services. Our technology operations are dependent in part on our ability to protect our operating systems against, among other events:
•physical damage from acts of God;
•terrorist attacks or other acts of war;
•power loss;
•telecommunications failures;
•network, hardware or software failures;
•physical and electronic break-ins;
•cyber security attacks;
21
•computer viruses or worms;
•identity theft;
•phishing attempts; and
•similar events.
Although we maintain insurance against fires, floods, cyber-attacks, and general business interruptions, the amount of coverage may not be adequate in any particular case. Furthermore, the occurrence of any of these events could result in interruptions, delays or cessations in service to users of our services, which could materially impair or prohibit our ability to provide our services and significantly impact our business.
Additionally, overall Internet usage could decline if any well-publicized compromise of security occurs or if there is a perceived lack of security of personal and corporate information stored within our systems to facilitate hiring and recruitment business processes. “Hacking” involves efforts to gain unauthorized access to information or systems or to cause intentional malfunctions or loss or corruption of data, software, hardware or other computer equipment, and online job boards, in particular, have been targeted by hackers who seek to gain unauthorized access to job seeker and customer data for purposes of implementing “phishing” or other schemes. Despite our implementation of numerous security measures; including access controls, network security, information security risk management processes, software development security, cryptography, operational security, business continuity and disaster recovery, and physical security, our websites, servers, databases and other systems as well as those of our customers may be vulnerable to computer hackers, physical or electronic break-ins, sabotage, computer viruses, worms, phishing attacks and similar disruptions from unauthorized tampering with our computer systems.
Our systems, like the systems of many other websites, have been targeted in the past in cyber-attacks and hacks and will continue to be subject to such attacks. While such targets and hacks have not had material impacts on our results of operations and financial condition in the past, we cannot guarantee that similar attacks will not have such material impacts in the future. Because the techniques used to obtain unauthorized access, disable or degrade service, or sabotage systems change frequently, such techniques often are not recognized until launched against a target and may originate from less regulated and remote areas around the world, we may be unable to proactively address these techniques or to implement adequate preventative measures. We will continue to review and enhance our security measures in an attempt to prevent unauthorized and unlawful intrusions, although in the future it is possible we may not be able to prevent all intrusions, and such intrusions could result in our network security or computer systems being compromised and possibly result in the misappropriation or corruption of proprietary or personal information or cause disruptions in our services. We might be required to expend significant capital and resources to protect against, remediate or alleviate problems caused by such intrusions. We may also not have a timely remedy against a hacker who is able to penetrate our network security.
Our networks could also be affected by viruses or malware or other similar disruptive problems, and we could inadvertently transmit these viruses or malware to our users or other third parties. Our hardware and back-up systems could fail causing our services to be interrupted. Our customers may fall prey to successful phishing attacks and inadvertently give unauthorized access to view our candidate profiles. Any of these occurrences, and negative publicity arising from any such occurrences, could harm our business or give rise to a cause of action against us. Our general business interruption insurance policies have limitations with respect to covering interruptions caused by computer viruses or hackers. While we have insurance we have not added specific insurance coverage to protect against these risks. Our activities and the activities of third party contractors involve the storage, use and transmission of proprietary and personal information, including personal information collected from professionals who use our websites. Accordingly, security breaches could expose us to a risk of loss or litigation and possibly liabilities. We cannot assure that contractual provisions attempting to limit our liability in these areas will be successful or enforceable, or that other parties will accept such contractual provisions as part of our agreements. Any security breaches or our inability to provide users with continuous access to our networks could materially impact our ability to provide our services as well as materially impact the confidence of our customers in our services, either of which could have a material adverse effect on our business.
The SEC has adopted new rules that require us to provide greater disclosures around cybersecurity risk management, strategy and governance, as well as disclose the occurrence of material cybersecurity incidents. We cannot predict or estimate the amount of additional costs we will incur in order to comply with these rules or the timing of such costs. These rules and regulations may also require us to report a cybersecurity incident before we have been able to fully assess its impact or remediate the underlying issue. Efforts to comply with such reporting requirements could divert management’s attention from our incident response and could potentially reveal system vulnerabilities to threat actors. Failure to timely report incidents under these or other similar rules could also result in monetary fines, sanctions, or subject us to other forms of liability. This
22
regulatory environment is increasingly challenging and may present material obligations and risks to our business, including significantly expanded compliance burdens, costs and enforcement risks.
If our users or customers do not find our candidate profiles useful, it could adversely impact demand for our products and services and the growth of our business.
Our product integrates publicly available data on the Internet to create aggregated profiles of prospective candidates’ professional experience and other employment-related data. These profiles are made available to our customers through our TalentSearch product to help them identify prospective technical candidates in a way that reduces their need to search multiple websites, while delivering more relevant candidates and useful employment information to recruiters and employers that use it. Candidates sought out through the socially aggregated profiles may not be interested in the opportunities presented to them by the recruiters and employers who use the product, which could decrease its demand.
If Internet search engines’ methodologies are modified or our search result page rankings decline for other reasons, our user engagement could decline.
We depend in part on various Internet search engines, such as Google, Bing and Yahoo!, to direct a significant amount of traffic to our websites. Our ability to maintain the number of visitors directed to our websites is not entirely within our control. Our competitors’ search engine optimization, or SEO, efforts may result in their websites receiving a higher search result page ranking than ours, or Internet search engines could revise their methodologies in an attempt to improve their search results, which could adversely affect the placement of our search result page ranking. If search engine companies modify their search algorithms in ways that are detrimental to our new user growth or in ways that make it harder for our users to use our websites, or if our competitors’ SEO efforts are more successful than ours, overall growth in our user base could slow, user engagement could decrease, and we could lose existing users. These modifications may be prompted by search engine companies entering the online professional networking market or aligning with competitors. Our websites have experienced fluctuations in search result rankings in the past, and we anticipate similar fluctuations in the future. Any reduction in the number of users directed to our websites would harm our business and operating results.
We may not be able to halt the operations of websites that aggregate our data as well as data from other companies, including social networks, or copycat websites that have misappropriated our data in the past or may misappropriate our data in the future. These activities could harm our brand and our business.
From time to time, third parties have misappropriated our data through website scraping, robots or other means and aggregated this data on their websites with data from other companies. In addition, “copycat” websites have misappropriated data on our network and attempted to imitate our brand or the functionality of our websites. These activities could degrade our brands and harm our business. When we have become aware of such websites, we have employed technological or legal measures in an attempt to halt their operations. However, we may not be able to detect all such websites in a timely manner and, even if we could, technological and legal measures may be insufficient to stop their operations. In some cases, particularly in the case of websites operating outside of the United States, our available remedies may not be adequate to protect us against such websites. Regardless of whether we can successfully enforce our rights against these websites, any measures that we may take could require us to expend significant financial or other resources.
We rely on the services of third-party data center hosting facilities. Interruptions or delays in those services could impair the delivery of our service and harm our business.
Our Dice and ClearanceJobs website applications utilize cloud computing technology. It is hosted pursuant to service agreements on technology platforms by third-party service providers, primarily through AWS. We do not control the operation of these providers or their facilities, and the facilities are vulnerable to damage, interruption or misconduct. Unanticipated problems at these facilities could result in lengthy interruptions in our services. If the services of one or more of these providers are terminated, disrupted, interrupted or suspended for any reason, we could experience disruption in our ability to provide our services, which may harm our business and reputation. Further, any damage to, or failure of, the cloud services we use could result in interruptions in our services. Interruptions in our service may damage our reputation, reduce our revenue, cause us to issue credits or pay penalties, cause customers to terminate their agreements and adversely affect our renewal rates and our ability to attract new customers. While we believe our application and network architecture and use of multiple availability
23
zones and regions within AWS reduce our risk, our business would be harmed if our customers and potential customers believe our services are unreliable.
Regulatory Risks
We may be liable with respect to the collection, storage, and use of the personal and professional information of the professionals who use our websites and our current practices may not be in compliance with proposed new laws and regulations.
Our business depends on our ability to collect, store, use, and disclose personal and professional data from the professionals who use our websites. Our policies concerning the collection, use and disclosure of personally identifiable information are described on our websites. In recent years, class action lawsuits have been filed and the Federal Trade Commission and state agencies have commenced investigations with respect to the collection, use, sale and storage by various Internet companies of users’ personal and professional information. While we believe we are in compliance with current law, we cannot ensure that we will not be subject to lawsuits or investigations for violations of law. Moreover, our current practices regarding the collection, storage and use of user information may not be in compliance with currently pending legislative and regulatory proposals by the United States federal government and various state governments intended to limit the collection and use of user information. While we have implemented and intend to implement additional programs designed to enhance the protection of the privacy of our users, these programs may not conform to all or any of these laws or regulations and we may consequently incur civil or criminal liability for failing to conform. As a result, we may be forced to change our current practices relating to the collection, storage and use of user information. Our failure or our perceived failure to comply with laws and regulations could also lead to adverse publicity and a loss of consumer confidence if it were known or perceived that we did not take adequate measures to assure the confidentiality of the personally identifiable information that our users had given to us. This could result in a loss of customers and revenue and materially adversely impact the success of our business. Concern among prospective customers and professionals regarding our use of personal information collected on our websites, such as credit card numbers, email addresses, phone numbers and other personal information, could keep prospective customers from using our career services websites. Internet-wide incidents or incidents with respect to our websites or databases, including misappropriation of our users’ personal information, penetration of our network security, or changes in industry standards, regulations or laws could result in regulatory penalties, liability to the persons whose information was compromised, as well as legal expenses, and could deter people from using the Internet or our websites to conduct transactions that involve confidential information, which could have a material adverse impact on our business. We generally comply with industry standards and are subject to the terms of our privacy policies and privacy-related obligations to third parties (including voluntary third-party certification bodies such as TrustArc). We strive to comply with all applicable laws, policies, legal obligations and industry codes of conduct relating to privacy and data protection, to the extent possible. However, it is possible that these obligations may be interpreted and applied in new ways and/or in a manner that is inconsistent from one jurisdiction to another and may conflict with other rules or our practices or that new regulations could be enacted.
We continue to see increased regulation of data privacy and security, including the adoption of more stringent subject matter specific state laws and national laws regulating the collection and use of data, as well as security and data breach obligations. For example, California adopted the CCPA, which became effective on January 1, 2020 and was recently replaced and expanded upon by the CPRA, which was enacted on November 3, 2020 and went into effect on January 1, 2023. The CCPA established a new privacy framework for covered businesses by, among other things, creating an expanded definition of personal information, establishing new data privacy rights for consumers in the State of California and creating a new and potentially severe statutory damages framework for violations of the CCPA and for businesses that fail to implement reasonable security procedures and practices to prevent data breaches. The CPRA expanded on these protections by introducing new limitations on the sale or sharing of consumers' personal information and the creation of a new state agency to enforce the regulations. In addition, numerous state legislatures have passed, or are contemplating passing, legislation similar in nature to the CPRA. To the extent these laws differ from existing laws, our compliance efforts will be further complicated.
The uncertainty and changes in the requirements of multiple jurisdictions may increase the cost of compliance, reduce demand for our websites, restrict our ability to offer services in certain locations or subject us to sanctions by state or national data protection regulators, all of which could harm our business, financial condition, and results of operations. Failure to provide adequate privacy protections and maintain compliance with the new data privacy laws, including the CPRA, could have a material adverse effect on our financial condition and results of operations.
24
Our business is subject to U.S. government regulation of the Internet and taxation, which may have a material adverse effect on our business.
Congress and various state and local governments have passed legislation that regulates various aspects of the Internet, including content, copyright infringement, user privacy, taxation, access charges, liability for third-party activities and jurisdiction. In addition, federal, state, and local governmental organizations are also considering legislative and regulatory proposals that would regulate the Internet. Areas of potential regulation include libel, pricing, quality of products and services and intellectual property ownership. A number of proposals have been made at the state and local level that would impose taxes on the sale of goods and services through the Internet. Such proposals, if adopted, could substantially impair the growth of commerce over the Internet and could adversely affect our business, future results of operations, financial condition and liquidity. We may be subject to restrictions on our ability to communicate with our customers through email, text messages and phone calls. Several jurisdictions have proposed or adopted privacy related laws that restrict or prohibit unsolicited email or “spam.” These laws may impose significant monetary penalties for violations. For example, the CAN-SPAM Act of 2003, or “CAN-SPAM,” imposes complex and often burdensome requirements in connection with sending commercial email. Among other requirements, CAN-SPAM obligates the sender of commercial emails to provide recipients with the right to "opt-out" of receiving future emails from the sender. In addition, some states have passed laws regulating commercial email practices that are significantly more restrictive and difficult to comply with than CAN-SPAM, some portions of which may not be preempted by CAN-SPAM. If we were found to be in violation of CAN-SPAM or applicable state laws governing email not preempted by CAN-SPAM, we could be required to pay large penalties, which would adversely affect our financial condition, harm our business operations and marketing efforts, injure our reputation and erode candidate and customer trust. The scope of those regulations is unpredictable.
Changes in laws or regulations that adversely affect the growth, popularity or use of the Internet, including laws impacting net neutrality, could decrease the demand for our service and increase our cost of doing business. Certain laws intended to prevent network operators from discriminating against the legal traffic that traverse their networks have been implemented in many jurisdictions. In others, the laws may be nascent or non-existent. Furthermore, favorable laws may change. Given uncertainty around these rules, including changing interpretations, amendments or repeal, coupled with potentially significant political and economic power of local network operators, we could experience discriminatory or anti-competitive practices that could impede our growth, cause us to incur additional expense or otherwise negatively affect our business.
Due to the global nature of the Internet, it is possible that the governments of other states and foreign countries might attempt to regulate its transmissions or prosecute us for violations of their laws. We might unintentionally violate such laws or such laws may be modified and new laws may be enacted in the future. Any such developments (or developments stemming from enactment or modification of other laws) may significantly harm our business, operating results and financial condition.
Risks Related to Ownership of Our Securities
If we do not meet the continued listing requirements of the NYSE our common stock may be delisted.
Our common stock is listed on the NYSE. The NYSE requires us to continue to meet certain listing standards, including standards related to the trading price of our common stock, as well as our global market capitalization. While we are currently in compliance with the NYSE continued listing requirements, we cannot assure you that we will remain in compliance. If we do not meet the NYSE’s continued listing standards, we will be notified by the NYSE and we will be required to take corrective action to meet the continued listing standards; otherwise our common stock will be delisted from the NYSE. A delisting of our common stock on the NYSE would reduce the liquidity and market price of our common stock and the number of investors willing to hold or acquire our common stock, which could negatively impact our ability to access the public capital markets. A delisting would also reduce the value of our equity compensation plans, which could negatively impact our ability to retain key employees.
Our stock price has been volatile in the past and may be subject to volatility in the future.
The trading price of our common stock has been volatile in the past and could be subject to fluctuations in response to various factors, some of which are beyond our control. Factors such as announcements of variations in our quarterly financial results and fluctuations in revenue could cause the market price of our common stock to fluctuate. Fluctuations in the valuation of companies perceived by investors to be comparable to us or in valuation metrics, such as our price to earnings ratio, could
25
impact our stock price. Additionally, the stock markets have at times experienced price and volume fluctuations that have affected and might in the future affect the market prices of equity securities of many companies. These fluctuations have, in some cases, been unrelated or disproportionate to the operating performance of these companies. Further, the trading prices of publicly traded shares of companies in our industry have been particularly volatile and may be very volatile in the future. These broad market and industry fluctuations, as well as general economic, political and market conditions such as recessions, interest rate changes, or political unrest, may negatively impact the market price of our common stock.
Failure to maintain effective internal control over financial reporting could have a material adverse effect on our business, operating results and stock price.
Maintaining effective internal control over financial reporting is necessary for us to produce reliable financial reports and is important in helping to prevent financial fraud. If we are unable to maintain adequate internal controls, our business and operating results could be harmed. We are required to satisfy the requirements of Section 404 of Sarbanes Oxley and the related rules of the SEC, which require, among other things, our management to assess annually the effectiveness of our internal control over financial reporting and our independent registered public accounting firm to issue a report on that assessment. We may be unable to remedy deficiencies before the requisite deadlines for those reports. Any failure to remediate deficiencies identified by management or our independent registered public accounting firm or to implement required new or improved controls or difficulties encountered in their implementation could cause us to fail to meet our reporting obligations or result in material misstatements in our financial statements. If our management or our independent registered public accounting firm were to conclude in their reports that our internal control over financial reporting was not effective, investors could lose confidence in our reported financial information, and the trading price of our stock could drop significantly.
The estimates and assumptions on which our financial projections are based may prove to be inaccurate, which may cause our actual results to materially differ from such projections, which may adversely affect our future profitability, cash flows and stock price.
Our financial projections, including any sales or earnings guidance or outlook we may provide from time to time, are dependent on certain estimates and assumptions related to, among other things, the demand for technology professionals, development and launch of innovative new products, market share projections, product pricing, sales, cost savings, accruals for estimated liabilities, and our ability to generate sufficient cash flow to reinvest in our existing business, fund internal growth, repurchase our stock, make acquisitions, invest in joint ventures, and meet debt obligations. Our financial projections are based on historical experience and on various other estimates and assumptions that we believe to be reasonable under the circumstances and at the time they are made, and our actual results may differ materially from our financial projections. Any material variation between our financial projections and our actual results may adversely affect our future profitability, cash flows and stock price.
We expect our operating results to fluctuate on a quarterly and annual basis.
Our revenue and operating results could vary significantly from quarter-to-quarter and year-to-year and may fail to match our past performance because of a variety of factors, some of which are outside of our control. Any of these events could cause the market price of our common stock to fluctuate. Factors that may contribute to the variability of our operating results include:
•the size and seasonal variability of our customers’ recruiting and marketing budgets;
•the emergence of new competitors in our market whether by established companies or the entrance of new companies;
•the cost of investing in our technology infrastructure may be greater than we anticipate;
•our ability to increase our customer base and customer and professional engagement;
•disruptions or outages in the availability of our websites, actual or perceived breaches of privacy and compromises of our customers’ or professionals’ data;
•changes in our pricing policies or those of our competitors;
•macroeconomic changes, in particular, deterioration in labor markets, which would adversely impact sales of our hiring solutions, or economic growth that does not lead to job growth;
•costs associated with data security which is becoming increasingly complex;
•the timing and costs of expanding our organization and delays or inability in achieving expected productivity;
•the timing of certain expenditures, including hiring of employees and capital expenditures;
•our ability to increase sales of our products and solutions to new customers and expand sales of additional products and solutions to our existing customers;
•the extent to which existing customers renew their agreements with us and the timing and terms of those renewals; and
•general industry and macroeconomic conditions.
26
Actions of activist shareholders could cause us to incur substantial costs, divert management's attention and resources, and have an adverse effect on our business.
We have been the subject of activity by activist shareholders in the past and shareholder activism generally is increasing. Responding to shareholder activism can be costly and time-consuming, disrupt our operations, and divert the attention of management and our employees from our strategic initiatives. Activist campaigns can create perceived uncertainties as to our future direction, strategy, or leadership and may result in the loss of potential business opportunities, harm our ability to attract new employees, investors, customers, and other partners, and cause our stock price to experience periods of volatility.
General Risk Factors
If we fail to attract or retain key executives and personnel, there could be a material adverse effect on our business.
Our performance is substantially dependent on the performance of senior management and key technical personnel. We have employment agreements, which include non-compete provisions, with all members of senior management and certain key technical personnel. However, we cannot assure you that any of these senior managers or others will remain with us or that they will not compete with us in the event they cease to be employees, which could have a material adverse effect on our business, results of operations, financial condition and liquidity. In addition, we have not purchased key person life insurance on any members of our senior management. Our future success also depends upon our continuing ability to identify, attract, hire and retain highly qualified personnel, including skilled technical, management, product and technology, and sales and marketing personnel, all of whom are in high demand and are often subject to competing offers. There has in the past been, and there may in the future be, a shortage of qualified personnel in the career services market. We also compete for qualified personnel with other companies. A loss of a substantial number of qualified employees, or an inability to attract, retain and motivate additional highly skilled employees required for expansion of our business, could have a material adverse effect on our business. In addition, the recent significant decline in our stock price may undermine the use of our equity as a retention tool and may make it more difficult to retain key personnel.
We may be adversely affected by cyclicality, volatility or an extended downturn in the United States or worldwide economies, in or related to the industries we serve.
Our revenues are generated primarily from servicing customers seeking to hire qualified professionals in the technology and security-cleared sectors. Demand for these professionals tends to be tied to economic and business cycles. Increases in the unemployment rate, specifically in the technology industry, cyclicality or an extended downturn in the economy could cause our revenues to decline. For example, in 2023, employers reduced or postponed their recruiting efforts, including their recruitment of professionals in the technology industry. As of December 2023, the seasonally unadjusted U.S. unemployment rate was 2.3% for computer-related occupations as compared to the overall national average of 3.7%, seasonally adjusted. The increase in unemployment and decrease in recruitment activity experienced during 2008 and 2009 resulted in decreased demand for our services. During 2009, we experienced a 29% decline in revenues compared to 2008. If an economic environment similar to those experienced during 2008 and 2009 returns, or if the environment we experienced in 2023 continues, our ability to generate revenue may be adversely affected.
In addition, the general level of economic activity in the regions and industries in which we operate significantly affects demand for our services. When economic activity slows, many companies hire fewer employees. Therefore, our operating results, business and financial condition could be significantly harmed by an extended economic downturn or future downturns, especially in regions or industries where our operations are heavily concentrated. Further, we may face increased pricing pressures during such periods as customers seek to use lower cost or fee services. Additionally, the labor market and certain of the industries we serve have historically experienced short-term cyclicality. For example, if the demand for technology professionals decreases, it may be more difficult to sell recruitment packages to our customers. It is difficult to estimate the total number of passive or active job seekers or available job openings in the United States or abroad during any given period. If there is a labor shortage, qualified professionals may be less likely to seek our services, which could cause our customers to look elsewhere for attractive employees. Such labor shortages would require us to intensify our marketing efforts toward professionals so that professionals who post their resumes on our websites remain relevant to our customers, which would increase our expenses. Furthermore, if there is a shortage of available job openings in a particular region or sector we serve, the number of job postings on our websites could decrease, causing our business to be adversely affected. For example, during 2020, because of the impacts of the COVID-19 pandemic and its potential impact on future earnings and cash flows for the tech-focused reporting unit and those that are attributable to the Dice trademarks and brand name, the Company recorded impairment charges totaling $37.8 million.
27
Any economic downturn or recession in the United States or abroad for an extended period of time could have a material adverse effect on our business, financial condition, results of operations and liquidity. Based on historical trends, improvements in labor markets and the need for our services generally lag behind overall economic improvements. Additionally, there has historically been a lag from the time customers begin to increase purchases of our services and the impact to our revenues due to the recognition of revenue occurring over the length of the contract, which can be several months to a year.
Volatility in global financial markets may limit our ability to access capital markets at a time when we would like, or need, to raise capital, which could have an impact on our ability to react to changing economic and business conditions. Accordingly, if the domestic or global economies worsen or volatility occurs, our business, results of operations and financial condition could be materially and adversely affected.
We could be subject to infringement and other claims relating to our services or the content on our websites that may result in costly litigation, the payment of damages or the need to revise the way we conduct business.
We cannot be certain that our technology, offerings, services or content do not or will not infringe upon the intellectual property or other proprietary rights of third parties, or otherwise violate laws. From time to time we receive notices alleging potential infringement of intellectual property or other proprietary rights of third parties or non-compliance with applicable laws. In seeking to protect our marks, copyrights, domain names and other intellectual property rights, or in defending ourselves against claims of infringement or non-compliance that may or may not be without merit, we could face costly litigation and the diversion of our management’s attention and resources. Claims against us could result in the need to develop alternative trademarks, content, technology or other intellectual property or enter into costly royalty or licensing agreements, or substantially modify or cease to offer one or more of our services, which could have a material adverse effect on our business, results of operations, financial condition and liquidity. If we were found to have infringed on a third party’s intellectual property or other proprietary rights, or failed to comply with applicable laws, among other things, the value of our brands and our business reputation could be impaired, and our business could suffer.
If we are unable to enforce or defend our ownership or use of intellectual property, our business, competitive position and operating results could be harmed.
The success of our business depends in large part on our intellectual property rights, including existing and future trademarks and copyrights, which are and will continue to be valuable and important assets of our business. Our business could be harmed if we are not able to protect the content of our databases and our other intellectual property. We have taken measures to protect our intellectual property, such as requiring our employees and consultants with access to our proprietary information to execute confidentiality agreements. In the future, we may sue competitors or other parties who we believe to be infringing our intellectual property. We may in the future also find it necessary to assert claims regarding our intellectual property. These measures may not be sufficient or effective to protect our intellectual property. We also rely on laws, including those regarding copyrights and trademarks to protect our intellectual property rights. Current laws, or the enforceability of such laws, specifically in foreign jurisdictions, may not adequately protect our intellectual property or our databases and the data contained in them. In addition, legal standards relating to the validity, enforceability and scope of protection of intellectual property rights in Internet related businesses are uncertain and evolving, and we cannot assure you of the future viability or value of any of our proprietary rights. Others may develop technologies similar or superior to our technology. A significant impairment of our intellectual property rights could require us to develop alternative intellectual property, incur licensing or other expenses or limit our product and service offerings.
Global climate change, including extreme weather conditions, natural disasters, public health issues, or other events outside of our control, as well as related regulations, could negatively impact our operating results and financial condition.
The effects of climate change, natural disasters such as earthquakes, hurricanes, tsunamis, or other adverse weather and climate conditions, and public health issues like the COVID-19 pandemic, whether occurring in the U.S. or abroad, and the consequences and effects thereof, have in the past and could in the future harm or disrupt our operations or the operations of our customers, or result in economic instability that may negatively impact our operating results and financial condition.
We have made a public commitment regarding our sourcing of renewable energy for our facilities regarding greenhouse gas Scope 2 emissions. Although we intend to meet these commitments, we may be required to expend significant resources to do so, which could increase our operational costs. Further, there can be no assurance of the extent to which our commitment will be achieved, or that any future investments we make in furtherance of achieving such target and goal will meet investor
28
expectations or legal standards, if any, regarding sustainability performance. Moreover, we may determine that it is in the best interest of our Company and our stockholders to prioritize other business, social, governance or sustainable investments over the achievement of our current commitments based on economic, technological developments, regulatory and social factors, business strategy or pressure from investors, activist groups or other stakeholders. If we are unable to meet these commitments, then we could incur adverse publicity and reaction from investors, activist groups or other stakeholders, which could adversely impact the perception of us and our products and services by current and potential customers, as well as investors, which could in turn adversely impact our results of operations.
The landscape related to ESG regulation, compliance, and reporting is constantly evolving, including expanding in scope and complexity. For example, the SEC has proposed rule changes that would require significantly increased disclosures related to climate change. We may experience significant future increases in the costs associated with regulatory compliance for ESG matters, including fees, licenses, and reporting to meet environmental regulatory requirements, as well as to address other regulations, standards, frameworks, and ratings from various governmental entities and other stakeholders or activist campaigns.
Public health issues may arise and have an adverse impact on our business.
Global public health issues may arise and cause economic slowdowns that negatively impact our business. For example, starting in 2019 and continuing through 2020, 2021, and 2022, the spread of the COVID-19 pandemic caused an economic downturn on a global scale, as well as significant volatility in the financial markets. COVID-19 slowed recruitment activity for our businesses in 2020 and into the first half of 2021 as employers slowed hiring, which reduced our revenues and operating cash flows. Also as a result of the COVID-19 pandemic, and in an effort to protect the health and safety of our employees, we took action to adopt certain policies at our office locations, including, at times, working from home, closing of our office locations where necessary, and suspending employee travel.
If a similar public health issue arose (or if there is a resurgence of COVID-19), it could negatively impact our financial performance, our business and operations, results of operations, financial condition, cash flows, liquidity and capital and financial resources.
Item 1B. Unresolved Staff Comments
None.
Item 1C. Cybersecurity
Cybersecurity is at the foundation of the Company's values and the way it approaches its users, professionals, and customers. We face a number of external threats common to companies in the industries we serve, such as ransomware, denial-of-service, phishing, and social engineering. Our customers, suppliers, and professionals face similar threats, and a cybersecurity incident impacting the Company or any of these entities could materially adversely affect the performance of our businesses, our results of operations, and our cash flows.
We maintain cyber event related insurance but we have also instituted an information security structure and process to assess, identify, manage, and, if necessary, report cybersecurity risks. We maintain a cybersecurity incident response process and a tracking system for any incidents in an effort to ensure appropriate actions are taken. Any member of the Company can report a suspected incident and it will be investigated.
We have implemented data security standards in our architecture and system design techniques. Reviews and testing of our systems and subsystems are performed at regular intervals and are designed to ensure our capability to respond to cybersecurity incidents or threats. Our cybersecurity framework is based on the National Institute of Standards and Technology Cybersecurity Framework. In accordance with this framework, risks are analyzed for impact and probability to determine severity level, with classifications of critical, high, medium, or low risk. These processes have been integrated into our overall risk management system and processes and are part of our operating procedures, internal controls and information systems. In addition, we engage in an ongoing improvement process to enhance our cybersecurity posture.
Third parties also play a role in our cybersecurity. We engage third-party services to assist in the scanning and testing of our web properties and cloud infrastructure. We have a retainer with a cybersecurity response organization to immediately respond
29
and provide professional expertise and assistance if necessary. Our process is designed to provide any required notifications in case of a cyber event, including those to federal, state, and local authorities, as well as to our insurance providers and auditors.
We also utilize a supply chain risk management process to assess cybersecurity risks associated with third-party software providers. We perform third-party risk assessments to both identify and mitigate risks from third parties such as vendors, suppliers, and others associated with our use of third-party service providers. Cybersecurity risks are evaluated when determining the selection and oversight of applicable third-party service providers and potential fourth-party risks when handling and/or processing our employee, business or customer data. In addition to new vendor onboarding, we perform risk management during third-party cybersecurity compromise incidents to identify and mitigate risks to us from third-party incidents.
The Company maintains a Security Council that regularly meets to review current or potential threats. The Security Council's membership consists of the following: the Company's Chief Executive Officer, Chief Financial Officer, Chief Technology Officer, General Counsel, Vice President of Technology, Manager of Security, and Head of Internal Audit. We also employ a Security Department responsible for cybersecurity across the organizations. The individuals in this department are vetted for their experience and expertise before joining the team and maintain continued education and training each year using our enhanced learning program. This department's responsibilities include cyber security risk management, security operations, awareness training, incident response, industry awareness and reporting. The team assesses and maintains awareness of global cyber security threats by using several services and notifications from our vendors. The team then considers each of these threats as applied to our environment, process, operations, vendors and clients. The Security Council is led by the Chief Technology Officer, Vice President of Technology, and Manager of Security, each of whom have a depth of knowledge and experience in the cyber security space.
Our Board of Directors has ultimate oversight of cybersecurity risk, which it manages as part of our enterprise risk management program, while the Audit Committee is directly responsible for oversight of the Company's cybersecurity and is briefed by the Security Council on a quarterly basis. Members of the Audit Committee receive updates on a quarterly basis from senior management, including leaders from our Information Security, Product Security, Compliance and Legal teams regarding matters of cybersecurity. This includes existing and new cybersecurity risks, status on how management is addressing and/or mitigating those risks, cybersecurity and data privacy incidents (if any) and status on key information security initiatives. Our Board members also engage in ad hoc conversations with management on cybersecurity-related news events and discuss any updates to our cybersecurity risk management and strategy programs.
Although the risks from cybersecurity threats, including as a result of any previous cybersecurity incidents, have not materially affected or are reasonably likely to materially affect the Company, including its business strategy, results of operations, or financial condition, such incidents could have a material adverse effect in the future as cyberattacks continue to increase in frequency and sophistication.
See Item 1A. Risk Factors “Capacity constraints, systems failures or breaches of our network security could materially and adversely affect our business. If we fail to manage our technical operations infrastructure, our existing customers may experience services outages, and our new customers may experience delays in the deployment of our solution.”
Item 2. Properties
We do not own any properties. Our corporate headquarters is located at 6465 South Greenwood Plaza, Suite 400, Centennial, Colorado, where we lease approximately 28,000 square feet. We lease approximately 25,000 square feet in West Des Moines, Iowa and 12,000 square feet of office space in New York, New York. All of our properties are leased for our Tech-focused segment, which is our only reportable segment.
We believe that our facilities are adequate for current and anticipated future use, although we may from time to time lease additional facilities as operations require.
Item 3. Legal Proceedings
From time to time we may be involved in disputes or litigation relating to claims arising out of our operations. We are currently not a party to any material unrecorded pending legal proceedings. See also Note 12 of the notes to consolidated financial statements.
30
Item 4. Mine Safety Disclosures
Not applicable.
PART II
Item 5. Market for Registrant’s Common Equity, Related Stockholder Matters and Issuer Purchases of Equity Securities
Market Information
Our common stock is listed on the NYSE under the ticker symbol “DHX”.
Holders
As of December 31, 2023, there were 20 stockholders of record of our common stock. A significant number of the outstanding shares of common stock, which are beneficially owned by individuals and entities, are registered in the name of Cede & Co. Cede & Co. is a nominee of The Depository Trust Company, a securities depository for banks and brokerage firms.
Dividend Policy
We have not declared or paid any cash dividends on our stock as a public company. We currently anticipate that all future earnings will be retained by the Company to support our long-term growth strategy. Accordingly, we do not anticipate paying periodic cash dividends on our stock for the foreseeable future.
Furthermore, our Credit Agreement restricts the amount of cash dividends that we can pay.
The payment of any future dividends will be at the discretion of our board of directors and subject to the Credit Agreement and will depend upon, among other things, future earnings, operations, capital requirements, our general financial condition, compliance with covenants under any then-existing financing agreements, contractual restrictions and general business conditions.
Purchases of Equity Securities by the Issuer
Our board of directors approved a stock repurchase program that permitted the Company to repurchase our common stock. The following table summarizes the stock repurchase plans approved by the board of directors over the past three fiscal years:
May 2020 to May 2021(1) | February 2021 to June 2022(2) | February 2022 to February 2023(3) | February 2023 to February 2024(4) | ||||||||||||||||||||
| Approval Date | May 2020 | February 2021 | February 2022 | February 2023 | |||||||||||||||||||
| Authorized Repurchase Amount of Common Stock | $5 million | $20 million | $15 million | $10 million | |||||||||||||||||||
| (1) During the first quarter of 2021, the Company completed its purchases under the plan, which consisted of 2.2 million shares for $5.0 million, effectively ending the plan prior to its original expiration date. | |||||||||||||||||||||||
| (2) During the second quarter of 2021, the Company ended its $8 million stock repurchase program approved in February 2021 and allowed for the purchase of an additional $12.0 million of our common stock through June 2022, bringing total authorized purchases under the plan to $20.0 million. During the first quarter of 2022, the Company completed its purchases under the plan, which consisted of approximately 4.4 million shares for $20.0 million, effectively ending the plan prior to its original expiration date. | |||||||||||||||||||||||
| (3) During February 2023, the stock repurchase program approved in February 2022 expired with a total of 2.6 million shares purchased for $14.7 million. | |||||||||||||||||||||||
| (4) On February 9, 2023, the Company announced that its Board approved a new stock repurchase program that permits the purchase of up to $10.0 million of the Company's common stock through February 2024. | |||||||||||||||||||||||
Under each plan, management has discretion in determining the conditions under which shares may be purchased from time to time.
31
During the three months ended December 31, 2023, purchases of our common stock pursuant to the Stock Repurchase Plans were as follows:
| Period | (a) Total Number of Shares Purchased [1] | (b) Average Price Paid per Share [2] | (c) Total Number of Shares Purchased as Part of Publicly Announced Plans or Programs [3] | (d) Maximum Dollar Value of Shares that May Yet Be Purchased Under the Plans or Programs | ||||||||||||||||||||||
| October 1 through October 31, 2023 | — | $ | — | — | $ | 4,796,796 | ||||||||||||||||||||
| November 1 through November 30, 2023 | — | $ | — | — | $ | 4,796,796 | ||||||||||||||||||||
| December 1 through December 31, 2023 | — | $ | — | — | $ | 4,796,796 | ||||||||||||||||||||
| Total | — | $ | — | — | ||||||||||||||||||||||
| [1] No shares of our common stock were purchased other than through a publicly announced plan or program. | ||||||||||||||||||||||||||
| [2] Average price paid per share includes costs associated with the repurchases. | ||||||||||||||||||||||||||
| [3] On February 9, 2023, the Company announced that its Board of Directors approved a new stock repurchase program that permits the purchase of up to $10.0 million of the Company's common stock through February 2024. The number, price, structure, and timing of the repurchases, if any, will be at our sole discretion and future repurchases will be evaluated by us depending on market conditions, liquidity needs, restrictions under the agreements governing our indebtedness, and other factors. Share repurchases may be made in the open market or in privately negotiated transactions. The repurchase authorization does not oblige us to acquire any particular amount of our common stock. The Board of Directors may suspend, modify, or terminate the repurchase program at any time without prior notice. | ||||||||||||||||||||||||||
Performance Graph
The following graph shows the total shareholder return of an investment of $100 in cash on December 31, 2018 through December 31, 2023 (the last trading day of our common stock on the NYSE in 2023) for (i) our common stock, (ii) the Russell 2000 and (iii) the Dow Jones Internet Composite Index, at the closing price on December 31, 2023. All values assume reinvestment of the full amount of all dividends, if any.
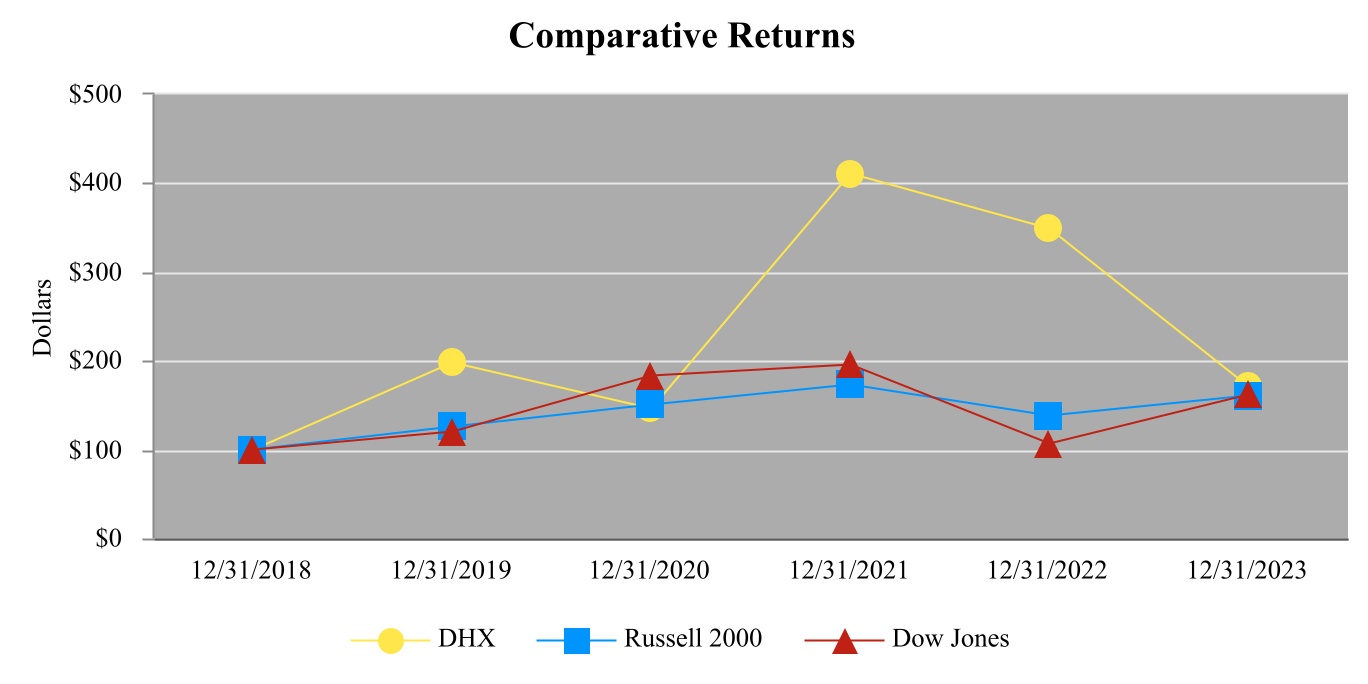
| 12/31/2018 | 12/31/2019 | 12/31/2020 | 12/31/2021 | 12/31/2022 | 12/31/2023 | |||||||||||||||
| DHX | $ | 100.00 | $ | 198.03 | $ | 146.05 | $ | 410.53 | $ | 348.03 | $ | 170.39 | ||||||||
| Russell 2000 | $ | 100.00 | $ | 125.52 | $ | 150.58 | $ | 172.90 | $ | 137.56 | $ | 160.85 | ||||||||
| Dow Jones Internet Composite Index | $ | 100.00 | $ | 119.65 | $ | 183.07 | $ | 195.42 | $ | 106.75 | $ | 162.11 | ||||||||
The returns shown on the graph do not necessarily predict future performance. The performance graph is not deemed “filed” with the SEC.
32
Item 6. Reserved
None.
Item 7. Management’s Discussion and Analysis of Financial Condition and Results of Operations
The following discussion should be read in conjunction with our consolidated financial statements and the related notes included elsewhere in this Annual Report. Certain statements we make under this Item 7 constitute “Forward-Looking Statements” under the Private Securities Litigation Reform Act of 1995, the Securities Act and the Exchange Act. See also “Note Concerning Forward-Looking Statements.”
You should keep in mind that any forward-looking statement made by us herein, or elsewhere, speaks only as of the date on which it is made. New risks and uncertainties come up from time to time, and it is impossible to predict these events or how they may affect us. We have no obligation to update any forward-looking statements after the date hereof, except as required by applicable federal securities law.
Overview
We are a provider of software products, online tools and services that deliver career marketplaces to candidates and employers in the United States. DHI’s brands, Dice and ClearanceJobs, enable recruiters and hiring managers to efficiently search, match and connect with highly skilled technologists in specialized fields, particularly technology and active government security clearance. Professionals find ideal employment opportunities, relevant job advice and personalized data that help manage their technologists' lives.
In online recruitment, we specialize in employment categories in which there has been a long-term scarcity of highly skilled, highly qualified professionals relative to market demand, specifically technologists who work in a variety of industries or have active government security clearances. Our websites serve as online two-sided marketplaces where employers and recruiters source and connect with prospective employees, and where technologists find relevant job opportunities, data and information to further their careers. Our websites offer job postings, news and content, career development and recruiting services tailored to the specific needs of the professional community that each website serves.
Majority ownership and control of DHI's eFinancialCareers ("eFC") business, which provides career websites to the financial services industry and has operations in the United Kingdom, Continental Europe, Asia, the Middle East and North America, was transferred to eFC management on June 30, 2021. The Company retained a 40% common share interest. As a result, all ongoing DHI operations, which include the Dice and ClearanceJobs brands, are in the United States subsequent to June 30, 2021. As a result of the eFC separation, the eFC business was deconsolidated from the Company's consolidated financial statements as of June 30, 2021 and is reflected as a discontinued operation. During the third quarter of 2023, the Company sold a portion of its ownership in eFC reducing its total interest in eFC from 40% to 10%.
We have been in the recruiting and career development business for over 30 years. Based on our operating structure, we have identified one reportable segment, Tech-focused, which includes the Dice and ClearanceJobs businesses and corporate related costs. The Dice and ClearanceJobs businesses and corporate related costs are aggregated into the Tech-focused reportable segment primarily because the Company does not have discrete financial information for those brands or costs.
Recent Developments
Director Appointment
On July 26, 2023, Joseph Massaquoi, Jr. was appointed as a member of the Board of Directors of the Company and a member of the Audit Committee.
Chief Financial Officer Transition
On August 7, 2023, Kevin Bostick resigned from his position as the Chief Financial Officer of the Company, effective September 1, 2023. Mr. Bostick served the Company through December 31, 2023 in order to help support a transition. Accordingly, on August 28, 2023 the Board of Directors of the Company appointed Art Zeile, the Company’s current President
33
and Chief Executive Officer, to also serve as Interim Chief Financial Officer while the Company searched for a permanent Chief Financial Officer.
On October 25, 2023, the Board of Directors of the Company appointed Raime Leeby Muhle as the Company’s Chief Financial Officer, effective December 4, 2023. Ms. Leeby Muhle will have overall responsibility for the Company’s financial organization, including financial planning, accounting, financial reporting, investor relations, treasury, internal audit and tax matters.
Our Revenues and Expenses
We derive the majority of our revenues from customers who pay fees, either annually, quarterly or monthly, to post jobs on our websites and to access our searchable databases of resumes. Our fees vary by customer based on the number of individual users of our databases of resumes, the number and type of job postings and profile views purchased and the terms of the packages purchased. Our Company sells recruitment packages that can include access to our databases of resumes and job posting capabilities. We believe the key metrics that are material to an analysis of our businesses are our total number of Dice and ClearanceJobs recruitment package customers and the revenue, on average, that these customers generate. The tables below detail this customer data.
| Recruitment Package Customers | |||||||||||||||||||||||
| Increase (Decrease) | Percent Change | ||||||||||||||||||||||
| Recruitment Package Customers: | December 31, 2023 | December 31, 2022 | |||||||||||||||||||||
| Dice | 5,492 | 6,311 | (819) | (13)% | |||||||||||||||||||
| ClearanceJobs | 2,055 | 2,064 | (9) | —% | |||||||||||||||||||
Average Annual Revenue per Recruitment Package Customer (1) | ||||||||||||||||||||||||||
| FY 2023 | FY 2022 | Increase (Decrease) | Percent Change | |||||||||||||||||||||||
| Dice | $ | 15,631 | $ | 14,664 | $ | 967 | 7% | |||||||||||||||||||
| ClearanceJobs | $ | 21,164 | $ | 19,080 | $ | 2,084 | 11% | |||||||||||||||||||
(1) Calculated by dividing recruitment package customer revenue by the daily average count of recruitment package customers during each month, adjusted to reflect a thirty day month. The simple average of each month is used to derive the amount for each period and then annualized to reflect 12 months. | ||||||||||||||||||||||||||
Dice had 5,492 recruitment package customers as of December 31, 2023, which was a decrease of 819, or 13%, year over year while average revenue per recruitment package customer for Dice increased 7% for the year ended December 31, 2023. The decrease in recruitment package customers was due to macroeconomic conditions causing customer counts to decline while the average annual revenue per recruitment package customer increased driven by strong retention rates as our larger recurring customers continue to renew with Dice. ClearanceJobs had 2,055 recruitment package customers as of December 31, 2023 compared to 2,064 as of December 31, 2022, a less than 1% decrease, and average revenue per recruitment package customer increased 11%. The increase in average annual revenue per recruitment package customer for ClearanceJobs was due to continued high demand for professionals with government clearance and consistent product releases and enhancements driving activity on the site.
Deferred revenue, as shown on the consolidated balance sheets, reflects customer billings made in advance of services being rendered. Backlog consists of deferred revenue plus customer contractual commitments not invoiced representing the value of future services to be rendered under committed contracts. We believe backlog to be an important measure of our business as it represents our ability to generate future revenue. A summary of our deferred revenue and backlog is as follows:
34
| Summary of Deferred Revenue and Backlog: | December 31, 2023 | December 31, 2022 | Increase | Percent Change | ||||||||||||||||||||||
| (in thousands, except percentages) | ||||||||||||||||||||||||||
| Deferred Revenue | $ | 49,971 | $ | 50,864 | $ | (893) | (2) | % | ||||||||||||||||||
| Contractual commitments not invoiced | 58,126 | 66,391 | (8,265) | (12) | % | |||||||||||||||||||||
Backlog1 | $ | 108,097 | $ | 117,255 | $ | (9,158) | (8) | % | ||||||||||||||||||
(1) Backlog consists of deferred revenue plus customer contractual commitments not invoiced representing the value of future services to be rendered under committed contracts. | ||||||||||||||||||||||||||
Backlog at December 31, 2023 decreased $9.2 million from December 31, 2022. The decrease is primarily due to macroeconomic conditions causing lower demand for the Company's services.
To a lesser extent, we also generate revenue from advertising on our various websites or from lead generation and marketing solutions provided to our customers. Advertisements include various forms of rich media and banner advertising, text links, sponsorships, and custom content marketing solutions. Lead generation information utilizes advertising and other methods to deliver leads to a customer.
The Company continues to evolve and develop new software products and features to attract and engage qualified professionals and match them with employers. Our ability to grow our revenues will largely depend on our ability to grow our customer bases in the markets in which we operate by acquiring new customers while retaining a high proportion of the customers we currently serve, and to expand the breadth of services our customers purchase from us. We continue to make investments in our business and infrastructure to help us achieve our long-term growth objectives, such as the innovative products in the table below.
| Product Releases | |||||||||||
| 2023 | 2022 | ||||||||||
| Dice Premium Enhanced Company Profile, Dice Remote and Company Preferences, Dice Invite to Apply, Dice Matchscore on Jobs, Dice Connections, SMS Notifications, Company Search | Dice Employer Multi-Factor Authentication, Revamped technologist onboarding, New Job Page, Dice New Job Apply Flow, Dice TalentSearch Time Zone Search, Dice TalentSearch Auto Talent Alerts, Dice iOS App Messaging | ||||||||||
| ClearanceJobs Comments, ClearanceJobs Expressed Interest, ClearanceJobs Enhanced Employer Profile, ClearanceJobs Mobile App, ClearanceJobs Live Stream | ClearanceJobs Company Page, ClearanceJobs Multi-Factor Authentication, ClearanceJobs Live Video, ClearanceJobs Scheduled Broadcast Messages | ||||||||||
Other material factors that may affect our results of operations include, but are not limited to, our ability to attract qualified professionals that become engaged with our websites and our ability to attract customers with relevant job opportunities. The more qualified professionals that use our websites, the more attractive our websites become to employers and advertisers, which in turn makes them more likely to become our customers, positively impacting our results of operations. If we are unable to continue to attract qualified professionals to engage with our websites, our customers may no longer find our services attractive, which could have a negative impact on our results of operations. Additionally, we need to ensure that our websites remain relevant in order to attract qualified professionals to our websites and to engage them in high-value tasks, such as posting resumes and applying to jobs.
The largest components of our expenses are personnel costs and marketing and sales expenditures. Personnel costs consist of salaries, benefits, and incentive compensation for our employees, including commissions for salespeople. Personnel costs are categorized in our statement of operations based on each employee’s principal function. Marketing expenditures primarily consist of online advertising, brand promotion and lead generation to employers and job seekers.
Critical Accounting Estimates
This discussion of our financial condition and results of operations is based upon our consolidated financial statements, which have been prepared in accordance with U.S. GAAP. The preparation of these financial statements requires us to make estimates, judgments and assumptions that affect the reported amount of assets, liabilities, revenues and expenses and related disclosure of contingent assets and liabilities. We evaluate our estimates, including our critical accounting estimates, on an ongoing basis. We based our estimates of the carrying value of certain assets and liabilities on historical experience and on various other assumptions that we believe are reasonable. In many cases, we could reasonably have used different accounting policies and
35
estimates. In some cases, changes in the accounting estimates are reasonably likely to occur from period to period. Our actual results may differ from these estimates under different assumptions or conditions. We believe the following critical accounting estimates affect our more significant judgments used in the preparation of our consolidated financial statements.
Goodwill
We record goodwill when the purchase price paid for an acquisition exceeds the estimated fair value of the net identified tangible and intangible assets acquired.
We determine whether the carrying value of recorded goodwill is impaired on an annual basis or more frequently if indicators of potential impairment exist. In testing goodwill for impairment, a qualitative assessment can be performed and if it is determined that the fair value of the reporting unit is more likely than not less than the carrying amount, the impairment review process compares the fair value of the reporting unit in which the goodwill resides to the carrying value of that reporting unit. If the fair value of the reporting unit is less than its carrying amount, an impairment charge is recorded for the amount the carrying value exceeds the fair value. Our annual impairment test for goodwill is performed on October 1 of each year.
The annual impairment test for the Tech-focused reporting unit performed as of October 1, 2023 resulted in the fair value of the reporting unit being substantially in excess of the carrying value. Results for the Tech-focused reporting unit for the fourth quarter of 2023 and estimated future results as of December 31, 2023 approximate the projections used in the October 1, 2023 analysis. As a result, the Company believes it is not more likely than not that the fair value of the reporting unit is less than the carrying value as of December 31, 2023. Therefore, no quantitative impairment test was performed as of December 31, 2023. No impairment was recorded during the years ended December 31, 2023, 2022 and 2021.
The amount of goodwill as of December 31, 2023 allocated to the Tech-focused reporting unit was $128.1 million. The discount rate applied for the Tech-focused reporting unit in the October 1, 2023 analysis was 12.1%. An increase to the discount rate applied or reductions to future projected operating results could result in future impairment of the Tech-focused reporting unit’s goodwill. It is reasonably possible that changes in judgments, assumptions and estimates the Company made in assessing the fair value of goodwill could cause the Company to consider some portion or all of the goodwill of the Tech-focused reporting unit to become impaired. In addition, a future decline in the overall market conditions, political instability, and/or changes in the Company’s market share could negatively impact the estimated future cash flows and discount rates used to determine the fair value of the reporting unit and could result in an impairment charge in the foreseeable future.
The determination of whether or not goodwill has become impaired is judgmental in nature and requires the use of estimates and key assumptions, particularly assumed discount rates and projections of future operating results, such as forecasted revenues and earnings before interest, taxes, depreciation and amortization margins and capital expenditure requirements. Fair values are determined by using a combination of a discounted cash flow methodology and a market comparable method. The discounted cash flow methodology is based on projections of the amounts and timing of future revenues and cash flows, assumed discount rates and other assumptions as deemed appropriate. We consider factors such as historical performance, anticipated market conditions, operating expense trends and capital expenditure requirements. Additionally, the discounted cash flows analysis takes into consideration cash expenditures for product development, other technological updates and advancements to our websites and investments to improve our candidate databases. The market comparable method indicates the fair value of a business by comparing it to publicly traded companies in similar lines of business or to comparable transactions or assets. Considerations for factors such as size, growth, profitability, risk and return on investment are analyzed and compared to the comparable businesses and adjustments are made. A market value of invested capital of the publicly traded companies is calculated and then applied to the entity’s operating results to arrive at an estimate of value. Changes in our strategy and/or market conditions could significantly impact these judgments and require adjustments to recorded amounts of goodwill.
Indefinite-Lived Acquired Intangible Assets
The indefinite-lived acquired intangible assets include the Dice trademarks and brand name. The Dice trademark, trade name and domain name is one of the most recognized names of online technology recruiting and career development. Since Dice’s inception in 1991, the brand has been recognized as a leader in recruiting and career development services for technology and engineering professionals. Currently, the brand is synonymous with the most specialized online marketplace for industry-specific technologists. The brand has a significant presence in online recruiting and career development services. Considering the recognition and the awareness of the Dice brand in the talent acquisition and staffing services market, Dice’s long operating
36
history and the intended use of the Dice brand, the remaining useful life of the Dice trademark, trade name and domain name was determined to be indefinite.
We determine whether the carrying value of our recorded indefinite-lived acquired intangible asset is impaired on an annual basis or more frequently if indicators of potential impairment exist. The impairment review process is performed on October 1 of each year and compares the fair value of the indefinite-lived acquired intangible asset to its carrying value. If the carrying value exceeds the fair value, an impairment loss is recorded. The impairment test performed as of October 1, 2023 resulted in the fair value of the Dice trademarks and brand name exceeding the carrying value by 51%. The Company's operating results attributable to the Dice trademarks and brand name for the fourth quarter of 2023 and estimated future results as of December 31, 2023 approximate the projections used in the October 1, 2023 analysis. As a result, the Company believes it is not more likely than not that the fair value of the Dice trademarks and brand name is less than the carrying value as of December 31, 2023. Therefore, no quantitative impairment test was performed as of December 31, 2023. No impairment was recorded during the years ended December 31, 2022 and 2021.
The Company’s ability to achieve the projections used in the October 1, 2023 analysis may be impacted by, among other things, competition in the technology recruiting market, challenges in developing and introducing new products and product enhancements to the market and the Company’s ability to attribute value delivered to customers. If future cash flows that are attributable to the Dice trademarks and brand name are not achieved, the Company could realize an impairment in a future period. In the October 1, 2023 analysis, the Company utilized a relief from royalty rate method to value the Dice trademarks and brand name using a royalty rate of 4.0%, which is based on comparable industry licensing agreements and the profitability attributable to the Dice trademarks and brand name, and a discount rate of 13.1%.
The determination of whether or not indefinite-lived acquired intangible assets have become impaired involves a significant level of judgment in the assumptions underlying the approach used to determine the value of the indefinite-lived acquired intangible assets. Fair values are determined using a profit allocation methodology which estimates the value of the trademark and brand name by capitalizing the profits saved because the company owns the asset. We consider factors such as historical performance, anticipated market conditions, revenues, operating expense trends and capital expenditure requirements. Changes in our strategy and/or changes in market conditions could significantly impact these judgments and require adjustments to recorded amounts of intangible assets. If projections are not achieved, the Company could realize an impairment in the foreseeable future.
Income Taxes
We utilize the asset and liability method of accounting for income taxes. Under this method, deferred income taxes are recognized for differences between the financial statement and tax bases of assets and liabilities at enacted statutory tax rates in effect for the years in which the differences are expected to reverse. Valuation allowances are established when necessary to reduce deferred tax assets to the amounts expected to be realized.
The calculation of our tax liabilities involves dealing with uncertainties in applying tax laws and regulations in numerous jurisdictions. Tax benefits from uncertain tax positions are recognized when it is more likely than not that the positions will be sustained upon examination, including resolutions of any related appeals or litigation processes, based on the technical merits. Because of the complexity of some of these uncertainties, the ultimate resolution could result in a payment that is materially different from our current estimate of the accrual for unrecognized tax benefits.
37
Results of Operations
A discussion of our comparison between 2023 and 2022 is presented below. A discussion of the changes in our results of operations between the years ended December 31, 2022 and December 31, 2021 has been omitted from this Annual Report on Form 10-K but may be found in Item 7. Management’s Discussion and Analysis of Financial Condition and Results of Operations of our Annual Report on Form 10-K for the year ended December 31, 2022, filed with the SEC on February 10, 2023, which is available free of charge on the SEC’s website at www.sec.gov and our corporate website (www.dhigroupinc.com).
Our historical financial information discussed in this Annual Report has been derived from the Company’s financial statements and accounting records for the years ended December 31, 2023 and 2022. Consolidated operating results in dollars and as a percent of revenue follows:
| For the year ended December 31, | |||||||||||||||||
| (in thousands) | 2023 | 2022 | 2023 vs 2022 | ||||||||||||||
| Revenues | $ | 151,878 | $ | 149,680 | $ | 2,198 | |||||||||||
| Operating expenses: | |||||||||||||||||
| Cost of revenues | 19,787 | 17,607 | 2,180 | ||||||||||||||
| Product development | 17,777 | 17,674 | 103 | ||||||||||||||
| Sales and marketing | 57,421 | 59,364 | (1,943) | ||||||||||||||
| General and administrative | 31,273 | 34,049 | (2,776) | ||||||||||||||
| Depreciation | 16,915 | 17,487 | (572) | ||||||||||||||
| Restructuring | 2,417 | — | 2,417 | ||||||||||||||
| Total operating expenses | 145,590 | 146,181 | (3,008) | ||||||||||||||
| Other operating income: | |||||||||||||||||
| Proceeds from settlement | — | 2,061 | (2,061) | ||||||||||||||
| Operating income (loss) | $ | 6,288 | $ | 5,560 | $ | 3,145 | |||||||||||
| For the year ended December 31, | |||||||||||
| 2023 | 2022 | ||||||||||
| Revenues | 100.0% | 100.0% | |||||||||
| Operating expenses: | |||||||||||
| Cost of revenues | 13.0 | % | 11.8 | % | |||||||
| Product development | 11.7 | % | 11.8 | % | |||||||
| Sales and marketing | 37.8 | % | 39.7 | % | |||||||
| General and administrative | 20.6 | % | 22.7 | % | |||||||
| Depreciation | 11.1 | % | 11.7 | % | |||||||
| Restructuring | 1.6 | % | — | % | |||||||
| Total operating expenses | 95.9 | % | 97.7 | % | |||||||
| Other operating income: | |||||||||||
| Proceeds from settlement | — | % | 1.4 | % | |||||||
| Operating income (loss) | 4.1 | % | 3.7 | % | |||||||
38
Comparison of Years Ended December 31, 2023 and 2022
Revenues
| Year Ended December 31, | Increase (Decrease) | Percent Change | |||||||||||||||||||||
| 2023 | 2022 | ||||||||||||||||||||||
| (in thousands, except percentages) | |||||||||||||||||||||||
Dice(1) | $ | 102,584 | $ | 106,957 | $ | (4,373) | (4.1) | % | |||||||||||||||
ClearanceJobs | 49,294 | 42,723 | 6,571 | 15.4 | % | ||||||||||||||||||
| Total revenues | $ | 151,878 | $ | 149,680 | $ | 2,198 | 1.5 | % | |||||||||||||||
| (1) Includes Dice and Career Events. | |||||||||||||||||||||||
We experienced an increase in revenue of $2.2 million, or 1.5%. Revenue at Dice decreased by $4.4 million, or 4.1%, compared to the same period of 2022 as bookings performance in 2022 delivered revenue for Dice early in 2023 but macroeconomic conditions throughout 2023 drove lower new business activity and lower activity with Dice's non-annual products. Revenues for ClearanceJobs increased by $6.6 million, or 15.4%, as compared to the same period of 2022, driven by continued high demand for professionals with government clearance and consistent product releases and enhancements driving activity on the site.
Cost of Revenues
| Year Ended December 31, | Increase | Percent Change | |||||||||||||||||||||
| 2023 | 2022 | ||||||||||||||||||||||
| (in thousands, except percentages) | |||||||||||||||||||||||
| Cost of revenues | $ | 19,787 | $ | 17,607 | $ | 2,180 | 12.4 | % | |||||||||||||||
| Percentage of revenues | 13.0 | % | 11.8 | % | |||||||||||||||||||
Cost of revenues increased by $2.2 million, or 12.4%, driven by an increase of $1.2 million from higher compensation related costs and $1.0 million in operational costs, primarily related to the amortization of cloud computing costs.
Product Development Expenses
| Year Ended December 31, | Increase | Percent Change | |||||||||||||||||||||
| 2023 | 2022 | ||||||||||||||||||||||
| (in thousands, except percentages) | |||||||||||||||||||||||
| Product development | $ | 17,777 | $ | 17,674 | $ | 103 | 0.6 | % | |||||||||||||||
| Percentage of revenues | 11.7 | % | 11.8 | % | |||||||||||||||||||
Product development expenses increased $0.1 million, or 0.6%, driven by a decrease of $1.2 million in compensation related costs, primarily related to lower headcount and bonus expense, which was offset by lower capitalized labor of $1.3 million as compared to the prior year period, which increases operating expenses.
Sales and Marketing Expenses
| Year Ended December 31, | Decrease | Percent Change | |||||||||||||||||||||
| 2023 | 2022 | ||||||||||||||||||||||
| (in thousands, except percentages) | |||||||||||||||||||||||
| Sales and marketing | $ | 57,421 | $ | 59,364 | $ | (1,943) | (3.3) | % | |||||||||||||||
| Percentage of revenues | 37.8 | % | 39.7 | % | |||||||||||||||||||
Sales and marketing expenses decreased $1.9 million, or 3.3%, from the same period in 2022. The decrease was primarily driven by a $3.0 million decrease in discretionary marketing expenses, which was partially offset by an increase of $0.8 million in operational costs, primarily discretionary marketing expenses.
39
General and Administrative Expenses
| Year Ended December 31, | Decrease | Percent Change | |||||||||||||||||||||
| 2023 | 2022 | ||||||||||||||||||||||
| (in thousands, except percentages) | |||||||||||||||||||||||
| General and administrative | $ | 31,273 | $ | 34,049 | $ | (2,776) | (8.2) | % | |||||||||||||||
| Percentage of revenues | 20.6 | % | 22.7 | % | |||||||||||||||||||
General and administrative costs decreased $2.8 million or 8.2%, from prior year. The decrease was driven by a $1.9 million decrease in compensation related costs, primarily due to lower bonus expense in 2023, and a decrease of $1.0 million in other operating costs including recruiting, software, and insurance costs.
Depreciation
| Year Ended December 31, | Decrease | Percent Change | |||||||||||||||||||||
| 2023 | 2022 | ||||||||||||||||||||||
| (in thousands, except percentages) | |||||||||||||||||||||||
| Depreciation | $ | 16,915 | $ | 17,487 | $ | (572) | (3.3) | % | |||||||||||||||
| Percentage of revenues | 11.1 | % | 11.7 | % | |||||||||||||||||||
Depreciation expense decreased $0.6 million or 3.3% from the same period in 2022. The decrease was driven by the timing of assets being placed into service.
Restructuring
| Year Ended December 31, | Increase | Percent Change | |||||||||||||||||||||
| 2023 | 2022 | ||||||||||||||||||||||
| (in thousands, except percentages) | |||||||||||||||||||||||
| Restructuring | $ | 2,417 | $ | — | $ | 2,417 | — | % | |||||||||||||||
| Percentage of revenues | 1.6 | % | — | % | |||||||||||||||||||
During 2023, the Company recorded restructuring charges of $2.4 million as part of an organizational restructuring intended to streamline its operations, drive business objectives, reduce operating expenses and improve operating margins. The restructuring included a reduction of the Company’s then-current workforce by approximately 10%.
Proceeds from settlement
| Year Ended December 31, | Decrease | Percent Change | |||||||||||||||||||||
| 2023 | 2022 | ||||||||||||||||||||||
| (in thousands, except percentages) | |||||||||||||||||||||||
| Proceeds from settlement | $ | — | $ | 2,061 | $ | (2,061) | (100.0) | % | |||||||||||||||
| Percentage of revenues | — | % | 1.4 | % | |||||||||||||||||||
During the fourth quarter of 2022 the Company received proceeds from a legal settlement of $2.1 million.
Operating Income (Loss)
| Year Ended December 31, | Increase | Percent Change | |||||||||||||||||||||
| 2023 | 2022 | ||||||||||||||||||||||
| (in thousands, except percentages) | |||||||||||||||||||||||
| Revenue | $ | 151,878 | $ | 149,680 | $ | 2,198 | 1.5 | % | |||||||||||||||
| Operating income | 6,288 | 5,560 | $ | 728 | 13.1 | % | |||||||||||||||||
| Percentages of revenues | 4.1 | % | 3.7 | % | |||||||||||||||||||
Operating income for the year ended December 31, 2023 was $6.3 million, a margin of 4.1%, compared to operating income of $5.6 million, a margin of 3.7%, for the same period in 2022. The increase in operating income and improved percentage margin was driven by higher revenues and a decrease in operational costs, as discussed above.
40
Income from equity method investment
| Year Ended December 31, | Decrease | Percent Change | |||||||||||||||||||||
| 2023 | 2022 | ||||||||||||||||||||||
| (in thousands, except percentages) | |||||||||||||||||||||||
| Income from equity method investment | $ | 502 | $ | 1,597 | $ | (1,095) | (68.6) | % | |||||||||||||||
| Percentage of revenues | 0.3 | % | 1.1 | % | |||||||||||||||||||
During the years ended December 31, 2023 and 2022, the Company recorded $0.5 million and $1.6 million, respectively, of income related to its proportionate share of eFC's net income. The Company records its proportionate share of eFC's net income three months in arrears. See note 7 of the notes to consolidated financial statements for additional information.
Impairment of investment
| Year Ended December 31, | Decrease | Percent Change | |||||||||||||||||||||
| 2023 | 2022 | ||||||||||||||||||||||
| (in thousands, except percentages) | |||||||||||||||||||||||
| Impairment of investment | $ | 300 | $ | 2,300 | $ | (2,000) | (87.0) | % | |||||||||||||||
| Percentage of revenues | 0.2 | % | 1.5 | % | |||||||||||||||||||
During the years ended December 31, 2023 and 2022, the Company recognized a $0.3 million and $2.3 million, respectively, loss related to the impairment of an investment. See note 7 of the notes to consolidated financial statements for additional information.
Gain on investments
| Year Ended December 31, | Increase | Percent Change | |||||||||||||||||||||
| 2023 | 2022 | ||||||||||||||||||||||
| (in thousands, except percentages) | |||||||||||||||||||||||
| Gain on investments | $ | 614 | $ | 320 | $ | 294 | 91.9 | % | |||||||||||||||
| Percentage of revenues | 0.4 | % | 0.2 | % | |||||||||||||||||||
During the year ended December 31, 2023, the Company recognized a $0.6 million gain from a partial sale of its 40% common share interest in eFC. During the year ended December 31, 2022, the Company recognized a $0.3 million gain from the sale of its 40% common share interest in Rigzone. See note 7 of the notes to consolidated financial statements for additional information.
Interest Expense and Other
| Year Ended December 31, | Increase | Percent Change | |||||||||||||||||||||
| 2023 | 2022 | ||||||||||||||||||||||
| (in thousands, except percentages) | |||||||||||||||||||||||
| Interest expense and other | $ | 3,482 | $ | 1,580 | $ | 1,902 | 120.4 | % | |||||||||||||||
| Percentage of revenues | 2.3 | % | 1.1 | % | |||||||||||||||||||
Interest expense and other increased by $1.9 million, or 120.4%, from the same period in 2022 due to higher debt outstanding on our revolving credit facility during 2023 and higher interest rates.
41
Income Taxes
| Year Ended December 31, | |||||||||||
| 2023 | 2022 | ||||||||||
| (in thousands, except percentages) | |||||||||||
| Income before income taxes | $ | 3,622 | $ | 3,597 | |||||||
| Income tax expense (benefit) | 131 | (579) | |||||||||
| Effective tax rate | 3.6 | % | (16.1) | % | |||||||
A reconciliation between the income tax expense at the federal statutory rate and the reported income tax expense (benefit) is summarized as follows:
| Year Ended December 31, | |||||||||||
| 2023 | 2022 | ||||||||||
| Federal statutory rate | $ | 760 | $ | 755 | |||||||
| Loss on sale of investments | (22,881) | — | |||||||||
| Expiration of capital loss carryforward | 4,680 | — | |||||||||
| Stock-based compensation | (399) | (1,130) | |||||||||
| State tax expense, net of federal effect | 80 | 139 | |||||||||
| Change in accrual for unrecognized tax benefits | 263 | (16) | |||||||||
| Executive compensation | 1,214 | 266 | |||||||||
| Research and development tax credits | (1,651) | (763) | |||||||||
| Income from equity method investment | (105) | (335) | |||||||||
| Change in valuation allowance | 18,158 | 555 | |||||||||
| Other | 12 | (50) | |||||||||
| Income tax expense (benefit) | $ | 131 | $ | (579) | |||||||
Our effective income tax rate was 3.6% and (16.1)% for the years ended December 31, 2023 and 2022, respectively. The 2023 tax rate differed from the federal statutory rate primarily because of permanent book/tax differences in basis related to the sale of investments, the expiration of a capital loss carryforward, a tax benefit related to the vesting of stock-based compensation, deduction limitations on executive compensation, tax credits for research and development, and an increase in the valuation allowance for capital loss carryforwards. The 2022 tax rate differed from the federal statutory rate primarily because of a tax benefit related to the vesting of stock-based compensation, tax credits for research and development, and an increase in the valuation allowance associated with an investment.
Earnings per Share
| Year Ended December 31, | |||||||||||
| 2023 | 2022 | ||||||||||
| (in thousands, except per share amounts) | |||||||||||
| Net income | $ | 3,491 | $ | 4,176 | |||||||
| Weighted-average shares outstanding - basic | 43,571 | 44,274 | |||||||||
| Weighted-average shares outstanding - diluted | 44,496 | 46,533 | |||||||||
| Diluted earnings per share | $ | 0.08 | $ | 0.09 | |||||||
Diluted earnings per share was $0.08 and $0.09 for the years ended December 31, 2023 and 2022, respectively. The lower 2023 earnings per share was driven by slightly lower net income, partially offset by lower diluted shares outstanding.
42
Non-GAAP Financial Measures
We have provided certain non-GAAP financial information as additional measures for our operating results. These measures are not in accordance with, or an alternative for, measures in accordance with U.S. GAAP and may be different from similarly titled non-GAAP measures reported by other companies. We believe the presentation of non-GAAP measures, such as Adjusted EBITDA and Adjusted EBITDA margin, provides useful information to management and investors regarding certain financial and business trends relating to our financial condition and results of operations.
Adjusted EBITDA and Adjusted EBITDA Margin
Adjusted EBITDA and Adjusted EBITDA Margin are non-GAAP metrics used by management to measure operating performance. Management uses Adjusted EBITDA and Adjusted EBITDA Margin as performance measures for internal monitoring and planning, including preparation of annual budgets, analyzing investment decisions and evaluating profitability and performance comparisons between us and our competitors. The Company also uses this measure to calculate amounts of performance based compensation under the senior management incentive bonus program. Adjusted EBITDA represents net income plus (to the extent deducted in calculating such net income) interest expense, income tax expense, depreciation and amortization, and items such as non-cash stock based compensation, losses resulting from certain dispositions outside the ordinary course of business including prior negative operating results of those divested businesses, certain write-offs in connection with indebtedness, impairment charges with respect to long-lived assets, expenses incurred in connection with an equity offering or any other offering of securities by the Company, extraordinary or non-recurring non-cash expenses or losses, losses from equity method investments, transaction costs in connection with the credit agreement, deferred revenues written off in connection with acquisition purchase accounting adjustments, write-off of non-cash stock-based compensation expense, impairment of investment, severance and retention costs related to dispositions and reorganizations of the Company, restructuring charges and losses related to legal claims and fees that are unusual in nature or infrequent, minus (to the extent included in calculating such net income) non-cash income or gains, including income from equity method investments, interest income, business interruption insurance proceeds, and any income or gain resulting from certain dispositions outside the ordinary course of business, including prior operating results of those divested businesses, and gains related to legal claims that are unusual in nature or infrequent.
Adjusted EBITDA Margin is computed as Adjusted EBITDA divided by Revenues.
We also consider Adjusted EBITDA and Adjusted EBITDA Margin, as defined above, to be important indicators to investors because they provide information related to our ability to provide cash flows to meet future debt service, capital expenditures, and working capital requirements, and to fund future growth. We present Adjusted EBITDA and Adjusted EBITDA Margin as supplemental performance measures because we believe that these measures provide our Board, management and investors with additional information to measure our performance, provide comparisons from period to period by excluding potential differences caused by variations in capital structures (affecting interest expense) and tax positions (such as the impact on periods or companies of changes in effective tax rates or net operating losses), and to estimate our value.
We understand that although Adjusted EBITDA and Adjusted EBITDA Margin is frequently used by securities analysts, lenders and others in their evaluation of companies, Adjusted EBITDA and Adjusted EBITDA Margin have limitations as analytical tools, and you should not consider them in isolation, or as a substitute for analysis of our liquidity or results as reported under GAAP. Some limitations are:
•Adjusted EBITDA and Adjusted EBITDA Margin do not reflect our cash expenditures, or future requirements for capital expenditures or contractual commitments;
•Adjusted EBITDA and Adjusted EBITDA Margin do not reflect changes in, or cash requirements for, our working capital needs;
•Adjusted EBITDA and Adjusted EBITDA Margin do not reflect interest expense, or the cash requirements necessary to service interest or principal payments on our debt;
•Although depreciation and amortization are non-cash charges, the assets being depreciated and amortized often will have to be replaced in the future, and Adjusted EBITDA and Adjusted EBITDA Margin do not reflect any cash requirements for such replacements; and
•Other companies in our industry may calculate Adjusted EBITDA and Adjusted EBITDA Margin differently than we do, limiting their usefulness as a comparative measure.
43
To compensate for these limitations, management evaluates our liquidity by considering the economic effect of excluded expense items independently, as well as in connection with its analysis of cash flows from operations and through the use of other financial measures, such as capital expenditure budget variances, investment spending levels and return on capital analysis.
Adjusted EBITDA and Adjusted EBITDA Margin are not measurements of our financial performance under GAAP and should not be considered as an alternative to revenue, operating income, net income, net income margin, cash provided by operating activities, or any other performance measures derived in accordance with GAAP as a measure of our profitability or liquidity.
A reconciliation of Adjusted EBITDA for the years ended December 31, 2023, 2022 and 2021 follows (in thousands):
| Year Ended December 31, | |||||||||||||||||
| 2023 | 2022 | 2021 | |||||||||||||||
| Reconciliation of Net Income (loss) to Adjusted EBITDA: | |||||||||||||||||
| Net income (loss) | $ | 3,491 | $ | 4,176 | $ | (29,742) | |||||||||||
| Interest expense | 3,482 | 1,580 | 748 | ||||||||||||||
| Income tax expense (benefit) | 131 | (579) | (629) | ||||||||||||||
| Depreciation | 16,915 | 17,487 | 16,344 | ||||||||||||||
| Non-cash stock based compensation | 9,467 | 9,519 | 7,681 | ||||||||||||||
| Income from equity method investment | (502) | (1,597) | (190) | ||||||||||||||
| Proceeds from settlement | — | (2,061) | — | ||||||||||||||
| Gain on investments | (614) | (320) | (1,198) | ||||||||||||||
| Impairment of right-of-use asset | — | — | 1,919 | ||||||||||||||
| Impairment of investment | 300 | 2,300 | — | ||||||||||||||
| Severance and related costs | 1,167 | 445 | 1,969 | ||||||||||||||
| Loss on discontinued operations, net of tax | — | — | 29,340 | ||||||||||||||
| Restructuring | 2,417 | — | — | ||||||||||||||
| Other | — | — | (80) | ||||||||||||||
| Adjusted EBITDA | $ | 36,254 | $ | 30,950 | $ | 26,162 | |||||||||||
| Reconciliation of Operating Cash Flows to Adjusted EBITDA: | |||||||||||||||||
| Net cash provided by operating activities | $ | 21,345 | $ | 36,035 | $ | 28,581 | |||||||||||
| Interest expense | 3,482 | 1,580 | 748 | ||||||||||||||
| Amortization of deferred financing costs | (145) | (146) | (147) | ||||||||||||||
| Income tax expense (benefit) | 131 | (579) | (629) | ||||||||||||||
| Deferred income taxes | 3,301 | 3,800 | 569 | ||||||||||||||
| Change in accrual for unrecognized tax benefits | (263) | 16 | 156 | ||||||||||||||
| Change in accounts receivable | 1,398 | 2,109 | 1,102 | ||||||||||||||
| Change in deferred revenue | 893 | (4,718) | (10,075) | ||||||||||||||
| Discontinued operations results | — | — | (3,593) | ||||||||||||||
| Severance and related costs | 1,167 | 445 | 1,969 | ||||||||||||||
| Restructuring | 2,417 | — | — | ||||||||||||||
| Changes in working capital and other | 2,528 | (7,592) | 7,481 | ||||||||||||||
| Adjusted EBITDA | $ | 36,254 | $ | 30,950 | $ | 26,162 | |||||||||||
44
A reconciliation of Adjusted EBITDA Margin for the years ended December 31, 2023, 2022 and 2021 follows (in thousands, except percentages):
| Year Ended December 31, | |||||||||||||||||
| 2023 | 2022 | 2021 | |||||||||||||||
| Revenues | $ | $ | $ | ||||||||||||||
| Net income (loss) | $ | $ | $ | ( | |||||||||||||
Net income (loss) margin(1) | 2 | % | 3 | % | (25) | % | |||||||||||
| Adjusted EBITDA | $ | 36,254 | $ | 30,950 | $ | 26,162 | |||||||||||
Adjusted EBITDA Margin(1) | 24 | % | 21 | % | 22 | % | |||||||||||
(1) Net income (loss) margin and Adjusted EBITDA Margin are calculated by dividing the respective measure by that period's revenues. | |||||||||||||||||
Liquidity and Capital Resources
Cash Flows
We have summarized our cash flows for the years ended December 31, 2023, 2022 and 2021 as follows (in thousands):
| Year Ended December 31, | |||||||||||
| 2023 | 2022 | ||||||||||
| Cash from operating activities | $ | 21,345 | $ | 36,035 | |||||||
| Cash used in investing activities | (15,311) | (17,656) | |||||||||
| Cash used in financing activities | (4,834) | (16,913) | |||||||||
We have financed our operations primarily through cash provided by operating activities and borrowings under our revolving credit facility. At December 31, 2023, we had cash and borrowings of $4.2 million and $38.0 million, respectively, compared to $3.0 million and $30.0 million, respectively, at December 31, 2022.
Liquidity
Our principal internal sources of liquidity are cash on hand, as well as the cash flow that we generate from our operations. In addition, we had $62.0 million in borrowing capacity under our $100.0 million Credit Agreement at December 31, 2023, subject to certain availability limits including our consolidated leverage ratio, which generally limits borrowings to 2.5 times annual Adjusted EBITDA levels, as defined in the Credit Agreement. We believe that our existing cash and cash equivalents, cash generated from our continuing operations and available borrowings under our Credit Agreement will be sufficient to satisfy our currently anticipated cash requirements through at least the next 12 months and the foreseeable future thereafter. However, it is possible that one or more lenders under the Credit Agreement may refuse or be unable to satisfy their commitment to lend to us, we may violate one or more of our covenants or financial ratios contained in our Credit Agreement or we may need to refinance our debt and be unable to do so. In addition, our liquidity could be negatively affected by a decrease in demand for our products and services and the ability of our customers to pay for current or future services. We may also make acquisitions and may need to raise additional capital through future debt financings or equity offerings to the extent necessary to fund such acquisitions, which we may not be able to do on a timely basis or on terms satisfactory to us or at all.
Comparison of Years Ended December 31, 2023 and 2022
Operating Activities
Cash flows from operating activities is driven by earnings and is dependent on the amount and timing of billings and cash collections from our customers. Cash flows from operating activities primarily consists of net income adjusted for certain non-cash items, including depreciation, changes in deferred tax assets and liabilities, stock based compensation, impairments, and the effect of changes in working capital. Net cash flows from operating activities were $21.3 million and $36.0 million for the years ended December 31, 2023 and 2022, respectively, a decrease of $14.7 million. Cash inflow from operations is driven by earnings and is dependent on the amount and timing of payments to vendors and employees and billings to and cash collections from our customers. Cash provided by operating activities during the year ended December 31, 2023 decreased as compared to
45
the prior year due to the amount and timing of bonus payments, of payments to vendors, and of billings to and cash collections from our customers.
Investing Activities
During the year ended December 31, 2023, cash used in investing activities was $15.3 million compared to $17.7 million of cash used in investing activities during the year ended December 31, 2022. Cash used in investing activities during the year ended December 31, 2023 is comprised of $20.3 million of purchases of fixed assets, partially offset by $5.0 million of cash received from sale of investment. Cash used in investing activities during the year ended December 31, 2022 is primarily comprised of $18.0 million of purchases of fixed assets, which is primarily comprised of capitalized development costs as the Company continues to invest in its products.
Financing Activities
Cash used in financing activities during the year ended December 31, 2023 was $4.8 million primarily due to cash uses of $12.8 million, net, related to share repurchases, partially offset by $8.0 million of net proceeds on long-term debt. Cash used during the year ended December 31, 2022 was $16.9 million primarily due to cash uses of $23.4 million, net, related to share repurchases and $0.5 million from financing costs paid, partially offset by $7.0 million of net proceeds on long-term debt.
Financings and Capital Requirements
Credit Agreement
We have a $100 million revolving credit facility, which matures June 2027, with $38.0 million of outstanding borrowings on the facility at December 31, 2023, leaving $62.0 million available for future borrowings, subject to the terms of the Credit Agreement. Borrowings under the Credit Agreement denominated in U.S. dollars bear interest, payable at least quarterly, at the Company’s option, at the Secured Overnight Financing Rate ("SOFR") or a base rate, plus a margin. Borrowings under the credit agreement denominated in pounds sterling, if any, bear interest at the Sterling Overnight Index Average ("SONIA") rate plus a margin. The margin ranges from 2.00% to 2.75% on SOFR and SONIA loans and 1.00% to 1.75% on base rate loans, determined by the Company’s most recent consolidated leverage ratio, plus an additional spread of 0.10%. The Company incurs a commitment fee ranging from 0.35% to 0.50% on any unused capacity under the revolving loan facility, determined by the Company’s most recent consolidated leverage ratio. Assuming an interest rate of 7.71% (the rate in effect on December 31, 2023) on our current borrowings, interest payments are expected to be $2.9 million per year in years 2024 through 2026 and $1.5 million in 2027. The Credit Agreement contains various affirmative and negative covenants and also contains certain financial covenants, including a consolidated leverage ratio and a consolidated interest coverage ratio. As of December 31, 2023, the Company was in compliance with all of the financial covenants under the Credit Agreement. Refer to Note 11 of the notes to consolidated financial statements and Item 7A. "Quantitative and Qualitative Disclosures about Market Risk - Interest Rate Risk."
Contractual Obligations
The Company has operating leases for corporate office space and certain equipment. The leases have terms from one year to ten years, some of which include options to renew the lease, and are included in the lease term when it is reasonably certain that the Company will exercise the option. No leases include options to purchase the leased property. As of December 31, 2023 the value of our lease right-of-use asset was $4.8 million and the value of our lease liability was $8.5 million. See also Note 6 of the notes to consolidated financial statements for further information.
We make commitments to purchase advertising from online vendors, which we pay for on a monthly basis. We have no significant long-term obligations to purchase a fixed or minimum amount with these vendors.
Other Capital Requirements
As of December 31, 2023, we recorded approximately $1.0 million of unrecognized tax benefits as liabilities, and we are uncertain if or when such amounts may be settled. Related to the unrecognized tax benefits considered permanent differences, we have also recorded a liability for potential penalties and interest. Included in the balance of unrecognized tax benefits at December 31, 2023 are $1.0 million of tax benefits that would affect the effective tax rate if recognized. The Company believes it is reasonably possible that as much as $0.2 million of its unrecognized tax benefits may be recognized in the next twelve months.
46
The Company's Board of Directors approved a stock repurchase program that permits the Company to repurchase its common stock. During the year ended December 31, 2023, the Company repurchased 1.7 million shares for $6.9 million. As of December 31, 2023, the value of shares available to be purchased under the current plan was $4.8 million. Management has discretion in determining the conditions under which shares may be purchased from time to time.
We anticipate capital expenditures in 2024 to be approximately $15 million to $17 million. We intend to use operating cash flows to fund capital expenditures.
47
Cyclicality
The labor market and certain of the industries that we serve have historically experienced short-term cyclicality. However, we believe that online career websites and marketplaces continue to provide economic and strategic value to the labor market and industries that we serve.
Any slowdown in recruitment activity that occurs could negatively impact our revenues and results of operations. A decrease in the unemployment rate or a labor shortage, including as a result of an increase in job turnover, generally means that employers (including our customers) are seeking to hire more individuals, which would generally lead to more job postings and database licenses and have a positive impact on our revenues and results of operations. Based on historical trends, improvements in labor markets and the need for our services generally lag behind overall economic improvements. Additionally, there has historically been a lag from the time customers begin to increase purchases of our recruitment services and the impact to our revenues due to the recognition of revenue occurring over the length of the contract, which can be several months to over a year.
From time to time, we see market slowdowns, which can lead to lower demand for recruiting technologists and financial and security cleared professionals. If recruitment activity slows in the industries in which we operate, our revenues and results of operations could be negatively impacted.
48
Recent Accounting Pronouncements
For a discussion of new accounting pronouncements affecting the Company, refer to Note 2 of the notes to consolidated financial statements included in Item 8 of this Annual Report.
49
Item 7A. Quantitative and Qualitative Disclosures about Market Risk
We have exposure to financial market risks, including changes in foreign currency exchange rates, interest rates, and other relevant market prices.
Foreign Exchange Risk
Prior to June 30, 2021, we conducted business serving multiple markets, in four languages, mainly across Europe, Asia, Australia, and North America using the eFC name. Subsequent to June 30, 2021, our operations are conducted within the United States. As a result, our current operations are not subject to foreign exchange risk.
The Company's investment in eFC, as described in Note 7 of the notes to consolidated financial statements, which is recorded under the equity method of accounting, subjects the Company to foreign exchange risk because the functional currency of eFC is the British Pound Sterling. Accordingly, the Company must translate its share of eFC's net income into United States dollars. The Company's share of eFC's net income is not expected to be significant.
Interest Rate Risk
We have interest rate risk primarily related to borrowings under our Credit Agreement. Borrowings under our Credit Agreement denominated in U.S. dollars bear interest, payable at least quarterly, at the Company's option, at the SOFR or a base rate, plus a margin. Borrowings under the credit agreement denominated in pounds sterling, if any, bear interest at the SONIA rate plus a margin. The margin ranges from 2.00% to 2.75% on SOFR and SONIA loans and 1.00% to 1.75% on the base rate, as determined by our most recent consolidated leverage ratio, plus an additional spread of 0.10%. As of December 31, 2023, we had outstanding borrowings of $38.0 million under our Credit Agreement. A hypothetical increase of 1.0% on these variable rate borrowings would increase our annual interest expense over the next 12 months by approximately $0.4 million, based on the balances outstanding for these borrowings as of December 31, 2023.
50
Item 8. Financial Statements and Supplementary Data
| Page | ||||||||
| DHI Group, Inc. | ||||||||
Consolidated Financial Statements | ||||||||
51
REPORT OF INDEPENDENT REGISTERED PUBLIC ACCOUNTING FIRM
To the shareholders and the Board of Directors of DHI Group, Inc.
Opinions on the Financial Statements and Internal Control over Financial Reporting
We have audited the accompanying consolidated balance sheets of DHI Group, Inc. and subsidiaries (the "Company") as of December 31, 2023 and 2022, the related consolidated statements of operations, comprehensive income (loss), stockholders' equity, and cash flows, for each of the three years in the period ended December 31, 2023, and the related notes, and the schedule listed in the Index at Item 15 (collectively referred to as the "financial statements"). We also have audited the Company’s internal control over financial reporting as of December 31, 2023, based on criteria established in Internal Control — Integrated Framework (2013) issued by the Committee of Sponsoring Organizations of the Treadway Commission (COSO).
In our opinion, the financial statements referred to above present fairly, in all material respects, the financial position of the Company as of December 31, 2023 and 2022, and the results of its operations and its cash flows for each of the three years in the period ended December 31, 2023, in conformity with accounting principles generally accepted in the United States of America. Also, in our opinion, the Company maintained, in all material respects, effective internal control over financial reporting as of December 31, 2023, based on criteria established in Internal Control — Integrated Framework (2013) issued by COSO.
Basis for Opinions
The Company’s management is responsible for these financial statements, for maintaining effective internal control over financial reporting, and for its assessment of the effectiveness of internal control over financial reporting, included in the accompanying Management’s Report on Internal Control Over Financial Reporting. Our responsibility is to express an opinion on these financial statements and an opinion on the Company’s internal control over financial reporting based on our audits. We are a public accounting firm registered with the Public Company Accounting Oversight Board (United States) (PCAOB) and are required to be independent with respect to the Company in accordance with the U.S. federal securities laws and the applicable rules and regulations of the Securities and Exchange Commission and the PCAOB.
We conducted our audits in accordance with the standards of the PCAOB. Those standards require that we plan and perform the audits to obtain reasonable assurance about whether the financial statements are free of material misstatement, whether due to error or fraud, and whether effective internal control over financial reporting was maintained in all material respects.
Our audits of the financial statements included performing procedures to assess the risks of material misstatement of the financial statements, whether due to error or fraud, and performing procedures to respond to those risks. Such procedures included examining, on a test basis, evidence regarding the amounts and disclosures in the financial statements. Our audits also included evaluating the accounting principles used and significant estimates made by management, as well as evaluating the overall presentation of the financial statements. Our audit of internal control over financial reporting included obtaining an understanding of internal control over financial reporting, assessing the risk that a material weakness exists, and testing and evaluating the design and operating effectiveness of internal control based on the assessed risk. Our audits also included performing such other procedures as we considered necessary in the circumstances. We believe that our audits provide a reasonable basis for our opinions.
Definition and Limitations of Internal Control over Financial Reporting
A company’s internal control over financial reporting is a process designed to provide reasonable assurance regarding the reliability of financial reporting and the preparation of financial statements for external purposes in accordance with generally accepted accounting principles. A company’s internal control over financial reporting includes those policies and procedures that (1) pertain to the maintenance of records that, in reasonable detail, accurately and fairly reflect the transactions and dispositions of the assets of the company; (2) provide reasonable assurance that transactions are recorded as necessary to permit preparation of financial statements in accordance with generally accepted accounting principles, and that receipts and expenditures of the company are being made only in accordance with authorizations of management and directors of the company; and (3) provide reasonable assurance regarding prevention or timely detection of unauthorized acquisition, use, or disposition of the company’s assets that could have a material effect on the financial statements.
52
Because of its inherent limitations, internal control over financial reporting may not prevent or detect misstatements. Also, projections of any evaluation of effectiveness to future periods are subject to the risk that controls may become inadequate because of changes in conditions, or that the degree of compliance with the policies or procedures may deteriorate.
Critical Audit Matters
The critical audit matters communicated below are matters arising from the current-period audit of the financial statements that were communicated or required to be communicated to the audit committee and that (1) relate to accounts or disclosures that are material to the financial statements and (2) involved our especially challenging, subjective, or complex judgments. The communication of critical audit matters does not alter in any way our opinion on the financial statements, taken as a whole, and we are not, by communicating the critical audit matters below, providing a separate opinion on the critical audit matters or on the accounts or disclosures to which they relate.
Goodwill and Indefinite Long-Lived Acquired Intangible Assets– Refer to Notes 2, 9, and 10 to the financial statements
Critical Audit Matter Description
The Company determines whether the carrying value of recorded goodwill is impaired on an annual basis or more frequently if indicators of potential impairment exist. If the fair value of the reporting unit is less than its carrying amount, an impairment charge is recorded for the amount the carrying value exceeds the fair value. The Company determined the fair value of its reporting unit by using a combination of a discounted cash flow methodology and a market comparable method. The determination of the fair value for the Company’s reporting unit (“Tech-focused”) is judgmental and required management to make significant estimates and assumptions including forecasts of future revenue, EBITDA margin and the discount rate.
The Company’s evaluation of its indefinite lived trademark and brand intangible asset (“Dice”) involves the comparison of the fair value to its carrying value. The Company determined the fair value of Dice using a relief from royalty rate valuation method. The determination of the fair value of Dice required management to make significant estimates and assumptions including forecasts of future revenue, the royalty rate and the discount rate.
The goodwill balance was $128.1M as of December 31, 2023. The fair value of the reporting unit exceeded its carrying value as of the measurement date, October 1, 2023, and therefore, no goodwill impairment was recognized. The carrying value of Dice was $23.8M as of December 31, 2023.The fair value of Dice exceeded its carrying value as of the measurement date, October 1, 2023, and therefore no impairment was recognized.
Given the significant estimates and assumptions management makes to estimate the fair value of the Tech-focused reporting unit and the Dice brand, performing auditing procedures to evaluate the reasonableness of management’s forecasts of revenue, EBITDA margin, the royalty rate and the discount rates required a high degree of auditor judgment and an increased extent of effort, including the need to involve our fair value specialists.
How the Critical Audit Matter Was Addressed in the Audit
Our audit procedures related to the forecasts of future revenues, EBITDA margins and selection of the royalty and discount rates used by management to estimate the fair value of Tech-focused and Dice included the following, among others:
•We tested the effectiveness of controls over the Tech-focused reporting unit and Dice trademarks and brand name impairment tests, including controls related to management’s forecasts of revenue, EBITDA margin, royalty rate and the discount rates.
•We evaluated management’s ability to accurately forecast revenue growth rates and EBITDA margin by comparing actual results to management’s historical forecasts.
•We evaluated the reasonableness of management’s forecasts of revenues by comparing the forecasts of revenues to external market sources.
•With the assistance of our fair value specialists we evaluated the reasonableness of management’s selected long-term growth rate for revenue by comparing it to industry projections.
53
•With the assistance of our fair value specialists we evaluated the reasonableness of management’s selected royalty rate by comparing it to those of industry participants from external sources.
•With the assistance of our fair value specialists we evaluated the reasonableness of management’s selected discount rates by computing an independent estimate of those rates and the revenue growth rate through a peer analysis.
•We evaluated the reasonableness of management’s evaluation over ASC 350 qualitative impairment indicators of potential triggering events.
•We evaluated the reasonableness of management’s forecasts of revenues and EBITDA through the fiscal year-end date by comparing the fourth quarter forecast to actuals.
/s/ Deloitte & Touche LLP
February 8, 2024
We have served as the Company's auditor since 2005.
54
DHI GROUP, INC.
CONSOLIDATED BALANCE SHEETS
As of December 31, 2023 and 2022 (in thousands, except per share data)
| December 31, 2023 | December 31, 2022 | ||||||||||
| ASSETS | |||||||||||
| Current assets | |||||||||||
| Cash | $ | $ | |||||||||
Accounts receivable, net of allowance for doubtful accounts of $ | |||||||||||
| Income taxes receivable | |||||||||||
| Prepaid and other current assets | |||||||||||
| Total current assets | |||||||||||
| Fixed assets, net | |||||||||||
| Capitalized contract costs | |||||||||||
| Operating lease right-of-use assets | |||||||||||
| Investments | |||||||||||
| Acquired intangible assets | |||||||||||
| Goodwill | |||||||||||
| Other assets | |||||||||||
| Total assets | $ | $ | |||||||||
| LIABILITIES AND STOCKHOLDERS’ EQUITY | |||||||||||
| Current liabilities | |||||||||||
| Accounts payable and accrued expenses | $ | $ | |||||||||
| Deferred revenue | |||||||||||
| Income taxes payable | |||||||||||
| Operating lease liabilities | |||||||||||
| Total current liabilities | |||||||||||
| Deferred revenue | |||||||||||
| Operating lease liabilities | |||||||||||
| Long-term debt, net | |||||||||||
| Deferred income taxes | |||||||||||
| Accrual for unrecognized tax benefits | |||||||||||
| Other long-term liabilities | |||||||||||
| Total liabilities | |||||||||||
| Commitments and contingencies (Note 12) | |||||||||||
| Stockholders’ equity | |||||||||||
Convertible preferred stock, | |||||||||||
Common stock, | |||||||||||
| Additional paid-in capital | |||||||||||
| Accumulated other comprehensive loss | ( | ( | |||||||||
| Accumulated earnings | |||||||||||
Treasury stock, | ( | ( | |||||||||
| Total stockholders’ equity | |||||||||||
| Total liabilities and stockholders’ equity | $ | $ | |||||||||
| See accompanying notes to consolidated financial statements. | |||||||||||
55
DHI GROUP, INC.
CONSOLIDATED STATEMENTS OF OPERATIONS
For the years ended December 31, 2023, 2022 and 2021
(in thousands, except per share amounts)
| For the year ended December 31, | |||||||||||||||||
| 2023 | 2022 | 2021 | |||||||||||||||
| Revenues | $ | $ | $ | ||||||||||||||
| Operating expenses: | |||||||||||||||||
| Cost of revenues | |||||||||||||||||
| Product development | |||||||||||||||||
| Sales and marketing | |||||||||||||||||
| General and administrative | |||||||||||||||||
| Depreciation | |||||||||||||||||
| Impairment of right-of-use asset | |||||||||||||||||
| Restructuring | |||||||||||||||||
| Total operating expenses | |||||||||||||||||
| Other operating income: | |||||||||||||||||
| Proceeds from settlement | |||||||||||||||||
| Operating income (loss) | ( | ||||||||||||||||
| Income from equity method investment | |||||||||||||||||
| Gain on investments | |||||||||||||||||
| Impairment of investment | ( | ( | |||||||||||||||
| Interest expense and other | ( | ( | ( | ||||||||||||||
| Income (loss) before income taxes | ( | ||||||||||||||||
| Income tax expense (benefit) | ( | ( | |||||||||||||||
| Income (loss) from continuing operations | ( | ||||||||||||||||
| Loss from discontinued operations, net of tax | ( | ||||||||||||||||
| Net income (loss) | $ | $ | $ | ( | |||||||||||||
| Basic earnings (loss) per share - continuing operations | $ | $ | $ | ( | |||||||||||||
| Diluted earnings (loss) per share - continuing operations | $ | $ | $ | ( | |||||||||||||
| Basic earnings (loss) per share - discontinued operations | $ | $ | $ | ( | |||||||||||||
| Diluted earnings (loss) per share - discontinued operations | $ | $ | $ | ( | |||||||||||||
| Basic earnings (loss) per share | $ | $ | $ | ( | |||||||||||||
| Diluted earnings (loss) per share | $ | $ | $ | ( | |||||||||||||
| Weighted-average basic shares outstanding | |||||||||||||||||
| Weighted-average diluted shares outstanding | |||||||||||||||||
| See accompanying notes to consolidated financial statements. | |||||||||||||||||
56
DHI GROUP, INC.
CONSOLIDATED STATEMENTS OF COMPREHENSIVE INCOME (LOSS)
For the years ended December 31, 2023, 2022 and 2021
(in thousands)
| For the year ended December 31, | |||||||||||||||||
| 2023 | 2022 | 2021 | |||||||||||||||
| Net income (loss) | $ | $ | $ | ( | |||||||||||||
| Other comprehensive income (loss): | |||||||||||||||||
| Foreign currency translation adjustment | ( | ||||||||||||||||
| Cumulative translation adjustments reclassified to the Statements of Operations | |||||||||||||||||
| Total other comprehensive income (loss) | ( | ||||||||||||||||
| Comprehensive income (loss) | $ | $ | $ | ( | |||||||||||||
See accompanying notes to consolidated financial statements.
57
DHI GROUP, INC.
CONSOLIDATED STATEMENTS OF STOCKHOLDERS’ EQUITY
For the years ended December 31, 2023, 2022, and 2021 (in thousands)
| Convertible Preferred Stock | Common Stock | Additional Paid-in Capital | Treasury Stock | Accumulated Earnings | Accumulated Other Comprehensive Loss | Total | |||||||||||||||||||||||||||||||||||||||||||||||||||||
| Shares Issued | Amount | Shares Issued | Amount | Shares | Amount | ||||||||||||||||||||||||||||||||||||||||||||||||||||||
| Balance at January 1, 2021 | — | $ | — | $ | $ | $ | ( | $ | $ | ( | $ | ||||||||||||||||||||||||||||||||||||||||||||||||
| Net loss | ( | ( | |||||||||||||||||||||||||||||||||||||||||||||||||||||||||
| Other comprehensive income | |||||||||||||||||||||||||||||||||||||||||||||||||||||||||||
| Cumulative translation adjustments reclassified to the Statements of Operations | |||||||||||||||||||||||||||||||||||||||||||||||||||||||||||
| Stock based compensation | |||||||||||||||||||||||||||||||||||||||||||||||||||||||||||
| Restricted stock issued | ( | ||||||||||||||||||||||||||||||||||||||||||||||||||||||||||
| Performance-based restricted stock unites eligible to vest | |||||||||||||||||||||||||||||||||||||||||||||||||||||||||||
| Restricted stock forfeited or withheld to satisfy tax obligations | ( | ( | ( | ( | |||||||||||||||||||||||||||||||||||||||||||||||||||||||
| Performance based restricted stock forfeited or withheld to satisfy tax obligations | ( | ( | ( | ||||||||||||||||||||||||||||||||||||||||||||||||||||||||
| Purchase of treasury stock under stock repurchase plan | ( | ( | |||||||||||||||||||||||||||||||||||||||||||||||||||||||||
| Balance at December 31, 2021 | — | — | ( | ( | |||||||||||||||||||||||||||||||||||||||||||||||||||||||
| Net income | |||||||||||||||||||||||||||||||||||||||||||||||||||||||||||
| Other comprehensive loss | ( | ( | |||||||||||||||||||||||||||||||||||||||||||||||||||||||||
| Stock based compensation | |||||||||||||||||||||||||||||||||||||||||||||||||||||||||||
| Restricted stock issued | ( | ||||||||||||||||||||||||||||||||||||||||||||||||||||||||||
| Performance-based restricted stock units eligible to vest | ( | ||||||||||||||||||||||||||||||||||||||||||||||||||||||||||
| Restricted stock forfeited or withheld to satisfy tax obligations | ( | ( | ( | ( | |||||||||||||||||||||||||||||||||||||||||||||||||||||||
| Performance based restricted stock forfeited or withheld to satisfy tax obligations | ( | ( | ( | ( | |||||||||||||||||||||||||||||||||||||||||||||||||||||||
| Issuance of common stock upon ESPP purchase | |||||||||||||||||||||||||||||||||||||||||||||||||||||||||||
| Purchase of treasury stock under stock repurchase plan | ( | ( | |||||||||||||||||||||||||||||||||||||||||||||||||||||||||
| Balance at December 31, 2022 | — | — | ( | ( | |||||||||||||||||||||||||||||||||||||||||||||||||||||||
| Net income | |||||||||||||||||||||||||||||||||||||||||||||||||||||||||||
| Other comprehensive income | |||||||||||||||||||||||||||||||||||||||||||||||||||||||||||
| Cumulative translation adjustments reclassified to the Statements of Operations | |||||||||||||||||||||||||||||||||||||||||||||||||||||||||||
| Stock based compensation | |||||||||||||||||||||||||||||||||||||||||||||||||||||||||||
| Restricted stock issued | ( | ||||||||||||||||||||||||||||||||||||||||||||||||||||||||||
| Performance-based restricted stock units eligible to vest | ( | ||||||||||||||||||||||||||||||||||||||||||||||||||||||||||
| Restricted stock forfeited or withheld to satisfy tax obligations | ( | ( | ( | ( | |||||||||||||||||||||||||||||||||||||||||||||||||||||||
| Performance based restricted stock forfeited or withheld to satisfy tax obligations | ( | ( | ( | ( | |||||||||||||||||||||||||||||||||||||||||||||||||||||||
| Issuance of common stock upon ESPP purchase | |||||||||||||||||||||||||||||||||||||||||||||||||||||||||||
| Cumulative-effect of new accounting principle (See Note 2) | |||||||||||||||||||||||||||||||||||||||||||||||||||||||||||
| Purchase of treasury stock under stock repurchase plan | ( | ( | |||||||||||||||||||||||||||||||||||||||||||||||||||||||||
| Balance at December 31, 2023 | — | $ | — | $ | $ | $ | ( | $ | $ | ( | $ | ||||||||||||||||||||||||||||||||||||||||||||||||
See accompanying notes to consolidated financial statements.
58
DHI GROUP, INC.
CONSOLIDATED STATEMENTS OF CASH FLOWS
For the years ended December 31, 2023, 2022 and 2021
(in thousands)
| For the year ended December 31, | |||||||||||||||||
| 2023 | 2022 | 2021 | |||||||||||||||
| Cash flows from (used in) operating activities: | |||||||||||||||||
| Net income (loss) | $ | $ | $ | ( | |||||||||||||
| Adjustments to reconcile net income to net cash flows from (used in) operating activities: | |||||||||||||||||
| Depreciation | |||||||||||||||||
| Deferred income taxes | ( | ( | ( | ||||||||||||||
| Amortization of deferred financing costs | |||||||||||||||||
| Stock based compensation | |||||||||||||||||
| Income from equity method investment | ( | ( | ( | ||||||||||||||
| Gain on investments | ( | ( | ( | ||||||||||||||
| Impairment of investment | |||||||||||||||||
| Impairment of right-of-use asset | |||||||||||||||||
| Change in accrual for unrecognized tax benefits | ( | ( | |||||||||||||||
| Loss on disposition of discontinued operations | |||||||||||||||||
| Changes in operating assets and liabilities: | |||||||||||||||||
| Accounts receivable | ( | ( | ( | ||||||||||||||
| Prepaid expenses and other assets | ( | ( | ( | ||||||||||||||
| Capitalized contract costs | ( | ( | |||||||||||||||
| Accounts payable and accrued expenses | ( | ( | |||||||||||||||
| Income taxes receivable/payable | ( | ||||||||||||||||
| Deferred revenue | ( | ||||||||||||||||
| Other, net | ( | ( | |||||||||||||||
| Net cash flows from operating activities | |||||||||||||||||
| Cash flows from (used in) investing activities: | |||||||||||||||||
| Cash transferred with discontinued operations | ( | ||||||||||||||||
| Cash paid for investment | ( | ||||||||||||||||
| Cash received from sale of investments | |||||||||||||||||
| Purchases of fixed assets | ( | ( | ( | ||||||||||||||
| Net cash flows used in investing activities | ( | ( | ( | ||||||||||||||
| Cash flows from (used in) financing activities: | |||||||||||||||||
| Payments on long-term debt | ( | ( | ( | ||||||||||||||
| Proceeds from long-term debt | |||||||||||||||||
| Financing costs paid | ( | ||||||||||||||||
| Payments under stock repurchase plan | ( | ( | ( | ||||||||||||||
| Purchase of treasury stock related to vested restricted and performance stock units | ( | ( | ( | ||||||||||||||
| Proceeds from issuance of common stock through ESPP | |||||||||||||||||
| Net cash flows used in financing activities | ( | ( | ( | ||||||||||||||
| Effect of exchange rate changes | |||||||||||||||||
| Net change in cash for the period | ( | ||||||||||||||||
| Cash, beginning of period | |||||||||||||||||
| Cash, end of period | $ | $ | $ | ||||||||||||||
See accompanying notes to consolidated financial statements.
59
1. ORGANIZATION AND PRINCIPAL ACTIVITIES
DHI Group, Inc. (“DHI,” the “Company,” “we,” “us” or “our”), a Delaware corporation, was incorporated on June 28, 2005. DHI is a leading provider of data, insights and employment connections through its specialized services for technology professionals and other select online communities. Its mission is to empower tech professionals and organizations to compete and win through expert insights and relevant employment connections. Employers and recruiters use its websites and services to source, hire and connect with the most qualified and highly-skilled tech professionals, while professionals use our websites and services to find ideal employment opportunities, relevant job advice and tailored career-related data. For over 30 years, through its predecessor companies, the Company was built on providing employers and professionals with career connections, news, tools and information.
On June 30, 2021, the Company transferred majority ownership and control of its eFinancialCareers ("eFC") business to eFC's management, while retaining a 40 % common share interest, which was reduced to 10 % in the third quarter of 2023. The eFC business was significant to the Company and the transfer was considered to be a strategic shift from the financial services industry and from the geographies eFC serves that had a major effect on the Company's operations. As a result, the eFC business was deconsolidated from the Company's consolidated financial statements as of June 30, 2021 and is reflected as a discontinued operation in the Consolidated Statements of Operations for the year ended December 31, 2021. For further information on discontinued operations, see Note 4, “Discontinued Operations.” Unless noted otherwise, discussion in the notes to the consolidated financial statements pertain to continuing operations.
The Company allocates resources and assesses financial performance on a consolidated basis, as all services pertain to the Company's Tech-focused strategy. As a result, the Company has a single reportable segment, Tech-focused, which now includes only the Dice and ClearanceJobs brands, as well as corporate related costs. All operations are in the United States and the Company no longer has revenues and long-lived assets, which includes fixed assets and lease right of use assets, outside of the United States.
2. SIGNIFICANT ACCOUNTING POLICIES
Principles of Consolidation — The consolidated financial statements include the accounts of DHI and its wholly-owned subsidiaries. All intercompany balances and transactions have been eliminated in consolidation. Investments in companies that are not consolidated are included in the Company's consolidated financial statements as described in Notes 4 and 7 of the notes to consolidated financial statements.
Revenue Recognition — We recognize revenue when control of the promised goods or services is transferred to our customers at an amount that reflects the consideration to which we expect to receive in exchange for those goods or services. Revenue is recognized net of customer discounts ratably over the service period. Billings with customers are based on contractual schedules. Customer billings delivered in advance and payments received in advance of services being rendered are recorded as deferred revenue and recognized over the service period. We generate revenues from the following sources:
Recruitment packages. Recruitment package revenues are derived from the sale of a subscription to recruiters and employers that includes a combination of job postings and/or access to candidate profiles on Dice and ClearanceJobs. Certain of the Company’s arrangements include multiple performance obligations, which primarily consists of the ability to post jobs and access to candidate profiles. The Company determines the units of accounting for multiple performance obligations in accordance with Topic 606. Specifically, the Company considers a performance obligation as a separate unit of accounting if it has value to the customer on a standalone basis. The Company’s arrangements do not include a general right of return. Services to customers buying a package of available job postings and access to candidate profiles are delivered over the same period and revenue is recognized ratably over the length of the underlying contract, typically from one to twelve months. The separation of the package into two deliverables results in no change in revenue recognition because delivery of the two services occurs over the same time period.
Advertising revenue. Advertising revenue is recognized over the period in which the advertisements are displayed on the websites or at the time a promotional e-mail is sent out to the audience.
60
Classified revenue. Classified job posting revenues are derived from the sale of job postings to recruiters and employers. A job posting is the ability to list a job on the website for a specified time period. Revenue from the sale of classified job postings is recognized ratably over the length of the contract or the period of actual usage.
Career fair and recruitment event booth rentals. Career fair and recruitment event revenues, both live and virtual, are derived from renting booth space to recruiters and employers. Revenue from these sales are recognized when the career fair or recruitment event is held.
Cash—Cash consists of demand deposits with financial institutions.
Concentration of Credit Risk—Cash is maintained with several financial institutions. Cash potentially subjects the Company to a concentration of credit risk as substantially all of its deposits held in financial institutions were in excess of the Federal Deposit Insurance Corporation (“FDIC”) insurance limits as of December 31, 2023 and 2022.
The Company performs credit evaluations of its customers’ financial condition as needed and does not require collateral on accounts receivable. No single customer represents 10% or more of accounts receivable as of December 31, 2023 and 2022 and no single customer represents 10% or more of revenues for the years ended December 31, 2023, 2022 and 2021.
Allowance for Doubtful Accounts—The Company maintains allowances for doubtful accounts for estimated losses resulting from the inability of its customers to make required payments. If the financial condition of DHI’s customers were to deteriorate, resulting in an impairment of their ability to make payments, additional allowances may be required.
Statements of Cash Flows—All bank deposits are considered cash.
The supplemental disclosures to the accompanying consolidated statements of cash flows are as follows (in thousands):
| 2023 | 2022 | 2021 | |||||||||||||||
| Supplemental cash flow information: | |||||||||||||||||
| Interest paid | $ | $ | $ | ||||||||||||||
| Taxes paid | |||||||||||||||||
| Non-cash investing and financing activities: | |||||||||||||||||
| Capital expenditures on fixed assets included in accounts payable and accrued expenses | |||||||||||||||||
Fixed Assets—Depreciation of equipment, furniture and fixtures, computer software and capitalized website development costs are provided under the straight-line method over estimated useful lives ranging from to five years . Depreciation of leasehold improvements is provided over the shorter of the term of the related lease or the estimated useful life of the improvement. The cost of additions and improvements is capitalized, and repairs and maintenance costs are charged to operations in the periods incurred.
Capitalized Software Costs—Capitalized software costs consist of costs to purchase and develop software for internal use. The Company capitalizes incurred software development costs in accordance with the Internal Use Software subtopic of the FASB ASC. Costs incurred during the application-development stage for software bought and further customized by outside vendors for the Company’s use and software developed by a vendor for the Company’s proprietary use have been capitalized. These costs are amortized over the software’s estimated useful life, which generally approximates two years .
Website Development Costs—The Company capitalizes certain costs incurred in designing, developing, testing and implementing enhancements to its websites. These costs are amortized over the enhancement’s estimated useful life, which generally approximates two years . Costs related to the planning and post implementation phases of website development efforts are expensed as incurred.
61
Capitalized Contract Costs—The Company capitalizes certain contract acquisition costs consisting primarily of commissions paid when contracts are signed. For costs incurred to obtain new business sales contracts, the Company capitalizes and expenses these costs over an average customer life, which was approximately three years as of December 31, 2023. For the remaining sales contracts, the Company capitalizes and expenses these costs over a weighted average contract term, which was approximately one year as of December 31, 2023. See Note 5 for additional disclosures.
Leases—We determine if an arrangement is a lease at inception. The Company primarily has operating leases for corporate office space and certain equipment. Operating lease assets represent our right to use an underlying asset for the lease term and lease liabilities represent our obligation to make lease payments arising from the lease. Operating lease assets and liabilities are recognized at the commencement date of the lease based on the present value of lease payments over the lease term. The initial measurement of the lease liability is calculated on the basis of the present value of the remaining lease payments, and the right-of-use asset is measured on the basis of this liability, adjusted by prepaid and accrued rent, lease incentives, and initial direct costs. When readily available, the Company uses the implicit rate in determining the present value of the lease payments. When leases do not provide an implicit rate, the Company uses its incremental borrowing rate based on information available at the commencement of the lease, including the lease term. Because the implicit rate in each lease is not available, the Company used its incremental borrowing rate to determine the present value of lease payments. Leases with an initial term of 12 months or less are not recorded on the balance sheet. Variable components of the lease payments, such as utilities and maintenance, are expensed as incurred and are not included in determining the present value. Operating lease expense is recognized on a straight-
line basis over the lease term.
Equity Method Investments—The Company has a 40 % non-controlling common share interest in the eFC (adjusted to 10 % as of the third quarter of 2023) and Rigzone (adjusted to zero percent as of the second quarter of 2022) businesses as the Company does not have the ability to direct the activities of the businesses that most significantly impact their economic performance. The common share interests in eFC and Rigzone, during the periods of ownership, are being accounted for under the equity method of accounting as the Company does have the ability to exercise significant influence over the businesses. The recorded value is adjusted based on the Company's proportionate share of the businesses net income and is recorded three months in arrears. See Note 7 for additional disclosures.
Foreign Currency Translation—For the Company’s foreign operations, which entirely related to eFC prior to June 30, 2021, whose functional currency is not the U.S. dollar, the assets and liabilities are translated into U.S. dollars at current exchange rates. Resulting translation adjustments are reflected as Other Comprehensive Income (Loss). Revenue and expenses are translated at average exchange rates for the period. Transaction gains and losses that arise from exchange rate fluctuations on transactions denominated in a currency other than the functional currency are charged to operations as incurred. Translation adjustments subsequent to June 30, 2021 relate to the Company's equity method investment in eFC.
Advertising Costs—The Company expenses advertising costs as they are incurred. Advertising expense for the years ended December 31, 2023, 2022 and 2021 were $14.9 million, $17.9 million and $12.5 million, respectively.
Income Taxes—The Company recognizes deferred taxes by the asset and liability method. Under this method, deferred income taxes are recognized for differences between the financial statement and tax bases of assets and liabilities at enacted statutory tax rates in effect for the years in which the differences are expected to reverse. Valuation allowances are established when necessary to reduce deferred tax assets to the amounts expected to be realized. The primary sources of temporary differences are stock-based compensation, amortization and impairment of intangible assets, depreciation of fixed assets, operating lease assets and liabilities, and capitalized contract costs.
62
Stock-Based Compensation—The Company has a plan to grant equity awards to certain employees and directors of the Company and its subsidiaries. In accordance with FASB ASC Topic 718 Compensation-Stock Compensation, the Company accounts for forfeitures when they occur. See Note 15 for additional disclosures.
Fair Value of Financial Instruments—The carrying amounts reported in the consolidated balance sheets for cash, accounts receivable, and accounts payable and accrued expenses approximate their fair values. The Company’s long-term debt consists of borrowings under its credit facility. Investments consist of common and preferred share ownership interests in businesses. See Notes 3 and 11 for additional disclosures.
Risks and Uncertainties—The Company is subject to the risks, expenses and uncertainties frequently encountered by companies in the rapidly evolving markets for online products and services. These risks include the failure to develop and extend the Company’s web sites and brands, the rejection of the Company’s services by consumers, vendors and/or advertisers, the inability of the Company to maintain and increase the levels of traffic on its web sites, as well as other risks and uncertainties. In the event that the Company does not successfully execute its business plan, certain assets may not be recoverable.
Use of Estimates—The preparation of financial statements in conformity with accounting principles generally accepted in the United States of America requires management to make estimates and assumptions that affect the reported amounts of assets and liabilities, disclosure of contingent assets and liabilities as of the date of the financial statements, and reported amounts of revenues and expenses during the reporting period. Actual results could differ from these estimates. DHI’s significant estimates include the useful lives and valuation of fixed assets and intangible assets, goodwill, lease right-of-use assets, income taxes, and
the assumptions used to value the Performance-Based Restricted Stock Units (“PSUs”) of the Company.
Earnings per Share—The Company follows the Earnings Per Share topic of the FASB ASC in computing earnings per share (“EPS”). Basic EPS is calculated by dividing income from continuing operations, income from discontinued operations, and net income by the weighted average number of shares outstanding. When the effects are dilutive, diluted earnings per share is calculated using the weighted average number of shares outstanding, and the dilutive effect of stock-based compensation awards as determined under the treasury stock method. Certain stock awards were excluded from the computation of diluted earnings per share due to their anti-dilutive effect. See Note 18 for additional disclosures.
New Accounting Pronouncements— In June 2016, the FASB issued ASU No. 2016-13, Financial Instruments - Credit Losses (Topic 326): Measurement of Credit Losses on Financial Instruments. ASU 2016-13 changes how entities will account for credit losses for most financial assets and certain other instruments that are not measured at fair value through net income. The guidance replaces the current "incurred loss" model with an "expected loss" model that requires consideration of a broader range of information to estimate expected credit losses over the lifetime of a financial asset. The Company adopted ASU 2016-13 on January 1, 2023, under the modified retrospective method as required by the standard. The Company recorded a cumulative-effect adjustment of $0.3 million to increase accumulated earnings and reduce the allowance for doubtful accounts as of January 1, 2023. Prior period amounts were not adjusted and will continue to be reported under the accounting standards in effect for the period presented.
In November 2023, the FASB issued ASU 2023-07, Segment Reporting - Improvements to Reportable Segment Disclosures. The new accounting standard relates to disclosures about a public entity’s reportable segments and provides more detailed information about a reportable segment’s expenses. The new standard is effective for fiscal years beginning after December 15, 2023, and interim periods beginning after December 15, 2024, with retrospective application required. We are evaluating the effect of the standard on our consolidated financial statement disclosures.
3. FAIR VALUE MEASUREMENTS
The FASB ASC topic on Fair Value Measurements and Disclosures defines fair value, establishes a framework for measuring fair value and requires certain disclosures for each major asset and liability category measured at fair value on either a recurring or nonrecurring basis. As a basis for considering assumptions, a three-tier fair value hierarchy is used, which prioritizes the inputs used in measuring fair value as follows:
63
•Level 1 – Quoted prices for identical instruments in active markets.
•Level 2 – Quoted prices for similar instruments in active markets, quoted prices for identical or similar instruments in markets that are not active and model-derived valuations, in which all significant inputs are observable in active markets.
•Level 3 – Unobservable inputs in which there is little or no market data, which require the reporting entity to develop its own assumptions.
The carrying amounts reported in the consolidated balance sheets for cash, accounts receivable, other assets, accounts payable and accrued expenses and long-term debt approximate their fair values. Investments, non-current that were carried at fair value, prior to the conversion to preferred shares as described in Note 7, used a discounted cash flow technique based on the probability of one or more possible outcomes, based on Level 3 inputs, which inputs and fair value did not change during the 2022 period prior to the conversion. The estimated fair value of long-term debt is based on Level 2 inputs.
Certain assets and liabilities are measured at fair value on a non-recurring basis as they are subject to fair value adjustments in certain circumstances, for example, when there is evidence of impairment. Such instruments are not measured at fair value on an ongoing basis. These assets include equity investments, operating lease right-of-use assets, and goodwill and intangible assets which resulted from prior acquisitions. Items valued using such internally generated valuation techniques are classified according to the lowest level input or value driver that is significant to the valuation. Thus, an item may be classified in Level 3 even though there may be some significant inputs that are readily observable.
On June 30, 2021, the Company transferred majority ownership and control of its eFC business to eFC's management, while retaining a 40 % common share interest. On June 30, 2021, the Company valued its 40 % interest in eFC utilizing a combination of a discounted cash flow and a market approach. The discounted cash flow included declining revenues for the years ending December 31, 2021 and 2022 as compared to the year ended December 31, 2020 and then increasing moderately. The discounted cash flow also included operating margin declines for the year ending December 31, 2022 compared to the year ending December 31, 2021 and then increasing moderately. The Company utilized a discount rate of 19 %. The market approach included the analysis of data from transactions on guideline companies and applied multiples of those transactions to eFC's results. During the third quarter of 2023, the Company sold a portion of its ownership in eFC reducing its total interest in eFC from 40 % to 10 %.
4. DISCONTINUED OPERATIONS
As further described in Notes 1 and 7, on June 30, 2021, the Company transferred majority ownership and control of its eFC business to eFC's management, while retaining a 40 % common share interest. As a result, we have reflected eFC's financial results as discontinued operations in the consolidated statements of operations for the year ended December 31, 2021.
The results of discontinued operations on the consolidated statements of operations were as follows for the year ended December 31, 2021 (in thousands):
64
| Revenues | $ | ||||
| Operating expenses | ( | ||||
| Operating income | |||||
Loss on disposition of discontinued operations(1) | ( | ||||
| Other income | |||||
| Loss before income taxes | ( | ||||
| Income tax expense | |||||
| Net loss | $ | ( | |||
(1) The loss was comprised of $ | |||||
Depreciation, fixed asset purchases and other significant non-cash items related to discontinued operations were as follows (in thousands):
| 2021 | |||||
| Depreciation | $ | ||||
| Purchases of fixed assets | $ | ||||
| Cash paid for amounts included in measurement of lease liabilities: | |||||
| Operating cash flows from operating leases | $ | ||||
5. REVENUE RECOGNITION
The Company recognizes revenue when control of the promised goods or services is transferred to our customers at an amount that reflects the consideration to which we expect to receive in exchange for those goods or services. Revenue is recognized net of customer discounts. We recognize revenue when control of the goods or services are transferred to the customer either on a ratable basis over the contract period beginning on the date that our service is made available to the customer or as the products and services are used. The Company excludes sales tax from the transaction price and therefore, recognizes revenue net of applicable sales taxes. Customer billings delivered in advance of services being rendered are recorded as deferred revenue and recognized over the service period. The Company generates revenue from recruitment packages, advertising, classifieds, and virtual and live career fair and recruitment event booth rentals.
Disaggregation of revenue
Our brands primarily serve the technology and security cleared professions. The following table provides information about disaggregated revenue by brand (in thousands):
| For the Year Ended December 31, | |||||||||||||||||
| 2023 | 2022 | 2021 | |||||||||||||||
Dice (1) | $ | $ | $ | ||||||||||||||
| ClearanceJobs | |||||||||||||||||
| Total | $ | $ | $ | ||||||||||||||
| (1) Includes Dice and Career Events. | |||||||||||||||||
65
Contract Balances
The following table provides information about opening and closing balances of receivables and contract liabilities from contracts with customers as required under Topic 606 (in thousands):
| As of December 31, 2023 | As of December 31, 2022 | As of December 31, 2021 | |||||||||||||||
| Receivables | $ | $ | $ | ||||||||||||||
| Short-term contract liabilities (deferred revenue) | |||||||||||||||||
| Long-term contract liabilities (deferred revenue) | |||||||||||||||||
We receive payments from customers based upon contractual billing schedules; accounts receivable is recorded when customers are invoiced per the contractual billing schedules. As the Company's standard payment terms are less than one year, the Company elected the expedient, where applicable. As a result, the Company did not consider the effects of a significant financing component. Contract liabilities include customer billings delivered in advance of performance under the contract, and associated revenue is realized when services are rendered under the contract.
Receivables increase due to customer billings and decrease by cash collected from customers. Contract liabilities increase due to customer billings and are decreased as performance obligations are satisfied under the contracts.
The Company recognized the following revenues as a result of changes in the contract liability balances in the respective periods (in thousands):
| Year Ended December 31, 2023 | Year Ended December 31, 2022 | Year Ended December 31, 2021 | |||||||||||||||
| Revenue recognized in the period from: | |||||||||||||||||
| Amounts included in the contract liability at the beginning of the period | $ | $ | $ | ||||||||||||||
Transaction price allocated to the remaining performance obligations
Under the guidance of Topic 606, the following table includes estimated deferred revenue expected to be recognized in the future related to performance obligations that are unsatisfied or partially unsatisfied at the end of the reporting period (in thousands):
| 2024 | 2025 | 2026 | Total | ||||||||||||||||||||
| Tech-focused | $ | $ | $ | $ | |||||||||||||||||||
6. LEASES
The Company has operating leases for corporate office space and certain equipment. The leases have terms from one year to ten years , some of which include options to renew the lease, and are included in the lease term when it is reasonably certain that the Company will exercise the option. Our recorded lease right-of-use asset and lease liability were each reduced $2.1 million as of December 31, 2022, which represents a tenant improvement allowance that was consumed in 2023.
The components of lease cost were as follows (in thousands):
| Year Ended December 31, 2023 | Year Ended December 31, 2022 | Year Ended December 31, 2021 | |||||||||||||||
Operating lease cost1 | $ | $ | $ | ||||||||||||||
| Sublease income | ( | ( | ( | ||||||||||||||
Total lease cost2 | $ | $ | $ | ||||||||||||||
| (1) Includes short-term and variable lease costs, which are immaterial. | |||||||||||||||||
| (2) Total lease costs is recorded in general and administrative expenses in the consolidated statements of operations. | |||||||||||||||||
66
Supplemental cash flow information related to leases was as follows (in thousands):
| Year Ended December 31, 2023 | Year Ended December 31, 2022 | Year Ended December 31, 2021 | |||||||||||||||
| Cash paid for amounts included in measurement of lease liabilities: | |||||||||||||||||
Operating cash flows from operating leases | $ | $ | $ | ||||||||||||||
| Right-of-use assets obtained in exchange for lease obligations: | |||||||||||||||||
Operating leases1 | $ | $ | $ | ||||||||||||||
(1) During the year ended December 31, 2022, our right-of-use asset obtained in exchanged for lease obligations was reduced by $ | |||||||||||||||||
Supplemental balance sheet information related to leases was as follows (in thousands, except lease term and discount rate):
| December 31, 2023 | December 31, 2022 | ||||||||||
Operating lease right-of-use assets (as reported)1 | $ | $ | |||||||||
| Operating lease liabilities - current | $ | $ | |||||||||
Less: tenant improvement allowance1 | ( | ||||||||||
| Operating lease liabilities - current (as reported) | |||||||||||
| Operating lease liabilities - non-current (as reported) | |||||||||||
Total operating lease liabilities | $ | $ | |||||||||
| Weighted Average Remaining Lease Terms (in years) | |||||||||||
| Operating leases | |||||||||||
| Weighted Average Discount Rate | |||||||||||
| Operating leases | % | % | |||||||||
(1) At December 31, 2022, our right-of-use asset includes a reduction of $ | |||||||||||
The Company reviews its right-of-use ("ROU") assets for impairment if indicators of impairment exist. The impairment review process compares the fair value of the ROU asset to its carrying value. If the carrying value exceeds the fair value, an impairment loss is recorded. During the year ended December 31, 2021, due to the continuing impacts of COVID-19 on the real estate markets and its impact on the future cash flows attributable to its ROU assets, the Company recorded an impairment charge of $1.9 million. No
67
As of December 31, 2023, future operating lease payments were as follows (in thousands):
| Operating Leases | |||||
| 2024 | $ | ||||
| 2025 | |||||
| 2026 | |||||
| 2027 | |||||
| 2028 | |||||
| Thereafter | |||||
Total lease payments | |||||
| Less: imputed interest | ( | ||||
| Less: tenant improvement allowance | |||||
Total | $ | ||||
7. INVESTMENTS
Investments, Current, at Fair Value
Through its predecessor companies, the Company owned a minority interest representing less than 1% of the common stock of a technology company that completed an initial public offering ("IPO") and became publicly traded during the first quarter of 2021. Prior to the IPO, the Company had elected the measurement alternative in accordance with FASB ASC 321, Investments – Equity Securities. As of December 31, 2020, it was not practicable to estimate the fair value of its interest because there were no observable transactions for the investment. Accordingly, the investment was carried at its original cost, less impairments, which resulted in a carrying value of zero as of December 31, 2020. The investment was accounted for as an equity security, with realized and unrealized gains and losses included in earnings. During the third quarter of 2021, the investment was sold for $1.2 million. A realized gain of $1.2 million has been recorded for the year ended December 31, 2021.
Investments, Non-current, at Fair Value
During the third quarter of 2021, the Company invested $3.0 million through a subordinated convertible promissory note (the "Note") of $3.0 million with a values-based career destination company that allows the next generation workforce to search for jobs at companies whose people, perks and values align with their unique professional needs. The Note earned interest at 6.00 % and matured at the earlier of a Qualified Financing, as described in the Note, or settled in cash on or after August 20, 2022, at the option of the Company. Upon a Qualified Financing, the Company will convert its investment into shares of preferred stock at 80 % of the per share value in the Qualified Financing. The investment was recorded as a trading security at fair value with realized and unrealized gains and losses included in earnings. The Note was recorded at $3.0 million as of December 31, 2021.
In the third quarter of 2022, a Qualified Financing occurred and the Note was converted into preferred shares representing 4.9 % of the outstanding equity in the underlying business, on a fully-diluted basis. The Company's preferred shares are substantially similar to shares purchased by a third party investor in the Qualified Financing that resulted in such investor becoming the majority owner of the business, holding 50.5 % of the outstanding equity in the business, on a fully-diluted basis. Therefore, the Company's shares in the business were recorded at fair value based on the price per share realized in the Qualified Financing. The value of the Company's investment was $0.7 million as of December 31, 2022 and is recorded as an investment in the consolidated balance sheet. Accordingly, the Company recognized an impairment loss during the year ended December 31, 2022 of $2.3 million. During the third quarter of 2023, the majority investor purchased additional shares of the business as was contemplated in, and at the same price as, in the Qualified Financing and additional equity based compensation was issued to the investment's management team. As a result, the majority investor's ownership was reduced to 44.8 % and the Company's ownership was reduced to 4.1 %, both on a fully-diluted basis, as of December 31, 2023.
68
During the third quarter of 2023, the investment's financial position deteriorated. To meet its financial obligations, the investment issued convertible debt (the "Convertible Debt") at a price that indicated the value of the investment had declined. As such, the Company revalued its investment to $0.4 million and accordingly, recognized an impairment loss of $0.3 million during the third quarter of 2023.
The Company has elected the measurement alternative in accordance with FASB ASC 321, Investments – Equity Securities. As of December 31, 2023, subsequent to the Qualified Financing, it was not practicable to estimate the fair value of its interest because there were no observable transactions for the investment. Accordingly, the investment was carried at the value realized in the Qualified Financing as of December 31, 2023, as described above.
Investments, Non-current
Rigzone is a website dedicated to delivering online content, data, and career services in the oil and gas industry in North America, Europe, the Middle East, and Asia Pacific. Oil and gas companies, as well as companies that serve the energy industry, use Rigzone to find talent for roles such as petroleum engineers, sales professionals with energy industry expertise and skilled tradesmen. On August 31, 2018, the Company transferred a majority ownership and control of the Rigzone business to Rigzone management, while retaining a 40 % common share interest, with zero proceeds received from the transfer. During the second quarter of 2022, the Company sold its 40 % interest in Rigzone to Rigzone management for $0.3 million. At the time of the sale, the recorded value of the investment was zero. Accordingly, the Company recorded a $0.3 million gain on sale, which was included in gain on investments on the consolidated statements of operations.
During the fourth quarter of 2022, the Company entered into a legal settlement with a former employee of Rigzone and received $2.1 million, net of certain legal costs and subject to other agreements. The settlement is recorded as proceeds from settlement in the consolidated statements of operations for the year ended December 31, 2022.
As further described in Notes 1 and 4, on June 30, 2021, the Company transferred majority ownership and control of its eFC business to eFC's management, while retaining a 40 % common share interest with zero proceeds received from the transfer. The Company incurred approximately $0.1 million in selling costs and recognized a $30.2 million loss on the transfer in the second quarter of 2021, which included a $28.1 million charge related to accumulated foreign currency loss that was previously a reduction to equity. During the third quarter of 2023, the Company sold a portion of its ownership in eFC reducing its total interest in eFC from 40 % to 10 %. As a result of the sale, the Company received cash of $4.9 million and recognized a $0.6 million gain, which included a $0.2 million charge related to accumulated foreign currency loss that was previously a reduction to equity.
eFC is a financial services careers website, operating websites in multiple markets in four languages mainly across the United Kingdom, Continental Europe, Asia, the Middle East and North America. Professionals from across many sectors of the financial services industry, including asset management, risk management, investment banking, and information technology, use eFC to advance their careers. The Company has evaluated its common share interest in the eFC business and has determined the investment meets the definition and criteria of a variable interest entity ("VIE"). The Company evaluated the VIE and determined that the Company does not have a controlling financial interest in the VIE, as the Company does not have the power to direct the activities of the VIE that most significantly impact the VIE's economic performance. The common share interest is being accounted for under the equity method of accounting as the Company has the ability to exercise significant influence over eFC. The investment was recorded at its fair value on June 30, 2021, the date of transfer, which was $3.6 million. The Company's equity in net assets of eFC as of June 30, 2021 was $2.2 million. The difference between the Company's recorded value and its equity in net assets of eFC is amortized against the recorded value of the investment in accordance with ASC 323 Investments - Equity Method and Joint Ventures. Accordingly, the Company recorded amortization of $0.1 million during the year ended December 31, 2023. The amortization was not material for the years ended December 31, 2022 and 2021. The recorded value is further adjusted based on the Company's proportionate share of eFC's net income and is recorded three months in arrears. During the years ended December 31, 2023, 2022 and 2021, the Company recorded $0.5 million, $1.6 million and $0.2 million, respectively, of income related to its proportionate share of eFC's net income, net of currency translation adjustments and amortization of the basis difference.
At December 31, 2023, the Company held preferred stock representing a 7.3 % interest in the fully diluted shares of a tech skills assessment company. The investment is recorded at zero as of December 31, 2023 and 2022. The Company recorded no gain or loss related to the investment during the years ended December 31, 2023, 2022, and 2021.
69
8. FIXED ASSETS, NET
Fixed assets, net consist of the following as of December 31, 2023 and 2022 (in thousands):
| 2023 | 2022 | ||||||||||
| Computer equipment and software | $ | $ | |||||||||
| Furniture and fixtures | |||||||||||
| Leasehold improvements | |||||||||||
| Capitalized development costs | |||||||||||
| Less: Accumulated depreciation and amortization | ( | ( | |||||||||
| Fixed assets, net | $ | $ | |||||||||
9. ACQUIRED INTANGIBLE ASSETS, NET
As of December 31, 2023 and 2022, the Company had an indefinite-lived acquired intangible asset of $23.8 million related to the Dice trademarks and brand name. Considering the recognition of the Dice brand, its long history, awareness in the talent acquisition and staffing services market, and the intended use, the remaining useful life of the Dice.com trademarks and brand name was determined to be indefinite. We determine whether the carrying value of recorded indefinite-lived acquired intangible assets is impaired on an annual basis or more frequently if indicators of potential impairment exist. The annual impairment test for the Dice trademarks and brand name is performed on October 1 of each year. The impairment review process compares the fair value of the indefinite-lived acquired intangible assets to its carrying value. If the carrying value exceeds the fair value, an impairment loss is recorded.
The impairment test performed as of October 1, 2023 resulted in the fair value of the Dice trademarks and brand name exceeding the carrying value by 51 %. The Company's operating results attributable to the Dice trademarks and brand name for the fourth quarter of 2023 and estimated future results as of December 31, 2023 approximate the projections used in the October 1, 2023 analysis. As a result, the Company believes it is not more likely than not that the fair value of the Dice trademarks and brand name is less than the carrying value as of December 31, 2023. Therefore, no quantitative impairment test was performed as of December 31, 2023. No
The Company’s ability to achieve the projections used in the October 1, 2023 analysis may be impacted by, among other things, competition in the technology recruiting market, challenges in developing and introducing new products and product enhancements to the market and the Company’s ability to attribute value delivered to customers. If future cash flows that are attributable to the Dice trademarks and brand name are not achieved, the Company could realize an impairment in a future period. In the October 1, 2023 analysis, the Company utilized a relief from royalty rate method to value the Dice trademarks and brand name using a royalty rate of 4.0 %, which is based on comparable industry licensing agreements and the profitability attributable to the Dice trademarks and brand name, and a discount rate of 13.1 %.
10. GOODWILL
As of December 31, 2023, the Company has goodwill of $128.1 million, which was all allocated to the Tech-focused reporting unit. There were no changes to goodwill during the years ended December 31, 2023, 2022, and 2021.
70
We determine whether the carrying value of recorded goodwill is impaired on an annual basis or more frequently if indicators of potential impairment exist. In testing goodwill for impairment, a qualitative assessment can be performed and if it is determined that the fair value of the reporting unit is more likely than not less than the carrying amount, the impairment review process compares the fair value of the reporting unit in which the goodwill resides to the carrying value of that reporting unit. If the fair value of the reporting unit is less than its carrying amount, an impairment charge is recorded for the amount the carrying value exceeds the fair value. Our annual impairment test for goodwill is performed on October 1 of each year.
The annual impairment test for the Tech-focused reporting unit performed as of October 1, 2023 resulted in the fair value of the reporting unit being substantially in excess of the carrying value. Results for the Tech-focused reporting unit for the fourth quarter of 2023 and estimated future results as of December 31, 2023 approximate the projections used in the October 1, 2023 analysis. As a result, the Company believes it is not more likely than not that the fair value of the reporting unit is less than the carrying value as of December 31, 2023. Therefore, no quantitative impairment test was performed as of December 31, 2023. No
The discount rate applied for the Tech-focused reporting unit in the October 1, 2023 analysis was 12.1 %. An increase to the discount rate applied or reductions to future projected operating results could result in future impairment of the Tech-focused reporting unit’s goodwill. It is reasonably possible that changes in judgments, assumptions and estimates the Company made in assessing the fair value of goodwill could cause the Company to consider some portion or all of the goodwill of the Tech-focused reporting unit to become impaired. In addition, a future decline in the overall market conditions, political instability, and/or changes in the Company’s market share could negatively impact the estimated future cash flows and discount rates used to determine the fair value of the reporting unit and could result in an impairment charge in the foreseeable future.
The determination of whether or not goodwill has become impaired is judgmental in nature and requires the use of estimates and key assumptions, particularly assumed discount rates and projections of future operating results, such as forecasted revenues and earnings before interest, taxes, depreciation and amortization margins and capital expenditure requirements. Fair values are determined by using a combination of a discounted cash flow methodology and a market comparable method. The discounted cash flow methodology is based on projections of the amounts and timing of future revenues and cash flows, assumed discount rates and other assumptions as deemed appropriate. We consider factors such as historical performance, anticipated market conditions, operating expense trends and capital expenditure requirements. Additionally, the discounted cash flows analysis takes into consideration cash expenditures for product development, other technological updates and advancements to our websites and investments to improve our candidate databases. The market comparable method indicates the fair value of a business by comparing it to publicly traded companies in similar lines of business or to comparable transactions or assets. Considerations for factors such as size, growth, profitability, risk and return on investment are analyzed and compared to the comparable businesses and adjustments are made. A market value of invested capital of the publicly traded companies is calculated and then applied to the entity’s operating results to arrive at an estimate of value. Changes in our strategy and/or market conditions could significantly impact these judgments and require adjustments to recorded amounts of goodwill.
11. INDEBTEDNESS
Credit Agreement—In June 2022, the Company, together with Dice Inc. (a wholly-owned subsidiary of the Company) and its wholly-owned subsidiary, Dice Career Solutions, Inc. (collectively, the “Borrowers”), entered into a Third Amended and Restated Credit Agreement (the “Credit Agreement”), which matures in June 2027 and replaces the Company's Old Credit Agreement (defined below). The Credit Agreement provides for a revolving loan facility of $100 million ($90 million under the Old Credit Agreement), with an expansion option of $50 million, bringing the total facility to $150 million, as permitted under the terms of the Credit Agreement. At the closing of the Credit Agreement, the Company borrowed $30 million to repay, in full, all outstanding indebtedness, including accrued interest, under the Old Credit Agreement. Unamortized debt issuance costs from the previous credit agreement of $0.2 million and debt issuance costs of $0.5 million related to the new agreement were recorded as other assets on the consolidated balance sheets and are recorded to interest expense over the term of the Credit Agreement.
Borrowings under the Credit Agreement denominated in U.S. dollars bear interest, payable at least quarterly, at the Company’s option, at the Secured Overnight Financing Rate ("SOFR") or a base rate plus a margin. Borrowings under the credit agreement denominated in pounds sterling, if any, bear interest at the Sterling Overnight Index Average ("SONIA") rate plus a margin. The margin ranges from 2.00 % to 2.75 % on SOFR and SONIA loans and 1.00 % to 1.75 % on base rate loans, determined by the Company’s most recent consolidated leverage ratio, plus an additional spread of 0.10 %. The Company incurs a commitment fee
71
ranging from 0.35 % to 0.50 % on any unused capacity under the revolving loan facility, determined by the Company’s most recent consolidated leverage ratio. There were no borrowings in pounds sterling as of December 31, 2023 and 2022. The facility may be prepaid at any time without penalty.
The Credit Agreement contains various affirmative and negative covenants and also contains certain financial covenants, including a consolidated leverage ratio and a consolidated interest coverage ratio. Borrowings are allowed under the Credit Agreement to the extent the consolidated leverage ratio is equal to or less than 2.50 to 1.00 , subject to the terms of the Credit Agreement. Negative covenants include restrictions on incurring certain liens; making certain payments, such as stock repurchases and dividend payments; making certain investments; making certain acquisitions; making certain dispositions; and incurring additional indebtedness. Restricted payments are allowed under the Credit Agreement to the extent the consolidated leverage ratio, calculated on a pro forma basis, is equal to or less than 2.00 to 1.00 , plus an additional $7.5 million of restricted payments each fiscal year, as described in the Credit Agreement. The Credit Agreement also provides that the payment of obligations may be accelerated upon the occurrence of events of default, including, but not limited to, non-payment, change of control, or insolvency. As of December 31, 2023, the Company was in compliance with all of the financial covenants under the Credit Agreement.
The obligations under the Credit Agreement are guaranteed by one of the Company’s wholly-owned subsidiaries and secured by substantially all of the assets of the Borrowers and the guarantors.
Previous Credit Agreement - The Borrowers previously maintained a Second Amended and Restated Credit Agreement (the "Old Credit Agreement"), which was scheduled to mature in November 2023. The Old Credit Agreement, when entered into during November 2018, provided for a revolving loan facility of $90 million, with an expansion option of $50 million, bringing the total facility to $140 million, as permitted by the terms of the Old Credit Agreement.
Borrowings under the Old Credit Agreement accrued interest, at the Company's option, at the London Inter-bank Offered Rate ("LIBOR") or a base rate plus a margin. The margin ranged from 1.75 % to 2.50 % on LIBOR loans and 0.75 % to 1.50 % on base rate loans, determined by the Company's most recent consolidated leverage ratio. The Company incurred a commitment fee ranging from 0.30 % to 0.45 % on any unused capacity under the revolving loan facility, determined by the Company’s most recent consolidated leverage ratio. There was no penalty for prepayment of the Old Credit Agreement.
The amounts borrowed as of December 31, 2023 and 2022 are as follows (dollars in thousands):
| December 31, 2023 | December 31, 2022 | ||||||||||
Long-term debt under revolving credit facility(1) | $ | $ | |||||||||
Available to be borrowed under revolving facility(2) | $ | $ | |||||||||
| Interest rates: | |||||||||||
| LIBOR rate loans: | |||||||||||
Interest margin(3) | % | % | |||||||||
| Actual interest rates | % | % | |||||||||
| Commitment Fee | % | % | |||||||||
(1) In connection with the Credit Agreement, during the second quarter of 2022, the Company recorded deferred financing costs of $ | |||||||||||
| (2) The amount available to be borrowed is subject to certain limitations, such as a consolidated leverage ratio, as defined in the Credit Agreement. | |||||||||||
(3) Includes additional spread of | |||||||||||
There are no scheduled payments until maturity of the Credit Agreement in June 2027.
72
12. COMMITMENTS AND CONTINGENCIES
Litigation
The Company is subject to various claims from taxing authorities, lawsuits and other complaints arising in the ordinary course of business. The Company records provisions for losses when claims become probable and the amounts are reasonably estimable. Although the outcome of these legal matters cannot be determined, it is the opinion of management that the final resolution of these matters will not have a material adverse effect on the Company’s financial condition, operations or liquidity.
Tax Contingencies
13. EQUITY TRANSACTIONS
Stock Repurchase Plans— The Company's Board of Directors ("Board") approved a stock repurchase program that permits the Company to repurchase its common stock. Management has discretion in determining the conditions under which shares may be purchased from time to time.
The following table summarizes the stock repurchase plans approved by the Board of Directors:
May 2020 to May 2021(1) | Feb 2021 to Jun 2022(2) | Feb 2022 to Feb 2023(3) | Feb 2023 to Feb 2024(4) | |||||||||||
| Approval Date | May 2020 | February 2021 | February 2022 | February 2023 | ||||||||||
| Authorized Repurchase Amount of Common Stock | $ | $ | $ | $ | ||||||||||
(1) During the first quarter of 2021, the Company completed its purchases under the plan, which consisted of | ||||||||||||||
(2) During the second quarter of 2021, the Company amended its $ | ||||||||||||||
(3) During February 2023, the stock repurchase program approved in February 2022 expired with a total of | ||||||||||||||
(4) On February 9, 2023, the Company announced that its Board approved a new stock repurchase program that permits the purchase of up to $ | ||||||||||||||
As of December 31, 2023, the value of shares available to be purchased under the current plan was $4.8 million.
Purchases of the Company's common stock pursuant to the Stock Repurchase Plans were as follows:
| Year Ended December 31, | ||||||||||||||||||||
| 2023 | 2022 | 2021 | ||||||||||||||||||
Shares repurchased(1) | ||||||||||||||||||||
Average purchase price per share(2) | $ | $ | $ | |||||||||||||||||
Dollar value of shares repurchased (in thousands)(3) | $ | $ | $ | |||||||||||||||||
(1) No shares of our common stock were purchased other than through a publicly announced plan or program.
(2) Average price paid per share includes costs associated with the repurchases.
(3) The value of shares repurchased as of December 31, 2023, 2022, and 2021 includes $33,331 , $65,990 , and $55,780 , respectively, of costs associated with the repurchase.
There were 19,220 and 48,260 unsettled shares as of December 31, 2022 and 2021, respectively. No shares were unsettled as of December 31, 2023.
Stock Repurchases Pursuant to the 2022 Omnibus Equity Award Plan, as Amended and Restated-Under the 2022 Omnibus Equity Award Plan, as Amended and Restated as further described in Note 15 to the consolidated financial statements, the
73
Company repurchases its common stock withheld for income tax from the vesting of employee restricted stock or ("PSUs"). The Company remits the value, which is based on the closing share price on the vesting date of the common stock withheld to the appropriate tax authority on behalf of the employee and the related shares become treasury stock.
Purchases of the Company's common stock pursuant to the 2022 Omnibus Equity Award Plan, as Amended and Restated were as follows:
| Year Ended December 31, | ||||||||||||||||||||
| 2023 | 2022 | 2021 | ||||||||||||||||||
| Shares repurchased upon restricted stock/PSU vesting | ||||||||||||||||||||
| Average purchase price per share | $ | $ | $ | |||||||||||||||||
| Dollar value of shares repurchased upon restricted stock/PSU vesting (in thousands) | $ | $ | $ | |||||||||||||||||
Convertible Preferred Stock—The Company has 20 million shares of convertible preferred stock authorized, with a $0.01 par value. No no preferred stock outstanding. The Company’s amended and restated certificate of incorporation permits the terms of any preferred stock to be determined at the time of issuance.
Dividend provisions
The preferred stockholders would be entitled to dividends only when dividends are paid to common shareholders. In the event of a dividend, the holders of the preferred shares would be entitled to share in the dividend on a pro rata basis, as if their shares had been converted into shares of common stock.
Conversion rights
Any holder of preferred stock has the right, at its option, to convert the preferred shares into shares of common stock at a ratio of one preferred stock share for one common stock share. The holders of 66 2/3% of all outstanding preferred stock have the right at any time to require all the outstanding shares of preferred stock to be converted into an equal number of shares of common stock. Voting rights include the right to vote at a special or annual meeting of stockholders on all matters entitled to be voted on by holders of common stock, voting together as a single class with the common stock. There are no redemption rights associated with the preferred stock.
Liquidation rights
Upon the occurrence of liquidation, the holders of the preferred shares shall be paid in cash for each share of preferred stock held, out of, but only to the extent of, the assets of the Company legally available for distribution to its stockholders, before any payment or distribution is made to any shareholders of common stock. The liquidation value is $2.17 per share, subject to adjustments for stock splits, stock dividends, combinations, or other recapitalizations of the preferred stock.
Dividends—No
14. ACCUMULATED OTHER COMPREHENSIVE LOSS
FASB ASC topic on Comprehensive Income establishes standards for the reporting and display of comprehensive income and its components in a full set of general-purpose financial statements. This statement requires that all items that are required to be recognized as components of comprehensive income be reported in a financial statement with the same prominence as other financial statements. During the year ended December 31, 2021, the Company had $28.1 million of currency translation adjustments reclassified to the Statements of Operations related to the removal of eFC's net assets. The Company had no amounts reclassified out of accumulated other comprehensive income for the year ended December 31, 2022. During the year ended December 31, 2023, the Company had $0.2 million of currency translation adjustments reclassified to the Statements of Operations related to selling a portion of its eFC ownership. The foreign currency translation adjustments impact
74
comprehensive income. Accumulated other comprehensive income (loss), net consists of the following components, net of tax (in thousands):
| Year Ended December 31, | |||||||||||||||||
| 2023 | 2022 | 2021 | |||||||||||||||
| Foreign currency translation: | |||||||||||||||||
| Balance at beginning of year | $ | ( | $ | ( | $ | ( | |||||||||||
| Foreign currency translation adjustment | ( | ||||||||||||||||
| Cumulative translation adjustments reclassified to the Statements of Operations | |||||||||||||||||
| Balance at end of year | $ | ( | $ | ( | $ | ( | |||||||||||
15. STOCK BASED COMPENSATION
On July 13, 2022, the stockholders of the Company approved the DHI Group, Inc. 2022 Omnibus Equity Award Plan, which had been previously approved by the Company's Board of Directors on May 13, 2022 (the "2022 Omnibus Equity Award Plan"). The 2022 Omnibus Equity Award Plan generally mirrors the terms of the Company's prior omnibus equity award plan, which expired in accordance with its terms on April 20, 2022 (the "2012 Omnibus Equity Award Plan"). On April 26, 2023, the stockholders of the Company approved the DHI Group, Inc. 2022 Omnibus Equity Award Plan, as Amended and Restated, which had been previously approved by the Company’s Board of Directors on March 16, 2023 (the "2022 Omnibus Equity Award Plan, as Amended and Restated"). The 2022 Omnibus Equity Award Plan was amended and restated to, among other things, increase the number of shares of common stock authorized for issuance as equity awards under the plan by 2.9 million shares. The Company has previously granted restricted stock and PSUs to certain employees and directors pursuant to the 2012 Omnibus Equity Award Plan and continues to grant restricted stock and PSUs to certain employees and directors pursuant to the 2022 Omnibus Equity Award Plan, as Amended and Restated. The Company also offers an Employee Stock Purchase Plan. Stock-based compensation disclosures within this note include expense and shares related to the eFC business through June 30, 2021.
The Company recorded stock based compensation expense of $9.9 million, $9.5 million, and $8.3 million during the years ended December 31, 2023, 2022, and 2021, respectively. At December 31, 2023, there was $9.9 million of unrecognized compensation expense related to unvested awards, which is expected to be recognized over a weighted-average period of approximately 1.0 years.
Restricted Stock—Restricted stock is granted to employees of the Company and its subsidiaries, and to non-employee members of the Company’s Board. These shares are part of the compensation plan for services provided by the employees or Board members. The closing price of the Company’s stock on the date of grant is used to determine the fair value of the grants. The expense related to the restricted stock grants is recorded over the vesting period as described below. There was no cash flow impact resulting from the grants.
The restricted stock vests in various increments on the anniversaries of each grant, subject to the recipient’s continued employment or service through each applicable vesting date. Vesting occurs over one year for Board members and over to four years for employees.
A summary of the status of restricted stock awards as of December 31, 2023, 2022, and 2021 and the changes during the periods then ended is presented below:
75
| Year Ended December 31, | |||||||||||||||||||||||||||||||||||
| 2023 | 2022 | 2021 | |||||||||||||||||||||||||||||||||
| Shares | Weighted- Average Fair Value at Grant Date | Shares | Weighted- Average Fair Value at Grant Date | Shares | Weighted- Average Fair Value at Grant Date | ||||||||||||||||||||||||||||||
| Non-vested at beginning of the period | $ | $ | $ | ||||||||||||||||||||||||||||||||
| Granted | $ | $ | $ | ||||||||||||||||||||||||||||||||
| Forfeited | ( | $ | ( | $ | ( | $ | |||||||||||||||||||||||||||||
| Vested | ( | $ | ( | $ | ( | $ | |||||||||||||||||||||||||||||
| Non-vested at end of period | $ | $ | $ | ||||||||||||||||||||||||||||||||
| Expected to vest | $ | $ | $ | ||||||||||||||||||||||||||||||||
PSUs—PSUs are granted to employees of the Company and its subsidiaries. The fair value of the PSUs are measured at the grant date fair value of the award, which was determined based on an analysis of the probable performance outcomes. The performance period is over one year and is based on the achievement of bookings targets during the year of grant, as defined in the agreement. The earned shares will then vest over a three year period, one-third on each of the first, second, and third anniversaries of the grant date, or if later, the date the Compensation Committee certifies the performance results with respect to the performance period.
There were no cash flow impacts resulting from the grants.
A summary of the status of PSUs as of December 31, 2023, 2022, and 2021 and the changes during the periods then ended, is presented below:
| Year Ended December 31, | |||||||||||||||||||||||||||||||||||
| 2023 | 2022 | 2021 | |||||||||||||||||||||||||||||||||
| Shares | Weighted- Average Fair Value at Grant Date | Shares | Weighted- Average Fair Value at Grant Date | Shares | Weighted- Average Fair Value at Grant Date | ||||||||||||||||||||||||||||||
| Non-vested at beginning of the period | $ | $ | $ | ||||||||||||||||||||||||||||||||
Granted(1) | $ | $ | $ | ||||||||||||||||||||||||||||||||
Forfeited(2) | ( | $ | ( | $ | ( | $ | |||||||||||||||||||||||||||||
| Vested | ( | $ | ( | $ | ( | $ | |||||||||||||||||||||||||||||
| Non-vested at end of period | $ | $ | $ | ||||||||||||||||||||||||||||||||
| Expected to vest | $ | $ | $ | ||||||||||||||||||||||||||||||||
(1) PSUs granted includes | |||||||||||||||||||||||||||||||||||
(2)PSUs forfeited includes | |||||||||||||||||||||||||||||||||||
Stock Options—No no 110,000 stock options were forfeited.
Employee Stock Purchase Plan—On March 11, 2020 the Company's Board of Directors adopted an Employee Stock Purchase Plan ("ESPP"). The ESPP was approved by the Company's stockholders on April 21, 2020. The ESPP provides eligible employees the opportunity to purchase shares of the Company's common stock through payroll deductions during six-month offering periods. The purchase price per share of common stock is 85 % of the lower of the closing stock price on the first or last trading day of each offering period. The offering periods are January 1 to June 30 and July 1 to December 31. The maximum number of shares of common stock available for purchase under the ESPP is 500,000 , subject to adjustment as provided under the ESPP. Individual employee purchases are limited to $25,000 per calendar year, based on the fair market value of the shares
76
on the purchase date. The first offering period commenced January 1, 2022. During the years ended December 31, 2023 and 2022, 114,002 and 67,905 shares, respectively, were issued under the plan. No shares were issued during the year ended December 31, 2021.
16. INCOME TAXES
Deferred tax assets (liabilities) included in the balance sheet as of December 31, 2023 and 2022 are as follows (in thousands):
| 2023 | 2022 | ||||||||||
| Deferred tax assets: | |||||||||||
| Capital loss carryforward | $ | $ | |||||||||
| Allowance for doubtful accounts | |||||||||||
| Depreciation of fixed assets | |||||||||||
| Provision for accrued expenses and other, net | |||||||||||
| Investments | |||||||||||
| Stock-based compensation | |||||||||||
| Operating lease liabilities | |||||||||||
| Tax credit carryforward | |||||||||||
| Less valuation allowance | |||||||||||
| Deferred tax asset, net of valuation allowance | |||||||||||
| Deferred tax liabilities: | |||||||||||
| Acquired intangibles | ( | ( | |||||||||
| Depreciation of fixed assets | ( | ||||||||||
| Capitalized contract costs | ( | ( | |||||||||
| Operating lease assets | ( | ( | |||||||||
| Deferred tax liability | ( | ( | |||||||||
| Net deferred tax liability | $ | ( | $ | ( | |||||||
The Company had deferred tax assets of $23.0 million and $4.9 million, respectively, at December 31, 2023 and 2022 related to capital loss carryforwards and $0.3 million at December 31, 2023 and 2022 related to tax credit carryforwards. The capital losses expire in 2024 through 2028, and the tax credits expire in 2025 through 2032. The Company has recorded valuation allowances of $23.9 million and $5.7 million, respectively, at December 31, 2023 and 2022 in order to measure only the portion of the deferred tax assets which are more likely than not to be realized.
| 2023 | 2022 | 2021 | |||||||||||||||
| Current income tax expense (benefit): | |||||||||||||||||
| Federal | $ | $ | $ | ( | |||||||||||||
| State | |||||||||||||||||
| Current income tax expense (benefit) | ( | ||||||||||||||||
| Deferred income tax expense (benefit): | |||||||||||||||||
| Federal | ( | ( | ( | ||||||||||||||
| State | ( | ( | ( | ||||||||||||||
| Deferred income tax expense (benefit) | ( | ( | ( | ||||||||||||||
| Income tax expense (benefit) | $ | $ | ( | $ | ( | ||||||||||||
77
A reconciliation between tax expense (benefit) at the federal statutory rate and the reported income tax expense (benefit) is summarized as follows:
| Year Ended December 31, | |||||||||||||||||
| 2023 | 2022 | 2021 | |||||||||||||||
| Federal statutory rate | $ | $ | $ | ( | |||||||||||||
| Loss on sale of investments | ( | ( | |||||||||||||||
| Expiration of capital loss carryforward | |||||||||||||||||
| Stock-based compensation | ( | ( | ( | ||||||||||||||
| State tax expense, net of federal effect | |||||||||||||||||
| Change in accrual for unrecognized tax benefits | ( | ( | |||||||||||||||
| Executive compensation | |||||||||||||||||
| Research and development tax credits | ( | ( | ( | ||||||||||||||
| Income from equity method investment | ( | ( | |||||||||||||||
| Change in valuation allowance | |||||||||||||||||
| Other | ( | ( | |||||||||||||||
| Income tax expense (benefit) | $ | $ | ( | $ | ( | ||||||||||||
| Effective tax rate | % | ( | % | % | |||||||||||||
An uncertain tax position represents the Company’s expected treatment of a tax position taken in a filed tax return, or planned to be taken in a tax return not yet filed, that has not been reflected in measuring income tax expense for financial reporting purposes. At December 31, 2023 and 2022, the Company's accrual for unrecognized tax benefits consists of the following:
| 2023 | 2022 | ||||||||||
| Unrecognized tax benefits | $ | $ | |||||||||
| Estimated accrued interest and penalties | |||||||||||
| Accrual for unrecognized tax benefits, as recorded | $ | $ | |||||||||
During the years ended December 31, 2023, 2022 and 2021, interest expense (income) and penalties recorded in the consolidated statements of operations were $18,000 , $(20,000 ), and $(27,000 ), respectively. Following is a reconciliation of the amounts of unrecognized tax benefits, net of tax and excluding interest and penalties, for the years ended December 31, 2023, 2022 and 2021 (in thousands):
| 2023 | 2022 | 2021 | |||||||||||||||
| Unrecognized tax benefits—beginning of period | $ | $ | $ | ||||||||||||||
| Increases in tax positions related to current year | |||||||||||||||||
| Increases (decreases) in tax positions related to prior year | ( | ||||||||||||||||
| Lapse of statute of limitations | ( | ( | ( | ||||||||||||||
| Unrecognized tax benefits—end of period | $ | $ | $ | ||||||||||||||
The foregoing table indicates unrecognized tax benefits, net of tax and excluding interest and penalties. The balance of gross unrecognized benefits was $1.0 million, $0.8 million, and $0.8 million at December 31, 2023, 2022, and 2021, respectively. If the unrecognized tax benefits at December 31, 2023, 2022, and 2021 were recognized in full, tax benefits of $1.0 million, $0.8 million, and $0.8 million, respectively, would affect the effective tax rate.
The Company has filed income tax returns in the U.S. and various foreign jurisdictions. The foreign returns relate to the eFC business, of which the Company transferred a majority interest and control to eFC's management on June 30, 2021. See Notes 1 and 4 for additional disclosures. The Company is generally no longer subject to examinations by U.S. federal tax authorities for tax years prior to 2020, or by U.S. state and foreign authorities for tax years prior to 2019. The Company believes it is reasonably possible that as much as $0.2 million of its unrecognized tax benefits may be recognized by the end of 2024 as a result of a lapse of the statute of limitations.
78
17. EMPLOYEE SAVINGS PLAN
The Company has a savings plan (the “Savings Plan”) that qualifies as a deferred salary arrangement under Section 401(k) of the Internal Revenue Code. Under the Savings Plan, participating employees may defer a portion of their pretax earnings, up to the Internal Revenue Service annual contribution limit. The Company contributed $2.4 million, $2.1 million, and $1.7 million for the years ended December 31, 2023, 2022 and 2021, respectively, to match employee contributions to the Savings Plan.
18. EARNINGS (LOSS) PER SHARE
Basic earnings (loss) per share is computed based on the weighted-average number of shares of common stock outstanding. Diluted earnings per share is computed based on the weighted-average number of shares of common stock outstanding plus common stock equivalents, where dilutive. The following is a calculation of basic and diluted earnings (loss) per share and weighted-average shares outstanding (in thousands, except per share amounts):
| 2023 | 2022 | 2021 | |||||||||||||||
| Income (loss) from continuing operations | $ | $ | $ | ( | |||||||||||||
| Income (loss) from discontinued operations, net of tax | $ | $ | $ | ( | |||||||||||||
| Net Income (loss) | $ | $ | $ | ( | |||||||||||||
| Weighted-average shares outstanding—basic | |||||||||||||||||
Add shares issuable from stock-based awards(1) | |||||||||||||||||
| Weighted-average shares outstanding—diluted | $ | $ | $ | ||||||||||||||
| Basic earnings (loss) per share - continuing operations | $ | $ | $ | ( | |||||||||||||
| Diluted earnings (loss) per share - continuing operations | $ | $ | $ | ( | |||||||||||||
| Basic earnings (loss) per share - discontinued operations | $ | $ | $ | ( | |||||||||||||
| Diluted earnings (loss) per share - discontinued operations | $ | $ | $ | ( | |||||||||||||
| Basic earnings (loss) per share | $ | $ | $ | ( | |||||||||||||
| Diluted earnings (loss) per share | $ | $ | $ | ( | |||||||||||||
Shares excluded from the calculation of diluted earnings per share(2) | |||||||||||||||||
(1) For the twelve months ended December 31, 2021, | |||||||||||||||||
| (2) Represents outstanding stock-based awards that were anti-dilutive and excluded from the calculation of diluted earnings per share. | |||||||||||||||||
Item 9. Changes in and Disagreements with Accountants on Accounting and Financial Disclosures
None.
Item 9A. Controls and Procedures
Evaluation of Disclosure Controls and Procedures
Our management, under supervision and with the participation of our Chief Executive Officer (“CEO”) and Chief Financial Officer (“CFO”), has conducted an evaluation (pursuant to Rule 13a-15(b) of the Exchange Act) of the effectiveness of the Company’s disclosure controls and procedures (as defined in Rules 13a-15(e) under the Exchange Act) as of the end of the fiscal period covered by this report.
79
These disclosure controls and procedures are designed to ensure that information required to be disclosed in the Company’s reports that are filed or submitted under the Exchange Act is recorded, processed, summarized and reported within the time periods specified in the Securities and Exchange Commission’s rules and forms. The Company’s disclosure controls and procedures include, without limitation, controls and procedures designed to ensure that this information is accumulated and communicated to management, including the principal executive and principal financial officers, or persons performing similar functions, as appropriate, to allow timely decisions regarding required disclosure.
Based on such evaluations, the CEO and CFO have concluded that these disclosure controls and procedures are effective to provide reasonable assurance that information required to be disclosed in our Exchange Act reports is recorded, processed, summarized and reported within the time periods specified by the SEC, and that such information is accumulated and communicated to management, including the CEO and CFO, as appropriate, to allow timely decisions regarding required disclosure.
Management’s Report on Internal Control Over Financial Reporting
Our management is responsible for establishing and maintaining adequate internal control over financial reporting (as defined in Rules 13a-15(f) and 15d-15(f) under the Exchange Act).
Management conducted an evaluation of the effectiveness of our internal control over financial reporting based on the framework in Internal Control—Integrated Framework (2013) issued by the Committee of Sponsoring Organizations of the Treadway Commission. Based on this evaluation, management concluded that the Company’s internal control over financial reporting was effective as of December 31, 2023.
Because of its inherent limitations, internal control over financial reporting may not prevent or detect misstatements. Projections of any evaluation of effectiveness to future periods are subject to the risks that controls may become inadequate because of changes in conditions, or that the degree of compliance with the policies or procedures may deteriorate.
Deloitte & Touche LLP has audited the Company’s internal control over financial reporting as of December 31, 2023 and has issued a report regarding its assessment included herein.
Changes in Internal Controls
No change in our internal control over financial reporting (as defined in Rules 13a-15(f) under the Exchange Act) occurred during the quarter ended December 31, 2023 that has materially affected, or is reasonably likely to materially affect, our internal control over financial reporting.
80
Item 9B. Other Information
During the three months ended December 31, 2023, no director or officer of the Company adopted terminated
Item 9C. Disclosure Regarding Foreign Jurisdictions that Prevent Inspections
None.
81
PART III
Item 10. Directors, Executive Officers and Corporate Governance
The information called for by this Item will be set forth in our definitive proxy statement relating to our 2024 Annual Meeting of Stockholders (the "Proxy Statement”) to be filed within 120 days of the Company’s fiscal year end of December 31, 2023 and is incorporated herein by reference.
Item 11. Executive Compensation
The information called for by this Item will be set forth in the Proxy Statement and is incorporated herein by reference.
Item 12. Security Ownership of Certain Beneficial Owners and Management and Related Stockholder Matters
The information called for by this Item will be set forth in the Proxy Statement and is incorporated herein by reference.
Item 13. Certain Relationships and Related Transactions, and Director Independence
The information called for by this Item will be set forth in the Proxy Statement and is incorporated herein by reference.
Item 14. Principal Accountant Fees and Services
Our independent registered public accounting firm is Deloitte & Touche LLP, Denver, Colorado (PCAOB ID No. 34 ).
The information called for by this Item will be set forth in the Proxy Statement and is incorporated herein by reference.
82
PART IV
Item 15. Exhibits
| (a) | 1. | Financial Statement Schedules | |||||||||
| The consolidated financial statements are listed under Item 8 of this Annual Report. | |||||||||||
| 2. | Financial Statement Schedules. | ||||||||||
| See (b) below. | |||||||||||
| 3. | Exhibits. | ||||||||||
83
| 10.11† | ||||||||
10.12# | ||||||||
| 10.13† | ||||||||
| 10.14*† | ||||||||
| 10.15† | ||||||||
| 10.16*† | ||||||||
| 10.17*† | ||||||||
| 10.18*† | ||||||||
| 10.19*† | ||||||||
| 10.20† | ||||||||
| 10.21† | ||||||||
| 10.22† | ||||||||
| 21.1* | ||||||||
| 23.1* | ||||||||
| 31.1* | ||||||||
| 31.2* | ||||||||
| 32.1** | ||||||||
| 32.2** | ||||||||
84
| 97.1*† | ||||||||
| 101.INS | XBRL Instance Document - the instance document does not appear in the Interactive Data File because its XBRL tags are embedded within the Inline XBRL document. | |||||||
| 101.SCH | XBRL Taxonomy Extension Schema Document. | |||||||
| 101.CAL | XBRL Taxonomy Extension Calculation Linkbase Document. | |||||||
| 101.DEF | XBRL Taxonomy Extension Definition Linkbase Document. | |||||||
| 101.LAB | XBRL Taxonomy Extension Label Linkbase Document. | |||||||
| 101.PRE | XBRL Taxonomy Extension Presentation Linkbase Document. | |||||||
| 104 | Cover Page Interactive Data File (formatted as inline XBRL and contained in Exhibit 101) | |||||||
________________
| * | Filed herewith. | |||||||
| ** | Furnished herewith. | |||||||
| † | Identifies a management contract or compensatory plan or arrangement. | |||||||
| # | Schedules and exhibits have been omitted pursuant to Item 601(a)(5) of Regulation S-K. The Company hereby undertakes to supplementally furnish copies of any omitted schedules and exhibits to the Securities and Exchange Commission upon request. | |||||||
| (b) | Financial Statement Schedules. | |||||||
85
SCHEDULE II
DHI GROUP, INC.
CONSOLIDATED VALUATION AND QUALIFYING ACCOUNTS
As of December 31, 2021, 2022 and 2023
(in thousands)
| Column A | Column B | Column C | Column D | Column E | |||||||||||||||||||
| Balance at Beginning of Period | Charged to Income | Deductions | Balance at End of Period | ||||||||||||||||||||
| Description | |||||||||||||||||||||||
| Reserves Deducted From Assets to Which They Apply: | |||||||||||||||||||||||
| Reserve for uncollectible accounts receivable: | |||||||||||||||||||||||
| Year ended December 31, 2021 | $ | $ | $ | ( | $ | ||||||||||||||||||
| Year ended December 31, 2022 | ( | ||||||||||||||||||||||
| Year ended December 31, 2023 | ( | ||||||||||||||||||||||
| Deferred tax valuation allowance: | |||||||||||||||||||||||
| Year ended December 31, 2021 | $ | $ | ( | $ | $ | ||||||||||||||||||
| Year ended December 31, 2022 | |||||||||||||||||||||||
| Year ended December 31, 2023 | |||||||||||||||||||||||
____________________
See notes to consolidated financial statements included elsewhere herein.
86
Item 16. Form 10-K Summary
None.
87
SIGNATURES
Pursuant to the requirements of Section 13 or 15(d) of the Securities Exchange Act of 1934, as amended, the Registrant has duly caused this Annual Report on Form 10-K to be signed on its behalf by the undersigned, thereunto duly authorized.
| Date: | February 8, 2024 | DHI Group, Inc. | ||||||||||||
| By: | /S/ Art Zeile | |||||||||||||
| Art Zeile | ||||||||||||||
| President and Chief Executive Officer | ||||||||||||||
| (on behalf of the registrant) | ||||||||||||||
Pursuant to the requirements of the Securities Exchange Act of 1934, this report has been signed by the following persons in the capacities and on the dates indicated.
| Signature | Title | Date | ||||||||||||
| /S/ Art Zeile | President, Chief Executive Officer and Director | February 8, 2024 | ||||||||||||
| Art Zeile | (Principal Executive Officer) | |||||||||||||
| /S/ Raime Leeby Muhle | Chief Financial Officer | February 8, 2024 | ||||||||||||
| Raime Leeby Muhle | (Principal Financial and Accounting Officer) | |||||||||||||
| /S/ Brian Schipper | Chairman and Director | February 8, 2024 | ||||||||||||
| Brian Schipper | ||||||||||||||
| /S/ Scipio Carnecchia | Director | February 8, 2024 | ||||||||||||
| Scipio Carnecchia | ||||||||||||||
| /S/ Jim Friedlich | Director | February 8, 2024 | ||||||||||||
| Jim Friedlich | ||||||||||||||
| /S/ Joseph Massaquoi | Director | February 8, 2024 | ||||||||||||
| Joseph Massaquoi | ||||||||||||||
| /S/ David Windley | Director | February 8, 2024 | ||||||||||||
| David Windley | ||||||||||||||
| /S/ Elizabeth Salomon | Director | February 8, 2024 | ||||||||||||
| Elizabeth Salomon | ||||||||||||||
| /S/ Kathleen Swann | Director | February 8, 2024 | ||||||||||||
| Kathleen Swann | ||||||||||||||
88