UNITED STATES SECURITIES AND EXCHANGE COMMISSION
WASHINGTON, D.C. 20549
FORM 10-K
(Mark One)
| ANNUAL REPORT PURSUANT TO SECTION 13 OR 15(d) OF THE SECURITIES EXCHANGE ACT OF 1934 | |||||
| TRANSITION REPORT PURSUANT TO SECTION 13 OR 15(d) OF THE SECURITIES EXCHANGE ACT OF 1934 | |||||
For the transition period from________to________
| Commission File Number | Registrant, State of Incorporation or Organization, Address of Principal Executive Offices, Zip Code and Telephone Number | IRS Employer Identification No. | ||||||
 | ||||||||
(a Delaware corporation)
(a North Carolina limited liability company)
(a North Carolina corporation)
(a North Carolina limited liability company)
(a Florida limited liability company)
(an Ohio corporation)
(an Indiana limited liability company)
(a North Carolina corporation)
SECURITIES REGISTERED PURSUANT TO SECTION 12(b) OF THE ACT:
Name of each exchange on
Registrant Title of each class Trading symbols which registered
Duke Energy Corporation Common Stock, $0.001 par value DUK New York Stock Exchange LLC
(Duke Energy)
Duke Energy 5.625% Junior Subordinated Debentures due DUKB New York Stock Exchange LLC
September 15, 2078
Duke Energy Depositary Shares , each representing a 1/1,000th DUK PR A New York Stock Exchange LLC
interest in a share of 5.75% Series A Cumulative
Redeemable Perpetual Preferred Stock, par value
$0.001 per share
Duke Energy 3.10% Senior Notes due 2028 DUK 28A New York Stock Exchange LLC
Duke Energy 3.85% Senior Notes due 2034 DUK 34 New York Stock Exchange LLC
SECURITIES REGISTERED PURSUANT TO SECTION 12(g) OF THE ACT: None
Indicate by check mark if the registrant is a well-known seasoned issuer, as defined in Rule 405 of the Securities Act.
| Duke Energy | ☒ | No | ☐ | Duke Energy Florida, LLC (Duke Energy Florida) | ☒ | No | ☐ | |||||||||||||||||||||||||
| Duke Energy Carolinas, LLC (Duke Energy Carolinas) | ☒ | No | ☐ | Duke Energy Ohio, Inc. (Duke Energy Ohio) | ☒ | No | ☐ | |||||||||||||||||||||||||
| Progress Energy, Inc. (Progress Energy) | Yes | ☐ | ☒ | Duke Energy Indiana, LLC (Duke Energy Indiana) | ☒ | No | ☐ | |||||||||||||||||||||||||
| Duke Energy Progress, LLC (Duke Energy Progress) | ☒ | No | ☐ | Piedmont Natural Gas Company, Inc. (Piedmont) | ☒ | No | ☐ | |||||||||||||||||||||||||
Indicate by check mark if the registrant is not required to file reports pursuant to Section 13 or Section 15(d) of the Exchange Act. Yes ☐ No ☒ (Response applicable to all registrants.)
Indicate by check mark whether the registrants (1) have filed all reports required to be filed by Section 13 or 15(d) of the Securities Exchange Act of 1934 during the preceding 12 months (or for such shorter period that the registrant was required to file such reports), and (2) has been subject to such filing requirements for the past 90 days. Yes ☒ No ☐
Indicate by check mark whether the registrants have submitted electronically every Interactive Data File required to be submitted pursuant to Rule 405 of Regulation S-T (§232.405 of this chapter) during the preceding 12 months (or for such shorter period that the registrant was required to submit such files). Yes ☒ No ¨
Indicate by check mark whether Duke Energy is a large accelerated filer, an accelerated filer, a non-accelerated filer, a smaller reporting company, or an emerging growth company. See the definitions of “large accelerated filer,” “accelerated filer,” “smaller reporting company,” and "emerging growth company" in Rule 12b-2 of the Exchange Act.:
If an emerging growth company, indicate by check mark if the registrant has elected not to use the extended transition period for complying with any new or revised financial accounting standards provided pursuant to Section 13(a) of the Exchange Act. ☐
Indicate by check mark whether each of Duke Energy Carolinas, Progress Energy, Duke Energy Progress, Duke Energy Florida, Duke Energy Ohio, Duke Energy Indiana and Piedmont is a large accelerated filer, accelerated filer, non-accelerated filer, smaller reporting company, or emerging growth company. See the definitions of “large accelerated filer,” “accelerated filer,” “smaller reporting company,” and "emerging growth company" in Rule 12b-2 of the Exchange Act.:
Large Accelerated Filer ¨ Accelerated Filer ¨ Non-accelerated Filer ☐ ☐
If an emerging growth company, indicate by check mark if the registrant has elected not to use the extended transition period for complying with any new or revised financial accounting standards provided pursuant to Section 13(a) of the Exchange Act. ¨
Indicate by check mark whether the registrant has filed a report on and attestation to its management’s assessment of the effectiveness of its internal control over financial reporting under Section 404(b) of the Sarbanes-Oxley Act (15 U.S.C. 7262(b)) by the registered public accounting firm that prepared or issued its audit report. ☒
If securities are registered pursuant to Section 12(b) of the Act, indicate by check mark whether the financial statements of the registrant included in the filing reflect the correction of an error to previously issued financial statements. ¨
Indicate by check mark whether any of those error corrections are restatements that required a recovery analysis of incentive-based compensation received by any of the registrant’s executive officers during the relevant recovery period pursuant to §240.10D-1(b). ¨
Indicate by check mark whether each of the registrants is a shell company (as defined in Rule 12b-2 of the Exchange Act). Yes ☐
Estimated aggregate market value of the common equity held by nonaffiliates of Duke Energy at June 30, 2023. | $ | |||||||
Number of Shares of Common Stock Outstanding at January 31, 2024 | ||||||||
| Registrant | Description | Shares | ||||||
| Duke Energy | Common stock, $0.001 par value | |||||||
| Duke Energy Carolinas | All of the registrant's limited liability company member interests are directly owned by Duke Energy. | N/A | ||||||
| Progress Energy | All of the registrant's common stock is directly owned by Duke Energy. | |||||||
| Duke Energy Progress | All of the registrant's limited liability company member interests are indirectly owned by Duke Energy. | N/A | ||||||
| Duke Energy Florida | All of the registrant's limited liability company member interests are indirectly owned by Duke Energy. | N/A | ||||||
| Duke Energy Ohio | All of the registrant's common stock is indirectly owned by Duke Energy. | |||||||
| Duke Energy Indiana | All of the registrant's limited liability company member interests are owned by a Duke Energy subsidiary that is 80.1% indirectly owned by Duke Energy. | N/A | ||||||
| Piedmont | All of the registrant's common stock is directly owned by Duke Energy. | |||||||
DOCUMENTS INCORPORATED BY REFERENCE
Portions of the Duke Energy definitive proxy statement for the 2024 Annual Meeting of the Shareholders or an amendment to this Annual Report are incorporated by reference into PART III, Items 10, 11 and 13 hereof.
This combined Form 10-K is filed separately by eight registrants: Duke Energy, Duke Energy Carolinas, Progress Energy, Duke Energy Progress, Duke Energy Florida, Duke Energy Ohio, Duke Energy Indiana and Piedmont (collectively the Duke Energy Registrants). Information contained herein relating to any individual registrant is filed by such registrant solely on its own behalf. Each registrant makes no representation as to information relating exclusively to the other registrants.
Auditor Firm ID: 34 Deloitte & Touche LLP Charlotte, NC
| TABLE OF CONTENTS | |||||
TABLE OF CONTENTS
FORM 10-K FOR THE YEAR ENDED December 31, 2023
Item | Page | |||||||
| CAUTIONARY STATEMENT REGARDING FORWARD-LOOKING INFORMATION | ||||||||
| GLOSSARY OF TERMS | ||||||||
| PART I. | ||||||||
| 1. | ||||||||
| PIEDMONT | ||||||||
| 1A. | ||||||||
| 1B. | ||||||||
1C. | ||||||||
| 2. | ||||||||
| 3. | ||||||||
| 4. | ||||||||
| PART II. | ||||||||
| 5. | ||||||||
| 6. | ||||||||
| 7. | ||||||||
| 7A. | ||||||||
| 8. | ||||||||
| 9. | ||||||||
| 9A. | ||||||||
| 9B. | ||||||||
| PART III. | ||||||||
| 10. | ||||||||
| 11. | ||||||||
| 12. | ||||||||
| 13. | ||||||||
| 14. | ||||||||
| PART IV. | ||||||||
| 15. | ||||||||
| EXHIBIT INDEX | ||||||||
E-2 | ||||||||
| FORWARD LOOKING STATEMENTS | |||||
CAUTIONARY STATEMENT REGARDING FORWARD-LOOKING INFORMATION
This document includes forward-looking statements within the meaning of Section 27A of the Securities Act of 1933 and Section 21E of the Securities Exchange Act of 1934. Forward-looking statements are based on management’s beliefs and assumptions and can often be identified by terms and phrases that include “anticipate,” “believe,” “intend,” “estimate,” “expect,” “continue,” “should,” “could,” “may,” “plan,” “project,” “predict,” “will,” “potential,” “forecast,” “target,” “guidance,” “outlook” or other similar terminology. Various factors may cause actual results to be materially different than the suggested outcomes within forward-looking statements; accordingly, there is no assurance that such results will be realized. These factors include, but are not limited to:
◦The ability to implement our business strategy, including our carbon emission reduction goals;
◦State, federal and foreign legislative and regulatory initiatives, including costs of compliance with existing and future environmental requirements, including those related to climate change, as well as rulings that affect cost and investment recovery or have an impact on rate structures or market prices;
◦The extent and timing of costs and liabilities to comply with federal and state laws, regulations and legal requirements related to coal ash remediation, including amounts for required closure of certain ash impoundments, are uncertain and difficult to estimate;
◦The ability to recover eligible costs, including amounts associated with coal ash impoundment retirement obligations, asset retirement and construction costs related to carbon emissions reductions, and costs related to significant weather events, and to earn an adequate return on investment through rate case proceedings and the regulatory process;
◦The costs of decommissioning nuclear facilities could prove to be more extensive than amounts estimated and all costs may not be fully recoverable through the regulatory process;
◦The impact of extraordinary external events, such as the pandemic health event resulting from COVID-19, and their collateral consequences, including the disruption of global supply chains or the economic activity in our service territories;
◦Costs and effects of legal and administrative proceedings, settlements, investigations and claims;
◦Industrial, commercial and residential growth or decline in service territories or customer bases resulting from sustained downturns of the economy, reduced customer usage due to cost pressures from inflation or fuel costs, and the economic health of our service territories or variations in customer usage patterns, including energy efficiency efforts, natural gas building and appliance electrification, and use of alternative energy sources, such as self-generation and distributed generation technologies;
◦Federal and state regulations, laws and other efforts designed to promote and expand the use of energy efficiency measures, natural gas electrification, and distributed generation technologies, such as private solar and battery storage, in Duke Energy service territories could result in a reduced number of customers, excess generation resources as well as stranded costs;
◦Advancements in technology;
◦Additional competition in electric and natural gas markets and continued industry consolidation;
◦The influence of weather and other natural phenomena on operations, including the economic, operational and other effects of severe storms, hurricanes, droughts, earthquakes and tornadoes, including extreme weather associated with climate change;
◦Changing investor, customer and other stakeholder expectations and demands including heightened emphasis on environmental, social and governance concerns and costs related thereto;
◦The ability to successfully operate electric generating facilities and deliver electricity to customers including direct or indirect effects to the Company resulting from an incident that affects the United States electric grid or generating resources;
◦Operational interruptions to our natural gas distribution and transmission activities;
◦The availability of adequate interstate pipeline transportation capacity and natural gas supply;
◦The impact on facilities and business from a terrorist or other attack, war, vandalism, cybersecurity threats, data security breaches, operational events, information technology failures or other catastrophic events, such as fires, explosions, pandemic health events or other similar occurrences;
◦The inherent risks associated with the operation of nuclear facilities, including environmental, health, safety, regulatory and financial risks, including the financial stability of third-party service providers;
◦The timing and extent of changes in commodity prices and interest rates and the ability to recover such costs through the regulatory process, where appropriate, and their impact on liquidity positions and the value of underlying assets;
◦The results of financing efforts, including the ability to obtain financing on favorable terms, which can be affected by various factors, including credit ratings, interest rate fluctuations, compliance with debt covenants and conditions, an individual utility’s generation mix, and general market and economic conditions;
◦Credit ratings of the Duke Energy Registrants may be different from what is expected;
◦Declines in the market prices of equity and fixed-income securities and resultant cash funding requirements for defined benefit pension plans, other post-retirement benefit plans and nuclear decommissioning trust funds;
| FORWARD LOOKING STATEMENTS | |||||
◦Construction and development risks associated with the completion of the Duke Energy Registrants’ capital investment projects, including risks related to financing, timing and receipt of necessary regulatory approvals, obtaining and complying with terms of permits, meeting construction budgets and schedules and satisfying operating and environmental performance standards, as well as the ability to recover costs from customers in a timely manner, or at all;
◦Changes in rules for regional transmission organizations, including changes in rate designs and new and evolving capacity markets, and risks related to obligations created by the default of other participants;
◦The ability to control operation and maintenance costs;
◦The level of creditworthiness of counterparties to transactions;
◦The ability to obtain adequate insurance at acceptable costs;
◦Employee workforce factors, including the potential inability to attract and retain key personnel;
◦The ability of subsidiaries to pay dividends or distributions to Duke Energy Corporation holding company (the Parent);
◦The performance of projects undertaken by our businesses and the success of efforts to invest in and develop new opportunities;
◦The effect of accounting and reporting pronouncements issued periodically by accounting standard-setting bodies and the SEC;
◦The impact of United States tax legislation to our financial condition, results of operations or cash flows and our credit ratings;
◦The impacts from potential impairments of goodwill or equity method investment carrying values;
◦Asset or business acquisitions and dispositions may not yield the anticipated benefits; and
◦The actions of activist shareholders could disrupt our operations, impact our ability to execute on our business strategy, or cause fluctuations in the trading price of our common stock.
Additional risks and uncertainties are identified and discussed in the Duke Energy Registrants' reports filed with the SEC and available at the SEC's website at sec.gov. In light of these risks, uncertainties and assumptions, the events described in the forward-looking statements might not occur or might occur to a different extent or at a different time than described. Forward-looking statements speak only as of the date they are made and the Duke Energy Registrants expressly disclaim an obligation to publicly update or revise any forward-looking statements, whether as a result of new information, future events or otherwise.
| GLOSSARY OF TERMS | |||||
Glossary of Terms
The following terms or acronyms used in this Form 10-K are defined below:
| Term or Acronym | Definition | ||||
| 2021 Settlement | Settlement Agreement in 2021 among Duke Energy Florida, the Florida Office of Public Counsel, the Florida Industrial Power Users Group, White Springs Agricultural Chemicals, Inc. d/b/a PSC Phosphate and NUCOR Steel Florida, Inc. | ||||
| ACP | Atlantic Coast Pipeline, LLC, a limited liability company owned by Dominion and Duke Energy | ||||
| AFS | Available for Sale | ||||
| AFUDC | Allowance for funds used during construction | ||||
| AOCI | Accumulated Other Comprehensive Income (Loss) | ||||
ArcLight | ArcLight Capital Partners, LLC | ||||
| ARO | Asset Retirement Obligation | ||||
ARM | Annual Review Mechanism | ||||
ATM | At-the-market | ||||
| Audit Committee | Audit Committee of the Board of Directors | ||||
| Bison | Bison Insurance Company Limited | ||||
| Board of Directors | Duke Energy Board of Directors | ||||
Brookfield | Brookfield Renewable Partners L.P. | ||||
| Brunswick | Brunswick Nuclear Plant | ||||
| Cardinal | Cardinal Pipeline Company, LLC | ||||
| Catawba | Catawba Nuclear Station | ||||
| CC | Combined Cycle | ||||
| CCR | Coal Combustion Residuals | ||||
CCR Rule | A 2015 EPA rule establishing national regulations to provide a comprehensive set of requirements for the management and disposal of CCR from coal-fired power plants | ||||
CEP | Capital Expenditure Program | ||||
| Cinergy | Cinergy Corp. (collectively with its subsidiaries) | ||||
| Citrus County CC | Citrus County Combined Cycle Facility | ||||
CO2 | Carbon Dioxide | ||||
| Coal Ash Act | North Carolina Coal Ash Management Act of 2014 | ||||
the Company | Duke Energy Corporation and its subsidiaries | ||||
| Commercial Renewables Disposal Groups | Commercial Renewables business segment, excluding the offshore wind contract for Carolina Long Bay, separated into the utility-scale solar and wind group, the distributed generation group and the remaining assets | ||||
COR | Costs of Removal | ||||
| COVID-19 | Coronavirus Disease 2019 | ||||
| CPCN | Certificate of Public Convenience and Necessity | ||||
| CRC | Cinergy Receivables Company LLC | ||||
| Crystal River Unit 3 | Crystal River Unit 3 Nuclear Plant | ||||
| CT | Combustion Turbine | ||||
| DATC | Duke-American Transmission Company, LLC | ||||
| DECON | A method of decommissioning in which structures, systems, and components that contain radioactive contamination are removed from a site and safely disposed at a commercially operated low-level waste disposal facility, or decontaminated to a level that permits the site to be released for unrestricted use shortly after it ceases operation | ||||
| DEFR | Duke Energy Florida Receivables, LLC | ||||
| Deloitte | Deloitte & Touche LLP, and the member firms of Deloitte Touche Tohmatsu and their respective affiliates | ||||
| DEPR | Duke Energy Progress Receivables, LLC | ||||
| GLOSSARY OF TERMS | |||||
| DERF | Duke Energy Receivables Finance Company, LLC | ||||
| DOE | U.S. Department of Energy | ||||
| Dominion | Dominion Energy, Inc. | ||||
| Dth | Dekatherms | ||||
| Duke Energy | Duke Energy Corporation (collectively with its subsidiaries) | ||||
| Duke Energy Carolinas | Duke Energy Carolinas, LLC | ||||
| Duke Energy Florida | Duke Energy Florida, LLC | ||||
| Duke Energy Indiana | Duke Energy Indiana, LLC | ||||
| Duke Energy Kentucky | Duke Energy Kentucky, Inc. | ||||
| Duke Energy Ohio | Duke Energy Ohio, Inc. | ||||
| Duke Energy Progress | Duke Energy Progress, LLC | ||||
| Duke Energy Registrants | Duke Energy, Duke Energy Carolinas, Progress Energy, Duke Energy Progress, Duke Energy Florida, Duke Energy Ohio, Duke Energy Indiana and Piedmont | ||||
| East Bend | East Bend Generating Station | ||||
| EDIT | Excess deferred income tax | ||||
| EE | Energy efficiency | ||||
| EPA | U.S. Environmental Protection Agency | ||||
| EPS | Earnings Per Share | ||||
| ETR | Effective tax rate | ||||
| EU&I | Electric Utilities and Infrastructure | ||||
| Exchange Act | Securities Exchange Act of 1934 | ||||
| FERC | Federal Energy Regulatory Commission | ||||
| Form S-3 | Registration statement | ||||
| FPSC | Florida Public Service Commission | ||||
| FTR | Financial transmission rights | ||||
FV-NI | Fair Value Through Net Income | ||||
| GAAP | Generally Accepted Accounting Principles in the United States | ||||
| GAAP Reported Earnings | Net Income Available to Duke Energy Corporation common stockholders | ||||
GAAP Reported EPS | Basic EPS Available to Duke Energy Corporation common stockholders | ||||
| GHG | Greenhouse Gas | ||||
| GIC | GIC Private Limited | ||||
| GU&I | Gas Utilities and Infrastructure | ||||
| GWh | Gigawatt-hour | ||||
| Hardy Storage | Hardy Storage Company, LLC | ||||
| Harris | Shearon Harris Nuclear Plant | ||||
| HB 951 | The Energy Solutions for North Carolina, or House Bill 951, passed in October 2021 | ||||
IDEM | the Indiana Department of Environmental Management | ||||
IMPA | Indiana Municipal Power Agency | ||||
IMR | Integrity Management Rider | ||||
IRA | Inflation Reduction Act | ||||
| IRP | Integrated Resource Plans | ||||
| IRS | Internal Revenue Service | ||||
| ISO | Independent System Operator | ||||
| ITC | Investment Tax Credit | ||||
| IURC | Indiana Utility Regulatory Commission | ||||
| GLOSSARY OF TERMS | |||||
| Investment Trusts | Grantor trusts of Duke Energy Progress, Duke Energy Florida and Duke Energy Indiana | ||||
JDA | Joint Dispatch Agreement | ||||
| KO Transmission | KO Transmission Company | ||||
| KPSC | Kentucky Public Service Commission | ||||
| LLC | Limited Liability Company | ||||
| McGuire | McGuire Nuclear Station | ||||
| MGP | Manufactured gas plant | ||||
| MGP Settlement | Stipulation and Recommendation filed jointly by Duke Energy Ohio the staff of the PUCO, the Office of the Ohio Consumers' Counsel and the Ohio Energy Group on August 31, 2021 | ||||
| MISO | Midcontinent Independent System Operator, Inc. | ||||
| MTBE | Methyl tertiary butyl ether | ||||
| MW | Megawatt | ||||
| MWh | Megawatt-hour | ||||
| MYRP | Multiyear rate plans | ||||
| NCDEQ | North Carolina Department of Environmental Quality | ||||
NCEMC | North Carolina Electric Membership Corporation | ||||
| NCUC | North Carolina Utilities Commission | ||||
| NDTF | Nuclear decommissioning trust funds | ||||
| NMC | National Methanol Company | ||||
| NOL | Net operating loss | ||||
| NPNS | Normal purchase/normal sale | ||||
| NRC | U.S. Nuclear Regulatory Commission | ||||
| NYSE | New York Stock Exchange | ||||
OCC | Ohio Consumers' Counsel | ||||
| Oconee | Oconee Nuclear Station | ||||
| OPEB | Other Post-Retirement Benefit Obligations | ||||
| OVEC | Ohio Valley Electric Corporation | ||||
| the Parent | Duke Energy Corporation holding company | ||||
| PBR | Performance-based regulation | ||||
| PGA | Purchased Gas Adjustments | ||||
| PHMSA | Pipeline and Hazardous Materials Safety Administration | ||||
| Piedmont | Piedmont Natural Gas Company, Inc. | ||||
| Pine Needle | Pine Needle LNG Company, LLC | ||||
| Pioneer | Pioneer Transmission, LLC | ||||
| PJM | PJM Interconnection, LLC | ||||
| PMPA | Piedmont Municipal Power Agency | ||||
| PISCC | Post-in-service carrying costs | ||||
| PPA | Purchase Power Agreement | ||||
| Progress Energy | Progress Energy, Inc. | ||||
| PSCSC | Public Service Commission of South Carolina | ||||
| PTC | Production Tax Credit | ||||
| PUCO | Public Utilities Commission of Ohio | ||||
| PURPA | Public Utility Regulatory Policies Act of 1978 | ||||
| QF | Qualifying Facility | ||||
| Relative TSR | TSR of Duke Energy stock relative to a predefined peer group | ||||
| GLOSSARY OF TERMS | |||||
| Robinson | Robinson Nuclear Plant | ||||
| ROE | Return of equity | ||||
| ROU | Right-of-use | ||||
| RSU | Restricted Stock Unit | ||||
| RTO | Regional Transmission Organization | ||||
| Sabal Trail | Sabal Trail Transmission, LLC | ||||
| SAFSTOR | A method of decommissioning in which a nuclear facility is placed and maintained in a condition that allows the facility to be safely stored and subsequently decontaminated to levels that permit release for unrestricted use | ||||
| SEC | Securities and Exchange Commission | ||||
| S&P | Standard & Poor’s Rating Services | ||||
| State utility commissions | NCUC, PSCSC, FPSC, PUCO, IURC, KPSC and TPUC (Collectively) | ||||
| State electric utility commissions | NCUC, PSCSC, FPSC, PUCO, IURC and KPSC (Collectively) | ||||
| State gas utility commissions | NCUC, PSCSC, PUCO, TPUC and KPSC (Collectively) | ||||
| Subsidiary Registrants | Duke Energy Carolinas, Progress Energy, Duke Energy Progress, Duke Energy Florida, Duke Energy Ohio, Duke Energy Indiana and Piedmont | ||||
| Sutton | L.V. Sutton Combined Cycle Plant | ||||
| the Tax Act | Tax Cuts and Jobs Act | ||||
| TPUC | Tennessee Public Utility Commission | ||||
| TSR | Total shareholder return | ||||
| U.S. | United States | ||||
| W.S. Lee CC | William States Lee Combined Cycle Facility | ||||
| WVPA | Wabash Valley Power Association, Inc. | ||||
| BUSINESS | |||||
ITEM 1. BUSINESS
DUKE ENERGY
General
Duke Energy was incorporated on May 3, 2005, and is an energy company headquartered in Charlotte, North Carolina, subject to regulation by the FERC and other regulatory agencies listed below. Duke Energy operates in the U.S. primarily through its direct and indirect subsidiaries. Certain Duke Energy subsidiaries are also Subsidiary Registrants, including Duke Energy Carolinas, Progress Energy, Duke Energy Progress, Duke Energy Florida, Duke Energy Ohio, Duke Energy Indiana and Piedmont. Operations in Kentucky are conducted through Duke Energy Ohio's wholly owned subsidiary, Duke Energy Kentucky. References herein to Duke Energy Ohio include Duke Energy Ohio and its subsidiaries, unless otherwise noted. When discussing Duke Energy’s consolidated financial information, it necessarily includes the results of its separate Subsidiary Registrants, which along with Duke Energy, are collectively referred to as the Duke Energy Registrants.
The Duke Energy Registrants electronically file reports with the SEC, including Annual Reports on Form 10-K, quarterly reports on Form 10-Q, current reports on Form 8-K, proxy statements and amendments to such reports.
The SEC maintains an internet site that contains reports, proxy and information statements and other information regarding issuers that file electronically with the SEC at sec.gov. Additionally, information about the Duke Energy Registrants, including reports filed with the SEC, is available through Duke Energy’s website at duke-energy.com. Such reports are accessible at no charge and are made available as soon as reasonably practicable after such material is filed with or furnished to the SEC.
Business Segments
Duke Energy's segment structure includes two reportable business segments: Electric Utilities and Infrastructure (EU&I) and Gas Utilities and Infrastructure (GU&I). The remainder of Duke Energy’s operations is presented as Other. Commercial Renewables is reported as discontinued operations and is no longer a reportable segment beginning in the fourth quarter of 2022. See Note 2 to the Consolidated Financial Statements, “Dispositions," for further details. Duke Energy's chief operating decision-maker routinely reviews financial information about each of these business segments in deciding how to allocate resources and evaluate the performance of the business. For additional information on each of these business segments, including financial and geographic information, see Note 3 to the Consolidated Financial Statements, “Business Segments.” The following sections describe the business and operations of each of Duke Energy’s business segments, as well as Other.
ELECTRIC UTILITIES AND INFRASTRUCTURE
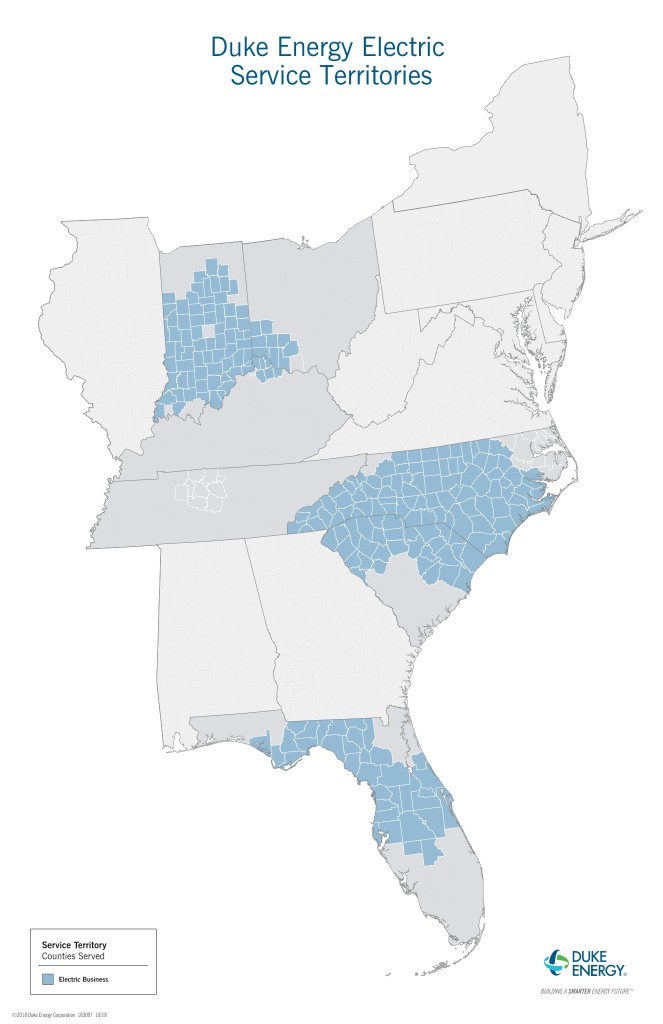
EU&I conducts operations primarily through the regulated public utilities of Duke Energy Carolinas, Duke Energy Progress, Duke Energy Florida, Duke Energy Indiana and Duke Energy Ohio. EU&I provides retail electric service through the generation, transmission, distribution and sale of electricity to approximately 8.4 million customers within the Southeast and Midwest regions of the U.S. The service territory is approximately 90,000 square miles across six states with a total estimated population of 27 million. The operations include electricity sold wholesale to municipalities, electric cooperative utilities and other load-serving entities.
During 2021, Duke Energy executed an agreement providing for an investment by an affiliate of GIC in Duke Energy Indiana in exchange for a 19.9% minority interest issued by Duke Energy Indiana Holdco, LLC, the holding company for Duke Energy Indiana. The transaction was completed following two closings. Additionally, in November 2022, Duke Energy committed to a plan to sell the Commercial Renewables business segment, excluding the offshore wind contract for Carolina Long Bay, which was moved to EU&I. Duke Energy entered into purchase and sale agreements with affiliates of Brookfield for the sale of the utility-scale solar and wind group in June 2023 and with affiliates of ArcLight for the distributed generation group in July 2023. Both transactions closed in October 2023. See Note 2 to the Consolidated Financial Statements, “Dispositions," for additional information.
EU&I is also a joint owner in certain electric transmission projects. EU&I has a 50% ownership interest in DATC, a partnership with American Transmission Company, formed to design, build and operate transmission infrastructure. DATC owns 72% of the transmission service rights to Path 15, an 84-mile transmission line in central California. EU&I also has a 50% ownership interest in Pioneer, which builds, owns and operates electric transmission facilities in North America. The following map shows the service territory for EU&I as of December 31, 2023.
9
| BUSINESS | |||||
The electric operations and investments in projects are subject to the rules and regulations of the FERC, the NRC, the NCUC, the PSCSC, the FPSC, the IURC, the PUCO and the KPSC.
The following table represents the distribution of GWh billed sales by customer class for the year ended December 31, 2023.
| Duke | Duke | Duke | Duke | Duke | |||||||||||||||||||||||||
| Energy | Energy | Energy | Energy | Energy | |||||||||||||||||||||||||
| Carolinas | Progress | Florida | Ohio | Indiana | |||||||||||||||||||||||||
| Residential | 32 | % | 26 | % | 50 | % | 37 | % | 28 | % | |||||||||||||||||||
| General service | 34 | % | 22 | % | 36 | % | 38 | % | 26 | % | |||||||||||||||||||
| Industrial | 23 | % | 15 | % | 8 | % | 23 | % | 31 | % | |||||||||||||||||||
| Total retail sales | 89 | % | 63 | % | 94 | % | 98 | % | 85 | % | |||||||||||||||||||
| Wholesale and other sales | 11 | % | 37 | % | 6 | % | 2 | % | 15 | % | |||||||||||||||||||
| Total sales | 100 | % | 100 | % | 100 | % | 100 | % | 100 | % | |||||||||||||||||||
The number of residential and general service customers within the EU&I service territory is expected to increase over time. Growth in weather-normal sales volumes, however, was lower in 2023 compared to 2022 due primarily to the continuation of energy efficiency adoption, rooftop solar and broad weakness across industrial sectors. While migration to EU&I's service territory remained strong, residential sales decreased due primarily to the return to more normal post-pandemic activities and economic conditions throughout the year. Lower industrial sales continued due to overall industrial weakness, including some manufacturing plant closings across certain jurisdictions, continuation of supply chain constraints and higher inventory levels, as well as higher interest rates. This was partially offset by higher data center usage, which contributed to growth in commercial sales volumes. The impact on customer's usage from these factors and other potential economic dynamics continues to be monitored. Over the longer time frame, it is still expected that the continued adoption of more efficient housing and appliances will have a negative impact on average usage per residential customer over time.
Seasonality and the Impact of Weather
Revenues and costs are influenced by seasonal weather patterns. Peak sales of electricity occur during the summer and winter months, which results in higher revenue and cash flows during these periods. By contrast, lower sales of electricity occur during the spring and fall, allowing for scheduled plant maintenance. Although decoupling mechanisms may mitigate some weather impacts, residential and general service customers are typically more impacted by weather than industrial customers. Estimated weather impacts are based on actual current period weather compared to normal weather conditions. Normal weather conditions are defined as the long-term average of actual historical weather conditions.
10
| BUSINESS | |||||
The estimated impact of weather on earnings is based on the temperature variances from a normal condition and customers’ historic usage patterns. The methodology used to estimate the impact of weather does not consider all variables that may impact customer response to weather conditions such as humidity in the summer or wind chill in the winter. The precision of this estimate may also be impacted by applying long-term weather trends to shorter-term periods. Estimates of weather impacts may be more difficult to determine during periods of extreme or more volatile weather.
Heating degree days measure the variation in weather based on the extent the average daily temperature falls below a base temperature. Cooling degree days measure the variation in weather based on the extent the average daily temperature rises above the base temperature. Each degree of temperature below the base temperature counts as one heating degree day and each degree of temperature above the base temperature counts as one cooling degree day.
Competition
Retail
EU&I’s businesses operate as the sole supplier of electricity within their service territories, with the exception of Ohio, which has a competitive electricity supply market for generation service. EU&I owns and operates facilities necessary to generate, transmit, distribute and sell electricity. Services are priced by state commission-approved rates designed to include the costs of providing these services and a reasonable return on invested capital. This regulatory policy is intended to provide safe and reliable electricity at fair prices.
In Ohio, EU&I conducts competitive auctions for electricity supply. The cost of energy purchased through these auctions is recovered from retail customers. EU&I earns retail margin in Ohio on the transmission and distribution of electricity, but not on the cost of the underlying energy.
Competition in the regulated electric distribution business is primarily from the development and deployment of alternative energy sources including on-site generation from industrial customers and distributed generation, such as private solar, at residential, general service and/or industrial customer sites.
Wholesale
Duke Energy competes with other utilities and merchant generators for bulk power sales, sales to municipalities and cooperatives and wholesale transactions under primarily cost-based contracts approved by FERC. The principal factors in competing for these sales are availability of capacity and power, reliability of service and price. Prices are influenced primarily by market conditions and fuel costs.
Increased competition in the wholesale electric utility industry and the availability of transmission access could affect EU&I’s load forecasts, plans for power supply and wholesale energy sales and related revenues. Wholesale energy sales will be impacted by the extent to which additional generation is available to sell to the wholesale market and the ability of EU&I to attract new customers and to retain existing customers.
Energy Capacity and Resources
EU&I owns approximately 54,772 MW of generation capacity. For additional information on owned generation facilities, see Item 2, “Properties.”
Energy and capacity are also supplied through contracts with other generators and purchased on the open market. Factors that could cause EU&I to purchase power for its customers may include, but are not limited to, generating plant outages, extreme weather conditions, generation reliability, demand growth and price. EU&I has interconnections and arrangements with its neighboring utilities to facilitate planning, emergency assistance, sale and purchase of capacity and energy and reliability of power supply.
EU&I’s generation portfolio is a balanced mix of energy resources having different operating characteristics and fuel sources designed to provide energy at the lowest possible cost to meet its obligation to serve retail customers. All options, including owned generation resources and purchased power opportunities, are continually evaluated on a real-time basis to select and dispatch the lowest-cost resources available to meet system load requirements.
Sources of Electricity
EU&I relies principally on natural gas, nuclear fuel and coal for its generation of electricity. The following table lists sources of electricity and fuel costs for the three years ended December 31, 2023.
| Cost of Delivered Fuel per Net | |||||||||||||||||||||||||||||||||||
| Generation by Source | Kilowatt-hour Generated (Cents) | ||||||||||||||||||||||||||||||||||
| 2023 | 2022 | 2021 | 2023 | 2022 | 2021 | ||||||||||||||||||||||||||||||
Natural gas and fuel oil(a) | 33.3 | % | 34.2 | % | 31.8 | % | 3.81 | 6.35 | 3.89 | ||||||||||||||||||||||||||
Nuclear(a) | 28.4 | % | 26.6 | % | 29.8 | % | 0.58 | 0.58 | 0.58 | ||||||||||||||||||||||||||
Coal(a) | 12.8 | % | 13.5 | % | 18.2 | % | 4.07 | 3.43 | 2.84 | ||||||||||||||||||||||||||
All fuels (cost based on weighted average)(a) | 74.5 | % | 74.3 | % | 79.8 | % | 2.63 | 3.75 | 2.42 | ||||||||||||||||||||||||||
Hydroelectric and solar(b) | 1.8 | % | 1.5 | % | 1.5 | % | |||||||||||||||||||||||||||||
| Total generation | 76.3 | % | 75.8 | % | 81.3 | % | |||||||||||||||||||||||||||||
| Purchased power and net interchange | 23.7 | % | 24.2 | % | 18.7 | % | |||||||||||||||||||||||||||||
| Total sources of energy | 100.0 | % | 100.0 | % | 100.0 | % | |||||||||||||||||||||||||||||
(a) Statistics related to all fuels reflect EU&I's public utility ownership interest in jointly owned generation facilities.
(b) Generating figures are net of output required to replenish pumped-storage facilities during off-peak periods.
11
| BUSINESS | |||||
Natural Gas and Fuel Oil
Natural gas and fuel oil supply, transportation and storage for EU&I’s generation fleet is purchased under standard industry agreements from various suppliers, including Piedmont. Natural gas supply agreements typically provide for a percentage of forecasted burns being procured over time, with varied expiration dates. EU&I believes it has access to an adequate supply of natural gas and fuel oil for the reasonably foreseeable future.
EU&I has certain dual-fuel generating facilities that can operate utilizing both natural gas and fuel oil. The cost of EU&I’s natural gas and fuel oil is fixed price or determined by published market prices as reported in certain industry publications, plus any transportation and freight costs. Duke Energy Carolinas, Duke Energy Progress, Duke Energy Florida and Duke Energy Indiana use derivative instruments to manage a portion of their exposure to price fluctuations for natural gas. Duke Energy Florida has temporarily agreed to not hedge natural gas prices, but retains an ability to propose hedging again in annual fuel docket filings.
EU&I has firm interstate and intrastate natural gas transportation agreements and storage agreements in place to support generation needed for load requirements. EU&I may purchase additional shorter-term natural gas transportation and utilize natural gas interruptible transportation agreements to support generation needed for load requirements. The EU&I natural gas plants are served by various supply zones and multiple pipelines.
Nuclear
The industrial processes for producing nuclear generating fuel generally involve the mining and milling of uranium ore to produce uranium concentrates and services to convert, enrich and fabricate fuel assemblies.
EU&I has contracted for uranium materials and services to fuel its nuclear reactors. Uranium concentrates, conversion services and enrichment services are primarily met through a diversified portfolio of long-term supply contracts. The contracts are diversified by supplier, country of origin and pricing. EU&I staggers its contracting so that its portfolio of long-term contracts covers the majority of its fuel requirements in the near term and decreasing portions of its fuel requirements over time thereafter. Near-term requirements not met by long-term supply contracts have been and are expected to be fulfilled with spot market purchases. Due to the technical complexities of changing suppliers of fuel fabrication services, EU&I generally source these services to a single domestic supplier on a plant-by-plant basis using multiyear contracts.
EU&I has entered into fuel contracts that cover 100% of its uranium concentrates through at least 2027, 100% of its conversion services through at least 2029, 100% of its enrichment services through at least 2027, and 100% of its fabrication services requirements for these plants through at least 2027. For future requirements not already covered under long-term contracts, EU&I believes it will be able to renew contracts as they expire or enter into similar contractual arrangements with other suppliers of nuclear fuel materials and services.
Coal
EU&I meets its coal demand through a portfolio of long-term purchase contracts and short-term spot market purchase agreements. Large amounts of coal are purchased under long-term contracts with mining operators who mine both underground and at the surface. EU&I uses spot market purchases to meet coal requirements not met by long-term contracts. Expiration dates for its long-term contracts, which may have various price adjustment provisions and market reopeners, range from 2024 to 2027 for Duke Energy Carolinas, Duke Energy Progress and Duke Energy Indiana, 2024 to 2026 for Duke Energy Florida and 2024 to 2025 for Duke Energy Ohio. EU&I expects to renew these contracts or enter into similar contracts with other suppliers as existing contracts expire, though prices will fluctuate over time as coal markets change. EU&I has an adequate supply of coal under contract to meet its risk management guidelines regarding projected future consumption. Coal inventory levels may fluctuate as a result of volatility in natural gas prices and the associated impacts on coal-fired dispatch within the generation fleet. EU&I continues to actively manage its portfolio and has worked with suppliers to obtain increased flexibility in its coal contracts.
Coal purchased for the Carolinas is primarily produced from mines in Central Appalachia, Northern Appalachia and the Illinois Basin. Coal purchased for Florida is primarily produced from mines in the Illinois Basin. Coal purchased for Kentucky is primarily produced from mines along the Ohio River in Illinois, Kentucky, Ohio, West Virginia and Pennsylvania. Coal purchased for Indiana is primarily produced in Indiana and Illinois. There are adequate domestic coal reserves to serve EU&I's coal generation needs through end of life. The current average sulfur content of coal purchased by EU&I is between 0.5% and 3.5% for Duke Energy Carolinas and Duke Energy Progress, between 1% and 3.5% for Duke Energy Florida, and between 0.5% and 4.0% for Duke Energy Ohio and Duke Energy Indiana. EU&I's environmental controls, in combination with the use of sulfur dioxide (SO2) emission allowances, enable EU&I to satisfy current SO2 emission limitations for its existing facilities.
Purchased Power
EU&I purchases a portion of its capacity and system requirements through purchase obligations, leases and purchase capacity contracts. EU&I believes it can obtain adequate purchased power capacity to meet future system load needs. However, during periods of high demand, the price and availability of purchased power may be significantly affected.
The following table summarizes purchased power for the previous three years:
| 2023 | 2022 | 2021 | |||||||||||||||
Purchase obligations and leases (in millions of MWh)(a) | 37.6 | 41.2 | 36.0 | ||||||||||||||
Purchase capacity under contract (in MW)(b) | 3,997 | 4,028 | 4,259 | ||||||||||||||
(a) Represents approximately 15% of total system requirements for 2023, 16% for 2022 and 14% for 2021.
(b) For 2023, 2022 and 2021, these agreements include approximately 412 MW of firm capacity under contract by Duke Energy Florida with QFs.
12
| BUSINESS | |||||
Inventory
EU&I must maintain an adequate stock of fuel and materials and supplies in order to ensure continuous operation of generating facilities and reliable delivery to customers. As of December 31, 2023, the inventory balance for EU&I was approximately $4.1 billion. For additional information on inventory, see Note 1 to the Consolidated Financial Statements, “Summary of Significant Accounting Policies.”
Ash Basin Management
The EPA has issued regulations related to the management of CCR from power plants including the CCR Rule. These regulations classify CCR as nonhazardous waste under the Resource Conservation and Recovery Act (RCRA) and apply to electric generating sites with new and existing landfills and new and existing surface impoundments and establish requirements regarding landfill design, structural integrity design and assessment criteria for surface impoundments, groundwater monitoring, protection and remedial procedures and other operational and reporting procedures for the disposal and management of CCR. In addition to the federal regulations, CCR landfills and surface impoundments (ash basins or impoundments) will continue to be regulated by existing state laws, regulations and permits, such as the North Carolina Coal Ash Management Act of 2014 (Coal Ash Act).
EU&I has and will periodically submit to applicable authorities required site-specific coal ash impoundment remediation or closure plans. Closure plans must be approved and all associated permits issued before any work can begin. Closure activities have begun in all of Duke Energy's jurisdictions. Excavation began in 2015 at the four sites specified as high priority by the Coal Ash Act and at the W.S. Lee Steam Station site in South Carolina in connection with other legal requirements. Excavation at these sites involves movement of CCR materials to appropriate engineered off-site or on-site lined landfills or for reuse in an approved beneficial application. Duke Energy has completed excavation of coal ash at the four high-priority North Carolina sites. At other sites where CCR management is required, planning and closure methods have been studied and factored into the estimated retirement and management costs, and closure activities have commenced.
The EPA CCR rule and the Coal Ash Act leave the decision on cost recovery determinations related to closure of coal ash surface impoundments to the normal ratemaking processes before utility regulatory commissions. Duke Energy's electric utilities have included compliance costs associated with federal and state requirements in their respective rate proceedings. During 2017, Duke Energy Carolinas' and Duke Energy Progress’ wholesale contracts were amended to include the recovery of expenditures related to AROs for the closure of coal ash basins. The amended contracts have retail disallowance parity or provisions limiting challenges to CCR cost recovery actions at FERC. FERC approved the amended wholesale rate schedules in 2017. For additional information on the ash basins and recovery, see Item 7, "Other Matters" and Notes 4, 5 and 10 to the Consolidated Financial Statements, "Regulatory Matters," "Commitments and Contingencies" and "Asset Retirement Obligations," respectively.
Nuclear Matters
Duke Energy owns, wholly or partially, 11 operating nuclear reactors located at six operating stations. The Crystal River Unit 3 permanently ceased operation in February 2013. Nuclear insurance includes: nuclear liability coverage; property damage coverage; nuclear accident decontamination and premature decommissioning coverage; and accidental outage coverage for losses in the event of a major accidental outage. Joint owners reimburse Duke Energy for certain expenses associated with nuclear insurance in accordance with joint owner agreements. The Price-Anderson Act requires plant owners to provide for public nuclear liability claims resulting from nuclear incidents to the maximum total financial protection liability, which is approximately $16.2 billion. For additional information on nuclear insurance, see Note 5 to the Consolidated Financial Statements, “Commitments and Contingencies.”
Duke Energy has a significant future financial commitment to dispose of spent nuclear fuel and decommission and decontaminate each plant safely. The NCUC and the PSCSC require Duke Energy Carolinas and Duke Energy Progress update cost estimates for decommissioning their nuclear plants every five years. The nuclear decommissioning liabilities are assessed and updated based on changes in cash flows provided in new studies as well as annual assessments to evaluate whether any indicators suggest a change in the estimate of the ARO is necessary.
The following table summarizes the fair value of NDTF investments and the most recent site-specific nuclear decommissioning cost studies. Decommissioning costs are stated in 2023 or 2019 dollars, depending on the year of the cost study, and include costs to decommission plant components not subject to radioactive contamination.
NDTF(a) | Decommissioning | ||||||||||||||||||||||
| (in millions) | December 31, 2023 | December 31, 2022 | Costs(a) | Year of Cost Study | |||||||||||||||||||
| Duke Energy | $ | 10,143 | $ | 8,637 | $ | 8,814 | 2023 or 2019 | ||||||||||||||||
Duke Energy Carolinas(b)(c) | 5,686 | 4,783 | 4,439 | 2023 | |||||||||||||||||||
Duke Energy Progress(d) | 4,075 | 3,430 | 4,181 | 2019 | |||||||||||||||||||
Duke Energy Florida(e) | 382 | 424 | 194 | N/A | |||||||||||||||||||
(a) Amounts for Progress Energy equal the sum of Duke Energy Progress and Duke Energy Florida.
(b) Decommissioning cost for Duke Energy Carolinas reflects its ownership interest in jointly owned reactors. Other joint owners are responsible for decommissioning costs related to their interest in the reactors.
(c) Duke Energy Carolinas' site-specific nuclear decommissioning cost study completed in 2023 was filed with the NCUC and PSCSC in 2024. A funding study was last completed and filed in 2019. An updated funding study will be completed and filed with the NCUC and PSCSC in 2024.
13
| BUSINESS | |||||
(d) Duke Energy Progress' site-specific nuclear decommissioning cost study completed in 2019 was filed with the NCUC and PSCSC in March 2020. Duke Energy Progress also completed a funding study, which was filed with the NCUC and PSCSC in July 2020. In October 2021, Duke Energy Progress filed the 2019 nuclear decommissioning cost study with the FERC, as well as a revised date schedule for decommissioning expense to be collected from wholesale customers. The FERC accepted the filing, as filed on December 9, 2021.
(e) During 2019, Duke Energy Florida reached an agreement to transfer decommissioning work for Crystal River Unit 3 to a third party and decommissioning costs are based on the agreement with this third party rather than a cost study. Regulatory approval was received from the NRC and the FPSC in April 2020 and August 2020, respectively. Duke Energy Florida provides the FPSC periodic reports on the status and progress of decommissioning activities.
The NCUC, PSCSC, FPSC and FERC have allowed EU&I to recover estimated decommissioning costs through retail and wholesale rates over the expected remaining service periods of their nuclear stations. EU&I believes the decommissioning costs being recovered through rates, when coupled with the existing fund balances and expected fund earnings, will be sufficient to provide for the cost of future decommissioning. For additional information, see Note 10 to the Consolidated Financial Statements, “Asset Retirement Obligations.”
The Nuclear Waste Policy Act of 1982 (as amended) provides the framework for development by the federal government of interim storage and permanent disposal facilities for high-level radioactive waste materials. The government has not yet developed a storage facility or disposal capacity, so EU&I will continue to store spent fuel on its reactor sites.
Under federal law, the DOE is responsible for the selection and construction of a facility for the permanent disposal of spent nuclear fuel and high-level radioactive waste. The DOE terminated the project to license and develop a geologic repository at Yucca Mountain, Nevada in 2010, and is currently taking no action to fulfill its responsibilities to dispose of spent fuel.
Until the DOE begins to accept the spent nuclear fuel, Duke Energy Carolinas, Duke Energy Progress and Duke Energy Florida will continue to safely manage their spent nuclear fuel. Under current regulatory guidelines, Harris has sufficient storage capacity in its spent fuel pools through the expiration of its renewed operating license. With certain modifications and approvals by the NRC to expand the on-site dry cask storage facilities, spent nuclear fuel dry storage facilities will be sufficient to provide storage space of spent fuel through the expiration of the operating licenses, including any license renewals, for Brunswick, Catawba, McGuire, Oconee and Robinson. Crystal River Unit 3 ceased operation in 2013 and was placed in a SAFSTOR condition in January 2018. As of January 2018, all spent fuel at Crystal River Unit 3 has been transferred from the spent fuel pool to dry storage at an on-site independent spent fuel storage installation.
The nuclear power industry faces uncertainties with respect to the cost and long-term availability of disposal sites for spent nuclear fuel and other radioactive waste, compliance with changing regulatory requirements, capital outlays for modifications and new plant construction.
EU&I is subject to the jurisdiction of the NRC for the design, construction and operation of its nuclear generating facilities. The following table includes the current year of expiration of nuclear operating licenses for nuclear stations in operation. In June 2021, Duke Energy Carolinas filed a subsequent license renewal application for Oconee with the U.S. Nuclear Regulatory Commission to renew Oconee's operating license for an additional 20 years. Duke Energy has announced its intention to seek 20-year operating license renewals for each of the reactors it operates in Duke Energy Carolinas and Duke Energy Progress. See Note 4 to the Consolidated Financial Statements, "Regulatory Matters,” for additional information.
| Unit | Year of Expiration | ||||
| Duke Energy Carolinas | |||||
| Catawba Units 1 and 2 | 2043 | ||||
| McGuire Unit 1 | 2041 | ||||
| McGuire Unit 2 | 2043 | ||||
| Oconee Units 1 and 2 | 2033 | ||||
| Oconee Unit 3 | 2034 | ||||
| Duke Energy Progress | |||||
| Brunswick Unit 1 | 2036 | ||||
| Brunswick Unit 2 | 2034 | ||||
| Harris | 2046 | ||||
| Robinson | 2030 | ||||
The NRC has acknowledged permanent cessation of operation and permanent removal of fuel from the reactor vessel at Crystal River Unit 3. Therefore, the license no longer authorizes operation of the reactor. For additional information on nuclear decommissioning activity, see Note 10 to the Consolidated Financial Statements, "Asset Retirement Obligations."
Regulation
State
The state electric utility commissions approve rates for Duke Energy's retail electric service within their respective states. The state electric utility commissions, to varying degrees, have authority over the construction and operation of EU&I’s generating facilities. CPCNs issued by the state electric utility commissions, as applicable, authorize EU&I to construct and operate its electric facilities and to sell electricity to retail and wholesale customers. Prior approval from the relevant state electric utility commission is required for the entities within EU&I to issue securities. The underlying concept of utility ratemaking is to set rates at a level that allows the utility to collect revenues equal to its cost of providing service plus earn a reasonable rate of return on its invested capital, including equity.
14
| BUSINESS | |||||
In addition to rates approved in base rate cases, each of the state electric utility commissions allow recovery of certain costs through various cost recovery clauses to the extent the respective commission determines in periodic hearings that such costs, including any past over or under-recovered costs, are prudent.
Fuel, fuel-related costs and certain purchased power costs are eligible for recovery by EU&I. EU&I uses coal, hydroelectric, natural gas, oil, renewable generation and nuclear fuel to generate electricity, thereby maintaining a diverse fuel mix that helps mitigate the impact of cost increases in any one fuel. Due to the associated regulatory treatment and the method allowed for recovery, changes in fuel costs from year to year have no material impact on operating results of EU&I, unless a commission finds a portion of such costs to have been imprudent. However, delays between the expenditure for fuel costs and recovery from customers can adversely impact the timing of cash flows of EU&I.
The table below reflects significant electric rate case applications approved and effective in the past three years and applications currently pending approval.
Regulatory Body | Annual Increase (Decrease) (in millions) | Return on Equity | Equity Component of Capital Structure | Effective Date | |||||||||||||
| Approved Rate Cases: | |||||||||||||||||
Duke Energy Carolinas 2023 North Carolina Rate Case(a) | NCUC | $ | 768 | 10.1 | % | 53 | % | January 2024 | |||||||||
Duke Energy Kentucky 2022 Kentucky Electric Rate Case(b) | KPSC | 48 | 9.75 | % | 52.145 | % | October 2023 | ||||||||||
Duke Energy Progress 2022 North Carolina Rate Case(c) | NCUC | 494 | 9.8 | % | 53 | % | October 2023 | ||||||||||
| Duke Energy Progress 2022 South Carolina Rate Case | PSCSC | 52 | 9.6 | % | 52.43 | % | April 2023 | ||||||||||
| Duke Energy Ohio 2021 Ohio Electric Rate Case | PUCO | 23 | 9.5 | % | 50.5 | % | January 2023 | ||||||||||
| Duke Energy Progress 2019 North Carolina Rate Case | NCUC | 178 | 9.6 | % | 52 | % | June 2021 | ||||||||||
| Duke Energy Carolinas 2019 North Carolina Rate Case | NCUC | 33 | 9.6 | % | 52 | % | June 2021 | ||||||||||
| Pending Rate Cases: | |||||||||||||||||
Duke Energy Carolinas 2024 South Carolina Rate Case | PSCSC | 239 | 10.5 | % | 53 | % | August 2024 | ||||||||||
(a) Of the total rate case increase, Year 1, 2 and 3 rates are approximately 57%, 22% and 21%, respectively.
(b) An ROE of 9.65% for electric riders was approved.
(c) Of the total rate increase, Year 1, 2 and 3 rates are approximately 49%, 24% and 27%, respectively.
Additionally, in January 2021, Duke Energy Florida filed the 2021 Settlement with the FPSC that will allow annual increases to its base rates, an agreed upon return on equity (ROE) and includes a base rate stay-out provision through 2024, among other provisions. The FPSC approved the 2021 Settlement on May 4, 2021, issuing an order on June 4, 2021. Revised customer rates became effective January 1, 2022, with subsequent base rate increases effective January 1, 2023, and January 1, 2024. In January 2024, Duke Energy Florida notified the FPSC that it expects to file a formal request for new base rates in April 2024. For more information on rate matters and other regulatory proceedings, see Note 4 to the Consolidated Financial Statements, “Regulatory Matters.”
Federal
The FERC approves EU&I’s cost-based rates for electric sales to certain power and transmission wholesale customers. Regulations of FERC and the state electric utility commissions govern access to regulated electric and other data by nonregulated entities and services provided between regulated and nonregulated energy affiliates. These regulations affect the activities of nonregulated affiliates with EU&I.
RTOs
PJM and MISO are the ISOs and FERC-approved RTOs for the regions in which Duke Energy Ohio and Duke Energy Indiana operate. PJM and MISO operate energy, capacity and other markets, and control the day-to-day operations of bulk power systems through central dispatch.
Duke Energy Ohio is a member of PJM and Duke Energy Indiana is a member of MISO. Transmission owners in these RTOs have turned over control of their transmission facilities and their transmission systems are currently under the dispatch control of the RTOs. Transmission service is provided on a regionwide, open-access basis using the transmission facilities of the RTO members at rates based on the costs of transmission service.
Environmental
EU&I is subject to the jurisdiction of the EPA and state and local environmental agencies. For a discussion of environmental regulation, see “Environmental Matters” in this section. See the “Other Matters” section of Item 7 Management's Discussion and Analysis for a discussion about potential Global Climate Change legislation and other EPA regulations under development and the potential impacts such legislation and regulation could have on Duke Energy’s operations.
15
| BUSINESS | |||||
GAS UTILITIES AND INFRASTRUCTURE
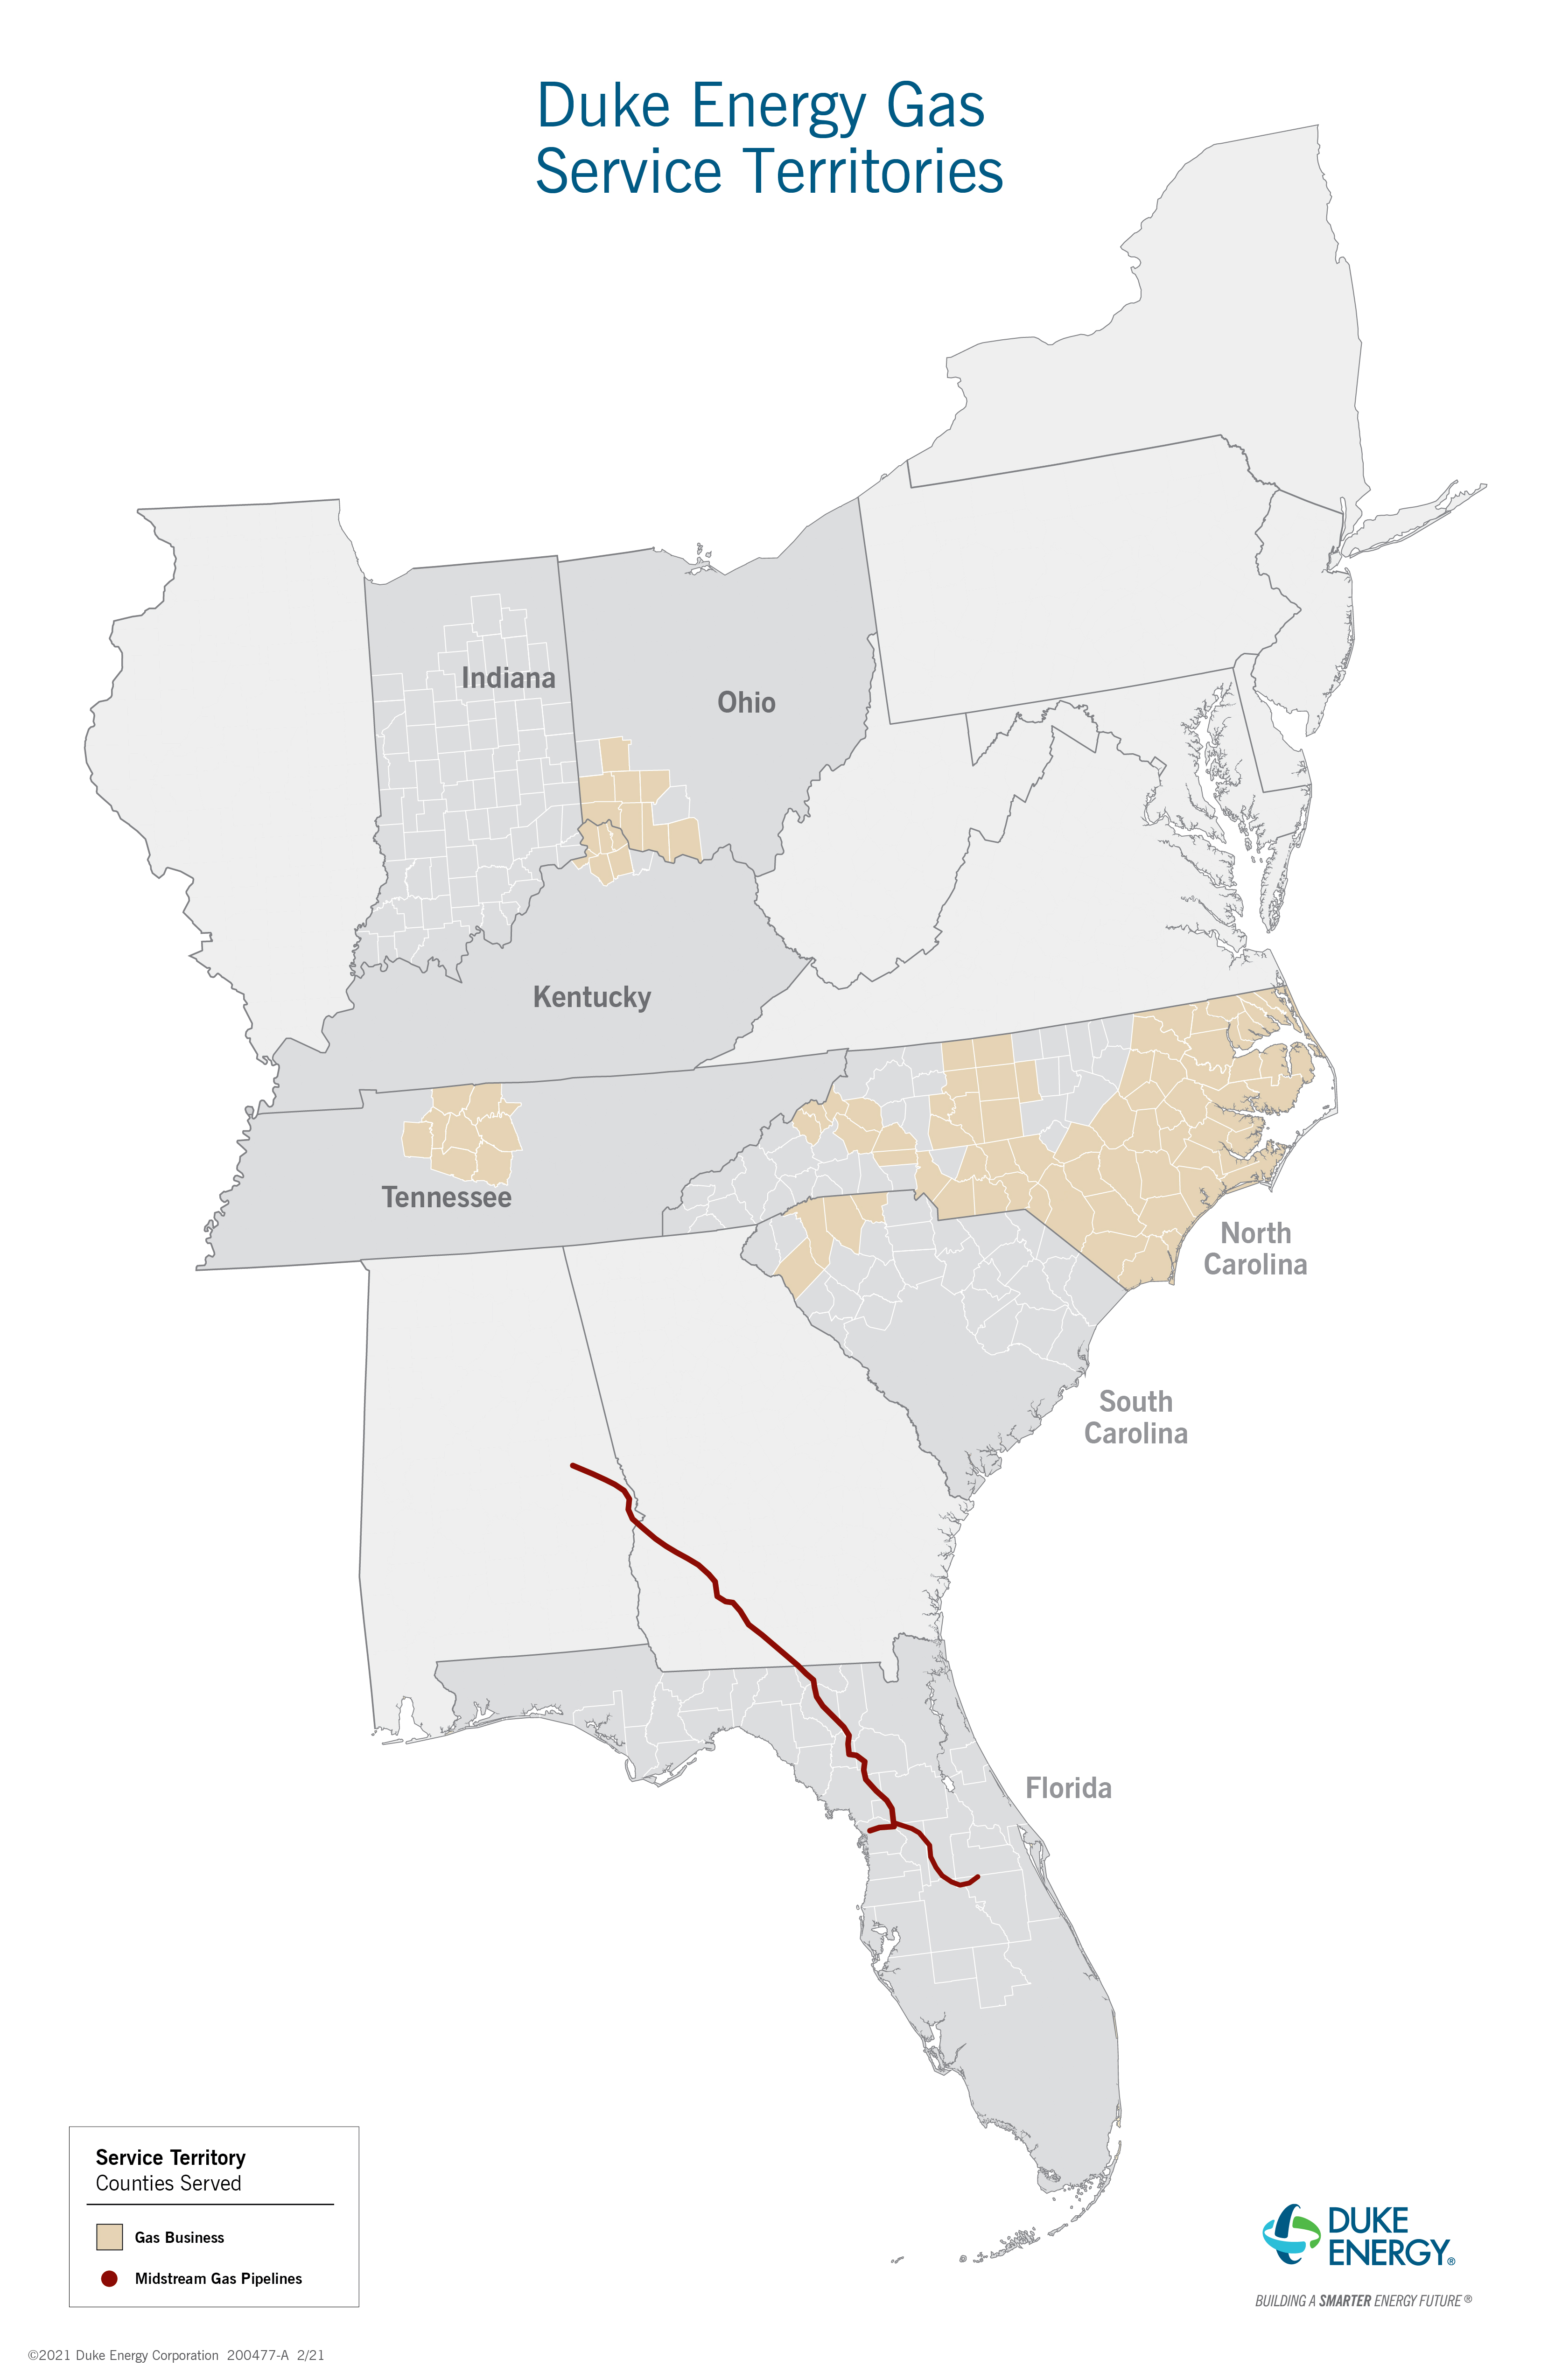
GU&I conducts natural gas operations primarily through the regulated public utilities of Piedmont, Duke Energy Ohio and Duke Energy Kentucky. The natural gas operations are subject to the rules and regulations of the NCUC, PSCSC, PUCO, KPSC, TPUC, PHMSA and the FERC. GU&I serves residential, commercial, industrial and power generation natural gas customers, including customers served by municipalities who are wholesale customers. GU&I has over 1.7 million total customers, including approximately 1.2 million customers located in North Carolina, South Carolina and Tennessee, and an additional 560,000 customers located within southwestern Ohio and northern Kentucky. In the Carolinas, Ohio and Kentucky, the service areas are comprised of numerous cities, towns and communities. In Tennessee, the service area is the metropolitan area of Nashville. The following map shows the service territory and investments in operating pipelines for GU&I as of December 31, 2023.
The number of residential, commercial and industrial customers within the GU&I service territory is expected to increase over time. Average usage per residential customer is expected to remain flat or decline for the foreseeable future; however, decoupled rates in North Carolina and various rate design mechanisms in other jurisdictions partially mitigate the impact of the declining usage per customer on overall profitability.
GU&I also has investments in various pipeline transmission projects, renewable natural gas projects and natural gas storage facilities.
16
| BUSINESS | |||||
Natural Gas for Retail Distribution
GU&I is responsible for the distribution of natural gas to retail customers in its North Carolina, South Carolina, Tennessee, Ohio and Kentucky service territories. GU&I’s natural gas procurement strategy is to contract primarily with major and independent producers and marketers for natural gas supply. It also purchases a diverse portfolio of transportation and storage service from interstate pipelines. This strategy allows GU&I to assure reliable natural gas supply and transportation for its firm customers during peak winter conditions. When firm pipeline services or contracted natural gas supplies are temporarily not needed due to market demand fluctuations, GU&I may release these services and supplies in the secondary market under FERC-approved capacity release provisions and/or make wholesale secondary market sales. In 2023, firm supply purchase commitment agreements provided for approximately 96% of the natural gas supply for both Piedmont and Duke Energy Ohio during the winter months and 100% of forecasted demand was under contract prior to the winter heating season.
Impact of Weather
GU&I revenues are generally protected from the impact of weather fluctuations due to the regulatory mechanisms that are available in most service territories. In North Carolina, margin decoupling provides protection from both weather and other usage variations like conservation for residential and small and medium general service customers. Margin decoupling provides a set margin per customer independent of actual usage. In South Carolina, Tennessee and Kentucky, weather normalization adjusts revenues either up or down depending on how much warmer or colder than normal a given month has been. Weather normalization adjustments occur from November through March in South Carolina, from October through April in Tennessee and from November through April in Kentucky. Duke Energy Ohio collects most of its non-fuel revenue through a fixed monthly charge that is not impacted by usage fluctuations that result from weather changes or conservation.
Competition
GU&I’s businesses operate as the sole provider of natural gas service within their retail service territories. GU&I owns and operates facilities necessary to transport and distribute natural gas. GU&I earns retail margin on the transmission and distribution of natural gas and not on the cost of the underlying commodity. Services are priced by state commission-approved rates designed to include the costs of providing these services and a reasonable return on invested capital. This regulatory policy is intended to provide safe and reliable natural gas service at fair prices.
In residential, commercial and industrial customer markets, natural gas distribution operations compete with other companies that supply energy, primarily electric companies, propane and fuel oil dealers, renewable energy providers and coal companies in relation to sources of energy for electric power plants, as well as nuclear energy. A significant competitive factor is price. GU&I's primary product competition is with electricity for space heating, water heating and cooking. Increases in the price of natural gas or decreases in the price of other energy sources could negatively impact competitive position by decreasing the price benefits of natural gas to the consumer. In the case of industrial customers, such as manufacturing plants, adverse economic or market conditions, including higher natural gas costs, could cause these customers to suspend business operations or to use alternative sources of energy in favor of energy sources with lower per-unit costs.
Higher natural gas costs or decreases in the price of other energy sources may allow competition from alternative energy sources for applications that have traditionally used natural gas, encouraging some customers to move away from natural gas-fired equipment to equipment fueled by other energy sources. Competition between natural gas and other forms of energy is also based on efficiency, performance, reliability, safety and other non-price factors. Technological improvements in other energy sources and events that impair the public perception of the non-price attributes of natural gas could erode our competitive advantage. These factors in turn could decrease the demand for natural gas, impair our ability to attract new customers and cause existing customers to switch to other forms of energy or to bypass our systems in favor of alternative competitive sources. This could result in slow or no customer growth and could cause customers to reduce or cease using our product, thereby reducing our ability to make capital expenditures and otherwise grow our business, adversely affecting our earnings.
Natural Gas Investments
Duke Energy, through its GU&I segment, has a 7.5% equity ownership interest in Sabal Trail. Sabal Trail is a joint venture that owns the Sabal Trail Natural Gas Pipeline (Sabal Trail pipeline) to transport natural gas to Florida, regulated by FERC. The Sabal Trail Phase I mainline was placed into service in July 2017 and traverses Alabama, Georgia and Florida. The remaining lateral line to the Duke Energy Florida's Citrus County CC was placed into service in March 2018. Phase II of Sabal Trail went into service in May 2020, adding approximately 200,000 Dth of capacity to the Sabal Trail pipeline.
Duke Energy, through its GU&I segment, has a 47% equity ownership interest in ACP, which planned to build the ACP pipeline, an approximately 600-mile interstate natural gas pipeline. The ACP pipeline was intended to transport diverse natural gas supplies into southeastern markets and would be regulated by FERC. Dominion Energy owns 53% of ACP and was contracted to construct and operate the ACP pipeline upon completion. On July 5, 2020, Dominion announced a sale of substantially all of its natural gas transmission and storage segment assets, which were critical to the ACP pipeline. Further, permitting delays and legal challenges had materially affected the timing and cost of the pipeline. As a result, Duke Energy determined that they would no longer invest in the construction of the ACP pipeline.
Duke Energy, also through its GU&I segment, has investments in various renewable natural gas joint ventures.
GU&I has a 21.49% equity ownership interest in Cardinal, an intrastate pipeline located in North Carolina regulated by the NCUC, a 45% equity ownership in Pine Needle, an interstate liquefied natural gas storage facility located in North Carolina and a 50% equity ownership interest in Hardy Storage, an underground interstate natural gas storage facility located in Hardy and Hampshire counties in West Virginia. Pine Needle and Hardy Storage are regulated by FERC.
KO Transmission Company (KO Transmission), a wholly owned subsidiary of Duke Energy Ohio, is an interstate pipeline company engaged in the business of transporting natural gas and is subject to the rules and regulations of FERC. KO Transmission's 90-mile pipeline supplies natural gas to Duke Energy Ohio and interconnects with the Columbia Gulf Transmission pipeline and Tennessee Gas Pipeline. An approximately 70-mile portion of KO Transmission's pipeline facilities was co-owned by Columbia Gas Transmission, LLC. KO Transmission sold all of its pipeline facilities and related real property to Columbia Gas Transmission, LLC on February 1, 2023, for approximately book value.
See Notes 4, 13 and 18 to the Consolidated Financial Statements, "Regulatory Matters," "Investments in Unconsolidated Affiliates" and "Variable Interest Entities," respectively, for further information on Duke Energy's and GU&I's natural gas investments.
17
| BUSINESS | |||||
Inventory
GU&I must maintain adequate natural gas inventory in order to provide reliable delivery to customers. As of December 31, 2023, the inventory balance for GU&I was $129 million. For more information on inventory, see Note 1 to the Consolidated Financial Statements, "Summary of Significant Accounting Policies."
Regulation
State
The state gas utility commissions approve rates for Duke Energy's retail natural gas service within their respective states. The state gas utility commissions, to varying degrees, have authority over the construction and operation of GU&I’s natural gas distribution facilities. CPCNs issued by the state gas utility commissions or other government agencies, as applicable, authorize GU&I to construct and operate its natural gas distribution facilities and to sell natural gas to retail and wholesale customers. Prior approval from the relevant state gas utility commission is required for GU&I to issue securities. The underlying concept of utility ratemaking is to set rates at a level that allows the utility to collect revenues equal to its cost of providing service plus a reasonable rate of return on its invested capital, including equity.
In addition to amounts collected from customers through approved base rates, each of the state gas utility commissions allow recovery of certain costs through various cost recovery clauses to the extent the respective commission determines in periodic hearings that such costs, including any past over- or under-recovered costs, are prudent.
Natural gas costs are eligible for recovery by GU&I. Due to the associated regulatory treatment and the method allowed for recovery, changes in natural gas costs from year to year have no material impact on operating results of GU&I, unless a commission finds a portion of such costs to have been imprudent. However, delays between the expenditure for natural gas and recovery from customers can adversely impact the timing of cash flows of GU&I.
The following table summarizes certain components underlying significant recently approved and effective base rates or ARM filings in the last three years.
Regulatory Body | Annual Increase (Decrease) (in millions) | Return on Equity | Equity Component of Capital Structure | Effective Date | ||||||||||||||||||||||
| Approved Rate Cases: | ||||||||||||||||||||||||||
| Duke Energy Ohio 2022 Natural Gas Base Rate Case | PUCO | $ | 32 | 9.6 | % | 52.32 | % | November 2023 | ||||||||||||||||||
Piedmont 2023 Tennessee Annual Review Mechanism | TPUC | 40 | 9.8 | % | 48.67 | % | October 2023 | |||||||||||||||||||
Duke Energy Kentucky 2021 Natural Gas Base Rate Case(a) | KPSC | 9 | 9.375 | % | 51.344 | % | January 2022 | |||||||||||||||||||
| Piedmont 2021 North Carolina Natural Gas Base Rate Case | NCUC | 67 | 9.6 | % | 51.60 | % | November 2021 | |||||||||||||||||||
| Piedmont 2020 Tennessee Natural Gas Base Rate Case | TPUC | 16 | 9.8 | % | 50.50 | % | January 2021 | |||||||||||||||||||
(a) An ROE of 9.3% for natural gas riders was approved.
GU&I has an IMR mechanism in North Carolina designed to separately track and recover certain costs associated with capital investments incurred to comply with federal pipeline safety and integrity programs. Piedmont has withdrawn from the Tennessee IMR mechanism subsequent to the authorization of the Tennessee Annual Review Mechanism effective January 2022. The following table summarizes information related to the recently approved IMR filing.
| Cumulative | Annual | Effective | |||||||||||||||
| (in millions) | Investment | Revenues | Date | ||||||||||||||
| Piedmont 2022 IMR Filing – North Carolina | $ | 213 | $ | 20 | December 2022 | ||||||||||||
In Ohio, GU&I has a CEP Rider designed to recover costs between rate cases on PUCO approved capital expenditures. Duke Energy Ohio submits a filing each year for incremental investments to increase the revenue requirement up to the approved annual residential rate cap increase. The cumulative investment under the CEP Rider is $164 million with total annual revenue requirement of $17 million with rates effective November 1, 2023.
For more information on rate matters and other regulatory proceedings, see Note 4 to the Consolidated Financial Statements, “Regulatory Matters.”
18
| BUSINESS | |||||
Federal
GU&I is subject to various federal regulations, including regulations that are particular to the natural gas industry. These federal regulations include but are not limited to the following:
•Regulations of the FERC affect the certification and siting of new interstate natural gas pipeline projects, the purchase and sale of, the prices paid for, and the terms and conditions of service for the interstate transportation and storage of natural gas.
•Regulations of the PHMSA affect the design, construction, operation, maintenance, integrity, safety and security of natural gas distribution and transmission systems.
•Regulations of the EPA relate to the environment including proposed air emissions regulations that would expand to include emissions of methane.
Regulations of the FERC and the state gas utility commissions govern access to regulated natural gas and other data by nonregulated entities and services provided between regulated and nonregulated energy affiliates. These regulations affect the activities of nonregulated affiliates with GU&I.
Environmental
GU&I is subject to the jurisdiction of the EPA and state and local environmental agencies. For a discussion of environmental regulation, see “Environmental Matters” in this section. See “Other Matters” section of Item 7 Management's Discussion and Analysis for a discussion about potential Global Climate Change legislation and other EPA regulations under development and the potential impacts such legislation and regulation could have on Duke Energy’s operations.
OTHER
The remainder of Duke Energy’s operations is presented as Other. While it is not a business segment, Other primarily includes interest expense on holding company debt, unallocated corporate costs, certain income tax amounts, amounts related to certain companywide initiatives and contributions made to the Duke Energy Foundation. Other also includes Bison and an investment in NMC.
The Duke Energy Foundation is a nonprofit organization funded by Duke Energy shareholders that makes charitable contributions to selected nonprofits and government subdivisions.
Bison, a wholly owned subsidiary of Duke Energy, is a captive insurance company with the principal activity of providing Duke Energy subsidiaries with indemnification for financial losses primarily related to property, workers’ compensation and general liability.
Duke Energy owns a 17.5% equity interest in NMC. The joint venture company has production facilities in Jubail, Saudi Arabia, where it manufactures certain petrochemicals and plastics. NMC annually produces approximately 1 million metric tons each of MTBE and methanol and has the capacity to produce 50,000 metric tons of polyacetal. The main feedstocks to produce these products are natural gas and butane. Duke Energy records the investment activity of NMC using the equity method of accounting and retains 25% of NMC's board of directors' representation and voting rights.
Human Capital Management
Governance
Our employees are critical to the success of our company. Our Human Resources organization is responsible for our human capital management strategy, which includes recruiting and hiring, onboarding and training, diversity and inclusion, workforce planning, talent and succession planning, performance management and employee development. Key areas of focus include fostering a high-performance and inclusive culture built on strong leadership and highly engaged and diverse employees, building a pipeline of skilled workers and ensuring knowledge transfer as employees retire.
Our Board of Directors provides oversight on certain human capital management matters, primarily through the Compensation and People Development Committee, which is responsible for reviewing strategies and policies related to human capital management, including with respect to matters such as diversity and inclusion, employee engagement and talent development.
Employees
On December 31, 2023, Duke Energy had a total of 27,037 full-time, part-time and temporary employees, the majority of which were full-time employees. The total includes 5,054 employees who are represented by labor unions under various collective bargaining agreements that generally cover wages, benefits, working practices, and other terms and conditions of employment.
Compensation
The Company seeks to attract and retain an appropriately qualified workforce and leverages Duke Energy’s leadership imperatives to foster a culture focused on customers, innovation, and highly engaged employees. Our compensation program is market driven and designed to link pay to performance with the goal of attracting and retaining talented employees, rewarding individual performance, and encouraging long-term commitment to our business. Our market competitive pay program includes short-term and long-term variable pay components that help to align the interests of Duke Energy to our customers and shareholders. In addition to competitive base pay, we provide eligible employees with compensation and benefits under a variety of plans and programs, including health care benefits, retirement savings, pension, health savings and flexible spending accounts, wellness, family leaves, employee assistance, as well as other benefits including a charitable matching program. The Company is committed to providing market competitive, fair, and equitable compensation and regularly conducts internal pay equity reviews, and benchmarking against peer companies to ensure our pay is competitive.
19
| BUSINESS | |||||
Diversity and Inclusion
Duke Energy is committed to continuing to build a diverse workforce that reflects the communities we serve while strengthening a culture of inclusion where all employees and customers feel respected and valued. Our goals include attracting and retaining the talent needed and rewarding performance to enable us to reach our strategic objectives. The Enterprise Diversity and Inclusion Council, chaired by our Executive Vice President and Chief Executive Officer, Duke Energy Florida and Midwest in 2023, monitors the effectiveness and execution of our diversity and inclusion strategy and programs. Employee-led councils are also embedded across the Company in our business units and focus on the specific diversity and inclusion needs of the business and help drive inclusion deeper into the employee experience. Leaders and individual contributors also have the opportunity to participate in voluntary diversity and inclusion training and facilitated conversations on insightful topics offered to further our commitment to building and enabling an inclusive work environment.
In 2022, our aspirational goals included achieving workforce representation of at least 25% for women and 20% for people of color. In 2023, we established new aspirational goals of 28% for women and 23% for people of color. We continue to strive toward reaching these aspirational goals and as of December 31, 2023, our workforce consisted of approximately 23.6% women and 20.5% people of color.
The Company also has 10 Employee Resource Groups (ERGs), with 38 chapters and more than 6,700 employees participating. ERGs are networks of employees formed around a common dimension of diversity whose goals and objectives align with the Company's goals and objectives. These groups focus on employee professional development and networking, community outreach, cultural awareness, recruiting and retention. They also serve as a resource to the Company for advocacy and community outreach and improving customer service through innovation. ERG-sponsored forums include networking events, mentoring, scholarship banquets for aspiring college students, and workshops on topics such as time management, stress reduction, career planning and work-life balance. Our ERGs are open to all employees.
Among other efforts, the Company has developed partnerships with community organizations, community colleges and historically Black colleges and universities (HBCUs) to support our strategy of building a diverse and highly skilled talent pipeline.
Operational Excellence
The foundation for our growth and success is our continued focus on operational excellence, the leading indicator of which is safety. As such, the safety of our workforce remains our top priority. The Company closely monitors the total incident case rate (TICR), which is a metric based on strict OSHA definitions that measures the number of occupational injuries and illnesses per 100 employees. This objective emphasizes our focus on achieving an event-free and injury-free workplace. As an indication of our commitment to safety, we include safety metrics in both the short-term and long-term incentive plans based on the TICR for employees. Our employees delivered strong safety results in 2023, consistent with our industry-leading performance levels since 2018.
20
| BUSINESS | |||||
Information about Our Executive Officers
The following table sets forth the individuals who currently serve as executive officers. Executive officers serve until their successors are duly elected or appointed.
| Name | Age(a) | Current and Recent Positions Held | ||||||||||||
| Lynn J. Good | 64 | Chair, President and Chief Executive Officer. Ms. Good has served as Chair, President and Chief Executive Officer of Duke Energy since January 1, 2016, and was Vice Chairman, President and Chief Executive Officer of Duke Energy from July 2013 through December 2015. Prior to that, she served as Executive Vice President and Chief Financial Officer since 2009. | ||||||||||||
| Brian D. Savoy | 48 | Executive Vice President and Chief Financial Officer. Mr. Savoy assumed his current position in September 2022. Prior to that, he served as Executive Vice President, Chief Strategy and Commercial Officer from May 2021 through August 2022; Senior Vice President, Chief Transformation and Administrative Officer from October 2019 through April 2021; Senior Vice President, Business Transformation and Technology from May 2016 through September 2019; Senior Vice President, Controller and Chief Accounting Officer from September 2013 to May 2016; Director, Forecasting and Analysis from 2009 to September 2013; and Vice President and Controller of the Commercial Power segment from 2006 to 2009. | ||||||||||||
| Kodwo Ghartey-Tagoe | 60 | Executive Vice President, Chief Legal Officer and Corporate Secretary. Mr. Ghartey-Tagoe assumed his current position in May 2020. He was appointed Executive Vice President and Chief Legal Officer in October 2019 after serving as President, South Carolina since 2017. Mr. Ghartey-Tagoe joined Duke Energy in 2002 and has held numerous leadership positions in Duke Energy’s Legal Department, including Duke Energy's Senior Vice President of State and Federal Regulatory Legal Support. | ||||||||||||
| T. Preston Gillespie | 61 | Executive Vice President, Chief Generation Officer and Enterprise Operational Excellence. Mr. Gillespie assumed his current position in January 2023. Prior to that, he served as the Chief Generation Officer since 2020. | ||||||||||||
| R. Alexander Glenn | 58 | Executive Vice President and Chief Executive Officer, Duke Energy Florida and Midwest. Mr. Glenn assumed his current position in March 2023. Prior to that, he served as Senior Vice President and Chief Executive Officer, Duke Energy Florida and Midwest from May 2021 to March 2023; Senior Vice President, State and Federal Regulatory Legal Support from 2017 to May 2021; and State President of Duke Energy Florida's operations from 2012 to 2017. | ||||||||||||
| Julia S. Janson | 59 | Executive Vice President and Chief Executive Officer, Duke Energy Carolinas. Ms. Janson assumed her current position in May 2021. Prior to that, she served as Executive Vice President, External Affairs and President, Carolinas Region since October 2019 and the position of Executive Vice President, External Affairs and Chief Legal Officer since November 2018. She originally assumed the position of Executive Vice President, Chief Legal Officer and Corporate Secretary in December 2012 and then assumed the responsibilities for External Affairs in February 2016. | ||||||||||||
| Cynthia S. Lee | 57 | Vice President, Chief Accounting Officer and Controller. Ms. Lee assumed her current position in May 2021. Prior to that, she served as Director, Investor Relations since June 2019 and in various roles within the Corporate Controller's organization after joining the Corporation and its affiliates in 2002. | ||||||||||||
| Ronald R. Reising | 63 | Adviser to the Chair, President, and Chief Executive Officer. Mr. Reising assumed his current position in January 2024. Prior to that, he served as Executive Vice President and Chief Human Resources Officer from April 2023 to December 2023; Senior Vice President and Chief Human Resource Officer from July 2020 to March 2023; Senior Vice President of Operations Support from 2014 to July 2020; and Chief Procurement Officer from 2006 to 2014. | ||||||||||||
| Louis E. Renjel | 50 | Executive Vice President, External Affairs and Communications. Mr. Renjel assumed his current position in March 2023. Prior to that, he served as Senior Vice President, External Affairs and Communications from May 2021 to March 2023; Senior Vice President of Federal Government and Corporate Affairs from 2019 to May 2021; and Vice President, Federal Government Affairs and Strategic Policy from March 2017 to 2019. Prior to joining Duke Energy, Mr. Renjel served as Vice President of Strategic Infrastructure from 2009 to March 2017 for CSX Corp and as their Director of Environmental and Government Affairs from 2006 to 2008. | ||||||||||||
| Harry K. Sideris | 53 | Executive Vice President, Customer Experience, Solutions and Services. Mr. Sideris assumed his current position in October 2019. Prior to that, he served as Senior Vice President and Chief Distribution Officer from June 2018 to October 2019; State President, Florida from January 2017 to June 2018; Senior Vice President of Environmental Health and Safety from August 2014 to January 2017; and Vice President of Power Generations for the Company's Fossil/Hydro Operations in the western portions of North Carolina and South Carolina from July 2012 to August 2014. | ||||||||||||
| Steven K. Young | 65 | Executive Vice President and Chief Commercial Officer. Mr. Young assumed his current position in September 2022. Prior to that, he held the position of Executive Vice President and Chief Financial Officer from August 2013 through August 2022; Vice President, Chief Accounting Officer and Controller, assuming the role of Chief Accounting Officer in July 2012 and the role of Controller in December 2006. | ||||||||||||
(a) The ages of the officers provided are as of January 31, 2024.
There are no family relationships between any of the executive officers, nor any arrangement or understanding between any executive officer and any other person involved in officer selection.
21
| BUSINESS | |||||
Environmental Matters
The Duke Energy Registrants are subject to federal, state and local laws and regulations with regard to air and water quality, hazardous and solid waste disposal and other environmental matters. Environmental laws and regulations affecting the Duke Energy Registrants include, but are not limited to:
•The Clean Air Act, as well as state laws and regulations impacting air emissions, including State Implementation Plans related to existing and new national ambient air quality standards for ozone and particulate matter. Owners and/or operators of air emission sources are responsible for obtaining permits and for annual compliance and reporting.
•The Clean Water Act, which requires permits for facilities that discharge wastewaters into navigable waters.
•The Comprehensive Environmental Response, Compensation and Liability Act, which can require any individual or entity that currently owns or in the past owned or operated a disposal site, as well as transporters or generators of hazardous substances sent to a disposal site, to share in remediation costs.
•The National Environmental Policy Act, which requires federal agencies to consider potential environmental impacts in their permitting and licensing decisions, including siting approvals.
•The CCR Rule, a 2015 EPA rule establishing national regulations to provide a comprehensive set of requirements for the management and disposal of CCR from coal-fired power plants.
•Coal Ash Act, as amended, which establishes requirements regarding the use and closure of existing ash basins, the disposal of ash at active coal plants and the handling of surface water and groundwater impacts from ash basins in North Carolina.
•The Solid Waste Disposal Act, as amended by RCRA, which creates a framework for the proper management of hazardous and nonhazardous solid waste; classifies CCR as nonhazardous waste; and establishes standards for landfill and surface impoundment placement, design, operation and closure, groundwater monitoring, corrective action, and post-closure care.
•The Toxic Substances Control Act, which gives EPA the authority to require reporting, recordkeeping and testing requirements, and to place restrictions relating to chemical substances and/or mixtures, including polychlorinated biphenyls.
For more information on environmental matters, see Notes 5 and 10 to the Consolidated Financial Statements, “Commitments and Contingencies – Environmental” and "Asset Retirement Obligations," respectively, and the “Other Matters” section of Item 7 Management's Discussion and Analysis. Except as otherwise described in these sections, costs to comply with current federal, state and local provisions regulating the discharge of materials into the environment or other potential costs related to protecting the environment are incorporated into the routine cost structure of our various business segments and are not expected to have a material adverse effect on the competitive position, consolidated results of operations, cash flows or financial position of the Duke Energy Registrants.
The "Other Matters" section of Item 7 Management's Discussion and Analysis includes more information on certain environmental regulations and a discussion of Global Climate Change including the potential impact of current and future legislation related to GHG emissions on the Duke Energy Registrants' operations. Recently passed and potential future environmental statutes and regulations could have a significant impact on the Duke Energy Registrants’ results of operations, cash flows or financial position. However, if and when such statutes and regulations become effective, the Duke Energy Registrants will seek appropriate regulatory recovery of costs to comply within its regulated operations.
DUKE ENERGY CAROLINAS
Duke Energy Carolinas is a regulated public utility primarily engaged in the generation, transmission, distribution and sale of electricity in portions of North Carolina and South Carolina. Duke Energy Carolinas’ service area covers approximately 24,000 square miles and supplies electric service to approximately 2.9 million residential, commercial and industrial customers. For information about Duke Energy Carolinas’ generating facilities, see Item 2, “Properties.” Duke Energy Carolinas is subject to the regulatory provisions of the NCUC, PSCSC, NRC and FERC.
Substantially all of Duke Energy Carolinas' operations are regulated and qualify for regulatory accounting. Duke Energy Carolinas operates one reportable business segment, EU&I. For additional information regarding this business segment, including financial information, see Note 3 to the Consolidated Financial Statements, “Business Segments.”
PROGRESS ENERGY
Progress Energy is a public utility holding company primarily engaged in the regulated electric utility business and is subject to regulation by the FERC. Progress Energy conducts operations through its wholly owned subsidiaries, Duke Energy Progress and Duke Energy Florida. When discussing Progress Energy’s financial information, it necessarily includes the results of Duke Energy Progress and Duke Energy Florida.
Substantially all of Progress Energy’s operations are regulated and qualify for regulatory accounting. Progress Energy operates one reportable business segment, EU&I. For additional information regarding this business segment, including financial information, see Note 3 to the Consolidated Financial Statements, “Business Segments.”
DUKE ENERGY PROGRESS
Duke Energy Progress is a regulated public utility primarily engaged in the generation, transmission, distribution and sale of electricity in portions of North Carolina and South Carolina. Duke Energy Progress’ service area covers approximately 28,000 square miles and supplies electric service to approximately 1.7 million residential, commercial and industrial customers.
For information about Duke Energy Progress’ generating facilities, see Item 2, “Properties.” Duke Energy Progress is subject to the regulatory provisions of the NCUC, PSCSC, NRC and FERC. Substantially all of Duke Energy Progress’ operations are regulated and qualify for regulatory accounting. Duke Energy Progress operates one reportable business segment, EU&I. For additional information regarding this business segment, including financial information, see Note 3 to the Consolidated Financial Statements, “Business Segments.”
22
PART I
DUKE ENERGY FLORIDA
Duke Energy Florida is a regulated public utility primarily engaged in the generation, transmission, distribution and sale of electricity in portions of Florida. Duke Energy Florida’s service area covers approximately 13,000 square miles and supplies electric service to approximately 2 million residential, commercial and industrial customers. For information about Duke Energy Florida’s generating facilities, see Item 2, “Properties.” Duke Energy Florida is subject to the regulatory provisions of the FPSC, NRC and FERC.
Substantially all of Duke Energy Florida’s operations are regulated and qualify for regulatory accounting. Duke Energy Florida operates one reportable business segment, EU&I. For additional information regarding this business segment, including financial information, see Note 3 to the Consolidated Financial Statements, “Business Segments.”
DUKE ENERGY OHIO
Duke Energy Ohio is a regulated public utility primarily engaged in the transmission and distribution of electricity in portions of Ohio and Kentucky, in the generation and sale of electricity in portions of Kentucky and the transportation and sale of natural gas in portions of Ohio and Kentucky. Duke Energy Ohio also conducts competitive auctions for retail electricity supply in Ohio whereby recovery of the energy price is from retail customers. Operations in Kentucky are conducted through Duke Energy Ohio's wholly owned subsidiary, Duke Energy Kentucky. References herein to Duke Energy Ohio include Duke Energy Ohio and its subsidiaries, unless otherwise noted. Duke Energy Ohio is subject to the regulatory provisions of the PUCO, KPSC, PHMSA and FERC.
Duke Energy Ohio’s service area covers approximately 3,000 square miles and supplies electric service to approximately 910,000 residential, commercial and industrial customers and provides transmission and distribution services for natural gas to approximately 560,000 customers. For information about Duke Energy Ohio's generating facilities and natural gas distribution facilities, see Item 2, “Properties.”
KO Transmission, a wholly owned subsidiary of Duke Energy Ohio, is an interstate pipeline company engaged in the business of transporting natural gas and is subject to the rules and regulations of FERC. KO Transmission's 90-mile pipeline supplies natural gas to Duke Energy Ohio and interconnects with the Columbia Gulf Transmission pipeline and Tennessee Gas Pipeline. An approximately 70-mile portion of KO Transmission's pipeline facilities was co-owned by Columbia Gas Transmission, LLC. KO Transmission sold all of its pipeline facilities and related real property to Columbia Gas Transmission, LLC on February 1, 2023, for approximately book value.
Substantially all of Duke Energy Ohio's operations are regulated and qualify for regulatory accounting. Duke Energy Ohio has two reportable segments, EU&I and GU&I. For additional information on these business segments, including financial information, see Note 3 to the Consolidated Financial Statements, “Business Segments.”
DUKE ENERGY INDIANA
Duke Energy Indiana is a regulated public utility primarily engaged in the generation, transmission, distribution and sale of electricity in portions of Indiana. Duke Energy Indiana’s service area covers approximately 23,000 square miles and supplies electric service to approximately 900,000 residential, commercial and industrial customers. For information about Duke Energy Indiana's generating facilities, see Item 2, “Properties.” Duke Energy Indiana is subject to the regulatory provisions of the IURC and FERC.
In 2021, Duke Energy executed an agreement providing for an investment in Duke Energy Indiana by GIC. The transaction was completed following two closings. For additional information, see Note 2 to the Consolidated Financial Statements, "Dispositions."
Substantially all of Duke Energy Indiana’s operations are regulated and qualify for regulatory accounting. Duke Energy Indiana operates one reportable business segment, EU&I. For additional information regarding this business segment, including financial information, see Note 3 to the Consolidated Financial Statements, “Business Segments.”
PIEDMONT
Piedmont is a regulated public utility primarily engaged in the distribution of natural gas to approximately 1.2 million residential, commercial, industrial and power generation customers in portions of North Carolina, South Carolina and Tennessee, including customers served by municipalities who are wholesale customers. For information about Piedmont's natural gas distribution facilities, see Item 2, "Properties." Piedmont is subject to the regulatory provisions of the NCUC, PSCSC, TPUC, PHMSA and FERC.
Substantially all of Piedmont’s operations are regulated and qualify for regulatory accounting. Piedmont operates one reportable business segment, GU&I. For additional information regarding this business segment, including financial information, see Note 3 to the Consolidated Financial Statements, “Business Segments.”
ITEM 1A. RISK FACTORS
In addition to other disclosures within this Form 10-K, including "Management's Discussion and Analysis of Financial Condition and Results of Operations – Matters Impacting Future Results" for each registrant in Item 7, and other documents filed with the SEC from time to time, the following factors should be considered in evaluating Duke Energy and its subsidiaries. Such factors could affect actual results of operations and cause results to differ substantially from those currently expected or sought. Unless otherwise indicated, risk factors discussed below generally relate to risks associated with all of the Duke Energy Registrants. Risks identified at the Subsidiary Registrant level are generally applicable to Duke Energy.
23
| RISK FACTORS | |||||
BUSINESS STRATEGY RISKS
Duke Energy’s future results could be adversely affected if it is unable to implement its business strategy including achieving its carbon emissions reduction goals.
Duke Energy’s results of operations depend, in significant part, on the extent to which it can implement its business strategy successfully. Duke Energy's clean energy transition, which includes achieving net-zero carbon emissions from electricity generation by 2050, modernizing the regulatory construct, transforming the customer experience, and digital transformation, is subject to business, policy, regulatory, technology, economic and competitive uncertainties and contingencies, many of which are beyond its control and may make those goals difficult to achieve.
Federal or state policies could be enacted that restrict the availability of fuels or generation technologies, such as natural gas or nuclear power, that enable Duke Energy to reduce its carbon emissions. Supportive policies may be needed to facilitate the siting and cost recovery of transmission and distribution upgrades needed to accommodate the build out of large volumes of renewables and energy storage. Further, the approval of our state regulators will be necessary for the Company to continue to retire existing carbon emitting assets or make investments in new generating capacity. The Company may be constrained by the ability to procure resources or labor needed to build new generation at a reasonable price as well as to construct projects on time. In addition, new technologies that are not yet commercially available or are unproven at utility scale will likely be needed including new resources capable of following electric load over long durations such as advanced nuclear, hydrogen and long-duration storage. If these technologies are not developed or are not available at reasonable prices, or if we invest in early stage technologies that are then supplanted by technological breakthroughs, Duke Energy’s ability to achieve a net-zero target by 2050 at a cost-effective price could be at risk.
Achieving our carbon reduction goals will require continued operation of our existing carbon-free technologies including nuclear and renewables. The rapid transition to and expansion of certain low-carbon resources, such as renewables without cost-effective storage, may challenge our ability to meet customer expectations of reliability in a carbon constrained environment. Our nuclear fleet is central to our ability to meet these objectives and customer expectations. We are continuing to seek to renew the operating licenses of the 11 reactors we operate at six nuclear stations for an additional 20 years, extending their operating lives to and beyond midcentury. Failure to receive approval from the NRC for the relicensing of any of these reactors could affect our ability to achieve a net-zero target by 2050.
As a consequence, Duke Energy may not be able to fully implement or realize the anticipated results of its energy transition strategy, which may have an adverse effect on its financial condition.
REGULATORY, LEGISLATIVE AND LEGAL RISKS
The Duke Energy Registrants’ regulated utility revenues, earnings and results of operations are dependent on state legislation and regulation that affect electric generation, electric and natural gas transmission, distribution and related activities, which may limit their ability to recover costs.
The Duke Energy Registrants’ regulated electric and natural gas utility businesses are regulated on a cost-of-service/rate-of-return basis subject to statutes and regulatory commission rules and procedures of North Carolina, South Carolina, Florida, Ohio, Tennessee, Indiana and Kentucky. If the Duke Energy Registrants’ regulated utility earnings exceed the returns established by the state utility commissions, retail electric and natural gas rates may be subject to review and possible reduction by the commissions, which may decrease the Duke Energy Registrants’ earnings. Additionally, if regulatory or legislative bodies do not allow recovery of costs incurred in providing service, or do not do so on a timely basis, the Duke Energy Registrants’ earnings could be negatively impacted. Differences in regulation between jurisdictions with concurrent operations, such as North Carolina and South Carolina in Duke Energy Carolinas' and Duke Energy Progress' service territory, may also result in failure to recover costs.
If legislative and regulatory structures were to evolve in such a way that the Duke Energy Registrants’ exclusive rights to serve their regulated customers were eroded, their earnings could be negatively impacted. Federal and state regulations, laws, commercialization and reduction of costs and other efforts designed to promote and expand the use of EE measures and distributed generation technologies, such as private solar and battery storage, in Duke Energy service territories could reduce recovery of fixed costs in Duke Energy service territories or result in customers leaving the electric distribution system and an increase in customer net energy metering, which allows customers with private solar to receive bill credits for surplus power up to the full retail credit amount. Over time, customer adoption of these technologies could result in Duke Energy not being able to fully recover the costs and investment in generation.
State regulators have approved various mechanisms to stabilize natural gas utility margins, including margin decoupling in North Carolina and rate stabilization in South Carolina. Additionally, certain jurisdictions have established performance incentive mechanisms and revenue decoupling mechanisms for EU&I. Performance incentive mechanisms condition some portion of the respective utility's earnings on its performance on established measurable consumer, utility system, or public policy outcomes. Revenue decoupling mechanisms provide periodic rate adjustments to ensure actual revenues match allowed revenues for certain customer classes. State regulators have also approved other margin stabilizing mechanisms that, for example, allow for recovery of margin losses associated with negotiated transactions designed to retain large volume customers that could use alternative fuels or that may otherwise directly access natural gas supply through their own connection to an interstate pipeline. If regulators decided to discontinue the Duke Energy Registrants' use of tariff mechanisms or other mechanisms intended to stabilize utility margins, it would negatively impact results of operations, financial position and cash flows. In addition, regulatory authorities also review whether natural gas costs are prudently incurred and can disallow the recovery of a portion of natural gas costs that the Duke Energy Registrants seek to recover from customers, which would adversely impact earnings.
The rates that the Duke Energy Registrants’ regulated utility businesses are allowed to charge are established by state utility commissions in rate case proceedings, which may limit their ability to recover costs and earn an appropriate return on investment.
The rates that the Duke Energy Registrants’ regulated utility businesses are allowed to charge significantly influences the results of operations, financial position and cash flows of the Duke Energy Registrants. The regulation of the rates that the regulated utility businesses charge customers is determined, in large part, by state utility commissions in rate case proceedings. Negative decisions made by these regulators, or by any court on appeal of a rate case proceeding, have, and in the future could have, a material adverse effect on the Duke Energy Registrants’ results of operations, financial position or cash flows and affect the ability of the Duke Energy Registrants to adequately recover costs on a timely basis, including an appropriate return on the significant infrastructure investments being made.
24
| RISK FACTORS | |||||
Deregulation or restructuring in the electric industry may result in increased competition and unrecovered costs that could adversely affect the Duke Energy Registrants’ results of operations, financial position or cash flows and their utility businesses.
Increased competition resulting from deregulation or restructuring legislation could have a significant adverse impact on the Duke Energy Registrants’ results of operations, financial position or cash flows and their utility businesses. If the retail jurisdictions served by the Duke Energy Registrants become subject to deregulation, the impairment of assets, loss of retail customers, lower profit margins or increased costs of capital, and recovery of stranded costs could have a significant adverse financial impact on the Duke Energy Registrants. Stranded costs primarily include the generation assets of the Duke Energy Registrants whose value in a competitive marketplace may be less than their current book value, as well as above-market purchased power commitments from QFs from whom the Duke Energy Registrants are legally obligated to purchase energy at an avoided cost rate under PURPA. The Duke Energy Registrants cannot predict the extent and timing of entry by additional competitors into the electric markets. The Duke Energy Registrants cannot predict if or when they will be subject to changes in legislation or regulation, nor can they predict the impact of these changes on their results of operations, financial position or cash flows.
The Duke Energy Registrants’ businesses are subject to extensive federal regulation and a wide variety of laws and governmental policies, including taxes and environmental regulations, that may change over time in ways that affect operations and costs.
The Duke Energy Registrants are subject to regulations under a wide variety of U.S. federal and state regulations and policies, including by FERC, NRC, EPA and various other federal agencies as well as the North American Electric Reliability Corporation. Regulation affects almost every aspect of the Duke Energy Registrants’ businesses, including, among other things, their ability to: take fundamental business management actions; determine the terms and rates of transmission and distribution services; make acquisitions; issue equity or debt securities; engage in transactions with other subsidiaries and affiliates; and pay dividends upstream to the Duke Energy Registrants. Changes to federal regulations are continuous and ongoing. There can be no assurance that laws, regulations and policies will not be changed in ways that result in material modifications of business models and objectives or affect returns on investment by restricting activities and products, subjecting them to escalating costs, causing delays, or prohibiting them outright.
The Duke Energy Registrants are subject to numerous environmental laws and regulations requiring significant capital expenditures that can increase the cost of operations, and which may impact or limit business plans, or cause exposure to environmental liabilities.
The Duke Energy Registrants are subject to numerous environmental laws and regulations affecting many aspects of their present and future operations, including CCRs, air emissions, water quality, wastewater discharges, solid waste and hazardous waste. These laws and regulations can result in increased capital, operating and other costs. These laws and regulations generally require the Duke Energy Registrants to obtain and comply with a wide variety of environmental licenses, permits, inspections and other approvals. Compliance with environmental laws and regulations can require significant expenditures, including expenditures for cleanup costs and damages arising from contaminated properties. Failure to comply with environmental regulations may result in the imposition of fines, penalties and injunctive measures affecting operating assets, as well as reputational damage. The steps the Duke Energy Registrants could be required to take to ensure their facilities are in compliance could be prohibitively expensive. As a result, the Duke Energy Registrants may be required to shut down or alter the operation of their facilities, which may cause the Duke Energy Registrants to incur losses. Further, the Duke Energy Registrants may not be successful in recovering capital and operating costs incurred to comply with new environmental regulations through existing regulatory rate structures and their contracts with customers. Also, the Duke Energy Registrants may not be able to obtain or maintain from time to time all required environmental regulatory approvals for their operating assets or development projects. Delays in obtaining any required environmental regulatory approvals, failure to obtain and comply with them or changes in environmental laws or regulations to more stringent compliance levels could result in additional costs of operation for existing facilities or development of new facilities being prevented, delayed or subject to additional costs. Although it is not expected that the costs to comply with current environmental regulations will have a material adverse effect on the Duke Energy Registrants’ results of operations, financial position and cash flows due to regulatory cost recovery, the Duke Energy Registrants are at risk that the costs of complying with environmental regulations in the future will have such an effect.
The EPA has issued or proposed federal regulations governing the management of cooling water intake structures, wastewater, CCR management units, and CO2 emissions. New state legislation could impose carbon reduction goals that are more aggressive than the Company's plans. These regulations may require the Duke Energy Registrants to make additional capital expenditures and increase operating and maintenance costs.
The Duke Energy Registrants' operations, capital expenditures and financial results may be affected by regulatory changes related to the impacts of global climate change.
There is continued concern, and increasing activism, both nationally and internationally, about climate change. The EPA and state regulators have, and may adopt and implement, additional regulations to restrict emissions of GHGs to address global climate change, as well as reporting requirements regarding such emissions and related climate-goal claims. Certain local and state jurisdictions have also enacted laws to restrict or prevent new natural gas infrastructure. Increased regulation of GHG emissions and reporting requirements could impose significant additional costs on the Duke Energy Registrants' electric and natural gas operations, their suppliers and customers and affect demand for energy conservation and renewable products, which could impact both our electric and natural gas businesses. Regulatory changes could also result in generation facilities to be retired earlier than planned to meet our net-zero 2050 goal. Though we would plan to seek cost recovery for investments related to GHG emissions reductions through regulatory rate structures, changes in the regulatory climate could result in the delay in or failure to fully recover such costs and investment in generation.
25
| RISK FACTORS | |||||
OPERATIONAL RISKS
The Duke Energy Registrants’ results of operations may be negatively affected by overall market, economic and other conditions that are beyond their control.
Sustained downturns or sluggishness in the economy generally affect the markets in which the Duke Energy Registrants operate and negatively influence operations. Declines in demand for electricity or natural gas as a result of economic downturns in the Duke Energy Registrants’ regulated service territories will reduce overall sales and lessen cash flows, especially as industrial customers reduce production and, therefore, consumption of electricity and the use of natural gas. Although the Duke Energy Registrants’ regulated electric and natural gas businesses are subject to regulated allowable rates of return and recovery of certain costs, such as fuel and purchased natural gas costs, under periodic adjustment clauses, overall declines in electricity or natural gas sold as a result of economic downturn or recession could reduce revenues and cash flows, thereby diminishing results of operations.
A continuation of adverse economic conditions including economic downturn or high commodity prices could also negatively impact the financial stability of certain of our customers and result in their inability to pay for electric and natural gas services. This could lead to increased bad debt expense and higher allowance for doubtful account reserves for the Duke Energy Registrants and result in delayed or unrecovered operating costs and lower financial results. Additionally, prolonged economic downturns that negatively impact the Duke Energy Registrants’ results of operations and cash flows could result in future material impairment charges to write-down the carrying value of certain assets, including goodwill, to their respective fair values. The Duke Energy Registrants also monitor the impacts of inflation on the procurement of goods and services and seek to minimize its effects in future periods through pricing strategies, productivity improvements, and cost reductions. Rapidly rising prices as a result of inflation or other factors may impact the ability of the Company to recover costs timely or execute on its business strategy including the achievement of growth objectives.
The Duke Energy Registrants sell electricity into the spot market or other competitive power markets on a contractual basis. With respect to such transactions, the Duke Energy Registrants are not guaranteed any rate of return on their capital investments through mandated rates, and revenues and results of operations are likely to depend, in large part, upon prevailing market prices. These market prices may fluctuate substantially over relatively short periods of time and could negatively impact the Company's ability to accurately forecast the financial impact or reduce the Duke Energy Registrants’ revenues and margins, thereby diminishing results of operations.
Factors that could impact sales volumes, generation of electricity and market prices at which the Duke Energy Registrants are able to sell electricity and natural gas are as follows:
•weather conditions, including abnormally mild winter or summer weather that cause lower energy or natural gas usage for heating or cooling purposes, as applicable, and periods of low rainfall that decrease the ability to operate facilities in an economical manner;
•supply of and demand for energy commodities;
•transmission or transportation constraints or inefficiencies;
•availability of purchased power;
•availability of competitively priced alternative energy sources, which are preferred by some customers over electricity produced from coal, nuclear or natural gas plants, and customer usage of energy-efficient equipment that reduces energy demand;
•natural gas, crude oil and refined products production levels and prices;
•ability to procure satisfactory levels of inventory, including materials, supplies, and fuel such as coal, natural gas and uranium; and
•capacity and transmission service into, or out of, the Duke Energy Registrants’ markets.
Natural disasters or operational accidents may adversely affect the Duke Energy Registrants’ operating results.
Natural disasters or operational accidents within the Company or industry (such as forest fires, earthquakes, hurricanes or natural gas transmission pipeline explosions) could have direct or indirect impacts to the Duke Energy Registrants or to key contractors and suppliers. Further, the generation of electricity and the transportation and storage of natural gas involve inherent operating risks that may result in accidents involving serious injury or loss of life, environmental damage or property damage. Such events could impact the Duke Energy Registrants through civil or criminal legal proceedings or changes to policies, laws and regulations whose compliance costs have a significant impact on the Duke Energy Registrants’ results of operations, financial position and cash flows. In addition, if a serious operational accident were to occur, existing insurance policies may not cover all of the potential exposures or the actual amount of loss incurred, including potential litigation awards. Any losses not covered by insurance, or any increases in the cost of applicable insurance as a result of such accident, could have a material adverse effect on the results of operations, financial position, cash flows and reputation of the Duke Energy Registrants.
The reputation and financial condition of the Duke Energy Registrants could be negatively impacted due to their obligations to comply with federal and state regulations, laws, and other legal requirements that govern the operations, assessments, storage, closure, remediation, disposal and monitoring relating to CCR, the high costs and new rate impacts associated with implementing these new CCR-related requirements and the strategies and methods necessary to implement these requirements in compliance with these legal obligations.
As a result of electricity produced for decades at coal-fired power plants, the Duke Energy Registrants manage large amounts of CCR that are primarily stored in dry storage within landfills or combined with water in surface impoundments, all in compliance with applicable regulatory requirements. A CCR-related operational incident could have a material adverse impact on the reputation and results of operations, financial position and cash flows of the Duke Energy Registrants.
26
| RISK FACTORS | |||||
During 2015, EPA regulations were enacted related to the management of CCR from power plants. These regulations classify CCR as nonhazardous waste under the RCRA and apply to electric generating sites with new and existing landfills and, new and existing surface impoundments, and establish requirements regarding landfill design, structural integrity design and assessment criteria for surface impoundments, groundwater monitoring, protection and remedial procedures and other operational and reporting procedures for the disposal and management of CCR. In addition to the federal regulations, CCR landfills and surface impoundments will continue to be regulated by existing state laws, regulations and permits, as well as additional legal requirements that may be imposed in the future, such as the settlement reached with the NCDEQ to excavate seven of the nine remaining coal ash basins in North Carolina, and partially excavate the remaining two, and the EPA's January 11, 2022, issuance of a letter interpreting the CCR Rule, including its applicability and closure provisions. These federal and state laws, regulations and other legal requirements may require or result in additional expenditures, including increased operating and maintenance costs, which could affect the results of operations, financial position and cash flows of the Duke Energy Registrants. The Duke Energy Registrants will continue to seek full cost recovery for expenditures through the normal ratemaking process with state and federal utility commissions, who permit recovery in rates of necessary and prudently incurred costs associated with the Duke Energy Registrants’ regulated operations, and through other wholesale contracts with terms that contemplate recovery of such costs, although there is no guarantee of full cost recovery. In addition, the timing for and amount of recovery of such costs could have a material adverse impact on Duke Energy's cash flows.
The Duke Energy Registrants have recognized significant AROs related to these CCR-related requirements. Closure activities began in 2015 at the four sites specified as high priority by the Coal Ash Act and at the W.S. Lee Steam Station site in South Carolina in connection with other legal requirements. Excavation at these sites involves movement of CCR materials to off-site locations for use as structural fill, to appropriately engineered off-site or on-site lined landfills or conversion of the ash for beneficial use. Duke Energy has completed excavation of coal ash at the four high-priority North Carolina sites. At other sites, planning and closure methods have been studied and factored into the estimated retirement and management costs, and closure activities have commenced. As the closure and CCR management work progresses and final closure plans and corrective action measures are developed and approved at each site, the scope and complexity of work and the amount of CCR material could be greater than estimates and could, therefore, materially increase compliance expenditures and rate impacts.
The Duke Energy Registrants’ results of operations, financial position and cash flows may be negatively affected by a lack of growth or slower growth in the number of customers, or decline in customer demand or number of customers.
Growth in customer accounts and growth of customer usage each directly influence demand for electricity and natural gas and the need for additional power generation and delivery facilities. Customer growth and customer usage are affected by several factors outside the control of the Duke Energy Registrants, such as mandated EE measures, demand-side management goals, distributed generation resources and economic and demographic conditions, such as inflation and interest rate volatility, population changes, job and income growth, housing starts, new business formation and the overall level of economic activity.
In addition, certain regulatory and legislative bodies have passed legislation implementing the extension of certain tax credits to be used toward the costs of residential solar installation or have introduced or are considering requirements and/or incentives to reduce energy consumption by certain dates in response to concerns related to climate change. Additionally, technological advances driven by federal laws mandating new levels of EE in end-use electric and natural gas devices or other improvements in or applications of technology could lead to declines in per capita energy consumption.
Advances in distributed generation technologies that produce power, including fuel cells, microturbines, wind turbines and solar cells, may reduce the cost of alternative methods of producing power to a level competitive with central power station electric production utilized by the Duke Energy Registrants. In addition, the electrification of buildings and appliances currently relying on natural gas could reduce the number of customers in our natural gas distribution business.
Some or all of these factors could result in a lack of growth or decline in customer demand for electricity or number of customers and may cause the failure of the Duke Energy Registrants to fully realize anticipated benefits from significant capital investments and expenditures, which could have a material adverse effect on their results of operations, financial position and cash flows.
Furthermore, the Duke Energy Registrants currently have EE riders in place to recover the cost of EE programs in North Carolina, South Carolina, Florida, Indiana, Ohio and Kentucky. Should the Duke Energy Registrants be required to invest in conservation measures that result in reduced sales from effective conservation, regulatory lag in adjusting rates for the impact of these measures could have a negative financial impact.
The Duke Energy Registrants future results of operations may be impacted by changing expectations and demands including heightened emphasis on environmental, social and governance concerns.
Duke Energy’s ability to execute its strategy and achieve anticipated financial outcomes are influenced by the expectations of our customers, regulators, investors, and stakeholders. Those expectations are based in part on the core fundamentals of reliability and affordability but are also increasingly focused on our ability to meet rapidly changing demands for new and varied products, services and offerings. Additionally, the risks of global climate change continues to shape our customers’ sustainability goals and energy needs as well as the investment and financing criteria of investors. Failure to meet these increasing expectations or to adequately address the risks and external pressures from regulators, customers, investors and other stakeholders may impact Duke Energy’s reputation and affect its ability to achieve favorable outcomes in future rate cases and the results of operations for the Duke Energy Registrants. Furthermore, the increasing use of social media may accelerate and increase the potential scope of negative publicity we might receive and could increase the negative impact on our reputation, business, results of operations, and financial condition.
As it relates to electric generation, a diversified fleet with increasingly clean generation resources may facilitate more efficient financing and lower costs. Conversely, jurisdictions utilizing more carbon-intensive generation such as coal may experience difficulty attracting certain investors and obtaining the most economical financing terms available. Furthermore, with this heightened emphasis on environmental, social, and governance concerns, and climate change in particular, there is an increased risk of litigation, activism, and legislation from groups both in support of and opposed to various environmental, social and governance initiatives, which could cause delays and increase the costs of our clean energy transition.
27
| RISK FACTORS | |||||
The Duke Energy Registrants’ operating results may fluctuate on a seasonal and quarterly basis and can be negatively affected by changes in weather conditions and severe weather, including extreme weather conditions and changes in weather patterns from climate change.
Electric power generation and natural gas distribution are generally seasonal businesses. In most parts of the U.S., the demand for power peaks during the warmer summer months, with market prices also typically peaking at that time. In other areas, demand for power peaks during the winter. Demand for natural gas peaks during the winter months. Further, changing frequency or magnitude of extreme weather conditions such as hurricanes, droughts, heat waves, winter storms and severe weather, including from climate change, could cause these seasonal fluctuations to be more pronounced. As a result, the overall operating results of the Duke Energy Registrants’ businesses may fluctuate substantially on a seasonal and quarterly basis and thus make period-to-period comparison less relevant.
Sustained severe drought conditions could impact generation by hydroelectric plants, as well as fossil and nuclear plant operations, as these facilities use water for cooling purposes and for the operation of environmental compliance equipment. Furthermore, destruction caused by severe weather events, such as hurricanes, flooding, tornadoes, severe thunderstorms, snow and ice storms, including from climate change, can result in lost operating revenues due to outages, property damage, including downed transmission and distribution lines, reputational harm, and additional and unexpected expenses to mitigate storm damage. The cost of storm restoration efforts may not be fully recoverable through the regulatory process.
The Duke Energy Registrants’ sales may decrease if they are unable to gain adequate, reliable and affordable access to transmission assets.
The Duke Energy Registrants depend on transmission and distribution facilities owned and operated by utilities and other energy companies to deliver electricity sold to the wholesale market. In addition, the growth of renewables and energy storage will put strains on existing transmission assets and require transmission and distribution upgrades. The FERC’s power transmission regulations require wholesale electric transmission services to be offered on an open-access, non-discriminatory basis. If transmission is disrupted, or if transmission capacity is inadequate, the Duke Energy Registrants’ ability to sell and deliver products may be hindered.
The different regional power markets have changing regulatory structures, which could affect growth and performance in these regions. In addition, the ISOs who oversee the transmission systems in regional power markets have imposed in the past, and may impose in the future, price limitations and other mechanisms to address volatility in the power markets. These types of price limitations and other mechanisms may adversely impact the profitability of the Duke Energy Registrants’ wholesale power marketing business.
The availability of adequate interstate pipeline transportation capacity and natural gas supply may decrease.
The Duke Energy Registrants purchase almost all of their natural gas supply from interstate sources that must be transported to the applicable service territories. Interstate pipeline companies transport the natural gas to the Duke Energy Registrants' systems under firm service agreements that are designed to meet the requirements of their core markets. A significant disruption to interstate pipelines capacity or reduction in natural gas supply due to events including, but not limited to, operational failures or disruptions, hurricanes, tornadoes, floods, freeze off of natural gas wells, terrorist or cyberattacks or other acts of war or legislative or regulatory actions or requirements, including remediation related to integrity inspections or regulations and laws enacted to address climate change, could reduce the normal interstate supply of natural gas and thereby reduce earnings. Moreover, if additional natural gas infrastructure, including, but not limited to, exploration and drilling rigs and platforms, processing and gathering systems, offshore pipelines, interstate pipelines and storage, cannot be built at a pace that meets demand, then growth opportunities could be limited.
Fluctuations in commodity prices or availability may adversely affect various aspects of the Duke Energy Registrants’ operations as well as their results of operations, financial position and cash flows.
The Duke Energy Registrants are exposed to the effects of market fluctuations in the price of natural gas, coal, fuel oil, nuclear fuel, electricity and other energy-related commodities as a result of their ownership of energy-related assets. Fuel costs are recovered primarily through cost recovery clauses, subject to the approval of state utility commissions.
Additionally, the Duke Energy Registrants are exposed to risk that counterparties will not be able to fulfill their obligations. Disruption in the delivery of fuel, including disruptions as a result of, among other things, bankruptcies, transportation delays, weather, labor relations, force majeure events or environmental regulations affecting any of these fuel suppliers, could limit the Duke Energy Registrants' ability to operate their facilities. Should counterparties fail to perform, the Duke Energy Registrants might be forced to replace the underlying commitment at prevailing market prices possibly resulting in losses in addition to the amounts, if any, already paid to the counterparties.
Certain of the Duke Energy Registrants’ hedge agreements may result in the receipt of, or posting of, collateral with counterparties, depending on the daily market-based calculation of financial exposure of the derivative positions. Fluctuations in commodity prices that lead to the return of collateral received and/or the posting of collateral with counterparties could negatively impact liquidity. Downgrades in the Duke Energy Registrants’ credit ratings could lead to additional collateral posting requirements. The Duke Energy Registrants continually monitor derivative positions in relation to market price activity.
28
| RISK FACTORS | |||||
Cyberattacks and data security breaches could adversely affect the Duke Energy Registrants' businesses.
Cybersecurity risks have increased in recent years as a result of the proliferation of new technologies and the increased sophistication, magnitude and frequency of cyberattacks and data security breaches. Duke Energy relies on the continued operation of sophisticated digital information technology systems and network infrastructure, which are part of an interconnected regional grid. Additionally, connectivity to the internet continues to increase through grid modernization and other operational excellence initiatives. Because of the critical nature of the infrastructure, increased connectivity to the internet and technology systems’ inherent vulnerability to disability or failures due to hacking, viruses, acts of war or terrorism or other types of data security breaches, the Duke Energy Registrants face a heightened risk of cyberattacks from foreign or domestic sources and have been subject, and will likely continue to be subject, to cyberattacks designed to gain unauthorized access to information and/or information systems or to disrupt utility operations through computer viruses and phishing attempts either directly or indirectly through its material vendors or related third parties. In the event of a significant cybersecurity breach on either the Duke Energy Registrants or with one of our material vendors or related third parties, the Duke Energy Registrants could (i) have business operations disrupted, including the disruption of the operation of our natural gas and electric assets and the power grid, theft of confidential company, employee, retiree, shareholder, vendor or customer information, and general business systems and process interruption or compromise, including preventing the Duke Energy Registrants from servicing customers, collecting revenues or the recording, processing and/or reporting financial information correctly, (ii) experience substantial loss of revenues, repair and restoration costs, penalties and costs for lack of compliance with relevant regulations, implementation costs for additional security measures to avert future cyberattacks and other financial loss and (iii) be subject to increased regulation, litigation and reputational damage. While Duke Energy maintains insurance relating to cybersecurity events, such insurance does not protect Duke Energy from such cyberattacks occurring, and while it does provide some potential mitigation of the financial impacts resulting from such cyberattacks, it is subject to a number of exclusions and may be insufficient to offset any losses, costs or damage experienced. Also, the market for cybersecurity insurance is relatively new and coverage available for cybersecurity events is evolving as the industry matures.
The Duke Energy Registrants are subject to standards enacted by the North American Electric Reliability Corporation and enforced by FERC regarding protection of the physical and cybersecurity of critical infrastructure assets required for operating North America's bulk electric system. The Duke Energy Registrants are also subject to regulations set by the Nuclear Regulatory Commission regarding the protection of digital computer and communication systems and networks required for the operation of nuclear power plants. The Duke Energy Registrants that operate designated critical pipelines that transport natural gas are also subject to security directives issued by the Department of Homeland Security's Transportation Security Administration (TSA) requiring such registrants to implement specific cybersecurity mitigation measures. While the Duke Energy Registrants believe they are in compliance with, or, in the case of recent TSA security directives, are in the process of implementing such standards and regulations, the Duke Energy Registrants have from time to time been, and may in the future be, found to be in violation of such standards and regulations. In addition, compliance with or changes in the applicable standards and regulations may subject the Duke Energy Registrants to higher operating costs and/or increased capital expenditures as well as substantial fines for non-compliance.
The Duke Energy Registrants’ operations have been and may be affected by pandemic health events, including COVID-19, in ways listed below and in ways the Duke Energy Registrants cannot predict at this time.
The COVID-19 pandemic and efforts to respond to it have resulted in widespread adverse consequences on the global economy and on the Duke Energy Registrants’ customers, third-party vendors, and other parties with whom we do business. If the COVID-19 pandemic or other health epidemics and outbreaks that may occur are significantly prolonged, it could impact the Duke Energy Registrants' business strategy, results of operations, financial position and cash flows in the future as a result of delays in rate cases or other legal proceedings, an inability to obtain labor or equipment necessary for the construction of large capital projects, an inability to procure satisfactory levels of fuels or other necessary equipment for the continued production of electricity and delivery of natural gas, volatility in global equity securities markets, and the health and availability of our critical personnel and their ability to perform business functions.
Duke Energy Ohio’s and Duke Energy Indiana’s membership in an RTO presents risks that could have a material adverse effect on their results of operations, financial position and cash flows.
The rules governing the various regional power markets may change, which could affect Duke Energy Ohio’s and Duke Energy Indiana’s costs and/or revenues. Both Duke Energy Ohio and Duke Energy Indiana have trackers to recover approved RTO costs, but to the degree Duke Energy Ohio and Duke Energy Indiana incur significant additional fees and increased costs to participate in an RTO that are not approved for recovery, their results of operations may be impacted. Duke Energy Ohio and Duke Energy Indiana may be allocated a portion of the cost of transmission facilities built by others due to changes in RTO transmission rate design, while being able to allocate costs of projects built by Duke Energy Ohio and Duke Energy Indiana to others. Duke Energy Ohio and Duke Energy Indiana may be required to expand their transmission system according to decisions made by an RTO rather than their own internal planning process. In addition, RTOs have been developing rules associated with the allocation and methodology of assigning costs associated with improved transmission reliability, reduced transmission congestion and firm transmission rights that may have a financial impact on the results of operations, financial position and cash flows of Duke Energy Ohio and Duke Energy Indiana.
As members of an RTO, Duke Energy Ohio and Duke Energy Indiana are subject to certain additional risks, including those associated with the allocation among RTO members, of losses caused by unreimbursed defaults of other participants in the RTO markets not covered by collateral requirements and those associated with complaint cases filed against an RTO that may seek refunds of revenues previously earned by RTO members.
The Duke Energy Registrants may not recover costs incurred to begin construction on projects that are canceled.
Duke Energy’s long-term strategy requires the construction of new projects, either wholly owned or partially owned, which involve a number of risks, including construction delays, delays in or failure to receive required regulatory approvals and/or sitting or environmental permits, nonperformance by equipment and other third-party suppliers, and increases in equipment and labor costs. To limit the risks of these construction projects, the Duke Energy Registrants enter into equipment purchase orders and construction contracts and incur engineering and design service costs in advance of receiving necessary regulatory approvals and/or siting or environmental permits. If any of these projects are canceled for any reason, including failure to receive necessary regulatory approvals and/or siting or environmental permits, significant cancellation penalties under the equipment purchase orders and construction contracts could occur. In addition, if any construction work or investments have been recorded as an asset, an impairment may need to be recorded in the event the project is canceled.
29
| RISK FACTORS | |||||
The Duke Energy Registrants are subject to risks associated with their ability to obtain adequate insurance at acceptable costs.
The financial condition of some insurance companies, actual or threatened physical or cyberattacks, and natural disasters, among other things, could have disruptive effects on insurance markets. The availability of insurance covering risks that the Duke Energy Registrants and their respective competitors typically insure against may decrease, and the insurance that the Duke Energy Registrants are able to obtain may have higher deductibles, higher premiums, and more restrictive policy terms. Further, the insurance policies may not cover all of the potential exposures or the actual amount of loss incurred. Any losses not covered by insurance, or any increases in the cost of applicable insurance, could adversely affect the results of operations, financial position or cash flows of the affected Duke Energy Registrant.
Our business could be negatively affected as a result of actions of activist shareholders.
While we strive to maintain constructive communications with our shareholders, activist shareholders may, from time to time, engage in proxy solicitations or advance shareholder proposals, or otherwise attempt to affect changes and assert influence on our Board and management. Perceived uncertainties as to the future direction or governance of the Company may cause concern to our current or potential regulators, vendors or strategic partners, or make it more difficult to execute on our strategy or to attract and retain qualified personnel, which may have a material impact on our business and operating results.
In addition, actions such as those described above could cause fluctuations in the trading price of our common stock, based on temporary or speculative market perceptions or other factors that do not necessarily reflect the underlying fundamentals and prospects of our business.
NUCLEAR GENERATION RISKS
Duke Energy Carolinas, Duke Energy Progress and Duke Energy Florida may incur substantial costs and liabilities due to their ownership and operation of nuclear generating facilities.
Ownership interests in and operation of nuclear stations by Duke Energy Carolinas, Duke Energy Progress and Duke Energy Florida subject them to various risks. These risks include, among other things: the potential harmful effects on the environment and human health resulting from the current or past operation of nuclear facilities and the storage, handling and disposal of radioactive materials; limitations on the amounts and types of insurance commercially available to cover losses that might arise in connection with nuclear operations; uncertainties with respect to the technological and financial aspects of decommissioning nuclear plants at the end of their licensed lives; and the threat of a terrorist attack or cyber incident and other potential liabilities arising out of the ownership or operation of nuclear facilities.
Ownership and operation of nuclear generation facilities requires compliance with licensing and safety-related requirements imposed by the NRC. In the event of non-compliance, the NRC may increase regulatory oversight, impose fines or shut down a unit depending upon its assessment of the severity of the situation. Revised security and safety requirements promulgated by the NRC, which could be prompted by, among other things, events within or outside of the control of Duke Energy Carolinas, Duke Energy Progress and Duke Energy Florida, such as a serious nuclear incident at a facility owned by a third party, could necessitate substantial capital and other expenditures, as well as assessments to cover third-party losses. In addition, if a serious nuclear incident were to occur, it could have a material adverse effect on the results of operations, financial position, cash flows and reputation of the Duke Energy Registrants.
LIQUIDITY, CAPITAL REQUIREMENTS AND COMMON STOCK RISKS
The Duke Energy Registrants rely on access to short-term borrowings and longer-term debt and equity markets to finance their capital requirements and support their liquidity needs. Access to those markets can be adversely affected by a number of conditions, many of which are beyond the Duke Energy Registrants’ control.
The Duke Energy Registrants’ businesses are significantly financed through issuances of debt and equity. The maturity and repayment profile of debt used to finance investments often does not correlate to cash flows from their assets. Accordingly, as a source of liquidity for capital requirements not satisfied by the cash flows from their operations and to fund investments originally financed through debt instruments with disparate maturities, the Duke Energy Registrants rely on access to short-term money markets as well as longer-term capital markets. The Subsidiary Registrants also rely on access to short-term intercompany borrowings. If the Duke Energy Registrants are not able to access debt or equity at competitive rates or at all, the ability to finance their operations and implement their strategy and business plan as scheduled could be adversely affected. An inability to access debt and equity may limit the Duke Energy Registrants’ ability to pursue improvements or acquisitions that they may otherwise rely on for future growth.
Market disruptions may increase the cost of borrowing or adversely affect the ability to access one or more financial markets. Such disruptions could include: economic downturns, unfavorable capital market conditions, market prices for natural gas and coal, geopolitical risks, actual or threatened terrorist attacks, or the overall health of the energy industry. Additionally, rapidly rising interest rates could impact the ability to affordably finance the capital plan or increase rates to customers and could have an impact on our ability to execute on our clean energy transition. The availability of credit under Duke Energy’s Master Credit Facility depends upon the ability of the banks providing commitments under the facility to provide funds when their obligations to do so arise. Systemic risk of the banking system and the financial markets could prevent a bank from meeting its obligations under the facility agreement.
Duke Energy maintains a revolving credit facility to provide backup for its commercial paper program and letters of credit to support variable rate demand tax-exempt bonds that may be put to the Duke Energy Registrant issuer at the option of the holder. The facility includes borrowing sublimits for the Duke Energy Registrants, each of whom is a party to the credit facility, and financial covenants that limit the amount of debt that can be outstanding as a percentage of the total capital for the specific entity. Failure to maintain these covenants at a particular entity could preclude Duke Energy from issuing commercial paper or the Duke Energy Registrants from issuing letters of credit or borrowing under the Master Credit Facility.
30
| RISK FACTORS | |||||
The Duke Energy Registrants must meet credit quality standards and there is no assurance they will maintain investment grade credit ratings. If the Duke Energy Registrants are unable to maintain investment grade credit ratings, they would be required under credit agreements to provide collateral in the form of letters of credit or cash, which may materially adversely affect their liquidity.
Each of the Duke Energy Registrants’ senior long-term debt issuances is currently rated investment grade by various rating agencies. The Duke Energy Registrants cannot ensure their senior long-term debt will be rated investment grade in the future.
If the rating agencies were to rate the Duke Energy Registrants below investment grade, borrowing costs would increase, perhaps significantly. In addition, the potential pool of investors and funding sources would likely decrease. Further, if the short-term debt rating were to fall, access to the commercial paper market could be significantly limited.
A downgrade below investment grade could also require the posting of additional collateral in the form of letters of credit or cash under various credit, commodity and capacity agreements and trigger termination clauses in some interest rate derivative agreements, which would require cash payments. All of these events would likely reduce the Duke Energy Registrants’ liquidity and profitability and could have a material effect on their results of operations, financial position and cash flows.
Non-compliance with debt covenants or conditions could adversely affect the Duke Energy Registrants’ ability to execute future borrowings.
The Duke Energy Registrants’ debt and credit agreements contain various financial and other covenants. Failure to meet those covenants beyond applicable grace periods could result in accelerated due dates and/or termination of the agreements.
Market performance and other changes may decrease the value of the NDTF investments of Duke Energy Carolinas, Duke Energy Progress and Duke Energy Florida, which then could require significant additional funding.
Ownership and operation of nuclear generation facilities also requires the maintenance of funded trusts that are intended to pay for the decommissioning costs of the respective nuclear power plants. The performance of the capital markets affects the values of the assets held in trust to satisfy these future obligations. Duke Energy Carolinas, Duke Energy Progress and Duke Energy Florida have significant obligations in this area and hold significant assets in these trusts. These assets are subject to market fluctuations and will yield uncertain returns, which may fall below projected rates of return. Although a number of factors impact funding requirements, a decline in the market value of the assets may increase the funding requirements of the obligations for decommissioning nuclear plants. If Duke Energy Carolinas, Duke Energy Progress and Duke Energy Florida are unable to successfully manage their NDTF assets or if the cost of decommissioning nuclear generation facilities exceeds the amount available in decommissioning funds and such costs cannot be recovered through insurance or regulatory mechanisms, their results of operations, financial position and cash flows could be negatively affected.
Poor investment performance of the Duke Energy pension plan holdings and other factors impacting pension plan costs could unfavorably impact the Duke Energy Registrants’ liquidity and results of operations.
The costs of providing non-contributory defined benefit pension plans are dependent upon a number of factors, such as the rates of return on plan assets, discount rates, the level of interest rates used to measure the required minimum funding levels of the plans, future government regulation and required or voluntary contributions made to the plans. The Subsidiary Registrants are allocated their proportionate share of the cost and obligations related to these plans. Without sustained growth in the pension investments over time to increase the value of plan assets and, depending upon the other factors impacting costs as listed above, Duke Energy could be required to fund its plans with significant amounts of cash. Such cash funding obligations, and the Subsidiary Registrants’ proportionate share of such cash funding obligations, could have a material adverse impact on the Duke Energy Registrants’ results of operations, financial position and cash flows.
Duke Energy is a holding company and depends on the cash flows from its subsidiaries to meet its financial obligations.
Because Duke Energy is a holding company with no operations or cash flows of its own, its ability to meet its financial obligations, including making interest and principal payments on outstanding indebtedness and to pay dividends on its common stock, is primarily dependent on the net income and cash flows of its subsidiaries and the ability of those subsidiaries to pay upstream dividends or to repay borrowed funds. Prior to funding Duke Energy, its subsidiaries have regulatory restrictions and financial obligations that must be satisfied. These subsidiaries are separate legal entities and have no obligation to provide Duke Energy with funds. In addition, Duke Energy may provide capital contributions or debt financing to its subsidiaries under certain circumstances, which would reduce the funds available to meet its financial obligations, including making interest and principal payments on outstanding indebtedness and to pay dividends on Duke Energy’s common stock.
GENERAL RISKS
The failure of Duke Energy information technology systems, or the failure to enhance existing information technology systems and implement new technology, could adversely affect the Duke Energy Registrants’ businesses.
Duke Energy’s operations are dependent upon the proper functioning of its internal systems, including the information technology systems that support our underlying business processes. Any significant failure or malfunction of such information technology systems may result in disruptions of our operations. In the ordinary course of business, we rely on information technology systems, including the internet and third-party hosted services, to support a variety of business processes and activities and to store sensitive data, including (i) intellectual property, (ii) proprietary business information, (iii) personally identifiable information of our customers, employees, retirees and shareholders and (iv) data with respect to invoicing and the collection of payments, accounting, procurement, and supply chain activities. Our information technology systems are dependent upon global communications and cloud service providers, as well as their respective vendors, many of whom have at some point experienced significant system failures and outages in the past and may experience such failures and outages in the future. These providers’ systems are susceptible to cybersecurity and data breaches, outages from fire, floods, power loss, telecommunications failures, break-ins and similar events. Failure to prevent or mitigate data loss from system failures or outages could materially affect the results of operations, financial position and cash flows of the Duke Energy Registrants.
31
| RISK FACTORS | |||||
In addition to maintaining our current information technology systems, Duke Energy believes the digital transformation of its business is key to driving internal efficiencies as well as providing additional capabilities to customers. Duke Energy’s information technology systems are critical to cost-effective, reliable daily operations and our ability to effectively serve our customers. We expect our customers to continue to demand more sophisticated technology-driven solutions and we must enhance or replace our information technology systems in response. This involves significant development and implementation costs to keep pace with changing technologies and customer demand. If we fail to successfully implement critical technology, or if it does not provide the anticipated benefits or meet customer demands, such failure could materially adversely affect our business strategy as well as impact the results of operations, financial position and cash flows of the Duke Energy Registrants.
Potential terrorist activities, or military or other actions, could adversely affect the Duke Energy Registrants’ businesses.
The continued threat of terrorism and the impact of retaliatory military and other action by the U.S. and its allies may lead to increased political, economic and financial market instability and volatility in prices for natural gas and oil, which may have material adverse effects in ways the Duke Energy Registrants cannot predict at this time. In addition, future acts of terrorism and possible reprisals as a consequence of action by the U.S. and its allies could be directed against companies operating in the U.S. Information technology systems, transportation systems for our fuel sources including natural gas pipelines, transmission and distribution and generation facilities such as nuclear plants could be potential targets of terrorist activities or harmful activities by individuals or groups that could have a material adverse effect on Duke Energy Registrants' businesses. In particular, the Duke Energy Registrants may experience increased capital and operating costs to implement increased security for their information technology systems, transmission and distribution and generation facilities, including nuclear power plants under the NRC’s design basis threat requirements. These increased costs could include additional physical plant security and security personnel or additional capability following a terrorist incident.
Failure to attract and retain an appropriately qualified workforce could unfavorably impact the Duke Energy Registrants’ results of operations.
Certain events, such as an aging workforce, mismatch of skill set or complement to future needs, or unavailability of contract resources may lead to operating challenges and increased costs. The challenges include lack of resources, loss of knowledge base and the lengthy time required for skill development. In this case, costs, including costs for contractors to replace employees, productivity costs and safety costs, may increase. Failure to hire and adequately train replacement employees, including the transfer of significant internal historical knowledge and expertise to new employees, or future availability and cost of contract labor may adversely affect the ability to manage and operate the business, especially considering the workforce needs associated with nuclear generation facilities and new skills required to operate a modernized, technology-enabled power grid. If the Duke Energy Registrants are unable to successfully attract and retain an appropriately qualified workforce, their results of operations, financial position and cash flows could be negatively affected.
ITEM 1B. UNRESOLVED STAFF COMMENTS
None.
ITEM 1C. CYBERSECURITY
Risk Management
Ensuring the security of Duke Energy’s assets, information and teammates is vital for delivering the essential service on which Duke Energy’s customers and communities depend. In light of the ever-evolving threat landscape and increasing sophistication of threat actor tactics, techniques and procedures, steadfast and sophisticated cybersecurity and security operations are integral parts of Duke Energy’s enterprise risk management framework. Duke Energy's enterprise risk management framework is used across the enterprise by subject matter experts to identify, assess, monitor and communicate enterprise level risks to the Chief Risk Officer. Duke Energy’s technology and cybersecurity risk management program is integrated into the Company’s overall Enterprise Risk Management program and is composed of three primary lines of defense: (1) the Cybersecurity Incident Response Team (CIRT); (2) the Duke Energy Enterprise Security Team (EST); and (3) internal and external cybersecurity audits.
Duke Energy’s first line of defense is the CIRT under the Office of the Chief Information Officer. The CIRT reports up to leaders in the Chief Security and Information Security Office, including the Chief Security and Information Security Officer (CSISO), Managing Director of Cybersecurity and Network Defense, and Director of Cybersecurity Operations, whose cybersecurity backgrounds include many years serving in operational cyber roles, leading incident response, participating in industry engagement, collaborating with federal and local cyber programs, and time analyzing security breaches across the industry. The CIRT oversees an enterprisewide process that identifies, assesses, responds to and resolves cyber incidents, both internal and those associated with the Company’s use of third-party service providers, by defining roles, responsibilities and the process for problem source identification, mitigation, and eradication triggered by a suspected cyber incident. Duke Energy manages cybersecurity threats through its 24/7 Duke Energy Cybersecurity Operations Center (CSOC), which serves as the Company’s central command center for monitoring and coordinating responses to cyberthreats. The CSOC engages in daily information sharing within the utilities industry and with government partners and monitors incoming intelligence and cyber incident impacts. The CSOC assesses the relevant information by assigning a CIRT Heat Map score, which results in CIRT activation if a certain threat level is met. It also results in the assignment of additional roles and responsibilities to enable the cybersecurity leadership and technical teams to collectively and regularly review incident information, score the impact, communicate to leadership, and respond appropriately. Another key component of Duke Energy’s first line of defense against cybersecurity threats is its Third-Party Risk Management (TPRM) process, whereby third parties providing services that meet certain criteria such as storing or transmitting Duke Energy data, hosting an application, or connecting to the Duke Energy network are required to undergo a cybersecurity assessment primarily to ascertain the risk of a third party’s proposed services to Duke Energy.
32
CYBERSECURITY | |||||
Duke Energy’s second line of defense against cybersecurity threats is the EST, which is led by the CSISO, and actively evaluates, anticipates and tests Duke Energy’s cybersecurity risk level and preventive and risk mitigation controls relative to the enterprisewide risk level and controls. The EST is responsible for infrastructure defense and security controls, performing vulnerability assessments and third-party information security assessments, employee awareness and training programs and security incident management, including oversight of the remediation of cybersecurity incidents. The EST monitors cyber activity and also reports on the status of the Company’s cybersecurity performance and any ongoing remediation efforts to the Company’s Chief Information Officer (CIO) and CSISO. The CIO and CSISO report these cybersecurity metrics, which use a vulnerability management scoring system and closely align with the National Institute of Standards and Technology Cybersecurity Framework, to the Audit Committee at each regularly scheduled Audit Committee meeting. The EST also employs tools and oversees and challenges Duke Energy’s cybersecurity and technology metrics under its Enterprise Security Risk Register to track, identify and manage risk. To this end, the EST engages outside expert firms to perform a comprehensive external penetration test each year, performs system and application penetration testing several times throughout the year, and conducts annual exercises simulating the tactics, techniques, and procedures of advanced threat actor groups to test the Company’s ability to prevent penetration, detect suspicious activity and respond to these threats in a timely manner. Lessons learned inform the ongoing improvement of security preventive and mitigating controls and procedures and the results of such testing and threat actor simulations are shared with senior management and the Board of Directors. Duke Energy also has a senior management committee, the Executive Cybersecurity Oversight Governance Committee (ECOG), which governs enterprise-level cybersecurity risk tolerance.
Internal and external cybersecurity audits provide a third line of defense and independently provide assurance on how effectively the Company, as a whole, manages cybersecurity risk. Each year, Duke Energy Corporate Audit Services (CAS) performs various audits of key Duke Energy security systems and functions, such as third-party risk management programs, to assess whether appropriate security controls are in place and operating effectively. In addition to these internal audits, the Company is subject to a variety of external audits, performed periodically as required by the auditing entity, including external audits performed by the North American Electric Reliability Corporation under the Critical Infrastructure Protection framework (NERC CIP), Transportation & Security Administration Pipeline Security Directive and Federal Energy Regulatory Commission Dam Security.
Duke Energy is not currently aware of any potential cybersecurity threats, including as a result of any previous cybersecurity incidents that have materially affected or are reasonably likely to materially affect the Company, including its business strategy, results of operations or financial condition, however, Duke Energy cannot provide assurance that it will not be materially affected in the future by cybersecurity risks or any future material incidents.
Governance
The Audit Committee has primary oversight of management’s efforts to mitigate cybersecurity and technology risk and respond to cyber incidents. The Audit Committee receives updates throughout the year from the CIO and CSISO on cybersecurity and grid security issues, including compliance with regulations, employee training, and drills, at every regularly scheduled Audit Committee meeting, and engages in discussions throughout the year with management on the effectiveness of Duke Energy’s overall cybersecurity program and progress for addressing any identified risks. In 2023, the Audit Committee received four updates on cybersecurity. The Audit Committee also receives periodic updates on Duke Energy’s digital transformation and the operation of, and enhancements to, the Company’s financial systems and business and operational technical systems. The reviews presented to the Audit Committee are followed with an update to the full Board of Directors by the Chair of the Audit Committee.
In addition, the Operations and Nuclear Oversight Committee (ONOC) of the Board of Directors provides oversight of the nuclear safety and cybersecurity of Duke Energy’s nuclear power program, which is integrated with the companywide cyber protocols, and the Chair of the ONOC reports out to the Board of Directors on such oversight activities. Duke Energy’s nuclear cybersecurity program and associated cybersecurity plan (CSP) were fully implemented in 2017 in accordance with NRC regulation 10 CFR 73.54, “Protection of digital computer and communication systems and networks” and leverage monitoring, testing, drills, audits, assessments, and NRC inspections to continue to validate the effectiveness of the program to protect plant assets from cybersecurity threats.
Moreover, Duke Energy’s processes ensure that the Board of Directors receive contemporaneous reporting on potentially significant cyber events including response, legal obligations, and outreach and notification to regulators and customers when needed, as well as an opportunity to provide guidance to management as appropriate.
In addition, the Company’s Executive Cybersecurity Oversight Governance Committee (ECOG), comprised of the Company's Chair, President, and Chief Executive Officer (CEO), Executive Vice President (EVP) and Chief Financial Officer, EVP and Chief Commercial Officer, EVP Customer Experience, Solutions and Services, and EVP, Chief Generation Officer and Enterprise Operational Excellence, receives monthly updates from the CIO and CSISO and provides senior management throughout the Company informational technology and operational technology perspectives, oversight and governance on investments and priorities for the broader cybersecurity organization, in addition to providing final decision oversight on recommendations and response to the ever challenging cybersecurity threat landscape. The ECOG also is leveraged to supply information and bring transparency to senior management throughout the company on the increasing threat landscape and the actions, response and road map to combat the threats.
The relevant cybersecurity risk expertise of Duke Energy’s management who serve on the ECOG and/or senior management who lead the CIRT and EST is described below.
•The CEO of Duke Energy has over 20 years of experience in the utilities industry, and has gained cybersecurity experience as CEO of one of America’s largest utility companies, and through service on the board of the Edison Electric Institute, the Institute of Nuclear Power Operations, the World Association of Nuclear Operators, and past service on the Department of Homeland Security Advisory Council.
•The EVP and Chief Financial Officer of Duke Energy (CFO) previously served as the Company’s Chief Transformation and Administrative Officer and led the Company’s business transformation through digital innovation, new ways of working and process redesign. In this role, the CFO gained an in-depth understanding of the Company's cybersecurity procedures and key threats, and was responsible for the enterprise business services and technology team, including the information and technology organization.
•The EVP, Chief Generation Officer and Enterprise Operational Excellence of Duke Energy has gained cybersecurity experience through being responsible for the safe, efficient and reliable operation of Duke Energy's fleet of nuclear, natural gas, hydro, solar and coal units.
33
CYBERSECURITY | |||||
•The EVP, Customer Experience, Solutions and Services of Duke Energy has gained cybersecurity experience through focusing on transmission and the development of long-term grid strategies and solutions and through a prior role as Chief Distribution Officer, overseeing the safe, reliable, and efficient operation of Duke Energy’s electric distribution systems, and through serving on the board of the Association of Edison Illuminating Companies.
•The EVP and Chief Commercial Officer of Duke Energy has cybersecurity experience gained through responsibility for enterprise technology and security, among other areas.
•The CSISO of Duke Energy has over 25 years of experience building and leading security teams within multiple industries. The CSISO holds a Secret Security clearance and is committed to strengthening U.S. critical infrastructure through active collaboration with federal partners at the Federal Bureau of Investigation, Department of Energy, Department of Homeland Security, and state partners including the national guard, law enforcement and universities.
•The CIO of Duke Energy has over 25 years of experience in delivering secure information technology solutions across multiple industries, leading technology delivery for all core business functions. The CIO holds a Secret Security clearance and has active interactions and partnership with the Federal Bureau of Investigation, Edison Electric Institute and State Fusion Centers in the jurisdictions that Duke Energy serves.
34
| PROPERTIES | |||||
ITEM 2. PROPERTIES
ELECTRIC UTILITIES AND INFRASTRUCTURE
The following table provides information related to the EU&I's generation stations as of December 31, 2023. The MW displayed in the table below are based on winter capacity for Fossil, Nuclear and Hydro generation stations, and nameplate capacity for Renewable generation stations. Ownership interest in all facilities is 100% unless otherwise indicated.
Prior to December 31, 2023, summer capacity was displayed for all EU&I generation stations in the table below. Certain registrants' IRPs, including those filed in North Carolina and South Carolina in 2023, currently use winter capacity for Fossil, Nuclear and Hydro stations as winter capacity is generally a more accurate representation of that stations' ability to support peak capacity requirements due to a higher risk of reliability challenges during the winter months in those jurisdictions. Additionally, analysis of resource adequacy across all jurisdictions demonstrates that as solar adoption increases, there is a higher risk of reliability challenges in the winter. As such, most of Duke Energy's IRPs are expected to shift toward winter planning. See Item 7, "Other Matters" for additional information on IRPs. Nameplate capacity is generally viewed as a transparent representation of the Renewable stations since their output varies by day, month, and real-time weather conditions, particularly with solar facilities, which may or may not be paired with battery storage depending on the location. The Owned MW Capacity based on summer capacity as of December 31, 2023, is 50,302 MW for all of EU&I.
| Owned MW | ||||||||||||||
| Facility | Plant Type | Primary Fuel | Location | Capacity | ||||||||||
| Duke Energy Carolinas | ||||||||||||||
| Oconee | Nuclear | Uranium | SC | 2,618 | ||||||||||
| McGuire | Nuclear | Uranium | NC | 2,386 | ||||||||||
Catawba(a) | Nuclear | Uranium | SC | 588 | ||||||||||
| Belews Creek | Fossil | Coal/Gas | NC | 2,220 | ||||||||||
| Marshall | Fossil | Coal/Gas | NC | 2,078 | ||||||||||
| Lincoln Combustion Turbine (CT) | Fossil | Gas/Oil | NC | 1,507 | ||||||||||
| J.E. Rogers | Fossil | Coal/Gas | NC | 1,395 | ||||||||||
| Rockingham CT | Fossil | Gas/Oil | NC | 895 | ||||||||||
| Mill Creek CT | Fossil | Gas/Oil | SC | 751 | ||||||||||
| Buck CC | Fossil | Gas | NC | 718 | ||||||||||
| Dan River CC | Fossil | Gas | NC | 718 | ||||||||||
W.S. Lee Combined Cycle (CC)(b) | Fossil | Gas | SC | 706 | ||||||||||
| Allen | Fossil | Coal | NC | 426 | ||||||||||
| W.S. Lee CT | Fossil | Gas/Oil | SC | 96 | ||||||||||
| Clemson CHP | Fossil | Gas | SC | 16 | ||||||||||
| Bad Creek | Hydro | Water | SC | 1,600 | ||||||||||
| Jocassee | Hydro | Water | SC | 780 | ||||||||||
| Cowans Ford | Hydro | Water | NC | 324 | ||||||||||
| Keowee | Hydro | Water | SC | 152 | ||||||||||
| Other small facilities (18 plants) | Hydro | Water | NC/SC | 584 | ||||||||||
| Distributed generation | Renewable | Solar | NC | 178 | ||||||||||
| Total Duke Energy Carolinas | 20,736 | |||||||||||||
35
| PROPERTIES | |||||
| Owned MW | ||||||||||||||
| Facility | Plant Type | Primary Fuel | Location | Capacity | ||||||||||
| Duke Energy Progress | ||||||||||||||
| Brunswick | Nuclear | Uranium | NC | 1,928 | ||||||||||
| Harris | Nuclear | Uranium | NC | 1,009 | ||||||||||
| Robinson | Nuclear | Uranium | SC | 793 | ||||||||||
| Roxboro | Fossil | Coal | NC | 2,462 | ||||||||||
| Smith CC | Fossil | Gas/Oil | NC | 1,250 | ||||||||||
| H.F. Lee CC | Fossil | Gas/Oil | NC | 1,054 | ||||||||||
| Wayne County CT | Fossil | Gas/Oil | NC | 975 | ||||||||||
| Smith CT | Fossil | Gas/Oil | NC | 960 | ||||||||||
| L.V. Sutton CC | Fossil | Gas/Oil | NC | 719 | ||||||||||
| Mayo | Fossil | Coal | NC | 713 | ||||||||||
| Asheville CC | Fossil | Gas/Oil | NC | 560 | ||||||||||
| Asheville CT | Fossil | Gas/Oil | NC | 370 | ||||||||||
| Darlington CT | Fossil | Gas/Oil | SC | 264 | ||||||||||
| Weatherspoon CT | Fossil | Gas/Oil | NC | 164 | ||||||||||
| L.V. Sutton CT | Fossil | Gas/Oil | NC | 97 | ||||||||||
| Blewett CT | Fossil | Oil | NC | 68 | ||||||||||
| Walters | Hydro | Water | NC | 112 | ||||||||||
| Other small facilities (3 plants) | Hydro | Water | NC | 116 | ||||||||||
| Distributed generation | Renewable | Solar | NC | 141 | ||||||||||
| Asheville – Rock Hill Battery | Renewable | Storage | NC | 9 | ||||||||||
| Hot Springs Microgrid | Renewable | Storage | NC | 6 | ||||||||||
| Total Duke Energy Progress | 13,770 | |||||||||||||
Owned MW | ||||||||||||||
| Facility | Plant Type | Primary Fuel | Location | Capacity | ||||||||||
| Duke Energy Florida | ||||||||||||||
| Hines CC | Fossil | Gas/Oil | FL | 2,149 | ||||||||||
| Citrus County CC | Fossil | Gas | FL | 1,854 | ||||||||||
| Crystal River | Fossil | Coal | FL | 1,442 | ||||||||||
| Bartow CC | Fossil | Gas/Oil | FL | 1,259 | ||||||||||
| Intercession City CT | Fossil | Gas/Oil | FL | 1,146 | ||||||||||
| Anclote | Fossil | Gas | FL | 1,035 | ||||||||||
| DeBary CT | Fossil | Gas/Oil | FL | 661 | ||||||||||
| Osprey CC | Fossil | Gas/Oil | FL | 611 | ||||||||||
| Tiger Bay CC | Fossil | Gas/Oil | FL | 230 | ||||||||||
| Bayboro CT | Fossil | Oil | FL | 226 | ||||||||||
| Bartow CT | Fossil | Gas/Oil | FL | 212 | ||||||||||
| Suwannee River CT | Fossil | Gas | FL | 194 | ||||||||||
| University of Florida CoGen CT | Fossil | Gas | FL | 50 | ||||||||||
| Lake Placid Battery (microgrid) | Renewable | Storage | FL | 17 | ||||||||||
| Trenton Battery | Renewable | Storage | FL | 11 | ||||||||||
| Micanopy Battery | Renewable | Storage | FL | 8 | ||||||||||
| Jennings Battery | Renewable | Storage | FL | 6 | ||||||||||
| Cape San Blas Battery | Renewable | Storage | FL | 6 | ||||||||||
| Distributed generation | Renewable | Solar | FL | 1,186 | ||||||||||
| Total Duke Energy Florida | 12,303 | |||||||||||||
| Owned MW | ||||||||||||||
| Facility | Plant Type | Primary Fuel | Location | Capacity | ||||||||||
| Duke Energy Ohio | ||||||||||||||
| East Bend | Fossil | Coal | KY | 600 | ||||||||||
| Woodsdale CT | Fossil | Gas/Propane | OH | 564 | ||||||||||
| Distributed generation | Renewable | Solar | KY | 9 | ||||||||||
| Total Duke Energy Ohio | 1,173 | |||||||||||||
36
| PROPERTIES | |||||
Owned MW | ||||||||||||||
| Facility | Plant Type | Primary Fuel | Location | Capacity | ||||||||||
| Duke Energy Indiana | ||||||||||||||
Gibson(c) | Fossil | Coal | IN | 2,845 | ||||||||||
Cayuga(d) | Fossil | Coal/Oil | IN | 1,015 | ||||||||||
| Madison CT | Fossil | Gas | OH | 704 | ||||||||||
| Edwardsport | Fossil | Coal/Gas | IN | 578 | ||||||||||
| Wheatland CT | Fossil | Gas | IN | 508 | ||||||||||
Vermillion CT(e) | Fossil | Gas | IN | 477 | ||||||||||
| Noblesville CC | Fossil | Gas/Oil | IN | 310 | ||||||||||
Henry County CT(f) | Fossil | Gas/Oil | IN | 134 | ||||||||||
| Cayuga CT | Fossil | Gas/Oil | IN | 105 | ||||||||||
| Purdue CHP | Fossil | Gas | IN | 16 | ||||||||||
| Markland | Hydro | Water | IN | 54 | ||||||||||
| Distributed generation | Renewable | Solar | IN | 29 | ||||||||||
| Camp Atterbury Battery | Renewable | Storage | IN | 5 | ||||||||||
| Nabb Battery | Renewable | Storage | IN | 5 | ||||||||||
| Crane Battery | Renewable | Storage | IN | 5 | ||||||||||
| Total Duke Energy Indiana | 6,790 | |||||||||||||
| Owned MW | |||||||||||
| Totals by Type | Capacity | ||||||||||
| Total Electric Utilities | 54,772 | ||||||||||
| Totals by Plant Type | |||||||||||
| Nuclear | 9,322 | ||||||||||
| Fossil | 40,107 | ||||||||||
| Hydro | 3,722 | ||||||||||
| Renewable | 1,621 | ||||||||||
| Total Electric Utilities | 54,772 | ||||||||||
(a)Jointly owned with North Carolina Municipal Power Agency Number 1, NCEMC and PMPA. Duke Energy Carolinas' ownership is 19.25% of the facility.
(b)Jointly owned with NCEMC. Duke Energy Carolinas' ownership is 87.27% of the facility.
(c)Duke Energy Indiana owns and operates Gibson Station Units 1 through 4 and is a joint owner of unit 5 with WVPA and IMPA. Duke Energy Indiana operates unit 5 and owns 50.05%.
(d)Includes Cayuga Internal Combustion.
(e)Jointly owned with WVPA. Duke Energy Indiana's ownership is 62.5% of the facility.
(f)Includes 50 MW, which are contracted to WVPA.
The following table provides information related to EU&I's electric transmission and distribution properties as of December 31, 2023.
| Duke | Duke | Duke | Duke | Duke | ||||||||||||||||
| Duke | Energy | Energy | Energy | Energy | Energy | |||||||||||||||
| Energy | Carolinas | Progress | Florida | Ohio | Indiana | |||||||||||||||
| Electric Transmission Lines | ||||||||||||||||||||
| Miles of 500 to 525 kilovolt (kV) | 1,100 | 600 | 300 | 200 | — | — | ||||||||||||||
| Miles of 345 kV | 1,100 | — | — | — | 400 | 700 | ||||||||||||||
| Miles of 230 kV | 8,500 | 2,700 | 3,400 | 1,700 | — | 700 | ||||||||||||||
| Miles of 100 to 161 kV | 12,600 | 6,900 | 2,600 | 1,000 | 700 | 1,400 | ||||||||||||||
| Miles of 13 to 69 kV | 8,100 | 2,800 | — | 2,200 | 600 | 2,500 | ||||||||||||||
| Total conductor miles of electric transmission lines | 31,400 | 13,000 | 6,300 | 5,100 | 1,700 | 5,300 | ||||||||||||||
| Electric Distribution Lines | ||||||||||||||||||||
| Miles of overhead lines | 171,100 | 66,600 | 44,300 | 25,000 | 13,300 | 21,900 | ||||||||||||||
| Miles of underground line | 111,800 | 43,600 | 28,900 | 22,900 | 6,500 | 9,900 | ||||||||||||||
| Total conductor miles of electric distribution lines | 282,900 | 110,200 | 73,200 | 47,900 | 19,800 | 31,800 | ||||||||||||||
| Number of electric transmission and distribution substations | 3,000 | 1,200 | 500 | 500 | 300 | 500 | ||||||||||||||
Substantially all of EU&I's electric plant in service is mortgaged under indentures relating to Duke Energy Carolinas’, Duke Energy Progress', Duke Energy Florida's, Duke Energy Ohio’s and Duke Energy Indiana’s various series of First Mortgage Bonds.
37
| PROPERTIES | |||||
GAS UTILITIES AND INFRASTRUCTURE
GU&I owns transmission pipelines and distribution mains that are generally underground, located near public streets and highways, or on property owned by others for which Duke Energy Ohio and Piedmont have obtained the necessary legal rights to place and operate facilities on such property located within the GU&I service territories. The following table provides information related to GU&I's natural gas distribution as of December 31, 2023.
| Duke | |||||||||||
| Duke | Energy | ||||||||||
| Energy | Ohio | Piedmont | |||||||||
| Miles of natural gas distribution and transmission pipelines | 35,700 | 7,700 | 28,000 | ||||||||
| Miles of natural gas service lines | 28,800 | 6,700 | 22,100 | ||||||||
OTHER
Duke Energy owns approximately 7.1 million square feet and leases approximately 2.5 million square feet of corporate, regional and district office space spread throughout its service territories. See Note 11, "Property, Plant and Equipment," for further information.
ITEM 3. LEGAL PROCEEDINGS
MTBE Litigation
On December 15, 2017, the state of Maryland filed suit in Baltimore City Circuit Court against Duke Energy Merchants and other defendants alleging contamination of state waters by MTBE leaking from gasoline storage tanks and is seeking an unspecified amount of monetary damages. MTBE is a gasoline additive intended to increase the oxygen levels in gasoline and make it burn cleaner. The case was removed from Baltimore City Circuit Court to federal District Court. Initial motions to dismiss filed by the defendants were denied by the court on September 4, 2019, and the matter is now in discovery. On December 18, 2020, the plaintiff and defendants selected 50 focus sites, none of which have any ties to Duke Energy Merchants. Discovery will be specific to those sites. At this time, Duke Energy Merchants has not engaged in settlement negotiations with the plaintiff and the plaintiff has not reached a settlement agreement with any defendant. Duke Energy cannot predict the outcome of this matter.
In addition, the Duke Energy Registrants are, from time to time, parties to various lawsuits and regulatory proceedings in the ordinary course of their business. For information regarding legal proceedings, including regulatory and environmental matters, see Note 4, “Regulatory Matters,” and Note 5, “Commitments and Contingencies,” to the Consolidated Financial Statements.
ITEM 4. MINE SAFETY DISCLOSURES
This is not applicable for any of the Duke Energy Registrants.
38
| SECURITIES INFORMATION | |||||
ITEM 5. MARKET FOR REGISTRANT'S COMMON EQUITY, RELATED STOCKHOLDER MATTERS AND ISSUER PURCHASES OF EQUITY SECURITIES
The common stock of Duke Energy is listed and traded on the NYSE (ticker symbol DUK). As of January 31, 2024, there were 121,476 Duke Energy common stockholders of record. For information on dividends, see the "Dividend Payments" section of Management's Discussion and Analysis.
There is no market for the common equity securities of the Subsidiary Registrants, all of which are directly or indirectly owned by Duke Energy. See Note 2, "Dispositions," to the Consolidated Financial Statements for information on the investment of a minority interest in Duke Energy Indiana.
Securities Authorized for Issuance Under Equity Compensation Plans
See Item 12 of Part III within this Annual Report for information regarding Securities Authorized for Issuance Under Equity Compensation Plans.
Issuer Purchases of Equity Securities for Fourth Quarter 2023
There were no repurchases of equity securities during the fourth quarter of 2023.
Unregistered Sales of Equity Securities and Use of Proceeds
None.
Stock Performance Graph
The following performance graph compares the cumulative TSR from Duke Energy Corporation common stock, as compared with the Standard & Poor's 500 Stock Index (S&P 500) and the Philadelphia Utility Index for the past five years. The graph assumes an initial investment of $100 on December 31, 2018, in Duke Energy common stock, in the S&P 500 and in the Philadelphia Utility Index and that all dividends were reinvested. The stockholder return shown below for the five-year historical period may not be indicative of future performance.
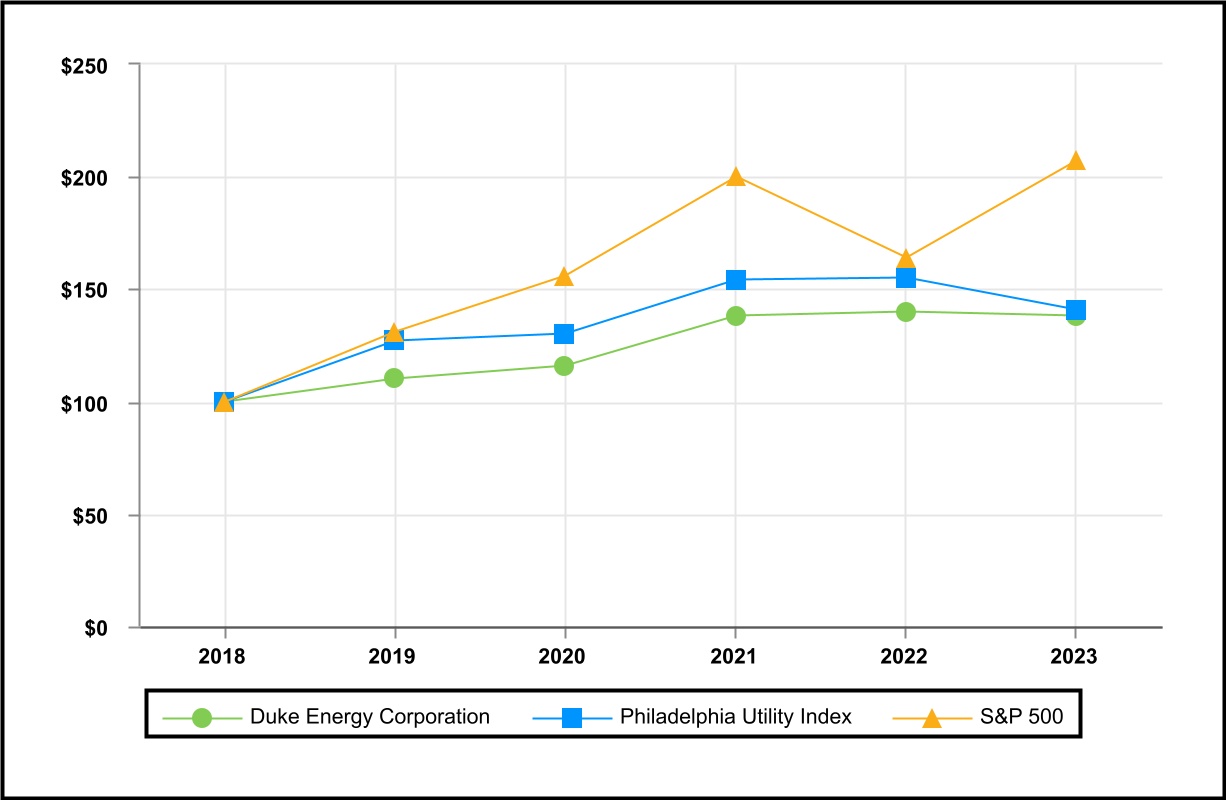
NYSE CEO Certification
Duke Energy has filed the certification of its Chief Executive Officer and Chief Financial Officer pursuant to Section 302 of the Sarbanes-Oxley Act of 2002 as exhibits to this Annual Report.
ITEM 6. SELECTED FINANCIAL DATA
This is not applicable for any of the Duke Energy Registrants.
39
| MD&A | DUKE ENERGY | ||||
ITEM 7. MANAGEMENT’S DISCUSSION AND ANALYSIS OF FINANCIAL CONDITION AND RESULTS OF OPERATIONS
Management’s Discussion and Analysis includes financial information prepared in accordance with GAAP in the U.S., as well as certain non-GAAP financial measures such as adjusted earnings and adjusted EPS discussed below. Generally, a non-GAAP financial measure is a numerical measure of financial performance, financial position or cash flows that excludes (or includes) amounts that are included in (or excluded from) the most directly comparable measure calculated and presented in accordance with GAAP. The non-GAAP financial measures should be viewed as a supplement to, and not a substitute for, financial measures presented in accordance with GAAP. Non-GAAP measures as presented herein may not be comparable to similarly titled measures used by other companies.
The following combined Management’s Discussion and Analysis of Financial Condition and Results of Operations is separately filed by Duke Energy Corporation and its subsidiaries. Duke Energy Carolinas, LLC, Progress Energy, Inc., Duke Energy Progress, LLC, Duke Energy Florida, LLC, Duke Energy Ohio, Inc., Duke Energy Indiana, LLC and Piedmont Natural Gas Company, Inc. However, none of the registrants make any representation as to information related solely to Duke Energy or the subsidiary registrants of Duke Energy other than itself.
Management’s Discussion and Analysis should be read in conjunction with the Consolidated Financial Statements and Notes for the years ended December 31, 2023, 2022 and 2021.
See "Item 7. Management's Discussion and Analysis of Financial Condition and Results of Operations," in Duke Energy's Annual Report on Form 10-K for the year ended December 31, 2022, filed with the SEC on February 27, 2023, for a discussion of variance drivers for the year ended December 31, 2022, as compared to December 31, 2021.
DUKE ENERGY
Duke Energy, an energy company headquartered in Charlotte, North Carolina, operates in the U.S. primarily through its subsidiaries, Duke Energy Carolinas, Duke Energy Progress, Duke Energy Florida, Duke Energy Ohio, Duke Energy Indiana and Piedmont. When discussing Duke Energy’s consolidated financial information, it necessarily includes the results of the Subsidiary Registrants, which along with Duke Energy, are collectively referred to as the Duke Energy Registrants.
Executive Overview
At Duke Energy, we remain focused on continuing to advance our clean energy transition while maintaining affordability and reliability for our customers and delivering on our commitments to our communities, employees, investors, and other stakeholders. The fundamentals of our business are strong and allow us to deliver growth in earnings and dividends in a low-risk, predictable and transparent way. In 2023, we continued to make progress, generating positive strategic and regulatory outcomes, navigating rising interest rates, lower volumes due to mild temperatures and other macroeconomic headwinds, while meeting our near-term financial commitments and continuing to provide the safe and reliable service that our communities depend on.
In 2023, we furthered our transition to a fully regulated utility by closing on the sale of our commercial utility-scale solar and wind group and our distributed generation operations. We advanced a variety of regulatory priorities resulting in positive outcomes and modern recovery mechanisms, and continued to engage with our customers and the communities in our jurisdictions. We also continue to make the investments necessary to support our ongoing clean energy transition and a business portfolio that delivers a reliable and growing dividend, with 2023 representing the 97th consecutive year Duke Energy paid a cash dividend on its common stock.
40
| MD&A | DUKE ENERGY | ||||
Financial Results
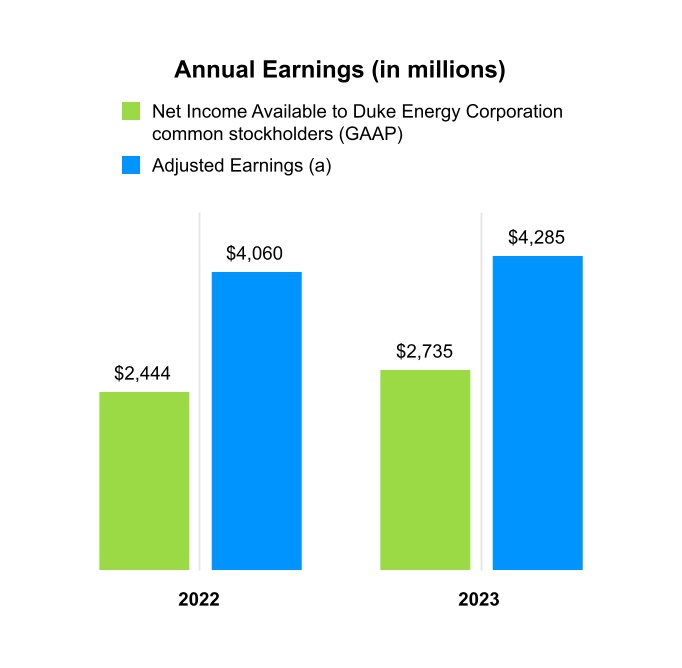

(a)See Results of Operations below for Duke Energy’s definition of adjusted earnings and adjusted EPS as well as a reconciliation of this non-GAAP financial measure to net income available to Duke Energy and net income available to Duke Energy per basic share.
Duke Energy's 2023 Net Income Available to Duke Energy Corporation (GAAP Reported Earnings) was impacted by higher regulatory charges in the prior year. Additional drivers primarily include growth from riders and other retail margin, favorable rate case impacts, lower operations and maintenance expense and lower tax expense. These items were partially offset by higher interest and depreciation expense, unfavorable weather and lower volumes. See “Results of Operations” below for a detailed discussion of the consolidated results of operations and a detailed discussion of financial results for each of Duke Energy’s reportable business segments, as well as Other.
2023 Areas of Focus and Accomplishments
Clean Energy Transition. Our industry continues to experience an unprecedented level of change and 2023 was a dynamic year for our company as we navigated ongoing macroeconomic headwinds and continued to execute on our strategic priorities and deliver on our vision.
Generating Cleaner Energy
We are targeting energy generated from coal to represent less than 5% of total generation by 2030 and a full exit by 2035, subject to regulatory approvals, as part of the largest planned coal fleet retirement in the industry. We have made strong progress to date in reducing carbon emissions from electricity generation (a 48% reduction from 2005) and have established goals to do more (at least 50% reduction by 2030, 80% by 2040, and net zero by 2050). We are also working to reduce Scope 2 and certain Scope 3 emissions, including emissions from upstream purchased power and fossil fuel purchases, as well as downstream customer use of natural gas, by 50% by 2035, on the way to net zero by 2050.
Duke Energy was one of the first utilities to address the totality of its impact – approximately 95% of the Company's greenhouse gas emissions are tied to a measurable net zero goal. Over the next decade, we expect to deploy between approximately $170 and $180 billion of capital into our regulated businesses, driven by clean energy transition investments. These investments will drive substantial economic benefits for the communities we serve and reduce our customers' exposure to fuel volatility. We have filed and refined comprehensive IRPs consistent with this strategy in multiple jurisdictions, allowing us to make needed investments to increase grid resiliency and enable coal plant retirements, renewables and energy storage.
As we look beyond 2030, we will need additional tools to continue our progress. We will actively work to advocate for research and development and deployment of carbon-free, dispatchable resources. This includes longer-duration energy storage, advanced nuclear technologies, carbon capture and zero-carbon fuels.
Sale of Commercial Renewables
In November 2022, Duke Energy committed to a plan to sell the Commercial Renewables business, excluding the offshore wind contract for Carolina Long Bay. As we look forward to the remainder of this decade and beyond, we have line of sight to significant renewable, grid and other investment opportunities within our faster-growing regulated operations. We closed on the sales of the commercial utility-scale solar and wind group and the distributed generation group in October 2023, facilitating our transition to a fully regulated utility.
41
| MD&A | DUKE ENERGY | ||||
Carolinas Integrated Resource Plan
HB 951 was passed in 2021 reflecting North Carolina policy accelerating a clean energy transition for generation while continuing to prioritize affordability and reliability for our customers. The legislation established a framework overseen by the NCUC to advance state CO2 emission reductions in North Carolina through the use of least cost planning, including stakeholder involvement, and also introduced modernized recovery mechanisms under PBR, which consists of MYRP, PIMS, and residential decoupling, and promotes more efficient recovery of investments and aligns incentives between the Company and the state’s energy policy objectives.
In May 2022, we filed a proposed Carbon Plan with the NCUC that outlined potential pathways toward achieving the HB 951 carbon reduction targets while balancing affordability and reliability for our customers and in December 2022, the NCUC issued an order adopting its initial Carbon Plan, which included a set of near-term actions to support meeting the state's carbon reduction goals. In August 2023, Duke Energy Carolinas and Duke Energy Progress filed an updated combined systemwide Carolinas IRP with the NCUC and the PSCSC, setting the course for the next 15 years of our clean energy transition. The plan outlined the diverse resources required to serve customers reliably and to achieve our clean energy transition in both states. In January 2024, we filed supplemental modeling and analysis with the NCUC and PSCSC due to substantially increased load forecasts resulting from continued economic development successes in the Carolinas occurring since the system-wide plan was prepared.
Modernizing the Power Grid and Natural Gas Infrastructure
We are leveraging new technology, digital tools and data analytics across the business in response to a transforming landscape and our grid improvement programs continue to be a key component of our growth strategy. Modernization of the electric grid, including smart meters, storm hardening, self-healing and targeted undergrounding, helps to ensure the system is better prepared for severe weather, improves the system's reliability and flexibility, and provides better information and services for our customers. We continue to enhance our customers' experience with the Self-Optimizing Grid (SOG), our flagship grid improvement program spanning all of Duke Energy’s regulated utilities. In 2023, our SOG investments helped to avoid approximately 330,000 customer interruptions across our six-state electric service area, preventing customers from having more than 1.4 million hours of lost outage time during major events.
Investments in integrity management of our natural gas infrastructure continue to be of importance to ensure reliable, safe, and increasingly clean delivery of natural gas to our customers. Recognizing the importance of natural gas, we continue to work toward a net-zero methane emission goal by 2030 related to our natural gas distribution business. In our LDC business, we remain focused on reducing methane emissions, leveraging our partnerships, emissions platform, sensors and other technologies to find and fix leaks in near real time. We also use cross compression to avoid releasing natural gas into the atmosphere during certain operational activities.
In October, we announced plans to build and operate our first system capable of producing, storing and combusting 100% green hydrogen. The one-of-its-kind, end-to-end system will use solar energy at Duke Energy Florida's 74.5-MW DeBary solar plant to produce green hydrogen for an upgraded on-site CT designed to operate on a blend of natural gas and hydrogen or up to 100% hydrogen. We anticipate the system will be installed and fully functioning in 2024, providing access to on-demand, dispatchable, increasingly clean energy for our Duke Energy Florida customers.
Response to Macroeconomic Headwinds. While 2023 presented unique macroeconomic challenges, Duke Energy has a demonstrated track record of executing on our business plans while driving efficiencies and productivity in the business. Despite rising interest rates and near-record mild weather across all of our service territories, we achieved financial results within our adjusted EPS guidance and continued our cost-management journey with a focus on driving productivity, increasing flexibility and prioritizing spend based on risk and strategic value to our customers and investors. We executed on our Workload Reduction Initiative launched in late 2022 while building on our culture of continuous improvement to continue to identify ways to reduce operating costs. We remain focused on organization simplification, automation, reducing service levels provided to internal customers as appropriate, outsourcing, and continued operational excellence.
Volatile commodity prices led to rapid fuel cost increases in 2022, impacting the price of electricity in all of our jurisdictions. We actively worked to manage and maintain prices at lower levels than they otherwise would have been in light of increased commodity prices, working with our regulators to extend recovery periods in certain jurisdictions in a way that was manageable for our customers. In 2023, we made substantial progress, recovering $1.5 billion in deferred fuel costs this year. With these actions, lower fuel prices, and increased stability in these markets during 2023, we anticipate to be in line with our historical average balance of deferred fuel costs by the end of 2024.
While inflation has moderated to a degree, we continue to successfully navigate supply chain challenges including longer lead times and shortages of solar panels and other equipment. We execute longer supply agreements and proactively secure equipment in advance of hurricane season. Our procurement teams continue to execute on action plans to enhance planning, augment supply, amend operations and leverage our scale to continue to mitigate these risks to the extent possible.
Recent macroeconomic headwinds aside, the level of economic development success and growth experienced in our service territories is significantly above what we have experienced over the last two decades. In 2023, Site Selection magazine recognized Duke Energy as a “Top Utility in Economic Development," recognizing our critical role and successful efforts working with our state partners to win 67 projects this year alone, representing approximately $22 billion in new capital investment and 15,000 new jobs within our service territories. These projects include transformational electric vehicle and battery manufacturing facilities as well as data centers. Supporting the increasing generation load demands expected from projects like these in the coming years is an immense opportunity for our Company and the communities we proudly serve.
Constructive Regulatory and Legislative Outcomes. One of our long-term strategic goals is to achieve modernized regulatory constructs across all of our jurisdictions. Modernized constructs provide benefits, which include improved earnings and cash flows through more timely recovery of investments, as well as stable pricing for customers. Grid investment riders in the Midwest and Florida enable more timely cost recovery and earnings growth and we have a MYRP in Florida through 2024.
In North Carolina, as highlighted above, HB 951 authorizes the use of modernized regulatory constructs under the direction of the NCUC. In October 2022, Duke Energy Progress filed its first North Carolina rate case utilizing PBR and reached partial settlements on key matters in April and May 2023. In August 2023, the NCUC issued a constructive order approving these partial settlements and Duke Energy Progress' PBR Application with certain modifications, marking the first implementation of an MYRP under the performance-based regulations authorized by HB 951. Duke Energy Progress implemented revised Year 1 rates on October 1, 2023. In January 2023, we also filed a Duke Energy Carolinas rate case in North Carolina, which incorporated elements of PBR. In August 2023, we reached partial settlements on key matters with the Public Staff and received a constructive order from the NCUC in December 2023, with new rates effective January 2024. After more than a decade of work, these rate cases mark a significant milestone in securing regulatory approval of modern ratemaking structures in North Carolina.
42
| MD&A | DUKE ENERGY | ||||
In addition to the Duke Energy Progress and Duke Energy Carolinas rate cases in North Carolina, we continued to move a variety of other regulatory initiatives forward during 2023. In February 2023, the PSCSC approved a constructive comprehensive settlement with all parties in the Duke Energy Progress South Carolina rate case and we implemented new customer rates effective April 1, 2023. In the Midwest, we received a constructive order on our Duke Energy Kentucky electric rate case in October 2023. As it relates to our natural gas businesses, in Duke Energy Ohio, we filed a stipulation on key matters in our base rate case with all parties except the OCC in April 2023. We received an order approving the stipulation in November 2023. In September 2023, the TPUC approved a settlement related to our Annual Review Mechanism in Tennessee, with adjusted rates effective October 1, 2023. Overall, this was a very active year as it relates to regulatory filings, which reflects the important investments and ongoing clean energy transition across all our service territories.
In 2022, storm securitization legislation was passed in South Carolina, providing the opportunity to securitize deferred storm costs and lower the bill impacts for our customers. In 2023, we made progress on our South Carolina storm securitization filings. The PSCSC approved a comprehensive settlement in September 2023 and issued its financing order in October 2023. Also in South Carolina, we filed a Duke Energy Carolinas rate case with the PSCSC in January 2024.
We also continued to evaluate the impacts of the Inflation Reduction Act, which is expected to have significant benefits to customers and lower the cost of the clean energy transition. In 2023, we worked to advocate successfully for the best interests of our customers, communities, and Company in important areas, including the preservation and application of nuclear PTCs in the regulated utility business model.
Customer Satisfaction. Duke Energy continues to transform the customer experience through our use of customer data to better inform operational priorities and performance levels. This data-driven approach allows us to identify the investments that are most important to the customer experience. While customer satisfaction across our industry continues to be impacted by the macroeconomic environment and the impacts of inflationary pressures including higher fuel prices on customer bills, our work continues to be recognized by our customers, with strong customer satisfaction scores in our jurisdictions including Piedmont, which was ranked number one in customer satisfaction by J.D. Power for residential natural gas service in the south for the second year in a row.
Operational Excellence, Safety and Reliability. The reliable and safe operation of our power plants, electric distribution system and natural gas infrastructure in our communities continues to be foundational to serving our customers, our financial results, and our credibility with stakeholders. Late 2022 presented unique challenges to the grid in our service territories, including attacks on two substations in Moore County, North Carolina, and extreme winter weather that forced us to take unprecedented measures to ensure the integrity of our systems in North Carolina.
Following the Moore County Substation attack, we reassessed the criticality of every substation, evaluated new security tools and technology, and conducted benchmarking with peer utilities. We created a plan to enhance physical security and resiliency at sites that are critical to the Bulk Electric System and those with the greatest impact to customers. We will work to implement these enhancements across all jurisdictions, representing an investment of approximately $500 million over the next three years. In North Carolina, recovery has been approved through the MYRP. Cost recovery requests in South Carolina, Florida and the Midwest are expected to be included in future rate cases.
In December 2022, high winds and extreme cold from Winter Storm Elliott, customer demand that was higher than forecasted, and the inability to import additional power from out of state, resulted in the need to temporarily interrupt service to about 500,000 customers to maintain overall grid reliability and prevent further potential disruptions in the Carolinas. In 2023, we established the Bulk Electric System Oversight Board to provide executive oversight of programs and policies designed to ensure energy adequacy for our customers. We practiced our forecasting, grid assessment, oversight, and governance processes throughout the summer, as hot weather challenged operations from time to time. We will continue to work to ensure that our grid and fleet can withstand the stress of extreme weather on our system, evaluate lessons learned and enhance our strategy and communications to effectively serve our customers now and in the future.
Despite these recent challenges, our regulated generation fleet and nuclear sites had strong performance throughout the year and our electric distribution system performed well. The safety of our workforce is a core value and we remain an industry leader in personal safety. In 2023, we achieved one of the best safety records in our company’s history with our TICR significantly above target. For the eighth consecutive year, we ranked first among North American combined gas and electric companies in Edison Electric Institute’s (EEI) annual safety survey, and our gas operations organization finished in the top 10% for the third year in a row, according to the American Gas Association. And, for the first time since our merger with Progress Energy in 2012, we finished the year with less than 100 Occupational Safety and Health Administration recordable incidents. In addition, we continued our strong environmental performance, with no reportable environmental events.
Our workforce and our contract partners worked hard to prepare for this year’s storm season, through drills, material planning, call center readiness, contingency planning, and customer communications. This summer, we experienced extreme weather across our regions, including a July 4 series of major storms in the Midwest, numerous storms in July and August in the Carolinas, and Hurricane Idalia in August, impacting Florida and the east coast of the Carolinas. We safely restored power to 95% of affected customers within 48 hours. Our preparation and robust communications to our customers and communities enhanced our reputation and built stakeholder loyalty and support.
Our ability to effectively handle all facets of the 2023 storm response efforts while making ongoing investments to enhance the reliability and physical security of the grid, mitigate ongoing macroeconomic challenges, and navigate supply chain constraints, is a testament to our team’s extensive preparation and coordination, applying lessons learned from previous storms, and to on-the-ground management throughout the restoration efforts. Duke Energy has received 20 Emergency Response Awards since EEI began recognizing storm response in 1998 (including 11 for assisting other utilities).
Duke Energy Objectives – 2024 and Beyond
At Duke Energy, our business strategy centers on delivering reliable, affordable and cleaner energy to our customers and communities, safely transforming and readying our system by investing in innovative technologies, modernizing our gas and electric infrastructure and expanding and integrating efficiency and demand management programs. As we transition our business to cleaner sources of energy, we are focused on delivering sustainable value for our customers and shareholders by leveraging business transformation to exceed customer expectations, optimizing investments to drive attractive shareholder returns, and by providing new product offerings and solutions that deliver growth and customer value. To achieve these major milestones, we are shaping the landscape by partnering with stakeholders, championing public policy that advances innovation, and advancing regulatory models that support carbon and methane emission reductions.
43
| MD&A | DUKE ENERGY | ||||
Matters Impacting Future Results
The matters discussed herein could materially impact the future operating results, financial condition and cash flows of the Duke Energy Registrants and Business Segments.
Regulatory Matters
Coal Ash Costs
Duke Energy Carolinas and Duke Energy Progress have approximately $1.6 billion and $1.2 billion, respectively, in regulatory assets related to coal ash retirement obligations as of December 31, 2023. Future spending, including amounts recorded for depreciation and liability accretion, is expected to continue to be deferred and recovered in future rate cases or rider filings. The majority of spend is primarily expected to occur over the next 10 years.
Duke Energy Indiana has interpreted the CCR Rule to identify the coal ash basin sites impacted and has assessed the amounts of coal ash subject to the rule and established methods of compliance. Interpretation of the requirements of the CCR Rule is subject to further legal challenges and regulatory approvals, which could result in additional ash basin closure requirements, higher costs of compliance and greater AROs. Additionally, Duke Energy Indiana has retired facilities that are not subject to the CCR Rule. Duke Energy Indiana may incur costs at these facilities to comply with environmental regulations or to mitigate risks associated with on-site storage of coal ash. Duke Energy Indiana has approximately $408 million in regulatory assets related to coal ash asset retirement obligations as of December 31, 2023. See “Other Matters” and Note 4 to the Consolidated Financial Statements, "Regulatory Matters" for more information.
Fuel Cost Recovery
As a result of rapidly rising commodity costs during 2022, including natural gas, fuel and purchased power prices in excess of amounts included in fuel-related revenues led to an increase in the undercollection of fuel costs from customers in jurisdictions including Duke Energy Carolinas, Duke Energy Progress and Duke Energy Florida. These amounts were deferred in regulatory assets and impacted the cash flows of the registrants, including increased borrowings to temporarily finance related expenditures until recovery. Natural gas costs stabilized in 2023 and the Duke Energy Registrants are making progress collecting deferred fuel balances. Regulatory filings have been made and approved for recovery of all remaining uncollected 2022 fuel costs. Across all jurisdictions, Duke Energy recovered $1.5 billion of deferred fuel costs in 2023, and expects deferred fuel cost balances to be back in line with historical norms by the end of 2024. See Note 4 to the Consolidated Financial Statements, "Regulatory Matters" for more information.
Commercial Renewables
In November 2022, Duke Energy committed to a plan to sell the Commercial Renewables Disposal Groups. The Commercial Renewables Disposal Groups were classified as held for sale and as discontinued operations in the fourth quarter of 2022. Duke Energy entered into purchase and sale agreements with affiliates of Brookfield in June 2023 for the sale of the utility-scale solar and wind group and with affiliates of ArcLight in July 2023 for the distributed generation group. Both transactions closed in October 2023 and proceeds from the sales were used for debt avoidance. Duke Energy expects to complete the disposition of the remaining assets in the first half of 2024. For more information, see Note 2 to the Consolidated Financial Statements, "Dispositions."
In February 2021, a severe winter storm impacted certain Commercial Renewables assets in Texas. Extreme weather conditions limited the ability for these solar and wind facilities to generate and sell electricity into the market. Originally, Duke Energy (Parent) was named in multiple lawsuits arising out of this winter storm, but the plaintiffs have dismissed Duke Energy (parent) from these lawsuits. The legal actions related to all but one of the project companies in this matter transferred to affiliates of Brookfield in conjunction with the transaction closing in October 2023. For more information, see Note 5 to the Consolidated Financial Statements, "Commitments and Contingencies."
Supply Chain
In 2023, Duke Energy has experienced modest improvement in the stability of the markets for key materials purchased and used by the Company. The Company continues to monitor developments, including proposed federal regulations, that could disrupt or impact the Company's supply chain and, as a result, may impact Duke Energy's execution of its capital plan, future financial results, or the achievement of its clean energy goals.
Goodwill
The Duke Energy Registrants performed their annual goodwill impairment tests as of August 31, 2023, as described in Note 12 to the Consolidated Financial Statements, "Goodwill and Intangible Assets." As of August 31, 2023, all of Duke Energy Registrants' reporting units' estimated fair values materially exceeded the carrying values except for the GU&I reporting unit of Duke Energy Ohio. While no goodwill impairment charges were recorded in 2023, the potential for continued interest rate pressures, and the related impact on the weighted average cost of capital, without timely or adequate updates to the regulated allowed return on equity or deteriorating economic conditions impacting GU&I's future cash flows or equity valuations of peer companies could impact the estimated fair value of GU&I, and goodwill impairment charges could be recorded in the future. The carrying value of goodwill within GU&I for Duke Energy Ohio was approximately $324 million as of December 31, 2023.
Other
Duke Energy continues to monitor general market conditions, including the potential for continued interest rate pressures on the Company's cost of capital, which may impact Duke Energy's execution of its capital plan, future financial results, or the achievement of its clean energy goals.
44
| MD&A | DUKE ENERGY | ||||
Results of Operations
Non-GAAP Measures
Management evaluates financial performance in part based on non-GAAP financial measures, including adjusted earnings and adjusted EPS. These items represent income from continuing operations available to Duke Energy common stockholders in dollar and per share amounts, adjusted for the dollar and per share impact of special items. As discussed below, special items include certain charges and credits, which management believes are not indicative of Duke Energy's ongoing performance. Management believes the presentation of adjusted earnings and adjusted EPS provides useful information to investors, as it provides them with an additional relevant comparison of Duke Energy’s performance across periods.
Management uses these non-GAAP financial measures for planning and forecasting, and for reporting financial results to the Board of Directors, employees, stockholders, analysts and investors. Adjusted EPS is also used as a basis for employee incentive bonuses. The most directly comparable GAAP measures for adjusted earnings and adjusted EPS are GAAP Reported Earnings and EPS Available to Duke Energy Corporation common stockholders (GAAP Reported EPS), respectively.
Special items included in the periods presented include the following, which management believes do not reflect ongoing costs:
•Regulatory matters primarily represents net impairment charges related to Duke Energy Carolinas' and Duke Energy Progress' North Carolina rate case orders.
•Organizational optimization costs represent amounts associated with strategic repositioning to a fully regulated utility, and primarily consist of severance costs, consultant fees and impairment charges for certain nonregulated assets.
•Regulatory matters and litigation primarily represents the net impact of charges related to the Indiana court rulings on coal ash and other unrelated ongoing litigation.
•Workplace and workforce realignment represents costs attributable to business transformation, including long-term real estate strategy changes and workforce reduction.
Discontinued operations primarily includes impairments on the sale of the Commercial Renewables business and results from Duke Energy's Commercial Renewables Disposal Groups.
Duke Energy’s adjusted earnings and adjusted EPS may not be comparable to similarly titled measures of another company because other companies may not calculate the measures in the same manner.
Reconciliation of GAAP Reported Amounts to Adjusted Amounts
The following table presents a reconciliation of adjusted earnings and adjusted EPS to the most directly comparable GAAP measures.
| Years Ended December 31, | |||||||||||||||||||||||
| 2023 | 2022 | ||||||||||||||||||||||
| (in millions, except per share amounts) | Earnings | EPS | Earnings | EPS | |||||||||||||||||||
| GAAP Reported Earnings/EPS | $ | 2,735 | $ | 3.54 | $ | 2,444 | $ | 3.17 | |||||||||||||||
| Adjustments to Reported: | |||||||||||||||||||||||
Organizational Optimization(a) | 95 | 0.13 | — | — | |||||||||||||||||||
Regulatory Matters(b) | 64 | 0.08 | — | — | |||||||||||||||||||
Regulatory Matters and Litigation(c) | — | — | 295 | 0.39 | |||||||||||||||||||
Workplace and Workforce Realignment(d) | — | — | 105 | 0.14 | |||||||||||||||||||
Discontinued Operations(e) | 1,391 | 1.81 | 1,216 | 1.57 | |||||||||||||||||||
| Adjusted Earnings/Adjusted EPS | $ | 4,285 | $ | 5.56 | $ | 4,060 | $ | 5.27 | |||||||||||||||
(a) Net of tax benefit of $29 million. $110 million recorded within Operations, maintenance and other and $14 million within Impairment of assets and other charges.
(b) Net of $20 million tax benefit. $68 million within Impairment of assets and other charges and $16 million within Operations, maintenance and other.
(c) Net of tax benefit of $128 million. $386 million recorded within Impairment of assets and other charges, $46 million within Regulated electric (Operating Revenues) and $34 million within Net (Income) Loss Attributable to Noncontrolling Interests. $25 million recorded within Operations, maintenance and other.
(d) Net of tax benefit of $31 million. $72 million recorded within Impairment of assets and other charges, $71 million recorded within Operations, maintenance and other and a $7 million gain recorded in Gains on sales of other assets and other.
(e) Recorded in Loss from Discontinued Operations, net of tax, and Net (Income) Loss Attributable to Noncontrolling Interests.
Year Ended December 31, 2023, as compared to 2022
GAAP Reported EPS was $3.54 for the year ended December 31, 2023, compared to $3.17 for the year ended December 31, 2022. In addition to the drivers below, the increase in GAAP Reported Earnings/EPS was also due to higher regulatory charges in the prior year.
45
| MD&A | DUKE ENERGY | ||||
As discussed and shown in the table above, management also evaluates financial performance based on adjusted EPS. Duke Energy’s adjusted EPS was $5.56 for the year ended December 31, 2023, compared to $5.27 for the year ended December 31, 2022. The increase in Adjusted Earnings/Adjusted EPS was primarily due to growth from riders and other retail margin, favorable rate case impacts, lower operations and maintenance expense and lower tax expense. These items were partially offset by higher interest and depreciation expense, unfavorable weather and lower volumes.
SEGMENT RESULTS
The remaining information presented in this discussion of results of operations is on a GAAP basis. Management evaluates segment performance based on segment income. Segment income is defined as income from continuing operations net of income attributable to noncontrolling interests and preferred stock dividends. Segment income includes intercompany revenues and expenses that are eliminated in the Consolidated Financial Statements.
Duke Energy's segment structure includes Electric Utilities and Infrastructure (EU&I) and Gas Utilities and Infrastructure (GU&I). The remainder of Duke Energy’s operations is presented as Other. See Note 3 to the Consolidated Financial Statements, “Business Segments,” for additional information on Duke Energy’s segment structure.
Electric Utilities and Infrastructure
| Years Ended December 31, | ||||||||||||||||||||
| (in millions) | 2023 | 2022 | Variance | |||||||||||||||||
| Operating Revenues | $ | 26,921 | $ | 26,024 | $ | 897 | ||||||||||||||
| Operating Expenses | ||||||||||||||||||||
| Fuel used in electric generation and purchased power | 9,164 | 8,862 | 302 | |||||||||||||||||
| Operations, maintenance and other | 5,309 | 5,354 | (45) | |||||||||||||||||
| Depreciation and amortization | 4,684 | 4,550 | 134 | |||||||||||||||||
| Property and other taxes | 1,320 | 1,315 | 5 | |||||||||||||||||
| Impairment of assets and other charges | 75 | 374 | (299) | |||||||||||||||||
| Total operating expenses | 20,552 | 20,455 | 97 | |||||||||||||||||
| Gains on Sales of Other Assets and Other, net | 28 | 7 | 21 | |||||||||||||||||
| Operating Income | 6,397 | 5,576 | 821 | |||||||||||||||||
| Other Income and Expenses, net | 517 | 467 | 50 | |||||||||||||||||
| Interest Expense | 1,850 | 1,565 | 285 | |||||||||||||||||
| Income Before Income Taxes | 5,064 | 4,478 | 586 | |||||||||||||||||
| Income Tax Expense | 742 | 536 | 206 | |||||||||||||||||
| Less: Income Attributable to Noncontrolling Interest | 99 | 13 | 86 | |||||||||||||||||
| Segment Income | $ | 4,223 | $ | 3,929 | $ | 294 | ||||||||||||||
| Duke Energy Carolinas GWh sales | 87,635 | 90,915 | (3,280) | |||||||||||||||||
| Duke Energy Progress GWh sales | 66,717 | 70,435 | (3,718) | |||||||||||||||||
| Duke Energy Florida GWh sales | 43,384 | 46,214 | (2,830) | |||||||||||||||||
| Duke Energy Ohio GWh sales | 23,307 | 24,269 | (962) | |||||||||||||||||
| Duke Energy Indiana GWh sales | 30,219 | 31,979 | (1,760) | |||||||||||||||||
| Total Electric Utilities and Infrastructure GWh sales | 251,262 | 263,812 | (12,550) | |||||||||||||||||
Net proportional MW capacity in operation(a) | 54,404 | 54,347 | 57 | |||||||||||||||||
(a) Net proportional MW capacity in operation reflects winter/nameplate capacity as of December 31, 2023, and 2022. See Item 2, "Properties" for further details.
Year Ended December 31, 2023, as compared to 2022
EU&I’s higher segment income was due to higher revenues from rate cases across multiple jurisdictions and the prior year Indiana court rulings on recovery of certain coal ash costs, partially offset by unfavorable weather, lower weather-normal retail sales volumes and higher interest expense. The following is a detailed discussion of the variance drivers by line item.
Operating Revenues. The variance was driven primarily by:
•a $902 million increase in fuel revenues primarily due to higher fuel cost recovery in the current year;
•a $363 million increase in storm revenues at Duke Energy Florida due to hurricanes Ian and Nicole collections;
•a $276 million increase due to higher pricing at Duke Energy Progress from the South Carolina rate case and interim rates from the North Carolina rate case, the Duke Energy Ohio electric rate case, the Duke Energy Kentucky electric rate case and Ohio tax reform deferrals in prior year, and base rate adjustments related to annual increases from the 2021 Settlement Agreement at Duke Energy Florida;
46
| MD&A | SEGMENT RESULTS - ELECTRIC UTILITIES AND INFRASTRUCTURE | ||||
•a $115 million increase in rider revenues primarily due to a decrease in the return of EDIT to customers compared to the prior year at Duke Energy Carolinas and increased Storm Protection Plan rider revenue at Duke Energy Florida; and
•a $67 million increase due to the provision for rate refund recognized in the prior year related to the Indiana Supreme Court ruling on recovery of certain coal ash costs.
Partially offset by:
•a $341 million decrease in retail sales due to unfavorable weather compared to prior year;
•a $323 million decrease in wholesale revenues primarily due to lower demand at Duke Energy Florida and lower prices at Duke Energy Indiana; and
•a $173 million decrease in weather-normal retail sales volumes.
Operating Expenses. The variance was driven primarily by:
•a $302 million increase in fuel used in electric generation and purchased power due to changes in the generation mix at Duke Energy Carolinas and recovery of fuel expense at Duke Energy Carolinas, Duke Energy Progress and Duke Energy Florida; and
•a $134 million increase in depreciation and amortization primarily due to higher plant in service, partially offset by the amortization of the DOE settlement regulatory liability at Duke Energy Florida.
Partially offset by:
•a $299 million decrease in impairment of assets and other charges primarily due to the Indiana court rulings on recovery of certain coal ash costs in the prior year, partially offset by rate case impacts at Duke Energy Carolinas and Duke Energy Progress in the current year; and
•a $45 million decrease in operation, maintenance and other expense primarily due to decrease in spend on outside services and lower project costs at Duke Energy Carolinas and Duke Energy Progress, partially offset by an increase in storm amortization at Duke Energy Florida.
Gains on Sales of Other Assets and Other, net. The increase was primarily due to the sale of the Mint Street parking deck.
Other Income and Expenses, net. The variance was primarily due to non-service pension expense.
Interest Expense. The variance was primarily driven by higher interest rates and outstanding debt balances.
Income Tax Expense. The increase in tax expense was primarily due to an increase in pretax income and a decrease in the amortization of EDIT. The ETRs for the years ended December 31, 2023, and 2022, were 14.7% and 12.0%, respectively. The increase in the ETR was primarily due to a decrease in the amortization of EDIT.
Income Attributable to Noncontrolling Interest. The increase was due to the second and final tranche of the GIC minority interest sale.
47
| MD&A | SEGMENT RESULTS - GAS UTILITIES AND INFRASTRUCTURE | ||||
Gas Utilities and Infrastructure
| Years Ended December 31, | |||||||||||||||||
| (in millions) | 2023 | 2022 | Variance | ||||||||||||||
| Operating Revenues | $ | 2,266 | $ | 2,840 | $ | (574) | |||||||||||
| Operating Expenses | |||||||||||||||||
| Cost of natural gas | 593 | 1,276 | (683) | ||||||||||||||
| Operation, maintenance and other | 455 | 532 | (77) | ||||||||||||||
| Depreciation and amortization | 349 | 327 | 22 | ||||||||||||||
| Property and other taxes | 129 | 138 | (9) | ||||||||||||||
| Impairment of assets and other charges | (4) | (12) | 8 | ||||||||||||||
| Total operating expenses | 1,522 | 2,261 | (739) | ||||||||||||||
| Gains on Sales of Other Assets and Other, net | — | 1 | (1) | ||||||||||||||
| Operating Income | 744 | 580 | 164 | ||||||||||||||
| Other income and expenses, net | 106 | 78 | 28 | ||||||||||||||
| Interest Expense | 217 | 182 | 35 | ||||||||||||||
| Income Before Income Taxes | 633 | 476 | 157 | ||||||||||||||
| Income Tax Expense | 116 | 8 | 108 | ||||||||||||||
Add: Loss Attributable to Noncontrolling Interest | 2 | — | 2 | ||||||||||||||
| Segment Income | $ | 519 | $ | 468 | $ | 51 | |||||||||||
| Piedmont Local Distribution Company (LDC) throughput (Dth) | 569,752,712 | 628,035,471 | (58,282,759) | ||||||||||||||
| Duke Energy Midwest LDC throughput (MCF) | 80,252,769 | 90,010,669 | (9,757,900) | ||||||||||||||
Year Ended December 31, 2023, as compared to 2022
GU&I's results were impacted primarily by margin growth partially offset by higher interest expense. The following is a detailed discussion of the variance drivers by line item.
Operating Revenues. The variance was driven primarily by:
•a $683 million decrease due to lower natural gas costs passed through to customers, lower volumes, and decreased off-system sales natural gas costs.
Partially offset by:
•a $26 million increase due to customer growth;
•a $19 million increase due to North Carolina IMR;
•a $15 million increase due to the MGP Settlement in prior year;
•an $11 million increase due to Tennessee ARM revenue recognition;
•a $9 million increase due to due to secondary marketing sales;
•a $6 million increase in Ohio tax reform deferrals; and
•a $4 million increase due to rider revenues.
Operating Expenses. The variance was driven primarily by:
•a $683 million decrease in cost of natural gas due to lower natural gas costs passed through to customers, lower volumes, and decreased off-system sales natural gas costs; and
•a $77 million decrease in operations, maintenance and other due to the MGP Settlement in prior year, lower labor costs, retirement of propane facilities and pipeline safety and integrity work.
Partially offset by:
•a $22 million increase in depreciation and amortization due to additional plant in service and lower CEP deferrals.
Other Income and Expenses, net. The variance was primarily due to revisions in estimated ACP ARO closure costs and higher AFUDC equity income.
Interest Expense. The variance was primarily due to higher outstanding debt balances and interest rates.
Income Tax Expense. The increase in tax expense was primarily due to a decrease in the amortization of EDIT related to the MGP Settlement recorded in the prior year and an increase in pretax income. The ETRs for the years ended December 31, 2023, and 2022, were 18.3% and 1.7%, respectively. The increase in the ETR was primarily due to a decrease in the amortization of EDIT related to the MGP Settlement recorded in the prior year.
48
| MD&A | SEGMENT RESULTS - OTHER | ||||
Other
| Years Ended December 31, | ||||||||||||||||||||
| (in millions) | 2023 | 2022 | Variance | |||||||||||||||||
| Operating Revenues | $ | 134 | $ | 122 | $ | 12 | ||||||||||||||
| Operating Expenses | 249 | 298 | (49) | |||||||||||||||||
Gains on Sales of Other Assets and Other, net | 24 | 14 | 10 | |||||||||||||||||
| Operating Loss | (91) | (162) | 71 | |||||||||||||||||
| Other Income and Expenses, net | 258 | 65 | 193 | |||||||||||||||||
| Interest Expense | 1,097 | 778 | 319 | |||||||||||||||||
| Loss Before Income Taxes | (930) | (875) | (55) | |||||||||||||||||
| Income Tax Benefit | (420) | (244) | (176) | |||||||||||||||||
| Less: Preferred Dividends | 106 | 106 | — | |||||||||||||||||
| Net Loss | $ | (616) | $ | (737) | $ | 121 | ||||||||||||||
Year Ended December 31, 2023, as compared to 2022
The lower net loss was driven by an increase in the tax benefit due to a favorable adjustment related to certain allowable tax deductions, a franchise tax benefit and higher returns on investments, partially offset by higher interest expense.
Operating Expenses. The decrease was primarily driven by franchise tax refunds in the current year and higher asset impairments in the prior year, partially offset by higher severance costs associated with strategic repositioning as the Company transitions to a fully regulated utility.
Other Income and Expenses, net. The variance was primarily due to higher return on investments that fund certain employee benefit obligations and higher yields on captive insurance investments.
Interest Expense. The variance was primarily due to higher interest rates on long-term debt and commercial paper, and higher outstanding long-term debt balances.
Income Tax Benefit. The increase in the tax benefit was primarily due to benefits associated with ongoing tax efficiency efforts and an increase in pretax losses. The ETRs for the year ended December 31, 2023, and 2022, were 45.2% and 27.9%, respectively. The increase in the ETR was primarily due to benefits associated with ongoing tax efficiency efforts. In 2023, the Company evaluated the deductibility of certain items spanning periods currently open under federal statute, including items related to interest on company-owned life insurance. As a result of this analysis, the Company recorded a favorable adjustment of approximately $120 million.
LOSS FROM DISCONTINUED OPERATIONS, NET OF TAX
| Years Ended December 31, | ||||||||||||||||||||
| (in millions) | 2023 | 2022 | Variance | |||||||||||||||||
| Loss From Discontinued Operations, net of tax | $ | (1,455) | $ | (1,323) | $ | (132) | ||||||||||||||
Year Ended December 31, 2023, as compared to 2022
The variance was primarily driven by lower results from Duke Energy's Commercial Renewables Disposal Groups in the current year.
49
| MD&A | DUKE ENERGY CAROLINAS | ||||
SUBSIDIARY REGISTRANTS
Basis of Presentation
The results of operations and variance discussion for the Subsidiary Registrants is presented in a reduced disclosure format in accordance with General Instruction (I)(2)(a) of Form 10-K.
DUKE ENERGY CAROLINAS
Results of Operations
| Years Ended December 31, | |||||||||||||||||
| (in millions) | 2023 | 2022 | Variance | ||||||||||||||
| Operating Revenues | $ | 8,288 | $ | 7,857 | $ | 431 | |||||||||||
| Operating Expenses | |||||||||||||||||
| Fuel used in electric generation and purchased power | 2,524 | 2,015 | 509 | ||||||||||||||
| Operation, maintenance and other | 1,774 | 1,892 | (118) | ||||||||||||||
| Depreciation and amortization | 1,593 | 1,526 | 67 | ||||||||||||||
| Property and other taxes | 320 | 340 | (20) | ||||||||||||||
| Impairment of assets and other charges | 44 | 26 | 18 | ||||||||||||||
Total operating expenses | 6,255 | 5,799 | 456 | ||||||||||||||
| Gains on Sales of Other Assets and Other, net | 26 | 4 | 22 | ||||||||||||||
| Operating Income | 2,059 | 2,062 | (3) | ||||||||||||||
| Other Income and Expenses, net | 238 | 221 | 17 | ||||||||||||||
| Interest Expense | 686 | 557 | 129 | ||||||||||||||
| Income Before Income Taxes | 1,611 | 1,726 | (115) | ||||||||||||||
| Income Tax Expense | 141 | 126 | 15 | ||||||||||||||
| Net Income | $ | 1,470 | $ | 1,600 | $ | (130) | |||||||||||
The following table shows the percent changes in GWh sales and average number of customers for Duke Energy Carolinas. The below percentages for retail customer classes represent billed sales only. Total sales includes billed and unbilled retail sales and wholesale sales to incorporated municipalities, public and private utilities and power marketers. Amounts are not weather-normalized.
| Increase (Decrease) over prior year | 2023 | ||||
| Residential sales | (3.5) | % | |||
| General service sales | 1.0 | % | |||
| Industrial sales | (5.2) | % | |||
| Wholesale power sales | 5.0 | % | |||
| Joint dispatch sales | (10.9) | % | |||
| Total sales | (3.6) | % | |||
| Average number of customers | 1.8 | % | |||
Year Ended December 31, 2023, as compared to 2022
Operating Revenues. The variance was driven primarily by:
•a $528 million increase in fuel revenues due to higher fuel cost recovery;
•a $71 million increase in rider revenues primarily due to the decrease in the return of EDIT to customers compared to the prior year;
•a $28 million increase in wholesale revenues primarily due to higher contractual demand and sales; and
•a $15 million increase in retail pricing due to interim rates from the North Carolina rate case.
Partially offset by:
•a $193 million decrease in retail sales due to unfavorable weather compared to prior year; and
•a $47 million decrease in weather-normal retail sales volumes.
50
| MD&A | DUKE ENERGY CAROLINAS | ||||
Operating Expenses. The variance was driven primarily by:
•a $509 million increase in fuel used in electric generation and purchased power primarily due to changes in the generation mix and the recovery of fuel expenses, partially offset by lower JDA purchased volumes and prices;
•a $67 million increase in depreciation and amortization primarily due to a higher depreciable base, partially offset by a decrease due to lower coal ash amortization from the North Carolina rate case and higher Grid Improvement Plan deferrals in the current year; and
•an $18 million increase in impairment of assets and other charges primarily due to the order in the North Carolina rate case, partially offset by prior year adjustments to optimize the Company's real estate portfolio and the South Carolina Supreme Court decision on coal ash.
Partially offset by:
•a $118 million decrease in operation, maintenance and other primarily due to a decrease in spend on outside services and lower project costs; and
•a $20 million decrease in property and other taxes primarily due to lower franchise taxes.
Gains on Sales of Other Assets and Other, net. The increase was primarily due to the sale of the Mint Street parking deck.
Other Income and Expenses. The variance was driven primarily by non-service pension expense and interest income.
Interest Expense. The variance was driven by higher interest rates and outstanding debt balances.
Income Tax Expense. The increase in tax expense was primarily due to a decrease in the amortization of EDIT, partially offset by a decrease in pretax income.
PROGRESS ENERGY
Results of Operations
| Years Ended December 31, | |||||||||||||||||
| (in millions) | 2023 | 2022 | Variance | ||||||||||||||
| Operating Revenues | $ | 13,544 | $ | 13,125 | $ | 419 | |||||||||||
| Operating Expenses | |||||||||||||||||
| Fuel used in electric generation and purchased power | 5,026 | 5,078 | (52) | ||||||||||||||
| Operation, maintenance and other | 2,636 | 2,458 | 178 | ||||||||||||||
| Depreciation and amortization | 2,151 | 2,142 | 9 | ||||||||||||||
| Property and other taxes | 644 | 607 | 37 | ||||||||||||||
| Impairment of assets and other charges | 28 | 12 | 16 | ||||||||||||||
Total operating expenses | 10,485 | 10,297 | 188 | ||||||||||||||
| Gains on Sales of Other Assets and Other, net | 27 | 11 | 16 | ||||||||||||||
| Operating Income | 3,086 | 2,839 | 247 | ||||||||||||||
| Other Income and Expenses, net | 201 | 181 | 20 | ||||||||||||||
| Interest Expense | 954 | 844 | 110 | ||||||||||||||
| Income Before Income Taxes | 2,333 | 2,176 | 157 | ||||||||||||||
| Income Tax Expense | 377 | 348 | 29 | ||||||||||||||
| Net Income | 1,956 | 1,828 | 128 | ||||||||||||||
Year Ended December 31, 2023, as compared to 2022
Operating Revenues. The variance was driven primarily by:
•a $363 million increase in storm revenues at Duke Energy Florida due to hurricanes Ian and Nicole collections;
•a $254 million increase in fuel cost recovery from retail customers at Duke Energy Florida, partially offset by a decrease at Duke Energy Progress driven by lower JDA sales volumes at lower prices in the current year, partially offset by higher fuel cost recovery;
•a $144 million increase due to higher pricing from the North Carolina and the South Carolina rate cases at Duke Energy Progress, and retail pricing due to base rate adjustments related to annual increases from the 2021 Settlement Agreement at Duke Energy Florida;
•a $66 million increase in rider revenues at Duke Energy Florida primarily due to increased Storm Protection Plan rider and a decrease in the return of EDIT to customers compared to the prior year at Duke Energy Progress; and
•a $23 million increase in franchise tax revenue primarily due to increased revenues over prior year at Duke Energy Florida.
51
| MD&A | PROGRESS ENERGY | ||||
Partially offset by:
•a $274 million decrease in wholesale revenues net of fuel due to decreased demand at Duke Energy Florida, partially offset by higher capacity rates net of lower volumes at Duke Energy Progress;
•a $99 million decrease in weather-normal retail sales volumes at Duke Energy Progress and Duke Energy Florida; and
•a $74 million decrease in retail sales due to unfavorable weather compared to prior year at Duke Energy Progress, partially offset by favorable weather in the current year at Duke Energy Florida.
Operating Expenses. The variance was driven primarily by:
•a $178 million increase in operation, maintenance and other primarily due to storm amortization costs at Duke Energy Florida, partially offset by lower storm costs, a decrease in spend on outside services and lower project costs at Duke Energy Progress;
•a $37 million increase in property and other taxes primarily due to higher franchise taxes and gross receipts taxes driven by higher revenues and higher property taxes due to property tax valuation adjustments at Duke Energy Florida, partially offset by lower franchise taxes at Duke Energy Progress; and
•a $16 million increase in impairment of assets and other charges primarily due to rate case impacts, partially offset by prior year adjustments from the South Carolina Supreme Court decision on coal ash and optimization of the Company's real estate portfolio at Duke Energy Progress.
Partially offset by:
•a $52 million decrease in fuel used in electric generation and purchased power primarily due to lower volumes and prices at Duke Energy Progress, partially offset by the recovery of fuel expenses at Duke Energy Progress and Duke Energy Florida.
Gains on Sales of Other Assets and Other, net. The increase was primarily due to sales of cell tower leases.
Other Income and Expenses, net. The variance was driven primarily by non-service pension expense and interest income.
Interest Expense. The variance was driven primarily by higher outstanding debt balances and interest rates at Duke Energy Progress and Duke Energy Florida.
Income Tax Expense. The increase in tax expense was primarily due to an increase in pretax income and a decrease in the amortization of EDIT, partially offset by an increase in PTCs.
DUKE ENERGY PROGRESS
Results of Operations
| Years Ended December 31, | |||||||||||||||||
| (in millions) | 2023 | 2022 | Variance | ||||||||||||||
| Operating Revenues | $ | 6,488 | $ | 6,753 | $ | (265) | |||||||||||
| Operating Expenses | |||||||||||||||||
| Fuel used in electric generation and purchased power | 2,203 | 2,492 | (289) | ||||||||||||||
| Operation, maintenance and other | 1,379 | 1,475 | (96) | ||||||||||||||
| Depreciation and amortization | 1,266 | 1,187 | 79 | ||||||||||||||
| Property and other taxes | 164 | 190 | (26) | ||||||||||||||
| Impairment of assets and other charges | 29 | 7 | 22 | ||||||||||||||
Total operating expenses | 5,041 | 5,351 | (310) | ||||||||||||||
| Gains on Sales of Other Assets and Other, net | 3 | 4 | (1) | ||||||||||||||
| Operating Income | 1,450 | 1,406 | 44 | ||||||||||||||
| Other Income and Expenses, net | 124 | 114 | 10 | ||||||||||||||
| Interest Expense | 427 | 354 | 73 | ||||||||||||||
| Income Before Income Taxes | 1,147 | 1,166 | (19) | ||||||||||||||
| Income Tax Expense | 149 | 158 | (9) | ||||||||||||||
| Net Income | $ | 998 | $ | 1,008 | $ | (10) | |||||||||||
52
| MD&A | DUKE ENERGY PROGRESS | ||||
The following table shows the percent changes in GWh sales and average number of customers for Duke Energy Progress. The below percentages for retail customer classes represent billed sales only. Total sales includes billed and unbilled retail sales and wholesale sales to incorporated municipalities, public and private utilities and power marketers. Amounts are not weather-normalized.
| Increase (Decrease) over prior year | 2023 | ||||
| Residential sales | (4.1) | % | |||
| General service sales | (4.0) | % | |||
| Industrial sales | (12.2) | % | |||
| Wholesale power sales | (3.7) | % | |||
| Joint dispatch sales | (1.1) | % | |||
| Total sales | (5.3) | % | |||
| Average number of customers | 1.7 | % | |||
Year Ended December 31, 2023, as compared to 2022
Operating Revenues. The variance was driven primarily by:
•a $259 million decrease in fuel revenues due to lower JDA sales volumes at lower prices in the current year, partially offset by higher fuel cost recovery;
•a $103 million decrease in retail sales due to unfavorable weather compared to prior year; and
•a $70 million decrease in weather-normal retail sales volumes.
Partially offset by:
•a $127 million increase due to higher pricing from the North Carolina and the South Carolina rate cases;
•a $21 million increase in rider revenues primarily due to the decrease in the return of EDIT to customers compared to the prior year; and
•a $17 million increase in wholesale revenues, net of fuel, due to higher capacity rates, partially offset by lower volumes.
Operating Expenses. The variance was driven primarily by:
•a $289 million decrease in fuel used in electric generation and purchased power primarily due to changes in the generation mix, partially offset by the recovery of fuel expenses;
•a $96 million decrease in operation, maintenance and other primarily due to lower storm costs, lower outside services and lower project costs; and
•a $26 million decrease in property and other taxes due to lower franchise taxes.
Partially offset by:
•a $79 million increase in depreciation and amortization due to higher depreciable base and rate case impacts; and
•a $22 million increase in impairment of assets and other charges primarily due to rate case impacts offset by prior year adjustments from the South Carolina Supreme Court decision on coal ash and the optimization of the Company's real estate portfolio.
Other Income and Expenses, net. The variance was driven primarily by interest income.
Interest Expense. The variance was driven primarily by higher interest rates and outstanding debt balances.
Income Tax Expense. The decrease in tax expense was primarily due to a decrease in pretax income and an increase in the amortization of EDIT.
53
| MD&A | DUKE ENERGY FLORIDA | ||||
DUKE ENERGY FLORIDA
Results of Operations
| Years Ended December 31, | |||||||||||||||||
| (in millions) | 2023 | 2022 | Variance | ||||||||||||||
| Operating Revenues | $ | 7,036 | $ | 6,353 | $ | 683 | |||||||||||
| Operating Expenses | |||||||||||||||||
| Fuel used in electric generation and purchased power | 2,823 | 2,586 | 237 | ||||||||||||||
| Operation, maintenance and other | 1,239 | 967 | 272 | ||||||||||||||
| Depreciation and amortization | 885 | 955 | (70) | ||||||||||||||
| Property and other taxes | 480 | 421 | 59 | ||||||||||||||
| Impairment of assets and other charges | (1) | 4 | (5) | ||||||||||||||
Total operating expenses | 5,426 | 4,933 | 493 | ||||||||||||||
| Gains on Sales of Other Assets and Other, net | 2 | 2 | — | ||||||||||||||
| Operating Income | 1,612 | 1,422 | 190 | ||||||||||||||
| Other Income and Expenses, net | 78 | 74 | 4 | ||||||||||||||
| Interest Expense | 413 | 362 | 51 | ||||||||||||||
| Income Before Income Taxes | 1,277 | 1,134 | 143 | ||||||||||||||
| Income Tax Expense | 261 | 225 | 36 | ||||||||||||||
| Net Income | $ | 1,016 | $ | 909 | $ | 107 | |||||||||||
The following table shows the percent changes in GWh sales and average number of customers for Duke Energy Florida. The below percentages for retail customer classes represent billed sales only. Wholesale power sales include both billed and unbilled sales. Total sales includes billed and unbilled retail sales and wholesale sales to incorporated municipalities, public and private utilities and power marketers. Amounts are not weather-normalized.
| Increase (Decrease) over prior year | 2023 | ||||
| Residential sales | 1.1 | % | |||
| General service sales | 1.2 | % | |||
| Industrial sales | (3.2) | % | |||
| Wholesale power sales | (49.3) | % | |||
| Total sales | (6.1) | % | |||
| Average number of customers | 1.8 | % | |||
Year Ended December 31, 2023, as compared to 2022
Operating Revenues. The variance was driven primarily by:
•a $513 million increase in fuel and capacity revenues primarily due to an increase in fuel and capacity rates billed to retail customers;
•a $363 million increase in storm revenues due to hurricanes Ian and Nicole collections;
•a $45 million increase in rider revenues primarily due to higher rates for the Storm Protection Plan rider;
•a $29 million increase in retail sales due to favorable weather in the current year;
•a $23 million increase in franchise taxes revenue primarily due to increased revenues over prior year; and
•a $17 million increase in retail pricing due to base rate adjustments related to annual increases from the 2021 Settlement Agreement.
Partially offset by:
•a $291 million decrease in wholesale power revenues, net of fuel, primarily due to decreased demand; and
•a $29 million decrease in weather-normal retail sales volumes.
Operating Expenses. The variance was driven primarily by:
•a $272 million increase in operation, maintenance and other primarily due to storm amortization;
•a $237 million increase in fuel used in electric generation and purchased power primarily due to the recovery of fuel expenses, partially offset by a decrease in purchased power costs due to lower natural gas prices; and
•a $59 million increase in property and other taxes primarily due to higher franchise taxes and gross receipts taxes driven by higher revenues and higher property taxes due to property tax valuation adjustments.
54
| MD&A | DUKE ENERGY FLORIDA | ||||
Partially offset by:
•a $70 million decrease in depreciation and amortization primarily due to the amortization of the DOE settlement regulatory liability, partially offset by higher depreciable base.
Interest Expense. The variance was primarily due to higher interest rates and outstanding debt balances.
Income Tax Expense. The increase in tax expense was primarily due to an increase in pretax income and a decrease in the amortization of EDIT, partially offset by an increase in PTCs.
DUKE ENERGY OHIO
Results of Operations
| Years Ended December 31, | |||||||||||
| (in millions) | 2023 | 2022 | Variance | ||||||||
| Operating Revenues | |||||||||||
| Regulated electric | $ | 1,868 | $ | 1,798 | $ | 70 | |||||
| Regulated natural gas | 639 | 716 | (77) | ||||||||
| Total operating revenues | 2,507 | 2,514 | (7) | ||||||||
| Operating Expenses | |||||||||||
| Fuel used in electric generation and purchased power | 608 | 657 | (49) | ||||||||
| Cost of natural gas | 163 | 261 | (98) | ||||||||
| Operation, maintenance and other | 478 | 523 | (45) | ||||||||
| Depreciation and amortization | 367 | 324 | 43 | ||||||||
| Property and other taxes | 364 | 369 | (5) | ||||||||
| Impairment of assets and other charges | 3 | (10) | 13 | ||||||||
Total operating expenses | 1,983 | 2,124 | (141) | ||||||||
| Gains on Sales of Other Assets and Other, net | 1 | 1 | — | ||||||||
| Operating Income | 525 | 391 | 134 | ||||||||
| Other Income and Expenses, net | 41 | 19 | 22 | ||||||||
| Interest Expense | 169 | 129 | 40 | ||||||||
| Income Before Income Taxes | 397 | 281 | 116 | ||||||||
Income Tax Expense (Benefit) | 63 | (21) | 84 | ||||||||
| Net Income | $ | 334 | $ | 302 | $ | 32 | |||||
The following table shows the percent changes in GWh sales of electricity, MCF of natural gas delivered and average number of electric and natural gas customers for Duke Energy Ohio. The below percentages for retail customer classes represent billed sales only. Total sales includes billed and unbilled retail sales and wholesale sales to incorporated municipalities, public and private utilities and power marketers. Amounts are not weather-normalized.
| Electric | Natural Gas | ||||||||||
| Increase (Decrease) over prior year | 2023 | 2023 | |||||||||
| Residential sales | (4.8) | % | (13.5) | % | |||||||
| General service sales | 1.5 | % | (19.7) | % | |||||||
| Industrial sales | 4.9 | % | 3.8 | % | |||||||
| Wholesale electric power sales | (19.3) | % | n/a | ||||||||
| Other natural gas sales | n/a | (0.7) | % | ||||||||
| Total sales | (4.0) | % | (10.8) | % | |||||||
| Average number of customers | 0.9 | % | 0.6 | % | |||||||
Year Ended December 31, 2023, as compared to 2022
Operating Revenues. The variance was driven primarily by:
•a $77 million decrease in fuel-related revenues primarily due to lower retail sales volumes and lower fuel cost recovery in the current year;
•a $59 million decrease in revenues related to lower OVEC rider collections and OVEC sales into PJM;
•a $35 million decrease due to unfavorable weather compared to prior year; and
•an $18 million decrease in retail revenue riders primarily due to the decrease in Distribution Capital Investment Rider, partially offset by increases in the Ohio CEP rider and Energy Efficiency Rider.
55
| MD&A | DUKE ENERGY OHIO | ||||
Partially offset by:
•a $145 million increase in price due to the Duke Energy Ohio and Duke Energy Kentucky electric rate cases and Ohio tax reform deferrals in prior year;
•a $15 million increase due to the MGP Settlement in the prior year; and
•an $11 million increase in weather-normal retail sales volumes.
Operating Expenses. The variance was driven primarily by:
•a $147 million decrease in fuel expense primarily driven by lower retail prices for natural gas and purchased power and a decrease in purchased power volumes; and
•a $45 million decrease in operation, maintenance and other expense primarily due to the MGP Settlement in the prior year.
Partially offset by:
•a $43 million increase in depreciation and amortization primarily driven by an increase in distribution plant in service and depreciation rates resulting from the Duke Energy Ohio and Duke Energy Kentucky electric retail rate cases implemented in 2023; and
•a $13 million increase in impairment of assets and other charges primarily due to the reversal in the prior year of the impairment related to the propane caverns in Ohio.
Other Income and Expenses. The variance was primarily due to interest income.
Interest Expense. The variance was primarily due to higher outstanding debt balances and interest rates.
Income Tax Expense (Benefit). The increase in tax expense was primarily due to a decrease in the amortization of EDIT related to the MGP Settlement recorded in the prior year and an increase in pretax income.
DUKE ENERGY INDIANA
Results of Operations
| Years Ended December 31, | |||||||||||
| (in millions) | 2023 | 2022 | Variance | ||||||||
| Operating Revenues | $ | 3,399 | $ | 3,922 | $ | (523) | |||||
| Operating Expenses | |||||||||||
| Fuel used in electric generation and purchased power | 1,217 | 1,819 | (602) | ||||||||
| Operation, maintenance and other | 713 | 729 | (16) | ||||||||
| Depreciation and amortization | 666 | 645 | 21 | ||||||||
| Property and other taxes | 59 | 75 | (16) | ||||||||
| Impairment of assets and other charges | — | 388 | (388) | ||||||||
Total operating expenses | 2,655 | 3,656 | (1,001) | ||||||||
| Operating Income | 744 | 266 | 478 | ||||||||
| Other Income and Expenses, net | 76 | 36 | 40 | ||||||||
| Interest Expense | 213 | 189 | 24 | ||||||||
| Income Before Income Taxes | 607 | 113 | 494 | ||||||||
Income Tax Expense (Benefit) | 110 | (24) | 134 | ||||||||
| Net Income | $ | 497 | $ | 137 | $ | 360 | |||||
The following table shows the percent changes in GWh sales and average number of customers for Duke Energy Indiana. The below percentages for retail customer classes represent billed sales only. Total sales includes billed and unbilled retail sales and wholesale sales to incorporated municipalities, public and private utilities and power marketers. Amounts are not weather-normalized.
| Increase (Decrease) over prior year | 2023 | ||||
| Residential sales | (6.3) | % | |||
| General service sales | (3.6) | % | |||
| Industrial sales | 9.0 | % | |||
| Wholesale power sales | (1.9) | % | |||
| Total sales | (5.5) | % | |||
| Average number of customers | 1.2 | % | |||
56
| MD&A | DUKE ENERGY INDIANA | ||||
Year Ended December 31, 2023, as compared to 2022
Operating Revenues. The variance was driven primarily by:
•a $401 million decrease in retail fuel revenues primarily due to lower fuel cost recovery driven by lower retail sales volumes and fuel prices;
•a $75 million decrease in wholesale revenues, including fuel revenues, driven by lower fuel prices;
•a $51 million decrease in weather-normal retail sales volumes primarily due to lower customer demand; and
•a $44 million decrease in retail sales due to unfavorable weather compared to the prior year.
Partially offset by:
•a $67 million increase primarily due to the provision for rate refund related to the Indiana Supreme Court ruling on recovery of certain coal ash costs in the prior year.
Operating Expenses. The variance was driven primarily by:
•a $602 million decrease in fuel used in electric generation and purchased power primarily due to lower purchased power expense, natural gas and coal costs, partially offset by higher deferred fuel amortization;
•a $388 million decrease in impairment of assets and other charges primarily due to the Indiana court rulings on recovery of certain coal ash costs in the prior year;
•a $16 million decrease in operation, maintenance and other primarily due to lower employee-related expenses and storm contingency costs; and
•a $16 million decrease in property and other taxes primarily due to property tax true-ups and lower franchise taxes.
Partially offset by:
•a $21 million increase in depreciation and amortization primarily due to higher depreciable base.
Other Income and Expenses, net. The variance was primarily due to coal ash insurance proceeds, non-service pension expense and interest income.
Interest Expense. The variance was primarily due to higher outstanding debt balances and interest rates.
Income Tax Expense (Benefit). The increase in tax expense was primarily due to an increase in pretax income and a decrease in the amortization of EDIT related to the coal ash impairment recorded in the prior year.
PIEDMONT
Results of Operations
| Years Ended December 31, | |||||||||||||||||
| (in millions) | 2023 | 2022 | Variance | ||||||||||||||
| Operating Revenues | $ | 1,628 | $ | 2,124 | $ | (496) | |||||||||||
| Operating Expenses | |||||||||||||||||
| Cost of natural gas | 430 | 1,015 | (585) | ||||||||||||||
| Operation, maintenance and other | 344 | 368 | (24) | ||||||||||||||
| Depreciation and amortization | 237 | 222 | 15 | ||||||||||||||
| Property and other taxes | 59 | 57 | 2 | ||||||||||||||
| Impairment of assets and other charges | (4) | 18 | (22) | ||||||||||||||
| Total operating expenses | 1,066 | 1,680 | (614) | ||||||||||||||
| Gains on Sales of Other Assets and Other, net | — | 4 | (4) | ||||||||||||||
| Operating Income | 562 | 448 | 114 | ||||||||||||||
| Other Income and Expenses, net | 66 | 54 | 12 | ||||||||||||||
| Interest Expense | 165 | 140 | 25 | ||||||||||||||
| Income Before Income Taxes | 463 | 362 | 101 | ||||||||||||||
| Income Tax Expense | 84 | 39 | 45 | ||||||||||||||
| Net Income | $ | 379 | $ | 323 | $ | 56 | |||||||||||
57
| MD&A | PIEDMONT | ||||
The following table shows the percent changes in Dth delivered and average number of customers. The percentages for all throughput deliveries represent billed and unbilled sales. Amounts are not weather-normalized.
| Increase (Decrease) over prior year | 2023 | ||||
| Residential deliveries | (14.3) | % | |||
| Commercial deliveries | (9.4) | % | |||
| Industrial deliveries | (2.4) | % | |||
| Power generation deliveries | (10.0) | % | |||
| For resale | (14.9) | % | |||
| Total throughput deliveries | (9.3) | % | |||
| Secondary market volumes | (26.6) | % | |||
| Average number of customers | 1.5 | % | |||
The margin decoupling mechanism adjusts for variations in residential and commercial use per customer, including those due to weather and conservation. The weather normalization adjustment mechanisms mostly offset the impact of weather on bills rendered, but do not ensure full recovery of approved margin during periods when winter weather is significantly warmer or colder than normal.
Year Ended December 31, 2023, as compared to 2022
Operating Revenues. The variance was driven primarily by:
•a $585 million decrease due to lower natural gas costs passed through to customers, lower volumes, and decreased off-system sales natural gas costs.
Partially offset by:
•a $26 million increase due to customer growth;
•a $19 million increase due to North Carolina IMR;
•an $11 million increase due to Tennessee ARM revenue recognition; and
•a $9 million increase due to secondary marketing sales.
Operating Expenses. The variance was driven primarily by:
•a $585 million decrease in the cost of natural gas due to lower natural gas costs passed through to customers, lower volumes, and decreased off-system sales natural gas costs;
•a $24 million decrease in operations, maintenance and other primarily due to lower labor costs, gas pipeline and integrity work and a decrease in bad debt reserves; and
•a $22 million decrease in impairment of assets and other charges due to the optimization of the Company's real estate portfolio in the prior year.
Partially offset by:
•a $15 million increase in depreciation and amortization due to additional plant in service.
Other Income and Expenses, net. The increase was primarily due to higher AFUDC equity income.
Interest Expense. The increase was primarily due to higher outstanding debt balances and interest rates.
Income Tax Expense. The increase in tax expense was primarily due to an increase in pretax income and a decrease in the amortization of EDIT.
CRITICAL ACCOUNTING POLICIES AND ESTIMATES
Preparation of financial statements requires the application of accounting policies, judgments, assumptions and estimates that can significantly affect the reported results of operations, cash flows or the amounts of assets and liabilities recognized in the financial statements. Judgments made include the likelihood of success of particular projects, possible legal and regulatory challenges, earnings assumptions on pension and other benefit fund investments and anticipated recovery of costs, especially through regulated operations.
Management discusses these policies, estimates and assumptions with senior members of management on a regular basis and provides periodic updates on management decisions to the Audit Committee. Management believes the areas described below require significant judgment in the application of accounting policy or in making estimates and assumptions that are inherently uncertain and that may change in subsequent periods.
For further information, see Note 1 to the Consolidated Financial Statements, "Summary of Significant Accounting Policies."
58
| MD&A | CRITICAL ACCOUNTING POLICIES AND ESTIMATES | ||||
Regulated Operations Accounting
Substantially all of Duke Energy’s regulated operations meet the criteria for application of regulated operations accounting treatment. As a result, Duke Energy is required to record assets and liabilities that would not be recorded for nonregulated entities. Regulatory assets generally represent incurred costs that have been deferred because such costs are probable of future recovery in customer rates. Regulatory liabilities are recorded when it is probable that a regulator will require Duke Energy to make refunds to customers or reduce rates to customers for previous collections or deferred revenue for costs that have yet to be incurred.
Management continually assesses whether recorded regulatory assets are probable of future recovery by considering factors such as:
•applicable regulatory environment changes;
•historical regulatory treatment for similar costs in Duke Energy’s jurisdictions;
•litigation of rate orders;
•recent rate orders to other regulated entities;
•levels of actual return on equity compared to approved rates of return on equity; and
•the status of any pending or potential deregulation legislation.
If future recovery of costs ceases to be probable, asset write-offs would be recognized in operating income. Additionally, regulatory agencies can provide flexibility in the manner and timing of the depreciation of property, plant and equipment, recognition of asset retirement costs and amortization of regulatory assets, or may disallow recovery of all or a portion of certain assets.
As required by regulated operations accounting rules, significant judgment can be required to determine if an otherwise recognizable incurred cost qualifies to be deferred for future recovery as a regulatory asset. Significant judgment can also be required to determine if revenues previously recognized are for entity-specific costs that are no longer expected to be incurred or have not yet been incurred and are therefore a regulatory liability.
For further information, see Note 4 to the Consolidated Financial Statements, "Regulatory Matters."
Goodwill Impairment Assessments
Duke Energy performed its annual goodwill impairment tests for all reporting units as of August 31, 2023. Additionally, Duke Energy monitors all relevant events and circumstances during the year to determine if an interim impairment test is required. Such events and circumstances include an adverse regulatory outcome, declining financial performance and deterioration of industry or market conditions. As of August 31, 2023, all of the reporting units' estimated fair value of equity exceeded the carrying value of equity. The fair values of the reporting units were calculated using a weighted combination of the income approach, which estimates fair value based on discounted cash flows, and the market approach, which estimates fair value based on market comparables within the utility and energy industries.
Estimated future cash flows under the income approach are based on Duke Energy’s internal business plan. Significant assumptions used are growth rates, future rates of return expected to result from ongoing rate regulation and discount rates. Management determines the appropriate discount rate for each of its reporting units based on the Weighted Average Cost of Capital (WACC) for each individual reporting unit. The WACC takes into account both the after-tax cost of debt and cost of equity. A major component of the cost of equity is the current risk-free rate on 20-year U.S. Treasury bonds. In the 2023 impairment tests, Duke Energy considered implied WACCs for certain peer companies in determining the appropriate WACC rates to use in its analysis. As each reporting unit has a different risk profile based on the nature of its operations, including factors such as regulation, the WACC for each reporting unit may differ. Accordingly, the WACCs were adjusted, as appropriate, to account for company-specific risk premiums. The discount rates used for calculating the fair values as of August 31, 2023, for each of Duke Energy’s reporting units ranged from 6.3% to 6.6%. The underlying assumptions and estimates are made as of a point in time. Subsequent changes, particularly changes in the discount rates, authorized regulated rates of return or growth rates inherent in management’s estimates of future cash flows, could result in future impairment charges.
One of the most significant assumptions utilized in determining the fair value of reporting units under the market approach is implied market multiples for certain peer companies. Management selects comparable peers based on each peer’s primary business mix, operations, and market capitalization compared to the applicable reporting unit and calculates implied market multiples based on available projected earnings guidance and peer company market values as of August 31. The implied market multiples used for calculating the fair values as of August 31, 2023, for each of Duke Energy's reporting units ranged from 9.3 to 11.2.
Duke Energy primarily operates in environments that are rate-regulated. In such environments, revenue requirements are adjusted periodically by regulators based on factors including levels of costs, sales volumes and costs of capital. Accordingly, Duke Energy’s regulated utilities operate to some degree with a buffer from the direct effects, positive or negative, of significant swings in market or economic conditions. However, significant changes in discount rates or implied market multiples over a prolonged period may have a material impact on the fair value of equity.
Duke Energy has $19.3 billion in Goodwill at both December 31, 2023, and 2022. For further information, see Note 12 to the Consolidated Financial Statements, "Goodwill and Intangible Assets."
Asset Retirement Obligations
AROs are recognized for legal obligations associated with the retirement of property, plant and equipment at the present value of the projected liability in the period in which it is incurred, if a reasonable estimate of fair value can be made. Duke Energy has $9.2 billion and $12.7 billion of AROs as of December 31, 2023, and 2022, respectively. See Note 10, "Asset Retirement Obligations," for further details including a rollforward of related liabilities.
59
| MD&A | CRITICAL ACCOUNTING POLICIES AND ESTIMATES | ||||
The present value of the initial obligation and subsequent updates are based on discounted cash flows, which include estimates regarding the amount and timing of future cash flows, regulatory, legal, and legislative decisions, selection of discount rates and cost escalation rates, among other factors. These estimates are subject to change.
Obligations for nuclear decommissioning are based on site-specific cost studies. Duke Energy Carolinas and Duke Energy Progress assume prompt dismantlement of the nuclear facilities after operations are ceased. During 2020, Duke Energy Florida, closed an agreement for the accelerated decommissioning of the Crystal River Unit 3 nuclear power station after receiving approval from the NRC and FPSC. The retirement obligations for the decommissioning of Crystal River Unit 3 nuclear power station are measured based on accelerated decommissioning from 2020 continuing through 2027. Duke Energy Carolinas, Duke Energy Progress and Duke Energy Florida also assume that spent fuel will be stored on-site until such time that it can be transferred to a yet-to-be-built DOE facility.
Obligations for closure of ash basins are based upon discounted cash flows of estimated costs for site-specific plans.
For further information, see Notes 4, 5 and 10 to the Consolidated Financial Statements, "Regulatory Matters," "Commitments and Contingencies" and "Asset Retirement Obligations."
Discontinued Operations
Duke Energy calculated an estimated impairment on the disposition of its Commercial Renewables Disposal Groups as of December 31, 2022. The impairment was recorded to write-down the carrying amount to fair value, less cost to sell. The fair value was primarily determined from the income approach using discounted cash flows, but also considered market information obtained through the bidding process. Estimated future cash flows under the income approach were based on Duke Energy's forecast, which was informed by existing power purchase agreements with offtakers and forward merchant curves. Significant assumptions used in the income approach include forward merchant curves and discount rates. The discount rates take into account both the after-tax cost of debt and cost of equity. Duke Energy continued to monitor the sales of the Commercial Renewables Disposal Groups throughout 2023 and recorded adjustments to the impairments as warranted by progression in the disposition process and changes in market information.
The actual loss for each of the Commercial Renewables Disposal Groups is being recorded based on final sales agreements and could differ from the estimated losses recorded as of December 31, 2023.
For further information, See Note 2 to the Consolidated Financial Statements, "Dispositions."
LIQUIDITY AND CAPITAL RESOURCES
Sources and Uses of Cash
Duke Energy relies primarily upon cash flows from operations, debt and equity issuances and its existing cash and cash equivalents to fund its liquidity and capital requirements. Duke Energy’s capital requirements arise primarily from capital and investment expenditures, repaying long-term debt and paying dividends to shareholders. Additionally, due to its existing tax attributes and projected tax credits to be generated relating to the IRA, Duke Energy does not expect to be a significant federal cash taxpayer until around 2030. See Note 24 to the Consolidated Financial Statements, "Income Taxes," for more information.
Capital Expenditures
Duke Energy continues to focus on reducing risk and positioning its business for future success and will invest principally in its strongest business sectors. Duke Energy’s projected capital and investment expenditures, including AFUDC debt and capitalized interest, for the next three fiscal years are included in the table below.
| (in millions) | 2024 | 2025 | 2026 | ||||||||
Electric Generation(a) | $ | 3,200 | $ | 4,100 | $ | 5,225 | |||||
| Electric Transmission | 2,325 | 2,550 | 2,625 | ||||||||
| Electric Distribution | 4,625 | 5,150 | 4,825 | ||||||||
| Environmental and Other | 725 | 875 | 700 | ||||||||
| Total EU&I | 10,875 | 12,675 | 13,375 | ||||||||
GU&I | 1,150 | 1,150 | 1,125 | ||||||||
| Other | 325 | 375 | 275 | ||||||||
| Total projected capital and investment expenditures | $ | 12,350 | $ | 14,200 | $ | 14,775 | |||||
(a) Includes nuclear fuel of approximately $2.1 billion in 2024-2026.
Debt
Long-term debt maturities and the interest payable on long-term debt each represent a significant cash requirement for the Duke Energy Registrants. See Note 7 to the Consolidated Financial Statements, “Debt and Credit Facilities,” for information regarding the Duke Energy Registrants' long-term debt at December 31, 2023, the weighted average interest rate applicable to each long-term debt category and a schedule of long-term debt maturities over the next five years. See Note 2 to the Consolidated Financial Statements, "Dispositions," for the timing and use of proceeds from the sale of certain Commercial Renewables assets to affiliates of Brookfield and ArcLight.
60
| MD&A | LIQUIDITY AND CAPITAL RESOURCES | ||||
Fuel and Purchased Power
Fuel and purchased power includes firm capacity payments that provide Duke Energy with uninterrupted firm access to electricity transmission capacity and natural gas transportation contracts, as well as undesignated contracts and contracts that qualify as NPNS. Duke Energy’s contractual cash obligations for fuel and purchased power as of December 31, 2023, are as follows:
| Payments Due by Period | |||||||||||||||||
| (in millions) | Total | Less than 1 year (2024) | 2-3 years (2025 & 2026) | 4-5 years (2027 & 2028) | More than 5 years (2029 & beyond) | ||||||||||||
| Fuel and purchased power | $ | 19,726 | $ | 4,831 | $ | 6,116 | $ | 2,991 | $ | 5,788 | |||||||
Other Purchase Obligations
Other purchase obligations includes contracts for software, telephone, data and consulting or advisory services, contractual obligations for Engineering, Procurement, and Construction agreement costs for new generation plants, solar facilities, plant refurbishments, maintenance and day-to-day contract work and commitments to buy certain products. Amount excludes certain open purchase orders for services that are provided on demand for which the timing of the purchase cannot be determined. Total cash commitments for related other purchase obligation expenditures are $12,286 million, with $11,744 million expected to be paid in the next 12 months.
See Note 6 to the Consolidated Financial Statements, “Leases” for a schedule of both finance lease and operating lease payments over the next five years. See Note 10 to the Consolidated Financial Statements, “Asset Retirement Obligations” for information on nuclear decommissioning trust funding obligations and the closure of ash impoundments.
Duke Energy performs ongoing assessments of its respective guarantee obligations to determine whether any liabilities have been incurred as a result of potential increased nonperformance risk by third parties for which Duke Energy has issued guarantees. See Note 8 to the Consolidated Financial Statements, “Guarantees and Indemnifications,” for further details of the guarantee arrangements. Issuance of these guarantee arrangements is not required for the majority of Duke Energy’s operations. Thus, if Duke Energy discontinued issuing these guarantees, there would not be a material impact to the consolidated results of operations, cash flows or financial position. Other than the guarantee arrangements discussed in Note 8 and off-balance sheet debt related to non-consolidated VIEs, Duke Energy does not have any material off-balance sheet financing entities or structures. For additional information, see Note 18 to the Consolidated Financial Statements, "Variable Interest Entities."
Cash and Liquidity
The Subsidiary Registrants generally maintain minimal cash balances and use short-term borrowings to meet their working capital needs and other cash requirements. The Subsidiary Registrants, excluding Progress Energy, support their short-term borrowing needs through participation with Duke Energy and certain of its other subsidiaries in a money pool arrangement. The companies with short-term funds may provide short-term loans to affiliates participating under this arrangement. See Note 7 to the Consolidated Financial Statements, “Debt and Credit Facilities,” for additional information on the money pool arrangement.
Duke Energy and the Subsidiary Registrants, excluding Progress Energy, may also use short-term debt, including commercial paper and the money pool, as a bridge to long-term debt financings. The levels of borrowing may vary significantly over the course of the year due to the timing of long-term debt financings and the impact of fluctuations in cash flows from operations. From time to time, Duke Energy’s current liabilities exceed current assets resulting from the use of short-term debt as a funding source to meet scheduled maturities of long-term debt, as well as cash needs, which can fluctuate due to the seasonality of its businesses.
As of December 31, 2023, Duke Energy had approximately $253 million of cash on hand, $4.9 billion available under its $9 billion Master Credit Facility. Duke Energy expects to have sufficient liquidity in the form of cash on hand, cash from operations and available credit capacity to support its funding needs. Refer to Notes 7 and 20 to the Consolidated Financial Statements, "Debt and Credit Facilities" and "Stockholders' Equity," respectively, for information regarding Duke Energy's debt and equity issuances, debt maturities and available credit facilities including the Master Credit Facility.
Credit Facilities and Registration Statements
See Note 7 to the Consolidated Financial Statements, "Debt and Credit Facilities," for further information regarding credit facilities and shelf registration statements available to Duke Energy and the Duke Energy Registrants.
Dividend Payments
In 2023, Duke Energy paid quarterly cash dividends for the 97th consecutive year and expects to continue its policy of paying regular cash dividends in the future. There is no assurance as to the amount of future dividends because they depend on future earnings, capital requirements, financial condition and are subject to the discretion of the Board of Directors.
Duke Energy targets a dividend payout ratio of between 60% and 70%, based upon adjusted EPS. Duke Energy increased the dividend by approximately 2% annually in both 2023 and 2022, and the Company remains committed to continued growth of the dividend.
61
| MD&A | LIQUIDITY AND CAPITAL RESOURCES | ||||
Dividend and Other Funding Restrictions of Duke Energy Subsidiaries
As discussed in Note 4 to the Consolidated Financial Statements, “Regulatory Matters,” Duke Energy’s public utility operating companies have restrictions on the amount of funds that can be transferred to Duke Energy through dividends, advances or loans as a result of conditions imposed by various regulators in conjunction with merger transactions. Duke Energy Progress and Duke Energy Florida also have restrictions imposed by their first mortgage bond indentures and Articles of Incorporation, which in certain circumstances, limit their ability to make cash dividends or distributions on common stock. Additionally, certain other Duke Energy subsidiaries have other restrictions, such as minimum working capital and tangible net worth requirements pursuant to debt and other agreements that limit the amount of funds that can be transferred to Duke Energy. At December 31, 2023, the amount of restricted net assets of subsidiaries of Duke Energy that may not be distributed to Duke Energy in the form of a loan or dividend does not exceed a material amount of Duke Energy’s net assets. Duke Energy does not have any legal or other restrictions on paying common stock dividends to shareholders out of its consolidated equity accounts. Although these restrictions cap the amount of funding the various operating subsidiaries can provide to Duke Energy, management does not believe these restrictions will have a significant impact on Duke Energy’s ability to access cash to meet its payment of dividends on common stock and other future funding obligations.
Cash Flows From Operating Activities
Cash flows from operations of EU&I and GU&I are primarily driven by sales of electricity and natural gas, respectively, and costs of operations. These cash flows from operations are relatively stable and comprise a substantial portion of Duke Energy’s operating cash flows. Weather conditions, working capital and commodity price fluctuations and unanticipated expenses including unplanned plant outages, storms, legal costs and related settlements can affect the timing and level of cash flows from operations.
As part of Duke Energy’s continued effort to improve its cash flows from operations and liquidity, Duke Energy works with vendors to improve terms and conditions, including the extension of payment terms. To support this effort, Duke Energy has a voluntary supply chain finance program (the “program”) under which suppliers, at their sole discretion, may sell their receivables from Duke Energy to the participating financial institution. The financial institution administers the program. Duke Energy does not issue any guarantees with respect to the program and does not participate in negotiations between suppliers and the financial institution. Duke Energy does not have an economic interest in the supplier’s decision to participate in the program and receives no interest, fees or other benefit from the financial institution based on supplier participation in the program. Suppliers’ decisions on which invoices are sold do not impact Duke Energy’s payment terms, which are based on commercial terms negotiated between Duke Energy and the supplier regardless of program participation. A significant deterioration in the credit quality of Duke Energy, economic downturn or changes in the financial markets could limit the financial institutions willingness to participate in the program. Duke Energy does not believe such risk would have a material impact on our cash flows from operations or liquidity, as substantially all our payments are made outside the program.
Duke Energy believes it has sufficient liquidity resources through the commercial paper markets, and ultimately, the Master Credit Facility, to support these operations. Cash flows from operations are subject to a number of other factors, including, but not limited to, regulatory constraints, economic trends and market volatility (see Item 1A, “Risk Factors,” for additional information).
Debt and Equity Issuances
Depending on availability based on the issuing entity, the credit rating of the issuing entity, and market conditions, the Subsidiary Registrants prefer to issue first mortgage bonds and secured debt, followed by unsecured debt. This preference is the result of generally higher credit ratings for first mortgage bonds and secured debt, which typically result in lower interest costs. Duke Energy Corporation primarily issues unsecured debt.
In 2024, Duke Energy anticipates issuing additional securities of $6.9 billion through debt capital markets. In certain instances, Duke Energy may utilize instruments other than senior notes, including equity-content securities such as subordinated debt or preferred stock. Proceeds will primarily be for the purpose of funding capital expenditures and debt maturities. See to Note 7 to the Consolidated Financial Statements, "Debt and Credit Facilities," for further information regarding significant debt issuances. In addition, in order to fund incremental growth capital, Duke Energy plans to issue $500 million of common stock equity per year through 2028 through the dividend reinvestment and ATM programs.
Duke Energy’s capitalization is balanced between debt and equity as shown in the table below.
Projected 2024 | Actual 2023 | Actual 2022 | |||||||||||||||
| Equity | 38 | % | 39 | % | 41 | % | |||||||||||
| Debt | 62 | % | 61 | % | 59 | % | |||||||||||
Restrictive Debt Covenants
Duke Energy’s debt and credit agreements contain various financial and other covenants. Duke Energy's Master Credit Facility contains a covenant requiring the debt-to-total capitalization ratio to not exceed 65% for each borrower, excluding Piedmont, and 70% for Piedmont. Failure to meet those covenants beyond applicable grace periods could result in accelerated due dates and/or termination of the agreements or sublimits thereto. The Duke Energy Registrants were in compliance with all other covenants related to their debt agreements as of December 31, 2023. In addition, some credit agreements may allow for acceleration of payments or termination of the agreements due to nonpayment, or acceleration of other significant indebtedness of the borrower or some of its subsidiaries. None of the debt or credit agreements contain material adverse change clauses.
62
| MD&A | LIQUIDITY AND CAPITAL RESOURCES | ||||
Credit Ratings
Moody’s Investors Service, Inc. and S&P provide credit ratings for various Duke Energy Registrants. The following table includes Duke Energy and certain subsidiaries’ credit ratings and ratings outlook as of February 2024.
| Moody's | S&P | |||||||||||||
| Duke Energy Corporation | Stable | Stable | ||||||||||||
| Issuer Credit Rating | Baa2 | BBB+ | ||||||||||||
| Senior Unsecured Debt | Baa2 | BBB | ||||||||||||
| Junior Subordinated Debt/Preferred Stock | Baa3 | BBB- | ||||||||||||
| Commercial Paper | P-2 | A-2 | ||||||||||||
| Duke Energy Carolinas | Stable | Stable | ||||||||||||
| Senior Secured Debt | Aa3 | A | ||||||||||||
| Senior Unsecured Debt | A2 | BBB+ | ||||||||||||
| Progress Energy | Stable | Stable | ||||||||||||
| Senior Unsecured Debt | Baa1 | BBB | ||||||||||||
| Duke Energy Progress | Stable | Stable | ||||||||||||
| Senior Secured Debt | Aa3 | A | ||||||||||||
| Duke Energy Florida | Stable | Stable | ||||||||||||
| Senior Secured Debt | A1 | A | ||||||||||||
| Senior Unsecured Debt | A3 | BBB+ | ||||||||||||
| Duke Energy Ohio | Stable | Stable | ||||||||||||
| Senior Secured Debt | A2 | A | ||||||||||||
| Senior Unsecured Debt | Baa1 | BBB+ | ||||||||||||
| Duke Energy Indiana | Stable | Stable | ||||||||||||
| Senior Secured Debt | Aa3 | A | ||||||||||||
| Senior Unsecured Debt | A2 | BBB+ | ||||||||||||
| Duke Energy Kentucky | Negative | Stable | ||||||||||||
| Senior Unsecured Debt | Baa1 | BBB+ | ||||||||||||
| Piedmont Natural Gas | Stable | Stable | ||||||||||||
| Senior Unsecured | A3 | BBB+ | ||||||||||||
Credit ratings are intended to provide credit lenders a framework for comparing the credit quality of securities and are not a recommendation to buy, sell or hold. The Duke Energy Registrants’ credit ratings are dependent on the rating agencies’ assessments of their ability to meet their debt principal and interest obligations when they come due. If, as a result of market conditions or other factors, the Duke Energy Registrants are unable to maintain current balance sheet strength, or if earnings and cash flow outlook materially deteriorates, credit ratings could be negatively impacted.
Cash Flow Information
The following table summarizes Duke Energy’s cash flows for the two most recently completed fiscal years.
| Years Ended December 31, | |||||||||||
| (in millions) | 2023 | 2022 | |||||||||
| Cash flows provided by (used in): | |||||||||||
| Operating activities | $ | 9,878 | $ | 5,927 | |||||||
| Investing activities | (12,475) | (11,973) | |||||||||
| Financing activities | 2,351 | 6,129 | |||||||||
Net (decrease) increase in cash, cash equivalents and restricted cash | (246) | 83 | |||||||||
| Cash, cash equivalents and restricted cash at beginning of period | 603 | 520 | |||||||||
| Cash, cash equivalents and restricted cash at end of period | $ | 357 | $ | 603 | |||||||
63
| MD&A | LIQUIDITY AND CAPITAL RESOURCES | ||||
OPERATING CASH FLOWS
The following table summarizes key components of Duke Energy’s operating cash flows for the two most recently completed fiscal years.
| Years Ended December 31, | ||||||||||||||||||||
| (in millions) | 2023 | 2022 | Variance | |||||||||||||||||
| Net income | $ | 2,874 | $ | 2,455 | $ | 419 | ||||||||||||||
| Non-cash adjustments to net income | 7,486 | 7,362 | 124 | |||||||||||||||||
| Contributions to qualified pension plans | (100) | (58) | (42) | |||||||||||||||||
| Payments for AROs | (632) | (584) | (48) | |||||||||||||||||
| Working capital | (1,248) | (2,081) | 833 | |||||||||||||||||
| Other assets and Other liabilities | 1,498 | (1,167) | 2,665 | |||||||||||||||||
| Net cash provided by operating activities | $ | 9,878 | $ | 5,927 | $ | 3,951 | ||||||||||||||
The variance was driven primarily by:
•a $2,665 million increase in cash inflows from Other assets and Other liabilities and an $833 million decrease in cash outflows from Working capital, both of which are primarily due to the recovery of deferred fuel costs and the timing of accruals and payments in other working capital accounts; and
•a $543 million increase in net income, after adjustment for non-cash items, primarily due to growth from riders and other retail margin, favorable rate case impacts, lower operations and maintenance expense and lower tax expense; partially offset by higher interest expense, unfavorable weather and lower volumes.
INVESTING CASH FLOWS
The following table summarizes key components of Duke Energy’s investing cash flows for the two most recently completed fiscal years.
| Years Ended December 31, | |||||||||||||||||
| (in millions) | 2023 | 2022 | Variance | ||||||||||||||
| Capital, investment and acquisition expenditures, net of return of investment capital | $ | (12,622) | $ | (11,419) | $ | (1,203) | |||||||||||
| Debt and equity securities, net | 63 | 90 | (27) | ||||||||||||||
Proceeds from the sales of Commercial Renewables Disposal Groups and other assets, net of cash divested | 883 | 83 | 800 | ||||||||||||||
| Other investing items | (799) | (727) | (72) | ||||||||||||||
| Net cash used in investing activities | $ | (12,475) | $ | (11,973) | $ | (502) | |||||||||||
The variance relates primarily to an increase in capital expenditures due to higher investments in EU&I, partially offset by the net proceeds received from the sales of Commercial Renewable Disposal Groups and other assets. The primary use of cash related to investing activities is typically capital, investment and acquisition expenditures, net of return of investment capital, detailed by reportable business segment in the following table.
| Years Ended December 31, | |||||||||||||||||
| (in millions) | 2023 | 2022 | Variance | ||||||||||||||
| Electric Utilities and Infrastructure | $ | 10,135 | $ | 8,985 | $ | 1,150 | |||||||||||
| Gas Utilities and Infrastructure | 1,492 | 1,295 | 197 | ||||||||||||||
| Other | 995 | 1,139 | (144) | ||||||||||||||
| Total capital, investment and acquisition expenditures, net of return of investment capital | $ | 12,622 | $ | 11,419 | $ | 1,203 | |||||||||||
FINANCING CASH FLOWS
The following table summarizes key components of Duke Energy’s financing cash flows for the two most recently completed fiscal years.
| Years Ended December 31, | |||||||||||||||||
| (in millions) | 2023 | 2022 | Variance | ||||||||||||||
| Issuances of long-term debt, net | $ | 5,291 | $ | 7,478 | $ | (2,187) | |||||||||||
| Notes payable and commercial paper | 142 | 574 | (432) | ||||||||||||||
| Dividends paid | (3,244) | (3,179) | (65) | ||||||||||||||
| Contributions from noncontrolling interests | 278 | 1,377 | (1,099) | ||||||||||||||
| Other financing items | (116) | (121) | 5 | ||||||||||||||
| Net cash provided by financing activities | $ | 2,351 | $ | 6,129 | $ | (3,778) | |||||||||||
64
| MD&A | LIQUIDITY AND CAPITAL RESOURCES | ||||
The variance was driven primarily by:
•a $2,187 million decrease in proceeds from net issuances of long-term debt, primarily due to timing of issuances and redemptions of long-term debt;
•a $1,099 million decrease in contributions from noncontrolling interests, primarily due to a $1.03 billion receipt from an affiliate of GIC in 2022 related to an additional indirect minority interest investment in Duke Energy Indiana; and
•a $432 million decrease in net borrowings of notes payable and commercial paper.
QUANTITATIVE AND QUALITATIVE DISCLOSURES ABOUT MARKET RISK
Risk Management Policies
The Enterprise Risk Management policy framework at Duke Energy includes strategic, operational, project execution and financial or transaction related risks. Enterprise Risk Management includes market risk as part of the financial and transaction related risks in its framework.
Duke Energy is exposed to market risks associated with commodity prices, interest rates and equity prices. Duke Energy has established comprehensive risk management policies to monitor and manage these market risks. Duke Energy’s Chief Executive Officer and Chief Financial Officer are responsible for the overall approval of market risk management policies and the delegation of approval and authorization levels. The Finance and Risk Management Committee of the Board of Directors receives periodic updates from the Chief Risk Officer and other members of management on market risk positions, corporate exposures and overall risk management activities. The Chief Risk Officer is responsible for the overall governance of managing commodity price risk, including monitoring exposure limits.
The following disclosures about market risk contain forward-looking statements that involve estimates, projections, goals, forecasts, assumptions, risks and uncertainties that could cause actual results or outcomes to differ materially from those expressed in the forward-looking statements. See Item 1A, “Risk Factors,” and “Cautionary Statement Regarding Forward-Looking Information” for a discussion of the factors that may impact any such forward-looking statements made herein.
Commodity Price Risk
Price risk represents the potential risk of loss from adverse changes in the market price of electricity or other energy commodities. Duke Energy’s exposure to commodity price risk is influenced by a number of factors, including the effects of regulation, commodity contract size and length, market liquidity, market conditions, location and unique or specific contract terms. Duke Energy is exposed to the impact of market fluctuations in the prices of electricity, coal, natural gas and other energy-related products marketed and purchased as a result of its ownership of energy-related assets.
Duke Energy’s exposure to these fluctuations through its regulated utility operations is limited since these operations are subject to cost-based regulation and are typically allowed to recover substantially all of these costs through various cost recovery clauses, including fuel clauses, formula-based contracts, or other cost-sharing mechanisms. While there may be a delay in timing between when these costs are incurred and when they are recovered through rates, changes from year to year generally do not have a material impact on operating results of these regulated operations.
Duke Energy employs established policies and procedures to manage risks associated with these market fluctuations, which may include using various commodity derivatives, such as swaps, futures, forwards and options. For additional information, see Note 15 to the Consolidated Financial Statements, “Derivatives and Hedging.”
Generation Portfolio Risks
For the EU&I segment, the generation portfolio not utilized to serve retail operations or committed load is subject to commodity price fluctuations. However, the impact on the Consolidated Statements of Operations is limited due to mechanisms in these regulated jurisdictions that result in the sharing of most of the net profits from these activities with retail customers.
Hedging Strategies
Duke Energy monitors risks associated with commodity price changes on its future operations and, where appropriate, uses various commodity instruments such as electricity, coal and natural gas hedging contracts and options to mitigate the effect of such fluctuations on operations. Duke Energy’s primary use of energy commodity derivatives is to hedge against exposure to the prices of power, fuel for generation and natural gas for customers.
Duke Energy also manages its exposure to basis risk through the use of congestion hedge products in RTOs such as financial transmission rights (PJM and MISO), which result in payments based on differentials in locational marginal prices. The majority of instruments used to manage Duke Energy’s commodity price exposure are either not designated as hedges or do not qualify for hedge accounting. These instruments are referred to as undesignated contracts. Mark-to-market changes for undesignated contracts entered into by regulated businesses are reflected as regulatory assets or liabilities on the Consolidated Balance Sheets.
Duke Energy may also enter into other contracts that qualify for the NPNS exception. When a contract meets the criteria to qualify as NPNS, Duke Energy applies such exception. Income recognition and realization related to NPNS contracts generally coincide with the physical delivery of the commodity. For contracts qualifying for the NPNS exception, no recognition of the contract’s fair value in the Consolidated Financial Statements is required until settlement of the contract as long as the transaction remains probable of occurring.
65
| MD&A | QUANTITATIVE AND QUALITATIVE DISCLOSURES ABOUT MARKET RISK | ||||
Interest Rate Risk
Duke Energy is exposed to risk resulting from changes in interest rates as a result of its issuance or anticipated issuance of variable and fixed-rate debt and commercial paper. Duke Energy manages interest rate exposure by limiting variable-rate exposures to a percentage of total debt and by monitoring the effects of market changes in interest rates. Duke Energy also enters into financial derivative instruments, which may include instruments such as, but not limited to, interest rate swaps, swaptions and U.S. Treasury lock agreements to manage and mitigate interest rate risk exposure. See Notes 1, 7, 15 and 17 to the Consolidated Financial Statements, “Summary of Significant Accounting Policies,” “Debt and Credit Facilities,” “Derivatives and Hedging,” and “Fair Value Measurements.”
Duke Energy had $8.0 billion of unhedged long- and short-term floating interest rate exposure at December 31, 2023. The impact of a 100-basis point change in interest rates on pretax income is approximately $80 million at December 31, 2023. This amount was estimated by considering the impact of the hypothetical interest rates on variable-rate securities outstanding, adjusted for interest rate hedges as of December 31, 2023.
Foreign Currency Exchange Risk
Duke Energy is exposed to risk resulting from changes in the foreign currency exchange rates as a result of its issuances of long-term debt denominated in a foreign currency. Duke Energy manages foreign currency exchange risk exposure by entering into cross-currency swaps, a type of financial derivative instrument, which mitigate foreign currency exchange exposure. See Notes 7, 15 and 17 to the Consolidated Financial Statements, “Debt and Credit Facilities,” “Derivatives and Hedging” and “Fair Value Measurements," respectively.
Credit Risk
Credit risk represents the loss that the Duke Energy Registrants would incur if a counterparty fails to perform under its contractual obligations. Where exposed to credit risk, the Duke Energy Registrants analyze the counterparty's financial condition prior to entering into an agreement and monitor exposure on an ongoing basis. The Duke Energy Registrants establish credit limits where appropriate in the context of contractual arrangements and monitor such limits.
To reduce credit exposure, the Duke Energy Registrants seek to include netting provisions with counterparties, which permit the offset of receivables and payables with such counterparties. The Duke Energy Registrants also frequently use master agreements with credit support annexes to further mitigate certain credit exposures. The master agreements provide for a counterparty to post cash or letters of credit to the exposed party for exposure in excess of an established threshold. The threshold amount represents a negotiated unsecured credit limit for each party to the agreement, determined in accordance with the Duke Energy Registrants’ internal corporate credit practices and standards. Collateral agreements generally also provide that the failure to post collateral when required is sufficient cause to terminate transactions and liquidate all positions.
The Duke Energy Registrants also obtain cash, letters of credit, or surety bonds from certain counterparties to provide credit support outside of collateral agreements, where appropriate, based on a financial analysis of the counterparty and the regulatory or contractual terms and conditions applicable to each transaction. See Note 15 to the Consolidated Financial Statements, “Derivatives and Hedging,” for additional information regarding credit risk related to derivative instruments.
The Duke Energy Registrants’ principal counterparties for its electric and natural gas businesses are RTOs, distribution companies, municipalities, electric cooperatives and utilities located throughout the U.S. Exposure to these entities consists primarily of amounts due to Duke Energy Registrants for delivered electricity. Additionally, there may be potential risks associated with remarketing of energy and capacity in the event of default by wholesale power customers. The Duke Energy Registrants have concentrations of receivables from certain of such entities that may affect the Duke Energy Registrants’ credit risk.
The Duke Energy Registrants are also subject to credit risk from transactions with their suppliers that involve prepayments or milestone payments in conjunction with outsourcing arrangements, major construction projects and certain commodity purchases. The Duke Energy Registrants’ credit exposure to such suppliers may take the form of increased costs or project delays in the event of nonperformance. The Duke Energy Registrants' frequently require guarantees or letters of credit from suppliers to mitigate this credit risk.
Credit risk associated with the Duke Energy Registrants’ service to residential, commercial and industrial customers is generally limited to outstanding accounts receivable. The Duke Energy Registrants mitigate this credit risk by requiring tariff customers to provide a cash deposit, letter of credit or surety bond until a satisfactory payment history is established, subject to the rules and regulations in effect in each retail jurisdiction at which time the deposit is typically refunded. Charge-offs for retail customers have historically been insignificant to the operations of the Duke Energy Registrants and are typically recovered through retail rates. Management continually monitors customer charge-offs, payment patterns and the impact of current economic conditions on customers' ability to pay their outstanding balance to ensure the adequacy of bad debt reserves.
In response to the COVID-19 pandemic that began in March 2020, the Duke Energy Registrants announced a suspension of disconnections for nonpayment to assist customers during the national emergency. While disconnections have resumed, the Company continued to offer flexible options to customers struggling with the pandemic and the economic fallout, including extended payment arrangements to satisfy delinquent balances through June 2021. Since then, the Company has resumed standard payment arrangement options. As a result, the Duke Energy Registrants experienced higher charge-offs during 2023, but lower utility account balances in arrears as of December 31, 2023. There is an expectation for the higher levels of charge-offs to continue. The Duke Energy Registrants have reserved for these estimated losses in the allowance for doubtful account balance. See Notes 4 and 19 to the Consolidated Financial Statements, "Regulatory Matters" and "Revenue," respectively, for more information. Duke Energy Ohio and Duke Energy Indiana sell certain of their accounts receivable and related collections through CRC, a Duke Energy consolidated VIE. Losses on collection are first absorbed by the equity of CRC and next by the subordinated retained interests held by Duke Energy Ohio, Duke Energy Kentucky and Duke Energy Indiana. See Note 18 to the Consolidated Financial Statements, “Variable Interest Entities.”
The Duke Energy Registrants provide certain non-tariff services, primarily to large commercial and industrial customers in which incurred costs, including invested capital, are intended to be recovered from the individual customer and therefore are not subject to rate recovery in the event of customer default. Customer creditworthiness is assessed prior to entering into these transactions. Credit concentration related to these transactions exists for certain of these customers.
66
| MD&A | QUANTITATIVE AND QUALITATIVE DISCLOSURES ABOUT MARKET RISK | ||||
Duke Energy Carolinas has third-party insurance to cover certain losses related to asbestos-related injuries and damages above an aggregate self-insured retention. See Note 5 to the Consolidated Financial Statements, "Commitments and Contingencies" for information on asbestos-related injuries and damages claims.
The Duke Energy Registrants also have credit risk exposure through issuance of performance and financial guarantees, letters of credit and surety bonds on behalf of less than wholly owned entities and third parties. Where the Duke Energy Registrants have issued these guarantees, it is possible that they could be required to perform under these guarantee obligations in the event the obligor under the guarantee fails to perform. Where the Duke Energy Registrants have issued guarantees related to assets or operations that have been disposed of via sale, they attempt to secure indemnification from the buyer against all future performance obligations under the guarantees. See Note 8 to the Consolidated Financial Statements, “Guarantees and Indemnifications,” for further information on guarantees issued by the Duke Energy Registrants.
Duke Energy is subject to credit risk from transactions with counterparties to cross-currency swaps related to future interest and principal payments. The credit exposure to such counterparties may take the form of higher costs to meet Duke Energy's future euro-denominated interest and principal payments in the event of counterparty default. Duke Energy selects highly rated banks as counterparties and allocates the hedge for each debt issuance across multiple counterparties. The master agreements with the counterparties impose collateral requirements on the parties in certain circumstances indicative of material deterioration in a party's creditworthiness.
Based on the Duke Energy Registrants’ policies for managing credit risk, their exposures and their credit and other reserves, the Duke Energy Registrants do not currently anticipate a materially adverse effect on their consolidated financial position or results of operations as a result of nonperformance by any counterparty.
Marketable Securities Price Risk
As described further in Note 16 to the Consolidated Financial Statements, “Investments in Debt and Equity Securities,” Duke Energy invests in debt and equity securities as part of various investment portfolios to fund certain obligations. The vast majority of investments in equity securities are within the NDTF and assets of the various pension and other post-retirement benefit plans.
Pension Plan Assets
Duke Energy maintains investments to facilitate funding the costs of providing non-contributory defined benefit retirement and other post-retirement benefit plans. These investments are exposed to price fluctuations in equity markets and changes in interest rates. The equity securities held in these pension plans are diversified to achieve broad market participation and reduce the impact of any single investment, sector or geographic region. Duke Energy has established asset allocation targets for its pension plan holdings, which take into consideration the investment objectives and the risk profile with respect to the trust in which the assets are held. See Note 23 to the Consolidated Financial Statements, “Employee Benefit Plans,” for additional information regarding investment strategy of pension plan assets.
A significant decline in the value of plan asset holdings could require Duke Energy to increase funding of its pension plans in future periods, which could adversely affect cash flows in those periods. Additionally, a decline in the fair value of plan assets, absent additional cash contributions to the plan, could increase the amount of pension cost required to be recorded in future periods, which could adversely affect Duke Energy’s results of operations in those periods.
Nuclear Decommissioning Trust Funds
As required by the NRC, NCUC, PSCSC and FPSC, subsidiaries of Duke Energy maintain trust funds to fund the costs of nuclear decommissioning. As of December 31, 2023, these funds were invested primarily in domestic and international equity securities, debt securities, cash and cash equivalents and short-term investments. Per the NRC, Internal Revenue Code, NCUC, PSCSC and FPSC requirements, these funds may be used only for activities related to nuclear decommissioning. These investments are exposed to price fluctuations in equity markets and changes in interest rates. Duke Energy actively monitors its portfolios by benchmarking the performance of its investments against certain indices and by maintaining, and periodically reviewing, target allocation percentages for various asset classes.
Accounting for nuclear decommissioning recognizes that costs are recovered through retail and wholesale rates; therefore, fluctuations in investment prices do not materially affect the Consolidated Statements of Operations, as changes in the fair value of these investments are primarily deferred as regulatory assets or regulatory liabilities pursuant to Orders by the NCUC, PSCSC, FPSC and FERC. Earnings or losses of the funds will ultimately impact the amount of costs recovered through retail and wholesale rates. See Note 10 to the Consolidated Financial Statements, “Asset Retirement Obligations,” for additional information regarding nuclear decommissioning costs. See Note 16 to the Consolidated Financial Statements, “Investments in Debt and Equity Securities,” for additional information regarding NDTF assets.
OTHER MATTERS
Environmental Regulations
The Duke Energy Registrants are subject to federal, state and local regulations regarding air and water quality, hazardous and solid waste disposal, coal ash and other environmental matters. These regulations can be changed from time to time and result in new obligations of the Duke Energy Registrants.
The following sections outline various proposed and recently enacted legislation and regulations that may impact the Duke Energy Registrants. Refer to Note 4 to the Consolidated Financial Statements, "Regulatory Matters," for further information regarding potential plant retirements and regulatory filings related to the Duke Energy Registrants.
67
| MD&A | OTHER MATTERS | ||||
Greenhouse Gas Standards and Guidelines
On May 23, 2023, the EPA published in the Federal Register proposed new source performance standards under Clean Air Act (CAA) section 111(b) that would establish standards of performance for emissions of greenhouse gases (expressed as carbon dioxide (CO2)) for newly constructed, modified, and reconstructed fossil fuel-fired electric utility steam generating units and fossil fuel-fired stationary combustion turbines. On that same day, in a separate rulemaking under CAA section 111(d), the EPA published proposed emission guidelines for states to use in developing plans to limit CO2 emissions from existing fossil fuel-fired electric generating units and certain large existing stationary combustion turbines. Duke Energy is reviewing the proposed rules and analyzing the potential impacts they could have on the Company, which could be material. A final rule is anticipated in the second quarter of 2024.
Coal Combustion Residuals
In April 2015, EPA published a rule to regulate the disposal of CCR from electric utilities as solid waste. The federal regulation classifies CCR as nonhazardous waste and allows for beneficial use of CCR with some restrictions. The regulation applies to all new and existing landfills, new and existing surface impoundments receiving CCR and existing surface impoundments located at stations generating electricity (regardless of fuel source), which were no longer receiving CCR but contained liquids as of the effective date of the rule. The rule establishes requirements regarding landfill design, structural integrity design and assessment criteria for surface impoundments, groundwater monitoring, protection and remedial procedures and other operational and reporting procedures to ensure the safe disposal and management of CCR.
On May 18, 2023, the EPA published in the Federal Register a proposed rule under the Resource Conservation and Recovery Act, which would establish regulatory requirements for inactive surface impoundments at inactive generating facilities (Legacy CCR Surface Impoundments) and establish groundwater monitoring, corrective action, closure and post-closure care requirements for all CCR management units at facilities otherwise subject to the CCR rule. Duke Energy is reviewing the proposed rule and analyzing the potential impacts it could have on the Company, which could be material. A final rule is anticipated in the second quarter of 2024.
In addition to the requirements of the federal CCR rule, CCR landfills and surface impoundments will continue to be regulated by the states. Cost recovery for future expenditures will be pursued through the normal ratemaking process with federal and state utility commissions and via wholesale contracts, which permit recovery of necessary and prudently incurred costs associated with Duke Energy’s regulated operations. For more information, see Notes 4 and 10 to the Consolidated Financial Statements, "Regulatory Matters" and "Asset Retirement Obligations," respectively.
Coal Ash Act
AROs recorded on the Duke Energy Carolinas and Duke Energy Progress Consolidated Balance Sheets at December 31, 2023, and December 31, 2022, include the legal obligation for closure of coal ash basins and the disposal of related ash as a result of the Coal Ash Act, the EPA CCR rule and other agreements. The Coal Ash Act includes a variance procedure for compliance deadlines and other issues surrounding the management of CCR and CCR surface impoundments and prohibits cost recovery in customer rates for unlawful discharge of ash impoundment waters occurring after January 1, 2014. The Coal Ash Act leaves the decision on cost recovery determinations related to closure of ash impoundments to the normal ratemaking processes before utility regulatory commissions.
Consistent with the requirements of the Coal Ash Act, Duke Energy previously submitted comprehensive site assessments and groundwater corrective action plans to NCDEQ. On December 31, 2019, Duke Energy submitted updated groundwater corrective action plans for six sites in North Carolina and site-specific coal ash impoundment closure plans for all 14 North Carolina sites to NCDEQ. In addition, from 2020 through 2023, Duke Energy submitted updated comprehensive site assessments and groundwater corrective action plans for the remaining North Carolina sites.
On April 1, 2019, NCDEQ issued a closure determination requiring Duke Energy Carolinas and Duke Energy Progress to excavate all remaining coal ash impoundments at the Allen, Belews Creek, J.E. Rogers, Marshall, Mayo and Roxboro facilities in North Carolina. On April 26, 2019, Duke Energy Carolinas and Duke Energy Progress filed Petitions for Contested Case Hearings in the Office of Administrative Hearings to challenge NCDEQ's April 1 Order. On December 31, 2019, Duke Energy Carolinas and Duke Energy Progress entered into a settlement agreement with NCDEQ and certain community groups under which Duke Energy Carolinas and Duke Energy Progress agreed to excavate six of the nine remaining coal ash basins at these sites with ash moved to on-site lined landfills, including two at Allen, one at Mayo, one at Roxboro, and two at Rogers. At the three remaining basins at Belews Creek, Marshall and Roxboro, uncapped basin ash will be excavated and moved to lined landfills. Those portions of the basins at Belews Creek, Marshall and Roxboro, which were previously filled with ash and on which permitted facilities were constructed, will not be disturbed and will be closed pursuant to other state regulations.
The estimated total cost to permanently close all coal ash basins in North Carolina and South Carolina is estimated to be approximately $7 billion to $8 billion of which approximately $4 billion has been spent through 2023. The majority of the remaining spend is primarily expected to occur over the next 10 years. Duke Energy has completed excavation of all coal ash at the Riverbend, Dan River, Asheville and Sutton plants.
For further information on coal ash basins and recovery, see Notes 4 and 10 to the Consolidated Financial Statements, "Regulatory Matters" and “Asset Retirement Obligations,” respectively.
North Carolina House Bill 951
On October 13, 2021, HB 951 was signed into law, establishing a framework overseen by the NCUC to advance state CO2 emission reductions from electric generating facilities in the state through the use of least cost planning while providing for continued reliability and affordable rates for customers served by such generation. It also authorized the use of PBR in North Carolina. Among other things, HB 951 required the NCUC to:
•develop a carbon plan that would target a 70% interim reduction in CO2 emissions from public utilities' electric generation in the state on the least cost path to carbon neutrality by 2050, considering all resource options and the latest technology;
•adopt rules to implement the requirements of the Legislation authorizing PBR that includes MYRP with a maximum three-year term, performance incentive mechanisms to track utility performance, and revenue decoupling for the residential customer class;
68
| MD&A | OTHER MATTERS | ||||
•establish rules to securitize costs associated with the early retirement of subcritical coal-fired electric generating facilities necessary to achieve the authorized carbon reduction goals at 50% of remaining net book value, with the remaining net book value recovered through normal cost-of-service basis; and
•initiate a process for updating rates and terms of certain existing solar PPAs executed under PURPA.
In October 2022 and January 2023, Duke Energy Progress and Duke Energy Carolinas, respectively, filed applications with the NCUC, which proposed implementation of HB 951’s provisions around PBR, including MYRP, residential decoupling and performance incentive mechanisms. Additionally, on December 30, 2022, the NCUC issued an order adopting the first Carbon Plan as directed by the Legislation with the Carbon Plan to be updated every two years thereafter. With this order, the NCUC recognized the value of an “all of the above” approach to achieving CO2 emission reductions and established a set of near-term procurement and development activities needed to continue progress towards the targeted CO2 reductions, along with the schedule for the future biennial updates to the Carbon Plan. The NCUC approved a near-term action plan including stakeholder engagement activities for onshore wind generation and certain procurement and development activities to strengthen the grid, improve resilience for customers and interconnect new generation and storage (in all cases, subject to any further applicable regulatory processes). The NCUC also approved early development activities for long lead-time resources, affirmed the ownership structure required in HB 951, and provided an orderly transition out of coal generation by 2035.
In August 2023 and December 2023, the NCUC issued orders approving Duke Energy Progress' and Duke Energy Carolinas' PBR Applications, respectively, as modified by the partial settlements and the orders. See Note 4, "Regulatory Matters" to the Consolidated Financial Statements for more information.
Other Environmental Regulations
The Duke Energy Registrants are also subject to various federal, state and local laws regarding air and water quality, hazardous and solid waste disposal and other environmental matters. Duke Energy continues to comply with enacted environmental statutes and regulations even as certain of these regulations are in various stages of clarification, revision or legal challenge. The Duke Energy Registrants cannot predict the outcome of these matters.
Global Climate Change and Regulation of GHG Emissions
In 2021, President Biden recommitted the United States to the Paris Agreement and announced a new target for the United States of 50% to 52% reduction in economywide net GHG emissions from 2005 levels by 2030. The U.S. submittal to support this Paris target includes a goal for 100% carbon-free electricity by 2035. These actions have been supplemented by a number of executive orders by President Biden and a number of proposed and final rules from federal regulatory agencies, including the EPA, that would impose additional regulations on CO2 and methane emissions to which Duke Energy will be subject. The Duke Energy Registrants are monitoring these matters and cannot predict the outcome, however, there could be a material impact on our clean energy transition.
EU&I CO2 Emissions Reductions
The Duke Energy Registrants’ direct GHG emissions consist primarily of CO2 that results primarily from operating a fleet of coal-fired and natural gas-fired power plants to serve its customers reliably and affordably. In 2019, Duke Energy announced an updated climate strategy with new goals of at least a 50% reduction in carbon emissions from 2005 levels from electric generation by 2030 and net-zero carbon emissions from electric generation by 2050. In February 2022, we added Scope 2 and certain Scope 3 emissions, including emissions from upstream purchased power and fossil fuel purchases, as well as downstream customer use of natural gas, to our 2050 net-zero goal. In October 2022, we announced an additional interim target to reduce carbon emissions from electric generation by 80% from 2005 levels by 2040. Duke Energy also adopted an interim goal of reducing Scope 2 and Scope 3 emissions mentioned above by 50% below 2021 levels by 2035.
The Duke Energy Registrants have taken actions that have resulted in a reduction of CO2 emissions over time. Between 2005 and 2023, the Duke Energy Registrants have collectively lowered the CO2 emissions from their electricity generation by 48%. Timelines and initiatives, as well as implementation of new technologies, for future reductions of GHG emissions will vary in each state in which the Company operates and will involve collaboration with regulators, customers and other stakeholders. The goals announced in 2019, and updated in 2022, as well as the actions taken to reduce CO2 emissions, potentially lower the exposure to any future mandatory CO2 emission reduction requirements, whether as a result of federal legislation, EPA regulation, state regulation or other as yet unknown emission reduction requirement.
Actions to reduce CO2 emissions have included the retirement of 56 coal-fired electric generating units with a combined generating capacity of 7,500 MW, while investing in renewables and state-of-the-art highly efficient natural gas-fired generation that produces far fewer CO2 emissions per unit of electricity generated than coal. Duke Energy also has made investments to increase EE offerings and ensure continued operations of its zero-CO2 emissions hydropower and nuclear plants. These efforts have diversified its system and significantly reduced CO2 emissions.
Duke Energy will continue to explore the use of currently available and commercially demonstrated technology to reduce CO2 emissions, including EE, wind, solar and storage, as well as evolving technologies like carbon capture, utilization and storage, the use of hydrogen and other low-carbon fuels, long-duration energy storage and advanced nuclear, in its efforts to achieve its net-zero goal as well as to comply with any future regulations. Duke Energy plans to adjust to and incorporate evolving and innovative technologies in a way that balances the reliability and affordability of energy while meeting regulatory requirements and customer demands. Under any future scenario involving mandatory CO2 limitations, the Duke Energy Registrants would plan to seek recovery of their compliance costs through appropriate regulatory mechanisms. Future levels of GHG emissions by the Duke Energy Registrants will be influenced by variables that include customer growth and capacity needs in the jurisdictions in which they operate, public policy, tax incentives, economic conditions that affect electricity demand, fuel prices, market prices, availability of resources and labor, compliance with new or existing regulations, the ability to make enhancements to transmission and distribution systems to support increased renewables, and the existence of new technologies that can be deployed to generate the electricity necessary to meet customer demand.
Currently, the Duke Energy Registrants do not purchase carbon credits or offsets for use in connection with the Company's net-zero CO2 emissions goals. Though they may purchase carbon credits or offsets for such uses in the future, the amount or cost of which is not expected to be material at this time.
69
| MD&A | OTHER MATTERS | ||||
Generation Mix Planning Process
The Duke Energy Registrants annually, biennially or triennially prepare lengthy, forward-looking IRPs. These detailed, highly technical plans are based on the Company’s thorough analysis of numerous factors that can impact the cost of producing and delivering electricity that influence long-term generation resource planning decisions. The IRP process helps to evaluate a range of options, taking into account stakeholder input as well as forecasts of future electricity demand, fuel prices, transmission improvements, new generating capacity, integration of renewables, energy storage, EE and demand response initiatives. The IRP process also helps evaluate potential environmental and regulatory scenarios to better mitigate policy and economic risks. The IRPs we file with regulators look out 10 to 20 years depending on the jurisdiction.
For a number of years, the Duke Energy Registrants have included a price on CO2 emissions in their IRP planning process to account for the potential regulation of CO2 emissions. Incorporating a price on CO2 emissions in the IRPs allows for the evaluation of existing and future resource needs against potential climate change policy risk in the absence of policy certainty. One of the challenges with using a CO2 price, especially in the absence of a clear and certain policy, is determining the appropriate price to use. To address this uncertainty and ensure the Company remains agile, the Duke Energy Registrants typically use a range of potential CO2 prices to reflect a range of potential policy outcomes.
In September 2020, Duke Energy Carolinas and Duke Energy Progress filed their IRPs in North Carolina and South Carolina, and, in December 2021, Duke Energy Indiana filed its IRP, outlining an accelerated energy transition, which aligns with the Company's 2030 CO2 emissions goal. In December 2021, the PSCSC rejected Duke Energy Carolinas and Duke Energy Progress’ preferred accelerated coal retirements IRP scenario and instead found that the base case without a price on CO2 emissions was the most reasonable IRP scenario.
In 2021, the state of North Carolina passed HB 951, which among other things, directed the NCUC to develop and approve a carbon reduction plan by the end of 2022 that would target a 70% reduction in CO2 emissions from Duke Energy Progress' and Duke Energy Carolinas' electric generation in the state by 2030 and carbon neutrality by 2050, considering all resource options and the latest technology. In light of this legislation, in November 2021, the NCUC declined to make a determination on the portfolios presented in the 2020 IRP noting that the legislation may impact the schedule for coal plant retirements and new resources and limited its order to short-term actions for use on an interim basis pending preparation of the carbon plan. The NCUC approved its initial carbon reduction plan in December 2022, which considered feedback from extensive stakeholder engagement and was informed by Duke Energy's initial proposed carbon plan, filed with the NCUC on May 16, 2022, and built on the IRPs that were filed in 2020 by Duke Energy Carolinas and Duke Energy Progress.
In August 2023, Duke Energy Carolinas and Duke Energy Progress filed their 2023 systemwide Carolinas Resource Plan (the Plan) with the NCUC and PSCSC. The Plan provided a range of generation options, including three core portfolios, reflecting an “all of the above” approach to powering the energy needs of our growing region. In the Plan, Duke Energy Carolinas and Duke Energy Progress recommended Portfolio 3 as the most prudent path forward to comply with applicable state laws, providing a reliable and orderly energy transition that was proposed as the most reasonable and lowest-cost plan for the Carolinas. Portfolio 3 proposes a diverse and reliable set of generation and energy storage solutions and shrinks the challenges of growth and the transition from coal by expanding industry-leading EE and demand response options, laying out a path to reliably exit coal by 2035. Portfolio 3 also makes the most of existing system resources by extending the lives of Duke Energy’s nuclear plants and extending the license and doubling the peak hourly capacity of the Bad Creek pumped-hydro storage facility. Near-term actions consistent with Portfolio 3 were also proposed that will be executed between now and 2026 to advance the orderly energy transition. In November 2023, Duke Energy Carolinas and Duke Energy Progress provided notice to the NCUC and PSCSC of a substantially increased load forecast resulting from increased economic development in the Carolinas occurring since the system-wide Plan was prepared. The companies filed supplemental modeling and analysis with the NCUC and PSCSC in January 2024, demonstrating the need for additional resources beyond the initial set of resources identified by the companies in their initial plan. The NCUC has scheduled an evidentiary hearing for July 2024, with an order expected by the end of 2024. The PSCSC will hold its hearing in September 2024 with a decision expected in late November 2024.
GU&I CO2 and Methane Emissions Reductions
In addition to CO2 emissions resulting primarily from our operations of coal-fired and natural gas-fired power plants, the Duke Energy Registrants are also responsible for certain methane emissions from the distribution of natural gas to customers. In October 2020, Duke Energy announced a new goal to achieve net-zero methane emissions from its natural gas distribution business by 2030. The Duke Energy Registrants have taken actions that have resulted in methane emission reductions, including the replacement of cast iron and bare steel pipelines and associated services with plastic or coated steel, advanced methane leak detection efforts, reducing time to repair nonhazardous leaks and operational releases of methane, and investment in renewable natural gas.
Timelines and initiatives, as well as implementation of new technologies, for future reductions of upstream methane emissions will vary in each state in which the Company’s natural gas distribution business operates and will involve collaboration with regulators, customers and other stakeholders. EPA has also proposed regulations that would require reduction of methane emissions upstream of the Duke Energy Registrants' natural gas distribution business. The impact of these regulations on natural gas fuel prices is not currently quantifiable.
In addition to possible EPA regulation of methane emissions, certain local governments, none within the jurisdictions in which the Duke Energy Registrants operate, have enacted or are considering initiatives to eliminate natural gas use in new buildings and focus on electrification. Enactment of similar regulations in the areas in which the Duke Energy Registrants' natural gas distribution operates could have a significant impact on the natural gas distribution business and its operations. At this time, such impacts are not able to be quantified; however, the net-zero methane goals announced in 2020 for the natural gas distribution business, as well as the actions taken to reduce these GHG emissions, potentially lowers the exposure to any future mandatory GHG emission reduction requirements. The Duke Energy Registrants would plan to seek recovery of their compliance costs with any new regulations through the regulatory process.
70
| MD&A | OTHER MATTERS | ||||
Physical Impacts of Climate Change
The Duke Energy Registrants recognize that scientists associate severe weather events with increasing levels of GHGs in the atmosphere. It is possible that these weather events could have a material impact on future results of operations should they occur more frequently and with greater severity. However, the uncertain nature of potential changes in extreme weather events (such as increased frequency, duration and severity), the long period of time over which any potential changes might take place and the inability to predict potential changes with any degree of accuracy, make estimating with any certainty any potential future financial risk to the Duke Energy Registrants’ operations difficult. Additionally, the Duke Energy Registrants would plan to continue to seek recovery of storm costs through the appropriate regulatory mechanisms. For more information on storm securitization and storm cost recovery, see Note 4 to the Consolidated Financial Statements, "Regulatory Matters."
The Duke Energy Registrants routinely take steps to reduce the potential impact of severe weather events on their electric transmission and distribution systems and natural gas facilities. The steps include modernizing the electric grid through smart meters, storm hardening, self-healing systems and targeted undergrounding and applying lessons learned from previous storms to restoration efforts. The Duke Energy Registrants’ electric generating facilities and natural gas facilities are designed to withstand extreme weather events without significant damage. The Duke Energy Registrants maintain inventories of coal, oil and liquified natural gas to mitigate the effects of any potential short-term disruption in fuel supply so they can continue to provide customers with an uninterrupted supply of electricity and/or natural gas.
New Accounting Standards
See Note 1 to the Consolidated Financial Statements, “Summary of Significant Accounting Policies,” for a discussion of the impact of new accounting standards.
ITEM 7A. QUANTITATIVE AND QUALITATIVE DISCLOSURES ABOUT MARKET RISK
See “Management’s Discussion and Analysis of Results of Operations and Financial Condition – Quantitative and Qualitative Disclosures About Market Risk.”
71
| FINANCIAL STATEMENTS | |||||
ITEM 8. FINANCIAL STATEMENTS AND SUPPLEMENTARY DATA
| Duke Energy | |||||
| Report of Independent Registered Public Accounting Firm | |||||
| Consolidated Statements of Operations | |||||
| Consolidated Statements of Comprehensive Income | |||||
| Consolidated Balance Sheets | |||||
| Consolidated Statements of Cash Flows | |||||
| Consolidated Statements of Changes in Equity | |||||
| Duke Energy Carolinas | |||||
| Report of Independent Registered Public Accounting Firm | |||||
| Consolidated Statements of Operations and Comprehensive Income | |||||
| Consolidated Balance Sheets | |||||
| Consolidated Statements of Cash Flows | |||||
| Consolidated Statements of Changes in Equity | |||||
| Progress Energy | |||||
| Report of Independent Registered Public Accounting Firm | |||||
| Consolidated Statements of Operations and Comprehensive Income | |||||
| Consolidated Balance Sheets | |||||
| Consolidated Statements of Cash Flows | |||||
| Consolidated Statements of Changes in Equity | |||||
| Duke Energy Progress | |||||
| Report of Independent Registered Public Accounting Firm | |||||
| Consolidated Statements of Operations and Comprehensive Income | |||||
| Consolidated Balance Sheets | |||||
| Consolidated Statements of Cash Flows | |||||
| Consolidated Statements of Changes in Equity | |||||
| Duke Energy Florida | |||||
| Report of Independent Registered Public Accounting Firm | |||||
| Consolidated Statements of Operations and Comprehensive Income | |||||
| Consolidated Balance Sheets | |||||
| Consolidated Statements of Cash Flows | |||||
| Consolidated Statements of Changes in Equity | |||||
| Duke Energy Ohio | |||||
| Report of Independent Registered Public Accounting Firm | |||||
| Consolidated Statements of Operations and Comprehensive Income | |||||
| Consolidated Balance Sheets | |||||
| Consolidated Statements of Cash Flows | |||||
| Consolidated Statements of Changes in Equity | |||||
| Duke Energy Indiana | |||||
| Report of Independent Registered Public Accounting Firm | |||||
| Consolidated Statements of Operations and Comprehensive Income | |||||
| Consolidated Balance Sheets | |||||
| Consolidated Statements of Cash Flows | |||||
| Consolidated Statements of Changes in Equity | |||||
| Piedmont | |||||
| Report of Independent Registered Public Accounting Firm | |||||
| Consolidated Statements of Operations and Comprehensive Income | |||||
| Consolidated Balance Sheets | |||||
| Consolidated Statements of Cash Flows | |||||
| Consolidated Statements of Changes in Equity | |||||
72
| FINANCIAL STATEMENTS | |||||
| Combined Notes to Consolidated Financial Statements | |||||
| Note 1 – Summary of Significant Accounting Policies | |||||
| Note 2 – Dispositions | |||||
| Note 3 – Business Segments | |||||
| Note 4 – Regulatory Matters | |||||
| Note 5 – Commitments and Contingencies | |||||
| Note 6 – Leases | |||||
| Note 7 – Debt and Credit Facilities | |||||
| Note 8 – Guarantees and Indemnifications | |||||
| Note 9 – Joint Ownership of Generating and Transmission Facilities | |||||
| Note 10 – Asset Retirement Obligations | |||||
| Note 11 – Property, Plant and Equipment | |||||
| Note 12 – Goodwill and Intangible Assets | |||||
| Note 13 – Investments in Unconsolidated Affiliates | |||||
| Note 14 – Related Party Transactions | |||||
| Note 15 – Derivatives and Hedging | |||||
| Note 16 – Investments in Debt and Equity Securities | |||||
| Note 17 – Fair Value Measurements | |||||
| Note 18 – Variable Interest Entities | |||||
| Note 19 – Revenue | |||||
| Note 20 – Stockholders' Equity | |||||
| Note 21 – Severance | |||||
| Note 22 – Stock-Based Compensation | |||||
| Note 23 – Employee Benefit Plans | |||||
| Note 24 – Income Taxes | |||||
| Note 25 – Other Income and Expenses, Net | |||||
| Note 26 – Subsequent Events | |||||
| Note 27 – Quarterly Financial Data (Unaudited) | |||||
73
| REPORTS | |||||
REPORT OF INDEPENDENT REGISTERED PUBLIC ACCOUNTING FIRM
To the shareholders and the Board of Directors of Duke Energy Corporation
Opinion on the Financial Statements
We have audited the accompanying consolidated balance sheets of Duke Energy Corporation and subsidiaries (the "Company") as of December 31, 2023 and 2022, the related consolidated statements of operations, comprehensive income, changes in equity, and cash flows, for each of the three years in the period ended December 31, 2023, and the related notes (collectively referred to as the "financial statements"). In our opinion, the financial statements present fairly, in all material respects, the financial position of the Company as of December 31, 2023 and 2022, and the results of its operations and its cash flows for each of the three years in the period ended December 31, 2023, in conformity with accounting principles generally accepted in the United States of America.
We have also audited, in accordance with the standards of the Public Company Accounting Oversight Board (United States) (PCAOB), the Company's internal control over financial reporting as of December 31, 2023, based on criteria established in Internal Control — Integrated Framework (2013) issued by the Committee of Sponsoring Organizations of the Treadway Commission and our report dated February 23, 2024, expressed an unqualified opinion on the Company's internal control over financial reporting.
Basis for Opinion
These financial statements are the responsibility of the Company's management. Our responsibility is to express an opinion on the Company's financial statements based on our audits. We are a public accounting firm registered with the PCAOB and are required to be independent with respect to the Company in accordance with the U.S. federal securities laws and the applicable rules and regulations of the Securities and Exchange Commission and the PCAOB.
We conducted our audits in accordance with the standards of the PCAOB. Those standards require that we plan and perform the audit to obtain reasonable assurance about whether the financial statements are free of material misstatement, whether due to error or fraud. Our audits included performing procedures to assess the risks of material misstatement of the financial statements, whether due to error or fraud, and performing procedures that respond to those risks. Such procedures included examining, on a test basis, evidence regarding the amounts and disclosures in the financial statements. Our audits also included evaluating the accounting principles used and significant estimates made by management, as well as evaluating the overall presentation of the financial statements. We believe that our audits provide a reasonable basis for our opinion.
Critical Audit Matters
The critical audit matters communicated below are matters arising from the current-period audit of the financial statements that were communicated or required to be communicated to the audit committee and that (1) relate to accounts or disclosures that are material to the financial statements and (2) involved our especially challenging, subjective, or complex judgments. The communication of critical audit matters does not alter in any way our opinion on the financial statements, taken as a whole, and we are not, by communicating the critical audit matters below, providing a separate opinion on the critical audit matters or on the accounts or disclosures to which they relate.
Regulatory Matters – Impact of Rate Regulation on the Financial Statements – Refer to Notes 1, 4, and 10 to the financial statements.
Critical Audit Matter Description
The Company is subject to regulation by federal and state utility regulatory agencies (the “Commissions”), which have jurisdiction with respect to the rates of the Company’s electric and natural gas distribution companies. Management has determined it meets the criteria for the application of regulated operations accounting in preparing its financial statements under accounting principles generally accepted in the United States of America. Judgment can be required to determine if otherwise recognizable incurred costs qualify to be presented as a regulatory asset and deferred because such costs are probable of future recovery in customer rates. As discussed in Note 4, regulatory proceedings in recent years have focused on the recoverability of storm costs, fuel costs, and asset retirement obligations specific to coal ash. As a result, assessing the potential outcomes of future regulatory orders requires management judgment.
We identified the impact of rate regulation related to regulatory assets as a critical audit matter due to the judgments made by management, including assumptions regarding the outcome of future decisions by the Commissions to support its assertions on the likelihood of future recovery for deferred costs. Given that management’s accounting judgments are based on assumptions about the outcome of future decisions by the Commissions, auditing these judgments required specialized knowledge of accounting for rate regulation and the ratemaking process due to its inherent complexities as it relates to regulatory assets.
How the Critical Audit Matter Was Addressed in the Audit
Our audit procedures related to the recovery of regulatory assets included the following, among others:
•We tested the effectiveness of management’s controls over the evaluation of the likelihood of the recovery in future rates and the monitoring and evaluation of regulatory developments that may affect the likelihood of recovering costs in future rates.
•We evaluated the Company’s disclosures related to the impacts of rate regulation including the balances recorded and regulatory developments.
•We read relevant regulatory orders issued by the Commissions, and other publicly available information to assess the likelihood of recovery in future rates based on precedents of the Commissions’ treatment of similar costs under similar circumstances. We also evaluated the external information and compared it to management’s recorded balances for completeness.
74
| REPORTS | |||||
•We evaluated management’s judgments regarding the recoverability of regulatory asset balances by performing the following:
–We inquired of management regarding changes in regulatory orders and regulatory asset balances during the year.
–We evaluated the reasonableness of such changes based on our knowledge of commission-approved amortization, expected incurred costs, and recently approved regulatory orders, as applicable.
–We utilized trend analyses to evaluate the historical consistency of regulatory asset balances.
–We compared the recorded regulatory asset balance to an independently developed expectation of the corresponding balance.
•We performed audit procedures on the incurred asset retirement obligations requested for recovery to confirm their completeness and accuracy.
•We obtained an analysis from management and letters from internal legal counsel for asset retirement obligations specific to coal ash costs, regarding probability of recovery for deferred costs not yet addressed in a regulatory order to assess management’s assertion that amounts are probable of recovery.
•We obtained representation from management asserting that regulatory assets recorded in the financial statements are probable of recovery.
•We performed substantive analytical procedures on the recoverability of deferred fuel costs and detail testing procedures on the recoverability of deferred storm costs.
Asset Retirement Obligations – Nuclear Decommissioning Cash Flow Revisions – Refer to Notes 4 and 10 to the financial statements.
Critical Audit Matter Description
The Company owns and operates nuclear facilities and records asset retirement obligations for their eventual decommissioning. On an annual basis, management performs an assessment for any indicators that would suggest a change in decommissioning cost estimates may be necessary. Judgment is required to calculate decommissioning estimates, which are determined through site-specific, third-party cost studies and are based on discounted cash flows, regulatory, legal, and legislative decisions, selection of discount rates and cost escalation rates, among other factors.
We identified the revisions in estimates of cash flows associated with nuclear asset retirement obligations as a critical audit matter because of the estimates and assumptions made by management and management’s specialist in determining the recorded asset retirement obligations. This required a high degree of auditor judgment, and for certain assumptions, the need to involve our environmental and fair value specialists, when performing audit procedures related to the revisions in estimates of cash flows associated with nuclear asset retirement obligations.
How the Critical Audit Matter Was Addressed in the Audit
Our audit procedures related to the revisions in estimates of cash flows associated with nuclear asset retirement obligations included the following, among others:
•We tested the effectiveness of management’s controls over the evaluation of nuclear asset retirement obligations, including those over management’s assessment of the results of the site-specific cost study, as well as the evaluation of economic inputs.
•We tested the mathematical accuracy of management’s nuclear asset retirement obligation calculations.
•We made inquiries and inspected opinions of internal counsel regarding the status of relevant assumptions.
•With the assistance of professionals in our firm with the appropriate expertise, we inspected and evaluated the reasonableness of the results of the decommissioning study, as well as the impacts of any economic inputs on the calculation of revisions to cash flow estimates.
•We evaluated the Company’s disclosures related to the impacts of the nuclear asset retirement obligation.
•We obtained representation from management asserting that the asset retirement obligations recorded in the financial statements represent management’s best estimates.
Dispositions - Disclosures related to Discontinued Operations and Accounting for the Associated Impairment Charges — Refer to Note 2 to the financial statements.
Critical Audit Matter Description
In November 2022, Duke Energy committed to a plan to sell the Commercial Renewables business segment. As a result, the utility-scale solar and wind group, the distributed generation group and the remaining assets (collectively, Commercial Renewables Disposal Groups) were classified as discontinued operations in the fourth quarter of 2022. During October 2023, Duke Energy completed the divestiture of the utility-scale solar and wind group and the distributed generation group. Pretax impairment charges of approximately $1.7 billion were recorded as of December 31, 2023 on the Commercial Renewables Disposal Groups.
We identified the disclosures related to discontinued operations and accounting for the associated impairment charges as a critical audit matter because of the extensive effort required to audit the subjective and complex judgments associated with the determination of the impairment charges.
75
| REPORTS | |||||
How the Critical Audit Matter Was Addressed in the Audit
Our audit procedures for the disclosures related to discontinued operations and accounting for the associated impairment charges included the following, among others:
•We tested the effectiveness of management’s controls over (1) the evaluation and disclosure of discontinued operations and (2) the determination of the impairment charges.
•We evaluated management’s assessment of discontinued operations classification and disclosure.
•We assessed the terms of the purchase and sale agreements of the utility-scale solar and wind group and the distributed generation group to evaluate management's calculations of the impairment charges including the completeness and accuracy of amounts included in such calculations and the mathematical accuracy of the calculations.
•With the assistance of our tax specialists, we evaluated the reasonableness of the methods, assumptions, and judgments used by management to determine the income tax benefit associated with the divestitures.
•We evaluated the reasonableness of the determination of the fair value of the remaining assets which are not yet divested.
•We evaluated the accuracy and completeness of the related disclosures.
•We obtained representation from management asserting to the appropriate presentation, measurement and timing of the Commercial Renewables Disposal Groups.
/s/ Deloitte & Touche LLP
Charlotte, North Carolina
February 23, 2024
We have served as the Company's auditor since 1947.
76
| FINANCIAL STATEMENTS | |||||
DUKE ENERGY CORPORATION
CONSOLIDATED STATEMENTS OF OPERATIONS
| Years Ended December 31, | |||||||||||||||||
| (in millions, except per share amounts) | 2023 | 2022 | 2021 | ||||||||||||||
| Operating Revenues | |||||||||||||||||
| Regulated electric | $ | $ | $ | ||||||||||||||
| Regulated natural gas | |||||||||||||||||
| Nonregulated electric and other | |||||||||||||||||
| Total operating revenues | |||||||||||||||||
| Operating Expenses | |||||||||||||||||
| Fuel used in electric generation and purchased power | |||||||||||||||||
| Cost of natural gas | |||||||||||||||||
| Operation, maintenance and other | |||||||||||||||||
| Depreciation and amortization | |||||||||||||||||
| Property and other taxes | |||||||||||||||||
| Impairment of assets and other charges | |||||||||||||||||
| Total operating expenses | |||||||||||||||||
| Gains on Sales of Other Assets and Other, net | |||||||||||||||||
| Operating Income | |||||||||||||||||
| Other Income and Expenses | |||||||||||||||||
Equity in earnings of unconsolidated affiliates | |||||||||||||||||
| Other income and expenses, net | |||||||||||||||||
| Total other income and expenses | |||||||||||||||||
| Interest Expense | |||||||||||||||||
| Income From Continuing Operations Before Income Taxes | |||||||||||||||||
Income Tax Expense From Continuing Operations | |||||||||||||||||
| Income From Continuing Operations | |||||||||||||||||
| Loss From Discontinued Operations, net of tax | ( | ( | ( | ||||||||||||||
| Net Income | |||||||||||||||||
Add: Net (Income) Loss Attributable to Noncontrolling Interests | ( | ||||||||||||||||
Net Income Attributable to Duke Energy Corporation | |||||||||||||||||
Less: Preferred Dividends | |||||||||||||||||
Net Income Available to Duke Energy Corporation Common Stockholders | $ | $ | $ | ||||||||||||||
Earnings Per Share – Basic and Diluted | |||||||||||||||||
| Income from continuing operations available to Duke Energy Corporation common stockholders | |||||||||||||||||
| Basic and Diluted | $ | $ | $ | ||||||||||||||
| (Loss) Income from discontinued operations attributable to Duke Energy Corporation common stockholders | |||||||||||||||||
| Basic and Diluted | $ | ( | $ | ( | $ | ||||||||||||
| Net income available to Duke Energy Corporation common stockholders | |||||||||||||||||
| Basic and Diluted | $ | $ | $ | ||||||||||||||
| Weighted average shares outstanding | |||||||||||||||||
Basic and Diluted | |||||||||||||||||
See Notes to Consolidated Financial Statements
77
| FINANCIAL STATEMENTS | |||||
DUKE ENERGY CORPORATION
CONSOLIDATED STATEMENTS OF COMPREHENSIVE INCOME
| Years Ended December 31, | |||||||||||||||||
| (in millions) | 2023 | 2022 | 2021 | ||||||||||||||
| Net Income | $ | $ | $ | ||||||||||||||
Other Comprehensive Income (Loss), net of tax(a) | |||||||||||||||||
| Pension and OPEB adjustments | ( | ( | |||||||||||||||
| Net unrealized gains (losses) on cash flow hedges | ( | ||||||||||||||||
| Reclassification into earnings from cash flow hedges | ( | ||||||||||||||||
Net unrealized gains (losses) on fair value hedges | ( | — | |||||||||||||||
Unrealized gains (losses) on available-for-sale securities | ( | ( | |||||||||||||||
| Other Comprehensive Income (Loss), net of tax | ( | ||||||||||||||||
| Comprehensive Income | |||||||||||||||||
Add: Comprehensive (Income) Loss Attributable to Noncontrolling Interests | ( | ||||||||||||||||
Comprehensive Income Attributable to Duke Energy Corporation | |||||||||||||||||
Less: Preferred Dividends | |||||||||||||||||
Comprehensive Income Available to Duke Energy Corporation Common Stockholders | $ | $ | $ | ||||||||||||||
(a) Net of income tax expense of approximately $40 million and $52 million for the years ended December 31, 2023, and 2022, respectively, and income tax benefit of $17 million for the year ended December 31, 2021.
See Notes to Consolidated Financial Statements
78
| FINANCIAL STATEMENTS | |||||
DUKE ENERGY CORPORATION
CONSOLIDATED BALANCE SHEETS
| December 31, | |||||||||||
| (in millions) | 2023 | 2022 | |||||||||
| ASSETS | |||||||||||
| Current Assets | |||||||||||
| Cash and cash equivalents | $ | $ | |||||||||
Receivables (net of allowance for doubtful accounts of $ | |||||||||||
Receivables of VIEs (net of allowance for doubtful accounts of $ | |||||||||||
Inventory (includes $ | |||||||||||
Regulatory assets (includes $ | |||||||||||
| Assets held for sale | |||||||||||
Other (includes $ | |||||||||||
| Total current assets | |||||||||||
| Property, Plant and Equipment | |||||||||||
| Cost | |||||||||||
| Accumulated depreciation and amortization | ( | ( | |||||||||
| Facilities to be retired, net | |||||||||||
| Net property, plant and equipment | |||||||||||
| Other Noncurrent Assets | |||||||||||
| Goodwill | |||||||||||
Regulatory assets (includes $ | |||||||||||
| Nuclear decommissioning trust funds | |||||||||||
| Operating lease right-of-use assets, net | |||||||||||
| Investments in equity method unconsolidated affiliates | |||||||||||
| Assets held for sale | |||||||||||
Other (includes $ | |||||||||||
| Total other noncurrent assets | |||||||||||
| Total Assets | $ | $ | |||||||||
| LIABILITIES AND EQUITY | |||||||||||
| Current Liabilities | |||||||||||
Accounts payable (includes $ | $ | $ | |||||||||
| Notes payable and commercial paper | |||||||||||
| Taxes accrued | |||||||||||
| Interest accrued | |||||||||||
Current maturities of long-term debt (includes $ | |||||||||||
| Asset retirement obligations | |||||||||||
| Regulatory liabilities | |||||||||||
| Liabilities associated with assets held for sale | |||||||||||
| Other | |||||||||||
| Total current liabilities | |||||||||||
Long-Term Debt (includes $ | |||||||||||
| Other Noncurrent Liabilities | |||||||||||
| Deferred income taxes | |||||||||||
| Asset retirement obligations | |||||||||||
| Regulatory liabilities | |||||||||||
| Operating lease liabilities | |||||||||||
| Accrued pension and other post-retirement benefit costs | |||||||||||
| Investment tax credits | |||||||||||
| Liabilities associated with assets held for sale | |||||||||||
Other (includes $ | |||||||||||
| Total other noncurrent liabilities | |||||||||||
| Commitments and Contingencies | |||||||||||
| Equity | |||||||||||
Preferred stock, Series A, $ | |||||||||||
Preferred stock, Series B, $ | |||||||||||
Common stock, $ | |||||||||||
| Additional paid-in capital | |||||||||||
| Retained earnings | |||||||||||
| Accumulated other comprehensive loss | ( | ( | |||||||||
Total Duke Energy Corporation stockholders' equity | |||||||||||
| Noncontrolling interests | |||||||||||
Total equity | |||||||||||
| Total Liabilities and Equity | $ | $ | |||||||||
See Notes to Consolidated Financial Statements
79
| FINANCIAL STATEMENTS | |||||
DUKE ENERGY CORPORATION
CONSOLIDATED STATEMENTS OF CASH FLOWS
| Years Ended December 31, | |||||||||||||||||
| (in millions) | 2023 | 2022 | 2021 | ||||||||||||||
| CASH FLOWS FROM OPERATING ACTIVITIES | |||||||||||||||||
| Net income | $ | $ | $ | ||||||||||||||
| Adjustments to reconcile net income to net cash provided by operating activities: | |||||||||||||||||
| Depreciation, amortization and accretion (including amortization of nuclear fuel) | |||||||||||||||||
| Equity in (earnings) losses of unconsolidated affiliates | ( | ( | ( | ||||||||||||||
| Equity component of AFUDC | ( | ( | ( | ||||||||||||||
Losses on sales of Commercial Renewables Disposal Groups | |||||||||||||||||
Gains on sales of other assets | ( | ( | ( | ||||||||||||||
| Impairment of assets and other charges | |||||||||||||||||
| Deferred income taxes | ( | ||||||||||||||||
| Contributions to qualified pension plans | ( | ( | — | ||||||||||||||
| Payments for asset retirement obligations | ( | ( | ( | ||||||||||||||
| Provision for rate refunds | ( | ( | ( | ||||||||||||||
| (Increase) decrease in | |||||||||||||||||
| Net realized and unrealized mark-to-market and hedging transactions | ( | ||||||||||||||||
| Receivables | ( | ( | |||||||||||||||
| Inventory | ( | ( | ( | ||||||||||||||
Other current assets | ( | ( | ( | ||||||||||||||
| Increase (decrease) in | |||||||||||||||||
| Accounts payable | ( | ||||||||||||||||
| Taxes accrued | |||||||||||||||||
| Other current liabilities | ( | ( | ( | ||||||||||||||
Other assets | ( | ||||||||||||||||
| Other liabilities | |||||||||||||||||
| Net cash provided by operating activities | |||||||||||||||||
| CASH FLOWS FROM INVESTING ACTIVITIES | |||||||||||||||||
| Capital expenditures | ( | ( | ( | ||||||||||||||
| Contributions to equity method investments | ( | ( | ( | ||||||||||||||
| Return of investment capital | |||||||||||||||||
| Purchases of debt and equity securities | ( | ( | ( | ||||||||||||||
| Proceeds from sales and maturities of debt and equity securities | |||||||||||||||||
Proceeds from the sales of other assets | |||||||||||||||||
Proceeds from the sales of Commercial Renewables Disposal Groups, net of cash divested | |||||||||||||||||
| Disbursements to canceled equity method investments | — | — | ( | ||||||||||||||
| Other | ( | ( | ( | ||||||||||||||
| Net cash used in investing activities | ( | ( | ( | ||||||||||||||
| CASH FLOWS FROM FINANCING ACTIVITIES | |||||||||||||||||
| Proceeds from the: | |||||||||||||||||
| Issuance of long-term debt | |||||||||||||||||
| Issuance of common stock | |||||||||||||||||
| Payments for the redemption of long-term debt | ( | ( | ( | ||||||||||||||
| Proceeds from the issuance of short-term debt with original maturities greater than 90 days | |||||||||||||||||
| Payments for the redemption of short-term debt with original maturities greater than 90 days | ( | ( | ( | ||||||||||||||
| Notes payable and commercial paper | ( | ||||||||||||||||
| Contributions from noncontrolling interests | |||||||||||||||||
| Dividends paid | ( | ( | ( | ||||||||||||||
| Other | ( | ( | ( | ||||||||||||||
| Net cash provided by financing activities | |||||||||||||||||
Net (decrease) increase in cash, cash equivalents and restricted cash | ( | ( | |||||||||||||||
| Cash, cash equivalents and restricted cash at beginning of period | |||||||||||||||||
| Cash, cash equivalents and restricted cash at end of period | $ | $ | $ | ||||||||||||||
| Supplemental Disclosures: | |||||||||||||||||
| Cash paid for interest, net of amount capitalized | $ | $ | $ | ||||||||||||||
Cash paid for (received from) income taxes | ( | ( | |||||||||||||||
| Significant non-cash transactions: | |||||||||||||||||
| Accrued capital expenditures | |||||||||||||||||
See Notes to Consolidated Financial Statements
80
| FINANCIAL STATEMENTS | |||||
DUKE ENERGY CORPORATION
CONSOLIDATED STATEMENTS OF CHANGES IN EQUITY
| Duke Energy Corporation Stockholders' Accumulated Other Comprehensive Income (Loss) | ||||||||||||||||||||||||||||||||||||||||||||||||||||||||
| Net Unrealized | Total | |||||||||||||||||||||||||||||||||||||||||||||||||||||||
| Net Gains | Gains (Losses) | Duke Energy | ||||||||||||||||||||||||||||||||||||||||||||||||||||||
| Common | Additional | (Losses) | on Available- | Pension and | Corporation | |||||||||||||||||||||||||||||||||||||||||||||||||||
| Preferred | Stock | Common | Paid-in | Retained | on | for-Sale- | OPEB | Stockholders' | Noncontrolling | Total | ||||||||||||||||||||||||||||||||||||||||||||||
| (in millions) | Stock | Shares | Stock | Capital | Earnings | Hedges(d) | Securities | Adjustments | Equity | Interests | Equity | |||||||||||||||||||||||||||||||||||||||||||||
| Balance at December 31, 2020 | $ | $ | $ | $ | $ | ( | $ | $ | ( | $ | $ | $ | ||||||||||||||||||||||||||||||||||||||||||||
| Net income (loss) | — | — | — | — | — | — | — | ( | ||||||||||||||||||||||||||||||||||||||||||||||||
| Other comprehensive (loss) income | — | — | — | — | — | ( | ( | ( | ( | |||||||||||||||||||||||||||||||||||||||||||||||
| Common stock issuances, including dividend reinvestment and employee benefits | — | — | — | — | — | — | — | — | ||||||||||||||||||||||||||||||||||||||||||||||||
| Common stock dividends | — | — | — | — | ( | — | — | — | ( | — | ( | |||||||||||||||||||||||||||||||||||||||||||||
Sale of noncontrolling interest(b) | — | — | — | — | — | — | — | |||||||||||||||||||||||||||||||||||||||||||||||||
Contribution from noncontrolling interest(a) | — | — | — | — | — | — | — | — | — | |||||||||||||||||||||||||||||||||||||||||||||||
| Distributions to noncontrolling interest in subsidiaries | — | — | — | — | — | — | — | — | — | ( | ( | |||||||||||||||||||||||||||||||||||||||||||||
Other | — | — | — | ( | — | — | — | — | ( | ( | ||||||||||||||||||||||||||||||||||||||||||||||
| Balance at December 31, 2021 | $ | $ | $ | $ | $ | ( | $ | ( | $ | ( | $ | $ | $ | |||||||||||||||||||||||||||||||||||||||||||
| Net income (loss) | — | — | — | — | — | — | — | ( | ||||||||||||||||||||||||||||||||||||||||||||||||
Other comprehensive income (loss) | — | — | — | — | — | ( | ( | |||||||||||||||||||||||||||||||||||||||||||||||||
| Common stock issuances, including dividend reinvestment and employee benefits | — | — | — | — | — | — | — | |||||||||||||||||||||||||||||||||||||||||||||||||
| Common stock dividends | — | — | — | — | ( | — | — | — | ( | — | ( | |||||||||||||||||||||||||||||||||||||||||||||
Sale of noncontrolling interest(b) | — | — | — | — | — | — | — | |||||||||||||||||||||||||||||||||||||||||||||||||
Purchase of noncontrolling interest | — | — | — | ( | — | — | — | — | ( | ( | ||||||||||||||||||||||||||||||||||||||||||||||
Contribution from noncontrolling interest, net of transaction costs(a) | — | — | — | — | — | — | — | — | — | |||||||||||||||||||||||||||||||||||||||||||||||
| Distributions to noncontrolling interest in subsidiaries | — | — | — | — | — | — | — | — | — | ( | ( | |||||||||||||||||||||||||||||||||||||||||||||
| Other | — | — | — | — | — | — | ||||||||||||||||||||||||||||||||||||||||||||||||||
| Balance at December 31, 2022 | $ | $ | $ | $ | $ | ( | $ | ( | $ | ( | $ | $ | $ | |||||||||||||||||||||||||||||||||||||||||||
Net income | — | — | — | — | — | — | — | |||||||||||||||||||||||||||||||||||||||||||||||||
| Other comprehensive income (loss) | — | — | — | — | — | ( | — | |||||||||||||||||||||||||||||||||||||||||||||||||
| Common stock issuances, including dividend reinvestment and employee benefits | — | — | — | — | — | — | — | |||||||||||||||||||||||||||||||||||||||||||||||||
| Common stock dividends | — | — | — | — | ( | — | — | — | ( | — | ( | |||||||||||||||||||||||||||||||||||||||||||||
Sale of noncontrolling interest | — | — | — | ( | — | — | — | — | ( | ( | ||||||||||||||||||||||||||||||||||||||||||||||
Contribution from noncontrolling interest, net of transaction costs(a) | — | — | — | — | — | — | — | — | — | |||||||||||||||||||||||||||||||||||||||||||||||
| Distributions to noncontrolling interests in subsidiaries | — | — | — | — | — | — | — | — | — | ( | ( | |||||||||||||||||||||||||||||||||||||||||||||
Sale of Commercial Renewables Disposal Groups(c) | — | — | — | — | — | — | — | — | ( | ( | ||||||||||||||||||||||||||||||||||||||||||||||
| Other | — | — | — | ( | — | — | — | ( | ( | |||||||||||||||||||||||||||||||||||||||||||||||
| Balance at December 31, 2023 | $ | $ | $ | $ | $ | $ | ( | $ | ( | $ | $ | $ | ||||||||||||||||||||||||||||||||||||||||||||
(a) Relates to tax equity financing activity in the Commercial Renewables Disposal Groups.
(b) Relates primarily to the sale of a noncontrolling interest in Duke Energy Indiana. See Note 2 for additional information.
(c) See Note 2 for additional information.
(d) See Duke Energy Consolidated Statements of Comprehensive Income for detailed activity related to Cash Flow and Fair Value Hedges.
See Notes to Consolidated Financial Statements
81
| REPORTS | |||||
REPORT OF INDEPENDENT REGISTERED PUBLIC ACCOUNTING FIRM
To the shareholder and the Board of Directors of Duke Energy Carolinas, LLC
Opinion on the Financial Statements
We have audited the accompanying consolidated balance sheets of Duke Energy Carolinas, LLC and subsidiaries (the "Company") as of December 31, 2023 and 2022, the related consolidated statements of operations and comprehensive income, changes in equity, and cash flows, for each of the three years in the period ended December 31, 2023, and the related notes (collectively referred to as the "financial statements"). In our opinion, the financial statements present fairly, in all material respects, the financial position of the Company as of December 31, 2023 and 2022, and the results of its operations and its cash flows for each of the three years in the period ended December 31, 2023, in conformity with accounting principles generally accepted in the United States of America.
Basis for Opinion
These financial statements are the responsibility of the Company's management. Our responsibility is to express an opinion on the Company's financial statements based on our audits. We are a public accounting firm registered with the Public Company Accounting Oversight Board (United States) (PCAOB) and are required to be independent with respect to the Company in accordance with the U.S. federal securities laws and the applicable rules and regulations of the Securities and Exchange Commission and the PCAOB.
We conducted our audits in accordance with the standards of the PCAOB. Those standards require that we plan and perform the audit to obtain reasonable assurance about whether the financial statements are free of material misstatement, whether due to error or fraud. The Company is not required to have, nor were we engaged to perform, an audit of its internal control over financial reporting. As part of our audits, we are required to obtain an understanding of internal control over financial reporting but not for the purpose of expressing an opinion on the effectiveness of the Company’s internal control over financial reporting. Accordingly, we express no such opinion.
Our audits included performing procedures to assess the risks of material misstatement of the financial statements, whether due to error or fraud, and performing procedures that respond to those risks. Such procedures included examining, on a test basis, evidence regarding the amounts and disclosures in the financial statements. Our audits also included evaluating the accounting principles used and significant estimates made by management, as well as evaluating the overall presentation of the financial statements. We believe that our audits provide a reasonable basis for our opinion.
Critical Audit Matters
The critical audit matters communicated below are matters arising from the current-period audit of the financial statements that were communicated or required to be communicated to the audit committee and that (1) relate to accounts or disclosures that are material to the financial statements and (2) involved our especially challenging, subjective, or complex judgments. The communication of critical audit matters does not alter in any way our opinion on the financial statements, taken as a whole, and we are not, by communicating the critical audit matters below, providing a separate opinion on the critical audit matters or on the accounts or disclosures to which they relate.
Regulatory Matters – Impact of Rate Regulation on the Financial Statements – Refer to Notes 1, 4 and 10 to the financial statements.
Critical Audit Matter Description
The Company is subject to rate regulation by the North Carolina Utilities Commission and by the South Carolina Public Service Commission (collectively the “Commissions”), which have jurisdiction with respect to the electric rates of the Company. Management has determined it meets the criteria for the application of regulated operations accounting in preparing its financial statements under accounting principles generally accepted in the United States of America. Judgment can be required to determine if otherwise recognizable incurred costs qualify to be presented as a regulatory asset and deferred because such costs are probable of future recovery in customer rates. As discussed in Note 4, regulatory proceedings in recent years have focused on the recoverability of fuel costs and asset retirement obligations specific to coal ash. As a result, assessing the potential outcomes of future regulatory orders requires management judgment.
We identified the impact of rate regulation related to regulatory assets as a critical audit matter due to the judgments made by management, including assumptions regarding the outcome of future decisions by the Commissions to support its assertions on the likelihood of future recovery for deferred costs. Given that management’s accounting judgments are based on assumptions about the outcome of future decisions by the Commissions, auditing these judgments required specialized knowledge of accounting for rate regulation and the ratemaking process due to its inherent complexities as it relates to regulatory assets.
How the Critical Audit Matter Was Addressed in the Audit
Our audit procedures related to the recovery of regulatory assets included the following, among others:
•We tested the effectiveness of management’s controls over the evaluation of the likelihood of the recovery in future rates and the monitoring and evaluation of regulatory developments that may affect the likelihood of recovering costs in future rates.
•We evaluated the Company’s disclosures related to the impacts of rate regulation, including the balances recorded and regulatory developments.
•We read relevant regulatory orders issued by the Commissions, and other publicly available information to assess the likelihood of recovery in future rates based on precedents of the Commissions’ treatment of similar costs under similar circumstances. We evaluated the external information and compared it to management’s recorded balances for completeness.
•We evaluated management’s judgments regarding the recoverability of regulatory asset balances by performing the following:
–We inquired of management regarding changes in regulatory orders and regulatory asset balances during the year.
82
| REPORTS | |||||
–We evaluated the reasonableness of such changes based on our knowledge of commission-approved amortization, expected incurred costs, and recently approved regulatory orders, as applicable.
–We utilized trend analyses to evaluate the historical consistency of regulatory asset balances.
–We compared the recorded regulatory asset balance to an independently developed expectation of the corresponding balance.
•We performed audit procedures on the incurred asset retirement obligations requested for recovery to confirm their completeness and accuracy.
•We obtained an analysis from management and letters from internal legal counsel for asset retirement obligations specific to coal ash costs, regarding probability of recovery for deferred costs not yet addressed in a regulatory order to assess management’s assertion that amounts are probable of recovery.
•We obtained representation from management asserting that regulatory assets recorded in the financial statements are probable of recovery.
•We performed substantive analytical procedures on the recoverability of deferred fuel costs.
Asset Retirement Obligations – Nuclear Decommissioning Cash Flow Revisions – Refer to Notes 4 and 10 to the financial statements.
Critical Audit Matter Description
The Company owns and operates nuclear facilities and records asset retirement obligations for their eventual decommissioning. On an annual basis, management performs an assessment for any indicators that would suggest a change in decommissioning cost estimates may be necessary. Judgment is required to calculate decommissioning estimates, which are determined through site-specific, third-party cost studies and are based on discounted cash flows, regulatory, legal, and legislative decisions, selection of discount rates and cost escalation rates, among other factors.
We identified the revisions in estimates of cash flows associated with nuclear asset retirement obligations as a critical audit matter because of the estimates and assumptions made by management and management’s specialist in determining the recorded asset retirement obligations. This required a high degree of auditor judgment, and for certain assumptions, the need to involve our environmental and fair value specialists, when performing audit procedures related to the revisions in estimates of cash flows associated with nuclear asset retirement obligations.
How the Critical Audit Matter Was Addressed in the Audit
Our audit procedures related to the revisions in estimates of cash flows associated with nuclear asset retirement obligations included the following, among others:
•We tested the effectiveness of management’s controls over the evaluation of nuclear asset retirement obligations, including those over management’s assessment of the results of the site-specific cost study, as well as the evaluation of economic inputs.
•We tested the mathematical accuracy of management’s nuclear asset retirement obligation calculations.
•We made inquiries and inspected opinions of internal counsel regarding the status of relevant assumptions.
•With the assistance of professionals in our firm with the appropriate expertise, we inspected and evaluated the reasonableness of the results of the decommissioning study, as well as the impacts of any economic inputs on the calculation of revisions to cash flow estimates.
•We evaluated the Company’s disclosures related to the impacts of the nuclear asset retirement obligation.
•We obtained representation from management asserting that the asset retirement obligations recorded in the financial statements represent management’s best estimate.
/s/ Deloitte & Touche LLP
Charlotte, North Carolina
February 23, 2024
We have served as the Company's auditor since 1947.
83
| FINANCIAL STATEMENTS | |||||
DUKE ENERGY CAROLINAS, LLC
CONSOLIDATED STATEMENTS OF OPERATIONS AND COMPREHENSIVE INCOME
| Years Ended December 31, | |||||||||||||||||
| (in millions) | 2023 | 2022 | 2021 | ||||||||||||||
| Operating Revenues | $ | $ | $ | ||||||||||||||
| Operating Expenses | |||||||||||||||||
| Fuel used in electric generation and purchased power | |||||||||||||||||
| Operation, maintenance and other | |||||||||||||||||
| Depreciation and amortization | |||||||||||||||||
| Property and other taxes | |||||||||||||||||
| Impairment of assets and other charges | |||||||||||||||||
| Total operating expenses | |||||||||||||||||
| Gains on Sales of Other Assets and Other, net | |||||||||||||||||
| Operating Income | |||||||||||||||||
| Other Income and Expenses, net | |||||||||||||||||
| Interest Expense | |||||||||||||||||
| Income Before Income Taxes | |||||||||||||||||
| Income Tax Expense | |||||||||||||||||
| Net Income | $ | $ | $ | ||||||||||||||
| Other Comprehensive Income, net of tax | |||||||||||||||||
| Net unrealized gain on cash flow hedges | — | — | |||||||||||||||
| Other Comprehensive Income, net of tax | — | — | |||||||||||||||
| Comprehensive Income | $ | $ | $ | ||||||||||||||
See Notes to Consolidated Financial Statements
84
| FINANCIAL STATEMENTS | |||||
DUKE ENERGY CAROLINAS, LLC
CONSOLIDATED BALANCE SHEETS
| December 31, | ||||||||||||||
| (in millions) | 2023 | 2022 | ||||||||||||
| ASSETS | ||||||||||||||
| Current Assets | ||||||||||||||
| Cash and cash equivalents | $ | $ | ||||||||||||
Receivables (net of allowance for doubtful accounts of $ | ||||||||||||||
Receivables of VIEs (net of allowance for doubtful accounts of $ | ||||||||||||||
| Receivables from affiliated companies | ||||||||||||||
| Inventory | ||||||||||||||
Regulatory assets (includes $ | ||||||||||||||
Other (includes $ | ||||||||||||||
| Total current assets | ||||||||||||||
| Property, Plant and Equipment | ||||||||||||||
| Cost | ||||||||||||||
| Accumulated depreciation and amortization | ( | ( | ||||||||||||
| Net property, plant and equipment | ||||||||||||||
| Other Noncurrent Assets | ||||||||||||||
Regulatory assets (includes $ | ||||||||||||||
| Nuclear decommissioning trust funds | ||||||||||||||
| Operating lease right-of-use assets, net | ||||||||||||||
| Other | ||||||||||||||
| Total other noncurrent assets | ||||||||||||||
| Total Assets | $ | $ | ||||||||||||
| LIABILITIES AND EQUITY | ||||||||||||||
| Current Liabilities | ||||||||||||||
| Accounts payable | $ | $ | ||||||||||||
| Accounts payable to affiliated companies | ||||||||||||||
| Notes payable to affiliated companies | ||||||||||||||
| Taxes accrued | ||||||||||||||
| Interest accrued | ||||||||||||||
Current maturities of long-term debt (includes $ | ||||||||||||||
| Asset retirement obligations | ||||||||||||||
| Regulatory liabilities | ||||||||||||||
| Other | ||||||||||||||
| Total current liabilities | ||||||||||||||
Long-Term Debt (includes $ | ||||||||||||||
| Long-Term Debt Payable to Affiliated Companies | ||||||||||||||
| Other Noncurrent Liabilities | ||||||||||||||
| Deferred income taxes | ||||||||||||||
| Asset retirement obligations | ||||||||||||||
| Regulatory liabilities | ||||||||||||||
| Operating lease liabilities | ||||||||||||||
| Accrued pension and other post-retirement benefit costs | ||||||||||||||
| Investment tax credits | ||||||||||||||
| Other | ||||||||||||||
| Total other noncurrent liabilities | ||||||||||||||
| Commitments and Contingencies | ||||||||||||||
| Equity | ||||||||||||||
| Member's equity | ||||||||||||||
| Accumulated other comprehensive loss | ( | ( | ||||||||||||
| Total equity | ||||||||||||||
| Total Liabilities and Equity | $ | $ | ||||||||||||
See Notes to Consolidated Financial Statements
85
| FINANCIAL STATEMENTS | |||||
DUKE ENERGY CAROLINAS, LLC
CONSOLIDATED STATEMENTS OF CASH FLOWS
| Years Ended December 31, | |||||||||||||||||
| (in millions) | 2023 | 2022 | 2021 | ||||||||||||||
| CASH FLOWS FROM OPERATING ACTIVITIES | |||||||||||||||||
| Net income | $ | $ | $ | ||||||||||||||
| Adjustments to reconcile net income to net cash provided by operating activities: | |||||||||||||||||
| Depreciation and amortization (including amortization of nuclear fuel) | |||||||||||||||||
| Equity component of AFUDC | ( | ( | ( | ||||||||||||||
Gains on sales of other assets | ( | ( | ( | ||||||||||||||
| Impairment of assets and other charges | |||||||||||||||||
| Deferred income taxes | ( | ( | |||||||||||||||
| Contributions to qualified pension plans | ( | ( | — | ||||||||||||||
| Payments for asset retirement obligations | ( | ( | ( | ||||||||||||||
| Provision for rate refunds | ( | ( | ( | ||||||||||||||
| (Increase) decrease in | |||||||||||||||||
| Receivables | ( | ( | |||||||||||||||
| Receivables from affiliated companies | ( | ( | |||||||||||||||
| Inventory | ( | ( | ( | ||||||||||||||
Other current assets | ( | ( | ( | ||||||||||||||
| Increase (decrease) in | |||||||||||||||||
| Accounts payable | ( | ||||||||||||||||
| Accounts payable to affiliated companies | ( | ( | |||||||||||||||
| Taxes accrued | ( | ||||||||||||||||
| Other current liabilities | ( | ( | |||||||||||||||
Other assets | ( | ||||||||||||||||
| Other liabilities | ( | ||||||||||||||||
| Net cash provided by operating activities | |||||||||||||||||
| CASH FLOWS FROM INVESTING ACTIVITIES | |||||||||||||||||
| Capital expenditures | ( | ( | ( | ||||||||||||||
| Purchases of debt and equity securities | ( | ( | ( | ||||||||||||||
| Proceeds from sales and maturities of debt and equity securities | |||||||||||||||||
| Net proceeds from the sales of other assets | — | ||||||||||||||||
| Other | ( | ( | ( | ||||||||||||||
| Net cash used in investing activities | ( | ( | ( | ||||||||||||||
| CASH FLOWS FROM FINANCING ACTIVITIES | |||||||||||||||||
| Proceeds from the issuance of long-term debt | |||||||||||||||||
| Payments for the redemption of long-term debt | ( | ( | ( | ||||||||||||||
| Notes payable to affiliated companies | ( | ( | |||||||||||||||
| Distributions to parent | — | ( | ( | ||||||||||||||
| Other | ( | ( | ( | ||||||||||||||
| Net cash provided by financing activities | |||||||||||||||||
Net (decrease) increase in cash, cash equivalents and restricted cash | ( | ( | |||||||||||||||
| Cash, cash equivalents and restricted cash at beginning of period | |||||||||||||||||
| Cash, cash equivalents and restricted cash at end of period | $ | $ | $ | ||||||||||||||
| Supplemental Disclosures: | |||||||||||||||||
| Cash paid for interest, net of amount capitalized | $ | $ | $ | ||||||||||||||
Cash paid for (received from) income taxes | ( | ||||||||||||||||
| Significant non-cash transactions: | |||||||||||||||||
| Accrued capital expenditures | |||||||||||||||||
See Notes to Consolidated Financial Statements
86
| FINANCIAL STATEMENTS | |||||
DUKE ENERGY CAROLINAS, LLC
CONSOLIDATED STATEMENTS OF CHANGES IN EQUITY
| Accumulated Other | |||||||||||||||||
| Comprehensive | |||||||||||||||||
| Income (Loss) | |||||||||||||||||
| Net Gains | |||||||||||||||||
| (Losses) on | |||||||||||||||||
| Member's | Cash Flow | Total | |||||||||||||||
| (in millions) | Equity | Hedges | Equity | ||||||||||||||
| Balance at December 31, 2020 | $ | $ | ( | $ | |||||||||||||
| Net income | — | ||||||||||||||||
| Other comprehensive income | — | ||||||||||||||||
| Distributions to parent | ( | — | ( | ||||||||||||||
| Balance at December 31, 2021 | $ | $ | ( | $ | |||||||||||||
| Net income | — | ||||||||||||||||
| Distributions to parent | ( | — | ( | ||||||||||||||
Other | — | ||||||||||||||||
| Balance at December 31, 2022 | $ | $ | ( | $ | |||||||||||||
| Net income | — | ||||||||||||||||
| Other | ( | — | ( | ||||||||||||||
| Balance at December 31, 2023 | $ | $ | ( | $ | |||||||||||||
See Notes to Consolidated Financial Statements
87
| REPORTS | |||||
REPORT OF INDEPENDENT REGISTERED PUBLIC ACCOUNTING FIRM
To the shareholder and the Board of Directors of Progress Energy, Inc.
Opinion on the Financial Statements
We have audited the accompanying consolidated balance sheets of Progress Energy, Inc. and subsidiaries (the "Company") as of December 31, 2023 and 2022, the related consolidated statements of operations and comprehensive income, changes in equity, and cash flows, for each of the three years in the period ended December 31, 2023, and the related notes (collectively referred to as the "financial statements"). In our opinion, the financial statements present fairly, in all material respects, the financial position of the Company as of December 31, 2023 and 2022, and the results of its operations and its cash flows for each of the three years in the period ended December 31, 2023, in conformity with accounting principles generally accepted in the United States of America.
Basis for Opinion
These financial statements are the responsibility of the Company's management. Our responsibility is to express an opinion on the Company's financial statements based on our audits. We are a public accounting firm registered with the Public Company Accounting Oversight Board (United States) (PCAOB) and are required to be independent with respect to the Company in accordance with the U.S. federal securities laws and the applicable rules and regulations of the Securities and Exchange Commission and the PCAOB.
We conducted our audits in accordance with the standards of the PCAOB. Those standards require that we plan and perform the audit to obtain reasonable assurance about whether the financial statements are free of material misstatement, whether due to error or fraud. The Company is not required to have, nor were we engaged to perform, an audit of its internal control over financial reporting. As part of our audits, we are required to obtain an understanding of internal control over financial reporting but not for the purpose of expressing an opinion on the effectiveness of the Company’s internal control over financial reporting. Accordingly, we express no such opinion.
Our audits included performing procedures to assess the risks of material misstatement of the financial statements, whether due to error or fraud, and performing procedures that respond to those risks. Such procedures included examining, on a test basis, evidence regarding the amounts and disclosures in the financial statements. Our audits also included evaluating the accounting principles used and significant estimates made by management, as well as evaluating the overall presentation of the financial statements. We believe that our audits provide a reasonable basis for our opinion.
Critical Audit Matters
The critical audit matters communicated below are matters arising from the current-period audit of the financial statements that were communicated or required to be communicated to the audit committee and that (1) relate to accounts or disclosures that are material to the financial statements and (2) involved our especially challenging, subjective, or complex judgments. The communication of critical audit matters does not alter in any way our opinion on the financial statements, taken as a whole, and we are not, by communicating the critical audit matters below, providing a separate opinion on the critical audit matters or on the accounts or disclosures to which they relate.
Regulatory Matters – Impact of Rate Regulation on the Financial Statements – Refer to Notes 1, 4 and 10 to the financial statements.
Critical Audit Matter Description
The Company is subject to rate regulation by the North Carolina Utilities Commission, South Carolina Public Service Commission and Florida Public Service Commission (collectively the “Commissions”), which have jurisdiction with respect to the electric rates of the Company. Management has determined it meets the criteria for the application of regulated operations accounting in preparing its financial statements under accounting principles generally accepted in the United States of America. Judgment can be required to determine if otherwise recognizable incurred costs qualify to be presented as a regulatory asset and deferred because such costs are probable of future recovery in customer rates. As discussed in Note 4, regulatory proceedings in recent years have focused on the recoverability of storm costs, fuel costs, and asset retirement obligations specific to coal ash. As a result, assessing the potential outcomes of future regulatory orders requires management judgment.
We identified the impact of rate regulation related to regulatory assets as a critical audit matter due to the judgments made by management, including assumptions regarding the outcome of future decisions by the Commissions to support its assertions on the likelihood of future recovery for deferred costs. Given that management’s accounting judgments are based on assumptions about the outcome of future decisions by the Commissions, auditing these judgments required specialized knowledge of accounting for rate regulation and the ratemaking process due to its inherent complexities as it relates to regulatory assets.
How the Critical Audit Matter Was Addressed in the Audit
Our audit procedures related to the recovery of regulatory assets included the following, among others:
•We tested the effectiveness of management’s controls over the evaluation of the likelihood of the recovery in future rates and the monitoring and evaluation of regulatory developments that may affect the likelihood of recovering costs in future rates.
•We evaluated the Company’s disclosures related to the impacts of rate regulation, including the balances recorded and regulatory developments.
•We read relevant regulatory orders issued by the Commissions, and other publicly available information to assess the likelihood of recovery in future rates based on precedents of the Commissions’ treatment of similar costs under similar circumstances. We evaluated the external information and compared it to management’s recorded balances for completeness.
88
| REPORTS | |||||
•We evaluated management’s judgments regarding the recoverability of regulatory asset balances by performing the following:
–We inquired of management regarding changes in regulatory orders and regulatory asset balances during the year.
–We evaluated the reasonableness of such changes based on our knowledge of commission-approved amortization, expected incurred costs, and recently approved regulatory orders, as applicable.
–We utilized trend analyses to evaluate the historical consistency of regulatory asset balances.
–We compared the recorded regulatory asset balance to an independently developed expectation of the corresponding balance.
•We performed audit procedures on the incurred asset retirement obligations requested for recovery to confirm their completeness and accuracy.
•We obtained an analysis from management and letters from internal legal counsel for asset retirement obligations specific to coal ash costs, regarding probability of recovery for deferred costs not yet addressed in a regulatory order to assess management’s assertion that amounts are probable of recovery.
•We obtained representation from management asserting that regulatory assets recorded in the financial statements are probable of recovery.
•We performed substantive analytical procedures on the recoverability of deferred fuel costs and detail testing procedures on the recoverability of deferred storm costs.
Asset Retirement Obligations – Nuclear Decommissioning Cash Flow Revisions – Refer to Notes 4 and 10 to the financial statements.
Critical Audit Matter Description
The Company owns and operates nuclear facilities and records asset retirement obligations for their eventual decommissioning. On an annual basis, management performs an assessment for any indicators that would suggest a change in decommissioning cost estimates may be necessary. Judgment is required to calculate decommissioning estimates, which are determined through site-specific, third-party cost studies and are based on discounted cash flows, regulatory, legal, and legislative decisions, selection of discount rates and cost escalation rates, among other factors.
We identified the revisions in estimates of cash flows associated with nuclear asset retirement obligations as a critical audit matter because of the estimates and assumptions made by management in determining the recorded asset retirement obligations. This required a high degree of auditor judgment, and for certain assumptions, the need to involve our fair value specialists, when performing audit procedures related to the revisions in estimates of cash flows associated with nuclear asset retirement obligations.
How the Critical Audit Matter Was Addressed in the Audit
Our audit procedures related to the revisions in estimates of cash flows associated with nuclear asset retirement obligations included the following, among others:
•We tested the effectiveness of management’s controls over the evaluation of nuclear asset retirement obligations, including those over management’s assessment of the economic inputs.
•We tested the mathematical accuracy of management’s nuclear asset retirement obligation calculations.
•We made inquiries and inspected opinions of internal counsel regarding the status of relevant assumptions.
•With the assistance of professionals in our firm with the appropriate expertise, we inspected and evaluated the reasonableness of the impacts of any economic inputs on the calculation of revisions to cash flow estimates.
•We evaluated the Company’s disclosures related to the impacts of the nuclear asset retirement obligation.
•We obtained representation from management asserting that the asset retirement obligations recorded in the financial statements represent management’s best estimate.
/s/ Deloitte & Touche LLP
Charlotte, North Carolina
February 23, 2024
We have served as the Company's auditor since 1930.
89
| FINANCIAL STATEMENTS | |||||
PROGRESS ENERGY, INC.
CONSOLIDATED STATEMENTS OF OPERATIONS AND COMPREHENSIVE INCOME
| Years Ended December 31, | |||||||||||||||||
| (in millions) | 2023 | 2022 | 2021 | ||||||||||||||
| Operating Revenues | $ | $ | $ | ||||||||||||||
| Operating Expenses | |||||||||||||||||
| Fuel used in electric generation and purchased power | |||||||||||||||||
| Operation, maintenance and other | |||||||||||||||||
| Depreciation and amortization | |||||||||||||||||
| Property and other taxes | |||||||||||||||||
| Impairment of assets and other charges | |||||||||||||||||
| Total operating expenses | |||||||||||||||||
Gains on Sales of Other Assets and Other, net | |||||||||||||||||
| Operating Income | |||||||||||||||||
| Other Income and Expenses, net | |||||||||||||||||
| Interest Expense | |||||||||||||||||
Income Before Income Taxes | |||||||||||||||||
Income Tax Expense | |||||||||||||||||
| Net Income | |||||||||||||||||
| Less: Net Income Attributable to Noncontrolling Interests | — | — | |||||||||||||||
| Net Income Attributable to Parent | $ | $ | $ | ||||||||||||||
| Net Income | $ | $ | $ | ||||||||||||||
| Other Comprehensive Income, net of tax | |||||||||||||||||
| Pension and OPEB adjustments | ( | ||||||||||||||||
| Net unrealized gain on cash flow hedges | |||||||||||||||||
Unrealized gains (losses) on available-for-sale securities | ( | — | |||||||||||||||
| Other Comprehensive Income, net of tax | |||||||||||||||||
| Comprehensive Income | |||||||||||||||||
| Less: Comprehensive Income Attributable to Noncontrolling Interests | — | — | |||||||||||||||
| Comprehensive Income Attributable to Parent | $ | $ | $ | ||||||||||||||
See Notes to Consolidated Financial Statements
90
| FINANCIAL STATEMENTS | |||||
PROGRESS ENERGY, INC.
CONSOLIDATED BALANCE SHEETS
| December 31, | |||||||||||
| (in millions) | 2023 | 2022 | |||||||||
| ASSETS | |||||||||||
| Current Assets | |||||||||||
| Cash and cash equivalents | $ | $ | |||||||||
Receivables (net of allowance for doubtful accounts of $ | |||||||||||
Receivables of VIEs (net of allowance for doubtful accounts of $ | |||||||||||
| Receivables from affiliated companies | |||||||||||
Inventory (includes $ | |||||||||||
Regulatory assets (includes $ | |||||||||||
Other (includes $ | |||||||||||
| Total current assets | |||||||||||
| Property, Plant and Equipment | |||||||||||
| Cost | |||||||||||
| Accumulated depreciation and amortization | ( | ( | |||||||||
| Net property, plant and equipment | |||||||||||
| Other Noncurrent Assets | |||||||||||
| Goodwill | |||||||||||
Regulatory assets (includes $ | |||||||||||
| Nuclear decommissioning trust funds | |||||||||||
| Operating lease right-of-use assets, net | |||||||||||
| Other | |||||||||||
| Total other noncurrent assets | |||||||||||
| Total Assets | $ | $ | |||||||||
| LIABILITIES AND EQUITY | |||||||||||
| Current Liabilities | |||||||||||
Accounts payable (includes $ | $ | $ | |||||||||
| Accounts payable to affiliated companies | |||||||||||
| Notes payable to affiliated companies | |||||||||||
| Taxes accrued | |||||||||||
| Interest accrued | |||||||||||
Current maturities of long-term debt (includes $ | |||||||||||
| Asset retirement obligations | |||||||||||
| Regulatory liabilities | |||||||||||
| Other | |||||||||||
| Total current liabilities | |||||||||||
Long-Term Debt (includes $ | |||||||||||
| Long-Term Debt Payable to Affiliated Companies | |||||||||||
| Other Noncurrent Liabilities | |||||||||||
| Deferred income taxes | |||||||||||
| Asset retirement obligations | |||||||||||
| Regulatory liabilities | |||||||||||
| Operating lease liabilities | |||||||||||
| Accrued pension and other post-retirement benefit costs | |||||||||||
| Investment tax credits | |||||||||||
Other (includes $ | |||||||||||
| Total other noncurrent liabilities | |||||||||||
| Commitments and Contingencies | |||||||||||
| Equity | |||||||||||
Common stock, $ | — | — | |||||||||
| Additional paid-in capital | |||||||||||
| Retained earnings | |||||||||||
| Accumulated other comprehensive loss | ( | ( | |||||||||
| Total equity | |||||||||||
| Total Liabilities and Equity | $ | $ | |||||||||
See Notes to Consolidated Financial Statements
91
| FINANCIAL STATEMENTS | |||||
PROGRESS ENERGY, INC.
CONSOLIDATED STATEMENTS OF CASH FLOWS
| Years Ended December 31, | |||||||||||||||||
| (in millions) | 2023 | 2022 | 2021 | ||||||||||||||
| CASH FLOWS FROM OPERATING ACTIVITIES | |||||||||||||||||
| Net income | $ | $ | $ | ||||||||||||||
| Adjustments to reconcile net income to net cash provided by operating activities: | |||||||||||||||||
| Depreciation, amortization and accretion (including amortization of nuclear fuel) | |||||||||||||||||
| Equity component of AFUDC | ( | ( | ( | ||||||||||||||
Gains on sales of other assets | ( | ( | ( | ||||||||||||||
| Impairment of assets and other charges | |||||||||||||||||
| Deferred income taxes | ( | ||||||||||||||||
| Contributions to qualified pension plans | ( | ( | — | ||||||||||||||
| Payments for asset retirement obligations | ( | ( | ( | ||||||||||||||
| Provision for rate refunds | ( | ( | ( | ||||||||||||||
| (Increase) decrease in | |||||||||||||||||
| Net realized and unrealized mark-to-market and hedging transactions | — | — | |||||||||||||||
| Receivables | ( | ( | |||||||||||||||
| Receivables from affiliated companies | ( | ||||||||||||||||
| Inventory | ( | ( | ( | ||||||||||||||
Other current assets | ( | ( | |||||||||||||||
| Increase (decrease) in | |||||||||||||||||
| Accounts payable | ( | ||||||||||||||||
| Accounts payable to affiliated companies | ( | ||||||||||||||||
| Taxes accrued | |||||||||||||||||
| Other current liabilities | ( | ||||||||||||||||
Other assets | ( | ( | |||||||||||||||
| Other liabilities | ( | ||||||||||||||||
| Net cash provided by operating activities | |||||||||||||||||
| CASH FLOWS FROM INVESTING ACTIVITIES | |||||||||||||||||
| Capital expenditures | ( | ( | ( | ||||||||||||||
| Purchases of debt and equity securities | ( | ( | ( | ||||||||||||||
| Proceeds from sales and maturities of debt and equity securities | |||||||||||||||||
| Other | ( | ( | ( | ||||||||||||||
| Net cash used in investing activities | ( | ( | ( | ||||||||||||||
| CASH FLOWS FROM FINANCING ACTIVITIES | |||||||||||||||||
| Proceeds from the issuance of long-term debt | |||||||||||||||||
| Payments for the redemption of long-term debt | ( | ( | ( | ||||||||||||||
| Notes payable to affiliated companies | ( | ||||||||||||||||
| Dividends to parent | ( | ( | ( | ||||||||||||||
| Other | ( | ( | ( | ||||||||||||||
| Net cash provided by financing activities | |||||||||||||||||
Net (decrease) increase in cash, cash equivalents and restricted cash | ( | ( | |||||||||||||||
| Cash, cash equivalents and restricted cash at beginning of period | |||||||||||||||||
| Cash, cash equivalents and restricted cash at end of period | $ | $ | $ | ||||||||||||||
| Supplemental Disclosures: | |||||||||||||||||
| Cash paid for interest, net of amount capitalized | $ | $ | $ | ||||||||||||||
| Cash paid for income taxes | |||||||||||||||||
| Significant non-cash transactions: | |||||||||||||||||
| Accrued capital expenditures | |||||||||||||||||
See Notes to Consolidated Financial Statements
92
| FINANCIAL STATEMENTS | |||||
PROGRESS ENERGY, INC.
CONSOLIDATED STATEMENTS OF CHANGES IN EQUITY
| Accumulated Other Comprehensive Income (Loss) | |||||||||||||||||||||||||||||||||||||||||||||||
| Net Gains | Net Unrealized | Total Progress | |||||||||||||||||||||||||||||||||||||||||||||
| Additional | (Losses) on | Gains (Losses) | Pension and | Energy, Inc. | |||||||||||||||||||||||||||||||||||||||||||
| Paid-in | Retained | Cash Flow | on Available-for- | OPEB | Stockholder's | Noncontrolling | Total | ||||||||||||||||||||||||||||||||||||||||
| (in millions) | Capital | Earnings | Hedges | Sale Securities | Adjustments | Equity | Interests | Equity | |||||||||||||||||||||||||||||||||||||||
| Balance at December 31, 2020 | $ | $ | $ | ( | $ | ( | $ | ( | $ | $ | $ | ||||||||||||||||||||||||||||||||||||
| Net income | — | — | — | — | |||||||||||||||||||||||||||||||||||||||||||
Other comprehensive income | — | — | — | — | |||||||||||||||||||||||||||||||||||||||||||
| Distributions to noncontrolling interests | — | — | — | — | — | — | ( | ( | |||||||||||||||||||||||||||||||||||||||
| Dividends to parent | — | ( | — | — | — | ( | — | ( | |||||||||||||||||||||||||||||||||||||||
| Other | — | — | — | — | ( | ||||||||||||||||||||||||||||||||||||||||||
| Balance at December 31, 2021 | $ | $ | $ | ( | $ | ( | $ | ( | $ | $ | $ | ||||||||||||||||||||||||||||||||||||
| Net income | — | — | — | — | — | ||||||||||||||||||||||||||||||||||||||||||
Other comprehensive income (loss) | — | — | ( | — | — | ||||||||||||||||||||||||||||||||||||||||||
| Distributions to noncontrolling interests | — | — | — | — | — | — | ( | ( | |||||||||||||||||||||||||||||||||||||||
| Dividends to parent | ( | ( | — | — | — | ( | — | ( | |||||||||||||||||||||||||||||||||||||||
| Equitization of certain notes payable to affiliates | — | — | — | — | — | ||||||||||||||||||||||||||||||||||||||||||
Purchase of a noncontrolling interest | ( | — | — | — | — | ( | ( | ||||||||||||||||||||||||||||||||||||||||
| Other | — | — | — | — | — | ||||||||||||||||||||||||||||||||||||||||||
| Balance at December 31, 2022 | $ | $ | $ | ( | $ | ( | $ | ( | $ | $ | $ | ||||||||||||||||||||||||||||||||||||
| Net income | — | — | — | — | — | ||||||||||||||||||||||||||||||||||||||||||
Other comprehensive income | — | — | — | ( | — | ||||||||||||||||||||||||||||||||||||||||||
| Dividends to parent | — | ( | — | — | — | ( | — | ( | |||||||||||||||||||||||||||||||||||||||
| Other | ( | ( | — | — | — | ( | — | ( | |||||||||||||||||||||||||||||||||||||||
| Balance at December 31, 2023 | $ | $ | $ | ( | $ | ( | $ | ( | $ | $ | $ | ||||||||||||||||||||||||||||||||||||
See Notes to Consolidated Financial Statements
93
| REPORTS | |||||
REPORT OF INDEPENDENT REGISTERED PUBLIC ACCOUNTING FIRM
To the shareholder and the Board of Directors of Duke Energy Progress, LLC
Opinion on the Financial Statements
We have audited the accompanying consolidated balance sheets of Duke Energy Progress, LLC and subsidiaries (the "Company") as of December 31, 2023 and 2022, the related consolidated statements of operations and comprehensive income, changes in equity, and cash flows, for each of the three years in the period ended December 31, 2023, and the related notes (collectively referred to as the "financial statements"). In our opinion, the financial statements present fairly, in all material respects, the financial position of the Company as of December 31, 2023 and 2022, and the results of its operations and its cash flows for each of the three years in the period ended December 31, 2023, in conformity with accounting principles generally accepted in the United States of America.
Basis for Opinion
These financial statements are the responsibility of the Company's management. Our responsibility is to express an opinion on the Company's financial statements based on our audits. We are a public accounting firm registered with the Public Company Accounting Oversight Board (United States) (PCAOB) and are required to be independent with respect to the Company in accordance with the U.S. federal securities laws and the applicable rules and regulations of the Securities and Exchange Commission and the PCAOB.
We conducted our audits in accordance with the standards of the PCAOB. Those standards require that we plan and perform the audit to obtain reasonable assurance about whether the financial statements are free of material misstatement, whether due to error or fraud. The Company is not required to have, nor were we engaged to perform, an audit of its internal control over financial reporting. As part of our audits, we are required to obtain an understanding of internal control over financial reporting but not for the purpose of expressing an opinion on the effectiveness of the Company’s internal control over financial reporting. Accordingly, we express no such opinion.
Our audits included performing procedures to assess the risks of material misstatement of the financial statements, whether due to error or fraud, and performing procedures that respond to those risks. Such procedures included examining, on a test basis, evidence regarding the amounts and disclosures in the financial statements. Our audits also included evaluating the accounting principles used and significant estimates made by management, as well as evaluating the overall presentation of the financial statements. We believe that our audits provide a reasonable basis for our opinion.
Critical Audit Matters
The critical audit matters communicated below are matters arising from the current-period audit of the financial statements that were communicated or required to be communicated to the audit committee and that (1) relate to accounts or disclosures that are material to the financial statements and (2) involved our especially challenging, subjective, or complex judgments. The communication of critical audit matters does not alter in any way our opinion on the financial statements, taken as a whole, and we are not, by communicating the critical audit matters below, providing a separate opinion on the critical audit matters or on the accounts or disclosures to which they relate.
Regulatory Matters – Impact of Rate Regulation on the Financial Statements – Refer to Notes 1, 4 and 10 to the financial statements.
Critical Audit Matter Description
The Company is subject to rate regulation by the North Carolina Utilities Commission and by the South Carolina Public Service Commission (collectively the “Commissions”), which have jurisdiction with respect to the electric rates of the Company. Management has determined it meets the criteria for the application of regulated operations accounting in preparing its financial statements under accounting principles generally accepted in the United States of America. Judgment can be required to determine if otherwise recognizable incurred costs qualify to be presented as a regulatory asset and deferred because such costs are probable of future recovery in customer rates. As discussed in Note 4, regulatory proceedings in recent years have focused on the recoverability of fuel costs and asset retirement obligations specific to coal ash. As a result, assessing the potential outcomes of future regulatory orders requires management judgment.
We identified the impact of rate regulation related to regulatory assets as a critical audit matter due to the judgments made by management, including assumptions regarding the outcome of future decisions by the Commissions to support its assertions on the likelihood of future recovery for deferred costs. Given that management’s accounting judgments are based on assumptions about the outcome of future decisions by the Commissions, auditing these judgments required specialized knowledge of accounting for rate regulation and the ratemaking process due to its inherent complexities as it relates to regulatory assets.
How the Critical Audit Matter Was Addressed in the Audit
Our audit procedures related to the recovery of regulatory assets included the following, among others:
•We tested the effectiveness of management’s controls over the evaluation of the likelihood of the recovery in future rates and the monitoring and evaluation of regulatory developments that may affect the likelihood of recovering costs in future rates.
•We evaluated the Company’s disclosures related to the impacts of rate regulation, including the balances recorded and regulatory developments.
•We read relevant regulatory orders issued by the Commissions, and other publicly available information to assess the likelihood of recovery in future rates based on precedents of the Commissions’ treatment of similar costs under similar circumstances. We evaluated the external information and compared it to management’s recorded balances for completeness.
94
| REPORTS | |||||
•We evaluated management’s judgments regarding the recoverability of regulatory asset balances by performing the following:
–We inquired of management regarding changes in regulatory orders and regulatory asset balances during the year.
–We evaluated the reasonableness of such changes based on our knowledge of commission-approved amortization, expected incurred costs, and recently approved regulatory orders, as applicable.
–We utilized trend analyses to evaluate the historical consistency of regulatory asset balances.
–We compared the recorded regulatory asset balance to an independently developed expectation of the corresponding balance.
•We performed audit procedures on the incurred asset retirement obligations requested for recovery to confirm their completeness and accuracy.
•We obtained an analysis from management and letters from internal legal counsel for asset retirement obligations specific to coal ash costs, regarding probability of recovery for deferred costs not yet addressed in a regulatory order to assess management’s assertion that amounts are probable of recovery.
•We obtained representation from management asserting that regulatory assets recorded in the financial statements are probable of recovery.
•We performed substantive analytical procedures on the recoverability of deferred fuel costs.
Asset Retirement Obligations – Nuclear Decommissioning Cash Flow Revisions – Refer to Notes 4 and 10 to the financial statements.
Critical Audit Matter Description
The Company owns and operates nuclear facilities and records asset retirement obligations for their eventual decommissioning. On an annual basis, management performs an assessment for any indicators that would suggest a change in decommissioning cost estimates may be necessary. Judgment is required to calculate decommissioning estimates, which are determined through site-specific, third-party cost studies and are based on discounted cash flows, regulatory, legal, and legislative decisions, selection of discount rates and cost escalation rates, among other factors.
We identified the revisions in estimates of cash flows associated with nuclear asset retirement obligations as a critical audit matter because of the estimates and assumptions made by management in determining the recorded asset retirement obligations. This required a high degree of auditor judgment, and for certain assumptions, the need to involve our fair value specialists, when performing audit procedures related to the revisions in estimates of cash flows associated with nuclear asset retirement obligations.
How the Critical Audit Matter Was Addressed in the Audit
Our audit procedures related to the revisions in estimates of cash flows associated with nuclear asset retirement obligations included the following, among others:
•We tested the effectiveness of management’s controls over the evaluation of nuclear asset retirement obligations, including those over management’s assessment of the economic inputs.
•We tested the mathematical accuracy of management’s nuclear asset retirement obligation calculations.
•We made inquiries and inspected opinions of internal counsel regarding the status of relevant assumptions.
•With the assistance of professionals in our firm with the appropriate expertise, we inspected and evaluated the reasonableness of the impacts of any economic inputs on the calculation of revisions to cash flow estimates.
•We evaluated the Company’s disclosures related to the impacts of the nuclear asset retirement obligation.
•We obtained representation from management asserting that the asset retirement obligations recorded in the financial statements represent management’s best estimate.
/s/ Deloitte & Touche LLP
Charlotte, North Carolina
February 23, 2024
We have served as the Company's auditor since 1930.
95
| FINANCIAL STATEMENTS | |||||
DUKE ENERGY PROGRESS, LLC
CONSOLIDATED STATEMENTS OF OPERATIONS AND COMPREHENSIVE INCOME
| Years Ended December 31, | |||||||||||||||||
| (in millions) | 2023 | 2022 | 2021 | ||||||||||||||
| Operating Revenues | $ | $ | $ | ||||||||||||||
| Operating Expenses | |||||||||||||||||
| Fuel used in electric generation and purchased power | |||||||||||||||||
| Operation, maintenance and other | |||||||||||||||||
| Depreciation and amortization | |||||||||||||||||
| Property and other taxes | |||||||||||||||||
| Impairment of assets and other charges | |||||||||||||||||
| Total operating expenses | |||||||||||||||||
Gains on Sales of Other Assets and Other, net | |||||||||||||||||
| Operating Income | |||||||||||||||||
| Other Income and Expenses, net | |||||||||||||||||
| Interest Expense | |||||||||||||||||
| Income Before Income Taxes | |||||||||||||||||
Income Tax Expense | |||||||||||||||||
| Net Income and Comprehensive Income | $ | $ | $ | ||||||||||||||
See Notes to Consolidated Financial Statements
96
| FINANCIAL STATEMENTS | |||||
DUKE ENERGY PROGRESS, LLC
CONSOLIDATED BALANCE SHEETS
| December 31, | |||||||||||
| (in millions) | 2023 | 2022 | |||||||||
| ASSETS | |||||||||||
| Current Assets | |||||||||||
| Cash and cash equivalents | $ | $ | |||||||||
Receivables (net of allowance for doubtful accounts of $ | |||||||||||
Receivables of VIEs (net of allowance for doubtful accounts of $ | |||||||||||
| Receivables from affiliated companies | |||||||||||
| Inventory | |||||||||||
Regulatory assets (includes $ | |||||||||||
Other (includes $ | |||||||||||
| Total current assets | |||||||||||
| Property, Plant and Equipment | |||||||||||
| Cost | |||||||||||
| Accumulated depreciation and amortization | ( | ( | |||||||||
| Net property, plant and equipment | |||||||||||
| Other Noncurrent Assets | |||||||||||
Regulatory assets (includes $ | |||||||||||
| Nuclear decommissioning trust funds | |||||||||||
| Operating lease right-of-use assets, net | |||||||||||
| Other | |||||||||||
| Total other noncurrent assets | |||||||||||
| Total Assets | $ | $ | |||||||||
| LIABILITIES AND EQUITY | |||||||||||
| Current Liabilities | |||||||||||
| Accounts payable | $ | $ | |||||||||
| Accounts payable to affiliated companies | |||||||||||
| Notes payable to affiliated companies | |||||||||||
| Taxes accrued | |||||||||||
| Interest accrued | |||||||||||
Current maturities of long-term debt (includes $ | |||||||||||
| Asset retirement obligations | |||||||||||
| Regulatory liabilities | |||||||||||
| Other | |||||||||||
| Total current liabilities | |||||||||||
Long-Term Debt (includes $ | |||||||||||
| Long-Term Debt Payable to Affiliated Companies | |||||||||||
| Other Noncurrent Liabilities | |||||||||||
| Deferred income taxes | |||||||||||
| Asset retirement obligations | |||||||||||
| Regulatory liabilities | |||||||||||
| Operating lease liabilities | |||||||||||
| Accrued pension and other post-retirement benefit costs | |||||||||||
| Investment tax credits | |||||||||||
Other (includes $ | |||||||||||
| Total other noncurrent liabilities | |||||||||||
| Commitments and Contingencies | |||||||||||
| Equity | |||||||||||
| Member's Equity | |||||||||||
| Total Liabilities and Equity | $ | $ | |||||||||
See Notes to Consolidated Financial Statements
97
| FINANCIAL STATEMENTS | |||||
DUKE ENERGY PROGRESS, LLC
CONSOLIDATED STATEMENTS OF CASH FLOWS
| Years Ended December 31, | |||||||||||||||||
| (in millions) | 2023 | 2022 | 2021 | ||||||||||||||
| CASH FLOWS FROM OPERATING ACTIVITIES | |||||||||||||||||
| Net income | $ | $ | $ | ||||||||||||||
| Adjustments to reconcile net income to net cash provided by operating activities: | |||||||||||||||||
| Depreciation and amortization (including amortization of nuclear fuel) | |||||||||||||||||
| Equity component of AFUDC | ( | ( | ( | ||||||||||||||
| Impairment of assets and other charges | |||||||||||||||||
| Deferred income taxes | ( | ( | |||||||||||||||
| Contributions to qualified pension plans | ( | ( | — | ||||||||||||||
| Payments for asset retirement obligations | ( | ( | ( | ||||||||||||||
| Provisions for rate refunds | ( | ( | ( | ||||||||||||||
| (Increase) decrease in | |||||||||||||||||
| Net realized and unrealized mark-to-market and hedging transactions | — | ||||||||||||||||
| Receivables | ( | ( | ( | ||||||||||||||
| Receivables from affiliated companies | ( | ||||||||||||||||
| Inventory | ( | ( | ( | ||||||||||||||
Other current assets | ( | ( | ( | ||||||||||||||
| Increase (decrease) in | |||||||||||||||||
| Accounts payable | ( | ||||||||||||||||
| Accounts payable to affiliated companies | ( | ||||||||||||||||
| Taxes accrued | ( | ||||||||||||||||
| Other current liabilities | ( | ||||||||||||||||
Other assets | ( | ( | |||||||||||||||
| Other liabilities | ( | ||||||||||||||||
| Net cash provided by operating activities | |||||||||||||||||
| CASH FLOWS FROM INVESTING ACTIVITIES | |||||||||||||||||
| Capital expenditures | ( | ( | ( | ||||||||||||||
| Purchases of debt and equity securities | ( | ( | ( | ||||||||||||||
| Proceeds from sales and maturities of debt and equity securities | |||||||||||||||||
| Other | ( | ( | ( | ||||||||||||||
| Net cash used in investing activities | ( | ( | ( | ||||||||||||||
| CASH FLOWS FROM FINANCING ACTIVITIES | |||||||||||||||||
| Proceeds from the issuance of long-term debt | |||||||||||||||||
| Payments for the redemption of long-term debt | ( | ( | ( | ||||||||||||||
| Notes payable to affiliated companies | ( | ||||||||||||||||
| Distributions to parent | ( | ( | ( | ||||||||||||||
| Other | ( | ( | ( | ||||||||||||||
| Net cash provided by (used in) financing activities | ( | ||||||||||||||||
Net (decrease) increase in cash, cash equivalents and restricted cash | ( | ||||||||||||||||
| Cash, cash equivalents and restricted cash at beginning of period | |||||||||||||||||
| Cash, cash equivalents and restricted cash at end of period | $ | $ | $ | ||||||||||||||
| Supplemental Disclosures: | |||||||||||||||||
| Cash paid for interest, net of amount capitalized | $ | $ | $ | ||||||||||||||
| Cash paid for income taxes | |||||||||||||||||
| Significant non-cash transactions: | |||||||||||||||||
| Accrued capital expenditures | |||||||||||||||||
See Notes to Consolidated Financial Statements
98
| FINANCIAL STATEMENTS | |||||
DUKE ENERGY PROGRESS, LLC
CONSOLIDATED STATEMENTS OF CHANGES IN EQUITY
| Member's | |||||
| (in millions) | Equity | ||||
| Balance at December 31, 2020 | $ | ||||
| Net income | |||||
| Distribution to parent | ( | ||||
| Balance at December 31, 2021 | $ | ||||
| Net income | |||||
| Distribution to parent | ( | ||||
| Balance at December 31, 2022 | $ | ||||
| Net income | |||||
| Distribution to parent | ( | ||||
| Balance at December 31, 2023 | $ | ||||
See Notes to Consolidated Financial Statements
99
| REPORTS | |||||
REPORT OF INDEPENDENT REGISTERED PUBLIC ACCOUNTING FIRM
To the shareholder and the Board of Directors of Duke Energy Florida, LLC
Opinion on the Financial Statements
We have audited the accompanying consolidated balance sheets of Duke Energy Florida, LLC and subsidiaries (the "Company") as of December 31, 2023 and 2022, the related consolidated statements of operations and comprehensive income, changes in equity, and cash flows, for each of the three years in the period ended December 31, 2023, and the related notes (collectively referred to as the "financial statements"). In our opinion, the financial statements present fairly, in all material respects, the financial position of the Company as of December 31, 2023 and 2022, and the results of its operations and its cash flows for each of the three years in the period ended December 31, 2023, in conformity with accounting principles generally accepted in the United States of America.
Basis for Opinion
These financial statements are the responsibility of the Company's management. Our responsibility is to express an opinion on the Company's financial statements based on our audits. We are a public accounting firm registered with the Public Company Accounting Oversight Board (United States) (PCAOB) and are required to be independent with respect to the Company in accordance with the U.S. federal securities laws and the applicable rules and regulations of the Securities and Exchange Commission and the PCAOB.
We conducted our audits in accordance with the standards of the PCAOB. Those standards require that we plan and perform the audit to obtain reasonable assurance about whether the financial statements are free of material misstatement, whether due to error or fraud. The Company is not required to have, nor were we engaged to perform, an audit of its internal control over financial reporting. As part of our audits, we are required to obtain an understanding of internal control over financial reporting but not for the purpose of expressing an opinion on the effectiveness of the Company’s internal control over financial reporting. Accordingly, we express no such opinion.
Our audits included performing procedures to assess the risks of material misstatement of the financial statements, whether due to error or fraud, and performing procedures that respond to those risks. Such procedures included examining, on a test basis, evidence regarding the amounts and disclosures in the financial statements. Our audits also included evaluating the accounting principles used and significant estimates made by management, as well as evaluating the overall presentation of the financial statements. We believe that our audits provide a reasonable basis for our opinion.
Critical Audit Matter
The critical audit matter communicated below is a matter arising from the current-period audit of the financial statements that was communicated or required to be communicated to the audit committee and that (1) relates to accounts or disclosures that are material to the financial statements and (2) involved our especially challenging, subjective, or complex judgments. The communication of critical audit matters does not alter in any way our opinion on the financial statements, taken as a whole, and we are not, by communicating the critical audit matter below, providing a separate opinion on the critical audit matter or on the accounts or disclosures to which it relates.
Regulatory Matters – Impact of Rate Regulation on the Financial Statements – Refer to Notes 1 and 4 to the financial statements.
Critical Audit Matter Description
The Company is subject to rate regulation by the Florida Public Service Commission (the “Commission”), which has jurisdiction with respect to the electric rates of the Company. Management has determined it meets the criteria for the application of regulated operations accounting in preparing its financial statements under accounting principles generally accepted in the United States of America. Judgment can be required to determine if otherwise recognizable incurred costs qualify to be presented as a regulatory asset and deferred because such costs are probable of future recovery in customer rates. As discussed in Note 4, regulatory proceedings in recent years have focused on the recoverability of storm and fuel cost. As a result, assessing the potential outcomes of future regulatory orders in Florida requires management judgment.
We identified the impact of rate regulation related to regulatory assets as a critical audit matter due to the judgments made by management, including assumptions regarding the outcome of future decisions by the Commission to support its assertions on the likelihood of future recovery for deferred costs. Given that management’s accounting judgments are based on assumptions about the outcome of future decisions by the Commission, auditing these judgments required specialized knowledge of accounting for rate regulation and the ratemaking process due to its inherent complexities as it relates to regulatory assets.
How the Critical Audit Matter Was Addressed in the Audit
Our audit procedures related to the recovery of regulatory assets included the following, among others:
•We tested the effectiveness of management’s controls over the evaluation of the likelihood of the recovery in future rates and the monitoring and evaluation of regulatory developments that may affect the likelihood of recovering costs in future rates.
•We evaluated the Company’s disclosures related to the impacts of rate regulation, including the balances recorded and regulatory developments.
•We read relevant regulatory orders issued by the Commission, and other publicly available information to assess the likelihood of recovery in future rates based on precedents of the Commission’s treatment of similar costs under similar circumstances. We evaluated the external information and compared it to management’s recorded balances for completeness.
•For regulatory matters in process, we inspected the Company’s and intervenors’ filings with the Commission, that may impact the Company’s future rates, for any evidence that might contradict management’s assertions.
100
| REPORTS | |||||
•We evaluated the reasonableness of management’s judgments regarding the recoverability of regulatory asset balances by performing the following:
–We inquired of management regarding changes in regulatory orders and regulatory asset balances during the year.
–We evaluated the reasonableness of such changes based on our knowledge of commission-approved amortization, expected incurred costs, and recently approved regulatory orders, as applicable.
–We utilized trend analyses to evaluate the historical consistency of regulatory asset balances.
–We compared the recorded regulatory asset balance to an independently developed expectation of the corresponding balance.
•We obtained representation from management asserting that regulatory assets recorded in the financial statements are probable of recovery.
•We performed substantive analytical procedures on the recoverability of deferred fuel costs and detail testing procedures on the recoverability of deferred storm costs.
/s/ Deloitte & Touche LLP
Charlotte, North Carolina
February 23, 2024
We have served as the Company's auditor since 2001.
101
| FINANCIAL STATEMENTS | |||||
DUKE ENERGY FLORIDA, LLC
CONSOLIDATED STATEMENTS OF OPERATIONS AND COMPREHENSIVE INCOME
| Years Ended December 31, | |||||||||||||||||
| (in millions) | 2023 | 2022 | 2021 | ||||||||||||||
| Operating Revenues | $ | $ | $ | ||||||||||||||
| Operating Expenses | |||||||||||||||||
| Fuel used in electric generation and purchased power | |||||||||||||||||
| Operation, maintenance and other | |||||||||||||||||
| Depreciation and amortization | |||||||||||||||||
| Property and other taxes | |||||||||||||||||
| Impairment of assets and other charges | ( | ||||||||||||||||
| Total operating expenses | |||||||||||||||||
| Gains on Sales of Other Assets and Other, net | |||||||||||||||||
| Operating Income | |||||||||||||||||
| Other Income and Expenses, net | |||||||||||||||||
| Interest Expense | |||||||||||||||||
| Income Before Income Taxes | |||||||||||||||||
| Income Tax Expense | |||||||||||||||||
| Net Income | $ | $ | $ | ||||||||||||||
Other Comprehensive Gain (Loss), net of tax | |||||||||||||||||
Unrealized gains (losses) on available-for-sale securities | ( | ( | |||||||||||||||
Other Comprehensive Gain (Loss), net of tax | ( | ( | |||||||||||||||
| Comprehensive Income | $ | $ | $ | ||||||||||||||
See Notes to Consolidated Financial Statements
102
| FINANCIAL STATEMENTS | |||||
DUKE ENERGY FLORIDA, LLC
CONSOLIDATED BALANCE SHEETS
| December 31, | |||||||||||
| (in millions) | 2023 | 2022 | |||||||||
| ASSETS | |||||||||||
| Current Assets | |||||||||||
| Cash and cash equivalents | $ | $ | |||||||||
Receivables (net of allowance for doubtful accounts of $ | |||||||||||
Receivables of VIEs (net of allowance for doubtful accounts of $ | |||||||||||
| Receivables from affiliated companies | |||||||||||
Inventory (includes $ | |||||||||||
Regulatory assets (includes $ | |||||||||||
Other (includes $ | |||||||||||
| Total current assets | |||||||||||
| Property, Plant and Equipment | |||||||||||
| Cost | |||||||||||
| Accumulated depreciation and amortization | ( | ( | |||||||||
| Net property, plant and equipment | |||||||||||
| Other Noncurrent Assets | |||||||||||
Regulatory assets (includes $ | |||||||||||
| Nuclear decommissioning trust funds | |||||||||||
| Operating lease right-of-use assets, net | |||||||||||
| Other | |||||||||||
| Total other noncurrent assets | |||||||||||
| Total Assets | $ | $ | |||||||||
| LIABILITIES AND EQUITY | |||||||||||
| Current Liabilities | |||||||||||
Accounts payable (includes $ | $ | $ | |||||||||
| Accounts payable to affiliated companies | |||||||||||
| Notes payable to affiliated companies | |||||||||||
| Taxes accrued | |||||||||||
| Interest accrued | |||||||||||
Current maturities of long-term debt (includes $ | |||||||||||
| Asset retirement obligations | |||||||||||
| Regulatory liabilities | |||||||||||
| Other | |||||||||||
| Total current liabilities | |||||||||||
Long-Term Debt (includes $ | |||||||||||
| Other Noncurrent Liabilities | |||||||||||
| Deferred income taxes | |||||||||||
| Asset retirement obligations | |||||||||||
| Regulatory liabilities | |||||||||||
| Operating lease liabilities | |||||||||||
| Accrued pension and other post-retirement benefit costs | |||||||||||
| Investment tax credits | |||||||||||
Other (includes $ | |||||||||||
| Total other noncurrent liabilities | |||||||||||
| Commitments and Contingencies | |||||||||||
| Equity | |||||||||||
| Member's equity | |||||||||||
| Accumulated other comprehensive loss | ( | ( | |||||||||
| Total equity | |||||||||||
| Total Liabilities and Equity | $ | $ | |||||||||
See Notes to Consolidated Financial Statements
103
| FINANCIAL STATEMENTS | |||||
DUKE ENERGY FLORIDA, LLC
CONSOLIDATED STATEMENTS OF CASH FLOWS
| Years Ended December 31, | |||||||||||||||||
| (in millions) | 2023 | 2022 | 2021 | ||||||||||||||
| CASH FLOWS FROM OPERATING ACTIVITIES | |||||||||||||||||
| Net income | $ | $ | $ | ||||||||||||||
| Adjustments to reconcile net income to net cash provided by operating activities: | |||||||||||||||||
| Depreciation, amortization and accretion | |||||||||||||||||
| Equity component of AFUDC | ( | ( | ( | ||||||||||||||
| Impairment of assets and other charges | ( | ||||||||||||||||
| Deferred income taxes | ( | ||||||||||||||||
| Contributions to qualified pension plans | ( | ( | — | ||||||||||||||
| Payments for asset retirement obligations | ( | ( | ( | ||||||||||||||
| (Increase) decrease in | |||||||||||||||||
| Receivables | ( | ( | |||||||||||||||
| Receivables from affiliated companies | ( | ( | |||||||||||||||
| Inventory | ( | ( | ( | ||||||||||||||
Other current assets | ( | ( | |||||||||||||||
| Increase (decrease) in | |||||||||||||||||
| Accounts payable | ( | ||||||||||||||||
| Accounts payable to affiliated companies | ( | ( | |||||||||||||||
| Taxes accrued | ( | ||||||||||||||||
| Other current liabilities | ( | ||||||||||||||||
Other assets | ( | ( | |||||||||||||||
| Other liabilities | ( | ||||||||||||||||
| Net cash provided by operating activities | |||||||||||||||||
| CASH FLOWS FROM INVESTING ACTIVITIES | |||||||||||||||||
| Capital expenditures | ( | ( | ( | ||||||||||||||
| Purchases of debt and equity securities | ( | ( | ( | ||||||||||||||
| Proceeds from sales and maturities of debt and equity securities | |||||||||||||||||
| Other | ( | ( | ( | ||||||||||||||
| Net cash used in investing activities | ( | ( | ( | ||||||||||||||
| CASH FLOWS FROM FINANCING ACTIVITIES | |||||||||||||||||
| Proceeds from the issuance of long-term debt | |||||||||||||||||
| Payments for the redemption of long-term debt | ( | ( | ( | ||||||||||||||
| Notes payable to affiliated companies | ( | ||||||||||||||||
| Distributions to parent | — | ( | — | ||||||||||||||
| Other | ( | ( | — | ||||||||||||||
| Net cash provided by financing activities | |||||||||||||||||
Net (decrease) increase in cash, cash equivalents and restricted cash | ( | ||||||||||||||||
| Cash, cash equivalents and restricted cash at beginning of period | |||||||||||||||||
| Cash, cash equivalents and restricted cash at end of period | $ | $ | $ | ||||||||||||||
| Supplemental Disclosures: | |||||||||||||||||
| Cash paid for interest, net of amount capitalized | $ | $ | $ | ||||||||||||||
Cash paid for (received from) income taxes | ( | ( | |||||||||||||||
| Significant non-cash transactions: | |||||||||||||||||
| Accrued capital expenditures | |||||||||||||||||
See Notes to Consolidated Financial Statements
104
| FINANCIAL STATEMENTS | |||||
DUKE ENERGY FLORIDA, LLC
CONSOLIDATED STATEMENTS OF CHANGES IN EQUITY
| Accumulated | ||||||||||||||||||||
| Other | ||||||||||||||||||||
| Comprehensive | ||||||||||||||||||||
| Income (Loss) | ||||||||||||||||||||
| Net Unrealized | ||||||||||||||||||||
| Gains (Losses) on | ||||||||||||||||||||
| Member's | Available-for- | Total | ||||||||||||||||||
| (in millions) | Equity | Sale Securities | Equity | |||||||||||||||||
| Balance at December 31, 2020 | $ | $ | ( | $ | ||||||||||||||||
| Net income | — | |||||||||||||||||||
| Other comprehensive loss | — | ( | ( | |||||||||||||||||
| Balance at December 31, 2021 | $ | $ | ( | $ | ||||||||||||||||
| Net income | — | |||||||||||||||||||
| Other comprehensive loss | — | ( | ( | |||||||||||||||||
| Distribution to parent | ( | — | ( | |||||||||||||||||
Other | ( | ( | ||||||||||||||||||
| Balance at December 31, 2022 | $ | $ | ( | $ | ||||||||||||||||
| Net income | — | |||||||||||||||||||
Other comprehensive income | — | |||||||||||||||||||
| Other | — | |||||||||||||||||||
| Balance at December 31, 2023 | $ | $ | ( | $ | ||||||||||||||||
See Notes to Consolidated Financial Statements
105
| REPORTS | |||||
REPORT OF INDEPENDENT REGISTERED PUBLIC ACCOUNTING FIRM
To the shareholder and the Board of Directors of Duke Energy Ohio, Inc.
Opinion on the Financial Statements
We have audited the accompanying consolidated balance sheets of Duke Energy Ohio, Inc. and subsidiaries (the "Company") as of December 31, 2023 and 2022, the related consolidated statements of operations and comprehensive income, changes in equity, and cash flows, for each of the three years in the period ended December 31, 2023, and the related notes (collectively referred to as the "financial statements"). In our opinion, the financial statements present fairly, in all material respects, the financial position of the Company as of December 31, 2023 and 2022, and the results of its operations and its cash flows for each of the three years in the period ended December 31, 2023, in conformity with accounting principles generally accepted in the United States of America.
Basis for Opinion
These financial statements are the responsibility of the Company's management. Our responsibility is to express an opinion on the Company's financial statements based on our audits. We are a public accounting firm registered with the Public Company Accounting Oversight Board (United States) (PCAOB) and are required to be independent with respect to the Company in accordance with the U.S. federal securities laws and the applicable rules and regulations of the Securities and Exchange Commission and the PCAOB.
We conducted our audits in accordance with the standards of the PCAOB. Those standards require that we plan and perform the audit to obtain reasonable assurance about whether the financial statements are free of material misstatement, whether due to error or fraud. The Company is not required to have, nor were we engaged to perform, an audit of its internal control over financial reporting. As part of our audits, we are required to obtain an understanding of internal control over financial reporting but not for the purpose of expressing an opinion on the effectiveness of the Company’s internal control over financial reporting. Accordingly, we express no such opinion.
Our audits included performing procedures to assess the risks of material misstatement of the financial statements, whether due to error or fraud, and performing procedures that respond to those risks. Such procedures included examining, on a test basis, evidence regarding the amounts and disclosures in the financial statements. Our audits also included evaluating the accounting principles used and significant estimates made by management, as well as evaluating the overall presentation of the financial statements. We believe that our audits provide a reasonable basis for our opinion.
Critical Audit Matter
The critical audit matter communicated below is a matter arising from the current-period audit of the financial statements that was communicated or required to be communicated to the audit committee and that (1) relates to accounts or disclosures that are material to the financial statements and (2) involved our especially challenging, subjective, or complex judgments. The communication of critical audit matters does not alter in any way our opinion on the financial statements, taken as a whole, and we are not, by communicating the critical audit matter below, providing a separate opinion on the critical audit matter or on the accounts or disclosures to which it relates.
Regulatory Matters – Impact of Rate Regulation on the Financial Statements – Refer to Notes 1 and 4 to the financial statements.
Critical Audit Matter Description
The Company is subject to rate regulation by the Public Utilities Commission of Ohio and by the Kentucky Public Service Commission (collectively the “Commissions”), which have jurisdiction with respect to the electric and gas rates of the Company. Management has determined it meets the criteria for the application of regulated operations accounting in preparing its financial statements under accounting principles generally accepted in the United States of America. Judgment can be required to determine if otherwise recognizable incurred costs qualify to be presented as a regulatory asset and deferred because such costs are probable of future recovery in customer rates.
We identified the impact of rate regulation related to regulatory assets as a critical audit matter due to the judgments made by management, including assumptions regarding the outcome of future decisions by the Commissions to support its assertions on the likelihood of future recovery for deferred costs. Given that management’s accounting judgments are based on assumptions about the outcome of future decisions by the Commissions, auditing these judgments required specialized knowledge of accounting for rate regulation and the ratemaking process due to its inherent complexities as it relates to regulatory assets.
How the Critical Audit Matter Was Addressed in the Audit
Our audit procedures related to the recovery of regulatory assets included the following, among others:
•We tested the effectiveness of management’s controls over the evaluation of the likelihood of the recovery in future rates and the monitoring and evaluation of regulatory developments that may affect the likelihood of recovering costs in future rates.
•We evaluated the Company’s disclosures related to the impacts of rate regulation, including the balances recorded and regulatory developments.
•We read relevant regulatory orders issued by the Commissions, and other publicly available information to assess the likelihood of recovery in future rates based on precedents of the Commissions’ treatment of similar costs under similar circumstances. We evaluated the external information and compared it to management’s recorded balances for completeness.
•We evaluated management’s judgments regarding the recoverability of regulatory asset balances by performing the following:
–We inquired of management regarding changes in regulatory orders and regulatory asset balances during the year.
–We evaluated the reasonableness of such changes based on our knowledge of commission-approved amortization, expected incurred costs, and recently approved regulatory orders, as applicable.
106
| REPORTS | |||||
–We utilized trend analyses to evaluate the historical consistency of regulatory asset balances.
–We compared the recorded regulatory asset balance to an independently developed expectation of the corresponding balance.
•We obtained representation from management asserting that regulatory assets recorded in the financial statements are probable of recovery.
/s/ Deloitte & Touche LLP
Charlotte, North Carolina
February 23, 2024
We have served as the Company's auditor since 2002.
107
| FINANCIAL STATEMENTS | |||||
DUKE ENERGY OHIO, INC.
CONSOLIDATED STATEMENTS OF OPERATIONS AND COMPREHENSIVE INCOME
| Years Ended December 31, | |||||||||||||||||
| (in millions) | 2023 | 2022 | 2021 | ||||||||||||||
| Operating Revenues | |||||||||||||||||
| Regulated electric | $ | $ | $ | ||||||||||||||
| Regulated natural gas | |||||||||||||||||
| Total operating revenues | |||||||||||||||||
| Operating Expenses | |||||||||||||||||
| Fuel used in electric generation and purchased power | |||||||||||||||||
| Cost of natural gas | |||||||||||||||||
| Operation, maintenance and other | |||||||||||||||||
| Depreciation and amortization | |||||||||||||||||
| Property and other taxes | |||||||||||||||||
| Impairment of assets and other charges | ( | ||||||||||||||||
| Total operating expenses | |||||||||||||||||
| Gains on Sales of Other Assets and Other, net | |||||||||||||||||
| Operating Income | |||||||||||||||||
| Other Income and Expenses, net | |||||||||||||||||
| Interest Expense | |||||||||||||||||
| Income Before Income Taxes | |||||||||||||||||
| Income Tax (Benefit) Expense | ( | ||||||||||||||||
| Net Income and Comprehensive Income | $ | $ | $ | ||||||||||||||
See Notes to Consolidated Financial Statements
108
| FINANCIAL STATEMENTS | |||||
DUKE ENERGY OHIO, INC.
CONSOLIDATED BALANCE SHEETS
| December 31, | |||||||||||
| (in millions) | 2023 | 2022 | |||||||||
| ASSETS | |||||||||||
| Current Assets | |||||||||||
| Cash and cash equivalents | $ | $ | |||||||||
Receivables (net of allowance for doubtful accounts of $ | |||||||||||
| Receivables from affiliated companies | |||||||||||
| Inventory | |||||||||||
| Regulatory assets | |||||||||||
| Other | |||||||||||
| Total current assets | |||||||||||
| Property, Plant and Equipment | |||||||||||
| Cost | |||||||||||
| Accumulated depreciation and amortization | ( | ( | |||||||||
| Net property, plant and equipment | |||||||||||
| Other Noncurrent Assets | |||||||||||
| Goodwill | |||||||||||
| Regulatory assets | |||||||||||
| Operating lease right-of-use assets, net | |||||||||||
| Other | |||||||||||
| Total other noncurrent assets | |||||||||||
| Total Assets | $ | $ | |||||||||
| LIABILITIES AND EQUITY | |||||||||||
| Current Liabilities | |||||||||||
| Accounts payable | $ | $ | |||||||||
| Accounts payable to affiliated companies | |||||||||||
| Notes payable to affiliated companies | |||||||||||
| Taxes accrued | |||||||||||
| Interest accrued | |||||||||||
| Current maturities of long-term debt | — | ||||||||||
| Asset retirement obligations | |||||||||||
| Regulatory liabilities | |||||||||||
| Other | |||||||||||
| Total current liabilities | |||||||||||
| Long-Term Debt | |||||||||||
| Long-Term Debt Payable to Affiliated Companies | |||||||||||
| Other Noncurrent Liabilities | |||||||||||
| Deferred income taxes | |||||||||||
| Asset retirement obligations | |||||||||||
| Regulatory liabilities | |||||||||||
| Operating lease liabilities | |||||||||||
| Accrued pension and other post-retirement benefit costs | |||||||||||
| Other | |||||||||||
| Total other noncurrent liabilities | |||||||||||
| Commitments and Contingencies | |||||||||||
| Equity | |||||||||||
Common stock, $ | |||||||||||
| Additional paid-in capital | |||||||||||
| Retained earnings | |||||||||||
| Total equity | |||||||||||
| Total Liabilities and Equity | $ | $ | |||||||||
See Notes to Consolidated Financial Statements
109
| FINANCIAL STATEMENTS | |||||
DUKE ENERGY OHIO, INC.
CONSOLIDATED STATEMENTS OF CASH FLOWS
| Years Ended December 31, | |||||||||||||||||
| (in millions) | 2023 | 2022 | 2021 | ||||||||||||||
| CASH FLOWS FROM OPERATING ACTIVITIES | |||||||||||||||||
| Net income | $ | $ | $ | ||||||||||||||
| Adjustments to reconcile net income to net cash provided by operating activities: | |||||||||||||||||
| Depreciation, amortization and accretion | |||||||||||||||||
| Equity component of AFUDC | ( | ( | ( | ||||||||||||||
| Impairment of assets and other charges | ( | ||||||||||||||||
| Deferred income taxes | ( | ||||||||||||||||
| Contributions to qualified pension plans | ( | ( | — | ||||||||||||||
| Payments for asset retirement obligations | ( | ( | ( | ||||||||||||||
| Provision for rate refunds | |||||||||||||||||
| (Increase) decrease in | |||||||||||||||||
| Receivables | ( | ||||||||||||||||
| Receivables from affiliated companies | ( | ( | ( | ||||||||||||||
| Inventory | ( | ( | ( | ||||||||||||||
| Other current assets | ( | ( | ( | ||||||||||||||
| Increase (decrease) in | |||||||||||||||||
| Accounts payable | ( | ||||||||||||||||
| Accounts payable to affiliated companies | ( | ( | |||||||||||||||
| Taxes accrued | ( | ||||||||||||||||
| Other current liabilities | ( | ( | |||||||||||||||
| Other assets | ( | ( | ( | ||||||||||||||
| Other liabilities | ( | ||||||||||||||||
| Net cash provided by operating activities | |||||||||||||||||
| CASH FLOWS FROM INVESTING ACTIVITIES | |||||||||||||||||
| Capital expenditures | ( | ( | ( | ||||||||||||||
| Net proceeds from the sales of other assets | — | — | |||||||||||||||
| Notes receivable from affiliated companies | ( | ( | |||||||||||||||
| Other | ( | ( | ( | ||||||||||||||
| Net cash used in investing activities | ( | ( | ( | ||||||||||||||
| CASH FLOWS FROM FINANCING ACTIVITIES | |||||||||||||||||
| Proceeds from the issuance of long-term debt | |||||||||||||||||
| Payments for the redemption of long-term debt | ( | — | ( | ||||||||||||||
| Notes payable to affiliated companies | ( | ||||||||||||||||
| Capital contribution from parent | — | — | |||||||||||||||
| Other | ( | ( | — | ||||||||||||||
| Net cash provided by financing activities | |||||||||||||||||
| Net increase (decrease) in cash and cash equivalents | ( | ||||||||||||||||
| Cash and cash equivalents at beginning of period | |||||||||||||||||
| Cash and cash equivalents at end of period | $ | $ | $ | ||||||||||||||
| Supplemental Disclosures: | |||||||||||||||||
| Cash paid for interest, net of amount capitalized | $ | $ | $ | ||||||||||||||
Cash paid for (received from) income taxes | ( | ||||||||||||||||
| Significant non-cash transactions: | |||||||||||||||||
| Accrued capital expenditures | |||||||||||||||||
See Notes to Consolidated Financial Statements
110
| FINANCIAL STATEMENTS | |||||
DUKE ENERGY OHIO, INC.
CONSOLIDATED STATEMENTS OF CHANGES IN EQUITY
| Additional | |||||||||||||||||||||||
| Common | Paid-in | Retained | Total | ||||||||||||||||||||
| (in millions) | Stock | Capital | Earnings | Equity | |||||||||||||||||||
| Balance at December 31, 2020 | $ | $ | $ | $ | |||||||||||||||||||
| Net income | — | — | |||||||||||||||||||||
| Contribution from parent | — | — | |||||||||||||||||||||
Other | — | ( | — | ||||||||||||||||||||
| Balance at December 31, 2021 | $ | $ | $ | $ | |||||||||||||||||||
| Net income | — | — | |||||||||||||||||||||
| Balance at December 31, 2022 | $ | $ | $ | $ | |||||||||||||||||||
| Net income | — | — | |||||||||||||||||||||
| Balance at December 31, 2023 | $ | $ | $ | $ | |||||||||||||||||||
See Notes to Consolidated Financial Statements
111
| REPORTS | |||||
REPORT OF INDEPENDENT REGISTERED PUBLIC ACCOUNTING FIRM
To the shareholder and the Board of Directors of Duke Energy Indiana, LLC
Opinion on the Financial Statements
We have audited the accompanying consolidated balance sheets of Duke Energy Indiana, LLC and subsidiary (the "Company") as of December 31, 2023 and 2022, the related consolidated statements of operations and comprehensive income, changes in equity, and cash flows, for each of the three years in the period ended December 31, 2023, and the related notes (collectively referred to as the "financial statements"). In our opinion, the financial statements present fairly, in all material respects, the financial position of the Company as of December 31, 2023 and 2022, and the results of its operations and its cash flows for each of the three years in the period ended December 31, 2023, in conformity with accounting principles generally accepted in the United States of America.
Basis for Opinion
These financial statements are the responsibility of the Company's management. Our responsibility is to express an opinion on the Company's financial statements based on our audits. We are a public accounting firm registered with the Public Company Accounting Oversight Board (United States) (PCAOB) and are required to be independent with respect to the Company in accordance with the U.S. federal securities laws and the applicable rules and regulations of the Securities and Exchange Commission and the PCAOB.
We conducted our audits in accordance with the standards of the PCAOB. Those standards require that we plan and perform the audit to obtain reasonable assurance about whether the financial statements are free of material misstatement, whether due to error or fraud. The Company is not required to have, nor were we engaged to perform, an audit of its internal control over financial reporting. As part of our audits, we are required to obtain an understanding of internal control over financial reporting but not for the purpose of expressing an opinion on the effectiveness of the Company’s internal control over financial reporting. Accordingly, we express no such opinion.
Our audits included performing procedures to assess the risks of material misstatement of the financial statements, whether due to error or fraud, and performing procedures that respond to those risks. Such procedures included examining, on a test basis, evidence regarding the amounts and disclosures in the financial statements. Our audits also included evaluating the accounting principles used and significant estimates made by management, as well as evaluating the overall presentation of the financial statements. We believe that our audits provide a reasonable basis for our opinion.
Critical Audit Matter
The critical audit matter communicated below is a matter arising from the current-period audit of the financial statements that was communicated or required to be communicated to the audit committee and that (1) relates to accounts or disclosures that are material to the financial statements and (2) involved our especially challenging, subjective, or complex judgments. The communication of critical audit matters does not alter in any way our opinion on the financial statements, taken as a whole, and we are not, by communicating the critical audit matter below, providing a separate opinion on the critical audit matter or on the accounts or disclosures to which it relates.
Regulatory Matters – Impact of Rate Regulation on the Financial Statements – Refer to Notes 1, 4 and 10 to the financial statements.
Critical Audit Matter Description
The Company is subject to rate regulation by the Indiana Utility Regulatory Commission (the “Commission”), which has jurisdiction with respect to the electric rates of the Company. Management has determined it meets the criteria for the application of regulated operations accounting in preparing its financial statements under accounting principles generally accepted in the United States of America. Judgment can be required to determine if otherwise recognizable incurred costs qualify to be presented as a regulatory asset and deferred because such costs are probable of future recovery in customer rates. As discussed in Note 4, regulatory proceedings in recent years in Indiana have focused on the recoverability of fuel costs and asset retirement obligations specific to coal ash. As a result, assessing the potential outcomes of future regulatory orders requires management judgment.
We identified the impact of rate regulation related to regulatory assets as a critical audit matter due to the judgments made by management, including assumptions regarding the outcome of future decisions by the Commission to support its assertions on the likelihood of future recovery for deferred costs. Given that management’s accounting judgments are based on assumptions about the outcome of future decisions by the Commission, auditing these judgments required specialized knowledge of accounting for rate regulation and the ratemaking process due to its inherent complexities as it relates to regulatory assets.
How the Critical Audit Matter Was Addressed in the Audit
Our audit procedures related to the recovery of regulatory assets included the following, among others:
•We tested the effectiveness of management’s controls over the evaluation of the likelihood of the recovery in future rates and the monitoring and evaluation of regulatory developments that may affect the likelihood of recovering costs in future rates.
•We evaluated the Company’s disclosures related to the impacts of rate regulation, including the balances recorded and regulatory developments.
•We read relevant regulatory orders issued by the Commission, and other publicly available information to assess the likelihood of recovery in future rates based on precedents of the Commission’s treatment of similar costs under similar circumstances. We evaluated the external information and compared it to management’s recorded balances for completeness.
•For regulatory matters in process, we inspected the Company’s and intervenors’ filings with the Commission, that may impact the Company’s future rates, for any evidence that might contradict management’s assertions.
112
| REPORTS | |||||
•We evaluated the reasonableness of management’s judgments regarding the recoverability of regulatory asset balances by performing the following:
–We inquired of management regarding changes in regulatory orders and regulatory asset balances during the year.
–We evaluated the reasonableness of such changes based on our knowledge of commission-approved amortization, expected incurred costs, and recently approved regulatory orders, as applicable.
–We utilized trend analyses to evaluate the historical consistency of regulatory asset balances.
–We compared the recorded regulatory asset balance to an independently developed expectation of the corresponding balance.
•We performed audit procedures on the incurred asset retirement obligations requested for recovery to confirm their completeness and accuracy.
•We obtained an analysis from management and letters from internal legal counsel for asset retirement obligations specific to coal ash costs, regarding probability of recovery for deferred costs not yet addressed in a regulatory order to assess management’s assertion that amounts are probable of recovery.
•We obtained representation from management asserting that regulatory assets recorded in the financial statements are probable of recovery.
•We performed substantive analytical procedures on the recoverability of deferred fuel costs.
/s/ Deloitte & Touche LLP
Charlotte, North Carolina
February 23, 2024
We have served as the Company's auditor since 2002.
113
| FINANCIAL STATEMENTS | |||||
DUKE ENERGY INDIANA, LLC
CONSOLIDATED STATEMENTS OF OPERATIONS AND COMPREHENSIVE INCOME
| Years Ended December 31, | |||||||||||||||||
| (in millions) | 2023 | 2022 | 2021 | ||||||||||||||
| Operating Revenues | $ | $ | $ | ||||||||||||||
| Operating Expenses | |||||||||||||||||
| Fuel used in electric generation and purchased power | |||||||||||||||||
| Operation, maintenance and other | |||||||||||||||||
| Depreciation and amortization | |||||||||||||||||
| Property and other taxes | |||||||||||||||||
| Impairment of assets and other charges | — | ||||||||||||||||
| Total operating expenses | |||||||||||||||||
| Operating Income | |||||||||||||||||
| Other Income and Expenses, net | |||||||||||||||||
| Interest Expense | |||||||||||||||||
| Income Before Income Taxes | |||||||||||||||||
| Income Tax (Benefit) Expense | ( | ||||||||||||||||
Net Income and Comprehensive Income | $ | $ | $ | ||||||||||||||
See Notes to Consolidated Financial Statements
114
| FINANCIAL STATEMENTS | |||||
DUKE ENERGY INDIANA, LLC
CONSOLIDATED BALANCE SHEETS
| December 31, | |||||||||||
| (in millions) | 2023 | 2022 | |||||||||
| ASSETS | |||||||||||
| Current Assets | |||||||||||
| Cash and cash equivalents | $ | $ | |||||||||
Receivables (net of allowance for doubtful accounts of $ | |||||||||||
| Receivables from affiliated companies | |||||||||||
| Inventory | |||||||||||
| Regulatory assets | |||||||||||
| Other | |||||||||||
| Total current assets | |||||||||||
| Property, Plant and Equipment | |||||||||||
| Cost | |||||||||||
| Accumulated depreciation and amortization | ( | ( | |||||||||
| Net property, plant and equipment | |||||||||||
| Other Noncurrent Assets | |||||||||||
| Regulatory assets | |||||||||||
| Operating lease right-of-use assets, net | |||||||||||
| Other | |||||||||||
| Total other noncurrent assets | |||||||||||
| Total Assets | $ | $ | |||||||||
| LIABILITIES AND EQUITY | |||||||||||
| Current Liabilities | |||||||||||
| Accounts payable | $ | $ | |||||||||
| Accounts payable to affiliated companies | |||||||||||
| Notes payable to affiliated companies | |||||||||||
| Taxes accrued | |||||||||||
| Interest accrued | |||||||||||
| Current maturities of long-term debt | |||||||||||
| Asset retirement obligations | |||||||||||
| Regulatory liabilities | |||||||||||
| Other | |||||||||||
| Total current liabilities | |||||||||||
| Long-Term Debt | |||||||||||
| Long-Term Debt Payable to Affiliated Companies | |||||||||||
| Other Noncurrent Liabilities | |||||||||||
| Deferred income taxes | |||||||||||
| Asset retirement obligations | |||||||||||
| Regulatory liabilities | |||||||||||
| Operating lease liabilities | |||||||||||
| Accrued pension and other post-retirement benefit costs | |||||||||||
| Investment tax credits | |||||||||||
| Other | — | ||||||||||
| Total other noncurrent liabilities | |||||||||||
| Commitments and Contingencies | |||||||||||
| Equity | |||||||||||
| Member's equity | |||||||||||
| Accumulated other comprehensive income | |||||||||||
| Total equity | |||||||||||
| Total Liabilities and Equity | $ | $ | |||||||||
See Notes to Consolidated Financial Statements
115
| FINANCIAL STATEMENTS | |||||
DUKE ENERGY INDIANA, LLC
CONSOLIDATED STATEMENTS OF CASH FLOWS
| Years Ended December 31, | |||||||||||||||||
| (in millions) | 2023 | 2022 | 2021 | ||||||||||||||
| CASH FLOWS FROM OPERATING ACTIVITIES | |||||||||||||||||
| Net income | $ | $ | $ | ||||||||||||||
| Adjustments to reconcile net income to net cash provided by operating activities: | |||||||||||||||||
| Depreciation, amortization and accretion | |||||||||||||||||
| Equity component of AFUDC | ( | ( | ( | ||||||||||||||
| Impairment of assets and other charges | — | ||||||||||||||||
| Deferred income taxes | ( | ||||||||||||||||
| Contributions to qualified pension plans | ( | ( | — | ||||||||||||||
| Payments for asset retirement obligations | ( | ( | ( | ||||||||||||||
| (Increase) decrease in | |||||||||||||||||
| Receivables | ( | ( | ( | ||||||||||||||
| Receivables from affiliated companies | ( | — | |||||||||||||||
| Inventory | ( | ( | |||||||||||||||
| Other current assets | ( | ( | |||||||||||||||
| Increase (decrease) in | |||||||||||||||||
| Accounts payable | ( | ||||||||||||||||
| Accounts payable to affiliated companies | ( | ||||||||||||||||
| Taxes accrued | ( | ||||||||||||||||
| Other current liabilities | |||||||||||||||||
| Other assets | ( | ( | |||||||||||||||
| Other liabilities | ( | ||||||||||||||||
| Net cash provided by operating activities | |||||||||||||||||
| CASH FLOWS FROM INVESTING ACTIVITIES | |||||||||||||||||
| Capital expenditures | ( | ( | ( | ||||||||||||||
| Purchases of debt and equity securities | ( | ( | ( | ||||||||||||||
| Proceeds from sales and maturities of debt and equity securities | |||||||||||||||||
| Notes receivable from affiliated companies | ( | ( | |||||||||||||||
| Other | ( | ( | |||||||||||||||
| Net cash used in investing activities | ( | ( | ( | ||||||||||||||
| CASH FLOWS FROM FINANCING ACTIVITIES | |||||||||||||||||
| Proceeds from the issuance of long-term debt | |||||||||||||||||
| Payments for the redemption of long-term debt | ( | ( | ( | ||||||||||||||
| Notes payable to affiliated companies | ( | ( | |||||||||||||||
| Distributions to parent | ( | ( | ( | ||||||||||||||
| Other | ( | ( | — | ||||||||||||||
| Net cash used in financing activities | ( | ( | ( | ||||||||||||||
Net (decrease) increase in cash and cash equivalents | ( | ( | |||||||||||||||
| Cash and cash equivalents at beginning of period | |||||||||||||||||
| Cash and cash equivalents at end of period | $ | $ | $ | ||||||||||||||
| Supplemental Disclosures: | |||||||||||||||||
| Cash paid for interest, net of amount capitalized | $ | $ | $ | ||||||||||||||
| Cash paid for income taxes | |||||||||||||||||
| Significant non-cash transactions: | |||||||||||||||||
| Accrued capital expenditures | |||||||||||||||||
See Notes to Consolidated Financial Statements
116
| FINANCIAL STATEMENTS | |||||
DUKE ENERGY INDIANA, LLC
CONSOLIDATED STATEMENTS OF CHANGES IN EQUITY
| Accumulated | |||||||||||||||||
| Other | |||||||||||||||||
| Comprehensive | |||||||||||||||||
| Income | |||||||||||||||||
| Pension | |||||||||||||||||
| Member's | and OPEB | Total | |||||||||||||||
| (in millions) | Equity | Adjustments | Equity | ||||||||||||||
| Balance at December 31, 2020 | $ | $ | — | $ | |||||||||||||
| Net income | — | ||||||||||||||||
| Distributions to parent | ( | — | ( | ||||||||||||||
Other | — | ||||||||||||||||
| Balance at December 31, 2021 | $ | $ | — | $ | |||||||||||||
| Net income | — | ||||||||||||||||
| Distributions to parent | ( | — | ( | ||||||||||||||
| Other | — | ||||||||||||||||
| Balance at December 31, 2022 | $ | $ | $ | ||||||||||||||
| Net income | — | ||||||||||||||||
| Distributions to parent | ( | — | ( | ||||||||||||||
| Balance at December 31, 2023 | $ | $ | $ | ||||||||||||||
See Notes to Consolidated Financial Statements
117
| REPORTS | |||||
REPORT OF INDEPENDENT REGISTERED PUBLIC ACCOUNTING FIRM
To the shareholder and the Board of Directors of Piedmont Natural Gas Company, Inc.
Opinion on the Financial Statements
We have audited the accompanying consolidated balance sheets of Piedmont Natural Gas Company, Inc. and subsidiaries (the "Company") as of December 31, 2023 and 2022, the related consolidated statements of operations and comprehensive income, changes in equity, and cash flows, for each of the three years in the period ended December 31, 2023, and the related notes (collectively referred to as the "financial statements"). In our opinion, the financial statements present fairly, in all material respects, the financial position of the Company as of December 31, 2023 and 2022 and the results of its operations and its cash flows for each of the three years in the period ended December 31, 2023, in conformity with accounting principles generally accepted in the United States of America.
Basis for Opinion
These financial statements are the responsibility of the Company's management. Our responsibility is to express an opinion on the Company's financial statements based on our audits. We are a public accounting firm registered with the Public Company Accounting Oversight Board (United States) (PCAOB) and are required to be independent with respect to the Company in accordance with the U.S. federal securities laws and the applicable rules and regulations of the Securities and Exchange Commission and the PCAOB.
We conducted our audits in accordance with the standards of the PCAOB. Those standards require that we plan and perform the audit to obtain reasonable assurance about whether the financial statements are free of material misstatement, whether due to error or fraud. The Company is not required to have, nor were we engaged to perform, an audit of its internal control over financial reporting. As part of our audits, we are required to obtain an understanding of internal control over financial reporting but not for the purpose of expressing an opinion on the effectiveness of the Company’s internal control over financial reporting. Accordingly, we express no such opinion.
Our audits included performing procedures to assess the risks of material misstatement of the financial statements, whether due to error or fraud, and performing procedures that respond to those risks. Such procedures included examining, on a test basis, evidence regarding the amounts and disclosures in the financial statements. Our audits also included evaluating the accounting principles used and significant estimates made by management, as well as evaluating the overall presentation of the financial statements. We believe that our audits provide a reasonable basis for our opinion.
Critical Audit Matter
The critical audit matter communicated below is a matter arising from the current-period audit of the financial statements that was communicated or required to be communicated to the audit committee and that (1) relates to accounts or disclosures that are material to the financial statements and (2) involved our especially challenging, subjective, or complex judgments. The communication of critical audit matters does not alter in any way our opinion on the financial statements, taken as a whole, and we are not, by communicating the critical audit matter below, providing a separate opinion on the critical audit matter or on the accounts or disclosures to which it relates.
Regulatory Matters – Impact of Rate Regulation on the Financial Statements – Refer to Notes 1 and 4 to the financial statements.
Critical Audit Matter Description
The Company is subject to rate regulation by the North Carolina Utilities Commission, the Public Service Commission of South Carolina, and the Tennessee Public Utility Commission (collectively the “Commissions”), which have jurisdiction with respect to the gas rates of the Company. Management has determined it meets the criteria for the application of regulated operations accounting in preparing its financial statements under accounting principles generally accepted in the United States of America. Judgment can be required to determine if otherwise recognizable incurred costs qualify to be presented as a regulatory asset and deferred because such costs are probable of future recovery in customer rates.
We identified the impact of rate regulation related to regulatory assets as a critical audit matter due to the judgments made by management, including assumptions regarding the outcome of future decisions by the Commissions to support its assertions on the likelihood of future recovery for deferred costs. Given that management’s accounting judgments are based on assumptions about the outcome of future decisions by the Commissions, auditing these judgments required specialized knowledge of accounting for rate regulation and the ratemaking process due to its inherent complexities as it relates to regulatory assets.
How the Critical Audit Matter Was Addressed in the Audit
Our audit procedures related to the recovery of regulatory assets included the following, among others:
•We tested the effectiveness of management’s controls over the evaluation of the likelihood of the recovery in future rates and the monitoring and evaluation of regulatory developments that may affect the likelihood of recovering costs in future rates.
•We evaluated the Company’s disclosures related to the impacts of rate regulation, including the balances recorded and regulatory developments.
•We read relevant regulatory orders issued by the Commissions, and other publicly available information to assess the likelihood of recovery in future rates based on precedents of the Commissions’ treatment of similar costs under similar circumstances. We evaluated the external information and compared it to management’s recorded balances for completeness.
•We evaluated management’s judgments regarding the recoverability of regulatory asset balances by performing the following:
–We inquired of management regarding changes in regulatory orders and regulatory asset balances during the year.
–We evaluated the reasonableness of such changes based on our knowledge of commission-approved amortization, expected incurred costs, and recently approved regulatory orders, as applicable.
118
| REPORTS | |||||
–We utilized trend analyses to evaluate the historical consistency of regulatory asset balances.
–We compared the recorded regulatory asset balance to an independently developed expectation of the corresponding balance.
•We obtained representation from management asserting that regulatory assets recorded in the financial statements are probable of recovery.
/s/ Deloitte & Touche LLP
Charlotte, North Carolina
February 23, 2024
We have served as the Company's auditor since 1951.
119
| FINANCIAL STATEMENTS | |||||
PIEDMONT NATURAL GAS COMPANY, INC.
CONSOLIDATED STATEMENTS OF OPERATIONS AND COMPREHENSIVE INCOME
| Years Ended December 31, | |||||||||||||||||
| (in millions) | 2023 | 2022 | 2021 | ||||||||||||||
| Operating Revenues | |||||||||||||||||
| Regulated natural gas | $ | $ | $ | ||||||||||||||
| Nonregulated natural gas and other | |||||||||||||||||
Total operating revenues | |||||||||||||||||
| Operating Expenses | |||||||||||||||||
| Cost of natural gas | |||||||||||||||||
| Operation, maintenance and other | |||||||||||||||||
| Depreciation and amortization | |||||||||||||||||
| Property and other taxes | |||||||||||||||||
| Impairment of assets and other charges | ( | ||||||||||||||||
| Total operating expenses | |||||||||||||||||
| Gains on Sales of Other Assets and Other, net | |||||||||||||||||
| Operating Income | |||||||||||||||||
| Equity in earnings of unconsolidated affiliates | |||||||||||||||||
| Other income and expense, net | |||||||||||||||||
Total other income and expenses | |||||||||||||||||
| Interest Expense | |||||||||||||||||
| Income Before Income Taxes | |||||||||||||||||
| Income Tax Expense | |||||||||||||||||
Net Income and Comprehensive Income | $ | $ | $ | ||||||||||||||
See Notes to Consolidated Financial Statements
120
| FINANCIAL STATEMENTS | |||||
PIEDMONT NATURAL GAS COMPANY, INC.
CONSOLIDATED BALANCE SHEETS
| December 31, | |||||||||||
| (in millions) | 2023 | 2022 | |||||||||
| ASSETS | |||||||||||
| Current Assets | |||||||||||
Receivables (net of allowance for doubtful accounts of $ | $ | $ | |||||||||
| Receivables from affiliated companies | |||||||||||
| Inventory | |||||||||||
| Regulatory assets | |||||||||||
| Other | |||||||||||
| Total current assets | |||||||||||
| Property, Plant and Equipment | |||||||||||
| Cost | |||||||||||
| Accumulated depreciation and amortization | ( | ( | |||||||||
| Facilities to be retired, net | |||||||||||
| Net property, plant and equipment | |||||||||||
| Other Noncurrent Assets | |||||||||||
| Goodwill | |||||||||||
| Regulatory assets | |||||||||||
| Operating lease right-of-use assets, net | |||||||||||
| Investments in equity method unconsolidated affiliates | |||||||||||
| Other | |||||||||||
| Total other noncurrent assets | |||||||||||
| Total Assets | $ | $ | |||||||||
| LIABILITIES AND EQUITY | |||||||||||
| Current Liabilities | |||||||||||
| Accounts payable | $ | $ | |||||||||
| Accounts payable to affiliated companies | |||||||||||
| Notes payable to affiliated companies | |||||||||||
| Taxes accrued | |||||||||||
| Interest accrued | |||||||||||
| Current maturities of long-term debt | |||||||||||
| Regulatory liabilities | |||||||||||
| Other | |||||||||||
| Total current liabilities | |||||||||||
| Long-Term Debt | |||||||||||
| Other Noncurrent Liabilities | |||||||||||
| Deferred income taxes | |||||||||||
| Asset retirement obligations | |||||||||||
| Regulatory liabilities | |||||||||||
| Operating lease liabilities | |||||||||||
| Accrued pension and other post-retirement benefit costs | |||||||||||
| Other | |||||||||||
| Total other noncurrent liabilities | |||||||||||
| Commitments and Contingencies | |||||||||||
| Equity | |||||||||||
Common stock, | |||||||||||
| Retained earnings | |||||||||||
| Total Piedmont Natural Gas Company, Inc. stockholder's equity | |||||||||||
| Noncontrolling interests | |||||||||||
| Total equity | |||||||||||
| Total Liabilities and Equity | $ | $ | |||||||||
See Notes to Consolidated Financial Statements
121
| FINANCIAL STATEMENTS | |||||
PIEDMONT NATURAL GAS COMPANY, INC.
CONSOLIDATED STATEMENTS OF CASH FLOWS
| Years Ended December 31, | |||||||||||||||||
| (in millions) | 2023 | 2022 | 2021 | ||||||||||||||
| CASH FLOWS FROM OPERATING ACTIVITIES | |||||||||||||||||
| Net income | $ | $ | $ | ||||||||||||||
| Adjustments to reconcile net income to net cash provided by operating activities: | |||||||||||||||||
| Depreciation and amortization | |||||||||||||||||
| Equity component of AFUDC | ( | ( | ( | ||||||||||||||
| Impairment of assets and other charges | ( | ||||||||||||||||
| Deferred income taxes | |||||||||||||||||
| Contributions to qualified pension plans | ( | ( | — | ||||||||||||||
| Equity in earnings from unconsolidated affiliates | ( | ( | ( | ||||||||||||||
| Provision for rate refunds | — | ( | ( | ||||||||||||||
| (Increase) decrease in | |||||||||||||||||
| Receivables | ( | ( | |||||||||||||||
| Receivables from affiliated companies | — | ( | |||||||||||||||
| Inventory | ( | ( | |||||||||||||||
| Other current assets | ( | ||||||||||||||||
| Increase (decrease) in | |||||||||||||||||
| Accounts payable | ( | ( | |||||||||||||||
| Accounts payable to affiliated companies | ( | ||||||||||||||||
| Taxes accrued | |||||||||||||||||
| Other current liabilities | ( | ||||||||||||||||
| Other assets | ( | ||||||||||||||||
| Other liabilities | ( | ( | |||||||||||||||
| Net cash provided by operating activities | |||||||||||||||||
| CASH FLOWS FROM INVESTING ACTIVITIES | |||||||||||||||||
| Capital expenditures | ( | ( | ( | ||||||||||||||
| Contributions to equity method investments | — | ( | ( | ||||||||||||||
| Other | ( | ( | ( | ||||||||||||||
| Net cash used in investing activities | ( | ( | ( | ||||||||||||||
| CASH FLOWS FROM FINANCING ACTIVITIES | |||||||||||||||||
| Proceeds from the issuance of long-term debt | |||||||||||||||||
| Payments for the redemption of long-term debt | ( | — | ( | ||||||||||||||
| Notes payable to affiliated companies | ( | ( | |||||||||||||||
| Capital contribution from parent | — | — | |||||||||||||||
| Other | — | ( | — | ||||||||||||||
| Net cash provided by financing activities | |||||||||||||||||
| Net increase (decrease) in cash and cash equivalents | — | — | — | ||||||||||||||
| Cash and cash equivalents at beginning of period | — | — | — | ||||||||||||||
| Cash and cash equivalents at end of period | $ | — | $ | — | $ | — | |||||||||||
| Supplemental Disclosures: | |||||||||||||||||
| Cash paid for interest, net of amount capitalized | $ | $ | $ | ||||||||||||||
| Cash paid for (received from) income taxes | ( | ||||||||||||||||
| Significant non-cash transactions: | |||||||||||||||||
| Accrued capital expenditures | |||||||||||||||||
See Notes to Consolidated Financial Statements
122
| FINANCIAL STATEMENTS | |||||
PIEDMONT NATURAL GAS COMPANY, INC.
CONSOLIDATED STATEMENTS OF CHANGES IN EQUITY
| Total | |||||||||||||||||||||||||||||
| Piedmont | |||||||||||||||||||||||||||||
| Natural Gas | |||||||||||||||||||||||||||||
| Common | Retained | Company, Inc. | Noncontrolling | Total | |||||||||||||||||||||||||
| (in millions) | Stock | Earnings | Equity | Interests | Equity | ||||||||||||||||||||||||
| Balance at December 31, 2020 | $ | $ | $ | $ | $ | ||||||||||||||||||||||||
| Net income | — | — | |||||||||||||||||||||||||||
| Contribution from parent | — | — | |||||||||||||||||||||||||||
| Other | — | ( | ( | — | ( | ||||||||||||||||||||||||
| Balance at December 31, 2021 | $ | $ | $ | $ | $ | ||||||||||||||||||||||||
| Net income | — | — | |||||||||||||||||||||||||||
| Other | — | — | — | ||||||||||||||||||||||||||
| Balance at December 31, 2022 | $ | $ | $ | $ | $ | ||||||||||||||||||||||||
| Net income | — | — | |||||||||||||||||||||||||||
| Balance at December 31, 2023 | $ | $ | $ | $ | $ | ||||||||||||||||||||||||
See Notes to Consolidated Financial Statements
123
| FINANCIAL STATEMENTS | SUMMARY OF SIGNIFICANT ACCOUNTING POLICIES | ||||
Index to Combined Notes To Consolidated Financial Statements
The notes to the consolidated financial statements are a combined presentation. The following table indicates the registrants to which the notes apply.
| Applicable Notes | |||||||||||||||||||||||||||||||||||||||||||||||||||||||||||||||||||||||||||||||||||
| Registrant | 1 | 2 | 3 | 4 | 5 | 6 | 7 | 8 | 9 | 10 | 11 | 12 | 13 | 14 | 15 | 16 | 17 | 18 | 19 | 20 | 21 | 22 | 23 | 24 | 25 | 26 | 27 | ||||||||||||||||||||||||||||||||||||||||||||||||||||||||
| Duke Energy | • | • | • | • | • | • | • | • | • | • | • | • | • | • | • | • | • | • | • | • | • | • | • | • | • | • | |||||||||||||||||||||||||||||||||||||||||||||||||||||||||
| Duke Energy Carolinas | • | • | • | • | • | • | • | • | • | • | • | • | • | • | • | • | • | • | • | • | • | • | |||||||||||||||||||||||||||||||||||||||||||||||||||||||||||||
| Progress Energy | • | • | • | • | • | • | • | • | • | • | • | • | • | • | • | • | • | • | • | • | • | ||||||||||||||||||||||||||||||||||||||||||||||||||||||||||||||
| Duke Energy Progress | • | • | • | • | • | • | • | • | • | • | • | • | • | • | • | • | • | • | • | • | • | ||||||||||||||||||||||||||||||||||||||||||||||||||||||||||||||
| Duke Energy Florida | • | • | • | • | • | • | • | • | • | • | • | • | • | • | • | • | • | • | • | • | • | ||||||||||||||||||||||||||||||||||||||||||||||||||||||||||||||
| Duke Energy Ohio | • | • | • | • | • | • | • | • | • | • | • | • | • | • | • | • | • | • | • | • | |||||||||||||||||||||||||||||||||||||||||||||||||||||||||||||||
| Duke Energy Indiana | • | • | • | • | • | • | • | • | • | • | • | • | • | • | • | • | • | • | • | • | • | • | • | ||||||||||||||||||||||||||||||||||||||||||||||||||||||||||||
| Piedmont | • | • | • | • | • | • | • | • | • | • | • | • | • | • | • | • | • | • | • | • | |||||||||||||||||||||||||||||||||||||||||||||||||||||||||||||||
Tables within the notes may not sum across due to (i) Progress Energy's consolidation of Duke Energy Progress, Duke Energy Florida and other subsidiaries that are not registrants and (ii) subsidiaries that are not registrants but included in the consolidated Duke Energy balances.
1. SUMMARY OF SIGNIFICANT ACCOUNTING POLICIES
Nature of Operations and Basis of Consolidation
Duke Energy is an energy company headquartered in Charlotte, North Carolina, subject to regulation by the FERC and other regulatory agencies listed below. Duke Energy operates in the U.S. primarily through its direct and indirect subsidiaries. Certain Duke Energy subsidiaries are also subsidiary registrants, including Duke Energy Carolinas; Progress Energy; Duke Energy Progress; Duke Energy Florida; Duke Energy Ohio; Duke Energy Indiana and Piedmont. When discussing Duke Energy’s consolidated financial information, it necessarily includes the results of its separate Subsidiary Registrants, which along with Duke Energy, are collectively referred to as the Duke Energy Registrants.
The information in these combined notes relates to each of the Duke Energy Registrants as noted in the Index to Combined Notes to Consolidated Financial Statements. However, none of the Subsidiary Registrants make any representation as to information related solely to Duke Energy or the Subsidiary Registrants of Duke Energy other than itself.
These Consolidated Financial Statements include, after eliminating intercompany transactions and balances, the accounts of the Duke Energy Registrants and subsidiaries or VIEs where the respective Duke Energy Registrants have control. See Note 18 for additional information on VIEs. These Consolidated Financial Statements also reflect the Duke Energy Registrants’ proportionate share of certain jointly owned generation and transmission facilities. See Note 9 for additional information on joint ownership. Substantially all of the Subsidiary Registrants' operations qualify for regulatory accounting.
Duke Energy Carolinas is a regulated public utility primarily engaged in the generation, transmission, distribution and sale of electricity in portions of North Carolina and South Carolina. Duke Energy Carolinas is subject to the regulatory provisions of the NCUC, PSCSC, NRC and FERC.
Progress Energy is a public utility holding company, which conducts operations through its wholly owned subsidiaries, Duke Energy Progress and Duke Energy Florida. Progress Energy is subject to regulation by FERC and other regulatory agencies listed below.
Duke Energy Progress is a regulated public utility primarily engaged in the generation, transmission, distribution and sale of electricity in portions of North Carolina and South Carolina. Duke Energy Progress is subject to the regulatory provisions of the NCUC, PSCSC, NRC and FERC.
Duke Energy Florida is a regulated public utility primarily engaged in the generation, transmission, distribution and sale of electricity in portions of Florida. Duke Energy Florida is subject to the regulatory provisions of the FPSC, NRC and FERC.
Duke Energy Ohio is a regulated public utility primarily engaged in the transmission and distribution of electricity in portions of Ohio and Kentucky, the generation and sale of electricity in portions of Kentucky and the transportation and sale of natural gas in portions of Ohio and Kentucky. Duke Energy Ohio conducts competitive auctions for retail electricity supply in Ohio whereby the energy price is recovered from retail customers and recorded in Operating Revenues on the Consolidated Statements of Operations and Comprehensive Income. Operations in Kentucky are conducted through its wholly owned subsidiary, Duke Energy Kentucky. References herein to Duke Energy Ohio collectively include Duke Energy Ohio and its subsidiaries, unless otherwise noted. Duke Energy Ohio is subject to the regulatory provisions of the PUCO, KPSC and FERC.
Duke Energy Indiana is a regulated public utility primarily engaged in the generation, transmission, distribution and sale of electricity in portions of Indiana. Duke Energy Indiana is subject to the regulatory provisions of the IURC and FERC.
Piedmont is a regulated public utility primarily engaged in the distribution of natural gas in portions of North Carolina, South Carolina and Tennessee. Piedmont is subject to the regulatory provisions of the NCUC, PSCSC, TPUC and FERC.
Certain prior year amounts have been reclassified to conform to the current year presentation.
124
| FINANCIAL STATEMENTS | SUMMARY OF SIGNIFICANT ACCOUNTING POLICIES | ||||
Other Current Assets and Liabilities
The following table provides a description of amounts included in Other within Current Assets or Current Liabilities that exceed 5% of total Current Assets or Current Liabilities on the Duke Energy Registrants' Consolidated Balance Sheets at either December 31, 2023, or 2022.
| December 31, | |||||||||||||||||
| (in millions) | Location | 2023 | 2022 | ||||||||||||||
| Duke Energy Carolinas | |||||||||||||||||
| Accrued compensation | Current Liabilities | $ | $ | ||||||||||||||
| Duke Energy Florida | |||||||||||||||||
Customer deposits/Collateral liabilities | Current Liabilities | $ | $ | ||||||||||||||
| Duke Energy Ohio | |||||||||||||||||
| Gas Storage | Current Assets | $ | $ | ||||||||||||||
Tax receivables | Current Assets | ||||||||||||||||
| Duke Energy Indiana | |||||||||||||||||
| Mark-to-market transactions | Current Assets | $ | $ | ||||||||||||||
Customer advances | Current Liabilities | $ | $ | ||||||||||||||
Discontinued Operations
Noncontrolling Interest
Duke Energy maintains a controlling financial interest in certain less than wholly owned subsidiaries. As a result, Duke Energy consolidates these subsidiaries and presents the third-party investors' portion of Duke Energy's net income (loss), net assets and comprehensive income (loss) as noncontrolling interest. Noncontrolling interest is included as a component of equity on the Consolidated Balance Sheets. Operating agreements of Duke Energy's subsidiaries with noncontrolling interest allocate profit and loss based on their pro rata shares of the ownership interest in the respective subsidiary. Therefore, Duke Energy allocates net income or loss and other comprehensive income or loss of these subsidiaries to the owners based on their pro rata shares.
Significant Accounting Policies
Use of Estimates
In preparing financial statements that conform to GAAP, the Duke Energy Registrants must make estimates and assumptions that affect the reported amounts of assets and liabilities, the reported amounts of revenues and expenses and the disclosure of contingent assets and liabilities at the date of the financial statements. Actual results could differ from those estimates.
Regulatory Accounting
The majority of the Duke Energy Registrants’ operations are subject to price regulation for the sale of electricity and natural gas by state utility commissions or FERC. When prices are set on the basis of specific costs of the regulated operations and an effective franchise is in place such that sufficient natural gas or electric services can be sold to recover those costs, the Duke Energy Registrants apply regulatory accounting. Regulatory accounting changes the timing of the recognition of costs or revenues relative to a company that does not apply regulatory accounting. As a result, regulatory assets and regulatory liabilities are recognized on the Consolidated Balance Sheets. Regulatory assets and liabilities are amortized consistent with the treatment of the related cost in the ratemaking process. Regulatory assets are reviewed for recoverability each reporting period. If a regulatory asset is no longer deemed probable of recovery, the deferred cost is charged to earnings. See Note 4 for further information.
Regulatory accounting rules also require recognition of a disallowance (also called "impairment") loss if it becomes probable that part of the cost of a plant under construction (or a recently completed plant or an abandoned plant) will be disallowed for ratemaking purposes and a reasonable estimate of the amount of the disallowance can be made. For example, if a cost cap is set for a plant still under construction, the amount of the disallowance is a result of a judgment as to the ultimate cost of the plant. These disallowances can require judgments on allowed future rate recovery.
When it becomes probable that regulated generation, transmission or distribution assets will be abandoned, the cost of the asset is removed from plant in service. The value that may be retained as a regulatory asset on the balance sheet for the abandoned property is dependent upon amounts that may be recovered through regulated rates, including any return. As such, an impairment charge could be partially or fully offset by the establishment of a regulatory asset if rate recovery is probable. The impairment charge for a disallowance of costs for regulated plants under construction, recently completed or abandoned is based on discounted cash flows.
125
| FINANCIAL STATEMENTS | SUMMARY OF SIGNIFICANT ACCOUNTING POLICIES | ||||
Cash, Cash Equivalents and Restricted Cash
| December 31, 2023 | |||||||||||||||||||||||||||||
| Duke | Duke | Duke | |||||||||||||||||||||||||||
| Duke | Energy | Progress | Energy | Energy | |||||||||||||||||||||||||
(in millions) | Energy | Carolinas | Energy | Progress | Florida | ||||||||||||||||||||||||
| Current Assets | |||||||||||||||||||||||||||||
| Cash and cash equivalents | $ | $ | $ | $ | $ | ||||||||||||||||||||||||
| Other | |||||||||||||||||||||||||||||
| Other Noncurrent Assets | |||||||||||||||||||||||||||||
| Other | |||||||||||||||||||||||||||||
| Total cash, cash equivalents and restricted cash | $ | $ | $ | $ | $ | ||||||||||||||||||||||||
| December 31, 2022 | |||||||||||||||||||||||||||||
| Duke | Duke | Duke | |||||||||||||||||||||||||||
| Duke | Energy | Progress | Energy | Energy | |||||||||||||||||||||||||
(in millions) | Energy | Carolinas | Energy | Progress | Florida | ||||||||||||||||||||||||
| Current Assets | |||||||||||||||||||||||||||||
| Cash and cash equivalents | $ | $ | $ | $ | $ | ||||||||||||||||||||||||
| Other | |||||||||||||||||||||||||||||
| Other Noncurrent Assets | |||||||||||||||||||||||||||||
| Other | — | ||||||||||||||||||||||||||||
| Total cash, cash equivalents and restricted cash | $ | $ | $ | $ | $ | ||||||||||||||||||||||||
Inventory
| December 31, 2023 | |||||||||||||||||||||||||||||||||||||||||||||||
| Duke | Duke | Duke | Duke | Duke | |||||||||||||||||||||||||||||||||||||||||||
| Duke | Energy | Progress | Energy | Energy | Energy | Energy | |||||||||||||||||||||||||||||||||||||||||
| (in millions) | Energy | Carolinas | Energy | Progress | Florida | Ohio | Indiana | Piedmont | |||||||||||||||||||||||||||||||||||||||
| Materials and supplies | $ | $ | $ | $ | $ | $ | $ | $ | |||||||||||||||||||||||||||||||||||||||
| Coal | — | ||||||||||||||||||||||||||||||||||||||||||||||
| Natural gas, oil and other | |||||||||||||||||||||||||||||||||||||||||||||||
| Total inventory | $ | $ | $ | $ | $ | $ | $ | $ | |||||||||||||||||||||||||||||||||||||||
| December 31, 2022 | |||||||||||||||||||||||||||||||||||||||||||||||
| Duke | Duke | Duke | Duke | Duke | |||||||||||||||||||||||||||||||||||||||||||
| Duke | Energy | Progress | Energy | Energy | Energy | Energy | |||||||||||||||||||||||||||||||||||||||||
| (in millions) | Energy | Carolinas | Energy | Progress | Florida | Ohio | Indiana | Piedmont | |||||||||||||||||||||||||||||||||||||||
| Materials and supplies | $ | $ | $ | $ | $ | $ | $ | $ | |||||||||||||||||||||||||||||||||||||||
| Coal | — | ||||||||||||||||||||||||||||||||||||||||||||||
| Natural gas, oil and other | |||||||||||||||||||||||||||||||||||||||||||||||
| Total inventory | $ | $ | $ | $ | $ | $ | $ | $ | |||||||||||||||||||||||||||||||||||||||
126
| FINANCIAL STATEMENTS | SUMMARY OF SIGNIFICANT ACCOUNTING POLICIES | ||||
Investments in Debt and Equity Securities
Goodwill
Duke Energy, Progress Energy, Duke Energy Ohio and Piedmont perform annual goodwill impairment tests as of August 31 each year at the reporting unit level, which is determined to be a business segment or one level below. Duke Energy, Progress Energy, Duke Energy Ohio and Piedmont update these tests between annual tests if events or circumstances occur that would more likely than not reduce the fair value of a reporting unit below its carrying value. See Note 12 for further information.
Intangible Assets
Intangible assets are included in Other in Other Noncurrent Assets on the Consolidated Balance Sheets. Generally, intangible assets are amortized using an amortization method that reflects the pattern in which the economic benefits of the intangible asset are consumed or on a straight-line basis if that pattern is not readily determinable. Amortization of intangibles is reflected in Depreciation and amortization on the Consolidated Statements of Operations. Intangible assets are subject to impairment testing and if impaired, the carrying value is accordingly reduced.
Long-Lived Asset Impairments
The Duke Energy Registrants evaluate long-lived assets that are held and used, excluding goodwill, for impairment when circumstances indicate the carrying value of those assets may not be recoverable. An impairment exists when a long-lived asset’s carrying value exceeds the estimated undiscounted cash flows expected to result from the use and eventual disposition of the asset. The estimated cash flows may be based on alternative expected outcomes that are probability weighted. If the carrying value of the long-lived asset is not recoverable based on these estimated future undiscounted cash flows, the carrying value of the asset is written down to its then current estimated fair value and an impairment charge is recognized.
The Duke Energy Registrants assess fair value of long-lived assets that are held and used using various methods, including recent comparable third-party sales, internally developed discounted cash flow analysis and analysis from outside advisors. Triggering events to reassess cash flows may include, but are not limited to, significant changes in commodity prices, the condition of an asset or management’s interest in selling the asset.
Property, Plant and Equipment
Property, plant and equipment are stated at the lower of depreciated historical cost net of any disallowances or fair value, if impaired. The Duke Energy Registrants capitalize all construction-related direct labor and material costs, as well as indirect construction costs such as general engineering, taxes and financing costs. See “Allowance for Funds Used During Construction and Interest Capitalized” section below for information on capitalized financing costs. Costs of renewals and betterments that extend the useful life of property, plant and equipment are also capitalized. The cost of repairs, replacements and major maintenance projects, which do not extend the useful life or increase the expected output of the asset, are expensed as incurred. Depreciation is generally computed over the estimated useful life of the asset using the composite straight-line method. Depreciation studies are conducted periodically to update composite rates and are approved by state utility commissions and/or the FERC when required. The composite weighted average depreciation rates, excluding nuclear fuel, are included in the table that follows.
| Years Ended December 31, | |||||||||||||||||
| 2023 | 2022 | 2021 | |||||||||||||||
| Duke Energy | % | % | % | ||||||||||||||
| Duke Energy Carolinas | % | % | % | ||||||||||||||
| Progress Energy | % | % | % | ||||||||||||||
| Duke Energy Progress | % | % | % | ||||||||||||||
| Duke Energy Florida | % | % | % | ||||||||||||||
| Duke Energy Ohio | % | % | % | ||||||||||||||
| Duke Energy Indiana | % | % | % | ||||||||||||||
| Piedmont | % | % | % | ||||||||||||||
127
| FINANCIAL STATEMENTS | SUMMARY OF SIGNIFICANT ACCOUNTING POLICIES | ||||
In general, when the Duke Energy Registrants retire regulated property, plant and equipment, the original cost plus the cost of retirement, less salvage value and any depreciation already recognized, is charged to accumulated depreciation. However, when it becomes probable the asset will be retired substantially in advance of its original expected useful life or is abandoned, the cost of the asset and the corresponding accumulated depreciation is recognized as a separate asset. If the asset is still in operation, the net amount is classified as Facilities to be retired, net on the Consolidated Balance Sheets. If the asset is no longer operating, the net amount is classified in Regulatory assets on the Consolidated Balance Sheets if deemed recoverable (see discussion of long-lived asset impairments above). The carrying value of the asset is based on historical cost if the Duke Energy Registrants are allowed to recover the remaining net book value and a return equal to at least the incremental borrowing rate. If not, an impairment is recognized to the extent the net book value of the asset exceeds the present value of future revenues discounted at the incremental borrowing rate.
Other Noncurrent Assets
Duke Energy, through a nonregulated subsidiary, was the winner of the Carolina Long Bay offshore wind auction in May 2022 and recorded an asset of $150
Leases
Duke Energy determines if an arrangement is a lease at contract inception based on whether the arrangement involves the use of a physically distinct identified asset and whether Duke Energy has the right to obtain substantially all of the economic benefits from the use of the asset throughout the period as well as the right to direct the use of the asset. As a policy election, Duke Energy does not evaluate arrangements with initial contract terms of less than one year as leases.
Operating leases are included in Operating lease ROU assets, net, Other current liabilities and Operating lease liabilities on the Consolidated Balance Sheets. Finance leases are included in Property, Plant and Equipment, Current maturities of long-term debt and Long-Term Debt on the Consolidated Balance Sheets.
For lessee and lessor arrangements, Duke Energy has elected a policy to not separate lease and non-lease components for all asset classes. For lessor arrangements, lease and non-lease components are only combined under one arrangement and accounted for under the lease accounting framework if the non-lease components are not the predominant component of the arrangement and the lease component would be classified as an operating lease.
Nuclear Fuel
Nuclear fuel is classified as Property, Plant and Equipment on the Consolidated Balance Sheets.
Nuclear fuel in the front-end fuel processing phase is considered work in progress and not amortized until placed in service. Amortization of nuclear fuel is included within Fuel used in electric generation and purchased power on the Consolidated Statements of Operations. Amortization is recorded using the units-of-production method.
Allowance for Funds Used During Construction and Interest Capitalized
For regulated operations, the debt and equity costs of financing the construction of property, plant and equipment are reflected as AFUDC and capitalized as a component of the cost of property, plant and equipment. AFUDC equity is reported on the Consolidated Statements of Operations as non-cash income in Other income and expenses, net. AFUDC debt is reported as a non-cash offset to Interest Expense. After construction is completed, the Duke Energy Registrants are permitted to recover these costs through their inclusion in rate base and the corresponding subsequent depreciation or amortization of those regulated assets.
AFUDC equity, a permanent difference for income taxes, reduces the ETR when capitalized and increases the ETR when depreciated or amortized. See Note 24 for additional information.
Asset Retirement Obligations
AROs are recognized for legal obligations associated with the retirement of property, plant and equipment. When recording an ARO, the present value of the projected liability is recognized in the period in which it is incurred, if a reasonable estimate of fair value can be made. The liability is accreted over time. For operating plants, the present value of the liability is added to the cost of the associated asset and depreciated over the remaining life of the asset. For retired plants, the present value of the liability is recorded as a regulatory asset unless determined not to be probable of recovery.
The present value of the initial obligation and subsequent updates are based on discounted cash flows, which include estimates regarding timing of future cash flows, selection of discount rates and cost escalation rates, among other factors. These estimates are subject to change. Depreciation expense is adjusted prospectively for any changes to the carrying amount of the associated asset. The Duke Energy Registrants receive amounts to fund the cost of the ARO for regulated operations through a combination of regulated revenues and earnings on the NDTF. As a result, amounts recovered in regulated revenues, earnings on the NDTF, accretion expense and depreciation of the associated asset are netted and deferred as a regulatory asset or liability.
128
| FINANCIAL STATEMENTS | SUMMARY OF SIGNIFICANT ACCOUNTING POLICIES | ||||
Accounts Payable
The following table presents the outstanding accounts payable balance sold to the financial institution by our suppliers and the supplier invoices sold to the financial institution under the program included within Net cash provided by operating activities on the Consolidated Statements of Cash Flows as of December 31, 2023, and December 31, 2022.
For the Years Ended December 31, 2022 and 2023 | ||||||||||||||||||||||||||
| Duke | Duke | Duke | Duke | Duke | ||||||||||||||||||||||
| Duke | Energy | Progress | Energy | Energy | Energy | Energy | ||||||||||||||||||||
| (in millions) | Energy | Carolinas | Energy | Progress | Florida | Ohio | Indiana | Piedmont | ||||||||||||||||||
Confirmed obligations outstanding at December 31, 2021 | $ | $ | $ | $ | $ | $ | $ | — | $ | |||||||||||||||||
Invoices confirmed during the period | ||||||||||||||||||||||||||
Confirmed invoices paid during the period | ( | ( | ( | ( | ( | ( | ( | ( | ||||||||||||||||||
Confirmed obligations outstanding at December 31, 2022 | $ | $ | $ | $ | $ | $ | $ | — | $ | |||||||||||||||||
Invoices confirmed during the period | — | |||||||||||||||||||||||||
Confirmed invoices paid during the period | ( | ( | ( | ( | ( | ( | — | ( | ||||||||||||||||||
Confirmed obligations outstanding at December 31, 2023 | $ | $ | $ | $ | $ | $ | $ | — | $ | |||||||||||||||||
Revenue Recognition
Duke Energy recognizes revenue as customers obtain control of promised goods and services in an amount that reflects consideration expected in exchange for those goods or services. Generally, the delivery of electricity and natural gas results in the transfer of control to customers at the time the commodity is delivered and the amount of revenue recognized is equal to the amount billed to each customer, including estimated volumes delivered when billings have not yet occurred. See Note 19 for further information.
Alternative Revenue Programs
Duke Energy accounts for certain types of programs established by the regulators in the states in which it operates, including decoupling mechanisms, as alternative revenue programs. Alternative revenue programs are contracts between an entity and its regulator, not a contract between an entity and a customer. Revenue arising from alternative revenue programs is presented as Regulated electric revenues and Regulated natural gas revenues on the Consolidated Statements of Operations. Revenue from alternative revenue programs is recognized in the period they are earned (i.e. during the period of revenue shortfall or excess due to fluctuations in customer usage or when specific targets are met resulting in the achievement of performance incentives or penalties) and a regulatory asset or liability on the Consolidated Balance Sheets is established which is subsequently billed or refunded to customers. Duke Energy recognizes revenue as alternative revenue programs for programs that have been authorized for rate recovery, are objectively determinable and probable of recovery, and are expected to be collected within 24 months. See Note 19 for disaggregated revenue information including revenue from contracts with customers and revenues recognized as alternative revenue programs.
Derivatives and Hedging
Derivative and non-derivative instruments may be used in connection with commodity price and interest rate activities, including swaps, futures, forwards and options. All derivative instruments, except those that qualify for the NPNS exception, are recorded on the Consolidated Balance Sheets at fair value. Qualifying derivative instruments may be designated as either cash flow hedges or fair value hedges. Other derivative instruments (undesignated contracts) either have not been designated or do not qualify as hedges. The effective portion of the change in the fair value of cash flow hedges is recorded in AOCI. The effective portion of the change in the fair value of a fair value hedge is offset in net income by changes in the hedged item. For activity subject to regulatory accounting, gains and losses on derivative contracts are reflected as regulatory assets or liabilities and not as other comprehensive income or current period income. As a result, changes in fair value of these derivatives have no immediate earnings impact.
Formal documentation, including transaction type and risk management strategy, is maintained for all contracts accounted for as a hedge. At inception and at least every three months thereafter, the hedge contract is assessed to see if it is highly effective in offsetting changes in cash flows or fair values of hedged items.
See Note 15 for further information.
Captive Insurance Reserves
Duke Energy has captive insurance subsidiaries that provide coverage, on an indemnity basis, to the Subsidiary Registrants as well as certain third parties, on a limited basis, for financial losses, primarily related to property, workers’ compensation and general liability. Liabilities include provisions for estimated losses incurred but not reported (IBNR), as well as estimated provisions for known claims. IBNR reserve estimates are primarily based upon historical loss experience, industry data and other actuarial assumptions. Reserve estimates are adjusted in future periods as actual losses differ from experience.
129
| FINANCIAL STATEMENTS | SUMMARY OF SIGNIFICANT ACCOUNTING POLICIES | ||||
Duke Energy, through its captive insurance entities, also has reinsurance coverage with third parties for certain losses above a per occurrence and/or aggregate retention. Receivables for reinsurance coverage are recognized when realization is deemed probable.
Preferred Stock
Loss Contingencies and Environmental Liabilities
Contingent losses are recorded when it is probable a loss has occurred and the loss can be reasonably estimated. When a range of the probable loss exists and no amount within the range is a better estimate than any other amount, the minimum amount in the range is recorded. Unless otherwise required by GAAP, legal fees are expensed as incurred.
Environmental liabilities are recorded on an undiscounted basis when environmental remediation or other liabilities become probable and can be reasonably estimated. Environmental expenditures related to past operations that do not generate current or future revenues are expensed. Environmental expenditures related to operations that generate current or future revenues are expensed or capitalized, as appropriate. Certain environmental expenditures receive regulatory accounting treatment and are recorded as regulatory assets.
See Notes 4 and 5 for further information.
Severance and Special Termination Benefits
Guarantees
Income Taxes
Duke Energy and its subsidiaries file a consolidated federal income tax return and other state and foreign jurisdictional returns. The Subsidiary Registrants are parties to a tax-sharing agreement with Duke Energy. Income taxes recorded represent amounts the Subsidiary Registrants would incur as separate C-Corporations. Deferred income taxes have been provided for temporary differences between GAAP and tax bases of assets and liabilities because the differences create taxable or tax-deductible amounts for future periods. ITCs associated with regulated operations are deferred and amortized as a reduction of income tax expense over the estimated useful lives of the related properties.
Accumulated deferred income taxes are valued using the enacted tax rate expected to apply to taxable income in the periods in which the deferred tax asset or liability is expected to be settled or realized. In the event of a change in tax rates, deferred tax assets and liabilities are remeasured as of the enactment date of the new rate. To the extent that the change in the value of the deferred tax represents an obligation to customers, the impact of the remeasurement is deferred to a regulatory liability. Remaining impacts are recorded in income from continuing operations. Duke Energy's results of operations could be impacted if the estimate of the tax effect of reversing temporary differences is not reflective of actual outcomes, is modified to reflect new developments or interpretations of the tax law, revised to incorporate new accounting principles, or changes in the expected timing or manner of a reversal.
Tax-related interest and penalties are recorded in Interest Expense and Other income and expenses, net in the Consolidated Statements of Operations.
See Note 24 for further information.
130
| FINANCIAL STATEMENTS | SUMMARY OF SIGNIFICANT ACCOUNTING POLICIES | ||||
Excise Taxes
| Years Ended December 31, | |||||||||||||||||
| (in millions) | 2023 | 2022 | 2021 | ||||||||||||||
| Duke Energy | $ | $ | $ | ||||||||||||||
| Duke Energy Carolinas | |||||||||||||||||
| Progress Energy | |||||||||||||||||
| Duke Energy Progress | |||||||||||||||||
| Duke Energy Florida | |||||||||||||||||
| Duke Energy Ohio | |||||||||||||||||
| Duke Energy Indiana | |||||||||||||||||
| Piedmont | |||||||||||||||||
Dividend Restrictions and Unappropriated Retained Earnings
New Accounting Standards
The following accounting standard was adopted by the Duke Energy Registrants in 2021.
Leases with Variable Lease Payments. In July 2021, the Financial Accounting Standards Board issued new accounting guidance requiring lessors to classify a lease with variable lease payments that do not depend on a reference index or rate as an operating lease if both of the following are met: (1) the lease would have to be classified as a sales-type or direct financing lease under prior guidance, and (2) the lessor would have recognized a day-one loss. Duke Energy elected to adopt the guidance immediately upon issuance of the new standard and will be applying the new standard prospectively to new lease arrangements meeting the criteria. Duke Energy did not have any lease arrangements that this new accounting guidance materially impacted.
2. DISPOSITIONS
The following table summarizes the Loss from Discontinued Operations, net of tax recorded on Duke Energy's Consolidated Statements of Operations:
| Years Ended December 31, | ||||||||||||||
| (in millions) | 2023 | 2022 | 2021 | |||||||||||
| Commercial Renewables Disposal Groups | $ | ( | $ | ( | $ | ( | ||||||||
Other(a) | ||||||||||||||
| Loss from Discontinued Operations, net of tax | $ | ( | $ | ( | $ | ( | ||||||||
(a) Amounts primarily represent income tax adjustments for previously sold businesses not related to the Commercial Renewables Disposal Groups.
Sale of Commercial Renewables Segment
In November 2022, Duke Energy committed to a plan to sell the Commercial Renewables business segment, excluding the offshore wind contract for Carolina Long Bay, which was moved to the EU&I segment. In June 2023, Duke Energy announced that it had entered into a purchase and sale agreement with affiliates of Brookfield for the sale of the utility-scale solar and wind group. Duke Energy closed on this transaction on October 25, 2023, for proceeds of $1.1 billion, with approximately half of the proceeds received at closing and the remainder due 18 months after closing. The balance of the proceeds to be received is classified in Other, within Other Noncurrent Asset on Duke Energy's Consolidated Balance Sheets. In July 2023, Duke Energy announced that it had entered into a purchase and sale agreement with affiliates of ArcLight for the distributed generation group. Duke Energy closed on this transaction on October 4, 2023, and received proceeds of $243 million. These proceeds amounts are gross of cash divested as part of the sales of the utility-scale wind and solar group and the distributed generation group, which totaled approximately $75 million. In March 2023, assets for certain projects were removed from the utility-scale solar and wind group and placed in a separate disposal group. The disposal process for the remaining assets is expected to be completed in the first half of 2024, with net proceeds from the dispositions not anticipated to be material.
131
| FINANCIAL STATEMENTS | DISPOSITIONS | ||||
Assets Held For Sale and Discontinued Operations
The Commercial Renewables Disposal Groups were classified as held for sale and as discontinued operations in the fourth quarter of 2022. No interest from corporate level debt was allocated to discontinued operations and no adjustments were made to the historical activity within the Consolidated Statements of Comprehensive Income, Consolidated Statements of Cash Flows or the Consolidated Statements of Changes in Equity. Unless otherwise noted, the notes to these consolidated financial statements exclude amounts related to discontinued operations for all periods presented.
The following table presents the carrying values of the major classes of Assets held for sale and Liabilities associated with assets held for sale included in Duke Energy's Consolidated Balance Sheets.
| December 31, | ||||||||||||||
| (in millions) | 2023 | 2022 | ||||||||||||
| Current Assets Held for Sale | ||||||||||||||
| Cash and cash equivalents | $ | $ | ||||||||||||
| Receivables, net | ||||||||||||||
| Inventory | ||||||||||||||
| Other | ||||||||||||||
| Total current assets held for sale | ||||||||||||||
| Noncurrent Assets Held for Sale | ||||||||||||||
| Property, Plant and Equipment | ||||||||||||||
| Cost | ||||||||||||||
| Accumulated depreciation and amortization | ( | ( | ||||||||||||
| Net property, plant and equipment | ||||||||||||||
| Operating lease right-of-use assets, net | ||||||||||||||
| Investments in equity method unconsolidated affiliates | ||||||||||||||
| Other | ||||||||||||||
| Total other noncurrent assets held for sale | ||||||||||||||
| Total Assets Held for Sale | $ | $ | ||||||||||||
| Current Liabilities Associated with Assets Held for Sale | ||||||||||||||
| Accounts payable | $ | $ | ||||||||||||
| Taxes accrued | ||||||||||||||
Current maturities of long-term debt | ||||||||||||||
Unrealized losses on commodity hedges | ||||||||||||||
| Other | ||||||||||||||
| Total current liabilities associated with assets held for sale | ||||||||||||||
| Noncurrent Liabilities Associated with Assets Held for Sale | ||||||||||||||
| Long-Term debt | ||||||||||||||
| Operating lease liabilities | ||||||||||||||
| Asset retirement obligations | ||||||||||||||
Unrealized losses on commodity hedges | ||||||||||||||
| Other | ||||||||||||||
| Total other noncurrent liabilities associated with assets held for sale | ||||||||||||||
| Total Liabilities Associated with Assets Held for Sale | $ | $ | ||||||||||||
132
| FINANCIAL STATEMENTS | DISPOSITIONS | ||||
As of December 31, 2023, and 2022, the noncontrolling interest balance is $66.3 million and $1.6 billion, respectively.
The following table presents the results of the Commercial Renewables Disposal Groups, which are included in Loss from Discontinued Operations, net of tax in Duke Energy's Consolidated Statements of Operations.
| Years Ended December 31, | |||||||||||||||||
| (in millions) | 2023 | 2022 | 2021 | ||||||||||||||
| Operating revenues | $ | $ | $ | ||||||||||||||
| Operation, maintenance and other | |||||||||||||||||
Depreciation and amortization(a) | |||||||||||||||||
| Property and other taxes | |||||||||||||||||
| Other income and expenses, net | ( | ( | |||||||||||||||
| Interest expense | |||||||||||||||||
| Loss on disposal | |||||||||||||||||
| Loss before income taxes | ( | ( | ( | ||||||||||||||
| Income tax benefit | ( | ( | ( | ||||||||||||||
| Loss from discontinued operations | $ | ( | $ | ( | $ | ( | |||||||||||
| Add: Net loss attributable to noncontrolling interest included in discontinued operations | |||||||||||||||||
Net (loss) income from discontinued operations attributable to Duke Energy Corporation | $ | ( | $ | ( | $ | ||||||||||||
(a) Upon meeting the criteria for assets held for sale, beginning in November 2022 depreciation and amortization expense were ceased.
The Commercial Renewables Disposal Groups' assets held for sale amounts presented above reflect pretax impairments recorded against property, plant and equipment of approximately $278 million and $1.7 billion as of December 31, 2023, and 2022, respectively. In connection with the sales of the utility-scale solar and wind group and the distributed generation group, impairments were recorded based upon the purchase and sale agreements and the net assets were derecognized following the closing of the sales. For the remainder of the assets, impairments were recorded based upon fair value determined from a discounted cash flow analysis. The impairments were included in Loss from Discontinued Operations, net of tax in Duke Energy's Consolidated Statements of Operations and Comprehensive Income for the periods presented. The discounted cash flow model utilized Level 2 and Level 3 inputs. The fair value hierarchy levels are further discussed in Note 17. The impairments for the utility-scale and distributed generation assets were updated based on customary adjustments at closing, and will be updated, if necessary, for any post-closing adjustments. The carrying amounts for the remaining assets will be updated, if necessary, based on final disposition amounts.
Duke Energy has elected not to separately disclose discontinued operations on Duke Energy's Consolidated Statements of Cash Flows. The following table summarizes Duke Energy's cash flows from discontinued operations related to the Commercial Renewables Disposal Groups.
| Years Ended December 31, | |||||||||||||||||
| (in millions) | 2023 | 2022 | 2021 | ||||||||||||||
| Cash flows provided by (used in): | |||||||||||||||||
| Operating activities | $ | $ | $ | ||||||||||||||
| Investing activities | ( | ( | |||||||||||||||
Other Sale Related Matters
Duke Energy (Parent) and several Duke Energy renewables project companies, located in the Electric Reliability Council of Texas (ERCOT) market, were named in several lawsuits arising out of Texas Storm Uri, which occurred in February 2021. The legal actions related to all but one of the project companies in this matter transferred to affiliates of Brookfield in conjunction with the transaction closing in October 2023. See Note 5 for more information.
As part of the purchase and sale agreement for the distributed generation group, Duke Energy has agreed to retain certain guarantees, with expiration dates between 2029 through 2034, related to tax equity partners' assets and operations that will be disposed of via sale. Duke Energy has obtained certain guarantees from the buyers in regard to future performance obligations to assist in limiting Duke Energy's exposure under the retained guarantees. The fair value of the guarantees is immaterial as Duke Energy does not believe conditions are likely for performance under these guarantees.
Sale of Minority Interest in Duke Energy Indiana Holdco, LLC
133
| FINANCIAL STATEMENTS | BUSINESS SEGMENTS | ||||
3. BUSINESS SEGMENTS
Reportable segments are determined based on information used by the chief operating decision-maker in deciding how to allocate resources and evaluate the performance of the business. Duke Energy evaluates segment performance based on segment income. Segment income is defined as income from continuing operations net of income attributable to noncontrolling interests and preferred stock dividends. Segment income, as discussed below, includes intercompany revenues and expenses that are eliminated on the Consolidated Financial Statements. Certain governance costs are allocated to each segment. In addition, direct interest expense and income taxes are included in segment income.
Products and services are sold between affiliate companies and reportable segments of Duke Energy at cost. Segment assets as presented in the tables that follow exclude all intercompany assets.
Duke Energy
Due to Duke Energy's commitment in the fourth quarter of 2022 to sell the Commercial Renewables business segment, Duke Energy's segment structure now includes the following two segments: EU&I and GU&I. Prior period information has been recast to conform to the current segment structure. See Note 2 for further information on the Commercial Renewables Disposal Groups.
The EU&I segment includes Duke Energy's regulated electric utilities in the Carolinas, Florida and the Midwest. The regulated electric utilities conduct operations through the Subsidiary Registrants that are substantially all regulated and, accordingly, qualify for regulatory accounting treatment. EU&I also includes Duke Energy's electric transmission infrastructure investments and the offshore wind contract for Carolina Long Bay. Refer to Note 2 for further information.
The GU&I segment includes Piedmont, Duke Energy's natural gas local distribution companies in Ohio and Kentucky, and Duke Energy's natural gas storage, midstream pipeline, and renewable natural gas investments. GU&I's operations are substantially all regulated and, accordingly, qualify for regulatory accounting treatment.
The remainder of Duke Energy’s operations is presented as Other, which is primarily comprised of interest expense on holding company debt, unallocated corporate costs and Duke Energy’s wholly owned captive insurance company, Bison. Other also includes Duke Energy's interest in NMC. See Note 13 for additional information on the investment in NMC.
Business segment information is presented in the following tables. Segment assets presented exclude intercompany assets.
| Year Ended December 31, 2023 | |||||||||||||||||||||||||||||||||||
| Electric | Gas | Total | |||||||||||||||||||||||||||||||||
| Utilities and | Utilities and | Reportable | |||||||||||||||||||||||||||||||||
| (in millions) | Infrastructure | Infrastructure | Segments | Other | Eliminations | Total | |||||||||||||||||||||||||||||
| Unaffiliated Revenues | $ | $ | $ | $ | $ | — | $ | ||||||||||||||||||||||||||||
| Intersegment Revenues | ( | — | |||||||||||||||||||||||||||||||||
| Total Revenues | $ | $ | $ | $ | $ | ( | $ | ||||||||||||||||||||||||||||
| Interest Expense | $ | $ | $ | $ | $ | ( | $ | ||||||||||||||||||||||||||||
| Depreciation and amortization | ( | ||||||||||||||||||||||||||||||||||
| Equity in earnings of unconsolidated affiliates | — | ||||||||||||||||||||||||||||||||||
| Income tax expense (benefit) | ( | — | |||||||||||||||||||||||||||||||||
Segment income (loss)(a)(b) | ( | — | |||||||||||||||||||||||||||||||||
| Less noncontrolling interest | ( | ||||||||||||||||||||||||||||||||||
| Add back preferred stock dividend | |||||||||||||||||||||||||||||||||||
| Discontinued operations | ( | ||||||||||||||||||||||||||||||||||
| Net income | $ | ||||||||||||||||||||||||||||||||||
Capital investments expenditures and acquisitions(c) | $ | $ | $ | $ | $ | — | $ | ||||||||||||||||||||||||||||
Segment assets(d) | — | ||||||||||||||||||||||||||||||||||
(a) EU&I includes $35 million recorded with Impairment of assets and other charges and $8 million within Operations, maintenance and other primarily related to the North Carolina rate case order on Duke Energy Carolinas' Consolidated Statements of Operations; it also includes $33 million within Impairment of assets and other charges and $8 million within Operations, maintenance and other primarily related to the North Carolina rate case order on Duke Energy Progress' Consolidated Statements of Operations. See Note 4 for additional information.
(b) Other includes $110 million recorded within Operations, maintenance and other and $14 million within Impairments of assets and other charges primarily related to strategic repositioning as the Company transitions to a fully regulated utility on the Consolidated Statements of Operations. See Note 21 for additional information.
(c) Other includes capital investments expenditures and acquisitions related to the Commercial Renewables Disposal Groups.
(d) Other includes Assets Held for Sale balances related to the Commercial Renewables Disposal Groups. Refer to Note 2 for further information.
134
| FINANCIAL STATEMENTS | BUSINESS SEGMENTS | ||||
| Year Ended December 31, 2022 | |||||||||||||||||||||||||||||||||||
| Electric | Gas | Total | |||||||||||||||||||||||||||||||||
| Utilities and | Utilities and | Reportable | |||||||||||||||||||||||||||||||||
| (in millions) | Infrastructure | Infrastructure | Segments | Other | Eliminations | Total | |||||||||||||||||||||||||||||
| Unaffiliated Revenues | $ | $ | $ | $ | $ | — | $ | ||||||||||||||||||||||||||||
| Intersegment Revenues | ( | — | |||||||||||||||||||||||||||||||||
| Total Revenues | $ | $ | $ | $ | $ | ( | $ | ||||||||||||||||||||||||||||
| Interest Expense | $ | $ | $ | $ | $ | ( | $ | ||||||||||||||||||||||||||||
| Depreciation and amortization | ( | ||||||||||||||||||||||||||||||||||
| Equity in earnings of unconsolidated affiliates | — | ||||||||||||||||||||||||||||||||||
| Income tax expense (benefit) | ( | — | |||||||||||||||||||||||||||||||||
Segment income (loss)(a)(b) | ( | ( | |||||||||||||||||||||||||||||||||
| Less noncontrolling interest | |||||||||||||||||||||||||||||||||||
| Add back preferred stock dividend | |||||||||||||||||||||||||||||||||||
| Discontinued operations | ( | ||||||||||||||||||||||||||||||||||
| Net income | $ | ||||||||||||||||||||||||||||||||||
Capital investments expenditures and acquisitions(c) | $ | $ | $ | $ | $ | — | $ | ||||||||||||||||||||||||||||
Segment assets(d) | — | ||||||||||||||||||||||||||||||||||
(a) EU&I includes $386 million recorded within Impairment of assets and other charges, $46 million within Regulated electric revenues and $34 million within Noncontrolling Interests related to the Duke Energy Indiana court rulings on coal ash on the Consolidated Statements of Operations. See Note 4 for additional information.
(b) Other includes $72 million recorded within Impairment of assets and other charges, $71 million within Operations, maintenance and other and a $7 million gain within Gains on sales of other assets related to costs attributable to business transformation, including long-term real estate strategy changes and workforce realignment on the Consolidated Statements of Operations; it also includes $25 million recorded within Operations, maintenance and other related to litigation on the Consolidated Statements of Operations.
(c) Other includes capital investments expenditures and acquisitions related to the Commercial Renewables Disposal Groups.
(d) Other includes Assets Held for Sale balances related to the Commercial Renewables Disposal Groups. Refer to Note 2 for further information.
| Year Ended December 31, 2021 | |||||||||||||||||||||||||||||||||||
| Electric | Gas | Total | |||||||||||||||||||||||||||||||||
| Utilities and | Utilities and | Reportable | |||||||||||||||||||||||||||||||||
| (in millions) | Infrastructure | Infrastructure | Segments | Other | Eliminations | Total | |||||||||||||||||||||||||||||
| Unaffiliated Revenues | $ | $ | $ | $ | $ | — | $ | ||||||||||||||||||||||||||||
| Intersegment Revenues | ( | — | |||||||||||||||||||||||||||||||||
| Total Revenues | $ | $ | $ | $ | $ | ( | $ | ||||||||||||||||||||||||||||
| Interest Expense | $ | $ | $ | $ | $ | ( | $ | ||||||||||||||||||||||||||||
| Depreciation and amortization | ( | ||||||||||||||||||||||||||||||||||
Equity in earnings of unconsolidated affiliates | — | ||||||||||||||||||||||||||||||||||
| Income tax expense (benefit) | ( | — | |||||||||||||||||||||||||||||||||
Segment income (loss)(a)(b)(c) | ( | ( | |||||||||||||||||||||||||||||||||
| Less noncontrolling interest | |||||||||||||||||||||||||||||||||||
| Add back preferred stock dividend | |||||||||||||||||||||||||||||||||||
| Discontinued operations | |||||||||||||||||||||||||||||||||||
| Net income | $ | ||||||||||||||||||||||||||||||||||
Capital investments expenditures and acquisitions(d) | $ | $ | $ | $ | $ | — | $ | ||||||||||||||||||||||||||||
Segment assets(e) | — | ||||||||||||||||||||||||||||||||||
(a) EU&I includes $160 million of expense recorded within Impairment of assets and other charges, $77 million of income within Other Income and expenses, $5 million of expense within Operations, maintenance and other, $13 million of income within regulated operating revenues, $3 million of expense within interest expense and $6 million of expense within Depreciation and amortization on the Duke Energy Carolinas' Consolidated Statement of Operations related to the South Carolina Supreme Court decision on coal ash and insurance proceeds; it also includes $42 million of expense recorded within Impairment of assets and other charges, $34 million of income within Other Income and expenses, $7 million of expense within Operations, maintenance, and other, $15 million of income within Regulated electric operating revenues, $5 million of expense within interest expense and $1 million of expense within Depreciation and amortization on the Duke Energy Progress' Consolidated Statement of Operations.
(b) GU&I includes $20 million, recorded within Equity in earnings (losses) of unconsolidated affiliates on the Consolidated Statements of Operations, related to natural gas pipeline investments.
(c) Other includes $133 million recorded within Impairment of assets and other charges, $42 million within Operations, maintenance and other, and $17 million within Depreciation and amortization on the Consolidated Statements of Operations, related to the workplace and workforce realignment. See Note 11 for additional information.
135
| FINANCIAL STATEMENTS | BUSINESS SEGMENTS | ||||
(d) Other includes capital investments expenditures and acquisitions related to the Commercial Renewables Disposal Groups.
(e) Other includes Assets Held for Sale balances related to the Commercial Renewables Disposal Groups. Refer to Note 2 for further information.
Geographical Information
Substantially all assets and revenues from continuing operations are within the U.S.
Major Customers
No Subsidiary Registrant has an individual customer representing more than 10% of its revenues for the year ended December 31, 2023.
Products and Services
The following table summarizes revenues of the reportable segments by type.
| Retail | Wholesale | Retail | Total | ||||||||||||||||||||||||||
| (in millions) | Electric | Electric | Natural Gas | Other | Revenues | ||||||||||||||||||||||||
| 2023 | |||||||||||||||||||||||||||||
| Electric Utilities and Infrastructure | $ | $ | $ | — | $ | $ | |||||||||||||||||||||||
| Gas Utilities and Infrastructure | — | — | |||||||||||||||||||||||||||
| Total Reportable Segments | $ | $ | $ | $ | $ | ||||||||||||||||||||||||
| 2022 | |||||||||||||||||||||||||||||
| Electric Utilities and Infrastructure | $ | $ | $ | — | $ | $ | |||||||||||||||||||||||
| Gas Utilities and Infrastructure | — | — | |||||||||||||||||||||||||||
| Total Reportable Segments | $ | $ | $ | $ | $ | ||||||||||||||||||||||||
| 2021 | |||||||||||||||||||||||||||||
| Electric Utilities and Infrastructure | $ | $ | $ | — | $ | $ | |||||||||||||||||||||||
| Gas Utilities and Infrastructure | — | — | |||||||||||||||||||||||||||
| Total Reportable Segments | $ | $ | $ | $ | $ | ||||||||||||||||||||||||
Duke Energy Ohio
Duke Energy Ohio has two reportable segments, EU&I and GU&I.
EU&I transmits and distributes electricity in portions of Ohio and generates, distributes and sells electricity in portions of Northern Kentucky. GU&I transports and sells natural gas in portions of Ohio and Northern Kentucky. Both reportable segments conduct operations primarily through Duke Energy Ohio and its wholly owned subsidiary, Duke Energy Kentucky. The remainder of Duke Energy Ohio's operations is presented as Other.
All Duke Energy Ohio assets and revenues from continuing operations are within the U.S.
| Year Ended December 31, 2023 | |||||||||||||||||||||||||||||||||||
| Electric | Gas | Total | |||||||||||||||||||||||||||||||||
| Utilities and | Utilities and | Reportable | |||||||||||||||||||||||||||||||||
| (in millions) | Infrastructure | Infrastructure | Segments | Other | Eliminations | Total | |||||||||||||||||||||||||||||
| Total revenues | $ | $ | $ | $ | — | $ | — | $ | |||||||||||||||||||||||||||
| Interest expense | $ | $ | $ | $ | — | $ | — | $ | |||||||||||||||||||||||||||
| Depreciation and amortization | — | — | |||||||||||||||||||||||||||||||||
| Income tax expense (benefit) | ( | — | |||||||||||||||||||||||||||||||||
| Segment income (loss)/Net income | ( | — | |||||||||||||||||||||||||||||||||
| Capital expenditures | $ | $ | $ | $ | — | $ | — | $ | |||||||||||||||||||||||||||
| Segment assets | ( | ||||||||||||||||||||||||||||||||||
136
| FINANCIAL STATEMENTS | BUSINESS SEGMENTS | ||||
| Year Ended December 31, 2022 | |||||||||||||||||||||||||||||||||||
| Electric | Gas | Total | |||||||||||||||||||||||||||||||||
| Utilities and | Utilities and | Reportable | |||||||||||||||||||||||||||||||||
| (in millions) | Infrastructure | Infrastructure | Segments | Other | Eliminations | Total | |||||||||||||||||||||||||||||
| Total revenues | $ | $ | $ | $ | — | $ | — | $ | |||||||||||||||||||||||||||
| Interest expense | $ | $ | $ | $ | — | $ | — | $ | |||||||||||||||||||||||||||
| Depreciation and amortization | — | — | |||||||||||||||||||||||||||||||||
| Income tax expense (benefit) | ( | ( | ( | — | ( | ||||||||||||||||||||||||||||||
| Segment income (loss)/Net Income | ( | — | |||||||||||||||||||||||||||||||||
| Capital expenditures | $ | $ | $ | $ | — | $ | — | $ | |||||||||||||||||||||||||||
| Segment assets | ( | ||||||||||||||||||||||||||||||||||
| Year Ended December 31, 2021 | |||||||||||||||||||||||||||||||||||
| Electric | Gas | Total | |||||||||||||||||||||||||||||||||
| Utilities and | Utilities and | Reportable | |||||||||||||||||||||||||||||||||
| (in millions) | Infrastructure | Infrastructure | Segments | Other | Eliminations | Total | |||||||||||||||||||||||||||||
| Total revenues | $ | $ | $ | $ | — | $ | — | $ | |||||||||||||||||||||||||||
| Interest expense | $ | $ | $ | $ | — | $ | — | $ | |||||||||||||||||||||||||||
| Depreciation and amortization | — | — | |||||||||||||||||||||||||||||||||
| Income tax expense (benefit) | ( | — | |||||||||||||||||||||||||||||||||
Segment income (loss)/Net Income | ( | — | |||||||||||||||||||||||||||||||||
| Capital expenditures | $ | $ | $ | $ | — | $ | — | $ | |||||||||||||||||||||||||||
| Segment assets | ( | ||||||||||||||||||||||||||||||||||
4. REGULATORY MATTERS
REGULATORY ASSETS AND LIABILITIES
The Duke Energy Registrants record regulatory assets and liabilities that result from the ratemaking process. See Note 1 for further information.
137
| FINANCIAL STATEMENTS | REGULATORY MATTERS | ||||
The following tables present the regulatory assets and liabilities recorded on the Consolidated Balance Sheets of Duke Energy and Progress Energy. See separate tables below for balances by individual registrant.
| Duke Energy | Progress Energy | ||||||||||||||||||||||
| December 31, | December 31, | ||||||||||||||||||||||
| (in millions) | 2023 | 2022 | 2023 | 2022 | |||||||||||||||||||
| Regulatory Assets | |||||||||||||||||||||||
| AROs – coal ash | $ | $ | $ | $ | |||||||||||||||||||
| AROs – nuclear and other | |||||||||||||||||||||||
| Deferred fuel and purchased power | |||||||||||||||||||||||
| Accrued pension and OPEB | |||||||||||||||||||||||
| Storm cost securitized balance, net | |||||||||||||||||||||||
| Nuclear asset securitized balance, net | |||||||||||||||||||||||
| Debt fair value adjustment | — | — | |||||||||||||||||||||
| Hedge costs deferrals | |||||||||||||||||||||||
| Storm cost deferrals | |||||||||||||||||||||||
| COR regulatory asset | |||||||||||||||||||||||
| Post-in-service carrying costs (PISCC) and deferred operating expenses | |||||||||||||||||||||||
| Retired generation facilities | |||||||||||||||||||||||
| Deferred asset – Lee and Harris COLA | |||||||||||||||||||||||
| Customer connect project | |||||||||||||||||||||||
| Advanced metering infrastructure (AMI) | |||||||||||||||||||||||
| Incremental COVID-19 expenses | |||||||||||||||||||||||
| Vacation accrual | |||||||||||||||||||||||
| Grid Deferral | |||||||||||||||||||||||
| Demand side management (DSM)/Energy efficiency (EE) | |||||||||||||||||||||||
| CEP deferral | — | — | |||||||||||||||||||||
| NCEMPA deferrals | |||||||||||||||||||||||
| Derivatives – natural gas supply contracts | — | — | |||||||||||||||||||||
| Deferred pipeline integrity costs | — | — | |||||||||||||||||||||
| Nuclear deferral | |||||||||||||||||||||||
| COR settlement | |||||||||||||||||||||||
| Decoupling | — | ||||||||||||||||||||||
| Deferred coal ash handling system costs | |||||||||||||||||||||||
| Qualifying facility contract buyouts | |||||||||||||||||||||||
| Network Integration Transmission Services deferral | — | — | |||||||||||||||||||||
| Transmission expansion obligation | — | — | |||||||||||||||||||||
| East Bend deferrals | — | — | |||||||||||||||||||||
| Propane caverns | — | — | |||||||||||||||||||||
| Tennessee ARM Deferral | — | — | |||||||||||||||||||||
| Other | |||||||||||||||||||||||
| Total regulatory assets | |||||||||||||||||||||||
Less: Current portion | |||||||||||||||||||||||
| Total noncurrent regulatory assets | $ | $ | $ | $ | |||||||||||||||||||
| Regulatory Liabilities | |||||||||||||||||||||||
| Net regulatory liability related to income taxes | $ | $ | $ | $ | |||||||||||||||||||
| COR regulatory liability | |||||||||||||||||||||||
| AROs – nuclear and other | — | — | |||||||||||||||||||||
| Hedge cost deferrals | |||||||||||||||||||||||
| Accrued pension and OPEB | — | — | |||||||||||||||||||||
| Deferred fuel and purchased power | — | ||||||||||||||||||||||
| DSM/EE | — | — | |||||||||||||||||||||
| DOE Settlement | |||||||||||||||||||||||
| Provision for rate refunds | |||||||||||||||||||||||
| Other | |||||||||||||||||||||||
| Total regulatory liabilities | |||||||||||||||||||||||
Less: Current portion | |||||||||||||||||||||||
| Total noncurrent regulatory liabilities | $ | $ | $ | $ | |||||||||||||||||||
138
| FINANCIAL STATEMENTS | REGULATORY MATTERS | ||||
Descriptions of regulatory assets and liabilities summarized in the tables above and below follow. See tables below for recovery and amortization periods at the separate registrants.
AROs – coal ash. Represents deferred depreciation and accretion related to the legal obligation to close ash basins. The costs are deferred until recovery treatment has been determined. See Notes 1 and 10 for additional information.
AROs – nuclear and other. Represents regulatory assets or liabilities, including deferred depreciation and accretion, related to legal obligations associated with the future retirement of property, plant and equipment, excluding amounts related to coal ash. The AROs relate primarily to decommissioning nuclear power facilities. The amounts also include certain deferred gains and losses on NDTF investments. See Notes 1 and 10 for additional information.
Deferred fuel and purchased power. Represents certain energy-related costs that are recoverable or refundable as approved by the applicable regulatory body.
Accrued pension and OPEB. Accrued pension and OPEB represent regulatory assets and liabilities related to each of the Duke Energy Registrants’ respective shares of unrecognized actuarial gains and losses and unrecognized prior service cost and credit attributable to Duke Energy’s pension plans and OPEB plans. The regulatory asset or liability is amortized with the recognition of actuarial gains and losses and prior service cost and credit to net periodic benefit costs for pension and OPEB plans. The accrued pension and OPEB regulatory assets are expected to be recovered primarily over the average remaining service periods or life expectancies of employees covered by the benefit plans. See Note 23 for additional detail.
Storm cost securitized balance, net. Represents the North Carolina portion of storm restoration expenditures related to Hurricane Florence, Hurricane Michael, Hurricane Dorian and Winter Storm Diego (2018 and 2019 events).
Nuclear asset securitized balance, net. Represents the balance associated with Crystal River Unit 3 retirement approved for recovery by the FPSC on September 15, 2015, and the upfront financing costs securitized in 2016 with issuance of the associated bonds. The regulatory asset balance is net of the AFUDC equity portion.
Debt fair value adjustment. Purchase accounting adjustments recorded to state the carrying value of Progress Energy and Piedmont at fair value in connection with the 2012 and 2016 mergers, respectively. Amount is amortized over the life of the related debt.
Hedge costs deferrals. Amounts relate to unrealized gains and losses on derivatives recorded as a regulatory asset or liability, respectively, until the contracts are settled.
Storm cost deferrals. Represents deferred incremental costs incurred related to major weather-related events.
COR regulatory asset. Represents the excess of spend over funds received from customers to cover the future removal of property, plant and equipment from retired or abandoned sites as property is retired, net of certain deferred gains on NDTF investments.
Post-in-service carrying costs (PISCC) and deferred operating expenses. Represents deferred depreciation and operating expenses as well as carrying costs on the portion of capital expenditures placed in service but not yet reflected in retail rates as plant in service.
Retired generation facilities. Represents amounts to be recovered for facilities that have been retired and are probable of recovery.
Deferred asset – Lee and Harris COLA. Represents deferred costs incurred for the canceled Lee and Harris nuclear projects.
Customer connect project. Represents incremental operating expenses and carrying costs on deferred amounts related to the deployment of the new customer information system.
AMI. Represents deferred costs related to the installation of AMI meters and remaining net book value of non-AMI meters to be replaced at Duke Energy Carolinas, net book value of existing meters at Duke Energy Florida, Duke Energy Progress and Duke Energy Ohio and future recovery of net book value of electromechanical meters that have been replaced with AMI meters at Duke Energy Indiana.
Incremental COVID-19 expenses. Represents incremental costs related to ensuring continuity and quality of service in a safe manner during the COVID-19 pandemic.
Vacation accrual. Represents vacation entitlement, which is generally recovered in the following year.
Grid deferral. Represents deferred incremental operation and maintenance expense, depreciation and property taxes associated with grid improvement plans.
DSM/EE. Deferred costs related to various DSM and EE programs recoverable or refundable as approved by the applicable regulatory body.
CEP deferral. Represents deferred depreciation, PISCC and deferred property tax for Duke Energy Ohio Gas capital assets for the CEP.
NCEMPA deferrals. Represents retail allocated cost deferrals and returns associated with the additional ownership interest in assets acquired from NCEMPA in 2015.
Derivatives – natural gas supply contracts. Represents costs for certain long-dated, fixed quantity forward natural gas supply contracts, which are recoverable through PGA clauses.
Deferred pipeline integrity costs. Represents pipeline integrity management costs in compliance with federal regulations.
Nuclear deferral. Includes amounts related to nuclear plant outage and refueling costs, which are deferred and recovered over the nuclear fuel cycle.
139
| FINANCIAL STATEMENTS | REGULATORY MATTERS | ||||
COR settlement. Represents approved COR settlements that are being amortized over the average remaining lives, at the time of approval, of the associated assets.
Decoupling. Relates primarily to margin and revenue decoupling.
Deferred coal ash handling system costs. Represents deferred depreciation and returns associated with capital assets related to converting the ash handling system from wet to dry.
Qualifying facility contract buyouts. Represents termination payments for regulatory recovery through the capacity clause.
Network Integration Transmission Services deferral. Represents a deferral of costs and return related transmission costs.
Transmission expansion obligation. Represents transmission expansion obligations related to Duke Energy Ohio's withdrawal from MISO.
East Bend deferrals. Represents amounts to be recovered for deferred costs and depreciation related to the East Bend station.
Propane Caverns. Represents amounts for costs related to propane inventory, the net book value of remaining assets and decommissioning costs at Duke Energy Ohio.
TN ARM Deferral. Represents amounts to be recovered for uncollected revenue for 2022 and deferred depreciation and carrying costs on the portion of capital expenditures placed in service but not yet reflected in rates.
Net regulatory liability related to income taxes. Amounts for all registrants include regulatory liabilities related primarily to impacts from the Tax Act. See Note 24 for additional information. Amounts have no immediate impact on rate base as regulatory assets are offset by deferred tax liabilities.
COR regulatory liability. Represents funds received from customers to cover the future removal of property, plant and equipment from retired or abandoned sites as property is retired. Also includes certain deferred gains on NDTF investments.
DOE Settlement. Represents litigation settlement funds received resulting from the DOE’s failure to accept spent nuclear fuel and other radioactive waste from the Crystal River Unit 3 during 2014-2018 as required under the Nuclear Waste Policy Act.
Provision for rate refunds. Represents estimated amounts due to customers based on recording interim rates subject to refund.
RESTRICTIONS ON THE ABILITY OF CERTAIN SUBSIDIARIES TO MAKE DIVIDENDS, ADVANCES AND LOANS TO DUKE ENERGY
As a condition to the approval of merger transactions, the NCUC, PSCSC, PUCO, KPSC and IURC imposed conditions on the ability of Duke Energy Carolinas, Duke Energy Progress, Duke Energy Ohio, Duke Energy Kentucky, Duke Energy Indiana and Piedmont to transfer funds to Duke Energy through loans or advances, as well as restricted amounts available to pay dividends to Duke Energy. Certain subsidiaries may transfer funds to the Parent by obtaining approval of the respective state regulatory commissions. These conditions imposed restrictions on the ability of the public utility subsidiaries to pay cash dividends as discussed below.
Duke Energy Progress and Duke Energy Florida also have restrictions imposed by their first mortgage bond indentures, which in certain circumstances, limit their ability to make cash dividends or distributions on common stock. Amounts restricted as a result of these provisions were not material at December 31, 2023.
Additionally, certain other subsidiaries of Duke Energy have restrictions on their ability to dividend, loan or advance funds to Duke Energy due to specific legal or regulatory restrictions, including, but not limited to, minimum working capital and tangible net worth requirements.
The restrictions discussed below were not a material amount of Duke Energy's and Progress Energy's net assets at December 31, 2023.
Duke Energy Carolinas
Duke Energy Carolinas must limit cumulative distributions subsequent to mergers to (i) the amount of retained earnings on the day prior to the closing of the mergers, plus (ii) any future earnings recorded.
Duke Energy Progress
Duke Energy Progress must limit cumulative distributions subsequent to the mergers between Duke Energy and Progress Energy and Duke Energy and Piedmont to (i) the amount of retained earnings on the day prior to the closing of the respective mergers, plus (ii) any future earnings recorded.
Duke Energy Ohio
Duke Energy Ohio will not declare and pay dividends out of capital or unearned surplus without the prior authorization of the PUCO. Duke Energy Ohio received FERC and PUCO approval to pay dividends from its equity accounts that are reflective of the amount that it would have in its retained earnings account had push-down accounting for the Cinergy merger not been applied to Duke Energy Ohio’s balance sheet. The conditions include a commitment from Duke Energy Ohio that equity, adjusted to remove the impacts of push-down accounting, will not fall below 30 % of total capital.
Duke Energy Kentucky is required to pay dividends solely out of retained earnings and to maintain a minimum of 35 % equity in its capital structure.
140
| FINANCIAL STATEMENTS | REGULATORY MATTERS | ||||
Duke Energy Indiana
Duke Energy Indiana must limit cumulative distributions subsequent to the merger between Duke Energy and Cinergy to (i) the amount of retained earnings on the day prior to the closing of the merger, plus (ii) any future earnings recorded. In addition, Duke Energy Indiana will not declare and pay dividends out of capital or unearned surplus without prior authorization of the IURC.
Piedmont
Piedmont must limit cumulative distributions subsequent to the acquisition of Piedmont by Duke Energy to (i) the amount of retained earnings on the day prior to the closing of the merger, plus (ii) any future earnings recorded.
RATE-RELATED INFORMATION
The NCUC, PSCSC, FPSC, IURC, PUCO, TPUC and KPSC approve rates for retail electric and natural gas services within their states. The FERC approves rates for electric sales to wholesale customers served under cost-based rates (excluding Ohio and Indiana), as well as sales of transmission service. The FERC also regulates certification and siting of new interstate natural gas pipeline projects.
Duke Energy Carolinas and Duke Energy Progress
Hurricane Ian
In late September and early October 2022, Hurricane Ian inflicted severe damage to the Duke Energy Carolinas and Duke Energy Progress territories in North Carolina and South Carolina. Approximately 950,000 customers were impacted. As of December 31, 2023, total estimated operation and maintenance expenses incurred for restoration efforts were approximately $95 million, with an additional $8 million in capital investments. Approximately $87 million of the operation and maintenance expenses are deferred in Regulatory assets within Other Noncurrent Assets on the Consolidated Balance Sheets as of December 31, 2023 ($32 million and $55 million for Duke Energy Carolinas and Duke Energy Progress, respectively), Duke Energy Carolinas and Duke Energy Progress have regulatory tools to recover storm costs including deferral and securitization. These estimates could change as Duke Energy Carolinas and Duke Energy Progress receive additional information on actual costs.
Nuclear Station Subsequent License Renewal
On June 7, 2021, Duke Energy Carolinas filed a subsequent license renewal (SLR) application for the Oconee Nuclear Station (ONS) with the U.S. Nuclear Regulatory Commission (NRC) to renew ONS’s operating license for an additional 20 years. The SLR would extend operations of the facility from 60 to 80 years. The current licenses for units 1 and 2 expire in 2033 and the license for unit 3 expires in 2034. By a Federal Register Notice dated July 28, 2021, the NRC provided a 60 -day comment period for persons whose interest may be affected by the issuance of a subsequent renewed license for ONS to file a request for a hearing and a petition for leave to intervene. On September 27, 2021, Beyond Nuclear and Sierra Club (Petitioners) filed a Hearing Request and Petition to Intervene (Hearing Request) and a Petition for Waiver. The Hearing Request proposed three contentions and claimed that Duke Energy Carolinas did not satisfy the National Environmental Policy Act (NEPA) of 1969, as amended, or the NRC’s NEPA-implementing regulations. Following Duke Energy Carolinas' answer and the Petitioners' reply, on February 11, 2022, the Atomic Safety and Licensing Board (ASLB) issued its decision on the Hearing Request and found that the Petitioners failed to establish that the proposed contentions are litigable. The ASLB also denied the Petitioners' Petition for Waiver and terminated the proceeding.
On February 24, 2022, the NRC issued a decision in the SLR appeal related to Florida Power and Light's Turkey Point nuclear generating station in Florida. The NRC ruled that the NRC’s license renewal Generic Environmental Impact Statement (GEIS) does not apply to SLR because the GEIS does not address SLR. The decision overturned a 2020 NRC decision that found the GEIS applies to SLR. Although Turkey Point is not owned or operated by a Duke Energy Registrant, the NRC’s order applies to all SLR applicants, including Oconee. The NRC order also indicated no subsequent renewed licenses will be issued until the NRC staff has completed an adequate NEPA review for each application. On April 5, 2022, the NRC approved a 24-month rulemaking plan that will enable the NRC staff to complete an adequate NEPA review. Although an SLR applicant may wait until the rulemaking is completed, the NRC also noted that an applicant may submit a supplement to its environmental report providing information on environmental impacts during the SLR period prior to the rulemaking being completed. On November 7, 2022, Duke Energy Carolinas submitted a supplement to its environmental report addressing environmental impacts during the SLR period. On September 14, 2023, the NRC posted on its website that the issuance of the GEIS will now be issued in August 2024 instead of May 2024 due to the volume and technical complexity of the comments received.
On December 19, 2022, the NRC published a notice in the Federal Register that the NRC will conduct a limited scoping process to gather additional information necessary to prepare an environmental impact statement (EIS) to evaluate the environmental impacts at Oconee during the SLR period. The NRC received comments from the EPA and the Petitioners and these comments identify 18 potential impacts that should be considered by the NRC in the EIS, which include, but are not limited to, climate change and flooding, environmental justice, severe accidents, and external events. On February 8, 2024, the NRC issued the Oconee site-specific draft EIS.
On December 19, 2022, the NRC issued the Safety Evaluation Report (SER) for the safety portion of the SLR application. The NRC determined Duke Energy Carolinas met the requirements of the applicable regulations and identified actions that have been taken or will be taken to manage the effects of aging and address time-limited analyses. Duke Energy Carolinas and the NRC met with the Advisory Committee on Reactor Safeguards (ACRS) on February 2, 2023, to discuss issues regarding the SER and SLR application. On February 25, 2023, the ACRS issued a report to the NRC on the safety aspects of the Oconee SLR application, which concluded that the established programs and commitments made by Duke Energy Carolinas to manage age-related degradation provide confidence that Oconee can be operated in accordance with its current licensing basis for the subsequent period of extended operation without undue risk to the health and safety of the public and the SLR application for Oconee should be approved.
Although the NRC’s GEIS applicability decision has delayed completion of the SLR proceeding, Duke Energy Carolinas does not believe it changes the probability that the Oconee subsequent renewed licenses will ultimately be issued, although Duke Energy Carolinas cannot guarantee the outcome of the license application process.
141
| FINANCIAL STATEMENTS | REGULATORY MATTERS | ||||
Duke Energy Carolinas and Duke Energy Progress intend to seek renewal of operating licenses and 20 -year license extensions for all of their nuclear stations. Accordingly, new depreciation rates were implemented for all of the nuclear facilities during the second quarter of 2021. Duke Energy Carolinas and Duke Energy Progress cannot predict the outcome of these additional relicensing proceedings.
Duke Energy Carolinas
Regulatory Assets and Liabilities
The following tables present the regulatory assets and liabilities recorded on Duke Energy Carolinas' Consolidated Balance Sheets.
| December 31, | Earns/Pays | Recovery/Refund | |||||||||||||||
| (in millions) | 2023 | 2022 | a Return | Period Ends | |||||||||||||
Regulatory Assets(a) | |||||||||||||||||
AROs – coal ash | $ | $ | (g) | (b) | |||||||||||||
Deferred fuel and purchased power(i) | (e) | 2025 | |||||||||||||||
Accrued pension and OPEB | (h) | ||||||||||||||||
Storm cost securitized balance, net | Yes | 2041 | |||||||||||||||
Hedge costs deferrals | (b) | ||||||||||||||||
Storm cost deferrals | Yes | (b) | |||||||||||||||
PISCC and deferred operating expenses | Yes | (b) | |||||||||||||||
Retired generation facilities(c) | Yes | (b) | |||||||||||||||
Deferred asset – Lee COLA | (b) | ||||||||||||||||
Customer connect project(c) | Yes | (b) | |||||||||||||||
AMI(c) | Yes | (b) | |||||||||||||||
Incremental COVID-19 expenses | Yes | (b) | |||||||||||||||
Vacation accrual | 2024 | ||||||||||||||||
Grid Deferral(c) | Yes | (b) | |||||||||||||||
Nuclear deferral | 2025 | ||||||||||||||||
COR settlement(c) | Yes | (b) | |||||||||||||||
Deferred coal ash handling system costs(c) | Yes | (b) | |||||||||||||||
| Other | (b) | ||||||||||||||||
| Total regulatory assets | |||||||||||||||||
Less: Current portion | |||||||||||||||||
| Total noncurrent regulatory assets | $ | $ | |||||||||||||||
Regulatory Liabilities(a) | |||||||||||||||||
Net regulatory liability related to income taxes(d) | $ | $ | Yes | (b) | |||||||||||||
COR regulatory liability(c) | Yes | (f) | |||||||||||||||
AROs – nuclear and other | (b) | ||||||||||||||||
Hedge cost deferrals | (b) | ||||||||||||||||
Accrued pension and OPEB | (h) | ||||||||||||||||
Deferred fuel and purchased power(i) | — | (e) | 2025 | ||||||||||||||
DSM/EE(c) | Yes | (j) | |||||||||||||||
Provision for rate refunds(c) | Yes | (b) | |||||||||||||||
| Other | (b) | ||||||||||||||||
| Total regulatory liabilities | |||||||||||||||||
Less: Current portion | |||||||||||||||||
| Total noncurrent regulatory liabilities | $ | $ | |||||||||||||||
(a) Regulatory assets and liabilities are excluded from rate base unless otherwise noted.
(b) The expected recovery or refund period varies or has not been determined.
(c) Included in rate base.
(d) Includes regulatory liabilities related to the change in the federal tax rate as a result of the Tax Act and the change in the North Carolina tax rate. Portions are included in rate base.
(e) Pays interest on over-recovered costs in North Carolina. Includes certain purchased power costs in North Carolina and South Carolina and costs of distributed energy in South Carolina. The asset balance principally relates to North Carolina costs while the liability balance relates to South Carolina.
(f) Recovered over the life of the associated assets.
(g) Earns a debt and equity return on coal ash expenditures for North Carolina and South Carolina retail customers as permitted by various regulatory orders.
(h) Recovered primarily over the average remaining service periods or life expectancies of employees covered by the benefit plans. See Note 23 for additional detail.
(i) Duke Energy Carolinas submitted a fuel filing to the NCUC in February 2023 for recovery of $998 million, which included deferrals through December 2022. The NCUC approved recovery of this balance through December 2024. The next filing will be made in the first quarter of 2024. Duke Energy Carolinas submitted a fuel filing to the PSCSC in August 2023 for recovery of $310 million, which included deferrals through May 2023. The PSCSC approved recovery of this balance through October 2024. The next filing will be made in the third quarter of 2024.
(j) Includes incentives on DSM/EE investments and is recovered or refunded through an annual rider mechanism.
142
| FINANCIAL STATEMENTS | REGULATORY MATTERS | ||||
2023 North Carolina Rate Case
On January 19, 2023, Duke Energy Carolinas filed a PBR application with the NCUC to request an increase in base rate retail revenues. The PBR Application included an MYRP to recover projected capital investments during the three-year MYRP period. In addition to the MYRP, the PBR Application included an Earnings Sharing Mechanism, Residential Decoupling Mechanism and Performance Incentive Mechanisms (PIMS) as required by HB 951. The application as originally filed requested an overall retail revenue increase of $501 million in Year 1, $172 million in Year 2 and $150 million in Year 3, for a combined total of $823 million or 15.7 % by early 2026. The rate increase is driven primarily by transmission and distribution investments since the last rate case and projected in the MYRP, as well as investments in energy storage and solar assets included in the MYRP consistent with the Carbon Plan.
On August 22, 2023, Duke Energy Carolinas filed with the NCUC a partial settlement with the Public Staff in connection with its PBR application. The partial settlement included, among other things, agreement on a substantial portion of the North Carolina retail rate base for the historic base case of approximately $19.5 billion and all of the capital projects and related costs to be included in the three-year MYRP, including $4.6 billion (North Carolina retail allocation) projected to go in service over the MYRP period. Additionally, the partial settlement included agreement, with certain adjustments, on depreciation rates, the recovery of grid improvement plan costs and PIMs, Tracking Metrics and the Residential Decoupling Mechanism under the PBR application. On August 28, 2023, Duke Energy Carolinas filed with the NCUC a second partial settlement with the Public Staff resolving additional issues, including the future treatment of nuclear production tax credits related to the Inflation Reduction Act, through a stand-alone rider that will provide the benefits to customers beginning January 1, 2025.
On December 15, 2023, the NCUC issued an order approving Duke Energy Carolinas' PBR Application, as modified by the partial settlements and the order, including an overall retail revenue increase of $436 million in Year 1, $174 million in Year 2 and $158 million in Year 3, for a combined total of $768 million. The order established an ROE of 10.1 % based upon a capital structure of 53 % equity and 47 % debt and approved, with certain adjustments, depreciation rates and the recovery of grid improvement plan costs and certain deferred COVID-related costs. Additionally, the Residential Decoupling Mechanism and PIMs were approved as requested under the PBR Application and revised by the partial settlements. As a result of the partial settlements and the order, Duke Energy Carolinas recognized pretax charges of $29 million within Impairment of assets and other charges, and $8 million within Operations, maintenance and other, for the year ended December 31, 2023, on the Consolidated Statements of Operations. Duke Energy Carolinas implemented interim rates, subject to refund, on September 1, 2023. New revised Year 1 rates and the residential decoupling were implemented on January 15, 2024. On February 13, 2024, a number of parties filed Notices of Appeal of the December 15, 2023 NCUC order. Appeals were filed by the Carolina Industrial Group for Fair Utility Rates (CIGFUR) III, a collection of various electric membership corporations (collectively, the EMCs), and the North Carolina Attorney General’s Office (the AGO). CIGFUR III and the EMCs appealed the interclass subsidy reduction percentage and the Transmission Cost Allocation stipulation. In addition, CIGFUR III appealed the NCUC’s elimination of the equal percentage fuel cost allocation methodology. The AGO appealed several issues including the authorized ROE and certain rate design and accounting matters. Duke Energy Carolinas cannot predict the outcome of this matter.
2024 South Carolina Rate Case
On January 4, 2024, Duke Energy Carolinas filed a rate case with the PSCSC to request an average effective net increase in annual retail revenues of 11.4 %, or approximately $239 million, in the first two years, and an additional overall effective increase of about 4.1 %, or approximately $84 million additional revenue, after the first two years. The requested increases, if approved, would result in an overall average 15.5 % increase in annual retail revenues, or approximately $323 million, prior to mitigation efforts. To mitigate the rate increase, Duke Energy Carolinas has proposed to accelerate the return of remaining federal unprotected EDIT balances to customers over two years. This offset reduces the impact to customers in the first two years to the effective net increase of 11.4 %, after which the credit for EDIT balances expire. Duke Energy Carolinas has requested the revised rates to be effective no later than August 1, 2024. The evidentiary hearing is scheduled to commence on May 20, 2024. Duke Energy Carolinas cannot predict the outcome of this matter.
143
| FINANCIAL STATEMENTS | REGULATORY MATTERS | ||||
Duke Energy Progress
Regulatory Assets and Liabilities
The following tables present the regulatory assets and liabilities recorded on Duke Energy Progress' Consolidated Balance Sheets.
| December 31, | Earns/Pays | Recovery/Refund | |||||||||||||||
| (in millions) | 2023 | 2022 | a Return | Period Ends | |||||||||||||
Regulatory Assets(a) | |||||||||||||||||
AROs – coal ash | $ | $ | (g) | (b) | |||||||||||||
AROs – nuclear and other | (c) | ||||||||||||||||
Deferred fuel and purchased power(l) | (e) | 2025 | |||||||||||||||
Accrued pension and OPEB | (j) | ||||||||||||||||
Storm cost securitized balance, net | Yes | 2041 | |||||||||||||||
Hedge costs deferrals | (b) | ||||||||||||||||
Storm cost deferrals | Yes | (b) | |||||||||||||||
PISCC and deferred operating expenses | Yes | 2054 | |||||||||||||||
Retired generation facilities(d) | Yes | (b) | |||||||||||||||
Deferred asset – Harris COLA | (b) | ||||||||||||||||
Customer connect project(d) | Yes | (b) | |||||||||||||||
AMI(d) | Yes | (b) | |||||||||||||||
Incremental COVID-19 expenses | (b) | ||||||||||||||||
Vacation accrual | 2024 | ||||||||||||||||
Grid Deferral(d) | Yes | (b) | |||||||||||||||
DSM/EE(d) | Yes | (h) | |||||||||||||||
NCEMPA deferrals(d) | (f) | 2042 | |||||||||||||||
Nuclear deferral | 2025 | ||||||||||||||||
COR settlement(d) | Yes | (b) | |||||||||||||||
Decoupling | — | Yes | (b) | ||||||||||||||
Deferred coal ash handling system costs(d) | Yes | (b) | |||||||||||||||
| Other | (b) | ||||||||||||||||
| Total regulatory assets | |||||||||||||||||
Less: Current portion | |||||||||||||||||
| Total noncurrent regulatory assets | $ | $ | |||||||||||||||
Regulatory Liabilities(a) | |||||||||||||||||
Net regulatory liability related to income taxes(k) | $ | $ | Yes | (b) | |||||||||||||
COR regulatory liability | (i) | ||||||||||||||||
Hedge cost deferrals | (b) | ||||||||||||||||
Deferred fuel and purchased power(l) | — | (e) | 2025 | ||||||||||||||
Provision for rate refunds(d) | Yes | (b) | |||||||||||||||
| Other | (b) | ||||||||||||||||
| Total regulatory liabilities | |||||||||||||||||
Less: Current portion | |||||||||||||||||
| Total noncurrent regulatory liabilities | $ | $ | |||||||||||||||
(a) Regulatory assets and liabilities are excluded from rate base unless otherwise noted.
(b) The expected recovery or refund period varies or has not been determined.
(c) Recovery period for costs related to nuclear facilities runs through the decommissioning period of each unit.
(d) Included in rate base.
(e) Pays interest on over-recovered costs in North Carolina. Includes certain purchased power costs in North Carolina and South Carolina and costs of distributed energy in South Carolina. The asset balance principally relates to North Carolina costs while the liability balance relates to South Carolina.
(f) South Carolina retail allocated costs are earning a return.
(g) Earns a debt and equity return on coal ash expenditures for North Carolina and South Carolina retail customers as permitted by various regulatory orders.
(h) Includes incentives on DSM/EE investments and is recovered through an annual rider mechanism.
(i) Recovered over the life of the associated assets.
(j) Recovered primarily over the average remaining service periods or life expectancies of employees covered by the benefit plans. See Note 23 for additional detail.
144
| FINANCIAL STATEMENTS | REGULATORY MATTERS | ||||
(k) Includes regulatory liabilities related to the change in the federal tax rate as a result of the Tax Act and the change in the North Carolina tax rate. Portions are included in rate base.
(l) Duke Energy Progress submitted a fuel filing to the NCUC in June 2023 for recovery of $445 million, which included deferrals through March 2023. The NCUC approved recovery of this balance through November 2024. The next filing will be made in the second quarter of 2024. Duke Energy Progress submitted a fuel filing to the PSCSC in May 2023 for recovery of $79 million, which included deferrals through February 2023. The PSCSC approved recovery of this balance through July 2024. The next filing will be made in the second quarter of 2024.
2022 North Carolina Rate Case
On October 6, 2022, Duke Energy Progress filed a PBR application with the NCUC to request an increase in base rate retail revenues. The rate request before the NCUC included an MYRP to recover projected capital investments during the -year MYRP period. In addition to the MYRP, the PBR Application included an Earnings Sharing Mechanism, Residential Decoupling Mechanism and PIMS as required by HB 951. The overall retail revenue increase as originally filed would have been $326 million in Year 1, $151 million in Year 2 and $138 million in Year 3, for a combined total of $615 million, by late 2025. The rate increase is driven primarily by transmission and distribution investments since the last rate case and projected in the MYRP, as well as investments in energy storage and solar assets included in the MYRP consistent with the Carbon Plan.
On April 26, 2023, Duke Energy Progress filed with the NCUC a partial settlement with Public Staff, which included agreement on many aspects of Duke Energy Progress' three-year MYRP proposal. In May 2023, CIGFUR II joined this partial settlement and Public Staff and CIGFUR II filed a separate settlement reaching agreement on PIMs, Tracking Metrics and the Residential Decoupling Mechanism under the PBR application.
On August 18, 2023, the NCUC issued an order approving Duke Energy Progress' PBR Application, as modified by the partial settlements and the order, including an overall retail revenue increase of $233 million in Year 1, $126 million in Year 2 and $135 million in Year 3, for a combined total of $494 million. Key aspects of the order include the approval of North Carolina retail rate base for the historic base case of approximately $12.2 billion and capital projects and related costs to be included in the three-year MYRP, including $3.5 billion (North Carolina retail allocation) projected to go in service over the MYRP period. The order established an ROE of 9.8 % based upon a capital structure of 53 % equity and 47 % debt and approved, with certain adjustments, depreciation rates and the recovery of grid improvement plan costs and certain deferred COVID-related costs. Additionally, the Residential Decoupling Mechanism and PIMs were approved as requested under the PBR Application and revised by the partial settlements. As a result of the order, Duke Energy Progress recognized pretax charges of $28 million within Impairment of assets and other charges, which primarily related to certain COVID-19 deferred costs, and $8 million within Operations, maintenance and other, for the year ended December 31, 2023, on the Consolidated Statements of Operations. Duke Energy Progress implemented interim rates, subject to refund, on June 1, 2023, and implemented revised Year 1 rates and the residential decoupling on October 1, 2023.
On October 17, 2023, CIGFUR II and Haywood Electric Membership Corporation each filed a Notice of Appeal and Exceptions to the Supreme Court of North Carolina. Both parties were appealing certain matters that do not impact the overall revenue requirement in the rate case. Specifically, they appealed the interclass subsidy reduction percentage, and CIGFUR II also appealed the Customer Assistance Program and the equal percentage fuel cost allocation methodology. On November 6, 2023, the AGO filed a Notice of Cross Appeal of the NCUC’s determination regarding the exclusion of electric vehicle revenue from the residential decoupling mechanism. On November 9, 2023, Duke Energy Progress, the Public Staff, CIGFUR II, and a number of other parties reached a settlement pursuant to which CIGFUR II agreed not to pursue its appeal of the Customer Assistance Program. Duke Energy Progress cannot predict the outcome of this matter.
2023 South Carolina Storm Securitization
On May 31, 2023, Duke Energy Progress filed a petition with the PSCSC requesting authorization for the financing of Duke Energy Progress' storm recovery costs in the amount of approximately $171 million, through securitization, due to storm recovery activities required as a result of the following storms: Pax, Ulysses, Matthew, Florence, Michael, Dorian, Izzy and Jasper. On September 8, 2023, Duke Energy Progress filed a comprehensive settlement agreement with all parties on all cost recovery issues raised in the storm securitization proceeding.
The evidentiary hearing occurred in early September 2023. On September 20, 2023, the PSCSC approved the comprehensive settlement agreement and on October 13, 2023, the PSCSC issued its financing order. Duke Energy Progress will proceed with structuring, marketing and pricing the storm recovery bonds and then seek PSCSC authorization to issue the bonds in the first half of 2024. Duke Energy Progress cannot predict the outcome of this matter.
2022 South Carolina Rate Case
On September 1, 2022, Duke Energy Progress filed an application with the PSCSC to request an increase in base rate retail revenues. On January 12, 2023, Duke Energy Progress and the ORS, as well as other consumer, environmental, and industrial intervening parties, filed a comprehensive Agreement and Stipulation of Settlement resolving all issues in the base rate proceeding. The major components of the stipulation include:
•A $52 million annual customer rate increase prior to the reduction from the accelerated return to customers of federal unprotected Property, Plant and Equipment related EDIT. After extending the remaining EDIT giveback to customers to 33 months, the net annual retail rate increase is approximately $36 million.
•ROE of 9.6 % based upon a capital structure of 52.43 % equity and 47.57 % debt.
•Continuation of deferral treatment of coal ash basin closure costs. Supports an amortization period for remaining coal ash closure costs in this rate case of seven years . Duke Energy Progress agreed not to seek recovery of approximately $50 million of deferred coal ash expenditures related to retired sites in this rate case (South Carolina retail allocation).
•Accepts the 2021 Depreciation Study as proposed in this case, as adjusted for certain recommendations from ORS and includes accelerated retirement dates for certain coal units as originally proposed.
•Establishment of a storm reserve to help offset the costs of major storms.
145
| FINANCIAL STATEMENTS | REGULATORY MATTERS | ||||
The PSCSC held a hearing on January 17, 2023, to consider evidence supporting the stipulation and unanimously voted to approve the comprehensive agreement on February 9, 2023. A final written order was issued on March 8, 2023. New rates went into effect April 1, 2023.
Duke Energy Florida
Regulatory Assets and Liabilities
The following tables present the regulatory assets and liabilities recorded on Duke Energy Florida's Consolidated Balance Sheets.
| December 31, | Earns/Pays | Recovery/Refund | |||||||||||||||
| (in millions) | 2023 | 2022 | a Return | Period Ends | |||||||||||||
Regulatory Assets(a) | |||||||||||||||||
AROs – coal ash | $ | $ | (b) | ||||||||||||||
AROs – nuclear and other | (b) | ||||||||||||||||
Deferred fuel and purchased power(g) | (e) | 2024 | |||||||||||||||
Accrued pension and OPEB(c) | Yes | (f) | |||||||||||||||
Nuclear asset securitized balance, net | 2036 | ||||||||||||||||
Hedge costs deferrals(c) | Yes | 2038 | |||||||||||||||
Storm cost deferrals(c) | (e) | (b) | |||||||||||||||
COR regulatory asset | (d) | (b) | |||||||||||||||
Retired generation facilities(c) | Yes | 2044 | |||||||||||||||
Customer connect project(c) | Yes | 2037 | |||||||||||||||
AMI(c) | Yes | 2032 | |||||||||||||||
Qualifying facility contract buyouts(c) | Yes | 2034 | |||||||||||||||
| Other | (d) | (b) | |||||||||||||||
| Total regulatory assets | |||||||||||||||||
Less: Current portion | |||||||||||||||||
| Total noncurrent regulatory assets | $ | $ | |||||||||||||||
Regulatory Liabilities(a) | |||||||||||||||||
Net regulatory liability related to income taxes(c) | $ | $ | (b) | ||||||||||||||
Hedge cost deferrals | — | (b) | |||||||||||||||
DOE Settlement | 2024 | ||||||||||||||||
| Other | (d) | (b) | |||||||||||||||
| Total regulatory liabilities | |||||||||||||||||
Less: Current portion | |||||||||||||||||
| Total noncurrent regulatory liabilities | $ | $ | |||||||||||||||
(a) Regulatory assets and liabilities are excluded from rate base unless otherwise noted.
(b) The expected recovery or refund period varies or has not been determined.
(c) Included in rate base.
(d) Certain costs earn/pay a return.
(e) Earns commercial paper rate.
(f) Recovered primarily over the average remaining service periods or life expectancies of employees covered by the benefit plans. See Note 23 for additional detail.
(g) On March 6, 2023, the FPSC approved Duke Energy Florida's amended February 2023 fuel filing recovery of $469 million, which included the 2022 actual under-recovery of $1.2 billion, offset by projected declining fuel costs in 2023 due to lower natural gas prices. The approved 21-month recovery period for the actual 2022 under-recovery is April 2023 through December 2024; the reduction in 2023 fuel costs were approved to be returned over 9-months from April 2023 through December 2023. Duke Energy Florida made its most recent fuel filing in September 2023. On November 1, 2023, the FPSC approved Duke Energy Florida's September 2023 fuel filing, which included the proposed fuel factors for 2024. In addition to the under-recoveries approved above, that filing also included a re-projected 2023 over-recovery of approximately $120 million that will be returned to customers January 2024 through December 2024.
2021 Settlement Agreement
On January 14, 2021, Duke Energy Florida filed the 2021 Settlement with the FPSC. The parties to the 2021 Settlement include Duke Energy Florida, the Office of Public Counsel (OPC), the Florida Industrial Power Users Group, White Springs Agricultural Chemicals, Inc. d/b/a PCS Phosphate and NUCOR Steel Florida, Inc. (collectively, the Parties).
146
| FINANCIAL STATEMENTS | REGULATORY MATTERS | ||||
Pursuant to the 2021 Settlement, the Parties agreed to a base rate stay-out provision that expires year-end 2024; however, Duke Energy Florida is allowed an increase to its base rates of an incremental $67 million in 2022, $49 million in 2023 and $79 million in 2024, subject to adjustment in the event of tax reform during the years 2021, 2022 and 2023. The Parties also agreed to an ROE band of 8.85 % to 10.85 % with a midpoint of 9.85 % based on a capital structure of 53 % equity and 47 % debt. The ROE band can be increased by 25 basis points if the average 30-year U.S. Treasury rate increases 50 basis points or more over a six-month period in which case the midpoint ROE would rise from 9.85 % to 10.10 %. On July 25, 2022, this provision was triggered. Duke Energy Florida filed a petition with the FPSC on August 12, 2022, to increase the ROE effective August 2022 with a base rate increase effective January 1, 2023. The FPSC approved this request on October 4, 2022. The 2021 Settlement also provided that Duke Energy Florida will be able to retain $173 million of the expected DOE award from its lawsuit to recover spent nuclear fuel to mitigate customer rates over the term of the 2021 Settlement. In return, Duke Energy Florida is permitted to recognize the $173 million into earnings through the approved settlement period. Duke Energy Florida settled the DOE lawsuit and received payment of approximately $180 million on June 15, 2022, of which the retail portion was approximately $154 million. The 2021 Settlement authorizes Duke Energy Florida to collect the difference between $173 million and the $154 million retail portion of the amount received through the capacity cost recovery clause. As of December 31, 2023, Duke Energy Florida has recognized $141 million into earnings. The remaining $32 million is expected to be recognized in 2024, while also remaining within the approved return on equity band.
The 2021 Settlement also contained a provision to recover or flow-back the effects of tax law changes. As a result of the IRA enacted on August 16, 2022, Duke Energy Florida is eligible for PTCs associated with solar facilities placed in service beginning in January 2022. Duke Energy Florida filed a petition with the FPSC on October 17, 2022, to reduce base rates effective January 1, 2023, by $56 million to flow back the expected 2023 PTCs and to flow back the expected 2022 PTCs via an adjustment to the capacity cost recovery clause. On December 14, 2022, the FPSC issued an order approving Duke Energy Florida’s petition. See Note 24 for additional information on the IRA.
In addition to these terms, the 2021 Settlement contained provisions related to the accelerated depreciation of Crystal River Units 4-5, the approval of approximately $1 billion in future investments in new cost-effective solar power, the implementation of a new Electric Vehicle Charging Station Program and the deferral and recovery of costs in connection with the implementation of Duke Energy Florida’s Vision Florida program, which explores various emerging non-carbon emitting generation technology, distributed technologies and resiliency projects, among other things. The 2021 Settlement also resolved remaining unrecovered storm costs for Hurricane Michael and Hurricane Dorian.
The FPSC approved the 2021 Settlement on May 4, 2021, issuing an order on June 4, 2021. Revised customer rates became effective January 1, 2022, with subsequent base rate increases effective January 1, 2023, and January 1, 2024.
Clean Energy Connection
On July 1, 2020, Duke Energy Florida petitioned the FPSC for approval of a voluntary solar program consisting of 10 new solar generating facilities with combined capacity of approximately 750 MW. The program allows participants to support cost-effective solar development in Florida by paying a subscription fee based on per kilowatt subscriptions and receiving a credit on their bill based on the actual generation associated with their portion of the solar portfolio. The estimated cost of the 10 new solar generation facilities is approximately $1 billion and the projects are expected to be completed by the end of 2024. This investment will be included in base rates offset by the revenue from the subscription fees and the credits will be included for recovery in the fuel cost recovery clause. The FPSC approved the program in January 2021.
On February 24, 2021, the League of United Latin American Citizens (LULAC) filed a notice of appeal of the FPSC’s order approving the Clean Energy Connection to the Supreme Court of Florida. The Supreme Court of Florida heard oral arguments in the appeal on February 9, 2022. On May 27, 2022, the Supreme Court of Florida issued an order remanding the case back to the FPSC so that the FPSC can amend its order to better address some of the arguments raised by LULAC. On September 23, 2022, the FPSC issued a revised order and submitted it on September 26, 2022, to the Supreme Court of Florida. The Supreme Court of Florida requested that the parties file supplemental briefs regarding the revised order, which were filed February 6, 2023. LULAC has filed a request for Oral Argument on the issues discussed in the supplemental briefs, but the Court has yet to rule on that request. The FPSC approval order remains in effect pending the outcome of the appeal. Duke Energy Florida cannot predict the outcome of this matter.
Storm Protection Plan
On April 11, 2022, Duke Energy Florida filed a Storm Protection Plan for approval with the FPSC. The plan, which covers investments for the 2023-2032 time frame, reflects approximately $7 billion of capital investment in transmission and distribution meant to strengthen its infrastructure, reduce outage times associated with extreme weather events, reduce restoration costs and improve overall service reliability. The evidentiary hearing began on August 2, 2022. On October 4, 2022, the FPSC voted to approve Duke Energy Florida's plan with one modification to remove the transmission loop radially fed program, representing a reduction of approximately $80 million over the 10 -year period starting in 2025. On December 9, 2022, the OPC filed a notice of appeal of this order to the Florida Supreme Court. The OPC's initial brief was filed on April 18, 2023. Duke Energy Florida filed its answer brief on July 17, 2023. The OPC's reply brief was filed on October 16, 2023. The Florida Supreme Court heard oral arguments on February 7, 2024. Duke Energy Florida cannot predict the outcome of this matter.
Hurricanes Ian and Idalia
On September 28, 2022, much of Duke Energy Florida’s service territory was impacted by Hurricane Ian, which caused significant damage resulting in more than 1.1 million outages. Duke Energy Florida's Consolidated Balance Sheets included an estimate of approximately $353 million as of December 31, 2022, related to deferred Hurricane Ian storm costs, consistent with the FPSC's storm rule, in Regulatory assets within Other Noncurrent Assets. After depleting any existing storm reserves, which were approximately $107 million before Hurricane Ian, Duke Energy Florida is permitted to petition the FPSC for recovery of additional incremental operation and maintenance costs resulting from the storm and to replenish the retail customer storm reserve to approximately $132 million. Duke Energy Florida filed its petition for cost recovery of various storms, including Hurricane Ian, and replenishment of the storm reserve on January 23, 2023, seeking recovery of $442 million, for recovery over 12 months beginning with the first billing cycle in April 2023. On March 7, 2023, the FPSC approved this request for interim recovery, subject to refund, and ordered Duke Energy Florida to file documentation of the total actual storm costs, once known. Duke Energy Florida filed documentation evidencing its total actual storm costs of $431 million on September 29, 2023. The FPSC will hold a final hearing to determine the prudence of these costs in May of 2024.
147
| FINANCIAL STATEMENTS | REGULATORY MATTERS | ||||
On August 30, 2023, Hurricane Idalia made landfall on Florida’s gulf coast, causing damage and impacting more than 200,000 customers across Duke Energy Florida's service territory. Duke Energy Florida's December 31, 2023, Consolidated Balance Sheets includes an estimate of approximately $102 million in Regulatory Assets within Current Assets related to deferred Hurricane Idalia storm costs consistent with the FPSC's storm rule. On October 16, 2023, Duke Energy Florida requested to combine the $92 million retail portion of the deferred estimated Hurricane Idalia costs with $74 million of costs projected to be collected after December 31, 2023, under the existing approved storm cost recovery and storm surcharge. This $74 million of costs relates primarily to the approved ongoing replenishment of the storm reserves. At its December 5, 2023 Agenda Conference, the FPSC approved recovery of the total $166 million over 12 months beginning with its first billing cycle in January 2024, replacing the previously approved storm cost recovery and storm surcharge, and ordered Duke Energy Florida to file documentation of the total actual Idalia related storm costs, once known. Revised rates were effective January 1, 2024. Duke Energy Florida cannot predict the outcome of these matters.
2024 Florida Rate Case
In January 2024, Duke Energy Florida notified the FPSC that it expects to file a formal request for new base rates in April 2024. Duke Energy Florida intends to propose a three-year rate plan that would begin in January 2025, once its current base rate settlement agreement concludes at the end of 2024. Duke Energy Florida will propose multiyear rate increases that use the projected 12-month periods ending December 31, 2025, 2026, and 2027 as the test years, with adjusted rates to be effective with the first billing period of January 2025, 2026, and 2027, respectively. Duke Energy Florida expects to request additional base rate revenue requirements of approximately $596 million in 2025, $95 million in 2026 and $127 million in 2027, representing an average annual increase in revenue requirements of approximately 4 % over 2025 through 2027.
Duke Energy Ohio
Regulatory Assets and Liabilities
The following tables present the regulatory assets and liabilities recorded on Duke Energy Ohio's Consolidated Balance Sheets.
| December 31, | Earns/Pays | Recovery/Refund | |||||||||||||||
| (in millions) | 2023 | 2022 | a Return | Period Ends | |||||||||||||
Regulatory Assets(a) | |||||||||||||||||
AROs – coal ash | $ | $ | — | Yes | (b) | ||||||||||||
Deferred fuel and purchased gas costs | 2024 | ||||||||||||||||
Accrued pension and OPEB | (e) | ||||||||||||||||
Storm cost deferrals | 2024 | ||||||||||||||||
COR regulatory asset | — | (b) | |||||||||||||||
PISCC and deferred operating expenses(c) | Yes | 2083 | |||||||||||||||
Customer connect project | (b) | ||||||||||||||||
AMI | (b) | ||||||||||||||||
CEP deferral | Yes | (b) | |||||||||||||||
Deferred pipeline integrity costs | Yes | (b) | |||||||||||||||
Decoupling | — | (b) | |||||||||||||||
Network Integration Transmission Services deferral | Yes | (b) | |||||||||||||||
Transmission expansion obligation | (b) | ||||||||||||||||
East Bend deferrals(c) | Yes | (b) | |||||||||||||||
Propane caverns | (b) | ||||||||||||||||
| Other | (b) | ||||||||||||||||
| Total regulatory assets | |||||||||||||||||
Less: Current portion | |||||||||||||||||
| Total noncurrent regulatory assets | $ | $ | |||||||||||||||
Regulatory Liabilities(a) | |||||||||||||||||
Net regulatory liability related to income taxes | $ | $ | (b) | ||||||||||||||
COR regulatory liability | — | (d) | |||||||||||||||
Accrued pension and OPEB | (e) | ||||||||||||||||
Deferred fuel and purchased gas costs | 2024 | ||||||||||||||||
| Other | (b) | ||||||||||||||||
| Total regulatory liabilities | |||||||||||||||||
Less: Current portion | |||||||||||||||||
| Total noncurrent regulatory liabilities | $ | $ | |||||||||||||||
(a) Regulatory assets and liabilities are excluded from rate base unless otherwise noted.
(b) The expected recovery or refund period varies or has not been determined.
(c) Included in rate base.
(d) Recovery over the life of the associated assets.
(e) Recovered primarily over the average remaining service periods or life expectancies of employees covered by the benefit plans. See Note 23 for additional detail.
148
| FINANCIAL STATEMENTS | REGULATORY MATTERS | ||||
Duke Energy Ohio Electric Base Rate Case
Duke Energy Ohio filed with the PUCO an electric distribution base rate case application on October 1, 2021, with supporting testimony filed on October 15, 2021, requesting an increase in electric distribution base rates of approximately $55 million. On September 19, 2022, Duke Energy Ohio filed a Stipulation and Recommendation with the PUCO, which included an increase in overall electric distribution base rates of approximately $23 million with an equity ratio of 50.5% and an ROE of 9.5 %. The stipulation was among all but one party to the proceeding. The PUCO issued an order on December 14, 2022, approving the Stipulation without modification. Rates went into effect on January 3, 2023. The Ohio Consumers' Counsel (OCC) filed an application for rehearing on January 13, 2023, arguing the Stipulation was unreasonable, discriminatory and denied OCC due process. On February 8, 2023, the Commission granted the OCC's application for rehearing for further consideration. Duke Energy Ohio cannot predict the outcome of this matter.
Energy Efficiency Cost Recovery
In response to changes in Ohio law that eliminated Ohio's energy efficiency mandates, the PUCO issued an order on February 26, 2020, directing utilities to wind down their demand-side management programs by September 30, 2020, and to terminate the programs by December 31, 2020.
•On March 27, 2020, Duke Energy Ohio filed an application for rehearing seeking clarification on the final true up and reconciliation process after 2020.
•Effective January 1, 2021, Duke Energy Ohio suspended its energy efficiency programs.
On August 9, 2023, the PUCO issued its decision approving the Company’s request for recovery and final true up of energy efficiency program costs, lost distribution revenues and performance incentives from calendar years 2018 through 2020, resulting in $14 million of Regulated electric revenue on the Consolidated Statements of Operations for the year ended December 31, 2023, and resolving all outstanding issues in these proceedings. Revised rates were effective September 1, 2023.
Duke Energy Ohio Natural Gas Base Rate Case
Duke Energy Ohio filed with the PUCO a natural gas base rate case application on June 30, 2022, with supporting testimony filed on July 14, 2022, requesting an increase in natural gas base rates of approximately $49 million. The drivers for this case are capital invested since Duke Energy Ohio's last natural gas base rate case in 2012. Duke Energy Ohio also sought to adjust the caps on its CEP Rider. On April 28, 2023, Duke Energy Ohio filed a stipulation with all parties to the case except the OCC. In the stipulation, the parties agreed to approximately $32 million in revenue increases with an equity ratio of 52.32 % and an ROE of 9.6 %, and adjustments to the CEP Rider caps. The stipulation was opposed by the OCC at an evidentiary hearing that concluded on May 24, 2023. On November 1, 2023, PUCO issued an order approving the stipulation as filed. New rates went into effect November 1, 2023. On December 1, 2023, the OCC filed an application for rehearing. On December 13, 2023, the PUCO granted OCC's application for rehearing for further consideration of issues raised. Duke Energy Ohio cannot predict the outcome of this matter.
MGP Cost Recovery
In an order issued in 2013, the PUCO approved Duke Energy Ohio's deferral and recovery of costs related to environmental remediation at two sites (East End and West End) that housed former MGP operations. Duke Energy Ohio made annual applications with the PUCO to recover its incremental remediation costs consistent with the PUCO’s directive in Duke Energy Ohio’s 2012 natural gas base rate case.
A Stipulation and Recommendation was filed jointly by Duke Energy Ohio, the Staff, the Office of the Ohio Consumers' Counsel and the Ohio Energy Group on August 31, 2021, which was approved without modification by the PUCO on April 20, 2022. The Stipulation and Recommendation resolved all open issues regarding MGP remediation costs incurred between 2013 and 2019, Duke Energy Ohio’s request for additional deferral authority beyond 2019 and the pending issues related to the Tax Act described below as it related to Duke Energy Ohio’s natural gas operations. As a result of the approval of the Stipulation and Recommendation, Duke Energy Ohio recognized pretax charges of approximately $15 million to Operating revenues, regulated natural gas and $58 million to Operation, maintenance and other and a tax benefit of $72 million to Income Tax (Benefit) Expense in the Consolidated Statements of Operations for the year ended December 31, 2022. The Stipulation and Recommendation further acknowledged Duke Energy Ohio’s ability to file a request for additional deferral authority in the future related to environmental remediation of any MGP impacts in the Ohio River, if necessary, subject to specific conditions. On June 15, 2022, the PUCO granted the rehearing requests of Interstate Gas Supply, Inc. (IGS) and The Retail Energy Supply Association (RESA), which were filed on May 20, 2022, for further consideration. Duke Energy Ohio cannot predict the outcome of this matter.
Tax Act – Ohio
On December 21, 2018, Duke Energy Ohio filed an application to change its base rate tariffs and establish a rider to implement the benefits of the Tax Act for natural gas customers. The rider would flow through to customers the benefit of the reduction in the statutory federal tax rate from 35% to 21% since January 1, 2018, all future benefits of the lower tax rates and a full refund of deferred income taxes collected at the higher tax rates in prior years. Deferred income taxes subject to normalization rules would be refunded consistent with federal law and deferred income taxes not subject to normalization rules will be refunded over a 10-year period. An evidentiary hearing occurred on August 7, 2019. The Stipulation and Recommendation filed on August 31, 2021, and approved on April 20, 2022, disclosed in the MGP Cost Recovery matter above, resolved the outstanding issues in this proceeding by providing customers a one-time bill credit for the reduction in the statutory federal tax rate from 35% to 21% since January 1, 2018, through June 1, 2022, and reducing base rates going forward. Deferred income taxes not subject to normalization rules were written off. Deferred income taxes subject to normalization rules are refunded consistent with federal law through a rider. The commission granted the rehearing requests of IGS and RESA for further consideration. Duke Energy Ohio cannot predict the outcome of this matter.
149
| FINANCIAL STATEMENTS | REGULATORY MATTERS | ||||
Midwest Propane Caverns
Duke Energy Ohio used propane stored in caverns to meet peak demand during winter for several decades. Once the Central Corridor Project was complete and placed in service, the propane peaking facilities were no longer necessary and were retired. On October 7, 2021, Duke Energy Ohio requested deferral treatment of the property, plant and equipment as well as costs related to propane inventory and decommissioning costs. On January 6, 2022, the Staff issued a report recommending deferral authority for costs related to propane inventory and decommissioning costs, but not for the net book value of the remaining plant assets. As a result of the Staff's report, Duke Energy Ohio recorded a $19 million charge to Impairment of assets and other charges on the Consolidated Statements of Operations and Comprehensive Income for the year ended December 31, 2021. A Stipulation and Recommendation was filed jointly by Duke Energy Ohio and the Staff on April 27, 2022, recommending, among other things, approval of deferral treatment of a portion of the net book value of the property, plant and equipment prior to the 2021 impairment at the time of the next natural gas base rate case, excluding operations and maintenance savings, decommissioning costs not to exceed $7 million and costs related to propane inventory. The Stipulation and Recommendation states that Duke Energy Ohio will seek recovery of the deferral through its next natural gas base rate case proceeding with a proposed amortization period of at least 10 years and include an independent engineering study analyzing the necessity and prudency of the incremental investments made at the facilities since March 31, 2012. Duke Energy Ohio will not seek a return on the deferred amounts. An evidentiary hearing was held on September 8, 2022. On October 5, 2022, the PUCO issued an order approving the Stipulation and Recommendation as filed. As a result of the order, Duke Energy Ohio recorded a reversal of $12 million to Impairment of assets and other charges on the Consolidated Statements of Operations and Comprehensive Income for the year ended December 31, 2022.
Duke Energy Kentucky Electric Base Rate Case
On December 1, 2022, Duke Energy Kentucky filed a rate case with the KPSC requesting an annualized increase in electric base rates of approximately $75 million. The request for rate increase was driven by capital investments to strengthen the electricity generation and delivery systems along with adjusted depreciation rates for the East Bend and Woodsdale generation stations to support the energy transition. Duke Energy Kentucky also requested new programs and tariff updates, including a voluntary community-based renewable subscription program and two electric vehicle charging programs. The KPSC issued an order on October 12, 2023, including a $48 million increase in base revenues, an ROE of 9.75 % for electric base rates and 9.65 % for electric riders and an equity ratio of 52.145 %. New rates went into effect October 13, 2023. The Company's request to align the depreciation rates of East Bend with a 2035 retirement date was denied and the KPSC ordered depreciation rates with a 2041 retirement date for the unit. The KPSC did approve the request to align the depreciation rates of Woodsdale CT with a 2040 retirement date and denied the voluntary community-based renewable subscription program and the two electric vehicle charging programs.
On November 1, 2023, Duke Energy Kentucky filed for rehearing requesting certain matters be reconsidered by the KPSC. On November 21, 2023, KPSC granted in part and denied in part the Company's request for rehearing. On February 15, 2024, the KPSC issued a briefing schedule for the rehearing process. Simultaneous briefs are due on March 18, 2024, simultaneous reply briefs are due on April 1, 2024 and the matter shall stand submitted on April 2, 2024. On December 14, 2023, Duke Energy Kentucky filed an appeal with the Franklin County Circuit Court on certain matters for which the KPSC denied rehearing, specifically as it relates to including decommissioning costs in depreciation rates for East Bend and Woodsdale. On January 8, 2024, answers to the appeal were filed by the KPSC, Kentucky Attorney General, and the Kentucky Broadband & Cable Association. Duke Energy Kentucky cannot predict the outcome of this matter.
150
| FINANCIAL STATEMENTS | REGULATORY MATTERS | ||||
Duke Energy Indiana
Regulatory Assets and Liabilities
The following tables present the regulatory assets and liabilities recorded on Duke Energy Indiana's Consolidated Balance Sheets.
| December 31, | Earns/Pays | Recovery/Refund | |||||||||||||||
| (in millions) | 2023 | 2022 | a Return | Period Ends | |||||||||||||
Regulatory Assets(a) | |||||||||||||||||
AROs – coal ash | $ | $ | Yes | (b) | |||||||||||||
Deferred fuel and purchased power | — | 2024 | |||||||||||||||
Accrued pension and OPEB | (e) | ||||||||||||||||
Hedge costs deferrals | (b) | ||||||||||||||||
PISCC and deferred operating expenses(c) | Yes | (b) | |||||||||||||||
Retired generation facilities(c) | Yes | 2030 | |||||||||||||||
Customer connect project | (b) | ||||||||||||||||
AMI | 2031 | ||||||||||||||||
| Other | (b) | ||||||||||||||||
| Total regulatory assets | |||||||||||||||||
Less: Current portion | |||||||||||||||||
| Total noncurrent regulatory assets | $ | $ | |||||||||||||||
Regulatory Liabilities(a) | |||||||||||||||||
Net regulatory liability related to income taxes | $ | $ | (b) | ||||||||||||||
COR regulatory liability | (d) | ||||||||||||||||
Hedge cost deferrals | (b) | ||||||||||||||||
Accrued pension and OPEB | (e) | ||||||||||||||||
Deferred fuel and purchased power | — | 2024 | |||||||||||||||
| Other | (b) | ||||||||||||||||
| Total regulatory liabilities | |||||||||||||||||
Less: Current portion | |||||||||||||||||
| Total noncurrent regulatory liabilities | $ | $ | |||||||||||||||
(a) Regulatory assets and liabilities are excluded from rate base unless otherwise noted.
(b) The expected recovery or refund period varies or has not been determined.
(c) Included in rate base.
(d) Refunded over the life of the associated assets.
(e) Recovered primarily over the average remaining service periods or life expectancies of employees covered by the benefit plans. See Note 23 for additional detail.
2019 Indiana Rate Case
On July 2, 2019, Duke Energy Indiana filed a general rate case with the IURC for a rate increase for retail customers of approximately $395 million. The rebuttal case, filed on December 4, 2019, updated the requested revenue requirement to result in a 15.6 % or $396 million average retail rate increase, including the impacts of the utility receipts tax. On June 29, 2020, the IURC issued an order in the rate case approving a revenue increase of $146 million before certain adjustments and ratemaking refinements. The order approved Duke Energy Indiana's requested forecasted rate base of $10.2 billion as of December 31, 2020, including the Edwardsport Integrated Gasification Combined Cycle (IGCC) Plant. The IURC reduced Duke Energy Indiana's request by slightly more than $200 million, when accounting for the utility receipts tax and other adjustments. Step one rates were estimated to be approximately 75 % of the total rate increase and became effective on July 30, 2020. Step two rates estimated to be the remaining 25 % of the total rate increase were approved on July 28, 2021, and implemented in August 2021.
Several groups appealed the IURC order to the Indiana Court of Appeals. The Indiana Court of Appeals affirmed the IURC decision on May 13, 2021. However, upon appeal by the Indiana Office of Utility Consumer Counselor (OUCC) and the Duke Industrial Group on March 10, 2022, the Indiana Supreme Court found that the IURC erred in allowing Duke Energy Indiana to recover coal ash costs incurred before the IURC’s rate case order in June 2020. The Indiana Supreme Court found that allowing Duke Energy Indiana to recover coal ash costs incurred between rate cases that exceeded the amount built into base rates violated the prohibition against retroactive ratemaking. The IURC’s order was remanded to the IURC for additional proceedings consistent with the Indiana Supreme Court’s opinion. As a result of the court's opinion, Duke Energy Indiana recognized pretax charges of approximately $211 million to Impairment of assets and other charges and $46 million to Operating revenues in the Consolidated Statements of Operations for the year ended December 31, 2022. Duke Energy Indiana filed a request for rehearing with the Supreme Court on April 11, 2022, which the court denied on May 26, 2022. Duke Energy Indiana filed its testimony in the remand proceeding on August 18, 2022. On February 3, 2023, Duke Energy Indiana filed a settlement agreement reached with the OUCC and Duke Industrial Group, which includes an agreed amount of approximately $70 million of refunds to be paid to customers. The IURC approved this settlement agreement in its entirety on April 12, 2023. In June of 2023, Duke Energy Indiana commenced refunding the approximate $70 million to customers in accordance with the settlement agreement.
151
| FINANCIAL STATEMENTS | REGULATORY MATTERS | ||||
Indiana Coal Ash Recovery
In Duke Energy Indiana’s 2019 rate case, the IURC also opened a subdocket for post-2018 coal ash related expenditures. Duke Energy Indiana filed testimony on April 15, 2020, in the coal ash subdocket requesting recovery for the post-2018 coal ash basin closure costs for plans that have been approved by IDEM as well as continuing deferral, with carrying costs, on the balance. On November 3, 2021, the IURC issued an order allowing recovery for post-2018 coal ash basin closure costs for the plans that have been approved by IDEM, as well as continuing deferral, with carrying costs, on the balance. The OUCC and the Duke Industrial Group appealed. The Indiana Court of Appeals issued its opinion on February 21, 2023, reversing the IURC's order to the extent that it allowed Duke Energy Indiana to recover federally mandated costs incurred prior to the IURC's November 3, 2021, order. In addition, the court found that any costs incurred pre-petition to determine federally mandated compliance options were not specifically authorized by the statute and should also be disallowed. As a result of the Indiana Court of Appeals' opinion, Duke Energy Indiana recognized a pretax charge of approximately $175 million to Impairment of assets and other charges for the year ended December 31, 2022.
In the second quarter of 2023, Duke Energy Indiana filed its proposal to remove from rates certain costs incurred prior to the IURC's November 3, 2021, order date. On September 20, 2023, the commission approved the Company's proposal to remove the costs from its rates and assessed simple interest of the refunds of 4.71 %, beginning from when the costs were initially recovered from customers. Duke Energy Indiana filed a new petition under the amended version of the federal mandate statute for post-2018 coal ash closure costs for the remaining basins not included in the 2020 Indiana Coal Ash Recovery Case. An evidentiary hearing was held on January 25, 2024. Duke Energy Indiana cannot predict the outcome of this matter.
TDSIC 2.0
On November 23, 2021, Duke Energy Indiana filed for approval of the Transmission, Distribution, Storage Improvement Charge 2.0 investment plan for 2023-2028 (TDSIC 2.0). On June 15, 2022, the IURC approved, without modification, TDSIC 2.0, which includes approximately $2 billion in transmission and distribution investments selected to improve customer reliability, harden and improve resiliency of the grid, enable expansion of renewable and distributed energy projects and encourage economic development. In addition, the IURC set up a subdocket to consider a targeted economic development project, which the IURC approved on March 2, 2022. On July 15, 2022, the OUCC filed a notice of appeal to the Indiana Court of Appeals in Duke Energy Indiana’s TDSIC 2.0 proceeding. An appellant brief was filed on October 28, 2022, and Duke Energy Indiana filed its responsive brief on December 28, 2022. The Indiana Court of Appeals issued its opinion on March 9, 2023, affirming the IURC’s order in its entirety. The Duke Industrial Group filed a petition to transfer to the Indiana Supreme Court. The Indiana Supreme Court granted transfer and held an oral argument on September 28, 2023. Duke Energy Indiana cannot predict the outcome of this matter.
Piedmont
Regulatory Assets and Liabilities
The following tables present the regulatory assets and liabilities recorded on Piedmont's Consolidated Balance Sheets.
| December 31, | Earns/Pays | Recovery/Refund | |||||||||||||||
| (in millions) | 2023 | 2022 | a Return | Period Ends | |||||||||||||
Regulatory Assets(a) | |||||||||||||||||
AROs – nuclear and other | $ | $ | (d) | ||||||||||||||
Accrued pension and OPEB(c) | (g) | ||||||||||||||||
Vacation accrual | 2024 | ||||||||||||||||
Derivatives – natural gas supply contracts(f) | |||||||||||||||||
Deferred pipeline integrity costs(c) | 2025 | ||||||||||||||||
Decoupling | (e) | (b) | |||||||||||||||
Tennessee ARM Deferral | (e) | (b) | |||||||||||||||
| Other | (e) | (b) | |||||||||||||||
| Total regulatory assets | |||||||||||||||||
Less: Current portion | |||||||||||||||||
| Total noncurrent regulatory assets | $ | $ | |||||||||||||||
Regulatory Liabilities(a) | |||||||||||||||||
Net regulatory liability related to income taxes | $ | $ | (b) | ||||||||||||||
COR regulatory liability(c) | (d) | ||||||||||||||||
| Other | (e) | (b) | |||||||||||||||
| Total regulatory liabilities | |||||||||||||||||
Less: Current portion | |||||||||||||||||
| Total noncurrent regulatory liabilities | $ | $ | |||||||||||||||
(a) Regulatory assets and liabilities are excluded from rate base unless otherwise noted.
(b) The expected recovery or refund period varies or has not been determined.
(c) Included in rate base.
(d) Recovery over the life of the associated assets.
(e) Certain costs earn/pay a return.
(f) Balance will fluctuate with changes in the market. Current contracts extend into 2031.
(g) Recovered primarily over the average remaining service periods or life expectancies of employees covered by the benefit plans. See Note 23 for additional detail.
152
| FINANCIAL STATEMENTS | REGULATORY MATTERS | ||||
Tennessee Annual Review Mechanism
On October 10, 2022, the TPUC approved Piedmont’s petition to adopt an ARM as allowed by Tennessee law. Under the ARM, Piedmont will adjust rates annually to achieve its allowed 9.80 % ROE over the upcoming year and to true up any variance between its allowed ROE and actual ROE from the prior calendar year. The initial year subject to the true up was 2022, and Piedmont filed the initial rate adjustments request on May 19, 2023, for a total increase of approximately $42 million. On September 11, 2023, the TPUC approved a settlement between Piedmont and the Consumer Advocate Division of the Tennessee Attorney General's Office, which provided for recovery of the Historic Base Period Reconciliation cost of service of $11 million through rider rates and an increase in Piedmont's base rates of $29 million for the Annual Base Rate Reset component of the ARM. These amounts result in a total increase of $40 million with adjusted rates effective October 1, 2023.
OTHER REGULATORY MATTERS
Potential Coal Plant Retirements
The Subsidiary Registrants periodically file IRPs with their state regulatory commissions. The IRPs provide a view of forecasted energy needs over a long term (10 to 20 years) and resources proposed to meet those needs.
IRPs filed by certain Subsidiary Registrants included planning assumptions around future retirement dates of aging coal-fired generating facilities in North Carolina (Duke Energy Carolinas and Duke Energy Progress) and Indiana (Duke Energy Indiana). In North Carolina, the NCUC concluded in its December 2022 Carbon Plan order that the projected retirement dates presented by Duke Energy Carolinas and Duke Energy Progress in their Carbon Plan for coal-fired generating facilities were reasonable for planning purposes and further directed that appropriate steps be taken to optimally retire the coal fleet according to such schedule. Duke Energy Carolinas and Duke Energy Progress filed updated Resource Plans (Carbon Plan and IRP) in August 2023, and a supplemental filing in January 2024. See the "Other Matters" section of Item 7 Management's Discussion and Analysis for further details on IRPs.
Duke Energy continues to evaluate the retirement date assumptions for coal-fired generating facilities as changes in energy usage and/or growth and availability of replacement generation could result in different retirement dates of units than their current estimated useful lives. Except as discussed above related to Duke Energy Kentucky's East Bend plant, rate cases recently filed or approved across all jurisdictions included proposed depreciation rates reflecting the earlier retirement dates as outlined in recent IRPs. Duke Energy plans to seek regulatory recovery for amounts that would not be otherwise recovered when any of these assets are retired.
5. COMMITMENTS AND CONTINGENCIES
INSURANCE
General Insurance
The Duke Energy Registrants have insurance and reinsurance coverage either directly or through indemnification from Duke Energy’s captive insurance company, Bison, and its affiliates, consistent with companies engaged in similar commercial operations with similar type properties. The Duke Energy Registrants’ coverage includes (i) commercial general liability coverage for liabilities arising to third parties for bodily injury and property damage; (ii) workers’ compensation; (iii) automobile liability coverage; and (iv) property coverage for all real and personal property damage. Real and personal property damage coverage excludes electric transmission and distribution lines, but includes damages arising from boiler and machinery breakdowns, earthquakes, flood damage and extra expense, but not outage or replacement power coverage. All coverage is subject to certain deductibles or retentions, sublimits, exclusions, terms and conditions common for companies with similar types of operations. The Duke Energy Registrants self-insure their electric transmission and distribution lines against loss due to storm damage and other natural disasters. As discussed further in Note 4, Duke Energy Florida maintains a storm damage reserve and has a regulatory mechanism to recover the cost of named storms on an expedited basis.
The cost of the Duke Energy Registrants’ coverage can fluctuate from year to year reflecting claims history and conditions of the insurance and reinsurance markets. In the event of a loss, terms and amounts of insurance and reinsurance available might not be adequate to cover claims and other expenses incurred. Uninsured losses and other expenses, to the extent not recovered by other sources, could have a material effect on the Duke Energy Registrants’ results of operations, cash flows or financial position. Each company is responsible to the extent losses may be excluded or exceed limits of the coverage available.
Nuclear Insurance
Duke Energy Carolinas owns and operates McGuire and Oconee and operates and has a partial ownership interest in Catawba. McGuire and Catawba each have two three reactors. The other joint owners of Catawba reimburse Duke Energy Carolinas for certain expenses associated with nuclear insurance per the Catawba joint owner agreements.
Duke Energy Progress owns and operates Robinson, Brunswick and Harris. Robinson and Harris each have one two reactors.
Duke Energy Florida owns Crystal River Unit 3, which permanently ceased operation in 2013 and achieved a SAFSTOR condition in July 2019. On October 1, 2020, Crystal River Unit 3 changed decommissioning strategies from SAFSTOR to DECON.
In the event of a loss, terms and amounts of insurance available might not be adequate to cover property damage and other expenses incurred. Uninsured losses and other expenses, to the extent not recovered by other sources, could have a material effect on Duke Energy Carolinas’, Duke Energy Progress’ and Duke Energy Florida’s results of operations, cash flows or financial position. Each company is responsible to the extent losses may be excluded or exceed limits of the coverage available.
153
| FINANCIAL STATEMENTS | COMMITMENTS AND CONTINGENCIES | ||||
Nuclear Liability Coverage
The Price-Anderson Act requires owners of nuclear reactors to provide for public nuclear liability protection per nuclear incident up to a maximum total financial protection liability. The maximum total financial protection liability, which is approximately $16.2 billion, is subject to change every five years for inflation and for the number of licensed reactors. Total nuclear liability coverage consists of a combination of private primary nuclear liability insurance coverage and a mandatory industry risk-sharing program to provide for excess nuclear liability coverage above the maximum reasonably available private primary coverage. The U.S. Congress could impose revenue-raising measures on the nuclear industry to pay claims.
Primary Liability Insurance
Duke Energy Carolinas and Duke Energy Progress have purchased the maximum reasonably available private primary nuclear liability insurance as required by law, which is $450 100 million primary nuclear liability insurance for Crystal River in compliance with the law.
Excess Liability Program
This program provides $16.2 billion of coverage per incident through the Price-Anderson Act’s mandatory industrywide excess secondary financial protection program of risk pooling. This amount is the product of potential cumulative retrospective premium assessments of $166 million times the current 95 licensed commercial nuclear reactors in the U.S. Under this program, operating unit licensees could be assessed retrospective premiums to compensate for public nuclear liability damages in the event of a nuclear incident at any licensed facility in the U.S. Retrospective premiums may be assessed at a rate not to exceed $24.7 million per year per licensed reactor for each incident. The assessment may be subject to state premium taxes.
Nuclear Property and Accidental Outage Coverage
Duke Energy Carolinas, Duke Energy Progress and Duke Energy Florida are members of Nuclear Electric Insurance Limited (NEIL), an industry mutual insurance company, which provides property damage, nuclear accident decontamination and premature decommissioning insurance for each station for losses resulting from damage to its nuclear plants, either due to accidents or acts of terrorism. Additionally, NEIL provides accidental outage coverage for losses in the event of a major accidental outage at an insured nuclear station.
Pursuant to regulations of the NRC, each company’s property damage insurance policies provide that all proceeds from such insurance be applied, first, to place the plant in a safe and stable condition after a qualifying accident and second, to decontaminate the plant before any proceeds can be used for decommissioning, plant repair or restoration.
Losses resulting from acts of terrorism are covered as common occurrences, such that if terrorist acts occur against one or more commercial nuclear power plants insured by NEIL within a 12-month period, they would be treated as one event and the owners of the plants where the act occurred would share one full limit of liability. The full limit of liability is currently $3.2 billion. NEIL sublimits the total aggregate for all of their policies for non-nuclear terrorist events to approximately $1.8 billion.
Each nuclear facility has accident property damage, nuclear accident decontamination and premature decommissioning liability insurance from NEIL with limits of $1.5 billion, except for Crystal River Unit 3. Crystal River Unit 3’s limit is $50 million and is on an actual cash value basis. All nuclear facilities except for Catawba and Crystal River Unit 3 also share an additional $1.25 billion nuclear accident insurance limit above their dedicated underlying limit. This shared additional excess limit is not subject to reinstatement in the event of a loss. Catawba has a dedicated $1.25 billion of additional nuclear accident insurance limit above its dedicated underlying limit. Catawba and Oconee also have an additional $750
NEIL’s Accidental Outage policy provides some coverage, similar to business interruption, for losses in the event of a major accident property damage outage of a nuclear unit. Coverage is provided on a weekly limit basis after a significant waiting period deductible and at 100 % of the applicable weekly limits for 52 weeks and 80 % of the applicable weekly limits for up to the next 110 weeks. Coverage is provided until these applicable weekly periods are met, where the accidental outage policy limit will not exceed $490 million for Catawba, McGuire and Harris, $462 million for Brunswick and Oconee and $378 million for Robinson. NEIL sublimits the accidental outage recovery up to the first 104 weeks of coverage not to exceed $328 million from non-nuclear accidental property damage. Coverage amounts decrease in the event more than one unit at a station is out of service due to a common accident. All coverages are subject to sublimits and significant deductibles.
Potential Retroactive Premium Assessments
In the event of NEIL losses, NEIL’s board of directors may assess member companies' retroactive premiums of amounts up to 10 times their annual premiums for up to six years after a loss. NEIL has never exercised this assessment. The maximum aggregate annual retrospective premium obligations for Duke Energy Carolinas, Duke Energy Progress and Duke Energy Florida are $147 million, $90 million and $1 million, respectively. Duke Energy Carolinas' maximum assessment amount includes 100 % of potential obligations to NEIL for jointly owned reactors. Duke Energy Carolinas would seek reimbursement from the joint owners for their portion of these assessment amounts.
ENVIRONMENTAL
The Duke Energy Registrants are subject to federal, state and local regulations regarding air and water quality, hazardous and solid waste disposal, coal ash and other environmental matters. These regulations can be changed from time to time, imposing new obligations on the Duke Energy Registrants. The following environmental matters impact all of the Duke Energy Registrants.
154
| FINANCIAL STATEMENTS | COMMITMENTS AND CONTINGENCIES | ||||
Remediation Activities
In addition to AROs recorded as a result of various environmental regulations, discussed in Note 10, the Duke Energy Registrants are responsible for environmental remediation at various sites. These include certain properties that are part of ongoing operations and sites formerly owned or used by Duke Energy entities. These sites are in various stages of investigation, remediation and monitoring. Managed in conjunction with relevant federal, state and local agencies, remediation activities vary based upon site conditions and location, remediation requirements, complexity and sharing of responsibility. If remediation activities involve joint and several liability provisions, strict liability, or cost recovery or contribution actions, the Duke Energy Registrants could potentially be held responsible for environmental impacts caused by other potentially responsible parties and may also benefit from insurance policies or contractual indemnities that cover some or all cleanup costs. Liabilities are recorded when losses become probable and are reasonably estimable. The total costs that may be incurred cannot be estimated because the extent of environmental impact, allocation among potentially responsible parties, remediation alternatives and/or regulatory decisions have not yet been determined at all sites. Additional costs associated with remediation activities are likely to be incurred in the future and could be significant. Costs are typically expensed as Operation, maintenance and other in the Consolidated Statements of Operations unless regulatory recovery of the costs is deemed probable.
The following table contains information regarding reserves for probable and estimable costs related to the various environmental sites. These reserves are recorded in Accounts Payable within Other Current Liabilities and Other within on the Consolidated Balance Sheets.
| (in millions) | December 31, 2023 | December 31, 2022 | ||||||||||||
| Reserves for Environmental Remediation | ||||||||||||||
| Duke Energy | $ | $ | ||||||||||||
| Duke Energy Carolinas | ||||||||||||||
| Progress Energy | ||||||||||||||
| Duke Energy Progress | ||||||||||||||
| Duke Energy Florida | ||||||||||||||
| Duke Energy Ohio | ||||||||||||||
| Duke Energy Indiana | ||||||||||||||
| Piedmont | ||||||||||||||
Additional losses in excess of recorded reserves that could be incurred for the stages of investigation, remediation and monitoring for environmental sites that have been evaluated at this time are not material.
LITIGATION
Duke Energy
Texas Storm Uri Tort Litigation
Duke Energy (Parent), several Duke Energy renewables project companies, and others in the ERCOT market were named in multiple lawsuits arising out of Texas Storm Uri, which occurred in February 2021. These lawsuits seek recovery for property damage, personal injury and wrongful death allegedly caused by the power outages that plaintiffs claim were the collective failure of generators including Duke Energy entities, transmission and distribution operators (TDUs), retail energy providers, and all others, including ERCOT. The cases were consolidated into a Texas state court multidistrict litigation (MDL) proceeding for discovery and pre-trial motions. Five MDL cases were designated as lead cases in which motions to dismiss were filed and all other cases were stayed. On January 28, 2023, the Court denied certain motions including those by the generator defendants and TDUs and granted others. The generators and TDUs filed separate petitions for Writ of Mandamus to the Texas Court of Appeals seeking to overturn the denials. The TDUs' petition, filed first, was accepted and oral argument was held on October 23, 2023. In the cases against the generators, Plaintiffs have dismissed the claims against Duke Energy (Parent). However, before Duke Energy (Parent) was dismissed from all cases, on December 14, 2023, without argument, the Court of Appeals accepted mandamus of the generator defendants’ appeal, which includes all Duke Energy entities, and directed the MDL court to dismiss all claims. Plaintiffs filed their Petition for Reconsideration on January 29, 2024. Regardless of the outcome of any motion for reconsideration or appeal, claims against Duke Energy (Parent) will remain dismissed. In October 2023, in conjunction with the closing of the sale of the utility-scale solar and wind group, all but one of the project company lawsuits transferred to Brookfield. Based on legal proceedings to date and applicable insurance and reinsurance coverage, Duke Energy (Parent) does not anticipate any material financial impacts with this remaining case. Duke Energy cannot predict the ultimate outcome of this matter. See Note 2 for more information related to the sale of the Commercial Renewables Disposal Groups.
Duke Energy Carolinas
Ruben Villano, et al. v. Duke Energy Carolinas, LLC
On June 16, 2021, a group of nine individuals went over a low-head dam adjacent to the Dan River Steam Station in Eden, North Carolina, while water tubing. Emergency personnel rescued four people and five others were confirmed deceased. On August 11, 2021, Duke Energy Carolinas was served with the complaint filed in Durham County Superior Court on behalf of four survivors, which was later amended to include all the decedents along with the survivors. The lawsuit alleges that Duke Energy Carolinas knew that the river was used for recreational purposes, did not adequately warn about the dam, and created a dangerous and hidden hazard on the Dan River in building and maintaining the low-head dam. In 2023, Duke Energy Carolinas reached an agreement that resolved this matter. The resolution, which did not have a material financial impact, was approved by the Durham County Superior Court. The case was dismissed on June 6, 2023.
155
| FINANCIAL STATEMENTS | COMMITMENTS AND CONTINGENCIES | ||||
NTE Carolinas II, LLC Litigation
In November 2017, Duke Energy Carolinas entered into a standard FERC large generator interconnection agreement (LGIA) with NTE Carolinas II, LLC (NTE), a company that proposed to build a combined-cycle natural gas plant in Rockingham County, North Carolina. On September 6, 2019, Duke Energy Carolinas filed a lawsuit in Mecklenburg County Superior Court against NTE for breach of contract, alleging that NTE's failure to pay benchmark payments for Duke Energy Carolinas' transmission system upgrades required under the interconnection agreement constituted a termination of the interconnection agreement. Duke Energy Carolinas sought a monetary judgment against NTE because NTE failed to make multiple milestone payments. The lawsuit was moved to federal court in North Carolina. NTE filed a motion to dismiss Duke Energy Carolinas’ complaint and brought counterclaims alleging anti-competitive conduct and violations of state and federal statutes. Duke Energy Carolinas filed a motion to dismiss NTE's counterclaims. Both NTE's and Duke Energy Carolinas' motions to dismiss were subsequently denied by the court.
On May 21, 2020, in response to a NTE petition challenging Duke Energy Carolinas' termination of the LGIA, FERC issued a ruling that 1) it has exclusive jurisdiction to determine whether a transmission provider may terminate a LGIA; 2) FERC approval is required to terminate a conforming LGIA if objected to by the interconnection customer; and 3) Duke Energy may not announce the termination of a conforming LGIA unless FERC has approved the termination. FERC's Office of Enforcement also initiated an investigation of Duke Energy Carolinas into matters pertaining to the LGIA. On April 6, 2023, Duke Energy Carolinas received notice from the FERC Office of Enforcement that they have closed their non-public investigation with no further action recommended.
Following completion of discovery, Duke Energy Carolinas filed a motion for summary judgment seeking a ruling in its favor as to some of its affirmative claims against NTE and to all of NTE’s counterclaims. On June 24, 2022, the court issued an order partially granting Duke Energy Carolinas' motion by dismissing NTE's counterclaims that Duke Energy Carolinas engaged in anti-competitive behavior in violation of state and federal statutes. On October 12, 2022, the parties executed a settlement agreement with respect to the remaining breach of contract claims in the litigation and a Stipulation of Dismissal was filed with the court on October 13, 2022. On November 11, 2022, NTE filed its Notice of Appeal to the U.S. Court of Appeals for the Fourth Circuit as to the District Court's summary judgment ruling in Duke Energy Carolinas' favor on NTE's antitrust and unfair competition claims. Briefing on NTE's appeal was completed on June 30, 2023. Oral Argument has been tentatively set for May 7-10, 2024. Duke Energy Carolinas cannot predict the outcome of this matter.
Asbestos-related Injuries and Damages Claims
Duke Energy Carolinas has experienced numerous claims for indemnification and medical cost reimbursement related to asbestos exposure. These claims relate to damages for bodily injuries alleged to have arisen from exposure to or use of asbestos in connection with construction and maintenance activities conducted on its electric generation plants prior to 1985.
Duke Energy Carolinas has recognized asbestos-related reserves of $423 million and $457 million at December 31, 2023, and 2022, respectively. These reserves are classified in Other within Other Noncurrent Liabilities and Other within Current Liabilities on the Consolidated Balance Sheets. These reserves are based upon Duke Energy Carolinas' best estimate for current and future asbestos claims through 2043 and are recorded on an undiscounted basis. In light of the uncertainties inherent in a longer-term forecast, management does not believe they can reasonably estimate the indemnity and medical costs that might be incurred after 2043 related to such potential claims. It is possible Duke Energy Carolinas may incur asbestos liabilities in excess of the recorded reserves.
Duke Energy Carolinas has third-party insurance to cover certain losses related to asbestos-related injuries and damages above an aggregate self-insured retention. Receivables for insurance recoveries were $572 million and $595 million at December 31, 2023, and 2022, respectively. These amounts are classified in Other within Other Noncurrent Assets and Receivables within Current Assets on the Consolidated Balance Sheets. Any future payments up to the policy limit will be reimbursed by the third-party insurance carrier. Duke Energy Carolinas is not aware of any uncertainties regarding the legal sufficiency of insurance claims. Duke Energy Carolinas believes the insurance recovery asset is probable of recovery as the insurance carrier continues to have a strong financial strength rating.
The reserve for credit losses for insurance receivables for the asbestos-related injuries and damages is $9 million as of December 31, 2023, and $12 million as of December 31, 2022, for both Duke Energy and Duke Energy Carolinas. The insurance receivable is evaluated based on the risk of default and the historical losses, current conditions and expected conditions around collectability. Management evaluates the risk of default annually based on payment history, credit rating and changes in the risk of default from credit agencies.
Duke Energy Indiana
Coal Ash Insurance Coverage Litigation
In June 2022, Duke Energy Indiana filed a civil action in Indiana Superior Court against various insurance companies seeking declaratory relief with respect to insurance coverage for CCR-related expenses and liabilities covered by third-party liability insurance policies. The insurance policies cover the 1969-1972 and 1984-1985 periods and provide third-party liability insurance for claims and suits alleging property damage, bodily injury and personal injury (or a combination thereof). A trial date has not yet been set. On June 30, 2023, Duke Energy Indiana and Associated Electric and Gas Insurance Services (AEGIS) reached a confidential settlement, the results of which were not material to Duke Energy, and as a result, AEGIS was dismissed from the litigation on July 13, 2023. On December 11, 2023, Duke Energy Indiana and Munich Reinsurance America, Inc. (formerly known as American Re-Insurance Company) (AmRe) reached a confidential settlement, the results of which were not material, and AmRe was dismissed from the litigation on January 18, 2024. The lawsuit remains pending as to the other insurers, but is stayed until March 31, 2024, to allow for further settlement negotiations with other defendants. Duke Energy Indiana cannot predict the outcome of this matter.
Other Litigation and Legal Proceedings
The Duke Energy Registrants are involved in other legal, tax and regulatory proceedings arising in the ordinary course of business, some of which involve significant amounts. The Duke Energy Registrants believe the final disposition of these proceedings will not have a material effect on their results of operations, cash flows or financial position for the years presented. Reserves are classified on the Consolidated Balance Sheets in Other within Other Noncurrent Liabilities and Other within Current Liabilities.
156
| FINANCIAL STATEMENTS | COMMITMENTS AND CONTINGENCIES | ||||
OTHER COMMITMENTS AND CONTINGENCIES
General
As part of their normal business, the Duke Energy Registrants are party to various financial guarantees, performance guarantees and other contractual commitments to extend guarantees of credit and other assistance to various subsidiaries, investees and other third parties. These guarantees involve elements of performance and credit risk, which are not fully recognized on the Consolidated Balance Sheets and have uncapped maximum potential payments. However, the Duke Energy Registrants do not believe these guarantees will have a material effect on their results of operations, cash flows or financial position. See Note 8 for more information.
Purchase Obligations
Purchased Power
Duke Energy Progress, Duke Energy Florida, Duke Energy Ohio and Duke Energy Indiana have ongoing purchased power contracts, including renewable energy contracts, with other utilities, wholesale marketers, co-generators and qualified facilities. These purchased power contracts generally provide for capacity and energy payments. In addition, Duke Energy Progress and Duke Energy Florida have various contracts to secure transmission rights.
The following table presents executory purchased power contracts with terms exceeding one year, excluding contracts classified as leases.
| Minimum Purchase Amount at December 31, 2023 | |||||||||||||||||||||||||||||||||||||||||||||||
| Contract | |||||||||||||||||||||||||||||||||||||||||||||||
| (in millions) | Expiration | 2024 | 2025 | 2026 | 2027 | 2028 | Thereafter | Total | |||||||||||||||||||||||||||||||||||||||
Duke Energy Progress(a) | 2028-2032 | $ | $ | $ | $ | $ | $ | $ | |||||||||||||||||||||||||||||||||||||||
Duke Energy Florida(b) | 2025 | — | — | — | — | ||||||||||||||||||||||||||||||||||||||||||
Duke Energy Ohio(c) | 2025 | — | — | — | — | ||||||||||||||||||||||||||||||||||||||||||
Duke Energy Indiana(c) | 2026 | — | — | — | |||||||||||||||||||||||||||||||||||||||||||
(a) Contracts represent between 18 % and 100 % of net plant output.
(b) Contracts represent 100 % of net plant output.
(c) Share of net plant output varies. Duke Energy Ohio excludes PPA with OVEC.
Gas Supply and Capacity Contracts
Duke Energy Ohio and Piedmont routinely enter into long-term natural gas supply commodity and capacity commitments and other agreements that commit future cash flows to acquire services needed in their businesses. These commitments include pipeline and storage capacity contracts and natural gas supply contracts to provide service to customers. Costs arising from the natural gas supply commodity and capacity commitments, while significant, are pass-through costs to customers and are generally fully recoverable through specific fuel rate components operating in conjunction with PGA procedures, and subject to periodic prudence reviews in North Carolina and South Carolina and the Performance Incentive Plan in Tennessee. In the Midwest, these costs are recovered via the Gas Cost Recovery Rate in Ohio or the Gas Cost Adjustment Clause in Kentucky. The time periods for fixed payments under pipeline and storage capacity contracts are up to 19 years. The time periods for fixed payments under natural gas supply contracts is up to two years . The time period for the natural gas supply purchase commitments is up to seven years .
Certain storage and pipeline capacity contracts require the payment of demand charges that are based on rates approved by the FERC in order to maintain rights to access the natural gas storage or pipeline capacity on a firm basis during the contract term. The demand charges that are incurred in each period are recognized in the Consolidated Statements of Operations and Comprehensive Income as part of natural gas purchases and are included in Cost of natural gas.
The following table presents future unconditional purchase obligations under natural gas supply and capacity contracts as of December 31, 2023.
| (in millions) | 2024 | 2025 | 2026 | 2027 | 2028 | Thereafter | Total | ||||||||||||||||
| Duke Energy Ohio | $ | $ | $ | $ | $ | $ | $ | ||||||||||||||||
| Piedmont | |||||||||||||||||||||||
6. LEASES
As part of its operations, Duke Energy leases certain aircraft, space on communication towers, industrial equipment, fleet vehicles, fuel transportation (barges and railcars), land and office space under various terms and expiration dates. Additionally, Duke Energy Carolinas, Duke Energy Progress and Duke Energy Indiana have finance leases related to firm natural gas pipeline transportation capacity. Duke Energy Progress and Duke Energy Florida have entered into certain PPAs, which are classified as finance and operating leases.
Duke Energy has certain lease agreements, which include variable lease payments that are based on the usage of an asset. These variable lease payments are not included in the measurement of the ROU assets or operating lease liabilities on the Consolidated Financial Statements.
Certain Duke Energy lease agreements include options for renewal and early termination. The intent to renew a lease varies depending on the lease type and asset. Renewal options that are reasonably certain to be exercised are included in the lease measurements. The decision to terminate a lease early is dependent on various economic factors. No termination options have been included in any of the lease measurements.
157
| FINANCIAL STATEMENTS | LEASES | ||||
Duke Energy Carolinas entered into a sale-leaseback arrangement in December 2019, to construct and occupy an office tower. The lease agreement was evaluated as a sale-leaseback of real estate and it was determined that the transaction did not qualify for sale-leaseback accounting. As a result, the transaction is being accounted for as a financing. For this transaction, Duke Energy Carolinas will continue to record the real estate on the Consolidated Balance Sheets within Property, Plant and Equipment as if it were the legal owner and will continue to recognize depreciation expense over the estimated useful life. In addition, the failed sale-leaseback obligation is reported within Long-Term Debt on the Consolidated Balance Sheets, with the monthly lease payments commencing after the construction phase being split between interest expense and principal pay down of the debt.
Piedmont has certain agreements with Duke Energy Carolinas for the construction and transportation of natural gas pipelines to supply its natural gas plant needs. Piedmont accounts for these pipeline lateral contracts as sales-type leases since the present value of the sum of the lease payments equals the fair value of the assets. These pipeline lateral assets owned by Piedmont had a current net investment basis of $2 199 million and $201 million as of December 31, 2023, and 2022, respectively. These assets are classified in Other, within Current Assets and Other Noncurrent Assets, respectively, on Piedmont's Consolidated Balance Sheets. Duke Energy Carolinas accounts for the contracts as finance leases. The activity for these contracts is eliminated in consolidation at Duke Energy.
The following tables present the components of lease expense.
| Year Ended December 31, 2023 | |||||||||||||||||||||||||||||||||||||||||||||||
| Duke | Duke | Duke | Duke | Duke | |||||||||||||||||||||||||||||||||||||||||||
| Duke | Energy | Progress | Energy | Energy | Energy | Energy | |||||||||||||||||||||||||||||||||||||||||
| (in millions) | Energy | Carolinas | Energy | Progress | Florida | Ohio | Indiana | Piedmont | |||||||||||||||||||||||||||||||||||||||
Operating lease expense(a) | $ | $ | $ | $ | $ | $ | $ | $ | |||||||||||||||||||||||||||||||||||||||
Short-term lease expense(a) | — | — | — | ||||||||||||||||||||||||||||||||||||||||||||
Variable lease expense(a) | — | — | |||||||||||||||||||||||||||||||||||||||||||||
| Finance lease expense | |||||||||||||||||||||||||||||||||||||||||||||||
Amortization of leased assets(b) | — | — | — | ||||||||||||||||||||||||||||||||||||||||||||
Interest on lease liabilities(c) | — | — | |||||||||||||||||||||||||||||||||||||||||||||
| Total finance lease expense | — | — | |||||||||||||||||||||||||||||||||||||||||||||
| Total lease expense | $ | $ | $ | $ | $ | $ | $ | $ | |||||||||||||||||||||||||||||||||||||||
| Year Ended December 31, 2022 | |||||||||||||||||||||||||||||||||||||||||||||||
| Duke | Duke | Duke | Duke | Duke | |||||||||||||||||||||||||||||||||||||||||||
| Duke | Energy | Progress | Energy | Energy | Energy | Energy | |||||||||||||||||||||||||||||||||||||||||
| (in millions) | Energy | Carolinas | Energy | Progress | Florida | Ohio | Indiana | Piedmont | |||||||||||||||||||||||||||||||||||||||
Operating lease expense(a) | $ | $ | $ | $ | $ | $ | $ | $ | |||||||||||||||||||||||||||||||||||||||
Short-term lease expense(a) | — | — | — | — | |||||||||||||||||||||||||||||||||||||||||||
Variable lease expense(a) | ( | — | — | ||||||||||||||||||||||||||||||||||||||||||||
| Finance lease expense | |||||||||||||||||||||||||||||||||||||||||||||||
Amortization of leased assets(b) | — | — | — | ||||||||||||||||||||||||||||||||||||||||||||
Interest on lease liabilities(c) | — | — | |||||||||||||||||||||||||||||||||||||||||||||
| Total finance lease expense | — | — | |||||||||||||||||||||||||||||||||||||||||||||
| Total lease expense | $ | $ | $ | $ | $ | $ | $ | $ | |||||||||||||||||||||||||||||||||||||||
(a) Included in Operations, maintenance and other or, for barges and railcars, Fuel used in electric generation and purchased power on the Consolidated Statements of Operations.
(b) Included in Depreciation and amortization on the Consolidated Statements of Operations.
(c) Included in Interest Expense on the Consolidated Statements of Operations.
158
| FINANCIAL STATEMENTS | LEASES | ||||
The following table presents operating lease maturities and a reconciliation of the undiscounted cash flows to operating lease liabilities.
| December 31, 2023 | |||||||||||||||||||||||||||||||||||||||||||||||
| Duke | Duke | Duke | Duke | Duke | |||||||||||||||||||||||||||||||||||||||||||
| Duke | Energy | Progress | Energy | Energy | Energy | Energy | |||||||||||||||||||||||||||||||||||||||||
| (in millions) | Energy | Carolinas | Energy | Progress | Florida | Ohio | Indiana | Piedmont | |||||||||||||||||||||||||||||||||||||||
| 2024 | $ | $ | $ | $ | $ | $ | $ | $ | |||||||||||||||||||||||||||||||||||||||
| 2025 | |||||||||||||||||||||||||||||||||||||||||||||||
| 2026 | |||||||||||||||||||||||||||||||||||||||||||||||
| 2027 | — | ||||||||||||||||||||||||||||||||||||||||||||||
| 2028 | — | ||||||||||||||||||||||||||||||||||||||||||||||
| Thereafter | — | ||||||||||||||||||||||||||||||||||||||||||||||
| Total operating lease payments | |||||||||||||||||||||||||||||||||||||||||||||||
Less: Present value discount | ( | ( | ( | ( | ( | ( | ( | — | |||||||||||||||||||||||||||||||||||||||
Total operating lease liabilities(a) | $ | $ | $ | $ | $ | $ | $ | $ | |||||||||||||||||||||||||||||||||||||||
(a) Certain operating lease payments include renewal options that are reasonably certain to be exercised.
The following table presents finance lease maturities and a reconciliation of the undiscounted cash flows to finance lease liabilities.
| December 31, 2023 | |||||||||||||||||||||||||||||||||||
| Duke | Duke | Duke | Duke | ||||||||||||||||||||||||||||||||
| Duke | Energy | Progress | Energy | Energy | Energy | ||||||||||||||||||||||||||||||
| (in millions) | Energy | Carolinas | Energy | Progress | Florida | Indiana | |||||||||||||||||||||||||||||
| 2024 | $ | $ | $ | $ | $ | $ | |||||||||||||||||||||||||||||
| 2025 | |||||||||||||||||||||||||||||||||||
| 2026 | |||||||||||||||||||||||||||||||||||
| 2027 | |||||||||||||||||||||||||||||||||||
| 2028 | — | ||||||||||||||||||||||||||||||||||
| Thereafter | — | ||||||||||||||||||||||||||||||||||
| Total finance lease payments | |||||||||||||||||||||||||||||||||||
Less: Amounts representing interest | ( | ( | ( | ( | ( | ( | |||||||||||||||||||||||||||||
| Total finance lease liabilities | $ | $ | $ | $ | $ | $ | |||||||||||||||||||||||||||||
The following tables contain additional information related to leases.
| December 31, 2023 | ||||||||||||||||||||||||||||||||||||||||||||||||||
| Duke | Duke | Duke | Duke | Duke | ||||||||||||||||||||||||||||||||||||||||||||||
| Duke | Energy | Progress | Energy | Energy | Energy | Energy | ||||||||||||||||||||||||||||||||||||||||||||
| (in millions) | Classification | Energy | Carolinas | Energy | Progress | Florida | Ohio | Indiana | Piedmont | |||||||||||||||||||||||||||||||||||||||||
| Assets | ||||||||||||||||||||||||||||||||||||||||||||||||||
| Operating | Operating lease ROU assets, net | $ | $ | $ | $ | $ | $ | $ | $ | |||||||||||||||||||||||||||||||||||||||||
| Finance | Net property, plant and equipment | — | — | |||||||||||||||||||||||||||||||||||||||||||||||
| Total lease assets | $ | $ | $ | $ | $ | $ | $ | $ | ||||||||||||||||||||||||||||||||||||||||||
| Liabilities | ||||||||||||||||||||||||||||||||||||||||||||||||||
| Current | ||||||||||||||||||||||||||||||||||||||||||||||||||
| Operating | Other current liabilities | $ | $ | $ | $ | $ | $ | $ | $ | — | ||||||||||||||||||||||||||||||||||||||||
| Finance | Current maturities of long-term debt | — | — | — | ||||||||||||||||||||||||||||||||||||||||||||||
| Noncurrent | ||||||||||||||||||||||||||||||||||||||||||||||||||
| Operating | Operating lease liabilities | |||||||||||||||||||||||||||||||||||||||||||||||||
| Finance | Long-Term Debt | — | — | |||||||||||||||||||||||||||||||||||||||||||||||
| Total lease liabilities | $ | $ | $ | $ | $ | $ | $ | $ | ||||||||||||||||||||||||||||||||||||||||||
159
| FINANCIAL STATEMENTS | LEASES | ||||
| December 31, 2022 | ||||||||||||||||||||||||||||||||||||||||||||||||||
| Duke | Duke | Duke | Duke | Duke | ||||||||||||||||||||||||||||||||||||||||||||||
| Duke | Energy | Progress | Energy | Energy | Energy | Energy | ||||||||||||||||||||||||||||||||||||||||||||
| (in millions) | Classification | Energy | Carolinas | Energy | Progress | Florida | Ohio | Indiana | Piedmont | |||||||||||||||||||||||||||||||||||||||||
| Assets | ||||||||||||||||||||||||||||||||||||||||||||||||||
| Operating | Operating lease ROU assets, net | $ | $ | $ | $ | $ | $ | $ | $ | |||||||||||||||||||||||||||||||||||||||||
| Finance | — | — | ||||||||||||||||||||||||||||||||||||||||||||||||
| Total lease assets | $ | $ | $ | $ | $ | $ | $ | $ | ||||||||||||||||||||||||||||||||||||||||||
| Liabilities | ||||||||||||||||||||||||||||||||||||||||||||||||||
| Current | ||||||||||||||||||||||||||||||||||||||||||||||||||
| Operating | $ | $ | $ | $ | $ | $ | $ | $ | — | |||||||||||||||||||||||||||||||||||||||||
| Finance | — | — | — | |||||||||||||||||||||||||||||||||||||||||||||||
| Noncurrent | ||||||||||||||||||||||||||||||||||||||||||||||||||
| Operating | ||||||||||||||||||||||||||||||||||||||||||||||||||
| Finance | — | — | ||||||||||||||||||||||||||||||||||||||||||||||||
| Total lease liabilities | $ | $ | $ | $ | $ | $ | $ | $ | ||||||||||||||||||||||||||||||||||||||||||
| Year Ended December 31, 2023 | |||||||||||||||||||||||||||||||||||||||||||||||
| Duke | Duke | Duke | Duke | Duke | |||||||||||||||||||||||||||||||||||||||||||
| Duke | Energy | Progress | Energy | Energy | Energy | Energy | |||||||||||||||||||||||||||||||||||||||||
| (in millions) | Energy | Carolinas | Energy | Progress | Florida | Ohio | Indiana | Piedmont | |||||||||||||||||||||||||||||||||||||||
Cash paid for amounts included in the measurement of lease liabilities(a) | |||||||||||||||||||||||||||||||||||||||||||||||
| Operating cash flows from operating leases | $ | $ | $ | $ | $ | $ | $ | $ | — | ||||||||||||||||||||||||||||||||||||||
| Operating cash flows from finance leases | — | — | |||||||||||||||||||||||||||||||||||||||||||||
| Financing cash flows from finance leases | — | — | — | ||||||||||||||||||||||||||||||||||||||||||||
| Lease assets obtained in exchange for new lease liabilities (non-cash) | |||||||||||||||||||||||||||||||||||||||||||||||
Operating | $ | $ | $ | $ | $ | $ | $ | $ | |||||||||||||||||||||||||||||||||||||||
| Finance | — | — | — | — | — | — | — | ||||||||||||||||||||||||||||||||||||||||
| Year Ended December 31, 2022 | |||||||||||||||||||||||||||||||||||||||||||||||
| Duke | Duke | Duke | Duke | Duke | |||||||||||||||||||||||||||||||||||||||||||
| Duke | Energy | Progress | Energy | Energy | Energy | Energy | |||||||||||||||||||||||||||||||||||||||||
| (in millions) | Energy | Carolinas | Energy | Progress | Florida | Ohio | Indiana | Piedmont | |||||||||||||||||||||||||||||||||||||||
Cash paid for amounts included in the measurement of lease liabilities(a) | |||||||||||||||||||||||||||||||||||||||||||||||
| Operating cash flows from operating leases | $ | $ | $ | $ | $ | $ | $ | $ | |||||||||||||||||||||||||||||||||||||||
| Operating cash flows from finance leases | — | — | |||||||||||||||||||||||||||||||||||||||||||||
| Financing cash flows from finance leases | — | — | — | ||||||||||||||||||||||||||||||||||||||||||||
| Lease assets obtained in exchange for new lease liabilities (non-cash) | |||||||||||||||||||||||||||||||||||||||||||||||
Operating | $ | $ | $ | — | $ | — | $ | — | $ | — | $ | — | $ | — | |||||||||||||||||||||||||||||||||
| Finance | — | — | — | — | — | — | — | — | |||||||||||||||||||||||||||||||||||||||
160
| FINANCIAL STATEMENTS | LEASES | ||||
| December 31, 2023 | |||||||||||||||||||||||||||||||||||||||||||||||
| Duke | Duke | Duke | Duke | Duke | |||||||||||||||||||||||||||||||||||||||||||
| Duke | Energy | Progress | Energy | Energy | Energy | Energy | |||||||||||||||||||||||||||||||||||||||||
| Energy | Carolinas | Energy | Progress | Florida | Ohio | Indiana | Piedmont | ||||||||||||||||||||||||||||||||||||||||
| Weighted average remaining lease term (years) | |||||||||||||||||||||||||||||||||||||||||||||||
| Operating leases | |||||||||||||||||||||||||||||||||||||||||||||||
| Finance leases | — | ||||||||||||||||||||||||||||||||||||||||||||||
Weighted average discount rate(a) | |||||||||||||||||||||||||||||||||||||||||||||||
| Operating leases | % | % | % | % | % | % | % | % | |||||||||||||||||||||||||||||||||||||||
| Finance leases | % | % | % | % | % | — | % | % | % | ||||||||||||||||||||||||||||||||||||||
| December 31, 2022 | |||||||||||||||||||||||||||||||||||||||||||||||
| Duke | Duke | Duke | Duke | Duke | |||||||||||||||||||||||||||||||||||||||||||
| Duke | Energy | Progress | Energy | Energy | Energy | Energy | |||||||||||||||||||||||||||||||||||||||||
| Energy | Carolinas | Energy | Progress | Florida | Ohio | Indiana | Piedmont | ||||||||||||||||||||||||||||||||||||||||
| Weighted average remaining lease term (years) | |||||||||||||||||||||||||||||||||||||||||||||||
| Operating leases | |||||||||||||||||||||||||||||||||||||||||||||||
| Finance leases | — | — | |||||||||||||||||||||||||||||||||||||||||||||
Weighted average discount rate(a) | |||||||||||||||||||||||||||||||||||||||||||||||
| Operating leases | % | % | % | % | % | % | % | % | |||||||||||||||||||||||||||||||||||||||
| Finance leases | % | % | % | % | % | — | % | % | — | % | |||||||||||||||||||||||||||||||||||||
(a) The discount rate is calculated using the rate implicit in a lease if it is readily determinable. Generally, the rate used by the lessor is not provided to Duke Energy and in these cases the incremental borrowing rate is used. Duke Energy will typically use its fully collateralized incremental borrowing rate as of the commencement date to calculate and record the lease. The incremental borrowing rate is influenced by the lessee’s credit rating and lease term and as such may differ for individual leases, embedded leases or portfolios of leased assets.
161
| FINANCIAL STATEMENTS | DEBT AND CREDIT FACILITIES | ||||
7. DEBT AND CREDIT FACILITIES
Summary of Debt and Related Terms
The following tables summarize outstanding debt.
| December 31, 2023 | ||||||||||||||||||||||||||||||||
| Weighted | ||||||||||||||||||||||||||||||||
| Average | Duke | Duke | Duke | Duke | Duke | |||||||||||||||||||||||||||
| Interest | Duke | Energy | Progress | Energy | Energy | Energy | Energy | |||||||||||||||||||||||||
| (in millions) | Rate | Energy | Carolinas | Energy | Progress | Florida | Ohio | Indiana | Piedmont | |||||||||||||||||||||||
Unsecured debt, maturing 2024-2082 | % | $ | $ | $ | $ | — | $ | $ | $ | $ | ||||||||||||||||||||||
Secured debt, maturing 2024-2052 | % | — | — | — | ||||||||||||||||||||||||||||
First mortgage bonds, maturing 2025-2073(a) | % | — | ||||||||||||||||||||||||||||||
Finance leases, maturing 2024-2051(b) | — | — | ||||||||||||||||||||||||||||||
Tax-exempt bonds, maturing 2027-2046(c) | % | — | — | — | ||||||||||||||||||||||||||||
Notes payable and commercial paper(d) | % | — | — | — | — | — | — | — | ||||||||||||||||||||||||
| Money pool/intercompany borrowings | — | |||||||||||||||||||||||||||||||
| Fair value hedge carrying value adjustment | — | — | — | — | — | — | — | |||||||||||||||||||||||||
Unamortized debt discount and premium, net(e) | ( | ( | ( | ( | ( | ( | ( | |||||||||||||||||||||||||
Unamortized debt issuance costs(f) | ( | ( | ( | ( | ( | ( | ( | ( | ||||||||||||||||||||||||
| Total debt | % | $ | $ | $ | $ | $ | $ | $ | $ | |||||||||||||||||||||||
| Short-term notes payable and commercial paper | ( | — | — | — | — | — | — | — | ||||||||||||||||||||||||
| Short-term money pool/intercompany borrowings | — | ( | ( | ( | ( | ( | ( | ( | ||||||||||||||||||||||||
Current maturities of long-term debt(g) | ( | ( | ( | ( | ( | — | ( | ( | ||||||||||||||||||||||||
Total long-term debt(g) | $ | $ | $ | $ | $ | $ | $ | $ | ||||||||||||||||||||||||
(a)Substantially all electric utility property is mortgaged under mortgage bond indentures.
(b)Duke Energy includes $63 million of finance lease purchase accounting adjustments related to Duke Energy Florida related to PPAs that are not accounted for as finance leases in their respective financial statements because of grandfathering provisions in GAAP.
(c)Substantially all tax-exempt bonds are secured by first mortgage bonds, letters of credit or the Master Credit Facility.
(d)Includes $625 million classified as Long-Term Debt on the Consolidated Balance Sheets due to the existence of long-term credit facilities that backstop these commercial paper balances, along with Duke Energy’s ability and intent to refinance these balances on a long-term basis. The weighted average days to maturity for Duke Energy's commercial paper program was 23 days.
(e)Duke Energy includes $992 million and $69 million in purchase accounting adjustments related to Progress Energy and Piedmont, respectively.
(f)Duke Energy includes $25 million in purchase accounting adjustments primarily related to the merger with Progress Energy.
(g)Refer to Note 18 for additional information on amounts from consolidated VIEs.
162
| FINANCIAL STATEMENTS | DEBT AND CREDIT FACILITIES | ||||
| December 31, 2022 | ||||||||||||||||||||||||||||||||
| Weighted | ||||||||||||||||||||||||||||||||
| Average | Duke | Duke | Duke | Duke | Duke | |||||||||||||||||||||||||||
| Interest | Duke | Energy | Progress | Energy | Energy | Energy | Energy | |||||||||||||||||||||||||
| (in millions) | Rate | Energy | Carolinas | Energy | Progress | Florida | Ohio | Indiana | Piedmont | |||||||||||||||||||||||
Unsecured debt, maturing 2023-2082 | % | $ | $ | $ | $ | — | $ | $ | $ | $ | ||||||||||||||||||||||
Secured debt, maturing 2023-2052 | % | — | — | — | ||||||||||||||||||||||||||||
First mortgage bonds, maturing 2023-2052(a) | % | — | ||||||||||||||||||||||||||||||
Finance leases, maturing 2024-2051(b) | — | — | ||||||||||||||||||||||||||||||
Tax-exempt bonds, maturing 2027-2046(c) | % | — | — | — | ||||||||||||||||||||||||||||
Notes payable and commercial paper(d) | % | — | — | — | — | — | — | — | ||||||||||||||||||||||||
| Money pool/intercompany borrowings | — | |||||||||||||||||||||||||||||||
| Fair value hedge carrying value adjustment | ( | — | — | — | — | — | — | — | ||||||||||||||||||||||||
Unamortized debt discount and premium, net(e) | ( | ( | ( | ( | ( | ( | ( | |||||||||||||||||||||||||
Unamortized debt issuance costs(f) | ( | ( | ( | ( | ( | ( | ( | ( | ||||||||||||||||||||||||
| Total debt | % | $ | $ | $ | $ | $ | $ | $ | $ | |||||||||||||||||||||||
| Short-term notes payable and commercial paper | ( | — | — | — | — | — | — | — | ||||||||||||||||||||||||
| Short-term money pool/intercompany borrowings | — | ( | ( | ( | ( | ( | ( | ( | ||||||||||||||||||||||||
Current maturities of long-term debt(g) | ( | ( | ( | ( | ( | ( | ( | ( | ||||||||||||||||||||||||
Total long-term debt(g) | $ | $ | $ | $ | $ | $ | $ | $ | ||||||||||||||||||||||||
(a) Substantially all electric utility property is mortgaged under mortgage bond indentures.
(b) Duke Energy includes $164 million of finance lease purchase accounting adjustments related to Duke Energy Florida related to PPAs that are not accounted for as finance leases in their respective financial statements because of grandfathering provisions in GAAP.
(c) Substantially all tax-exempt bonds are secured by first mortgage bonds, letters of credit or the Master Credit Facility.
(d) Includes $625 million that was classified as Long-Term Debt on the Consolidated Balance Sheets due to the existence of long-term credit facilities that backstop these commercial paper balances, along with Duke Energy’s ability and intent to refinance these balances on a long-term basis. The weighted average days to maturity for Duke Energy's commercial paper programs was 15 days.
(e) Duke Energy includes $1,057 million and $85 million in purchase accounting adjustments related to Progress Energy and Piedmont, respectively.
(f) Duke Energy includes $27 million in purchase accounting adjustments primarily related to the merger with Progress Energy.
(g) Refer to Note 18 for additional information on amounts from consolidated VIEs.
Current Maturities of Long-Term Debt
The following table shows the significant components of Current maturities of Long-Term Debt on the Consolidated Balance Sheets. The Duke Energy Registrants currently anticipate satisfying these obligations with cash on hand and proceeds from additional borrowings.
| (in millions) | Maturity Date | Interest Rate | December 31, 2023 | ||||||||||||||
| Unsecured Debt | |||||||||||||||||
Duke Energy (Parent) Term Loan Facility(a) | March 2024 | % | |||||||||||||||
Duke Energy (Parent) | April 2024 | % | |||||||||||||||
| First Mortgage Bonds | |||||||||||||||||
Duke Energy Florida(b) | October 2073 | % | |||||||||||||||
Other(c) | |||||||||||||||||
| Current maturities of long-term debt | $ | ||||||||||||||||
(a) Debt has a floating interest rate. In January 2024, Duke Energy (Parent) repaid the Term Loan Facility due March 2024.
(b) While final maturity is October 2073, these first mortgage bonds are classified as Current maturities of long-term debt on the Consolidated Balance Sheets beginning December 31, 2023, based on terms of the indenture, which could require repayment in less than 12 months if exercised by the bondholders.
(c) Includes finance lease obligations, amortizing debt, tax-exempt bonds with mandatory put options and small bullet maturities.
163
| FINANCIAL STATEMENTS | DEBT AND CREDIT FACILITIES | ||||
Maturities and Call Options
The following table shows the annual maturities of long-term debt for the next five years and thereafter. Amounts presented exclude short-term notes payable, commercial paper and money pool borrowings and debt issuance costs for the Subsidiary Registrants.
| December 31, 2023 | |||||||||||||||||||||||||||||||||||||||||||||||
| Duke | Duke | Duke | Duke | Duke | |||||||||||||||||||||||||||||||||||||||||||
| Duke | Energy | Progress | Energy | Energy | Energy | Energy | |||||||||||||||||||||||||||||||||||||||||
| (in millions) | Energy(a) | Carolinas | Energy | Progress | Florida | Ohio | Indiana | Piedmont | |||||||||||||||||||||||||||||||||||||||
| 2024 | $ | $ | $ | $ | $ | $ | — | $ | $ | ||||||||||||||||||||||||||||||||||||||
| 2025 | |||||||||||||||||||||||||||||||||||||||||||||||
| 2026 | |||||||||||||||||||||||||||||||||||||||||||||||
| 2027 | |||||||||||||||||||||||||||||||||||||||||||||||
| 2028 | — | ||||||||||||||||||||||||||||||||||||||||||||||
| Thereafter | |||||||||||||||||||||||||||||||||||||||||||||||
| Total long-term debt, including current maturities | $ | $ | $ | $ | $ | $ | $ | $ | |||||||||||||||||||||||||||||||||||||||
(a) Excludes $1,086 million in purchase accounting adjustments related to the Progress Energy merger and the Piedmont acquisition.
The Duke Energy Registrants have the ability under certain debt facilities to call and repay the obligation prior to its scheduled maturity. Therefore, the actual timing of future cash repayments could be materially different than as presented above.
Short-Term Obligations Classified as Long-Term Debt
Tax-exempt bonds that may be put to the Duke Energy Registrants at the option of the holder and certain commercial paper issuances and money pool borrowings are classified as Long-Term Debt on the Consolidated Balance Sheets. These tax-exempt bonds, commercial paper issuances and money pool borrowings, which are short-term obligations by nature, are classified as long-term due to Duke Energy’s intent and ability to utilize such borrowings as long-term financing. As Duke Energy’s Master Credit Facility and other bilateral letter of credit agreements have non-cancelable terms in excess of one year as of the balance sheet date, Duke Energy has the ability to refinance these short-term obligations on a long-term basis. The following tables show short-term obligations classified as long-term debt.
December 31, 2023 and 2022 | |||||||||||||||||||||||||||||
| Duke | Duke | Duke | Duke | ||||||||||||||||||||||||||
| Duke | Energy | Energy | Energy | Energy | |||||||||||||||||||||||||
| (in millions) | Energy | Carolinas | Progress | Ohio | Indiana | ||||||||||||||||||||||||
| Tax-exempt bonds | $ | $ | $ | $ | $ | ||||||||||||||||||||||||
Commercial paper(a) | |||||||||||||||||||||||||||||
| Total | $ | $ | $ | $ | $ | ||||||||||||||||||||||||
(a) Progress Energy amounts are equal to Duke Energy Progress amounts.
Summary of Significant Debt Issuances
In January 2024, Duke Energy Corporation issued $1.25 billion of senior unsecured notes. The issuance was split between a $600 million, -year tranche and a $650 million, -year tranche, both at a fixed rate of 4.85 %. The net proceeds were used to repay Duke Energy (Parent)'s $1 billion Term Loan Facility due March 2024, pay off short-term debt and for general corporate purposes.
In January 2024, Duke Energy Carolinas issued $1 billion of first mortgage bonds. The issuance consisted of a $575 million, 10 -year tranche at 4.85 % and a $425 million, 30 -year tranche at 5.40 %. The net proceeds were used to pay off short-term debt and for general company purposes.
164
| FINANCIAL STATEMENTS | DEBT AND CREDIT FACILITIES | ||||
The following tables summarize significant debt issuances (in millions).
| Year Ended December 31, 2023 | |||||||||||||||||||||||||||||||||||||||||||||||||||||||||||
| Duke | Duke | Duke | Duke | Duke | Duke | ||||||||||||||||||||||||||||||||||||||||||||||||||||||
| Maturity | Interest | Duke | Energy | Energy | Energy | Energy | Energy | Energy | |||||||||||||||||||||||||||||||||||||||||||||||||||
| Issuance Date | Date | Rate | Energy | (Parent) | Carolinas | Progress | Florida | Ohio | Indiana | Piedmont | |||||||||||||||||||||||||||||||||||||||||||||||||
| Unsecured Debt | |||||||||||||||||||||||||||||||||||||||||||||||||||||||||||
April 2023(a) | April 2026 | % | $ | $ | $ | — | $ | — | $ | — | $ | — | $ | — | $ | ||||||||||||||||||||||||||||||||||||||||||||
June 2023(b) | June 2033 | % | — | — | — | — | — | ||||||||||||||||||||||||||||||||||||||||||||||||||||
September 2023(c) | September 2033 | % | — | — | — | — | — | — | |||||||||||||||||||||||||||||||||||||||||||||||||||
September 2023(c) | September 2053 | % | — | — | — | — | — | — | |||||||||||||||||||||||||||||||||||||||||||||||||||
| First Mortgage Bonds | |||||||||||||||||||||||||||||||||||||||||||||||||||||||||||
January 2023(d) | January 2033 | % | — | — | — | — | |||||||||||||||||||||||||||||||||||||||||||||||||||||
January 2023(d) | January 2053 | % | — | — | — | — | |||||||||||||||||||||||||||||||||||||||||||||||||||||
March 2023(e) | March 2033 | % | — | — | — | — | |||||||||||||||||||||||||||||||||||||||||||||||||||||
March 2023(e) | March 2053 | % | — | — | — | — | |||||||||||||||||||||||||||||||||||||||||||||||||||||
March 2023(f) | April 2033 | % | — | — | — | ||||||||||||||||||||||||||||||||||||||||||||||||||||||
March 2023(f) | April 2053 | % | — | — | — | ||||||||||||||||||||||||||||||||||||||||||||||||||||||
March 2023(g) | April 2053 | % | — | — | — | — | |||||||||||||||||||||||||||||||||||||||||||||||||||||
June 2023(h) | January 2033 | % | — | — | — | — | |||||||||||||||||||||||||||||||||||||||||||||||||||||
June 2023(h) | January 2054 | % | — | — | — | — | |||||||||||||||||||||||||||||||||||||||||||||||||||||
September 2023(h) | October 2073 | % | — | — | — | ||||||||||||||||||||||||||||||||||||||||||||||||||||||
November 2023(i) | November 2033 | % | — | — | — | ||||||||||||||||||||||||||||||||||||||||||||||||||||||
November 2023(i) | November 2053 | % | — | — | — | ||||||||||||||||||||||||||||||||||||||||||||||||||||||
| Total issuances | $ | $ | $ | $ | $ | $ | $ | $ | |||||||||||||||||||||||||||||||||||||||||||||||||||
(a)See "Duke Energy (Parent) Convertible Senior Notes" below for additional information.
(b)Debt issued to repay $45 million of maturities due October 2023, to pay down a portion of short-term debt and for general corporate purposes.
(c)Debt issued to repay $400 million of maturities due October 2023, to pay down a portion of short-term debt and for general corporate purposes.
(d)Debt issued to repay $1 billion of maturities due March 2023, to pay down a portion of short-term debt and for general company purposes.
(e)Debt issued to repay $300 million of maturities due September 2023, to pay down a portion of short-term debt and for general company purposes.
(f)Debt issued to repay $300 million of maturities due September 2023, to pay down a portion of the $100 million Duke Energy Ohio Term Loan due October 2023, to repay a portion of short-term debt and for general corporate purposes.
(g)Debt issued to repay the $300 million Duke Energy Indiana Term Loan due October 2023, to pay down a portion of short-term debt and for general company purposes.
(h)Debt issued to pay down a portion of short-term debt and for general company purposes.
(i)Debt issued to repay the $800 million Duke Energy Florida Term Loan due April 2024, to pay down a portion of short-term debt and for general company purposes.
165
| FINANCIAL STATEMENTS | DEBT AND CREDIT FACILITIES | ||||
| Year Ended December 31, 2022 | |||||||||||||||||||||||||||||||||||||||||||||||
| Duke | Duke | Duke | Duke | ||||||||||||||||||||||||||||||||||||||||||||
| Maturity | Interest | Duke | Energy | Energy | Energy | Energy | |||||||||||||||||||||||||||||||||||||||||
| Issuance Date | Date | Rate | Energy | (Parent) | Carolinas | Progress | Florida | Piedmont | |||||||||||||||||||||||||||||||||||||||
| Unsecured Debt | |||||||||||||||||||||||||||||||||||||||||||||||
May 2022(a) | May 2052 | % | $ | $ | — | $ | — | $ | — | $ | — | $ | |||||||||||||||||||||||||||||||||||
June 2022(b) | June 2028 | % | — | — | — | — | |||||||||||||||||||||||||||||||||||||||||
June 2022(b) | June 2034 | % | — | — | — | — | |||||||||||||||||||||||||||||||||||||||||
August 2022(c) | March 2028 | % | — | — | — | — | |||||||||||||||||||||||||||||||||||||||||
August 2022(c) | August 2032 | % | — | — | — | — | |||||||||||||||||||||||||||||||||||||||||
August 2022(c) | August 2052 | % | — | — | — | ||||||||||||||||||||||||||||||||||||||||||
December 2022(c) | December 2025 | % | — | — | — | — | |||||||||||||||||||||||||||||||||||||||||
December 2022(c) | December 2027 | % | — | — | — | — | |||||||||||||||||||||||||||||||||||||||||
| First Mortgage Bonds | |||||||||||||||||||||||||||||||||||||||||||||||
March 2022(d) | March 2032 | % | — | — | — | — | |||||||||||||||||||||||||||||||||||||||||
March 2022(d) | March 2052 | % | — | — | — | — | |||||||||||||||||||||||||||||||||||||||||
March 2022(d) | April 2032 | % | — | — | — | — | |||||||||||||||||||||||||||||||||||||||||
March 2022(d) | April 2052 | % | — | — | — | — | |||||||||||||||||||||||||||||||||||||||||
November 2022(e) | November 2052 | % | — | — | — | — | |||||||||||||||||||||||||||||||||||||||||
| Tax-exempt Bonds | — | — | — | — | — | ||||||||||||||||||||||||||||||||||||||||||
June 2022(f) | September 2030 | % | — | — | — | — | |||||||||||||||||||||||||||||||||||||||||
June 2022(f) | November 2039 | % | — | — | — | — | |||||||||||||||||||||||||||||||||||||||||
September 2022(g) | October 2046 | % | — | — | — | ||||||||||||||||||||||||||||||||||||||||||
September 2022(h) | October 2046 | % | — | — | — | ||||||||||||||||||||||||||||||||||||||||||
September 2022(h) | October 2046 | % | — | — | — | ||||||||||||||||||||||||||||||||||||||||||
| Total issuances | $ | $ | $ | $ | $ | $ | |||||||||||||||||||||||||||||||||||||||||
(a)Debt issued to repay a portion of short-term debt and for general corporate purposes.
(b)Duke Energy (Parent) issued 600 million euros aggregate principal amount of 3.10 % senior notes due June 2028 and 500 million euros aggregate principal amount of 3.85 % senior notes due June 2034. Debt issued to repay a $500 million debt maturity, pay down a portion of short-term debt and for general corporate purposes. Duke Energy's obligations under its euro-denominated fixed-rate notes were effectively converted to fixed-rate U.S. dollars at issuance through cross-currency swaps, mitigating foreign currency exchange risk associated with the interest and principal payments. See Note 15 for additional information.
(c)Debt issued to repay a portion of short-term debt and for general corporate purposes.
(d)Debt issued to finance or refinance, in whole or in part, existing or new eligible projects under the sustainable financing framework.
(e)Debt issued to repay a portion of short-term debt and for general company purposes.
(f)Debt issued to refund the Ohio Air Quality Development Revenue Refunding bonds, previously held in treasury, which were used to finance or refinance portions of certain solid waste disposal facilities. The mandatory purchase date of these bonds is June 1, 2027.
(g)Debt issued to provide funds to refund the prior bonds, which were used to finance or refinance portions of certain air and water pollution control equipment and solid waste disposal equipment. The mandatory purchase date of these bonds is October 1, 2026.
(h)Debt issued to provide funds to refund the prior bonds, which were used to finance or refinance portions of certain air and water pollution control equipment and solid waste disposal equipment. The mandatory purchase date of these bonds is October 1, 2030.
Duke Energy (Parent) Convertible Senior Notes
In April 2023, Duke Energy (Parent) completed the sale of $1.7 billion 4.125 % Convertible Senior Notes due April 2026 (convertible notes). The convertible notes are senior unsecured obligations of Duke Energy, and will mature on April 15, 2026, unless earlier converted or repurchased in accordance with their terms. The convertible notes bear interest at a fixed rate of 4.125 % per year, payable semiannually in arrears on April 15 and October 15 of each year, beginning on October 15, 2023. Proceeds were used to repay a portion of outstanding commercial paper and for general corporate purposes.
Prior to the close of business on the business day immediately preceding January 15, 2026, the convertible notes will be convertible at the option of the holders when the following conditions are met:
•during any calendar quarter commencing after the calendar quarter ending on June 30, 2023, (and only during such calendar quarter) if the last reported sale price of Duke Energy common stock for at least 20 trading days (whether or not consecutive) during a period of 30 consecutive trading days ending on, and including, the last trading day of the immediately preceding calendar quarter is greater than or equal to 130 % of the conversion price on each applicable trading day;
•during the five consecutive business day period after any 10 consecutive trading day period (the measurement period) in which the trading price, as defined, per $1,000 principal amount of notes for each trading day of the measurement period was less than 98 % of the product of the last reported sale price of Duke Energy common stock and the conversion rate on each such trading day; or
•upon the occurrence of specified corporate events described in the indenture agreement.
166
| FINANCIAL STATEMENTS | DEBT AND CREDIT FACILITIES | ||||
On or after January 15, 2026, until the close of business on the second scheduled trading day immediately preceding the maturity date, holders of the convertible notes may convert all or any portion of their convertible notes at their option at any time at the conversion rate then in effect, irrespective of these conditions. Duke Energy will settle conversions of the convertible notes by paying cash up to the aggregate principal amount of the convertible notes to be converted and paying or delivering, as the case may be, cash, shares of Duke Energy's common stock, $0.001 par value per share, or a combination of cash and shares of its common stock, at its election, in respect of the remainder, if any, of its conversion obligation in excess of the aggregate principal amount of the convertible notes being converted.
The conversion rate for the convertible notes is initially 8.4131 shares of Duke Energy's common stock per $1,000 principal amount of convertible notes. The initial conversion price of the convertible notes represents a premium of approximately 25 % over the last reported sale price of Duke Energy’s common stock on the NYSE on April 3, 2023. The conversion rate and the corresponding conversion price will not be adjusted for any accrued and unpaid interest but will be subject to adjustment in some instances, such as stock splits or share combinations, certain distributions to common stockholders, or tender offers at off-market rates. The changes in the conversion rates are intended to make convertible note holders whole for changes in the fair value of Duke Energy common stock resulting from such events. Duke Energy may not redeem the convertible notes prior to the maturity date.
Duke Energy issued the convertible notes pursuant to an indenture, dated as of April 6, 2023, by and between Duke Energy and The Bank of New York Mellon Trust Company, N.A., as trustee. The terms of the convertible notes include customary fundamental change provisions that require repayment of the notes with interest upon certain events, such as a stockholder approved plan of liquidation or if Duke Energy's common stock ceases to be listed on the NYSE.
AVAILABLE CREDIT FACILITIES
Master Credit Facility
In March 2023, Duke Energy amended its existing Master Credit Facility of $9 billion to extend the termination date to March 2028. The Duke Energy Registrants, excluding Progress Energy, have borrowing capacity under the Master Credit Facility up to a specified sublimit for each borrower. Duke Energy has the unilateral ability at any time to increase or decrease the borrowing sublimits of each borrower, subject to a maximum sublimit for each borrower. The amount available under the Master Credit Facility has been reduced to backstop issuances of commercial paper, certain letters of credit and variable-rate demand tax-exempt bonds that may be put to the Duke Energy Registrants at the option of the holder. An amendment in conjunction with the issuance of the Convertible Senior Notes due April 2026 clarifies that payments due as a result of a conversion of a convertible note would not constitute an event of default.
The table below includes the current borrowing sublimits and available capacity under these credit facilities.
| December 31, 2023 | |||||||||||||||||||||||||||||||||||||||||||||||
| Duke | Duke | Duke | Duke | Duke | Duke | ||||||||||||||||||||||||||||||||||||||||||
| Duke | Energy | Energy | Energy | Energy | Energy | Energy | |||||||||||||||||||||||||||||||||||||||||
| (in millions) | Energy | (Parent) | Carolinas | Progress | Florida | Ohio | Indiana | Piedmont | |||||||||||||||||||||||||||||||||||||||
Facility size(a) | $ | $ | $ | $ | $ | $ | $ | $ | |||||||||||||||||||||||||||||||||||||||
| Reduction to backstop issuances | |||||||||||||||||||||||||||||||||||||||||||||||
Commercial paper(b) | ( | ( | ( | ( | ( | ( | ( | ( | |||||||||||||||||||||||||||||||||||||||
| Outstanding letters of credit | ( | ( | ( | ( | ( | — | — | — | |||||||||||||||||||||||||||||||||||||||
| Tax-exempt bonds | ( | — | — | — | — | — | ( | — | |||||||||||||||||||||||||||||||||||||||
| Available capacity | $ | $ | $ | $ | $ | $ | $ | $ | |||||||||||||||||||||||||||||||||||||||
(a) Represents the sublimit of each borrower.
(b) Duke Energy issued $625 million of commercial paper and loaned the proceeds through the money pool to Duke Energy Carolinas, Duke Energy Progress, Duke Energy Ohio and Duke Energy Indiana. The balances are classified as Long-Term Debt Payable to Affiliated Companies in the Consolidated Balance Sheets.
Duke Energy (Parent) Term Loan Facility
In March 2022, Duke Energy (Parent) entered into a Term Loan Credit Facility (facility) with commitments totaling $1.4 billion maturing March 2024. Borrowings under the facility were used to repay amounts drawn under the Three-Year Revolving Credit Facility and for general corporate purposes, including repayment of a portion of Duke Energy's outstanding commercial paper. The Three-Year Revolving Credit Facility was terminated in March 2022. In December 2022, Duke Energy (Parent) repaid $400 million of the facility. In January 2024, Duke Energy (Parent) repaid the remaining $1 billion outstanding on the facility, which was classified as Current maturities of long-term debt on Duke Energy's Consolidated Balance Sheets as of December 31, 2023.
Other Debt Matters
In September 2022, Duke Energy filed a Form S-3 with the SEC. Under this Form S-3, which is uncapped, the Duke Energy Registrants, excluding Progress Energy, may issue debt and other securities, including preferred stock, in the future at amounts, prices and with terms to be determined at the time of future offerings. The registration statement was filed to replace a similar prior filing upon expiration of its three-year term and also allows for the issuance of common and preferred stock by Duke Energy.
167
| FINANCIAL STATEMENTS | DEBT AND CREDIT FACILITIES | ||||
Also in September 2022, to replace another similar prior filing, Duke Energy filed an effective Form S-3 with the SEC to sell up to $4 billion of variable denomination floating-rate demand notes, called PremierNotes. The Form S-3 states that no more than $2 billion of the notes will be outstanding at any particular time. The notes are offered on a continuous basis and bear interest at a floating rate per annum determined by the Duke Energy PremierNotes Committee, or its designee, on a weekly basis. The interest rate payable on notes held by an investor may vary based on the principal amount of the investment. The notes have no stated maturity date, are non-transferable and may be redeemed in whole or in part by Duke Energy or at the investor’s option at any time. The balance as of December 31, 2023, and 2022, was $985 million and $897 million, respectively. The notes are short-term debt obligations of Duke Energy and are reflected as Notes payable and commercial paper on Duke Energy’s Consolidated Balance Sheets.
Money Pool and Intercompany Credit Agreements
The Subsidiary Registrants, excluding Progress Energy, are eligible to receive support for their short-term borrowing needs through participation with Duke Energy and certain of its subsidiaries in a money pool arrangement. Under this arrangement, those companies with short-term funds may provide short-term loans to affiliates participating in this arrangement. The money pool is structured such that the Subsidiary Registrants, excluding Progress Energy, separately manage their cash needs and working capital requirements. Accordingly, there is no net settlement of receivables and payables between money pool participants. Duke Energy (Parent) may loan funds to its participating subsidiaries, but may not borrow funds through the money pool. Accordingly, as the money pool activity is between Duke Energy and its subsidiaries, all money pool balances are eliminated within Duke Energy’s Consolidated Balance Sheets.
Money pool receivable balances are reflected within Notes receivable from affiliated companies on the Subsidiary Registrants’ Consolidated Balance Sheets. Money pool payable balances are reflected within either Notes payable to affiliated companies or Long-Term Debt Payable to Affiliated Companies on the Subsidiary Registrants’ Consolidated Balance Sheets.
In March 2022, Progress Energy closed a revolving credit agreement with Duke Energy (Parent), which allowed up to $2.5 billion in intercompany borrowings.
Restrictive Debt Covenants
The Duke Energy Registrants’ debt and credit agreements contain various financial and other covenants. Duke Energy's Master Credit Facility contains a covenant requiring the debt-to-total capitalization ratio not to exceed 65 70 % for Piedmont. Failure to meet those covenants beyond applicable grace periods could result in accelerated due dates and/or termination of the agreements. As of December 31, 2023, each of the Duke Energy Registrants were in compliance with all covenants related to their debt agreements. In addition, some credit agreements may allow for acceleration of payments or termination of the agreements due to nonpayment, or acceleration of other significant indebtedness of the borrower or some of its subsidiaries. None of the debt or credit agreements contain material adverse change clauses.
Other Loans
As of December 31, 2023, and 2022, Duke Energy had loans outstanding of $873 million, including $32 million at Duke Energy Progress and $852 million, including $33 million at Duke Energy Progress, respectively, against the cash surrender value of life insurance policies it owns on the lives of its executives. The amounts outstanding were carried as a reduction of the related cash surrender value that is included in Other within Other Noncurrent Assets on the Consolidated Balance Sheets.
8. GUARANTEES AND INDEMNIFICATIONS
Duke Energy has various financial and performance guarantees and indemnifications with non-consolidated entities, which are issued in the normal course of business. As discussed below, these contracts include performance guarantees, standby letters of credit, debt guarantees and indemnifications and include guarantees and indemnifications related to Commercial Renewables Disposal Groups as described in Note 2. Duke Energy enters into these arrangements to facilitate commercial transactions with third parties by enhancing the value of the transaction to the third party. At December 31, 2023, Duke Energy does not believe conditions are likely for significant performance under these guarantees. To the extent liabilities are incurred as a result of the activities covered by the guarantees, such liabilities are included on the accompanying Consolidated Balance Sheets.
On January 2, 2007, Duke Energy completed the spin-off of its previously wholly owned natural gas businesses to shareholders. Guarantees issued by Duke Energy or its affiliates, or assigned to Duke Energy prior to the spin-off, remained with Duke Energy subsequent to the spin-off. Guarantees issued by Spectra Energy Capital, LLC (Spectra Capital) or its affiliates prior to the spin-off remained with Spectra Capital subsequent to the spin-off, except for guarantees that were later assigned to Duke Energy. Duke Energy has indemnified Spectra Capital against any losses incurred under certain of the guarantee obligations that remain with Spectra Capital. At December 31, 2023, the maximum potential amount of future payments associated with these guarantees were $33 million, the majority of which expire by 2028.
In October 2017, ACP executed a $3.4 billion revolving credit facility with a stated maturity date of October 2021. Duke Energy entered into a guarantee agreement to support its share of the ACP revolving credit facility. In July 2020, ACP reduced the size of the credit facility to $1.9 billion. Duke Energy's maximum exposure to loss under the terms of the guarantee was $860 million as of December 31, 2020. This amount represented 47 % of the outstanding borrowings under the credit facility and was recognized within Other Current Liabilities on the Consolidated Balance Sheets at December 31, 2020, of which $95 million was previously recognized due the adoption of new guidance for credit losses effective January 1, 2020. In February 2021, Duke Energy paid approximately $855 million to fund ACP's outstanding debt, relieving Duke Energy of its guarantee.
In addition to the Spectra Capital and ACP revolving credit facility guarantees above, Duke Energy has issued performance guarantees to customers and other third parties that guarantee the payment and performance of other parties, including certain non-wholly owned entities, as well as guarantees of debt of certain non-consolidated entities. If such entities were to default on payments or performance, Duke Energy would be required under the guarantees to make payments on the obligations of these entities. The maximum potential amount of future payments required under these guarantees as of December 31, 2023, was $26 million of which all expire between 2024 and 2030, with the remaining performance guarantees having no contractual expiration. Additionally, certain guarantees have uncapped maximum potential payments; however, Duke Energy does not believe these guarantees will have a material effect on its results of operations, cash flows or financial position.
168
| FINANCIAL STATEMENTS | GUARANTEES AND INDEMNIFICATIONS | ||||
Duke Energy uses bank-issued standby letters of credit to secure the performance of wholly owned and non-wholly owned entities to a third party or customer. Under these arrangements, Duke Energy has payment obligations to the issuing bank that are triggered by a draw by the third party or customer due to the failure of the wholly owned or non-wholly owned entity to perform according to the terms of its underlying contract. At December 31, 2023, Duke Energy had issued a total of $411 million in letters of credit, which expire between 2024 and 2026. There are no unused amounts under these letters of credit.
9. JOINT OWNERSHIP OF GENERATING AND TRANSMISSION FACILITIES
The Duke Energy Registrants maintain ownership interests in certain jointly owned generating and transmission facilities and are entitled to a share of the generating capacity and output of each unit equal to their respective ownership interests. The Duke Energy Registrants pay their ownership share of additional construction costs, fuel inventory purchases and operating expenses. The Duke Energy Registrants share of revenues and operating costs of the jointly owned facilities is included within the corresponding line in the Consolidated Statements of Operations. Each participant in the jointly owned facilities must provide its own financing.
The following table presents the Duke Energy Registrants' interest of jointly owned plant or facilities and amounts included on the Consolidated Balance Sheets. All facilities are operated by the Duke Energy Registrants and are included in the EU&I segment.
| December 31, 2023 | |||||||||||||||||||||||
| Construction | |||||||||||||||||||||||
| Ownership | Property, Plant | Accumulated | Work in | ||||||||||||||||||||
| (in millions except for ownership interest) | Interest | and Equipment | Depreciation | Progress | |||||||||||||||||||
| Duke Energy Carolinas | |||||||||||||||||||||||
Catawba (units 1 and 2)(a) | % | $ | $ | $ | |||||||||||||||||||
W.S. Lee CC(b) | % | ||||||||||||||||||||||
| Duke Energy Indiana | |||||||||||||||||||||||
Gibson (unit 5)(c) | % | ||||||||||||||||||||||
Vermillion(d) | % | — | |||||||||||||||||||||
Transmission and local facilities(c) | Various | ||||||||||||||||||||||
(a) Jointly owned with North Carolina Municipal Power Agency Number 1, NCEMC and PMPA.
(b) Jointly owned with NCEMC.
(c) Jointly owned with WVPA and IMPA.
(d) Jointly owned with WVPA.
10. ASSET RETIREMENT OBLIGATIONS
Duke Energy records an ARO when it has a legal obligation to incur retirement costs associated with the retirement of a long-lived asset and the obligation can be reasonably estimated. Certain assets of the Duke Energy Registrants have an indeterminate life, such as transmission and distribution facilities, and thus the fair value of the retirement obligation is not reasonably estimable. A liability for these AROs will be recorded when a fair value is determinable.
The Duke Energy Registrants’ regulated operations accrue costs of removal for property that does not have an associated legal retirement obligation based on regulatory orders from state commissions. These costs of removal are recorded as a regulatory liability in accordance with regulatory accounting treatment. The amount spent may be higher than the amount accrued and result in a net asset. See Note 4 for the estimated cost of removal for assets without an associated legal retirement obligation, which are included in Regulatory liabilities on the Consolidated Balance Sheets.
The following table presents the AROs recorded on the Consolidated Balance Sheets.
| December 31, 2023 | |||||||||||||||||||||||||||||||||||||||||||||||
| Duke | Duke | Duke | Duke | Duke | |||||||||||||||||||||||||||||||||||||||||||
| Duke | Energy | Progress | Energy | Energy | Energy | Energy | |||||||||||||||||||||||||||||||||||||||||
| (in millions) | Energy | Carolinas | Energy | Progress | Florida | Ohio | Indiana | Piedmont | |||||||||||||||||||||||||||||||||||||||
Decommissioning of nuclear power facilities | $ | $ | $ | $ | $ | $ | — | $ | — | $ | — | ||||||||||||||||||||||||||||||||||||
| Closure of ash impoundments | — | ||||||||||||||||||||||||||||||||||||||||||||||
| Other | |||||||||||||||||||||||||||||||||||||||||||||||
| Total asset retirement obligation | $ | $ | $ | $ | $ | $ | $ | $ | |||||||||||||||||||||||||||||||||||||||
| Less: Current portion | — | ||||||||||||||||||||||||||||||||||||||||||||||
| Total noncurrent asset retirement obligation | $ | $ | $ | $ | $ | $ | $ | $ | |||||||||||||||||||||||||||||||||||||||
169
| FINANCIAL STATEMENTS | ASSET RETIREMENT OBLIGATIONS | ||||
Nuclear Decommissioning Liability
AROs related to nuclear decommissioning are based on site-specific cost studies. The NCUC and the PSCSC require Duke Energy Carolinas and Duke Energy Progress update cost estimates for decommissioning their nuclear plants every five years. The nuclear decommissioning liabilities are assessed and updated based on changes in cash flows provided in new studies as well as annual assessments to evaluate whether any indicators suggest a change in the estimate of the ARO is necessary.
The following table summarizes information about the most recent site-specific nuclear decommissioning cost studies. Decommissioning costs are stated in 2023 or 2019 dollars, depending on the year of the cost study, and include costs to decommission plant components not subject to radioactive contamination.
| Annual Funding | Decommissioning | ||||||||||||||||
| (in millions) | Requirement(a) | Costs(a) | Year of Cost Study | ||||||||||||||
| Duke Energy | $ | $ | 2023 or 2019 | ||||||||||||||
Duke Energy Carolinas(b)(c) | — | 2023 | |||||||||||||||
Duke Energy Progress(d) | 2019 | ||||||||||||||||
Duke Energy Florida(e) | — | N/A | |||||||||||||||
(a) Amount represents annual funding requirement for the current fiscal year. Amounts for Progress Energy equal the sum of Duke Energy Progress and Duke Energy Florida.
(b) Decommissioning costs for Duke Energy Carolinas reflects its ownership interest in jointly owned reactors. Other joint owners are responsible for decommissioning costs related to their interest in the reactors.
(c) Duke Energy Carolinas' site-specific nuclear decommissioning cost study completed in 2023 was filed with the NCUC and PSCSC in 2024. A funding study was last completed and filed in 2019. An updated funding study will be completed and filed with the NCUC and PSCSC in 2024.
(d) Duke Energy Progress' site-specific nuclear decommissioning cost study completed in 2019 was filed with the NCUC and PSCSC in March 2020. Duke Energy Progress also completed a funding study, which was filed with the NCUC and PSCSC in July 2020. In October 2021, Duke Energy Progress filed the 2019 nuclear decommissioning cost study with the FERC, as well as a revised rate schedule for decommissioning expense to be collected from wholesale customers. The FERC accepted the filing, as filed on December 9, 2021.
(e) During 2019, Duke Energy Florida reached an agreement to transfer decommissioning work for Crystal River Unit 3 to a third party and decommissioning costs are based on the agreement with this third party rather than a cost study. Regulatory approval was received from the NRC and the FPSC in April 2020 and August 2020, respectively. Duke Energy Florida provides the FPSC periodic reports on the status and progress of decommissioning activities.
Nuclear Decommissioning Trust Funds
Duke Energy Carolinas, Duke Energy Progress and Duke Energy Florida each maintain NDTFs that are intended to pay for the decommissioning costs of their respective nuclear power plants. The NDTF investments are managed and invested in accordance with applicable requirements of various regulatory bodies including the NRC, FERC, NCUC, PSCSC, FPSC and the IRS.
Use of the NDTF investments is restricted to nuclear decommissioning activities including license termination, spent fuel and site restoration. The license termination and spent fuel obligations relate to contaminated decommissioning and are recorded as AROs. The site restoration obligation relates to non-contaminated decommissioning and is recorded to cost of removal within Regulatory liabilities on the Consolidated Balance Sheets.
The following table presents the fair value of NDTF assets legally restricted for purposes of settling AROs associated with nuclear decommissioning. Duke Energy Florida entered into an agreement with a third party to decommission Crystal River Unit 3 and was granted an exemption from the NRC, which allows for use of the NDTF for all aspects of nuclear decommissioning. The entire balance of Duke Energy Florida's NDTF may be applied toward license termination, spent fuel and site restoration costs incurred to decommission Crystal River Unit 3 and is excluded from the table below. See Note 17 for additional information related to the fair value of the Duke Energy Registrants' NDTFs.
| December 31, | |||||||||||
| (in millions) | 2023 | 2022 | |||||||||
| Duke Energy | $ | $ | |||||||||
| Duke Energy Carolinas | |||||||||||
| Duke Energy Progress | |||||||||||
170
| FINANCIAL STATEMENTS | ASSET RETIREMENT OBLIGATIONS | ||||
Nuclear Operating Licenses
As described in Note 4, Duke Energy Carolinas and Duke Energy Progress intend to seek renewal of operating licenses and 20 -year license extensions for all of their nuclear stations. The following table includes the current expiration of nuclear operating licenses.
| Unit | Year of Expiration | ||||
| Duke Energy Carolinas | |||||
| Catawba Units 1 and 2 | 2043 | ||||
| McGuire Unit 1 | 2041 | ||||
| McGuire Unit 2 | 2043 | ||||
| Oconee Units 1 and 2 | 2033 | ||||
| Oconee Unit 3 | 2034 | ||||
| Duke Energy Progress | |||||
| Brunswick Unit 1 | 2036 | ||||
| Brunswick Unit 2 | 2034 | ||||
| Harris | 2046 | ||||
| Robinson | 2030 | ||||
The NRC has acknowledged permanent cessation of operation and permanent removal of fuel from the reactor vessel at Crystal River Unit 3. Therefore, the license no longer authorizes operation of the reactor. During 2019, Duke Energy Florida entered into an agreement for the accelerated decommissioning of Crystal River Unit 3. Regulatory approval was received from the NRC and the FPSC in April 2020 and August 2020, respectively. See Note 4 for more information.
Closure of Ash Impoundments
The Duke Energy Registrants are subject to state and federal regulations covering the closure of coal ash impoundments, including the EPA CCR Rule and the Coal Ash Act, and other agreements. AROs recorded on the Duke Energy Registrants' Consolidated Balance Sheets include the legal obligation for closure of coal ash basins and the disposal of related ash as a result of these regulations and agreements.
The ARO amount recorded on the Consolidated Balance Sheets is based upon estimated closure costs for impacted ash impoundments. The amount recorded represents the discounted cash flows for estimated closure costs based upon specific closure plans. Actual costs to be incurred will be dependent upon factors that vary from site to site. The most significant factors are the method and time frame of closure at the individual sites. Closure methods considered include removing the water from ash basins, consolidating material as necessary and capping the ash with a synthetic barrier, excavating and relocating the ash to a lined structural fill or lined landfill or recycling the ash for concrete or some other beneficial use. The ultimate method and timetable for closure will be in compliance with standards set by federal and state regulations and other agreements. The ARO amount will be adjusted as additional information is gained through the closure and post-closure process, including acceptance and approval of compliance approaches, which may change management assumptions, and may result in a material change to the balance. See ARO Liability Rollforward section below for information on revisions made to the coal ash liability during 2023 and 2022.
Asset retirement costs associated with the AROs for operating plants and retired plants are included in Net property, plant and equipment and Regulatory assets, respectively, on the Consolidated Balance Sheets. See Note 4 for additional information on Regulatory assets related to AROs and Note 5 for additional information on commitments and contingencies.
Cost recovery for future expenditures will be pursued through the normal ratemaking process with federal and state utility commissions, which permit recovery of necessary and prudently incurred costs associated with Duke Energy’s regulated operations. See Note 4 for additional information on recovery of coal ash costs.
ARO Liability Rollforward
The following tables present changes in the liability associated with AROs.
| Duke | Duke | Duke | Duke | Duke | |||||||||||||||||||||||||||||||||||||||||||
| Duke | Energy | Progress | Energy | Energy | Energy | Energy | |||||||||||||||||||||||||||||||||||||||||
| (in millions) | Energy | Carolinas | Energy | Progress | Florida | Ohio | Indiana | Piedmont | |||||||||||||||||||||||||||||||||||||||
| Balance at December 31, 2021 | $ | $ | $ | $ | $ | $ | $ | $ | |||||||||||||||||||||||||||||||||||||||
Accretion expense(a) | |||||||||||||||||||||||||||||||||||||||||||||||
Liabilities settled(b) | ( | ( | ( | ( | ( | ( | ( | — | |||||||||||||||||||||||||||||||||||||||
| Liabilities incurred in the current year | — | — | — | — | |||||||||||||||||||||||||||||||||||||||||||
Revisions in estimates of cash flows(c) | ( | ||||||||||||||||||||||||||||||||||||||||||||||
| Balance at December 31, 2022 | |||||||||||||||||||||||||||||||||||||||||||||||
Accretion expense(a) | |||||||||||||||||||||||||||||||||||||||||||||||
Liabilities settled(b) | ( | ( | ( | ( | ( | ( | ( | — | |||||||||||||||||||||||||||||||||||||||
| Liabilities incurred in the current year | — | ||||||||||||||||||||||||||||||||||||||||||||||
Revisions in estimates of cash flows(c) | ( | ( | ( | ( | ( | ( | ( | ( | |||||||||||||||||||||||||||||||||||||||
| Balance at December 31, 2023 | $ | $ | $ | $ | $ | $ | $ | $ | |||||||||||||||||||||||||||||||||||||||
171
| FINANCIAL STATEMENTS | ASSET RETIREMENT OBLIGATIONS | ||||
(a) Substantially all accretion expense for the years ended December 31, 2023, and 2022, relates to Duke Energy’s regulated operations and has been deferred in accordance with regulatory accounting treatment.
(b) Amounts primarily relate to ash impoundment closures and nuclear decommissioning.
(c) The amounts recorded represent the discounted cash flows for estimated closure costs as evaluated on a site-by-site basis. The increases in 2022 primarily relate to higher unit costs associated with basin closure and routine maintenance. The decreases in 2023 primarily relate to lower discounted cash flows for decommissioning the nuclear power facilities due to changes in estimates and economic assumptions including discount rates, cost escalation rates and cash flow timing, as well as lower unit costs associated with basin closure, routine maintenance and beneficiation activities, as well as reduction in monitoring wells needed.
11. PROPERTY, PLANT AND EQUIPMENT
The following tables summarize the property, plant and equipment for Duke Energy and its subsidiary registrants.
| December 31, 2023 | |||||||||||||||||||||||||||||||||||||||||||||||||||||
| Average | |||||||||||||||||||||||||||||||||||||||||||||||||||||
| Remaining | Duke | Duke | Duke | Duke | Duke | ||||||||||||||||||||||||||||||||||||||||||||||||
| Useful Life | Duke | Energy | Progress | Energy | Energy | Energy | Energy | ||||||||||||||||||||||||||||||||||||||||||||||
| (in millions) | (Years) | Energy | Carolinas | Energy | Progress | Florida | Ohio | Indiana | Piedmont | ||||||||||||||||||||||||||||||||||||||||||||
| Land | $ | $ | $ | $ | $ | $ | $ | $ | |||||||||||||||||||||||||||||||||||||||||||||
| Plant – Regulated | |||||||||||||||||||||||||||||||||||||||||||||||||||||
| Electric generation, distribution and transmission | — | ||||||||||||||||||||||||||||||||||||||||||||||||||||
| Natural gas transmission and distribution | — | — | — | — | — | ||||||||||||||||||||||||||||||||||||||||||||||||
| Other buildings and improvements | |||||||||||||||||||||||||||||||||||||||||||||||||||||
| Nuclear fuel | — | — | — | — | |||||||||||||||||||||||||||||||||||||||||||||||||
| Equipment | |||||||||||||||||||||||||||||||||||||||||||||||||||||
| Construction in process | |||||||||||||||||||||||||||||||||||||||||||||||||||||
| Other | |||||||||||||||||||||||||||||||||||||||||||||||||||||
Total property, plant and equipment(a) | |||||||||||||||||||||||||||||||||||||||||||||||||||||
Total accumulated depreciation – regulated(b)(c) | ( | ( | ( | ( | ( | ( | ( | ( | |||||||||||||||||||||||||||||||||||||||||||||
Total accumulated depreciation – other(d) | ( | — | — | — | — | — | — | — | |||||||||||||||||||||||||||||||||||||||||||||
| Facilities to be retired, net | — | — | — | — | — | — | |||||||||||||||||||||||||||||||||||||||||||||||
| Total net property, plant and equipment | $ | $ | $ | $ | $ | $ | $ | $ | |||||||||||||||||||||||||||||||||||||||||||||
(a) Includes finance leases of $697 million, $335 million, $615 million, $552 million, $63 million and $10 million at Duke Energy, Duke Energy Carolinas, Progress Energy, Duke Energy Progress, Duke Energy Florida and Duke Energy Indiana, respectively, primarily within Plant – Regulated. The Progress Energy, Duke Energy Progress and Duke Energy Florida amounts are net of $292 million, $119 million and $173 million, respectively, of accumulated amortization of finance leases.
(b) Includes $1,793 million, $991 million, $802 million and $802 million of accumulated amortization of nuclear fuel at Duke Energy, Duke Energy Carolinas, Progress Energy and Duke Energy Progress, respectively.
(c) Includes accumulated amortization of finance leases of $3 million, $67 million and $4 million at Duke Energy, Duke Energy Carolinas and Duke Energy Indiana, respectively.
(d) Includes accumulated amortization of finance leases of $7 million at Duke Energy.
172
| FINANCIAL STATEMENTS | PROPERTY, PLANT AND EQUIPMENT | ||||
| December 31, 2022 | |||||||||||||||||||||||||||||||||||||||||||||||||||||
| Average | |||||||||||||||||||||||||||||||||||||||||||||||||||||
| Remaining | Duke | Duke | Duke | Duke | Duke | ||||||||||||||||||||||||||||||||||||||||||||||||
| Useful Life | Duke | Energy | Progress | Energy | Energy | Energy | Energy | ||||||||||||||||||||||||||||||||||||||||||||||
| (in millions) | (Years) | Energy | Carolinas | Energy | Progress | Florida | Ohio | Indiana | Piedmont | ||||||||||||||||||||||||||||||||||||||||||||
| Land | $ | $ | $ | $ | $ | $ | $ | $ | |||||||||||||||||||||||||||||||||||||||||||||
| Plant – Regulated | |||||||||||||||||||||||||||||||||||||||||||||||||||||
| Electric generation, distribution and transmission | — | ||||||||||||||||||||||||||||||||||||||||||||||||||||
| Natural gas transmission and distribution | — | — | — | — | — | ||||||||||||||||||||||||||||||||||||||||||||||||
| Other buildings and improvements | |||||||||||||||||||||||||||||||||||||||||||||||||||||
| Nuclear fuel | — | — | — | — | |||||||||||||||||||||||||||||||||||||||||||||||||
| Equipment | |||||||||||||||||||||||||||||||||||||||||||||||||||||
| Construction in process | |||||||||||||||||||||||||||||||||||||||||||||||||||||
| Other | |||||||||||||||||||||||||||||||||||||||||||||||||||||
Total property, plant and equipment(a) | |||||||||||||||||||||||||||||||||||||||||||||||||||||
Total accumulated depreciation – regulated(b)(c) | ( | ( | ( | ( | ( | ( | ( | ( | |||||||||||||||||||||||||||||||||||||||||||||
Total accumulated depreciation – other(d) | ( | — | — | — | — | — | — | — | |||||||||||||||||||||||||||||||||||||||||||||
| Facilities to be retired, net | — | — | — | — | — | — | |||||||||||||||||||||||||||||||||||||||||||||||
| Total net property, plant and equipment | $ | $ | $ | $ | $ | $ | $ | $ | |||||||||||||||||||||||||||||||||||||||||||||
(a) Includes finance leases of $816 million, $335 million, $674 million, $590 million, $84 million, and $10 million at Duke Energy, Duke Energy Carolinas, Progress Energy, Duke Energy Progress, Duke Energy Florida and Duke Energy Indiana, respectively, primarily within Plant – Regulated. The Progress Energy, Duke Energy Progress and Duke Energy Florida amounts are net of $233 million, $81 million and $152 million, respectively, of accumulated amortization of finance leases.
(b) Includes $1,683 million, $934 million, $749 million and $749 million of accumulated amortization of nuclear fuel at Duke Energy, Duke Energy Carolinas, Progress Energy and Duke Energy Progress, respectively.
(c) Includes accumulated amortization of finance leases of $7 million, $51 million, and $4 million at Duke Energy, Duke Energy Carolinas and Duke Energy Indiana, respectively.
(d) Includes accumulated amortization of finance leases of ($1 million) at Duke Energy.
Duke Energy has continued to execute on its business transformation strategy, including the evaluation of in-office work policies considering the experience with the COVID-19 pandemic and also workforce realignment of roles and responsibilities. In May 2021, Duke Energy management approved the sale of certain properties and entered into an agreement to exit certain leased space on December 31, 2021. The sale of the properties was subject to abandonment accounting and resulted in an impairment charge. Additionally, the exit of the leased space resulted in the impairment of related furniture, fixtures and equipment. During the year ended December 31, 2021, Duke Energy recorded a pretax charge to earnings of $192 million on the Consolidated Statements of Operations, which includes $133 million within Impairment of assets and other charges, $42 million within Operations, maintenance and other and $17 million within Depreciation and amortization.
The following table presents capitalized interest, which includes the debt component of AFUDC.
| Years Ended December 31, | |||||||||||||||||
| (in millions) | 2023 | 2022 | 2021 | ||||||||||||||
| Duke Energy | $ | $ | $ | ||||||||||||||
| Duke Energy Carolinas | |||||||||||||||||
| Progress Energy | |||||||||||||||||
| Duke Energy Progress | |||||||||||||||||
| Duke Energy Florida | |||||||||||||||||
| Duke Energy Ohio | |||||||||||||||||
Duke Energy Indiana(a) | ( | ||||||||||||||||
| Piedmont | |||||||||||||||||
(a) In 2021, Duke Energy Indiana is primarily compromised of ($24 million) of PISCC amortization, which is partially offset by $7 million of the debt component of AFUDC.
173
| FINANCIAL STATEMENTS | GOODWILL AND INTANGIBLE ASSETS | ||||
12. GOODWILL AND INTANGIBLE ASSETS
GOODWILL
Duke Energy
Duke Energy's Goodwill balance of $19.3 17.4 1.9 no
Duke Energy Ohio
Duke Energy Ohio's Goodwill balance of $920 596 324 216
Progress Energy
Progress Energy's Goodwill is included in the EU&I segment and there are no accumulated impairment charges.
Piedmont
Piedmont's Goodwill is included in the GU&I segment and there are no accumulated impairment charges.
Goodwill Impairment Testing
Duke Energy, Progress Energy, Duke Energy Ohio and Piedmont are required to perform an annual goodwill impairment test as of the same date each year and, accordingly, perform their annual impairment testing of goodwill as of August 31. Duke Energy, Progress Energy, Duke Energy Ohio and Piedmont update their test between annual tests if events or circumstances occur that would more likely than not reduce the fair value of a reporting unit below its carrying value. As the fair value for Duke Energy, Progress Energy, Duke Energy Ohio and Piedmont exceeded their respective carrying values at the date of the annual impairment analysis, no goodwill impairment charges were recorded in 2023.
INTANGIBLE ASSETS
The following tables show the carrying amount and accumulated amortization of intangible assets included in Other within Other Noncurrent Assets on the Consolidated Balance Sheets of the Duke Energy Registrants at December 31, 2023, and 2022.
| December 31, 2023 | |||||||||||||||||||||||||||||||||||||||||||||||
| Duke | Duke | Duke | Duke | Duke | |||||||||||||||||||||||||||||||||||||||||||
| Duke | Energy | Progress | Energy | Energy | Energy | Energy | |||||||||||||||||||||||||||||||||||||||||
| (in millions) | Energy | Carolinas | Energy | Progress | Florida | Ohio | Indiana | Piedmont | |||||||||||||||||||||||||||||||||||||||
| Emission allowances | $ | $ | — | $ | $ | $ | $ | — | $ | $ | — | ||||||||||||||||||||||||||||||||||||
| Renewable energy certificates | — | — | — | ||||||||||||||||||||||||||||||||||||||||||||
| Other | — | — | — | ||||||||||||||||||||||||||||||||||||||||||||
| Total gross carrying amounts | |||||||||||||||||||||||||||||||||||||||||||||||
| Accumulated amortization – other | ( | — | ( | — | ( | — | — | ( | |||||||||||||||||||||||||||||||||||||||
| Total intangible assets, net | $ | $ | $ | $ | $ | $ | $ | $ | |||||||||||||||||||||||||||||||||||||||
| December 31, 2022 | |||||||||||||||||||||||||||||||||||||||||||||||
| Duke | Duke | Duke | Duke | Duke | |||||||||||||||||||||||||||||||||||||||||||
| Duke | Energy | Progress | Energy | Energy | Energy | Energy | |||||||||||||||||||||||||||||||||||||||||
| (in millions) | Energy | Carolinas | Energy | Progress | Florida | Ohio | Indiana | Piedmont | |||||||||||||||||||||||||||||||||||||||
| Emission allowances | $ | $ | — | $ | $ | $ | $ | — | $ | $ | — | ||||||||||||||||||||||||||||||||||||
| Renewable energy certificates | — | — | — | ||||||||||||||||||||||||||||||||||||||||||||
| Other | — | — | — | ||||||||||||||||||||||||||||||||||||||||||||
| Total gross carrying amounts | |||||||||||||||||||||||||||||||||||||||||||||||
| Accumulated amortization – other | ( | — | ( | — | ( | — | — | ( | |||||||||||||||||||||||||||||||||||||||
| Total intangible assets, net | $ | $ | $ | $ | $ | $ | $ | $ | |||||||||||||||||||||||||||||||||||||||
Amortization Expense
Amortization expense amounts for other intangible assets are immaterial for the years ended December 31, 2023, 2022 and 2021, and are expected to be immaterial for the next five years as of December 31, 2023.
13. INVESTMENTS IN UNCONSOLIDATED AFFILIATES
EQUITY METHOD INVESTMENTS
Investments in affiliates that are not controlled by Duke Energy, but over which it has significant influence, are accounted for using the equity method.
174
| FINANCIAL STATEMENTS | INVESTMENTS IN UNCONSOLIDATED AFFILIATES | ||||
The following table presents Duke Energy’s investments in unconsolidated affiliates accounted for under the equity method, as well as the respective equity in earnings, by segment, for periods presented in this filing.
| Years Ended December 31, | |||||||||||||||||||||||||||||
| 2023 | 2022 | 2021 | |||||||||||||||||||||||||||
Equity in | Equity in | Equity in | |||||||||||||||||||||||||||
| (in millions) | Investments | earnings | Investments | earnings | earnings | ||||||||||||||||||||||||
| Electric Utilities and Infrastructure | $ | $ | $ | $ | $ | ||||||||||||||||||||||||
| Gas Utilities and Infrastructure | |||||||||||||||||||||||||||||
| Other | |||||||||||||||||||||||||||||
| Total | $ | $ | $ | $ | $ | ||||||||||||||||||||||||
During the years ended December 31, 2023, 2022 and 2021, Duke Energy received distributions from equity investments of $50 million, $111 million and $56 million, respectively, which are included in Other assets within Cash Flows from Operating Activities on the Consolidated Statements of Cash Flows. During the years ended December 31, 2023, 2022 and 2021, Duke Energy received distributions from equity investments of $16 million, $6 million and $14 million, respectively, which are included in Return of investment capital within Cash Flows from Investing Activities on the Consolidated Statements of Cash Flows.
During the years ended December 31, 2023, 2022 and 2021, Piedmont received distributions from equity investments of $9 million, $31 million and $8 million, respectively, which are included in Other assets within Cash Flows from Operating Activities. During the years ended December 31, 2023, and 2021, Piedmont received distributions from equity investments of $1 million and $2 million, respectively, which are included within Cash Flows from Investing Activities on the Consolidated Statements of Cash Flows. Amounts received during the year ended December 31, 2022, included in Cash Flows from Investing Activities on the Consolidated Statements of Cash Flows were immaterial.
Significant investments in affiliates accounted for under the equity method are discussed below.
Electric Utilities and Infrastructure
Duke Energy owns 50
Gas Utilities and Infrastructure
Pipeline Investments
Piedmont owns a 21.49 % investment in Cardinal, an intrastate pipeline located in North Carolina.
Duke Energy owns a 7.5 % interest in Sabal Trail, a 517-mile interstate natural gas pipeline, which provides natural gas to Duke Energy Florida and Florida Power and Light.
Storage Facilities
Piedmont owns a 45 % interest in Pine Needle, an interstate LNG storage facility located in North Carolina, and a 50 % interest in Hardy Storage, an underground interstate natural gas storage facility located in West Virginia.
Renewable Natural Gas Investments
Duke Energy owns a 29.68 % investment in SustainRNG, a developer of renewable natural gas projects, a 70 % interest in Sustain T&W, SustainRNG's renewable natural gas project located in Georgia, and a 70 % interest in Sustain Liberty, SustainRNG's renewable natural gas project located in North Carolina.
Other
Duke Energy has a 17.5 % indirect economic ownership interest and a 25 % board representation and voting rights interest in NMC, which owns and operates a methanol and MTBE business in Jubail, Saudi Arabia.
175
| FINANCIAL STATEMENTS | RELATED PARTY TRANSACTIONS | ||||
14. RELATED PARTY TRANSACTIONS
The Subsidiary Registrants engage in related party transactions in accordance with the applicable state and federal commission regulations. Refer to the Consolidated Balance Sheets of the Subsidiary Registrants for balances due to or due from related parties. Material amounts related to transactions with related parties included in the Consolidated Statements of Operations and Comprehensive Income are presented in the following table.
| Years Ended December 31, | |||||||||||||||||
| (in millions) | 2023 | 2022 | 2021 | ||||||||||||||
| Duke Energy Carolinas | |||||||||||||||||
Corporate governance and shared service expenses(a) | $ | $ | $ | ||||||||||||||
Indemnification coverages(b) | |||||||||||||||||
JDA revenue(c) | |||||||||||||||||
JDA expense(c) | |||||||||||||||||
Intercompany natural gas purchases(d) | |||||||||||||||||
| Progress Energy | |||||||||||||||||
Corporate governance and shared service expenses(a) | $ | $ | $ | ||||||||||||||
Indemnification coverages(b) | |||||||||||||||||
JDA revenue(c) | |||||||||||||||||
JDA expense(c) | |||||||||||||||||
Intercompany natural gas purchases(d) | |||||||||||||||||
| Duke Energy Progress | |||||||||||||||||
Corporate governance and shared service expenses(a) | $ | $ | $ | ||||||||||||||
Indemnification coverages(b) | |||||||||||||||||
JDA revenue(c) | |||||||||||||||||
JDA expense(c) | |||||||||||||||||
Intercompany natural gas purchases(d) | |||||||||||||||||
| Duke Energy Florida | |||||||||||||||||
Corporate governance and shared service expenses(a) | $ | $ | $ | ||||||||||||||
Indemnification coverages(b) | |||||||||||||||||
| Duke Energy Ohio | |||||||||||||||||
Corporate governance and shared service expenses(a) | $ | $ | $ | ||||||||||||||
Indemnification coverages(b) | |||||||||||||||||
| Duke Energy Indiana | |||||||||||||||||
Corporate governance and shared service expenses(a) | $ | $ | $ | ||||||||||||||
Indemnification coverages(b) | |||||||||||||||||
| Piedmont | |||||||||||||||||
Corporate governance and shared service expenses(a) | $ | $ | $ | ||||||||||||||
Indemnification coverages(b) | |||||||||||||||||
Intercompany natural gas sales(d) | |||||||||||||||||
Natural gas storage and transportation costs(e) | |||||||||||||||||
(a)The Subsidiary Registrants are charged their proportionate share of corporate governance and other shared services costs, primarily related to human resources, employee benefits, information technology, legal and accounting fees, as well as other third-party costs. These amounts are primarily recorded in Operation, maintenance and other on the Consolidated Statements of Operations and Comprehensive Income.
(b)The Subsidiary Registrants incur expenses related to certain indemnification coverages through Bison, Duke Energy’s wholly owned captive insurance subsidiary. These expenses are recorded in Operation, maintenance and other on the Consolidated Statements of Operations and Comprehensive Income.
(c)Duke Energy Carolinas and Duke Energy Progress participate in a JDA, which allows the collective dispatch of power plants between the service territories to reduce customer rates. Revenues from the sale of power and expenses from the purchase of power pursuant to the JDA are recorded in Operating Revenues and Fuel used in electric generation and purchased power, respectively, on the Consolidated Statements of Operations and Comprehensive Income.
(d)Piedmont provides long-term natural gas delivery service to certain Duke Energy Carolinas and Duke Energy Progress natural gas-fired generation facilities. Piedmont records the sales in Operating Revenues, and Duke Energy Carolinas and Duke Energy Progress record the related purchases as a component of Fuel used in electric generation and purchased power on their respective Consolidated Statements of Operations and Comprehensive Income. These intercompany revenues and expenses are eliminated in consolidation.
(e)Piedmont has related party transactions as a customer of its equity method investments in Pine Needle, Hardy Storage, and Cardinal natural gas storage and transportation facilities. These expenses are included in Cost of natural gas on Piedmont's Consolidated Statements of Operations and Comprehensive Income.
176
| FINANCIAL STATEMENTS | RELATED PARTY TRANSACTIONS | ||||
In addition to the amounts presented above, the Subsidiary Registrants have other affiliate transactions, including rental of office space, participation in a money pool arrangement, other operational transactions and their proportionate share of certain charged expenses. See Note 7 for more information regarding money pool. These transactions of the Subsidiary Registrants are incurred in the ordinary course of business and are eliminated in consolidation.
As discussed in Note 18, certain trade receivables have been sold by Duke Energy Ohio and Duke Energy Indiana to CRC, an affiliate formed by a subsidiary of Duke Energy. The proceeds obtained from the sales of receivables are largely cash but do include a subordinated note from CRC for a portion of the purchase price.
Intercompany Income Taxes
Duke Energy and the Subsidiary Registrants file a consolidated federal income tax return and other state and jurisdictional returns. The Subsidiary Registrants have a tax sharing agreement with Duke Energy for the allocation of consolidated tax liabilities and benefits. Income taxes recorded represent amounts the Subsidiary Registrants would incur as separate C-Corporations. The following table includes the balance of intercompany income tax receivables and payables for the Subsidiary Registrants.
| Duke | Duke | Duke | Duke | Duke | |||||||||||||||||||
| Energy | Progress | Energy | Energy | Energy | Energy | ||||||||||||||||||
| (in millions) | Carolinas | Energy | Progress | Florida | Ohio | Indiana | Piedmont | ||||||||||||||||
| December 31, 2023 | |||||||||||||||||||||||
| Intercompany income tax receivable | $ | — | $ | — | $ | — | $ | — | $ | $ | $ | — | |||||||||||
| Intercompany income tax payable | — | — | |||||||||||||||||||||
| December 31, 2022 | |||||||||||||||||||||||
| Intercompany income tax receivable | $ | — | $ | $ | $ | $ | — | $ | — | $ | — | ||||||||||||
| Intercompany income tax payable | — | — | — | ||||||||||||||||||||
15. DERIVATIVES AND HEDGING
The Duke Energy Registrants use commodity, interest rate and foreign currency contracts to manage commodity price risk, interest rate risk and foreign currency exchange rate risk. The primary use of commodity derivatives is to hedge the generation portfolio against changes in the prices of electricity and natural gas. Piedmont enters into natural gas supply contracts to provide diversification, reliability and natural gas cost benefits to its customers. Interest rate derivatives are used to manage interest rate risk associated with borrowings. Foreign currency derivatives are used to manage risk related to foreign currency exchange rates on certain issuances of debt.
All derivative instruments not identified as NPNS are recorded at fair value as assets or liabilities on the Consolidated Balance Sheets. Cash collateral related to derivative instruments executed under master netting arrangements is offset against the collateralized derivatives on the Consolidated Balance Sheets. The cash impacts of settled derivatives are recorded as operating activities or financing activities on the Consolidated Statements of Cash Flows.
INTEREST RATE RISK
The Duke Energy Registrants are exposed to changes in interest rates as a result of their issuance or anticipated issuance of variable-rate and fixed-rate debt and commercial paper. Interest rate risk is managed by limiting variable-rate exposures to a percentage of total debt and by monitoring changes in interest rates. To manage risk associated with changes in interest rates, the Duke Energy Registrants may enter into interest rate swaps, U.S. Treasury lock agreements and other financial contracts. In anticipation of certain fixed-rate debt issuances, a series of forward-starting interest rate swaps or Treasury locks may be executed to lock in components of current market interest rates. These instruments are later terminated prior to or upon the issuance of the corresponding debt.
Cash Flow Hedges
For a derivative designated as hedging the exposure to variable cash flows of a future transaction, referred to as a cash flow hedge, the effective portion of the derivative's gain or loss is initially reported as a component of other comprehensive income and subsequently reclassified into earnings once the future transaction impacts earnings. Amounts for interest rate contracts are reclassified to earnings as interest expense over the term of the related debt. Gains and losses reclassified out of AOCI for the years ended December 31, 2023, 2022, and 2021, were not material. Duke Energy's interest rate derivatives designated as hedges include forward-starting interest rate swaps not accounted for under regulatory accounting.
Undesignated Contracts
Undesignated contracts primarily include contracts not designated as a hedge because they are accounted for under regulatory accounting or contracts that do not qualify for hedge accounting.
Duke Energy’s interest rate swaps for its regulated operations employ regulatory accounting. With regulatory accounting, the mark-to-market gains or losses on the swaps are deferred as regulatory liabilities or regulatory assets, respectively. Regulatory assets and liabilities are amortized consistent with the treatment of the related costs in the ratemaking process. The accrual of interest on the swaps is recorded as Interest Expense on the Duke Energy Registrant's Consolidated Statements of Operations and Comprehensive Income.
177
| FINANCIAL STATEMENTS | DERIVATIVES AND HEDGING | ||||
The following tables show notional amounts of outstanding derivatives related to interest rate risk.
| December 31, 2023 | |||||||||||||||||||||||||||||||||||||||||
| Duke | Duke | Duke | Duke | Duke | |||||||||||||||||||||||||||||||||||||
| Duke | Energy | Progress | Energy | Energy | Energy | Energy | |||||||||||||||||||||||||||||||||||
| (in millions) | Energy | Carolinas | Energy | Progress | Florida | Indiana | Ohio | ||||||||||||||||||||||||||||||||||
| Cash flow hedges | $ | $ | — | $ | — | $ | — | $ | — | $ | — | $ | — | ||||||||||||||||||||||||||||
| Undesignated contracts | |||||||||||||||||||||||||||||||||||||||||
| Total notional amount | $ | $ | $ | $ | $ | $ | $ | ||||||||||||||||||||||||||||||||||
| December 31, 2022 | |||||||||||||||||||||||||||||||||||||||||
| Duke | Duke | Duke | Duke | Duke | |||||||||||||||||||||||||||||||||||||
| Duke | Energy | Progress | Energy | Energy | Energy | Energy | |||||||||||||||||||||||||||||||||||
| (in millions) | Energy | Carolinas | Energy | Progress | Florida | Indiana | Ohio | ||||||||||||||||||||||||||||||||||
| Cash flow hedges | $ | $ | — | $ | — | $ | — | $ | — | $ | — | $ | — | ||||||||||||||||||||||||||||
| Undesignated contracts | |||||||||||||||||||||||||||||||||||||||||
| Total notional amount | $ | $ | $ | $ | $ | $ | $ | ||||||||||||||||||||||||||||||||||
COMMODITY PRICE RISK
The Duke Energy Registrants are exposed to the impact of changes in the prices of electricity purchased and sold in bulk power markets and natural gas purchases, including Piedmont's natural gas supply contracts. Exposure to commodity price risk is influenced by a number of factors including the term of contracts, the liquidity of markets and delivery locations. To manage risk associated with commodity prices, the Duke Energy Registrants may enter into long-term power purchase or sales contracts and long-term natural gas supply agreements.
Undesignated Contracts
For the Subsidiary Registrants, bulk power electricity and natural gas purchases flow through fuel adjustment clauses, formula-based contracts or other cost sharing mechanisms. Differences between the costs included in rates and the incurred costs, including undesignated derivative contracts, are largely deferred as regulatory assets or regulatory liabilities. Piedmont policies allow for the use of financial instruments to hedge commodity price risks. The strategy and objective of these hedging programs are to use the financial instruments to reduce natural gas cost volatility for customers.
Volumes
The tables below include volumes of outstanding commodity derivatives. Amounts disclosed represent the absolute value of notional volumes of commodity contracts excluding NPNS. The Duke Energy Registrants have netted contractual amounts where offsetting purchase and sale contracts exist with identical delivery locations and times of delivery. Where all commodity positions are perfectly offset, no quantities are shown.
| December 31, 2023 | |||||||||||||||||||||||||||||||||||||||||
| Duke | Duke | Duke | Duke | ||||||||||||||||||||||||||||||||||||||
| Duke | Energy | Progress | Energy | Energy | Energy | ||||||||||||||||||||||||||||||||||||
| Energy | Carolinas | Energy | Progress | Ohio | Indiana | Piedmont | |||||||||||||||||||||||||||||||||||
| Electricity (GWh) | — | — | — | — | |||||||||||||||||||||||||||||||||||||
| Natural gas (millions of Dth) | — | ||||||||||||||||||||||||||||||||||||||||
| December 31, 2022 | |||||||||||||||||||||||||||||||||||||||||
| Duke | Duke | Duke | Duke | ||||||||||||||||||||||||||||||||||||||
| Duke | Energy | Progress | Energy | Energy | Energy | ||||||||||||||||||||||||||||||||||||
| Energy | Carolinas | Energy | Progress | Ohio | Indiana | Piedmont | |||||||||||||||||||||||||||||||||||
| Electricity (GWh) | — | — | — | — | |||||||||||||||||||||||||||||||||||||
| Natural gas (millions of Dth) | — | ||||||||||||||||||||||||||||||||||||||||
FOREIGN CURRENCY RISK
Duke Energy may enter into foreign currency derivatives to hedge exposure to changes in foreign currency exchange rates, such as that arising from the issuance of debt denominated in a currency other than U.S. dollars.
Fair Value Hedges
Derivatives related to existing fixed rate securities are accounted for as fair value hedges, where the derivatives’ fair value gains or losses and hedged items’ fair value gains or losses are both recorded directly to earnings on the same income statement line item, including foreign currency gains or losses arising from changes in the U.S. currency exchange rates. Duke Energy has elected to exclude the cross-currency basis spread from the assessment of effectiveness in the fair value hedges of its foreign currency risk and record any difference between the change in the fair value of the excluded components and the amounts recognized in earnings as a component of other comprehensive income or loss.
178
| FINANCIAL STATEMENTS | DERIVATIVES AND HEDGING | ||||
The following table shows Duke Energy's outstanding derivatives related to foreign currency risk. There were no fair value hedges in 2021.
Fair Value Gain (Loss)(a) | |||||||||||||||||||||||||||||||||||||||||
| Receive | Hedge | (in millions) | |||||||||||||||||||||||||||||||||||||||
| Pay Notional | Notional | Receive | Maturity | Years Ended December 31, | |||||||||||||||||||||||||||||||||||||
| (in millions) | Pay Rate | (in millions) | Rate | Date | 2023 | 2022 | |||||||||||||||||||||||||||||||||||
| Fair value hedges | |||||||||||||||||||||||||||||||||||||||||
| $ | % | euros | % | June 2028 | $ | ( | |||||||||||||||||||||||||||||||||||
| % | euros | % | June 2034 | ( | |||||||||||||||||||||||||||||||||||||
| Total notional amount | $ | euros | $ | ( | |||||||||||||||||||||||||||||||||||||
(a) Amounts are recorded in Other Income and expenses, net on the Consolidated Statement of Operations, which offsets an equal translation adjustment of the foreign denominated debt. See the Consolidated Statements of Comprehensive Income for amounts excluded from the assessment of effectiveness for which the difference between changes in fair value and periodic amortization is recorded.
LOCATION AND FAIR VALUE OF DERIVATIVE ASSETS AND LIABILITIES RECOGNIZED IN THE CONSOLIDATED BALANCE SHEETS
The following tables show the fair value and balance sheet location of derivative instruments. Although derivatives subject to master netting arrangements are netted on the Consolidated Balance Sheets, the fair values presented below are shown gross and cash collateral on the derivatives has not been netted against the fair values shown.
| Derivative Assets | December 31, 2023 | |||||||||||||||||||||||||||||||||||||||||||||||||
| Duke | Duke | Duke | Duke | Duke | ||||||||||||||||||||||||||||||||||||||||||||||
| Duke | Energy | Progress | Energy | Energy | Energy | Energy | ||||||||||||||||||||||||||||||||||||||||||||
| (in millions) | Energy | Carolinas | Energy | Progress | Florida | Ohio | Indiana | Piedmont | ||||||||||||||||||||||||||||||||||||||||||
| Commodity Contracts | ||||||||||||||||||||||||||||||||||||||||||||||||||
| Not Designated as Hedging Instruments | ||||||||||||||||||||||||||||||||||||||||||||||||||
| Current | $ | $ | $ | $ | $ | $ | $ | $ | ||||||||||||||||||||||||||||||||||||||||||
| Noncurrent | — | — | — | — | ||||||||||||||||||||||||||||||||||||||||||||||
| Total Derivative Assets – Commodity Contracts | $ | $ | $ | $ | $ | $ | $ | $ | ||||||||||||||||||||||||||||||||||||||||||
| Interest Rate Contracts | ||||||||||||||||||||||||||||||||||||||||||||||||||
| Designated as Hedging Instruments | ||||||||||||||||||||||||||||||||||||||||||||||||||
| Current | $ | $ | — | $ | — | $ | — | $ | — | $ | — | $ | — | $ | — | |||||||||||||||||||||||||||||||||||
| Noncurrent | — | — | — | — | — | — | — | |||||||||||||||||||||||||||||||||||||||||||
| Not Designated as Hedging Instruments | ||||||||||||||||||||||||||||||||||||||||||||||||||
| Current | $ | $ | $ | — | $ | — | $ | — | $ | — | $ | — | $ | — | ||||||||||||||||||||||||||||||||||||
| Noncurrent | — | — | — | — | — | |||||||||||||||||||||||||||||||||||||||||||||
| Total Derivative Assets – Interest Rate Contracts | $ | $ | $ | — | $ | — | $ | — | $ | — | $ | $ | — | |||||||||||||||||||||||||||||||||||||
Foreign Currency Contracts | ||||||||||||||||||||||||||||||||||||||||||||||||||
| Designated as Hedging Instruments | ||||||||||||||||||||||||||||||||||||||||||||||||||
| Noncurrent | — | — | — | — | — | — | — | |||||||||||||||||||||||||||||||||||||||||||
Total Derivative Assets – Foreign Currency Contracts | $ | $ | — | $ | — | $ | — | $ | — | $ | — | $ | — | $ | — | |||||||||||||||||||||||||||||||||||
| Total Derivative Assets | $ | $ | $ | $ | $ | $ | $ | $ | ||||||||||||||||||||||||||||||||||||||||||
179
| FINANCIAL STATEMENTS | DERIVATIVES AND HEDGING | ||||
| Derivative Liabilities | December 31, 2023 | |||||||||||||||||||||||||||||||||||||||||||||||||
| Duke | Duke | Duke | Duke | Duke | ||||||||||||||||||||||||||||||||||||||||||||||
| Duke | Energy | Progress | Energy | Energy | Energy | Energy | ||||||||||||||||||||||||||||||||||||||||||||
| (in millions) | Energy | Carolinas | Energy | Progress | Florida | Ohio | Indiana | Piedmont | ||||||||||||||||||||||||||||||||||||||||||
| Commodity Contracts | ||||||||||||||||||||||||||||||||||||||||||||||||||
| Not Designated as Hedging Instruments | ||||||||||||||||||||||||||||||||||||||||||||||||||
| Current | $ | $ | $ | $ | $ | — | $ | — | $ | $ | ||||||||||||||||||||||||||||||||||||||||
| Noncurrent | — | — | — | |||||||||||||||||||||||||||||||||||||||||||||||
| Total Derivative Liabilities – Commodity Contracts | $ | $ | $ | $ | $ | — | $ | — | $ | $ | ||||||||||||||||||||||||||||||||||||||||
| Interest Rate Contracts | ||||||||||||||||||||||||||||||||||||||||||||||||||
| Designated as Hedging Instruments | ||||||||||||||||||||||||||||||||||||||||||||||||||
| Current | $ | $ | — | $ | — | $ | — | $ | — | $ | — | $ | — | $ | — | |||||||||||||||||||||||||||||||||||
| Noncurrent | — | — | — | — | — | — | — | |||||||||||||||||||||||||||||||||||||||||||
| Not Designated as Hedging Instruments | ||||||||||||||||||||||||||||||||||||||||||||||||||
| Current | — | — | — | — | ||||||||||||||||||||||||||||||||||||||||||||||
| Noncurrent | — | — | ||||||||||||||||||||||||||||||||||||||||||||||||
| Total Derivative Liabilities – Interest Rate Contracts | $ | $ | $ | $ | $ | $ | $ | — | $ | — | ||||||||||||||||||||||||||||||||||||||||
| Foreign Currency Contracts | ||||||||||||||||||||||||||||||||||||||||||||||||||
| Designated as Hedging Instruments | ||||||||||||||||||||||||||||||||||||||||||||||||||
| Current | $ | $ | — | $ | — | $ | — | $ | — | $ | — | $ | — | $ | — | |||||||||||||||||||||||||||||||||||
| Total Derivative Liabilities – Foreign Currency Contracts | $ | $ | — | $ | — | $ | — | $ | — | $ | — | $ | — | $ | — | |||||||||||||||||||||||||||||||||||
| Total Derivative Liabilities | $ | $ | $ | $ | $ | $ | $ | $ | ||||||||||||||||||||||||||||||||||||||||||
| Derivative Assets | December 31, 2022 | |||||||||||||||||||||||||||||||||||||||||||||||||
| Duke | Duke | Duke | Duke | Duke | ||||||||||||||||||||||||||||||||||||||||||||||
| Duke | Energy | Progress | Energy | Energy | Energy | Energy | ||||||||||||||||||||||||||||||||||||||||||||
| (in millions) | Energy | Carolinas | Energy | Progress | Florida | Ohio | Indiana | Piedmont | ||||||||||||||||||||||||||||||||||||||||||
| Commodity Contracts | ||||||||||||||||||||||||||||||||||||||||||||||||||
| Not Designated as Hedging Instruments | ||||||||||||||||||||||||||||||||||||||||||||||||||
| Current | $ | $ | $ | $ | $ | — | $ | $ | $ | — | ||||||||||||||||||||||||||||||||||||||||
| Noncurrent | — | — | — | — | ||||||||||||||||||||||||||||||||||||||||||||||
| Total Derivative Assets – Commodity Contracts | $ | $ | $ | $ | $ | — | $ | $ | $ | — | ||||||||||||||||||||||||||||||||||||||||
| Interest Rate Contracts | ||||||||||||||||||||||||||||||||||||||||||||||||||
| Designated as Hedging Instruments | ||||||||||||||||||||||||||||||||||||||||||||||||||
| Current | $ | $ | — | $ | — | $ | — | $ | — | $ | — | $ | — | $ | — | |||||||||||||||||||||||||||||||||||
| Not Designated as Hedging Instruments | ||||||||||||||||||||||||||||||||||||||||||||||||||
| Current | $ | $ | $ | $ | $ | $ | — | $ | $ | — | ||||||||||||||||||||||||||||||||||||||||
| Total Derivative Assets – Interest Rate Contracts | $ | $ | $ | $ | $ | $ | — | $ | $ | — | ||||||||||||||||||||||||||||||||||||||||
| Total Derivative Assets | $ | $ | $ | $ | $ | $ | $ | $ | — | |||||||||||||||||||||||||||||||||||||||||
180
| FINANCIAL STATEMENTS | DERIVATIVES AND HEDGING | ||||
| Derivative Liabilities | December 31, 2022 | |||||||||||||||||||||||||||||||||||||||||||||||||
| Duke | Duke | Duke | Duke | Duke | ||||||||||||||||||||||||||||||||||||||||||||||
| Duke | Energy | Progress | Energy | Energy | Energy | Energy | ||||||||||||||||||||||||||||||||||||||||||||
| (in millions) | Energy | Carolinas | Energy | Progress | Florida | Ohio | Indiana | Piedmont | ||||||||||||||||||||||||||||||||||||||||||
| Not Designated as Hedging Instruments | ||||||||||||||||||||||||||||||||||||||||||||||||||
| Current | $ | $ | $ | $ | $ | $ | — | $ | $ | |||||||||||||||||||||||||||||||||||||||||
| Noncurrent | — | — | — | |||||||||||||||||||||||||||||||||||||||||||||||
| Total Derivative Liabilities – Commodity Contracts | $ | $ | $ | $ | $ | $ | — | $ | $ | |||||||||||||||||||||||||||||||||||||||||
| Interest Rate Contracts | ||||||||||||||||||||||||||||||||||||||||||||||||||
| Not Designated as Hedging Instruments | ||||||||||||||||||||||||||||||||||||||||||||||||||
| Noncurrent | — | — | — | — | — | — | ||||||||||||||||||||||||||||||||||||||||||||
| Total Derivative Liabilities – Interest Rate Contracts | $ | $ | — | $ | — | $ | — | $ | — | $ | $ | — | $ | — | ||||||||||||||||||||||||||||||||||||
| Foreign Currency Contracts | ||||||||||||||||||||||||||||||||||||||||||||||||||
| Designated as Hedging Instruments | ||||||||||||||||||||||||||||||||||||||||||||||||||
| Current | $ | $ | — | $ | — | $ | — | $ | — | $ | — | $ | — | $ | — | |||||||||||||||||||||||||||||||||||
| Noncurrent | — | — | — | — | — | — | — | |||||||||||||||||||||||||||||||||||||||||||
| Total Derivative Liabilities – Foreign Currency Contracts | $ | $ | — | $ | $ | — | $ | $ | — | $ | — | $ | — | |||||||||||||||||||||||||||||||||||||
| Total Derivative Liabilities | $ | $ | $ | $ | $ | $ | $ | $ | ||||||||||||||||||||||||||||||||||||||||||
OFFSETTING ASSETS AND LIABILITIES
The following tables present the line items on the Consolidated Balance Sheets where derivatives are reported. Substantially all of Duke Energy's outstanding derivative contracts are subject to enforceable master netting arrangements. The amounts shown are calculated by counterparty. Accounts receivable or accounts payable may also be available to offset exposures in the event of bankruptcy. These amounts are not included in the tables below.
| Derivative Assets | December 31, 2023 | |||||||||||||||||||||||||||||||||||||||||||||||||
| Duke | Duke | Duke | Duke | Duke | ||||||||||||||||||||||||||||||||||||||||||||||
| Duke | Energy | Progress | Energy | Energy | Energy | Energy | ||||||||||||||||||||||||||||||||||||||||||||
| (in millions) | Energy | Carolinas | Energy | Progress | Florida | Ohio | Indiana | Piedmont | ||||||||||||||||||||||||||||||||||||||||||
| Current | ||||||||||||||||||||||||||||||||||||||||||||||||||
| Gross amounts recognized | $ | $ | $ | $ | $ | $ | $ | $ | ||||||||||||||||||||||||||||||||||||||||||
| Offset | ( | ( | ( | ( | — | — | — | — | ||||||||||||||||||||||||||||||||||||||||||
| $ | $ | $ | $ | — | $ | $ | $ | $ | ||||||||||||||||||||||||||||||||||||||||||
| Noncurrent | ||||||||||||||||||||||||||||||||||||||||||||||||||
| Gross amounts recognized | $ | $ | $ | $ | $ | — | $ | — | $ | $ | — | |||||||||||||||||||||||||||||||||||||||
| Offset | ( | ( | ( | ( | — | — | — | — | ||||||||||||||||||||||||||||||||||||||||||
| $ | $ | $ | $ | $ | — | $ | — | $ | $ | — | ||||||||||||||||||||||||||||||||||||||||
| Derivative Liabilities | December 31, 2023 | |||||||||||||||||||||||||||||||||||||||||||||||||
| Duke | Duke | Duke | Duke | Duke | ||||||||||||||||||||||||||||||||||||||||||||||
| Duke | Energy | Progress | Energy | Energy | Energy | Energy | ||||||||||||||||||||||||||||||||||||||||||||
| (in millions) | Energy | Carolinas | Energy | Progress | Florida | Ohio | Indiana | Piedmont | ||||||||||||||||||||||||||||||||||||||||||
| Current | ||||||||||||||||||||||||||||||||||||||||||||||||||
| Gross amounts recognized | $ | $ | $ | $ | $ | — | $ | — | $ | $ | ||||||||||||||||||||||||||||||||||||||||
| Offset | ( | ( | ( | ( | — | — | — | — | ||||||||||||||||||||||||||||||||||||||||||
| Cash collateral posted | ( | ( | ( | ( | — | — | ( | — | ||||||||||||||||||||||||||||||||||||||||||
| $ | $ | $ | $ | $ | — | $ | — | $ | — | $ | ||||||||||||||||||||||||||||||||||||||||
| Noncurrent | ||||||||||||||||||||||||||||||||||||||||||||||||||
| Gross amounts recognized | $ | $ | $ | $ | $ | $ | $ | — | $ | |||||||||||||||||||||||||||||||||||||||||
| Offset | ( | ( | ( | ( | — | — | — | — | ||||||||||||||||||||||||||||||||||||||||||
| Cash collateral posted | ( | ( | ( | ( | — | — | — | — | ||||||||||||||||||||||||||||||||||||||||||
| $ | $ | $ | $ | $ | $ | $ | — | $ | ||||||||||||||||||||||||||||||||||||||||||
181
| FINANCIAL STATEMENTS | DERIVATIVES AND HEDGING | ||||
| Derivative Assets | December 31, 2022 | |||||||||||||||||||||||||||||||||||||||||||||||||
| Duke | Duke | Duke | Duke | Duke | ||||||||||||||||||||||||||||||||||||||||||||||
| Duke | Energy | Progress | Energy | Energy | Energy | Energy | ||||||||||||||||||||||||||||||||||||||||||||
| (in millions) | Energy | Carolinas | Energy | Progress | Florida | Ohio | Indiana | Piedmont | ||||||||||||||||||||||||||||||||||||||||||
| Current | ||||||||||||||||||||||||||||||||||||||||||||||||||
| Gross amounts recognized | $ | $ | $ | $ | $ | $ | $ | $ | — | |||||||||||||||||||||||||||||||||||||||||
| Offset | ( | ( | ( | ( | — | — | — | — | ||||||||||||||||||||||||||||||||||||||||||
| Cash collateral received | ( | ( | ( | ( | — | — | — | — | ||||||||||||||||||||||||||||||||||||||||||
| $ | $ | $ | $ | $ | $ | $ | $ | — | ||||||||||||||||||||||||||||||||||||||||||
| Noncurrent | ||||||||||||||||||||||||||||||||||||||||||||||||||
| Gross amounts recognized | $ | $ | $ | $ | $ | — | $ | — | $ | — | $ | — | ||||||||||||||||||||||||||||||||||||||
| Offset | ( | ( | ( | ( | — | — | — | — | ||||||||||||||||||||||||||||||||||||||||||
| Cash collateral received | ( | ( | ( | ( | — | — | — | — | ||||||||||||||||||||||||||||||||||||||||||
| $ | $ | $ | $ | $ | — | $ | — | $ | — | $ | — | |||||||||||||||||||||||||||||||||||||||
| Derivative Liabilities | December 31, 2022 | |||||||||||||||||||||||||||||||||||||||||||||||||
| Duke | Duke | Duke | Duke | Duke | ||||||||||||||||||||||||||||||||||||||||||||||
| Duke | Energy | Progress | Energy | Energy | Energy | Energy | ||||||||||||||||||||||||||||||||||||||||||||
| (in millions) | Energy | Carolinas | Energy | Progress | Florida | Ohio | Indiana | Piedmont | ||||||||||||||||||||||||||||||||||||||||||
| Current | ||||||||||||||||||||||||||||||||||||||||||||||||||
| Gross amounts recognized | $ | $ | $ | $ | $ | $ | — | $ | $ | |||||||||||||||||||||||||||||||||||||||||
| Offset | ( | ( | ( | ( | — | — | — | — | ||||||||||||||||||||||||||||||||||||||||||
| Cash collateral posted | ( | — | — | — | — | — | ( | — | ||||||||||||||||||||||||||||||||||||||||||
| $ | $ | $ | $ | — | $ | $ | — | $ | — | $ | ||||||||||||||||||||||||||||||||||||||||
| Noncurrent | ||||||||||||||||||||||||||||||||||||||||||||||||||
| Gross amounts recognized | $ | $ | $ | $ | $ | — | $ | $ | — | $ | ||||||||||||||||||||||||||||||||||||||||
| Offset | ( | ( | ( | ( | — | — | — | — | ||||||||||||||||||||||||||||||||||||||||||
| $ | $ | $ | — | $ | — | $ | — | $ | $ | — | $ | |||||||||||||||||||||||||||||||||||||||
OBJECTIVE CREDIT CONTINGENT FEATURES
Certain derivative contracts contain objective credit contingent features. These features include the requirement to post cash collateral or letters of credit if specific events occur, such as a credit rating downgrade below investment grade. The following tables show information with respect to derivative contracts that are in a net liability position and contain objective credit risk-related payment provisions.
| December 31, 2023 | |||||||||||||||||||||||
| Duke | Duke | ||||||||||||||||||||||
| Duke | Energy | Progress | Energy | ||||||||||||||||||||
| (in millions) | Energy | Carolinas | Energy | Progress | |||||||||||||||||||
| Aggregate fair value of derivatives in a net liability position | $ | $ | $ | $ | |||||||||||||||||||
| Fair value of collateral already posted | |||||||||||||||||||||||
| Additional cash collateral or letters of credit in the event credit risk-related contingent features were triggered | |||||||||||||||||||||||
| December 31, 2022 | |||||||||||||||||||||||||||||
| Duke | Duke | Duke | |||||||||||||||||||||||||||
| Duke | Energy | Progress | Energy | Energy | |||||||||||||||||||||||||
| (in millions) | Energy | Carolinas | Energy | Progress | Florida | ||||||||||||||||||||||||
| Aggregate fair value of derivatives in a net liability position | $ | $ | $ | $ | $ | ||||||||||||||||||||||||
| Fair value of collateral already posted | — | — | — | — | — | ||||||||||||||||||||||||
| Additional cash collateral or letters of credit in the event credit risk-related contingent features were triggered | |||||||||||||||||||||||||||||
The Duke Energy Registrants have elected to offset cash collateral and fair values of derivatives. For amounts to be netted, the derivative and cash collateral must be executed with the same counterparty under the same master netting arrangement.
182
| FINANCIAL STATEMENTS | INVESTMENTS IN DEBT AND EQUITY SECURITIES | ||||
16. INVESTMENTS IN DEBT AND EQUITY SECURITIES
Duke Energy’s investments in debt and equity securities are primarily comprised of investments held in (i) the NDTF at Duke Energy Carolinas, Duke Energy Progress and Duke Energy Florida, (ii) the grantor trusts at Duke Energy Progress, Duke Energy Florida and Duke Energy Indiana related to OPEB plans and (iii) Bison. The Duke Energy Registrants classify investments in debt securities as AFS and investments in equity securities as FV-NI.
For investments in debt securities classified as AFS, the unrealized gains and losses are included in other comprehensive income until realized, at which time they are reported through net income. For investments in equity securities classified as FV-NI, both realized and unrealized gains and losses are reported through net income. Substantially all of Duke Energy’s investments in debt and equity securities qualify for regulatory accounting, and accordingly, all associated realized and unrealized gains and losses on these investments are deferred as a regulatory asset or liability.
Duke Energy classifies the majority of investments in debt and equity securities as long term, unless otherwise noted.
Investment Trusts
The investments within the Investment Trusts are managed by independent investment managers with discretion to buy, sell and invest pursuant to the objectives set forth by the investment manager agreements and trust agreements. The Duke Energy Registrants have limited oversight of the day-to-day management of these investments. As a result, the ability to hold investments in unrealized loss positions is outside the control of the Duke Energy Registrants. Accordingly, all unrealized losses associated with debt securities within the Investment Trusts are recognized immediately and deferred to regulatory accounts where appropriate.
Other AFS Securities
Other Investments amounts are recorded in Other within Other Noncurrent Assets on the Consolidated Balance Sheets.
DUKE ENERGY
The following table presents the estimated fair value of investments in debt and equity securities; equity investments are classified as FV-NI and debt investments are classified as AFS.
| December 31, 2023 | December 31, 2022 | ||||||||||||||||||||||||||||||||||
| Gross | Gross | Gross | Gross | ||||||||||||||||||||||||||||||||
| Unrealized | Unrealized | Unrealized | Unrealized | ||||||||||||||||||||||||||||||||
| Holding | Holding | Estimated | Holding | Holding | Estimated | ||||||||||||||||||||||||||||||
| (in millions) | Gains | Losses | Fair Value | Gains | Losses | Fair Value | |||||||||||||||||||||||||||||
| NDTF | |||||||||||||||||||||||||||||||||||
| Cash and cash equivalents | $ | — | $ | — | $ | $ | — | $ | — | $ | |||||||||||||||||||||||||
| Equity securities | |||||||||||||||||||||||||||||||||||
| Corporate debt securities | |||||||||||||||||||||||||||||||||||
| Municipal bonds | — | ||||||||||||||||||||||||||||||||||
| U.S. government bonds | |||||||||||||||||||||||||||||||||||
| Other debt securities | — | ||||||||||||||||||||||||||||||||||
| Total NDTF Investments | $ | $ | $ | $ | $ | $ | |||||||||||||||||||||||||||||
| Other Investments | |||||||||||||||||||||||||||||||||||
| Cash and cash equivalents | $ | — | $ | — | $ | $ | — | $ | — | $ | |||||||||||||||||||||||||
| Equity securities | — | ||||||||||||||||||||||||||||||||||
| Corporate debt securities | — | — | |||||||||||||||||||||||||||||||||
| Municipal bonds | — | ||||||||||||||||||||||||||||||||||
| U.S. government bonds | — | — | |||||||||||||||||||||||||||||||||
| Other debt securities | — | — | |||||||||||||||||||||||||||||||||
| Total Other Investments | $ | $ | $ | $ | $ | $ | |||||||||||||||||||||||||||||
| Total Investments | $ | $ | $ | $ | $ | $ | |||||||||||||||||||||||||||||
183
| FINANCIAL STATEMENTS | INVESTMENTS IN DEBT AND EQUITY SECURITIES | ||||
Realized gains and losses, which were determined on a specific identification basis, from sales of FV-NI and AFS securities for the years ended December 31, 2023, 2022 and 2021, were as follows.
| Years Ended December 31, | |||||||||||||||||
| (in millions) | 2023 | 2022 | 2021 | ||||||||||||||
| FV-NI: | |||||||||||||||||
| Realized gains | $ | $ | $ | ||||||||||||||
| Realized losses | |||||||||||||||||
| AFS: | |||||||||||||||||
| Realized gains | |||||||||||||||||
| Realized losses | |||||||||||||||||
DUKE ENERGY CAROLINAS
The following table presents the estimated fair value of investments in debt and equity securities; equity investments are classified as FV-NI and debt investments are classified as AFS.
| December 31, 2023 | December 31, 2022 | ||||||||||||||||||||||||||||||||||
| Gross | Gross | Gross | Gross | ||||||||||||||||||||||||||||||||
| Unrealized | Unrealized | Unrealized | Unrealized | ||||||||||||||||||||||||||||||||
| Holding | Holding | Estimated | Holding | Holding | Estimated | ||||||||||||||||||||||||||||||
| (in millions) | Gains | Losses | Fair Value | Gains | Losses | Fair Value | |||||||||||||||||||||||||||||
| NDTF | |||||||||||||||||||||||||||||||||||
| Cash and cash equivalents | $ | — | $ | — | $ | $ | — | $ | — | $ | |||||||||||||||||||||||||
| Equity securities | |||||||||||||||||||||||||||||||||||
| Corporate debt securities | |||||||||||||||||||||||||||||||||||
| Municipal bonds | — | — | |||||||||||||||||||||||||||||||||
| U.S. government bonds | |||||||||||||||||||||||||||||||||||
| Other debt securities | — | ||||||||||||||||||||||||||||||||||
| Total NDTF Investments | $ | $ | $ | $ | $ | $ | |||||||||||||||||||||||||||||
Realized gains and losses, which were determined on a specific identification basis, from sales of FV-NI and AFS securities for the years ended December 31, 2023, 2022 and 2021, were as follows.
| Years Ended December 31, | |||||||||||||||||
| (in millions) | 2023 | 2022 | 2021 | ||||||||||||||
| FV-NI: | |||||||||||||||||
| Realized gains | $ | $ | $ | ||||||||||||||
| Realized losses | |||||||||||||||||
| AFS: | |||||||||||||||||
| Realized gains | |||||||||||||||||
| Realized losses | |||||||||||||||||
184
| FINANCIAL STATEMENTS | INVESTMENTS IN DEBT AND EQUITY SECURITIES | ||||
PROGRESS ENERGY
The following table presents the estimated fair value of investments in debt and equity securities; equity investments are classified as FV-NI and debt investments are classified as AFS.
| December 31, 2023 | December 31, 2022 | ||||||||||||||||||||||||||||||||||
| Gross | Gross | Gross | Gross | ||||||||||||||||||||||||||||||||
| Unrealized | Unrealized | Unrealized | Unrealized | ||||||||||||||||||||||||||||||||
| Holding | Holding | Estimated | Holding | Holding | Estimated | ||||||||||||||||||||||||||||||
| (in millions) | Gains | Losses | Fair Value | Gains | Losses | Fair Value | |||||||||||||||||||||||||||||
| NDTF | |||||||||||||||||||||||||||||||||||
| Cash and cash equivalents | $ | — | $ | — | $ | $ | — | $ | — | $ | |||||||||||||||||||||||||
| Equity securities | |||||||||||||||||||||||||||||||||||
| Corporate debt securities | — | ||||||||||||||||||||||||||||||||||
| Municipal bonds | — | ||||||||||||||||||||||||||||||||||
| U.S. government bonds | |||||||||||||||||||||||||||||||||||
| Other debt securities | — | — | — | — | |||||||||||||||||||||||||||||||
| Total NDTF Investments | $ | $ | $ | $ | $ | $ | |||||||||||||||||||||||||||||
| Other Investments | |||||||||||||||||||||||||||||||||||
| Cash and cash equivalents | $ | — | $ | — | $ | $ | — | $ | — | $ | |||||||||||||||||||||||||
| Municipal bonds | — | — | — | ||||||||||||||||||||||||||||||||
| Total Other Investments | $ | — | $ | $ | $ | — | $ | — | $ | ||||||||||||||||||||||||||
| Total Investments | $ | $ | $ | $ | $ | $ | |||||||||||||||||||||||||||||
Realized gains and losses, which were determined on a specific identification basis, from sales of FV-NI and AFS securities for the years ended December 31, 2023, 2022 and 2021, were as follows.
| Years Ended December 31, | |||||||||||||||||
| (in millions) | 2023 | 2022 | 2021 | ||||||||||||||
| FV-NI: | |||||||||||||||||
| Realized gains | $ | $ | $ | ||||||||||||||
| Realized losses | |||||||||||||||||
| AFS: | |||||||||||||||||
| Realized gains | |||||||||||||||||
| Realized losses | |||||||||||||||||
DUKE ENERGY PROGRESS
The following table presents the estimated fair value of investments in debt and equity securities; equity investments are classified as FV-NI and debt investments are classified as AFS.
| December 31, 2023 | December 31, 2022 | ||||||||||||||||||||||||||||||||||
| Gross | Gross | Gross | Gross | ||||||||||||||||||||||||||||||||
| Unrealized | Unrealized | Unrealized | Unrealized | ||||||||||||||||||||||||||||||||
| Holding | Holding | Estimated | Holding | Holding | Estimated | ||||||||||||||||||||||||||||||
| (in millions) | Gains | Losses | Fair Value | Gains | Losses | Fair Value | |||||||||||||||||||||||||||||
| NDTF | |||||||||||||||||||||||||||||||||||
| Cash and cash equivalents | $ | — | $ | — | $ | $ | — | $ | — | $ | |||||||||||||||||||||||||
| Equity securities | |||||||||||||||||||||||||||||||||||
| Corporate debt securities | — | ||||||||||||||||||||||||||||||||||
| Municipal bonds | — | ||||||||||||||||||||||||||||||||||
| U.S. government bonds | |||||||||||||||||||||||||||||||||||
| Other debt securities | — | — | — | — | |||||||||||||||||||||||||||||||
| Total NDTF Investments | $ | $ | $ | $ | $ | $ | |||||||||||||||||||||||||||||
| Other Investments | |||||||||||||||||||||||||||||||||||
| Cash and cash equivalents | $ | — | $ | — | $ | $ | — | $ | — | $ | |||||||||||||||||||||||||
| Total Other Investments | $ | — | $ | — | $ | $ | — | $ | — | $ | |||||||||||||||||||||||||
| Total Investments | $ | $ | $ | $ | $ | $ | |||||||||||||||||||||||||||||
185
| FINANCIAL STATEMENTS | INVESTMENTS IN DEBT AND EQUITY SECURITIES | ||||
Realized gains and losses, which were determined on a specific identification basis, from sales of FV-NI and AFS securities for the years ended December 31, 2023, 2022 and 2021, were as follows.
| Years Ended December 31, | |||||||||||||||||
| (in millions) | 2023 | 2022 | 2021 | ||||||||||||||
| FV-NI: | |||||||||||||||||
| Realized gains | $ | $ | $ | ||||||||||||||
| Realized losses | |||||||||||||||||
| AFS: | |||||||||||||||||
| Realized gains | |||||||||||||||||
| Realized losses | |||||||||||||||||
DUKE ENERGY FLORIDA
The following table presents the estimated fair value of investments in debt and equity securities; equity investments are classified as FV-NI and debt investments are classified as AFS.
| December 31, 2023 | December 31, 2022 | ||||||||||||||||||||||||||||||||||
| Gross | Gross | Gross | Gross | ||||||||||||||||||||||||||||||||
| Unrealized | Unrealized | Unrealized | Unrealized | ||||||||||||||||||||||||||||||||
| Holding | Holding | Estimated | Holding | Holding | Estimated | ||||||||||||||||||||||||||||||
| (in millions) | Gains | Losses | Fair Value | Gains | Losses | Fair Value | |||||||||||||||||||||||||||||
| NDTF | |||||||||||||||||||||||||||||||||||
| Cash and cash equivalents | $ | — | $ | — | $ | $ | — | $ | — | $ | |||||||||||||||||||||||||
| Equity securities | — | — | |||||||||||||||||||||||||||||||||
| Corporate debt securities | — | — | |||||||||||||||||||||||||||||||||
| U.S. government bonds | — | ||||||||||||||||||||||||||||||||||
| Other debt securities | — | — | — | — | — | ||||||||||||||||||||||||||||||
Total NDTF Investments(a) | $ | $ | $ | $ | $ | $ | |||||||||||||||||||||||||||||
| Other Investments | |||||||||||||||||||||||||||||||||||
| Cash and cash equivalents | $ | — | $ | — | $ | $ | — | $ | — | $ | |||||||||||||||||||||||||
| Municipal bonds | — | — | |||||||||||||||||||||||||||||||||
| Total Other Investments | $ | — | $ | $ | $ | — | $ | — | $ | ||||||||||||||||||||||||||
| Total Investments | $ | $ | $ | $ | $ | $ | |||||||||||||||||||||||||||||
(a) During the years ended December 31, 2023, and 2022, Duke Energy Florida received reimbursements from the NDTF for costs related to ongoing decommissioning activity of Crystal River Unit 3.
Realized gains and losses, which were determined on a specific identification basis, from sales of FV-NI and AFS securities for the years ended December 31, 2023, 2022 and 2021, were immaterial.
DUKE ENERGY INDIANA
The following table presents the estimated fair value of investments in debt and equity securities; equity investments are measured at FV-NI and debt investments are classified as AFS.
| December 31, 2023 | December 31, 2022 | ||||||||||||||||||||||||||||||||||
| Gross | Gross | Gross | Gross | ||||||||||||||||||||||||||||||||
| Unrealized | Unrealized | Unrealized | Unrealized | ||||||||||||||||||||||||||||||||
| Holding | Holding | Estimated | Holding | Holding | Estimated | ||||||||||||||||||||||||||||||
| (in millions) | Gains | Losses | Fair Value | Gains | Losses | Fair Value | |||||||||||||||||||||||||||||
| Investments | |||||||||||||||||||||||||||||||||||
| Cash and cash equivalents | $ | — | $ | — | $ | $ | — | $ | — | $ | |||||||||||||||||||||||||
| Equity securities | — | ||||||||||||||||||||||||||||||||||
| Corporate debt securities | — | — | — | ||||||||||||||||||||||||||||||||
| Municipal bonds | — | ||||||||||||||||||||||||||||||||||
| U.S. government bonds | — | — | — | — | |||||||||||||||||||||||||||||||
| Total Investments | $ | $ | $ | $ | $ | $ | |||||||||||||||||||||||||||||
Realized gains and losses, which were determined on a specific identification basis, from sales of FV-NI and AFS securities for the years ended December 31, 2023, 2022 and 2021, were immaterial.
186
| FINANCIAL STATEMENTS | INVESTMENTS IN DEBT AND EQUITY SECURITIES | ||||
DEBT SECURITY MATURITIES
The table below summarizes the maturity date for debt securities.
| December 31, 2023 | ||||||||||||||||||||
| Duke | Duke | Duke | Duke | |||||||||||||||||
| Duke | Energy | Progress | Energy | Energy | Energy | |||||||||||||||
| (in millions) | Energy | Carolinas | Energy | Progress | Florida | Indiana | ||||||||||||||
| Due in one year or less | $ | $ | $ | $ | $ | $ | ||||||||||||||
| Due after one through five years | ||||||||||||||||||||
| Due after five through 10 years | ||||||||||||||||||||
| Due after 10 years | ||||||||||||||||||||
| Total | $ | $ | $ | $ | $ | $ | ||||||||||||||
17. FAIR VALUE MEASUREMENTS
Fair value is the exchange price to sell an asset or transfer a liability in an orderly transaction between market participants at the measurement date. The fair value definition focuses on an exit price versus the acquisition cost. Fair value measurements use market data or assumptions market participants would use in pricing the asset or liability, including assumptions about risk and the risks inherent in the inputs to the valuation technique. These inputs may be readily observable, corroborated by market data, or generally unobservable. Valuation techniques maximize the use of observable inputs and minimize the use of unobservable inputs. A midmarket pricing convention (the midpoint price between bid and ask prices) is permitted for use as a practical expedient.
Fair value measurements are classified in three levels based on the fair value hierarchy as defined by GAAP. Certain investments are not categorized within the fair value hierarchy. These investments are measured at fair value using the net asset value per share practical expedient. The net asset value is derived based on the investment cost, less any impairment, plus or minus changes resulting from observable price changes for an identical or similar investment of the same issuer.
Fair value accounting guidance permits entities to elect to measure certain financial instruments that are not required to be accounted for at fair value, such as equity method investments or the Company’s own debt, at fair value. The Duke Energy Registrants have not elected to record any of these items at fair value.
Valuation methods of the primary fair value measurements disclosed below are as follows.
Investments in equity securities
The majority of investments in equity securities are valued using Level 1 measurements. Investments in equity securities are typically valued at the closing price in the principal active market as of the last business day of the quarter. Principal active markets for equity prices include published exchanges such as the NYSE and Nasdaq Stock Market. Foreign equity prices are translated from their trading currency using the currency exchange rate in effect at the close of the principal active market. There was no after-hours market activity that was required to be reflected in the reported fair value measurements.
Investments in debt securities
Most investments in debt securities are valued using Level 2 measurements because the valuations use interest rate curves and credit spreads applied to the terms of the debt instrument (maturity and coupon interest rate) and consider the counterparty credit rating. If the market for a particular fixed-income security is relatively inactive or illiquid, the measurement is Level 3.
Commodity derivatives
Commodity derivatives with clearinghouses are classified as Level 1. Commodity derivatives with observable forward curves are classified as Level 2. If forward price curves are not observable for the full term of the contract and the unobservable period had more than an insignificant impact on the valuation, the commodity derivative is classified as Level 3. In isolation, increases (decreases) in natural gas forward prices result in favorable (unfavorable) fair value adjustments for natural gas purchase contracts; and increases (decreases) in electricity forward prices result in unfavorable (favorable) fair value adjustments for electricity sales contracts. Duke Energy regularly evaluates and validates pricing inputs used to estimate the fair value of certain commodity contracts by a market participant price verification procedure. This procedure provides a comparison of internal forward commodity curves to market participant generated curves.
Interest rate derivatives
Most over-the-counter interest rate contract derivatives are valued using financial models that utilize observable inputs for similar instruments and are classified as Level 2. Inputs include forward interest rate curves, notional amounts, interest rates and credit quality of the counterparties.
Foreign currency derivatives
Most over-the-counter foreign currency derivatives are valued using financial models that utilize observable inputs for similar instruments and are classified as Level 2. Inputs include forward foreign currency rate curves, notional amounts, foreign currency rates and credit quality of the counterparties.
Other fair value considerations
See Note 2 for further information on the valuation of the Commercial Renewables Disposal Groups. See Note 12 for a discussion of the valuation of goodwill and intangible assets.
187
| FINANCIAL STATEMENTS | FAIR VALUE MEASUREMENTS | ||||
DUKE ENERGY
The following tables provide recorded balances for assets and liabilities measured at fair value on a recurring basis on the Consolidated Balance Sheets. Derivative amounts in the tables below for all Duke Energy Registrants exclude cash collateral, which is disclosed in Note 15. See Note 16 for additional information related to investments by major security type for the Duke Energy Registrants.
| December 31, 2023 | |||||||||||||||||
| (in millions) | Total Fair Value | Level 1 | Level 2 | Level 3 | Not Categorized | ||||||||||||
| NDTF cash and cash equivalents | $ | $ | $ | — | $ | — | $ | — | |||||||||
| NDTF equity securities | — | — | |||||||||||||||
| NDTF debt securities | — | — | |||||||||||||||
| Other equity securities | — | — | — | ||||||||||||||
| Other debt securities | — | — | |||||||||||||||
| Other cash and cash equivalents | — | — | — | ||||||||||||||
| — | |||||||||||||||||
| Total assets | |||||||||||||||||
| ( | ( | ( | — | — | |||||||||||||
Net assets | $ | $ | $ | $ | $ | ||||||||||||
| December 31, 2022 | |||||||||||||||||
| (in millions) | Total Fair Value | Level 1 | Level 2 | Level 3 | Not Categorized | ||||||||||||
| NDTF cash and cash equivalents | $ | $ | $ | — | $ | — | $ | — | |||||||||
| NDTF equity securities | — | — | |||||||||||||||
| NDTF debt securities | — | — | |||||||||||||||
| Other equity securities | — | — | — | ||||||||||||||
| Other debt securities | — | — | |||||||||||||||
| Other cash and cash equivalents | — | — | — | ||||||||||||||
| — | |||||||||||||||||
| Total assets | |||||||||||||||||
| ( | ( | ( | — | — | |||||||||||||
Net assets | $ | $ | $ | $ | $ | ||||||||||||
The following table provides reconciliations of beginning and ending balances of assets and liabilities measured at fair value using Level 3 measurements.
| Derivatives (net) | |||||||||||
| Years Ended December 31, | |||||||||||
| (in millions) | 2023 | 2022 | |||||||||
| Balance at beginning of period | $ | $ | |||||||||
| Purchases, sales, issuances and settlements: | |||||||||||
| Purchases | |||||||||||
| Settlements | ( | ( | |||||||||
| Total gains (losses) included on the Consolidated Balance Sheet | ( | ||||||||||
| Balance at end of period | $ | $ | |||||||||
188
| FINANCIAL STATEMENTS | FAIR VALUE MEASUREMENTS | ||||
DUKE ENERGY CAROLINAS
The following tables provide recorded balances for assets and liabilities measured at fair value on a recurring basis on the Consolidated Balance Sheets.
| December 31, 2023 | ||||||||||||||
| (in millions) | Total Fair Value | Level 1 | Level 2 | Not Categorized | ||||||||||
| NDTF cash and cash equivalents | $ | $ | $ | — | $ | — | ||||||||
| NDTF equity securities | — | |||||||||||||
| NDTF debt securities | — | |||||||||||||
| Derivative assets | — | — | ||||||||||||
| Total assets | ||||||||||||||
| Derivative liabilities | ( | — | ( | — | ||||||||||
| Net assets | $ | $ | $ | $ | ||||||||||
| December 31, 2022 | ||||||||||||||
| (in millions) | Total Fair Value | Level 1 | Level 2 | Not Categorized | ||||||||||
| NDTF cash and cash equivalents | $ | $ | $ | — | $ | — | ||||||||
| NDTF equity securities | — | |||||||||||||
| NDTF debt securities | — | |||||||||||||
| Derivative assets | — | — | ||||||||||||
| Total assets | ||||||||||||||
| Derivative liabilities | ( | — | ( | — | ||||||||||
| Net assets | $ | $ | $ | $ | ||||||||||
PROGRESS ENERGY
The following table provides recorded balances for assets and liabilities measured at fair value on a recurring basis on the Consolidated Balance Sheets.
| December 31, 2023 | December 31, 2022 | ||||||||||||||||||||||
| (in millions) | Total Fair Value | Level 1 | Level 2 | Total Fair Value | Level 1 | Level 2 | |||||||||||||||||
| NDTF cash and cash equivalents | $ | $ | $ | — | $ | $ | $ | — | |||||||||||||||
| NDTF equity securities | — | — | |||||||||||||||||||||
| NDTF debt securities | |||||||||||||||||||||||
| Other debt securities | — | — | |||||||||||||||||||||
| Other cash and cash equivalents | — | — | |||||||||||||||||||||
| Derivative assets | — | — | |||||||||||||||||||||
| Total assets | |||||||||||||||||||||||
| Derivative liabilities | ( | — | ( | ( | — | ( | |||||||||||||||||
| Net assets | $ | $ | $ | $ | $ | $ | |||||||||||||||||
189
| FINANCIAL STATEMENTS | FAIR VALUE MEASUREMENTS | ||||
DUKE ENERGY PROGRESS
The following table provides recorded balances for assets and liabilities measured at fair value on a recurring basis on the Consolidated Balance Sheets.
| December 31, 2023 | December 31, 2022 | ||||||||||||||||||||||
| (in millions) | Total Fair Value | Level 1 | Level 2 | Total Fair Value | Level 1 | Level 2 | |||||||||||||||||
| NDTF cash and cash equivalents | $ | $ | $ | — | $ | $ | $ | — | |||||||||||||||
| NDTF equity securities | — | — | |||||||||||||||||||||
| NDTF debt securities | |||||||||||||||||||||||
| Other cash and cash equivalents | — | — | |||||||||||||||||||||
| Derivative assets | — | — | |||||||||||||||||||||
| Total assets | |||||||||||||||||||||||
| Derivative liabilities | ( | — | ( | ( | — | ( | |||||||||||||||||
| Net assets | $ | $ | $ | $ | $ | $ | |||||||||||||||||
DUKE ENERGY FLORIDA
The following table provides recorded balances for assets and liabilities measured at fair value on a recurring basis on the Consolidated Balance Sheets.
| December 31, 2023 | December 31, 2022 | ||||||||||||||||||||||
| (in millions) | Total Fair Value | Level 1 | Level 2 | Total Fair Value | Level 1 | Level 2 | |||||||||||||||||
| NDTF cash and cash equivalents | $ | $ | $ | — | $ | $ | $ | — | |||||||||||||||
| NDTF equity securities | — | — | |||||||||||||||||||||
| NDTF debt securities | |||||||||||||||||||||||
| Other debt securities | — | — | |||||||||||||||||||||
| Other cash and cash equivalents | — | — | |||||||||||||||||||||
| Derivative assets | — | — | |||||||||||||||||||||
| Total assets | |||||||||||||||||||||||
| Derivative liabilities | ( | — | ( | ( | — | ( | |||||||||||||||||
| Net assets | $ | $ | $ | $ | $ | $ | |||||||||||||||||
DUKE ENERGY OHIO
The recorded balances for assets and liabilities measured at fair value on a recurring basis on the Consolidated Balance Sheets were not material at December 31, 2023, and 2022.
DUKE ENERGY INDIANA
The following table provides recorded balances for assets and liabilities measured at fair value on a recurring basis on the Consolidated Balance Sheets.
| December 31, 2023 | December 31, 2022 | ||||||||||||||||||||||||||||
| (in millions) | Total Fair Value | Level 1 | Level 2 | Level 3 | Total Fair Value | Level 1 | Level 2 | Level 3 | |||||||||||||||||||||
| Other equity securities | $ | $ | $ | — | $ | — | $ | $ | $ | — | $ | — | |||||||||||||||||
| Other debt securities | — | — | — | — | |||||||||||||||||||||||||
| Other cash equivalents | — | — | — | — | |||||||||||||||||||||||||
| Derivative assets | — | ||||||||||||||||||||||||||||
| Total assets | |||||||||||||||||||||||||||||
| Derivative liabilities | ( | ( | — | — | ( | ( | — | — | |||||||||||||||||||||
| Net assets | $ | $ | $ | $ | $ | $ | $ | $ | |||||||||||||||||||||
190
| FINANCIAL STATEMENTS | FAIR VALUE MEASUREMENTS | ||||
The following table provides a reconciliation of beginning and ending balances of assets and liabilities measured at fair value using Level 3 measurements.
| Derivatives (net) | |||||||||||
| Years Ended December 31, | |||||||||||
| (in millions) | 2023 | 2022 | |||||||||
| Balance at beginning of period | $ | $ | |||||||||
| Purchases, sales, issuances and settlements: | |||||||||||
| Purchases | |||||||||||
| Settlements | ( | ( | |||||||||
Total gains (losses) included on the Consolidated Balance Sheet | ( | ||||||||||
| Balance at end of period | $ | $ | |||||||||
PIEDMONT
The following table provides recorded balances for assets and liabilities measured at fair value on a recurring basis on the Consolidated Balance Sheets.
| December 31, 2023 | December 31, 2022 | ||||||||||||||||||||||
| (in millions) | Total Fair Value | Level 1 | Level 2 | Total Fair Value | Level 1 | Level 2 | |||||||||||||||||
| Derivative assets | $ | $ | $ | — | $ | — | $ | — | $ | — | |||||||||||||
| Derivative liabilities | ( | — | ( | ( | — | ( | |||||||||||||||||
| Net (liabilities) assets | $ | ( | $ | $ | ( | $ | ( | $ | — | $ | ( | ||||||||||||
QUANTITATIVE INFORMATION ABOUT UNOBSERVABLE INPUTS
The following tables include quantitative information about the Duke Energy Registrants' derivatives classified as Level 3.
| December 31, 2023 | |||||||||||||||||||||||
| Weighted | |||||||||||||||||||||||
| Fair Value | Average | ||||||||||||||||||||||
| Investment Type | (in millions) | Valuation Technique | Unobservable Input | Range | Range | ||||||||||||||||||
| Duke Energy Ohio | |||||||||||||||||||||||
| FTRs | $ | RTO auction pricing | FTR price – per MWh | $ | – | $ | $ | ||||||||||||||||
| Duke Energy Indiana | |||||||||||||||||||||||
| FTRs | RTO auction pricing | FTR price – per MWh | ( | – | |||||||||||||||||||
| Duke Energy | |||||||||||||||||||||||
| Total Level 3 derivatives | $ | ||||||||||||||||||||||
| December 31, 2022 | |||||||||||||||||||||||
| Weighted | |||||||||||||||||||||||
| Fair Value | Average | ||||||||||||||||||||||
| Investment Type | (in millions) | Valuation Technique | Unobservable Input | Range | Range | ||||||||||||||||||
| Duke Energy Ohio | |||||||||||||||||||||||
| FTRs | $ | RTO auction pricing | FTR price – per MWh | $ | – | $ | $ | ||||||||||||||||
| Duke Energy Indiana | |||||||||||||||||||||||
| FTRs | RTO auction pricing | FTR price – per MWh | – | ||||||||||||||||||||
| Duke Energy | |||||||||||||||||||||||
| Total Level 3 derivatives | $ | ||||||||||||||||||||||
191
| FINANCIAL STATEMENTS | FAIR VALUE MEASUREMENTS | ||||
OTHER FAIR VALUE DISCLOSURES
The fair value and book value of long-term debt, including current maturities, is summarized in the following table. Estimates determined are not necessarily indicative of amounts that could have been settled in current markets. Fair value of long-term debt uses Level 2 measurements.
| December 31, 2023 | December 31, 2022 | ||||||||||||||||||||||
| (in millions) | Book Value | Fair Value | Book Value | Fair Value | |||||||||||||||||||
Duke Energy(a) | $ | $ | $ | $ | |||||||||||||||||||
| Duke Energy Carolinas | |||||||||||||||||||||||
| Progress Energy | |||||||||||||||||||||||
| Duke Energy Progress | |||||||||||||||||||||||
| Duke Energy Florida | |||||||||||||||||||||||
| Duke Energy Ohio | |||||||||||||||||||||||
| Duke Energy Indiana | |||||||||||||||||||||||
| Piedmont | |||||||||||||||||||||||
(a) Book value of long-term debt includes $1.0 billion as of December 31, 2023, and $1.2 billion as of December 31, 2022, of unamortized debt discount and premium, net in purchase accounting adjustments related to the mergers with Progress Energy and Piedmont that are excluded from fair value of long-term debt.
At both December 31, 2023, and December 31, 2022, fair value of cash and cash equivalents, accounts and notes receivable, accounts payable, notes payable and commercial paper, and nonrecourse notes payable of VIEs are not materially different from their carrying amounts because of the short-term nature of these instruments and/or because the stated rates approximate market rates.
18. VARIABLE INTEREST ENTITIES
A Variable Interest Entity (VIE) is an entity that is evaluated for consolidation using more than a simple analysis of voting control. The analysis to determine whether an entity is a VIE considers contracts with an entity, credit support for an entity, the adequacy of the equity investment of an entity and the relationship of voting power to the amount of equity invested in an entity. This analysis is performed either upon the creation of a legal entity or upon the occurrence of an event requiring reevaluation, such as a significant change in an entity’s assets or activities. A qualitative analysis of control determines the party that consolidates a VIE. This assessment is based on (i) what party has the power to direct the activities of the VIE that most significantly impact its economic performance and (ii) what party has rights to receive benefits or is obligated to absorb losses that could potentially be significant to the VIE. The analysis of the party that consolidates a VIE is a continual reassessment.
CONSOLIDATED VIEs
The obligations of the consolidated VIEs discussed in the following paragraphs are nonrecourse to the Duke Energy Registrants. The registrants have no requirement to provide liquidity to, purchase assets of or guarantee performance of these VIEs unless noted in the following paragraphs.
Receivables Financing – DERF/DEPR/DEFR
DERF, DEPR and DEFR are bankruptcy remote, special purpose subsidiaries of Duke Energy Carolinas, Duke Energy Progress and Duke Energy Florida, respectively. DERF, DEPR and DEFR are wholly owned LLCs with separate legal existence from their parent companies, and their assets are not generally available to creditors of their parent companies. On a revolving basis, DERF, DEPR and DEFR buy certain accounts receivable arising from the sale of electricity and related services from their parent companies.
DERF, DEPR and DEFR borrow amounts under credit facilities to buy these receivables. Borrowing availability from the credit facilities is limited to the amount of qualified receivables purchased, which generally exclude receivables past due more than a predetermined number of days and reserves for expected past-due balances. The sole source of funds to satisfy the related debt obligations is cash collections from the receivables. Amounts borrowed under the DERF and DEPR credit facilities are reflected on the Consolidated Balance Sheets as Long-Term Debt. Amounts borrowed under the DEFR credit facility are reflected on the Consolidated Balance Sheets as Current maturities of long-term debt.
The most significant activity that impacts the economic performance of DERF, DEPR and DEFR are the decisions made to manage delinquent receivables. Duke Energy Carolinas, Duke Energy Progress and Duke Energy Florida are considered the primary beneficiaries and consolidate DERF, DEPR and DEFR, respectively, as they make those decisions.
Receivables Financing – CRC
CRC is a bankruptcy remote, special purpose entity indirectly owned by Duke Energy. On a revolving basis, CRC buys certain accounts receivable arising from the sale of electricity, natural gas and related services from Duke Energy Ohio and Duke Energy Indiana. CRC borrows amounts under a credit facility to buy the receivables from Duke Energy Ohio and Duke Energy Indiana. Borrowing availability from the credit facility is limited to the amount of qualified receivables sold to CRC, which generally exclude receivables past due more than a predetermined number of days and reserves for expected past-due balances. The sole source of funds to satisfy the related debt obligation is cash collections from the receivables. Amounts borrowed under the credit facility are reflected on Duke Energy's Consolidated Balance Sheets as Long-Term Debt.
192
| FINANCIAL STATEMENTS | VARIABLE INTEREST ENTITIES | ||||
The proceeds Duke Energy Ohio and Duke Energy Indiana receive from the sale of receivables to CRC are approximately 75 % cash and 25 % in the form of a subordinated note from CRC. The subordinated note is a retained interest in the receivables sold. Depending on collection experience, additional equity infusions to CRC may be required by Duke Energy to maintain a minimum equity balance of $3 million.
CRC is considered a VIE because (i) equity capitalization is insufficient to support its operations, (ii) power to direct the activities that most significantly impact the economic performance of the entity is not held by the equity holder and (iii) deficiencies in net worth of CRC are funded by Duke Energy. The most significant activities that impact the economic performance of CRC are decisions made to manage delinquent receivables. Duke Energy is considered the primary beneficiary and consolidates CRC as it makes these decisions. Neither Duke Energy Ohio nor Duke Energy Indiana consolidate CRC.
Receivables Financing – Credit Facilities
The following table summarizes the amounts and expiration dates of the credit facilities and associated restricted receivables described above.
| Duke Energy | |||||||||||||||||||||||
| Duke Energy | Duke Energy | Duke Energy | |||||||||||||||||||||
| Carolinas | Progress | Florida | |||||||||||||||||||||
| (in millions) | CRC | DERF | DEPR | DEFR | |||||||||||||||||||
| Expiration date | February 2025 | January 2025 | April 2025 | April 2024 | |||||||||||||||||||
| Credit facility amount | $ | $ | $ | $ | |||||||||||||||||||
| Amounts borrowed at December 31, 2023 | |||||||||||||||||||||||
| Amounts borrowed at December 31, 2022 | |||||||||||||||||||||||
| Restricted Receivables at December 31, 2023 | |||||||||||||||||||||||
| Restricted Receivables at December 31, 2022 | |||||||||||||||||||||||
Nuclear Asset-Recovery Bonds – Duke Energy Florida Project Finance
Duke Energy Florida Project Finance, LLC (DEFPF) is a bankruptcy remote, wholly owned special purpose subsidiary of Duke Energy Florida. DEFPF was formed in 2016 for the sole purpose of issuing nuclear asset-recovery bonds to finance Duke Energy Florida's unrecovered regulatory asset related to Crystal River Unit 3.
In 2016, DEFPF issued senior secured bonds and used the proceeds to acquire nuclear asset-recovery property from Duke Energy Florida. The nuclear asset-recovery property acquired includes the right to impose, bill, collect and adjust a non-bypassable nuclear asset-recovery charge from all Duke Energy Florida retail customers until the bonds are paid in full and all financing costs have been recovered. The nuclear asset-recovery bonds are secured by the nuclear asset-recovery property and cash collections from the nuclear asset-recovery charges are the sole source of funds to satisfy the debt obligation. The bondholders have no recourse to Duke Energy Florida.
DEFPF is considered a VIE primarily because the equity capitalization is insufficient to support its operations. Duke Energy Florida has the power to direct the significant activities of the VIE as described above and therefore Duke Energy Florida is considered the primary beneficiary and consolidates DEFPF.
The following table summarizes the impact of DEFPF on Duke Energy Florida's Consolidated Balance Sheets.
| December 31, | ||||||||
| (in millions) | 2023 | 2022 | ||||||
| Receivables of VIEs | $ | — | $ | |||||
| Regulatory Assets: Current | ||||||||
| Current Assets: Other | ||||||||
| Other Noncurrent Assets: Regulatory assets | ||||||||
| Current Liabilities: Other | ||||||||
| Current maturities of long-term debt | ||||||||
| Long-Term Debt | ||||||||
Storm Recovery Bonds – Duke Energy Carolinas NC Storm Funding and Duke Energy Progress NC Storm Funding
Duke Energy Carolinas NC Storm Funding, LLC. (DECNCSF) and Duke Energy Progress NC Storm Funding, LLC. (DEPNCSF) are bankruptcy remote, wholly owned special purpose subsidiaries of Duke Energy Carolinas and Duke Energy Progress, respectively. These entities were formed in 2021 for the sole purpose of issuing storm recovery bonds to finance certain of Duke Energy Carolinas’ and Duke Energy Progress’ unrecovered regulatory assets related to storm costs.
In November 2021, DECNCSF and DEPNCSF issued $237 million and $770 million of senior secured bonds, respectively and used the proceeds to acquire storm recovery property from Duke Energy Carolinas and Duke Energy Progress. The storm recovery property was created by state legislation and NCUC financing orders for the purpose of financing storm costs incurred in 2018 and 2019. The storm recovery property acquired includes the right to impose, bill, collect and adjust a non-bypassable charge from all Duke Energy Carolinas’ and Duke Energy Progress’ retail customers until the bonds are paid in full and all financing costs have been recovered. The storm recovery bonds are secured by the storm recovery property and cash collections from the storm recovery charges are the sole source of funds to satisfy the debt obligation. The bondholders have no recourse to Duke Energy Carolinas or Duke Energy Progress.
193
| FINANCIAL STATEMENTS | VARIABLE INTEREST ENTITIES | ||||
DECNCSF and DEPNCSF are considered VIEs primarily because the equity capitalization is insufficient to support their operations. Duke Energy Carolinas and Duke Energy Progress have the power to direct the significant activities of the VIEs as described above and therefore Duke Energy Carolinas and Duke Energy Progress are considered the primary beneficiaries and consolidate DECNCSF and DEPNCSF, respectively.
The following table summarizes the impact of these VIEs on Duke Energy Carolinas’ and Duke Energy Progress’ Consolidated Balance Sheets.
| Duke Energy Carolinas | Duke Energy Progress | |||||||||||||
| December 31, | December 31, | |||||||||||||
| (in millions) | 2023 | 2022 | 2023 | 2022 | ||||||||||
| Regulatory Assets: Current | $ | $ | $ | $ | ||||||||||
| Current Assets: Other | ||||||||||||||
| Other Noncurrent Assets: Regulatory assets | ||||||||||||||
| Other Noncurrent Assets: Other | ||||||||||||||
| Current maturities of long-term debt | ||||||||||||||
| Current Liabilities: Other | ||||||||||||||
| Long-Term Debt | ||||||||||||||
Purchasing Company – Duke Energy Florida
Duke Energy Florida Purchasing Company, LLC (DEF ProCo) is a wholly owned special purpose subsidiary of Duke Energy Florida. DEF ProCo was formed in 2023 as the primary procurement agent for equipment, materials and supplies for Duke Energy Florida. DEF ProCo interacts with third party suppliers on Duke Energy Florida’s behalf with credit and risk support provided by Duke Energy Florida. DEF ProCo is a qualified reseller under Florida tax law and conveys acquired assets to Duke Energy Florida through leases on each acquired asset.
As of December 31, 2023, Duke Energy Florida’s Consolidated Balance Sheets included Inventory and Accounts Payable for DEF ProCo of $462 million and $188 million, respectively.
NON-CONSOLIDATED VIEs
The following tables summarize the impact of non-consolidated VIEs on the Consolidated Balance Sheets.
| December 31, 2023 | |||||||||||||||||
| Duke Energy | Duke | Duke | |||||||||||||||
| Natural Gas | Energy | Energy | |||||||||||||||
| (in millions) | Investments | Ohio | Indiana | ||||||||||||||
| Receivables from affiliated companies | $ | — | $ | $ | |||||||||||||
| Investments in equity method unconsolidated affiliates | — | — | |||||||||||||||
| Other noncurrent assets | — | — | |||||||||||||||
| Total assets | $ | $ | $ | ||||||||||||||
| Other current liabilities | — | — | |||||||||||||||
| Other noncurrent liabilities | — | — | |||||||||||||||
| Total liabilities | $ | — | $ | — | |||||||||||||
Net assets | $ | $ | $ | ||||||||||||||
| December 31, 2022 | |||||||||||||||||
| Duke Energy | Duke | Duke | |||||||||||||||
| Natural Gas | Energy | Energy | |||||||||||||||
| (in millions) | Investments | Ohio | Indiana | ||||||||||||||
| Receivables from affiliated companies | $ | — | $ | $ | |||||||||||||
| Investments in equity method unconsolidated affiliates | — | — | |||||||||||||||
| Other noncurrent assets | — | — | |||||||||||||||
| Total assets | $ | $ | $ | ||||||||||||||
| Other current liabilities | — | — | |||||||||||||||
| Other noncurrent liabilities | — | — | |||||||||||||||
| Total liabilities | $ | $ | — | $ | — | ||||||||||||
| Net (liabilities) assets | $ | ( | $ | $ | |||||||||||||
The Duke Energy Registrants are not aware of any situations where the maximum exposure to loss significantly exceeds the carrying values shown above.
194
| FINANCIAL STATEMENTS | VARIABLE INTEREST ENTITIES | ||||
Natural Gas Investments
Duke Energy has investments in various joint ventures including pipeline and renewable natural gas projects. These entities are considered VIEs due to having insufficient equity to finance their own activities without subordinated financial support. Duke Energy does not have the power to direct the activities that most significantly impact the economic performance, the obligation to absorb losses or the right to receive benefits of these VIEs and therefore does not consolidate these entities.
CRC
See discussion under Consolidated VIEs for additional information related to CRC.
Amounts included in Receivables from affiliated companies in the above table for Duke Energy Ohio and Duke Energy Indiana reflect their retained interest in receivables sold to CRC. These subordinated notes held by Duke Energy Ohio and Duke Energy Indiana are stated at fair value. Carrying values of retained interests are determined by allocating carrying value of the receivables between assets sold and interests retained based on relative fair value. The allocated bases of the subordinated notes are not materially different than their face value because (i) the receivables generally turnover in less than two months, (ii) credit losses are reasonably predictable due to the broad customer base and lack of significant concentration and (iii) the equity in CRC is subordinate to all retained interests and thus would absorb losses first. The hypothetical effect on fair value of the retained interests assuming both a 10 % and a 20 % unfavorable variation in credit losses or discount rates is not material due to the short turnover of receivables and historically low credit loss history. Interest accrues to Duke Energy Ohio and Duke Energy Indiana on the retained interests using the acceptable yield method. This method generally approximates the stated rate on the notes since the allocated basis and the face value are nearly equivalent. An impairment charge is recorded against the carrying value of both retained interests and purchased beneficial interest whenever it is determined that an other-than-temporary impairment has occurred.
Key assumptions used in estimating fair value are detailed in the following table.
| Duke Energy Ohio | Duke Energy Indiana | ||||||||||||||||||||||
| 2023 | 2022 | 2023 | 2022 | ||||||||||||||||||||
| Anticipated credit loss ratio | % | % | % | % | |||||||||||||||||||
| Discount rate | % | % | % | % | |||||||||||||||||||
| Receivable turnover rate | % | % | % | % | |||||||||||||||||||
The following table shows the gross and net receivables sold.
| Duke Energy Ohio | Duke Energy Indiana | ||||||||||||||||||||||
| December 31, | December 31, | ||||||||||||||||||||||
| (in millions) | 2023 | 2022 | 2023 | 2022 | |||||||||||||||||||
| Receivables sold | $ | $ | $ | $ | |||||||||||||||||||
| Less: Retained interests | |||||||||||||||||||||||
| Net receivables sold | $ | $ | $ | $ | |||||||||||||||||||
The following table shows sales and cash flows related to receivables sold.
| Duke Energy Ohio | Duke Energy Indiana | ||||||||||||||||||||||||||||||||||
| Years Ended December 31, | Years Ended December 31, | ||||||||||||||||||||||||||||||||||
| (in millions) | 2023 | 2022 | 2021 | 2023 | 2022 | 2021 | |||||||||||||||||||||||||||||
| Sales | |||||||||||||||||||||||||||||||||||
| Receivables sold | $ | $ | $ | $ | $ | $ | |||||||||||||||||||||||||||||
| Loss recognized on sale | |||||||||||||||||||||||||||||||||||
| Cash flows | |||||||||||||||||||||||||||||||||||
| Cash proceeds from receivables sold | |||||||||||||||||||||||||||||||||||
| Collection fees received | |||||||||||||||||||||||||||||||||||
| Return received on retained interests | |||||||||||||||||||||||||||||||||||
Cash flows from sales of receivables are reflected within Cash Flows From Operating Activities and Cash Flows from Investing Activities on Duke Energy Ohio’s and Duke Energy Indiana’s Consolidated Statements of Cash Flows.
Collection fees received in connection with servicing transferred accounts receivable are included in Operation, maintenance and other on Duke Energy Ohio’s and Duke Energy Indiana’s Consolidated Statements of Operations and Comprehensive Income. The loss recognized on sales of receivables is calculated monthly by multiplying receivables sold during the month by the required discount. The required discount is derived monthly utilizing a three-year weighted average formula that considers charge-off history, late charge history and turnover history on the sold receivables, as well as a component for the time value of money. The discount rate, or component for the time value of money, is the prior month-end Daily Simple SOFR plus a fixed rate of 1 %.
195
| FINANCIAL STATEMENTS | REVENUE | ||||
19. REVENUE
Duke Energy recognizes revenue consistent with amounts billed under tariff offerings or at contractually agreed upon rates based on actual physical delivery of electric or natural gas service, including estimated volumes delivered when billings have not yet occurred. As such, the majority of Duke Energy’s revenues have fixed pricing based on the contractual terms of the published tariffs. Absent decoupling mechanisms, the variability in expected cash flows of the majority of Duke Energy's revenue is attributable to the customer’s volumetric demand and ultimate quantities of energy or natural gas supplied and used during the billing period. The stand-alone selling price of related sales are designed to support recovery of prudently incurred costs and an appropriate return on invested assets and are primarily governed by published tariff rates or contractual agreements approved by relevant regulatory bodies. As described in Note 1, certain excise taxes and franchise fees levied by state or local governments are required to be paid even if not collected from the customer. These taxes are recognized on a gross basis as part of revenues. Duke Energy elects to account for all other taxes net of revenues.
Performance obligations are satisfied over time as energy or natural gas is delivered and consumed with billings generally occurring monthly and related payments due within 30 days, depending on regulatory requirements. In no event does the timing between payment and delivery of the goods and services exceed one year. Using this output method for revenue recognition provides a faithful depiction of the transfer of electric and natural gas service as customers obtain control of the commodity and benefit from its use at delivery. Additionally, Duke Energy has an enforceable right to consideration for energy or natural gas delivered at any discrete point in time and will recognize revenue at an amount that reflects the consideration to which Duke Energy is entitled for the energy or natural gas delivered.
As described above, the majority of Duke Energy’s tariff revenues are at will and, as such, related contracts with customers have an expected duration of one year or less and will not have future performance obligations for disclosure. Additionally, other long-term revenue streams, including wholesale contracts, generally provide services that are part of a single performance obligation, the delivery of electricity or natural gas. As such, other than material fixed consideration under long-term contracts, related disclosures for future performance obligations are also not applicable.
Duke Energy earns substantially all of its revenues through its reportable segments, EU&I and GU&I.
Electric Utilities and Infrastructure
EU&I earns the majority of its revenues through retail and wholesale electric service through the generation, transmission, distribution and sale of electricity. Duke Energy generally provides retail and wholesale electric service customers with their full electric load requirements or with supplemental load requirements when the customer has other sources of electricity.
Retail electric service is generally marketed throughout Duke Energy’s electric service territory through standard service offers. The standard service offers are through tariffs determined by regulators in Duke Energy's regulated service territory. Each tariff, which is assigned to customers based on customer class, has multiple components such as an energy charge, a demand charge, a basic facilities charge and applicable riders. Duke Energy considers each of these components to be aggregated into a single performance obligation for providing electric service, or in the case of distribution only customers in Duke Energy Ohio, for delivering electricity. Electricity is considered a single performance obligation satisfied over time consistent with the series guidance and is provided and consumed over the billing period, generally one month. Retail electric service is typically provided to at-will customers who can cancel service at any time, without a substantive penalty. Additionally, Duke Energy adheres to applicable regulatory requirements in each jurisdiction to ensure the collectability of amounts billed and appropriate mitigating procedures are followed when necessary. As such, revenue from contracts with customers for such contracts is equivalent to the electricity supplied and billed in that period (including unbilled estimates).
Wholesale electric service is generally provided under long-term contracts using cost-based pricing. FERC regulates costs that may be recovered from customers and the amount of return companies are permitted to earn. Wholesale contracts include both energy and demand charges. For full requirements contracts, Duke Energy considers both charges as a single performance obligation for providing integrated electric service. For contracts where energy and demand charges are considered separate performance obligations, energy and demand are each a distinct performance obligation under the series guidance and are satisfied as energy is delivered and stand-ready service is provided on a monthly basis. This service represents consumption over the billing period and revenue is recognized consistent with billings and unbilled estimates, which generally occur monthly. Contractual amounts owed are typically trued up annually based upon incurred costs in accordance with FERC published filings and the specific customer’s actual peak demand. Estimates of variable consideration related to potential additional billings or refunds owed are updated quarterly.
The majority of wholesale revenues are full requirements contracts where the customers purchase the substantial majority of their energy needs and do not have a fixed quantity of contractually required energy or capacity. As such, related forecasted revenues are considered optional purchases. Supplemental requirements contracts that include contracted blocks of energy and capacity at contractually fixed prices have the following estimated remaining performance obligations:
| Remaining Performance Obligations | |||||||||||||||||||||||
| (in millions) | 2024 | 2025 | 2026 | 2027 | 2028 | Thereafter | Total | ||||||||||||||||
| Progress Energy | $ | $ | $ | $ | $ | $ | $ | ||||||||||||||||
| Duke Energy Progress | — | — | — | — | — | ||||||||||||||||||
| Duke Energy Florida | |||||||||||||||||||||||
| Duke Energy Indiana | — | ||||||||||||||||||||||
Revenues for block sales are recognized monthly as energy is delivered and stand-ready service is provided, consistent with invoiced amounts and unbilled estimates.
196
| FINANCIAL STATEMENTS | REVENUE | ||||
Gas Utilities and Infrastructure
GU&I earns its revenue through retail and wholesale natural gas service through the transportation, distribution and sale of natural gas. Duke Energy generally provides retail and wholesale natural gas service customers with all natural gas load requirements. Additionally, while natural gas can be stored, substantially all natural gas provided by Duke Energy is consumed by customers simultaneously with receipt of delivery.
Retail natural gas service is marketed throughout Duke Energy's natural gas service territory using published tariff rates. The tariff rates are established by regulators in Duke Energy's service territories. Each tariff, which is assigned to customers based on customer class, have multiple components, such as a commodity charge, demand charge, customer or monthly charge and transportation costs. Duke Energy considers each of these components to be aggregated into a single performance obligation for providing natural gas service. For contracts where Duke Energy provides all of the customer’s natural gas needs, the delivery of natural gas is considered a single performance obligation satisfied over time, and revenue is recognized monthly based on billings and unbilled estimates as service is provided and the commodity is consumed over the billing period. Additionally, natural gas service is typically at will and customers can cancel service at any time, without a substantive penalty. Duke Energy also adheres to applicable regulatory requirements to ensure the collectability of amounts billed and receivable and appropriate mitigating procedures are followed when necessary.
Certain long-term individually negotiated contracts exist to provide natural gas service. These contracts are regulated and approved by state commissions. The negotiated contracts may have multiple components, including a natural gas and a demand charge, similar to retail natural gas contracts. Duke Energy considers each of these components to be a single performance obligation for providing natural gas service. This service represents consumption over the billing period, generally one month.
Fixed capacity payments under long-term contracts for the GU&I segment include minimum margin contracts and supply arrangements with municipalities and power generation facilities. Revenues for related sales are recognized monthly as natural gas is delivered and stand-ready service is provided, consistent with invoiced amounts and unbilled estimates. Estimated remaining performance obligations are as follows:
| Remaining Performance Obligations | |||||||||||||||||||||||
| (in millions) | 2024 | 2025 | 2026 | 2027 | 2028 | Thereafter | Total | ||||||||||||||||
| Piedmont | $ | $ | $ | $ | $ | $ | $ | ||||||||||||||||
Other
The remainder of Duke Energy’s operations is presented as Other, which does not include material revenues from contracts with customers.
197
| FINANCIAL STATEMENTS | REVENUE | ||||
Disaggregated Revenues
For the EU&I and GU&I segments, revenue by customer class is most meaningful to Duke Energy as each respective customer class collectively represents unique customer expectations of service, generally has different energy and demand requirements, and operates under tailored, regulatory approved pricing structures. Additionally, each customer class is impacted differently by weather and a variety of economic factors including the level of population growth, economic investment, employment levels, and regulatory activities in each of Duke Energy’s jurisdictions. As such, analyzing revenues disaggregated by customer class allows Duke Energy to understand the nature, amount, timing and uncertainty of revenue and cash flows arising from contracts with customers. Disaggregated revenues are presented as follows:
| Year Ended December 31, 2023 | ||||||||||||||||||||||||||
| Duke | Duke | Duke | Duke | Duke | ||||||||||||||||||||||
| (in millions) | Duke | Energy | Progress | Energy | Energy | Energy | Energy | |||||||||||||||||||
| By market or type of customer | Energy | Carolinas | Energy | Progress | Florida | Ohio | Indiana | Piedmont | ||||||||||||||||||
| Electric Utilities and Infrastructure | ||||||||||||||||||||||||||
| Residential | $ | $ | $ | $ | $ | $ | $ | $ | — | |||||||||||||||||
| General | — | |||||||||||||||||||||||||
| Industrial | — | |||||||||||||||||||||||||
| Wholesale | — | |||||||||||||||||||||||||
| Other revenues | — | |||||||||||||||||||||||||
| Total Electric Utilities and Infrastructure revenue from contracts with customers | $ | $ | $ | $ | $ | $ | $ | $ | — | |||||||||||||||||
| Gas Utilities and Infrastructure | ||||||||||||||||||||||||||
| Residential | $ | $ | — | $ | — | $ | — | $ | — | $ | $ | — | $ | |||||||||||||
| Commercial | — | — | — | — | — | |||||||||||||||||||||
| Industrial | — | — | — | — | — | |||||||||||||||||||||
| Power Generation | — | — | — | — | — | — | — | |||||||||||||||||||
| Other revenues | — | — | — | — | — | |||||||||||||||||||||
| Total Gas Utilities and Infrastructure revenue from contracts with customers | $ | $ | — | $ | — | $ | — | $ | — | $ | $ | — | $ | |||||||||||||
Other | ||||||||||||||||||||||||||
| Revenue from contracts with customers | $ | $ | — | $ | — | $ | — | $ | — | $ | — | $ | — | $ | — | |||||||||||
| Total revenue from contracts with customers | $ | $ | $ | $ | $ | $ | $ | $ | ||||||||||||||||||
Other revenue sources(a) | $ | $ | $ | $ | $ | $ | $ | $ | ||||||||||||||||||
| Total revenues | $ | $ | $ | $ | $ | $ | $ | $ | ||||||||||||||||||
(a) Other revenue sources include revenues from leases, derivatives and alternative revenue programs that are not considered revenues from contracts with customers. Alternative revenue programs in certain jurisdictions include regulatory mechanisms that periodically adjust for over or under collection of related revenues.
198
| FINANCIAL STATEMENTS | REVENUE | ||||
| Year Ended December 31, 2022 | ||||||||||||||||||||||||||
| Duke | Duke | Duke | Duke | Duke | ||||||||||||||||||||||
| (in millions) | Duke | Energy | Progress | Energy | Energy | Energy | Energy | |||||||||||||||||||
| By market or type of customer | Energy | Carolinas | Energy | Progress | Florida | Ohio | Indiana | Piedmont | ||||||||||||||||||
| Electric Utilities and Infrastructure | ||||||||||||||||||||||||||
| Residential | $ | $ | $ | $ | $ | $ | $ | $ | — | |||||||||||||||||
| General | — | |||||||||||||||||||||||||
| Industrial | — | |||||||||||||||||||||||||
| Wholesale | — | |||||||||||||||||||||||||
| Other revenues | — | |||||||||||||||||||||||||
| Total Electric Utilities and Infrastructure revenue from contracts with customers | $ | $ | $ | $ | $ | $ | $ | $ | — | |||||||||||||||||
| Gas Utilities and Infrastructure | ||||||||||||||||||||||||||
| Residential | $ | $ | — | $ | — | $ | — | $ | — | $ | $ | — | $ | |||||||||||||
| Commercial | — | — | — | — | — | |||||||||||||||||||||
| Industrial | — | — | — | — | — | |||||||||||||||||||||
| Power Generation | — | — | — | — | — | — | — | |||||||||||||||||||
| Other revenues | — | — | — | — | — | |||||||||||||||||||||
| Total Gas Utilities and Infrastructure revenue from contracts with customers | $ | $ | — | $ | — | $ | — | $ | — | $ | $ | — | $ | |||||||||||||
Other | ||||||||||||||||||||||||||
| Revenue from contracts with customers | $ | $ | — | $ | — | $ | — | $ | — | $ | — | $ | — | $ | — | |||||||||||
| Total revenue from contracts with customers | $ | $ | $ | $ | $ | $ | $ | $ | ||||||||||||||||||
Other revenue sources(a) | $ | $ | $ | $ | $ | $ | $ | $ | ||||||||||||||||||
| Total revenues | $ | $ | $ | $ | $ | $ | $ | $ | ||||||||||||||||||
(a) Other revenue sources include revenues from leases, derivatives and alternative revenue programs that are not considered revenues from contracts with customers. Alternative revenue programs in certain jurisdictions include regulatory mechanisms that periodically adjust for over or under collection of related revenues.
199
| FINANCIAL STATEMENTS | REVENUE | ||||
| Year Ended December 31, 2021 | ||||||||||||||||||||||||||
| Duke | Duke | Duke | Duke | Duke | ||||||||||||||||||||||
| (in millions) | Duke | Energy | Progress | Energy | Energy | Energy | Energy | |||||||||||||||||||
| By market or type of customer | Energy | Carolinas | Energy | Progress | Florida | Ohio | Indiana | Piedmont | ||||||||||||||||||
| Electric Utilities and Infrastructure | ||||||||||||||||||||||||||
| Residential | $ | $ | $ | $ | $ | $ | $ | $ | — | |||||||||||||||||
| General | — | |||||||||||||||||||||||||
| Industrial | — | |||||||||||||||||||||||||
| Wholesale | — | |||||||||||||||||||||||||
| Other revenues | — | |||||||||||||||||||||||||
| Total Electric Utilities and Infrastructure revenue from contracts with customers | $ | $ | $ | $ | $ | $ | $ | $ | — | |||||||||||||||||
| Gas Utilities and Infrastructure | ||||||||||||||||||||||||||
| Residential | $ | $ | — | $ | — | $ | — | $ | — | $ | $ | — | $ | |||||||||||||
| Commercial | — | — | — | — | — | |||||||||||||||||||||
| Industrial | — | — | — | — | — | |||||||||||||||||||||
| Power Generation | — | — | — | — | — | — | — | |||||||||||||||||||
| Other revenues | — | — | — | — | — | |||||||||||||||||||||
| Total Gas Utilities and Infrastructure revenue from contracts with customers | $ | $ | — | $ | — | $ | — | $ | — | $ | $ | — | $ | |||||||||||||
Other | ||||||||||||||||||||||||||
| Revenue from contracts with customers | $ | $ | — | $ | — | $ | — | $ | — | $ | — | $ | — | $ | — | |||||||||||
| Total revenue from contracts with customers | $ | $ | $ | $ | $ | $ | $ | $ | ||||||||||||||||||
Other revenue sources(a) | $ | $ | ( | $ | $ | $ | $ | $ | $ | |||||||||||||||||
| Total revenues | $ | $ | $ | $ | $ | $ | $ | $ | ||||||||||||||||||
(a) Other revenue sources include revenues from leases, derivatives and alternative revenue programs that are not considered revenues from contracts with customers. Alternative revenue programs in certain jurisdictions include regulatory mechanisms that periodically adjust for over or under collection of related revenues.
The following table presents the reserve for credit losses for trade and other receivables.
| Duke | Duke | Duke | Duke | Duke | ||||||||||||||||||||||
| Duke | Energy | Progress | Energy | Energy | Energy | Energy | ||||||||||||||||||||
| (in millions) | Energy | Carolinas | Energy | Progress | Florida | Ohio | Indiana | Piedmont | ||||||||||||||||||
| Balance at December 31, 2020 | $ | $ | $ | $ | $ | $ | $ | $ | ||||||||||||||||||
| Write-Offs | ( | ( | ( | ( | ( | — | — | ( | ||||||||||||||||||
| Credit Loss Expense | — | — | ||||||||||||||||||||||||
| Other Adjustments | ( | ( | ( | — | — | |||||||||||||||||||||
| Balance at December 31, 2021 | $ | $ | $ | $ | $ | $ | $ | $ | ||||||||||||||||||
| Write-Offs | ( | ( | ( | ( | ( | — | — | ( | ||||||||||||||||||
| Credit Loss Expense | ||||||||||||||||||||||||||
| Other Adjustments | ( | — | — | — | ||||||||||||||||||||||
| Balance at December 31, 2022 | $ | $ | $ | $ | $ | $ | $ | $ | ||||||||||||||||||
| Write-Offs | ( | ( | ( | ( | ( | — | — | ( | ||||||||||||||||||
| Credit Loss Expense | ||||||||||||||||||||||||||
| Other Adjustments | — | — | — | — | ||||||||||||||||||||||
| Balance at December 31, 2023 | $ | $ | $ | $ | $ | $ | $ | $ | ||||||||||||||||||
Trade and other receivables are evaluated based on an estimate of the risk of loss over the life of the receivable and current and historical conditions using supportable assumptions. Management evaluates the risk of loss for trade and other receivables by comparing the historical write-off amounts to total revenue over a specified period. Historical loss rates are adjusted due to the impact of current conditions, as well as forecasted conditions over a reasonable time period. The calculated write-off rate can be applied to the receivable balance for which an established reserve does not already exist. Management reviews the assumptions and risk of loss periodically for trade and other receivables.
200
| FINANCIAL STATEMENTS | REVENUE | ||||
The aging of trade receivables is presented in the table below.
| December 31, 2023 | ||||||||||||||||||||||||||
| Duke | Duke | Duke | Duke | Duke | ||||||||||||||||||||||
| Duke | Energy | Progress | Energy | Energy | Energy | Energy | ||||||||||||||||||||
| (in millions) | Energy | Carolinas | Energy | Progress | Florida | Ohio | Indiana | Piedmont | ||||||||||||||||||
Unbilled Receivables(a)(b) | $ | $ | $ | $ | $ | $ | $ | $ | ||||||||||||||||||
| Current | ||||||||||||||||||||||||||
| 1-30 days past due | ||||||||||||||||||||||||||
| 31-60 days past due | ||||||||||||||||||||||||||
| 61-90 days past due | ||||||||||||||||||||||||||
| 91+ days past due | ||||||||||||||||||||||||||
Deferred Payment Arrangements(c) | — | — | ||||||||||||||||||||||||
| Trade and Other Receivables | $ | $ | $ | $ | $ | $ | $ | $ | ||||||||||||||||||
| December 31, 2022 | ||||||||||||||||||||||||||
| Duke | Duke | Duke | Duke | Duke | ||||||||||||||||||||||
| Duke | Energy | Progress | Energy | Energy | Energy | Energy | ||||||||||||||||||||
| (in millions) | Energy | Carolinas | Energy | Progress | Florida | Ohio | Indiana | Piedmont | ||||||||||||||||||
Unbilled Receivables(a)(b) | $ | $ | $ | $ | $ | $ | $ | $ | ||||||||||||||||||
| Current | ||||||||||||||||||||||||||
| 1-30 days past due | ||||||||||||||||||||||||||
| 31-60 days past due | ||||||||||||||||||||||||||
| 61-90 days past due | ||||||||||||||||||||||||||
| 91+ days past due | ||||||||||||||||||||||||||
Deferred Payment Arrangements(c) | — | |||||||||||||||||||||||||
| Trade and Other Receivables | $ | $ | $ | $ | $ | $ | $ | $ | ||||||||||||||||||
(a) Unbilled revenues are recognized by applying customer billing rates to the estimated volumes of energy or natural gas delivered but not yet billed and are included within Receivables and Receivables of VIEs on the Consolidated Balance Sheets.
(b) Duke Energy Ohio and Duke Energy Indiana sell, on a revolving basis, nearly all of their retail accounts receivable, including receivables for unbilled revenues, to an affiliate, CRC, and account for the transfers of receivables as sales. Accordingly, the receivables sold are not reflected on the Consolidated Balance Sheets of Duke Energy Ohio and Duke Energy Indiana. See Note 18 for further information. These receivables for unbilled revenues are $141 million and $197 million for Duke Energy Ohio and Duke Energy Indiana, respectively, as of December 31, 2023, and $148 million and $260 million for Duke Energy Ohio and Duke Energy Indiana, respectively, as of December 31, 2022.
(c) Due to ongoing financial hardships impacting customers, Duke Energy has permitted customers to defer payment of past-due amounts through installment payment plans.
20. STOCKHOLDERS' EQUITY
201
| FINANCIAL STATEMENTS | STOCKHOLDERS' EQUITY | ||||
The following table presents Duke Energy’s basic and diluted EPS calculations, the weighted average number of common shares outstanding and common and preferred share dividends declared.
| Years Ended December 31, | |||||||||||||||||
| (in millions, except per share amounts) | 2023 | 2022 | 2021 | ||||||||||||||
| Net Income available to Duke Energy common stockholders | $ | $ | $ | ||||||||||||||
| Less: (Loss) Income from discontinued operations attributable to Duke Energy common stockholders | ( | ( | |||||||||||||||
| Accumulated preferred stock dividends adjustment | — | — | — | ||||||||||||||
| Less: Impact of participating securities | |||||||||||||||||
| Income from continuing operations available to Duke Energy common stockholders | $ | $ | $ | ||||||||||||||
| Loss from discontinued operations, net of tax | $ | ( | $ | ( | $ | ( | |||||||||||
| Add: Loss attributable to NCI | |||||||||||||||||
| (Loss) Income from discontinued operations attributable to Duke Energy common stockholders | $ | ( | $ | ( | $ | ||||||||||||
Weighted average common shares outstanding – basic and diluted | |||||||||||||||||
| EPS from continuing operations available to Duke Energy common stockholders | |||||||||||||||||
Basic and Diluted(a) | $ | $ | $ | ||||||||||||||
| (Loss) Earnings Per Share from discontinued operations attributable to Duke Energy common stockholders | |||||||||||||||||
Basic and Diluted(a) | $ | ( | $ | ( | $ | ||||||||||||
Potentially dilutive items excluded from the calculation(b) | |||||||||||||||||
| Dividends declared per common share | $ | $ | $ | ||||||||||||||
Dividends declared on Series A preferred stock per depositary share(c) | $ | $ | $ | ||||||||||||||
Dividends declared on Series B preferred stock per share(d) | $ | $ | $ | ||||||||||||||
(a) For the periods presented subsequent to issuance in April 2023, the convertible notes were excluded from the calculations of diluted
EPS because the effect was antidilutive.
(b) Performance stock awards were not included in the dilutive securities calculation because the performance measures related to the awards had not been met.
(c) 5.75 % Series A Cumulative Redeemable Perpetual Preferred Stock dividends are payable quarterly in arrears on the 16th day of March, June, September and December. The preferred stock has a $25 liquidation preference per depositary share.
(d) 4.875 % Series B Fixed-Rate Reset Cumulative Redeemable Perpetual Preferred Stock dividends are payable semiannually in arrears on the 16th day of March and September. The preferred stock has a $1,000 liquidation preference per share. On September 16, 2024, the First Call Date, and any fifth anniversary of the First Call Date, the dividend rate will reset based on the then current five-year U.S. Treasury rate plus a spread of 3.388 %.
Common Stock
In November 2022, Duke Energy filed a prospectus supplement and executed an Equity Distribution Agreement (EDA) under which it may sell up to $1.5 billion of its common stock through a new ATM offering program, including an equity forward sales component. Under the terms of the EDA, Duke Energy may issue and sell shares of common stock through September 2025.
Preferred Stock
The Series A Preferred Stock has no maturity or mandatory redemption date, is not redeemable at the option of the holders and includes separate call options. The first call option allows Duke Energy to call the Series A Preferred Stock at a redemption price of $25.50 per depositary share prior to June 15, 2024, in whole but not in part, at any time within 120 days after a ratings event where a rating agency amends, clarifies or changes the criteria it uses to assign equity credit for securities such as the preferred stock. The second call option allows Duke Energy to call the preferred stock, in whole or in part, at any time, on or after June 15, 2024, at a redemption price of $25 per depositary share. Duke Energy is also required to redeem all accumulated and unpaid dividends if either call option is exercised.
The Series B Preferred Stock has no maturity or mandatory redemption date, is not redeemable at the option of the holders and includes separate call options. The first call option allows Duke Energy to call the Series B Preferred Stock at a redemption price of $1,020 per share, in whole but not in part, at any time within 120 days after a ratings event. The second call option allows Duke Energy to call the preferred stock, in whole or in part, on the First Call Date or any subsequent Reset Date at a redemption price in cash equal to $1,000 per share. Duke Energy is also required to redeem all accumulated and unpaid dividends if either call option is exercised.
Dividends issued on its Series A and Series B Preferred Stock are subject to approval by the Board of Directors. However, the deferral of dividend payments on the preferred stock prohibits the declaration of common stock dividends.
The Series A and Series B Preferred Stock rank, with respect to dividends and distributions upon liquidation or dissolution:
•senior to Common Stock and to each other class or series of capital stock established after the original issue date of the Series A and Series B Preferred Stock that is expressly made subordinated to the Series A and Series B Preferred Stock;
•on a parity with any class or series of capital stock established after the original issue date of the Series A and Series B Preferred Stock that is not expressly made senior or subordinated to the Series A or Series B Preferred Stock;
202
| FINANCIAL STATEMENTS | STOCKHOLDERS' EQUITY | ||||
•junior to any class or series of capital stock established after the original issue date of the Series A and Series B Preferred Stock that is expressly made senior to the Series A or Series B Preferred Stock;
•junior to all existing and future indebtedness (including indebtedness outstanding under Duke Energy's credit facilities, unsecured senior notes, junior subordinated debentures and commercial paper) and other liabilities with respect to assets available to satisfy claims against Duke Energy; and
•structurally subordinated to existing and future indebtedness and other liabilities of Duke Energy's subsidiaries and future preferred stock of subsidiaries.
Holders of Series A and Series B Preferred Stock have no voting rights with respect to matters that generally require the approval of voting stockholders. The limited voting rights of holders of Series A and Series B Preferred Stock include the right to vote as a single class, respectively, on certain matters that may affect the preference or special rights of the preferred stock, except in the instance that Duke Energy elects to defer the payment of dividends for a total of six quarterly full dividend periods for Series A Preferred Stock or three semiannual full dividend periods for Series B Preferred Stock. If dividends are deferred for a cumulative total of six quarterly full dividend periods for Series A Preferred Stock or three semiannual full dividend periods for Series B Preferred Stock, whether or not for consecutive dividend periods, holders of the respective preferred stock have the right to elect two additional Board members to the Board of Directors.
21. SEVERANCE
During 2023, as Duke Energy transitions from the foundational work of clean energy strategy planning to the launch of the largest power generation build period in its history, it is streamlining certain functions and changing how it is structured and staffed to ensure the resulting organization reflects best-in-class standards, is optimally aligned with its jurisdictions, and is best positioned to serve its customers, stakeholders and investors. As a result, Duke Energy is extending involuntary severance benefits to certain employees in specific areas as a part of its organizational optimization. For the year ended December 31, 2023, Duke Energy recorded severance charges of approximately $97 million within Operations, maintenance and other on the Consolidated Statements of Income. These charges, along with amortization of severance regulatory deferrals and reversals of certain prior period severance costs, resulted in a total severance charge of $102 million in 2023.
During 2022, Duke Energy identified opportunities to eliminate work and create sustainable savings through a workload reduction initiative with a focus on process improvement through digital technology, governance simplification and elimination of low-value work. As a result, Duke Energy extended involuntary severance benefits to certain employees in specific areas as a part of this initiative.
During 2021, Duke Energy reviewed its operations and identified opportunities for improvement to better serve its customers. This operational review included workforce realignment to ensure the Company is staffed with the right skill sets and number of teammates to execute the long-term vision for Duke Energy. As such, Duke Energy extended involuntary severance benefits to certain employees in specific areas as a part of these workforce realignment efforts.
The following table presents the direct and allocated severance and related charges accrued for 682 employees in 2023, 233 employees in 2022 and 290 employees in 2021 by the Duke Energy Registrants within Operation, maintenance and other on the Consolidated Statements of Operations.
| Duke | Duke | Duke | Duke | Duke | ||||||||||||||||||||||
| Duke | Energy | Progress | Energy | Energy | Energy | Energy | ||||||||||||||||||||
| (in millions) | Energy | Carolinas | Energy | Progress | Florida | Ohio | Indiana | Piedmont | ||||||||||||||||||
Year Ended December 31, 2023(a)(b)(c) | $ | $ | $ | $ | $ | $ | $ | $ | ||||||||||||||||||
Year Ended December 31, 2022(d)(e) | ||||||||||||||||||||||||||
Year Ended December 31, 2021(f)(g) | ||||||||||||||||||||||||||
(a) Includes amortization of deferred severance charges of approximately $22 million, $14 million, $8 million and $8 million for Duke Energy, Duke Energy Carolinas, Progress Energy and Duke Energy Progress, respectively.
(b) Includes adjustments associated with 2021 severance charges of approximately $(6 ) million, $(2 ) million, $(3 ) million, $(2 ) million, $(1 ) million and $(1 ) million for Duke Energy, Duke Energy Carolinas, Progress Energy, Duke Energy Progress, Duke Energy Florida and Duke Energy Indiana, respectively.
(c) Includes adjustments associated with 2022 severance charges of approximately $(14 ) million, $(7 ) million, $(5 ) million, $(3 ) million, $(2 ) million, $(1 ) million and $(1 ) million for Duke Energy, Duke Energy Carolinas, Progress Energy, Duke Energy Progress, Duke Energy Florida, Duke Energy Ohio and Duke Energy Indiana, respectively.
(d) Includes amortization of deferred severance charges of approximately $33 million, $22 million, $11 million and $11 million for Duke Energy, Duke Energy Carolinas, Progress Energy and Duke Energy Progress, respectively.
(e) Includes adjustments associated with 2021 severance charges of approximately $(19 ) million, $(6 ) million, $(8 ) million, $(4 ) million, $(4 ) million, $(1 ) million, $(2 ) million and $(1 ) million for Duke Energy, Duke Energy Carolinas, Progress Energy, Duke Energy Progress, Duke Energy Florida, Duke Energy Ohio, Duke Energy Indiana and Piedmont, respectively.
(f) Includes amortization of deferred severance charges of approximately $33 million, $22 million, $11 million and $11 million for Duke Energy, Duke Energy Carolinas, Progress Energy and Duke Energy Progress, respectively.
(g) Includes adjustments associated with 2018 severance charges of approximately $(3 ) million, $(2 ) million and $(1 ) million for Duke Energy, Duke Energy Carolinas and Duke Energy Indiana, respectively.
203
| FINANCIAL STATEMENTS | SEVERANCE | ||||
The table below presents the severance liability for past and ongoing severance plans including the plans described above.
| Duke | Duke | Duke | Duke | Duke | ||||||||||||||||||||||
| Duke | Energy | Progress | Energy | Energy | Energy | Energy | ||||||||||||||||||||
| (in millions) | Energy | Carolinas | Energy | Progress | Florida | Ohio | Indiana | Piedmont | ||||||||||||||||||
| Balance at December 31, 2021 | $ | $ | $ | $ | $ | $ | — | $ | — | $ | — | |||||||||||||||
| Provision/Adjustments | — | — | ||||||||||||||||||||||||
| Cash Reductions | ( | ( | — | — | — | — | — | — | ||||||||||||||||||
| Balance at December 31, 2022 | $ | $ | $ | $ | $ | $ | — | $ | — | $ | ||||||||||||||||
| Provision/Adjustments | ||||||||||||||||||||||||||
| Cash Reductions | ( | ( | ( | ( | ( | — | — | ( | ||||||||||||||||||
| Balance at December 31, 2023 | $ | $ | $ | $ | $ | $ | $ | $ | ||||||||||||||||||
22. STOCK-BASED COMPENSATION
The Duke Energy Corporation 2023 Long-Term Incentive Plan (the 2023 Plan) provides for the grant of stock-based compensation awards to employees and outside directors. The 2023 Plan supersedes the Duke Energy Corporation 2015 Long-Term Incentive Plan (the 2015 Plan). No additional grants will be made from the 2015 Plan. The 2023 Plan reserved 15 million shares of common stock for issuance. Duke Energy has historically issued new shares upon exercising or vesting of share-based awards. However, Duke Energy may use a combination of new share issuances and open market repurchases for share-based awards that are exercised or vest in the future. Duke Energy has not determined with certainty the amount of such new share issuances or open market repurchases.
The following table summarizes the total expense recognized by the Duke Energy Registrants, net of tax, for stock-based compensation.
| Years Ended December 31, | |||||||||||||||||
| (in millions) | 2023 | 2022 | 2021 | ||||||||||||||
| Duke Energy | $ | $ | $ | ||||||||||||||
| Duke Energy Carolinas | |||||||||||||||||
| Progress Energy | |||||||||||||||||
| Duke Energy Progress | |||||||||||||||||
| Duke Energy Florida | |||||||||||||||||
| Duke Energy Ohio | |||||||||||||||||
| Duke Energy Indiana | |||||||||||||||||
| Piedmont | |||||||||||||||||
Duke Energy's pretax stock-based compensation costs, the tax benefit associated with stock-based compensation expense and stock-based compensation costs capitalized are included in the following table.
| Years Ended December 31, | |||||||||||||||||
| (in millions) | 2023 | 2022 | 2021 | ||||||||||||||
| RSU awards | $ | $ | $ | ||||||||||||||
| Performance awards | |||||||||||||||||
| Pretax stock-based compensation cost | $ | $ | $ | ||||||||||||||
| Stock-based compensation costs capitalized | |||||||||||||||||
| Stock-based compensation expense | $ | $ | $ | ||||||||||||||
| Tax benefit associated with stock-based compensation expense | $ | $ | $ | ||||||||||||||
RESTRICTED STOCK UNIT AWARDS
RSU awards generally vest over periods from immediate to three years . Fair value amounts are based on the market price of Duke Energy's common stock on the grant date. The following table includes information related to RSU awards.
| Years Ended December 31, | |||||||||||||||||
| 2023 | 2022 | 2021 | |||||||||||||||
| Shares granted (in thousands) | |||||||||||||||||
| Fair value (in millions) | $ | $ | $ | ||||||||||||||
204
| FINANCIAL STATEMENTS | STOCK-BASED COMPENSATION | ||||
The following table summarizes information about RSU awards outstanding.
| Weighted Average | |||||||||||
| Shares | Grant Date Fair Value | ||||||||||
| (in thousands) | (per share) | ||||||||||
Outstanding at December 31, 2022 | $ | ||||||||||
| Granted | |||||||||||
| Vested | ( | ||||||||||
| Forfeited | ( | ||||||||||
Outstanding at December 31, 2023 | |||||||||||
| RSU awards expected to vest | |||||||||||
The total grant date fair value of shares vested during the years ended December 31, 2023, 2022 and 2021, was $52 million, $49 million and $45 million, respectively. At December 31, 2023, Duke Energy had $33 million of unrecognized compensation cost, which is expected to be recognized over a weighted average period of 23 months.
PERFORMANCE AWARDS
Stock-based performance awards generally vest after three years to the extent performance targets are met. The actual number of shares issued will range from zero to 200 % of target shares, depending on the level of performance achieved.
Performance awards contain performance conditions and a market condition. The performance conditions are based on Duke Energy's cumulative adjusted EPS and total incident case rate (total incident case rate is one of our key employee safety metrics). The market condition is based on TSR of Duke Energy relative to a predefined peer group.
Relative TSR is valued using a path-dependent model that incorporates expected relative TSR into the fair value determination of Duke Energy’s performance-based share awards. The model uses three-year historical volatilities and correlations for all companies in the predefined peer group, including Duke Energy, to simulate Duke Energy’s relative TSR as of the end of the performance period. For each simulation, Duke Energy’s relative TSR associated with the simulated stock price at the end of the performance period plus expected dividends within the period results in a value per share for the award portfolio. The average of these simulations is the expected portfolio value per share. Actual life to date results of Duke Energy’s relative TSR for each grant are incorporated within the model. For performance awards granted in 2023, the model used a risk-free interest rate of 4.43 %, which reflects the yield on three-year Treasury bonds as of the grant date, and an expected volatility of 28.6 % based on Duke Energy's historical volatility over three years using daily stock prices.
The following table includes information related to stock-based performance awards.
| Years Ended December 31, | |||||||||||||||||
| 2023 | 2022 | 2021 | |||||||||||||||
| Shares granted assuming target performance (in thousands) | |||||||||||||||||
| Fair value (in millions) | $ | $ | $ | ||||||||||||||
The following table summarizes information about stock-based performance awards outstanding and assumes payout at the target level.
| Weighted Average | |||||||||||
| Shares | Grant Date Fair Value | ||||||||||
| (in thousands) | (per share) | ||||||||||
Outstanding at December 31, 2022 | $ | ||||||||||
| Granted | |||||||||||
| Vested | ( | ||||||||||
| Forfeited | ( | ||||||||||
Outstanding at December 31, 2023 | |||||||||||
| Stock-based performance awards expected to vest | |||||||||||
The total grant date fair value of shares vested during the years ended December 31, 2023, 2022 and 2021, was $31 million, $25 million and $25 million, respectively. At December 31, 2023, Duke Energy had $23 million of unrecognized compensation cost, which is expected to be recognized over a weighted average period of 22 months.
205
| FINANCIAL STATEMENTS | EMPLOYEE BENEFIT PLANS | ||||
23. EMPLOYEE BENEFIT PLANS
DEFINED BENEFIT RETIREMENT PLANS
Duke Energy and certain subsidiaries maintain, and the Subsidiary Registrants participate in, qualified, non-contributory defined benefit retirement plans, which consist of the Duke Energy Retirement Cash Balance Plan (RCBP) and the Duke Energy Legacy Pension Plan (DELPP) These plans cover most employees using a cash balance formula. Under a cash balance formula, a plan participant accumulates a retirement benefit consisting of pay credits based upon a percentage of current eligible earnings, age or age and years of service and interest credits. Certain employees are eligible for benefits that use a final average earnings formula. Under these final average earnings formulas, a plan participant accumulates a retirement benefit equal to the sum of percentages of their (i) highest -, four- or five-year average earnings, (ii) highest three-, four- or five-year average earnings in excess of covered compensation per year of participation (maximum of 35 years) or (iii) highest three-year average earnings times years of participation in excess of 35 years. Duke Energy also maintains, and the Subsidiary Registrants participate in, non-qualified, non-contributory defined benefit retirement plans that cover certain executives. The qualified and non-qualified, non-contributory defined benefit plans are closed to new participants.
Duke Energy uses a December 31 measurement date for its defined benefit retirement plan assets and obligations. Actuarial gains experienced by the defined benefit retirement plans in remeasuring plan assets on December 31, 2023, were primarily attributable to actual investment performance that exceeded expected investment performance. Actuarial losses experienced by the defined benefit retirement plans in remeasuring plan obligations as of December 31, 2023 were primarily attributable to the decrease in the discount rate used to measure plan obligations. Actuarial losses experienced by the defined benefit retirement plans in remeasuring plan assets on December 31, 2022, were primarily attributable to actual investment performance that was less than expected investment performance. Actuarial gains experienced by the defined benefit retirement plans in remeasuring plan obligations as of December 31, 2022, were primarily attributable to the increase in the discount rate used to measure plan obligations.
As a result of the application of settlement accounting due to total lump-sum benefit payments exceeding the settlement threshold (defined as the sum of service cost and interest cost on projected benefit obligation components of net periodic benefit costs) for one of its qualified pension plans, Duke Energy recognized settlement charges of $117 million, of which $95 million was recorded to Regulatory Assets within Other Noncurrent Assets on the Consolidated Balance Sheets and $22 million was recorded to Other income and expenses, net, within the Consolidated Statement of Operations as of December 31, 2022.
Settlement charges recognized by the Subsidiary Registrants as of December 31, 2022, which represent amounts allocated by Duke Energy for employees of the Subsidiary Registrants and allocated charges for their proportionate share of settlement charges for employees of Duke Energy's shared services affiliate, and recorded to Regulatory Assets within Other Noncurrent Assets on the Consolidated Balance Sheets were $35 million for Duke Energy Carolinas, $23 million for Progress Energy, $16 million for Duke Energy Progress, $7 million for Duke Energy Florida, $8 million for Duke Energy Indiana and $29 million for Piedmont. Settlement charges recognized by the Subsidiary Registrants as of December 31, 2022, recorded to Other income and expenses, net, within the Consolidated Statement of Operations were $3 million for Duke Energy Carolinas, $5 million for Progress Energy, $5 million for Duke Energy Progress, $1 million for Duke Energy Florida, $5 million for Duke Energy Ohio and $6 million for Piedmont.
The settlement charges reflect the recognition of a pro-rata portion of previously unrecognized actuarial losses, equal to the percentage of reduction in the projected benefit obligation resulting from total lump-sum benefit payments as of December 31, 2022. Settlement charges recognized as a regulatory asset within Other Noncurrent Assets on the Consolidated Balance Sheets are amortized over the average remaining service period for participants in the plan. Amortization of settlement charges is disclosed in the tables below as a component of net periodic pension costs.
Effective December 31, 2022, Duke Energy Florida changed its method for calculating the market related value of plan assets (MRVA) from the fair value method to a method that recognizes changes in fair value of its plan assets over a five-year period. This represents a change in regulatory treatment that will serve to mitigate the impact of market volatility on retail customer rates, resulting in the timing of net periodic pension cost recognition that is more consistent with treatment of the related cost in the ratemaking process. The three-year retrospective impact of this method change of $24 million was recognized by Duke Energy, Progress Energy and Duke Energy Florida, respectively, and was recorded to Other income and expenses, net, within the Consolidated Statement of Operations as of December 31, 2022, and has been disclosed in the tables below as a component of net periodic pension costs.
Net periodic benefit costs disclosed in the tables below represent the cost of the respective benefit plan for the periods presented prior to capitalization of amounts reflected as Net property, plant and equipment, on the Consolidated Balance Sheets. Only the service cost component of net periodic benefit costs is eligible to be capitalized. The remaining non-capitalized portions of net periodic benefit costs are classified as either: (1) service cost, which is recorded in Operations, maintenance and other on the Consolidated Statements of Operations; or as (2) components of non-service cost, which is recorded in Other income and expenses, net on the Consolidated Statements of Operations. Amounts presented in the tables below for the Subsidiary Registrants represent the amounts of pension and other post-retirement benefit cost allocated by Duke Energy for employees of the Subsidiary Registrants. Additionally, the Consolidated Statements of Operations of the Subsidiary Registrants also include allocated net periodic benefit costs for their proportionate share of pension and post-retirement benefit cost for employees of Duke Energy’s shared services affiliate that provide support to the Subsidiary Registrants. However, in the tables below, these amounts are only presented within the Duke Energy column (except for amortization of settlement charges). These allocated amounts are included in the governance and shared service costs discussed in Note 14.
206
| FINANCIAL STATEMENTS | EMPLOYEE BENEFIT PLANS | ||||
Duke Energy’s policy is to fund amounts on an actuarial basis to provide assets sufficient to meet benefit payments to be paid to plan participants. The following table includes information related to the Duke Energy Registrants’ contributions to its qualified defined benefit pension plans. There were no contributions made in the year ended December 31, 2021.
| Duke | Duke | Duke | Duke | Duke | |||||||||||||||||||||||||||||||||||||||||||
| Duke | Energy | Progress | Energy | Energy | Energy | Energy | |||||||||||||||||||||||||||||||||||||||||
| (in millions) | Energy | Carolinas | Energy | Progress | Florida | Ohio | Indiana | Piedmont | |||||||||||||||||||||||||||||||||||||||
| Contributions Made: | |||||||||||||||||||||||||||||||||||||||||||||||
| 2023 | $ | $ | $ | $ | $ | $ | $ | $ | |||||||||||||||||||||||||||||||||||||||
| 2022 | |||||||||||||||||||||||||||||||||||||||||||||||
QUALIFIED PENSION PLANS
Components of Net Periodic Pension Costs
| Year Ended December 31, 2023 | |||||||||||||||||||||||||||||||||||||||||||||||
| Duke | Duke | Duke | Duke | Duke | |||||||||||||||||||||||||||||||||||||||||||
| Duke | Energy | Progress | Energy | Energy | Energy | Energy | |||||||||||||||||||||||||||||||||||||||||
| (in millions) | Energy | Carolinas | Energy | Progress | Florida | Ohio | Indiana | Piedmont | |||||||||||||||||||||||||||||||||||||||
| Service cost | $ | $ | $ | $ | $ | $ | $ | $ | |||||||||||||||||||||||||||||||||||||||
| Interest cost on projected benefit obligation | |||||||||||||||||||||||||||||||||||||||||||||||
| Expected return on plan assets | ( | ( | ( | ( | ( | ( | ( | ( | |||||||||||||||||||||||||||||||||||||||
| Amortization of actuarial loss | — | — | |||||||||||||||||||||||||||||||||||||||||||||
| Amortization of prior service credit | ( | ( | — | — | — | — | ( | ( | |||||||||||||||||||||||||||||||||||||||
Amortization of settlement charges | — | ||||||||||||||||||||||||||||||||||||||||||||||
Net periodic pension costs(a)(b) | $ | ( | $ | ( | $ | ( | $ | ( | $ | ( | $ | ( | $ | ( | $ | ( | |||||||||||||||||||||||||||||||
| Year Ended December 31, 2022 | |||||||||||||||||||||||||||||||||||||||||||||||
| Duke | Duke | Duke | Duke | Duke | |||||||||||||||||||||||||||||||||||||||||||
| Duke | Energy | Progress | Energy | Energy | Energy | Energy | |||||||||||||||||||||||||||||||||||||||||
| (in millions) | Energy | Carolinas | Energy | Progress | Florida | Ohio | Indiana | Piedmont | |||||||||||||||||||||||||||||||||||||||
| Service cost | $ | $ | $ | $ | $ | $ | $ | $ | |||||||||||||||||||||||||||||||||||||||
| Interest cost on projected benefit obligation | |||||||||||||||||||||||||||||||||||||||||||||||
| Expected return on plan assets | ( | ( | ( | ( | ( | ( | ( | ( | |||||||||||||||||||||||||||||||||||||||
| Amortization of actuarial loss | |||||||||||||||||||||||||||||||||||||||||||||||
| Amortization of prior service credit | ( | ( | — | — | — | — | ( | ( | |||||||||||||||||||||||||||||||||||||||
Amortization of settlement charges(c) | |||||||||||||||||||||||||||||||||||||||||||||||
| MRVA method change | |||||||||||||||||||||||||||||||||||||||||||||||
Net periodic pension costs(a)(b) | $ | ( | $ | ( | $ | ( | $ | ( | $ | $ | $ | — | $ | ( | |||||||||||||||||||||||||||||||||
207
| FINANCIAL STATEMENTS | EMPLOYEE BENEFIT PLANS | ||||
| Year Ended December 31, 2021 | |||||||||||||||||||||||||||||||||||||||||||||||
| Duke | Duke | Duke | Duke | Duke | |||||||||||||||||||||||||||||||||||||||||||
| Duke | Energy | Progress | Energy | Energy | Energy | Energy | |||||||||||||||||||||||||||||||||||||||||
| (in millions) | Energy | Carolinas | Energy | Progress | Florida | Ohio | Indiana | Piedmont | |||||||||||||||||||||||||||||||||||||||
| Service cost | $ | $ | $ | $ | $ | $ | $ | $ | |||||||||||||||||||||||||||||||||||||||
| Interest cost on projected benefit obligation | |||||||||||||||||||||||||||||||||||||||||||||||
| Expected return on plan assets | ( | ( | ( | ( | ( | ( | ( | ( | |||||||||||||||||||||||||||||||||||||||
| Amortization of actuarial loss | |||||||||||||||||||||||||||||||||||||||||||||||
| Amortization of prior service credit | ( | ( | ( | ( | ( | ( | ( | ( | |||||||||||||||||||||||||||||||||||||||
Amortization of settlement charges | — | — | |||||||||||||||||||||||||||||||||||||||||||||
Net periodic pension costs(a)(b) | $ | ( | $ | ( | $ | ( | $ | ( | $ | ( | $ | ( | $ | ( | $ | ( | |||||||||||||||||||||||||||||||
(a) Duke Energy amounts exclude $3 million, $3 million and $3 million for the years ended December 2023, 2022 and 2021, respectively, of regulatory asset amortization resulting from purchase accounting adjustments associated with Duke Energy's merger with Cinergy in April 2006.
(b) Duke Energy Ohio amounts exclude $1 million, $1 million and $1 million for the years ended December 2023, 2022 and 2021, respectively, of regulatory asset amortization resulting from purchase accounting adjustments associated with Duke Energy's merger with Cinergy in April 2006.
(c) Includes settlement charges not deferred as a regulatory asset.
Amounts Recognized in Accumulated Other Comprehensive Income and Regulatory Assets
| Year Ended December 31, 2023 | |||||||||||||||||||||||||||||||||||||||||||||||
| Duke | Duke | Duke | Duke | Duke | |||||||||||||||||||||||||||||||||||||||||||
| Duke | Energy | Progress | Energy | Energy | Energy | Energy | |||||||||||||||||||||||||||||||||||||||||
| (in millions) | Energy | Carolinas | Energy | Progress | Florida | Ohio | Indiana | Piedmont | |||||||||||||||||||||||||||||||||||||||
| Regulatory assets, net increase (decrease) | $ | $ | ( | $ | $ | — | $ | $ | ( | $ | ( | $ | |||||||||||||||||||||||||||||||||||
| Accumulated other comprehensive loss (income) | |||||||||||||||||||||||||||||||||||||||||||||||
| Deferred income tax expense | $ | — | $ | — | $ | — | $ | — | $ | — | $ | — | $ | — | $ | — | |||||||||||||||||||||||||||||||
| Amortization of prior year actuarial losses | ( | — | — | — | — | — | — | — | |||||||||||||||||||||||||||||||||||||||
| Net amount recognized in accumulated other comprehensive income | $ | ( | $ | — | $ | — | $ | — | $ | — | $ | — | $ | — | $ | — | |||||||||||||||||||||||||||||||
| Year Ended December 31, 2022 | |||||||||||||||||||||||||||||||||||||||||||||||
| Duke | Duke | Duke | Duke | Duke | |||||||||||||||||||||||||||||||||||||||||||
| Duke | Energy | Progress | Energy | Energy | Energy | Energy | |||||||||||||||||||||||||||||||||||||||||
| (in millions) | Energy | Carolinas | Energy | Progress | Florida | Ohio | Indiana | Piedmont | |||||||||||||||||||||||||||||||||||||||
Regulatory assets, net increase (decrease) | $ | $ | $ | $ | $ | $ | ( | $ | ( | $ | |||||||||||||||||||||||||||||||||||||
| Accumulated other comprehensive loss (income) | |||||||||||||||||||||||||||||||||||||||||||||||
| Deferred income tax expense | $ | ( | $ | — | $ | ( | $ | — | $ | — | $ | — | $ | — | $ | — | |||||||||||||||||||||||||||||||
| Amortization of prior year actuarial losses | — | — | — | — | — | — | |||||||||||||||||||||||||||||||||||||||||
| Net amount recognized in accumulated other comprehensive income | $ | $ | — | $ | $ | — | $ | — | $ | — | $ | — | $ | — | |||||||||||||||||||||||||||||||||
208
| FINANCIAL STATEMENTS | EMPLOYEE BENEFIT PLANS | ||||
Reconciliation of Funded Status to Net Amount Recognized
| Year Ended December 31, 2023 | |||||||||||||||||||||||||||||||||||||||||||||||
| Duke | Duke | Duke | Duke | Duke | |||||||||||||||||||||||||||||||||||||||||||
| Duke | Energy | Progress | Energy | Energy | Energy | Energy | |||||||||||||||||||||||||||||||||||||||||
| (in millions) | Energy | Carolinas | Energy | Progress | Florida | Ohio | Indiana | Piedmont | |||||||||||||||||||||||||||||||||||||||
| Change in Projected Benefit Obligation | |||||||||||||||||||||||||||||||||||||||||||||||
| Obligation at prior measurement date | $ | $ | $ | $ | $ | $ | $ | $ | |||||||||||||||||||||||||||||||||||||||
| Service cost | |||||||||||||||||||||||||||||||||||||||||||||||
| Interest cost | |||||||||||||||||||||||||||||||||||||||||||||||
Actuarial loss | |||||||||||||||||||||||||||||||||||||||||||||||
| Benefits paid | ( | ( | ( | ( | ( | ( | ( | ( | |||||||||||||||||||||||||||||||||||||||
| Transfers | — | ( | ( | ( | — | — | — | ||||||||||||||||||||||||||||||||||||||||
| Obligation at measurement date | $ | $ | $ | $ | $ | $ | $ | $ | |||||||||||||||||||||||||||||||||||||||
| Accumulated Benefit Obligation at measurement date | $ | $ | $ | $ | $ | $ | $ | $ | |||||||||||||||||||||||||||||||||||||||
| Change in Fair Value of Plan Assets | |||||||||||||||||||||||||||||||||||||||||||||||
| Plan assets at prior measurement date | $ | $ | $ | $ | $ | $ | $ | $ | |||||||||||||||||||||||||||||||||||||||
| Employer contributions | |||||||||||||||||||||||||||||||||||||||||||||||
| Actual return on plan assets | |||||||||||||||||||||||||||||||||||||||||||||||
| Benefits paid | ( | ( | ( | ( | ( | ( | ( | ( | |||||||||||||||||||||||||||||||||||||||
| Transfers | — | ( | ( | ( | — | — | — | ||||||||||||||||||||||||||||||||||||||||
| Plan assets at measurement date | $ | $ | $ | $ | $ | $ | $ | $ | |||||||||||||||||||||||||||||||||||||||
| Funded status of plan | $ | $ | $ | $ | $ | $ | $ | $ | |||||||||||||||||||||||||||||||||||||||
| Year Ended December 31, 2022 | |||||||||||||||||||||||||||||||||||||||||||||||
| Duke | Duke | Duke | Duke | Duke | |||||||||||||||||||||||||||||||||||||||||||
| Duke | Energy | Progress | Energy | Energy | Energy | Energy | |||||||||||||||||||||||||||||||||||||||||
| (in millions) | Energy | Carolinas | Energy | Progress | Florida | Ohio | Indiana | Piedmont | |||||||||||||||||||||||||||||||||||||||
| Change in Projected Benefit Obligation | |||||||||||||||||||||||||||||||||||||||||||||||
| Obligation at prior measurement date | $ | $ | $ | $ | $ | $ | $ | $ | |||||||||||||||||||||||||||||||||||||||
| Service cost | |||||||||||||||||||||||||||||||||||||||||||||||
| Interest cost | |||||||||||||||||||||||||||||||||||||||||||||||
| Actuarial gain | ( | ( | ( | ( | ( | ( | ( | ( | |||||||||||||||||||||||||||||||||||||||
| Benefits paid | ( | ( | ( | ( | ( | ( | ( | ( | |||||||||||||||||||||||||||||||||||||||
| Transfers | — | ( | ( | — | — | — | — | ||||||||||||||||||||||||||||||||||||||||
| Obligation at measurement date | $ | $ | $ | $ | $ | $ | $ | $ | |||||||||||||||||||||||||||||||||||||||
| Accumulated Benefit Obligation at measurement date | $ | $ | $ | $ | $ | $ | $ | $ | |||||||||||||||||||||||||||||||||||||||
| Change in Fair Value of Plan Assets | |||||||||||||||||||||||||||||||||||||||||||||||
| Plan assets at prior measurement date | $ | $ | $ | $ | $ | $ | $ | $ | |||||||||||||||||||||||||||||||||||||||
| Employer contributions | |||||||||||||||||||||||||||||||||||||||||||||||
| Actual return on plan assets | ( | ( | ( | ( | ( | ( | ( | ( | |||||||||||||||||||||||||||||||||||||||
| Benefits paid | ( | ( | ( | ( | ( | ( | ( | ( | |||||||||||||||||||||||||||||||||||||||
| Transfers | — | ( | ( | — | — | — | — | ||||||||||||||||||||||||||||||||||||||||
| Plan assets at measurement date | $ | $ | $ | $ | $ | $ | $ | $ | |||||||||||||||||||||||||||||||||||||||
| Funded status of plan | $ | $ | $ | $ | $ | $ | ( | $ | $ | ||||||||||||||||||||||||||||||||||||||
209
| FINANCIAL STATEMENTS | EMPLOYEE BENEFIT PLANS | ||||
Amounts Recognized in the Consolidated Balance Sheets
| December 31, 2023 | |||||||||||||||||||||||||||||||||||||||||||||||
| Duke | Duke | Duke | Duke | Duke | |||||||||||||||||||||||||||||||||||||||||||
| Duke | Energy | Progress | Energy | Energy | Energy | Energy | |||||||||||||||||||||||||||||||||||||||||
| (in millions) | Energy | Carolinas | Energy | Progress | Florida | Ohio | Indiana | Piedmont | |||||||||||||||||||||||||||||||||||||||
Prefunded pension(a) | $ | $ | $ | $ | $ | $ | $ | $ | |||||||||||||||||||||||||||||||||||||||
Noncurrent pension liability(b) | $ | — | $ | — | $ | — | $ | — | $ | — | $ | $ | $ | — | |||||||||||||||||||||||||||||||||
| Net asset (liability) recognized | $ | $ | $ | $ | $ | $ | $ | $ | |||||||||||||||||||||||||||||||||||||||
| Regulatory assets | $ | $ | $ | $ | $ | $ | $ | $ | |||||||||||||||||||||||||||||||||||||||
| Accumulated other comprehensive (income) loss | |||||||||||||||||||||||||||||||||||||||||||||||
| Deferred income tax benefit | $ | ( | $ | — | $ | ( | $ | — | $ | — | $ | — | $ | — | $ | — | |||||||||||||||||||||||||||||||
| Prior service credit | ( | — | — | — | — | — | — | — | |||||||||||||||||||||||||||||||||||||||
| Net actuarial loss | — | — | — | — | — | ||||||||||||||||||||||||||||||||||||||||||
| Net amounts recognized in accumulated other comprehensive loss | $ | $ | — | $ | $ | — | $ | — | $ | — | $ | $ | — | ||||||||||||||||||||||||||||||||||
| December 31, 2022 | |||||||||||||||||||||||||||||||||||||||||||||||
| Duke | Duke | Duke | Duke | Duke | |||||||||||||||||||||||||||||||||||||||||||
| Duke | Energy | Progress | Energy | Energy | Energy | Energy | |||||||||||||||||||||||||||||||||||||||||
| (in millions) | Energy | Carolinas | Energy | Progress | Florida | Ohio | Indiana | Piedmont | |||||||||||||||||||||||||||||||||||||||
Prefunded pension(a) | $ | $ | $ | $ | $ | $ | $ | $ | |||||||||||||||||||||||||||||||||||||||
Noncurrent pension liability(b) | $ | $ | — | $ | — | $ | — | $ | — | $ | $ | $ | — | ||||||||||||||||||||||||||||||||||
| Net asset (liability) recognized | $ | $ | $ | $ | $ | $ | ( | $ | $ | ||||||||||||||||||||||||||||||||||||||
| Regulatory assets | $ | $ | $ | $ | $ | $ | $ | $ | |||||||||||||||||||||||||||||||||||||||
| Accumulated other comprehensive (income) loss | |||||||||||||||||||||||||||||||||||||||||||||||
| Deferred income tax benefit | $ | ( | $ | — | $ | ( | $ | — | $ | — | $ | — | $ | — | $ | — | |||||||||||||||||||||||||||||||
| Prior service credit | ( | — | — | — | — | — | — | — | |||||||||||||||||||||||||||||||||||||||
| Net actuarial loss | — | — | — | — | — | — | |||||||||||||||||||||||||||||||||||||||||
| Net amounts recognized in accumulated other comprehensive loss | $ | $ | — | $ | $ | — | $ | — | $ | — | $ | — | $ | — | |||||||||||||||||||||||||||||||||
(a) Included in Other within Other Noncurrent Assets on the Consolidated Balance Sheets.
(b) Included in Accrued pension and other post-retirement benefit costs on the Consolidated Balance Sheets.
Information for Plans with Accumulated Benefit Obligation in Excess of Plan Assets
| December 31, 2023 | ||||||||||||||
| Duke | Duke | |||||||||||||
| Energy | Energy | |||||||||||||
| (in millions) | Ohio | Indiana | ||||||||||||
| Projected benefit obligation | $ | $ | ||||||||||||
| Accumulated benefit obligation | ||||||||||||||
| Fair value of plan assets | ||||||||||||||
| December 31, 2022 | |||||||||||||||||
| Duke | Duke | ||||||||||||||||
| Duke | Energy | Energy | |||||||||||||||
| (in millions) | Energy | Ohio | Indiana | ||||||||||||||
| Projected benefit obligation | $ | $ | $ | ||||||||||||||
| Accumulated benefit obligation | |||||||||||||||||
| Fair value of plan assets | |||||||||||||||||
210
| FINANCIAL STATEMENTS | EMPLOYEE BENEFIT PLANS | ||||
Assumptions Used for Pension Benefits Accounting
The discount rate used to determine the current year pension obligation and following year’s pension expense is based on a bond selection-settlement portfolio approach. This approach develops a discount rate by selecting a portfolio of high-quality corporate bonds that generate sufficient cash flow to provide for projected benefit payments of the plan. The selected bond portfolio is derived from a universe of non-callable corporate bonds rated Aa quality or higher. After the bond portfolio is selected, a single interest rate is determined that equates the present value of the plan’s projected benefit payments discounted at this rate with the market value of the bonds selected.
The RCBP contains a mostly active participant population while the DELPP contains a mostly inactive participant population. The average remaining service period for RCBP participants is nine years and the average life expectancy of DELPP participants is 15 years. Unrecognized net actuarial gains/losses and prior service credit are amortized over 12 14 11 years for Duke Energy Carolinas, Progress Energy and Duke Energy Progress and nine years for Piedmont.
The following tables present the assumptions or range of assumptions used for pension benefit accounting.
| December 31, | ||||||||||||||||||||||||||||||||||||||
| 2023 | 2022 | 2021 | ||||||||||||||||||||||||||||||||||||
| Benefit Obligations | ||||||||||||||||||||||||||||||||||||||
| Discount rate | ||||||||||||||||||||||||||||||||||||||
| Interest crediting rate | ||||||||||||||||||||||||||||||||||||||
| Salary increase | % | – | % | – | % | – | ||||||||||||||||||||||||||||||||
| Net Periodic Benefit Cost | ||||||||||||||||||||||||||||||||||||||
| Discount rate | % | – | ||||||||||||||||||||||||||||||||||||
| Interest crediting rate | ||||||||||||||||||||||||||||||||||||||
| Salary increase | % | – | % | – | % | – | ||||||||||||||||||||||||||||||||
| Expected long-term rate of return on plan assets | 6.50 | % | – | % | ||||||||||||||||||||||||||||||||||
Expected Benefit Payments
| Duke | Duke | Duke | Duke | Duke | ||||||||||||||||||||||
| Duke | Energy | Progress | Energy | Energy | Energy | Energy | ||||||||||||||||||||
| (in millions) | Energy | Carolinas | Energy | Progress | Florida | Ohio | Indiana | Piedmont | ||||||||||||||||||
| Years ending December 31, | ||||||||||||||||||||||||||
| 2024 | $ | $ | $ | $ | $ | $ | $ | $ | ||||||||||||||||||
| 2025 | ||||||||||||||||||||||||||
| 2026 | ||||||||||||||||||||||||||
| 2027 | ||||||||||||||||||||||||||
| 2028 | ||||||||||||||||||||||||||
2029-2033 | ||||||||||||||||||||||||||
NON-QUALIFIED PENSION PLANS
The accumulated benefit obligation, which equals the projected benefit obligation for non-qualified pension plans, was $224 10 78 23 31 2 2 2
Employer contributions, which equal benefits paid for non-qualified pension plans, were $24 1 8 3 3
Net periodic pension costs for non-qualified pension plans were not material for the years ended December 31, 2023, 2022 or 2021.
OTHER POST-RETIREMENT BENEFIT PLANS
Duke Energy provides, and the Subsidiary Registrants participate in, some health care and life insurance benefits for retired employees on a contributory and non-contributory basis. Employees are eligible for these benefits if they have satisfied the applicable eligibility requirements (e.g., age and service) at retirement, as defined in the plans. The health care benefits include medical, dental, vision and prescription drug coverage and are subject to certain limitations, such as deductibles and copayments.
Duke Energy did not make any pre-funding contributions to its other post-retirement benefit plans during the years ended December 31, 2023, 2022 or 2021.
211
| FINANCIAL STATEMENTS | EMPLOYEE BENEFIT PLANS | ||||
Components of Net Periodic Other Post-Retirement Benefit Costs
| Year Ended December 31, 2023 | |||||||||||||||||||||||||||||||||||||||||||||||
| Duke | Duke | Duke | Duke | Duke | |||||||||||||||||||||||||||||||||||||||||||
| Duke | Energy | Progress | Energy | Energy | Energy | Energy | |||||||||||||||||||||||||||||||||||||||||
| (in millions) | Energy | Carolinas | Energy | Progress | Florida | Ohio | Indiana | Piedmont | |||||||||||||||||||||||||||||||||||||||
| Service cost | $ | $ | $ | — | $ | — | $ | — | $ | — | $ | — | $ | — | |||||||||||||||||||||||||||||||||
| Interest cost on accumulated post-retirement benefit obligation | |||||||||||||||||||||||||||||||||||||||||||||||
| Expected return on plan assets | ( | ( | — | — | — | — | — | ( | |||||||||||||||||||||||||||||||||||||||
Amortization of actuarial (gain) loss | ( | ( | ( | ( | — | ||||||||||||||||||||||||||||||||||||||||||
| Amortization of prior service credit | ( | ( | ( | ( | ( | — | ( | — | |||||||||||||||||||||||||||||||||||||||
Net periodic post-retirement benefit costs (a)(b) | $ | ( | $ | ( | $ | $ | $ | $ | ( | $ | ( | $ | ( | ||||||||||||||||||||||||||||||||||
| Year Ended December 31, 2022 | |||||||||||||||||||||||||||||||||||||||||||||||
| Duke | Duke | Duke | Duke | Duke | |||||||||||||||||||||||||||||||||||||||||||
| Duke | Energy | Progress | Energy | Energy | Energy | Energy | |||||||||||||||||||||||||||||||||||||||||
| (in millions) | Energy | Carolinas | Energy | Progress | Florida | Ohio | Indiana | Piedmont | |||||||||||||||||||||||||||||||||||||||
| Service cost | $ | $ | $ | — | $ | — | $ | — | $ | — | $ | — | $ | — | |||||||||||||||||||||||||||||||||
| Interest cost on accumulated post-retirement benefit obligation | |||||||||||||||||||||||||||||||||||||||||||||||
| Expected return on plan assets | ( | ( | — | — | — | — | — | ( | |||||||||||||||||||||||||||||||||||||||
| Amortization of actuarial loss | — | — | — | — | |||||||||||||||||||||||||||||||||||||||||||
| Amortization of prior service credit | ( | ( | ( | ( | ( | — | — | ( | |||||||||||||||||||||||||||||||||||||||
Net periodic post-retirement benefit costs(a)(b) | $ | $ | ( | $ | $ | $ | $ | $ | $ | ( | |||||||||||||||||||||||||||||||||||||
| Year Ended December 31, 2021 | |||||||||||||||||||||||||||||||||||||||||||||||
| Duke | Duke | Duke | Duke | Duke | |||||||||||||||||||||||||||||||||||||||||||
| Duke | Energy | Progress | Energy | Energy | Energy | Energy | |||||||||||||||||||||||||||||||||||||||||
| (in millions) | Energy | Carolinas | Energy | Progress | Florida | Ohio | Indiana | Piedmont | |||||||||||||||||||||||||||||||||||||||
| Service cost | $ | $ | $ | $ | — | $ | — | $ | — | $ | $ | — | |||||||||||||||||||||||||||||||||||
| Interest cost on accumulated post-retirement benefit obligation | |||||||||||||||||||||||||||||||||||||||||||||||
| Expected return on plan assets | ( | ( | — | — | — | — | — | ( | |||||||||||||||||||||||||||||||||||||||
| Amortization of actuarial loss | — | — | — | — | |||||||||||||||||||||||||||||||||||||||||||
| Amortization of prior service credit | ( | ( | ( | ( | ( | ( | ( | ( | |||||||||||||||||||||||||||||||||||||||
Net periodic post-retirement benefit costs(a)(b) | $ | — | $ | ( | $ | $ | $ | $ | — | $ | $ | ( | |||||||||||||||||||||||||||||||||||
(a) Duke Energy amounts exclude $4 million, $4 million and $5 million for the years ended December 2023, 2022 and 2021, respectively, of regulatory asset amortization resulting from purchase accounting adjustments associated with Duke Energy's merger with Cinergy in April 2006.
(b) Duke Energy Ohio amounts exclude $1 million, $1 million and $1 million for the years ended December 2023, 2022 and 2021, respectively, of regulatory asset amortization resulting from purchase accounting adjustments associated with Duke Energy's merger with Cinergy in April 2006.
212
| FINANCIAL STATEMENTS | EMPLOYEE BENEFIT PLANS | ||||
Amounts Recognized in Accumulated Other Comprehensive Income and Regulatory Assets and Liabilities
| Year Ended December 31, 2023 | |||||||||||||||||||||||||||||||||||||||||||||||
| Duke | Duke | Duke | Duke | Duke | |||||||||||||||||||||||||||||||||||||||||||
| Duke | Energy | Progress | Energy | Energy | Energy | Energy | |||||||||||||||||||||||||||||||||||||||||
| (in millions) | Energy | Carolinas | Energy | Progress | Florida | Ohio | Indiana | Piedmont | |||||||||||||||||||||||||||||||||||||||
Regulatory assets, net increase (decrease) | $ | $ | $ | ( | $ | ( | $ | — | $ | ( | $ | ( | $ | ||||||||||||||||||||||||||||||||||
| Regulatory liabilities, net increase (decrease) | $ | $ | $ | — | $ | — | $ | — | $ | ( | $ | ( | $ | — | |||||||||||||||||||||||||||||||||
| Accumulated other comprehensive (income) loss | |||||||||||||||||||||||||||||||||||||||||||||||
| Amortization of prior year service credit | $ | $ | — | $ | — | $ | — | $ | — | $ | — | $ | — | $ | — | ||||||||||||||||||||||||||||||||
| Amortization of prior year actuarial gain | — | — | ( | — | — | — | — | — | |||||||||||||||||||||||||||||||||||||||
| Net amount recognized in accumulated other comprehensive income | $ | $ | — | $ | ( | $ | — | $ | — | $ | — | $ | — | $ | — | ||||||||||||||||||||||||||||||||
| Year Ended December 31, 2022 | |||||||||||||||||||||||||||||||||||||||||||||||
| Duke | Duke | Duke | Duke | Duke | |||||||||||||||||||||||||||||||||||||||||||
| Duke | Energy | Progress | Energy | Energy | Energy | Energy | |||||||||||||||||||||||||||||||||||||||||
| (in millions) | Energy | Carolinas | Energy | Progress | Florida | Ohio | Indiana | Piedmont | |||||||||||||||||||||||||||||||||||||||
| Regulatory assets, net (decrease) increase | $ | ( | $ | — | $ | ( | $ | ( | $ | ( | $ | — | $ | ( | $ | — | |||||||||||||||||||||||||||||||
Regulatory liabilities, net increase (decrease) | $ | $ | — | $ | — | $ | — | $ | — | $ | — | $ | $ | ( | |||||||||||||||||||||||||||||||||
| Accumulated other comprehensive (income) loss | |||||||||||||||||||||||||||||||||||||||||||||||
| Amortization of prior year actuarial gain | $ | $ | — | $ | — | $ | — | $ | — | $ | — | $ | — | $ | — | ||||||||||||||||||||||||||||||||
| Net amount recognized in accumulated other comprehensive income | $ | $ | — | $ | — | $ | — | $ | — | $ | — | $ | — | $ | — | ||||||||||||||||||||||||||||||||
Reconciliation of Funded Status to Accrued Other Post-Retirement Benefit Costs
| Year Ended December 31, 2023 | |||||||||||||||||||||||||||||||||||||||||||||||
| Duke | Duke | Duke | Duke | Duke | |||||||||||||||||||||||||||||||||||||||||||
| Duke | Energy | Progress | Energy | Energy | Energy | Energy | |||||||||||||||||||||||||||||||||||||||||
| (in millions) | Energy | Carolinas | Energy | Progress | Florida | Ohio | Indiana | Piedmont | |||||||||||||||||||||||||||||||||||||||
| Change in Projected Benefit Obligation | |||||||||||||||||||||||||||||||||||||||||||||||
| Accumulated post-retirement benefit obligation at prior measurement date | $ | $ | $ | $ | $ | $ | $ | $ | |||||||||||||||||||||||||||||||||||||||
| Service cost | — | — | — | — | — | — | |||||||||||||||||||||||||||||||||||||||||
| Interest cost | |||||||||||||||||||||||||||||||||||||||||||||||
| Plan participants' contributions | — | — | — | ||||||||||||||||||||||||||||||||||||||||||||
Actuarial (gains) losses | ( | ( | ( | ( | ( | ( | |||||||||||||||||||||||||||||||||||||||||
| Transfers | ( | ( | ( | ||||||||||||||||||||||||||||||||||||||||||||
| Benefits paid | ( | ( | ( | ( | ( | ( | ( | ( | |||||||||||||||||||||||||||||||||||||||
| Accumulated post-retirement benefit obligation at measurement date | $ | $ | $ | $ | $ | $ | $ | $ | |||||||||||||||||||||||||||||||||||||||
| Change in Fair Value of Plan Assets | |||||||||||||||||||||||||||||||||||||||||||||||
| Plan assets at prior measurement date | $ | $ | $ | — | $ | ( | $ | ( | $ | $ | $ | ||||||||||||||||||||||||||||||||||||
| 401(h) asset transfers | ( | ||||||||||||||||||||||||||||||||||||||||||||||
| Actual return on plan assets | — | — | — | — | |||||||||||||||||||||||||||||||||||||||||||
| Benefits paid | ( | ( | ( | ( | ( | ( | ( | ( | |||||||||||||||||||||||||||||||||||||||
| Transfers | ( | ( | |||||||||||||||||||||||||||||||||||||||||||||
| Employer contributions | |||||||||||||||||||||||||||||||||||||||||||||||
| Plan participants' contributions | — | — | — | ||||||||||||||||||||||||||||||||||||||||||||
| Plan assets at measurement date | $ | $ | $ | ( | $ | ( | $ | ( | $ | $ | $ | ||||||||||||||||||||||||||||||||||||
| Funded status of plan | $ | ( | $ | $ | ( | $ | ( | $ | ( | $ | ( | $ | ( | $ | |||||||||||||||||||||||||||||||||
213
| FINANCIAL STATEMENTS | EMPLOYEE BENEFIT PLANS | ||||
| Year Ended December 31, 2022 | |||||||||||||||||||||||||||||||||||||||||||||||
| Duke | Duke | Duke | Duke | Duke | |||||||||||||||||||||||||||||||||||||||||||
| Duke | Energy | Progress | Energy | Energy | Energy | Energy | |||||||||||||||||||||||||||||||||||||||||
| (in millions) | Energy | Carolinas | Energy | Progress | Florida | Ohio | Indiana | Piedmont | |||||||||||||||||||||||||||||||||||||||
| Change in Projected Benefit Obligation | |||||||||||||||||||||||||||||||||||||||||||||||
| Accumulated post-retirement benefit obligation at prior measurement date | $ | $ | $ | $ | $ | $ | $ | $ | |||||||||||||||||||||||||||||||||||||||
| Service cost | — | — | — | — | — | — | |||||||||||||||||||||||||||||||||||||||||
| Interest cost | |||||||||||||||||||||||||||||||||||||||||||||||
| Plan participants' contributions | — | ||||||||||||||||||||||||||||||||||||||||||||||
| Actuarial gains | ( | ( | ( | ( | ( | ( | ( | ( | |||||||||||||||||||||||||||||||||||||||
| Plan amendments | ( | ( | ( | ( | ( | ( | |||||||||||||||||||||||||||||||||||||||||
| Benefits paid | ( | ( | ( | ( | ( | ( | ( | ( | |||||||||||||||||||||||||||||||||||||||
| Accumulated post-retirement benefit obligation at measurement date | $ | $ | $ | $ | $ | $ | $ | $ | |||||||||||||||||||||||||||||||||||||||
| Change in Fair Value of Plan Assets | |||||||||||||||||||||||||||||||||||||||||||||||
| Plan assets at prior measurement date | $ | $ | $ | ( | $ | ( | $ | ( | $ | $ | $ | ||||||||||||||||||||||||||||||||||||
| Actual return on plan assets | ( | ( | — | — | — | ( | — | ( | |||||||||||||||||||||||||||||||||||||||
| Benefits paid | ( | ( | ( | ( | ( | ( | ( | ( | |||||||||||||||||||||||||||||||||||||||
| Employer contributions | |||||||||||||||||||||||||||||||||||||||||||||||
| Plan participants' contributions | — | ||||||||||||||||||||||||||||||||||||||||||||||
| Plan assets at measurement date | $ | $ | $ | — | $ | ( | $ | ( | $ | $ | $ | ||||||||||||||||||||||||||||||||||||
| Funded status of plan | $ | ( | $ | ( | $ | ( | $ | ( | $ | ( | $ | ( | $ | ( | $ | ||||||||||||||||||||||||||||||||
Amounts Recognized in the Consolidated Balance Sheets
| December 31, 2023 | |||||||||||||||||||||||||||||||||||||||||||||||
| Duke | Duke | Duke | Duke | Duke | |||||||||||||||||||||||||||||||||||||||||||
| Duke | Energy | Progress | Energy | Energy | Energy | Energy | |||||||||||||||||||||||||||||||||||||||||
| (in millions) | Energy | Carolinas | Energy | Progress | Florida | Ohio | Indiana | Piedmont | |||||||||||||||||||||||||||||||||||||||
| Prefunded post-retirement benefit | $ | — | $ | $ | — | $ | — | $ | — | $ | $ | — | $ | ||||||||||||||||||||||||||||||||||
Current post-retirement liability(a) | — | — | |||||||||||||||||||||||||||||||||||||||||||||
Noncurrent post-retirement liability(b) | — | ||||||||||||||||||||||||||||||||||||||||||||||
| Net liability (asset) recognized | $ | $ | ( | $ | $ | $ | $ | $ | $ | ( | |||||||||||||||||||||||||||||||||||||
| Regulatory assets | $ | $ | $ | $ | $ | $ | $ | $ | |||||||||||||||||||||||||||||||||||||||
| Regulatory liabilities | $ | $ | $ | — | $ | — | $ | — | $ | $ | $ | — | |||||||||||||||||||||||||||||||||||
| Accumulated other comprehensive (income) loss | |||||||||||||||||||||||||||||||||||||||||||||||
| Deferred income tax expense | $ | $ | — | $ | — | $ | — | $ | — | $ | — | $ | — | $ | — | ||||||||||||||||||||||||||||||||
| Net actuarial gain | ( | — | ( | — | — | — | — | — | |||||||||||||||||||||||||||||||||||||||
| Net amounts recognized in accumulated other comprehensive income | $ | ( | $ | — | $ | ( | $ | — | $ | — | $ | — | $ | — | $ | — | |||||||||||||||||||||||||||||||
214
| FINANCIAL STATEMENTS | EMPLOYEE BENEFIT PLANS | ||||
| December 31, 2022 | |||||||||||||||||||||||||||||||||||||||||||||||
| Duke | Duke | Duke | Duke | Duke | |||||||||||||||||||||||||||||||||||||||||||
| Duke | Energy | Progress | Energy | Energy | Energy | Energy | |||||||||||||||||||||||||||||||||||||||||
| (in millions) | Energy | Carolinas | Energy | Progress | Florida | Ohio | Indiana | Piedmont | |||||||||||||||||||||||||||||||||||||||
| Prefunded post-retirement benefit | $ | — | $ | — | $ | — | $ | — | $ | — | $ | $ | — | $ | |||||||||||||||||||||||||||||||||
Current post-retirement liability(a) | — | — | — | ||||||||||||||||||||||||||||||||||||||||||||
Noncurrent post-retirement liability(b) | — | ||||||||||||||||||||||||||||||||||||||||||||||
| Net liability (asset) recognized | $ | $ | $ | $ | $ | $ | $ | $ | ( | ||||||||||||||||||||||||||||||||||||||
| Regulatory assets | $ | $ | — | $ | $ | $ | $ | $ | $ | — | |||||||||||||||||||||||||||||||||||||
| Regulatory liabilities | $ | $ | $ | — | $ | — | $ | — | $ | $ | $ | — | |||||||||||||||||||||||||||||||||||
| Accumulated other comprehensive (income) loss | |||||||||||||||||||||||||||||||||||||||||||||||
| Deferred income tax expense | $ | $ | — | $ | — | $ | — | $ | — | $ | — | $ | — | $ | — | ||||||||||||||||||||||||||||||||
| Prior service credit | ( | — | — | — | — | — | — | — | |||||||||||||||||||||||||||||||||||||||
| Net actuarial gain | ( | — | — | — | — | — | — | — | |||||||||||||||||||||||||||||||||||||||
| Net amounts recognized in accumulated other comprehensive income | $ | ( | $ | — | $ | — | $ | — | $ | — | $ | — | $ | — | $ | — | |||||||||||||||||||||||||||||||
(a) Included in Other within Current Liabilities on the Consolidated Balance Sheets.
(b) Included in Accrued pension and other post-retirement benefit costs on the Consolidated Balance Sheets.
Assumptions Used for Other Post-Retirement Benefits Accounting
The discount rate used to determine the current year other post-retirement benefits obligation and following year’s other post-retirement benefits expense is based on a bond selection-settlement portfolio approach. This approach develops a discount rate by selecting a portfolio of high-quality corporate bonds that generate sufficient cash flow to provide for projected benefit payments of the plan. The selected bond portfolio is derived from a universe of non-callable corporate bonds rated Aa quality or higher. After the bond portfolio is selected, a single interest rate is determined that equates the present value of the plan’s projected benefit payments discounted at this rate with the market value of the bonds selected.
The average remaining service period of active covered employees is seven years six years five years
The following tables present the assumptions used for other post-retirement benefits accounting.
| December 31, | ||||||||||||||||||||||||||
| 2023 | 2022 | 2021 | ||||||||||||||||||||||||
| Benefit Obligations | ||||||||||||||||||||||||||
| Discount rate | % | % | % | |||||||||||||||||||||||
| Net Periodic Benefit Cost | ||||||||||||||||||||||||||
| Discount rate | % | % | % | |||||||||||||||||||||||
| Expected long-term rate of return on plan assets | % | – | % | % | % | |||||||||||||||||||||
Assumed Health Care Cost Trend Rate
| December 31, | |||||||||||
| 2023 | 2022 | ||||||||||
Health care cost trend rate assumed for next year – pre-65 trend | % | % | |||||||||
Health care cost trend rate assumed for next year – post-65 trend | % | % | |||||||||
| Rate to which the cost trend is assumed to decline (the ultimate trend rate) | % | % | |||||||||
| Year that rate reaches ultimate trend | 2031-2032 | 2030-2032 | |||||||||
215
| FINANCIAL STATEMENTS | EMPLOYEE BENEFIT PLANS | ||||
Expected Benefit Payments
| Duke | Duke | Duke | Duke | Duke | ||||||||||||||||||||||
| Duke | Energy | Progress | Energy | Energy | Energy | Energy | ||||||||||||||||||||
| (in millions) | Energy | Carolinas | Energy | Progress | Florida | Ohio | Indiana | Piedmont | ||||||||||||||||||
| Years ending December 31, | ||||||||||||||||||||||||||
| 2024 | $ | $ | $ | $ | $ | $ | $ | $ | ||||||||||||||||||
| 2025 | ||||||||||||||||||||||||||
| 2026 | ||||||||||||||||||||||||||
| 2027 | ||||||||||||||||||||||||||
| 2028 | ||||||||||||||||||||||||||
2029-2033 | ||||||||||||||||||||||||||
PLAN ASSETS
Description and Allocations
Duke Energy Corporation Master Retirement Trust
Assets for both the qualified pension and other post-retirement benefits are maintained in the Duke Energy Corporation Master Retirement Trust. Approximately 98 2
As of December 31, 2023, Duke Energy assumes qualified pension and other post-retirement plan assets will generate a long-term rate of return of 8.50 % for the RCBP pension and RCBP 401(h) account assets and 7.00 % for the DELPP pension and DELPP 401(h) account assets. The expected long-term rate of return was developed using a weighted average calculation of expected returns based primarily on future expected returns across asset classes considering the use of active asset managers, where applicable. The asset allocation targets were set after considering the investment objective and the risk profile. Equity securities are held for their higher expected returns. Debt securities are primarily held to hedge the qualified pension plan. Return seeking debt securities, hedge funds and other global securities are held for diversification. Investments within asset classes are diversified to achieve broad market participation and reduce the impact of individual managers or investments.
Effective January 1, 2024, the target asset allocation for the RCBP assets is 35 % liability hedging and 65 % return-seeking assets and the target asset allocation for the DELPP assets is 80 % liability hedging assets and 20 % return-seeking assets. Duke Energy periodically reviews its asset allocation targets, and over time, as the funded status of the benefit plans increase, the level of asset risk relative to plan liabilities may be reduced to better manage Duke Energy's benefit plan liabilities and reduce funded status volatility.
The Duke Energy Corporation Master Retirement Trust is authorized to engage in the lending of certain plan assets. Securities lending is an investment management enhancement that utilizes certain existing securities of the Duke Energy Corporation Master Retirement Trust to earn additional income. Securities lending involves the loaning of securities to approved parties. In return for the loaned securities, the Duke Energy Corporation Master Retirement Trust receives collateral in the form of cash and securities as a safeguard against possible default of any borrower on the return of the loan under terms that permit the Duke Energy Corporation Master Retirement Trust to sell the securities. The Duke Energy Corporation Master Retirement Trust mitigates credit risk associated with securities lending arrangements by monitoring the fair value of the securities loaned, with additional collateral obtained or refunded as necessary. Effective December 31, 2023, the Duke Energy Corporation Master Retirement Trust discontinued lending plan assets. The fair value of securities on loan was approximately $2 million and $390 million at December 31, 2023, and 2022, respectively. Cash and securities obtained as collateral exceeded the fair value of the securities loaned at December 31, 2023, and 2022, respectively. Securities lending income earned by the Duke Energy Corporation Master Retirement Trust was immaterial for the years ended December 31, 2023, 2022 and 2021, respectively.
Qualified pension and other post-retirement benefits for the Subsidiary Registrants are derived from the Duke Energy Corporation Master Retirement Trust, as such, each are allocated their proportionate share of the assets discussed below.
The following table includes the target asset allocations by asset class at December 31, 2023, and the actual asset allocations for the RCBP assets.
| Actual Allocation at | |||||||||||||||||
| Target | December 31, | ||||||||||||||||
| Allocation | 2023 | 2022 | |||||||||||||||
| Global equity securities | % | % | % | ||||||||||||||
| Global private equity securities | % | % | % | ||||||||||||||
| Debt securities | % | % | % | ||||||||||||||
| Return seeking debt securities | % | % | % | ||||||||||||||
| Hedge funds | % | % | % | ||||||||||||||
| Real estate and cash | % | % | % | ||||||||||||||
| Total | % | % | % | ||||||||||||||
216
| FINANCIAL STATEMENTS | EMPLOYEE BENEFIT PLANS | ||||
The following table includes the target asset allocations by asset class at December 31, 2023, and the actual asset allocations for the DELPP assets.
| Actual Allocation at | |||||||||||||||||
| Target | December 31, | ||||||||||||||||
| Allocation | 2023 | 2022 | |||||||||||||||
| Global equity securities | % | % | % | ||||||||||||||
| Global private equity securities | % | — | % | — | % | ||||||||||||
| Debt securities | % | % | % | ||||||||||||||
| Return seeking debt securities | % | % | % | ||||||||||||||
| Hedge funds | % | % | % | ||||||||||||||
| Real estate and cash | % | % | % | ||||||||||||||
| Total | % | % | % | ||||||||||||||
Other post-retirement assets
Duke Energy's other post-retirement assets are comprised of Voluntary Employees' Beneficiary Association (VEBA) trusts and 401(h) accounts held within the Duke Energy Corporation Master Retirement Trust. Duke Energy's investment objective is to achieve sufficient returns, subject to a prudent level of portfolio risk, for the purpose of promoting the security of plan benefits for participants.
The following table presents target and actual asset allocations for the VEBA trusts at December 31, 2023.
| Actual Allocation at | |||||||||||||||||
| Target | December 31, | ||||||||||||||||
| Allocation | 2023 | 2022 | |||||||||||||||
| U.S. equity securities | % | % | % | ||||||||||||||
| Non-U.S. equity securities | % | % | % | ||||||||||||||
| Real estate | % | % | % | ||||||||||||||
| Debt securities | % | % | % | ||||||||||||||
| Cash | % | % | % | ||||||||||||||
| Total | % | % | % | ||||||||||||||
Fair Value Measurements
Duke Energy classifies recurring and non-recurring fair value measurements based on the fair value hierarchy as discussed in Note 17.
Valuation methods of the primary fair value measurements disclosed below are as follows:
Investments in equity securities
Investments in equity securities are typically valued at the closing price in the principal active market as of the last business day of the reporting period. Principal active markets for equity prices include published exchanges such as NASDAQ and NYSE. Foreign equity prices are translated from their trading currency using the currency exchange rate in effect at the close of the principal active market. Prices have not been adjusted to reflect after-hours market activity. The majority of investments in equity securities are valued using Level 1 measurements. When the price of an institutional commingled fund is unpublished, it is not categorized in the fair value hierarchy, even though the funds are readily available at the fair value.
Investments in corporate debt securities and U.S. government securities
Most debt investments are valued based on a calculation using interest rate curves and credit spreads applied to the terms of the debt instrument (maturity and coupon interest rate) and consider the counterparty credit rating. Most debt valuations are Level 2 measurements. If the market for a particular fixed-income security is relatively inactive or illiquid, the measurement is Level 3. U.S. Treasury debt is typically Level 2.
Investments in short-term investment funds
Investments in short-term investment funds are valued at the net asset value of units held at year end and are readily redeemable at the measurement date. Investments in short-term investment funds with published prices are valued as Level 1. Investments in short-term investment funds with unpublished prices are valued as Level 2.
217
| FINANCIAL STATEMENTS | EMPLOYEE BENEFIT PLANS | ||||
Duke Energy Corporation Master Retirement Trust
The following tables provide the fair value measurement amounts for the Duke Energy Corporation Master Retirement Trust qualified pension and other post-retirement assets.
| December 31, 2023 | |||||||||||||||||||||||||||||
| Total Fair | Not | ||||||||||||||||||||||||||||
| (in millions) | Value | Level 1 | Level 2 | Level 3 | Categorized(b) | ||||||||||||||||||||||||
| Equity securities | $ | $ | $ | $ | — | $ | |||||||||||||||||||||||
| Corporate debt securities | — | — | — | ||||||||||||||||||||||||||
| Short-term investment funds | — | — | — | ||||||||||||||||||||||||||
| Partnership interests | — | — | — | ||||||||||||||||||||||||||
| Hedge funds | — | — | — | ||||||||||||||||||||||||||
| U.S. government securities | — | — | — | ||||||||||||||||||||||||||
| Governments bonds – foreign | — | — | — | ||||||||||||||||||||||||||
| Cash | — | — | — | ||||||||||||||||||||||||||
Government and commercial mortgage-backed securities | — | — | — | ||||||||||||||||||||||||||
| Net pending transactions and other investments | — | — | |||||||||||||||||||||||||||
Total assets(a) | $ | $ | $ | $ | $ | ||||||||||||||||||||||||
(a) Duke Energy Carolinas, Progress Energy, Duke Energy Progress, Duke Energy Florida, Duke Energy Ohio, Duke Energy Indiana and Piedmont were allocated approximately 27 %, 33 %, 15 %, 18 %, 5 %, 7 % and 3 %, respectively, of the Duke Energy Corporation Master Retirement Trust at December 31, 2023. Accordingly, all amounts included in the table above are allocable to the Subsidiary Registrants using these percentages.
(b) Certain investments that are measured at fair value using the net asset value per share practical expedient have not been categorized in the fair value hierarchy.
| December 31, 2022 | |||||||||||||||||||||||||||||
| Total Fair | Not | ||||||||||||||||||||||||||||
| (in millions) | Value | Level 1 | Level 2 | Level 3 | Categorized(b) | ||||||||||||||||||||||||
| Equity securities | $ | $ | $ | $ | — | $ | |||||||||||||||||||||||
| Corporate debt securities | — | — | — | ||||||||||||||||||||||||||
| Short-term investment funds | — | — | |||||||||||||||||||||||||||
| Partnership interests | — | — | — | ||||||||||||||||||||||||||
| Hedge funds | — | — | — | ||||||||||||||||||||||||||
| U.S. government securities | — | — | — | ||||||||||||||||||||||||||
| Governments bonds – foreign | — | — | — | ||||||||||||||||||||||||||
| Cash | — | — | — | ||||||||||||||||||||||||||
Government and commercial mortgage-backed securities | — | — | — | ||||||||||||||||||||||||||
| Net pending transactions and other investments | — | — | |||||||||||||||||||||||||||
Total assets(a) | $ | $ | $ | $ | $ | ||||||||||||||||||||||||
(a) Duke Energy Carolinas, Progress Energy, Duke Energy Progress, Duke Energy Florida, Duke Energy Ohio, Duke Energy Indiana and Piedmont were allocated approximately 27 %, 33 %, 15 %, 18 %, 5 %, 7 % and 3 %, respectively, of the Duke Energy Corporation Master Retirement Trust at December 31, 2022. Accordingly, all amounts included in the table above are allocable to the Subsidiary Registrants using these percentages.
(b) Certain investments that are measured at fair value using the net asset value per share practical expedient have not been categorized in the fair value hierarchy.
The following table provides a reconciliation of beginning and ending balances of Duke Energy Corporation Master Retirement Trust qualified pension and other post-retirement assets at fair value on a recurring basis where the determination of fair value includes significant unobservable inputs (Level 3).
| (in millions) | 2023 | 2022 | |||||||||
| Balance at January 1 | $ | $ | |||||||||
| Sales | ( | ( | |||||||||
| Total gains and other, net | ( | ||||||||||
| Transfer of Level 3 assets from other classifications | — | ( | |||||||||
| Balance at December 31 | $ | $ | |||||||||
218
| FINANCIAL STATEMENTS | EMPLOYEE BENEFIT PLANS | ||||
Other post-retirement assets
The following tables provide the fair value measurement amounts for VEBA trust assets.
| December 31, 2023 | |||||||||||
| Total Fair | |||||||||||
| (in millions) | Value | Level 2 | |||||||||
| Cash and cash equivalents | $ | $ | |||||||||
| Real estate | |||||||||||
| Equity securities | |||||||||||
| Debt securities | |||||||||||
| Total assets | $ | $ | |||||||||
| December 31, 2022 | |||||||||||
| Total Fair | |||||||||||
| (in millions) | Value | Level 2 | |||||||||
| Cash and cash equivalents | $ | $ | |||||||||
| Real estate | |||||||||||
| Equity securities | |||||||||||
| Debt securities | |||||||||||
| Total assets | $ | $ | |||||||||
EMPLOYEE SAVINGS PLANS
Retirement Savings Plan
Duke Energy Corporation sponsors, and the Subsidiary Registrants participate in, employee savings plans that cover substantially all U.S. employees. Most employees participate in a matching contribution formula where Duke Energy provides a matching contribution generally equal to 100 % of employee before-tax and Roth 401(k) contributions of up to 6 % of eligible pay per pay period. Dividends on Duke Energy shares held by the savings plans are charged to retained earnings when declared and shares held in the plans are considered outstanding in the calculation of basic and diluted EPS. For new and rehired employees who are not eligible to participate in Duke Energy’s defined benefit plans, an additional employer contribution of 4 % of eligible pay per pay period, which is subject to a three-year vesting schedule, is provided to the employee’s savings plan account.
The following table includes pretax employer matching contributions made by Duke Energy and expensed by the Subsidiary Registrants.
| Duke | Duke | Duke | Duke | Duke | |||||||||||||||||||||||||||||||||||||||||||
| Duke | Energy | Progress | Energy | Energy | Energy | Energy | |||||||||||||||||||||||||||||||||||||||||
| (in millions) | Energy | Carolinas | Energy | Progress | Florida | Ohio | Indiana | Piedmont | |||||||||||||||||||||||||||||||||||||||
| Years ended December 31, | |||||||||||||||||||||||||||||||||||||||||||||||
| 2023 | $ | $ | $ | $ | $ | $ | $ | $ | |||||||||||||||||||||||||||||||||||||||
| 2022 | |||||||||||||||||||||||||||||||||||||||||||||||
| 2021 | |||||||||||||||||||||||||||||||||||||||||||||||
24. INCOME TAXES
Inflation Reduction Act
On August 16, 2022, the IRA was signed into law. Among other provisions, the IRA implemented a new 15% corporate alternative minimum tax based on GAAP net income, with certain adjustments as defined by the IRA, and clean energy-related provisions. The IRA's clean energy provisions included, among other provisions, the extension and modification of existing investment and PTCs for projects placed in service through 2024 and introduced new technology-neutral clean energy related credits beginning in 2025. In addition, the IRA created a new, zero-emission nuclear power PTC and a clean hydrogen PTC.
There were no material impacts on the results of operations, financial position, or cash flows in the periods presented for the Duke Energy Registrants as a result of the IRA being signed into law. Based on the review of the IRA provisions, future annual cash flow impacts related to the energy credits could be material to the Duke Energy Registrants. However, the majority of Duke Energy's operations are regulated and the FERC and state utility commissions will determine the regulatory treatment. We anticipate the Subsidiary Registrants will defer and expect to pass along the net financial impact associated with the IRA to customers over time. See Note 4 for further details on the IRA as it relates to Duke Energy Florida. Duke Energy will continue to assess the IRA as new information and anticipated guidance from the U.S. Department of the Treasury becomes available.
219
| FINANCIAL STATEMENTS | INCOME TAXES | ||||
North Carolina's 2021 Appropriations Act
On November 18, 2021, North Carolina Senate Bill 105 (SB 105) was signed into law. Starting with tax year 2025, SB 105 begins phasing out the North Carolina corporate income tax rate over five years, from a statutory rate of 2.5% to zero. Duke Energy recorded a net reduction of approximately $490 million to its North Carolina deferred tax liability in the fourth quarter of 2021. The majority of this deferred tax liability reduction was offset by recording a regulatory liability pending NCUC determination of the disposition of the amounts related to Duke Energy Carolinas, Duke Energy Progress and Piedmont. In addition, Duke Energy recorded a net reduction of North Carolina consolidating deferred tax assets of approximately $25 million to deferred state income tax expense in the fourth quarter of 2021. North Carolina SB 105 did not have a significant impact on the financial position, results of operation, or cash flows of Duke Energy, Duke Energy Carolinas, Progress Energy, Duke Energy Progress or Piedmont.
Income Tax Expense
Components of Income Tax Expense
Tax benefit from discontinued operations, in the following tables, includes income tax benefits related to the Commercial Renewables Disposal Groups. See Note 2 for further details.
| Year Ended December 31, 2023 | ||||||||||||||||||||||||||
| Duke | Duke | Duke | Duke | Duke | ||||||||||||||||||||||
| Duke | Energy | Progress | Energy | Energy | Energy | Energy | ||||||||||||||||||||
| (in millions) | Energy | Carolinas | Energy | Progress | Florida | Ohio | Indiana | Piedmont | ||||||||||||||||||
| Current income taxes | ||||||||||||||||||||||||||
Federal(b) | $ | $ | $ | $ | $ | $ | ( | $ | $ | |||||||||||||||||
| State | ( | |||||||||||||||||||||||||
| Foreign | — | — | — | — | — | — | — | |||||||||||||||||||
| Total current income taxes | ( | |||||||||||||||||||||||||
| Deferred income taxes | ||||||||||||||||||||||||||
| Federal | ( | ( | ( | ( | ||||||||||||||||||||||
| State | ( | — | ||||||||||||||||||||||||
Total deferred income taxes(a) | ( | ( | ( | ( | ||||||||||||||||||||||
| ITC amortization | ( | ( | ( | ( | — | — | — | — | ||||||||||||||||||
| Income tax expense from continuing operations | ||||||||||||||||||||||||||
| Tax benefit from discontinued operations | ( | — | — | — | — | — | — | — | ||||||||||||||||||
Total income tax expense included in Consolidated Statements of Operations | $ | $ | $ | $ | $ | $ | $ | $ | ||||||||||||||||||
(a) Total deferred income taxes includes the utilization of NOL carryforwards and tax credit carryforwards of $214 million at Duke Energy and $54 million at Duke Energy Indiana. In addition, total deferred income taxes includes the generation of NOL carryforwards and tax credit carryforwards of $2 million at Duke Energy Carolinas, $116 million at Progress Energy, $59 million at Duke Energy Progress, $5 million at Duke Energy Florida, $22 million at Duke Energy Ohio, and $15 million at Piedmont.
(b) Total current federal income tax at Duke Energy includes corporate alternative minimum tax, net of tax credit utilization, of $69 million. In addition, under the IRA transferability provision, Progress Energy elected to sell $28 million of PTCs generated by Duke Energy Florida. Cash received and paid related to the transfer of tax credits is included in Cash paid for (received from) income taxes on the Consolidated Statements of Cash Flows.
220
| FINANCIAL STATEMENTS | INCOME TAXES | ||||
| Year Ended December 31, 2022 | ||||||||||||||||||||||||||
| Duke | Duke | Duke | Duke | Duke | ||||||||||||||||||||||
| Duke | Energy | Progress | Energy | Energy | Energy | Energy | ||||||||||||||||||||
| (in millions) | Energy | Carolinas | Energy | Progress | Florida | Ohio | Indiana | Piedmont | ||||||||||||||||||
| Current income taxes | ||||||||||||||||||||||||||
| Federal | $ | $ | ( | $ | ( | $ | $ | ( | $ | ( | $ | $ | ||||||||||||||
| State | ( | ( | ( | — | ( | |||||||||||||||||||||
| Foreign | — | — | — | — | — | — | — | |||||||||||||||||||
| Total current income taxes | ( | ( | ( | ( | ( | |||||||||||||||||||||
| Deferred income taxes | ||||||||||||||||||||||||||
| Federal | ( | ( | ||||||||||||||||||||||||
| State | ( | ( | — | ( | ||||||||||||||||||||||
Total deferred income taxes(a) | ( | ( | ||||||||||||||||||||||||
| ITC amortization | ( | ( | ( | ( | — | ( | ( | — | ||||||||||||||||||
| Income tax expense from continuing operations | ( | ( | ||||||||||||||||||||||||
| Tax benefit from discontinued operations | ( | — | — | — | — | — | — | — | ||||||||||||||||||
Total income tax (benefit) expense included in Consolidated Statements of Operations | $ | ( | $ | $ | $ | $ | $ | ( | $ | ( | $ | |||||||||||||||
(a) Total deferred income taxes includes the generation of NOL carryforwards and tax credit carryforwards of $550 million at Duke Energy, $97 million at Duke Energy Carolinas, $128 million at Progress Energy, $9 million at Duke Energy Progress, $111 million at Duke Energy Florida, $7 million at Duke Energy Ohio, $13 million at Duke Energy Indiana, and $12 million at Piedmont.
| Year Ended December 31, 2021 | ||||||||||||||||||||||||||
| Duke | Duke | Duke | Duke | Duke | ||||||||||||||||||||||
| Duke | Energy | Progress | Energy | Energy | Energy | Energy | ||||||||||||||||||||
| (in millions) | Energy | Carolinas | Energy | Progress | Florida | Ohio | Indiana | Piedmont | ||||||||||||||||||
| Current income taxes | ||||||||||||||||||||||||||
| Federal | $ | ( | $ | $ | ( | $ | $ | ( | $ | ( | $ | $ | ||||||||||||||
| State | ( | ( | ( | |||||||||||||||||||||||
| Foreign | — | — | — | — | — | — | — | |||||||||||||||||||
| Total current income taxes | ( | ( | ( | |||||||||||||||||||||||
| Deferred income taxes | ||||||||||||||||||||||||||
| Federal | ( | ( | ||||||||||||||||||||||||
| State | — | ( | ( | ( | ||||||||||||||||||||||
Total deferred income taxes(a) | ( | ( | ||||||||||||||||||||||||
| ITC amortization | ( | ( | ( | ( | — | — | — | — | ||||||||||||||||||
Income tax expense from continuing operations | ||||||||||||||||||||||||||
| Tax benefit from discontinued operations | ( | — | — | — | — | — | — | — | ||||||||||||||||||
Total income tax expense included in Consolidated Statements of Operations | $ | $ | $ | $ | $ | $ | $ | $ | ||||||||||||||||||
Duke Energy Income from Continuing Operations before Income Taxes
| Years Ended December 31, | |||||||||||||||||
| (in millions) | 2023 | 2022 | 2021 | ||||||||||||||
| Domestic | $ | $ | $ | ||||||||||||||
| Foreign | |||||||||||||||||
| Income from continuing operations before income taxes | $ | $ | $ | ||||||||||||||
221
| FINANCIAL STATEMENTS | INCOME TAXES | ||||
Statutory Rate Reconciliation
The following tables present a reconciliation of income tax expense at the U.S. federal statutory tax rate to the actual tax expense from continuing operations.
| Year Ended December 31, 2023 | ||||||||||||||||||||||||||
| Duke | Duke | Duke | Duke | Duke | ||||||||||||||||||||||
| Duke | Energy | Progress | Energy | Energy | Energy | Energy | ||||||||||||||||||||
| (in millions) | Energy | Carolinas | Energy | Progress | Florida | Ohio | Indiana | Piedmont | ||||||||||||||||||
| Income tax expense, computed at the statutory rate of 21% | $ | $ | $ | $ | $ | $ | $ | $ | ||||||||||||||||||
| State income tax, net of federal income tax effect | ( | |||||||||||||||||||||||||
Amortization of EDIT | ( | ( | ( | ( | ( | ( | ( | ( | ||||||||||||||||||
| AFUDC equity income | ( | ( | ( | ( | ( | ( | ( | ( | ||||||||||||||||||
| AFUDC equity depreciation | — | |||||||||||||||||||||||||
Tax credits(b) | ( | ( | ( | ( | ( | ( | ( | ( | ||||||||||||||||||
Interest on company-owned life insurance(a) | ( | — | — | — | — | — | — | — | ||||||||||||||||||
| Other items, net | ( | — | ( | ( | ( | ( | — | |||||||||||||||||||
| Income tax expense from continuing operations | $ | $ | $ | $ | $ | $ | $ | $ | ||||||||||||||||||
| Effective tax rate | % | % | % | % | % | % | % | % | ||||||||||||||||||
(a) During 2023, the Company evaluated the deductibility of certain items spanning periods currently open under federal statute, including items related to interest on company-owned life insurance. As a result of this analysis, the Company recorded a favorable federal adjustment of approximately $114 million and a favorable state adjustment of approximately $6 million. The favorable state adjustment is included in State income tax, net of federal income tax effect, in the above table.
(b) Tax credits at Progress Energy and Duke Energy Florida include $28 million of certain eligible PTCs, net of discount, that were elected to be sold in 2023 under the transferability provisions of the IRA. Cash received and paid related to the transfer of tax credits is included in Cash paid for (received from) income taxes on the Consolidated Statements of Cash Flows.
| Year Ended December 31, 2022 | ||||||||||||||||||||||||||
| Duke | Duke | Duke | Duke | Duke | ||||||||||||||||||||||
| Duke | Energy | Progress | Energy | Energy | Energy | Energy | ||||||||||||||||||||
| (in millions) | Energy | Carolinas | Energy | Progress | Florida | Ohio | Indiana | Piedmont | ||||||||||||||||||
| Income tax expense, computed at the statutory rate of 21% | $ | $ | $ | $ | $ | $ | $ | $ | ||||||||||||||||||
| State income tax, net of federal income tax effect | ( | ( | ( | |||||||||||||||||||||||
Amortization of EDIT | ( | ( | ( | ( | ( | ( | ( | ( | ||||||||||||||||||
| AFUDC equity income | ( | ( | ( | ( | ( | ( | ( | ( | ||||||||||||||||||
| AFUDC equity depreciation | — | |||||||||||||||||||||||||
| Other tax credits | ( | ( | ( | ( | ( | ( | ( | ( | ||||||||||||||||||
| Other items, net | ( | ( | ( | ( | ( | ( | — | |||||||||||||||||||
Income tax expense (benefit) from continuing operations | $ | $ | $ | $ | $ | $ | ( | $ | ( | $ | ||||||||||||||||
| Effective tax rate | % | % | % | % | % | ( | % | ( | % | % | ||||||||||||||||
222
| FINANCIAL STATEMENTS | INCOME TAXES | ||||
| Year Ended December 31, 2021 | ||||||||||||||||||||||||||
| Duke | Duke | Duke | Duke | Duke | ||||||||||||||||||||||
| Duke | Energy | Progress | Energy | Energy | Energy | Energy | ||||||||||||||||||||
| (in millions) | Energy | Carolinas | Energy | Progress | Florida | Ohio | Indiana | Piedmont | ||||||||||||||||||
| Income tax expense, computed at the statutory rate of 21% | $ | $ | $ | $ | $ | $ | $ | $ | ||||||||||||||||||
| State income tax, net of federal income tax effect | ( | ( | ( | |||||||||||||||||||||||
Amortization of EDIT | ( | ( | ( | ( | ( | ( | ( | ( | ||||||||||||||||||
| AFUDC equity income | ( | ( | ( | ( | ( | ( | ( | ( | ||||||||||||||||||
| AFUDC equity depreciation | — | |||||||||||||||||||||||||
| Other tax credits | ( | ( | ( | ( | ( | ( | ( | ( | ||||||||||||||||||
Valuation allowance(a) | ( | — | — | — | — | — | — | — | ||||||||||||||||||
| Other items, net | ( | ( | ( | ( | — | |||||||||||||||||||||
Income tax expense from continuing operations | $ | $ | $ | $ | $ | $ | $ | $ | ||||||||||||||||||
| Effective tax rate | % | % | % | % | % | % | % | % | ||||||||||||||||||
(a) In 2021, the Company recognized a federal capital gain in the amount of $426 million. As a result, a valuation allowance of $85 million related to a federal capital loss carryforward was released. This valuation allowance was originally recorded as a result of the 2019 sale of minority interest of certain renewable assets within the Commercial Renewables Disposal Groups.
Valuation allowances have been established for certain state NOL carryforwards and state income tax credits that reduce deferred tax assets to an amount that will be realized on a more-likely-than-not basis. The net change in the total valuation allowance is included in state income tax, net of federal income tax effect, in the above tables.
DEFERRED TAXES
Net Deferred Income Tax Liability Components
| December 31, 2023 | ||||||||||||||||||||||||||
| Duke | Duke | Duke | Duke | Duke | ||||||||||||||||||||||
| Duke | Energy | Progress | Energy | Energy | Energy | Energy | ||||||||||||||||||||
| (in millions) | Energy | Carolinas | Energy | Progress | Florida | Ohio | Indiana | Piedmont | ||||||||||||||||||
| Deferred credits and other liabilities | $ | $ | $ | $ | $ | $ | $ | $ | ||||||||||||||||||
| Lease obligations | ||||||||||||||||||||||||||
| Pension, post-retirement and other employee benefits | ( | ( | ( | ( | ( | |||||||||||||||||||||
Progress Energy merger purchase accounting adjustments(a) | — | — | — | — | — | — | — | |||||||||||||||||||
| Tax credits and NOL carryforwards | ||||||||||||||||||||||||||
| Regulatory liabilities and deferred credits | — | — | — | — | — | — | — | |||||||||||||||||||
| Investments and other assets | — | — | — | — | — | — | — | |||||||||||||||||||
| Other | ||||||||||||||||||||||||||
| Valuation allowance | ( | — | — | — | — | — | — | — | ||||||||||||||||||
| Total deferred income tax assets | ||||||||||||||||||||||||||
| Investments and other assets | ( | ( | ( | ( | ( | — | — | ( | ||||||||||||||||||
| Accelerated depreciation rates | ( | ( | ( | ( | ( | ( | ( | ( | ||||||||||||||||||
| Regulatory assets and deferred debits, net | ( | ( | ( | ( | ( | ( | — | ( | ||||||||||||||||||
| Total deferred income tax liabilities | ( | ( | ( | ( | ( | ( | ( | ( | ||||||||||||||||||
| Net deferred income tax liabilities | $ | ( | $ | ( | $ | ( | $ | ( | $ | ( | $ | ( | $ | ( | $ | ( | ||||||||||
(a) Primarily related to lease obligations and debt fair value adjustments.
223
| FINANCIAL STATEMENTS | INCOME TAXES | ||||
The following table presents the expiration of tax credits and NOL carryforwards.
| December 31, 2023 | |||||||||||||||||||||||
| (in millions) | Amount | Expiration Year | |||||||||||||||||||||
| General Business Credits | $ | 2029 | — | 2043 | |||||||||||||||||||
Foreign Tax Credits(d) | 2024 | — | 2028 | ||||||||||||||||||||
State Carryforwards and Credits(b) (e) | 2024 | — | Indefinite | ||||||||||||||||||||
Corporate AMT Credits | Indefinite | ||||||||||||||||||||||
Federal Capital Loss(f) | 2027 | — | 2028 | ||||||||||||||||||||
Federal NOL carryforwards(a) (e) | 2024 | — | Indefinite | ||||||||||||||||||||
Foreign NOL carryforwards(c) | 2027 | — | 2038 | ||||||||||||||||||||
| Total tax credits and NOL carryforwards | $ | ||||||||||||||||||||||
(a) A valuation allowance of $4 million has been recorded on the Federal NOL carryforwards, as presented in the Net Deferred Income Tax Liability Components table.
(b) A valuation allowance of $110 million has been recorded on the state NOL and attribute carryforwards, as presented in the Net Deferred Income Tax Liability Components table.
(c) A valuation allowance of $12 million has been recorded on the foreign NOL carryforwards, as presented in the Net Deferred Income Tax Liability Components table.
(d) A valuation allowance of $389 million has been recorded on the foreign tax credits, as presented in the Net Deferred Income Tax Liability Components table.
(e) Indefinite carryforward for Federal NOLs, and NOLs for states that have adopted the Tax Act's NOL provisions, generated in tax years beginning after December 31, 2017.
(f) A valuation allowance of $29 million has been recorded on the Federal Capital Loss, as presented in the Net Deferred Income Tax Liability Components table.
| December 31, 2022 | ||||||||||||||||||||||||||
| Duke | Duke | Duke | Duke | Duke | ||||||||||||||||||||||
| Duke | Energy | Progress | Energy | Energy | Energy | Energy | ||||||||||||||||||||
| (in millions) | Energy | Carolinas | Energy | Progress | Florida | Ohio | Indiana | Piedmont | ||||||||||||||||||
| Deferred credits and other liabilities | $ | $ | $ | $ | $ | $ | $ | $ | ||||||||||||||||||
| Lease obligations | ||||||||||||||||||||||||||
| Pension, post-retirement and other employee benefits | ( | ( | ( | |||||||||||||||||||||||
Progress Energy merger purchase accounting adjustments(a) | — | — | — | — | — | — | — | |||||||||||||||||||
| Tax credits and NOL carryforwards | ||||||||||||||||||||||||||
| Regulatory liabilities and deferred credits | — | — | — | — | — | — | ||||||||||||||||||||
| Investments and other assets | — | — | — | — | — | — | — | |||||||||||||||||||
| Other | ||||||||||||||||||||||||||
| Valuation allowance | ( | — | — | — | — | — | — | — | ||||||||||||||||||
| Total deferred income tax assets | ||||||||||||||||||||||||||
| Investments and other assets | ( | ( | ( | ( | ( | — | ( | ( | ||||||||||||||||||
| Accelerated depreciation rates | ( | ( | ( | ( | ( | ( | ( | ( | ||||||||||||||||||
| Regulatory assets and deferred debits, net | ( | ( | ( | ( | ( | — | — | ( | ||||||||||||||||||
| Total deferred income tax liabilities | ( | ( | ( | ( | ( | ( | ( | ( | ||||||||||||||||||
| Net deferred income tax liabilities | $ | ( | $ | ( | $ | ( | $ | ( | $ | ( | $ | ( | $ | ( | $ | ( | ||||||||||
(a) Primarily related to lease obligations and debt fair value adjustments.
224
| FINANCIAL STATEMENTS | INCOME TAXES | ||||
UNRECOGNIZED TAX BENEFITS
The following tables present changes to unrecognized tax benefits.
| Year Ended December 31, 2023 | ||||||||||||||||||||||||||
| Duke | Duke | Duke | Duke | Duke | ||||||||||||||||||||||
| Duke | Energy | Progress | Energy | Energy | Energy | Energy | ||||||||||||||||||||
| (in millions) | Energy | Carolinas | Energy | Progress | Florida | Ohio | Indiana | Piedmont | ||||||||||||||||||
| Unrecognized tax benefits – January 1 | $ | $ | $ | $ | $ | $ | $ | $ | ||||||||||||||||||
| Gross decreases – tax positions in prior periods | ( | — | — | — | — | — | — | — | ||||||||||||||||||
| Gross increases – current period tax positions | ||||||||||||||||||||||||||
| Total changes | ( | |||||||||||||||||||||||||
| Unrecognized tax benefits – December 31 | $ | $ | $ | $ | $ | $ | $ | $ | ||||||||||||||||||
| Year Ended December 31, 2022 | ||||||||||||||||||||||||||
| Duke | Duke | Duke | Duke | Duke | ||||||||||||||||||||||
| Duke | Energy | Progress | Energy | Energy | Energy | Energy | ||||||||||||||||||||
| (in millions) | Energy | Carolinas | Energy | Progress | Florida | Ohio | Indiana | Piedmont | ||||||||||||||||||
| Unrecognized tax benefits – January 1 | $ | $ | $ | $ | $ | $ | $ | $ | ||||||||||||||||||
| Gross increases – current period tax positions | — | — | ||||||||||||||||||||||||
| Total changes | — | — | ||||||||||||||||||||||||
| Unrecognized tax benefits – December 31 | $ | $ | $ | $ | $ | $ | $ | $ | ||||||||||||||||||
| Year Ended December 31, 2021 | ||||||||||||||||||||||||||
| Duke | Duke | Duke | Duke | Duke | ||||||||||||||||||||||
| Duke | Energy | Progress | Energy | Energy | Energy | Energy | ||||||||||||||||||||
| (in millions) | Energy | Carolinas | Energy | Progress | Florida | Ohio | Indiana | Piedmont | ||||||||||||||||||
| Unrecognized tax benefits – January 1 | $ | $ | $ | $ | $ | $ | $ | $ | ||||||||||||||||||
Gross decreases – tax positions in prior periods(a) | ( | — | — | — | — | — | — | — | ||||||||||||||||||
| Gross increases – current period tax positions | — | |||||||||||||||||||||||||
| Total changes | ( | — | ||||||||||||||||||||||||
| Unrecognized tax benefits – December 31 | $ | $ | $ | $ | $ | $ | $ | $ | ||||||||||||||||||
(a) In 2021, the Company recognized a federal capital gain in the amount of $426 million. As a result of the capital gain, a previously recorded unrecognized tax benefit related to the character of a taxable loss has been reversed. See note (a) under the Statutory Rate Reconciliation table for more details.
The following table includes additional information regarding the Duke Energy Registrants' unrecognized tax benefits at December 31, 2023. None of Duke Energy Registrants anticipates a material increase or decrease in unrecognized tax benefits within the next 12 months.
| December 31, 2023 | ||||||||||||||||||||||||||
| Duke | Duke | Duke | Duke | Duke | ||||||||||||||||||||||
| Duke | Energy | Progress | Energy | Energy | Energy | Energy | ||||||||||||||||||||
| (in millions) | Energy | Carolinas | Energy | Progress | Florida | Ohio | Indiana | Piedmont | ||||||||||||||||||
Amount that if recognized, would affect the effective tax rate or regulatory liability(a) | $ | $ | $ | $ | $ | $ | $ | $ | ||||||||||||||||||
(a) The Duke Energy Registrants are unable to estimate the specific amounts that would affect the ETR versus the regulatory liability.
Duke Energy and its subsidiaries are no longer subject to federal, state, local or non-U.S. income tax examinations by tax authorities for years before 2018, aside from certain tax attributes carried forward for utilization in future years.
225
| FINANCIAL STATEMENTS | OTHER INCOME AND EXPENSES, NET | ||||
25. OTHER INCOME AND EXPENSES, NET
The components of Other income and expenses, net on the Consolidated Statements of Operations are as follows.
| Year Ended December 31, 2023 | |||||||||||||||||||||||||||||||||||||||||||||||
| Duke | Duke | Duke | Duke | Duke | |||||||||||||||||||||||||||||||||||||||||||
| Duke | Energy | Progress | Energy | Energy | Energy | Energy | |||||||||||||||||||||||||||||||||||||||||
(in millions) | Energy | Carolinas | Energy | Progress | Florida | Ohio | Indiana | Piedmont | |||||||||||||||||||||||||||||||||||||||
| Interest income | $ | $ | $ | $ | $ | $ | $ | $ | |||||||||||||||||||||||||||||||||||||||
| AFUDC equity | |||||||||||||||||||||||||||||||||||||||||||||||
Post-in-service equity returns | — | — | — | ||||||||||||||||||||||||||||||||||||||||||||
| Nonoperating income, other | |||||||||||||||||||||||||||||||||||||||||||||||
| Other income and expense, net | $ | $ | $ | $ | $ | $ | $ | $ | |||||||||||||||||||||||||||||||||||||||
| Year Ended December 31, 2022 | |||||||||||||||||||||||||||||||||||||||||||||||
| Duke | Duke | Duke | Duke | Duke | |||||||||||||||||||||||||||||||||||||||||||
| Duke | Energy | Progress | Energy | Energy | Energy | Energy | |||||||||||||||||||||||||||||||||||||||||
(in millions) | Energy | Carolinas | Energy | Progress | Florida | Ohio | Indiana | Piedmont | |||||||||||||||||||||||||||||||||||||||
| Interest income | $ | $ | $ | $ | $ | $ | $ | $ | |||||||||||||||||||||||||||||||||||||||
| AFUDC equity | |||||||||||||||||||||||||||||||||||||||||||||||
Post-in-service equity returns | — | — | |||||||||||||||||||||||||||||||||||||||||||||
| Nonoperating income, other | — | ||||||||||||||||||||||||||||||||||||||||||||||
| Other income and expense, net | $ | $ | $ | $ | $ | $ | $ | $ | |||||||||||||||||||||||||||||||||||||||
| Year Ended December 31, 2021 | |||||||||||||||||||||||||||||||||||||||||||||||
| Duke | Duke | Duke | Duke | Duke | |||||||||||||||||||||||||||||||||||||||||||
| Duke | Energy | Progress | Energy | Energy | Energy | Energy | |||||||||||||||||||||||||||||||||||||||||
(in millions) | Energy | Carolinas | Energy | Progress | Florida | Ohio | Indiana | Piedmont | |||||||||||||||||||||||||||||||||||||||
| Interest income | $ | $ | $ | $ | $ | $ | $ | $ | |||||||||||||||||||||||||||||||||||||||
| AFUDC equity | |||||||||||||||||||||||||||||||||||||||||||||||
Post-in-service equity returns | — | — | |||||||||||||||||||||||||||||||||||||||||||||
| Nonoperating income, other | |||||||||||||||||||||||||||||||||||||||||||||||
| Other income and expense, net | $ | $ | $ | $ | $ | $ | $ | $ | |||||||||||||||||||||||||||||||||||||||
26. SUBSEQUENT EVENTS
For information on subsequent events related to regulatory matters, commitments and contingencies, debt and credit facilities, and asset retirement obligations, see Notes 4, 5, 7 and 10, respectively.
226
| FINANCIAL STATEMENTS | QUARTERLY FINANCIAL DATA (UNAUDITED) | ||||
27. QUARTERLY FINANCIAL DATA (UNAUDITED)
DUKE ENERGY
Quarterly EPS amounts may not sum to the full-year total due to changes in the weighted average number of common shares outstanding and rounding.
| First | Second | Third | Fourth | ||||||||||||||||||||||||||
| (in millions, except per share data) | Quarter | Quarter | Quarter | Quarter | Total | ||||||||||||||||||||||||
| 2023 | |||||||||||||||||||||||||||||
| Operating revenues | $ | $ | $ | $ | $ | ||||||||||||||||||||||||
| Operating income | |||||||||||||||||||||||||||||
| Income from continuing operations | |||||||||||||||||||||||||||||
Loss from discontinued operations, net of tax | ( | ( | ( | ( | ( | ||||||||||||||||||||||||
| Net income (loss) | ( | ||||||||||||||||||||||||||||
| Net income (loss) available to Duke Energy Corporation common stockholders | ( | ||||||||||||||||||||||||||||
| Earnings per share: | |||||||||||||||||||||||||||||
| Income from continuing operations available to Duke Energy Corporation common stockholders | |||||||||||||||||||||||||||||
| Basic and diluted | $ | $ | $ | $ | $ | ||||||||||||||||||||||||
Loss from discontinued operations attributable to Duke Energy Corporation common stockholders | |||||||||||||||||||||||||||||
| Basic and diluted | $ | ( | $ | ( | $ | ( | $ | ( | $ | ( | |||||||||||||||||||
| Net income (loss) available to Duke Energy Corporation common stockholders | |||||||||||||||||||||||||||||
| Basic and diluted | $ | $ | ( | $ | $ | $ | |||||||||||||||||||||||
| 2022 | |||||||||||||||||||||||||||||
| Operating revenues | $ | $ | $ | $ | $ | ||||||||||||||||||||||||
| Operating income | |||||||||||||||||||||||||||||
| Income from continuing operations | |||||||||||||||||||||||||||||
(Loss) Income from discontinued operations, net of tax | ( | ( | ( | ( | |||||||||||||||||||||||||
Net income (loss) | ( | ||||||||||||||||||||||||||||
Net income (loss) available to Duke Energy Corporation common stockholders | ( | ||||||||||||||||||||||||||||
| Earnings per share: | |||||||||||||||||||||||||||||
| Income from continuing operations available to Duke Energy Corporation common stockholders | |||||||||||||||||||||||||||||
| Basic and diluted | $ | $ | $ | $ | $ | ||||||||||||||||||||||||
Income (Loss) from discontinued operations attributable to Duke Energy Corporation common stockholders | |||||||||||||||||||||||||||||
| Basic and diluted | $ | $ | $ | $ | ( | $ | ( | ||||||||||||||||||||||
Net income (loss) available to Duke Energy Corporation common stockholders | |||||||||||||||||||||||||||||
| Basic and diluted | $ | $ | $ | $ | ( | $ | |||||||||||||||||||||||
227
| INDEPENDENT ACCOUNTANTS | |||||
ITEM 9. CHANGES IN AND DISAGREEMENTS WITH ACCOUNTANTS ON ACCOUNTING AND FINANCIAL DISCLOSURE
None.
ITEM 9A. CONTROLS AND PROCEDURES
Disclosure Controls and Procedures
Disclosure controls and procedures are controls and other procedures that are designed to ensure that information required to be disclosed by the Duke Energy Registrants in the reports they file or submit under the Exchange Act is recorded, processed, summarized and reported, within the time periods specified by the SEC rules and forms.
Disclosure controls and procedures include, without limitation, controls and procedures designed to provide reasonable assurance that information required to be disclosed by the Duke Energy Registrants in the reports they file or submit under the Exchange Act is accumulated and communicated to management, including the Chief Executive Officer and Chief Financial Officer, as appropriate, to allow timely decisions regarding required disclosure.
Under the supervision and with the participation of management, including the Chief Executive Officer and Chief Financial Officer, the Duke Energy Registrants have evaluated the effectiveness of their disclosure controls and procedures (as such term is defined in Rule 13a-15(e) and 15d-15(e) under the Exchange Act) as of December 31, 2023, and, based upon this evaluation, the Chief Executive Officer and Chief Financial Officer have concluded that these controls and procedures are effective in providing reasonable assurance of compliance.
Changes in Internal Control Over Financial Reporting
Under the supervision and with the participation of management, including the Chief Executive Officer and Chief Financial Officer, the Duke Energy Registrants have evaluated changes in internal control over financial reporting (as such term is defined in Rules 13a-15 and 15d-15 under the Exchange Act) that occurred during the fiscal quarter ended December 31, 2023, and have concluded no change has materially affected, or is reasonably likely to materially affect, internal controls over financial reporting.
Management’s Annual Report on Internal Control Over Financial Reporting
The Duke Energy Registrants’ management is responsible for establishing and maintaining an adequate system of internal control over financial reporting, as such term is defined in Exchange Act Rules 13a-15(f) and 15d-15(f). The Duke Energy Registrants’ internal control system was designed to provide reasonable assurance regarding the reliability of financial reporting and the preparation of financial statements for external purposes, in accordance with GAAP. Due to inherent limitations, internal control over financial reporting may not prevent or detect misstatements. Also, projections of any evaluation of effectiveness of the internal control over financial reporting to future periods are subject to the risk that controls may become inadequate because of changes in conditions, or that the degree of compliance with policies and procedures may deteriorate.
The Duke Energy Registrants’ management, including their Chief Executive Officer and Chief Financial Officer, has conducted an evaluation of the effectiveness of their internal control over financial reporting as of December 31, 2023, based on the framework in the Internal Control – Integrated Framework (2013) issued by the Committee of Sponsoring Organizations of the Treadway Commission. Based on that evaluation, management concluded that its internal controls over financial reporting were effective as of December 31, 2023.
Deloitte & Touche LLP, Duke Energy’s independent registered public accounting firm, has issued an attestation report on the effectiveness of Duke Energy’s internal control over financial reporting, which is included herein. This report is not applicable to the Subsidiary Registrants as these companies are not accelerated or large accelerated filers.
228
| REPORTS | |||||
REPORT OF INDEPENDENT REGISTERED PUBLIC ACCOUNTING FIRM
To the shareholders and the Board of Directors of Duke Energy Corporation
Opinion on Internal Control over Financial Reporting
We have audited the internal control over financial reporting of Duke Energy Corporation and subsidiaries (the “Company”) as of December 31, 2023, based on criteria established in Internal Control — Integrated Framework (2013) issued by the Committee of Sponsoring Organizations of the Treadway Commission (COSO). In our opinion, the Company maintained, in all material respects, effective internal control over financial reporting as of December 31, 2023, based on criteria established in Internal Control — Integrated Framework (2013) issued by COSO.
We have also audited, in accordance with the standards of the Public Company Accounting Oversight Board (United States) (PCAOB), the consolidated financial statements as of and for the year ended December 31, 2023, of the Company and our report dated February 23, 2024, expressed an unqualified opinion on those financial statements.
Basis for Opinion
The Company’s management is responsible for maintaining effective internal control over financial reporting and for its assessment of the effectiveness of internal control over financial reporting, included in the accompanying Management's Annual Report on Internal Control Over Financial Reporting. Our responsibility is to express an opinion on the Company’s internal control over financial reporting based on our audit. We are a public accounting firm registered with the PCAOB and are required to be independent with respect to the Company in accordance with the U.S. federal securities laws and the applicable rules and regulations of the Securities and Exchange Commission and the PCAOB.
We conducted our audit in accordance with the standards of the PCAOB. Those standards require that we plan and perform the audit to obtain reasonable assurance about whether effective internal control over financial reporting was maintained in all material respects. Our audit included obtaining an understanding of internal control over financial reporting, assessing the risk that a material weakness exists, testing and evaluating the design and operating effectiveness of internal control based on the assessed risk, and performing such other procedures as we considered necessary in the circumstances. We believe that our audit provides a reasonable basis for our opinion.
Definition and Limitations of Internal Control over Financial Reporting
A company’s internal control over financial reporting is a process designed to provide reasonable assurance regarding the reliability of financial reporting and the preparation of financial statements for external purposes in accordance with generally accepted accounting principles. A company’s internal control over financial reporting includes those policies and procedures that (1) pertain to the maintenance of records that, in reasonable detail, accurately and fairly reflect the transactions and dispositions of the assets of the company; (2) provide reasonable assurance that transactions are recorded as necessary to permit preparation of financial statements in accordance with generally accepted accounting principles, and that receipts and expenditures of the company are being made only in accordance with authorizations of management and directors of the company; and (3) provide reasonable assurance regarding prevention or timely detection of unauthorized acquisition, use, or disposition of the company’s assets that could have a material effect on the financial statements.
Because of its inherent limitations, internal control over financial reporting may not prevent or detect misstatements. Also, projections of any evaluation of effectiveness to future periods are subject to the risk that controls may become inadequate because of changes in conditions, or that the degree of compliance with the policies or procedures may deteriorate.
/s/ Deloitte and Touche LLP
Charlotte, North Carolina
February 23, 2024
229
| OTHER INFORMATION | |||||
ITEM 9B. OTHER INFORMATION
During the three months ended December 31, 2023, no director or officer of the Company adopted terminated
ITEM 10. DIRECTORS, EXECUTIVE OFFICERS AND CORPORATE GOVERNANCE
Information regarding Duke Energy's Executive Officers is set forth in Part I, Item 1, "Business – Information about Our Executive Officers," in this Annual Report. Duke Energy will provide information that is responsive to the remainder of this Item 10 in its definitive proxy statement or in an amendment to this Annual Report not later than 120 days after the end of the fiscal year covered by this Annual Report. That information is incorporated in this Item 10 by reference.
ITEM 11. EXECUTIVE COMPENSATION
Duke Energy will provide information that is responsive to this Item 11 in its definitive proxy statement or in an amendment to this Annual Report not later than 120 days after the end of the fiscal year covered by this Annual Report. That information is incorporated in this Item 11 by reference.
ITEM 12. SECURITY OWNERSHIP OF CERTAIN BENEFICIAL OWNERS AND MANAGEMENT AND RELATED STOCKHOLDER MATTERS
Equity Compensation Plan Information
The following table shows information as of December 31, 2023, about securities to be issued upon exercise of outstanding options, warrants and rights under Duke Energy's equity compensation plans, along with the weighted average exercise price of the outstanding options, warrants and rights and the number of securities remaining available for future issuance under the plans.
| Plan Category | Number of securities to be issued upon exercise of outstanding options, warrants and rights (a) | Weighted average exercise price of outstanding options, warrants and rights (b)(1) | Number of securities remaining available for future issuance under equity compensation plans (excluding securities reflected in column (a)) (c) | ||||||||||||||
Equity compensation plans approved by security holders | 3,586,377 | (2) | n/a | 14,990,958 | (3) | ||||||||||||
Equity compensation plans not approved by security holders | 104,831 | (4) | n/a | n/a | (5) | ||||||||||||
Total | 3,691,208 | n/a | 14,990,958 | ||||||||||||||
(1) As of December 31, 2023, no options were outstanding under equity compensation plans.
(2) Includes RSUs and performance shares (assuming the maximum payout level) granted under the Duke Energy Corporation 2015 Long-Term Incentive Plan or the Duke Energy Corporation 2023 Long-Term Incentive Plan, as well as shares that could be payable with respect to certain compensation deferred under the Duke Energy Corporation Executive Savings Plan (Executive Savings Plan) or the Directors’ Savings Plan.
(3) Includes shares remaining available for issuance pursuant to stock awards under the Duke Energy Corporation 2023 Long-Term Incentive Plan. The Duke Energy Corporation 2015 Long-Term Incentive Plan is no longer available for the grant of additional stock awards.
(4) Includes shares that could be payable with respect to certain compensation deferred under the Executive Savings Plan or the Duke Energy Corporation Directors' Savings Plan (Directors' Savings Plan), each of which is a non-qualified deferred compensation plan described in more detail below.
(5) The number of shares remaining available for future issuance under equity compensation plans not approved by security holders cannot be determined because it is based on the amount of future voluntary deferrals, if any, under the Executive Savings Plan and the Directors' Savings Plan.
Under the Executive Savings Plan, participants can elect to defer a portion of their base salary and short‑term incentive compensation. Participants also receive a company matching contribution in excess of the contribution limits prescribed by the Internal Revenue Code under the Duke Energy Retirement Savings Plan, which is the 401(k) plan in which employees are generally eligible to participate. Eligible participants may also earn pay credits based on age and length of service on eligible earnings that exceed limits prescribed by the Internal Revenue Code.
In general, payments are made following termination of employment or death in the form of a lump sum or installments, as selected by the participant. Participants may direct the deemed investment of their accounts (with certain exceptions) among investment options available under the Duke Energy Retirement Savings Plan, including the Duke Energy Common Stock Fund. Participants may change their investment elections on a daily basis. Deferrals of equity awards are credited with earnings and losses based on the performance of the Duke Energy Common Stock Fund. The benefits payable under the plan are unfunded and subject to the claims of Duke Energy’s creditors.
Under the Directors’ Savings Plan, outside directors may elect to defer all or a portion of their annual compensation, generally consisting of retainers. Deferred amounts are credited to an unfunded account, the balance of which is adjusted for the performance of phantom investment options, including the Duke Energy Common Stock Fund, as elected by the director, and generally are paid when the director terminates his or her service from the Board of Directors.
230
| OTHER INFORMATION | |||||
Duke Energy will provide additional information that is responsive to this Item 12 in its definitive proxy statement or in an amendment to this Annual Report not later than 120 days after the end of the fiscal year covered by this Annual Report. That information is incorporated in this Item 12 by reference.
ITEM 13. CERTAIN RELATIONSHIPS AND RELATED TRANSACTIONS AND DIRECTOR INDEPENDENCE
Duke Energy will provide information that is responsive to this Item 13 in its definitive proxy statement or in an amendment to this Annual Report not later than 120 days after the end of the fiscal year covered by this Annual Report. That information is incorporated in this Item 13 by reference.
ITEM 14. PRINCIPAL ACCOUNTING FEES AND SERVICES
Deloitte provided professional services to the Duke Energy Registrants. The following tables present the Deloitte fees for services rendered to the Duke Energy Registrants during 2023 and 2022.
| Year Ended December 31, 2023 | |||||||||||||||||||||||||||||||||||||||||||||||
| Duke | Duke | Duke | Duke | Duke | |||||||||||||||||||||||||||||||||||||||||||
| Duke | Energy | Progress | Energy | Energy | Energy | Energy | |||||||||||||||||||||||||||||||||||||||||
| (in millions) | Energy | Carolinas | Energy | Progress | Florida | Ohio | Indiana | Piedmont | |||||||||||||||||||||||||||||||||||||||
| Types of Fees | |||||||||||||||||||||||||||||||||||||||||||||||
Audit Fees(a) | $ | 14.0 | $ | 3.3 | $ | 5.0 | $ | 2.5 | $ | 2.5 | $ | 2.1 | $ | 1.8 | $ | 1.4 | |||||||||||||||||||||||||||||||
Audit-Related Fees(b) | 0.5 | 0.1 | 0.2 | 0.1 | 0.1 | 0.2 | — | — | |||||||||||||||||||||||||||||||||||||||
| Total Fees | $ | 14.5 | $ | 3.4 | $ | 5.2 | $ | 2.6 | $ | 2.6 | $ | 2.3 | $ | 1.8 | $ | 1.4 | |||||||||||||||||||||||||||||||
| Year Ended December 31, 2022 | |||||||||||||||||||||||||||||||||||||||||||||||
| Duke | Duke | Duke | Duke | Duke | |||||||||||||||||||||||||||||||||||||||||||
| Duke | Energy | Progress | Energy | Energy | Energy | Energy | |||||||||||||||||||||||||||||||||||||||||
| (in millions) | Energy | Carolinas | Energy | Progress | Florida | Ohio | Indiana | Piedmont | |||||||||||||||||||||||||||||||||||||||
| Types of Fees | |||||||||||||||||||||||||||||||||||||||||||||||
Audit Fees(a) | $ | 13.7 | $ | 3.2 | $ | 4.9 | $ | 2.5 | $ | 2.4 | $ | 2.0 | $ | 1.8 | $ | 1.3 | |||||||||||||||||||||||||||||||
Audit-Related Fees(b) | 1.7 | 0.1 | 0.2 | 0.1 | 0.1 | 0.2 | — | — | |||||||||||||||||||||||||||||||||||||||
| Total Fees | $ | 15.4 | $ | 3.3 | $ | 5.1 | $ | 2.6 | $ | 2.5 | $ | 2.2 | $ | 1.8 | $ | 1.3 | |||||||||||||||||||||||||||||||
(a) Audit Fees are fees billed, or expected to be billed, by Deloitte for professional services for the financial statement audits, audit of the Duke Energy Registrants’ financial statements included in Duke Energy's Annual Report on Form 10-K, reviews of financial statements included in Quarterly Reports on Form 10‑Q, and services associated with securities filings such as comfort letters and consents.
(b) Audit-Related Fees are fees billed, or expected to be billed, by Deloitte for assurance and related services that are reasonably related to the performance of an audit or review of financial statements, including statutory reporting requirements.
To safeguard the continued independence of the independent auditor, the Audit Committee of Duke Energy adopted a policy that all services provided by the independent auditor require preapproval by the Audit Committee. Pursuant to the policy, certain audit services, audit-related services, tax services and other services have been specifically preapproved up to fee limits. In the event the cost of any of these services may exceed the fee limits, the Audit Committee must specifically approve the service. All services performed in 2023 and 2022 by the independent accountant were approved by the Audit Committee pursuant to the preapproval policy.
231
| EXHIBITS | |||||
ITEM 15. EXHIBITS AND FINANCIAL STATEMENT SCHEDULES
(a) Consolidated Financial Statements and Supplemental Schedules included in Part II of this Annual Report are as follows:
Duke Energy Corporation
Consolidated Financial Statements
Consolidated Statements of Operations for the Years Ended December 31, 2023, 2022 and 2021
Consolidated Statements of Comprehensive Income for the Years Ended December 31, 2023, 2022 and 2021
Consolidated Balance Sheets as of December 31, 2023, and 2022
Consolidated Statements of Cash Flows for the Years Ended December 31, 2023, 2022 and 2021
Consolidated Statements of Changes in Equity for the Years Ended December 31, 2023, 2022 and 2021
Notes to the Consolidated Financial Statements
Report of Independent Registered Public Accounting Firm
All other schedules are omitted because they are not required, or because the required information is included in the Consolidated Financial Statements or Notes.
Duke Energy Carolinas, LLC
Consolidated Financial Statements
Consolidated Statements of Operations and Comprehensive Income for the Years Ended December 31, 2023, 2022 and 2021
Consolidated Balance Sheets as of December 31, 2023, and 2022
Consolidated Statements of Cash Flows for the Years Ended December 31, 2023, 2022 and 2021
Consolidated Statements of Changes in Equity for the Years Ended December 31, 2023, 2022 and 2021
Notes to the Consolidated Financial Statements
Report of Independent Registered Public Accounting Firm
All other schedules are omitted because they are not required, or because the required information is included in the Consolidated Financial Statements or Notes.
Progress Energy, Inc.
Consolidated Financial Statements
Consolidated Statements of Operations and Comprehensive Income for the Years Ended December 31, 2023, 2022 and 2021
Consolidated Balance Sheets as of December 31, 2023, and 2022
Consolidated Statements of Cash Flows for the Years Ended December 31, 2023, 2022 and 2021
Consolidated Statements of Changes in Equity for the Years Ended December 31, 2023, 2022 and 2021
Notes to the Consolidated Financial Statements
Report of Independent Registered Public Accounting Firm
All other schedules are omitted because they are not required, or because the required information is included in the Consolidated Financial Statements or Notes.
Duke Energy Progress, LLC
Consolidated Financial Statements
Consolidated Statements of Operations and Comprehensive Income for the Years Ended December 31, 2023, 2022 and 2021
Consolidated Balance Sheets as of December 31, 2023, and 2022
Consolidated Statements of Cash Flows for the Years Ended December 31, 2023, 2022 and 2021
Consolidated Statements of Changes in Equity for the Years Ended December 31, 2023, 2022 and 2021
Notes to the Consolidated Financial Statements
Report of Independent Registered Public Accounting Firm
All other schedules are omitted because they are not required, or because the required information is included in the Consolidated Financial Statements or Notes.
Duke Energy Florida, LLC
Consolidated Financial Statements
Consolidated Statements of Operations and Comprehensive Income for the Years Ended December 31, 2023, 2022 and 2021
Consolidated Balance Sheets as of December 31, 2023, and 2022
Consolidated Statements of Cash Flows for the Years Ended December 31, 2023, 2022 and 2021
Consolidated Statements of Changes in Equity for the Years Ended December 31, 2023, 2022 and 2021
Notes to the Consolidated Financial Statements
Report of Independent Registered Public Accounting Firm
All other schedules are omitted because they are not required, or because the required information is included in the Consolidated Financial Statements or Notes.
Duke Energy Ohio, Inc.
Consolidated Financial Statements
Consolidated Statements of Operations and Comprehensive Income for the Years Ended December 31, 2023, 2022 and 2021
Consolidated Balance Sheets as of December 31, 2023, and 2022
Consolidated Statements of Cash Flows for the Years Ended December 31, 2023, 2022 and 2021
Consolidated Statements of Changes in Equity for the Years Ended December 31, 2023, 2022 and 2021
Notes to the Consolidated Financial Statements
Report of Independent Registered Public Accounting Firm
All other schedules are omitted because they are not required, or because the required information is included in the Consolidated Financial Statements or Notes.
232
| EXHIBITS | |||||
Duke Energy Indiana, LLC
Consolidated Financial Statements
Consolidated Statements of Operations and Comprehensive Income for the Years Ended December 31, 2023, 2022 and 2021
Consolidated Balance Sheets as of December 31, 2023, and 2022
Consolidated Statements of Cash Flows for the Years Ended December 31, 2023, 2022 and 2021
Consolidated Statements of Changes in Equity for the Years Ended December 31, 2023, 2022 and 2021
Notes to the Consolidated Financial Statements
Report of Independent Registered Public Accounting Firm
All other schedules are omitted because they are not required, or because the required information is included in the Consolidated Financial Statements or Notes.
Piedmont Natural Gas Company, Inc.
Consolidated Financial Statements
Consolidated Statements of Operations and Comprehensive Income for the Years Ended December 31, 2023, 2022 and 2021
Consolidated Balance Sheets as of December 31, 2023, and 2022
Consolidated Statements of Cash Flows for the Years Ended December 31, 2023, 2022 and 2021
Consolidated Statements of Changes in Equity for the Years Ended December 31, 2023, 2022 and 2021
Notes to the Consolidated Financial Statements
Report of Independent Registered Public Accounting Firm
All other schedules are omitted because they are not required, or because the required information is included in the Consolidated Financial Statements or Notes.
233
| EXHIBITS | |||||
EXHIBIT INDEX
Exhibits filed herewith are designated by an asterisk (*). All exhibits not so designated are incorporated by reference to a prior filing, as indicated. Items constituting management contracts or compensatory plans or arrangements are designated by a double asterisk (**). The Company agrees to furnish upon request to the commission a copy of any omitted schedules or exhibits upon request on all items designated by a triple asterisk (***).
| Duke | Duke | Duke | Duke | Duke | ||||||||||||||||||||||||||||||||||||||||||||||
| Exhibit | Duke | Energy | Progress | Energy | Energy | Energy | Energy | |||||||||||||||||||||||||||||||||||||||||||
| Number | Energy | Carolinas | Energy | Progress | Florida | Ohio | Indiana | Piedmont | ||||||||||||||||||||||||||||||||||||||||||
| 2.1 | X | X | ||||||||||||||||||||||||||||||||||||||||||||||||
| 2.2 | X | X | ||||||||||||||||||||||||||||||||||||||||||||||||
| 3.1 | X | |||||||||||||||||||||||||||||||||||||||||||||||||
3.2 | X | |||||||||||||||||||||||||||||||||||||||||||||||||
| 3.3 | X | |||||||||||||||||||||||||||||||||||||||||||||||||
| 3.3.1 | X | |||||||||||||||||||||||||||||||||||||||||||||||||
| 3.4 | X | |||||||||||||||||||||||||||||||||||||||||||||||||
| 3.4.1 | X | |||||||||||||||||||||||||||||||||||||||||||||||||
| 3.5 | X | |||||||||||||||||||||||||||||||||||||||||||||||||
| 3.5.1 | X | |||||||||||||||||||||||||||||||||||||||||||||||||
| 3.5.2 | X | |||||||||||||||||||||||||||||||||||||||||||||||||
| 3.5.3 | X | |||||||||||||||||||||||||||||||||||||||||||||||||
| 3.5.4 | X | |||||||||||||||||||||||||||||||||||||||||||||||||
| 3.6 | X | |||||||||||||||||||||||||||||||||||||||||||||||||
| 3.7 | X | |||||||||||||||||||||||||||||||||||||||||||||||||
| 3.8 | X | |||||||||||||||||||||||||||||||||||||||||||||||||
| 3.8.1 | X | |||||||||||||||||||||||||||||||||||||||||||||||||
| 3.8.2 | X | |||||||||||||||||||||||||||||||||||||||||||||||||
| 3.9 | X | |||||||||||||||||||||||||||||||||||||||||||||||||
| 3.9.1 | X | |||||||||||||||||||||||||||||||||||||||||||||||||
| 3.9.2 | X | |||||||||||||||||||||||||||||||||||||||||||||||||
| 3.9.3 | X | |||||||||||||||||||||||||||||||||||||||||||||||||
| 3.10 | X | |||||||||||||||||||||||||||||||||||||||||||||||||
| 3.10.1 | X | |||||||||||||||||||||||||||||||||||||||||||||||||
| 3.10.2 | X | |||||||||||||||||||||||||||||||||||||||||||||||||
| 3.10.3 | X | |||||||||||||||||||||||||||||||||||||||||||||||||
| 3.11 | X | |||||||||||||||||||||||||||||||||||||||||||||||||
| 3.11.1 | X | |||||||||||||||||||||||||||||||||||||||||||||||||
| 3.12 | X | |||||||||||||||||||||||||||||||||||||||||||||||||
| 3.13 | X | |||||||||||||||||||||||||||||||||||||||||||||||||
| 3.14 | X | |||||||||||||||||||||||||||||||||||||||||||||||||
| 3.15 | X | |||||||||||||||||||||||||||||||||||||||||||||||||
| 3.16 | X | |||||||||||||||||||||||||||||||||||||||||||||||||
| 3.17 | X | |||||||||||||||||||||||||||||||||||||||||||||||||
| 3.18 | X | |||||||||||||||||||||||||||||||||||||||||||||||||
| 3.19 | X | |||||||||||||||||||||||||||||||||||||||||||||||||
| 3.20 | X | |||||||||||||||||||||||||||||||||||||||||||||||||
| 4.1 | X | |||||||||||||||||||||||||||||||||||||||||||||||||
| 4.1.1 | X | |||||||||||||||||||||||||||||||||||||||||||||||||
| 4.1.2 | X | |||||||||||||||||||||||||||||||||||||||||||||||||
| 4.1.3 | X | |||||||||||||||||||||||||||||||||||||||||||||||||
| 4.1.4 | X | |||||||||||||||||||||||||||||||||||||||||||||||||
| 4.1.5 | X | |||||||||||||||||||||||||||||||||||||||||||||||||
| 4.1.6 | X | |||||||||||||||||||||||||||||||||||||||||||||||||
| 4.1.7 | X | |||||||||||||||||||||||||||||||||||||||||||||||||
| 4.1.8 | X | |||||||||||||||||||||||||||||||||||||||||||||||||
| 4.1.9 | X | |||||||||||||||||||||||||||||||||||||||||||||||||
| 4.1.10 | X | |||||||||||||||||||||||||||||||||||||||||||||||||
| 4.1.11 | X | |||||||||||||||||||||||||||||||||||||||||||||||||
| 4.1.12 | X | |||||||||||||||||||||||||||||||||||||||||||||||||
| 4.1.13 | X | |||||||||||||||||||||||||||||||||||||||||||||||||
| 4.1.14 | X | |||||||||||||||||||||||||||||||||||||||||||||||||
| 4.1.15 | X | |||||||||||||||||||||||||||||||||||||||||||||||||
| 4.1.16 | X | |||||||||||||||||||||||||||||||||||||||||||||||||
| 4.1.17 | X | |||||||||||||||||||||||||||||||||||||||||||||||||
| 4.1.18 | X | |||||||||||||||||||||||||||||||||||||||||||||||||
| 4.1.19 | X | |||||||||||||||||||||||||||||||||||||||||||||||||
| 4.1.20 | X | |||||||||||||||||||||||||||||||||||||||||||||||||
4.1.21 | X | |||||||||||||||||||||||||||||||||||||||||||||||||
4.1.22 | X | |||||||||||||||||||||||||||||||||||||||||||||||||
| 4.1.23 | X | |||||||||||||||||||||||||||||||||||||||||||||||||
| 4.1.24 | X | |||||||||||||||||||||||||||||||||||||||||||||||||
| 4.1.25 | X | |||||||||||||||||||||||||||||||||||||||||||||||||
| 4.1.26 | X | |||||||||||||||||||||||||||||||||||||||||||||||||
| 4.1.27 | X | |||||||||||||||||||||||||||||||||||||||||||||||||
| 4.1.28 | X | |||||||||||||||||||||||||||||||||||||||||||||||||
| 4.1.29 | X | |||||||||||||||||||||||||||||||||||||||||||||||||
4.1.30 | Thirtieth Supplemental Indenture, dated as of September 8, 2023, to the Indenture, dated as of June 3, 2008, between Duke Energy Corporation and The Bank of New York Mellon Trust Company, N.A., as Trustee, and forms of global notes included therein (incorporated by reference to exhibit 4.1 to registrant's Current Report on Form 8-K filed on September 8, 2023, File No. 1-32853). | X | ||||||||||||||||||||||||||||||||||||||||||||||||
4.2 | Indenture, dated as of April 6, 2023, by and between Duke Energy Corporation and The Bank of New York Mellon Trust Company, N.A., as Trustee, and form of global note included therein (incorporated by reference to Exhibit 4.1 to registrant's Current Report on Form 8-K filed on April 6, 2023, File No. 1-32853). | X | ||||||||||||||||||||||||||||||||||||||||||||||||
4.3 | X | |||||||||||||||||||||||||||||||||||||||||||||||||
4.3.1 | X | |||||||||||||||||||||||||||||||||||||||||||||||||
4.3.2 | X | |||||||||||||||||||||||||||||||||||||||||||||||||
4.4 | First and Refunding Mortgage from Duke Energy Carolinas, LLC to The Bank of New York Mellon Trust Company, N.A., successor trustee to Guaranty Trust Company of New York, dated as of December 1, 1927 (incorporated by reference to Exhibit 7(a) to registrant's Form S-1, effective October 15, 1947, File No. 2-7224). | X | ||||||||||||||||||||||||||||||||||||||||||||||||
4.4.1 | X | |||||||||||||||||||||||||||||||||||||||||||||||||
| 4.4.2 | Ninth Supplemental Indenture, dated as of February 1, 1949 (incorporated by reference to Exhibit 7(j) to registrant's Form S-1 filed on February 3, 1949, File No. 2-7808). | X | ||||||||||||||||||||||||||||||||||||||||||||||||
4.4.3 | Twentieth Supplemental Indenture, dated as of June 15, 1964 (incorporated by reference to Exhibit 4-B-20 to registrant's Form S-1 filed on August 23, 1966, File No. 2-25367). | X | ||||||||||||||||||||||||||||||||||||||||||||||||
4.4.4 | Twenty-third Supplemental Indenture, dated as of February 1, 1968 (incorporated by reference to Exhibit 2-B-26 to registrant's Form S-9 filed on January 21, 1969, File No. 2-31304). | X | ||||||||||||||||||||||||||||||||||||||||||||||||
4.4.5 | Sixtieth Supplemental Indenture, dated as of March 1, 1990 (incorporated by reference to Exhibit 4-B-61 to registrant's Annual Report on Form 10-K for the year ended December 31, 1990, File No.1-4928). | X | ||||||||||||||||||||||||||||||||||||||||||||||||
4.4.6 | Sixty-third Supplemental Indenture, dated as of July 1, 1991 (incorporated by reference to Exhibit 4-B-64 to registrant's Registration Statement on Form S-3 filed on February 13, 1992, File No. 33-45501). | X | ||||||||||||||||||||||||||||||||||||||||||||||||
4.4.7 | X | |||||||||||||||||||||||||||||||||||||||||||||||||
4.4.8 | X | |||||||||||||||||||||||||||||||||||||||||||||||||
4.4.9 | X | |||||||||||||||||||||||||||||||||||||||||||||||||
4.4.10 | X | |||||||||||||||||||||||||||||||||||||||||||||||||
4.4.11 | X | |||||||||||||||||||||||||||||||||||||||||||||||||
4.4.12 | X | |||||||||||||||||||||||||||||||||||||||||||||||||
4.4.13 | X | |||||||||||||||||||||||||||||||||||||||||||||||||
4.4.14 | X | |||||||||||||||||||||||||||||||||||||||||||||||||
4.4.15 | X | |||||||||||||||||||||||||||||||||||||||||||||||||
4.4.16 | X | |||||||||||||||||||||||||||||||||||||||||||||||||
4.4.17 | X | |||||||||||||||||||||||||||||||||||||||||||||||||
4.4.18 | X | |||||||||||||||||||||||||||||||||||||||||||||||||
4.4.19 | X | |||||||||||||||||||||||||||||||||||||||||||||||||
4.4.20 | X | |||||||||||||||||||||||||||||||||||||||||||||||||
4.4.21 | X | |||||||||||||||||||||||||||||||||||||||||||||||||
4.4.22 | X | |||||||||||||||||||||||||||||||||||||||||||||||||
4.4.23 | X | |||||||||||||||||||||||||||||||||||||||||||||||||
4.4.24 | X | |||||||||||||||||||||||||||||||||||||||||||||||||
4.4.25 | X | |||||||||||||||||||||||||||||||||||||||||||||||||
4.4.26 | One-Hundred and Seventh Supplemental Indenture, dated as of January 6, 2023, between Duke Energy Carolinas, LLC and The Bank of New York Mellon Trust Company, N.A., as Trustee (incorporated by reference to Exhibit 4.1 to registrant’s Current Report on Form 8-K filed on January 6, 2023, File No. 1-04928). | X | ||||||||||||||||||||||||||||||||||||||||||||||||
4.4.27 | One-Hundred and Eighth Supplemental Indenture, dated as of June 15, 2023, between Duke Energy Carolinas, LLC and The Bank of New York Mellon Trust Company, N.A., as Trustee (incorporated by reference to Exhibit 4.2 to registrant’s Current Report on Form 8-K filed on June 15, 2023, File No. 1-04928). | X | ||||||||||||||||||||||||||||||||||||||||||||||||
4.4.28 | X | |||||||||||||||||||||||||||||||||||||||||||||||||
4.5 | Mortgage and Deed of Trust between Duke Energy Progress, Inc. (formerly Carolina Power & Light Company) and The Bank of New York Mellon (formerly Irving Trust Company) and Frederick G. Herbst (Tina D. Gonzalez, successor), as Trustees, dated as of May 1, 1940. | X | ||||||||||||||||||||||||||||||||||||||||||||||||
4.5.1 | First through Fifth Supplemental Indentures thereto (incorporated by reference to Exhibit 2(b), File No. 2-64189). | X | ||||||||||||||||||||||||||||||||||||||||||||||||
4.5.2 | Sixth Supplemental Indenture dated April 1, 1960 (incorporated by reference to Exhibit 2(b)-5, File No. 2-16210). | X | ||||||||||||||||||||||||||||||||||||||||||||||||
4.5.3 | Seventh Supplemental Indenture dated November 1, 1961 (incorporated by reference to Exhibit 2(b)-6, File No. 2-16210). | X | ||||||||||||||||||||||||||||||||||||||||||||||||
4.5.4 | Eighth Supplemental Indenture dated July 1, 1964 (incorporated by reference to Exhibit 4(b)-8, File No. 2-19118). | X | ||||||||||||||||||||||||||||||||||||||||||||||||
4.5.5 | Ninth Supplemental Indenture dated April 1, 1966 (incorporated by reference to Exhibit 4(b)-2, File No. 2-22439). | X | ||||||||||||||||||||||||||||||||||||||||||||||||
4.5.6 | Tenth Supplemental Indenture dated October 1, 1967 (incorporated by reference to Exhibit 4(b)-2, File No. 2-24624). | X | ||||||||||||||||||||||||||||||||||||||||||||||||
4.5.7 | Eleventh Supplemental Indenture dated October 1, 1968 (incorporated by reference to Exhibit 2(c), File No. 2-27297). | X | ||||||||||||||||||||||||||||||||||||||||||||||||
4.5.8 | Twelfth Supplemental Indenture dated January 1, 1970 (incorporated by reference to Exhibit 2(c), File No. 2-30172). | X | ||||||||||||||||||||||||||||||||||||||||||||||||
4.5.9 | Thirteenth Supplemental Indenture dated August 1, 1970 (incorporated by reference to Exhibit 2(c), File No. 2-35694). | X | ||||||||||||||||||||||||||||||||||||||||||||||||
4.5.10 | Fourteenth Supplemental Indenture dated January 1, 1971 (incorporated by reference to Exhibit 2(c), File No. 2-37505). | X | ||||||||||||||||||||||||||||||||||||||||||||||||
4.5.11 | Fifteenth Supplemental Indenture dated October 1, 1971 (incorporated by reference to Exhibit 2(c), File No. 2-39002). | X | ||||||||||||||||||||||||||||||||||||||||||||||||
4.5.12 | Sixteenth Supplemental Indenture dated May 1, 1972 (incorporated by reference to Exhibit 2(c), File No. 2-41738). | X | ||||||||||||||||||||||||||||||||||||||||||||||||
4.5.13 | Seventeenth Supplemental Indenture dated November 1, 1973 (incorporated by reference to Exhibit 2(c), File No. 2-43439). | X | ||||||||||||||||||||||||||||||||||||||||||||||||
4.5.14 | Eighteenth Supplemental Indenture dated (incorporated by reference to Exhibit 2(c), File No. 2-47751). | X | ||||||||||||||||||||||||||||||||||||||||||||||||
4.5.15 | Nineteenth Supplemental Indenture dated May 1, 1974 (incorporated by reference to Exhibit 2(c), File No. 2-49347). | X | ||||||||||||||||||||||||||||||||||||||||||||||||
4.5.16 | Twentieth Supplemental Indenture dated December 1, 1974 (incorporated by reference to Exhibit 2(c), File No. 2-53113). | X | ||||||||||||||||||||||||||||||||||||||||||||||||
4.5.17 | Twenty-first Supplemental Indenture dated April 15, 1975 (incorporated by reference to Exhibit 2(d), File No. 2-53113). | X | ||||||||||||||||||||||||||||||||||||||||||||||||
4.5.18 | Twenty-second Supplemental Indenture dated October 1, 1977 (incorporated by reference to Exhibit 2(c), File No. 2-59511). | X | ||||||||||||||||||||||||||||||||||||||||||||||||
4.5.19 | Twenty-third Supplemental Indenture dated June 1, 1978 (incorporated by reference to Exhibit 2(c), File No. 2-61611). | X | ||||||||||||||||||||||||||||||||||||||||||||||||
4.5.20 | Twenty-fourth Supplemental Indenture dated May 15, 1979 (incorporated by reference to Exhibit 2(d), File No. 2-64189). | X | ||||||||||||||||||||||||||||||||||||||||||||||||
4.5.21 | Twenty-fifth Supplemental Indenture dated November 1, 1979 (incorporated by reference to Exhibit 2(c), File No. 2-65514). | X | ||||||||||||||||||||||||||||||||||||||||||||||||
4.5.22 | Twenty-sixth Supplemental Indenture dated November 1, 1979 (incorporated by reference to Exhibit 2(c), File No. 2-66851). | X | ||||||||||||||||||||||||||||||||||||||||||||||||
4.5.23 | Twenty-seventh Supplemental Indenture dated April 1, 1980 (incorporated by reference to Exhibit 2 (d), File No. 2-66851). | X | ||||||||||||||||||||||||||||||||||||||||||||||||
4.5.24 | Twenty-eighth Supplemental Indenture dated October 1, 1980 (incorporated by reference to Exhibit 4(b)-1, File No. 2-81299). | X | ||||||||||||||||||||||||||||||||||||||||||||||||
4.5.25 | Twenty-ninth Supplemental Indenture dated October 1, 1980 (incorporated by reference to Exhibit 4(b)-2, File No. 2-81299). | X | ||||||||||||||||||||||||||||||||||||||||||||||||
4.5.26 | Thirtieth Supplemental Indenture dated December 1, 1982 (incorporated by reference to Exhibit 4(b)- 3, File No. 2-81299). | X | ||||||||||||||||||||||||||||||||||||||||||||||||
4.5.27 | Thirty-first Supplemental Indenture dated March 15, 1983 (incorporated by reference to Exhibit 4(c)-1, File No. 2-95505). | X | ||||||||||||||||||||||||||||||||||||||||||||||||
4.5.28 | Thirty-second Supplemental Indenture dated March 15, 1983 (incorporated by reference to Exhibit 4(c)-2, File No. 2-95505). | X | ||||||||||||||||||||||||||||||||||||||||||||||||
4.5.29 | Thirty-third Supplemental Indenture dated December 1, 1983 (incorporated by reference to Exhibit 4(c)-3, File No. 2-95505). | X | ||||||||||||||||||||||||||||||||||||||||||||||||
4.5.30 | Thirty-fourth Supplemental Indenture dated December 15, 1983 (incorporated by reference to Exhibit 4(c)-4, File No. 2-95505). | X | ||||||||||||||||||||||||||||||||||||||||||||||||
4.5.31 | Thirty-fifth Supplemental Indenture dated April 1, 1984 (incorporated by reference to Exhibit 4(c)-5, File No. 2-95505). | X | ||||||||||||||||||||||||||||||||||||||||||||||||
4.5.32 | Thirty-sixth Supplemental Indenture dated June 1, 1984 (incorporated by reference to Exhibit 4(c)-6, File No. 2-95505). | X | ||||||||||||||||||||||||||||||||||||||||||||||||
4.5.33 | Thirty-seventh Supplemental Indenture dated June 1, 1984 (incorporated by reference to Exhibit 4(c)-7, File No. 2-95505). | X | ||||||||||||||||||||||||||||||||||||||||||||||||
4.5.34 | Thirty-eighth Supplemental Indenture dated June 1, 1984 (incorporated by reference to Exhibit 4(c)- 8, File No. 2-95505). | X | ||||||||||||||||||||||||||||||||||||||||||||||||
4.5.35 | Thirty-ninth Supplemental Indenture dated April 1, 1985 (incorporated by reference to Exhibit 4(b), File No. 33-25560). | X | ||||||||||||||||||||||||||||||||||||||||||||||||
4.5.36 | Fortieth Supplemental Indenture dated October 1, 1985 (incorporated by reference to Exhibit 4(c), File No. 33-25560). | X | ||||||||||||||||||||||||||||||||||||||||||||||||
4.5.37 | Forty-first Supplemental Indenture dated March 1, 1986 (incorporated by reference to Exhibit 4(d), File No. 33-25560). | X | ||||||||||||||||||||||||||||||||||||||||||||||||
4.5.38 | Forty-second Supplemental Indenture dated July 1, 1986 (incorporated by reference to Exhibit 4(e), File No. 33-25560). | X | ||||||||||||||||||||||||||||||||||||||||||||||||
4.5.39 | Forty-third Supplemental Indenture dated January 1, 1987 (incorporated by reference to Exhibit 4(f), File No. 33-25560). | X | ||||||||||||||||||||||||||||||||||||||||||||||||
4.5.40 | Forty-fourth Supplemental Indenture dated December 1, 1987 (incorporated by reference to Exhibit 4(g), File No. 33-25560). | X | ||||||||||||||||||||||||||||||||||||||||||||||||
4.5.41 | Forty-fifth Supplemental Indenture dated September 1, 1988 (incorporated by reference to Exhibit 4(h), File No. 33-25560). | X | ||||||||||||||||||||||||||||||||||||||||||||||||
4.5.42 | Forty-sixth Supplemental Indenture dated April 1, 1989 (incorporated by reference to Exhibit 4(b), File No. 33-33431). | X | ||||||||||||||||||||||||||||||||||||||||||||||||
4.5.43 | Forty-seventh Supplemental Indenture dated August 1, 1989 (incorporated by reference to Exhibit 4(c), File No. 33-33431). | X | ||||||||||||||||||||||||||||||||||||||||||||||||
4.5.44 | Forty-eighth Supplemental Indenture dated November 15, 1990 (incorporated by reference to Exhibit 4(b), File No. 33-38298). | X | ||||||||||||||||||||||||||||||||||||||||||||||||
4.5.45 | Forty-ninth Supplemental Indenture dated November 15, 1990 (incorporated by reference to Exhibit 4(c), File No. 33-38298). | X | ||||||||||||||||||||||||||||||||||||||||||||||||
4.5.46 | Fiftieth Supplemental Indenture dated February 15, 1991 (incorporated by reference to Exhibit 4(h), File No. 33-42869). | X | ||||||||||||||||||||||||||||||||||||||||||||||||
4.5.47 | Fifty-first Supplemental Indenture dated April 1, 1991 (incorporated by reference to Exhibit 4(i), File No. 33-42869). | X | ||||||||||||||||||||||||||||||||||||||||||||||||
4.5.48 | Fifty-second Supplemental Indenture dated September 15, 1991(incorporated by reference to Exhibit 4(e), File No. 33-48607). | X | ||||||||||||||||||||||||||||||||||||||||||||||||
4.5.49 | Fifty-third Supplemental Indenture dated January 1, 1992 (incorporated by reference to Exhibit 4(f), File No. 33-48607). | X | ||||||||||||||||||||||||||||||||||||||||||||||||
4.5.50 | Fifty-fourth Supplemental Indenture dated April 15, 1992 (incorporated by reference to Exhibit 4 (g), File No. 33-48607). | X | ||||||||||||||||||||||||||||||||||||||||||||||||
4.5.51 | Fifty-fifth Supplemental Indenture dated July 1, 1992 (incorporated by reference to Exhibit 4(e), File No. 33-55060). | X | ||||||||||||||||||||||||||||||||||||||||||||||||
4.5.52 | Fifty-sixth Supplemental Indenture dated October 1, 1992 (incorporated by reference to Exhibit 4(f), File No. 33-55060). | X | ||||||||||||||||||||||||||||||||||||||||||||||||
4.5.53 | Fifty-seventh Supplemental Indenture dated February 1, 1993 (incorporated by reference to Exhibit 4(e), File No. 33-60014). | X | ||||||||||||||||||||||||||||||||||||||||||||||||
4.5.54 | Fifty-eighth Supplemental Indenture dated March 1, 1993 (incorporated by reference to Exhibit 4(f), File No. 33-60014). | X | ||||||||||||||||||||||||||||||||||||||||||||||||
4.5.55 | Fifty-ninth Supplemental Indenture dated July 1, 1993 (incorporated by reference to Exhibit 4(a) to Post-Effective Amendment No. 1, File No. 33-38349). | X | ||||||||||||||||||||||||||||||||||||||||||||||||
4.5.56 | Sixtieth Supplemental Indenture dated July 1, 1993 (incorporated by reference to Exhibit 4(b) to Post-Effective Amendment No. 1, File No. 33-38349). | X | ||||||||||||||||||||||||||||||||||||||||||||||||
4.5.57 | Sixty-first Supplemental Indenture dated August 15, 1993 (incorporated by reference to Exhibit 4(e), File No. 33-50597). | X | ||||||||||||||||||||||||||||||||||||||||||||||||
4.5.58 | X | |||||||||||||||||||||||||||||||||||||||||||||||||
4.5.59 | X | |||||||||||||||||||||||||||||||||||||||||||||||||
4.5.60 | X | |||||||||||||||||||||||||||||||||||||||||||||||||
4.5.61 | X | |||||||||||||||||||||||||||||||||||||||||||||||||
4.5.62 | X | |||||||||||||||||||||||||||||||||||||||||||||||||
4.5.63 | X | |||||||||||||||||||||||||||||||||||||||||||||||||
4.5.64 | X | |||||||||||||||||||||||||||||||||||||||||||||||||
4.5.65 | X | |||||||||||||||||||||||||||||||||||||||||||||||||
4.5.66 | X | |||||||||||||||||||||||||||||||||||||||||||||||||
4.5.67 | X | |||||||||||||||||||||||||||||||||||||||||||||||||
4.5.68 | X | |||||||||||||||||||||||||||||||||||||||||||||||||
4.5.69 | X | |||||||||||||||||||||||||||||||||||||||||||||||||
4.5.70 | X | |||||||||||||||||||||||||||||||||||||||||||||||||
4.5.71 | X | |||||||||||||||||||||||||||||||||||||||||||||||||
4.5.72 | X | |||||||||||||||||||||||||||||||||||||||||||||||||
4.5.73 | X | |||||||||||||||||||||||||||||||||||||||||||||||||
4.5.74 | X | |||||||||||||||||||||||||||||||||||||||||||||||||
4.5.75 | X | |||||||||||||||||||||||||||||||||||||||||||||||||
4.5.76 | X | |||||||||||||||||||||||||||||||||||||||||||||||||
4.5.77 | X | |||||||||||||||||||||||||||||||||||||||||||||||||
4.5.78 | X | |||||||||||||||||||||||||||||||||||||||||||||||||
4.5.79 | X | |||||||||||||||||||||||||||||||||||||||||||||||||
4.5.80 | X | |||||||||||||||||||||||||||||||||||||||||||||||||
4.5.81 | X | |||||||||||||||||||||||||||||||||||||||||||||||||
4.5.82 | X | |||||||||||||||||||||||||||||||||||||||||||||||||
4.5.83 | X | |||||||||||||||||||||||||||||||||||||||||||||||||
4.5.84 | X | |||||||||||||||||||||||||||||||||||||||||||||||||
4.5.85 | X | |||||||||||||||||||||||||||||||||||||||||||||||||
4.5.86 | X | |||||||||||||||||||||||||||||||||||||||||||||||||
4.5.87 | X | |||||||||||||||||||||||||||||||||||||||||||||||||
4.6 | X | |||||||||||||||||||||||||||||||||||||||||||||||||
4.7 | X | |||||||||||||||||||||||||||||||||||||||||||||||||
4.8 | Indenture (for First Mortgage Bonds) between Duke Energy Florida, Inc. (formerly Florida Power Corporation) and The Bank of New York Mellon (as successor to Guaranty Trust Company of New York and The Florida National Bank of Jacksonville), as Trustee, dated as of January 1, 1944, (incorporated by reference to Exhibit B-18 to registrant's Form A-2, File No. 2-5293). | X | ||||||||||||||||||||||||||||||||||||||||||||||||
4.8.1 | Seventh Supplemental Indenture (incorporated by reference to Exhibit 4(b) to Duke Energy Florida, Inc.'s (formerly Florida Power Corporation) Registration Statement on Form S-3 filed on September 27, 1991, File No. 33-16788). | X | ||||||||||||||||||||||||||||||||||||||||||||||||
4.8.2 | Eighth Supplemental Indenture (incorporated by reference to Exhibit 4(c) to Duke Energy Florida, Inc.'s (formerly Florida Power Corporation) Registration Statement on Form S-3 filed on September 27, 1991, File No. 33-16788). | X | ||||||||||||||||||||||||||||||||||||||||||||||||
4.8.3 | Sixteenth Supplemental Indenture (incorporated by reference to Exhibit 4(d) to Duke Energy Florida, Inc.'s (formerly Florida Power Corporation) Registration Statement on Form S-3 filed on September 27, 1991, File No. 33-16788). | X | ||||||||||||||||||||||||||||||||||||||||||||||||
4.8.4 | Twenty-ninth Supplemental Indenture (incorporated by reference to Exhibit 4(c) to Duke Energy Florida, Inc.'s (formerly Florida Power Corporation) Registration Statement on Form S-3 filed on September 17, 1982, File No. 2-79832). | X | ||||||||||||||||||||||||||||||||||||||||||||||||
4.8.5 | X | |||||||||||||||||||||||||||||||||||||||||||||||||
4.8.6 | X | |||||||||||||||||||||||||||||||||||||||||||||||||
4.8.7 | X | |||||||||||||||||||||||||||||||||||||||||||||||||
4.8.8 | X | |||||||||||||||||||||||||||||||||||||||||||||||||
4.8.9 | X | |||||||||||||||||||||||||||||||||||||||||||||||||
4.8.10 | X | |||||||||||||||||||||||||||||||||||||||||||||||||
4.8.11 | X | |||||||||||||||||||||||||||||||||||||||||||||||||
4.8.12 | X | |||||||||||||||||||||||||||||||||||||||||||||||||
4.8.13 | X | |||||||||||||||||||||||||||||||||||||||||||||||||
4.8.14 | X | |||||||||||||||||||||||||||||||||||||||||||||||||
4.8.15 | X | |||||||||||||||||||||||||||||||||||||||||||||||||
4.8.16 | X | |||||||||||||||||||||||||||||||||||||||||||||||||
4.8.17 | X | |||||||||||||||||||||||||||||||||||||||||||||||||
4.8.18 | X | |||||||||||||||||||||||||||||||||||||||||||||||||
4.8.19 | X | |||||||||||||||||||||||||||||||||||||||||||||||||
4.8.20 | X | |||||||||||||||||||||||||||||||||||||||||||||||||
4.8.21 | X | |||||||||||||||||||||||||||||||||||||||||||||||||
4.8.22 | Sixtieth Supplemental Indenture, dated as of September 1, 2023, between Duke Energy Florida, LLC and The Bank of New York Mellon, as successor Trustee and Calculation Agent (incorporated by reference to Exhibit 4.1 to registrant's Current Report on Form 8-K filed on September 29, 2023, File No. 1-3274). | X | ||||||||||||||||||||||||||||||||||||||||||||||||
4.8.23 | X | |||||||||||||||||||||||||||||||||||||||||||||||||
4.9 | X | |||||||||||||||||||||||||||||||||||||||||||||||||
4.9.1 | X | |||||||||||||||||||||||||||||||||||||||||||||||||
4.9.2 | X | |||||||||||||||||||||||||||||||||||||||||||||||||
4.10 | X | |||||||||||||||||||||||||||||||||||||||||||||||||
4.11 | X | |||||||||||||||||||||||||||||||||||||||||||||||||
4.11.1 | X | |||||||||||||||||||||||||||||||||||||||||||||||||
4.11.2 | X | |||||||||||||||||||||||||||||||||||||||||||||||||
4.12 | Original Indenture (First Mortgage Bonds) between Duke Energy Ohio, Inc. (formerly The Cincinnati Gas & Electric Company) and The Bank of New York Mellon Trust Company, N.A., as Successor Trustee, dated as of August 1, 1936 (incorporated by reference to an exhibit to registrant's Registration Statement No. 2-2374). | X | ||||||||||||||||||||||||||||||||||||||||||||||||
4.12.1 | X | |||||||||||||||||||||||||||||||||||||||||||||||||
4.12.2 | X | |||||||||||||||||||||||||||||||||||||||||||||||||
4.12.3 | X | |||||||||||||||||||||||||||||||||||||||||||||||||
4.12.4 | X | |||||||||||||||||||||||||||||||||||||||||||||||||
4.12.5 | X | |||||||||||||||||||||||||||||||||||||||||||||||||
4.12.6 | X | |||||||||||||||||||||||||||||||||||||||||||||||||
4.12.7 | X | |||||||||||||||||||||||||||||||||||||||||||||||||
4.13 | X | |||||||||||||||||||||||||||||||||||||||||||||||||
4.13.1 | X | |||||||||||||||||||||||||||||||||||||||||||||||||
4.13.2 | X | |||||||||||||||||||||||||||||||||||||||||||||||||
4.133 | X | |||||||||||||||||||||||||||||||||||||||||||||||||
4.13.4 | X | |||||||||||||||||||||||||||||||||||||||||||||||||
4.14 | Original Indenture (First Mortgage Bonds) between Duke Energy Indiana, LLC (formerly PSI Energy, Inc.) and Deutsche Bank National Trust Company, as Successor Trustee, dated as of September 1, 1939, (filed as an exhibit in File No. 70-258). | X | ||||||||||||||||||||||||||||||||||||||||||||||||
4.14.1 | Tenth Supplemental Indenture, dated as of July 1, 1952, (filed as an exhibit in File No. 2-9687). | X | ||||||||||||||||||||||||||||||||||||||||||||||||
4.14.2 | Twenty-third Supplemental Indenture, dated as of January 1, 1977, (filed as an exhibit in File No. 2-57828). | X | ||||||||||||||||||||||||||||||||||||||||||||||||
4.14.3 | Twenty-fifth Supplemental Indenture, dated as of September 1, 1978, (filed as an exhibit in File No. 2-62543). | X | ||||||||||||||||||||||||||||||||||||||||||||||||
4.14.4 | Twenty-sixth Supplemental Indenture, dated as of September 1, 1978, (filed as an exhibit in File No. 2-62543). | X | ||||||||||||||||||||||||||||||||||||||||||||||||
4.14.5 | Thirtieth Supplemental Indenture, dated as of August 1, 1980, (filed as an exhibit in File No. 2-68562). | X | ||||||||||||||||||||||||||||||||||||||||||||||||
4.14.6 | Thirty-fifth Supplemental Indenture, dated as of March 30, 1984, (filed as an exhibit to registrant's Annual Report on Form 10-K for the year ended December 31, 1984, File No. 1-3543). | X | ||||||||||||||||||||||||||||||||||||||||||||||||
4.14.7 | Forty-sixth Supplemental Indenture, dated as of June 1, 1990, (filed as an exhibit to registrant's Annual Report on Form 10-K for the year ended December 31, 1991, File No. 1-3543). | X | ||||||||||||||||||||||||||||||||||||||||||||||||
4.14.8 | Forty-seventh Supplemental Indenture, dated as of July 15, 1991, (filed as an exhibit to registrant's Annual Report on Form 10-K for the year ended December 31, 1991, File No. 1-3543). | X | ||||||||||||||||||||||||||||||||||||||||||||||||
4.14.9 | Forty-eighth Supplemental Indenture, dated as of July 15, 1992, (filed as an exhibit to registrant's Annual Report on Form 10-K for the year ended December 31, 1992, File No. 1-3543). | X | ||||||||||||||||||||||||||||||||||||||||||||||||
4.14.10 | X | |||||||||||||||||||||||||||||||||||||||||||||||||
4.14.11 | X | |||||||||||||||||||||||||||||||||||||||||||||||||
4.14.12 | X | |||||||||||||||||||||||||||||||||||||||||||||||||
4.14.13 | X | |||||||||||||||||||||||||||||||||||||||||||||||||
4.14.14 | X | |||||||||||||||||||||||||||||||||||||||||||||||||
4.14.15 | X | |||||||||||||||||||||||||||||||||||||||||||||||||
4.14.16 | X | |||||||||||||||||||||||||||||||||||||||||||||||||
4.14.17 | X | |||||||||||||||||||||||||||||||||||||||||||||||||
4.14.18 | X | |||||||||||||||||||||||||||||||||||||||||||||||||
4.14.19 | X | |||||||||||||||||||||||||||||||||||||||||||||||||
4.14.20 | X | |||||||||||||||||||||||||||||||||||||||||||||||||
4.14.21 | X | |||||||||||||||||||||||||||||||||||||||||||||||||
4.14.22 | X | |||||||||||||||||||||||||||||||||||||||||||||||||
4.14.23 | X | |||||||||||||||||||||||||||||||||||||||||||||||||
4.14.24 | X | |||||||||||||||||||||||||||||||||||||||||||||||||
4.14.25 | X | |||||||||||||||||||||||||||||||||||||||||||||||||
4.15 | Repayment Agreement between Duke Energy Ohio, Inc. (formerly The Cincinnati Gas & Electric Company) and The Dayton Power and Light Company, dated as of December 23, 1992, (filed with registrant's Annual Report on Form 10-K for the year ended December 31, 1992, File No. 1-1232). | X | ||||||||||||||||||||||||||||||||||||||||||||||||
4.16 | X | |||||||||||||||||||||||||||||||||||||||||||||||||
4.17 | X | |||||||||||||||||||||||||||||||||||||||||||||||||
4.18 | X | |||||||||||||||||||||||||||||||||||||||||||||||||
4.19 | X | |||||||||||||||||||||||||||||||||||||||||||||||||
4.20 | X | |||||||||||||||||||||||||||||||||||||||||||||||||
4.21 | X | |||||||||||||||||||||||||||||||||||||||||||||||||
4.22 | X | |||||||||||||||||||||||||||||||||||||||||||||||||
4.23 | X | |||||||||||||||||||||||||||||||||||||||||||||||||
4.24 | X | |||||||||||||||||||||||||||||||||||||||||||||||||
4.25 | X | |||||||||||||||||||||||||||||||||||||||||||||||||
4.26 | X | |||||||||||||||||||||||||||||||||||||||||||||||||
4.27 | X | |||||||||||||||||||||||||||||||||||||||||||||||||
4.27.1 | X | |||||||||||||||||||||||||||||||||||||||||||||||||
4.27.2 | X | |||||||||||||||||||||||||||||||||||||||||||||||||
4.27.3 | X | |||||||||||||||||||||||||||||||||||||||||||||||||
4.27.4 | X | |||||||||||||||||||||||||||||||||||||||||||||||||
4.27.5 | X | |||||||||||||||||||||||||||||||||||||||||||||||||
4.27.6 | X | |||||||||||||||||||||||||||||||||||||||||||||||||
4.27.7 | X | |||||||||||||||||||||||||||||||||||||||||||||||||
4.27.8 | X | |||||||||||||||||||||||||||||||||||||||||||||||||
4.27.9 | X | |||||||||||||||||||||||||||||||||||||||||||||||||
4.2.710 | X | |||||||||||||||||||||||||||||||||||||||||||||||||
4.27.11 | Thirteenth Supplemental Indenture, dated as of June 8, 2023 between Piedmont Natural Gas Company, Inc. and The Bank of New York Mellon Trust Company, N.A., as successor to Citibank, N.A. (incorporated by reference to exhibit 4.1 to registrant’s Current Report on Form 8-K filed on June 8, 2023, File No. 1-6196). | X | ||||||||||||||||||||||||||||||||||||||||||||||||
4.28 | Medium-Term Note, Series A, dated as of October 6, 1993 (incorporated by reference to Exhibit 4.8 to registrant's Annual Report on Form 10-K for the year ended October 31, 1993, File No. 1-06196). | X | ||||||||||||||||||||||||||||||||||||||||||||||||
4.29 | X | |||||||||||||||||||||||||||||||||||||||||||||||||
4.30 | X | |||||||||||||||||||||||||||||||||||||||||||||||||
4.31 | X | |||||||||||||||||||||||||||||||||||||||||||||||||
4.32 | X | |||||||||||||||||||||||||||||||||||||||||||||||||
4.33 | X | |||||||||||||||||||||||||||||||||||||||||||||||||
4.34 | X | |||||||||||||||||||||||||||||||||||||||||||||||||
4.35 | X | |||||||||||||||||||||||||||||||||||||||||||||||||
| 10.1 | X | |||||||||||||||||||||||||||||||||||||||||||||||||
| 10.2 | X | |||||||||||||||||||||||||||||||||||||||||||||||||
| 10.3 | X | |||||||||||||||||||||||||||||||||||||||||||||||||
| 10.4 | X | |||||||||||||||||||||||||||||||||||||||||||||||||
| 10.5 | X | |||||||||||||||||||||||||||||||||||||||||||||||||
| 10.6 | X | |||||||||||||||||||||||||||||||||||||||||||||||||
| 10.7 | X | |||||||||||||||||||||||||||||||||||||||||||||||||
| 10.8 | X | |||||||||||||||||||||||||||||||||||||||||||||||||
| 10.9 | X | |||||||||||||||||||||||||||||||||||||||||||||||||
| 10.10 | X | |||||||||||||||||||||||||||||||||||||||||||||||||
| 10.11** | X | |||||||||||||||||||||||||||||||||||||||||||||||||
| 10.12** | X | |||||||||||||||||||||||||||||||||||||||||||||||||
| 10.13 | X | X | ||||||||||||||||||||||||||||||||||||||||||||||||
| 10.14** | X | |||||||||||||||||||||||||||||||||||||||||||||||||
| 10.15 | X | X | X | X | ||||||||||||||||||||||||||||||||||||||||||||||
| 10.15.1 | X | X | X | X | X | X | ||||||||||||||||||||||||||||||||||||||||||||
| 10.15.2 | X | X | X | X | X | X | ||||||||||||||||||||||||||||||||||||||||||||
| 10.15.3 | X | X | X | X | X | X | X | |||||||||||||||||||||||||||||||||||||||||||
| 10.15.4 | X | X | X | X | X | X | X | |||||||||||||||||||||||||||||||||||||||||||
| 10.15.5 | X | X | X | X | X | X | X | |||||||||||||||||||||||||||||||||||||||||||
| 10.16** | X | |||||||||||||||||||||||||||||||||||||||||||||||||
| 10.16.1** | X | |||||||||||||||||||||||||||||||||||||||||||||||||
10.17** | X | |||||||||||||||||||||||||||||||||||||||||||||||||
10.18** | X | |||||||||||||||||||||||||||||||||||||||||||||||||
10.19** | X | |||||||||||||||||||||||||||||||||||||||||||||||||
10.20** | X | |||||||||||||||||||||||||||||||||||||||||||||||||
10.21** | X | |||||||||||||||||||||||||||||||||||||||||||||||||
10.22** | X | |||||||||||||||||||||||||||||||||||||||||||||||||
10.23** | X | |||||||||||||||||||||||||||||||||||||||||||||||||
10.24** | X | |||||||||||||||||||||||||||||||||||||||||||||||||
10.25** | X | |||||||||||||||||||||||||||||||||||||||||||||||||
10.26 | X | |||||||||||||||||||||||||||||||||||||||||||||||||
10.27 | X | |||||||||||||||||||||||||||||||||||||||||||||||||
10.28 | X | X | ||||||||||||||||||||||||||||||||||||||||||||||||
10.29 | X | X | X | |||||||||||||||||||||||||||||||||||||||||||||||
| 10.30 | X | X | X | |||||||||||||||||||||||||||||||||||||||||||||||
10.31 | X | X | ||||||||||||||||||||||||||||||||||||||||||||||||
10.32 | X | |||||||||||||||||||||||||||||||||||||||||||||||||
10.33** | X | |||||||||||||||||||||||||||||||||||||||||||||||||
10.34** | X | |||||||||||||||||||||||||||||||||||||||||||||||||
10.34.1** | X | |||||||||||||||||||||||||||||||||||||||||||||||||
10.35 | Purchase, Construction and Ownership Agreement, dated as of July 30, 1981, between Duke Energy Progress, Inc. (formerly Carolina Power & Light Company) and North Carolina Municipal Power Agency Number 3 and Exhibits, together with resolution, dated as of December 16, 1981, changing name to North Carolina Eastern Municipal Power Agency, amending letter, dated as of February 18, 1982, and amendment, dated as of February 24, 1982 (incorporated by reference to Exhibit 10(a) to registrant's File No. 33-25560). | X | ||||||||||||||||||||||||||||||||||||||||||||||||
10.36 | Operating and Fuel Agreement, dated as of July 30, 1981, between Duke Energy Progress, Inc. (formerly Carolina Power & Light Company) and North Carolina Municipal Power Agency Number 3 and Exhibits, together with resolution, dated as of December 16, 1981, changing name to North Carolina Eastern Municipal Power Agency, amending letters, dated as of August 21, 1981, and December 15, 1981, and amendment, dated as of February 24, 1982 (incorporated by reference to Exhibit 10(b) to registrant's File No. 33-25560). | X | ||||||||||||||||||||||||||||||||||||||||||||||||
10.37 | Power Coordination Agreement, dated as of July 30, 1981, between Duke Energy Progress, Inc. (formerly Carolina Power & Light Company) and North Carolina Municipal Power Agency Number 3 and Exhibits, together with resolution, dated as of December 16, 1981, changing name to North Carolina Eastern Municipal Power Agency and amending letter, dated as of January 29, 1982 (incorporated by reference to Exhibit 10(c) to registrant's File No. 33-25560). | X | ||||||||||||||||||||||||||||||||||||||||||||||||
10.38 | Amendment, dated as of December 16, 1982, to Purchase, Construction and Ownership Agreement, dated as of July 30, 1981, between Duke Energy Progress, Inc. (formerly Carolina Power & Light Company) and North Carolina Eastern Municipal Power Agency (incorporated by reference to Exhibit 10(d) to registrant's File No. 33-25560). | X | ||||||||||||||||||||||||||||||||||||||||||||||||
10.39 | X | X | ||||||||||||||||||||||||||||||||||||||||||||||||
10.40 | X | X | ||||||||||||||||||||||||||||||||||||||||||||||||
10.41** | X | |||||||||||||||||||||||||||||||||||||||||||||||||
10.41.1** | X | |||||||||||||||||||||||||||||||||||||||||||||||||
10.42** | X | |||||||||||||||||||||||||||||||||||||||||||||||||
10.43** | X | |||||||||||||||||||||||||||||||||||||||||||||||||
10.44** | X | |||||||||||||||||||||||||||||||||||||||||||||||||
10.45** | X | |||||||||||||||||||||||||||||||||||||||||||||||||
10.46** | X | |||||||||||||||||||||||||||||||||||||||||||||||||
10.46.1** | X | |||||||||||||||||||||||||||||||||||||||||||||||||
10.46.2** | X | |||||||||||||||||||||||||||||||||||||||||||||||||
10.47** | X | |||||||||||||||||||||||||||||||||||||||||||||||||
10.48 | X | X | ||||||||||||||||||||||||||||||||||||||||||||||||
10.49 | X | X | ||||||||||||||||||||||||||||||||||||||||||||||||
10.50 | X | |||||||||||||||||||||||||||||||||||||||||||||||||
10.51 | X | |||||||||||||||||||||||||||||||||||||||||||||||||
10.52 | X | |||||||||||||||||||||||||||||||||||||||||||||||||
10.53 | X | |||||||||||||||||||||||||||||||||||||||||||||||||
10.54 | X | |||||||||||||||||||||||||||||||||||||||||||||||||
10.55 | X | |||||||||||||||||||||||||||||||||||||||||||||||||
10.56 | X | |||||||||||||||||||||||||||||||||||||||||||||||||
10.56.1 | X | |||||||||||||||||||||||||||||||||||||||||||||||||
10.57 | X | X | X | X | X | X | X | |||||||||||||||||||||||||||||||||||||||||||
10.57.1 | Amendment No. 1, dated as of March 17, 2023, to Amended and Restated Credit Agreement, dated as of March 18, 2022 (incorporated by reference to Exhibit 10.1 to registrant's Quarterly Report on Form 10-Q for the quarter ended March 31, 2023, filed on May 9, 2023, File Nos. 1-32853, 1-4928, 1-3382, 1-3274, 1-1232, 1-3543, 1-6196). | X | X | X | X | X | X | X | ||||||||||||||||||||||||||||||||||||||||||
10.58 | X | |||||||||||||||||||||||||||||||||||||||||||||||||
10.59 | X | |||||||||||||||||||||||||||||||||||||||||||||||||
10.60 | X | |||||||||||||||||||||||||||||||||||||||||||||||||
10.61 | X | |||||||||||||||||||||||||||||||||||||||||||||||||
10.61.1 | X | X | X | X | X | X | X | |||||||||||||||||||||||||||||||||||||||||||
10.62 | X | |||||||||||||||||||||||||||||||||||||||||||||||||
10.63 | X | |||||||||||||||||||||||||||||||||||||||||||||||||
10.63.1 | X | |||||||||||||||||||||||||||||||||||||||||||||||||
10.63.2 | X | |||||||||||||||||||||||||||||||||||||||||||||||||
10.64 | X | |||||||||||||||||||||||||||||||||||||||||||||||||
10.65 | X | |||||||||||||||||||||||||||||||||||||||||||||||||
10.66 | X | X | ||||||||||||||||||||||||||||||||||||||||||||||||
10.67 | X | |||||||||||||||||||||||||||||||||||||||||||||||||
10.68 | X | |||||||||||||||||||||||||||||||||||||||||||||||||
10.69 | X | |||||||||||||||||||||||||||||||||||||||||||||||||
10.70 | X | |||||||||||||||||||||||||||||||||||||||||||||||||
10.71 | X | |||||||||||||||||||||||||||||||||||||||||||||||||
10.72 | X | |||||||||||||||||||||||||||||||||||||||||||||||||
*10.73** | X | |||||||||||||||||||||||||||||||||||||||||||||||||
| *21 | X | |||||||||||||||||||||||||||||||||||||||||||||||||
| *23.1.1 | X | |||||||||||||||||||||||||||||||||||||||||||||||||
| *23.1.2 | X | |||||||||||||||||||||||||||||||||||||||||||||||||
| *23.1.3 | X | |||||||||||||||||||||||||||||||||||||||||||||||||
| *23.1.4 | X | |||||||||||||||||||||||||||||||||||||||||||||||||
| *23.1.5 | X | |||||||||||||||||||||||||||||||||||||||||||||||||
| *23.1.6 | X | |||||||||||||||||||||||||||||||||||||||||||||||||
| *23.1.7 | X | |||||||||||||||||||||||||||||||||||||||||||||||||
| *24.1 | X | |||||||||||||||||||||||||||||||||||||||||||||||||
| *24.2 | X | |||||||||||||||||||||||||||||||||||||||||||||||||
| *31.1.1 | X | |||||||||||||||||||||||||||||||||||||||||||||||||
| *31.1.2 | X | |||||||||||||||||||||||||||||||||||||||||||||||||
| *31.1.3 | X | |||||||||||||||||||||||||||||||||||||||||||||||||
| *31.1.4 | X | |||||||||||||||||||||||||||||||||||||||||||||||||
| *31.1.5 | X | |||||||||||||||||||||||||||||||||||||||||||||||||
| *31.1.6 | X | |||||||||||||||||||||||||||||||||||||||||||||||||
| *31.1.7 | X | |||||||||||||||||||||||||||||||||||||||||||||||||
| *31.1.8 | X | |||||||||||||||||||||||||||||||||||||||||||||||||
| *31.2.1 | X | |||||||||||||||||||||||||||||||||||||||||||||||||
| *31.2.2 | X | |||||||||||||||||||||||||||||||||||||||||||||||||
| *31.2.3 | X | |||||||||||||||||||||||||||||||||||||||||||||||||
| *31.2.4 | X | |||||||||||||||||||||||||||||||||||||||||||||||||
| *31.2.5 | X | |||||||||||||||||||||||||||||||||||||||||||||||||
| *31.2.6 | X | |||||||||||||||||||||||||||||||||||||||||||||||||
| *31.2.7 | X | |||||||||||||||||||||||||||||||||||||||||||||||||
| *31.2.8 | X | |||||||||||||||||||||||||||||||||||||||||||||||||
| *32.1.1 | X | |||||||||||||||||||||||||||||||||||||||||||||||||
| *32.1.2 | X | |||||||||||||||||||||||||||||||||||||||||||||||||
| *32.1.3 | X | |||||||||||||||||||||||||||||||||||||||||||||||||
| *32.1.4 | X | |||||||||||||||||||||||||||||||||||||||||||||||||
| *32.1.5 | X | |||||||||||||||||||||||||||||||||||||||||||||||||
| *32.1.6 | X | |||||||||||||||||||||||||||||||||||||||||||||||||
| *32.1.7 | X | |||||||||||||||||||||||||||||||||||||||||||||||||
| *32.1.8 | X | |||||||||||||||||||||||||||||||||||||||||||||||||
| *32.2.1 | X | |||||||||||||||||||||||||||||||||||||||||||||||||
| *32.2.2 | X | |||||||||||||||||||||||||||||||||||||||||||||||||
| *32.2.3 | X | |||||||||||||||||||||||||||||||||||||||||||||||||
| *32.2.4 | X | |||||||||||||||||||||||||||||||||||||||||||||||||
| *32.2.5 | X | |||||||||||||||||||||||||||||||||||||||||||||||||
| *32.2.6 | X | |||||||||||||||||||||||||||||||||||||||||||||||||
| *32.2.7 | X | |||||||||||||||||||||||||||||||||||||||||||||||||
| *32.2.8 | X | |||||||||||||||||||||||||||||||||||||||||||||||||
| *101.INS | XBRL Instance Document (this does not appear in the Interactive Data File because it's XBRL tags are embedded within the Inline XBRL document). | X | X | X | X | X | X | X | X | |||||||||||||||||||||||||||||||||||||||||
| *101.SCH | XBRL Taxonomy Extension Schema Document | X | X | X | X | X | X | X | X | |||||||||||||||||||||||||||||||||||||||||
| *101.CAL | XBRL Taxonomy Calculation Linkbase Document | X | X | X | X | X | X | X | X | |||||||||||||||||||||||||||||||||||||||||
| *101.LAB | XBRL Taxonomy Label Linkbase Document | X | X | X | X | X | X | X | X | |||||||||||||||||||||||||||||||||||||||||
| *101.PRE | XBRL Taxonomy Presentation Linkbase Document | X | X | X | X | X | X | X | X | |||||||||||||||||||||||||||||||||||||||||
| *101.DEF | XBRL Taxonomy Definition Linkbase Document | X | X | X | X | X | X | X | X | |||||||||||||||||||||||||||||||||||||||||
| *104 | Cover Page Interactive Data File (formatted in Inline XBRL and contained in Exhibit 101). | X | X | X | X | X | X | X | X | |||||||||||||||||||||||||||||||||||||||||
The total amount of securities of each respective registrant or its subsidiaries authorized under any instrument with respect to long-term debt not filed as an exhibit does not exceed 10% of the total assets of such registrant and its subsidiaries on a consolidated basis. Each registrant agrees, upon request of the SEC, to furnish copies of any or all of such instruments to it.
E-1
| SIGNATURES | |||||
SIGNATURES
Pursuant to the requirements of Section 13 or 15(d) of the Securities Exchange Act of 1934, the registrants have duly caused this report to be signed on their behalf by the undersigned, thereunto duly authorized.
Date: February 23, 2024
DUKE ENERGY CORPORATION (Registrant) | |||||||||||
| By: | /s/ LYNN J. GOOD | ||||||||||
| Lynn J. Good Chair, President and Chief Executive Officer | |||||||||||
Pursuant to the requirements of the Securities Exchange Act of 1934, this report has been signed below by the following persons on behalf of the registrant and in the capacities and on the date indicated.
| (i) | /s/ LYNN J. GOOD | |||||||
| Lynn J. Good | ||||||||
| Chair, President and Chief Executive Officer (Principal Executive Officer and Director) | ||||||||
| (ii) | /s/ BRIAN D. SAVOY | |||||||
| Brian D. Savoy | ||||||||
| Executive Vice President and Chief Financial Officer (Principal Financial Officer) | ||||||||
| (iii) | /s/ CYNTHIA S. LEE | |||||||
| Cynthia S. Lee | ||||||||
| Vice President, Chief Accounting Officer and Controller (Principal Accounting Officer) | ||||||||
| (iv) | Directors: | |||||||
| Derrick Burks* | Lynn J. Good* | |||||||
| Annette K. Clayton* | John T. Herron* | |||||||
| Theodore F. Craver, Jr.* | Idalene F. Kesner* | |||||||
| Robert M. Davis* | E. Marie McKee* | |||||||
| Caroline D. Dorsa* | Michael J. Pacilio* | |||||||
| W. Roy Dunbar* | Thomas E. Skains* | |||||||
| Nicholas C. Fanandakis* | William E. Webster, Jr.* | |||||||
Brian D. Savoy, by signing his name hereto, does hereby sign this document on behalf of the registrant and on behalf of each of the above-named persons previously indicated by asterisk (*) pursuant to a power of attorney duly executed by the registrant and such persons, filed with the Securities and Exchange Commission as an exhibit hereto.
| By: | /s/ BRIAN D. SAVOY | ||||||||||
| Attorney-In-Fact | |||||||||||
Date: February 23, 2024
E-2
| SIGNATURES | |||||
SIGNATURES
Pursuant to the requirements of Section 13 or 15(d) of the Securities Exchange Act of 1934, the registrant has duly caused this report to be signed on its behalf by the undersigned, thereunto duly authorized.
Date: February 23, 2024
DUKE ENERGY CAROLINAS, LLC (Registrant) | |||||||||||
| By: | /s/ LYNN J. GOOD | ||||||||||
| Lynn J. Good Chief Executive Officer | |||||||||||
Pursuant to the requirements of the Securities Exchange Act of 1934, this report has been signed below by the following persons on behalf of the registrant and in the capacities and on the date indicated.
| (i) | /s/ LYNN J. GOOD | |||||||
| Lynn J. Good | ||||||||
| Chief Executive Officer (Principal Executive Officer) | ||||||||
| (ii) | /s/ BRIAN D. SAVOY | |||||||
| Brian D. Savoy | ||||||||
| Executive Vice President and Chief Financial Officer (Principal Financial Officer) | ||||||||
| (iii) | /s/ CYNTHIA S. LEE | |||||||
| Cynthia S. Lee | ||||||||
| Vice President, Chief Accounting Officer and Controller (Principal Accounting Officer) | ||||||||
| (iv) | Directors: | |||||||
| /s/ KODWO GHARTEY-TAGOE | ||||||||
| Kodwo Ghartey-Tagoe | ||||||||
| /s/ LYNN J. GOOD | ||||||||
| Lynn J. Good | ||||||||
| /s/ JULIA S. JANSON | ||||||||
| Julia S. Janson | ||||||||
Date: February 23, 2024
E-3
| SIGNATURES | |||||
SIGNATURES
Pursuant to the requirements of Section 13 or 15(d) of the Securities Exchange Act of 1934, the registrant has duly caused this report to be signed on its behalf by the undersigned, thereunto duly authorized.
Date: February 23, 2024
PROGRESS ENERGY, INC. (Registrant) | |||||||||||
| By: | /s/ LYNN J. GOOD | ||||||||||
| Lynn J. Good Chief Executive Officer | |||||||||||
Pursuant to the requirements of the Securities Exchange Act of 1934, this report has been signed below by the following persons on behalf of the registrant and in the capacities and on the date indicated.
| (i) | /s/ LYNN J. GOOD | |||||||
| Lynn J. Good | ||||||||
| Chief Executive Officer (Principal Executive Officer) | ||||||||
| (ii) | /s/ BRIAN D. SAVOY | |||||||
| Brian D. Savoy | ||||||||
| Executive Vice President and Chief Financial Officer (Principal Financial Officer) | ||||||||
| (iii) | /s/ CYNTHIA S. LEE | |||||||
| Cynthia S. Lee | ||||||||
| Vice President, Chief Accounting Officer and Controller (Principal Accounting Officer) | ||||||||
| (iv) | Directors: | |||||||
| /s/ KODWO GHARTEY-TAGOE | ||||||||
| Kodwo Ghartey-Tagoe | ||||||||
| /s/ LYNN J. GOOD | ||||||||
| Lynn J. Good | ||||||||
Date: February 23, 2024
E-4
| SIGNATURES | |||||
SIGNATURES
Pursuant to the requirements of Section 13 or 15(d) of the Securities Exchange Act of 1934, the registrant has duly caused this report to be signed on its behalf by the undersigned, thereunto duly authorized.
Date: February 23, 2024
DUKE ENERGY PROGRESS, LLC (Registrant) | |||||||||||
| By: | /s/ LYNN J. GOOD | ||||||||||
| Lynn J. Good Chief Executive Officer | |||||||||||
Pursuant to the requirements of the Securities Exchange Act of 1934, this report has been signed below by the following persons on behalf of the registrant and in the capacities and on the date indicated.
| (i) | /s/ LYNN J. GOOD | |||||||
| Lynn J. Good | ||||||||
| Chief Executive Officer (Principal Executive Officer) | ||||||||
| (ii) | /s/ BRIAN D. SAVOY | |||||||
| Brian D. Savoy | ||||||||
| Executive Vice President and Chief Financial Officer (Principal Financial Officer) | ||||||||
| (iii) | /s/ CYNTHIA S. LEE | |||||||
| Cynthia S. Lee | ||||||||
| Vice President, Chief Accounting Officer and Controller (Principal Accounting Officer) | ||||||||
| (iv) | Directors: | |||||||
| /s/ KODWO GHARTEY-TAGOE | ||||||||
| Kodwo Ghartey-Tagoe | ||||||||
| /s/ T. PRESTON GILLESPIE JR. | ||||||||
| T. Preston Gillespie Jr. | ||||||||
| /s/ R. ALEXANDER GLENN | ||||||||
| R. Alexander Glenn | ||||||||
| /s/ LYNN J. GOOD | ||||||||
| Lynn J. Good | ||||||||
| /s/ JULIA S. JANSON | ||||||||
| Julia S. Janson | ||||||||
Date: February 23, 2024
E-5
| SIGNATURES | |||||
SIGNATURES
Pursuant to the requirements of Section 13 or 15(d) of the Securities Exchange Act of 1934, the registrant has duly caused this report to be signed on its behalf by the undersigned, thereunto duly authorized.
Date: February 23, 2024
DUKE ENERGY FLORIDA, LLC (Registrant) | |||||||||||
| By: | /s/ LYNN J. GOOD | ||||||||||
| Lynn J. Good Chief Executive Officer | |||||||||||
Pursuant to the requirements of the Securities Exchange Act of 1934, this report has been signed below by the following persons on behalf of the registrant and in the capacities and on the date indicated.
| (i) | /s/ LYNN J. GOOD | |||||||
| Lynn J. Good | ||||||||
| Chief Executive Officer (Principal Executive Officer) | ||||||||
| (ii) | /s/ BRIAN D. SAVOY | |||||||
| Brian D. Savoy | ||||||||
| Executive Vice President and Chief Financial Officer (Principal Financial Officer) | ||||||||
| (iii) | /s/ CYNTHIA S. LEE | |||||||
| Cynthia S. Lee | ||||||||
| Vice President, Chief Accounting Officer and Controller (Principal Accounting Officer) | ||||||||
| (iv) | Directors: | |||||||
| /s/ KODWO GHARTEY-TAGOE | ||||||||
| Kodwo Ghartey-Tagoe | ||||||||
| /s/ T. PRESTON GILLESPIE JR. | ||||||||
| T. Preston Gillespie Jr. | ||||||||
| /s/ R. ALEXANDER GLENN | ||||||||
| R. Alexander Glenn | ||||||||
| /s/ LYNN J. GOOD | ||||||||
| Lynn J. Good | ||||||||
| /s/ JULIA S. JANSON | ||||||||
| Julia S. Janson | ||||||||
Date: February 23, 2024
E-6
| SIGNATURES | |||||
SIGNATURES
Pursuant to the requirements of Section 13 or 15(d) of the Securities Exchange Act of 1934, the registrant has duly caused this report to be signed on its behalf by the undersigned, thereunto duly authorized.
Date: February 23, 2024
DUKE ENERGY OHIO, INC. (Registrant) | |||||||||||
| By: | /s/ LYNN J. GOOD | ||||||||||
| Lynn J. Good Chief Executive Officer | |||||||||||
Pursuant to the requirements of the Securities Exchange Act of 1934, this report has been signed below by the following persons on behalf of the registrant and in the capacities and on the date indicated.
| (i) | /s/ LYNN J. GOOD | |||||||
| Lynn J. Good | ||||||||
| Chief Executive Officer (Principal Executive Officer) | ||||||||
| (ii) | /s/ BRIAN D. SAVOY | |||||||
| Brian D. Savoy | ||||||||
| Executive Vice President and Chief Financial Officer (Principal Financial Officer) | ||||||||
| (iii) | /s/ CYNTHIA S. LEE | |||||||
| Cynthia S. Lee | ||||||||
| Vice President, Chief Accounting Officer and Controller (Principal Accounting Officer) | ||||||||
| (iv) | Directors: | |||||||
| /s/ KODWO GHARTEY-TAGOE | ||||||||
| Kodwo Ghartey-Tagoe | ||||||||
| /s/ R. ALEXANDER GLENN | ||||||||
| R. Alexander Glenn | ||||||||
| /s/ LYNN J. GOOD | ||||||||
| Lynn J. Good | ||||||||
Date: February 23, 2024
E-7
| SIGNATURES | |||||
SIGNATURES
Pursuant to the requirements of Section 13 or 15(d) of the Securities Exchange Act of 1934, the registrant has duly caused this report to be signed on its behalf by the undersigned, thereunto duly authorized.
Date: February 23, 2024
DUKE ENERGY INDIANA, LLC (Registrant) | |||||||||||
| By: | /s/ LYNN J. GOOD | ||||||||||
| Lynn J. Good Chief Executive Officer | |||||||||||
Pursuant to the requirements of the Securities Exchange Act of 1934, this report has been signed below by the following persons on behalf of the registrant and in the capacities and on the date indicated.
| (i) | /s/ LYNN J. GOOD | |||||||
| Lynn J. Good | ||||||||
| Chief Executive Officer (Principal Executive Officer) | ||||||||
| (ii) | /s/ BRIAN D. SAVOY | |||||||
| Brian D. Savoy | ||||||||
| Executive Vice President and Chief Financial Officer (Principal Financial Officer) | ||||||||
| (iii) | /s/ CYNTHIA S. LEE | |||||||
| Cynthia S. Lee | ||||||||
| Vice President, Chief Accounting Officer and Controller (Principal Accounting Officer) | ||||||||
| (iv) | Directors: | |||||||
| /s/ R. ALEXANDER GLENN | ||||||||
| R. Alexander Glenn | ||||||||
| /s/ KELLEY A. KARN | ||||||||
| Kelley A. Karn | ||||||||
| /s/ STAN PINEGAR | ||||||||
| Stan Pinegar | ||||||||
Date: February 23, 2024
E-8
| SIGNATURES | |||||
SIGNATURES
Pursuant to the requirements of Section 13 or 15(d) of the Securities Exchange Act of 1934, the registrant has duly caused this report to be signed on its behalf by the undersigned, thereunto duly authorized.
Date: February 23, 2024
PIEDMONT NATURAL GAS COMPANY, INC. (Registrant) | |||||||||||
| By: | /s/ LYNN J. GOOD | ||||||||||
| Lynn J. Good Chief Executive Officer | |||||||||||
Pursuant to the requirements of the Securities Exchange Act of 1934, this report has been signed below by the following persons on behalf of the registrant and in the capacities and on the date indicated.
| (i) | /s/ LYNN J. GOOD | |||||||
| Lynn J. Good | ||||||||
| Chief Executive Officer (Principal Executive Officer) | ||||||||
| (ii) | /s/ BRIAN D. SAVOY | |||||||
| Brian D. Savoy | ||||||||
| Executive Vice President and Chief Financial Officer (Principal Financial Officer) | ||||||||
| (iii) | /s/ CYNTHIA S. LEE | |||||||
| Cynthia S. Lee | ||||||||
| Vice President, Chief Accounting Officer and Controller (Principal Accounting Officer) | ||||||||
| (iv) | Directors: | |||||||
| /s/ KODWO GHARTEY-TAGOE | ||||||||
| Kodwo Ghartey-Tagoe | ||||||||
| /s/ LYNN J. GOOD | ||||||||
| Lynn J. Good | ||||||||
| /s/ BRIAN D. SAVOY | ||||||||
| Brian D. Savoy | ||||||||
Date: February 23, 2024
E-9