UNITED STATES
SECURITIES AND EXCHANGE COMMISSION
Washington, D.C. 20549
FORM 10-K
(Mark One)
For the fiscal year ended December 31 , 2023
or
For the transition period from ____________ to ____________
Commission File Number: 001-15373
(Exact name of registrant as specified in its charter)
| (State or Other Jurisdiction of | (I.R.S. Employer | |||||||
| Incorporation or Organization) | Identification No.) | |||||||
(Address of Principal Executive Offices)
(314 ) 725-5500
(Registrant’s telephone number, including area code)
Securities registered pursuant to Section 12(b) of the Act:
| (Title of each class) | (Trading Symbol) | (Name of each exchange on which registered) | ||||||||||||
| Depositary Shares, each representing a 1/40th interest in a share of 5.00% Fixed Rate Non-Cumulative Perpetual Preferred Stock, Series A | EFSCP | Nasdaq Global Select Market | ||||||||||||
Securities registered pursuant to Section 12(g) of the Act:
None
Indicate by check mark if the registrant is a well-known seasoned issuer, as defined in Rule 405 of the Securities Act. Yes x No ¨
Indicate by check mark if the registrant is not required to file reports pursuant to Section 13 or Section 15(d) of the Act. Yes ¨ No x
Indicate by check mark whether the registrant (1) has filed all reports required to be filed by Section 13 or 15(d) of the Securities Exchange Act of 1934 during the preceding 12 months (or for such shorter period that the registrant was required to file such reports), and (2) has been subject to such filing requirements for the past 90 days. Yes x No ¨
Indicate by check mark whether the registrant has submitted electronically every Interactive Data File required to be submitted pursuant to Rule 405 of Regulation S-T (§ 232.405 of this chapter) during the preceding 12 months (or for such shorter period that the registrant was required to submit such files). Yes x No ¨
Indicate by check mark whether the registrant is a large accelerated filer, an accelerated filer, a non-accelerated filer, a smaller reporting company, or an emerging growth company. See the definitions of “large accelerated filer,” “accelerated filer,” “smaller reporting company” and “emerging growth company” in Rule 12b-2 of the Exchange Act.
| ☒ | Accelerated filer | ☐ | ||||||||||||
| Non-accelerated filer | ☐ | Smaller reporting company | ||||||||||||
| Emerging growth company | ||||||||||||||
If an emerging growth company, indicate by check mark if the registrant has elected not to use the extended transition period for complying with any new or revised financial accounting standards provided pursuant to Section 13(a) of the Exchange Act. ¨
Indicate by check mark whether the registrant has filed a report on and attestation to its management’s assessment of the effectiveness of its internal control over financial reporting under Section 404(b) of the Sarbanes-Oxley Act (15 U.S.C. 7262(b)) by the registered public accounting firm that prepared or issued its audit report. ☒
If securities are registered pursuant to Section 12(b) of the Act, indicate by check mark whether the financial statements of the registrant included in the filing reflect the correction of an error to previously issued financial statements. ¨
Indicate by check mark whether any of those error corrections are restatements that required a recovery analysis of incentive-based compensation received by any of the registrant’s executive officers during the relevant recovery period pursuant to §240.10D-1(b). ¨
Indicate by check mark whether the registrant is a shell company (as defined in Rule 12b-2 of the Act). Yes ☐ No x
The aggregate market value of the voting and non-voting common stock held by non-affiliates of the Registrant was approximately $1,430,397,000 based on the closing price of the common stock of $39.10 as of the last business day of the registrant’s most recently completed second fiscal quarter (June 30, 2023) as reported by the Nasdaq Global Select Market.
As of February 21, 2024, the Registrant had 37,466,585 shares of outstanding common stock.
DOCUMENTS INCORPORATED BY REFERENCE
Portions of our Annual Report on Form 10-K for the fiscal year ended December 31, 2022 are incorporated by reference into Item 7 of this Annual Report on Form 10-K. Additionally, the information required by Items 10, 11, 12, 13 and 14 of Part III of this Annual Report on Form 10-K is incorporated by reference to the Registrant’s Definitive Proxy Statement for its 2024 Annual Meeting of Shareholders, which will be filed pursuant to Regulation 14A under the Securities Exchange Act of 1934, as amended.
ENTERPRISE FINANCIAL SERVICES CORP
2023 ANNUAL REPORT ON FORM 10-K
TABLE OF CONTENTS
| Page | ||||||||
| PART I | ||||||||
| Item 1. | Business | |||||||
| Item 1A. | Risk Factors | |||||||
| Item 1B. | Unresolved Staff Comments | |||||||
| Item 1C. | Cybersecurity | |||||||
| Item 2. | Properties | |||||||
| Item 3. | Legal Proceedings | |||||||
| Item 4. | Mine Safety Disclosures | |||||||
| PART II | ||||||||
| Item 5. | Market for Registrant’s Common Equity, Related Stockholder Matters and Issuer Purchases of Equity Securities | |||||||
| Item 6. | Reserved | |||||||
| Item 7. | Management’s Discussion and Analysis of Financial Condition and Results of Operations | |||||||
| Item 7A. | Quantitative and Qualitative Disclosures About Market Risk | |||||||
| Item 8. | Financial Statements and Supplementary Data | |||||||
| Item 9. | Changes in and Disagreements with Accountants on Accounting and Financial Disclosure | |||||||
| Item 9A. | Controls and Procedures | |||||||
| Item 9B. | Other Information | |||||||
| Item 9C. | Disclosure Regarding Foreign Jurisdictions that Prevent Inspections | |||||||
| PART III | ||||||||
| Item 10. | Directors, Executive Officers, and Corporate Governance | |||||||
| Item 11. | Executive Compensation | |||||||
| Item 12. | Security Ownership of Certain Beneficial Owners, and Management and Related Stockholder Matters | |||||||
| Item 13. | Certain Relationships and Related Transactions, and Director Independence | |||||||
| Item 14. | Principal Accountant Fees and Services | |||||||
| PART IV | ||||||||
| Item 15. | Exhibits and Financial Statement Schedules | |||||||
| Item 16. | Form 10-K Summary | |||||||
| SIGNATURES | ||||||||
Glossary of Acronyms, Abbreviations and Entities
The acronyms and abbreviations identified below are used in various sections of this Form 10-K, including “Management’s Discussion and Analysis of Financial Condition and Results of Operations,” in Item 7 and the Consolidated Financial Statements and the Notes to Consolidated Financial Statements in Item 8 of this Form 10-K.
| ACL | Allowance for Credit Losses | FASB | Financial Accounting Standards Board | |||||||||||
| ASC | Accounting Standards Codification | FDIC | Federal Deposit Insurance Corporation | |||||||||||
| ASU | Accounting Standards Update | Federal Reserve | Federal Reserve Board | |||||||||||
| Bank | Enterprise Bank & Trust | FHLB | Federal Home Loan Bank | |||||||||||
| BHCA | Bank Holding Company Act of 1956, as amended | GAAP | Generally Accepted Accounting Principles | |||||||||||
| Board or Board of Directors | Enterprise Financial Services Corp board of directors | GDP | Gross Domestic Product | |||||||||||
| C&I | Commercial and Industrial | ICE | The Intercontinental Exchange | |||||||||||
| CCB | Capital Conservation Buffer | LIBOR | London Interbank Offered Rate | |||||||||||
| CDFI | Community Development Financial Institution | MD&A | Management’s Discussion and Analysis of Financial Condition and Results of Operations | |||||||||||
| CECL | Current Expected Credit Loss | MSA | Metropolitan Statistical Area | |||||||||||
| CET1 | Common Equity Tier 1 Capital | OCC | Office of the Comptroller of the Currency | |||||||||||
| CFPB | Consumer Financial Protection Bureau | PCD | Purchased Credit Deteriorated | |||||||||||
| Company | Enterprise Financial Services Corp and Subsidiaries | PPP | Paycheck Protection Program | |||||||||||
| CRA | Community Reinvestment Act | SBA | U.S. Small Business Administration | |||||||||||
| CRE | Commercial Real Estate | SBIC | Small Business Investment Company | |||||||||||
| Dodd-Frank Act | Dodd-Frank Wall Street Reform and Consumer Protection Act of 2010 | SEC | Securities and Exchange Commission | |||||||||||
| EFSC | Enterprise Financial Services Corp | SOFR | Secured Overnight Financing Rate | |||||||||||
| Enterprise | Enterprise Financial Services Corp and Subsidiaries | We, Us, Our | Enterprise Financial Services Corp and Subsidiaries | |||||||||||
PART 1
ITEM 1: BUSINESS
Forward-Looking Information
Some of the information in this Annual Report on Form 10-K may contain “forward-looking statements” within the meaning of and intended to be covered by the safe harbor provisions of the Private Securities Litigation Reform Act of 1995, and by Section 27A of the Securities Act of 1933, as amended, and Section 21E of the Securities Exchange Act of 1934, as amended. Such forward-looking statements are based on management’s current expectations and beliefs concerning future developments and their potential effects on the Company, and include, without limitation, statements about the Company’s plans, strategies, goals, objectives, expectations, or consequences of statements about the future performance, operations, products and services of the Company and its subsidiaries, as well as statements about the Company’s expectations regarding revenue and asset growth, financial performance and profitability, loan and deposit growth, yields and returns, loan diversification and credit management, products and services, shareholder value creation and the impact of acquisitions. Forward-looking statements typically are identified with use of terms such as “may,” “might,” “will, “would,” “should,” “expect,” “plan,” “anticipate,” “believe,” “estimate,” “predict,” “intend,” “potential,” “could,” “continue” and the negative and other variations of these terms and similar words, although some forward-looking statements may be expressed differently. Forward-looking statements also include, but are not limited to, statements regarding plans, objectives, expectations or consequences of announced transactions, known trends, and statements about future performance, operations, products and services. Because forward-looking statements are subject to assumptions and uncertainties, actual results or future events could differ, possibly materially, from those anticipated in the forward-looking statements and future results could differ materially from historical performance. Further, the ability to predict results or the actual effect of future plans or strategies is inherently uncertain. While there is no assurance that any list of risks and uncertainties or risk factors is complete, important factors that could cause actual results to differ materially from those in the forward-looking statements include the following, without limitation: our ability to efficiently integrate acquisitions into our operations, retain the customers of these businesses and grow the acquired operations; credit risk; changes in the appraised valuation of real estate securing impaired loans; our ability to recover our investment in loans; fluctuations in the fair value of collateral underlying loans; outcomes of litigation and other contingencies; exposure to general and local economic and market conditions, including risk of recession, high unemployment rates, higher inflation and its impacts (including U.S. federal government measures to address higher inflation), U.S. fiscal debt, budget and tax matters, and any slowdown in global economic growth; risks associated with rapid increases or decreases in prevailing interest rates; changes in business prospects that could impact goodwill estimates and assumptions; consolidation within the banking industry; competition from banks and other financial institutions; the ability to attract and retain relationship officers and other key personnel; burdens imposed by federal and state regulation; changes in legislative or regulatory requirements, as well as current, pending or future legislation or regulation that could have a negative effect on our revenue and business, including rules and regulations relating to bank products and financial services; changes in accounting policies and practices or accounting standards; natural disasters; terrorist activities, war and geopolitical matters (including the war in Israel and potential for a broader regional conflict and the war in Ukraine and the imposition of additional sanctions and export controls in connection therewith), or pandemics, or other health emergencies and their effects on economic and business environments in which we operate, including the related disruption to the financial market and other economic activity; and other risks discussed under the caption “Risk Factors” in Item 1A of this Annual Report on Form 10-K, all of which could cause actual results to differ from those set forth in the forward-looking statements. The Company cautions that the preceding list is not exhaustive of all possible risk factors and other factors could also adversely affect the Company’s results.
Readers are cautioned not to place undue reliance on forward-looking statements, which reflect management’s analysis and expectations only as of the date of such statements. Forward-looking statements speak only as of the date they are made, and the Company does not intend, and undertakes no obligation, to publicly revise or update forward-looking statements after the date of this report, whether as a result of new information, future events or otherwise, except as required by federal securities law. You should understand that it is not possible to predict or identify all risk factors. Readers should carefully review all disclosures we file from time to time with the SEC which are available on the Company’s website at www.enterprisebank.com under “Investor Relations.”
1
General Development and Description of Our Business
Enterprise Financial Services Corp, headquartered in Clayton, Missouri, is a financial holding company incorporated under Delaware law in December 1994. EFSC is the holding company for Enterprise Bank & Trust, a full-service financial institution offering banking and wealth management services to individuals and corporate customers primarily located in Arizona, California, Florida, Kansas, Missouri, Nevada, and New Mexico, in addition to loan and deposit production offices throughout the United States. Our executive offices are located at 150 North Meramec Avenue, Clayton, Missouri 63105, and our telephone number is (314) 725-5500.
Our stated mission is “Guiding people to a lifetime of financial success.” We have established an accompanying corporate vision, “To be a company where our associates are proud to work, that delivers ease of navigation to our customers and value to our investors, while helping our communities flourish.” These tenets are fundamental to our business strategies and operations.
Our business objective is to generate attractive shareholder returns by providing comprehensive financial services primarily to privately-held businesses, their owner families, and other success-minded individuals. To achieve these objectives we have developed a business strategy that leverages a focused and relationship-oriented distribution and sales approach, with an emphasis on niche businesses, while maintaining prudent credit and interest rate risk management, opportunities for fee income, appropriate supporting technology, and controlling expenses. We believe this strategy allows us to maximize organic growth opportunities, which we supplement and enhance through disciplined growth through acquisition.
As described in greater detail below, the Company offers a broad range of business and personal banking services, including wealth management services provided through Enterprise Trust. Lending services include C&I, CRE, real estate construction and development, residential real estate, SBA, consumer and other loan products. A wide variety of deposit products, including property management and community associations along with a complete suite of treasury management and international trade services for operating businesses, complement our lending capabilities.
Building long-term client relationships – Our growth strategy is first and foremost client relationship driven. We continuously seek to add clients who fit our target market of businesses, business owners, professionals, and associated relationships. Those relationships are maintained, cultivated, and expanded over time by experienced banking officers and other trained professionals. We fund loan growth primarily with core deposits from our business and professional clients in addition to consumers in our branch market areas. This is supplemented by borrowing or other deposit sources, including advances from the FHLB and brokered certificates of deposits.
Specialized lending and product niches – We have focused our lending activities in specialty markets where we believe our expertise and experience as a commercial lender provides advantages over other competitors. In addition, we have developed expertise in certain product niches. These specialty niche activities focus on the following areas:
•SBA 7(a). We have a team of experienced bankers in production offices across the country that originate loans through the SBA 7(a) program. These loans are primarily owner-occupied, commercial real estate loans secured by a first lien. These loans predominantly have a 75% portion guaranteed by the SBA. By focusing on this specific product type, we have developed an expertise that differentiates us based upon speed and reliability of execution.
•Life Insurance Premium Finance. We specialize in financing whole life insurance premiums utilized in high net worth estate planning through relationships with boutique estate planners throughout the United States.
•Sponsor Finance. We support mid-market company mergers and acquisitions in many domestic markets. We market directly to targeted private equity firms, principally SBICs, and provide primarily senior debt financing to the portfolio companies. In addition, the Company has both financing and depository relationships with the sponsors of the portfolio companies.
•Tax Credit Related Lending. We are a secured lender on affordable housing projects funded through the use of federal and state low income housing tax credits. In addition, we provide leveraged and other loans on projects funded through the U.S. Department of the Treasury Community Development Financial Institution (“ Treasury
2
CDFI”) New Markets Tax Credit (“NMTC”) Program. In 2023, we were awarded a $60.0 million NMTC allocation from the Treasury CDFI. This was our sixth NMTC allocation and brings the total amount of these allocations to $303.0 million. We will continue to participate in the application process for future awards, as well as serve as a secured lender to other allocatees.
•Tax Credit Brokerage. We have a minority ownership in a partnership that acquires, invests and sells, state low income housing tax credits. We lend the partnership money with 6 - 12 year terms and receive interest income and fee income as projects close or credits are sold.
Specialty deposits – In addition to commercial operating accounts for our C&I customers, we offer specialty deposit accounts to customers in certain industries with complex account needs. Our focus areas include community associations, property management, third party escrow, and trust services. These accounts are primarily demand accounts and have a low overall interest cost. Customers in our specialty deposit products will typically receive an earnings credit rate that is used to offset the cost of maintaining the deposit accounts. Payments made by the Company through the application of the earnings credit is reflected as a component of non-interest expense in the Consolidated Statement of Income.
Fee income business – We offer a broad range of treasury management products and services that benefit businesses ranging from large national clients to local businesses. Customized solutions and special product bundles are available to clients of all sizes. In response to ever increasing needs for data/information security and functional efficiency, we continue to offer cash management systems that employ mobile technology and fraud detection/mitigation services. Enterprise Trust offers a wide range of fiduciary, investment management, and financial advisory services to facilitate providing these services. We also offer customer hedging products, international banking, card services and tax credit businesses that generate fee income. The Company also invests in certain private equity and SBIC investments that generate additional fee income.
Use of technology – Clients access our products and services both in physical branch locations as well as remotely. We offer online, device applications, text and voice banking in addition to a variety of “on site” hardware and software solutions, such as remote deposit capture. These portals facilitate access to the commercial and consumer products we offer such as internet banking, mobile banking, cash management products, remote deposit capture, positive pay services, fraud detection and prevention, automated payables, check image, and statement and document imaging. Additional service offerings currently supported by the Bank include controlled disbursements, repurchase agreements, and sweep investment accounts. Our cash management suite of products blends technology and personal service, which we believe often creates a competitive advantage over our competition. Technology products are also extensively utilized within the organization by associates in all lines of business including operations and support, customer service, and financial reporting for internal management purposes and for external compliance. We have begun the process of converting our primary operating system to a leading core solution, and plan to implement the new core in late 2024.
Maintaining asset quality – We monitor asset quality through formal, ongoing, multiple-level reviews of loans in each market and specialized lending niche. These reviews are overseen by the Bank’s credit administration department. In addition, the loan portfolio is subject to ongoing monitoring by a loan review function that reports directly to the Bank’s Board of Directors or its committees.
Expense management – We manage expenses carefully through detailed budgeting and expense approval processes. Our success is gauged through the measurement of the “efficiency ratio.” The efficiency ratio is equal to noninterest expense divided by total revenue (tax equivalent net interest income plus noninterest income).
Growth through Acquisitions – Disciplined strategic acquisitions have contributed significantly to the Company’s growth and expansion.
3
Competition
The Company and its subsidiaries operate in highly competitive markets. Our geographic markets are served by multiple large financial and bank holding companies with substantial capital resources and lending capacity. We face competition not only from other financial holding companies and commercial banks, but also from credit unions, investment managers, insurers, brokerage firms, financial technology companies, and other providers of financial services and products. Strong competition for deposit and loan products affects the rates of those products, as well as the terms on which they are offered to customers.
Supervision and Regulation
The Company is a financial holding company registered under the BHCA and is subject to regulation, supervision and examination by the Federal Reserve. The Bank is a Missouri trust company with banking powers and is subject to supervision and regulation by the Missouri Division of Finance. In addition, as a Federal Reserve non-member bank, the Bank is subject to supervision and regulation by the FDIC.
The Company has securities registered with the SEC under the Securities Exchange Act of 1934, as amended. The Company’s common stock is listed on the Nasdaq Stock Market. The Company also has depositary shares, each representing a 1/40th interest in a share of the Company’s 5%, noncumulative perpetual preferred stock (“Series A Preferred Stock”), listed on the Nasdaq Stock Market. Accordingly, the Company is subject to both SEC and Nasdaq listing standards.
The following is a summary description of the relevant laws, rules, and regulations governing banks and financial holding companies, including the Company. The description of, and references to, the statutes and regulations below are brief summaries and do not purport to be complete. The descriptions are qualified in their entirety by reference to the related statutes and regulations.
The regulatory and supervisory structure establishes a comprehensive framework of activities in which an institution can engage and is intended primarily for the protection of depositors, the deposit insurance funds and the banking system as a whole, rather than for the protection of shareholders or creditors. The regulatory structure also gives the regulatory authorities extensive discretion in connection with their supervisory and enforcement activities and examination policies, including policies concerning the establishment of deposit insurance assessment fees, classification of assets and establishment of adequate credit loss reserves for regulatory purposes.
Various legislation is from time to time introduced in Congress and state legislatures where we operate. Such legislation may change applicable statutes and the operating environment in substantial and unpredictable ways. We cannot determine the ultimate effect that future legislation or implementing regulations would have on our financial condition or our results of operations or the results of operations of any of our subsidiaries.
The Dodd-Frank Act is a comprehensive legislative act that contains a set of provisions designed to govern the practices and oversight of financial institutions and other participants in the financial markets. The Dodd-Frank Act made extensive changes in the regulation of financial institutions and their holding companies. Some of the changes brought about by the Dodd-Frank Act have been modified by the Economic Growth, Regulatory Relief, and Consumer Protection Act of 2018, signed into law on May 24, 2018.
Financial Holding Company
As a financial holding company, the Company is subject to regulation and examination by the Federal Reserve, and is required to file periodic reports of its operations and such additional information as the Federal Reserve may require. In order to remain a financial holding company, the Company must continue to be considered well-managed and well-capitalized by the Federal Reserve, and the Bank must continue to be considered well-managed and well-capitalized by the FDIC, and have at least a “satisfactory” rating under the CRA. See “Liquidity and Capital Resources” in the MD&A for more information on our capital adequacy, and “Bank Subsidiary - Community Reinvestment Act” below for more information on the CRA.
4
Acquisitions: With certain limited exceptions, the BHCA requires every financial holding company or bank holding company to obtain the prior approval of the Federal Reserve before (i) acquiring substantially all the assets of any bank, (ii) acquiring direct or indirect ownership or control of any voting shares of any bank if, after such acquisition, it would own or control more than 5% of the voting shares of such bank (unless it already owns or controls the majority of such shares), or (iii) merging or consolidating with another bank holding company. Additionally, the BHCA provides that the Federal Reserve may not approve any of these transactions if it would result in or tend to create a monopoly, substantially lessen competition, or otherwise function as a restraint of trade, unless the anti-competitive effects of the proposed transaction are clearly outweighed by the public interest in meeting the convenience and needs of the community to be served. The Federal Reserve also is required to consider the financial and managerial resources and future prospects of the bank holding companies and banks concerned and the convenience and needs of the community to be served. The Federal Reserve’s consideration of financial resources generally focuses on capital adequacy, which is described below.
Change in Bank Control: Subject to various exceptions, the BHCA and the Change in Bank Control Act, together with related regulations, require Federal Reserve approval prior to any person or company acquiring “control” of a bank or financial holding company. Control is conclusively presumed to exist if an individual or company acquires 25% or more of any class of voting securities of a company or controls a majority of the board of directors. In certain circumstances, control is rebuttably presumed to exist if a person or company acquires 10% or more, but less than 25%, of any class of voting securities of a company. The regulations provide a procedure for challenging rebuttable presumptions of control.
Permitted Activities: The BHCA has generally prohibited a bank holding company from engaging in activities other than banking or managing or controlling banks or other permissible subsidiaries and from acquiring or retaining direct or indirect control of any company engaged in any activities other than those determined by the Federal Reserve to be closely related to banking or managing or controlling banks as to be a proper incident thereto. Provisions of the Gramm-Leach-Bliley Act have expanded the permissible activities of a bank holding company that qualifies as a financial holding company. Under the regulations implementing the Gramm-Leach-Bliley Act, a financial holding company may engage in additional activities that are financial in nature or incidental or complementary to financial activities. Those activities include, among other activities, certain insurance, advisory and securities activities.
Support of Bank Subsidiary: Under Federal Reserve policy, the Company is expected to act as a source of financial and managerial strength for the Bank and to commit resources to support the Bank. The Dodd-Frank Act codified this longstanding policy by adopting a provision requiring, among other things, that bank holding companies serve as a source of strength for an subsidiary depository institution. Such financial and managerial support from the Company may be required at times when, without this legal requirement, the Company may not be inclined to provide it.
Capital Adequacy: The Company is subject to capital requirements and standards established by the Federal Reserve (“Basel III Capital Rules”) that are applied on a consolidated basis. These requirements are substantially similar to those required of the Bank (summarized below).
Under the Basel III Capital Rules, capital instruments such as trust preferred securities and cumulative preferred shares have been phased out of tier 1 capital for banking organizations that had $15 billion or more in total consolidated assets as of December 31, 2009, and have grandfathered as tier 1 capital such instruments issued by smaller entities prior to May 19, 2010 (provided they do not exceed 25% of tier 1 capital). At December 31, 2023, the Company had $93.0 million of trust preferred securities that are grandfathered under this provision. However, if the Company has total assets of $15 billion and acquires another bank, or if an acquisition causes the Company to exceed $15 billion in total assets, the trust preferred securities will no longer qualify as tier 1 instruments (but may be included in tier 2 capital).
Dividend Restrictions and Share Repurchases: From time to time the Company may engage in share repurchases. The Federal Reserve requires that bank and financial holding companies, where certain conditions are triggered,
5
provide prior notice to, consult with, and in certain circumstances seek the approval of, the Federal Reserve or reserve bank staff prior to implementing a share repurchase plan.
Under Federal Reserve policies, financial holding companies may pay cash dividends on common stock only out of income available over the past year if prospective earnings retention is consistent with the organization’s expected future needs and financial condition and if the organization is not in danger of failing to meet its minimum regulatory capital requirements. Federal Reserve policy also provides that financial holding companies should not pay a level of cash dividends that undermines the financial holding company’s ability to serve as a source of strength to its banking subsidiaries.
Dividends, repurchases and redemptions on the Company’s capital stock (common and preferred) are prohibited under the terms of the junior subordinated debenture agreements (see “Item 8. Note 10 – Subordinated Debentures and Notes”) if the Company is in continuous default on its payment obligations, has elected to defer interest payments or extends the interest payment period. Furthermore, unless dividends on all outstanding shares of the Series A Preferred Stock for the most recently completed dividend period have been paid or declared, dividends on, and repurchases of, common stock are prohibited.
Incentive Compensation: Federal banking agencies have issued guidance on incentive compensation policies intended to ensure that the incentive compensation policies of banking organizations do not undermine the safety and soundness of such organizations by encouraging excessive risk-taking. The guidance, which covers all employees that have the ability to materially affect the risk profile of an organization, is based upon the key principles that a banking organization’s incentive compensation arrangements should (i) provide incentives that do not encourage risk-taking beyond the organization’s ability to effectively identify and manage risks, (ii) be compatible with effective internal controls and risk management, and (iii) be supported by strong corporate governance, including active and effective oversight by the organization’s board of directors. In accordance with the Dodd-Frank Act, the federal banking agencies prohibit incentive-based compensation arrangements that encourage inappropriate risk taking by covered financial institutions (generally institutions, like us, that have over $1 billion in assets) and are deemed to be excessive, or that may lead to material losses.
The Federal Reserve will review, as part of the regular, risk-focused examination process, the incentive compensation arrangements of banking organizations, such as the Company, that are not “large, complex banking organizations.” These reviews will be tailored to each organization based on the scope and complexity of the organization’s activities and the prevalence of incentive compensation arrangements. The findings of the supervisory initiatives will be included in reports of examination. Deficiencies will be incorporated into the organization’s supervisory ratings, which can affect the organization’s ability to make acquisitions and take other actions. Enforcement actions may be taken against a banking organization if its incentive compensation arrangements, or related risk- management control or governance processes, pose a risk to the organization’s safety and soundness, and the organization is not taking prompt and effective measures to correct the deficiencies.
The scope and content of the U.S. banking regulators’ policies on executive compensation may continue to evolve in the near future. It cannot be determined at this time whether compliance with such policies will adversely affect the Company’s ability to hire, retain, and motivate its key employees.
In October 2022, the SEC adopted rules requiring securities exchanges, including Nasdaq, to adopt listing standards that require issuers to develop and implement a policy providing, under certain circumstances, for the recovery of erroneously awarded incentive-based compensation received by current or former executive officers. The new rules, which were mandated as part of the Dodd-Frank Act became effective in January 2023. Pursuant to Nasdaq listing standards, the Company adopted a clawback policy that implemented the rules in the third quarter of 2023.
6
Bank Subsidiary
The Bank is subject to extensive federal and state regulatory oversight. The various regulatory authorities regulate or monitor all areas of the banking operations, including security devices and procedures, adequacy of capitalization and loss reserves, loans, investments, borrowings, deposits, mergers, issuance of securities, payment of dividends, interest rates payable on deposits, interest rates and fees chargeable on loans, establishment of branches, corporate reorganizations, maintenance of books and records, and adequacy of staff training to carry on safe lending and deposit gathering practices. The Bank must maintain certain capital ratios and is subject to limitations on aggregate investments in real estate, bank premises, low-income housing projects, and furniture and fixtures. In connection with their supervision and regulation responsibilities, the Bank is subject to periodic examination by the FDIC and Missouri Division of Finance.
Capital Adequacy: The Bank is required to comply with the FDIC’s capital adequacy standards for insured banks. The FDIC has issued risk-based capital and leverage capital guidelines for measuring capital adequacy, and all applicable capital standards must be satisfied for the Bank to be considered in compliance with regulatory capital requirements.
Prompt Corrective Action: The Bank’s capital categories are determined for the purpose of applying the “prompt corrective action” rules described below and may be taken into consideration by banking regulators in evaluating proposals for expansion or new activities. They are not necessarily an accurate representation of a bank’s overall financial condition or prospects for other purposes. A failure to meet the capital guidelines could subject the Bank to a variety of enforcement actions under those rules, including the issuance of a capital directive, the termination of deposit insurance by the FDIC, a prohibition on taking brokered deposits, and other restrictions on its business. As described below, the FDIC also can impose other substantial restrictions on banks that fail to meet applicable capital requirements.
Federal law establishes a system of prompt corrective action to resolve the problems of undercapitalized banks. Under this system, the FDIC has established five capital categories (“well-capitalized,” “adequately capitalized,” “undercapitalized,” “significantly undercapitalized,” and “critically undercapitalized”) and is required to take various mandatory supervisory actions, and is authorized to take other discretionary actions with respect to banks in the three undercapitalized categories. The severity of any such actions taken will depend upon the capital category in which a bank is placed. Generally, subject to a narrow exception, current federal law requires the FDIC to appoint a receiver or conservator for a bank that is critically undercapitalized.
The following table summarizes the prompt corrective action categories:
| Prompt Corrective Action Category | Total Risk-Based Capital | Tier 1 Risk-Based Capital | Common Equity Tier 1 Risk-Based Capital | Tier 1 Leverage Ratio | ||||||||||
| Well-capitalized | 10.0% | 8.0% | 6.5% | 5.0% | ||||||||||
| Adequately capitalized | 8.0% | 6.0% | 4.5% | 4.0% | ||||||||||
| Undercapitalized | < 8.0% | < 6.0% | < 4.5% | < 4.0% | ||||||||||
| Significantly undercapitalized | < 6.0% | < 4.0% | < 3.0% | < 3.0% | ||||||||||
| Critically undercapitalized | Tangible equity / Total assets ≤ 2.0% | |||||||||||||
In addition to the minimum capital ratios noted in the table above, the Basel III Capital Rules require the maintenance of a CCB consisting of CET1 capital in an amount equal to 2.5% of risk weighted assets to avoid restrictions on the ability to make capital distributions and to pay certain discretionary bonus payments to executive officers. The CCB effectively increases the minimum CET1 capital, tier 1 capital, and total capital ratios for U.S. banking organizations to 7.0%, 8.5%, and 10.5%, respectively.
A bank that becomes “undercapitalized,” “significantly undercapitalized,” or “critically undercapitalized” is required to submit an acceptable capital restoration plan to the FDIC. An “undercapitalized” bank also is generally prohibited from increasing its average total assets, making acquisitions, establishing new branches, or engaging in any new line of business, except in accordance with an accepted capital restoration plan or with the approval of the
7
FDIC. Also, the FDIC may treat an “undercapitalized” bank as being “significantly undercapitalized” if it determines that those actions are necessary to carry out the purpose of the law.
All of the Bank’s capital ratios were at levels that qualify it to be “well-capitalized” for regulatory purposes as of December 31, 2023 (see “Item 8. Note 14 – Regulatory Capital”).
Consumer Financial Protection Bureau: The Dodd-Frank Act centralized responsibility for consumer financial protection including implementing, examining and enforcing compliance with federal consumer financial laws with the CFPB. Depository institutions with more than $10 billion in assets, such as the Bank, are subject to examination by the CFPB.
The CFPB has broad rule-making authority for a wide range of consumer protection laws that apply to all banks, including the authority to prohibit unfair, deceptive or abusive acts and practices. In addition, the Dodd-Frank Act enhanced the regulation of mortgage banking and gave to the CFPB oversight of many of the core laws which regulate the mortgage industry and the authority to implement mortgage regulations. Any new regulations adopted by the CFPB may significantly impact consumer mortgage lending and servicing.
The Bank is also subject to other laws and regulations intended to protect consumers in transactions with depository institutions, as well as other laws or regulations affecting customers of financial institutions generally. While the list set forth herein is not exhaustive, these laws and regulations include the Truth in Lending Act, the Truth in Savings Act, the Electronic Funds Transfer Act, the Expedited Funds Availability Act, the Equal Credit Opportunity Act, the Fair Housing Act, the Real Estate Settlement and Procedures Act, the Fair Credit Reporting Act and the Federal Trade Commission Act, among others. These laws and regulations mandate certain disclosure requirements and regulate the manner in which financial institutions must deal with customers when taking deposits or making loans to such customers. The Bank must comply with the applicable provisions of these consumer protection laws and regulations as part of its ongoing customer relations.
UDAP and UDAAP: Banking regulatory agencies have increasingly used a general consumer protection statute to address “unethical” or otherwise “bad” business practices that may not necessarily fall directly under the purview of a specific banking or consumer finance law. The law of choice for enforcement against such business practices has been Section 5 of the Federal Trade Commission Act - the primary federal law that prohibits unfair or deceptive acts or practices and unfair methods of competition in or affecting commerce (“UDAP” or “FTC Act”). “Unjustified consumer injury” is the principal focus of the FTC Act. Moreover, the UDAP provisions have been expanded under the Dodd-Frank Act to apply to “unfair, deceptive or abusive acts or practices” (“UDAAP”), which has been delegated to the CFPB for supervision. The CFPB has brought a variety of enforcement actions for violations of UDAAP provisions and CFPB guidance continues to evolve.
Mortgage Reform: The CFPB has adopted final rules implementing minimum standards for the origination of residential mortgages, including standards regarding a customer’s ability to repay, restricting variable-rate lending by requiring the ability to repay variable-rate loans be determined by using the maximum rate that could apply during the first five years of a variable-rate loan term, and making more loans subject to provisions for higher cost loans, new disclosures, and certain other revisions. The Dodd-Frank Act allows borrowers to raise certain defenses to foreclosure if they receive any loan other than a “qualified mortgage” as defined by the CFPB.
Dividends by the Bank Subsidiary: Under Missouri law, the Bank may pay dividends to the Company only from a portion of its undivided profits and may not pay dividends if its capital is impaired. As an insured depository institution, federal law prohibits the Bank from making any capital distributions, including the payment of a cash dividend, if it is “undercapitalized” or after making the distribution would become undercapitalized. If the FDIC believes the Bank is engaged in, or about to engage in, an unsafe or unsound practice, the FDIC may require, after notice and hearing, that the Bank cease and desist from that practice. The FDIC has indicated that paying dividends that deplete a depository institution’s capital base to an inadequate level would be an unsafe and unsound banking practice. The FDIC has issued policy statements providing that insured banks generally should pay dividends only from their current operating earnings. The Bank’s payment of dividends also could be affected or limited by other
8
factors, such as events or circumstances which would lead the FDIC to require that it maintain capital in excess of regulatory guidelines.
Transactions with Affiliates and Insiders: The Bank is subject to the provisions of Regulation W promulgated by the Federal Reserve, which encompasses Sections 23A and 23B of the Federal Reserve Act. Regulation W places limits and conditions on the amount of loans or extensions of credit to, investments in, or certain other transactions with, affiliates and on the amount of advances to third parties collateralized by the securities or obligations of affiliates. Regulation W also prohibits, among other things, an institution from engaging in certain transactions with certain affiliates unless the transactions are on terms substantially the same, or at least as favorable to such institution or its subsidiaries, as those prevailing at the time for comparable transactions with nonaffiliated companies. Federal law also places restrictions on the Bank’s ability to extend credit to its executive officers, directors, principal shareholders and their related interests. These extensions of credit must be made on substantially the same terms, including interest rates and collateral, as those prevailing at the time for comparable transactions with unrelated third parties; and must not involve more than the normal risk of repayment or present other unfavorable features.
Community Reinvestment Act: The CRA requires that, in connection with examinations of financial institutions within its jurisdiction, the FDIC is required to evaluate the record of the financial institutions in meeting the credit needs of their local communities, including low and moderate income neighborhoods, consistent with the safe and sound operation of those institutions. These factors are also considered in evaluating mergers, acquisitions, and applications to open a branch or facility. The Bank has a satisfactory rating under CRA.
Prior to 2023, the last significant interagency revision to the CRA regulations occurred in 1995. In May 2022, federal bank regulatory agencies jointly issued a proposal to strengthen and modernize regulations implementing the CRA to better achieve the purposes of the law. On October 24, 2023, the Board of Governors of the Federal Reserve System, the FDIC, and the OCC issued a final rule amending the agencies’ CRA regulations. The objective of the final rule is to strengthen the achievement of the core purpose of the statute, and adapt to changes in the banking industry, including the expanded role of mobile and online banking. The final rule becomes effective on April 1, 2024, while most of the new requirements are applicable beginning January 1, 2026, and the remaining requirements are applicable January 1, 2027.
USA PATRIOT Act: The Uniting and Strengthening America by Providing Appropriate Tools Required to Intercept and Obstruct Terrorism Act of 2001 (the “USA PATRIOT Act”) requires each financial institution to: (i) establish an anti-money laundering program; (ii) establish due diligence policies, procedures and controls with respect to its private banking accounts and correspondent banking accounts involving foreign individuals and certain foreign banks; and (iii) implement certain due diligence policies, procedures and controls with regard to correspondent accounts in the United States for, or on behalf of, a foreign bank that does not have a physical presence in any country. In addition, the USA PATRIOT Act contains a provision encouraging cooperation among financial institutions, regulatory authorities and law enforcement authorities with respect to individuals, entities and organizations engaged in, or reasonably suspected of engaging in, terrorist acts or money laundering activities.
Commercial Real Estate Lending: The Bank’s lending operations may be subject to enhanced scrutiny by federal banking regulators based on its concentration of commercial real estate loans. CRE loans generally include land development, construction loans, and loans secured by multifamily property, and non-farm, nonresidential real property where the primary source of repayment is derived from rental income associated with the property. Guidance from the federal banking regulators on the risk posed by CRE lending concentrations prescribes guidelines for its examiners to help identify institutions that are potentially exposed to significant CRE risk. These guidelines include concentrations in certain types of CRE that may warrant greater supervisory scrutiny: total reported loans for construction, land development, and other land represent 100% or more of the institutions total capital; or total commercial real estate loans represent 300% or more of the institution’s total capital, and the outstanding balance of the institution’s commercial real estate loan portfolio has increased by 50% or more in the prior 36 months.
9
Volcker Rule: On December 10, 2013, the federal regulators adopted final regulations to implement the proprietary trading and private fund prohibitions of the Volcker Rule under the Dodd-Frank Act. Under the final regulations, banking entities are generally prohibited, subject to significant exceptions, from: (i) short-term proprietary trading as principal in securities and other financial instruments, and (ii) sponsoring or acquiring or retaining an ownership interest in private equity and hedge funds. Revisions to the Volcker Rule in 2019, that become effective in 2020, simplified and streamlined the compliance requirements for banks that do not have significant trading activities. In 2020, the OCC, Federal Reserve, FDIC, SEC and Commodity Futures Trading Commission finalized further amendments to the Volcker Rule. The amendments include new exclusions from the Volcker Rule’s general prohibitions on banking entities investing in and sponsoring private equity funds, hedge funds, and certain other investment vehicles (collectively “covered funds”). The amendments in the final rule, which became effective on October 1, 2020, clarify and expand permissible banking activities and relationships under the Volcker Rule.
Interchange Income: The Durbin Amendment to the Dodd-Frank Act capped debit card interchange fees for banks with over $10 billion in assets. Interchange fees are paid to banks by merchants for processing transactions. The Durbin Amendment cap for a single debit card transaction is 21 cents plus 5 basis points multiplied by the amount of the transaction. In addition, an issuer may receive up to 1 cent per transaction for fraud prevention. The Durbin Amendment cap became effective for the Bank on July 1, 2022 and resulted in a reduction in interchange income earned by the Bank. In October 2023, the Federal Reserve issued a proposed rule to lower the interchange fee cap to a level that the Federal Reserve believes is reasonable and proportional to the cost incurred by card issuers. Under the proposal, the base cap would decrease from 21 cents to 14.4 cents and from 5 basis points to 4 basis points. In addition, the fraud-prevention adjustment would increase from 1 cent to 1.3 cents. We will continue to monitor for final rulemaking and will evaluate the impact of any changes.
Corporate Governance and Risk Management: In September 2023, the FDIC issued proposed rulemaking to establish standards for corporate governance and risk management for FDIC insured banks with total consolidated assets of $10 billion or more. The proposed guidelines would set standards for corporate governance, risk management practices and board oversight. In establishing the proposed guidelines, the FDIC considered the OCCs heightened standards for banks with total consolidated assets of $50 billion or more and the Federal Reserve’s enhanced prudential standards for bank holding companies with total consolidated assets of $100 billion or more. We will continue to monitor for final rulemaking and will evaluate the impact of any changes.
Governmental Policies
The operations of the Company and its subsidiaries are affected not only by general economic conditions, but also by the policies of various regulatory authorities. In particular, the Federal Reserve regulates monetary policy and interest rates in order to influence general economic conditions. These policies have a significant influence on overall growth and distribution of loans, investments and deposits and affect interest rates charged on loans or paid for deposits. Federal Reserve monetary policies have had a significant effect on the operating results of all financial institutions in the past and may continue to do so in the future.
Human Capital Management
We pride ourselves in creating an open, diverse, and transparent culture that celebrates teamwork and recognizes associates at all levels. We expect and encourage participation and collaboration, and understand that we need each other to be successful. We value accountability because it is essential to our success, and we accept our responsibility to hold ourselves and others accountable for meeting shareholder commitments and achieving exceptional standards of performance. We also believe in supporting our associates to achieve a work/life balance.
Attracting and Retaining Talent. Our goal is to offer careers to our associates; not just jobs. At December 31, 2023, we employed 1,172 regular full-time and 49 part-time associates. We also employ seasonal/temporary associates and occasionally hire independent contractors for specific projects that require a highly specialized skill set or to provide additional resources during peak times, as needed.
Our performance measures and compensation determinations are designed to ensure the proper balance of risk and reward. Performance evaluations facilitate our ongoing assessment of associates’ skills and improvements as needed. We use annual talent reviews to identify high performing associates and future potential leaders, provide
10
insight into critical development needs and retention risks, and identify business-critical talent needs, including anticipated workforce planning challenges. Additionally, we have established succession plans to ensure continuation of critical roles and operations.
We are committed to offering a competitive total compensation package that is consistent with our principles and aligned with the Company’s financial performance. We regularly compare compensation and benefits with peer companies and market data, making adjustments as needed to ensure our compensation stays competitive.
In addition to base salary, approximately 64% of associates are eligible to participate in the Company’s Short Term Incentive Plan (“STIP”) program. Our STIP program is designed to align compensation with an associate’s performance in a given year. The program sets a performance level of short-term incentive awards that an associate is eligible to earn. The STIP target is defined as a percentage of base salary based on the associate’s grade level as determined by our Human Resources department.
As of January 1, 2024, our minimum wage is $17 per hour. The current minimum wage was instituted to maintain a competitive total rewards package that attracts and retains top talent. The determination for our minimum wage was made after extensive research, including reviewing the current market landscape both inside and outside of banking and financial services, and with feedback from leadership. Currently, 96% of our associates earn more than the minimum wage.
We also offer a wide array of benefits for our associates and their families including 401(k), paid time off, parental leave, medical, dental and vision benefits as well as life insurance and short-term disability for all full-time associates. Our wellness program is designed to help associates avoid illness while improving and maintaining their general health. The program offers financial rewards to associates who adopt healthy habits and participate in wellness education and health screens. Annual health screenings are provided to all associates enrolled in medical benefits at no charge.
Associate Feedback. We conduct associate surveys to ensure we understand what is important to our associates, including their opinions on a variety of topics. The adoption of a volunteer time-off policy and improvements to internal communication processes are examples of changes that have been made in response to survey results. Our efforts are being recognized. For the past six years, the Bank has been included in the “Best Banks to Work for” by American Banker magazine for our dedication to employee satisfaction. In 2023, we were ranked fifth among similar financial institutions with more than $10 billion in assets.
Diversity, Equity & Inclusion. We believe diversity of thought and experiences results in better outcomes and empowers our associates to make more meaningful contributions within our company and communities. We continue to learn and grow, and our current initiatives reflect our ongoing efforts around a more diverse, inclusive and equitable workplace.
Our Diversity, Equity & Inclusion Council is tasked with making recommendations to help us foster a diverse, equitable and inclusive environment for our associates and the communities we serve. In addition, we have several associate development programs that help to create a more inclusive environment by giving associates and other individuals of all backgrounds additional opportunities to succeed and contribute. These programs include:
•Career Acceleration Program - This trainee program introduces participants to the foundations of credit and commercial banking, while allowing participants to experience a wide range of assignments by rotating through the various product partners and operational areas of the Company. Upon successful completion of the program, the associate is placed in a role that aligns with their strengths and talents and helps meet the needs of our organization.
•Gateway to a Banking Career - This program provides training for jobs as tellers and customer service representatives, job interview practice and job placement assistance. It is a joint effort with two other St. Louis-based financial institutions. Upon successful completion of the program, participants receive a small stipend and are guaranteed an interview with one of the program sponsors.
•Business Resource Groups - These groups bring together associates with a shared identity, interest or goal to create community and opportunities for improvement and engagement.
11
We track the representation of women and underrepresented minorities because we believe that diversity helps us build more effective teams and improve our client experience, leading to greater success for the Company and our shareholders. Our diversity data is monitored by the Board. We have made progress in this area and continue to strive to further diversify our workforce and strengthen our culture of inclusion.
Focusing on a Safe and Healthy Workplace. We value our associates and are committed to providing a safe and healthy workplace. Our formal Health & Safety (“HS”) Policy mandates all tasks be conducted in a safe and efficient manner and comply with all local, state and federal health and safety regulations, and special safety concerns. The HS Policy encompasses all facilities and operations and addresses on-site emergencies, injuries and illnesses, evacuation procedures, cell phone usage and general safety rules.
Additionally, our Business Continuity Plan is an important component in helping maintain the health and safety of our associates and clients.
Available Information
Various reports provided to the SEC, including our annual reports, quarterly reports, current reports, proxy statements, and amendments to such reports filed or furnished pursuant to Section 13(a) or 15(d) of the Securities Exchange Act of 1934, as amended, are available free of charge on our website at www.enterprisebank.com under the “Investor Relations” link. These reports are made available as soon as reasonably practicable after they are electronically filed with or furnished to the SEC. Our filings with the SEC are also available on the SEC’s website at www.sec.gov. All website addresses given in this document are for information only and are not intended to be an active link or to incorporate any website information into this document.
12
ITEM 1A: RISK FACTORS
An investment in our common or depositary stock is subject to risks inherent to our business. Before making an investment decision, you should carefully consider the risks and uncertainties described below together with all of the other information included or incorporated by reference in this report. The value of our common and depositary stock could decline due to any of these risks, and you could lose all or part of your investment.
Risks Relating to General Economic and Market Conditions
An economic downturn could adversely affect our financial condition, results of operations or cash flows.
Recessionary conditions and/or negative developments in the domestic and international credit markets may significantly affect the markets in which we do business, the value of our loans and investments, and our ongoing operations and profitability. If the communities in which we operate do not grow, or if prevailing economic conditions locally or nationally are unfavorable, our business may not succeed. Unpredictable economic conditions may have an adverse effect on the quality of our loan portfolio and our financial performance. Adverse changes in the economies in our market areas may have a material adverse effect on our financial condition, results of operations or cash flows. We bear increased risk of unfavorable local economic conditions. Moreover, we cannot give any assurance we will benefit from any market growth or favorable economic conditions in our primary market areas even if they do occur.
We face potential risk from changes in governmental monetary policies.
Our earnings are affected by domestic economic conditions and the monetary and fiscal policies of the U.S. government and its agencies. The Federal Reserve’s monetary policies have had, and are likely to continue to have, an important impact on the operating results of commercial banks through its power to implement national monetary policy in order, among other things, to curb inflation or combat a recession. The monetary policies of the Federal Reserve affect the levels of bank loans, investments, and deposits through its control over the issuance of U.S. government securities, its regulation of the discount rate applicable to member banks, and its influence over reserve requirements to which member banks are subject. We cannot predict the nature or impact of future changes in monetary and fiscal policies.
Adverse developments affecting the banking industry, and resulting media coverage, have eroded customer confidence in the banking system and could have a material effect on our operations and/or stock price.
In the first quarter of 2023, high-profile bank failures involving Silicon Valley Bank, Signature Bank and First Republic Bank generated significant market volatility among publicly traded bank holding companies and, in particular, regional banks. In assessing the failures in 2023, the banking regulators noted that each of the failed banks had a high proportion of deposits that exceeded FDIC deposit insurance limits. These market developments have negatively impacted customer confidence in the safety and soundness of regional banks. As a result, some chose to maintain deposits with larger financial institutions or invest in higher yielding short-term fixed income securities, all of which impacted our liquidity, cost of funding, loan funding capacity, net interest margin, capital and results of operations. In connection with the high-profile bank failures of early 2023, uncertainty and concern has been, and may be in the future, compounded by advances in technology that increase the speed at which deposits can be moved, as well as the speed and reach of media attention, including social media, and its ability to disseminate concerns or rumors, in each case potentially exacerbating liquidity concerns. While the Department of the Treasury, the Federal Reserve, and the FDIC ensured that depositors of Silicon Valley Bank, Signature Bank and First Republic Bank had access to their deposits, including uninsured deposit accounts, there is no guarantee that such actions will continue to be successful in restoring customer confidence in regional banks and the banking system more broadly. In addition, the banking operating environment and public trading prices of banking institutions can be highly correlated, in particular during times of stress, which could adversely impact the trading prices of our common stock and potentially our results of operations.
Legal, Regulatory and Tax Risks
SBA lending is an important part of our business. Our SBA lending program is dependent upon the U.S. federal government, and we face specific risks associated with originating SBA loans.
Our SBA lending program is dependent upon the U.S. federal government. As an approved participant in the SBA Preferred Lender’s Program (a “Preferred Lender”), we enable our clients to obtain SBA loans without being
13
subject to the potentially lengthy SBA approval process necessary for lenders that are not Preferred Lenders. The SBA periodically reviews the lending operations of participating lenders to assess, among other things, whether the lender exhibits prudent risk management. When weaknesses are identified, the SBA may request corrective actions or impose enforcement actions, including revocation of the Preferred Lender status. If we lose our status as a Preferred Lender, we may lose some or all of our customers to lenders who are Preferred Lenders, and as a result we could experience a material adverse effect to our financial results. Any changes to the SBA program, including but not limited to, changes to the level of guarantee provided by the federal government on SBA loans, changes to program-specific rules impacting volume eligibility under the guaranty program, as well as changes to the program amounts authorized by Congress, may also have a material adverse effect on our business. In addition, any default by the U.S. government on its obligations or any prolonged government shutdown could, among other things, impede our ability to originate SBA loans or sell such loans in the secondary market, which could materially adversely affect our business, results of operations, and financial condition. When we originate SBA loans, we incur credit risk on the non-guaranteed portion of the loans, and if a customer defaults on a loan, we share any loss and recovery related to the loan pro-rata with the SBA. If the SBA establishes that a loss on an SBA guaranteed loan is attributable to significant technical deficiencies in the way the loan was originated, funded, or serviced by us, the SBA may seek recovery of the principal loss related to the deficiency.
Changes in government regulation and supervision may increase our costs or impact our ability to operate in certain lines of business.
Our operations are subject to extensive regulation by federal, state and local governmental authorities and are subject to various laws and judicial and administrative decisions imposing requirements and restrictions on part or all of our operations. Banking regulations are primarily intended to protect depositors’ funds, federal deposit insurance funds and the banking system as a whole, rather than shareholders. Because our business is highly regulated, the laws, rules, regulations and supervisory guidance and policies applicable to us are subject to regular modification and change and could result in an adverse impact on our results of operations.
We are subject to numerous laws designed to protect consumers, including the CRA and fair lending laws, and failure to comply with these laws could lead to a wide variety of sanctions.
The CRA, the Equal Credit Opportunity Act, the Fair Housing Act and other fair lending laws and regulations impose nondiscriminatory lending requirements on financial institutions. The CFPB, the U.S. Department of Justice and other federal agencies are responsible for enforcing these laws and regulations. A successful regulatory challenge to an institution’s performance under the CRA or fair lending laws and regulations could result in a wide variety of sanctions, including damages and civil monetary penalties; injunctive relief; and restrictions on mergers and acquisitions activity, expansion, and new business lines. Private parties may also have the ability to challenge an institution’s performance under fair lending laws in private class action litigation. Such actions could have a material adverse effect on our business, financial condition, results of operations and future prospects.
We are subject to compliance with the Bank Secrecy Act and other anti-money laundering statutes and regulations, and failure to comply with these laws could lead to a wide variety of sanctions.
The Bank Secrecy Act, the USA PATRIOT Act, and other laws and regulations require financial institutions, among other duties, to institute and maintain an effective anti-money laundering program and file suspicious activity and currency transaction reports when appropriate. In addition to other bank regulatory agencies, the federal Financial Crimes Enforcement Network of the Department of the Treasury is authorized to impose significant civil money penalties for violations of those requirements and engages in coordinated enforcement efforts with the state and federal banking regulators, as well as the U.S. Department of Justice, CFPB, Drug Enforcement Administration, and Internal Revenue Service. We are also subject to compliance with the rules enforced by the Office of Foreign Assets Control of the Department of the Treasury regarding, among other things, the prohibition of transacting business with, and the need to freeze assets of, certain persons and organizations identified as a threat to the national security, foreign policy or economy of the United States. If our policies, procedures and systems are deemed deficient, we would be subject to liability, including fines and regulatory actions, which may include restrictions on our ability to pay dividends and the necessity to obtain regulatory approvals to proceed with certain aspects of our business plan, including any acquisition plans. Failure to maintain and implement adequate programs to combat money laundering
14
and terrorist financing could also have serious reputational consequences for us. Any of these results could have a material adverse effect on our business, financial condition, results of operations and future prospects.
If the Company or the Bank incur losses that erode its capital, it may become subject to enhanced regulation or supervisory action.
Under federal and state laws and regulations pertaining to the safety and soundness of insured depository institutions, the Missouri Division of Finance, the Federal Reserve, and the FDIC have the authority to compel or restrict certain actions if the Company’s or the Bank’s capital should fall below adequate capital standards. Among other matters, the corrective actions include but are not limited to requiring affirmative action to correct any conditions resulting from any violation or practice; directing an increase in capital and the maintenance of specific minimum capital ratios; restricting the Bank’s operations; limiting the interest rate the Bank may pay on brokered deposits; restricting the amount of distributions and dividends and payment of interest on its trust preferred securities; requiring the Bank to enter into informal or formal enforcement orders, including memoranda of understanding, written agreements and consent or cease and desist orders to take corrective action and enjoin unsafe and unsound practices; removing officers and directors and assessing civil monetary penalties; and taking possession of and closing and liquidating the Bank. These actions may limit the ability of the Bank or Company to execute its business plan and thus can lead to an adverse impact on the results of operations or financial position.
Financial Risks
Our business is subject to interest rate risk and variations in interest rates may negatively affect our financial performance.
A substantial portion of our income is derived from the differential or “spread” between the interest earned on loans, investment securities, and other interest-earning assets, and the interest and/or earnings credit paid on deposits, borrowings, and other interest-bearing liabilities. Because of the differences in the maturities and repricing characteristics of our interest-earning assets and interest-bearing liabilities, changes in interest rates may not produce equivalent changes in income earned on interest-earning assets and expense paid on interest-bearing liabilities. Our assets and liabilities may react differently to changes in overall interest rates or conditions. Significant fluctuations in market interest rates could materially and adversely affect not only our net interest spread, but also our asset quality and loan origination volume, deposits, funding availability, and/or net income.
Our allowance for credit losses may not be adequate to cover actual loan losses.
We maintain an allowance for credit losses, which is a reserve established through a provision for credit losses charged to expense, that represents management’s estimate of probable losses within the existing loan portfolio. The allowance, in the judgment of management, is sufficient to reserve for estimated credit losses and risks inherent in the loan portfolio. We continue to monitor the adequacy of our loan credit allowance and may need to increase it if economic conditions or other factors deteriorate. In addition, bank regulatory agencies periodically review our allowance for credit losses and may require an increase in the provision for credit losses or the recognition of further loan charge-offs, based on judgments that can differ somewhat from those of our own management. In addition, if charge-offs in future periods exceed the allowance for loan losses (i.e., if the loan allowance is inadequate), we may need additional credit loss provisions to increase the allowance for loan losses. Additional provisions to increase the allowance for credit losses, should they become necessary, would result in a decrease in net income and a reduction in capital, and may have a material adverse effect on our financial condition and results of operations.
We may not be able to maintain our historical rate of growth or profitability, which could have a material adverse effect on our ability to successfully implement our business strategy.
Successful growth requires that we follow adequate loan underwriting standards, balance loan and deposit growth without increasing interest rate risk or compressing our net interest margin, maintain adequate capital at all times, produce investment performance results competitive with our peers and benchmarks, further diversify our revenue sources, meet the expectations of our clients and hire and retain qualified employees. If we do not manage our growth successfully, then our business, results of operations or financial condition may be adversely affected.
15
We may incur impairments to goodwill.
As of December 31, 2023, we had $365 million recorded as goodwill. We evaluate our goodwill for impairment at least annually. Significant negative industry or economic trends, including a sustained decrease in the market price of our common stock, or reduced future cash flows or disruptions to our business, could result in impairments to goodwill. Our valuation methodology for assessing impairment requires management to make judgments and assumptions based on experience and to rely on projections of future operating performance. We operate in competitive environments and projections of future operating results and cash flows may vary significantly from actual results. If our analysis results in impairment to goodwill, we would be required to record an impairment charge to earnings in our financial statements during the period in which such impairment is determined to exist. Any such change could have a material adverse effect on our results of operations and stock price.
Declines in asset values may result in impairment charges and adversely impact the value of our investments and our financial performance and capital.
We hold an investment portfolio that includes, but is not limited to, municipal bonds, corporate debt securities, government securities and agency mortgage-backed securities. Factors beyond our control can significantly influence the fair value of securities in our portfolio and can cause potential adverse changes to the fair value of these securities. These factors include, but are not limited to, rating agency actions in respect to the securities, defaults by the issuer or with respect to the underlying securities, changes in market interest rates and/or spread, and instability and other factors impacting the capital markets. Any of these factors, among others, could cause realized or unrealized losses in future periods and declines in other comprehensive income (loss), which could have a material adverse effect on our business, results of operations, financial condition and future prospects. The process for determining whether impairment of a security is other-than-temporary often requires complex, subjective judgments about whether there has been significant deterioration in the financial condition of the issuer, whether management has the intent or ability to hold a security for a period of time sufficient to allow for any anticipated recovery in fair value, the future financial performance and liquidity of the issuer and any collateral underlying the security and other relevant factors.
We invest in mortgage-backed obligations and such obligations have been, and are likely to continue to be, impacted by market dislocations, declining home values and prepayment risk, which may lead to volatility in cash flow and market risk and declines in the value of our investment portfolio.
Our investment portfolio includes mortgage-backed obligations primarily secured by pools of mortgages on single-family residences. The value of mortgage-backed obligations in our investment portfolio may fluctuate for several reasons, including (i) delinquencies and defaults on the mortgages underlying such obligations, due in part to high unemployment rates, (ii) falling home prices, (iii) lack of a liquid market for such obligations, and (iv) uncertainties in respect of government-sponsored enterprises such as the Federal National Mortgage Association or the Federal Home Loan Mortgage Corporation, which guarantee such obligations. If the value of homes were to materially decline, the fair value of the mortgage-backed obligations in which we invest may also decline. Any such decline in the fair value of mortgage-backed obligations, or perceived market uncertainty about their fair value, could adversely affect our financial position and results of operations. In addition, when we acquire a mortgage-backed security, we anticipate the underlying mortgages will prepay at a projected rate, thereby generating an expected yield. Prepayment rates generally increase as interest rates fall and decrease when rates rise, but changes in prepayment rates are difficult to predict. At the time of purchase, some of our mortgage-backed securities had a higher interest rate than prevailing market rates, resulting in a premium purchase price. In accordance with applicable accounting standards, we amortize the premium over the expected life of the mortgage-backed security. If the mortgage loans securing the mortgage-backed security prepay more rapidly than anticipated, we would have to amortize the premium on an accelerated basis, which would thereby adversely affect our profitability.
Credit and Liquidity Risks
Our loan and deposit portfolios are in certain markets which could result in increased concentration risk.
A majority of our loans are to businesses and individuals in the St. Louis, Kansas City, Phoenix, Los Alamos, Albuquerque, Santa Fe, Los Angeles, San Diego, Dallas, and Las Vegas metropolitan areas. These loans are funded by deposits in the same metropolitan areas. The regional economic conditions in areas where we conduct our business have an impact on the demand for our products and services as well as the ability of our clients to repay
16
loans, the value of the collateral securing loans, and the stability of our deposit funding sources. Consequently, a decline in local economic conditions may adversely affect our earnings.
There are material risks involved in commercial lending that could adversely affect our business.
Our business plan calls for continued efforts to increase our assets invested in commercial loans. Our commercial loans include loans secured by real estate (commercial property, construction and land, 1-4 family residential property, and multi-family residential property). Commercial loans generally involve a higher degree of credit risk than residential mortgage loans due, in part, to their larger average size and less marketable collateral. In addition, unlike residential mortgage loans, commercial loans generally depend on the cash flow of the borrower’s business to service the debt. Adverse economic conditions or other factors affecting our target markets may have a greater adverse effect on us than on other financial institutions that have a more diversified client base. Increases in non-performing commercial loans could result in operating losses, impaired liquidity and erosion of our capital, and could have a material adverse effect on our financial condition and results of operations. Credit market tightening could adversely affect our commercial borrowers through declines in their business activities and adversely impact their overall liquidity through the diminished availability of other borrowing sources or otherwise.
The ability of our borrowers to repay their loans may be adversely affected by an increase in market interest rates which could result in increased credit losses. These increased credit losses, where the Bank has retained credit exposure, could decrease our assets, net income and available cash.
The loans we make to our borrowers often bear interest at a variable interest rate. When market interest rates increase, the amount of revenue borrowers need to service their debt also increases. Some borrowers may be unable to make their debt service payments. As a result, an increase in market interest rates may increase the risk of loan default. An increase in non-performing loans could result in a net loss of earnings from these loans, an increase in the provision for loan and covered loan losses, and an increase in loan charge-offs, all of these factors could impact allowance, earnings and/or capital levels.
Our loan portfolio includes loans secured by real estate, which could result in increased credit risk.
A portion of our portfolio is secured by real estate, and thus we face a high degree of risk from a downturn in our real estate markets. If real estate values would decline in our markets, our ability to recover on defaulted loans for which the primary reliance for repayment is on the real estate collateral by foreclosing and selling that real estate would then be diminished, and we would be more likely to suffer losses on defaulted loans.
Additionally, the state-specific foreclosure laws of the jurisdictions in which our real estate collateral is located may hinder our ability to timely or fully recover on defaulted loans secured by property in certain states. For example, some states in which our collateral is located are judicial foreclosure states. In judicial foreclosure states, all foreclosures must be processed through the court system. Due to this process, it may take up to a year or longer to foreclose on real estate collateral located in those states. Our ability to recover on defaulted loans secured by property in those states may be delayed and our recovery efforts are lengthened due to this process. In addition, some states have anti-deficiency statutes with regards to certain types of residential mortgage loans. Our ability to recover on defaulted loans secured by residential mortgages in anti-deficiency statute states may be limited to the fair value of the real estate securing the loan at the time of foreclosure.
Our commercial and industrial loans and sponsor finance loans are underwritten based primarily on cash flow, profitability and enterprise value of the client and are not fully covered by the value of tangible assets or collateral of the client. Consequently, if any of these transactions becomes non-performing, we could experience significant losses.
Cash flow lending involves lending money to a client based primarily on the expected cash flow, profitability and enterprise value of a client, with the value of any tangible assets as secondary protection. In some cases, these loans may have more leverage than traditional bank debt. In the case of our senior cash flow loans, we generally take a lien on substantially all of a client’s assets, but the value of those assets is typically substantially less than the amount of money we advance to the client under a cash flow transaction. In addition, some of our cash flow loans may be viewed as stretch loans, meaning they may be at leverage multiples that exceed traditional accepted bank lending standards for senior cash flow loans. Thus, if a cash flow transaction becomes non-performing, our primary
17
recourse to recover some or all of the principal of our loan or other debt product would be to force the sale of all or part of the company as a going concern. Additionally, we may obtain equity ownership in a borrower as a means to recover some or all of the principal of our loan. The risks inherent in cash flow lending include, among other things:
•reduced use of or demand for the client’s products or services and, thus, reduced cash flow of the client to service the loan and other debt product as well as reduced value of the client as a going concern;
•inability of the client to manage working capital, which could result in lower cash flow;
•inaccurate or fraudulent reporting of our client’s positions or financial statements; and
•our client’s poor management of their business.
Additionally, many of our clients use the proceeds of our cash flow transactions to make acquisitions. Poorly executed or poorly conceived acquisitions can burden management, systems and the operations of the existing business, causing a decline in both the client’s cash flow and the value of its business as a going concern. In addition, many acquisitions involve new management teams taking over day-to-day operations of a business. These new management teams may fail to execute at the same level as the former management team, which could reduce the cash flow of the client available to service the loan or other debt product, as well as reduce the value of the client as a going concern.
Widespread financial difficulties or downgrades in the financial strength or credit ratings of life insurance providers could lessen the value of the collateral securing our life insurance premium finance loans and impair our financial condition and liquidity.
One of the specialized products we offer is financing whole life insurance premiums utilized in high net worth estate planning. These loans are primarily secured by the insurance policies financed by the loans, i.e., the obligations of the life insurance providers under those policies. Nationally Recognized Statistical Rating Organizations (“NRSROs”) such as Standard & Poor’s, Moody’s and A.M. Best evaluate the life insurance providers that are the payors on the life insurance policies that we finance. The value of our collateral could be materially impaired in the event there are widespread financial difficulties among life insurance providers or the NRSROs downgrade the financial strength ratings or credit ratings of the life insurance providers, indicating the NRSROs’ opinion is the life insurance provider’s ability to meet policyholder obligations is impaired, or the ability of the life insurance provider to meet the terms of its debt obligations is impaired. The value of our collateral is also subject to the risk a life insurance provider could become insolvent. In particular, if one or more large nationwide life insurance providers were to fail, the value of our portfolio could be significantly negatively impacted. A significant downgrade in the value of the collateral supporting our premium finance business could impair our ability to create liquidity for this business, which, in turn could negatively impact our ability to expand.
Our construction and land development loans are based upon estimates of costs and value associated with the completed project. These estimates may be inaccurate and we may be exposed to more losses on these projects than on other loans.
Construction, land acquisition and development lending involves additional risks because funds are advanced based upon the projected value of the project, which is inherently uncertain prior to the project’s completion. Because of the uncertainties inherent in estimating construction costs, as well as the fair value of the completed project and the effects of governmental regulation of real property and the general effects of the national and local economies, it is relatively difficult to evaluate accurately the total funds required to complete a project and the related loan-to-value ratio. As a result, construction loans often involve the disbursement of substantial funds with repayment dependent, in part, on the success of the ultimate project and the ability of the borrower to sell or lease the property, rather than the ability of the borrower or guarantor to repay principal and interest. If our appraisal of the value of the completed project proves to be overstated, we may have inadequate security for the repayment of the loan upon completion of construction of the project. If we are forced to foreclose on a project prior to or at completion due to a default, there can be no assurance we will be able to recover all of the unpaid balance of, and accrued interest on, the loan or the related foreclosure, sale and holding costs. In addition, we may be required to fund additional amounts to complete the project and may have to hold the property for an unspecified period of time. If any of these events occur, our financial condition, results of operations and cash flows could be materially and adversely affected.
18
We are subject to environmental risks associated with owning real estate or collateral.
When a borrower defaults on a loan secured by real property, we may purchase the property in foreclosure or accept a deed to the property surrendered by the borrower. We may also take over the management of commercial properties whose owners have defaulted on loans. We may also own and lease premises where branches and other facilities are located. While we have lending, foreclosure and facilities guidelines intended to exclude properties with an unreasonable risk of contamination, hazardous substances could exist on some of the properties we may own, manage or occupy. We face the risk that environmental laws could force us to clean up the properties at our expense. The cost of cleaning up or paying damages and penalties associated with environmental problems could increase our operating expenses. It may cost more to clean a property than the property is worth. We could also be liable for pollution generated by a borrower’s operations if we take a role in managing those operations after a default. The Company may also find it difficult or impossible to sell these properties.
We may be obligated to indemnify certain counterparties in financing transactions we enter into pursuant to the New Markets Tax Credit Program.
We participate in and have previously been an “Allocatee” of the New Markets Tax Credit Program of the U.S. Department of the Treasury Community Development Financial Institutions Fund. Through this program, we provide our allocation to certain projects, which in turn for an equity investment from an Investor in the project generate federal tax credits to those investors. This equity, coupled with any debt or equity from the project sponsor is in turn invested in a certified community development entity for a period of at least seven years. Community development entities must use this capital to make loans to, or other investments in, qualified businesses in low-income communities in accordance with New Markets Tax Credit Program criteria. Investors receive an overall tax credit equal to 39% of their qualified equity investment, credited at a rate of five percent in each of the first three years and six percent in each of the final four years. However, after the exhaustion of all cure periods and remedies, the entire credit is subject to recapture if the certified community development entity fails to maintain its certified status, or if substantially all of the equity investment proceeds associated with the tax credits we allocate are no longer continuously invested in a qualified business that meets the New Markets Tax Credit Program criteria, or if the equity investment is redeemed prior to the end of the minimum seven-year term. As part of these financing transactions, we as the parent to Enterprise Financial CDE, LLC (“CDE”), provide customary indemnities to the tax credit investors, which require us to indemnify and hold harmless the investors in the event a credit recapture event occurs, unless the recapture is a result of action or inaction of the investor. No assurance can be given that these counterparties will not call upon us to discharge these obligations in the circumstances under which they are owed. If this were to occur, the amount we may be required to pay a bank investor could be substantial and could have a material adverse effect on our results of operations and financial condition.
If we fail to comply with requirements of the federal New Markets Tax Credit program, the U.S. Department of the Treasury Community Development Financial Institutions Fund could seek any remedies available under its Allocation Agreement with us, and we could suffer significant reputational harm and be subject to greater scrutiny from banking regulators.
Because we have been designated as an “Allocatee” under the New Markets Tax Credit Program, we are required to provide allocation fund qualifying projects under the New Markets Tax Credit Program, and we are responsible for monitoring those projects, ensuring their ongoing compliance with the requirements of the New Markets Tax Credit Program and satisfying the various recordkeeping and reporting requirements under the New Markets Tax Credit Program. If we default in our obligations under the New Markets Tax Credit Program, the U.S. Department of the Treasury may revoke our participation in any other CDFI Fund programs, reallocate the New Market Tax Credits that were originally allocated to us, and take any other remedial actions that it is empowered to take under the Allocation Agreement they have entered into with us with respect to the New Markets Tax Credit Program, with the full range of such remedies being unknown. If we were to default under the New Markets Tax Credit Program, we could suffer negative publicity in the communities in which we operate, and we could face greater scrutiny from federal and state bank regulators, especially with regard to our compliance with the CRA. These developments could have a material adverse impact on our reputation, business, financial condition, results of operations and liquidity.
19
Liquidity risk could impair our ability to fund operations and meet debt coverage obligations, and jeopardize our financial condition.
Liquidity is essential to our business. We are a holding company and depend on our subsidiaries for liquidity needs, including debt coverage requirements. An inability to raise funds through deposits, borrowings, the sale of investment securities and other sources could have a substantial material adverse effect on our liquidity. Our access to funding sources in amounts that are adequate to finance our activities could be impaired by factors that affect us specifically or the financial services industry in general. Factors that could detrimentally impact our access to liquidity sources include, but are not limited to, a decrease in the level of our business activity due to a market downturn, our failure to remain well-capitalized, or adverse regulatory action against us. Our ability to acquire deposits or to borrow could also be impaired by factors that are not specific to us, such as a severe disruption of the financial markets or negative views and expectations about the prospects for the financial services industry as a whole.
Our utilization of brokered deposits could adversely affect our liquidity and results of operations.
Since our inception, we have utilized both brokered and non-brokered deposits as a source of funds to support our growing loan demand and other liquidity needs. As a bank regulatory supervisory matter, reliance upon brokered deposits as a significant source of funding is discouraged. Brokered deposits may not be as stable as other types of deposits, and, in the future, those depositors may not renew their deposits when they mature, or we may have to pay a higher rate of interest to keep those deposits or may have to replace them with other deposits or with funds from other sources. Additionally, if the Bank ceases to be categorized as “well-capitalized” for bank regulatory purposes, it would not be able to accept, renew or roll over brokered deposits without a waiver from the FDIC. Our inability to maintain or replace these brokered deposits as they mature could adversely affect our liquidity and results of operations. Further, paying higher interest rates to maintain or replace these deposits could adversely affect our net interest margin and results of operations.
By engaging in derivative transactions, we are exposed to additional credit and market risk in our banking business.
We use interest rate swaps to help manage our interest rate risk in our banking business from recorded financial assets and liabilities when they can be demonstrated to effectively hedge a designated asset or liability and the asset or liability exposes us to interest rate risk or risks inherent in client related derivatives. We may use other derivative financial instruments to help manage other economic risks, such as liquidity and credit risk, including exposures that arise from business activities that result in the receipt or payment of future known or uncertain cash amounts, the value of which are determined by interest rates. We also have derivatives that result from a service we provide to certain qualifying clients approved through our credit process and therefore, these derivatives are not used to manage interest rate risk in our assets or liabilities. We do not enter into derivative financial instruments for trading purposes. Hedging interest rate risk is a complex process, requiring sophisticated models and routine monitoring. As a result of interest rate fluctuations, hedged assets and liabilities will appreciate or depreciate in market value. The effect of this unrealized appreciation or depreciation will generally be offset by income or loss on the derivative instruments that are linked to the hedged assets and liabilities. By engaging in derivative transactions, we are exposed to credit and market risk. If the counterparty fails to perform, credit risk exists to the extent of the fair value gain in the derivative. Market risk exists to the extent that interest rates change in ways that are significantly different from what we expected when we entered into the derivative transaction. The existence of credit and market risk associated with our derivative instruments could adversely affect our net interest income and, therefore, could have a material adverse effect on our business, financial condition, results of operations and future prospects.
Competitive and Reputational Risks
The loss of any of our executive officers or other key employees, or the inability to recruit highly skilled and other key employees, may adversely affect our operations.
We believe our growth and continued success will depend in large part on our executive team and other key employees. The loss of any of our executive officers or other key employees, the failure to successfully transition key roles, or the inability to hire, train, retain, and manage qualified personnel, could have a material adverse effect on our business strategy, financial condition, results of operations and cash flows.
20
We face significant competition.
The financial services industry, including, but not limited to, commercial banking, mortgage banking, consumer lending, and home equity lending, is highly competitive, and we encounter strong competition for deposits, loans, and other financial services in all of our market areas in each of our lines of business. Our principal competitors include other commercial banks, savings banks, savings and loan associations, mutual funds, money market funds, finance companies, trust companies, technology companies, insurers, credit unions, and mortgage companies among others. Many of our non-bank competitors are not subject to the same degree of regulation as us and have advantages over us in providing certain services. Many of our competitors are significantly larger than we are and have greater access to capital and other resources. Also, our ability to compete effectively in our business is dependent on our ability to adapt successfully to regulatory and technological changes within the banking and financial services industry, generally. If we are unable to compete effectively, we will lose market share and our income from loans and other products may diminish.
Our ability to compete successfully depends on a number of factors, including, among other things:
•the ability to develop, maintain, and build upon long-term client relationships based on top quality service and high ethical standards;
•the scope, relevance, and pricing of products and services, including technological innovations to those products and services, offered to meet client needs and demands;
•the rate at which we introduce new products and services relative to our competitors;
•client satisfaction with our level of service; and/or
•industry and general economic trends.
Failure to perform in any of these areas could significantly weaken our competitive position, and could adversely affect our growth and profitability, which, in turn, could have a material adverse effect on our financial condition and results of operations.
Technology is continually changing and we must effectively implement new innovations in providing services to our customers.
The financial services industry is undergoing rapid technological changes with frequent innovations in technology-driven products and services. In addition to better serving customers, the effective use of technology increases our efficiency and enables us to reduce costs. Our future success will depend, in part, upon our ability to address the needs of our customers using innovative methods, processes and technology to provide products and services that will satisfy customer demands for convenience as well as to add efficiencies in our operations as we continue to grow and expand our market areas. Many national vendors provide turn-key services to community banks, such as Internet banking and remote deposit capture, that allow smaller banks to compete with institutions that have substantially greater resources to invest in technological improvements. We may not be able, however, to effectively implement new technology-driven products and services or be successful in marketing these products and services to our customers.
Costs and levels of deposits are affected by competition that could increase our funding costs or liquidity risk.
We rely on bank deposits to be a low cost and stable source of funding. We compete with banks and other financial services companies for deposits. If our competitors raise the rates they pay on deposits, our funding costs may increase, either because we raise our rates to avoid losing deposits or because we lose deposits and must rely on more expensive sources of funding. Higher funding costs could reduce our net interest margin and net interest income and could have a material adverse effect on our business, financial condition and results of operations.
Acquisition Risks
We have engaged in and may continue to engage in expansion through acquisitions, and these acquisitions present a number of risks related both to the acquisition transactions and to the integration of the acquired businesses.
The acquisition of other financial services companies or assets present risks to us in addition to those presented by the nature of the business acquired. Our earnings, financial condition, and prospects after a merger or acquisition depend in part on our ability to successfully integrate the operations of the acquired company. We may be unable to integrate operations successfully or to achieve expected results or cost savings.
21
Acquiring other banks or businesses involves various risks commonly associated with acquisitions, including, among other things:
•potential exposure to unknown or contingent liabilities of the target company;
•exposure to potential asset quality issues of the target company;
•difficulty and expense of integrating the operations and personnel of the target company;
•potential disruption to our business;
•potential diversion of our management’s time and attention;
•the possible loss of key employees and clients of the target company;
•difficulty in estimating the value of the target company;
•payment of a premium over book and market values that may dilute our tangible book value and earnings per share in the short- and long-term;
•inability to realize the expected revenue increases, cost savings, increases in geographic or product presence, and/or other projected benefits; and/or
•potential changes in banking or tax laws or regulations that may affect the target company.
We periodically evaluate merger and acquisition opportunities and conduct due diligence activities related to possible transactions with other financial institutions and financial services companies. As a result, merger or acquisition discussions and, in some cases, negotiations may take place, and future mergers or acquisitions involving cash, debt or equity securities may occur at any time. In addition to the risks noted above, potential acquisitions may incur additional costs for diligence or break-up fees, even if the transaction is not consummated.
We may be unable to successfully integrate new business lines into our existing operations.
From time to time, we may implement other new lines of business or offer new products or services within existing lines of business. There can be substantial risks and uncertainties associated with these efforts, particularly in instances where the markets are not fully developed. Although we continue to expend substantial managerial, operating and financial resources as our business grows, we may be unable to successfully continue the integration of new business lines, and price and profitability targets may not prove feasible. External factors such as compliance with regulations, competitive alternatives and shifting market preferences, may also impact the successful implementation of a new line of business or a new product or service. Furthermore, any new line of business and new product or service could have a significant impact on the effectiveness of our system of internal controls. Failure to successfully manage these risks in the development and implementation of new lines of business or new products or services could have a material adverse effect on our business, financial condition and results of operations.
As we expand outside our current markets, we may encounter additional risks that may adversely affect us.
We are headquartered in Missouri, but have branch locations in the Kansas City, Phoenix, Los Angeles, and San Diego metropolitan areas, as well as Northern New Mexico, Florida and Nevada. Over time, we may acquire or open locations in other parts of the United States as well. In the course of these expansion activities, we may encounter significant risks, including unfamiliarity with the characteristics and business dynamics of new markets, increased marketing and administrative expenses and operational difficulties arising from our efforts to attract business in new markets, manage operations in noncontiguous geographic markets, comply with local laws and regulations and effectively and consistently manage personnel and business outside of the State of Missouri. If we are unable to manage these risks, our operations may be materially and adversely affected.
22
Technology and Cybersecurity Risks
A failure in or breach, or the inability to recognize a potential breach of our operational or security systems, or those of our third party service providers, including as a result of cyber-attacks, may cause industry-wide operational disruptions that could materially affect our business, result in unintentional disclosure or misuse of confidential or proprietary information, damage our reputation, increase our costs and adversely impact our earnings.
Information security, including cybersecurity, is a high priority for us. Recent highly publicized material events have highlighted the importance of cybersecurity, including cyberattacks against other financial institutions, governmental agencies, and other organizations that resulted in the compromise of personal and/or confidential information, the theft or destruction of corporate information, and demands for ransom payments to release corporate information encrypted by “ransomware.” A successful cyberattack could materially and adversely affect the Bank’s reputation and/or impair its ability to provide services to its clients. We have expended, and may in the future expend, significant resources to implement technologies and various response and recovery plans and procedures as part of our information security program. Additionally, we face the risk of operational disruption, failure, termination or capacity constraints of any of the third parties that facilitate our business activities, including exchanges, clearing agents, clearing houses or other financial intermediaries. Such parties could also be the source of an attack on, or breach of, our operational systems. Any material failures, interruptions or security breaches in our information systems could damage our reputation, result in a loss of client business, result in a violation of privacy or other laws, or expose us to civil litigation, regulatory fines or losses not covered by insurance.
We rely on third-party vendors to provide key components of our business infrastructure.
We rely heavily on third-party service providers for much of our communications, information, operating and financial control systems technology, including relationship management, mobile banking, general ledger, investment, deposit, loan servicing and loan origination systems. While we have selected these third-party vendors carefully and perform ongoing monitoring, we do not control their actions. Any problems caused by these third parties, including as a result of inadequate or interrupted service, could materially affect our ability to successfully deliver products and services to our clients and otherwise conduct our business. Financial or operational difficulties of a third-party vendor could also hurt our operations if those difficulties interfere with the vendor’s ability to serve us, and replacing these third-party vendors could result in significant delay and expense. Accordingly, use of such third parties creates an unavoidable inherent risk to our business operations as well as reputational risk.
Our core operating system conversion may result in business interruptions or other adverse developments.
We plan to replace our core operating systems, including those for loans, deposits, financials and other ancillary systems (collectively referred to as “core system”). The conversion to the new core system is expected to be completed in 2024. We use the core system to track client relationships and accounts and report financial information. The core system is integrated with various other applications that are used to service client requests by bank personnel or directly by clients (such as online and mobile banking). Changing the core system will subject us to operational risks during and after the conversion, including disruptions to its technology systems, which may adversely impact our clients. We have documented plans, policies and procedures designed to prevent or limit the risks of a failure during or after the conversion of our core system. However, there can be no assurance that any such adverse developments will not occur or, if they do occur, that they will be timely and adequately remediated. The ultimate impact of any adverse development could damage our reputation, result in a loss of client business, subject us to regulatory scrutiny, or expose it to civil litigation and possibly financial liability, any of which could have a material effect on our business, financial condition, and results of operations.
Risks Relating to Our Common Stock and Depositary Shares
The price of our common stock and depositary shares may be volatile or may decline.
The trading price of our common stock and depositary shares may fluctuate widely as a result of a number of factors, many of which are outside our control. In addition, the stock market is subject to fluctuations in the share prices and trading volumes that affect the market prices of the shares of many companies. These broad market fluctuations could make it more difficult for you to resell your common stock or depositary shares when you want and at prices you find attractive.
23
Our stock price and the price of our depositary shares can fluctuate significantly in response to a variety of factors including, among other things:
•actual or anticipated quarterly fluctuations in our operating results and financial condition;
•changes in revenue or earnings estimates or publication of research reports and recommendations by financial analysts;
•reputation;
•failure to meet analysts’ revenue or earnings estimates;
•speculation in the press or investment community;
•strategic actions by us or our competitors, such as acquisitions or restructurings;
•actions by institutional shareholders;
•fluctuations in the stock prices and operating results of our competitors;
•general market conditions and, in particular, developments related to market conditions for the financial services industry;
•proposed or adopted regulatory changes or developments;
•anticipated or pending investigations, proceedings or litigation that involve or affect us; and/or
•domestic and international economic factors unrelated to our performance.
The stock market and, in particular, the market for financial institution stocks, has historically experienced significant volatility. As a result, the market price of our common stock and depositary shares may be volatile. In addition, the trading volume in our common stock and depositary shares may fluctuate more than usual and cause significant price variations to occur. The trading price of the shares of our common stock and our depositary shares and the value of our other securities will depend on many factors, which may change from time to time, including, without limitation, our financial condition, performance, creditworthiness and prospects, future sales of our equity or equity related securities, and other factors identified in this annual report and our other reports. In some cases, the markets have produced downward pressure on stock prices and credit availability for certain issuers without regard to those issuers’ underlying financial strength or operating results. A significant decline in our stock or depositary share prices could result in substantial losses for individual shareholders and could lead to costly and disruptive securities litigation.
The trading volume in our common stock and depositary shares is less than that of other larger financial institutions.
Although our common stock and depositary shares are listed for trading on the Nasdaq Global Select Market, trading volume may be less than that of other, larger financial services companies. A public trading market having the desired characteristics of depth, liquidity and orderliness depends on the presence in the marketplace of willing buyers and sellers of our common stock or depositary shares at any given time, a factor over which we have no control. During any period of lower trading volume of our common stock or depositary shares, significant sales of shares of our common stock or depositary shares or the expectation of these sales could cause our common stock or depositary shares price to fall.
An investment in our common stock or depositary shares is not insured and you could lose the value of your entire investment.
An investment in our common stock or depositary shares is not a savings account, deposit or other obligation of our bank subsidiary, any non-bank subsidiary or any other bank, and such investment is not insured or guaranteed by the FDIC or any other governmental agency. As a result, if you acquire our common stock or depositary shares, you may lose some or all of your investment.
Our ability to pay dividends is limited by various statutes and regulations and depends primarily on the Bank’s ability to distribute funds to us and is also limited by various statutes and regulations.
We depend on payments from the Bank, including dividends, management fees and payments under tax sharing agreements, for substantially all of our liquidity requirements. Federal and state regulations limit the amount of dividends and the amount of payments the Bank may make to us under tax sharing agreements. In certain circumstances, the Missouri Division of Finance, FDIC, or Federal Reserve Board could restrict or prohibit the Bank from distributing dividends or making other payments to us. In the event the Bank was restricted from paying
24
dividends to us or making payments under the tax sharing agreement, we may not be able to service our debt, pay our other obligations or pay dividends on our common stock or preferred stock. If we are unable or determine not to pay dividends on our outstanding equity securities, the market price of such securities could be materially adversely affected.
There can be no assurance of any future dividends on our common stock or our depositary shares.
Holders of our common stock and depositary shares are entitled to receive dividends only when, as and if declared by the Board of Directors. Although we have historically paid cash dividends, we are not required to do so.
Our outstanding preferred stock and debt securities, including debt securities related to our trust preferred securities, restrict our ability to pay dividends on our capital stock.
We have outstanding preferred stock and subordinated debentures issued to statutory trust subsidiaries, which have issued and sold preferred securities in the Trusts to investors. These instruments prohibit the payment of dividends on our common stock in certain situations. See “Item 1. Business – Supervision and Regulation - Financial Holding Company - Dividend Restrictions and Share Repurchases” for additional information.
Moreover, any other financing agreements that we enter into in the future may limit our ability to pay cash dividends on our capital stock, including the common stock. In the event that our existing or future financing agreements restrict our ability to pay dividends in cash on the common stock, we may be unable to pay dividends in cash on the common stock unless we can refinance amounts outstanding under those agreements. In addition, if we are unable or determine not to pay interest on our preferred stock or subordinated debentures, the market price of our common stock could be materially or adversely affected.
Anti-takeover provisions could negatively impact our shareholders.
Provisions of Delaware law and of our certificate of incorporation, as amended, and bylaws, as well as various provisions of federal and Missouri state law applicable to bank and bank holding companies, could make it more difficult for a third party to acquire control of us or have the effect of discouraging a third party from attempting to acquire control of us. We are subject to Section 203 of the Delaware General Corporation Law, which would make it more difficult for another party to acquire us without the approval of our Board of Directors. Additionally, our certificate of incorporation, as amended, authorizes our Board of Directors to issue preferred stock which could be issued as a defensive measure in response to a takeover proposal. In the event of a proposed merger, tender offer or other attempt to gain control of the Company, our Board of Directors would have the ability to readily issue available shares of preferred stock as a method of discouraging, delaying or preventing a change in control of the Company. Such issuance could occur regardless of whether our shareholders favorably view the merger, tender offer or other attempt to gain control of the Company. These and other provisions could make it more difficult for a third party to acquire us even if an acquisition might be in the best interests of our shareholders. Although we have no present intention to issue any additional shares of our authorized preferred stock, there can be no assurance that the Company will not do so in the future.
General Risk Factors
Climate change may materially adversely affect our business and results of operations.
Political and social attention to the issue of climate change has continued. Federal and state legislatures and regulatory agencies continue to propose and advance numerous legislative and regulatory initiatives seeking to mitigate the effects of climate change. As a financial institution, it is unclear how future government regulations and shifts in business trends resulting from increased concern about climate change will affect our operations; however, natural or man-made disasters and severe weather events may cause operational disruptions and damage to both our properties and properties securing our loans. Losses resulting from these disasters and severe weather events may make it more difficult for borrowers to timely repay their loans. If these events occur, we may experience a decrease in the value of our loan portfolio and our revenue, and may incur additional operational expenses, each of which could have a material adverse effect on our financial condition and results of operations.
With the increased importance and focus on climate change, we are making efforts to enhance our governance of climate change-related risks and integrate climate considerations into our risk governance framework. Nonetheless,
25
the risks associated with climate change are rapidly changing and evolving in an escalating fashion, making them difficult to assess due to limited data and other uncertainties. We could experience increased expenses resulting from strategic planning, litigation, and technology and market changes, and reputational harm as a result of negative public sentiment, regulatory scrutiny, and reduced investor and stakeholder confidence due to our response to climate change and our climate change strategy, which, in turn, could have a material negative impact on our business, results of operations, and financial condition.
ITEM 1B: UNRESOLVED STAFF COMMENTS
None.
ITEM 1C: CYBERSECURITY
Governance
Our Information Security (“IS”) Program consists of policies, procedures and guidelines to ensure the security, availability and confidentiality of client information. The IS Program is led by our Chief Information Security Officer (“CISO”) under the direction of the Chief Administrative Officer and is subject to additional management oversight by our Operations Technology Committee. The CISO has over 20 years of experience in cybersecurity and has a bachelor's, master's, and Juris Doctorate law degrees. He is a licensed attorney in both Missouri and Illinois. He currently holds multiple professional security certifications that include ISC2 Certified Information System Security Professional and Certified Cloud Security Professional, ISACA Certified Information Security Manager and EC-Council Certified Ethical Hacker. The Chief Administrative Officer has a bachelor’s degree and an MBA degree. He is also an active, licensed CPA in the state of Missouri. Prior to his appointment as Chief Administrative Officer, he served at Enterprise in senior finance roles within the Company, including Senior Vice President and Controller, and Chief Financial Officer of Enterprise Bank & Trust. The Operations Technology Committee is a management committee with overall responsibility for monitoring the systems, policies and procedures for our loan, deposit and wealth management business operations. This includes the framework used to identify and prevent cyberattacks or breaches. The Operations Technology Committee chair reports committee activities into the Risk Committee of the Board. Additionally, the CISO is a member of this committee, as well as the Risk Oversight and ESG Management Committees, and advises these committees on risks and opportunities related to information security, including data privacy.
The Risk Committee of the Board oversees the IS Program in the following ways: (a) monitors and oversees the Company’s business and information technology operations necessary for its business plan, including projected growth, technology capacity, planning, operational execution, product development and management capacity, (b) reviews the Company’s framework to prevent, detect, and respond to cyberattacks or breaches, as well as identifying areas of concern regarding possible vulnerabilities and best practices to secure points of vulnerability, and reviews policies pertaining to information security and cyber threats, taking into account the potential for external threats, internal threats, and threats arising from transactions with trusted third parties and vendors, and (c) reviews the Company’s incident response, business continuity and disaster recovery planning and preparedness including processes, policies and procedures that are related to preparing for recovery or continuation of technology infrastructure which are vital to the Company. As part of the Board’s oversight, the Board receives quarterly IS reports and updates from the Chief Information Officer (“CIO”) and CISO. At least annually, our Board also receives IS reports from the CISO which summarize new and emerging cybersecurity trends, trends in type, frequency and origination of attacks, and the effectiveness of our IS Program in mitigating cybersecurity threats. In the event of an information security incident, our Incident Response Plan clarifies the steps for escalation according to the severity of the attack
The IS team is staffed primarily with internal associates and we utilize third party service providers for extended coverage. We hire IS team members that have industry relevant information security or technology certifications and knowledge to implement and oversee the procedures and processes of our IS Program and to adequately manage and enforce our IS policies, procedures and guidelines. Further, management involved in the cybersecurity process possess the necessary skills and expertise to adequately manage and enforce our IS policies, procedures and guidelines.
26
While all vendors are subject to our vendor management due diligence process, those with access to our data and data centers are subject to more rigorous initial and more frequent ongoing due diligence. This includes reviews of Service Organization Control 2 reports, information security policies, vulnerability and penetration tests, human resource policies such as background checks and training, and business continuity plans.
We may face cybersecurity risks in connection with our normal business that could have a material adverse effect on our business strategy, results of operations, financial condition, or reputation. Although such risks have not materially affected us, we have experienced, and may continue to experience, cyber incidents during our normal course of business. For further discussion about these risks, see “Item 1A- Risk Factors - Technology and Cybersecurity Risks.”
Risk Management and Strategy
As part of the ongoing maintenance and development of our IS Program, we assess the various risks associated with the unauthorized access or loss of client information and the quality of security controls as prescribed by the Federal Financial Institutions Examinations Council and the National Institute of Standards and Technology Cybersecurity Framework. Our IS risk assessments are prepared in conjunction with our ERM framework, and the results are used to develop strategies to minimize risk to information assets.
Our systems are monitored 24/7 for cybersecurity threats, and we utilize a variety of tools to reduce the risk of data breaches. We maintain an Incident Response Plan which outlines the steps to be taken in the event of an information security incident, which could include a potential or actual data breach. The plan identifies a designated team, including associates and third-party experts responsible for the response, and summarizes the steps, including escalation protocol, for determining whether a breach has occurred and the nature and scope of the breach (if applicable). The plan also summarizes protocol for notifying impacted persons, which may include clients, as well as other applicable agencies or persons, including law enforcement and regulatory authorities.
The Incident Response Plan is led by our CISO, who is also a member of the Disclosure Committee. The Disclosure Committee is a cross-functional management group that is tasked with ensuring that external disclosures subject to SEC rules and regulations are accurate, complete, and timely. Members of the Disclosure Committee include leadership from accounting, credit, information security, information technology, legal, and operations. In conjunction with the working process of the Incident Response Plan, members of the Disclosure Committee evaluate cybersecurity incidents to determine whether disclosure is required.
At least annually, we conduct a third-party information security penetration audit focusing on internal and external network security protocols, as well as internally managed ad hoc testing as needed. Simulations and tabletop testing of our business continuity and Incident Response Plans are performed on a routine basis to test and assist with our associates’ familiarity and preparedness for a security event. Any gaps or improvement areas identified by routine testing are addressed in a timely manner to help improve future security testing.
The processes and controls related to data security are regularly tested by the IS department and Internal Audit. Additional internal security assessments may be performed at the request of the CISO, CIO, the Director of Internal Audit, Management or our Board. Audit and assessment results are presented to the Board, as well as the following committees: management’s Operations Technology Committee and the Audit and Risk Committees of the Board.
At least annually, the IS Program, including its effectiveness, is reviewed by the Board or a committee thereof. Annually, all associates participate in mandatory training on data privacy provisions and policies, including information security and its importance with respect to client and associate privacy.
All associates (including both full-time and part-time associates) are required to participate in monthly firmwide phishing tests.
27
ITEM 2: PROPERTIES
Our executive offices are located at 150 North Meramec Avenue, Clayton, Missouri, 63105. As of December 31, 2023, we utilized banking locations and administrative offices throughout our market areas of Arizona, California, Florida, Kansas, Missouri, Nevada, and New Mexico. Additionally, the Company has a limited network of loan production offices and deposit production offices in various other states. We own or lease our facilities and believe all of our properties are in good condition to meet our business needs.
ITEM 3: LEGAL PROCEEDINGS
The Company and its subsidiaries are, from time to time, parties to various legal proceedings arising out of their businesses. Management believes there are no such legal proceedings pending or threatened against the Company or its subsidiaries in the ordinary course of business, directly, indirectly, or in the aggregate that, if determined adversely, would have a material adverse effect on the business, consolidated financial condition, results of operations or cash flows of the Company or any of its subsidiaries.
For more information on our legal proceedings, see “Item 8. Note 13 – Litigation and Other Contingencies” in this report.
ITEM 4: MINE SAFETY DISCLOSURES
Not applicable.
PART II
ITEM 5: MARKET FOR REGISTRANT’S COMMON EQUITY, RELATED STOCKHOLDER MATTERS AND ISSUER PURCHASES OF EQUITY SECURITIES
Market for Our Common Stock
The Company’s common stock trades on the Nasdaq Global Select Market under the symbol “EFSC.” As of February 21, 2024, the Company had 1,670 registered shareholders of common stock. The number of holders of record does not represent the actual number of beneficial owners of our common stock because securities dealers and others frequently hold shares in “street name” for the benefit of individual owners who have the right to vote shares.
Dividends
The Company paid quarterly cash dividends on common shares in each of 2023, 2022 and 2021 and anticipates continuing to pay comparable dividends. Total dividends paid per common share were $1.00 in 2023, $0.90 in 2022 and $0.75 in 2021. However, we have no obligation to pay dividends and we may change our dividend policy at any time without notice to our shareholders.
Our ability to pay dividends is substantially dependent upon the ability of our subsidiaries to pay cash dividends to us. Information on regulatory restrictions on our ability to pay dividends is set forth in “Part I, Item 1. Business - Supervision and Regulation - Financial Holding Company - Dividend Restrictions and Share Repurchases.” The amount of dividends, if any, that may be declared by the Company also depends on many other factors, including future earnings, bank regulatory capital requirements and business conditions as they affect the Company and its subsidiaries. As a result, no assurance can be given that dividends will be paid in the future with respect to our common stock.
Recent Sales of Unregistered Securities and Use of Proceeds
None.
28
Issuer Purchases of Equity Securities
None.
Stock Performance Graph
The following graph compares the cumulative total shareholder return on the Company’s common stock from December 31, 2018 through December 31, 2023. The graph compares the Company’s common stock with the Nasdaq Composite Index (U.S. companies) and the S&P Regional Banks Select Industry Index.
The graph assumes an investment of $100.00 in the Company’s common stock and each index at the respective closing price on December 31, 2018 and reinvestment of all quarterly dividends. The investment is measured as of each subsequent fiscal year end. There is no assurance the Company’s common stock performance will continue in the future with the same or similar results as shown in the graph.
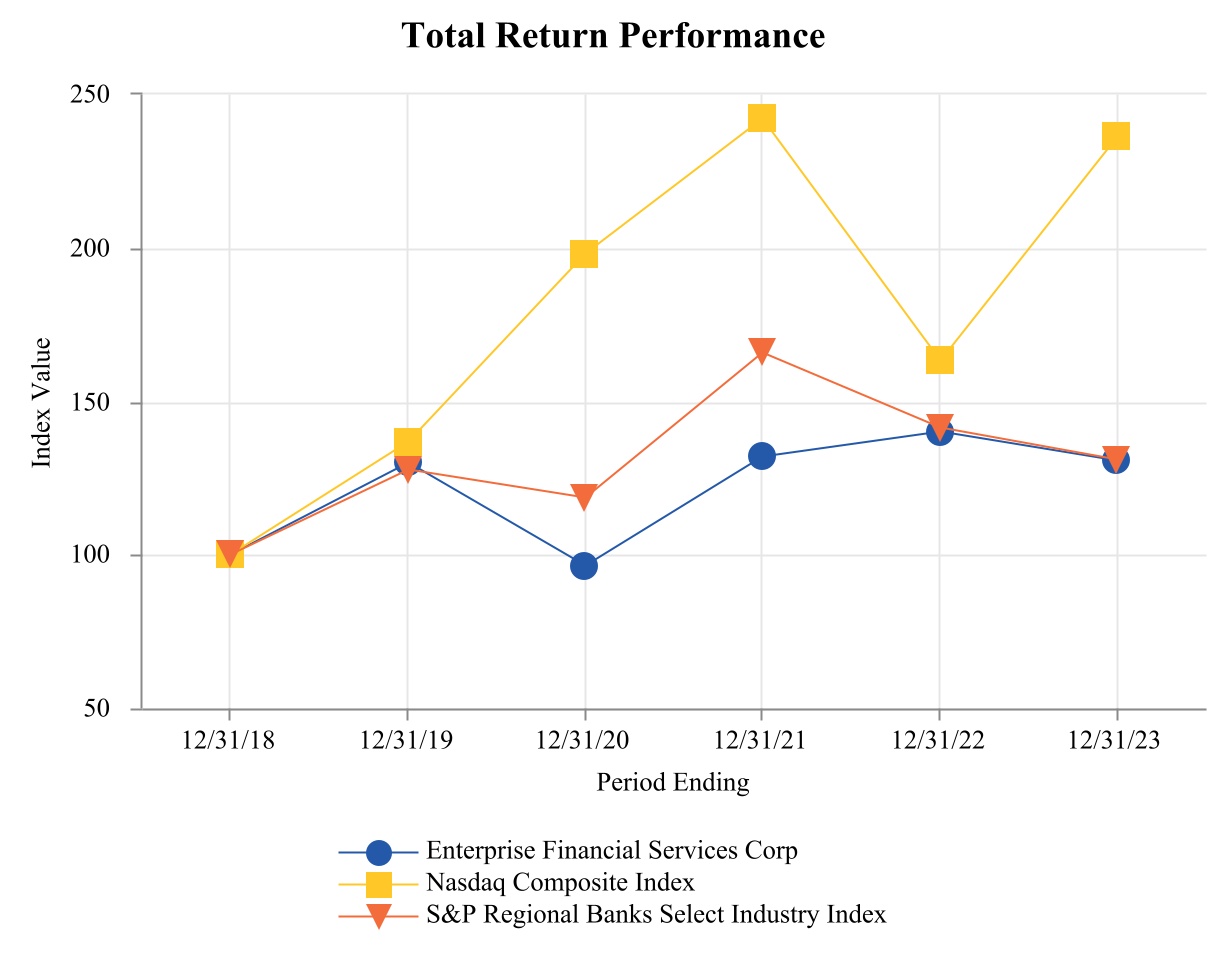
| Period Ending December 31, | ||||||||||||||||||||
| Index | 2018 | 2019 | 2020 | 2021 | 2022 | 2023 | ||||||||||||||
| Enterprise Financial Services Corp | $ | 100.00 | $ | 129.98 | $ | 96.41 | $ | 131.97 | $ | 139.92 | $ | 130.59 | ||||||||
| Nasdaq Composite Index | $ | 100.00 | $ | 136.69 | $ | 198.10 | $ | 242.03 | $ | 163.28 | $ | 236.17 | ||||||||
| S&P Regional Banks Select Industry Index | $ | 100.00 | $ | 127.64 | $ | 118.58 | $ | 165.90 | $ | 141.42 | $ | 130.91 | ||||||||
*Source: S&P Global Market Intelligence. Used with permission. All rights reserved.
ITEM 6: [RESERVED]
29
ITEM 7: MANAGEMENT’S DISCUSSION AND ANALYSIS OF FINANCIAL CONDITION AND
RESULTS OF OPERATIONS
Introduction
The objective of this section is to provide an overview of the results of operations and financial condition of the Company by focusing on changes in certain key measures from year to year. It should be read in conjunction with the Consolidated Financial Statements and related Notes contained in “Item 8. Financial Statements and Supplementary Data,” and other financial data presented elsewhere in this report, particularly the information regarding the Company’s business operations described in Item 1. A detailed discussion comparing 2022 and 2021 results is incorporated herein by reference to Item 7 of the Company’s 2022 Annual Report on Form 10-K filed on February 24, 2023.
Executive Summary
Our Company offers a broad range of business and personal banking services including wealth management services. Lending services include commercial and industrial, commercial real estate, real estate construction and development, residential real estate, specialty, and other loans. A wide variety of deposit products and a complete suite of treasury management and international trade services complement our lending capabilities. The Company’s results of operations are also affected by prevailing economic conditions, competition, government policies and other actions of regulatory agencies.
The Company’s financial condition, operating results and liquidity in 2023 continued to be impacted by the monetary policy actions enacted to address rising inflation. The Federal Reserve increased the target federal funds rate 100 basis points in 2023, following a 425 basis point increase in 2022. The Federal Reserve has continued to tighten their monetary policy by reducing Treasuries and agency mortgage-backed securities held on its balance sheet. This follows a period of highly expansionary fiscal support from the federal government during the start of the COVID-19 pandemic in 2020-2021.
30
Financial Performance Highlights
Below are highlights of our financial performance for the years ended December 31, 2023, 2022 and 2021.
| ($ in thousands, except per share data) | Year ended December 31, | ||||||||||||||||
| 2023 | 2022 | 2021 | |||||||||||||||
| EARNINGS | |||||||||||||||||
| Total interest income | $ | 764,919 | $ | 515,082 | $ | 383,230 | |||||||||||
| Total interest expense | 202,327 | 41,179 | 23,036 | ||||||||||||||
| Net interest income | 562,592 | 473,903 | 360,194 | ||||||||||||||
| Provision (benefit) for credit losses | 36,605 | (611) | 13,385 | ||||||||||||||
| Net interest income after provision (benefit) for credit losses | 525,987 | 474,514 | 346,809 | ||||||||||||||
| Total noninterest income | 68,725 | 59,162 | 67,743 | ||||||||||||||
| Total noninterest expense | 348,186 | 274,216 | 245,919 | ||||||||||||||
| Income before income tax expense | 246,526 | 259,460 | 168,633 | ||||||||||||||
| Income tax expense | 52,467 | 56,417 | 35,578 | ||||||||||||||
| Net income | $ | 194,059 | $ | 203,043 | $ | 133,055 | |||||||||||
| Preferred dividends | 3,750 | 4,041 | — | ||||||||||||||
| Net income available to common shareholders | $ | 190,309 | $ | 199,002 | $ | 133,055 | |||||||||||
| Basic earnings per share | $ | 5.09 | $ | 5.32 | $ | 3.86 | |||||||||||
| Diluted earnings per share | $ | 5.07 | $ | 5.31 | $ | 3.86 | |||||||||||
Return on average assets1 | 1.42 | % | 1.52 | % | 1.16 | % | |||||||||||
Return on average common equity1 | 12.39 | % | 13.95 | % | 10.49 | % | |||||||||||
Return on average tangible common equity1 | 16.40 | % | 19.10 | % | 14.18 | % | |||||||||||
| Net interest margin (fully tax equivalent) | 4.43 | % | 3.89 | % | 3.41 | % | |||||||||||
| Efficiency ratio | 55.15 | % | 51.44 | % | 57.47 | % | |||||||||||
Core efficiency ratio1 | 53.42 | % | 49.77 | % | 49.68 | % | |||||||||||
| Common dividend payout ratio | 19.64 | % | 16.89 | % | 19.66 | % | |||||||||||
| Book value per common share | $ | 43.94 | $ | 38.93 | $ | 38.53 | |||||||||||
Tangible book value per common share1 | $ | 33.85 | $ | 28.67 | $ | 28.28 | |||||||||||
| Average common equity to average assets | 11.76 | % | 11.25 | % | 11.14 | % | |||||||||||
Tangible common equity to tangible assets1 | 8.96 | % | 8.43 | % | 8.13 | % | |||||||||||
| At or for the year ended December 31, | |||||||||||||||||
| 2023 | 2022 | 2021 | |||||||||||||||
| ASSET QUALITY | |||||||||||||||||
| Net charge-offs | $ | 38,044 | $ | 3,899 | $ | 11,629 | |||||||||||
| Nonperforming loans | 43,728 | 9,981 | 28,024 | ||||||||||||||
| Nonaccrual loans | 43,181 | 9,766 | 23,449 | ||||||||||||||
| Classified assets | 185,389 | 99,122 | 100,797 | ||||||||||||||
| Total assets | 14,518,590 | 13,054,172 | 13,537,358 | ||||||||||||||
| Total loans | 10,884,118 | 9,737,138 | 9,017,642 | ||||||||||||||
| Classified assets to total assets | 1.28 | % | 0.76 | % | 0.74 | % | |||||||||||
| Nonperforming loans to total loans | 0.40 | % | 0.10 | % | 0.31 | % | |||||||||||
| Nonperforming assets to total assets | 0.34 | % | 0.08 | % | 0.23 | % | |||||||||||
| ACL on loans to total loans | 1.24 | % | 1.41 | % | 1.61 | % | |||||||||||
| Net charge-offs to average loans | 0.37 | % | 0.04 | % | 0.14 | % | |||||||||||
1Non-GAAP measures. A reconciliation has been included in this MD&A section under the caption “Use of Non-GAAP Financial Measures.”
31
The Company noted the following trends during 2023:
•The Company reported net income of $194.1 million, or $5.07 per diluted share for 2023, compared to $203.0 million, or $5.31 per diluted share for 2022. PPNR1 for 2023 was $284.8 million, compared to $258.9 million in 2022. PPNR ROAA1 for 2023 and 2022 was 2.06% and 1.94%, respectively. Organic earning-asset growth and expansion of net interest income due to the increase in market interest rates were the primary contributors to the PPNR increase in 2023. Offsetting the increase in PPNR was a $37.2 million increase in the provision for credit losses in 2023 compared to 2022.
•Net interest income for 2023 totaled $562.6 million, an increase of $88.7 million, or 19%, compared to $473.9 million for 2022. The Company’s asset sensitive balance sheet benefited from the increase in market interest rates during 2023. Net interest margin increased 54 basis points to 4.43% during 2023, compared to 3.89% in 2022. The increase was primarily due to the 6.67% loan yield in 2023, which increased 170 basis points, from 4.97% in 2022.
•Noninterest income was $68.7 million, an increase of 16% from $59.2 million in 2022. The increase was primarily due to higher volumes in tax credit income, private equity and community development income, and gains on the sale of SBA loans. Offsetting these amounts were a decrease in deposit services charges due to higher earnings credit rates, and a decrease in card services income due to the full year impact of the Durbin Amendment.
•Total noninterest expense was $348.2 million in 2023, a 27% increase from $274.2 million in 2022. The increase was primarily from higher customer servicing deposit costs due to higher deposit balances and an increase in earnings credit rates, and an increase in compensation from a larger associate base and annual merit increases. The Company’s core efficiency ratio1 was 53.4% in 2023, compared to 49.8% for the prior year.
•The Company’s effective tax rate was 21.3% in 2023 compared to 21.7% in 2022.
1Non-GAAP measures. A reconciliation has been included in this MD&A section under the caption “Use of Non-GAAP Financial Measures.”
2023 Significant Transactions
During 2023, we announced the following significant transactions:
•Dividends paid in 2023 of $1.00 per share increased $0.10 per share, or 11%, compared to $0.90 per share in 2022.
•The Company paid $3.8 million, or $50.00 per share, to preferred shareholders in 2023.
•The process of converting to a leading core operating system was initiated. The conversion is expected to be completed in the fourth quarter of 2024.
2022 Significant Transactions
During 2022, we announced the following significant transactions:
•The Company repurchased 700,473 of its common shares at a weighted-average share price of $47.00.
•Dividends paid in 2022 of $0.90 per share increased $0.15 per share, or 20%, compared to $0.75 per share in 2021.
•Retired 1,980,093 shares of treasury stock.
32
RESULTS OF OPERATIONS
Net Interest Income
Average Balance Sheet
The following table presents, for the periods indicated, certain information related to our average interest-earning assets and interest-bearing liabilities, as well as, the corresponding interest rates earned and paid, all on a tax equivalent basis. Average balances are presented on a daily average basis.
| Year ended December 31, | |||||||||||||||||||||||||||||||||||||||||||||||||||||
| 2023 | 2022 | 2021 | |||||||||||||||||||||||||||||||||||||||||||||||||||
| ($ in thousands) | Average Balance | Interest Income/Expense | Average Yield/ Rate | Average Balance | Interest Income/Expense | Average Yield/ Rate | Average Balance | Interest Income/Expense | Average Yield/ Rate | ||||||||||||||||||||||||||||||||||||||||||||
| Assets | |||||||||||||||||||||||||||||||||||||||||||||||||||||
| Interest-earning assets: | |||||||||||||||||||||||||||||||||||||||||||||||||||||
Loans1, 2 | $ | 10,324,951 | $ | 688,439 | 6.67 | % | $ | 9,193,682 | $ | 456,703 | 4.97 | % | $ | 8,055,873 | $ | 349,112 | 4.33 | % | |||||||||||||||||||||||||||||||||||
| Taxable securities | 1,320,664 | 40,920 | 3.10 | 1,228,514 | 29,638 | 2.41 | 908,189 | 19,305 | 2.13 | ||||||||||||||||||||||||||||||||||||||||||||
Non-taxable securities2 | 970,888 | 30,209 | 3.11 | 872,173 | 25,184 | 2.89 | 659,804 | 18,468 | 2.80 | ||||||||||||||||||||||||||||||||||||||||||||
| Total securities | 2,291,552 | 71,129 | 3.10 | 2,100,687 | 54,822 | 2.61 | 1,567,993 | 37,773 | 2.41 | ||||||||||||||||||||||||||||||||||||||||||||
| Interest-earning deposits | 260,214 | 13,430 | 5.16 | 1,074,165 | 10,599 | 0.99 | 1,084,853 | 1,496 | 0.14 | ||||||||||||||||||||||||||||||||||||||||||||
| Total interest-earning assets | 12,876,717 | 772,998 | 6.00 | 12,368,534 | 522,124 | 4.22 | 10,708,719 | 388,381 | 3.63 | ||||||||||||||||||||||||||||||||||||||||||||
| Noninterest-earning assets | 928,519 | 951,090 | 758,591 | ||||||||||||||||||||||||||||||||||||||||||||||||||
| Total assets | $ | 13,805,236 | $ | 13,319,624 | $ | 11,467,310 | |||||||||||||||||||||||||||||||||||||||||||||||
| Liabilities and Shareholders' Equity | |||||||||||||||||||||||||||||||||||||||||||||||||||||
| Interest-bearing liabilities: | |||||||||||||||||||||||||||||||||||||||||||||||||||||
| Interest-bearing demand accounts | $ | 2,559,238 | $ | 46,976 | 1.84 | % | $ | 2,318,363 | $ | 7,038 | 0.30 | % | $ | 2,122,752 | $ | 1,614 | 0.08 | % | |||||||||||||||||||||||||||||||||||
| Money market accounts | 3,043,794 | 92,976 | 3.05 | 2,781,579 | 19,306 | 0.69 | 2,557,836 | 4,669 | 0.18 | ||||||||||||||||||||||||||||||||||||||||||||
| Savings accounts | 668,368 | 975 | 0.15 | 819,043 | 305 | 0.04 | 724,768 | 225 | 0.03 | ||||||||||||||||||||||||||||||||||||||||||||
| Certificates of deposit | 1,198,551 | 42,796 | 3.57 | 569,272 | 3,509 | 0.62 | 570,496 | 4,160 | 0.73 | ||||||||||||||||||||||||||||||||||||||||||||
| Total interest-bearing deposits | 7,469,951 | 183,723 | 2.46 | 6,488,257 | 30,158 | 0.46 | 5,975,852 | 10,668 | 0.18 | ||||||||||||||||||||||||||||||||||||||||||||
| Subordinated debentures and notes | 155,702 | 9,781 | 6.28 | 155,160 | 9,166 | 5.91 | 195,686 | 10,960 | 5.60 | ||||||||||||||||||||||||||||||||||||||||||||
| FHLB advances | 54,615 | 2,752 | 5.04 | 33,467 | 599 | 1.79 | 59,945 | 803 | 1.34 | ||||||||||||||||||||||||||||||||||||||||||||
| Securities sold under agreements to repurchase | 168,745 | 3,647 | 2.16 | 211,039 | 506 | 0.24 | 225,894 | 235 | 0.10 | ||||||||||||||||||||||||||||||||||||||||||||
| Other borrowings | 71,738 | 2,424 | 3.38 | 22,812 | 750 | 3.29 | 26,428 | 370 | 1.40 | ||||||||||||||||||||||||||||||||||||||||||||
| Total interest-bearing liabilities | 7,920,751 | 202,327 | 2.55 | 6,910,735 | 41,179 | 0.60 | 6,483,805 | 23,036 | 0.36 | ||||||||||||||||||||||||||||||||||||||||||||
| Noninterest bearing liabilities: | |||||||||||||||||||||||||||||||||||||||||||||||||||||
| Demand deposits | 4,131,163 | 4,805,549 | 3,597,204 | ||||||||||||||||||||||||||||||||||||||||||||||||||
| Other liabilities | 130,201 | 104,581 | 109,148 | ||||||||||||||||||||||||||||||||||||||||||||||||||
| Total liabilities | 12,182,115 | 11,820,865 | 10,190,157 | ||||||||||||||||||||||||||||||||||||||||||||||||||
| Shareholders' equity | 1,623,121 | 1,498,759 | 1,277,153 | ||||||||||||||||||||||||||||||||||||||||||||||||||
| Total liabilities & shareholders' equity | $ | 13,805,236 | $ | 13,319,624 | $ | 11,467,310 | |||||||||||||||||||||||||||||||||||||||||||||||
| Net interest income | $ | 570,671 | $ | 480,945 | $ | 365,345 | |||||||||||||||||||||||||||||||||||||||||||||||
| Net interest spread | 3.45 | % | 3.62 | % | 3.27 | % | |||||||||||||||||||||||||||||||||||||||||||||||
| Net interest margin (tax equivalent) | 4.43 | % | 3.89 | % | 3.41 | % | |||||||||||||||||||||||||||||||||||||||||||||||
1Average balances include non-accrual loans. Interest income includes net loan fees of $13.8 million, $16.7 million, and $28.4 million for the years ended December 31, 2023, 2022, and 2021 respectively. Loan fees in 2022 and 2021 included PPP fees of $4.1 million and $21.7 million, respectively.
2Non-taxable income is presented on a fully tax-equivalent basis using a tax rate of approximately 25%. The tax-equivalent adjustments were $8.1 million, $7.0 million, and $5.1 million for the years ended December 31, 2023, 2022, and 2021 respectively.
33
Rate/Volume
The following table sets forth, on a tax-equivalent basis for the periods indicated, a summary of the changes in interest income and interest expense resulting from changes in yield/rates and volume.
| 2023 compared to 2022 | 2022 compared to 2021 | ||||||||||||||||||||||||||||||||||
| Increase (decrease) due to | Increase (decrease) due to | ||||||||||||||||||||||||||||||||||
| ($ in thousands) | Volume1 | Rate2 | Net | Volume1 | Rate2 | Net | |||||||||||||||||||||||||||||
| Interest earned on: | |||||||||||||||||||||||||||||||||||
| Loans | $ | 61,460 | $ | 170,276 | $ | 231,736 | $ | 52,238 | $ | 55,353 | $ | 107,591 | |||||||||||||||||||||||
| Taxable securities | 2,355 | 8,927 | 11,282 | 7,474 | 2,859 | 10,333 | |||||||||||||||||||||||||||||
Non-taxable securities3 | 2,981 | 2,045 | 5,026 | 6,115 | 601 | 6,716 | |||||||||||||||||||||||||||||
| Interest-earning deposits | (13,192) | 16,023 | 2,831 | (15) | 9,118 | 9,103 | |||||||||||||||||||||||||||||
| Total interest-earning assets | 53,604 | 197,271 | 250,875 | 65,812 | 67,931 | 133,743 | |||||||||||||||||||||||||||||
| Interest paid on: | |||||||||||||||||||||||||||||||||||
| Interest-bearing demand accounts | $ | 805 | $ | 39,133 | $ | 39,938 | $ | 162 | $ | 5,262 | $ | 5,424 | |||||||||||||||||||||||
| Money market accounts | 1,987 | 71,683 | 73,670 | 443 | 14,194 | 14,637 | |||||||||||||||||||||||||||||
| Savings | (66) | 736 | 670 | 31 | 49 | 80 | |||||||||||||||||||||||||||||
| Certificates of deposit | 7,363 | 31,924 | 39,287 | (9) | (642) | (651) | |||||||||||||||||||||||||||||
| Subordinated debentures and notes | 32 | 583 | 615 | (2,368) | 574 | (1,794) | |||||||||||||||||||||||||||||
| FHLB advances | 555 | 1,599 | 2,154 | (423) | 219 | (204) | |||||||||||||||||||||||||||||
| Securities sold under agreements to repurchase | (126) | 3,268 | 3,142 | (16) | 287 | 271 | |||||||||||||||||||||||||||||
| Other borrowed funds | 1,729 | (56) | 1,673 | (57) | 437 | 380 | |||||||||||||||||||||||||||||
| Total interest-bearing liabilities | 12,279 | 148,870 | 161,149 | (2,237) | 20,380 | 18,143 | |||||||||||||||||||||||||||||
| Net interest income | $ | 41,325 | $ | 48,401 | $ | 89,726 | $ | 68,049 | $ | 47,551 | $ | 115,600 | |||||||||||||||||||||||
1Change in volume multiplied by yield/rate of prior period. | |||||||||||||||||||||||||||||||||||
2Change in yield/rate multiplied by volume of prior period. | |||||||||||||||||||||||||||||||||||
3Nontaxable income is presented on a fully tax equivalent basis using a tax rate of approximately 25%. | |||||||||||||||||||||||||||||||||||
| NOTE: The change in interest due to both rate and volume has been allocated to rate and volume changes in proportion to the relationship of the absolute dollar amounts of the change in each. | |||||||||||||||||||||||||||||||||||
Net interest income (on a tax equivalent basis) was $570.7 million for 2023, compared to $480.9 million for 2022, an increase of $89.8 million, or 19%. The increase in net interest income in 2023 was primarily due to a higher average yield on interest earning assets and organic loan growth. These increases were offset by an increase in the average cost paid on interest bearing liabilities.
Total tax equivalent interest income increased $250.9 million in 2023 primarily due to a $231.7 million increase in loan interest income. The increase was primarily due to the 6.67% loan yield in 2023, which increased 170 basis points, from 4.97% in 2022. In addition, average loan balances in 2023 increased to $10.3 billion, an increase of $1.1 billion over the average for 2022. Tax equivalent interest income on securities (taxable and non-taxable) in 2023 increased $16.3 million from 2022, primarily due to an $11.0 million increase in yield and a $5.3 million increase in average balances. Average securities represented 18% of earnings assets in 2023 and 17% in 2022.
Overall, average interest-earning assets increased $0.5 billion, or 4%, to $12.9 billion for the year ended December 31, 2023. The increase was due to organic growth in average earning assets in the loan portfolio and a deployment of excess liquidity into the investment portfolio. Volume growth of the balance sheet drove an increase in interest income on earning assets of $53.6 million, while the increase in interest rates drove interest income on interest-earnings assets up by $197.3 million in 2023 compared to 2022.
Total interest expense increased $161.1 million in 2023 primarily due to increased deposit interest expense. The increase in deposit interest expense reflects higher rates paid on deposits, as well as successful marketing efforts that
34
increased average deposits. Remixing of the deposit portfolio from non-interest bearing and lower cost accounts into higher cost accounts contributed to the increase in deposit interest expense in 2023. Total average interest-bearing deposits increased to $7.5 billion, an increase of $981.7 million, or 15%, in 2023 over the average for 2022. Average noninterest bearing deposits declined $674.4 million, or 14%, in 2023 compared to the average for 2022. Average noninterest bearing deposits represented 36% of total average deposits in 2023, compared to 43% in 2022. Overall, average interest-bearing liabilities increased $1.0 billion, or 15% for the year ended December 31, 2023. The current mix of interest-bearing liabilities increased interest expense in 2023 by $12.3 million, while the increase in the average cost of interest bearing liabilities increased interest expense $148.9 million in 2023.
The tax-equivalent net interest margin was 4.43% for 2023, compared to 3.89% for 2022. The primary driver of the increase in net interest margin from 2022 to 2023 was an increase market interest rates. In 2023, the Federal Reserve increased interest rates three times. The federal funds target rate increased 100 basis points in 2023. The increase in short-term rates increased the yield on the Company’s variable-rate loan portfolio, as well as the yield earned on new loan production. As of December 31, 2023, variable-rate loans comprised approximately 61% of total loans. The increase in market interest rates also increased the cost on interest bearing liabilities. The earning asset yield increased 178 basis points to 6.00% in 2023, compared to 4.22% in 2022. Comparatively, the cost of interest bearing liabilities increased 195 basis points to 2.55%, from 0.60% in 2022.
Noninterest Income
The following table presents a comparative summary of the major components of noninterest income for each of the years in the three-year period ended December 31, 2023:
| Year ended December 31, | Change from | ||||||||||||||||||||||||||||
| ($ in thousands) | 2023 | 2022 | 2021 | 2023 vs. 2022 | 2022 vs. 2021 | ||||||||||||||||||||||||
| Service charges on deposit accounts | $ | 16,559 | $ | 18,326 | $ | 15,428 | $ | (1,767) | $ | 2,898 | |||||||||||||||||||
| Wealth management revenue | 10,030 | 10,010 | 10,259 | 20 | (249) | ||||||||||||||||||||||||
| Card services revenue | 10,028 | 11,551 | 11,880 | (1,523) | (329) | ||||||||||||||||||||||||
| Tax credit income | 9,196 | 2,558 | 8,028 | 6,638 | (5,470) | ||||||||||||||||||||||||
| Miscellaneous income | 22,912 | 16,717 | 22,148 | 6,195 | (5,431) | ||||||||||||||||||||||||
| Total noninterest income | $ | 68,725 | $ | 59,162 | $ | 67,743 | $ | 9,563 | $ | (8,581) | |||||||||||||||||||
Noninterest income increased $9.6 million, or 16%, in 2023 compared to 2022. This increase was primarily due to a $6.6 million increase in tax credit income and a $6.2 million increase in miscellaneous income. Tax credit income increased due to higher activity and a decline in longer term interest rates that positively impacted tax credits carried at fair value. Miscellaneous income increased due to private equity and community development income and gains on the sale of SBA loans. Private equity and community development income are not consistent sources of income and fluctuate based on distributions and earnings from the underlying funds. In 2023, $42.1 million of SBA loans were sold and a gain of $2.0 million was recognized. No SBA loans were sold in 2022.
Card services revenue declined $1.5 million in 2023. Included in this decline was a decrease of $2.3 million in debit card interchange income, partially offset by a $0.6 million increase in credit card fees. The Durbin Amendment limits the amount of interchange income banks can earn on debit card transactions after total assets exceed $10 billion. This limitation went into effect for the Company at the beginning of the third quarter of 2022 and was the primary driver of the reduction in debit card revenue.
35
Noninterest Expense
The following table presents a comparative summary of the components of noninterest expense:
| Year ended December 31, | Change from | ||||||||||||||||||||||||||||
| ($ in thousands) | 2023 | 2022 | 2021 | 2023 vs. 2022 | 2022 vs. 2021 | ||||||||||||||||||||||||
| Employee compensation and benefits | $ | 164,566 | $ | 147,029 | $ | 124,904 | $ | 17,537 | $ | 22,125 | |||||||||||||||||||
| Deposit costs | 72,293 | 31,082 | 14,211 | 41,211 | 16,871 | ||||||||||||||||||||||||
| Occupancy | 16,526 | 17,640 | 16,286 | (1,114) | 1,354 | ||||||||||||||||||||||||
| Data processing | 15,196 | 13,513 | 12,242 | 1,683 | 1,271 | ||||||||||||||||||||||||
| Professional fees | 5,719 | 7,079 | 4,289 | (1,360) | 2,790 | ||||||||||||||||||||||||
| Branch-closure expenses | — | — | 3,441 | — | (3,441) | ||||||||||||||||||||||||
| Merger-related expenses | — | — | 22,082 | — | (22,082) | ||||||||||||||||||||||||
| Other expenses | 73,886 | 57,873 | 48,464 | 16,013 | 9,409 | ||||||||||||||||||||||||
| Total noninterest expense | $ | 348,186 | $ | 274,216 | $ | 245,919 | $ | 73,970 | $ | 28,297 | |||||||||||||||||||
| Efficiency ratio | 55.15 | % | 51.44 | % | 57.47 | % | 3.71 | % | (6.03) | % | |||||||||||||||||||
Core efficiency ratio1 | 53.42 | % | 49.77 | % | 49.68 | % | 3.65 | % | 0.09 | % | |||||||||||||||||||
1 A non-GAAP measure. A reconciliation has been included in this MD&A section under the caption “Use of Non-GAAP Financial Measures.” | |||||||||||||||||||||||||||||
Noninterest expense increased $74.0 million, or 27%, in 2023 compared to 2022. The increase was attributed primarily to a $41.2 million increase in deposit costs, a $17.5 million increase in compensation and benefits, and a $16.0 million increase in other expenses. For certain deposit accounts in the Company’s specialized deposit portfolio, clients receive an earnings credit rate on average collected balances that may be used to offset expenses associated with the client’s activities for managing the accounts. These costs are reflected in noninterest expense as Deposit costs. The increase in deposit costs in 2023 is due to organic growth in specialized deposits and an increase in market interest rates that increased the earnings credit rate and related expenses for those accounts. The Company maintained approximately $2.6 billion and $2.0 billion of average specialty deposits, resulting in an average specialty deposit cost of 2.75% and 1.41% for 2023 and 2022, respectively.
The increase in compensation and benefits was due to annual merit increases and an increase in full time equivalent employees, higher share-based compensation from higher award levels, and higher medical costs due to inflationary increases. The Company expects to continue to invest in its associates and other infrastructure that supports growth. In addition, low unemployment, inflationary pressures and a shift in employee work arrangements to a virtual/hybrid model are expected to continue to have an impact on future operating expenses.
The increase in other expense of $16.0 million was attributed primarily to a $6.1 million increase in FDIC assessment and other insurance, a $1.7 million increase in loan, legal and other real estate expenses, and a $1.6 million increase in marketing and public relations expenses. The increase in FDIC assessment and other insurance is primarily due to an FDIC special assessment in the amount of $2.4 million and an increase due to the growth of the balance sheet. In November 2023, the FDIC issued a Final Rule on Special Assessment Pursuant to Systemic Risk Determination, implementing a special assessment to recover the cost associated with protecting uninsured depositors following the closure of FDIC insured banks earlier in 2023. The FDIC will collect the special assessment at an annual rate of approximately 13.4 basis points over eight quarterly assessment periods beginning in January 2024. The Company’s portion of the special assessment is approximately $2.4 million and was expensed in the fourth quarter of 2023.
36
Income Taxes
The Company’s blended federal and state tax rate was approximately 24.8% in 2023 and 25.2% in 2022. The effective tax rate, which is adjusted for permanent differences, such as tax exempt income, was 21.3% in 2023 compared to 21.7% in 2022. In conjunction with the completion of the 2022 tax returns in the fourth quarter of 2023, the effective tax rate decreased due to a lower state tax apportionment. See “Item 8. Note 16 – Income Taxes” for additional information.
FINANCIAL CONDITION
Summary Balance Sheet
| ($ in thousands) | December 31, | % Increase (Decrease) | |||||||||||||||||||||||||||
| 2023 | 2022 | 2021 | 2023 vs. 2022 | 2022 vs. 2021 | |||||||||||||||||||||||||
| Total cash and cash equivalents | $ | 433,029 | $ | 291,359 | $ | 2,021,689 | 48.62 | % | (85.59) | % | |||||||||||||||||||
| Securities | 2,368,707 | 2,245,722 | 1,795,687 | 5.48 | % | 25.06 | % | ||||||||||||||||||||||
| Total loans | 10,884,118 | 9,737,138 | 9,017,642 | 11.78 | % | 7.98 | % | ||||||||||||||||||||||
| Total assets | 14,518,590 | 13,054,172 | 13,537,358 | 11.22 | % | (3.57) | % | ||||||||||||||||||||||
| Deposits | 12,176,371 | 10,829,150 | 11,343,799 | 12.44 | % | (4.54) | % | ||||||||||||||||||||||
| Total liabilities | 12,802,522 | 11,531,909 | 12,008,242 | 11.02 | % | (3.97) | % | ||||||||||||||||||||||
| Total shareholders’ equity | 1,716,068 | 1,522,263 | 1,529,116 | 12.73 | % | (0.45) | % | ||||||||||||||||||||||
The table below represents the summary balance sheet shown as a percentage of account class (total assets, total liabilities or total shareholders’ equity), as applicable:
| December 31, | |||||||||||||||||
| 2023 | 2022 | 2021 | |||||||||||||||
| Total cash and cash equivalents | 2.98 | % | 2.23 | % | 14.93 | % | |||||||||||
| Securities | 16.31 | % | 17.20 | % | 13.26 | % | |||||||||||
| Total loans | 74.97 | % | 74.59 | % | 66.61 | % | |||||||||||
| Total assets | 100.00 | % | 100.00 | % | 100.00 | % | |||||||||||
| Deposits | 95.11 | % | 93.91 | % | 94.47 | % | |||||||||||
| Total liabilities | 100.00 | % | 100.00 | % | 100.00 | % | |||||||||||
| Total shareholders’ equity | 100.00 | % | 100.00 | % | 100.00 | % | |||||||||||
Assets
Loans by Type
The Company has a diversified loan portfolio, with no particular concentration of credit in any one economic sector; however, a substantial portion of the portfolio, including the C&I category, is secured by real estate. The ability of the Company’s borrowers to honor their contractual obligations is partially dependent upon the local economy and its effect on the real estate market.
37
The following table sets forth the composition of the loan portfolio by type of loans:
| December 31, | |||||||||||
| ($ in thousands) | 2023 | 2022 | |||||||||
| Commercial and industrial | $ | 4,672,559 | $ | 3,859,882 | |||||||
| Commercial real estate - investor owned | 2,451,953 | 2,357,820 | |||||||||
| Commercial real estate - owner occupied | 2,351,618 | 2,270,551 | |||||||||
| Construction and land development | 760,425 | 611,565 | |||||||||
| Residential real estate | 372,188 | 395,537 | |||||||||
| Other | 275,375 | 241,783 | |||||||||
| Total loans | $ | 10,884,118 | $ | 9,737,138 | |||||||
| December 31, | |||||||||||
| 2023 | 2022 | ||||||||||
| Commercial and industrial | 42.9 | % | 39.6 | % | |||||||
| Commercial real estate - investor owned | 22.5 | % | 24.2 | % | |||||||
| Commercial real estate - owner occupied | 21.6 | % | 23.3 | % | |||||||
| Construction and land development | 7.1 | % | 6.3 | % | |||||||
| Residential real estate | 3.4 | % | 4.1 | % | |||||||
| Other | 2.5 | % | 2.5 | % | |||||||
| Total loans | 100.0 | % | 100.0 | % | |||||||
C&I loans are made based on the borrower’s ability to generate cash flows for repayment from income sources, general credit strength, experience, and character, even though such loans may also be secured by real estate or other assets. The credit risk related to commercial loans is largely influenced by general economic conditions and the resulting impact on a borrower’s operations.
The Company continues to focus on originating high-quality C&I loan relationships as they typically have variable interest rates and allow for cross selling opportunities involving other banking products. C&I loan growth also supports our efforts to maintain the Company’s asset-sensitive interest rate risk position. Additionally, our specialized products, especially sponsor finance, life insurance premium financing, and tax credit lending, consist of primarily C&I loans, and have contributed significantly to the Company’s C&I loan growth. These loans are sourced through relationships developed with wealth and estate planning firms, private equity funds and tax credit specialists and are not bound geographically to our markets. As a result, these specialized loan products offer opportunities to expand and diversify our overall geographic concentration by entering into new markets.
Real estate loans place an emphasis on the estimated cash flows from the operation of the property and/or the underlying collateral value.
•Our commercial real estate loans, including investor-owned and owner-occupied categories, primarily represent commercial property loans on which the primary source of repayment is income from the property. These loans are principally underwritten based on the cash flow coverage of the property, the Company’s loan to value guidelines, and generally require either the limited or full guaranty of principal sponsors of the credit. Commercial real estate loans also represent owner-occupied C&I loans for which the primary source of repayment is dependent on sources other than the underlying collateral.
•Construction and land development loans relating primarily to residential and commercial properties, represent financing secured by real estate under development for eventual sale or undeveloped ground. At December 31, 2023, $447.0 million of these loans include the use of interest reserves and follow standard
38
underwriting guidelines. Construction projects are monitored by the loan officer and a centralized independent loan disbursement function.
•Residential real estate loans include residential mortgages, which are loans that, due to size or other attributes, do not qualify for conventional home mortgages available-for-sale in the secondary market, second mortgages, home equity lines and conventional mortgages that are part of a broad banking relationship with the Company. Residential mortgage loans are usually limited to a maximum of 80% of collateral value at origination.
Other loans represent loans to individuals, loans to state and political subdivisions, loans to nondepository financial institutions, and loans to purchase or are fully secured by investment securities. Credit risk is managed by thoroughly reviewing the creditworthiness of the borrowers prior to origination and thereafter.
The following table presents a breakdown of loans by NAICS code at the periods indicated:
| December 31, | |||||||||||||||||||||||
| 2023 | 2022 | ||||||||||||||||||||||
| ($ in thousands) | Outstanding Balance | % | Outstanding Balance | % | |||||||||||||||||||
| Accommodation and Food Services | $ | 975,357 | 9 | % | $ | 880,870 | 9 | % | |||||||||||||||
| Administrative and Support and Waste Management and Remediation Services | 215,733 | 2 | % | 200,586 | 2 | % | |||||||||||||||||
Agriculture, Forestry, Fishing and Hunting1 | 229,719 | 2 | % | 200,144 | 2 | % | |||||||||||||||||
| Arts, Entertainment, and Recreation | 125,487 | 1 | % | 105,851 | 1 | % | |||||||||||||||||
| Construction | 692,403 | 6 | % | 555,343 | 6 | % | |||||||||||||||||
| Educational Services | 54,044 | 1 | % | 51,083 | — | % | |||||||||||||||||
| Finance and Insurance | 2,005,183 | 18 | % | 1,622,712 | 17 | % | |||||||||||||||||
| Health Care and Social Assistance | 551,979 | 5 | % | 455,839 | 5 | % | |||||||||||||||||
| Information | 97,052 | 1 | % | 100,004 | 1 | % | |||||||||||||||||
| Management of Companies and Enterprises | 88,079 | 1 | % | 78,548 | 1 | % | |||||||||||||||||
| Manufacturing | 704,750 | 7 | % | 694,483 | 7 | % | |||||||||||||||||
| Mining, Quarrying, and Oil and Gas Extraction | 32,024 | — | % | 8,106 | — | % | |||||||||||||||||
| Other Services (except Public Administration) | 588,449 | 5 | % | 536,112 | 6 | % | |||||||||||||||||
| Professional, Scientific, and Technical Services | 326,176 | 3 | % | 304,027 | 3 | % | |||||||||||||||||
| Public Administration | 13,774 | — | % | 9,111 | — | % | |||||||||||||||||
| Real Estate and Rental and Leasing | 2,766,754 | 25 | % | 2,534,275 | 26 | % | |||||||||||||||||
| Retail Trade | 513,763 | 5 | % | 517,659 | 5 | % | |||||||||||||||||
| Transportation and Warehousing | 284,706 | 3 | % | 257,384 | 3 | % | |||||||||||||||||
| Utilities | 15,853 | — | % | 34,079 | — | % | |||||||||||||||||
| Wholesale Trade | 535,666 | 5 | % | 491,218 | 5 | % | |||||||||||||||||
| Other | 67,167 | 1 | % | 99,704 | 1 | % | |||||||||||||||||
| Total Loans | $ | 10,884,118 | 100 | % | $ | 9,737,138 | 100 | % | |||||||||||||||
1Includes $95.0 million and $94.0 million in animal production at December 31, 2023, and 2022, respectively and $113.8 million and $95.6 million in crop production at December 31, 2023, and 2022, respectively. | |||||||||||||||||||||||
At December 31, 2023 and 2022, the Company had an agricultural loan portfolio of $229.7 million and $200.1 million, respectively. The Company has announced its intent to wind down this portfolio over time as the loans mature or pay down. The Company does not intend to enter into new agricultural loans.
39
The following table presents a breakdown of commercial & industrial loans by size at the periods indicated:
| December 31, | |||||||||||||||||||||||||||||||||||
| 2023 | 2022 | ||||||||||||||||||||||||||||||||||
| ($ in thousands) | Number of Loans | Outstanding Balance | Average Balance | Number of Loans | Outstanding Balance | Average Balance | |||||||||||||||||||||||||||||
| <$2 million | 2,466 | $ | 850,849 | $ | 345 | 2,116 | $ | 771,717 | $ | 365 | |||||||||||||||||||||||||
| $2-5 million | 339 | 1,114,522 | 3,288 | 314 | 991,748 | 3,158 | |||||||||||||||||||||||||||||
| $5-10 million | 139 | 984,795 | 7,085 | 124 | 862,427 | 6,955 | |||||||||||||||||||||||||||||
| >$10 million | 97 | 1,722,393 | 17,757 | 76 | 1,233,990 | 16,237 | |||||||||||||||||||||||||||||
| Total | 3,041 | $ | 4,672,559 | $ | 1,537 | 2,630 | $ | 3,859,882 | $ | 1,468 | |||||||||||||||||||||||||
The following table presents a breakdown of commercial real estate loans (investor owned and owner occupied) by size at the periods indicated:
| December 31, | |||||||||||||||||||||||||||||||||||
| 2023 | 2022 | ||||||||||||||||||||||||||||||||||
| ($ in thousands) | Number of Loans | Outstanding Balance | Average Balance | Number of Loans | Outstanding Balance | Average Balance | |||||||||||||||||||||||||||||
| <$2 million | 3,133 | $ | 1,867,452 | $ | 596 | 3,170 | $ | 1,872,671 | $ | 591 | |||||||||||||||||||||||||
| $2-5 million | 413 | 1,265,659 | 3,065 | 416 | 1,272,977 | 3,060 | |||||||||||||||||||||||||||||
| $5-10 million | 118 | 793,837 | 6,727 | 105 | 727,681 | 6,930 | |||||||||||||||||||||||||||||
| >$10 million | 57 | 876,623 | 15,379 | 50 | 755,042 | 15,101 | |||||||||||||||||||||||||||||
| Total | 3,721 | $ | 4,803,571 | $ | 1,291 | 3,741 | $ | 4,628,371 | $ | 1,237 | |||||||||||||||||||||||||
The Company had $482.0 million and $443.1 million of investor owned office real estate loans as of December 31, 2023 and 2022, respectively.
The following table presents a breakdown of construction loans by size at the periods indicated:
| December 31, | |||||||||||||||||||||||||||||||||||
| 2023 | 2022 | ||||||||||||||||||||||||||||||||||
| ($ in thousands) | Number of Loans | Outstanding Balance | Average Balance | Number of Loans | Outstanding Balance | Average Balance | |||||||||||||||||||||||||||||
| <$2 million | 355 | $ | 143,461 | $ | 404 | 408 | $ | 181,813 | $ | 446 | |||||||||||||||||||||||||
| $2-5 million | 60 | 190,857 | 3,181 | 52 | 154,563 | 2,972 | |||||||||||||||||||||||||||||
| $5-10 million | 23 | 160,228 | 6,966 | 14 | 96,194 | 6,871 | |||||||||||||||||||||||||||||
| >$10 million | 17 | 265,879 | 15,640 | 13 | 178,995 | 13,769 | |||||||||||||||||||||||||||||
| Total | 455 | $ | 760,425 | $ | 1,671 | 487 | $ | 611,565 | $ | 1,256 | |||||||||||||||||||||||||
40
The following table presents a breakdown of residential loans by size at the periods indicated:
| December 31, | |||||||||||||||||||||||||||||||||||
| 2023 | 2022 | ||||||||||||||||||||||||||||||||||
| ($ in thousands) | Number of Loans | Outstanding Balance | Average Balance | Number of Loans | Outstanding Balance | Average Balance | |||||||||||||||||||||||||||||
| <$2 million | 2,130 | $ | 284,594 | $ | 134 | 2,252 | $ | 293,691 | $ | 130 | |||||||||||||||||||||||||
| $2-5 million | 18 | 58,337 | 3,241 | 21 | 70,658 | 3,365 | |||||||||||||||||||||||||||||
| $5-10 million | 4 | 29,257 | 7,314 | 4 | 31,188 | 7,797 | |||||||||||||||||||||||||||||
| Total | 2,152 | $ | 372,188 | $ | 173 | 2,277 | $ | 395,537 | $ | 174 | |||||||||||||||||||||||||
The following table presents a breakdown of other loans by size at the periods indicated:
| December 31, | |||||||||||||||||||||||||||||||||||
| 2023 | 2022 | ||||||||||||||||||||||||||||||||||
| ($ in thousands) | Number of Loans | Outstanding Balance | Average Balance | Number of Loans | Outstanding Balance | Average Balance | |||||||||||||||||||||||||||||
| <$2 million | 1,171 | $ | 105,759 | $ | 90 | 1,265 | $ | 125,136 | $ | 99 | |||||||||||||||||||||||||
| $2-5 million | 18 | 60,801 | 3,378 | 18 | 59,099 | 3,283 | |||||||||||||||||||||||||||||
| $5-10 million | 7 | 44,593 | 6,370 | 3 | 18,255 | 6,085 | |||||||||||||||||||||||||||||
| >$10 million | 4 | 64,222 | 16,056 | 3 | 39,293 | 13,098 | |||||||||||||||||||||||||||||
| Total | 1,200 | $ | 275,375 | $ | 229 | 1,289 | $ | 241,783 | $ | 188 | |||||||||||||||||||||||||
The following table presents a breakdown of total loans by geographic region at the periods indicated:
| December 31, | |||||||||||
| ($ in thousands) | 2023 | 2022 | |||||||||
| Midwest | $ | 3,338,308 | $ | 3,214,305 | |||||||
| Southwest | 1,565,852 | 1,242,125 | |||||||||
| West | 1,813,239 | 1,654,899 | |||||||||
| Specialty and other loans | 4,166,719 | 3,625,809 | |||||||||
| Total | $ | 10,884,118 | $ | 9,737,138 | |||||||
41
The following table presents a breakdown of total loans by MSA, excluding specialty and other loans, at the periods indicated:
| December 31, | |||||||||||
| ($ in thousands) | 2023 | 2022 | |||||||||
| St. Louis, MO-IL MSA | $ | 2,382,192 | $ | 2,328,830 | |||||||
| Los Angeles-Long Beach-Santa Ana, CA MSA | 1,561,720 | 1,477,084 | |||||||||
| Kansas City, MO-KS MSA | 953,557 | 882,499 | |||||||||
| Phoenix-Mesa-Scottsdale, AZ MSA | 899,768 | 692,788 | |||||||||
| San Diego-Carlsbad-San Marcos, CA MSA | 234,808 | 177,815 | |||||||||
| Albuquerque, NM MSA | 183,813 | 197,004 | |||||||||
| Santa Fe, NM MSA | 167,321 | 180,976 | |||||||||
| Dallas-Fort Worth-Arlington, TX MSA | 155,459 | 42,545 | |||||||||
| Las Vegas-Paradise, NV MSA | 83,737 | 39,477 | |||||||||
| All other MSAs | 95,024 | 92,311 | |||||||||
| Specialty and other loans | 4,166,719 | 3,625,809 | |||||||||
| Total | $ | 10,884,118 | $ | 9,737,138 | |||||||
Loan guarantees, primarily on SBA 7(a) loans, totaled $932.1 million and $960.3 million at December 31, 2023 and 2022, respectively.
The following table provides additional information on select specialty lending detail, at the periods indicated:
| ($ in thousands) | December 31, 2023 | December 31, 2022 | Increase (decrease) | ||||||||||||||||||||
| C&I | $ | 2,186,203 | $ | 1,904,654 | $ | 281,549 | 15 | % | |||||||||||||||
| CRE investor owned | 2,291,660 | 2,176,424 | 115,236 | 5 | % | ||||||||||||||||||
| CRE owner occupied | 1,262,264 | 1,174,094 | 88,170 | 8 | % | ||||||||||||||||||
| SBA loans* | 1,281,632 | 1,312,378 | (30,746) | (2) | % | ||||||||||||||||||
| Sponsor finance* | 872,264 | 635,061 | 237,203 | 37 | % | ||||||||||||||||||
| Life insurance premium finance* | 956,162 | 817,115 | 139,047 | 17 | % | ||||||||||||||||||
| Tax credits* | 734,594 | 559,605 | 174,989 | 31 | % | ||||||||||||||||||
| Residential real estate | 359,957 | 379,924 | (19,967) | (5) | % | ||||||||||||||||||
| Construction and land development | 670,567 | 534,753 | 135,814 | 25 | % | ||||||||||||||||||
| Other | 268,815 | 243,130 | 25,685 | 11 | % | ||||||||||||||||||
| Total loans | $ | 10,884,118 | $ | 9,737,138 | $ | 1,146,980 | 12 | % | |||||||||||||||
| *Specialty loan category | |||||||||||||||||||||||
The sponsor finance portfolio is primarily comprised of loans in the manufacturing and wholesale trade sectors. It includes mid-market company mergers and acquisitions, targeted private equity firms, principally SBICs, and senior debt financing to portfolio companies.
The life insurance premium finance category specializes in financing whole life insurance premiums utilized in high net worth estate planning, through relationships with boutique estate planners throughout the United States.
The tax credit portfolio includes tax credit-related lending on affordable housing projects funded through the use of
federal and state low income housing tax credits. In addition, we provide leveraged and other loans on projects funded through the CDFI New Markets Tax Credit Program. This portfolio also includes tax credit brokerage
42
through 10-year streams of state tax credits from affordable housing development funds. The tax credits are sold to clients and other individuals for tax planning purposes.
SBA loans are originated under the SBA 7(a) program and are primarily owner-occupied, commercial real estate loans secured by a 1st lien. These loans predominantly have a 75% portion guaranteed by the SBA.
Significant loan concentrations are considered to exist for a financial institution when there are amounts loaned to numerous borrowers engaged in similar activities that would cause them to be similarly impacted by economic or other conditions. At December 31, 2023, no significant concentrations exceeding 10% of total loans existed in the Company’s loan portfolio, except as described above.
The following table presents the maturity distribution of loans at December 31, 2023 categorized by fixed or variable interest rates, net of unearned loan fees:
| ($ in thousands) | Due in One Year or Less (1) | After One Through Five Years | After Five Through Fifteen Years | After Fifteen Years | Total | Percent of Total Loans | |||||||||||||||||||||||||||||
| Fixed Rate Loans | |||||||||||||||||||||||||||||||||||
| Commercial and industrial | $ | 51,175 | $ | 607,919 | $ | 604,659 | $ | 11,859 | $ | 1,275,612 | 12 | % | |||||||||||||||||||||||
| Real estate: | |||||||||||||||||||||||||||||||||||
| Commercial | 302,811 | 1,647,258 | 461,445 | 147,176 | 2,558,690 | 23 | % | ||||||||||||||||||||||||||||
| Construction and land development | 30,137 | 56,756 | 3,171 | 2,176 | 92,240 | 1 | % | ||||||||||||||||||||||||||||
| Residential | 18,213 | 92,594 | 13,957 | 25,011 | 149,775 | 1 | % | ||||||||||||||||||||||||||||
| Other | 2,084 | 26,181 | 86,192 | 55,922 | 170,379 | 2 | % | ||||||||||||||||||||||||||||
| Total | $ | 404,420 | $ | 2,430,708 | $ | 1,169,424 | $ | 242,144 | $ | 4,246,696 | 39 | % | |||||||||||||||||||||||
| Variable Rate Loans | |||||||||||||||||||||||||||||||||||
| Commercial and industrial | $ | 1,224,975 | $ | 1,985,579 | $ | 180,990 | $ | 5,403 | $ | 3,396,947 | 31 | % | |||||||||||||||||||||||
| Real estate: | |||||||||||||||||||||||||||||||||||
| Commercial | 217,526 | 415,253 | 384,171 | 1,227,931 | 2,244,881 | 21 | % | ||||||||||||||||||||||||||||
| Construction and land development | 247,919 | 277,764 | 63,959 | 78,543 | 668,185 | 6 | % | ||||||||||||||||||||||||||||
| Residential | 36,337 | 25,351 | 58,760 | 101,965 | 222,413 | 2 | % | ||||||||||||||||||||||||||||
| Other | 42,902 | 14,713 | 47,261 | 120 | 104,996 | 1 | % | ||||||||||||||||||||||||||||
| Total | $ | 1,769,659 | $ | 2,718,660 | $ | 735,141 | $ | 1,413,962 | $ | 6,637,422 | 61 | % | |||||||||||||||||||||||
| Total Loans | |||||||||||||||||||||||||||||||||||
| Commercial and industrial | $ | 1,276,150 | $ | 2,593,498 | $ | 785,649 | $ | 17,262 | $ | 4,672,559 | 43 | % | |||||||||||||||||||||||
| Real estate: | |||||||||||||||||||||||||||||||||||
| Commercial | 520,337 | 2,062,511 | 845,616 | 1,375,107 | 4,803,571 | 44 | % | ||||||||||||||||||||||||||||
| Construction and land development | 278,056 | 334,520 | 67,130 | 80,719 | 760,425 | 7 | % | ||||||||||||||||||||||||||||
| Residential | 54,550 | 117,945 | 72,717 | 126,976 | 372,188 | 3 | % | ||||||||||||||||||||||||||||
| Other | 44,986 | 40,894 | 133,453 | 56,042 | 275,375 | 3 | % | ||||||||||||||||||||||||||||
| Total | $ | 2,174,079 | $ | 5,149,368 | $ | 1,904,565 | $ | 1,656,106 | $ | 10,884,118 | 100.0 | % | |||||||||||||||||||||||
(1) Includes loans with no stated maturity and overdraft lines of credit.
The majority of variable loans are based on the prime rate or SOFR. At December 31, 2023, $4.2 billion or 64% of variable rate loans were subject to an interest rate floor. Most variable rate loan originations have one-to three-year maturities. Management monitors this mix as part of its interest rate risk management. See “Interest Rate Risk” of this MD&A section.
43
Provision and Allowance for Credit Losses
The following table presents the components of the provision for credit losses for the periods indicated:
| December 31, | |||||||||||
| ($ in thousands) | 2023 | 2022 | |||||||||
| Provision (benefit) for credit losses on loans | $ | 35,883 | $ | (4,210) | |||||||
| Provision for available-for-sale securities | 4,281 | — | |||||||||
| Provision (benefit) for off-balance sheet commitments | (5,450) | 4,462 | |||||||||
| Provision for held-to-maturity securities | 50 | 121 | |||||||||
| Charge-offs (recoveries) of accrued interest | 1,841 | (984) | |||||||||
| Provision (benefit) for credit losses | $ | 36,605 | $ | (611) | |||||||
The provision for credit losses, which includes a provision for losses on unfunded commitments, is a charge to earnings to maintain the ACL at a level consistent with management’s assessment of expected losses in the loan portfolio at the balance sheet date. The Company also records reversals of interest on nonaccrual loans and interest recoveries directly through the provision of credit losses.
CECL requires economic forecasts to be factored into determining estimated losses. As a result, CECL is designed to typically require a higher level of provision at the start of an economic downturn. The increase in the provision for credit losses in 2023 was primarily due to loan growth, net charge-offs and the increase in nonperforming loans. The provision for credit losses in 2023 also included the impact of the impairment of an available-for-sale investment security. The available-for-sale investment impairment was related to a subordinated debt security in a publicly-traded bank that failed in the first quarter of 2023. The provision benefit in the prior year-to-date period, was primarily due to an improvement in economic factors and the recovery of accrued interest on nonperforming loans.
To the extent the Company does not recognize charge-offs and economic forecasts improve in future periods, the Company could recognize a reversal of provision for credit losses. Conversely, if economic conditions and the Company’s forecast worsens, the Company could recognize elevated levels of provision for credit losses. The provision is also reflective of charge-offs in the period.
The following table summarizes the allocation of the ACL on loans:
| December 31, | |||||||||||||||||
| ($ in thousands) | 2023 | 2022 | |||||||||||||||
| Balance at End of Period Applicable to: | Amount | Percent of loans in each category to total loans | Amount | Percent of loans in each category to total loans | |||||||||||||
| Commercial and industrial | $ | 58,886 | 42.9 | % | $ | 53,835 | 39.6 | % | |||||||||
| Real estate: | |||||||||||||||||
| Commercial | 54,685 | 44.1 | % | 58,943 | 47.5 | % | |||||||||||
| Construction and land development | 10,198 | 7.0 | % | 11,444 | 6.3 | % | |||||||||||
| Residential | 6,142 | 3.4 | % | 7,928 | 4.1 | % | |||||||||||
| Other | 4,860 | 2.6 | % | 4,782 | 2.5 | % | |||||||||||
| Total allowance | $ | 134,771 | 100.0 | % | $ | 136,932 | 100.0 | % | |||||||||
The allowance for credit losses was 1.24% of total loans at December 31, 2023, compared to 1.41%, and 1.61%, at December 31, 2022 and 2021, respectively. The decline in the allowance to total loans ratio in 2023 compared to 2022 was primarily due to a shift in the mix of the loan portfolio to categories with lower reserve requirements, improvement in the economic forecast and net loan charge-offs of $38.0 million.
44
The following table is a summary of net charge-offs (recoveries) to average loans for the periods indicated:
| December 31, | |||||||||||||||||||||||
| 2023 | 2022 | ||||||||||||||||||||||
| ($ in thousands) | Net Charge-offs (Recoveries) | Average Loans(1) | Net Charge-offs (Recoveries)/Average Loans | Net Charge-offs (Recoveries) | Average Loans(1) | Net Charge-offs (Recoveries)/Average Loans | |||||||||||||||||
| Commercial and industrial | $ | 33,257 | $ | 4,247,091 | 0.78 | % | $ | 3,869 | $ | 3,555,483 | 0.11 | % | |||||||||||
| Real estate: | |||||||||||||||||||||||
| Commercial | 4,446 | 4,712,037 | 0.09 | % | (593) | 4,323,757 | (0.01) | % | |||||||||||||||
| Construction and land development | (54) | 712,578 | (0.01) | % | (53) | 689,048 | (0.01) | % | |||||||||||||||
| Residential | (323) | 362,641 | (0.09) | % | 539 | 382,485 | 0.14 | % | |||||||||||||||
| Other | 718 | 290,054 | 0.25 | % | 137 | 240,816 | 0.06 | % | |||||||||||||||
| Total | 38,044 | 10,324,401 | 0.37 | % | 3,899 | 9,191,589 | 0.04 | % | |||||||||||||||
(1) Excludes loans held for sale.
To the extent the Company does not recognize charge-offs and economic forecasts improve in future periods, the Company could recognize provision reversals. Conversely, if economic conditions and the Company’s forecast worsens and charge-offs increase, the Company could recognize elevated levels of provision for credit losses. The provision is also reflective of charge-offs (recoveries) in the period.
See “Critical Accounting Policies and Estimates” of this MD&A section for more information on the allowance for credit losses methodology.
Nonperforming loans and assets
See “Item 8. Note 1 – Summary of Significant Accounting Policies” for more information on nonaccrual loans and other real estate. The following table presents the categories of nonperforming assets and other ratios, excluding government guaranteed portions, as of the dates indicated.
| December 31, | |||||||||||
| ($ in thousands) | 2023 | 2022 | |||||||||
| Non-accrual loans | $ | 43,181 | $ | 9,766 | |||||||
| Loans past due 90 days or more and still accruing interest | 547 | 142 | |||||||||
| Restructured loans | — | 73 | |||||||||
| Total nonperforming loans | 43,728 | 9,981 | |||||||||
| Other real estate | 5,736 | 269 | |||||||||
| Total nonperforming assets | $ | 49,464 | $ | 10,250 | |||||||
| Total assets | $ | 14,518,590 | $ | 13,054,172 | |||||||
| Total loans | 10,884,118 | 9,737,138 | |||||||||
| Total allowance for credit losses | 134,771 | 136,932 | |||||||||
| ACL to nonaccrual loans | 312 | % | 1,402 | % | |||||||
| ACL to nonperforming loans | 308 | % | 1,372 | % | |||||||
| ACL to total loans | 1.24 | % | 1.41 | % | |||||||
| Nonaccrual loans to total loans | 0.40 | % | 0.10 | % | |||||||
| Nonperforming loans to total loans | 0.40 | % | 0.10 | % | |||||||
| Nonperforming assets to total assets | 0.34 | % | 0.08 | % | |||||||
45
Nonperforming loans based on loan type were as follows:
| ($ in thousands) | December 31, 2023 | Number of loans | December 31, 2022 | Number of loans | |||||||||||||||||||||||||||||||
| Commercial and industrial | $ | 7,756 | 18 | % | 15 | $ | 4,443 | 44 | % | 14 | |||||||||||||||||||||||||
| Commercial real estate | 33,739 | 77 | % | 27 | 4,200 | 42 | % | 10 | |||||||||||||||||||||||||||
| Construction and land development | 1,269 | 3 | % | 3 | 1,192 | 12 | % | 2 | |||||||||||||||||||||||||||
| Residential real estate | 959 | 2 | % | 1 | 73 | 1 | % | 1 | |||||||||||||||||||||||||||
| Other | 5 | — | % | 2 | 73 | 1 | % | 2 | |||||||||||||||||||||||||||
| Total | $ | 43,728 | 100 | % | 48 | $ | 9,981 | 100 | % | 29 | |||||||||||||||||||||||||
The following table summarizes the changes in nonperforming loans:
| Year ended December 31, | |||||||||||
| ($ in thousands) | 2023 | 2022 | |||||||||
| Nonperforming loans, beginning of period | $ | 9,981 | $ | 28,024 | |||||||
| Additions to nonaccrual loans | 109,766 | 8,904 | |||||||||
| Charge-offs | (43,215) | (9,393) | |||||||||
| Principal payments | (25,871) | (17,554) | |||||||||
| Moved to other real estate and repossessed assets | (6,933) | — | |||||||||
| Nonperforming loans, end of period | $ | 43,728 | $ | 9,981 | |||||||
Nonperforming loans at December 31, 2023 increased $33.7 million, or 338%, when compared to December 31, 2022. The increase in nonperforming loans during 2023 was primarily from additions to nonaccrual loans of $109.8 million, offset by principal payments of $25.9 million and charge-offs of $43.2 million. The charge-offs of nonperforming loans were primarily in C&I and commercial real estate (investor owned), representing 84% and 11% of gross charge-offs in 2023, respectively.
Other real estate
The following table summarizes the changes in other real estate:
| Year ended December 31, | |||||||||||
| ($ in thousands) | 2023 | 2022 | |||||||||
| Other real estate, beginning of period | $ | 269 | $ | 3,493 | |||||||
| Additions | 5,736 | — | |||||||||
| Writedowns in value | — | (268) | |||||||||
| Sales | (269) | (2,956) | |||||||||
| Other real estate, end of period | $ | 5,736 | $ | 269 | |||||||
Investments
At December 31, 2023, our portfolio of investment securities was $2.4 billion, or 16%, of total assets, compared to $2.2 billion, or 17%, of total assets as of December 31, 2022. The portfolio is comprised of both available-for-sale and held-to-maturity securities.
46
The table below sets forth the carrying value of investment securities, excluding the allowance for credit losses:
| December 31, | |||||||||||||||||||||||
| 2023 | 2022 | ||||||||||||||||||||||
| ($ in thousands) | Amount | % | Amount | % | |||||||||||||||||||
| Obligations of U.S. Government sponsored enterprises | $ | 296,446 | 12.5 | % | $ | 237,785 | 10.6 | % | |||||||||||||||
| Obligations of states and political subdivisions | 1,007,870 | 42.5 | % | 946,456 | 42.1 | % | |||||||||||||||||
| Agency mortgage-backed securities | 752,481 | 31.8 | % | 716,422 | 31.9 | % | |||||||||||||||||
| U.S. Treasury Bills | 181,701 | 7.7 | % | 208,534 | 9.3 | % | |||||||||||||||||
| Corporate debt securities | 130,994 | 5.5 | % | 137,260 | 6.1 | % | |||||||||||||||||
| Total | $ | 2,369,492 | 100.0 | % | $ | 2,246,457 | 100.0 | % | |||||||||||||||
The allowance for credit losses on held-to-maturity debt securities was $0.8 million and $0.7 million at December 31, 2023 and 2022, respectively. The Company had no debt securities classified as trading at December 31, 2023, or 2022.
The following table summarizes contractual maturity and tax-equivalent yields on the investment portfolio at December 31, 2023:
| Within 1 year | 1 to 5 years | 5 to 10 years | Over 10 years | Total | ||||||||||||||||||||||||||||||||||||||||
| ($ in thousands) | Amount | Yield | Amount | Yield | Amount | Yield | Amount | Yield | Amount | Yield | ||||||||||||||||||||||||||||||||||
| Obligations of U.S. Government-sponsored enterprises | $ | 19,002 | 2.0 | % | $ | 233,663 | 1.8 | % | $ | 32,821 | 4.2 | % | $ | 10,960 | 2.1 | % | $ | 296,446 | 2.1 | % | ||||||||||||||||||||||||
| Obligations of states and political subdivisions | 6,357 | 1.4 | % | 22,167 | 2.4 | % | 214,115 | 3.4 | % | 765,231 | 3.2 | % | 1,007,870 | 3.3 | % | |||||||||||||||||||||||||||||
| Agency mortgage-backed securities | 103 | 3.5 | % | 74,432 | 2.9 | % | 67,521 | 3.6 | % | 610,425 | 3.1 | % | 752,481 | 3.1 | % | |||||||||||||||||||||||||||||
| U.S. Treasury Bills | 116,225 | 4.2 | % | 63,055 | 3.0 | % | 2,421 | 3.1 | % | — | — | % | 181,701 | 3.7 | % | |||||||||||||||||||||||||||||
| Corporate debt securities | — | — | % | 72,377 | 3.2 | % | 58,617 | 3.5 | % | — | — | % | 130,994 | 3.4 | % | |||||||||||||||||||||||||||||
| Total | $ | 141,687 | 3.8 | % | $ | 465,694 | 2.4 | % | $ | 375,495 | 3.5 | % | $ | 1,386,616 | 3.2 | % | $ | 2,369,492 | 3.1 | % | ||||||||||||||||||||||||
Yields on tax-exempt securities are computed on a taxable equivalent basis using a tax rate of 24.8%. Actual maturities can differ from contractual maturities, as borrowers may have the right to call or repay obligations with or without prepayment penalties.
Other investments primarily consist of the FHLB capital stock, common stock investments related to our trust preferred securities, community development funds, and other investments in private equity funds, primarily SBICs. These investments do not have a stated maturity.
| December 31, | |||||||||||||||||||||||
| 2023 | 2022 | ||||||||||||||||||||||
| ($ in thousands) | Amount | % | Amount | % | |||||||||||||||||||
| FHLB capital stock | $ | 7,824 | 11.8 | % | $ | 14,015 | 22.0 | % | |||||||||||||||
| Other investments | 58,371 | 88.2 | % | 49,775 | 78.0 | % | |||||||||||||||||
| Total | $ | 66,195 | 100.0 | % | $ | 63,790 | 100.0 | % | |||||||||||||||
47
Deposits
The following table shows the breakdown of deposits by type:
| Years ended December 31, | $ Increase (decrease) | % Increase (decrease) | |||||||||||||||||||||
| ($ in thousands) | 2023 | 2022 | 2023 vs. 2022 | 2023 vs. 2022 | |||||||||||||||||||
| Noninterest-bearing demand accounts | $ | 3,958,743 | $ | 4,642,732 | $ | (683,989) | (14.7) | % | |||||||||||||||
| Interest-bearing demand accounts | 2,950,259 | 2,256,295 | 693,964 | 30.8 | % | ||||||||||||||||||
| Money market accounts | 3,399,280 | 2,655,159 | 744,121 | 28.0 | % | ||||||||||||||||||
| Savings accounts | 595,175 | 744,256 | (149,081) | (20.0) | % | ||||||||||||||||||
| Certificates of deposit: | |||||||||||||||||||||||
| Brokered | 482,759 | 118,968 | 363,791 | 305.8 | % | ||||||||||||||||||
| Customer | 790,155 | 411,740 | 378,415 | 91.9 | % | ||||||||||||||||||
| Total deposits | $ | 12,176,371 | $ | 10,829,150 | $ | 1,347,221 | 12.4 | % | |||||||||||||||
| Noninterest-bearing deposits / Total deposits | 33 | % | 43 | % | |||||||||||||||||||
Brokered certificates of deposit increased $363.8 million, to $482.8 million at December 31, 2023. Brokered certificates of deposit are used for term liquidity purposes in place of FHLB borrowings. The brokered certificates of deposit balance has a weighted average cost of 4.73% and a weighted average remaining term of 7 months at December 31, 2023. The Company has a specialty deposit portfolio focusing primarily on property management, community associations, and escrow companies. These deposits totaled $2.8 billion and $2.1 billion at the end of 2023 and 2022, respectively.
The following table shows the average balance and average rate of the Company’s deposits by type:
| Years ended December 31, | |||||||||||||||||||||||||||||||||||
| 2023 | 2022 | 2021 | |||||||||||||||||||||||||||||||||
| ($ in thousands) | Average Balance | Average Rate Paid | Average Balance | Average Rate Paid | Average Balance | Average Rate Paid | |||||||||||||||||||||||||||||
| Noninterest-bearing deposit accounts | $ | 4,131,163 | — | % | $ | 4,805,549 | — | % | $ | 3,597,204 | — | % | |||||||||||||||||||||||
| Interest-bearing demand accounts | 2,559,238 | 1.84 | % | 2,318,363 | 0.30 | % | 2,122,752 | 0.08 | % | ||||||||||||||||||||||||||
| Money market accounts | 3,043,794 | 3.05 | % | 2,781,579 | 0.69 | % | 2,557,836 | 0.18 | % | ||||||||||||||||||||||||||
| Savings accounts | 668,368 | 0.15 | % | 819,043 | 0.04 | % | 724,768 | 0.03 | % | ||||||||||||||||||||||||||
| Certificates of deposit: | |||||||||||||||||||||||||||||||||||
| Brokered | 557,761 | 4.44 | % | 128,120 | 1.08 | % | 66,265 | 1.66 | % | ||||||||||||||||||||||||||
| Customer | 640,790 | 2.81 | % | 441,152 | 0.48 | % | 504,231 | 0.61 | % | ||||||||||||||||||||||||||
| Total interest-bearing deposits | $ | 7,469,951 | 2.46 | % | $ | 6,488,257 | 0.46 | % | $ | 5,975,852 | 0.18 | % | |||||||||||||||||||||||
| Total average deposits | $ | 11,601,114 | 1.58 | % | $ | 11,293,806 | 0.27 | % | $ | 9,573,056 | 0.11 | % | |||||||||||||||||||||||
Average total deposits were $11.6 billion for the year ended December 31, 2023, an increase of $307.3 million, or 3%, from December 31, 2022. The increase in 2023 was primarily due to organic growth in money market and interest-bearing demand accounts.
48
The following table sets forth the maturities of estimated uninsured certificates of deposit as of December 31, 2023. Uninsured deposits are amounts estimated to exceed the FDIC deposit insurance limit and are not subject to any federal or state insurance program.
| ($ in thousands) | Total | ||||
| Three months or less | $ | 118,125 | |||
| Over three through six months | 48,185 | ||||
| Over six through twelve months | 48,786 | ||||
| Over twelve months | 19,507 | ||||
| Total | $ | 234,603 | |||
As of December 31, 2023, estimated uninsured deposits totaled $4.3 billion, including $234.6 million of certificates of deposit. At December 31, 2022 estimated uninsured deposits totaled $5.9 billion. Estimated uninsured deposits at December 31, 2023 include $0.5 million of balances that are collateralized or secured with third party insurance.
Shareholders’ equity
Shareholders’ equity totaled $1.7 billion at December 31, 2023, an increase of $193.8 million, or 12.7%, from December 31, 2022.
Significant activity during the year ended December 31, 2023 included the following:
•Increase from net income of $194.1 million;
•Net increase in fair value of available-for-sale securities and cash flow hedges of $29.3 million;
•Decrease from dividends paid on common stock of $37.4 million and preferred stock of $3.8 million, respectively
Liquidity and Capital Resources
Liquidity
The objective of liquidity management is to ensure we have the ability to generate sufficient cash or cash equivalents in a timely and cost-effective manner to meet our commitments as they become due. Typical demands on liquidity are changes in deposit levels, maturing time deposits which are not renewed, and fundings under credit commitments to customers. Funds are available from a number of sources, such as the core deposit base and loan and security repayments and maturities.
Additionally, liquidity is provided from lines of credit with the FHLB, the Federal Reserve, and correspondent banks; the ability to acquire large and brokered deposits; sales of the securities portfolio; and the ability to sell loan participations to other banks. These alternatives are an important part of our liquidity plan and provide flexibility and efficient execution of the asset-liability management strategy.
The Company’s Asset-Liability Management Committee oversees our liquidity position, the parameters of which are approved by the Bank’s Board of Directors. Our liquidity position is monitored daily. Our liquidity management framework includes measurement of several key elements, such as a loan to deposit ratio, a liquidity ratio, and a dependency ratio. The Company’s liquidity framework also incorporates contingency planning to assess the nature and volatility of funding sources and to determine alternatives to these sources. While core deposits and loan and investment repayments are principal sources of liquidity, funding diversification is another key element of liquidity management and is achieved by strategically varying depositor types, terms, funding markets, and instruments.
Liquidity from assets is available primarily from cash balances and the investment portfolio. Cash and interest-bearing deposits with other banks totaled $433.0 million at December 31, 2023, compared to $291.4 million at December 31, 2022. The increase in cash balances during 2023 is due to deposit growth exceeding loan growth. The increase in market interest rates in 2022-2023 increased the competitive environment for deposits, as depositors
49
have more alternatives to bank deposit accounts. While client deposit balances declined in the first half of 2023, successful marketing efforts increased total deposits in the last half of the year. Investment securities are another important tool to the Company’s liquidity objectives. Securities totaled $2.4 billion at December 31, 2023, and included $1.6 billion pledged as collateral for deposits of public institutions, treasury, loan notes, and other requirements. The remaining $808.7 million could be pledged or sold to enhance liquidity, if necessary.
Available on- and off-balance sheet liquidity sources include the following items:
| ($ in thousands) | December 31, 2023 | ||||
| Federal Reserve Bank borrowing capacity | $ | 2,533,405 | |||
| FHLB borrowing capacity | 1,029,921 | ||||
| Unpledged securities | 808,709 | ||||
| Federal funds lines (6 correspondent banks) | 120,000 | ||||
| Cash and interest-bearing deposits | 433,029 | ||||
| Holding Company line of credit | 25,000 | ||||
| Total | $ | 4,950,064 | |||
The Company also has a portfolio of SBA guaranteed loans, a portion of which could be sold in the secondary market to generate earnings and liquidity. SBA loans totaling $42.1 million were sold during 2023.
Liability liquidity funding sources are available to increase financial flexibility. In addition to amounts borrowed at December 31, 2023, the Company could borrow an additional $1.0 billion from the FHLB of Des Moines under blanket loan pledges and has additional real estate loans that could be pledged. In the first quarter of 2024, the Company pledged an additional $495 million of loans to the FHLB to increase the borrowing capacity. The Company also has $2.5 billion available from the Federal Reserve Bank under a pledged loan agreement. Included in the Federal Reserve Bank borrowing capacity at December 31, 2023 is $215.0 million related to the Bank Term Funding Program. On January 24, 2024, the Federal Reserve announced that the program would cease making new loans on March 11, 2024. The Company also has unsecured federal funds lines with six correspondent banks totaling $120 million.
In the normal course of business, the Company enters into certain forms of off-balance sheet transactions, including unfunded loan commitments and letters of credit. These transactions are managed through the Company’s various risk management processes. Management considers both on-balance sheet and off-balance sheet transactions in its evaluation of the Company’s liquidity. The Company has $3.0 billion in unused commitments to extend credit as of December 31, 2023. While this commitment level would exhaust the majority the Company’s current liquidity resources, the nature of these commitments is such that the likelihood of funding them in the aggregate at any one time is low.
At the holding company level, our primary funding sources are dividends and payments from the Bank and proceeds from the issuance of equity (i.e. stock option exercises, stock offerings) and debt instruments. The main use of this liquidity is to provide the funds necessary to pay dividends to shareholders, service debt, invest in subsidiaries as necessary, and satisfy other operating requirements. In 2023, the holding company maintained a revolving line of credit for an aggregate amount up to $25 million, all of which was available at December 31, 2023. The line of credit has a one-year term that was renewed in February 2024 for an additional one-year term, and the interest rate was amended to one-month Term SOFR plus 185 basis points and the annual unused commitment fee was increased to 0.40%. The proceeds can be used for general corporate purposes.
The Company has an effective automatic shelf registration statement on Form S-3 allowing for the issuance of various forms of equity and debt securities. The Company’s ability to offer securities pursuant to the registration statement depends on market conditions and the Company’s continuing eligibility to use the Form S-3 under rules of the SEC.
50
Strong capital ratios, credit quality and core earnings are essential to retaining cost-effective access to the wholesale funding markets. Deterioration in any of these factors could have a negative impact on the Company’s ability to access these funding sources and, as a result, these factors are monitored on an ongoing basis as part of the liquidity management process. The Bank is subject to regulations and, among other things, may be limited in its ability to pay dividends or transfer funds to the parent company. Accordingly, consolidated cash flows as presented in the consolidated statements of cash flows may not represent cash immediately available for the payment of cash dividends to the Company’s shareholders or for other cash needs.
Through the normal course of operations, the Company has entered into certain contractual obligations and other commitments. Such obligations relate to funding of operations through deposits or debt issuances, as well as leases for premises and equipment. As a financial services provider, the Company routinely enters into commitments to extend credit. While contractual obligations represent future cash requirements of the Company, a significant portion of commitments to extend credit may expire without being drawn upon. Such commitments are subject to the same credit policies and approval process accorded to loans made by the Company. The Company also enters into derivative contracts under which the Company either receives cash from or pays cash to counterparties depending on changes in interest rates. Derivative contracts are carried at fair value on the consolidated balance sheet with the fair value representing the net present value of expected future cash receipts or payments based on market interest rates as of the balance sheet date. The fair value of these contracts changes daily as market interest rates change. For additional information on the Company’s contractual obligations and commitments see the following footnotes in Item 8: “Note 5 – Leases,” “Note 6 – Derivative Financial Instruments,” “Note 10 – Subordinated Debentures and Notes,” “Note 11 – Federal Home Loan Bank Advances,” “Note 12 – Other Borrowings,” and “Note 17 – Commitments and Contingent Liabilities.”
Capital Resources
The Company and the Bank are subject to various regulatory capital requirements administered by the state and federal banking agencies. Failure to meet minimum capital requirements can initiate certain mandatory and possible additional discretionary actions by regulators that, if undertaken, could have a direct material effect on the financial statements and results of operations of the Company. Under capital adequacy guidelines and the regulatory framework for prompt corrective action, the Company and its bank affiliate must meet specific capital guidelines that involve quantitative measures of assets, liabilities, and certain off-balance-sheet items as calculated under regulatory accounting practices. The banking affiliate’s capital amounts and classification are also subject to qualitative judgments by the regulators about components, risk weightings and other factors.
Quantitative measures established by regulation to ensure capital adequacy require the Company and the Bank to maintain minimum amounts and ratios (set forth in the following table) of total and tier 1 capital to risk-weighted assets, and of tier 1 capital to average assets. To be categorized as “well-capitalized”, banks must maintain minimum total risk-based (10%), tier 1 risk-based (8%), common equity tier 1 risk-based (6.5%), and tier 1 leverage ratios (5%). As of December 31, 2023, and December 31, 2022, the Company and the Bank met all capital adequacy requirements to which they are subject.
The Bank met the definition of “well-capitalized” at each of December 31, 2023 and 2022. Refer to “Item 8. Note 14 – Regulatory Capital” for a summary of our risk-based capital and leverage ratios.
51
The following table summarizes the Company’s capital ratios:
| December 31, 2023 | December 31, 2022 | |||||||||||||||||||||||||
| ($ in thousands) | EFSC | Bank | EFSC | Bank | To Be Well-Capitalized | Minimum Ratio with CCB | ||||||||||||||||||||
| Common Equity Tier 1 Capital to Risk Weighted Assets | 11.3 | % | 12.2 | % | 11.1 | % | 12.1 | % | 6.5 | % | 7.0 | % | ||||||||||||||
| Tier 1 Capital to Risk Weighted Assets | 12.7 | % | 12.2 | % | 12.6 | % | 12.1 | % | 8.0 | % | 8.5 | % | ||||||||||||||
| Total Capital to Risk Weighted Assets | 14.2 | % | 13.2 | % | 14.2 | % | 13.1 | % | 10.0 | % | 10.5 | % | ||||||||||||||
| Leverage Ratio (Tier 1 Capital to Average Assets) | 11.0 | % | 10.6 | % | 10.9 | % | 10.5 | % | 5.0 | % | N/A | |||||||||||||||
Tangible common equity to tangible assets1 | 8.96 | % | 8.43 | % | ||||||||||||||||||||||
| Common equity tier 1 capital | $ | 1,387,802 | $ | 1,493,105 | $ | 1,228,786 | $ | 1,333,978 | ||||||||||||||||||
| Tier 1 capital | 1,553,448 | 1,493,163 | 1,394,426 | 1,334,030 | ||||||||||||||||||||||
| Total risk-based capital | 1,732,501 | 1,608,966 | 1,568,332 | 1,444,685 | ||||||||||||||||||||||
1 Not a required regulatory capital ratio | ||||||||||||||||||||||||||
The Company believes the tangible common equity and regulatory capital ratios are important measures of capital strength. The tangible common equity to tangible assets ratio is considered a non-GAAP measure. The tables included in this MD&A section under the caption “Use of Non-GAAP Financial Measures” reconcile these ratios to U.S. GAAP.
Risk Management
Market risk arises from exposure to changes in interest rates and other relevant market rate or price risk. The Company faces market risk in the form of interest rate risk through transactions other than trading activities. Market risk from these activities, in the form of interest rate risk, is measured and managed through a number of methods. The Company uses financial modeling techniques to measure interest rate risk. These techniques measure the sensitivity of future earnings due to changing interest rate environments. Guidelines established by the Bank’s Asset/Liability Management Committee and approved by the Bank’s Board of Directors are used to monitor exposure of earnings at risk. General interest rate movements are used to develop sensitivity as management believes it has no primary exposure to a specific point on the yield curve. These limits are based on the Company’s exposure to immediate and sustained parallel rate movements, either upward or downward. The Company does not have any direct market risk from commodity exposures.
Interest Rate Risk
Our interest rate risk management practices are aimed at optimizing net interest income, while guarding against deterioration that could be caused by certain interest rate scenarios. Interest rate sensitivity varies with different types of interest-earning assets and interest-bearing liabilities. We attempt to maintain interest-earning assets, comprised primarily of both loans and investments, and interest-bearing liabilities, comprised primarily of deposits, maturing or repricing in similar time horizons in order to manage any impact from market interest rate changes according to our risk tolerance. The Company uses an earnings simulation model to measure earnings sensitivity to changing rates.
The Company determines the sensitivity of its short-term future earnings to a hypothetical plus or minus 100 to 300 basis point parallel rate shock through the use of simulation modeling. The simulation of earnings includes the modeling of the balance sheet as an ongoing entity. Future business assumptions involving administered rate products, prepayments for future rate-sensitive balances, and the reinvestment of maturing assets and liabilities are included. These items are then modeled to project net interest income based on a hypothetical change in interest rates. The resulting net interest income for the next 12-month period is compared to the net interest income amount calculated using flat rates. This difference represents the Company’s earnings sensitivity to a positive or negative parallel rate shock.
52
The following table summarizes the projected impact of interest rate shocks on net interest income:
| Rate Shock | Annual % change in net interest income | |||||||||||||
| At December 31, | ||||||||||||||
| 2023 | 2022 | |||||||||||||
| + 300 bp | 9.8% | 11.1% | ||||||||||||
| + 200 bp | 6.6% | 7.5% | ||||||||||||
| + 100 bp | 3.3% | 3.8% | ||||||||||||
| - 100 bp | (3.5)% | (4.1)% | ||||||||||||
| - 200 bp | (7.3)% | (9.0)% | ||||||||||||
| - 300 bp | (11.2)% | (15.1)% | ||||||||||||
In addition to the rate shocks shown in the table above, the Company models net interest income under various dynamic interest rate scenarios. In general, changes in interest rates are positively correlated with changes in net interest income.
The Company occasionally uses interest rate derivative instruments as an asset/liability management tool to hedge mismatches in interest rate exposure indicated by the net interest income simulation described above. They are used to modify the Company’s exposures to interest rate fluctuations and provide more stable spreads between loan yields and the rate on their funding sources. At December 31, 2023, the Company had derivative contracts to manage interest rate risk, including $250.0 million in notional value on derivatives to hedge the cash flows on floating rate loans and $62.0 million in notional value on derivatives on floating rate debt. Derivative financial instruments are discussed in “Item 8. Note 6 – Derivative Financial Instruments.”
The FCA has announced that the most common USD LIBOR settings (overnight, 1-month. 3-month, 6-month and 12-month) will cease publication after September 30, 2024. LIBOR was the most liquid and common interest rate index in the world and was commonly referenced in financial instruments. With the cessation of LIBOR, the Company has selected term SOFR as the replacement index for the majority of its variable rate loans and began providing customer notifications in early 2023. The Company ceased using LIBOR and ICE swap rates in new contracts and began issuing SOFR based loans in December 2021.
The Company had $6.6 billion in variable rate loans as of December 31, 2023. Of these loans, $4.2 billion have an interest rate floor and nearly all of those loans were at or above the floor. Variable rate loans include $2.8 billion indexed to the prime rate, $2.7 billion are indexed to SOFR, $294.8 million indexed to LIBOR, and $813.3 million indexed to other rates.
Changes in interest rates will also have an effect on noninterest expense. Certain deposit accounts receive an earnings credit that provides a reimbursement for costs clients incur on the accounts. As interest rates increase, the amount available for reimbursement also increases, resulting in an increase to noninterest expense. Conversely, a decrease in interest rates would reduce the amount available for reimbursement and decrease noninterest expense.
Critical Accounting Policies and Estimates
The following accounting policies are considered most critical to the understanding of the Company’s financial condition and results of operations. These critical accounting policies require management’s most difficult, subjective and complex judgments about matters that are inherently uncertain. Because these estimates and judgments are based on current circumstances, they may change over time or prove to be inaccurate based on experience. In the event different assumptions or conditions were to prevail, and depending upon the severity of such changes, the possibility of a materially different financial condition and/or results of operations could reasonably be expected. The impact and any associated risks related to our critical accounting policies on our business operations are described throughout “Management’s Discussion and Analysis of Financial Condition and Results of Operations,” where such policies affect our reported and expected financial results. For a detailed
53
discussion on the application of these and other accounting policies, see “Item 8. Note 1 – Summary of Significant Accounting Policies.”
The Company has prepared all of the consolidated financial information in this report in accordance with GAAP. The Company makes estimates and assumptions that affect the reported amount of assets and liabilities, disclosure of contingent assets and liabilities at the date of the consolidated financial statements, and the reported amounts of revenue and expenses during the reporting period. These estimates and assumptions are based on management’s best estimates and judgment. Management evaluates its estimates and assumptions on an ongoing basis using loss experience and other factors, including the current economic environment, which management believes to be reasonable under the circumstances. We adjust such estimates and assumptions when facts and circumstances dictate. As future events and their effects cannot be determined with precision, actual results could differ significantly from these estimates. Changes in estimates resulting from continuing changes in the economic environment will be reflected in the financial statements in future periods. There can be no assurances that actual results will not differ from those estimates.
Allowance for Credit Losses
The Company maintains separate allowances for funded loans, unfunded loans, and held-to-maturity securities, collectively referred to the ACL. The ACL is a valuation account to adjust the cost basis to the amount expected to be collected, based on management’s experience, current conditions, and reasonable and supportable forecasts. For purposes of determining the allowance for funded and unfunded loans, the portfolios are segregated into pools that share similar risk characteristics that are then further segregated by credit grades. Loans that do not share similar risk characteristics are evaluated on an individual basis and are not included in the collective evaluation. The Company estimates the amount of the allowance based on loan loss experience, adjusted for current and forecasted economic conditions, including unemployment, changes in GDP, and commercial and residential real estate prices. The Company’s forecast of economic conditions uses internal and external information and considers a weighted average of a baseline, upside, and downside scenarios. Because economic conditions can change and are difficult to predict, the anticipated amount of estimated loan defaults and losses, and therefore the adequacy of the allowance, could change significantly and have a direct impact on the Company’s credit costs. The Company’s allowance for credit losses on loans was $134.8 million at December 31, 2023 based on the weighting of the different economic scenarios. As a hypothetical example, if the Company had only used the upside scenario, the allowance would have decreased $27.5 million. Conversely, the allowance would have increased $43.9 million using only the downside scenario.
Income Taxes
Management uses certain assumptions and estimates in determining income taxes payable or refundable for the current year, deferred income tax assets and liabilities and income tax expense. Deferred tax assets and liabilities are recognized for the future tax consequences attributable to differences between the financial statement carrying amounts of existing assets and liabilities and their respective tax basis. Deferred tax assets and liabilities are measured using enacted tax rates expected to apply to taxable income in the years in which those temporary differences are expected to be recovered or settled. If current available information raises doubt as to the realization of the deferred tax assets, a valuation allowance may be established. We consider the determination of this valuation allowance to be a critical accounting policy because of the need to exercise significant judgment in evaluating the amount and timing of recognition of deferred tax liabilities and assets, including projections of future taxable income. These judgments and estimates are reviewed on a continual basis as regulatory and business factors change. A valuation allowance for deferred tax assets may be required in the future if the amounts of taxes recoverable through loss carry backs decline, if we project lower levels of future taxable income, or we project lower levels of tax planning strategies. Such valuation allowance would be established through a charge to income tax expense that would adversely affect our operating results.
Effects of New Accounting Pronouncements
See “Item 8. Note 1 – Summary of Significant Accounting Policies – Recent Accounting Pronouncements” for information on recent accounting pronouncements and their impact, if any, on our consolidated financial statements.
54
Use of Non-GAAP Financial Measures
The Company’s accounting and reporting policies conform to U.S. GAAP and the prevailing practices in the banking industry. However, the Company provides other financial measures, such as core efficiency ratio, tangible common equity ratio, return on average tangible common equity, and tangible book value per common share, in this report that are considered “non-GAAP financial measures.” Generally, a non-GAAP financial measure is a numerical measure of a company’s financial performance, financial position, or cash flows that exclude (or include) amounts that are included in (or excluded from) the most directly comparable measure calculated and presented in accordance with GAAP.
The Company considers its core efficiency ratio, tangible common equity ratio, return on average tangible common equity, and tangible book value per common share, collectively “core performance measures,” presented in this earnings release and the included tables as important measures of financial performance, even though they are non-GAAP measures, as they provide supplemental information by which to evaluate the impact of certain non-comparable items, and the Company’s operating performance on an ongoing basis. Core performance measures exclude certain other income and expense items, such as the FDIC special assessment, merger-related expenses, facilities charges, and the gain or loss on sale of investment securities, that the Company believes to be not indicative of or useful to measure the Company’s operating performance on an ongoing basis. The attached tables contain a reconciliation of these core performance measures to the GAAP measures. The Company believes that the tangible common equity ratio provides useful information to investors about the Company’s capital strength even though it is considered to be a non-GAAP financial measure and is not part of the regulatory capital requirements to which the Company is subject.
The Company believes these non-GAAP measures and ratios, when taken together with the corresponding GAAP measures and ratios, provide meaningful supplemental information regarding the Company’s performance and capital strength. The Company’s management uses, and believes investors benefit from referring to, these non-GAAP measures and ratios in assessing the Company’s operating results and related trends and when forecasting future periods. However, these non-GAAP measures and ratios should be considered in addition to, and not as a substitute for or preferable to, ratios prepared in accordance with GAAP. The Company has provided a reconciliation of, where applicable, the most comparable GAAP financial measures and ratios to the non-GAAP financial measures and ratios, or a reconciliation of the non-GAAP calculation of the financial measure for the periods indicated.
55
Reconciliations of Non-GAAP Financial Measures
Core Efficiency Ratio
| For the Years ended December 31, | |||||||||||||||||
| ($ in thousands) | 2023 | 2022 | 2021 | ||||||||||||||
| Net interest income (GAAP) | $ | 562,592 | $ | 473,903 | $ | 360,194 | |||||||||||
| Tax-equivalent adjustment | 8,079 | 7,042 | 5,151 | ||||||||||||||
| Net interest income - FTE (non-GAAP) | 570,671 | 480,945 | 365,345 | ||||||||||||||
| Noninterest income (GAAP) | 68,725 | 59,162 | 67,743 | ||||||||||||||
| Less gain on sale of investment securities | 601 | — | — | ||||||||||||||
| Less gain (loss) on sale of other real estate owned | 187 | (93) | 884 | ||||||||||||||
| Core revenue (non-GAAP) | $ | 638,608 | $ | 540,200 | $ | 432,204 | |||||||||||
| Noninterest expense (GAAP) | $ | 348,186 | $ | 274,216 | $ | 245,919 | |||||||||||
| Less amortization on intangibles | 4,601 | 5,367 | 5,691 | ||||||||||||||
| Less branch closure expenses | — | — | 3,441 | ||||||||||||||
| Less merger-related expenses | — | — | 22,082 | ||||||||||||||
| Less FDIC special assessment | 2,412 | — | — | ||||||||||||||
| Core noninterest expense (non-GAAP) | $ | 341,173 | $ | 268,849 | $ | 214,705 | |||||||||||
| Core efficiency ratio (non-GAAP) | 53.42 | % | 49.77 | % | 49.68 | % | |||||||||||
Tangible Common Equity, Tangible Book Value per Share, and Tangible Common Equity Ratio
| Period ended December 31, | |||||||||||||||||
| ($ and shares in thousands, except per share data) | 2023 | 2022 | 2021 | ||||||||||||||
| Shareholders' equity (GAAP) | $ | 1,716,068 | $ | 1,522,263 | $ | 1,529,116 | |||||||||||
| Less preferred stock | 71,988 | 71,988 | 71,988 | ||||||||||||||
| Less goodwill | 365,164 | 365,164 | 365,164 | ||||||||||||||
| Less intangible assets | 12,318 | 16,919 | 22,286 | ||||||||||||||
| Tangible common equity (non-GAAP) | $ | 1,266,598 | $ | 1,068,192 | $ | 1,069,678 | |||||||||||
| Common shares outstanding | 37,416 | 37,253 | 37,820 | ||||||||||||||
| Tangible book value per share (non-GAAP) | $ | 33.85 | $ | 28.67 | $ | 28.28 | |||||||||||
| Total assets (GAAP) | $ | 14,518,590 | $ | 13,054,172 | $ | 13,537,358 | |||||||||||
| Less goodwill | 365,164 | 365,164 | 365,164 | ||||||||||||||
| Less intangible assets | 12,318 | 16,919 | 22,286 | ||||||||||||||
| Tangible assets (non-GAAP) | $ | 14,141,108 | $ | 12,672,089 | $ | 13,149,908 | |||||||||||
| Tangible common equity to tangible assets (non-GAAP) | 8.96 | % | 8.43 | % | 8.13 | % | |||||||||||
56
Return on Average Tangible Common Equity (ROATCE)
| For the Years ended December 31, | |||||||||||||||||
| ($ in thousands) | 2023 | 2022 | 2021 | ||||||||||||||
| Average shareholder’s equity (GAAP) | $ | 1,623,121 | $ | 1,498,759 | $ | 1,277,153 | |||||||||||
| Less average preferred stock | 71,988 | 71,988 | 8,903 | ||||||||||||||
| Less average goodwill | 365,164 | 365,164 | 307,614 | ||||||||||||||
| Less average intangible assets | 14,531 | 19,516 | 22,460 | ||||||||||||||
| Average tangible common equity (non-GAAP) | $ | 1,171,438 | $ | 1,042,091 | $ | 938,176 | |||||||||||
| Net income available to common shareholders (GAAP) | $ | 190,309 | $ | 199,002 | $ | 133,055 | |||||||||||
| FDIC special assessment (after tax) | 1,814 | — | — | ||||||||||||||
| Net income available to common shareholders adjusted (non-GAAP) | $ | 192,123 | $ | 199,002 | $ | 133,055 | |||||||||||
| Return on average tangible common equity adjusted for FDIC assessment (non-GAAP) | 16.40 | % | 19.10 | % | 14.18 | % | |||||||||||
| Return on average common equity (GAAP) | 12.27 | % | 13.95 | % | 10.49 | % | |||||||||||
| Return on average common equity adjusted for FDIC assessment (non-GAAP) | 12.39 | % | 13.95 | % | 10.49 | % | |||||||||||
Pre-Provision Net Revenue (PPNR) and Pre-Provision Net Revenue Return on Average Assets (PPNR ROAA)
| For the Years ended December 31, | |||||||||||||||||
| ($ in thousands) | 2023 | 2022 | 2021 | ||||||||||||||
| Net interest income | $ | 562,592 | $ | 473,903 | $ | 360,194 | |||||||||||
| Noninterest income | 68,725 | 59,162 | 67,743 | ||||||||||||||
| FDIC special assessment | 2,412 | — | — | ||||||||||||||
| Less gain on sale of investment securities | 601 | — | — | ||||||||||||||
| Less gain (loss) on sale of other real estate owned | 187 | (93) | 884 | ||||||||||||||
| Less noninterest expense | 348,186 | 274,216 | 245,919 | ||||||||||||||
| PPNR (non-GAAP) | $ | 284,755 | $ | 258,942 | $ | 181,134 | |||||||||||
| Average assets | $ | 13,805,236 | $ | 13,319,624 | $ | 11,467,310 | |||||||||||
| PPNR ROAA (non-GAAP) | 2.06 | % | 1.94 | % | 1.58 | % | |||||||||||
Return on Average Assets (ROAA)
| For the Years ended December 31, | |||||||||||||||||
| ($ in thousands) | 2023 | 2022 | 2021 | ||||||||||||||
| Net income (GAAP) | $ | 194,059 | $ | 203,043 | $ | 133,055 | |||||||||||
| FDIC special assessment (after tax) | 1,814 | — | — | ||||||||||||||
| Net income adjusted (non-GAAP) | 195,873 | 203,043 | 133,055 | ||||||||||||||
| Average assets | $ | 13,805,236 | $ | 13,319,624 | $ | 11,467,310 | |||||||||||
| ROAA (GAAP) | 1.41 | % | 1.52 | % | 1.16 | % | |||||||||||
| ROAA adjusted for FDIC special assessment (non-GAAP) | 1.42 | % | 1.52 | % | 1.16 | % | |||||||||||
ITEM 7A: QUANTITATIVE AND QUALITATIVE DISCLOSURES ABOUT MARKET RISK
Please refer to “Risk Factors” included in Item 1A and “Risk Management” and “Interest Rate Risk” included in Management’s Discussion and Analysis under Item 7.
57
ITEM 8: FINANCIAL STATEMENTS AND SUPPLEMENTARY DATA
Enterprise Financial Services Corp and Subsidiaries
| Page Number | |||||
Report of Independent Registered Public Accounting Firm, PCAOB ID | |||||
Consolidated Balance Sheets at December 31, 2023 and 2022 | |||||
Consolidated Statements of Income for the years ended December 31, 2023, 2022, and 2021 | |||||
Consolidated Statements of Comprehensive Income for the years ended December 31, 2023, 2022, and 2021 | |||||
Consolidated Statements of Shareholders’ Equity for the years ended December 31, 2023, 2022, and 2021 | |||||
Consolidated Statements of Cash Flows for the years ended December 31, 2023, 2022, and 2021 | |||||
| Notes to Consolidated Financial Statements | |||||
58
REPORT OF INDEPENDENT REGISTERED PUBLIC ACCOUNTING FIRM
To the shareholders and Board of Directors of Enterprise Financial Services Corp
Opinion on the Consolidated Financial Statements
We have audited the accompanying consolidated balance sheets of Enterprise Financial Services Corp and subsidiaries (the "Company") as of December 31, 2023 and 2022, the related consolidated statements of income, comprehensive income, shareholders’ equity, and cash flows, for each of the three years in the period ended December 31, 2023, and the related notes (collectively referred to as the "financial statements"). In our opinion, the financial statements present fairly, in all material respects, the financial position of the Company as of December 31, 2023 and 2022, and the results of its operations and its cash flows for each of the three years in the period ended December 31, 2023, in conformity with accounting principles generally accepted in the United States of America.
We have also audited, in accordance with the standards of the Public Company Accounting Oversight Board (United States) (PCAOB), the Company's internal control over financial reporting as of December 31, 2023, based on criteria established in Internal Control — Integrated Framework (2013) issued by the Committee of Sponsoring Organizations of the Treadway Commission and our report dated February 26, 2024, expressed an unqualified opinion on the Company's internal control over financial reporting.
Basis for Opinion
These financial statements are the responsibility of the Company's management. Our responsibility is to express an opinion on the Company's financial statements based on our audits. We are a public accounting firm registered with the PCAOB and are required to be independent with respect to the Company in accordance with the U.S. federal securities laws and the applicable rules and regulations of the Securities and Exchange Commission and the PCAOB.
We conducted our audits in accordance with the standards of the PCAOB. Those standards require that we plan and perform the audit to obtain reasonable assurance about whether the financial statements are free of material misstatement, whether due to error or fraud. Our audits included performing procedures to assess the risks of material misstatement of the financial statements, whether due to error or fraud, and performing procedures that respond to those risks. Such procedures included examining, on a test basis, evidence regarding the amounts and disclosures in the financial statements. Our audits also included evaluating the accounting principles used and significant estimates made by management, as well as evaluating the overall presentation of the financial statements. We believe that our audits provide a reasonable basis for our opinion.
Critical Audit Matter
The critical audit matter communicated below is a matter arising from the current-period audit of the financial statements that was communicated or required to be communicated to the audit committee and that (1) relates to accounts or disclosures that are material to the financial statements and (2) involved our especially challenging, subjective, or complex judgments. The communication of critical audit matters does not alter in any way our opinion on the financial statements, taken as a whole, and we are not, by communicating the critical audit matter below, providing a separate opinion on the critical audit matter or on the accounts or disclosures to which it relates.
Allowance for Credit Losses on Loans — Refer to Note 1 to the financial statements
Critical Audit Matter Description
The Company utilizes a discounted cash flow (“DCF”) method to measure the Allowance for Credit Losses (“ACL”) on loans collectively evaluated that are sub-segmented by credit risk levels. The DCF method incorporates assumptions for probability of default, loss given default, prepayments and curtailments over the contractual term of the loans. In determining the probability of default, the Company utilized a regression analysis to determine certain economic factors that are relevant loss drivers in the portfolio segments based on historical or peer evaluations. Additionally, the Company applies qualitative adjustments to address risks not directly captured in the quantitative
59
reserve; including to address macroeconomic uncertainty by weighting the forecasted baseline, upside, and downside economic factors.
We identified the ACL on loans as a critical audit matter because of the complexity of the Company’s model and the significant assumptions used by management. Auditing the ACL on loans required a high degree of auditor judgment and an increased extent of effort, including the need to involve credit specialists when performing audit procedures to evaluate the reasonableness of management’s models and assumptions.
How the Critical Audit Matter Was Addressed in the Audit
Our audit procedures related to the Company’s ACL on loans included the following, among others:
•We tested the design and operating effectiveness of management’s controls covering the key data, assumptions and judgments impacting the ACL on loans.
•We evaluated the appropriateness of the Company’s accounting policies, methodologies, and elections involved in determining the ACL on loans.
•We involved credit specialists to assist us in evaluating the Company’s development of the ACL model, including the selection of and calibration to economic factors.
•We assessed the reasonableness of the Company’s qualitative methodology, tested key calculations utilized within the qualitative estimate, and agreed underlying data within the calculation to source documents.
/s/ Deloitte & Touche LLP
February 26, 2024
We have served as the Company’s auditor since 2010.
60
REPORT OF INDEPENDENT REGISTERED PUBLIC ACCOUNTING FIRM
To the shareholders and Board of Directors of Enterprise Financial Services Corp
Opinion on Internal Control over Financial Reporting
We have audited the internal control over financial reporting of Enterprise Financial Services Corp and subsidiaries (the “Company”) as of December 31, 2023, based on criteria established in Internal Control — Integrated Framework (2013) issued by the Committee of Sponsoring Organizations of the Treadway Commission (COSO). In our opinion, the Company maintained, in all material respects, effective internal control over financial reporting as of December 31, 2023, based on criteria established in Internal Control — Integrated Framework (2013) issued by COSO.
We have also audited, in accordance with the standards of the Public Company Accounting Oversight Board (United States) (PCAOB), the consolidated financial statements as of and for the year ended December 31, 2023, of the Company and our report dated February 26, 2024, expressed an unqualified opinion on those financial statements.
Basis for Opinion
The Company’s management is responsible for maintaining effective internal control over financial reporting and for its assessment of the effectiveness of internal control over financial reporting, included in the accompanying Management’s Assessment of Internal Control over Financial Reporting. Our responsibility is to express an opinion on the Company’s internal control over financial reporting based on our audit. We are a public accounting firm registered with the PCAOB and are required to be independent with respect to the Company in accordance with the U.S. federal securities laws and the applicable rules and regulations of the Securities and Exchange Commission and the PCAOB.
We conducted our audit in accordance with the standards of the PCAOB. Those standards require that we plan and perform the audit to obtain reasonable assurance about whether effective internal control over financial reporting was maintained in all material respects. Our audit included obtaining an understanding of internal control over financial reporting, assessing the risk that a material weakness exists, testing and evaluating the design and operating effectiveness of internal control based on the assessed risk, and performing such other procedures as we considered necessary in the circumstances. We believe that our audit provides a reasonable basis for our opinion.
Definition and Limitations of Internal Control over Financial Reporting
A company’s internal control over financial reporting is a process designed to provide reasonable assurance regarding the reliability of financial reporting and the preparation of financial statements for external purposes in accordance with generally accepted accounting principles. A company’s internal control over financial reporting includes those policies and procedures that (1) pertain to the maintenance of records that, in reasonable detail, accurately and fairly reflect the transactions and dispositions of the assets of the company; (2) provide reasonable assurance that transactions are recorded as necessary to permit preparation of financial statements in accordance with generally accepted accounting principles, and that receipts and expenditures of the company are being made only in accordance with authorizations of management and directors of the company; and (3) provide reasonable assurance regarding prevention or timely detection of unauthorized acquisition, use, or disposition of the company’s assets that could have a material effect on the financial statements.
Because of its inherent limitations, internal control over financial reporting may not prevent or detect misstatements. Also, projections of any evaluation of effectiveness to future periods are subject to the risk that controls may become inadequate because of changes in conditions, or that the degree of compliance with the policies or procedures may deteriorate.
/s/ Deloitte & Touche LLP
St. Louis, Missouri
February 26, 2024
61
ENTERPRISE FINANCIAL SERVICES CORP AND SUBSIDIARIES
Consolidated Balance Sheets
As of December 31, 2023 and 2022
| December 31, | |||||||||||
| ($ in thousands, except per share data) | 2023 | 2022 | |||||||||
| Assets | |||||||||||
| Cash and due from banks | $ | $ | |||||||||
| Federal funds sold | |||||||||||
| Interest-earning deposits | |||||||||||
| Total cash and cash equivalents | |||||||||||
| Interest-earning deposits greater than 90 days | |||||||||||
| Securities available-for-sale | |||||||||||
| Securities held-to-maturity, net | |||||||||||
| Loans held-for-sale | |||||||||||
| Loans | |||||||||||
| Allowance for credit losses on loans | ( | ( | |||||||||
| Total loans, net | |||||||||||
| Other investments | |||||||||||
| Fixed assets, net | |||||||||||
| Goodwill | |||||||||||
| Intangible assets, net | |||||||||||
| Other assets | |||||||||||
| Total assets | $ | $ | |||||||||
| Liabilities and Shareholders' equity | |||||||||||
| Noninterest-bearing demand accounts | $ | $ | |||||||||
| Interest-bearing demand accounts | |||||||||||
| Money market accounts | |||||||||||
| Savings accounts | |||||||||||
| Certificates of deposit: | |||||||||||
| Brokered | |||||||||||
| Customer | |||||||||||
| Total deposits | |||||||||||
| Subordinated debentures and notes | |||||||||||
| FHLB advances | |||||||||||
| Other borrowings | |||||||||||
| Other liabilities | |||||||||||
| Total liabilities | |||||||||||
| Commitments and contingent liabilities (Note 17) | |||||||||||
| Shareholders' equity: | |||||||||||
Preferred stock, $ | |||||||||||
Common stock, $ | |||||||||||
| Additional paid-in capital | |||||||||||
| Retained earnings | |||||||||||
| Accumulated other comprehensive loss, net | ( | ( | |||||||||
| Total shareholders' equity | |||||||||||
| Total liabilities and shareholders' equity | $ | $ | |||||||||
The accompanying notes are an integral part of these Consolidated Financial Statements.
62
ENTERPRISE FINANCIAL SERVICES CORP AND SUBSIDIARIES
Consolidated Statements of Income
Years ended December 31, 2023, 2022, and 2021
| Year ended December 31, | |||||||||||||||||
| ($ in thousands, except per share data) | 2023 | 2022 | 2021 | ||||||||||||||
| Interest income: | |||||||||||||||||
| Loans | $ | $ | $ | ||||||||||||||
| Debt securities: | |||||||||||||||||
| Taxable | |||||||||||||||||
| Nontaxable | |||||||||||||||||
| Interest-earning deposits | |||||||||||||||||
| Dividends on equity securities | |||||||||||||||||
| Total interest income | |||||||||||||||||
| Interest expense: | |||||||||||||||||
| Deposits | |||||||||||||||||
| Subordinated debentures and notes | |||||||||||||||||
| FHLB advances | |||||||||||||||||
| Other borrowings | |||||||||||||||||
| Total interest expense | |||||||||||||||||
| Net interest income | |||||||||||||||||
| Provision (benefit) for credit losses | ( | ||||||||||||||||
| Net interest income after provision (benefit) for credit losses | |||||||||||||||||
| Noninterest income: | |||||||||||||||||
| Deposit service charges | |||||||||||||||||
| Wealth management revenue | |||||||||||||||||
| Card services revenue | |||||||||||||||||
| Tax credit income | |||||||||||||||||
| Other income | |||||||||||||||||
| Total noninterest income | |||||||||||||||||
| Noninterest expense: | |||||||||||||||||
| Employee compensation and benefits | |||||||||||||||||
| Deposit costs | |||||||||||||||||
| Occupancy | |||||||||||||||||
| Data processing | |||||||||||||||||
| Professional fees | |||||||||||||||||
| Branch-closure expenses | |||||||||||||||||
| Merger-related expenses | |||||||||||||||||
| Other expense | |||||||||||||||||
| Total noninterest expense | |||||||||||||||||
| Income before income tax expense | |||||||||||||||||
| Income tax expense | |||||||||||||||||
| Net income | $ | $ | $ | ||||||||||||||
| Preferred stock dividends | |||||||||||||||||
| Net income available to common shareholders | $ | $ | $ | ||||||||||||||
| Earnings per common share | |||||||||||||||||
| Basic | $ | $ | $ | ||||||||||||||
| Diluted | |||||||||||||||||
The accompanying notes are an integral part of these Consolidated Financial Statements.
63
ENTERPRISE FINANCIAL SERVICES CORP AND SUBSIDIARIES
Consolidated Statements of Comprehensive Income
Years ended December 31, 2023, 2022, and 2021
| Year ended December 31, | |||||||||||||||||
| ($ in thousands) | 2023 | 2022 | 2021 | ||||||||||||||
| Net income | $ | $ | $ | ||||||||||||||
| Other comprehensive income (loss), net of tax: | |||||||||||||||||
| Change in unrealized gain (loss) on available-for-sale securities | ( | ( | |||||||||||||||
| Reclassification of gain on the sale of available-for-sale securities | ( | ||||||||||||||||
| Reclassification of gain on held-to-maturity securities | ( | ( | ( | ||||||||||||||
| Change in unrealized gain (loss) on cash flow hedges | ( | ||||||||||||||||
| Reclassification of loss on cash flow hedges | |||||||||||||||||
| Total other comprehensive income (loss), net | ( | ( | |||||||||||||||
| Total comprehensive income | $ | $ | $ | ||||||||||||||
The accompanying notes are an integral part of these Consolidated Financial Statements.
64
ENTERPRISE FINANCIAL SERVICES CORP AND SUBSIDIARIES
Consolidated Statements of Shareholders’ Equity
Years ended December 31, 2023, 2022, and 2021
| Preferred | Common | |||||||||||||||||||||||||||||||||||||||||||||||||||||||
| (in thousands, except per share data) | Shares | Amount | Shares | Amount | Treasury Stock | Additional Paid-in Capital | Retained Earnings | Accumulated Other Comprehensive Income (Loss) | Total Shareholders' Equity | |||||||||||||||||||||||||||||||||||||||||||||||
| Balance December 31, 2020 | $ | $ | $ | ( | $ | $ | $ | $ | ||||||||||||||||||||||||||||||||||||||||||||||||
| Net income | — | $ | — | — | $ | — | $ | — | $ | — | $ | $ | — | $ | ||||||||||||||||||||||||||||||||||||||||||
| Other comprehensive loss | — | — | — | — | — | — | — | ( | ( | |||||||||||||||||||||||||||||||||||||||||||||||
Common stock dividends ($ | — | — | — | — | — | — | ( | — | ( | |||||||||||||||||||||||||||||||||||||||||||||||
| Repurchase of common stock | — | — | ( | ( | — | ( | ( | — | ( | |||||||||||||||||||||||||||||||||||||||||||||||
| Issuance under equity compensation plans, net | — | — | — | — | ( | — | ||||||||||||||||||||||||||||||||||||||||||||||||||
Shares issued in connection with acquisition of First Choice Bancorp, net (gross issuance | — | — | — | ( | — | |||||||||||||||||||||||||||||||||||||||||||||||||||
Preferred stock issuance, net of $ | — | — | — | — | — | — | ||||||||||||||||||||||||||||||||||||||||||||||||||
| Share-based compensation | — | — | — | — | — | — | — | |||||||||||||||||||||||||||||||||||||||||||||||||
| Balance December 31, 2021 | $ | $ | $ | ( | $ | $ | $ | $ | ||||||||||||||||||||||||||||||||||||||||||||||||
| Net income | — | $ | — | — | $ | — | $ | — | $ | — | $ | $ | — | $ | ||||||||||||||||||||||||||||||||||||||||||
| Other comprehensive loss | — | — | — | — | — | — | — | ( | ( | |||||||||||||||||||||||||||||||||||||||||||||||
Common stock dividends ($ | — | — | — | — | — | — | ( | — | ( | |||||||||||||||||||||||||||||||||||||||||||||||
Preferred stock dividends ($ | — | — | — | — | — | — | ( | — | ( | |||||||||||||||||||||||||||||||||||||||||||||||
| Repurchase of common stock | — | — | ( | ( | — | ( | ( | — | ( | |||||||||||||||||||||||||||||||||||||||||||||||
| Issuance under equity compensation plans, net | — | — | — | ( | — | |||||||||||||||||||||||||||||||||||||||||||||||||||
| Share-based compensation | — | — | — | — | — | — | — | |||||||||||||||||||||||||||||||||||||||||||||||||
Retirement of treasury stock ( | — | — | — | ( | ( | ( | — | — | ||||||||||||||||||||||||||||||||||||||||||||||||
| Balance December 31, 2022 | $ | $ | $ | $ | $ | $ | ( | $ | ||||||||||||||||||||||||||||||||||||||||||||||||
| Net income | — | $ | — | — | $ | — | $ | — | $ | — | $ | $ | — | $ | ||||||||||||||||||||||||||||||||||||||||||
| Other comprehensive income | — | — | — | — | — | — | — | |||||||||||||||||||||||||||||||||||||||||||||||||
Common stock dividends ($ | — | — | — | — | — | — | ( | — | ( | |||||||||||||||||||||||||||||||||||||||||||||||
Preferred stock dividends ($ | — | — | — | — | — | — | ( | — | ( | |||||||||||||||||||||||||||||||||||||||||||||||
| Issuance under equity compensation plans, net | — | — | — | ( | — | |||||||||||||||||||||||||||||||||||||||||||||||||||
| Share-based compensation | — | — | — | — | — | — | — | |||||||||||||||||||||||||||||||||||||||||||||||||
| Balance December 31, 2023 | $ | $ | $ | $ | $ | $ | ( | $ | ||||||||||||||||||||||||||||||||||||||||||||||||
The accompanying notes are an integral part of these Consolidated Financial Statements.
65
ENTERPRISE FINANCIAL SERVICES CORP AND SUBSIDIARIES
Consolidated Statements of Cash Flows
Years ended December 31, 2023, 2022, and 2021
| Year ended December 31, | |||||||||||||||||
| ($ in thousands) | 2023 | 2022 | 2021 | ||||||||||||||
| Cash flows from operating activities: | |||||||||||||||||
| Net income | $ | $ | $ | ||||||||||||||
| Adjustments to reconcile net income to net cash provided by operating activities: | |||||||||||||||||
| Depreciation | |||||||||||||||||
| Provision (benefit) for credit losses | ( | ||||||||||||||||
| Deferred income taxes | |||||||||||||||||
| Net amortization of debt securities | |||||||||||||||||
| Net amortization (accretion) on loans | ( | ||||||||||||||||
| Amortization of intangible assets | |||||||||||||||||
| Amortization of servicing assets | |||||||||||||||||
| Mortgage loans originated-for-sale | ( | ( | ( | ||||||||||||||
| Proceeds from mortgage loans sold | |||||||||||||||||
| Loss (gain) on: | |||||||||||||||||
| Investment securities | ( | ||||||||||||||||
| Loans sold | ( | ||||||||||||||||
| Other real estate | ( | ( | |||||||||||||||
| Fixed assets | ( | ( | |||||||||||||||
| State tax credits | ( | ( | ( | ||||||||||||||
| Asset impairment | |||||||||||||||||
| Share-based compensation | |||||||||||||||||
| Changes in other assets and liabilities, net | ( | ( | |||||||||||||||
Net cash provided by operating activities | |||||||||||||||||
| Cash flows from investing activities: | |||||||||||||||||
| Proceeds from acquisitions, net | |||||||||||||||||
| Net (increase) decrease in loans | ( | ( | |||||||||||||||
| Proceeds received from: | |||||||||||||||||
| Sale of debt securities, available-for-sale | |||||||||||||||||
| Paydown or maturity of debt securities, available-for-sale | |||||||||||||||||
| Paydown or maturity of debt securities, held-to-maturity | |||||||||||||||||
| Redemption of other investments | |||||||||||||||||
| Sale of loans | |||||||||||||||||
| Sale of state tax credits held-for-sale | |||||||||||||||||
| Sale of other real estate | |||||||||||||||||
| Sale of fixed assets | |||||||||||||||||
| Settlement of bank-owned life insurance policies | |||||||||||||||||
| Payments for the purchase of: | |||||||||||||||||
| Available-for-sale debt securities | ( | ( | ( | ||||||||||||||
| Held-to-maturity debt securities | ( | ( | |||||||||||||||
| Other investments | ( | ( | ( | ||||||||||||||
| State tax credits held-for-sale | ( | ( | ( | ||||||||||||||
| Fixed assets | ( | ( | ( | ||||||||||||||
Net cash used in investing activities | ( | ( | ( | ||||||||||||||
66
| Year ended December 31, | |||||||||||||||||
| ($ in thousands) | 2023 | 2022 | 2021 | ||||||||||||||
| Cash flows from financing activities: | |||||||||||||||||
| Net (decrease) increase in noninterest-bearing deposit accounts | $ | ( | $ | $ | |||||||||||||
| Net (decrease) increase in interest-bearing deposit accounts | ( | ||||||||||||||||
| Payments for the redemption of subordinated notes | ( | ||||||||||||||||
| Net increase (decrease) in short term FHLB advances, net | ( | ( | |||||||||||||||
| Repayments of long-term FHLB advances | ( | ||||||||||||||||
| Repayments of notes payable | ( | ( | ( | ||||||||||||||
| Net (decrease) increase in other borrowings | ( | ( | |||||||||||||||
| Dividends paid on common stock | ( | ( | ( | ||||||||||||||
| Repurchase of common stock | ( | ( | |||||||||||||||
| Dividends paid on preferred stock | ( | ( | |||||||||||||||
| Proceeds from issuance of preferred stock, net | |||||||||||||||||
| Other, net | |||||||||||||||||
Net cash provided by (used in) financing activities | ( | ||||||||||||||||
| Net (decrease) increase in cash and cash equivalents | ( | ||||||||||||||||
| Cash and cash equivalents, beginning of period | |||||||||||||||||
| Cash and cash equivalents, end of period | $ | $ | $ | ||||||||||||||
| Supplemental disclosures of cash flow information: | |||||||||||||||||
| Cash paid during the period for: | |||||||||||||||||
| Interest | $ | $ | $ | ||||||||||||||
| Income taxes | |||||||||||||||||
| Noncash investing and financing transactions: | |||||||||||||||||
| Transfer to other real estate and repossessed assets owned in settlement of loans | $ | $ | $ | ||||||||||||||
| Sales of other real estate financed | |||||||||||||||||
| Transfer of securities from available-for-sale to held-to-maturity | |||||||||||||||||
| Transfer to loans from fixed assets for building sale and leaseback | |||||||||||||||||
| Right-of-use assets obtained in exchange for lease obligations | |||||||||||||||||
| Leasehold improvement allowance in other assets | |||||||||||||||||
| Common shares issued in connection with acquisitions | |||||||||||||||||
The accompanying notes are an integral part of these Consolidated Financial Statements.
67
ENTERPRISE FINANCIAL SERVICES CORP AND SUBSIDIARIES
Notes to Consolidated Financial Statements
NOTE 1 - SUMMARY OF SIGNIFICANT ACCOUNTING POLICIES
The significant accounting policies used by the Company in the preparation of the consolidated financial statements are summarized below.
Business and Consolidation
Enterprise is a financial holding company that provides a full range of banking and wealth management services to individuals and corporate customers primarily located in Arizona, California, Florida, Kansas, Missouri, Nevada, and New Mexico through its banking subsidiary, Enterprise Bank & Trust. All intercompany accounts and transactions have been eliminated.
Use of Estimates
Cash Flow Information
For purposes of reporting cash flows, the Company considers cash and due from banks, interest-bearing deposits and federal funds sold that mature within 90 days to be cash and cash equivalents. Cash balances include deposits in transit and drafts in the process of collection. The Federal Reserve is authorized to establish reserve requirements on depository institutions. In 2020, the Federal Reserve reduced the reserve requirement to zero percent. As such, cash balances at the Federal Reserve at December 31, 2023 and 2022 were not subject to a reserve requirement.
Recent Accounting Pronouncements
FASB ASU 2021-01, Reference Rate Reform (Topic 848): Scope (ASU 2021-01). ASU 2021-01 was issued in January 2021 and provides optional expedients and exceptions in ASC 848 to contracts, hedging relationships, and other transactions affected by reference rate reform if certain criteria are met. The amendment only applies to contracts, hedging relationships, and other transactions that reference LIBOR or another reference rate expected to be discontinued because of reference rate reform. The expedients and exceptions provided by the amendments will not apply to contract modifications made and hedging relationships entered into or evaluated after December 31, 2022, except for hedging relationships existing as of December 31, 2022, that an entity has elected certain optional expedients for and that are retained through the end of the hedging relationship. The amendments in this update were effective immediately upon issuance and did not have a material effect on the consolidated financial statements. In December 2022, ASU 2022-06 Reference Rate Reform (Topic 848): Deferral of the Sunset date of Topic 848 was issued, which extends the sunset date from December 31, 2022 to December 31, 2024.
FASB ASU 2022-02, Financial Instruments–Credit Losses (Topic 326); Troubled Debt Restructurings and Vintage Disclosures. ASU 2022-02 was issued in March 2022 and eliminates the accounting guidance on troubled
68
debt restructurings for creditors in ASC 310-40 and amends the guidance on “vintage disclosures” to require disclosure of current-period gross write-offs by year of origination. The ASU also updates the requirements related to accounting for credit losses under ASC 326 and adds enhanced disclosures for creditors with respect to loan refinancings and restructurings for borrowers experiencing financial difficulty. The amendments in this update will be effective for fiscal years beginning after December 15, 2022 for entities that have adopted the amendments in ASU 2016-13, Financial Instruments–Credit Losses (Topic 326) Measurement of Credit Losses on Financial Instruments. The adoption of ASU 2022-02 did not have a material effect on the consolidated financial statements.
FASB ASU 2022-03, Fair Value Measurement of Equity Securities Subject to Contractual Sale Restrictions. ASU 2022-03 was issued in June 2022 to (1) clarify the guidance in Topic 820, Fair Value Measurement, when measuring the fair value of an equity security subject to contractual restrictions that prohibit the sale of an equity security, (2) amend a related illustrative example, and (3) introduce new disclosure requirements for equity securities subject to contractual sale restrictions that are measured at fair value in accordance with Topic 820. The amendments in this update are effective for fiscal years beginning after December 15, 2023, and interim periods within those fiscal years. The Company has evaluated the accounting and disclosure requirements of ASU 2022-03 and does not expect them to have a material effect on the consolidated financial statements.
FASB ASU 2023-02, Accounting for Investments in Tax Credit Structures Using the Proportional Amortization Method. ASU 2023-02 was issued in March 2023 to allow reporting entities to consistently account for equity investments made primarily for the purpose of receiving income tax credits and other income tax benefits. If certain conditions are met, a reporting entity may elect to account for its tax equity investments by using the proportional amortization method regardless of the program from which it receives income tax credits, instead of only low-income-housing tax credit (“LIHTC”) structures. This amendment also eliminates certain LIHTC-specific guidance aligning the accounting with other equity investments in tax credit structures. The amendments in this update are effective for fiscal years beginning after December 15, 2023, and interim periods within those fiscal years. The Company is evaluating the accounting and disclosure requirements of ASU 2023-02 and does not expect them to have a material effect on the consolidated financial statements.
FASB ASU 2023-07, Improvements to Reportable Segment Disclosures. ASU 2023-07 was issued in November 2023 to improve reportable segment disclosure requirements, primarily through enhanced disclosures about significant segment disclosures. The amendments in this update require annual and interim disclosures on significant segment expenses that are regularly provided to the chief operating decision maker and require annual and interim disclosures on “other segment items” that comprise the difference between segment revenue less segment expense compared to the reported measure of segment profit or loss. In addition, the amendments will require all annual disclosures that are currently required to be reported on an interim basis and requires disclosure of the title and position of the chief operating decision maker and how that position uses the information to assess segment performance and the allocation of resources. ASU 2023-07 also requires entities that have a single reportable segment, such as the Company, to provide all disclosures required in this update and the existing segment disclosures in Topic 280. The amendments in this update are effective for fiscal years beginning after December 15, 2023, and interim periods within fiscal years beginning after December 15, 2024. The Company is evaluating the accounting and disclosure requirements of ASU 2023-07 and does not expect them to have a material effect on the consolidated financial statements.
FASB ASU 2023-09, Income Tax Disclosures. ASU 2023-09 was issued in December 2023 to require annual disclosures on specific categories in the income tax rate reconciliation and provide additional information for reconciling items that meet a quantitative threshold. Annual disclosures are required on income taxes paid, including the amounts paid for federal, state and foreign taxes and the amount paid in individual jurisdictions if the amount is equal to or greater than 5% of total income taxes paid (net of refunds received). Additional annual disclosures are required on pre-tax income from continuing operations and income tax expense, disaggregated by domestic and foreign amounts. The amendments in this update are effective for fiscal years beginning after December 15, 2024. The Company is evaluating the accounting and disclosure requirements of ASU 2023-09 and does not expect them to have a material effect on the consolidated financial statements.
69
Investments
The Company has classified all investments in debt securities as either available-for-sale or held-to-maturity.
Securities classified as available-for-sale are carried at fair value. Unrealized holding gains and losses for available-for-sale securities are excluded from earnings and reported as a net amount as a separate component of shareholders’ equity until realized. All previous fair value adjustments included in the separate component of shareholders’ equity are reversed upon sale.
Securities classified as held-to-maturity are carried at amortized cost and adjusted for amortization of premiums and accretion of discounts.
An ACL on held-to-maturity securities is deducted from the amortized cost basis of the securities to reflect the expected amount to be collected. When it is determined a security will not be collected, the balance is written-off through the allowance. In evaluating the need for an ACL, securities with similar risk characteristics are grouped and an estimate of expected cash flows is determined using loss experience, adjusted for current and reasonable and supportable forecasts of economic conditions.
For available-for-sale securities in a loss position, the Company evaluates whether the decline in fair value below amortized cost resulted from a credit loss or other factors. Losses attributed to credit are recognized through an ACL on available-for-sale securities, limited to the amount that the fair value of securities is less than the amortized cost basis. In assessing credit loss, the Company considers, among other things, (1) the extent to which fair value is less than the amortized cost basis, (2) adverse conditions specific to the security or industry, (3) historical payment patterns, (4) the likelihood of future payments, and (5) changes to the rating of a security by a rating agency.
The Company has elected to exclude accrued interest receivable balances from the estimate of the ACL as these amounts are timely written off as a credit loss expense. Adjustments to the ACL on held-to-maturity and available-for-sale securities are recognized as a component of the provision for credit losses in the Consolidated Statements of Income.
Premiums and discounts are amortized or accreted over the expected lives of the respective securities as an adjustment to yield using the interest method. Dividend and interest income is recognized when earned. Realized gains and losses are included in earnings and are derived using the specific identification method for determining the cost of securities sold.
Loans Held-for-Sale and Servicing Assets
The Company provides long-term financing of 1-4 family residential real estate by originating fixed and variable rate loans. Long-term fixed and variable rate loans are usually sold into the secondary market with limited recourse. Upon receipt of an application for a real estate loan, the Company determines whether the loan will be sold into the secondary market or retained in the Company’s loan portfolio. The interest rates on the loans sold are locked with the buyer and the Company bears no interest rate risk related to these loans. Mortgage loans held-for-sale are carried at the lower of cost or fair value, which is determined on a specific identification method. The Company does not retain servicing on these loans.
The Company also originates SBA 7(a) loans that generally provide for a guarantee of 75% of the loan, up to a maximum amount. The guaranteed portion of the loan can be sold in an active secondary market. For the years ended December 31, 2023 and 2022, all SBA7(a) loans are considered held-for-investment; however, as the Company makes the determination to sell the loans, they will be moved into the held-for-sale category. Sales of SBA guaranteed loans are executed on a servicing retained basis, and the Company retains the rights and obligations to service the loans. At December 31, 2023, the Company was servicing SBA loans that had been sold and has recorded a related servicing asset of $2.9 million. The servicing asset is accounted for under the amortization method and is evaluated for impairment. Amortization of the servicing asset is recorded as a reduction to servicing income.
70
Gains on the sale of held-for-sale loans are reported net of direct origination fees and costs in the Company’s Consolidated Statements of Income.
Loans
Loans are reported at the principal balance outstanding, net of unearned fees, costs, and premiums or discounts on acquired loans. Loan origination fees, direct origination costs, and premiums or discounts resulting from acquired loans are deferred and recognized over the lives of the related loans as a yield adjustment using the interest method.
Interest on loans is accrued to income based on the principal balance outstanding. The recognition of interest income is discontinued when a loan becomes 90 days past due or a significant deterioration in the borrower’s credit has occurred which, in management’s judgment, negatively impacts the collectibility of the loan. Unpaid interest on such loans is reversed at the time the loan becomes uncollectible and subsequent interest payments received are generally applied to principal if any doubt exists as to the collectibility of such principal. Loans that have not been restructured are returned to accrual status when management believes full collectibility of principal and interest is expected. Non-accrual loans that have been restructured will remain in a non-accrual status until the borrower has made at least six months of consecutive contractual payments.
The Company has elected to present the accrued interest receivable balance separate from amortized cost basis, to exclude accrued interest receivable balances from the tabular disclosures, and not to estimate an ACL on accrued interest receivable as these amounts are timely written off as a credit loss expense.
Accrued interest receivable totaled $66.7 million and $48.1 million at December 31, 2023 and 2022, respectively, and were reported in Other Assets on the consolidated balance sheets.
Acquired Loans
Acquired loans are separated into two categories based on the credit risk characteristics of the underlying borrowers as either PCD, for loans which have experienced more than insignificant credit deterioration since origination, or loans with no credit deterioration (non-PCD). At the date of acquisition, an ACL on PCD loans is determined and added to the amortized cost basis of the individual loans. The difference between the initial amortized cost basis and the par value of the loan is a noncredit discount or premium, which is amortized into interest income over the life of the loan. The ACL on PCD loans is recorded in the acquisition accounting and no provision for credit losses is recognized at the acquisition date. Subsequent changes to the ACL are recorded through provision expense. For non-PCD loans, an ACL is established immediately after the acquisition through a charge to the provision for credit losses.
The ACL for both PCD and non-PCD is determined by pooling loans with similar risk characteristics and using the approach described below under “Allowance for Credit Losses on Loans.”
Non-accrual Loans
Loans are generally placed on non-accrual status when contractually past due 90 days or more as to interest or principal payments. Additionally, whenever management becomes aware of facts or circumstances that may adversely impact the collectability of principal or interest on loans, it is management’s practice to place such loans on non-accrual status immediately, rather than delaying such action until the loans become 90 days past due. Previously accrued and uncollected interest on such loans is reversed. Income is recorded only to the extent a determination has been made that the principal balance of the loan is collectible and the interest payments are subsequently received in cash, or for a restructured loan, the borrower has made six consecutive contractual payments. If collectibility of the principal is in doubt, payments received are applied to loan principal.
Loans past due 90 days or more but still accruing interest are also generally included in nonperforming loans. Loans past due 90 days or more but still accruing are classified as such where the underlying loans are both well secured (the collateral value covers principal and accrued interest) and in the process of collection.
71
Allowance for Credit Losses on Loans
The ACL on loans is a valuation account that is deducted from the amortized cost basis to present the net amount expected to be collected. Loans are charged-off against the allowance when management deems the loan uncollectible.
Management estimates the allowance using relevant available information, from internal and external sources, relating to past events, current conditions, and reasonable and supportable forecasts. Credit loss experience provides the basis for the estimation of expected credit losses. Adjustments to historical loss information are made for differences in current loan-specific risk characteristics such as differences in underwriting standards, portfolio mix, delinquency level, or term as well as for changes in environmental conditions, such as changes in unemployment rates, property values, or other relevant factors.
The ACL on loans is measured on a collective basis when similar risk characteristics exist. The Company has identified the following portfolio segments:
C&I – C&I loans consist of loans to small and medium-sized businesses in a wide variety of industries. These loans are generally collateralized by inventory, accounts receivable, equipment, real estate and other commercial assets, and may be supported by other credit enhancements such as personal guarantees. Risk arises primarily due to a difference between expected and actual cash flows of the borrower. However, the recoverability of these loans is also dependent on other factors primarily dictated by the type of collateral securing these loans. The fair value of the collateral securing these loans may fluctuate as market conditions change. Included within C&I are revolving loans supported by borrowing bases that fluctuate depending on the amount of underlying collateral. A portion of C&I loans consists of sponsor finance, which are loans with senior debt exposure to private equity backed companies.
CRE – CRE loans include various types of loans for which the Company holds real property as collateral. Commercial real estate lending activity is typically restricted to owner-occupied properties or to investor properties that are owned by customers with a current banking relationship. The primary risks of CRE loans include the borrower’s inability to pay, material decreases in the value of the real estate being held as collateral and significant increases in interest rates, which may make the real estate mortgage loan unprofitable. Real estate loans may be more adversely affected by conditions in the real estate markets and in the general economy.
Construction and Land Development – The Company originates loans to finance construction projects including 1-4 family residences, multifamily residences, commercial office, and industrial projects. Construction loans are generally collateralized by first liens on the real estate and have floating interest rates. Construction loans are considered to have higher risks due to construction completion and timing risk, and the ultimate repayment being sensitive to interest rate changes, governmental regulation of real property and the availability of long-term financing. Additionally, economic conditions may impact the Company’s ability to recover its investment in construction loans. Adverse economic conditions may negatively impact the real estate market which could affect the borrowers’ ability to complete and sell the project. Additionally, the fair value of the underlying collateral may fluctuate as market conditions change.
Residential Real Estate – The Company originates loans to finance one- to four-family residences, secured by both first and second liens. Repayment of these loans is dependent on the borrowers’ ability to pay and the fair value of the underlying collateral. Residential loans with a second lien are inherently riskier due to the junior lien position.
Agricultural – Agricultural loans are generally secured with equipment, livestock, crops or other non-real property and at times the underlying real property. Agricultural loans are primarily included as a component of CRE and C&I loans. As of December 31, 2023, the Company has ceased originating new agricultural credit relationships.
Consumer – The Company provides a broad range of consumer loans to customers, including personal lines of credit, credit cards, recreational vehicles, yachts and automobile loans. Repayment of these loans is dependent on the borrowers’ ability to pay and the fair value of the underlying collateral. Consumer loans are included as a component of Other loans.
72
The Company utilizes a DCF method to measure the ACL on loans collectively evaluated that are sub-segmented by credit risk levels. The DCF method incorporates assumptions for probability of default, loss given default, prepayments and curtailments over the contractual term of the loans. In determining the probability of default, the Company utilized regression analysis to determine certain economic factors that are relevant loss drivers in the portfolio segments based on historical or peer evaluations. National unemployment is a loss driver used in all portfolios. The annual percentage change in gross domestic product is used in Construction, Agricultural, and Consumer portfolios. The annual percentage change in a commercial real estate index, national house price index and national retail sales are used in the CRE, Residential Real Estate and C&I portfolios, respectively. The contractual term excludes expected extensions, renewals, and modifications unless the extension or renewal options are included in the original or modified contract at the reporting date and are not unconditionally cancellable by the Company.
The Company uses a one-year reasonable and supportable forecast that considers baseline, upside and downside economic scenarios. For periods beyond the forecast period, the Company reverts to historical loss rates on a straight-line basis over a one-year period.
Loans that do not share risk characteristics are evaluated on an individual basis. Loans evaluated individually are not also included in the collective evaluation. When management determines foreclosure is probable, expected credit losses are based on the fair value of the collateral at the reporting date, adjusted for selling costs. Other individually-evaluated loans may be remeasured using a discounted cash flow method if appropriate. Non-accrual loans, loans past due greater than 90 days and still accruing, unless adequately secured and in the process of collection, and restructured loans are evaluated individually.
Loan Charge-Offs
Other Real Estate and Repossessed Assets
Other real estate represents property acquired through foreclosure or deeded to the Company in lieu of foreclosure on loans on which the borrowers have defaulted on the payment of principal or interest. Other real estate is initially recorded at fair value less cost to sell and subsequently at the lower of cost or fair value less estimated costs to sell. The fair value of other real estate is based upon estimates of future cash flows, market value of similar assets, if available, or independent appraisals. These estimates involve significant uncertainties and judgments. As a result, fair value estimates may not be realizable in a current sale or settlement of the other real estate. Gains, losses and writedowns resulting from the writedown or sale of other real estate are credited or charged to earnings.
Gains and losses resulting from the sale of other real estate are credited or charged to current period earnings. Costs of maintaining and operating other real estate are expensed as incurred, and expenditures to complete or improve other real estate properties are capitalized if the expenditures are expected to be recovered upon ultimate sale of the property.
Repossessed assets represent property, other than real estate, that is acquired through repossession and is initially recorded at estimated fair value on the date of acquisition, less costs to sell. Subsequent to repossession, the assets are carried at the lower of cost or fair value, less estimated costs to sell.
Fixed Assets
Buildings, leasehold improvements, furniture, fixtures, and equipment are stated at cost less accumulated depreciation. All categories are computed using the straight-line method over their respective estimated useful lives. Furniture, fixtures and equipment is depreciated over to ten years and buildings and leasehold improvements over to forty years , based upon estimated lives or lease obligation periods.
73
State Tax Credits
Cash Surrender Value of Life Insurance
The Company has purchased bank-owned life insurance policies on certain bank officers. Bank-owned life insurance is recorded at its cash surrender value. Changes in the cash surrender values, including death benefits in excess of the carrying amount, are included in noninterest income.
Federal Home Loan Bank Stock
Goodwill and Other Intangible Assets
The Company tests goodwill for impairment on an annual basis and whenever events or changes in circumstances indicate the Company may not be able to recover the respective asset’s carrying amount. The Company’s annual test for impairment was performed in the fourth quarter of 2023. Such tests involve the use of estimates and assumptions.
Potential impairments to goodwill must first be identified by performing a qualitative assessment which evaluates relevant events or circumstances to determine whether it is more likely than not that the fair value of a reporting unit is less than its carrying amount. If this test indicates it is more likely than not that goodwill has been impaired, then a quantitative impairment test is completed. The quantitative impairment test calculates the fair value of the reporting unit and compares it with its carrying amount, including goodwill. If the carrying amount of goodwill exceeds its implied fair market value, an impairment loss is recognized. That loss is equal to the carrying amount of goodwill that is in excess of its implied fair market value.
Core deposit intangibles are amortized using an accelerated method over an estimated useful life of approximately 10 years.
Impairment of Long-Lived Assets
Long-lived assets, such as fixed assets and purchased intangibles subject to amortization, are reviewed for impairment whenever events or changes in circumstances indicate the carrying amount of an asset may not be recoverable. Recoverability of assets to be held and used is measured by a comparison of the carrying amount of an asset to estimated undiscounted future cash flows expected to be generated by the asset. If the carrying amount of an asset exceeds its estimated future cash flows, an impairment charge is recognized in the amount by which the carrying amount of the asset exceeds the fair value of the asset. Assets to be disposed of are separately presented in the balance sheet and reported at the lower of the carrying amount or fair value less costs to sell, and are no longer depreciated. The assets and liabilities of a disposal group classified as held-for-sale are presented separately in the appropriate asset and liability sections of the balance sheet.
Derivative Financial Instruments and Hedging Activities
The Company uses derivative financial instruments to assist in managing interest rate sensitivity and to modify the repricing, maturity and option characteristics of certain assets and liabilities. In addition, the Company also offers an interest rate hedge program that includes interest rate swaps to assist its customers in managing their interest rate risk profile. In order to eliminate the interest rate risk associated with offering these products, the Company enters into derivative contracts with third parties to offset the customer contracts. The Company does not enter into derivative financial instruments for trading purposes.
74
Derivative instruments are required to be measured at fair value and recognized as either assets or liabilities in the consolidated financial statements. Fair value represents the payment the Company would receive or pay if the item were sold or bought in a current transaction. The accounting for changes in fair value (gains or losses) of a hedged item is dependent on whether the related derivative is designated and qualifies for “hedge accounting.” The Company assigns derivatives to one of these categories at the purchase date: cash flow hedge, fair value hedge, or non-designated hedges as part of a customer interest-rate swap product. An assessment of the expected and ongoing hedge effectiveness of any derivative designated a fair value hedge or cash flow hedge is performed as required by the applicable accounting standards. Derivatives are included in and in the consolidated balance sheets. The fair value amounts recognized for derivative instruments and the fair value amounts recognized for the right to reclaim or obligation to return cash collateral are not offset when represented under a master netting arrangement. Generally, the only derivative instruments used by the Company have been interest rate swaps, collars, forward currency contracts, and interest rate caps.
Certain derivative financial instruments are not designated as cash flow or as fair value hedges for accounting purposes. These non-designated derivatives are intended to provide interest rate protection on net interest income or noninterest income but do not meet hedge accounting treatment. Customer accommodation interest rate swap contracts are not designated as hedging instruments. Changes in the fair value of these instruments are recorded in interest income or noninterest income in the consolidated statements of income depending on the underlying hedged item.
Income Taxes
The Company and its subsidiaries file a consolidated federal income tax return. Deferred tax assets and liabilities are recognized for the estimated future tax consequences attributable to differences between the financial statement carrying amounts of existing assets and liabilities and their respective tax bases. Deferred tax assets and liabilities are measured using enacted tax rates in effect for the year in which those temporary differences are expected to be recovered or settled. The need for deferred tax asset valuation allowances is based on a more-likely-than-not standard. The ability to realize deferred tax assets depends on the ability to generate sufficient positive taxable income within the carryback or carryforward periods provided for in the laws for each applicable taxing jurisdiction. The following possible sources of taxable income are considered: future reversal patterns of existing taxable temporary differences, future taxable income exclusive of reversing temporary differences, taxable income in prior carryback years and the availability of qualified tax planning strategies. The assessment regarding whether a valuation allowance is required or should be adjusted depends on all available positive and negative factors including, but not limited to, nature, frequency, and severity of recent losses, duration of available carryforward periods, experience with tax attributes expiring unused and near and medium term financial outlook. Because of the complexity of tax laws and regulations, interpretation can be difficult and subject to legal judgment given specific facts and circumstances. It is possible that others, given the same information, may at any point in time reach different reasonable conclusions regarding the estimated amounts of accrued taxes.
Share-Based Compensation
Specialty Deposits
The Company offers specialty deposit accounts to customers in certain industries, primarily community associations, property management, third party escrow, and trust services. These customers will typically receive an earnings credit rate on average collected balances that is used to offset their cost of maintaining the deposit accounts. Earnings credits, otherwise referred to as Deposit costs, are reflected as a component of non-interest expense in the Consolidated Statement of Income.
75
Acquisitions and Divestitures
Acquisitions and business combinations are accounted for using the acquisition method of accounting. The assets and liabilities of the acquired entities have been recorded at their estimated fair values at the date of acquisition. Goodwill represents the excess of the purchase price over the fair value of net assets acquired, including the amount assigned to identifiable intangible assets.
The purchase price allocation process requires an estimation of the fair values of the assets acquired and the liabilities assumed. When a business combination agreement provides for an adjustment to the cost of the combination contingent on future events, the Company includes an estimate of the acquisition-date fair value as part of the cost of the combination. To determine the fair values, the Company relies on third party valuations, such as appraisals, or internal valuations based on discounted cash flow analyses or other valuation techniques. The results of operations of the acquired business are included in the Company’s consolidated financial statements from the date of acquisition. Merger-related expenses include costs directly related to merger or acquisition activity and include legal and professional fees, system consolidation and conversion costs, and compensation costs such as severance and retention incentives for employees impacted by acquisition activity. The Company accounts for merger-related expenses in the periods in which the costs are incurred and the services are received.
For divestitures, the Company measures an asset (disposal group) classified as held-for-sale at the lower of its carrying value at the date the asset is initially classified as held-for-sale or its fair value less costs to sell. The Company reports the results of operations of an entity or group of components that either has been disposed of or held-for-sale as discontinued operations only if the disposal of that component represents a strategic shift that has or will have a major effect on an entity’s operations and financial results.
Any incremental direct costs incurred to transact the sale are allocated against the gain or loss on the sale. These costs include items such as legal fees, title transfer fees, broker fees, etc. Any goodwill and intangible assets associated with the portion of the reporting unit to be disposed of is included in the carrying amount of the business in determining the gain or loss on the sale.
Basic and Diluted Earnings Per Common Share
Consolidated Statement of Comprehensive Income
Share Repurchases
The Company periodically adopts share repurchase plans that authorize open market repurchases of common stock. Shares acquired through the repurchase plan are classified as treasury stock or the shares are immediately retired upon settlement, depending on plan authorization. When shares are retired, the excess of repurchase price over par is allocated between additional paid in capital and retained earnings. The amount allocated to additional paid in capital is limited to the pro rata portion of additional paid in capital at the time of repurchase.
Reclassifications
Certain amounts, including deposit costs and other noninterest expense, reported in prior periods in the “Consolidated Statements of Income,” and “Note 20 – Supplemental Financial Information,” have been reclassified to conform to the current presentation. The reclassifications had no effect on net income or shareholders’ equity.
76
NOTE 2 - EARNINGS PER SHARE
Basic earnings per common share data is calculated by dividing net income available to common shareholders by the weighted average number of common shares outstanding during the period. Diluted earnings per common share gives effect to all dilutive potential common shares outstanding during the period using the treasury stock method.
The following table presents a summary of per common share data and amounts for the periods indicated.
| Year ended December 31, | |||||||||||||||||
| ($ and shares in thousands, except per share data) | 2023 | 2022 | 2021 | ||||||||||||||
| Net income available to common shareholders | $ | $ | $ | ||||||||||||||
| Weighted average common shares outstanding | |||||||||||||||||
| Additional dilutive common stock equivalents | |||||||||||||||||
| Weighted average diluted common shares outstanding | |||||||||||||||||
| Basic earnings per common share | $ | $ | $ | ||||||||||||||
| Diluted earnings per common share | $ | $ | $ | ||||||||||||||
For 2023, 2022 and 2021, common stock equivalents of approximately 419,000 , 224,000 and 158,000 , respectively, were excluded from the earnings per share calculation because their effect would have been anti-dilutive.
77
NOTE 3 - INVESTMENTS
The following table presents the amortized cost, gross unrealized gains and losses and fair value of securities available-for-sale and held-to-maturity:
| December 31, 2023 | |||||||||||||||||||||||
| ($ in thousands) | Amortized Cost | Gross Unrealized Gains | Gross Unrealized Losses | Fair Value | |||||||||||||||||||
| Available-for-sale securities: | |||||||||||||||||||||||
| Obligations of U.S. Government-sponsored enterprises | $ | $ | $ | ( | $ | ||||||||||||||||||
| Obligations of states and political subdivisions | ( | ||||||||||||||||||||||
| Agency mortgage-backed securities | ( | ||||||||||||||||||||||
| Corporate debt securities | ( | ||||||||||||||||||||||
| U.S. Treasury Bills | ( | ||||||||||||||||||||||
| Total securities available-for-sale | $ | $ | $ | ( | $ | ||||||||||||||||||
| Held-to-maturity securities: | |||||||||||||||||||||||
| Obligations of states and political subdivisions | $ | $ | $ | ( | $ | ||||||||||||||||||
| Agency mortgage-backed securities | ( | ||||||||||||||||||||||
| Corporate debt securities | ( | ||||||||||||||||||||||
| Total securities held-to-maturity | $ | $ | $ | ( | $ | ||||||||||||||||||
| Allowance for credit losses | ( | ||||||||||||||||||||||
| Total securities held-to-maturity, net | $ | ||||||||||||||||||||||
| December 31, 2022 | |||||||||||||||||||||||
| ($ in thousands) | Amortized Cost | Gross Unrealized Gains | Gross Unrealized Losses | Fair Value | |||||||||||||||||||
| Available-for-sale securities: | |||||||||||||||||||||||
| Obligations of U.S. Government-sponsored enterprises | $ | $ | $ | ( | $ | ||||||||||||||||||
| Obligations of states and political subdivisions | ( | ||||||||||||||||||||||
| Agency mortgage-backed securities | ( | ||||||||||||||||||||||
| Corporate debt securities | ( | ||||||||||||||||||||||
| U.S. Treasury Bills | ( | ||||||||||||||||||||||
| Total securities available-for-sale | $ | $ | $ | ( | $ | ||||||||||||||||||
| Held-to-maturity securities: | |||||||||||||||||||||||
| Obligations of states and political subdivisions | $ | $ | $ | ( | $ | ||||||||||||||||||
| Agency mortgage-backed securities | ( | ||||||||||||||||||||||
| Corporate debt securities | ( | ||||||||||||||||||||||
| Total securities held-to-maturity | $ | $ | $ | ( | $ | ||||||||||||||||||
| Allowance for credit losses | ( | ||||||||||||||||||||||
| Total securities held-to-maturity, net | $ | ||||||||||||||||||||||
During 2023, the Company did no t transfer any securities from available-for-sale to held-to-maturity. The Company believes the held-to-maturity category is consistent with the Company’s intent for these securities. In 2022, the Company transferred $116.7 million of securities from available-for-sale to held-to-maturity. The transfer of securities was made at fair value at the time of transfer. The unamortized portion of the unrealized holding gain at the time of transfer is retained in accumulated other comprehensive income and in the carrying value of held-to-
78
maturity securities. The balance of held-to-maturity securities in the “Amortized Cost” column in the table above includes a cumulative net unamortized, unrealized gain of $14.1 million and $17.6 million at December 31, 2023 and 2022, respectively. Such amounts are amortized over the remaining life of the securities.
At December 31, 2023 and 2022, there were no holdings of securities of any one issuer in an amount greater than 10 1.6 billion and $734.5 million at December 31, 2023 and December 31, 2022, respectively, were pledged as collateral to secure deposits of public institutions and for other purposes as required by law or contract provisions.
The amortized cost and estimated fair value of debt securities at December 31, 2023, by contractual maturity, are shown below. Expected maturities may differ from contractual maturities because borrowers may have the right to call or prepay obligations with or without call or prepayment penalties. The weighted average life of the mortgage-backed securities is approximately 5 years.
| Available-for-sale | Held-to-maturity | ||||||||||||||||||||||
| ($ in thousands) | Amortized Cost | Estimated Fair Value | Amortized Cost | Estimated Fair Value | |||||||||||||||||||
| Due in one year or less | $ | $ | $ | $ | |||||||||||||||||||
| Due after one year through five years | |||||||||||||||||||||||
| Due after five years through ten years | |||||||||||||||||||||||
| Due after ten years | |||||||||||||||||||||||
| Agency mortgage-backed securities | |||||||||||||||||||||||
| $ | $ | $ | $ | ||||||||||||||||||||
79
There were 753 and 740 available-for-sale securities in an unrealized loss position as of December 31, 2023 and 2022, respectively, included in the following tables:
| December 31, 2023 | |||||||||||||||||||||||||||||||||||
| Less than 12 months | 12 months or more | Total | |||||||||||||||||||||||||||||||||
| ($ in thousands) | Fair Value | Unrealized Losses | Fair Value | Unrealized Losses | Fair Value | Unrealized Losses | |||||||||||||||||||||||||||||
| Obligations of U.S. Government-sponsored enterprises | $ | $ | $ | $ | $ | $ | |||||||||||||||||||||||||||||
| Obligations of states and political subdivisions | |||||||||||||||||||||||||||||||||||
| Agency mortgage-backed securities | |||||||||||||||||||||||||||||||||||
| Corporate debt securities | |||||||||||||||||||||||||||||||||||
| U.S. Treasury Bills | |||||||||||||||||||||||||||||||||||
| $ | $ | $ | $ | $ | $ | ||||||||||||||||||||||||||||||
| December 31, 2022 | |||||||||||||||||||||||||||||||||||
| Less than 12 months | 12 months or more | Total | |||||||||||||||||||||||||||||||||
| ($ in thousands) | Fair Value | Unrealized Losses | Fair Value | Unrealized Losses | Fair Value | Unrealized Losses | |||||||||||||||||||||||||||||
| Obligations of U.S. Government-sponsored enterprises | $ | $ | $ | $ | $ | $ | |||||||||||||||||||||||||||||
| Obligations of states and political subdivisions | |||||||||||||||||||||||||||||||||||
| Agency mortgage-backed securities | |||||||||||||||||||||||||||||||||||
| Corporate debt securities | |||||||||||||||||||||||||||||||||||
| U.S. Treasury Bills | |||||||||||||||||||||||||||||||||||
| $ | $ | $ | $ | $ | $ | ||||||||||||||||||||||||||||||
The unrealized losses at both December 31, 2023 and 2022, were primarily attributable to changes in market interest rates since the securities were purchased. In 2023, an allowance for credit losses on available-for-sale investment securities was established through a provision for credit losses of $4.2 million. A debt security of $4.2 million was subsequently charged-off against that allowance. At both December 31, 2023 and 2022, there was no
Accrued interest receivable on held-to-maturity debt securities totaled $6.5 million and $5.8 million at December 31, 2023 and 2022, respectively, and is excluded from the estimate of expected credit losses. The estimate of expected credit losses considers historical credit loss information adjusted for current conditions and reasonable and supportable forecasts. At December 31, 2023 and 2022, the ACL on held-to-maturity securities was $0.8 million and $0.7 million, respectively.
The proceeds, gross gains and losses realized from sales of available-for-sale investment securities were as follows:
| December 31, | |||||||||||||||||
| ($ in thousands) | 2023 | 2022 | 2021 | ||||||||||||||
| Gross gains realized | $ | $ | $ | ||||||||||||||
| Proceeds from sales | |||||||||||||||||
80
Other Investments
At December 31, 2023 and 2022, other investments totaled $66.2 million and $63.8 million, respectively. As a member of the FHLB, the Bank is required to maintain a minimum investment in capital stock with the FHLB consisting of membership stock and activity-based stock. The FHLB capital stock of $7.8 million, and $14.0 million at December 31, 2023 and 2022, respectively, is recorded at cost, which represents redemption value, and is included in other investments in the consolidated balance sheets. The remaining amounts in other investments primarily include various investments in SBICs, CDFIs, and the Company’s investment in unconsolidated trusts used to issue preferred securities to third parties, see “Note 10 – Subordinated Debentures and Notes.”
81
NOTE 4 - LOANS
The following table presents a summary of loans by category:
| ($ in thousands) | December 31, 2023 | December 31, 2022 | |||||||||
| Commercial and industrial | $ | $ | |||||||||
| Real estate loans: | |||||||||||
| Commercial - investor owned | |||||||||||
| Commercial - owner occupied | |||||||||||
| Construction and land development | |||||||||||
| Residential | |||||||||||
| Total real estate loans | |||||||||||
| Other | |||||||||||
| Loans, before unearned loan fees | |||||||||||
| Unearned loan fees, net | ( | ( | |||||||||
| Loans, including unearned loan fees | $ | $ | |||||||||
The loan balance includes a net premium on acquired loans of $9.6 million and $11.9 million at December 31, 2023 and 2022, respectively. At December 31, 2023 and 2022 loans of $4.8 billion and $2.8 billion, respectively, were pledged to the FHLB and the Federal Reserve.
Consumer mortgage loans secured by residential real estate in process of foreclosure totaled $1.0 million at December 31, 2023. There were no consumer mortgage loans secured by residential real estate in process of foreclosure at December 31, 2022.
Loans to executive officers and directors, or to entities in which such individuals had beneficial interests as a shareholder, officer, or director totaled $0.1 million and $0.1 million for the year ended December 31, 2023 and 2022, respectively. Such loans were made in the normal course of business on substantially the same terms, including interest rates and collateral, as those prevailing at the time for comparable transactions with other customers and did not involve more than the normal risk of collectibility.
82
A summary of the activity, by loan category, in the allowance for credit losses on loans for 2021, 2022, and 2023 is as follows:
| ($ in thousands) | Commercial and industrial | CRE - investor owned | CRE - owner occupied | Construction and land development | Residential real estate | Other | Total | ||||||||||||||||||||||||||||||||||
| Balance at December 31, 2021 | |||||||||||||||||||||||||||||||||||||||||
| Allowance for credit losses on loans: | |||||||||||||||||||||||||||||||||||||||||
| Balance, beginning of year | $ | $ | $ | $ | $ | $ | $ | ||||||||||||||||||||||||||||||||||
| Provision (benefit) for credit losses | ( | ( | |||||||||||||||||||||||||||||||||||||||
| Initial allowance on acquired PCD loans | |||||||||||||||||||||||||||||||||||||||||
| Charge-offs | ( | ( | ( | ( | ( | ( | ( | ||||||||||||||||||||||||||||||||||
| Recoveries | |||||||||||||||||||||||||||||||||||||||||
| Balance, end of year | $ | $ | $ | $ | $ | $ | $ | ||||||||||||||||||||||||||||||||||
| Balance at December 31, 2022 | |||||||||||||||||||||||||||||||||||||||||
| Allowance for credit losses on loans: | |||||||||||||||||||||||||||||||||||||||||
| Balance, beginning of year | $ | $ | $ | $ | $ | $ | $ | ||||||||||||||||||||||||||||||||||
| Provision (benefit) for credit losses | ( | ( | ( | ( | |||||||||||||||||||||||||||||||||||||
| Charge-offs | ( | ( | ( | ( | ( | ( | |||||||||||||||||||||||||||||||||||
| Recoveries | |||||||||||||||||||||||||||||||||||||||||
| Balance, end of year | $ | $ | $ | $ | $ | $ | $ | ||||||||||||||||||||||||||||||||||
| Balance at December 31, 2023 | |||||||||||||||||||||||||||||||||||||||||
| Allowance for credit losses on loans: | |||||||||||||||||||||||||||||||||||||||||
| Balance, beginning of year | $ | $ | $ | $ | $ | $ | $ | ||||||||||||||||||||||||||||||||||
| Provision (benefit) for credit losses | ( | ( | ( | ||||||||||||||||||||||||||||||||||||||
| Charge-offs | ( | ( | ( | ( | ( | ( | |||||||||||||||||||||||||||||||||||
| Recoveries | |||||||||||||||||||||||||||||||||||||||||
| Balance, end of year | $ | $ | $ | $ | $ | $ | $ | ||||||||||||||||||||||||||||||||||
The Company recorded a provision for credit losses on loans of $35.9 million and a provision benefit for credit losses of $4.2 million for the years ended December 31, 2023 and 2022, respectively. An additional provision for credit losses of $0.7 million and $3.6 million was recorded in 2023 and 2022, respectively, for securities, unfunded commitments and accrued interest on nonaccrual loans. Acquisition-related provision expense of $25.4 million in 2021 was included in the provision for credit losses. This expense, commonly referred to as the “CECL double-count”, is recognized when a loan portfolio is acquired.
The CECL methodology incorporates various economic scenarios. The Company utilizes three forecasts in the model; Moody’s baseline, a stronger near-term growth upside and a moderate recession downside forecast. The Company weights these scenarios at 40%, 30%, and 30%, respectively, which added approximately $12.3 million to the ACL over the baseline model at December 31, 2023. The forecasts at the end of 2023 incorporate an expectation that the federal funds rate has peaked at the range of 5.25% to 5.50% and will begin falling in the latter half of 2024. It is also assumed that the bank failures in early 2023 were not an indication of a broader problem in the industry. The Company has also recognized various risks posed by loans in certain segments, including the commercial office sector, by allocating additional reserves to those segments. Some of the key risks to the forecasts that could result in future provision for credit losses are market reactions to the Federal Reserve policy actions that could push the economy into a recession, persistently higher inflation, tightening in the credit markets, and further weakness in the financial system.
83
In addition to the CECL methodology, the Company incorporates qualitative adjustments into the ACL on loans to capture credit risks inherent within the loan portfolio that are not captured in the DCF model. Included in these risks are 1) changes in lending policies and procedures, 2) actual and expected changes in business and economic conditions, 3) changes in the nature and volume of the portfolio, 4) changes in lending management, 5) changes in volume and the severity of past due loans, 6) changes in the quality of the loan review system, 7) changes in the value of underlying collateral, 8) the existence and effect of concentrations of credit and 9) other factors such as the regulatory, legal and competitive environments and events such as natural disasters and pandemics. At December 31, 2023, the ACL on loans included a qualitative adjustment of $37.4 million. Of this amount, $15.2 million was allocated to Sponsor Finance loans due to their unsecured nature.
Gross charge-offs by loan class and year of origination is presented in the following table:
| December 31, 2023 | ||||||||||||||||||||||||||||||||||||||||||||||||||||||||
| Term Loans by Origination Year | ||||||||||||||||||||||||||||||||||||||||||||||||||||||||
| ($ in thousands) | 2023 | 2022 | 2021 | 2020 | 2019 | Prior | Revolving Loans Converted to Term Loans | Revolving Loans | Total | |||||||||||||||||||||||||||||||||||||||||||||||
| Commercial and industrial | $ | $ | $ | $ | $ | $ | $ | $ | $ | |||||||||||||||||||||||||||||||||||||||||||||||
| Real estate: | ||||||||||||||||||||||||||||||||||||||||||||||||||||||||
| Commercial - investor owned | ||||||||||||||||||||||||||||||||||||||||||||||||||||||||
| Construction and land development | ||||||||||||||||||||||||||||||||||||||||||||||||||||||||
| Residential | ||||||||||||||||||||||||||||||||||||||||||||||||||||||||
| Other | ||||||||||||||||||||||||||||||||||||||||||||||||||||||||
| Total charge-offs by origination year | $ | $ | $ | $ | $ | $ | $ | $ | $ | |||||||||||||||||||||||||||||||||||||||||||||||
| Total gross charge-offs by performing status | ||||||||||||||||||||||||||||||||||||||||||||||||||||||||
| Total gross charge-offs | $ | |||||||||||||||||||||||||||||||||||||||||||||||||||||||
The following tables present the recorded investment in nonperforming loans by category, excluding government guaranteed balances:
| December 31, 2023 | |||||||||||||||||||||||||||||
| ($ in thousands) | Non-accrual | Restructured, accruing | Loans over 90 days past due and still accruing interest | Total nonperforming loans | Nonaccrual loans with no allowance | ||||||||||||||||||||||||
| Commercial and industrial | $ | $ | $ | $ | $ | ||||||||||||||||||||||||
| Real estate: | |||||||||||||||||||||||||||||
| Commercial - investor owned | |||||||||||||||||||||||||||||
| Commercial - owner occupied | |||||||||||||||||||||||||||||
| Construction and land development | |||||||||||||||||||||||||||||
| Residential | |||||||||||||||||||||||||||||
| Other | |||||||||||||||||||||||||||||
| Total | $ | $ | $ | $ | $ | ||||||||||||||||||||||||
84
| December 31, 2022 | |||||||||||||||||||||||||||||
| ($ in thousands) | Non-accrual | Restructured, accruing | Loans over 90 days past due and still accruing interest | Total nonperforming loans | Nonaccrual loans with no allowance | ||||||||||||||||||||||||
| Commercial and industrial | $ | $ | $ | $ | $ | ||||||||||||||||||||||||
| Real estate: | |||||||||||||||||||||||||||||
| Commercial - investor owned | |||||||||||||||||||||||||||||
| Commercial - owner occupied | |||||||||||||||||||||||||||||
| Construction and land development | |||||||||||||||||||||||||||||
| Residential | |||||||||||||||||||||||||||||
| Other | |||||||||||||||||||||||||||||
| Total | $ | $ | $ | $ | $ | ||||||||||||||||||||||||
The nonperforming loan balances at December 31, 2023 and December 31, 2022 exclude government guaranteed balances of $10.7 million and $6.7 million, respectively. Interest income recognized on nonaccrual loans was immaterial in the years ending December 31, 2021, 2022 and 2023.
Collateral-dependent nonperforming loans by class of loan is presented as of the dates indicated:
| December 31, 2023 | |||||||||||||||||||||||
| Type of Collateral | |||||||||||||||||||||||
| ($ in thousands) | Commercial Real Estate | Residential Real Estate | Blanket Lien | Other | |||||||||||||||||||
| Commercial and industrial | $ | $ | $ | $ | |||||||||||||||||||
| Real estate: | |||||||||||||||||||||||
| Commercial - investor owned | |||||||||||||||||||||||
| Commercial - owner occupied | |||||||||||||||||||||||
| Construction and land development | |||||||||||||||||||||||
| Residential | |||||||||||||||||||||||
| Total | $ | $ | $ | $ | |||||||||||||||||||
| December 31, 2022 | |||||||||||||||||
| Type of Collateral | |||||||||||||||||
| ($ in thousands) | Commercial Real Estate | Residential Real Estate | Blanket Lien | ||||||||||||||
| Commercial and industrial | $ | $ | $ | ||||||||||||||
| Real estate: | |||||||||||||||||
| Commercial - investor owned | |||||||||||||||||
| Commercial - owner occupied | |||||||||||||||||
| Construction and land development | |||||||||||||||||
| Residential | |||||||||||||||||
| Total | $ | $ | $ | ||||||||||||||
85
The aging of the recorded investment in past due loans by class and category is presented as of the dates indicated.
| December 31, 2023 | |||||||||||||||||||||||||||||
| ($ in thousands) | 30-89 Days Past Due | 90 or More Days Past Due | Total Past Due | Current | Total | ||||||||||||||||||||||||
| Commercial and industrial | $ | $ | $ | $ | $ | ||||||||||||||||||||||||
| Real estate: | |||||||||||||||||||||||||||||
| Commercial - investor owned | |||||||||||||||||||||||||||||
| Commercial - owner occupied | |||||||||||||||||||||||||||||
| Construction and land development | |||||||||||||||||||||||||||||
| Residential | |||||||||||||||||||||||||||||
| Other | |||||||||||||||||||||||||||||
| Loans, before unearned loan fees | |||||||||||||||||||||||||||||
| Unearned loan fees, net | ( | ||||||||||||||||||||||||||||
| Total | $ | ||||||||||||||||||||||||||||
| December 31, 2022 | |||||||||||||||||||||||||||||
| ($ in thousands) | 30-89 Days Past Due | 90 or More Days Past Due | Total Past Due | Current | Total | ||||||||||||||||||||||||
| Commercial and industrial | $ | $ | $ | $ | $ | ||||||||||||||||||||||||
| Real estate: | |||||||||||||||||||||||||||||
| Commercial - investor owned | |||||||||||||||||||||||||||||
| Commercial - owner occupied | |||||||||||||||||||||||||||||
| Construction and land development | |||||||||||||||||||||||||||||
| Residential | |||||||||||||||||||||||||||||
| Other | |||||||||||||||||||||||||||||
| Loans, before unearned loan fees | |||||||||||||||||||||||||||||
| Unearned loan fees, net | ( | ||||||||||||||||||||||||||||
| Total | $ | ||||||||||||||||||||||||||||
The allowance for credit losses incorporates an estimate of lifetime expected credit losses and is recorded on each asset upon origination or acquisition. The starting point for the estimate of the allowance for credit losses is historical loss information, which includes losses from modifications of receivables to borrowers experiencing financial difficulty. The Company uses a probability of default and loss given default model to determine the allowance for credit losses.
An assessment of whether a borrower is experiencing financial difficulty is made on the date of a modification. The effect of most modifications made to borrowers experiencing financial difficulty is already included in the allowance for credit losses because of the measurement methodologies used to estimate the allowance.
The most common concession the Company provides to borrowers experiencing financial difficulty is a term extension. In limited circumstances, the Company may modify loans by providing principal forgiveness or an interest rate reduction. When principal forgiveness is provided, the amortized cost basis of the asset is written off against the allowance for credit losses. The amount of the principal forgiveness is deemed to be uncollectible; therefore, that portion of the loan is written off, resulting in a reduction of the amortized cost basis and a corresponding adjustment to the allowance for credit losses.
In some cases, the Company will modify a loan by providing multiple types of concessions. Typically, one type of concession, such as a term extension, is granted initially. If the borrower continues to experience financial difficulty, another concession, such as an interest rate reduction or principal forgiveness, may be granted.
86
The following table shows the recorded investment at the end of the reporting period for loans modified to borrowers experiencing financial difficulty, disaggregated by loan class and type of concession granted:
| Term Extension | |||||||||||
| Twelve months ended | |||||||||||
| ($ in thousands) | December 31, 2023 | Percent of Total Loan Class | |||||||||
| Commercial and industrial | $ | % | |||||||||
| Real estate: | |||||||||||
| Commercial - investor owned | % | ||||||||||
| Commercial - owner occupied | % | ||||||||||
| Construction and land development | % | ||||||||||
| Residential | % | ||||||||||
| Other | % | ||||||||||
| Total | $ | ||||||||||
The following table summarizes the financial impacts of loan modifications made to borrowers experiencing financial difficulty and outstanding at the end of the year:
| Weighted Average Term Extension (in months) | |||||
| Twelve months ended | |||||
| December 31, 2023 | |||||
| Commercial and industrial | |||||
| Real estate: | |||||
| Commercial - investor owned | |||||
| Commercial - owner occupied | |||||
| Construction and land development | |||||
| Residential | |||||
| Other | |||||
The following table shows the aging of the recorded investment in modified loans by class:
| December 31, 2023 | |||||||||||||||||||||||
| ($ in thousands) | Current | 30-89 Days Past Due | 90 or More Days Past Due | Total | |||||||||||||||||||
| Commercial and industrial | $ | $ | $ | $ | |||||||||||||||||||
| Real estate: | |||||||||||||||||||||||
| Commercial - investor owned | |||||||||||||||||||||||
| Commercial - owner occupied | |||||||||||||||||||||||
| Construction and land development | |||||||||||||||||||||||
| Residential | |||||||||||||||||||||||
| Other | |||||||||||||||||||||||
| Total | $ | $ | $ | $ | |||||||||||||||||||
As of December 31, 2023, no loans experienced a default subsequent to being granted a term extension modification in the prior twelve months. Default is defined as movement to nonperforming status, foreclosure or charge-off. As of December 31, 2023, the Company allocated an immaterial amount in specific reserves to loans that have been restructured.
87
The Company categorizes loans into risk categories based on relevant information about the ability of borrowers to service their debt, such as current financial information, payment experience, credit documentation, and current economic factors among other factors. This analysis is performed on a quarterly basis. The Company uses the following definitions for risk ratings:
•Grades 1, 2, and 3 – Includes loans to borrowers with a continuous record of strong earnings, sound balance sheet condition and capitalization, ample liquidity with solid cash flow, and whose management team has experience and depth within their industry.
•Grade 4 – Includes loans to borrowers with positive trends in profitability, satisfactory capitalization and balance sheet condition, and sufficient liquidity and cash flow.
•Grade 5 – Includes loans to borrowers that may display fluctuating trends in sales, profitability, capitalization, liquidity, and cash flow.
•Grade 6 – Includes loans to borrowers where an adverse change or perceived weakness has occurred, but may be correctable in the near future. Alternatively, this rating category may also include circumstances where the borrower is starting to reverse a negative trend or condition, or has recently been upgraded from a 7, 8, or 9 rating.
•Grade 7 – Special Mention credits are borrowers that have experienced financial setback of a nature that is not determined to be severe or influence ‘ongoing concern’ expectations. Although possible, no loss is anticipated, due to strong collateral and/or guarantor support.
•Grade 8 – Substandard credits include those borrowers characterized by significant losses and sustained downward trends in balance sheet condition, liquidity, and cash flow. Repayment reliance may have shifted to secondary sources. Collateral exposure may exist and additional reserves may be warranted.
•Grade 9 – Doubtful credits include borrowers that may show deteriorating trends that are unlikely to be corrected. Collateral values may appear insufficient for full recovery, therefore requiring a partial charge-off, or debt renegotiation with the borrower. The borrower may have declared bankruptcy or bankruptcy is likely in the near term. All doubtful rated credits will be on non-accrual.
88
The recorded investment by risk category of the loans by class and year of origination is presented in the following tables as of the dates indicated:
| December 31, 2023 | ||||||||||||||||||||||||||||||||||||||||||||||||||||||||
| Term Loans by Origination Year | ||||||||||||||||||||||||||||||||||||||||||||||||||||||||
| ($ in thousands) | 2023 | 2022 | 2021 | 2020 | 2019 | Prior | Revolving Loans Converted to Term Loans | Revolving Loans | Total | |||||||||||||||||||||||||||||||||||||||||||||||
| Commercial and industrial | ||||||||||||||||||||||||||||||||||||||||||||||||||||||||
| Pass (1-6) | $ | $ | $ | $ | $ | $ | $ | $ | $ | |||||||||||||||||||||||||||||||||||||||||||||||
| Special Mention (7) | ||||||||||||||||||||||||||||||||||||||||||||||||||||||||
| Classified (8-9) | ||||||||||||||||||||||||||||||||||||||||||||||||||||||||
| Total Commercial and industrial | $ | $ | $ | $ | $ | $ | $ | $ | $ | |||||||||||||||||||||||||||||||||||||||||||||||
| Commercial real estate-investor owned | ||||||||||||||||||||||||||||||||||||||||||||||||||||||||
| Pass (1-6) | $ | $ | $ | $ | $ | $ | $ | $ | $ | |||||||||||||||||||||||||||||||||||||||||||||||
| Special Mention (7) | ||||||||||||||||||||||||||||||||||||||||||||||||||||||||
| Classified (8-9) | ||||||||||||||||||||||||||||||||||||||||||||||||||||||||
| Total Commercial real estate-investor owned | $ | $ | $ | $ | $ | $ | $ | $ | $ | |||||||||||||||||||||||||||||||||||||||||||||||
| Commercial real estate-owner occupied | ||||||||||||||||||||||||||||||||||||||||||||||||||||||||
| Pass (1-6) | $ | $ | $ | $ | $ | $ | $ | $ | $ | |||||||||||||||||||||||||||||||||||||||||||||||
| Special Mention (7) | ||||||||||||||||||||||||||||||||||||||||||||||||||||||||
| Classified (8-9) | ||||||||||||||||||||||||||||||||||||||||||||||||||||||||
| Total Commercial real estate-owner occupied | $ | $ | $ | $ | $ | $ | $ | $ | $ | |||||||||||||||||||||||||||||||||||||||||||||||
| Construction real estate | ||||||||||||||||||||||||||||||||||||||||||||||||||||||||
| Pass (1-6) | $ | $ | $ | $ | $ | $ | $ | $ | $ | |||||||||||||||||||||||||||||||||||||||||||||||
| Special Mention (7) | ||||||||||||||||||||||||||||||||||||||||||||||||||||||||
| Classified (8-9) | ||||||||||||||||||||||||||||||||||||||||||||||||||||||||
| Total Construction real estate | $ | $ | $ | $ | $ | $ | $ | $ | $ | |||||||||||||||||||||||||||||||||||||||||||||||
| Residential real estate | ||||||||||||||||||||||||||||||||||||||||||||||||||||||||
| Pass (1-6) | $ | $ | $ | $ | $ | $ | $ | $ | $ | |||||||||||||||||||||||||||||||||||||||||||||||
| Special Mention (7) | ||||||||||||||||||||||||||||||||||||||||||||||||||||||||
| Classified (8-9) | ||||||||||||||||||||||||||||||||||||||||||||||||||||||||
| Total residential real estate | $ | $ | $ | $ | $ | $ | $ | $ | $ | |||||||||||||||||||||||||||||||||||||||||||||||
| Other | ||||||||||||||||||||||||||||||||||||||||||||||||||||||||
| Pass (1-6) | $ | $ | $ | $ | $ | $ | $ | $ | $ | |||||||||||||||||||||||||||||||||||||||||||||||
| Special Mention (7) | ||||||||||||||||||||||||||||||||||||||||||||||||||||||||
| Classified (8-9) | ||||||||||||||||||||||||||||||||||||||||||||||||||||||||
| Total Other | $ | $ | $ | $ | $ | $ | $ | $ | $ | |||||||||||||||||||||||||||||||||||||||||||||||
| Total loans classified by risk category | $ | $ | $ | $ | $ | $ | $ | $ | $ | |||||||||||||||||||||||||||||||||||||||||||||||
| Total loans classified by performing status | ||||||||||||||||||||||||||||||||||||||||||||||||||||||||
| Total loans | $ | |||||||||||||||||||||||||||||||||||||||||||||||||||||||
89
| December 31, 2022 | ||||||||||||||||||||||||||||||||||||||||||||||||||||||||
| Term Loans by Origination Year | ||||||||||||||||||||||||||||||||||||||||||||||||||||||||
| ($ in thousands) | 2022 | 2021 | 2020 | 2019 | 2018 | Prior | Revolving Loans Converted to Term Loans | Revolving Loans | Total | |||||||||||||||||||||||||||||||||||||||||||||||
| Commercial and industrial | ||||||||||||||||||||||||||||||||||||||||||||||||||||||||
| Pass (1-6) | $ | $ | $ | $ | $ | $ | $ | $ | $ | |||||||||||||||||||||||||||||||||||||||||||||||
| Special Mention (7) | ||||||||||||||||||||||||||||||||||||||||||||||||||||||||
| Classified (8-9) | ||||||||||||||||||||||||||||||||||||||||||||||||||||||||
| Total Commercial and industrial | $ | $ | $ | $ | $ | $ | $ | $ | $ | |||||||||||||||||||||||||||||||||||||||||||||||
| Commercial real estate-investor owned | ||||||||||||||||||||||||||||||||||||||||||||||||||||||||
| Pass (1-6) | $ | $ | $ | $ | $ | $ | $ | $ | $ | |||||||||||||||||||||||||||||||||||||||||||||||
| Special Mention (7) | ||||||||||||||||||||||||||||||||||||||||||||||||||||||||
| Classified (8-9) | ||||||||||||||||||||||||||||||||||||||||||||||||||||||||
| Total Commercial real estate-investor owned | $ | $ | $ | $ | $ | $ | $ | $ | $ | |||||||||||||||||||||||||||||||||||||||||||||||
| Commercial real estate-owner occupied | ||||||||||||||||||||||||||||||||||||||||||||||||||||||||
| Pass (1-6) | $ | $ | $ | $ | $ | $ | $ | $ | $ | |||||||||||||||||||||||||||||||||||||||||||||||
| Special Mention (7) | ||||||||||||||||||||||||||||||||||||||||||||||||||||||||
| Classified (8-9) | ||||||||||||||||||||||||||||||||||||||||||||||||||||||||
| Total Commercial real estate-owner occupied | $ | $ | $ | $ | $ | $ | $ | $ | $ | |||||||||||||||||||||||||||||||||||||||||||||||
| Construction real estate | ||||||||||||||||||||||||||||||||||||||||||||||||||||||||
| Pass (1-6) | $ | $ | $ | $ | $ | $ | $ | $ | $ | |||||||||||||||||||||||||||||||||||||||||||||||
| Special Mention (7) | ||||||||||||||||||||||||||||||||||||||||||||||||||||||||
| Classified (8-9) | ||||||||||||||||||||||||||||||||||||||||||||||||||||||||
| Total Construction real estate | $ | $ | $ | $ | $ | $ | $ | $ | $ | |||||||||||||||||||||||||||||||||||||||||||||||
| Residential real estate | ||||||||||||||||||||||||||||||||||||||||||||||||||||||||
| Pass (1-6) | $ | $ | $ | $ | $ | $ | $ | $ | $ | |||||||||||||||||||||||||||||||||||||||||||||||
| Special Mention (7) | ||||||||||||||||||||||||||||||||||||||||||||||||||||||||
| Classified (8-9) | ||||||||||||||||||||||||||||||||||||||||||||||||||||||||
| Total residential real estate | $ | $ | $ | $ | $ | $ | $ | $ | $ | |||||||||||||||||||||||||||||||||||||||||||||||
| Other | ||||||||||||||||||||||||||||||||||||||||||||||||||||||||
| Pass (1-6) | $ | $ | $ | $ | $ | $ | $ | $ | $ | |||||||||||||||||||||||||||||||||||||||||||||||
| Special Mention (7) | ||||||||||||||||||||||||||||||||||||||||||||||||||||||||
| Classified (8-9) | ||||||||||||||||||||||||||||||||||||||||||||||||||||||||
| Total Other | $ | $ | $ | $ | $ | $ | $ | $ | $ | |||||||||||||||||||||||||||||||||||||||||||||||
| Total loans classified by risk category | $ | $ | $ | $ | $ | $ | $ | $ | $ | |||||||||||||||||||||||||||||||||||||||||||||||
| Total loans classified by performing status | ||||||||||||||||||||||||||||||||||||||||||||||||||||||||
| Total loans | $ | |||||||||||||||||||||||||||||||||||||||||||||||||||||||
90
In the tables above, loan originations in 2023 and 2022 with a classification of “special mention” or “classified” primarily represent renewals or modifications initially underwritten and originated in prior years. For certain loans the Company evaluates credit quality based on the aging status. The following tables present the recorded investment in loans based on payment activity as of the dates indicated:
| December 31, 2023 | |||||||||||||||||
| ($ in thousands) | Performing | Non Performing | Total | ||||||||||||||
| Commercial and industrial | $ | $ | $ | ||||||||||||||
| Real estate: | |||||||||||||||||
| Commercial - investor owned | |||||||||||||||||
| Commercial - owner occupied | |||||||||||||||||
| Residential | |||||||||||||||||
| Other | |||||||||||||||||
| Total | $ | $ | $ | ||||||||||||||
| December 31, 2022 | |||||||||||||||||
| ($ in thousands) | Performing | Non Performing | Total | ||||||||||||||
| Commercial and industrial | $ | $ | $ | ||||||||||||||
| Real estate: | |||||||||||||||||
| Commercial - investor owned | |||||||||||||||||
| Commercial - owner occupied | |||||||||||||||||
| Residential | |||||||||||||||||
| Other | |||||||||||||||||
| Total | $ | $ | $ | ||||||||||||||
91
NOTE 5 - LEASES
Lessee Arrangements
The Company has banking and limited-service facilities, data centers, and certain equipment under lease agreements. Most of the leases expire between 2024 and 2028 and include one or more renewal options for up to 5 years. Five leases expire between 2030 and 2034. All leases are classified as operating leases.
| For the year ended December 31, | |||||||||||
| ($ in thousands) | 2023 | 2022 | |||||||||
| Operating lease cost | $ | $ | |||||||||
| Short-term lease cost | |||||||||||
| Total lease cost | $ | $ | |||||||||
Payments on operating leases included in the measurement of lease liabilities during the twelve months ended December 31, 2023 and 2022 totaled $5.5 million and $5.8 million, respectively. Right-of-use assets obtained in exchange for lease obligations totaled $15.6 million and $9.5 million during the twelve months ended December 31, 2023 and 2022, respectively. The additions in 2023 and 2022 were primarily from lease renewals.
Supplemental balance sheet information related to leases is as follows:
| ($ in thousands) | December 31, 2023 | December 31, 2022 | |||||||||
| $ | $ | ||||||||||
| Operating leases | |||||||||||
| Weighted average remaining lease term | |||||||||||
| Weighted average discount rate | % | % | |||||||||
Maturities of operating lease liabilities are as follows:
| ($ in thousands) | |||||
| Year | Amount | ||||
| 2024 | $ | ||||
| 2025 | |||||
| 2026 | |||||
| 2027 | |||||
| 2028 | |||||
| Thereafter | |||||
| Total operating lease liabilities, payments | |||||
| Less: present value adjustment | |||||
| Operating lease liabilities | $ | ||||
Lessor Arrangements
92
NOTE 6 - DERIVATIVE FINANCIAL INSTRUMENTS
Risk Management Objective of Using Derivatives
The Company is exposed to certain risks arising from both its business operations and economic conditions. The Company principally manages its exposures to a wide variety of business and operational risks through management of its core business activities. The Company manages economic risks, including interest rate, liquidity, and credit risk primarily by managing the amount, sources, and duration of its assets and liabilities and the use of derivative financial instruments. Specifically, the Company enters into derivative financial instruments to manage exposures that arise from business activities that result in the receipt or payment of future known and uncertain cash amounts, the value of which are determined by interest rates. The Company’s derivative financial instruments are used to manage differences in the amount, timing, and duration of the Company’s known or expected cash receipts and its known or expected cash payments principally related to the Company’s loans and borrowings. The Company does not enter into derivative financial instruments for trading purposes.
Cash Flow Hedges of Interest Rate Risk
The Company’s objectives in using interest rate derivatives are to add stability to interest income and expense and to manage its exposure to interest rate movements. To accomplish this objective, the Company primarily uses interest rate swaps as part of its interest rate risk management strategy.
For hedges of the Company’s variable-rate loans, interest rate swaps designated as cash flow hedges involve the receipt of fixed amounts and the Company making variable rate payments. In the fourth quarter 2022, the Company executed a cash flow hedge to reduce a portion of variability in cash flows on the Company’s prime based loan portfolio. The interest rate swap has a notional value of $100.0 million, that effectively fixes the interest rate at 6.63 % for the notional amount and has a maturity date of January 1, 2028. In January 2023, the Company entered into another hedge on the prime based loan portfolio with a notional value of $50.0 million, that effectively fixes the interest rate at 6.56 % for the notional amount and has a maturity date of February 1, 2027.
In addition, the Company executed a prime based interest rate collar in the fourth quarter of 2022 with a notional amount of $100.0 million. The collar includes a cap of 8.14 % and a floor of 5.25 %. This transaction, commonly referred to as a zero cost collar, involves the Company selling an interest rate cap where payments will be made when the index exceeds the cap rate, and the purchase of a floor where payments will be received if the index falls below the floor. The collar matures on October 1, 2029.
For hedges of the variable-rate liabilities, interest rate swaps designated as cash flow hedges involve the receipt of variable amounts from a counterparty in exchange for the Company making fixed-rate payments over the life of the agreements without exchange of the underlying notional amount. The Company has executed a series of cash flow hedges to fix the effective interest rate for payments due on $62.0 million of junior subordinated debentures to a weighted-average-fixed rate of 2.62 %.
Select terms of the hedges are as follows:
| $ in thousands | ||||||||
| Notional | Fixed Rate | Maturity Date | ||||||
| $ | March 15, 2024 | |||||||
| $ | March 30, 2024 | |||||||
| $ | March 15, 2026 | |||||||
| $ | March 17, 2026 | |||||||
The gain or loss on derivatives designated and qualified as cash flow hedges of interest rate risk are recorded in accumulated other comprehensive income and subsequently reclassified into interest income or expense in the same period(s) during which the hedged transaction affects earnings. Amounts reported in accumulated other comprehensive income related to derivatives will be reclassified to interest income or expense as interest payments are paid on the Company’s variable-rate loans and debt. During the next twelve months, the Company estimates an
93
additional $0.9 million will be reclassified as a decrease to interest expense and $1.7 million will be reclassified as a decrease to interest income.
Non-designated Hedges
Derivatives not designated as hedges are not considered speculative and result from a service the Company provides to certain customers. The Company executes interest rate swaps with commercial banking customers to facilitate their respective risk management strategies. Those interest rate swaps are simultaneously hedged by offsetting derivatives the Company executes with a third party, such that the Company minimizes its net risk exposure resulting from such transactions. As the interest rate derivatives associated with this program do not meet the strict hedge accounting requirements, changes in the fair value of both the customer derivatives and the offsetting derivatives are recognized directly in earnings as a component of other noninterest income.
The table below presents the fair value of the Company’s derivative financial instruments as well as their classification on the Balance Sheet.
| Notional Amount | Derivative Assets | Derivative Liabilities | |||||||||||||||||||||||||||||||||
| ($ in thousands) | December 31, 2023 | December 31, 2022 | December 31, 2023 | December 31, 2022 | December 31, 2023 | December 31, 2022 | |||||||||||||||||||||||||||||
| Derivatives designated as hedging instruments | |||||||||||||||||||||||||||||||||||
| Interest rate swaps | $ | $ | $ | $ | $ | $ | |||||||||||||||||||||||||||||
| Interest rate collar | |||||||||||||||||||||||||||||||||||
| Total | $ | $ | $ | $ | |||||||||||||||||||||||||||||||
| Derivatives not designated as hedging instruments | |||||||||||||||||||||||||||||||||||
| Interest rate swaps | $ | $ | $ | $ | $ | $ | |||||||||||||||||||||||||||||
94
The tables below present a gross presentation, the effects of offsetting, and a net presentation of the Company’s financial instruments subject to offsetting. The gross amounts of assets or liabilities can be reconciled to the tabular disclosure of fair value. The tabular disclosure of fair value provides the location that financial assets and liabilities are presented on the Balance Sheet.
| As of December 31, 2023 | |||||||||||||||||||||||||||||||||||
| Gross Amounts Not Offset in the Statement of Financial Position | |||||||||||||||||||||||||||||||||||
| ($ in thousands) | Gross Amounts Recognized | Gross Amounts Offset in the Statement of Financial Position | Net Amounts of Assets presented in the Statement of Financial Position | Financial Instruments | Fair Value Collateral Posted | Net Amount | |||||||||||||||||||||||||||||
| Assets: | |||||||||||||||||||||||||||||||||||
| Interest rate swaps | $ | $ | $ | $ | $ | $ | |||||||||||||||||||||||||||||
| Interest rate collar | |||||||||||||||||||||||||||||||||||
| Liabilities: | |||||||||||||||||||||||||||||||||||
| Interest rate swaps | $ | $ | $ | $ | $ | $ | |||||||||||||||||||||||||||||
| Securities sold under agreements to repurchase | |||||||||||||||||||||||||||||||||||
| As of December 31, 2022 | |||||||||||||||||||||||||||||||||||
| Gross Amounts Not Offset in the Statement of Financial Position | |||||||||||||||||||||||||||||||||||
| ($ in thousands) | Gross Amounts Recognized | Gross Amounts Offset in the Statement of Financial Position | Net Amounts of Assets presented in the Statement of Financial Position | Financial Instruments | Fair Value Collateral Posted | Net Amount | |||||||||||||||||||||||||||||
| Assets: | |||||||||||||||||||||||||||||||||||
| Interest rate swaps | $ | $ | $ | $ | $ | $ | |||||||||||||||||||||||||||||
| Liabilities: | |||||||||||||||||||||||||||||||||||
| Interest rate swaps | $ | $ | $ | $ | $ | $ | |||||||||||||||||||||||||||||
| Interest rate collar | |||||||||||||||||||||||||||||||||||
| Securities sold under agreements to repurchase | |||||||||||||||||||||||||||||||||||
As of December 31, 2023, the fair value of counterparty derivatives in a net liability position, which includes accrued interest, related to these agreements was $15.8 million. The company has minimum collateral posting thresholds with certain derivative counterparties and posts collateral related to derivatives in a net liability position. The Company has received cash collateral from counterparties on derivatives that were in a net asset position as noted in the tables above.
95
NOTE 7 - FIXED ASSETS
A summary of fixed assets is as follows:
| December 31, | |||||||||||
| ($ in thousands) | 2023 | 2022 | |||||||||
| Land | $ | $ | |||||||||
| Buildings and leasehold improvements | |||||||||||
| Furniture, fixtures and equipment | |||||||||||
| Less accumulated depreciation and amortization | |||||||||||
| Total fixed assets | $ | $ | |||||||||
Depreciation and amortization of fixed assets included in noninterest expense amounted to $5.1 million, $5.6 million, and $6.1 million in 2023, 2022, and 2021, respectively.
NOTE 8 - GOODWILL AND INTANGIBLE ASSETS
The Company’s goodwill was $365.2
The table below presents a summary of intangible assets:
| ($ in thousands) | Years ended December 31, | ||||||||||
| 2023 | 2022 | ||||||||||
| Core deposit intangible, net, beginning of year | $ | $ | |||||||||
| Amortization | ( | ( | |||||||||
| Core deposit intangible, net, end of year | $ | $ | |||||||||
Amortization expense on the core deposit intangibles was $4.6 million, $5.4 million, and $5.7 million for the years ended December 31, 2023, 2022, and 2021, respectively. The core deposit intangibles are being amortized over a 10 -year period.
The following table reflects the amortization schedule for the core deposit intangible at December 31, 2023.
| Year | Core Deposit Intangible ($ in thousands) | ||||
| 2024 | $ | ||||
| 2025 | |||||
| 2026 | |||||
| 2027 | |||||
| 2028 | |||||
| After 2028 | |||||
| $ | |||||
96
NOTE 9 - DEPOSITS
Following is a summary of certificates of deposit maturities at December 31, 2023:
| ($ in thousands) | Brokered | Customer | Total | ||||||||||||||
| Less than 1 year | $ | $ | $ | ||||||||||||||
| Greater than 1 year and less than 2 years | |||||||||||||||||
| Greater than 2 years and less than 3 years | |||||||||||||||||
| Greater than 3 years and less than 4 years | |||||||||||||||||
| Greater than 4 years and less than 5 years | |||||||||||||||||
| Greater than 5 years | |||||||||||||||||
| $ | $ | $ | |||||||||||||||
Certificates of deposit balances over the FDIC insurance limit of $250,000 were $234.6 million as of December 31, 2023.
At December 31, 2023, deposit accounts of executive officers and directors, or to entities in which such individuals had beneficial interests as a shareholder, officer, or director totaled $2.6 million.
The Company is a participant in certain networks that offer deposit placement services on a reciprocal basis that qualify large deposits for FDIC insurance. The Company had $91.7 million and $10.6 million of certificates of deposits, and $1.1 billion and $195.1 million of demand deposits in these reciprocal accounts at December 31, 2023 and 2022, respectively.
At December 31, 2023 and 2022, overdraft deposits of $1.6 million and $3.2 million, respectively, were reclassified to loans.
97
NOTE 10 - SUBORDINATED DEBENTURES AND NOTES
The following table summarizes the Company’s subordinated debentures at December 31:
| Amount | Maturity Date | Initial Call Date (1) | Interest Rate | ||||||||||||||||||||||||||
| ($ in thousands) | 2023 | 2022 | |||||||||||||||||||||||||||
| EFSC Clayco Statutory Trust I | $ | $ | Floats @ 3 month term SOFR + | ||||||||||||||||||||||||||
| EFSC Capital Trust II | Floats @ 3 month term SOFR + | ||||||||||||||||||||||||||||
| EFSC Statutory Trust III | Floats @ 3 month term SOFR + | ||||||||||||||||||||||||||||
| EFSC Clayco Statutory Trust II | Floats @ 3 month term SOFR + | ||||||||||||||||||||||||||||
| EFSC Statutory Trust IV | Floats @ 3 month term SOFR + | ||||||||||||||||||||||||||||
| EFSC Statutory Trust V | Floats @ 3 month term SOFR + | ||||||||||||||||||||||||||||
| EFSC Capital Trust VI | Floats @ 3 month term SOFR + | ||||||||||||||||||||||||||||
| EFSC Capital Trust VII | Floats @ 3 month term SOFR + | ||||||||||||||||||||||||||||
| JEFFCO Stat Trust I | Fixed @ | ||||||||||||||||||||||||||||
| JEFFCO Stat Trust II (2) | Floats @ 3 month term SOFR + | ||||||||||||||||||||||||||||
| Trinity Capital Trust III (2) | Floats @ 3 month term SOFR + | ||||||||||||||||||||||||||||
| Trinity Capital Trust IV | Fixed @ | ||||||||||||||||||||||||||||
| Trinity Capital Trust V (2) | Floats @ 3 month term SOFR + | ||||||||||||||||||||||||||||
| Total junior subordinated debentures | |||||||||||||||||||||||||||||
Fixed @ June 1, 2025, then floats @ Benchmark rate (3 month term SOFR) + | |||||||||||||||||||||||||||||
| Debt issuance costs | ( | ( | |||||||||||||||||||||||||||
| Total fixed-to-floating rate subordinated notes | |||||||||||||||||||||||||||||
| Total subordinated debentures and notes | $ | $ | |||||||||||||||||||||||||||
| (1) Callable each quarter after initial call date. | |||||||||||||||||||||||||||||
| (2) Purchase accounting adjustments are reflected in the balance and also impact the effective interest rate. | |||||||||||||||||||||||||||||
The Company has 13 unconsolidated statutory business trusts. These trusts issued preferred securities that were sold to third parties. The sole purpose of the trusts was to invest the proceeds in junior subordinated debentures of the Company that have terms identical to the trust preferred securities. The subordinated debentures, which are the sole assets of the trusts, are subordinate and junior in right of payment to all present and future senior and subordinated indebtedness and certain other financial conditions of the Company. The Company fully and unconditionally guarantees each trust’s securities obligations. Under current regulations, the trust preferred securities are included in tier 1 capital for regulatory capital purposes, subject to certain limitations.
The trust preferred securities are redeemable in whole or in part on or after their respective call dates. Mandatory redemption dates may be shortened if certain conditions are met. The securities are classified as subordinated debentures in the Company’s consolidated balance sheets. Interest on the subordinated debentures held by the trusts is recorded as interest expense in the Company’s Consolidated Statements of Income. The Company’s investment in these trusts of $2.9 million at December 31, 2023 is included in other investments in the consolidated balance sheets. The Company has fixed the interest rate on a portion of its junior subordinated debentures through a series of
98
interest rate swaps. For further discussion of the interest rate swaps and the corresponding terms, see “Note 6 – Derivative Financial Instruments.”
On November 1, 2016, the Company issued $50 million of fixed-to-floating rate subordinated notes. The notes initially bore a fixed annual interest rate of 4.75 %, with interest payable semiannually in arrears on May 1 and November 1 of each year, commencing May 1, 2017. On November 1, 2021, the Company redeemed the $50.0 million of subordinated debentures at par. A loss of $0.7 million on the redemption was recognized for the write-off of unamortized debt issuance costs.
NOTE 11 - FEDERAL HOME LOAN BANK ADVANCES
FHLB advances are collateralized by 1-4 family residential real estate loans, business loans, and certain commercial real estate loans. At December 31, 2023 and 2022, the carrying value of the loans pledged to the FHLB of Des Moines was $1.9 billion and $1.4 billion, respectively. The loans are pledged to the secured line of credit to maintain the borrowing base, which had availability of approximately $1.0 billion at December 31, 2023.
The following table summarizes the Company’s FHLB advances at December 31:
| 2023 | 2022 | |||||||||||||||||||
| ($ in thousands) | Outstanding Balance | Weighted Rate | Outstanding Balance | Weighted Rate | ||||||||||||||||
| Non-amortizing fixed advance | $ | % | $ | % | ||||||||||||||||
NOTE 12 - OTHER BORROWINGS
Securities Sold Under Agreement to Repurchase
The Company enters into sales of securities under agreements to repurchase. The agreements are transacted with deposit customers and are utilized as an overnight investment product. The amounts received under these agreements represent short-term borrowings and are reflected as a liability in the consolidated balance sheets. The securities underlying these agreements are included in investment securities in the Consolidated Balance Sheets. The Company has no control over the market value of the securities, which fluctuates due to market conditions. However, the Company is obligated to promptly transfer additional securities if the market value of the securities falls below the repurchase agreement price. The Company manages this risk by maintaining an unpledged securities portfolio that it believes is sufficient to cover a decline in the market value of the securities sold under agreements to repurchase.
99
A summary of securities sold under agreements to repurchase is as follows:
| December 31, | |||||||||||
| ($ in thousands) | 2023 | 2022 | |||||||||
| Securities sold under agreement to repurchase | $ | $ | |||||||||
| Average balance during the year | |||||||||||
| Maximum balance outstanding at any month-end | |||||||||||
| Average interest rate during the year | % | % | |||||||||
| Average interest rate at December 31 | % | % | |||||||||
Federal Reserve Line
The Bank also has a line with the Federal Reserve Bank of St. Louis which provides additional liquidity to the Company. As of December 31, 2023, $2.5 billion was available under this line. Included in this line is $215.0 million related to the Bank Term Funding program. On January 24, 2024, the Federal Reserve announced that the program would cease making new loans on March 11, 2024. This line is secured by a pledge of certain eligible loans and securities aggregating $2.9 billion. There were no amounts drawn on the Federal Reserve line of credit as of December 31, 2023.
Other Borrowings
The Bank has $36.2 million of borrowings from various entities related to New Market Tax Credit investments. These notes have remaining terms that range from 25 -30 years. These notes have an interest rate of 1.0 % and are generally interest only for the first 7 years.
Revolving Credit Line
In February 2016, the Company entered into a senior unsecured revolving credit agreement (the “Revolving Agreement”) with another bank. The Revolving Agreement has a one-year term, maturing on February 22, 2024, allows for borrowings up to $25 million, and had an interest rate of one-month Term SOFR plus 136 basis points until February 2024. A fee of 0.30 % annually is assessed against the unused commitment. The proceeds can be used for general corporate purposes. The Revolving Agreement is subject to ongoing compliance with a number of customary affirmative and negative covenants as well as specified financial covenants. The revolving credit line was not accessed in 2023 or 2022.
Term Loan
In February 2019, the Company entered into a five year , $40.0 million unsecured term loan agreement (the “Term Loan”) with another bank with the proceeds primarily used to fund the company’s cash portion of an acquisition in 2019. The interest rate was one-month LIBOR plus 125 basis points until February 2022. In February 2022, the interest rate on the Term Loan was amended to one-month Term SOFR plus 136 basis points. The term loan agreement matures in February 2024.
A summary of the Term Loan is as follows:
| December 31, | |||||||||||
| ($ in thousands) | 2023 | 2022 | |||||||||
| Term Loan | $ | $ | |||||||||
| Average balance during the year | |||||||||||
| Maximum balance outstanding at any month-end | |||||||||||
| Weighted average interest rate during the year | % | % | |||||||||
| Average interest rate at December 31 | % | ||||||||||
100
NOTE 13 - LITIGATION AND OTHER CONTINGENCIES
NOTE 14 - REGULATORY CAPITAL
Quantitative measures established by regulation to ensure capital adequacy require the Bank to maintain minimum ratios (set forth in the following table) of total, tier 1, and common equity tier 1 capital to risk-weighted assets, and of tier 1 capital to average assets. Management believes, as of December 31, 2023 and 2022, that the Company met all capital adequacy requirements to which it is subject.
As of December 31, 2023 and 2022, the Bank was categorized as “well-capitalized” under the regulatory framework for prompt corrective action. To be categorized as “well-capitalized” the Bank must maintain minimum total risk-based capital, tier 1 risk-based capital, common equity tier 1 risk-based capital, and tier 1 leverage ratios as set forth in the following table. In addition, the Company must maintain an additional CCB above the regulatory minimum ratio requirements. The CCB is designed to insulate banks from periods of stress and impose constraints on dividends, share repurchases and discretionary bonus payments when capital levels fall below prescribed levels.
The capital ratios are presented in the following table:
| December 31, 2023 | December 31, 2022 | |||||||||||||||||||||||||
| EFSC | Bank | EFSC | Bank | To Be Well-Capitalized | Minimum Ratio with CCB | |||||||||||||||||||||
| Common Equity Tier 1 Capital to Risk Weighted Assets | % | % | % | % | % | % | ||||||||||||||||||||
| Tier 1 Capital to Risk Weighted Assets | % | % | % | % | % | % | ||||||||||||||||||||
| Total Capital to Risk Weighted Assets | % | % | % | % | % | % | ||||||||||||||||||||
| Leverage Ratio (Tier 1 Capital to Average Assets) | % | % | % | % | % | N/A | ||||||||||||||||||||
101
NOTE 15 - SHAREHOLDERS’ EQUITY AND COMPENSATION PLANS
Shareholders’ Equity
Common Stock
At December 31, 2023 and 2022, the Company has reserved the following shares of its authorized but unissued common stock for possible future issuance in connection with the following:
| December 31, 2023 | December 31, 2022 | ||||||||||
| Outstanding performance units (maximum issuance) | |||||||||||
| Outstanding RSU’s | |||||||||||
| Outstanding options | |||||||||||
| 2018 Stock Incentive Plan | |||||||||||
| Non-Management Director Plan | |||||||||||
| 2018 Employee Stock Purchase Plan | |||||||||||
| Total | |||||||||||
Common Stock Repurchase Plan
In April 2021, the Company’s board of directors authorized the repurchase of up to two million shares of the Company’s common stock. As of May 2022, this plan was depleted. In May 2022, the Company’s board of directors authorized the repurchase of up to two million shares of the Company’s common stock. The repurchases may be made in open market or privately negotiated transactions and the stock repurchase program will remain in effect until fully utilized or until modified, superseded or terminated. At December 31, 2023, there were two million shares available for repurchase under the plan.
Preferred Stock
The Company has 5,000,000 0.01 75,000 3,000,000 depositary shares, each representing 1/40th interest in a share of the Company’s 5% Noncumulative, Perpetual Preferred Stock, Series A (“Series A Preferred Stock”), totaling $72.0 million, net of issuance costs. The depositary shares trade under the ticker “EFSCP”. The Series A Preferred Stock may be redeemed at the Company’s option, subject to prior regulatory approval, in whole or in part on any dividend payment date on or after December 15, 2026 or within 90 days following a regulatory capital event, as defined in the offering documents. If any Series A Preferred Stock are redeemed, a proportionate number of depositary shares will also be redeemed.
Dividends
The Company’s ability to pay dividends to its shareholders is generally dependent upon the payment of dividends by the Bank to the parent company. The Bank cannot pay dividends to the extent it would be deemed undercapitalized by the FDIC after making such dividend.
Preferred stock dividends, when and if declared by the board of directors, are payable, quarterly in arrears, on March 15, June 15, September 15 and December 15 of each year. If dividends on the Series A Preferred stock have not been declared or paid in six quarterly periods, whether or not consecutive, the number of directors on the board will automatically be increased by two and the holders of the Series A preferred stock will be entitled to vote for the additional directors. Quarterly dividends have been declared and paid in all periods since the preferred stock was issued.
Dividends on the Company’s capital stock are prohibited under the terms of the junior subordinated debenture agreements, see “Note 10 – Subordinated Debentures and Notes,” if the Company is in continuous default on its payment obligations to the capital trusts, has elected to defer interest payments on the debentures or extends the
102
interest payment period. Furthermore, unless dividends on all outstanding shares of the Series A Preferred Stock for the most recently completed dividend period have been paid or declared, dividends on, and repurchases of, common stock is prohibited. At December 31, 2023, the Company was not in default on any of the junior subordinated debenture issuances or preferred stock.
Accumulated Other Comprehensive Income (Loss)
The following table presents the changes in accumulated other comprehensive income (loss) after-tax by component:
| ($ in thousands) | Net Unrealized Gain (Loss) on Available-for-Sale Debt Securities | Unamortized Gain (Loss) on Held-to-Maturity Securities | Net Unrealized Gain (Loss) on Cash Flow Hedges | Total | |||||||||||||||||||
| Balance, December 31, 2020 | $ | $ | $ | ( | $ | ||||||||||||||||||
| Net change | ( | ( | ( | ||||||||||||||||||||
| Balance, December 31, 2021 | $ | $ | $ | ( | $ | ||||||||||||||||||
| Net change | ( | ( | ( | ||||||||||||||||||||
| Transfer from available-for-sale to held-to-maturity | ( | ||||||||||||||||||||||
| Balance, December 31, 2022 | $ | ( | $ | $ | $ | ( | |||||||||||||||||
| Net change | ( | ||||||||||||||||||||||
| Balance, December 31, 2023 | $ | ( | $ | $ | $ | ( | |||||||||||||||||
The following table presents the pre-tax and after-tax changes in the components of other comprehensive income:
| 2023 | 2022 | 2021 | |||||||||||||||||||||||||||||||||||||||||||||||||||
| ($ in thousands) | Pre-tax | Tax effect | After-tax | Pre-tax | Tax effect | After-tax | Pre-tax | Tax effect | After-tax | ||||||||||||||||||||||||||||||||||||||||||||
| Change in unrealized gain (loss) on available-for-sale securities | $ | $ | $ | $ | ( | $ | ( | $ | ( | $ | ( | $ | ( | $ | ( | ||||||||||||||||||||||||||||||||||||||
| Reclassification of gain on sale of available-for-sale securities(a) | ( | ( | ( | ||||||||||||||||||||||||||||||||||||||||||||||||||
| Reclassification of gain on held-to-maturity securities(a) | ( | ( | ( | ( | ( | ( | ( | ( | ( | ||||||||||||||||||||||||||||||||||||||||||||
| Change in unrealized gain (loss) on cash flow hedges | ( | ( | ( | ||||||||||||||||||||||||||||||||||||||||||||||||||
| Reclassification of loss on cash flow hedges(b) | |||||||||||||||||||||||||||||||||||||||||||||||||||||
| Total other comprehensive income (loss) | $ | $ | $ | $ | ( | $ | ( | $ | ( | $ | ( | $ | ( | $ | ( | ||||||||||||||||||||||||||||||||||||||
(a)The pre-tax amount is reported in noninterest income/expense in the Consolidated Statements of Income.
(b)The pre-tax amount is reported in interest income/expense in the Consolidated Statements of Income.
103
Compensation Plans
The Company has adopted share-based compensation plans to reward and provide long-term incentive for directors and key employees of the Company including its subsidiaries. These plans provide for the granting of stock, stock options, stock-settled stock appreciation rights, and restricted stock units (“RSUs”), and may contain performance terms for key employees as designated by the Company’s Board of Directors upon the recommendation of the Compensation Committee of the Board. The Company uses authorized and unissued shares to satisfy share award exercises.
The total excess income tax benefit (expense) for share-based compensation arrangements was $0.3 million, $0.1 million, and $(0.1 ) million for the years ended December 31, 2023, 2022, and 2021, respectively. At December 31, 2023, there was $14.5 million of total unrecognized compensation cost related to unvested share-based compensation awards. The cost is expected to be recognized over a weighted-average term of approximately 2 years.
The following table summarizes share-based compensation expense:
| ($ in thousands) | 2023 | 2022 | 2021 | ||||||||||||||
| Performance stock units | $ | $ | $ | ||||||||||||||
| Restricted stock units | |||||||||||||||||
| Stock options | |||||||||||||||||
| Employee stock purchase plan | |||||||||||||||||
| Total share-based compensation expense | $ | $ | $ | ||||||||||||||
Performance Stock Units
The Company has entered into long-term incentive agreements with certain key employees. These awards are conditioned on certain performance criteria and market criteria measured against a group of peer banks over a three-year period for each grant. The awards contain minimum (threshold), target, and maximum (exceptional) performance levels. In the event of a change in control, as defined in the plan, the awards will vest at least at the target level. The amount of the awards is determined at the end of the three-year vesting and performance period. The fair value of performance units issued upon vesting in 2023, 2022, and 2021 were $1.6 million, $0.5 million, and $0.9 million, respectively.
Information related to the outstanding grants at December 31, 2023 is shown below:
| ($ in thousands, except per share data) | 2021 - 2023 Cycle | 2022 - 2024 Cycle | 2023 - 2025 Cycle | ||||||||||||||
| Shares issuable at target | |||||||||||||||||
| Maximum shares issuable | |||||||||||||||||
| Unrecognized compensation cost | $ | $ | $ | ||||||||||||||
| Weighted average grant date fair value (per share) | $ | $ | $ | ||||||||||||||
| Maximum Shares Issuable | |||||
| Outstanding at December 31, 2022 | |||||
| Granted | |||||
Vested (issued | ( | ||||
| Outstanding at December 31, 2023 | |||||
104
Restricted Stock Units
The Company awards nonvested stock, in the form of RSUs to employees. RSUs generally are subject to continued employment and generally vest ratably over to five years . Vesting is accelerated upon a change in control or the employee meeting certain retirement criteria. RSUs do not carry voting or dividend rights until vested. Sales of the units are restricted prior to vesting.
Various information related to the RSUs is shown below.
| ($ in thousands) | 2023 | 2022 | 2021 | ||||||||||||||
| Total fair value of awards vesting during the year | $ | $ | $ | ||||||||||||||
| Unrecognized compensation cost | |||||||||||||||||
| Expected years to recognize unearned compensation | |||||||||||||||||
| Weighted average grant date fair value | $ | $ | $ | ||||||||||||||
A summary of the status of the Company’s RSU awards as of December 31, 2023 and changes during the year then ended is presented below.
| Shares | Weighted Average Grant Date Fair Value | |||||||||||||
| Outstanding at December 31, 2022 | $ | |||||||||||||
| Granted | ||||||||||||||
| Vested | ( | |||||||||||||
| Forfeited | ( | |||||||||||||
| Outstanding at December 31, 2023 | $ | |||||||||||||
Stock Options
In determining compensation cost for stock options, the Black-Scholes option-pricing model is used to estimate the fair value on date of grant. The model utilizes several assumptions in its calculations. The risk-free rate for periods within the contractual life of the option is based on the U.S. Treasury yield in effect at the time of the grant. The expected term of options granted is based on the option's vesting schedule and expected exercise patterns and represent the period of time options granted are expected to be outstanding. The expected volatility is based on the historical volatility of the Company's stock and expected term of the option. The dividend yield is determined by annualizing the dividend rate as a percentage of the Company's stock price.
The following weighted average assumptions were used for grants issued during the year ended December 31, 2023.
| Weighted Average | |||||
| Risk Free Interest Rate | |||||
| Expected Dividend Yield | |||||
| Expected Volatility | |||||
| Expected Term (years) | |||||
Non-qualified stock options have been granted to key employees with exercise prices equal to the market price of the Company’s common stock at the date of grant and 10 -year contractual terms. Stock options have a vesting schedule of to five years .
105
Following is a summary of stock option activity for 2023.
| Shares | Weighted Average Exercise Price | Weighted Average Remaining Contractual Term | |||||||||||||||
| Outstanding at December 31, 2022 | $ | ||||||||||||||||
| Granted | |||||||||||||||||
| Exercised | ( | ||||||||||||||||
| Forfeited | ( | ||||||||||||||||
| Outstanding at December 31, 2023 | $ | ||||||||||||||||
| Exercisable at December 31, 2023 | $ | ||||||||||||||||
The intrinsic value of options exercised totaled $0.1 million and $0.1 million in 2023 and 2022, respectively.
Employee Stock Purchase Plan
The Company’s Employee Stock Purchase Plan (“ESPP”) provides its eligible employees with an opportunity to purchase common stock through accumulated payroll contributions. The ESPP provides for shares to be purchased at 85 % of the lesser of the stock price at the enrollment date or the exercise date. The maximum number of shares of common stock available for sale under the ESPP is 750,000 . In 2023, 2022, and 2021, employees purchased 68,286 , 55,123 , and 64,826 shares, respectively, and there are 447,655 remaining shares available under the ESPP at December 31, 2023.
Stock Plan for Non-Management Directors
The Company has adopted a Stock Plan for Non-Management Directors, which provides for issuing up to 400,000 shares of common stock to non-management directors as compensation. At December 31, 2023, there were 108,893 shares of stock available for grant under the Stock Plan for Non-Management Directors, exclusive of 21,269 shares to be issued upon deferral release.
Various information related to the Director Plan is shown below.
| 2023 | 2022 | 2021 | |||||||||||||||
| Shares granted | |||||||||||||||||
| Weighted average grant date fair value | $ | $ | $ | ||||||||||||||
401(k) Plan
The Company has a 401(k) savings plan which covers substantially all full-time employees over the age of 21 and matches 100% of the first 6% of employee contributions. The amount charged to expense for the Company’s contributions to the plan was $6.5 million, $5.8 million and $4.9 million for 2023, 2022, and 2021, respectively.
Deferred Compensation Plan
The Company has a nonqualified deferred compensation plan that permits certain executives to participate and defer up to 25 % of their base salary and/or up to 100 % of their eligible bonus for a plan year. Participants make an irrevocable election when they elect to participate for a plan year to receive the vested account balance following their retirement date, or at a future date not less than five years after the beginning of the plan year. At December 31, 2023, the Company had a liability of $3.7 million related to the deferred compensation plan.
106
NOTE 16 - INCOME TAXES
The components of income tax expense (benefit) for the years ended December 31, are as follows:
| Year ended December 31, | |||||||||||||||||
| ($ in thousands) | 2023 | 2022 | 2021 | ||||||||||||||
| Current: | |||||||||||||||||
| Federal | $ | $ | $ | ||||||||||||||
| State and local | |||||||||||||||||
| Total current | |||||||||||||||||
| Deferred: | |||||||||||||||||
| Federal | |||||||||||||||||
| State and local | ( | ||||||||||||||||
| Total deferred | |||||||||||||||||
| Total income tax expense | $ | $ | $ | ||||||||||||||
A reconciliation of expected income tax expense, computed by applying the statutory federal income tax rate to income before income taxes reflected in the Consolidated Statements of Income is as follows:
| Year ended December 31, | |||||||||||||||||
| ($ in thousands) | 2023 | 2022 | 2021 | ||||||||||||||
| Income tax expense at statutory rate | $ | $ | $ | ||||||||||||||
| Increase (reduction) in income tax resulting from: | |||||||||||||||||
| Tax-exempt interest income, net | ( | ( | ( | ||||||||||||||
| State and local income taxes, net | |||||||||||||||||
| Bank-owned life insurance | ( | ( | ( | ||||||||||||||
| Non-deductible expenses | |||||||||||||||||
| Tax benefit of low-income housing tax credit ("LIHTC") investments, net | ( | ( | ( | ||||||||||||||
| Excess tax benefits | ( | ( | |||||||||||||||
| Federal tax credits | ( | ( | ( | ||||||||||||||
| Non-taxable donation to charitable foundation | ( | ||||||||||||||||
| Other, net | ( | ( | |||||||||||||||
| Total income tax expense | $ | $ | $ | ||||||||||||||
The net amount recognized as a component of tax expense for tax credits, other tax benefits, and amortization from LIHTC investments recognized per the table above was immaterial for the year ended December 31, 2023, and $0.2 million and $0.1 million for the years ended December 31, 2022, and December 31, 2021, respectively. As of December 31, 2023 and 2022, the carrying value of the investments related to low-income housing tax credits was $17.2 million and $7.3 million, respectively. No impairment losses have been recognized from forfeiture or ineligibility of tax credits or other circumstances during the life of any of the investments.
107
A net deferred income tax asset of $76.7 million and $89.0 million is included in other assets in the consolidated balance sheets at December 31, 2023 and 2022, respectively. The tax effect of temporary differences that gave rise to significant portions of the deferred tax assets and deferred tax liabilities is as follows:
| Year ended December 31, | |||||||||||
| ($ in thousands) | 2023 | 2022 | |||||||||
| Deferred tax assets: | |||||||||||
| Allowance for loan losses | $ | $ | |||||||||
| Loans held-for-sale | |||||||||||
| Other real estate | |||||||||||
| Deferred compensation | |||||||||||
| Accrued compensation | |||||||||||
| Unrealized losses on securities, net | |||||||||||
| Net operating losses and tax credits | |||||||||||
| Lease liability accrual | |||||||||||
| Other investments | |||||||||||
| Research and experimental expenses | |||||||||||
| Fixed assets | |||||||||||
| Other deferred tax assets | |||||||||||
| Total deferred tax assets | |||||||||||
| Deferred tax liabilities: | |||||||||||
| Acquired loans | |||||||||||
| Intangible assets | |||||||||||
| Right of use asset | |||||||||||
| Other investments | |||||||||||
| Other deferred tax liabilities | |||||||||||
| Total deferred tax liabilities | |||||||||||
| Net deferred tax asset before valuation allowance | |||||||||||
| Less: valuation allowance | |||||||||||
| Net deferred tax asset | $ | $ | |||||||||
As part of an acquisition in 2019, the company acquired net operating loss, tax credit, and capital loss deferred tax assets. Net operating losses originated in the years 2012, 2014-2017, and 2019 and will expire in the years between 2032-2037. Tax credit carryforwards originated in years 2010-2015 and will expire in the years between 2030-2035.
A valuation allowance is provided on deferred tax assets when it is more likely than not that some portion of the assets will not be realized. The company determined it was more likely than not that some of the acquired net operating loss and tax credit assets would not be realized and has recognized a valuation allowance of $2.8 million at December 31, 2023 and 2022, respectively.
The Company and its subsidiaries file income tax returns in the federal jurisdiction and in thirty-two states. The Company is no longer subject to federal, state or local income tax audits by tax authorities for years before 2018, with the exception of 2016 and 2017 being open years by state taxing authorities. Net operating losses generated prior to 2016 that are utilized going forward would still be subject to examination.
As of December 31, 2023, the gross amount of unrecognized tax benefits was $3.1 million and the total amount of net unrecognized tax benefits that would impact the effective tax rate, if recognized, was $2.4 million compared to $2.2 million and $2.5 million as of December 31, 2022 and 2021, respectively. The Company believes it is reasonably possible the gross amount of unrecognized benefits will be reduced by approximately $0.4 million as a
108
result of a lapse of statute of limitations in the next 12 months. The Company is under audit by the state of Missouri, and while the Company has concluded it has adequately provided for uncertain tax positions, the outcome of such audits are always uncertain and could result in additional tax expense, though immaterial.
The Company recognizes interest and penalties related to uncertain tax positions in income tax expense and classifies such interest and penalties in the liability for unrecognized tax benefits. The amount accrued for interest and penalties was $1.0 million for 2023, $0.6 million as of 2022, and $0.5 million for 2021.
The activity in the gross liability for unrecognized tax benefits was as follows:
| ($ in thousands) | 2023 | 2022 | 2021 | ||||||||||||||
| Balance at beginning of year | $ | $ | $ | ||||||||||||||
| Additions based on tax positions related to the current year | |||||||||||||||||
| Additions for tax positions of prior years | |||||||||||||||||
| Settlements for tax positions of prior years | ( | ( | |||||||||||||||
| Settlements or lapse of statute of limitations | ( | ( | ( | ||||||||||||||
| Balance at end of year | $ | $ | $ | ||||||||||||||
NOTE 17 - COMMITMENTS AND CONTINGENT LIABILITIES
Long-term Lease Commitments
See “Note 5 – Leases” in this report for information regarding the Company’s long-term lease commitments.
Off-balance-Sheet Commitments
The Company issues financial instruments in the normal course of the business of meeting the financing needs of its customers. These financial instruments include commitments to extend credit and standby letters of credit. These instruments may involve, to varying degrees, elements of credit and interest rate risk in excess of the amounts recognized in the consolidated balance sheets. The Company’s extent of involvement and maximum potential exposure to credit loss in the event of nonperformance by the other party to the financial instrument for commitments to extend credit and standby letters of credit is not more than the contractual amount of these instruments. The Company uses the same credit policies in making commitments and conditional obligations as it does for financial instruments included on its consolidated balance sheets.
The contractual amounts of off-balance-sheet financial instruments are as follows:
| ($ in thousands) | December 31, 2023 | December 31, 2022 | |||||||||
| Commitments to extend credit | $ | $ | |||||||||
| Letters of credit | |||||||||||
| Tax credits | |||||||||||
| Limited partnership commitments | |||||||||||
There was an insignificant amount of unadvanced commitments on impaired loans at December 31, 2023 and December 31, 2022. Other liabilities include an allowance for credit losses on unadvanced commitments of $6.6 million and $12.1 million at December 31, 2023 and 2022, respectively.
Commitments to extend credit are agreements to lend to a customer as long as there is no violation of any condition established in the contract. Commitments usually have fixed expiration dates or other termination clauses, may have significant usage restrictions, and may require payment of a fee. Of the total commitments to extend credit at December 31, 2023, and December 31, 2022, $191.6 million and $246.5 million, respectively, represent fixed rate loan commitments. Since certain of the commitments may expire without being drawn upon or may be revoked, the total commitment amounts do not necessarily represent future cash obligations. The Company evaluates each customer’s credit worthiness on a case-by-case basis. The amount of collateral obtained, if deemed necessary by the
109
Company upon extension of credit, is based on management’s credit evaluation of the borrower. Collateral held varies, but may include accounts receivable, inventory, premises and equipment, and real estate.
Letters of credit are conditional commitments issued by the Company to guarantee the performance of a customer to a third party. These letters of credit are issued to support contractual obligations of the Company’s customers. The credit risk involved in issuing letters of credit is essentially the same as the risk involved in extending loans to customers. The approximate remaining term of letters of credit range from one month to 9 years at December 31, 2023.
The Company also has off-balance sheet commitments for purchases of tax credits and commitments for various capital raises for limited partnership investments.
NOTE 18 - FAIR VALUE MEASUREMENTS
The fair value of an asset or liability is the exchange price that would be received to sell that asset or paid to transfer that liability in an orderly transaction occurring in the principal market (or most advantageous market in the absence of a principal market) for such asset or liability. Inputs to valuation techniques include the assumptions that market participants would use in pricing an asset or liability. ASC Topic 820, Fair Value Measurements and Disclosures, establishes a fair value hierarchy for valuation inputs that gives the highest priority to quoted prices in active markets for identical assets or liabilities and the lowest priority to unobservable inputs. The fair value hierarchy is as follows:
•Level 1 Inputs - Unadjusted quoted prices in active markets for identical assets or liabilities that the reporting entity has the ability to access at the measurement date.
•Level 2 Inputs - Inputs other than quoted prices included in Level 1 that are observable for the asset or liability, either directly or indirectly. These might include quoted prices for similar assets or liabilities in active markets, quoted prices for identical or similar assets or liabilities in markets that are not active, inputs other than quoted prices that are observable for the asset or liability (such as interest rates, volatilities, prepayment speeds, credit risks, etc.) or inputs that are derived principally from or corroborated by market data by correlation or other means.
•Level 3 Inputs - Unobservable inputs for determining the fair values of assets or liabilities that reflect an entity’s own assumptions about the assumptions that market participants would use in pricing the assets or liabilities.
110
Fair value on a recurring basis
The following table summarizes financial instruments measured at fair value on a recurring basis, segregated by the level of the valuation inputs within the fair value hierarchy utilized to measure fair value.
| December 31, 2023 | |||||||||||||||||||||||
| ($ in thousands) | Quoted Prices in Active Markets for Identical Assets (Level 1) | Significant Other Observable Inputs (Level 2) | Significant Unobservable Inputs (Level 3) | Total Fair Value | |||||||||||||||||||
| Assets | |||||||||||||||||||||||
| Securities available-for-sale | |||||||||||||||||||||||
| Obligations of U.S. Government-sponsored enterprises | $ | $ | $ | $ | |||||||||||||||||||
| Obligations of states and political subdivisions | |||||||||||||||||||||||
| Residential mortgage-backed securities | |||||||||||||||||||||||
| Corporate debt securities | |||||||||||||||||||||||
| U.S. Treasury Bills | |||||||||||||||||||||||
| Total securities available-for-sale | |||||||||||||||||||||||
| Other investments | |||||||||||||||||||||||
| Derivatives | |||||||||||||||||||||||
| Total assets | $ | $ | $ | $ | |||||||||||||||||||
| Liabilities | |||||||||||||||||||||||
| Derivatives | $ | $ | $ | $ | |||||||||||||||||||
| Total liabilities | $ | $ | $ | $ | |||||||||||||||||||
| December 31, 2022 | |||||||||||||||||||||||
| ($ in thousands) | Quoted Prices in Active Markets for Identical Assets (Level 1) | Significant Other Observable Inputs (Level 2) | Significant Unobservable Inputs (Level 3) | Total Fair Value | |||||||||||||||||||
| Assets | |||||||||||||||||||||||
| Securities available-for-sale | |||||||||||||||||||||||
| Obligations of U.S. Government-sponsored enterprises | $ | $ | $ | $ | |||||||||||||||||||
| Obligations of states and political subdivisions | |||||||||||||||||||||||
| Residential mortgage-backed securities | |||||||||||||||||||||||
| Corporate debt securities | |||||||||||||||||||||||
| U.S. Treasury Bills | |||||||||||||||||||||||
| Total securities available-for-sale | |||||||||||||||||||||||
| Other investments | |||||||||||||||||||||||
| Derivative financial instruments | |||||||||||||||||||||||
| Total assets | $ | $ | $ | $ | |||||||||||||||||||
| Liabilities | |||||||||||||||||||||||
| Derivative financial instruments | $ | $ | $ | $ | |||||||||||||||||||
| Total liabilities | $ | $ | $ | $ | |||||||||||||||||||
•Securities available-for-sale. Fair values for available-for-sale securities are based upon dealer quotes, market spreads, the U.S. Treasury yield curve, trade execution data, market consensus prepayment speeds, credit information and the bond’s terms and conditions at the security level. Changes in fair value are recognized through accumulated other comprehensive income.
111
•Derivatives. Derivatives are reported at fair value utilizing Level 2 inputs. The Company obtains counterparty quotations to value its interest rate swaps and caps. In addition, the Company validates the counterparty quotations with third-party valuation sources. Derivatives with negative fair values are included in Other liabilities in the consolidated balance sheets. Derivatives with positive fair value are included in Other assets in the consolidated balance sheets. Changes in the fair value of client-related derivative instruments are recognized through net income. For the years ended December 31, 2023 and 2022, the gains and losses substantially offset each other due to the Company’s hedging of the client swaps with other bank counterparties.
Fair value on a non-recurring basis
Certain financial assets and financial liabilities are measured at fair value on a non-recurring basis; that is, the instruments are not measured at fair value on an ongoing basis but are subject to fair value adjustments in certain circumstances (for example, when there is evidence of impairment).
•Individually-evaluated loans. On a quarterly basis, fair value adjustments are recorded as necessary on loans that no longer exhibit risk characteristics similar to other loans to account for (1) partial write-downs based on the current appraised or market-quoted value of the underlying collateral or (2) the full charge-off of the loan carrying value. In some cases, the properties for which market quotes or appraised values have been obtained are located in areas where comparable sales data is limited, outdated, or unavailable. In addition, the Company may adjust the valuations based on other relevant market conditions or information. Accordingly, fair value estimates, including those obtained from real estate brokers or other third-party consultants, for collateral-dependent loans are classified in Level 3 of the valuation hierarchy. Fair value estimates on individually-evaluated loans utilizing a discounted cash flow approach are also classified as Level 3.
•Other real estate. These assets are initially reported at fair value, less cost to sell, and subsequently at the lower of cost or fair value, less cost to sell. Fair value is based on third party appraisals of each property and the Company’s judgment of other relevant market conditions. These are considered Level 3 inputs.
•Loan servicing asset. The loan servicing asset is included in Other assets on the Company’s consolidated balance sheets and assessed for impairment on a quarterly basis. Market-based cash flow modeling and discounting models specific to the SBA industry are provided by a third-party valuation service and are considered Level 2 inputs.
The following tables present financial instruments and non-financial assets still held as of the reporting date measured at fair value on a non-recurring basis.
| December 31, 2023 | |||||||||||||||||||||||
| (1) | (1) | (1) | (1) | ||||||||||||||||||||
| ($ in thousands) | Total Fair Value | Quoted Prices in Active Markets for Identical Assets (Level 1) | Significant Other Observable Inputs (Level 2) | Significant Unobservable Inputs (Level 3) | |||||||||||||||||||
| Individually-evaluated loans | $ | $ | $ | $ | |||||||||||||||||||
| Other real estate | |||||||||||||||||||||||
| Total | $ | $ | $ | $ | |||||||||||||||||||
112
| December 31, 2022 | |||||||||||||||||||||||
| (1) | (1) | (1) | (1) | ||||||||||||||||||||
| ($ in thousands) | Total Fair Value | Quoted Prices in Active Markets for Identical Assets (Level 1) | Significant Other Observable Inputs (Level 2) | Significant Unobservable Inputs (Level 3) | |||||||||||||||||||
| Other real estate | |||||||||||||||||||||||
| Loan servicing asset | |||||||||||||||||||||||
| Total | $ | $ | $ | $ | |||||||||||||||||||
Carrying amount and fair value
Following is a summary of the carrying amounts and fair values of the Company’s financial instruments on the consolidated balance sheets at December 31, 2023 and 2022. This summary excludes certain financial assets and liabilities for which carrying value approximates fair value and financial instruments that are recorded at fair value on a recurring basis disclosed above. Financial instruments for which carrying values approximate fair value include cash and due from banks, federal funds sold, interest bearing deposits, accrued interest receivable/payable, demand, savings and money market deposits.
| December 31, 2023 | December 31, 2022 | ||||||||||||||||||||||||||||||||||
| ($ in thousands) | Carrying Amount | Estimated fair value | Level | Carrying Amount | Estimated fair value | Level | |||||||||||||||||||||||||||||
| Balance sheet assets | |||||||||||||||||||||||||||||||||||
| Securities held-to-maturity | $ | $ | Level 2 | $ | $ | Level 2 | |||||||||||||||||||||||||||||
| Other investments | Level 2 | Level 2 | |||||||||||||||||||||||||||||||||
| Loans held-for-sale | Level 2 | Level 2 | |||||||||||||||||||||||||||||||||
| Loans, net | Level 3 | Level 3 | |||||||||||||||||||||||||||||||||
| State tax credits, held-for-sale | Level 3 | Level 3 | |||||||||||||||||||||||||||||||||
| Servicing asset | Level 2 | Level 2 | |||||||||||||||||||||||||||||||||
| Balance sheet liabilities | |||||||||||||||||||||||||||||||||||
| Certificates of deposit | $ | $ | Level 3 | $ | $ | Level 3 | |||||||||||||||||||||||||||||
| Subordinated debentures and notes | Level 2 | Level 2 | |||||||||||||||||||||||||||||||||
| FHLB advances | Level 2 | Level 2 | |||||||||||||||||||||||||||||||||
| Other borrowings | Level 2 | Level 2 | |||||||||||||||||||||||||||||||||
Limitations
Fair value estimates are made at a specific point in time based on relevant market information and information about the financial instrument. These estimates are subjective in nature and involve uncertainties and matters of significant judgment, and therefore, cannot be determined with precision. Such estimates include the valuation of loans, goodwill, intangible assets, and other long-lived assets, along with assumptions used in the calculation of income taxes, among others. These estimates and assumptions are based on management’s best estimates and judgment. Management evaluates its estimates and assumptions on an ongoing basis using experience and other factors, including the current economic environment. Such estimates and assumptions are adjusted when facts and circumstances dictate. Changing real estate values, illiquid credit markets, volatile equity markets, and changes in consumer spending have combined to increase the uncertainty inherent in such estimates and assumptions. As future events and their effects cannot be determined with precision, actual results could differ significantly from these estimates. Changes in estimates resulting from continuing changes in the economic environment will be reflected in the financial statements in future periods. In addition, these estimates do not reflect any premium or discount that could result from offering for sale the Company’s entire holdings of a particular financial instrument at one time. Fair value estimates are based on existing on-balance and off-balance-sheet financial instruments without attempting to estimate the value of anticipated future business and the value of assets and liabilities that are not
113
considered financial instruments. In addition, the tax ramifications related to the realization of the unrealized gains and losses can have a significant effect on fair value estimates and have not been considered in many of the estimates.
NOTE 19 - PARENT COMPANY ONLY CONDENSED FINANCIAL STATEMENTS
Condensed Balance Sheets
| December 31, | |||||||||||
| ($ in thousands) | 2023 | 2022 | |||||||||
| Assets | |||||||||||
| Cash | $ | $ | |||||||||
| Investment in Bank | |||||||||||
| Investment in nonbank subsidiaries | |||||||||||
| Other assets | |||||||||||
| Total assets | $ | $ | |||||||||
| Liabilities and Shareholders’ Equity | |||||||||||
| Subordinated debentures and notes | $ | $ | |||||||||
| Notes payable | |||||||||||
| Accounts payable and other liabilities | |||||||||||
| Shareholders' equity | |||||||||||
| Total liabilities and shareholders' equity | $ | $ | |||||||||
114
Condensed Statements of Income
| Year ended December 31, | |||||||||||||||||
| ($ in thousands) | 2023 | 2022 | 2021 | ||||||||||||||
| Income: | |||||||||||||||||
| Dividends from Bank | $ | $ | $ | ||||||||||||||
| Dividends from nonbank subsidiaries | |||||||||||||||||
| Other | |||||||||||||||||
| Total income | |||||||||||||||||
| Expenses: | |||||||||||||||||
| Interest expense | |||||||||||||||||
| Other expenses | |||||||||||||||||
| Total expenses | |||||||||||||||||
| Income before taxes and equity in undistributed earnings of subsidiaries | |||||||||||||||||
| Income tax benefit | |||||||||||||||||
| Net income before equity in undistributed earnings of subsidiaries | |||||||||||||||||
| Equity in undistributed earnings of subsidiaries | |||||||||||||||||
| Net income | $ | $ | $ | ||||||||||||||
115
Condensed Statements of Cash Flows
| Year ended December 31, | |||||||||||||||||
| ($ in thousands) | 2023 | 2022 | 2021 | ||||||||||||||
| Cash flows from operating activities: | |||||||||||||||||
| Net income | $ | $ | $ | ||||||||||||||
| Adjustments to reconcile net income to net cash provided by operating activities: | |||||||||||||||||
| Share-based compensation | |||||||||||||||||
| Net income of subsidiaries | ( | ( | ( | ||||||||||||||
| Dividends from subsidiaries | |||||||||||||||||
| Other, net | ( | ( | |||||||||||||||
Net cash provided by operating activities | |||||||||||||||||
| Cash flows from investing activities: | |||||||||||||||||
| Proceeds from acquisitions, net of cash acquired | |||||||||||||||||
| Purchases of other investments | ( | ( | ( | ||||||||||||||
| Proceeds from distributions on other investments | |||||||||||||||||
Net cash provided by investing activities | |||||||||||||||||
| Cash flows from financing activities: | |||||||||||||||||
| Payments for the redemption of subordinated notes | ( | ||||||||||||||||
| Repayment of long-term debt | ( | ( | ( | ||||||||||||||
| Dividends paid on common stock | ( | ( | ( | ||||||||||||||
| Payments for the repurchase of common stock | ( | ( | |||||||||||||||
| Proceeds from issuance of preferred stock | |||||||||||||||||
| Dividends paid on preferred stock | ( | ( | |||||||||||||||
| Other | |||||||||||||||||
Net cash used in financing activities | ( | ( | ( | ||||||||||||||
| Net increase in cash and cash equivalents | |||||||||||||||||
| Cash and cash equivalents, beginning of year | |||||||||||||||||
| Cash and cash equivalents, end of year | $ | $ | $ | ||||||||||||||
| Supplemental disclosures of cash flow information: | |||||||||||||||||
| Noncash transactions: | |||||||||||||||||
| Common shares issued in connection with acquisitions | $ | $ | $ | ||||||||||||||
116
NOTE 20 - SUPPLEMENTAL FINANCIAL INFORMATION
The following table presents other income and other expense components that primarily exceed one percent of the aggregate of total interest income and noninterest income in one or more of the periods indicated:
| Year ended December 31, | |||||||||||||||||
| ($ in thousands) | 2023 | 2022 | 2021 | ||||||||||||||
| Other income: | |||||||||||||||||
| Community development fees | $ | $ | $ | ||||||||||||||
| Bank-owned life insurance | |||||||||||||||||
| Other income | |||||||||||||||||
| Total other noninterest income | $ | $ | $ | ||||||||||||||
| Other expense: | |||||||||||||||||
| Amortization of intangibles | $ | $ | $ | ||||||||||||||
| Banking expenses | |||||||||||||||||
| FDIC and other insurance | |||||||||||||||||
| Loan, legal expenses | |||||||||||||||||
| Outside services | |||||||||||||||||
| Other expenses | |||||||||||||||||
| Total other noninterest expenses | $ | $ | $ | ||||||||||||||
117
ITEM 9: CHANGES IN AND DISAGREEMENTS WITH ACCOUNTANTS ON ACCOUNTING AND FINANCIAL DISCLOSURE
None.
ITEM 9A: CONTROLS AND PROCEDURES
Evaluation of Disclosure Controls and Procedures
Our management, with the participation of our Chief Executive Officer and our Chief Financial Officer, evaluated the Company’s disclosure controls and procedures (as defined in Rule 13a-15(e) and 15d-15(e) under the Securities Exchange Act of 1934, as amended, the “Act”) as of December 31, 2023. Based upon this evaluation, our Chief Executive Officer and our Chief Financial Officer have concluded that as of December 31, 2023, such disclosure controls and procedures were effective to ensure that information required to be disclosed by the Company in the reports it files or submits under the Act is accumulated and communicated to the Company’s management (including the Chief Executive Officer and Chief Financial Officer) to allow timely decisions regarding required disclosure, and is recorded, processed, summarized and reported within the time periods specified in the SEC’s rules and forms.
Management’s Assessment of Internal Control Over Financial Reporting
Management of the Company is responsible for establishing and maintaining adequate internal control over financial reporting (as defined in Rule 13a-15(f) and 15(d)-15(f) under the Act). The Company’s internal control system is a process designed to provide reasonable assurance to the Company’s management and Board of Directors regarding the preparation and fair presentation of published financial statements.
The Company’s internal control over financial reporting includes policies and procedures that pertain to the maintenance of records that, in reasonable detail, accurately and fairly reflect transactions and dispositions of assets; provide reasonable assurances that transactions are recorded as necessary to permit preparation of financial statements in accordance with accounting principles generally accepted in the United States of America, and that receipts and expenditures are being made only in accordance with authorizations of management and the directors of the Company; and provide reasonable assurance regarding prevention or untimely detection of unauthorized acquisition, use or disposition of the Company’s assets that could have a material effect on the Company’s financial statements.
All internal control systems, no matter how well designed, have inherent limitations. Therefore, even those systems determined to be effective can provide only reasonable assurance with respect to financial reporting. Further, because of changes in conditions, the effectiveness of any system of internal control may vary over time. The design of any internal control system also factors in resource constraints and consideration for the benefit of the control relative to the cost of implementing the control. Because of these inherent limitations in any system of internal control, management cannot provide absolute assurance that all control issues and instances of fraud within the Company have been detected.
Management assessed the effectiveness of the Company’s internal control over financial reporting as of December 31, 2023. In making this assessment, management used the criteria set forth by the Internal Control - Integrated Framework (2013) issued by the Committee of Sponsoring Organizations of the Treadway Commission. Management has concluded that the Company maintained an effective system of internal control over financial reporting based on these criteria as of December 31, 2023.
The Company’s independent registered public accounting firm, Deloitte & Touche LLP, who audited the consolidated financial statements, has issued an audit report on the Company’s internal control over financial reporting as of December 31, 2023, and it is included herein.
118
Changes in Internal Control Over Financial Reporting
There have been no changes in the Company’s internal control over financial reporting (as defined in Rule 13a-15(f) and 15d-15(f) under the Act) that occurred during the Company’s quarter ended December 31, 2023 that have materially affected, or are reasonably likely to materially affect, the Company’s internal control over financial reporting.
ITEM 9B: OTHER INFORMATION
During the year ended December 31, 2023, no officer or director of the company adopted terminated
ITEM 9C: DISCLOSURE REGARDING FOREIGN JURISDICTIONS THAT PREVENT INSPECTIONS
Not applicable.
PART III
ITEM 10: DIRECTORS, EXECUTIVE OFFICERS AND CORPORATE GOVERNANCE
The information required by this item is incorporated herein by reference to the Board and Committee Information and Executive Officer sections of the Company’s Proxy Statement for its 2024 Annual Meeting of Shareholders, which will be filed pursuant to Regulation 14A under the Securities Exchange Act of 1934, as amended, not later than 120 days after December 31, 2023.
Governance:
The Company has adopted a Code of Ethics applicable to all of its directors and employees, including the principal executive officer, principal financial officer and principal accounting officer. A copy of the Code of Ethics is available on the Company’s website at www.enterprisebank.com.
ITEM 11: EXECUTIVE COMPENSATION
The information required by this item is incorporated herein by reference to the Executive Compensation section of the Company’s Proxy Statement for its 2024 Annual Meeting of Stockholders, which will be filed pursuant to Regulation 14A under the Securities Exchange Act of 1934, as amended, not later than 120 days after December 31, 2023.
119
ITEM 12: SECURITY OWNERSHIP OF CERTAIN BENEFICIAL OWNERS AND MANAGEMENT AND RELATED STOCKHOLDER MATTERS
Securities Authorized for Issuance Under Equity Compensation Plans
The following table provides information regarding the securities authorized for issuance under our equity compensation plans as of December 31, 2023.
EQUITY COMPENSATION PLAN INFORMATION
| Plan Category | Number of securities to be issued upon exercise of outstanding options, warrants and rights (a) | Weighted-average exercise price of outstanding options, warrants and rights (b) | Number of securities remaining available for future issuance under equity compensation plans (excluding securities reflected in column (a)) (c) | |||||||||||||||||
| Equity compensation plans approved by security holders | 918,220 | $ | 49.11 | 1,288,975 | ||||||||||||||||
| Equity compensation plans not approved by security holders | — | — | — | |||||||||||||||||
| Total | 918,220 | $ | 49.11 | 1,288,975 | ||||||||||||||||
(a) Includes the following:
•290,141 shares of common stock to be issued upon vesting of outstanding restricted stock units under the 2018 Stock Incentive Plan;
•273,202 shares of common stock to be issued upon vesting of outstanding performance units under the 2018 Stock Incentive Plan;
•333,608 shares of common stock to be issued upon exercise of outstanding non-qualified stock options; and
•21,269 shares of common stock to be issued upon deferral release of common stock under the Non-Management Director Stock Plan.
(b) Includes the following:
•price only applicable to the outstanding non-qualified stock options.
(c) Includes the following:
•732,427 shares of common stock available for issuance under the 2018 Stock Incentive Plan;
•108,893 shares of common stock available for issuance under the Non-Management Director Stock Plan; and
•447,655 shares of common stock available for issuance under the 2018 Employee Stock Purchase Plan.
Additional information required by this item is incorporated herein by reference to the Information Regarding Beneficial Ownership section of the Company’s Proxy Statement for its 2024 Annual Meeting of Stockholders, which will be filed pursuant to Regulation 14A under the Securities Exchange Act of 1934, as amended, not later than 120 days after December 31, 2023.
ITEM 13: CERTAIN RELATIONSHIPS AND RELATED TRANSACTIONS, AND DIRECTOR INDEPENDENCE
The information required by this item is incorporated herein by reference to the Related Person Transactions section of the Company’s Proxy Statement for its 2024 Annual Meeting of Stockholders, which will be filed pursuant to Regulation 14A under the Securities Exchange Act of 1934, as amended, not later than 120 days after December 31, 2023.
120
ITEM 14: PRINCIPAL ACCOUNTANT FEES AND SERVICES
The information required by this item is incorporated by reference to the Fees Paid to Independent Registered Public Accounting Firm section of the Company’s Proxy Statement for its 2024 Annual Meeting of Stockholders, which will be filed pursuant to Regulation 14A under the Securities Exchange Act of 1934, as amended, not later than 120 days after December 31, 2023.
121
PART IV
ITEM 15: EXHIBITS AND FINANCIAL STATEMENT SCHEDULES
(a) 1. Financial Statements
The following consolidated financial statements of Enterprise Financial Services Corp and its subsidiaries and independent auditors’ reports are included in Part II, Item 8, of this Form 10-K and are incorporated by reference from Part II, Item 8 hereof:
Report of Independent Registered Public Accounting Firm
Consolidated Balance Sheets at December 31, 2023 and 2022
Consolidated Statements of Income for the years ended December 31, 2023, 2022, and 2021
Consolidated Statements of Comprehensive Income for the years ended December 31, 2023, 2022, and 2021
Consolidated Statements of Shareholders’ Equity for the years ended December 31, 2023, 2022, and 2021
Consolidated Statements of Cash Flows for the years ended December 31, 2023, 2022, and 2021
Notes to Consolidated Financial Statements
2. Financial Statement Schedules
All financial statement schedules have been omitted, as they are either inapplicable or included in the Notes to Consolidated Financial Statements.
3. Exhibits
No. Description
2.1 Agreement and Plan of Merger, dated April 26, 2021 by and among Enterprise Financial Services Corp, Enterprise Bank & Trust, First Choice Bancorp and First Choice Bank (incorporated by reference to Exhibit 2.1 to the Registrant’s Current Report on Form 8-K filed with the SEC on April 26, 2021 (File No. 001-15373)).
122
4.1 Description of Registrant’s Securities (incorporated by reference to Exhibit 4.1 to Registrant's Report on Form 10-K filed on February 25, 2022 (File No. 001-15373)).
4.2 Long-term borrowing instruments are omitted pursuant to Item 601(b)(4)(iii) of Regulation S-K. The Company undertakes to furnish copies of such instruments to the Securities and Exchange Commission upon request.
10.1.1* Executive Employment Agreement by and between Enterprise Financial Services Corp and James B. Lally, dated May 2, 2017 (incorporated by reference to Exhibit 10.1.1 to the Current Report on Form 8-K of Registrant, filed with the Commission on June 6, 2017 (File No. 001-15373)), and amended by that First Amendment to Executive Employment Agreement dated as of August 4, 2023 (incorporated by reference to Exhibit 10.1.1 to Registrant’s Quarterly Report on Form 10-Q for the period ending June 30, 2023 (File No. 001-15373)).
10.1.2* Executive Employment Agreement dated September 13, 2013 by and between Enterprise Financial Services Corp and Keene S. Turner (incorporated by reference herein to Exhibit 10.1 to Registrant’s Quarterly Report on Form 10-Q for the period ending September 30, 2013 (File No. 001-15373)), amended by that First Amendment of Executive Employment Agreement dated as of February 27, 2015 (incorporated herein by reference to Exhibit 10.1.7 to the Registrant’s Annual Report on Form 10-K filed on February 27, 2015 (File No. 001-15373)), amended by that Second Amendment to Executive Employment Agreement dated as of October 29, 2015 (incorporated by reference to Exhibit 10.1.2 to the Registrant’s Quarterly Report on Form 10-Q for the period ending September 30, 2015 (File No. 001-15373)), and amended by that Third Amendment to Executive Employment Agreement dated as of August 4, 2023 (incorporated by reference to Exhibit 10.2 to Registrant’s Quarterly Report on Form 10-Q for the period ending June 30, 2023 (File No. 001-15373)).
123
10.1.3* Executive Employment Agreement dated effective January 1, 2005 by and between Enterprise Financial Services Corp and Scott R. Goodman, amended by that First Amendment of Executive Employment Agreement dated as of December 31, 2008 (incorporated herein by reference to Exhibit 10.1.5 to Registrant’s Annual Report on Form 10-K filed on March 15, 2013 (File 001-15373)), amended by that Second Amendment of Executive Employment Agreement dated October 11, 2013 (incorporated herein by reference to Exhibit 10.1.5 to Registrant’s Annual Report on Form 10-K filed on March 17, 2014 (File 001-15373)), and amended by that Third Amendment to Executive Employment Agreement dated as of August 4, 2023 (incorporated by reference to Exhibit 10.3 to Registrant’s Quarterly Report on Form 10-Q for the period ending June 30, 2023 (File No. 001-15373)).
10.1.4* Amended and Restated Executive Employment Agreement dated as of October 24, 2019 by and between Enterprise Financial Services Corp and Douglas N. Bauche (incorporated herein by reference to Exhibit 10.1 to the Quarterly Report on Form 10-Q of the Registrant, filed with the Commission on October 25, 2019 (File No. 001-15373)), and amended by that First Amendment to Executive Employment Agreement dated as of August 4, 2023 (incorporated by reference to Exhibit 10.4 to Registrant’s Quarterly Report on Form 10-Q for the period ending June 30, 2023 (File No. 001-15373)).
10.1.5* Executive Employment Agreement dated as of October 24, 2019 by and between Enterprise Financial Services Corp and Nicole M. Iannacone (incorporated herein by reference to Exhibit 10.2 to the Quarterly Report on Form 10-Q of the Registrant, filed with the Commission on October 25, 2019 (File No. 001-15373)), and amended by that First Amendment to Executive Employment Agreement dated as of August 4, 2023 (incorporated by reference to Exhibit 10.5 to Registrant’s Quarterly Report on Form 10-Q for the period ending June 30, 2023 (File No. 001-15373)).
10.1.6*+ Executive Employment Agreement dated as of October 24, 2019 by and between Enterprise Financial Services Corp and Mark G. Ponder (incorporated herein by reference to Exhibit 10.3 to the Quarterly Report on Form 10-Q of the Registrant, filed with the Commission on October 25, 2019 (File No. 001-15373)), and amended by that First Amendment to Executive Employment Agreement dated as of August 4, 2023.
10.1.8* Enterprise Financial Services Corp Stock Plan for Non-Management Directors (incorporated herein by reference to Registrant’s Proxy Statement on Schedule 14-A filed on March 7, 2006, as amended on Schedule 14A filed on April 23, 2012 (File No. 001-15373), and as amended on Schedule 14A filed on April 17, 2019 (File No. 001-15373), and as amended on Schedule 14A filed on March 29, 2023 (File No. 001-15373)).
10.1.10* Enterprise Financial Services Corp Amended and Restated 2018 Stock Incentive Plan (incorporated herein by reference to Appendix A to Registrant’s Proxy Statement on Schedule 14A, filed on March 14, 2018 (File No. 001-15373), and as further amended by the Proxy Statements filed on March 17, 2021 (File No. 000-15373) and March 29, 2023 (File No. 000-15373)).
124
24.1+ Power of Attorney.
101+ Pursuant to Rule 405 of Regulation S-T, the following financial information from the Company’s Annual Report on Form 10-K for the period ended December 31, 2023, is formatted in Inline XBRL interactive data files: (i) Consolidated Balance Sheet at December 31, 2023 and December 31, 2022; (ii) Consolidated Statements of Income for the years ended December 31, 2023, 2022, and 2021; (iii) Consolidated Statements of Comprehensive Income for the years ended December 31, 2023, 2022, and 2021; (iv) Consolidated Statements of Shareholders’ Equity for the years ended December 31, 2023, 2022, and 2021; (v) Consolidated Statements of Cash Flows for the years ended December 31, 2023, 2022, and 2021; and (vi) Notes to Consolidated Financial Statements.
104+ The cover page of Enterprise Financial Services Corp’s Annual Report on Form 10-K for the year ended December 31, 2023, formatted in Inline XBRL (contained in Exhibit 101).
* Management contract or compensatory plan or arrangement.
+ Filed herewith
(b) The exhibits not incorporated by reference herein are filed herewith.
(c) The financial statement schedules are either included in the Notes to Consolidated Financial Statements or omitted if inapplicable.
ITEM 16: FORM 10-K SUMMARY
None.
125
SIGNATURES
Pursuant to the requirements of Section 13 or 15(d) of the Securities Exchange Act of 1934, as amended, the Registrant has duly caused this report to be signed on its behalf by the undersigned, thereunto duly authorized on February 26, 2024.
ENTERPRISE FINANCIAL SERVICES CORP
| /s/ James B. Lally | ||
| James B. Lally | ||
| Chief Executive Officer and Director | ||
126
Pursuant to the requirements of the Securities Exchange Act of 1934, this report has been signed by the following persons on behalf of the registrant and in the capacities indicated on February 26, 2024.
| Signatures | Title | |||||||
| /s/ James B. Lally | Chief Executive Officer and Director (Principal Executive Officer) | |||||||
| James B. Lally | ||||||||
| /s/ Keene S. Turner | Executive Vice President and Chief Financial Officer (Principal Financial Officer) | |||||||
| Keene S. Turner | ||||||||
| /s/ Troy R. Dumlao | Chief Accounting Officer (Principal Accounting Officer) | |||||||
| Troy R. Dumlao | ||||||||
| /s/ Michael A. DeCola* | ||||||||
| Michael A. DeCola | Chairman of the Board of Directors | |||||||
| /s/ Lyne B. Andrich* | ||||||||
| Lyne B. Andrich | Director | |||||||
| /s/ Robert E. Guest, Jr.* | ||||||||
| Robert E. Guest, Jr. | Director | |||||||
| /s/ James M. Havel* | ||||||||
| James M. Havel | Director | |||||||
| /s/ Michael R. Holmes* | ||||||||
| Michael R. Holmes | Director | |||||||
| /s/ Nevada A. Kent, IV* | ||||||||
| Nevada A. Kent, IV | Director | |||||||
| /s/ Marcela Manjarrez* | ||||||||
| Marcela Manjarrez | Director | |||||||
| /s/ Stephen P. Marsh* | ||||||||
| Stephen P. Marsh | Director | |||||||
| /s/ Daniel A. Rodrigues* | ||||||||
| Daniel A. Rodrigues | Director | |||||||
| /s/ Richard M. Sanborn* | ||||||||
| Richard M. Sanborn | Director | |||||||
| /s/ Eloise E. Schmitz* | ||||||||
| Eloise E. Schmitz | Director | |||||||
| /s/ Sandra A. Van Trease* | ||||||||
| Sandra A. Van Trease | Director | |||||||
| /s/ Lina A. Young* | ||||||||
| Lina A. Young | Director | |||||||
*By: /s/ Keene S. Turner
Keene S. Turner
Attorney-In-Fact
February 26, 2024
127