Item
UNITED STATES
SECURITIES AND EXCHANGE COMMISSION
WASHINGTON, D.C. 20549
FORM
ANNUAL REPORT PURSUANT TO SECTION 13 OR 15(d) OF THE SECURITIES EXCHANGE ACT OF 1934 |
For the fiscal year ended
OR
TRANSITION REPORT PURSUANT TO SECTION 13 OR 15(d) OF THE SECURITIES EXCHANGE ACT OF 1934 |
For The Transition Period From To
Commission file number:
(Exact name of registrant as specified in its charter)
(State of Other Jurisdiction of incorporation or Organization) | (I.R.S. Employer Identification No.) |
(Address of principal executive offices) | (Zip code) |
Registrant’s telephone number, including area code: (
Securities registered pursuant to Section 12(b) of the Act:
Name Of Each Exchange | ||||
Title of Each Class |
| Trading Symbol(s) |
| On Which Registered |
Securities registered pursuant to Section 12(g) of the Act: None
Indicate by check mark if the registrant is a well-known seasoned issuer, as defined in Rule 405 of the Securities Act.
Yes ☐
Indicate by check mark if the registrant is not required to file reports pursuant to Section 13 or Section 15(d) of the Act.
Yes ☐
Indicate by check mark whether the registrant (1) has filed all reports required to be filed by Section 13 or 15(d) of the Securities Exchange Act of 1934 during the preceding 12 months (or for such shorter period that the registrant was required to file such reports), and (2) has been subject to such filing requirements for the past 90 days.
Indicate by check mark whether the registrant has submitted electronically; every Interactive Data File required to be submitted pursuant to Rule 405 of Regulation S-T (§232.0405 of this chapter) during the preceding 12 months (or for such shorter period that the registrant was required to submit such files).
Indicate by check mark whether the registrant is a large accelerated filer, an accelerated filer, a non-accelerated filer, a smaller reporting company, or an emerging growth company. See the definitions of “large accelerated filer,” “accelerated filer,” “smaller reporting company,” and “emerging growth company” in Rule 12b-2 of the Exchange Act.
Large accelerated filer ☐ | Non-accelerated filer ☐ | Smaller reporting company | Emerging growth company |
If an emerging growth company, indicate by check mark if the registrant has elected not to use the extended transition period for complying with any new or revised financial accounting standards provided pursuant to Section 13(a) of the Exchange Act.
Indicate by check mark whether the registrant has filed a report on and attestation to its management’s assessment of the effectiveness of its internal control over financial reporting under Section 404(b) of the Sarbanes-Oxley Act (15 U.S.C. 7262(b)) by the registered public accounting firm that prepared or issued its audit report.
If securities are registered pursuant to Section 12(b) of the Act, indicate by check mark whether the financial statements of the registrant included in the filing reflect the correction of an error to previously issued financial statements.
Indicate by check mark whether any of those error corrections are restatements that required a recovery analysis of incentive-based compensation received by any of the registrant’s executive officers during the relevant recovery period pursuant to §240.10D-1(b). ☐
Indicate by check mark whether the registrant is a shell company (as defined in Rule 12b-2 of the Act). Yes
The aggregate market value of the registrant’s Class A common stock held by non-affiliates of the registrant on June 30, 2023, based on the closing price of $11.22 for shares of the registrant’s Class A common stock as reported by the New York Stock Exchange, was $
As of March 8, 2024, the registrant had
Documents Incorporated by Reference
Portions of the registrant's Definitive Proxy Statement relating to the 2024 Annual Meeting of Stockholders are incorporated by reference into Part III of this Annual Report on Form 10-K where indicated. Such Definitive Proxy Statement will be filed with the Securities and Exchange Commission within 120 days after the end of the registrant's fiscal year ended December 31, 2023.
TABLE OF CONTENTS
2
CAUTIONARY STATEMENT
This Annual Report on Form 10-K contains forward-looking statements about us and our industry that involve substantial risks and uncertainties. All statements other than statements of historical facts contained in this Annual Report on Form 10-K, including statements regarding our future results of operations, financial condition, business strategy, plans and objectives of management for future operations, our market opportunity and the potential growth of that market, our liquidity and capital needs and other similar matters, are forward-looking statements. In some cases, you can identify forward-looking statements because they contain words such as “anticipate,” “believe,” “contemplate,” “continue,” “could,” “estimate,” “expect,” “intend,” “may,” “plan,” “potential,” “predict,” “project,” “should,” “target,” “will,” or “would,” or the negative of these words or other similar terms or expressions. These forward-looking statements are based on management’s current expectations and assumptions about future events, which are inherently subject to uncertainties, risks, and changes in circumstances that are difficult to predict. Forward-looking statements contained in this Annual Report on Form 10-K include, but are not limited to, statements concerning the following:
| ● | our future financial performance, including our revenues, costs of revenues, gross profit or gross profit margin and operating expenses; |
| ● | our ability to successfully expand in our existing markets and into new markets; |
| ● | anticipated trends and growth rates in our business and in the markets in which we operate; |
| ● | our ability to retain existing clients and onboard new clients; |
| ● | our ability to sell additional products and services to our clients; |
| ● | our ability to successfully identify, integrate and realize the benefits of strategic acquisitions or partnerships; |
| ● | our ability to effectively manage our growth and future expenses; |
| ● | our anticipated investments in our business, our anticipated capital expenditures, and our estimates regarding our capital requirements; |
| ● | our ability to maintain the security and availability of the products and services that comprise our solution; |
| ● | our ability to maintain, protect and enhance our intellectual property; |
| ● | our ability to comply with modified or new laws and regulations applying to our business; |
| ● | the attraction and retention of qualified employees and key personnel; |
| ● | the impact of global financial, economic, and political events on our business and industry; and |
| ● | our ability to compete effectively with existing competitors and new market entrants. |
You should not rely upon forward-looking statements as predictions of future events. We have based the forward-looking statements contained in this Annual Report on Form 10-K primarily on our current expectations and projections about future events and trends that we believe may affect our business, financial condition, results of operations and prospects. The outcome of the events described in these forward-looking statements is subject to risks, uncertainties and other factors described in Part I, Item 1A. Risk Factors and elsewhere in this Annual Report on Form 10-K. Moreover, we operate in a very competitive and rapidly changing environment. New risks and uncertainties emerge from time to time, and it is not possible for us to predict all risks and uncertainties that could have an impact on the forward-looking statements contained in this Annual Report on Form 10-K. The results, events and circumstances reflected in the forward-looking statements may not be achieved or occur, and actual results, events, or circumstances could differ materially from those described in the forward-looking statements.
The forward-looking statements made in this Annual Report on Form 10-K relate only to events as of the date on which the statements are made. We undertake no obligation to update any forward-looking statements made in this Annual Report on Form 10-K to reflect events or circumstances after the date of this Annual Report on Form 10-K or to reflect new information or the occurrence of unanticipated events, except as required by law. We may not actually achieve the plans, intentions or expectations disclosed in our forward-looking statements and you should not place undue reliance on our forward-looking statements. Our forward-looking statements do not reflect the potential impact of any future acquisitions, mergers, dispositions, joint ventures, or investments we may make.
3
In addition, statements that “we believe” and similar statements reflect our beliefs and opinions on the relevant subject. These statements are based upon information available to us as of the date of this Annual Report on Form 10-K. And while we believe such information provides a reasonable basis for such statements, such information may be limited or incomplete. Our statements should not be read to indicate that we have conducted an exhaustive inquiry into, or review of, all potentially available relevant information. These statements are inherently uncertain, and you are cautioned not to unduly rely upon these statements.
CERTAIN DEFINITIONS
As used in this Annual Report on Form 10-K, unless the context otherwise requires:
| ● | “Blocker Companies” refer to certain entities that are taxable as corporations for U.S. federal income tax purposes in which the Pre-IPO Shareholders held interests. |
| ● | “Common Units” refers to the new class of units of Enfusion Ltd. LLC created by the reclassification of the LLC interests of Enfusion Ltd. LLC as part of the Reorganization Transactions. |
| ● | “Enfusion,” the “Company,” “we,” “us” and “our” and similar references refer: (1) following the consummation of the Reorganization Transactions, including our IPO, to Enfusion, Inc., and, unless otherwise stated, all of its direct and indirect subsidiaries, including Enfusion Ltd. LLC and (2) prior to the completion of the Reorganization Transactions, including our IPO, to Enfusion Ltd. LLC and, unless otherwise stated, all of its direct and indirect subsidiaries. |
| ● | “IPO” refers to the Company’s initial public offering, completed on October 25, 2021. |
| ● | “LLC Operating Agreement” refers to the Seventh Amended and Restated Operating Agreement of Enfusion Ltd, LLC, dated as of October 19, 2021. |
| ● | “New Credit Agreement” refers to the senior secured Credit Agreement, dated September 15, 2023, which Enfusion, Inc., Enfusion Ltd. LLC and certain subsidiaries of Enfusion Ltd. LLC entered into with Bank of America, N.A., as administrative agent, swing line lender and L/C issuer, and a syndicate of lending institutions from time to time party thereto. |
| ● | “Pre-IPO Owners” refer to the equity holders who were the owners of Enfusion Ltd. LLC immediately prior to the Reorganization Transactions. |
| ● | “Pre-IPO Shareholders” refer to Pre-IPO Owners that received shares of Class A common stock of Enfusion, Inc. as part of the Reorganization Transactions. |
| ● | “Pre-IPO Common Unitholders” refer to Pre-IPO Owners that held Common Units following the Reorganization Transactions. |
| ● | “Prior Credit Agreement” refers to the amended and restated Credit Agreement with Silicon Valley Bank, dated October 19, 2021, which was terminated in connection with our entry into the New Credit Agreement. |
| ● | “Reorganization Transactions” refer to our IPO and certain organizational transactions that were affected in connection with our IPO, and the application of the net proceeds therefrom. See “Initial Public Offering and Reorganization Transactions” in Note 2 to our consolidated financial statements included in our Annual Report on Form 10-K for the year ended December 31, 2021 for a description of the transactions. |
| ● | “SEC” refers to the U.S. Securities & Exchange Commission. |
| ● | “Tax Receivable Agreement” refers to the Tax Receivable Agreement, dated as of October 19, 2021, entered into by and among the Company and each of the other persons from time to time party thereto. |
| ● | “U.S. GAAP” refers to accounting principles generally accepted in the United States of America. |
4
PART I
Item 1. Business
Overview
Enfusion is a global, high-growth, software-as-a-service (“SaaS”), provider focused on transforming the investment management industry. The products and services that comprise our solution are designed to eliminate technology and information barriers, empowering investment managers to confidently make and execute better-informed investment decisions in real time. We simplify investment and operational workflows by unifying mission-critical systems and coalescing data into a single dataset resulting in a single source of truth. This allows stakeholders throughout the entire client organization to interact more effectively with one another across the investment management lifecycle.
We believe, by means of our purposefully-designed, interconnected systems underpinned by one dataset, we are the only solution that allows clients to see and interact with all parts of the investment management lifecycle, ranging from portfolio construction, trading, risk management, accounting, and operations through to investor reporting, seamlessly in real time, in one screen, in one solution. As a result, our solution enables clients to better align teams, optimizing their investment decision-making, operations and technology footprint, and lowering operating costs. By harnessing the efficiencies, agility, and scale inherent to our cloud-native, multi-tenant software that is integrated with a suite of technology-powered, managed services, we believe we have created the industry’s most compelling investment management solution, capable of shaping and addressing the evolving demands of the global investment management landscape.
Existing solutions in the investment management technology industry include a patchwork of “task-specific” point solutions from disparate vendors, technology stitched together through acquisitions, internally-developed technology, as well as cost-prohibitive solutions accessible only to the largest investment managers. Where available solutions are cloud-enabled, many were originally designed for on-premises installations and subsequently individually migrated to the cloud via discrete code streams, retaining single-tenant infrastructure limitations that require changes to be made for each client individually instead of delivering changes to all clients simultaneously, and leading to laborious and costly maintenance and difficult security requirements. As a result, many investment managers spend considerable time and resources managing legacy, stitched together, or disparate systems, fragmented data, complex communication networks and cumbersome workflows. Designed for the cloud from inception, Enfusion provides a flexible and simplified end-to-end alternative that allows investment managers to focus their time and resources on investment performance. This enables us to build long-term partnerships with our clients, offering a solution that is not only tailored to meet their business needs today, but also has the depth and breadth of capability to support them as they grow or enter new markets or asset classes.
Our cloud-native, multi-tenant solution provides:
| ● | Seamless unification and simplification of workflows provided through one cohesive solution; |
| ● | A robust, real-time view of a client’s business that can be displayed through countless reports, and utilized across client personnel that depend on one another, but have different roles throughout the organization; |
| ● | Inherent scalability and extensive integrations via client, third-party and proprietary interfaces, and APIs; |
| ● | Weekly, functional enhancements provided to all clients, eliminating complicated upgrade and version control issues, and providing the agility to meet rapidly evolving industry needs; |
| ● | Reduced operational risk through granular, user-defined access controls and governance capabilities; and |
| ● | Anywhere access across the desktop, the web, and mobile devices. |
5
Enfusion’s comprehensive solution cohesively addresses the core components of the investment lifecycle. Our portfolio management system gives clients the ability to construct and analyze portfolios and performance metrics with granularity, enabling better-informed investment decision-making. Once trade decisions are made, clients use our combined order and execution management systems to obtain market insights, run compliance checks and send electronic trade orders directly to executing brokers and exchanges. When orders are executed, execution data flows back to our solution and instantly feeds our systems, including our accounting system, enabling clients to produce a full set of financial statements in real time. The data also feeds our extensive reporting and analytics capabilities, allowing stakeholders across client organizations, including executive management, investment teams, operational support, compliance, and investor relations, to obtain differentiating insights into their investment activities and better analyze investment performance. The purposefully-designed interconnectedness of our systems removes the need for manual data processing and validating across workflows. Coupled with market data and aggregated transactional and derived data provided to or received from a full suite of a client’s supporting parties, our solution creates a single dataset and source of truth that gives our clients a real-time, comprehensive, and consistent view of their data across the investment lifecycle. Altogether, our full lifecycle, single-dataset investment management solution provides investment managers with a tailored suite of tools and investment content to make better-informed decisions, faster and with greater confidence, in one screen and one solution.
In addition to facilitating the full investment lifecycle, our robust and agile solution allows us to serve a diverse client base that ranges in investment strategies, size, and geography. Our clients include alternative investment managers such as hedge funds of all types, private equity funds, family offices and corporate investment arms, as well as institutional investment managers such as traditional asset managers and mutual funds:
| ● | Alternative Investment Managers – We enable alternative investment management clients to achieve scale efficiently, instill investor confidence, easily expand into new strategies, asset classes or geographies and significantly increase their speed to market. Clients can interact with the entire investment management lifecycle on one solution, unified by one dataset and are not burdened by costly hardware requirements or disruptive software upgrades. We generally deliver weekly upgrades through our cloud-native, multi-tenant solution, allowing us to continuously innovate and quickly adapt to meet ever-evolving client needs. |
| ● | Institutional Investment Managers – We deliver an intelligent solution that can replace or supplement institutional investment management clients’ legacy systems and can be utilized as a unifying hub across other existing systems, improving our clients’ operational inefficiencies and providing access to more relevant and simplified workflows and technologies. This intelligent solution gives large, less-agile clients the ability to replace their existing systems at their own pace, as they become better positioned to reduce their costly and inefficient legacy technology dependencies. |
The Enfusion Solution
Our cloud-native, purposefully-designed, end-to-end solution gives our clients the ability to easily access and analyze investment information in real time, perform complex calculations quickly and interact with markets electronically adding up to better, more informed investment decisions and actions. Our solution is highly configurable to different work streams, client segments and asset classes. Rather than relying on large, specialized workforces necessary for local or tenant-by-tenant deployments, modifications to our solution are made remotely within one code-base and without client intervention or interaction. Software enhancements developed for individual, sponsoring clients are made available to all clients at the same time. This process, where our community of clients continuously contributes to the ever-evolving nature of our solution, strengthens the value of the solution to all of our clients. Further, Enfusion’s open and flexible architecture easily integrates into clients’ existing technology stacks via APIs and other connectivity and is adaptable to our clients’ existing internal and third-party systems. With a limited footprint, wide-ranging use-cases and ‘anywhere’ access across multiple mediums, our solution increasingly serves as the operational epicenter for our clients.
Our solution, comprised of mission critical systems integrated with a suite of technology-powered, managed services, serves the full investment lifecycle, driving better insights into and control over the business activities of the investment manager and investment operations. We recognize that, despite increasing market pressures to the contrary, some clients may not be in a position to replace all of their systems at once. Therefore, we have designed our solution to allow our clients to use some or all of our solution to manage their investment lifecycle workflow and also to augment or
6
integrate into their existing workflows or systems, giving them the flexibility to expand their usage and us the ability to solve their unique needs through time.
Our solution is utilized by a variety of users including portfolio managers, traders, compliance officers, operational support staff and executive management, all of whom benefit from role-based functionality underpinned by a single dataset. This single dataset enables each of these users to generate valuable insights while operating on the same real-time information governed by appropriate access controls. The end-to-end functionality our solution provides is detailed below:
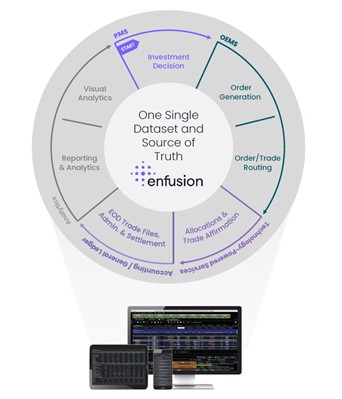
| ● | Portfolio Management System (“PMS”): Able to comprehensively construct and re-balance investment portfolios, this system generates a real-time investment book of record (“IBOR”), for CIOs and portfolio managers, features a full suite of valuation and risk tools and allows users to analyze aggregated or decomposed portfolio data by any number of customizable dimensions. |
| ● | Order and Execution Management System (“OEMS”): Intertwined with our PMS, this module offers portfolio managers, traders, compliance teams and analysts the ability to electronically communicate trade orders for a variety of asset classes and with a choice of hundreds of executing counterparties globally, manage trade orders and systemically enforce trading regulations and internal guidelines. |
| ● | Accounting/General Ledger System: Underpinning our PMS and OEMS systems, our accounting system features a proper double-entry ledger that automates the posting of general ledger journal entries for all cash and securities transactions directly from our PMS—providing CFOs, COOs, accountants, and operations teams a complete, real-time accounting book of record. |
| ● | Enfusion Analytics System: Connected in real time with our PMS and OEMS, the Enfusion Analytics System enables CIOs, portfolio managers, traders, and analysts to utilize the solution’s comprehensive client data insights to analyze portfolios through time horizons and automate customized visualized reports for both |
7
| internal and external stakeholders. This module also acts as a centralized data warehouse that may be accessed or utilized by both individual and systematic users. |
| ● | Technology-Powered, Managed Services: We offer access to technology-powered, managed services designed to maximize the power of the Enfusion solution. By using expert teams empowered by technology to address time-consuming front-, middle- and back-office administrative tasks related to the investment lifecycle such as performing various fund and position level reconciliations, processing corporate actions, proactive trade break resolutions, and back up accounting against fund administrators, our clients are able to focus on their highest-value business activities and recognize the full benefit of our solution. |
Our Market Opportunity
Investment managers spend significant time and resources supporting their business processes, which is intensifying as their industry continues to become more complex and subject to unprecedented pace of change. It is critical that investment managers have the tools to confidently make and execute upon better-informed investment decisions in real time and, in turn, remain competitive. Accordingly, the demand for a comprehensive investment lifecycle, cloud-native solution that simplifies workflows by unifying mission-critical systems and coalescing data into a single dataset will continue to increase.
The Enfusion solution, comprised of mission-critical systems integrated with a suite of technology-powered, managed services, is designed to eliminate the inherent constraints and maintenance demands tied to managing legacy and disparate technology as well as aggregating and validating data across workflows, allowing our clients to focus on innovation and investment returns. Our flexible architecture, built on a single codebase, gives us the ability to provide weekly software upgrades with improvements and new capabilities and, in turn, allows us to match the unprecedented pace of change and continuously evolve to meet our clients’ needs.
We believe there is a significant opportunity for us to replace competing legacy products as well as in-house proprietary technology. Our solution provides clients with flexibility to augment their existing systems, replace all legacy systems at once, or to take a more gradual approach, initially utilizing one system or limited parts of our solution and then gradually expanding utilization. Our solution is built for plug-and-play integration, with flexible APIs and other forms of connectivity that make it easy for clients to connect with other solutions or supporting parties.
Our Clients and Client Service
Enfusion has a diverse, global client base of 865 clients as of December 31, 2023, ranging from alternative investment managers such as hedge funds of all types, family offices and corporate investment arms, to institutional investment managers such as traditional investment managers, and mutual funds. Our client base spans our geographic reach; as of December 31, 2023, 54% of clients are from the Americas, 28% are from APAC, and 18% are from EMEA.
Our client-centric approach is embedded in the operating ethos across Enfusion. Our most important goal is to hold a high standard that couples both excellent ongoing innovation and excellent client experience. We believe our client-centric approach differentiates Enfusion and is made possible by our solution’s nimble, single-codebase architecture that is delivered in a one-to-many manner. In practice, our structure allows us to dedicate resources to our clients holistically, driving a superior client experience from the point of identifying a sales opportunity to product and services implementation and continuing throughout the client relationship. By providing dedicated continuity in the servicing team assigned to each client, we are able to ensure that our clients are continuously interfacing with familiar Enfusion employees that understand their business, workflows, daily needs and product use leading to increased efficiency and improved client experience. We also provide dedicated support teams and 24-hour, follow-the-sun support, six days a week, to all of our clients and with no additional charge.
Our Revenue Model
We derive the vast majority of our total revenues (99.3%, 98.9% and 98.8% for the years ended December 31, 2023, 2022, and 2021, respectively) from our recurring subscription-based revenues. Client subscription fees are
8
comprised of various components such as user fees, connectivity fees, market data fees and managed services fees, all of which take into account client size, complexity, and growth. The weekly enhancements and upgrades that we deliver and the dedicated client service are included in the price of the contract.
Our typical contract has an initial term of two or three years and generally auto-renews for one year, although actual renewal terms vary by contract, upon the completion of the initial term without an option to terminate for convenience. Certain legacy contracts have a termination for convenience clause with 30 days’ notice. Invoicing typically occurs in monthly installments at the end of each month during the subscription period.
Our Growth Strategy
We continue to advance our position as a leading technology partner to the investment management industry. The key components of our growth strategy include:
| ● | Continue Broadening Our Client Base: There are significant opportunities to expand our client base across the various client segments we serve today. We believe we are a leading cloud-native, SaaS provider within the alternative investment sector, and expect that as that sector grows, we will continue to extend our position. In addition, we continue to extend this growth through increasing adoption by larger institutional asset management clients due to increasing acceptance of cloud technology and the robust capabilities of our solution that better meet their evolving needs and address their existing pain points. Taking advantage of the unique position that allows us to sell our products and services through shorter sales cycles and on faster client implementation timelines, we continue to expand our sales efforts to aggressively capitalize on opportunities in this client segment. Our success in signing new clients is also supported by referrals from our existing clients, client stakeholders when they transition to other or launch new organizations, industry channel partners and our global, strategic partners and alliances. |
| ● | Expanding Relationships with Existing Clients: We believe there is a significant opportunity to further expand our relationships with existing clients as they continue to evolve and grow in size and expand into new markets and strategies or as we provide new functionality or release new systems, features, or services. We also believe we have a significant opportunity to expand our relationship with existing clients that were not in a position to replace all of their systems at once when they first engaged with us. For those clients that elect to initially utilize some portion of our solution or only use our solution for a particular strategy or fund, we find that once they experience the advantages of our end-to-end solution, many seek opportunities to expand the breadth of their relationship with us to further help improve their investment management workflows and technology infrastructure. |
| ● | Ongoing Pace of Innovation: To retain and expand our client base, we continuously evaluate opportunities to advance our solution through increased breadth and depth of functionality to enrich overall experience and better enable our clients to achieve their investment goals and solve for a broad array of business, operational and technology challenges. We invest heavily in innovation and, on a weekly basis, deliver enhancements and added functionality based on our ongoing dialogues with our clients and consistent with our commitment to grow and evolve with our clients. |
| ● | Geographic Expansion: We believe there are attractive, untapped opportunities across various geographies within which we can expand our business. For the years ended December 31, 2023 and 2022, approximately 62% and 63% of our total revenues were generated from clients in the Americas and 38% and 37% were generated from clients outside of the Americas, respectively. We are globally situated in nine offices in Chicago, New York City, London, Dublin, Hong Kong, Singapore, Mumbai, Bengaluru, and Sydney. We continue to invest in expanding our presence and capitalize on opportunities in markets such as Europe, the Middle East, and Asia Pacific. In 2023, we established an entity in Dubai to facilitate business in a rapidly growing region. In 2023, we signed 148 clients across the world, representing an 18% increase in total clients from 2022. |
9
| ● | Selectively Pursue Acquisitions: We may selectively pursue strategic acquisitions of complementary businesses and technologies that improve and accelerate our ability to deliver world-class investment management products and services and excellent client experience. |
Our Go-To Market Strategy
We sell subscriptions to our cloud-native solution through the demand generated globally by our marketing efforts, using our direct sales force and by leveraging client referrals, industry channel partners and strategic alliances.
Our industry-experienced sales team includes sales development representatives, field sales representatives, and solution engineers. The team is responsible for managing and developing outbound leads, driving new business, and providing product demonstrations. Once a lead is identified, the team frames the unique pain points, goals, and needs of the prospective client and works with the solution engineers to map a tailored end-to-end solution molded around their workflows.
Our partnerships are an important aspect of our sales and marketing strategy. We leverage a broad network of global relationships across trading systems, fund administrators, technology providers, investment systems consultants and prime brokers to further expand our reach. Through these relationships, we often receive significant prospect referrals. Our channel partners suggest our solution to their clients because they often benefit operationally from working with clients that have unified data, superior access to information, improved workflows and a stringent control environment. Additionally, our simplified implementation process significantly increases our clients’ speed to market, which is beneficial to our partners whose services are largely dependent on our clients being active in the market.
Our go-to market strategy is supported by a marketing team that oversees all aspects of the Enfusion global demand generation engine including digital marketing, social media, public relations, segment marketing, graphic design, conferences, and events. Our marketing efforts focus on generating and facilitating quality inbound leads, optimizing the lead generation strategy, leveraging the power of client references and testimonials, building an institutionalized and recognizable brand, and promoting direct sales. We leverage online and offline marketing channels by participating in conferences, industry events and using digital marketing and social media to educate the community on who we are and the solution we provide.
Intellectual Property
We rely on a combination of trade secret, copyright, and trademark laws; a variety of contractual arrangements, such as license agreements, intellectual property assignment agreements, confidentiality, and non-disclosure agreements; and confidentiality procedures and technical measures to protect our rights and the intellectual property used in our business. We do not currently have any patents.
We have an ongoing trademark and service mark registration program pursuant to which we register our brand names and product names, taglines and logos in the United States and other countries to the extent we determine appropriate and cost-effective. We also have common law rights in some trademarks and numerous pending trademark applications in various jurisdictions. In addition, we have registered domain names for websites that we use in our business, such as https://www.enfusion.com/ and other variations.
We intend to pursue additional intellectual property protection to the extent we believe it would be beneficial and cost-effective. Despite our efforts to protect our intellectual property rights, they may not be respected in the future or may be invalidated, circumvented, or challenged.
See Part I, Item 1A. Risk Factors, including the section titled “Risks Related to Our Intellectual Property,” for a description of the risks related to our intellectual property.
10
Our Competition
The market for investment management software and services is highly competitive and we compete with new and established providers that offer products ranging from point solutions to multi-product suites. We compete on the basis of a number of factors, including:
| ● | flexibility of solution; |
| ● | quality of professional services; |
| ● | depth of product functionality and asset coverage; |
| ● | speed of implementations and client support; |
| ● | innovation and responsiveness to client needs; |
| ● | return on investment and total cost of ownership; |
| ● | security and reliability; |
| ● | integration and interoperability with third-party systems; and |
| ● | ability to support regulatory requirements and compliance. |
We believe that we compete favorably with respect to these factors. However, many of our competitors have greater financial, technical, and other resources, greater brand recognition, larger sales forces and marketing budgets and broader distribution networks. They may be able to leverage these resources to gain business in a manner that discourages customers from purchasing and implementing our solution. Furthermore, we expect that our industry will continue to attract new market entrants, including smaller emerging companies, which could introduce new offerings. We may also expand into new markets and encounter additional competitors in such markets.
Incumbents such as Blackrock’s Aladdin, Broadridge, State Street Alpha, SS&C, SimCorp, Bloomberg AIM, LayerOne and Coremont may provide end-to-end systems, but many of them are single-tenant and cloud-migrated rather than cloud-native or built for the cloud, or are faced with other deployment challenges. As a result, they are not sufficiently nimble to allow for scale and often require physical provisioning, rely on large teams of specialized personnel that through time are difficult to hire, face latency issues and continue to increase the investment manager’s overall costly and inefficient legacy technology dependencies. Their single tenant and cloud-migrated structures restrict their agility and inhibit their ability to provide frequent or simultaneous upgrades to all of their clients. New entrants in the space often provide single point solutions such as trading, fund administration or portfolio analytics that are intended to be coupled with other offerings.
We believe our multi-tenant cloud-native solution, comprised of mission critical systems integrated with a suite of services, is highly differentiating. Our cloud-native, single codebase architecture allows us to serve the full investment lifecycle in a way that unifies workflows creating one dataset that accurately reflects the activities across all systems and multiple departments within a client organization in real time. Additionally, our single codebase architecture allows us to deliver faster implementation and continuously add functionality. As a result, we believe Enfusion is able to continue to innovate faster, delivering a better, more nimble solution that investment managers require in light of the global challenges they face.
Human Capital Resources and Culture
As of December 31, 2023, we had 1,102 employees across the Company. Of these employees, 330 are based in the Americas, and 772 are based internationally, of which 577 are based in India. We consider our current relationship
11
with our employees to be strong. None of our employees are represented by a labor union or are a party to a collective bargaining agreement.
We believe in our collaborative, innovative, transparent, and integrity-driven culture where, despite differences in geographic locations, titles, and responsibilities, we operate as one team and celebrate shared success. Our culture is represented by a set of core values summarized below:
| ● | Integrity: We say what we mean, and we do what we say. We are honest with our clients, colleagues, partners, and ourselves. We always strive to do the right thing. |
| ● | Innovation: We are focused on what’s next and aim to win by relentlessly innovating and improving. We take pride in our efforts to anticipate our clients’ needs and design dynamic product enhancements. |
| ● | Clients: We are obsessed with going above and beyond for our clients every day. Our deep understanding of the industry and their businesses is augmented by our willingness to ask our clients “Why?” We use that level of understanding to create products and services that aim to continuously improve their performance. |
| ● | Collaboration: We solve complex problems for our clients, which is only possible when we pool our talents. We recognize and prize our teammates’ strengths and work together to meet challenges. We compete to win as one – One Enfusion. |
| ● | Ownership: We are collectively and individually responsible for creating value for our clients and our firm. We are both the first and last line of defense. When we see a problem, we take it on and then own the solution. |
| ● | Passion: We are driven by our ambition to transform our industry and lead change, which fuels personal pride in our work and our brand. We care deeply about our clients and each other. |
Available Information
Enfusion, Inc. was incorporated in Delaware on June 11, 2021. Our principal executive offices are located at 125 South Clark Street, Suite 750, Chicago, IL 60603, and our telephone number is (312) 253-9800.
Our website address is https://www.enfusion.com/. In addition to the information about us and our subsidiaries contained in this Annual Report on Form 10-K, information about us can be found on our website. Our official LinkedIn account is a means of disclosing material non-public information and for complying with our disclosure obligations under Regulation FD. Our website and our official LinkedIn account and information included in or linked to our website or our official LinkedIn account are not part of this Annual Report on Form 10-K.
Our Annual Reports on Form 10-K, Quarterly Reports on Form 10-Q, Current Reports on Form 8-K, and amendments to those reports (including exhibits) filed or furnished pursuant to Section 13(a) or 15(d) of the Securities Exchange Act of 1934, as amended (the “Exchange Act”) are available free of charge through our website at https://ir.enfusion.com/ as soon as reasonably practicable after they are electronically filed with or furnished to the SEC. Additionally, the SEC maintains an internet site that contains reports, proxy and information statements and other information. The address of the SEC’s website is www.sec.gov.
Item 1A. Risk Factors
A description of the risks and uncertainties associated with our business and ownership of our Class A common stock is set forth below. You should carefully consider the material and other risks and uncertainties described below, as well as the other information in this Annual Report on Form 10-K, including our consolidated financial statements and related notes and Part II, Item 7. Management’s Discussion and Analysis of Financial Condition and Results of Operations. The risks described below are not the only risks that we face. The occurrence of any of the events or developments described below could harm our business, financial condition, results of operations, and prospects. As a result, the market
12
price of our Class A common stock could decline, and you may lose all or part of your investment in our Class A common stock.
Risk Factor Summary
The following is a summary of the principal risks that could materially adversely affect our business, results of operations, and financial condition. Additional discussion of the risks included in this summary, and other risks that we face, can be found below and should be read together with other information in this Annual Report on Form 10-K and other filings we make with the SEC. This summary should not be relied upon as an exhaustive summary of the material risks facing our business.
| ● | If the adoption and acceptance of cloud-based financial solutions slows or shifts in a way we do not anticipate or are unable to support or if we do not accurately anticipate, prepare for, and promptly respond to rapidly evolving client needs, our sales will suffer, and the results of our operations will be adversely affected. |
| ● | If we are unable to develop, introduce, and market new and enhanced versions of our solution or are unable to anticipate or respond to evolving technological requirements, we may be put at a competitive disadvantage and our operating results could be adversely affected. |
| ● | If we continue expanding our operations but fail to effectively execute on our growth strategy, our margins and net income may decline, which may harm our business and results of operations. |
| ● | We may be unable to maintain our revenue growth rate in the future. |
| ● | Cyberattacks or other breaches of our security measures or those we rely on could result in unauthorized access to, use or destruction of confidential or proprietary information, including our clients’ or their clients’ data, which may materially and adversely impact our reputation, business, and results of operations. |
| ● | Actual or perceived defects, errors, or vulnerabilities in our solution, including failures in connection with client market orders, could harm our reputation, result in significant costs to us, impair our ability to sell our solution and subject us to substantial liability. |
| ● | Events affecting the investment management industry could materially and adversely affect us and cause our stock price to decline significantly. |
| ● | Our international operations may fail, and we may fail to successfully expand internationally. In addition, sales to clients outside the United States or with international operations expose us to risks inherent to international businesses, which may include adverse impacts arising out of international regulatory changes. |
| ● | Our solution is highly technical, and if we are unable to attract or retain key employees and other skilled personnel that are capable of managing our business strategy or working with our solution, we may be unable to achieve our goals and our business will suffer. |
| ● | Our revenue recognition and other factors may create volatility in our financial results in any given period and make them difficult to predict. |
| ● | If we are unable to protect our intellectual property, including trade secrets, or if we fail to enforce our intellectual property rights, our business could be adversely affected. |
13
| ● | Although we are not subject to the same regulations as our clients, the regulatory environment in which our clients operate is subject to continual change and regulatory developments designed to increase oversight could adversely affect our business. |
| ● | Our failure to comply with various data privacy, protection and security regulations could impose additional costs and liabilities on us, limit our use, storage, or processing of information and adversely affect our business. |
| ● | An active, liquid trading market for our Class A common stock may not develop or be sustained, which may make it difficult for you to sell the Class A common stock you purchase. |
| ● | Enfusion, Inc. is a holding company, and its only material asset is its direct and indirect interest in Enfusion Ltd. LLC, and it is accordingly dependent upon distributions from Enfusion Ltd. LLC to pay taxes, make payments under the Tax Receivable Agreement, and pay dividends. |
Risks Related to Our Business and Our Industry
If the adoption and acceptance of cloud-based financial solutions slows or shifts in a way we do not anticipate or are unable to support or if we do not accurately anticipate, prepare for, and promptly respond to rapidly evolving client needs, our sales will suffer, and the results of our operations will be adversely affected.
Use of, and reliance on, cloud-based investment management technology is still at an early stage, and we do not know whether financial institutions will continue to adopt cloud-based investment management technology such as the Enfusion solution in the future, or whether the market will change in ways we do not anticipate and cannot support. Many financial institutions have invested substantial personnel and financial resources in legacy software, and these institutions may be reluctant, unwilling, or unable to convert from their existing legacy or disparate systems to our end-to-end solution. Furthermore, these financial institutions may be reluctant, unwilling, or unable to use cloud-based investment management technology due to various concerns such as data security and the reliability of the delivery model. These concerns or other considerations may cause financial institutions to choose not to adopt cloud-based investment management technology such as ours or to adopt them more slowly than we anticipate, either of which would adversely affect us. Our future success also depends on our ability to sell additional applications and functionality to our current and prospective clients. As we create new applications and enhance our existing solution, these applications and enhancements may not be attractive to clients. In addition, promoting and selling new and enhanced functionality may require increasingly costly sales and marketing efforts, and if clients choose not to adopt this functionality, our business and results of operations could suffer. If financial institutions are unwilling or unable to transition from their legacy systems, or if the demand for our solution does not meet our expectations, our results of operations and financial condition will be adversely affected.
If we are unable to develop, introduce and market new and enhanced versions of our solution or are unable to anticipate or respond to evolving technological requirements, we may be put at a competitive disadvantage and our operating results could be adversely affected.
Our ability to increase revenues will depend, in large part, on our ability to further penetrate our existing markets and to attract new clients, as well as our ability to increase sales from existing clients who do not utilize the full Enfusion solution. The success of any enhancement or new systems or service depends on several factors, including the timely completion, introduction and market acceptance of an enhanced or new system, adaptation to new industry standards and technological changes, the ability to maintain and to develop relationships with third parties, and the ability to attract, retain and effectively train sales and marketing personnel. Any new systems we develop or acquire may not be introduced in a timely or cost-effective manner and may not achieve the market acceptance necessary to generate significant revenues. Any new industry standards or practices that emerge, or any introduction by competitors of new solutions embodying new services or technologies, may cause our solution to become obsolete. Any new markets in which we attempt to sell our solution, including new countries or regions, may not be receptive or implementation may be delayed due to the COVID-19 pandemic or other similar factors beyond our control. Additionally, any expansion into new markets will require commensurate ongoing expansion of our monitoring of local laws and regulations, which increases our costs as well as the risk of our solution not incorporating in a timely fashion or at all due to a failure of our solution to comply with such
14
local laws or regulations. Our ability to further penetrate our existing markets depends on the quality of our solution and our ability to design our solution to meet changing consumer demands and industry standards, as well as our ability to assure that our clients will be satisfied with our existing and new systems. If we are unable to sell our solution into new markets or to further penetrate existing markets, or to increase sales from existing clients by expanding their relationship with us, our revenues will not grow as expected, which would have a material adverse effect on our business, financial condition, and results of operations.
We may be unable to maintain our revenue growth rate in the future.
We have grown rapidly over the last several years, and therefore, our recent revenue growth rate and financial performance may not be indicative of our future performance. Our total revenues increased from $59.0 million in 2019 to $174.5 million in 2023. We may not be able to sustain revenue growth consistent with our recent history, if at all. Furthermore, to the extent we grow in future periods, maintaining consistent rates of revenue growth may be difficult. Our revenue growth may also slow or even reverse in future periods due to a number of factors, which may include reduced client spending levels, changes in the type and size of our clients, decreasing growth of our overall market, competitive conditions, slowing demand for our solution, and general economic conditions. If we are unable to maintain consistent revenue growth, the price of our Class A common stock could be volatile, and it may be difficult for us to maintain profitability.
If we continue expanding our operations but fail to effectively execute on our growth strategy, our margins and net income may decline, which may harm our business and results of operations.
We have expanded our operations in recent years, which has resulted in an increase in our employee headcount, and an expansion of our infrastructure, our number of locations and the geographic scope of our operations. In order to continue to implement our growth strategy, innovate and improve upon our solution, and pursue high levels of client service and satisfaction, we may need to continue expanding our operations and we also expect to continue improving our IT infrastructure, and our operational and financial controls and systems. Our success will depend on our ability to plan for and manage this growth effectively. Our growth strategy may require significant capital expenditures and may divert financial resources from other projects. If we increase the size of our organization or expend significant capital resources without experiencing a corresponding increase in sales of our solution, we may experience reductions in our gross and operating margins and net income, our revenues could decline or grow more slowly than expected, and our business and results of operations could be materially and adversely affected.
We may have to invest more resources in technology and development than anticipated and our technology and development efforts or spend may prove to be fruitless or unsuccessful, which could increase our operating expenses and negatively affect our results of operations.
We may have to devote substantial resources to technology and development due to technological advances in the software industry or by competitors, the integration of our acquisitions, our entry into new markets or client segments, or other competitive factors. If we are required to invest greater resources than anticipated without a corresponding increase in revenues, our results of operations could decline. Additionally, our periodic technology and development expenses may be independent of our level of revenues, which could negatively impact our financial results.
Further, technology for which we spend a significant amount of time and resources on in our technology and development may prove to be less marketable than we expect, if at all. There can be no guarantee that our technology and development investments will result in products or enhancements that create additional revenues.
15
We may experience quarterly fluctuations in our operating results due to a number of factors, which may make our future results difficult to predict and could cause our operating results to fall below expectations or our guidance.
Our quarterly operating results have fluctuated in the past and are expected to fluctuate in the future due to a variety of factors, many of which are outside of our control. As a result, comparing our operating results on a period-to-period basis may not be meaningful. Our past results may not be indicative of our future performance. In addition to the other risks described in this report, factors that may affect our quarterly operating results include the following:
| ● | the addition or loss of clients, including through acquisitions, consolidations, or failures; |
| ● | the frequency of the use of our solution in a period and the amount of any associated revenues and expenses; |
| ● | budgeting cycles of our clients and changes in spending on cloud-based investment management solution by our current or prospective clients; |
| ● | changes in the competitive dynamics of our industry, including consolidation among competitors, changes to pricing, or the introduction of new products and services that limit demand for our cloud-based investment management solutions or cause clients to delay purchasing decisions; |
| ● | the amount and timing of cash collections from our clients; |
| ● | long or delayed implementation times for new clients, including larger clients, or other changes in the levels of client support we provide; |
| ● | the amount and timing of our operating costs and capital expenditures; |
| ● | changes in tax rules or the impact of new accounting pronouncements; |
| ● | unexpected expenses such as those related to litigation or other disputes; |
| ● | the amount and timing of costs associated with recruiting, hiring, training, integrating, and retaining new and existing employees; |
| ● | the timing of our entry into new markets and client segments; |
| ● | limitations on our ability to forecast our future operating results due to our limited operating history at our current scale; and |
| ● | general economic conditions. |
Moreover, our stock price might be based on expectations of investors or securities analysts of future performance that are inconsistent with our actual growth opportunities or that we might fail to meet and, if our revenues or operating results fall below expectations, the price of our Class A common stock could decline substantially.
We may not accurately predict the long-term client retention rate or adoption of our solution, or any resulting impact on our revenues or operating results.
Our clients have no obligation to continue to renew their subscriptions for our solution after the expiration of the initial or current subscription term, and our clients, if they choose to renew at all, may renew for fewer users or on less favorable pricing terms. Our client retention rates may decrease as a result of a number of factors, including our clients’ satisfaction with our pricing or our solution or their ability to continue their operations or spending levels. If our clients
16
terminate their agreements or do not renew their subscriptions for our solution on similar or more favorable pricing terms, our revenues may decline, and our business could suffer.
Additionally, as the market for our solution develops, we may be unable to attract new clients based on the same subscription model we have used historically. Moreover, large or influential financial institution clients may demand more favorable pricing or other contract terms from us. As a result, we may in the future be required to change our pricing model, reduce our prices, or accept other unfavorable contract terms, any of which could adversely affect our risks, revenues, gross profit margin, profitability, financial position, and/or cash flow.
Cyberattacks or other breaches of our security measures or those we rely on could result in unauthorized access to, use or destruction of confidential or proprietary information, including our clients’ or their clients’ data, which may materially and adversely impact our reputation, business, and results of operations.
We rely on information technology systems that we or our third-party providers operate to process, transmit and store electronic information in our day-to-day operations. We maintain policies, procedures, and technological safeguards designed to protect the confidentiality, integrity, and availability of our information technology systems and confidential or proprietary information that we may possess, such as our intellectual property and data, and our clients or their clients’ personally identifiable information and trading data or related strategies. However, we cannot entirely eliminate the risk of improper or unauthorized access to our information technology systems or the access to or disclosure of our confidential or proprietary information. We also may not be able to anticipate all types of security threats, implement preventative measures against all such threats, or eliminate the risk of other security events that impact the integrity or availability of our information technology systems or the protection of our confidential or proprietary information, or the related costs we may incur to mitigate the consequences from such events or with respect to any remediation efforts.
Further, the Enfusion solution is a flexible and complex software solution and there is a risk that configurations of, or defects in, the solution or errors in implementation could create vulnerabilities to security breaches. There may be unlawful attempts to disrupt or gain access to our information technology systems or our confidential or proprietary information or other data of our clients or their clients that may disrupt our or our clients’ operations. In addition, because we leverage third-party providers, including cloud, software, co-locate data center, and other critical technology vendors to deliver our solution to our clients and their clients, we rely heavily on the data security technology practices and policies adopted by these third-party providers. A vulnerability in a third-party provider’s software or systems, a failure of our third-party providers’ safeguards, policies or procedures, or a breach of a third-party provider’s software or systems could result in the compromise of the confidentiality, integrity, or availability of our systems or the data housed in our solution.
Cyberattacks and other malicious internet-based activity continue to increase and evolve, and cloud-based providers of products and services have been and are expected to continue to be targeted. In addition to traditional computer “hackers,” industrial espionage, wire fraud and other forms of cyber fraud, social engineering fraud, malicious code (such as viruses and worms), phishing, employee theft or misuse and denial-of-service attacks, sophisticated criminal networks as well as nation-state and nation-state supported actors now engage in attacks, including advanced persistent threat intrusions. Current or future criminal capabilities, discovery of existing or new vulnerabilities, and attempts to exploit those vulnerabilities or other developments, may compromise or breach our systems or solution. In the event our or our third-party providers’ protection efforts are unsuccessful and our systems or solution are compromised, we could suffer substantial harm, including, without limitation, the disruption of operations, the misappropriation of confidential business information, including financial information, trade secrets, financial loss, the disclosure of corporate strategic plans, or the compromise or corruption of client data or data we rely on to provide our solution. In addition, a security breach may adversely impact our clients’ ability to use our systems to perform their day-to-day functions. Also, our reputation could suffer irreparable harm, causing our current and prospective clients to decline to use our solution in the future. Further, we could be forced to expend significant financial and operational resources in response to a security breach, including investigating, repairing system damage, increasing security protection costs by deploying additional personnel and protection technologies, and defending against and resolving legal and regulatory claims, all of which could divert resources and the attention of our management and key personnel away from our business operations.
Federal, state, and international regulations may require us or our clients to notify individuals of data security incidents involving certain types of personal data or information technology systems. Security compromises experienced
17
by others in our industry, our clients, or us may lead to public disclosures and widespread negative publicity. Any security compromise in our industry, whether actual or perceived, could erode client confidence in the effectiveness of our security measures, negatively impact our ability to attract new clients, cause existing clients to terminate our agreements or elect not to renew or expand their use of our solution, or subject us to third-party lawsuits, regulatory fines, or other actions or liabilities, which could materially and adversely affect our business and results of operations.
In addition, some of our clients contractually require notification of data security compromises and include representations and warranties in their contracts with us that our solution complies with certain legal and technical standards related to data security and privacy and meets certain service levels. In certain of our contracts, a data security compromise or operational disruption impacting us or one of our critical vendors, or system unavailability or damage due to other circumstances, may constitute a material breach and give rise to a client’s right to terminate their contract with us. In these circumstances, it may be difficult or impossible to cure such a breach in order to prevent clients from potentially terminating their contracts with us. Furthermore, although our client contracts typically include limitations on our potential liability, there can be no assurance that such limitations of liability would be adequate. We also cannot be sure that our existing liability insurance coverage and coverage for professional liability and errors or omissions will be available on acceptable terms or will be available in sufficient amounts to cover one or more claims and on the timing in which we need it, or that our insurers will not deny or attempt to deny coverage as to any future claim. The successful assertion of one or more claims against us, the inadequacy or denial of coverage under our insurance policies, litigation to pursue claims under our policies, or the occurrence of changes in our insurance policies, including premium increases or the imposition of large deductible or coinsurance requirements, could materially and adversely affect our business and results of operations.
We depend on third-party co-locate facilities, data centers operated by third parties, and third-party Internet service providers, and any disruption in the operation of such facilities or access to the Internet could adversely affect our business.
We currently serve our clients from two third-party co-locate data center hosting facilities located in Chicago, Illinois and Secaucus, New Jersey and therefore cannot guarantee that our clients’ access to our solution will be uninterrupted, error-free, or secure. We may experience service and application disruptions, outages, and other performance problems. These problems may be caused by a variety of factors, including infrastructure changes, human or software errors, viruses, security attacks, fraud, spikes in client usage, and denial of service issues. In some instances, we may not be able to identify the cause or causes of these performance problems within an acceptable period of time. We do not control the operation of these data center facilities, and such facilities are vulnerable to damage or interruption from human error, intentional bad acts, power loss, hardware failures, telecommunications failures, fires, wars, terrorist attacks, floods, earthquakes, hurricanes, tornadoes, or similar catastrophic events. Both we and our service providers also could be subject to break-ins, computer viruses, sabotage, intentional acts of vandalism, and other misconduct. The occurrence of a natural disaster or an act of terrorism, a decision to close the facilities without adequate notice or terminate our hosting arrangement, or other unanticipated problems could result in lengthy interruptions in the delivery of our solution, cause system interruptions, prevent our clients’ account holders from accessing their accounts online, reputational harm and loss of critical data, prevent us from supporting our solution, or cause us to incur additional expense in arranging for new facilities and support.
In addition to third-party co-locate data centers where we host the data, we also depend on third-party data centers that host data on our behalf, and any disruption in the operation of these facilities could impair the delivery of our solution and adversely affect our business. We currently deploy portions of our solution and serve our clients using third-party data center services. While we typically control and have access to the servers we operate in co-location facilities and the components of our custom-built infrastructure that are located in those co-location facilities, we control neither the operation of these facilities nor our third-party service providers. In the event of significant physical damage to one of these facilities, it may take a significant period of time to achieve full resumption of our services, and our disaster recovery planning may not account for all eventualities. We may also incur significant costs for using alternative equipment or taking other actions in preparation for, or in reaction to, events that damage the third-party data centers that we use.
We also depend on third-party Internet service providers and continuous and uninterrupted access to the Internet through third-party bandwidth providers to operate our business. If we lose the services of one or more of our Internet
18
service or bandwidth providers for any reason or if their services are disrupted, for example due to viruses or denial of service or other attacks on their systems, or due to human error, intentional bad acts, power loss, hardware failures, telecommunications failures, fires, wars, terrorist attacks, floods, earthquakes, hurricanes, tornadoes, or similar catastrophic events, we could experience disruption in our ability to offer our solution and adverse perception of our solution’s reliability, termination of our agreements or we could be required to retain the services of replacement providers, which could increase our operating costs and harm our business and reputation.
Actual or perceived defects, errors, or vulnerabilities in our solution, including failures in connection with client market orders, could harm our reputation, result in significant costs to us, impair our ability to sell our solution and subject us to substantial liability.
Our cloud-based investment management solution is inherently complex and may contain bugs, errors, failures, defects, or other performance problems, particularly when a client is onboarded, systems are first introduced, or new versions are released. Despite extensive testing, from time-to-time we have discovered errors, failures, defects, bugs, or other performance problems in our systems. In addition, due to changes in regulatory requirements relating to our clients, we may discover deficiencies in our software processes related to those requirements. Material performance problems or defects in our systems might arise in the future.
Any such bugs, errors, failures, defects, or other performance problems could be costly for us to remedy, damage our clients’ businesses and harm our reputation, and cause our clients to seek to terminate their agreements, elect not to renew their subscriptions, delay or withhold payment, or assert liability claims against us. Any of these actions could also result in lost business, increased insurance costs, difficulty in collecting our accounts receivable, costly litigation, adverse publicity, or a loss of, or delay in, the market acceptance of our solution.
Moreover, software development is time-consuming, expensive, complex and requires regular maintenance. Unforeseen difficulties can arise including failures in connection with client market orders and failures in delivering software development in a timely manner. If we do not complete our periodic maintenance according to schedule or if clients are otherwise dissatisfied with the frequency and/or duration of our maintenance services, clients could elect not to renew, or delay or withhold payment to us or cause us to issue credits, make refunds, or pay penalties.
We believe that our reputation and name recognition are critical factors in our ability to compete in our industry and generate sales, and the occurrence or perception of the occurrence of bugs, errors, failures, defects or other performance problems in our solution or client dissatisfaction with our maintenance services may damage our reputation in the market and our relationships with our existing clients, and as a result, we may be unable to attract or retain clients, which could seriously harm our sales and our results of operations and financial condition.
We and our clients leverage third-party software, content, connectivity, and services for use with our solution. Performance issues, errors and defects, or failure to successfully integrate or license necessary third-party software, content, connectivity, or services, could cause delays, errors, or failures of our solution, cause reputational harm, increases in our expenses and reductions in our sales, each of which could materially and adversely affect our business and results of operations.
We and our clients use software and content licensed from, and services provided by, a variety of third parties in connection with the operation of our solution. Any errors, failures, defects, bugs, or other performance problems in third-party software, content, or services could result in errors or a failure of our solution, which could adversely affect our business and results of operations. In the future, we might need to license other software, content, or services to enhance our solution and meet evolving client demands and requirements. Any limitations in our ability to use third-party software, content or services could significantly increase our expenses and otherwise result in delays, a reduction in functionality, errors, or failures of our solution until equivalent technology or content is either developed by us or, if available, identified, obtained through purchase or license, and integrated into our solution. In addition, third-party licenses may expose us to increased risks, including risks associated with the integration of new technology, the diversion of resources from the development of our own proprietary technology, and our inability to generate revenues from new technology sufficient to offset associated acquisition and maintenance costs, all of which may increase our expenses and materially and adversely affect our business and results of operations.
19
Interruptions in the availability of server systems or network or communications with Internet, third-party hosting facilities or cloud-based services, interruptions in the third-party connections utilized by our clients, or failure to maintain the security, confidentiality, accessibility, or integrity of data stored on such systems, could harm our business or impair the delivery of our solution.
A significant portion of our software development personnel, source code, and computer equipment is located at operating facilities within the United States. Certain of our internal operating systems depend on data maintained on servers running third-party enterprise resource planning, account relationship management and other business operations systems. We further rely upon a variety of Internet service providers, third-party hosting facilities and cloud computing platform providers, as well as local service providers to support project teams and users in most regions and countries throughout the world, particularly with respect to our cloud service solution. Failure to maintain the security, confidentiality, accessibility, or integrity of data stored on such systems could damage our reputation in the market and our relationships with our accounts, cause us to lose revenues or market share, increase our service costs, cause us to incur substantial costs, cause us to lose accounts, subject us to liability for damages and divert our resources from other tasks, any one of which could adversely affect our business, financial condition, results of operations and prospects. Any damage to, or failure of, such systems, or communications to and between such systems, could result in interruptions in our operations, managed services, and software development activities. Such interruptions may reduce our revenues, delay billing, cause us to issue credits or pay penalties, cause accounts to terminate their subscriptions or adversely affect our attrition rates and our ability to attract new accounts. Our business would also be harmed if our accounts and potential accounts believe our products or services are unreliable. In light of our status as a critical system for our clients, service disruptions could impact their ability to operate, and in some cases, may inhibit their ability to trade.
The markets in which we participate are intensely competitive, and pricing pressure, new technologies, or other competitive dynamics could adversely affect our business and operating results.
We currently compete with providers of technology and services in the financial services industry. Certain of our competitors have significantly more financial, technical, marketing, and other resources than we have, may devote greater resources to the promotion, sale, and support of their systems than we can, have more extensive client bases and broader client relationships than we have, and have longer operating histories and greater name recognition than we have. In addition, many of our competitors expend a greater amount of funds on research and development.
We may also face competition from other companies within our markets, which may include large established businesses that decide to develop, market, or resell cloud-based investment management solutions, acquire one of our competitors, or form a strategic alliance with one of our competitors. In addition, new companies entering our markets or established companies creating or marketing new products may choose to offer cloud-based investment management applications at little or no additional cost to the client by bundling them with their existing applications, including adjacent banking technologies and core processing software. New entrants to the market might also include non-banking providers of payment solutions and other technologies. Competition from these new entrants or consolidation among new or existing competitors may result in pricing pressure or loss of market share, which could limit our growth prospects, make our business more difficult, and adversely affect our results.
If we are unable to compete in this environment, sales and renewals of our cloud-based investment management solution could decline and adversely affect our business, operating results, and financial condition. With the introduction of new technologies and potential new entrants into the cloud-based investment management solutions market, we expect competition to intensify in the future, which could harm our ability to increase sales and maintain profitability.
If we fail to effectively anticipate and respond to changes in the industry in which we operate, our ability to attract and retain clients could be impaired and our competitive position could be harmed.
The financial services industry is subject to rapid change and the introduction of new technologies to meet the needs of this industry will continue to have a significant effect on competitive conditions in our market. If we are unable to successfully expand our product offerings beyond our current solution, our clients could migrate to competitors who may offer a broader or more attractive range of products and services. Unexpected delays in releasing new or enhanced versions of our solution, or errors following their release, could result in loss of sales, delay in market acceptance, or client
20
claims against us, any of which could adversely affect our business. The success of any new system depends on several factors, including timely completion, adequate quality testing and market acceptance. We may not be able to enhance aspects of our solution successfully or introduce and gain market acceptance of new applications or improvements in a timely manner, or at all. Additionally, we must continually modify and enhance our solution to keep pace with changes in software applications, database technology, and evolving technical standards and interfaces.
Uncertainties related to our ability to introduce and improve functionality, announcements or introductions of a new or updated solution, or modifications by our competitors could adversely affect our business and results of operations.
Events affecting the investment management industry could materially and adversely affect us and cause our stock price to decline significantly.
Our revenues are diversified across our client base. During the year ended December 31, 2023, one client represented more than 4% of our total revenues, and our top 10 clients represented approximately 23.4% of our total revenues. However, our clients are concentrated within the investment management sector, and any events that have an adverse impact on that sector could materially and adversely affect us. Furthermore, our clients operate in the volatile global financial markets and are influenced by a number of factors outside of their control, including interest rate volatility, inflation, the availability of credit, issues with sovereign and large institutional obligors, changes in laws and regulations, terrorism and political unrest or uncertainty, among others. As a result, any of our clients may go out of business unexpectedly or decide to no longer use our products and services for other reasons which may be out of our control. The loss of or events affecting any one or more of these clients could materially and adversely affect us and cause our stock price to decline significantly.
If we fail to effectively train our clients to use our solution or fail to provide high-quality implementation, technical support, or managed services, it could have an adverse effect on our reputation and our ability to sell our solution to new clients and retain existing clients or renew agreements with our existing clients.
Effective client training on the Enfusion solution is critical to the successful adoption of our solution by our clients. We must also assist our clients in implementing our solution, and help our clients quickly resolve post-implementation issues. We believe that the training and implementation experience is vital to retaining clients or encouraging referrals, and that our ability to provide predictable delivery results and product expertise is critical to our ability to retain or renew agreements with our existing clients or receive referrals for new clients. If we fail to effectively provide effective training or implementation services, our ability to retain or sell additional systems and services to existing clients would be adversely affected and our reputation with potential clients could be damaged.
Once our clients are trained and our solution is implemented and integrated with our clients’ existing IT investments and data, our clients may depend on our technical support services and/or the support of service partners to resolve any issues relating to our solution. High-quality support is critical for the continued successful marketing and sale of our solution and the retention and renewal of contracts. In addition, as we continue to expand our operations internationally, our support organization will face additional challenges, including those associated with delivering support, training, and documentation in languages other than English. Many enterprise clients require higher levels of support than smaller clients. If we fail to meet the requirements of our larger clients, it may be more difficult to sell additional systems and services to these clients, a key group for the growth of our revenues and profitability. In addition, as we further expand our SaaS solution, our services and support organization will face new challenges, including hiring, training, and integrating a large number of new services or support personnel with experience in delivering high-quality support for our solution. Alleviating any of these problems could require significant expenditures which could adversely affect our results of operations and growth prospects. Our failure to maintain high-quality implementation and support services could have a material adverse effect on our business, results of operations, financial condition, and growth prospects.
21
If we are unable to effectively integrate our solution with other systems used by our clients, or if there are performance issues with such third-party systems, our solution will not operate effectively, and our business and reputation will be adversely affected.
The Enfusion solution integrates with other third-party systems used by our clients. We do not have formal arrangements with many of these third-party providers regarding the delivery and receipt of client data. If we are unable to effectively integrate with third-party systems, our clients’ operations may be disrupted, which may result in disputes with clients, negatively impact client satisfaction and harm our business. If the software of such third-party providers has performance or other problems, such issues may reflect poorly on us and the adoption and renewal of our solution, and our business and reputation may be harmed.
Our sales cycle and related client implementation, especially with regard to large financial institutions and other institutional or complex client profiles, can be lengthy and variable, depend upon factors outside our control, and could cause us to expend significant time and resources.
The timing of our sales is difficult to predict. Our sales efforts involve educating prospective clients about the use, technical capabilities and benefits of our products and services. Prospective clients may undertake a prolonged product-evaluation process. We may face significant costs, long sales cycles, and inherent unpredictability in completing client sales. A prospective client’s decision to purchase our solution may be an enterprise-wide decision and, if so, may require us to educate a significant number of people within the prospective client’s organization regarding the use and benefits of our solution. In addition, prospective clients may require customized features and functions unique to their business process and may require acceptance testing related to those unique features. As a result of these factors, we may be required to devote greater sales support and services resources to a number of individual prospective clients, increasing costs and time required to complete sales and diverting our sales and services resources to a smaller number of clients, while delaying revenues from other potential new clients until the sales cycle has been completed and the criteria for revenue recognition have been met.
Our international operations may fail, and we may fail to successfully expand internationally. In addition, sales to clients outside the United States or with international operations expose us to risks inherent to international businesses, which may include adverse impacts arising out of international regulatory changes.
Our international revenues represented approximately 40%, 38% and 34% of our total revenues for the fiscal years ended December 31, 2023, 2022, and 2021, respectively. Part of our growth strategy involves expanding our international operations and worldwide client base. We cannot assure you that our international expansion efforts will be successful and our experience in the United States may not be relevant to our ability to expand in any international market.
Operating in international markets requires significant resources and management attention and subjects us to regulatory, economic, and political risks that are different from those in the United States. Export control regulations in the United States may increasingly be implicated in our operations as we expand internationally. These regulations may limit the export of our solution and provision of our solution outside of the United States, or may require export authorizations, including by license, a license exception or other appropriate government authorizations, including annual or semi-annual reporting and the filing of an encryption registration. Changes in export or import laws, or corresponding sanctions, may delay the introduction and sale of our solution in international markets, or, in some cases, prevent the export or import of our solution to certain countries, regions, governments, persons or entities altogether, which could adversely affect our business, financial condition and results of operations.
We are also subject to various domestic and international anti-corruption laws, such as the U.S. Foreign Corrupt Practices Act (the “FCPA”) and the U.K. Bribery Act, as well as other similar anti-bribery and anti-kickback laws and regulations. These laws and regulations generally prohibit companies and their employees and intermediaries from authorizing, offering or providing improper payments or benefits to officials and other recipients for improper purposes. Although we take precautions to prevent violations of these laws, our exposure for violating these laws increases as our international presence expands and as we increase sales and operations in foreign jurisdictions.
22
In addition, we face risks in doing business internationally that could adversely affect our business, including:
| ● | unanticipated costs; |
| ● | the need to localize and adapt our solution for specific countries; |
| ● | complying with varying and sometimes conflicting data privacy laws and regulations; |
| ● | difficulties in staffing and managing foreign operations, including employment laws and regulations; |
| ● | unstable regional, economic, or political conditions, including trade sanctions, political unrest, terrorism, war, health and safety epidemics, or the threat of any of these events; |
| ● | different pricing environments, longer sales cycles, and collections issues; |
| ● | new and different sources of competition; |
| ● | weaker protection for intellectual property and other legal rights than in the United States and practical difficulties in enforcing intellectual property and other rights outside of the United States; |
| ● | laws and business practices favoring local competitors; |
| ● | operational and compliance challenges related to the complexity of multiple, conflicting, and changing governmental laws and regulations, including employment, tax and anti-bribery laws and regulations and difficulties understanding and ensuring compliance with those laws by both our employees and our service partners, over whom we exert no control; |
| ● | increased financial accounting and reporting burdens and complexities; |
| ● | restrictions on the transfer of funds; and |
| ● | differing and potentially adverse tax consequences. |
The occurrence or impact of any or all of the events described above could materially and adversely affect our international operations, which could in turn materially and adversely affect our business, financial condition and results of operations.
Our solution is highly technical, and if we are unable to attract or retain key employees and other skilled personnel that are capable of managing our business strategy or working with our solution, we may be unable to achieve our goals and our business will suffer.
Our future success depends upon our ability to continue to attract, train, integrate and retain highly skilled personnel, particularly our executive officers and the personnel serving on our engineering, product, client services and sales teams. Failure to attract, train, integrate and retain such personnel could harm our ability to generate sales, successfully develop enhancements or new systems or services, and otherwise delay or prevent us from achieving our business goals.
Our United States-based personnel, which includes our executive officers and certain other key employees, are generally employed on an at-will basis, which means that these individuals could terminate their relationship with us at any time. We depend on the efforts, relationships, and reputations of our executive officers in order to successfully manage our business, and the loss of any of our executive officers could significantly delay or prevent us from achieving our business objectives.
23
Furthermore, because of the technical nature of our solution and the dynamic market in which we operate, it can be difficult to attract, train, integrate, and retain skilled personnel that are capable of managing our business strategy or working with our solution. We compete with other companies, many of which have greater resources than we have, for a limited number of personnel within our industry. Significant amounts of time and resources may be required to train and integrate such personnel to successfully manage, develop, implement, and sell our solution. We may lose them to our competitors or other technology companies before we realize the benefit of our investment in recruiting and training these individuals. In addition, if U.S. immigration policy related to skilled foreign workers were materially adjusted, such a change could hamper our efforts to hire highly skilled foreign employees, including highly specialized engineers, which would adversely impact our business. Also, to the extent that we hire personnel from competitors, we may be subject to allegations that such personnel have been improperly solicited or have divulged proprietary or other confidential information.
Furthermore, our ability to expand internationally depends, in large part, on our ability to attract, retain and integrate managers to lead the local business and employees with the appropriate skills. If we are unable to effectively hire or deploy our employees globally on a timely basis to fulfill the needs of our clients or implement our growth strategy, our reputation could suffer and our ability to retain existing clients or attract new clients may be harmed. For more information on the risks associated with our operations in India, see “—If we are unable to effectively manage certain risks and challenges related to our India operations, our business could be harmed.”
Our corporate culture has contributed to our success, and if we cannot maintain it as we grow, we could lose the innovation, creativity and teamwork fostered by our culture, and our business may be adversely affected.
We believe our corporate culture is one of our fundamental strengths, as we believe it enables us to attract and retain top talent and deliver superior results for our clients. As we grow, we may find it difficult to preserve our corporate culture, which could reduce our ability to innovate and operate effectively. In turn, the failure to preserve our culture could negatively affect our ability to attract, recruit, integrate and retain employees, continue to perform at current levels, and effectively execute our business strategy. Furthermore, our growth may require us to develop a more hierarchical structure, which may impact our ability to operate swiftly and efficiently.
Increases in labor costs, including salaries or wages, and an overall tightening of the labor market, could adversely affect our business, results of operations, or financial condition.
The labor costs associated with our business are subject to several external factors affecting our industry, including unemployment levels and the quality and the size of the labor market, prevailing salaries, health and other insurance costs, other forms of remuneration and benefits offered to prospective employees by competitor employers, and changes in employment and labor legislation or other workplace regulation. From time to time, the labor market may become increasingly competitive. If we are unable to mitigate salary or wage rate increases driven by the labor market through automation and other labor savings initiatives, our labor costs may increase, or we may have difficulty attracting or retaining personnel. Increases in labor costs could force us to increase our prices, and these increased prices or any failure to attract or retain personnel may adversely affect our business results.
Global or regional economic and market conditions may negatively impact our business, financial condition, and results of operations.
Our overall performance depends in part on economic and market conditions, which may remain challenging or uncertain for the foreseeable future. Financial developments seemingly unrelated to us or our industry may adversely affect us. Domestic and international economies have been impacted by changes in interest rates, military operations or conflicts, threatened sovereign defaults and ratings downgrades, falling demand for a variety of goods and services, restricted credit, threats to major multinational companies, poor liquidity, reduced corporate profitability, volatility in credit, equity and foreign exchange markets, bankruptcies, and overall uncertainty. These conditions affect the rate of technology spending and could adversely affect our clients’ ability or willingness to purchase our cloud-based investment management solution, delay prospective clients’ purchasing decisions, reduce the value or duration of their subscriptions, or affect renewal rates, any of which could adversely affect our operating results. We cannot predict the timing, strength, or duration of the economic recovery or any subsequent economic slowdown in the United States, the market generally or in our industry.
24
Natural or man-made disasters outside of our control and other similar events may significantly disrupt our business, and negatively impact our business, financial condition, and results of operations.
Our operating facilities and infrastructure, including our co-located data centers, may be harmed or rendered inoperable by natural or man-made disasters, including hurricanes, tornadoes, wildfires, floods, earthquakes, nuclear disasters, acts of terrorism or other criminal activities, outbreak of hostilities or military conflicts, infectious disease outbreaks or pandemic events, power outages and other infrastructure failures, which may render it difficult or impossible for us to operate our business for some period of time. Our facilities would likely be costly to repair or replace, and any such efforts would likely require substantial time. Any disruptions in our operations could adversely affect our business and results of operations and harm our reputation. Moreover, although we have disaster recovery plans, they may prove inadequate. We may not carry sufficient business insurance to compensate for losses that may occur. Any such losses or damages could have a material adverse effect on our business and results of operations. In addition, the facilities of our third-party providers may be harmed or rendered inoperable by such natural or man-made disasters, which may cause disruptions, difficulties or otherwise materially and adversely affect our business. To the extent any such disasters or other similar events adversely affect our business and financial results, it may also have the effect of heightening many of the other risks described in this “Risk Factors” section, such as our ability to maintain profitability in the future, our ability to attract new clients or continue to broaden our existing clients’ use of our solution and the impact of any decrease in technology spend by clients and potential clients in the financial services industry where we derive all of our revenues.
Failure of any of our established systems to satisfy client demands or to maintain market acceptance would harm our business, results of operations, financial condition, and growth prospects.
We derive a significant majority of our revenues and cash flows from our established solution and expect to continue to derive a substantial portion of our revenues from this source. As such, continued market acceptance of our solution and underlying systems is critical to our growth and success. Demand for our solution is affected by a number of factors, some of which are beyond our control, including the successful implementation of our solution, the timing of development and release of new enhancements and upgrades by us and our competitors, technological advances which reduce the appeal of our solution, changes in regulations that our clients must comply with in the jurisdictions in which they operate and the growth or contraction in the worldwide market for technological solutions for the investment management industry. If we are unable to continue to meet client demands, to achieve and maintain a technological advantage over competitors, or to maintain market acceptance of our solution, our business, results of operations, financial condition and growth prospects would be adversely affected.
We may acquire or invest in companies, or pursue business partnerships, which may divert our management’s attention or result in dilution to our stockholders, and we may be unable to integrate acquired businesses and technologies successfully or achieve the expected benefits of such acquisitions, investments, or partnerships.
From time to time, we consider potential strategic transactions, including acquisitions of, or investments in, businesses, technologies, services, solutions, and other assets. We also may enter into relationships with other businesses to expand our solution, which could involve preferred or exclusive licenses, additional channels of distribution, discount pricing, or investments in other companies. Negotiating these transactions can be time-consuming, difficult, and expensive, and our ability to close these transactions may be subject to approvals that are beyond our control. In addition, we do not have any experience in acquiring other businesses. If an acquired business fails to meet our expectations, our operating results, business, and financial position may suffer. We may not be able to find and identify desirable acquisition targets, we may incorrectly estimate the value of an acquisition target, and we may not be successful in entering into an agreement with any particular target. If we are successful in acquiring additional businesses, we may not achieve the anticipated benefits from the acquired business due to a number of factors, including:
| ● | our inability to integrate or benefit from acquired technologies or services; |
| ● | unanticipated costs or liabilities associated with the acquisition; |
| ● | difficulty integrating the technology, accounting systems, operations, control environments and personnel of the acquired business and integrating the acquired business or its employees into our culture; |
25
| ● | difficulties and additional expenses associated with supporting legacy solutions and infrastructure of the acquired business; |
| ● | diversion of management’s attention and other resources; |
| ● | additional costs for the support or professional services model of the acquired company; |
| ● | adverse effects to our existing business relationships with service partners and clients; |
| ● | the issuance of additional equity securities that could dilute the ownership interests of our stockholders; |
| ● | incurrence of debt on terms unfavorable to us or that we are unable to repay; |
| ● | incurrence of substantial liabilities; |
| ● | difficulties retaining key employees of the acquired business; and |
| ● | adverse tax consequences, substantial depreciation, or deferred compensation charges. |
In addition, a significant portion of the purchase price of companies we acquire may be allocated to acquired goodwill and other intangible assets, which must be assessed for impairment at least annually and when indicators of impairment are present. In the future, if our acquisitions do not yield expected returns, we may be required to take charges to our operating results based on this impairment assessment process, which could adversely affect our results of operations.
If we are unable to effectively manage certain risks and challenges related to our India operations, our business could be harmed.
Our significant presence and operations in India creates certain risks that we must effectively manage. As of December 31, 2023, 577 of our 1,102 global employees were based in India. Although wage and benefit costs in India for skilled professionals are currently significantly lower than in the United States, these costs have been increasing at a faster rate in India than in the United States. There is also intense competition in India for skilled professionals, and we expect such competition to increase. As a result, we may be unable to cost-effectively retain or add to our employee base in India. Furthermore, India has experienced natural disasters, civil unrest and terrorism and, in the past, has been involved in conflicts with neighboring countries. If we are unable to effectively manage the risks related to our India operations, our operations could be impaired, which could materially and negatively impact our growth and operating results.
Financial and Accounting Related Risks
Our revenue recognition and other factors may create volatility in our financial results in any given period and make them difficult to predict.
Historically, our platform subscription contracts have typically had a one-year term and were cancellable with 30 days’ notice. Beginning in the first quarter of 2021, our default platform subscription contract has a multi-year term and does not allow termination for convenience, although each contract may be negotiated with varying term lengths, and with or without a termination for convenience clause. Quarterly and annual results are subject to volatility due to the timing of renewals between periods, timing of new sales contracts, changes in contract term and length, and conversion of existing subscription users to other commercial offerings.
Regardless of the term of these contracts, revenues are generally billed one month in arrears based on utilization of the different attributes of platform. While utilization may be predictable for certain aspects such as user fees, connectivity fees, market data fees, and managed services fees, other aspects such as OEMS are based on actual utilization of connections, which can be canceled or reduced month to month.
26
We derive substantially all of our revenues from clients in the financial services industry and any downturn or consolidation in the financial services industry, regulatory changes concerning financial technology providers, or unfavorable economic conditions affecting regions in which a significant portion of our clients are concentrated or segments of potential clients on which we focus, could harm our business. These clients have experienced significant pressure in recent years due to economic uncertainty, liquidity concerns and increased regulation. In recent years, many financial institutions have failed, merged, or been acquired and failures and consolidations are likely to continue. Further, if our clients merge with or are acquired by other entities such as financial institutions that have in-house developed virtual investment management solutions or that are not our clients or use fewer of our systems, our clients may discontinue, reduce, or change the terms of their use of our solution. It is also possible that the larger financial institutions that result from mergers or consolidations could have greater leverage in negotiating terms with us or could decide to replace some or all of our solution. In addition, any downturn in the financial services industry may cause our clients to reduce their spending on cloud-based investment management solutions or to seek to terminate or renegotiate their contracts with us. Any of these developments could have an adverse effect on our business, results of operations and financial condition.
Our ability to raise capital in a timely manner if needed in the future may be limited, or such capital may be unavailable on acceptable terms, if at all. Our failure to raise capital if needed could adversely affect our business and results of operations, and any debt or equity issued to raise additional capital may reduce the value of our Class A common stock.
We have funded a significant portion of our operations since inception through receipts generated from customers. We cannot be certain if our operations will continue to generate sufficient cash to fund our ongoing operations or the growth of our business. We intend to continue to make investments to support our business and may require additional funds. Additional financing may not be available on favorable terms, if at all. If adequate funds are not available on acceptable terms, we may be unable to invest in future growth opportunities, which could adversely affect our business and results of operations. Under our credit facility, our existing lenders have rights senior to the holders of Class A common stock to make claims on our assets, the terms of the credit facility restrict our operations, and we may be unable to service or repay any debt that we incur under the credit facility. In addition, if we incur additional debt in the future, the lenders would also have rights senior to holders of Class A common stock to make claims on our assets, the terms of any such future debt could further restrict our operations, and we may be unable to service or repay such additional debt. Furthermore, if we issue additional equity securities, stockholders may experience dilution, and the new equity securities could have rights senior to those of our Class A common stock. Because our decision to issue securities in a future offering will depend on numerous considerations, including factors beyond our control, we cannot predict or estimate the impact any future incurrence of debt or issuance of equity securities will have on us. Any future incurrence of debt or issuance of equity securities could adversely affect the value of our Class A common stock.
Our estimates of certain operational metrics are subject to inherent challenges in measurement.
We make certain estimates with regard to certain operational metrics which we track using internal systems that are not independently verified by any third-party. While the metrics presented in this report are based on what we believe to be reasonable assumptions and estimates, our internal systems have a number of limitations, and our methodologies for tracking these metrics may change over time. If investors do not perceive our estimates of our operational metrics to be accurate, or if we discover material inaccuracies with respect to these figures, our reputation may be significantly harmed, and our results of operations and financial condition could be adversely affected.
We are subject to certain restrictive covenants under agreements relating to our credit facility. In addition, substantially all of our assets, including our intellectual property, are pledged as collateral to secure such credit facility.
Our credit facility contains certain customary covenants with which we must comply, including financial covenants relating to maintaining a specified net leverage ratio and interest coverage ratio, and restrictive covenants that, among other things, impose certain limitations on our ability to make, incur or enter into certain: liens, indebtedness, investments, fundamental changes, dispositions, restricted payments, and transactions with affiliates. Our ability to meet the ratios required by our financial covenants can be affected by operating performance or other events beyond our control, and we cannot assure you that we will meet those ratios. Certain events of default under our credit facility could allow the lenders to declare all amounts outstanding to be immediately due and payable and, therefore, could have a material adverse effect on our business.
27
We have pledged substantially all of our assets, including our intellectual property, in support of the credit facility. If we were unable to repay the amounts due under our credit facility or fail to cure any breach of the covenants contained thereunder, our lenders could proceed against the collateral granted to them to secure such indebtedness.
Risks Related to Our Intellectual Property
If we are unable to protect our intellectual property, including trade secrets, or if we fail to enforce our intellectual property rights, our business could be adversely affected.
Our success depends upon our ability to protect our intellectual property, which may require us to incur significant costs. We have developed much of our intellectual property internally, and we rely on a combination of confidentiality obligations in contracts, copyrights, trademarks, service marks, trade secret laws and other contractual restrictions to establish and protect our intellectual property and other proprietary rights. In particular, we enter into confidentiality and invention assignment agreements with our employees and consultants and enter into confidentiality agreements with the parties with whom we have business relationships in which they will have access to our confidential information. We also rely upon licenses to intellectual property from third parties. No assurance can be given that these agreements or other steps we take to protect our intellectual property or the third-party intellectual property used in our solution will be effective in controlling access to and distribution of our solution and our confidential and proprietary information. We will not be able to protect our intellectual property if we are unable to enforce our rights or if we do not detect unauthorized uses of our intellectual property.
Despite our precautions, it may be possible for third parties to copy our solution and use information that we regard as proprietary to create solutions and services that compete with ours. Third parties may also independently develop technologies that are substantially equivalent to our solution. Some license provisions protecting against unauthorized use, copying, transfer and disclosure of our solution may be unenforceable under the laws of certain jurisdictions.
In some cases, litigation may be necessary to enforce our intellectual property rights or to protect our trade secrets. Litigation could be costly, time consuming and distracting to management and could result in the impairment or loss of portions of our intellectual property. Furthermore, our efforts to enforce our intellectual property rights may be met with defenses, counterclaims and countersuits attacking the validity and enforceability of our intellectual property rights and exposing us to significant damages or injunctions. Our inability to protect our intellectual property against unauthorized copying or use, as well as any costly litigation or diversion of our management’s attention and resources, could delay sales or the implementation of our solution, impair the functionality of our solution, delay introductions of new systems, result in our substituting less-advanced or more-costly technologies into our solution or harm our reputation. In addition, we may be required to license additional intellectual property from third parties to develop and market new systems, and we cannot assure you that we could license that intellectual property on commercially reasonable terms or at all.
Despite our efforts to protect our proprietary technology and trade secrets, unauthorized parties may attempt to misappropriate, reverse engineer, or otherwise obtain and use them. In addition, others may independently discover our trade secrets, in which case we would not be able to assert trade secret rights, or develop similar technologies and processes. Further, the contractual provisions that we enter into may not prevent unauthorized use or disclosure of our proprietary technology or intellectual property rights and may not provide an adequate remedy in the event of unauthorized use or disclosure of our proprietary technology or intellectual property rights. Moreover, policing unauthorized use of our technologies, trade secrets and intellectual property is difficult, expensive, and time-consuming, particularly in foreign countries where the laws may not be as protective of intellectual property rights as those in the United States and where mechanisms for enforcement of intellectual property rights may be weak. We may be unable to determine the extent of any unauthorized use or infringement of our solution, technologies, or intellectual property rights. If we are unable to protect our intellectual property, our business could be adversely affected.
Claims or assertions by third parties of infringement or other violations by us of their intellectual property rights could result in significant costs and substantially harm our business and results of operations.
Vigorous protection and pursuit of intellectual property rights has resulted in protracted and expensive litigation for many companies in the technology industry. Although claims of this kind have not materially affected our business to
28
date, there can be no assurance such claims will not arise in the future. Any claims or proceedings against us, regardless of whether meritorious, could be time consuming, result in costly litigation, require significant amounts of management time, result in the diversion of significant operational resources, or require us to enter into royalty or licensing agreements, any of which could harm our business, financial condition, and results of operations.
Intellectual property lawsuits are subject to inherent uncertainties due to the complexity of the technical issues involved, and we cannot be certain that we will be successful in defending ourselves against intellectual property claims. In addition, we may not be able to effectively use our intellectual property portfolio to assert defenses or counterclaims in response to copyright, patent and trademark infringement claims or litigation, as well as claims for trade secret misappropriation and unfair competition, brought against us by third parties.
Many potential litigants have the capability to dedicate substantially greater resources to enforce their intellectual property rights and to defend claims that may be brought against them. Furthermore, a successful claimant could secure a judgment that requires us to pay substantial damages or prevents us from distributing certain systems or performing certain services. We might also be required to seek a license and pay royalties for the use of such intellectual property, which may not be available on commercially acceptable terms or at all. Alternatively, we may be required to develop non-infringing technology, which could require significant effort and expense and may ultimately not be successful.
If our solution infringes on the intellectual property rights of others, we may be required to obtain costly licenses, enter into unfavorable royalty agreements, be forced to terminate some clients’ agreements, or indemnify our clients for any or some damages they suffer.
We generally indemnify our clients with respect to infringement by our products of the proprietary rights of third parties. Third parties may assert infringement claims against our clients. These claims may require us to initiate or defend protracted and costly litigation on behalf of our clients, regardless of the merits of these claims. If any of these claims succeed, we may be forced to pay damages on behalf of our clients or may be required to obtain licenses for the products they use. If we cannot obtain all necessary licenses on commercially reasonable terms, our clients may stop using our products.
We use “open source” software in our solution, which may restrict how we use or distribute our solution, require that we release the source code of certain software subject to open source licenses, or subject us to litigation or other actions that could adversely affect our business.
We currently use in our solution, and may use in the future, software that is licensed under "open source," "free" or other similar licenses where the licensed software is made available to the general public on an "as-is" basis under the terms of a specific non-negotiable license. Some open source software licenses require that software subject to the license be made available to the public and that any modifications or derivative works based on the open source code be licensed in source code form under the same open source licenses. Although we monitor our use of open source software, we cannot assure you that all open source software is reviewed prior to use in our solution, that our programmers have not incorporated open source software into our solution, or that they will not do so in the future. In addition, some of our products may incorporate third-party software under commercial licenses. We cannot be certain whether such third-party software incorporates open source software without our knowledge. In the past, companies that incorporate open source software into their products have faced claims alleging noncompliance with open source license terms or infringement or misappropriation of proprietary software. Therefore, we could be subject to suits by parties claiming noncompliance with open source licensing terms or infringement or misappropriation of proprietary software. Because few courts have interpreted open source licenses, the manner in which these licenses may be interpreted and enforced is subject to some uncertainty. There is a risk that open source software licenses could be construed in a manner that imposes unanticipated conditions or restrictions on our ability to market or provide our solution. As a result of using open source software subject to such licenses, we could be required to release our proprietary source code, pay damages, re-engineer our products, limit or discontinue sales, or take other remedial action, any of which could adversely affect our business.
29
Risks Related to Legal and Regulatory Matters
Although we are not subject to the same regulations as our clients, the regulatory environment in which our clients operate is subject to continual change and regulatory developments designed to increase oversight could adversely affect our business.
Although we are not currently subject to the same regulations as our clients, the legislative and regulatory environment in which our clients operate undergoes continuous change, which could subject our clients to additional, more costly, and potentially more punitive regulation. New laws or regulations, or changes in the enforcement of existing laws or regulations, applicable to our clients or directly applicable to us could adversely affect our business subjecting us to additional costs. Any or all of the regulators who oversee our clients could adopt new rules or rule amendments that could substantially impact how we operate and may necessitate significant expenditures in order to adapt and comply. Our ability to support our clients in an uncertain and ever-changing regulatory environment will depend on our ability to constantly monitor and promptly react to legislative and regulatory changes, which inevitably result in intangible costs and resource drains. The compliance burden resulting from regulatory changes and uncertainty is likely to increase, particularly as regulators grow more technologically advanced and more reliant on data analytics. As a result, we may be forced to divert resources and expenditures to information technology in order to analyze data and risk in the same manner as regulators to be able to assist our clients in providing regulators with the data output they may expect going forward.
There also have been a number of highly publicized regulatory inquiries that have focused on the investment management industry. These inquiries have resulted in increased scrutiny of the industry and new rules and regulations for mutual funds and investment managers. This regulatory scrutiny may limit our ability to engage in certain activities that might be beneficial to our stockholders. Further, adverse results of regulatory investigations of mutual fund, investment advisory and financial services firms could tarnish the reputation of the financial services industry generally and mutual funds and investment advisers more specifically, causing investors to avoid further fund investments or redeem their account balances. Further, due to acts of serious fraud in the investment management industry and perceived lapses in regulatory oversight, U.S. and non-U.S. governmental and regulatory authorities may continue to increase regulatory oversight of our clients’ businesses.
This evolving, complex and often unpredictable regulatory environment could result in our failure to provide a compliant solution, which could result in clients not purchasing our solution or terminating their agreements with us or the imposition of fines or other liabilities for which we may be responsible. In addition, federal, state, local and/or foreign agencies may attempt to further regulate our activities in the future. If enacted or deemed applicable to us, such laws, rules, or regulations could be imposed on our activities or our business thereby rendering our business or operations more costly, burdensome, less efficient, or impossible, any of which could have a material adverse effect on our business, financial condition, and operating results.
Any future litigation against us could damage our reputation and be costly and time-consuming to defend.
We may become subject, from time to time, to legal proceedings and claims that arise in the ordinary course of business, such as claims brought by our clients in connection with commercial disputes or employment claims made by current or former employees. Litigation might result in reputational damage and substantial costs and may divert management’s attention and resources, which might adversely impact our business, overall financial condition, and results of operations. Insurance might not cover such claims, might not provide sufficient payments to cover all the costs to resolve one or more such claims and might not continue to be available on terms acceptable to us. Moreover, any negative impact to our reputation will not be adequately covered by any insurance recovery. A claim brought against us that is uninsured or underinsured could result in unanticipated costs, thereby reducing our results of operations and leading analysts or potential investors to reduce their expectations of our performance, which could reduce the value of our Class A common stock. While we currently are not aware of any material pending or threatened litigation against us, we can make no assurances the same will continue to be true in the future.
30
Our failure to comply with laws and regulations related to the Internet or future government regulation of the Internet could increase costs and impose constraints on the way we conduct our business.
We and our clients are subject to laws and regulations applicable to doing business over the Internet. It is often not clear how existing laws governing issues such as property ownership, sales and other taxes apply to the Internet, as these laws have in some cases failed to keep pace with technological change. Laws governing the Internet could also impact our business or the business of our clients. For instance, existing and future regulations on taxing Internet use, pricing, characterizing the types and quality of services and products, or restricting the exchange of information over the Internet or mobile devices could result in reduced growth of our business, a general decline in the use of the Internet by financial services providers, or their end users, or diminished viability of our solution and could significantly restrict our clients’ ability to use our solution. Changing laws and regulations, industry standards and industry self-regulation regarding the collection, use and disclosure of certain data may have similar effects on our and our clients’ businesses. Any such constraint on the growth in the Internet could decrease its acceptance as a medium of communication and commerce or result in increased adoption of new modes of communication and commerce that may not be supported by our solution. Any such adverse legal or regulatory developments could substantially harm our operating results and our business.
Our failure to comply with the FCPA and similar anti-bribery and anti-corruption laws associated with our activities outside the United States could subject us to penalties and other adverse consequences.
A portion of our revenues are derived from jurisdictions outside of the United States. We are subject to the FCPA, which generally prohibits U.S. companies and their intermediaries from making payments to foreign officials for the purpose of directing, obtaining, or keeping business and requires companies to maintain reasonable books and records and a system of internal accounting controls. The FCPA applies to companies and individuals alike, including company directors, officers, employees, and agents. Under the FCPA, U.S. companies may be held liable for corrupt actions taken by employees, strategic, or local partners or other representatives. In addition, the government may seek to rely on a theory of successor liability and hold us responsible for FCPA violations committed by companies or associated with assets that we acquire.
In certain foreign jurisdictions where we currently operate or plan to expand our operations, particularly countries with developing economies, it may be a local custom for businesses to engage in practices that are prohibited by the FCPA or other similar laws and regulations. There can be no assurance that our colleagues, partners, and agents, as well as those companies to which we outsource certain of our business operations, will not take actions in violation of the FCPA or our policies for which we may be ultimately held responsible. If we or our intermediaries fail to comply with the requirements of the FCPA or similar anti-bribery and anti-corruption legislation such as the United Kingdom Bribery Act and the China Unfair Competition law, governmental authorities in the United States and elsewhere could seek to impose civil and/or criminal fines and penalties, which could harm our business, financial conditions and results of operations. We may also face collateral consequences such as debarment and the loss of our export privileges.
Our failure to comply with various data privacy, protection and security regulations could impose additional costs and liabilities on us, limit our use, storage, or processing of information and adversely affect our business.
We operate in a regulatory environment in which requirements applicable to privacy, data protection and data security are continually evolving. We cannot assure you that relevant governmental authorities will not interpret or implement the laws or regulations in ways that negatively affect the cloud service industry, our clients and us. Regulatory investigations, restrictions, penalties, and sanctions, whether targeted at us or not, may negatively affect the market environment in which we operate, our existing or potential clients and our products and services, which may in turn have a material adverse effect on our business, results of operations and financial condition. It is also possible that we may become subject to additional or new laws and regulations regarding privacy, data protection and data security in connection with the data we have access to and the data products and services we provide to our clients. Moreover, we may be subject to regulatory requirements as a result of utilization of our products and services by residents of certain jurisdictions, such as the General Data Protection Regulation (the “GDPR”) of the European Union, the UK version of the GDPR, the California Consumer Privacy Act, and Virginia’s Consumer Data Protection Act. Complying with these and other regulatory requirements could force us to incur substantial costs or require us to change our business practices. Moreover, if a high profile security breach occurs with respect to our competitors, people may lose trust in the security of cloud
31
service providers generally, including us, which could damage the reputation of the industry, result in heightened regulation and strengthened regulatory enforcement and adversely affect our business and results of operations.
We expect that we will continue to face uncertainty as to whether our efforts to comply with evolving obligations under global data protection, privacy and security laws will be sufficient. Any failure or perceived failure by us to comply with applicable laws and regulations could result in reputational damage or proceedings or actions against us by governmental authorities, individuals, or others. These proceedings or actions could subject us to significant civil or criminal penalties and negative publicity, require us to change our business practices, increase our costs and materially harm our business, prospects, financial condition, and results of operations. In addition, our current and future relationships with clients, vendors and other third parties could be negatively affected by any proceedings or actions against us or current or future data protection obligations imposed on them under applicable law. Furthermore, a data breach affecting personal information could result in significant legal and financial exposure and reputational damage that could potentially have an adverse effect on our business.
Failure to comply with governmental laws and regulations could harm our business, materially and adversely affect us, and cause our stock price to decline significantly.
Our business is subject to regulation by various federal, state, local and foreign governmental agencies, including agencies responsible for monitoring and enforcing employment and labor laws, workplace safety, product safety, environmental laws, consumer protection laws, anti-bribery laws, import/export controls, federal securities laws and tax laws and regulations. In certain jurisdictions, these regulatory requirements may be more stringent than those in the United States. Noncompliance with applicable regulations or requirements could subject us to investigations, sanctions, revocation of required licenses, enforcement actions, disgorgement of profits, fines, damages, civil and criminal penalties, or injunctions. If any governmental sanctions are imposed, or if we do not prevail in any possible civil or criminal litigation, we could be materially and adversely affected. In addition, responding to any action will likely result in a significant diversion of management’s attention and resources and an increase in legal and professional costs and expenses.
We are not a registered broker-dealer and therefore we do not execute trades. We provide passive communication technology to institutional investors, such as money managers and hedge funds, that enables such investors to communicate with executing brokers, prime brokers and clearing firms. As such, we must ensure that our technology activities and our compensation structure therefore would not result in our acting as an unregistered broker-dealer or investment adviser that could subject us to, among other things, regulatory enforcement actions, monetary fines, restrictions on the conduct of our technology business and rescission/damages claims by clients who use our technology. Our failure to comply with any laws or regulations, or the costs associated with defending any action alleging our noncompliance with any laws or regulations, could materially and adversely affect us and cause our stock price to decline significantly.
Risks Related to our Class A Common Stock
The market price and trading volume of our Class A common stock may be volatile, which could result in rapid and substantial losses for our stockholders.
The market price of our Class A common stock may be highly volatile and could be subject to wide fluctuations. In addition, the trading volume in our Class A common stock may fluctuate and cause significant price variations to occur. If the market price of our Class A common stock declines significantly, stockholders’ may be unable to resell their shares at or above their purchase price, if at all. The market price of our Class A common stock may fluctuate or decline significantly in the future. Some of the factors that could negatively affect our share price or result in fluctuations in the price or trading volume of our Class A common stock include:
| ● | variations in our quarterly or annual operating results; |
| ● | our ability to attract new clients, particularly larger clients, in both domestic and international markets and our ability to increase sales to and renew agreements with our existing clients, particularly larger clients, at comparable prices; |
32
| ● | the timing of our clients’ buying decisions and reductions in our clients’ budgets for IT purchases and delays in their purchasing cycles, particularly in light of recent adverse global economic conditions; |
| ● | changes in our earnings estimates (if provided) or differences between our actual financial and operating results and those expected by investors and analysts; |
| ● | the contents of published research reports about us or our industry or the failure of securities analysts to cover our Class A common stock; |
| ● | additions to, or departures of, key management personnel; |
| ● | any increased indebtedness we may incur in the future; |
| ● | announcements and public filings by us or others and developments affecting us; |
| ● | actions by institutional stockholders; |
| ● | litigation and governmental investigations; |
| ● | operating and stock performance of other companies that investors deem comparable to us (and changes in their market valuations) and overall performance of the equity markets; |
| ● | speculation or reports by the press or investment community with respect to us or our industry in general; |
| ● | increases in market interest rates that may lead purchasers of our shares to demand a higher yield; |
| ● | announcements by us or our competitors of significant contracts, acquisitions, dispositions, strategic relationships, joint ventures, or capital commitments; |
| ● | announcements or actions taken by significant stockholders; |
| ● | sales of substantial amounts of our Class A common stock by significant stockholders or our insiders, or the expectation that such sales might occur; |
| ● | volatility or economic downturns in the markets in which we, our clients and our partners are located caused by pandemics, including the COVID-19 pandemic and related policies and restrictions undertaken to contain the spread of such pandemics or potential pandemics; and |
| ● | general market, political and economic conditions, in the investment management industry in particular, including any such conditions and local conditions in the markets in which any of our clients are located. |
These broad market and industry factors may decrease the market price of our Class A common stock, regardless of our actual operating performance. The stock market in general has from time to time experienced extreme price and volume fluctuations. In addition, in the past, following periods of volatility in the overall market and the market price of a company’s securities, securities class action litigation has often been instituted against these companies. This litigation, if instituted against us, could result in substantial costs and a diversion of our management’s attention and resources.
An active, liquid trading market for our Class A common stock may not develop or be sustained, which may make it difficult for you to sell the Class A common stock you purchase.
We cannot assure you that the price of our Class A common stock will equal or exceed the price at which our securities have traded at any point from and after our IPO. We cannot predict the extent to which investor interest in us
33
will lead to the development of a trading market or how active and liquid that market may become. If an active and liquid trading market for our Class A common stock may not develop or continue, you may have difficulty selling any of our Class A common stock at a price above the price you purchase it or at all. If an active and liquid trading market for our Class A common stock does not develop or continue, or, if not further developed, it may not be sustained and our ability to raise capital to fund our operations by selling shares and our ability to acquire other companies or technologies by using our shares as consideration will suffer.
Future sales of shares by existing stockholders could cause our stock price to decline.
If our existing stockholders, including employees who obtain equity, sell, or indicate an intention to sell, substantial amounts of our Class A common stock in the public market, the trading price of our Class A common stock could decline. As of December 31, 2023, we had outstanding 88,332,175 shares of Class A common stock and 39,198,767 shares of Class B common stock. Sales of a substantial number of such shares or the perception that such sales may occur could cause our market price to fall or make it more difficult for you to sell your Class A common stock at a time and price that you deem appropriate.
Future offerings of debt or equity securities by us may materially and adversely affect the market price of our Class A common stock.
In the future, we may attempt to obtain financing or to further increase our capital resources by issuing additional shares of our Class A common stock or offering debt or other equity securities, including senior or subordinated notes, debt securities convertible into equity, or shares of preferred stock. In addition, we may seek to expand operations in the future to other markets which we would expect to finance through a combination of additional issuances of equity, corporate indebtedness and/or cash from operations.
Issuing additional shares of our Class A common stock or other equity securities or securities convertible into equity may dilute the economic and voting rights of our existing stockholders or reduce the market price of our Class A common stock or both. Upon liquidation, holders of such debt securities and preferred shares, if issued, and lenders with respect to other borrowings would receive a distribution of our available assets prior to the holders of our Class A common stock. Debt securities convertible into equity could be subject to adjustments in the conversion ratio pursuant to which certain events may increase the number of equity securities issuable upon conversion. Preferred shares, if issued, could have a preference with respect to liquidating distributions or a preference with respect to dividend payments that could limit our ability to pay dividends to the holders of our Class A common stock. Our decision to issue securities in any future offering will depend on market conditions and other factors beyond our control, which may adversely affect the amount, timing, or nature of our future offerings. Thus, holders of our Class A common stock bear the risk that our future offerings may reduce the market price of our Class A common stock and dilute their stockholdings in us.
The future issuance of additional Class A common stock in connection with our incentive plans or otherwise will dilute all other stockholdings.
We may issue additional shares of Class A common stock that are authorized under our amended and restated certificate of incorporation but not currently issued or reserved for issuance under our equity incentive plans. Subject to applicable law and stock exchange rules, we may issue these shares of Class A common stock without any action or approval by our stockholders, subject to certain exceptions. Any Class A common stock issued in connection with our incentive plans, the exercise of outstanding stock options or otherwise would dilute the percentage ownership held by our Class A common stockholders.
Insiders have substantial control over us, which could limit your ability to influence the outcome of key transactions, including a change of control.
As of December 31, 2023, our directors, executive officers, and each of our stockholders who own greater than 5% of our outstanding common stock and their affiliates, in the aggregate, beneficially owned approximately 67.1% of the combined voting power of our then-outstanding common stock through their ownership of both Class A common stock and Class B common stock. As a result, these stockholders are able to influence or control matters requiring approval by
34
our stockholders, including the election of directors and the approval of mergers, acquisitions or other extraordinary transactions. They may also have interests that differ from yours and may vote in a way with which you disagree and which may be adverse to your interests. This concentration of ownership may have the effect of delaying, preventing, or deterring a change of control of our company, could deprive our stockholders of an opportunity to receive a premium for their Class A common stock as part of a sale of our company and might ultimately adversely affect the market price of our Class A common stock.
Risks Related to our Organizational Structure
Enfusion, Inc. is a holding company, and its only material asset is its direct and indirect interest in Enfusion Ltd. LLC, and it is accordingly dependent upon distributions from Enfusion Ltd. LLC to pay taxes, make payments under the Tax Receivable Agreement, and pay dividends.
Enfusion, Inc. is a holding company and after the completion of the IPO has no material assets other than its direct and/or indirect ownership of Common Units. Enfusion, Inc. has no independent means of generating revenues. Enfusion, Inc. intends to cause Enfusion Ltd. LLC to make distributions to holders of its Common Units, including directly and/or indirectly Enfusion, Inc. and our Pre-IPO Common Unitholders, in an amount sufficient to cover all applicable taxes at assumed tax rates, payments under the Tax Receivable Agreement and dividends, if any, declared by it. Deterioration in the financial condition, earnings, or cash flow of Enfusion Ltd. LLC and its subsidiaries for any reason could limit or impair their ability to pay such distributions. Additionally, to the extent that Enfusion, Inc. needs funds, and Enfusion Ltd. LLC is restricted from making such distributions under applicable law or regulation or under the terms of our financing arrangements, or is otherwise unable to provide such funds, such restriction could materially adversely affect our liquidity and financial condition.
We anticipate that Enfusion Ltd. LLC will continue to be treated as a partnership for U.S. federal income tax purposes and, as such, generally will not be subject to any entity-level U.S. federal income tax. Instead, taxable income will be allocated to holders of Common Units, including us. Accordingly, we will be required to pay income taxes on our direct and/or indirect allocable share of any net taxable income of Enfusion Ltd. LLC. Legislation that is effective for taxable years beginning after December 31, 2017 may impute liability for adjustments to a partnership’s tax return to the partnership itself in certain circumstances, absent an election to the contrary. Enfusion Ltd. LLC may be subject to material liabilities pursuant to this legislation and related guidance if, for example, its calculations of taxable income are incorrect. In addition, the income taxes on our direct and/or indirect allocable share of Enfusion Ltd. LLC’s net taxable income will increase over time as our Pre-IPO Common Unitholders exchange their Common Units for shares of our Class A common stock. Such increase in our tax expenses may have a material adverse effect on our business, results of operations and financial condition.
Under the terms of the amended and restated limited partnership agreement, Enfusion Ltd. LLC is obligated to make tax distributions to holders of Common Units, including (directly and/or indirectly) us, at certain assumed tax rates. These tax distributions may in certain periods exceed our tax liabilities and obligations to make payments under the Tax Receivable Agreement. Our board of directors, in its sole discretion, will make any determination from time to time with respect to the use of any such excess cash so accumulated, which may include, among other uses, funding repurchases of Class A common stock; acquiring additional newly issued Common Units from Enfusion Ltd. LLC at a per unit price determined by reference to the market value of the Class A common stock; paying dividends, which may include special dividends, on our Class A common stock; or any combination of the foregoing. We will have no obligation to distribute such cash (or other available cash other than any declared dividend) to our stockholders. To the extent that we do not distribute such excess cash as dividends on our Class A common stock or otherwise undertake ameliorative actions between Common Units and shares of Class A common stock and instead, for example, hold such cash balances, our Pre-IPO Common Unitholders may benefit from any value attributable to such cash balances as a result of their ownership of Class A common stock following a redemption or exchange of their Common Units, notwithstanding that such Pre-IPO Common Unitholders may previously have participated as holders of Common Units in distributions by Enfusion Ltd. LLC that resulted in such excess cash balances at Enfusion, Inc. See “Certain Relationships and Related Party Transactions—Seventh Amended and Restated Operating Agreement of Enfusion Ltd. LLC” of the definitive Proxy Statement for our 2023 Annual Meeting of Stockholders, which was filed with the SEC on May 1, 2023.
35
Payments of dividends, if any, will be at the discretion of our board of directors after taking into account various factors, including our business, operating results and financial condition, current and anticipated cash needs, plans for expansion and any legal or contractual limitations on our ability to pay dividends. Our existing credit facilities include, and any financing arrangement that we enter into in the future may include, restrictive covenants that limit our ability to pay dividends. In addition, Enfusion Ltd. LLC is generally prohibited under Delaware law from making a distribution to a limited partner to the extent that, at the time of the distribution, after giving effect to the distribution, liabilities of Enfusion Ltd. LLC (with certain exceptions) exceed the fair value of its assets. Subsidiaries of Enfusion Ltd. LLC are generally subject to similar legal limitations on their ability to make distributions to Enfusion Ltd. LLC.
Enfusion, Inc. will be required to pay certain of our Pre-IPO Owners for most of the benefits relating to tax depreciation or amortization deductions that we may claim as a result of Enfusion, Inc.’s acquisition of existing tax basis in the IPO, increases in existing tax basis and anticipated tax basis adjustments we receive in connection with sales or exchanges (or deemed exchanges) of Common Units or distributions (or deemed distributions) with respect to Common Units after the IPO and our utilization of certain tax attributes of the Blocker Companies.
Prior to the completion of the IPO, we entered into a Tax Receivable Agreement with certain of our Pre-IPO Owners that provides for the payment by Enfusion, Inc. to such Pre-IPO Owners of 85% of the benefits, if any, that Enfusion, Inc. actually realizes, or is deemed to realize (calculated using certain assumptions), as a result of (i) existing tax basis acquired in the IPO, (ii) increases in existing tax basis and adjustments to the tax basis of the tangible and intangible assets of Enfusion Ltd. LLC as a result of sales or exchanges (or deemed exchanges) of Common Units for shares of Class A common stock or distributions (or deemed distributions) with respect to Common Units after the IPO, (iii) Enfusion, Inc.’s utilization of certain attributes of the Blocker Companies, and (iv) certain other tax benefits related to entering into the Tax Receivable Agreement, including tax benefits attributable to payments under the Tax Receivable Agreement. The existing tax basis, increases in existing tax basis and the tax basis adjustments generated over time may increase (for tax purposes) the depreciation and amortization deductions available to Enfusion, Inc. and, therefore, may reduce the amount of U.S. federal, state and local tax that Enfusion, Inc. would otherwise be required to pay in the future, although the IRS may challenge all or part of the validity of that tax basis, and a court could sustain such a challenge. The existing tax basis acquired in the IPO and the increase in existing tax basis and the anticipated tax basis adjustments upon purchases or exchanges (or deemed exchanges) of Common Units for shares of Class A common stock or distributions (or deemed distributions) with respect to Common Units may also decrease gains (or increase losses) on future dispositions of certain assets to the extent tax basis is allocated to those assets. Actual tax benefits realized by Enfusion, Inc. may differ from tax benefits calculated under the Tax Receivable Agreement as a result of the use of certain assumptions in the Tax Receivable Agreement, including the use of an assumed weighted-average state and local income tax rate to calculate tax benefits.
The payment obligation under the Tax Receivable Agreement is an obligation of Enfusion, Inc. and not of Enfusion Ltd. LLC. While the amount of existing tax basis and anticipated tax basis adjustments and utilization of tax attributes, as well as the amount and timing of any payments under the Tax Receivable Agreement, will vary depending upon a number of factors, we expect the payments that Enfusion, Inc. may make under the Tax Receivable Agreement will be substantial. The actual amounts payable will depend upon, among other things, the timing of purchases or exchanges, the price of shares of our Class A common stock at the time of such purchases or exchanges, the extent to which such purchases or exchanges are taxable, the tax rate and the amount and timing of our taxable income. As of December 31, 2023, the Company estimates the amount of total tax attributes acquired to be approximately $323.6 million. If all of the Pre-IPO Common Unitholders had exchanged or sold to us all of their outstanding Common Units as of December 31, 2023, we would have recognized a deferred tax asset of approximately $148.5 million and a liability under the Tax Receivable Agreement of approximately $126.2 million, assuming: (i) all exchanges or purchases occurred on the same day, (ii) a price of $9.70 per share, which was the price per share of Class A common stock as of December 31, 2023, (iii) a constant corporate tax rate of 29.7%, (iv) that we would have sufficient taxable income to utilize the tax benefits fully, and (v) no material changes in tax law. The payments under the Tax Receivable Agreement are not conditioned upon continued ownership of us by the Pre-IPO Owners.
36
In certain cases, payments under the Tax Receivable Agreement may be accelerated and/or significantly exceed the actual benefits Enfusion Ltd. LLC realizes in respect of the tax attributes subject to the Tax Receivable Agreement.
Enfusion, Inc.’s payment obligations under the Tax Receivable Agreement will be accelerated in the event of certain changes of control, upon a breach by Enfusion, Inc. of a material obligation under the Tax Receivable Agreement or if Enfusion, Inc. elects to terminate the Tax Receivable Agreement early. The accelerated payments required in such circumstances will be calculated by reference to the present value (at a discount rate equal to the lesser of (i) 6.5% per annum and (ii) one-year LIBOR (or its successor rate) plus 100 basis points) of all future payments that holders of Common Units or other recipients would have been entitled to receive under the Tax Receivable Agreement, and such accelerated payments and any other future payments under the Tax Receivable Agreement will utilize certain valuation assumptions, including that Enfusion, Inc. will have sufficient taxable income to fully utilize the deductions arising from the increased tax deductions and tax basis and other benefits related to entering into the Tax Receivable Agreement and sufficient taxable income to fully utilize any remaining net operating losses subject to the Tax Receivable Agreement on a straight line basis over the shorter of the statutory expiration period for such net operating losses or the five-year period after the early termination or change of control. In addition, recipients of payments under the Tax Receivable Agreement will not reimburse us for any payments previously made under the Tax Receivable Agreement if the tax attributes or Enfusion, Inc.’s utilization of tax attributes underlying the relevant Tax Receivable Agreement payment are successfully challenged by the IRS (although any such detriment would be taken into account as an offset against future payments due to the relevant recipient under the Tax Receivable Agreement). Enfusion, Inc.’s ability to achieve benefits from any existing tax basis, tax basis adjustments, or other tax attributes, and the payments to be made under the Tax Receivable Agreement, will depend upon a number of factors, including the timing and amount of our future income. As a result, even in the absence of a change of control or an election to terminate the Tax Receivable Agreement early, payments under the Tax Receivable Agreement could be in excess of 85% of Enfusion, Inc.’s actual cash tax benefits.
Accordingly, it is possible that the actual cash tax benefits realized by Enfusion, Inc. may be significantly less than the corresponding Tax Receivable Agreement payments. It is also possible that payments under the Tax Receivable Agreement may be made years in advance of the actual realization, if any, of the anticipated future tax benefits. There may be a material negative effect on our liquidity if the payments under the Tax Receivable Agreement exceed the actual cash tax benefits that Enfusion, Inc. realizes in respect of the tax attributes subject to the Tax Receivable Agreement and/or if distributions to Enfusion, Inc. by Enfusion Ltd. LLC are not sufficient to permit Enfusion, Inc. to make payments under the Tax Receivable Agreement after it has paid taxes and other expenses. We estimate that if Enfusion, Inc. had exercised its termination right as of December 31, 2023, the aggregate amount of the early termination payments required under the Tax Receivable Agreement would have been approximately $53.3 million. The foregoing number is merely an estimate, and the actual payments could differ materially. We may need to incur additional indebtedness to finance payments under the Tax Receivable Agreement to the extent our cash resources are insufficient to meet our obligations under the Tax Receivable Agreement as a result of timing discrepancies or otherwise, and these obligations could have the effect of delaying, deferring or preventing certain mergers, asset sales, other forms of business combinations, or other changes of control.
The acceleration of payments under the Tax Receivable Agreement in the case of certain changes of control may impair our ability to consummate change of control transactions or negatively impact the value received by owners of our Class A common stock.
In the case of certain changes of control, payments under the Tax Receivable Agreement will be accelerated and may significantly exceed the actual benefits Enfusion, Inc. realizes in respect of the tax attributes subject to the Tax Receivable Agreement. We expect that the payments that we may make under the Tax Receivable Agreement in the event of a change of control will be substantial. As a result, our accelerated payment obligations and/or the assumptions adopted under the Tax Receivable Agreement in the case of a change of control may impair our ability to consummate change of control transactions or negatively impact the value received by owners of our Class A common stock in a change of control transaction.
37
General Risk Factors
As an “emerging growth company” under the Jumpstart Our Business Startups Act (the “JOBS Act”), we are permitted to, and intend to, rely on exemptions from certain disclosure requirements, which could make our Class A common stock less attractive to investors.
As an “emerging growth company” under the JOBS Act, we are relying on permitted exemptions from certain disclosure requirements. In addition, for so long as we are an emerging growth company, we will not be required to:
| ● | have an auditor report on our internal control over financial reporting pursuant to Section 404(b) of the Sarbanes-Oxley Act of 2002 (the “Sarbanes-Oxley Act”); |
| ● | comply with any requirement that may be adopted by the Public Company Accounting Oversight Board regarding mandatory audit firm rotation or a supplement to the auditor’s report providing additional information about the audit and the financial statements (auditor discussion and analysis); and |
| ● | submit certain executive compensation matters to stockholder advisory votes, such as “say on pay” and “say on frequency.” |
Because of these exemptions and the other reduced disclosure obligations for emerging growth companies set forth elsewhere in this report, our stock may appear less attractive to investors and could cause our stock price to decline.
Although we intend to rely on certain of the exemptions provided in the JOBS Act, the exact implications of the JOBS Act for us are still subject to interpretations and guidance by the SEC and other regulatory agencies. Also, as our business grows, we may no longer satisfy the conditions of an emerging growth company. We will remain an "emerging growth company" until the earliest of (i) the last day of the fiscal year during which we have total annual gross revenues of $1.235 billion or more; (ii) the last day of the fiscal year following the fifth anniversary of our initial public offering; (iii) the date on which we have, during the previous three-year period, issued more than $1 billion in non-convertible debt; and (iv) the date on which we are deemed to be a "large accelerated filer" under the Exchange Act. We will be deemed a large accelerated filer on the first day of the fiscal year after the market value of our common equity held by non-affiliates exceeds $700.0 million, measured on June 30. If investors find our Class A common stock less attractive as a result of our reliance on certain of the JOBS Act exemptions, there may be a less active trading market for our Class A common stock, and our stock price may be more volatile.
In addition, section 107 of the JOBS Act also provides that an emerging growth company can take advantage of the extended transition period provided in Section 7(a)(2)(B) of the Securities Act of 1933, as amended (the “Securities Act”) for complying with new or revised accounting standards. In other words, an emerging growth company can delay the adoption of certain accounting standards until those standards would otherwise apply to private companies. We have chosen to "opt in" to such extended transition period, and as a result, we will not initially have to comply with new or revised accounting standards on the relevant dates on which adoption of such standards is required for non-emerging growth companies.
As a public company, we are obligated to develop and maintain proper and effective internal control over financial reporting and any failure to maintain the adequacy of these internal controls may adversely affect investor confidence in our company and, as a result, the value of our Class A common stock.
We are required, pursuant to Section 404(a) of the Sarbanes-Oxley Act, to furnish a report by management on, among other things, the effectiveness of our internal control over financial reporting on an annual basis. This assessment must include disclosure of any material weaknesses identified by our management in our internal control over financial reporting. Our independent registered public accounting firm will not be required to attest to the effectiveness of our internal control over financial reporting until our first annual report required to be filed with the SEC following the date we are no longer an “emerging growth company,” as defined in the JOBS Act. We are and will be required to disclose significant changes made in our internal control procedures on a quarterly basis.
38
Our compliance with Section 404(a) has and will require that we incur substantial expenses, including legal, compliance, accounting, and informational technology expenses, and expend significant management efforts. We currently do not have an internal audit group, and we may need to hire additional accounting and financial staff to maintain the system and process documentation necessary to perform the evaluation needed to comply with Section 404(a).
During the evaluation and testing process of our internal controls, if we identify one or more material weaknesses in our internal control over financial reporting, we will be unable to assert that our internal control over financial reporting is effective. We cannot assure you that there will not be material weaknesses or significant deficiencies in our internal control over financial reporting in the future. Any failure to maintain internal control over financial reporting could severely inhibit our ability to accurately report our financial condition and operating results. If we are unable to conclude that our internal control over financial reporting is effective, or if our independent registered public accounting firm determines we have a material weakness or significant deficiency in our internal control over financial reporting, we could lose investor confidence in the accuracy and completeness of our financial reports, the market price of our Class A common stock could decline, and we could be subject to sanctions or investigations by the SEC or other regulatory authorities. Failure to remedy any material weakness in our internal control over financial reporting, or to implement or maintain other effective control systems required of public companies, could also restrict our future access to the capital markets.
We incur increased costs and administrative burdens in connection with operating as a public company, and our management is required to devote substantial time to new compliance initiatives and corporate governance practices. We may fail to comply with the rules that apply to public companies, including Section 404 of the Sarbanes-Oxley Act, which could result in sanctions or other penalties that would harm our business.
As a public company, and particularly after we are no longer an “emerging growth company,” we have and will incur significant legal, accounting, and other expenses, including costs resulting from public company reporting obligations under the Securities Act or the Exchange Act, and regulations regarding corporate governance practices. The expenses incurred by public companies generally for reporting and corporate governance purposes are greater than those for private companies. The Sarbanes-Oxley Act, the Dodd-Frank Wall Street Reform and Consumer Protection Act, the rules of the SEC, the listing requirements of the New York Stock Exchange, and other applicable securities rules and regulations impose various requirements on public companies, including establishment and maintenance of effective disclosure and financial controls and corporate governance practices. These requirements have and will increase our legal and financial compliance costs and make some activities more time-consuming and costly. We are currently evaluating these rules and regulations and cannot predict or estimate the amount of additional costs we may incur or the timing of such costs. These rules and regulations are often subject to varying interpretations, in many cases due to their lack of specificity, and, as a result, their application in practice may evolve over time as new guidance is provided by regulatory and governing bodies. This could result in continuing uncertainty regarding compliance matters and higher costs necessitated by ongoing revisions to disclosure and governance practices. We cannot predict or estimate the amount of additional costs we will continue to incur as a public company or the timing of such costs. Any changes we make to comply with these obligations may not be sufficient to allow us to satisfy our obligations as a public company on a timely basis, or at all. These reporting requirements, rules and regulations, coupled with the increase in potential litigation exposure associated with being a public company, could also make it more difficult for us to attract and retain qualified persons to serve on our board of directors or board committees or to serve as executive officers, or to obtain certain types of insurance, including directors’ and officers’ insurance, on acceptable terms. In addition, as a public company we are and will be required to file accurate and timely quarterly and annual reports with the SEC under the Securities Act or the Exchange Act. Any failure to report our financial results on an accurate and timely basis could result in sanctions, lawsuits, delisting of our shares from the New York Stock Exchange or other adverse consequences that would materially harm our business and reputation.
Pursuant to Sarbanes-Oxley Act Section 404(a), we are required to furnish a report by our management on our internal control over financial reporting. However, while we remain an emerging growth company, we will not be required to include an attestation report on internal control over financial reporting issued by our independent registered public accounting firm, as required by Sarbanes-Oxley Act Section 404(b). In anticipation of being subject to Sarbanes-Oxley Act Section 404(b), we will be engaged in a process of further documenting and evaluating our internal control over financial reporting, which is both costly and challenging. In this regard, we will need to continue to dedicate internal resources, potentially engage outside consultants, adopt a detailed work plan to assess and document the adequacy of
39
internal control over financial reporting, continue steps to improve control processes as appropriate, validate through testing that controls are functioning as documented and implement a continuous reporting and improvement process for internal control over financial reporting. Furthermore, we have hired and may continue to hire additional accounting, finance, and other personnel in connection with our becoming subject to the requirements of Section 404(b), and our management and other personnel will need to devote a substantial amount of time towards maintaining compliance with these requirements. Despite our efforts, there is a risk that an independent assessment of the effectiveness of our internal controls by our independent registered public accounting firm could detect problems that our management’s assessment might not. Undetected material weaknesses in our internal controls could lead to financial statement restatements and require us to incur the expense of remediation, which could result in an adverse reaction in the financial markets due to a loss of confidence in the reliability of our financial statements.
Our amended and restated bylaws designate a state or federal court located within the State of Delaware as the exclusive forum for substantially all disputes between us and our stockholders, which could limit our stockholders’ ability to choose the judicial forum for disputes with us or our directors, officers or employees.
Our amended and restated bylaws provide that, unless we consent in writing to the selection of an alternative forum, to the fullest extent permitted by law, the sole and exclusive forum for (1) any derivative action or proceeding brought on our behalf under Delaware law, (2) any action asserting a claim of breach of a fiduciary duty owed by any of our directors, officers or other employees to us or our stockholders, (3) any action arising pursuant to any provision of the Delaware General Corporation Law (the “DGCL”), our amended and restated certificate of incorporation or bylaws, (4) any other action asserting a claim that is governed by the internal affairs doctrine, or (5) any other action asserting an “internal corporate claim,” as defined in Section 115 of the DGCL, shall be the Court of Chancery of the State of Delaware (or, if the Court of Chancery does not have jurisdiction, the federal district court for the District of Delaware) in all cases subject to the court having jurisdiction over indispensable parties named as defendants. These exclusive forum provisions do not apply to claims under the Securities Act or the Exchange Act.
To the extent that any such claims may be based upon federal law claims, Section 27 of the Exchange Act creates exclusive federal jurisdiction over all suits brought to enforce any duty or liability created by the Exchange Act or the rules and regulations thereunder.
Section 22 of the Securities Act creates concurrent jurisdiction for federal and state courts over all suits brought to enforce any duty or liability created by the Securities Act or the rules and regulations thereunder. However, our amended and restated bylaws contain a federal forum provision which provides that unless we consent in writing to the selection of an alternative forum, the federal district courts of the United States of America will be the exclusive forum for the resolution of any complaint asserting a cause of action arising under the Securities Act.
Any person or entity purchasing or otherwise acquiring any interest in any of our securities shall be deemed to have notice of and consented to this provision; provided, however, that stockholders cannot and will not be deemed to have waived our compliance with the federal securities laws and the rules and regulations thereunder. This exclusive forum provision may limit a stockholder’s ability to bring a claim in a judicial forum of its choosing for disputes with us or our directors, officers, or other employees, which may discourage lawsuits against us and our directors, officers, and other employees. If a court were to find the exclusive forum provision in our amended and restated bylaws to be inapplicable or unenforceable in an action, we may incur additional costs associated with resolving the dispute in other jurisdictions, which could harm our results of operations.
Item 1B. Unresolved Staff Comments
None.
Item 1C. Cybersecurity
As a cloud-based SaaS provider operating within the financial services industry, cybersecurity risk management is a critical part of our overall risk management efforts. We maintain Cyber Security and Technology Risk programs that are comprised of policies and controls designed to mitigate cybersecurity and other technology risks. We continuously
40
work to enhance these Cyber Security and Technology Risk programs, though we acknowledge that, at any given time, we may face known and unknown cybersecurity risks and threats that are not fully mitigated.
In order to identify, assess, and manage our cybersecurity risks, we use a risk management framework informed by industry standards and industry-recognized practices, including the National Institute of Standards and Technology and the Secure Controls Framework. We perform periodic technology risk assessments based on these frameworks to identify and assess risks from cybersecurity threats and review the efficacy of our controls. These risk assessments include security assessments, vulnerability assessments, penetration testing, and security audits, and we also engage third-party security experts and consultants to assist with assessments and enhancements of our cybersecurity risk management processes, and provide benchmarks against industry practices. Using the results of these assessments, we have developed risk mitigation strategies that include a variety of technical and operational measures, such as cybersecurity training and compliance programs for all employees with access to our information systems. In addition, we maintain specific policies and practices governing our third-party risks, including our third-party risk management process. Our third-party risk management process uses a number of approaches, including consultation with outside specialists, to assess potential risks associated with third parties’ security controls. Generally, we also contractually require third parties who have access to our data and systems to, among other things, maintain security controls to protect our confidential information and data, and notify us of cybersecurity incidents that may impact our data.
Our Global Head of Security has over 20 years of industry experience and leads a dedicated Cybersecurity, and Governance, Risk and Compliance (“GRC”) team that is responsible for managing the cybersecurity, technology risk management, and cyber continual improvement programs, as well as other activities designed to identify, assess, manage and treat risks, and respond to threats or incidents. The Cybersecurity and GRC teams include personnel with decades of experience in managing risk and selecting, deploying, and operating cybersecurity technologies, initiatives, and processes around the world. The team gathers and relies upon threat intelligence obtained from external consultants, government sources, and technology providers.
Assessing, identifying, and managing our cybersecurity and technology risks is also part of our enterprise risk management (“ERM”) framework. Our ERM framework and associated process is designed to evaluate the Company’s most significant risks, including, as applicable, cybersecurity and technology risks. The ERM framework and associated process is directly overseen by a management-led Risk Management Committee (the “RMC”) that meets on a regular basis and is comprised of our CEO, COO, General Counsel, and Global Head of Security.
The RMC, as supported by individual risk managers for each line of business, also maintains reports regarding the assessment, identification, and management of our enterprise risks for the Board to periodically review. The Global Head of Security also presents to the Board on cybersecurity risks on an approximately annual basis and the Board, through these periodic reports it receives from the RMC and the presentations by the Global Head of Security, maintains involvement with and oversight over the Company’s cybersecurity risks. As part of our Cyber Security and Technology Risk programs, the Company has also established an incident response process to track and log cybersecurity incidents. This process provides for escalating notifications to our CEO and Board depending on the nature and severity of an incident.
In the year ended December 31, 2023, we did not identify any cybersecurity threats that have materially affected or are reasonably likely to materially affect our business strategy, results of operations, or financial condition. However, despite our efforts, we cannot eliminate all risks from cybersecurity threats, or provide assurances that we have not experienced undetected cybersecurity incidents. For more information on our cybersecurity related risks, see Part I Item 1A. Risk Factors of this Annual Report on Form 10-K.
Item 2. Properties
We are headquartered in Chicago, Illinois, pursuant to an operating lease that expires in 2025. We lease additional offices in New York City and, internationally, in London, Dublin, Hong Kong, Singapore, Mumbai, Bengaluru, and Sydney. We believe these facilities are generally suitable to meet our current needs. We intend to expand our facilities or add new facilities as we add employees and enter new geographic markets, and we believe that suitable additional or alternative space will be available as needed to accommodate any such growth.
41
Item 3. Legal Proceedings
From time to time, we may become involved in legal proceedings or be subject to claims arising in the ordinary course of our business. We are not presently a party to any legal proceedings that, if determined adversely to us, would individually or taken together have a material adverse effect on our business, operating results, financial condition, or cash flows. Regardless of the outcome, legal proceedings can have an adverse impact on us because of defense and settlement costs, diversion of management resources and other factors.
Item 4. Mine Safety Disclosures
Not applicable.
42
PART II
Item 5. Market for Registrant’s Common Equity, Related Stockholder Matters and Issuer Purchases of Equity Securities
Market Information for Common Stock
Our Class A common stock has been listed on the New York Stock Exchange under the symbol “ENFN” since October 21, 2021. Prior to that date, there was no public trading market for our Class A common stock.
Our Class B common stock is neither listed nor traded.
Holders of Record
As of March 8, 2024, there were 10 holders of record of our Class A common stock. The actual number of stockholders is greater than this number and includes an indeterminate number of stockholders who are beneficial owners but whose shares are held in street name by brokers and other nominees.
As of March 8, 2024, there were 5 holders of record of our Class B common stock.
Dividend Policy
We have never declared or paid cash dividends on our capital stock. We currently intend to retain all available funds and future earnings and do not anticipate declaring or paying any cash dividends in the foreseeable future. Any future determination regarding the declaration and payment of dividends will be at the discretion of our board of directors and will depend on then-existing conditions, including our financial condition, operating results, contractual restrictions, capital requirements, business prospects, and other factors our board of directors may deem relevant.
Performance Graph
This performance graph shall not be deemed “soliciting material” or to be “filed” with the SEC for purposes of Section 18 of the Exchange Act, or otherwise subject to the liabilities under that Section, and shall not be deemed to be incorporated by reference into any filing of ours under the Securities Act or the Exchange Act.
The following graph compares the cumulative total return to stockholders on our Class A common stock with the cumulative total returns of the NYSE Composite Index and the S&P Software & Services Select Industry Index. An investment of $100 is assumed to have been made in our Class A common stock and in each index on October 21, 2021, the date our Class A common stock began trading on the New York Stock Exchange, and its relative performance is tracked through December 31, 2023. Data for the NYSE Composite Index and the S&P Software & Services Select Industry Index assume reinvestment of dividends.
43
The returns shown are based on historical results and are not intended to suggest future performance.
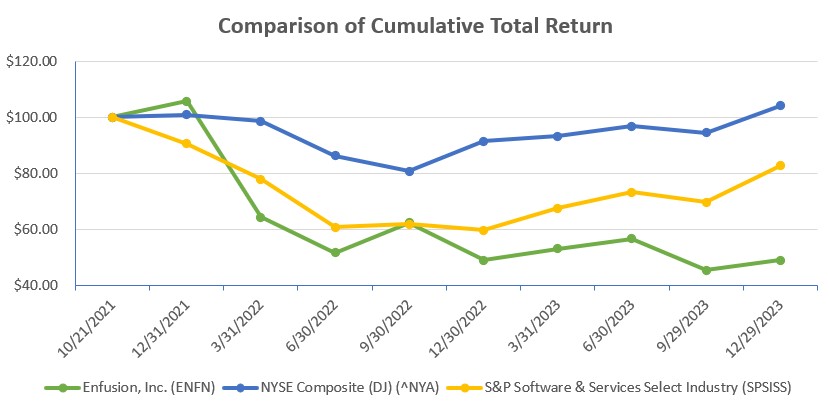
Recent Sales of Unregistered Securities
There were no unregistered sales of equity securities during the fiscal year ended December 31, 2023 that were not previously reported in a Quarterly Report on Form 10-Q or Current Report on Form 8-K.
Issuer Purchases of Equity Securities
None.
Item 6. [Reserved]
44
Item 7. Management’s Discussion and Analysis of Financial Condition and Results of Operations
This discussion and analysis reflect historical results of operations and financial position. The following discussion and analysis is intended to highlight and supplement data and information presented elsewhere in this Annual Report on Form 10-K, including our consolidated financial statements and the related notes and other financial information. To the extent that this discussion describes prior performance, the descriptions relate only to the periods listed, which may not be indicative of our future financial outcomes. Furthermore, this discussion and analysis generally discusses results of operations and financial position for the years ended December 31, 2023 and 2022, and year-to-year comparisons between those years. Discussions of results of operations and financial position for the year ended December 31, 2021 and year to year comparisons between the years ended December 31, 2022 and 2021 are not included, and can be found in “Management’s Discussion and Analysis of Financial Condition and Results of Operations” in Part II, Item 7 of our Annual Report on Form 10-K for the fiscal year ended December 31, 2022, filed with the SEC on March 10, 2023. In addition to the historical information presented, this discussion contains forward-looking statements that involve risks, uncertainties and assumptions that could cause results to differ materially from management’s expectations. Factors that could cause or contribute to such differences are discussed in the section titled “Cautionary Statement” and Part I, Item 1A. Risk Factors. We assume no obligation to update any of these forward-looking statements. All subsequent written or oral forward-looking statements attributable to us or persons acting on Enfusion’s behalf are qualified in their entirety by this paragraph.
Overview
Enfusion is a global, high-growth, software-as-a-service provider focused on transforming the investment management industry. Our solution is designed to eliminate technology and information barriers, empowering investment managers to confidently make and execute better-informed investment decisions in real time. We simplify investment and operational workflows by unifying mission critical systems and coalescing data into a single dataset resulting in a single source of truth. This allows stakeholders throughout the entire client organization to interact more effectively with one another across the investment management lifecycle.
We believe, by means of our purposefully designed interconnected systems underpinned by one dataset, we are the only solution that allows clients to see and interact with all parts of the investment management lifecycle ranging from portfolio construction, trading, risk management, accounting and operations through to investor reporting seamlessly in real time, in one screen, in one solution. As a result, our solution enables clients to better align teams, optimizing their investment decision-making operations and technology footprint, and lowering operating costs. By harnessing the efficiencies, agility, and scale inherent to our cloud-native, multi-tenant software that is integrated with a suite of technology-powered, managed services, we believe we have created the industry’s most compelling investment management solution, capable of shaping and addressing the evolving demands of the global investment management landscape.
Our Business Model
By virtue of our flexible and open architecture solution, we offer clients the ability to either replace their investment management systems using the end-to-end Enfusion solution integrated with technology-powered managed services or integrate into their existing ecosystem with an option to expand their utilization of Enfusion over time.
Additionally, our solution’s nimble, single-codebase architecture allows us to dedicate resources to our clients holistically, driving a superior client experience that is critical to our business model. All clients leverage the most current version of the Enfusion application at all times, which ensures that our development teams maintain focus on delivering new features and capabilities rather than managing compatibility across multiple platform versions. From the moment client onboarding commences, Enfusion prioritizes the customer experience. Dedicated account managers work hand-in-hand with clients through the duration of the relationship to ensure a personalized experience while product specialists regularly engage to facilitate optimal utilization of the Enfusion platform. It also fosters a partnership built on ongoing communication and feedback, which continuously informs the weekly upgrades and functional enhancements that we deliver to each of our clients. As we continue to scale and add clients, we benefit from an evolving solution that mirrors
45
the needs and demands of our clients and the market, leading to a compelling competitive advantage and in turn increased client retention and revenues from expanded and new business.
Our total revenues were approximately 99.3%, 98.9%, and 98.8% recurring subscription-based during the years ended December 31, 2023, 2022, and 2021, respectively. Generally, we charge our clients fees for various components such as user fees, connectivity fees, market data fees, and managed services fees, all of which take into account client complexity and that is subject to contract minimums. The weekly enhancements and upgrades that we deliver and the dedicated client service are included in the price of the contract.
To support our growth and capitalize on our market opportunity, we continue to invest across all aspects of our business. In technology and development, we are focused on developing additional system functionality that will open revenue opportunities across alternative and traditional investment managers. We have also further institutionalized and increased spend in our sales and marketing efforts, both in the United States and internationally.
We operate as a single operating and reportable segment, which reflects the way our chief operating decision maker reviews and assesses the performance of our business. Our total revenues were $174.5 million, $150.3 million, and $111.7 million for the years ended December 31, 2023, 2022, and 2021, respectively. Recurring subscription-based revenues from platform subscriptions and managed services were $173.3 million for the year ended December 31, 2023, or approximately 99.3% of total revenues, up approximately 16.5% from $148.7 million for the year ended December 31, 2022, or approximately 98.9% of total revenues, up approximately 34.7% from $110.4 million for the year ended December 31, 2021, or approximately 98.8% of total revenues. We had net income (loss) of $9.3 million, $(13.3) million, and $(282.2) million in the years ended December 31, 2023, 2022, and 2021, respectively.
Key Factors Affecting Our Operating Results
Breadth of Our Client Bases
Our future revenue growth depends, in part, on our ability to expand our reach to new clients. There are significant opportunities to expand our client base across the various client segments we serve today. We believe we are the leading cloud-native, SaaS provider to the global emerging fund and hedge fund sector and expect that as the alternative investment sector grows, we will continue to extend our position. We expect that our efforts in signing new clients in this sector benefit from referrals from our existing clients, client stakeholders when they transit to other or launch new organizations, industry channel partners and strategic partners. In addition, we continue to extend this growth through increasing adoption by larger institutional asset management clients due to increasing acceptance of cloud technology and the robust capabilities of our solution that better meet their evolving needs and address their existing pain points. Taking advantage of the unique position that allows us to sell our products and services through shorter sales cycles and on faster client implementation timelines, we expect to continue to expand and invest our sales efforts to capitalize on opportunities in this client segment.
Expansion of Usage with Existing Clients
We believe there is a significant opportunity to further expand our relationships with existing clients as they continue to evolve and grow in size and expand into new markets and strategies or as we provide new functionality or release new systems or services. We also believe we have a significant opportunity to expand our relationship with existing clients that were not in a position to replace all of their systems at once when they first engaged with us. For those clients that elect to initially utilize some portion of our solution or only use our solution for a particular strategy or fund, we find that once they experience the advantages of our end-to-end solution, many seek opportunities to expand the breadth of their relationship with us to further help improve their investment management workflows and technology infrastructure. We expect our revenues from existing clients to continue to increase as they broaden their use of our solution and expand utilization into other investment groups within the firm.
46
Existing Client Retention and Renewals
The growth of our revenues base from expanding relationships with our existing clients is driven by our ability to retain these clients. Our client retention also strengthens the stability and predictability of our revenue model, facilitating better management of business. Our Net Dollar Retention Rate, which is described below in the section titled “Key Metrics and Financial Measures” was 106.4%, 115.4% and 115.0% for the years ended December 31, 2023, 2022, and 2021, respectively. We believe that our delivery of excellent ongoing innovation together with superior client experience is critical to our client retention and we expect to continue to invest in both areas.
Geographic Expansion
Our future growth depends, in part, on our ability to grow our client base through geographic expansion and build on the success internationally. For the year ended December 31, 2023, we generated approximately 62.1% of our total revenues from clients in the Americas and approximately 37.9% of our total revenues from clients outside of the Americas. For the year ended December 31, 2022, we generated approximately 63.3% of our total revenues from clients in the Americas and approximately 36.7% of our total revenues from clients outside of the Americas. For the year ended December 31, 2021, we generated approximately 65.3% of our total revenues from clients in the Americas and approximately 34.7% of our total revenues from clients outside of the Americas. We are globally situated in nine offices in Chicago, New York City, London, Dublin, Hong Kong, Singapore, Mumbai, Bengaluru, and Sydney. We continue to invest in expanding our presence and capitalize on opportunities in markets such as Europe, the Middle East and Asia Pacific. We continue to make investments in our sales and marketing efforts in regions outside of the Americas to capture sizable revenue opportunities.
Leading in Ongoing Innovation & Pursuing Growth Investments
We continuously evaluate opportunities to advance our solution through increased breadth and depth of functionality to better enable our clients to achieve their investment goals and solve for a broader array of business, operational and technology challenges. Our ability to lead and compete with a differentiated solution is dependent upon our pace of innovation. We remain committed to investing in ongoing innovation which may require increased spend in technology and development.
Costs of Being a Public Company
As a recently public company, we will continue to refine and implement procedures and processes to address the standards and requirements applicable to public companies. Specifically, accounting, legal, investor relations, insurance and personnel-related expenses will continue to increase as we establish more comprehensive compliance and governance functions, establish internal controls over financial reporting in accordance with the Sarbanes-Oxley Act and prepare and distribute periodic reports in accordance with SEC rules. Our financial statements reflect the impact of these expenses.
Effects of the Reorganization Transactions on our Corporate Structure
We were incorporated as Enfusion, Inc. on June 11, 2021 and formed for the purpose of the IPO. Following the completion of the Reorganization Transactions, we became a holding company, and our sole material asset is an indirect ownership interest in Enfusion Ltd. LLC. Through our ability to control the managing members of Enfusion Ltd. LLC, we control all of the business and affairs of Enfusion Ltd. LLC. All of our business is conducted through Enfusion Ltd. LLC and its subsidiaries, and the financial results of Enfusion Ltd. LLC are included in the consolidated financial statements of Enfusion, Inc.
Enfusion Ltd. LLC has been treated as a pass-through entity for U.S. federal and state income tax purposes and accordingly has not been subject to U.S. federal or state income tax. Enfusion Ltd. LLC will continue to be treated as a pass-through entity for U.S. federal and state income tax purposes. As a result of our ownership of Common Units in Enfusion Ltd. LLC, we are subject to U.S., federal, state, and local income taxes with respect to our allocable share of any taxable income of Enfusion Ltd. LLC and will be taxed at the prevailing corporate tax rates. In addition to tax expenses, we also will incur expenses related to our operations and we will be required to make payments under the Tax Receivable
47
Agreement. Due to the uncertainty of various factors, we cannot estimate the likely tax benefits we will realize as a result of Common Unit exchanges and the resulting amounts we are likely to pay out to Common Unitholders pursuant to the Tax Receivable Agreement; however, we estimate that such payments may be substantial. We intend to cause Enfusion Ltd. LLC to make distributions in an amount sufficient to allow us to pay our tax obligations and operating expenses, including distributions to fund any ordinary course payments due under the Tax Receivable Agreement.
Components of Our Results of Operations
Revenues
Platform subscriptions revenues
Platform subscriptions revenues consist primarily of user fees to provide our clients access to our cloud-based solution. Fees consider various components such as number of users, connectivity, trading volume, data usage and product coverage. Platform subscriptions clients do not have the right to take possession of the platform’s software and do not have any general return right. Platform subscriptions revenues are recognized ratably over the period of contractually enforceable rights and obligations, beginning on the date the client gains access to the platform. Installment payments are generally invoiced at the end of each calendar month during the subscription term. There is no financing available.
Managed services
Managed services revenues primarily consist of client-selected middle- and back-office, technology-powered services. Managed services revenues are recognized ratably over the period of contractually enforceable rights and obligations, beginning on the contract effective date. Clients are invoiced a set fee for managed services typically at the end of each month. Generally, invoices have a 30-day payment period in accordance with the associated contract. There is no financing available.
Other
Other revenues consist of non-subscription-based revenue, primarily including data conversion. We recognize revenues as these services are performed with invoicing generally occurring at the end of each month.
Cost of Revenues
Cost of revenues consists primarily of personnel-related costs associated with the delivery of our software and services, including base salaries, bonuses, employee benefits, and related costs. Additionally, cost of revenues includes amortization of capitalized software development costs, allocated overhead and certain direct data and hosting costs, and stock-based compensation expense. Our cost of revenues has fixed and variable components and depends on the type of revenues earned in each period. We expect our cost of revenues to increase in absolute dollars as we continue to hire personnel to provide onboarding and account management services to our growing client base. We anticipate additional expenses as a result of stock-based compensation expenses related to equity awards to be issued under our equity plans.
Operating Expenses
We present stock-based compensation expense within Cost of revenues, General and administrative, Sales and marketing, and Technology and development based on the individual employee’s department. We anticipate additional operating expenses as a result of stock-based compensation expenses related to equity awards to be issued under our equity plans.
General and administrative
General and administrative expenses primarily consist of personnel costs and related expenses for executive, finance, legal, human resources, and recruiting and administrative personnel. These personnel costs and related expenses include salaries, benefits and bonuses, fees for external legal and other consulting services, and stock-based compensation
48
expense. General and administrative expenses also include expenses for our information technology systems. We expect certain expenses to increase as we continue to operate as a publicly traded company and expand our client base and geographic footprint.
Sales and marketing
Sales and marketing expenses consist primarily of personnel and related costs associated with our sales and marketing staff, including base salaries, employee benefits, bonuses and commissions, and stock-based compensation expense.
Technology and development
Technology and development expenses consist primarily of employee-related expenses related to our software development, including the development of non-enhancing features, maintenance, quality assurance, and ongoing refinement of our existing solutions. In addition, it includes expenses related to the exploration of new technologies and costs associated with preliminary project stage activities, training, maintenance, and all other post-implementation stage activities which are expensed as incurred.
Non-Controlling Interests
Non-controlling interests represent the portion of profit or loss, net assets, and comprehensive income (loss) of Enfusion Ltd. LLC that is not allocable to the Company based on our percentage of ownership of this entity. Income or loss attributed to the non-controlling interests is based on the Common Units outstanding during the period and is presented on the consolidated statements of operations and consolidated statements of comprehensive income (loss).
Key Metrics and Financial Measures
In connection with the management of our business, we identify, measure, and assess a variety of key metrics and use certain financial measures. The key metrics and financial measures we use in managing our business are set forth below.
Annual Recurring Revenue
We calculate Annual Recurring Revenue (“ARR”) by annualizing platform subscriptions and managed services revenues recognized in the last month of the measurement period. We believe ARR provides important information about our future revenue potential, our ability to acquire new clients and our ability to maintain and expand our relationship with existing clients. ARR was $185.1 million, $164.7 million, and $127.1 million as of December 31, 2023, 2022, and 2021, respectively. ARR is included in a set of metrics we calculate monthly to review with management as well as periodically with our board of directors.
Net Dollar Retention Rate
We calculate Net Dollar Retention Rate as of a period end by starting with the ARR for all clients as of twelve months prior to such period end or Prior Period ARR. We then calculate the ARR from those same clients as of the current period end (“Current Period ARR”). Current Period ARR includes expansion within existing clients inclusive of contraction and voluntary attrition, but excluding involuntary cancellations. We define involuntary cancellations as accounts that were canceled due to the client no longer being in business. We identify involuntary cancellations based on representations made by the client at the time of cancellation. Our Net Dollar Retention Rate is equal to the Current Period ARR divided by the Prior Period ARR.
Our Net Dollar Retention Rate was 106.4%, 115.4%, and 115.0% as of December 31, 2023, 2022, and 2021, respectively. We believe Net Dollar Retention Rate is an important metric because, in addition to providing a measure of retention, it indicates our ability to grow revenues within existing client accounts. The decrease in NDR in the current year
49
is primarily driven by lower upsells and higher downgrades from our existing client base (i.e. challenges in our back book), and the increased churn in the first half of 2023.
Revenue Churn Rate and Adjusted Revenue Churn Rate
We calculate our Revenue Churn Rate by measuring the revenue contribution associated with clients that cancel all of their product and service agreements with us over the measurement year. This canceled revenue contribution for each such client is calculated as the revenues recognized for such clients over the trailing 12 months prior to the month in which the client canceled its product and service agreements. We then divide this canceled revenue contribution by the ARR calculated for the prior period to calculate our Revenue Churn Rate. Our Revenue Churn Rate for the years ended December 31, 2023, 2022, and 2021 was 7.5%, 4.5%, and 3.7%, respectively.
We also calculate an Adjusted Revenue Churn Rate which excludes all involuntary cancellations as described above. Our Adjusted Revenue Churn Rate for the years ended December 31, 2023, 2022, and 2021 was 3.4%, 1.0%, and 0.6%, respectively. The increase in churn rate was particularly steep in the first half of 2023 and primarily related to macroeconomic factors, including high market volatility. These trends stabilized in the second half of 2023. We believe our Revenue Churn Rate and Adjusted Revenue Churn Rate are important metrics because they indicate our ability to retain our existing client base.
50
Results of Operations
The results of operations presented below should be reviewed in conjunction with the consolidated financial statements and notes included elsewhere in this Annual Report on Form 10-K. The following table sets forth our consolidated results of operations for the periods shown:
| Year Ended December 31, | |||||
(in thousands) |
| 2023 |
| 2022 | ||
REVENUES: |
|
|
|
| ||
Platform subscriptions | $ | 161,519 | $ | 138,868 | ||
Managed services |
| 11,773 |
| 9,821 | ||
Other |
| 1,243 |
| 1,660 | ||
Total revenues | 174,535 |
| 150,349 | |||
COST OF REVENUES: |
|
|
|
| ||
Platform subscriptions |
| 50,702 |
| 40,017 | ||
Managed services |
| 6,514 |
| 6,692 | ||
Other |
| 425 |
| 391 | ||
Total cost of revenues |
| 57,641 |
| 47,100 | ||
Gross profit |
| 116,894 |
| 103,249 | ||
OPERATING EXPENSES: |
|
|
|
| ||
General and administrative |
| 64,635 |
| 68,764 | ||
Sales and marketing |
| 20,418 |
| 29,286 | ||
Technology and development |
| 19,893 |
| 17,163 | ||
Total operating expenses |
| 104,946 |
| 115,213 | ||
Income (loss) from operations |
| 11,948 |
| (11,964) | ||
NON-OPERATING INCOME (EXPENSE): |
|
|
|
| ||
Payment to related party | (1,501) | — | ||||
Interest income, net |
| 1,641 |
| 413 | ||
Other expense, net | (604) | (638) | ||||
Total non-operating income (expense) |
| (464) |
| (225) | ||
Income (loss) before income taxes |
| 11,484 |
| (12,189) | ||
Income taxes |
| 2,231 |
| 1,074 | ||
Net income (loss) | 9,253 | (13,263) | ||||
Net income (loss) attributable to non-controlling interests | 3,228 | (5,609) | ||||
Net income (loss) attributable to Enfusion, Inc. | $ | 6,025 | $ | (7,654) | ||
Revenues
Year Ended December 31, |
| |||||||||||
Increase (Decrease) |
| |||||||||||
(in thousands) |
| 2023 |
| 2022 |
| Amount |
| Percent |
| |||
Platform subscriptions | $ | 161,519 | $ | 138,868 | $ | 22,651 |
| 16.3 | % | |||
Managed services |
| 11,773 |
| 9,821 |
| 1,952 |
| 19.9 | % | |||
Other |
| 1,243 |
| 1,660 |
| (417) |
| (25.1) | % | |||
Total revenues | $ | 174,535 | $ | 150,349 | $ | 24,186 |
| 16.1 | % | |||
Total revenue was $174.5 million for the year ended December 31, 2023, compared to $150.3 million for the year ended December 31, 2022, representing an increase of $24.2 million, or 16.1%.
51
Platform subscriptions
Platform subscriptions revenues increased by $22.7 million, or 16.3%, from $138.9 million for the year ended December 31, 2022 to $161.5 million for the year ended December 31, 2023. The increase was primarily comprised of $16.1 million related to upsell and increased users within existing contracts and $14.3 million reflecting the full-period impact of contracts signed in prior periods. In addition, new client revenue increased by $6.5 million. Increases and upsells were offset by client churn of $9.9 million and downgrades of $4.3 million. Price changes did not materially impact period-over-period growth.
Managed services
Managed services revenues increased by $2.0 million, or 19.9%, from $9.8 million for the year ended December 31, 2022 to $11.8 million for the year ended December 31, 2023. The increase was driven by $1.4 million in new client revenue, including the full impact of contracts signed in prior periods, $1.8 million related to upsells to existing clients, and $0.2 million of favorability in credit memo reserves. This increase was offset by churn and downgrades of $1.4 million.
Other
Other revenues, primarily consisting of data conversion services, decreased by $0.4 million over the comparative period. The decrease was due primarily to a lower volume of data conversion services in the current period.
Cost of Revenues, Gross Profit and Gross Profit Margin
Year Ended December 31, |
| |||||||||||
Increase (Decrease) |
| |||||||||||
(in thousands) |
| 2023 |
| 2022 |
| Amount |
| Percent |
| |||
Cost of revenues: |
|
|
|
|
|
|
| |||||
Platform subscriptions | $ | 50,702 | $ | 40,017 | $ | 10,685 |
| 26.7 | % | |||
Managed services |
| 6,514 |
| 6,692 |
| (178) |
| (2.7) | % | |||
Other |
| 425 |
| 391 |
| 34 |
| 8.7 | % | |||
Total cost of revenues | $ | 57,641 | $ | 47,100 | $ | 10,541 |
| 22.4 | % | |||
Gross profit | $ | 116,894 | $ | 103,249 | $ | 13,645 |
| 13.2 | % | |||
Gross profit margin |
| 67.0 | % |
| 68.7 | % |
|
|
|
| ||
Cost of Revenues
Cost of revenues increased by $10.5 million, or 22.4%, from $47.1 million for the year ended December 31, 2022 to $57.6 million for the year ended December 31, 2023. The increase was driven by $3.7 million additional market data expenses primarily attributed to a larger client base, increased usage, and increased provider rates. In addition, payroll and payroll-related expenses increased by $3.7 million from headcount additions to support our continued growth, annual employee salary increases, and increased costs of benefits. Furthermore, hosting costs increased by $1.5 million due to the expansion of our data centers, amortization of capitalized software development costs increased by $1.2 million, and depreciation expense increased by $0.4 million.
Gross profit increased by $13.6 million, from $103.2 million for the year ended December 31, 2022 to $116.9 million for the year ended December 31, 2023. Gross profit margin decreased by 1.7% primarily attributable to increased market data and hosting costs. Gross profit margin also decreased due to an increase in personnel costs from increased staffing levels across onboarding and account management, increased annual salaries, and increased cost of employee benefits.
52
Operating Expenses
Year Ended December 31, |
| |||||||||||
Increase (Decrease) |
| |||||||||||
(in thousands) |
| 2023 |
| 2022 |
| Amount |
| Percent |
| |||
General and administrative | $ | 64,635 | $ | 68,764 | $ | (4,129) |
| (6.0) | % | |||
Sales and marketing |
| 20,418 |
| 29,286 |
| (8,868) |
| (30.3) | % | |||
Technology and development |
| 19,893 |
| 17,163 |
| 2,730 |
| 15.9 | % | |||
Total operating expenses | $ | 104,946 | $ | 115,213 | $ | (10,267) |
| (8.9) | % | |||
General and administrative
General and administrative expenses decreased by $4.1 million, from $68.8 million for the year ended December 31, 2022 to $64.6 million for the year ended December 31, 2023. The decrease was primarily attributable to a $8.5 million decrease in stock-based compensation expense related to executive departures in the first quarter of 2023, partially offset by the impact of new grants. Additionally, professional services fees decreased by $2.2 million reflecting the growth of our in-house capabilities and insurance costs decreased by $0.7 million due to a softening of insurance market pricing favoring consumers. The decrease was partially offset by $3.8 million of additional payroll and payroll-related expenses, $1.4 million of additional depreciation expense, $0.9 million of additional U.S. state and local taxes including franchise tax in multiple jurisdictions, $0.7 million of incremental information technology systems costs to support organizational growth and increased headcount (e.g., additional licenses), and $0.5 million in additional occupancy costs.
Sales and marketing
Sales and marketing expenses decreased by $8.9 million, from $29.3 million for the year ended December 31, 2022 to $20.4 million for the year ended December 31, 2023. The decrease was primarily attributable to a $6.9 million decrease in stock-based compensation expense related to executive departures in the first quarter of 2023, partially offset by the impact of new grants. Payroll and payroll-related expenses decreased by $2.0 million attributable to lower headcount and cost-reduction measures, and travel expenses decreased by $1.2 million. The decrease was partially offset by a $1.2 million increase in commission expenses.
Technology and development
Technology and development expenses increased by $2.7 million, from $17.2 million for the year ended December 31, 2022 to $19.9 million for the year ended December 31, 2023. The increase was primarily attributable to a $3.5 million increase in payroll and payroll-related expenses attributable to increased headcount. Furthermore, there was a $0.9 million increase resulting from the write-off of capitalized labor and licenses related to a technology project which was abandoned in the fourth quarter of 2023. The increase was partially offset by a $1.7 million decrease in stock-based compensation expense related to the 2022 vesting of the Award Units associated with the IPO.
Non-Operating Income (Expense)
Non-operating expenses increased from $0.2 million during the year ended December 31, 2022 to $0.5 million for the year ended December 31, 2023. The increase was attributable to the related-party payment to FTV Fund IV of $1.5 million in the second quarter of 2023 (see Note 14, Related Party Transactions, to our consolidated financial statements, included elsewhere in this Annual Report on Form 10-K) partially offset by the $1.2 million increase in net interest income earned on cash invested in the money market account established in the third quarter of 2022 (see Note 3, Summary of Significant Accounting Policies, to our consolidated financial statements, included elsewhere in this Annual Report on Form 10-K).
Liquidity and Capital Resources
To date, we have funded our capital needs through collections from our clients, the use of debt instruments, and private and public issuances of equity. As of December 31, 2023, we had cash and cash equivalents of $35.6 million and
53
$100.0 million in available borrowing capacity under our New Credit Agreement. We believe that our current sources of liquidity, available borrowings under the New Credit Agreement cash flows from operations, and existing available cash, together with our other available external financing sources, will be adequate to fund our operating and capital needs for at least the next 12 months.
We previously had a “Deferred Share Issuance Obligation” that consisted of obligations to issue shares of Class A common stock to (i) holders of Award Units that were vested at the time of our IPO (or would have vested within one year thereof), and (ii) a non-executive employee. During the year ended December 31, 2023, we satisfied the remaining 17.2 million Deferred Share Issuance Obligation in full. We satisfied the related tax withholding obligations by utilizing $17.3 million of net proceeds from two private placements of common stock, $3.7 million of proceeds from “sell to cover” arrangements, and by using $39.4 million of cash on hand.
Our future capital requirements will depend on many factors, including those set forth under Part 1, Item 1A. Risk Factors. We expect that our future uses of cash will also include paying income taxes and obligations under our Tax Receivable Agreement.
We may in the future enter into arrangements to acquire or invest in complementary businesses or services, which could decrease our cash and cash equivalents and increase our cash requirements. As a result of these and other factors, we could use our available capital resources sooner than expected and may be required to seek additional equity or debt financing.
Cash Flow Information
The following table presents a summary of our consolidated cash flows from operating, investing, and financing activities for the periods indicated.
Year Ended December 31, | ||||||||||||
Increase (Decrease) | ||||||||||||
(in thousands) |
| 2023 |
| 2022 |
| Amount | Percent | |||||
Net cash provided by operating activities |
| $ | 25,634 | $ | 14,156 | $ | 11,478 | 81.1 | % | |||
Net cash used in investing activities |
| (9,671) |
| (7,931) |
| (1,740) | 21.9 | % | ||||
Net cash used in financing activities |
| (43,083) |
| (7,959) |
| (35,124) | 441.3 | % | ||||
Effect of exchange rate changes on cash and cash equivalents |
| 179 |
| (86) |
| 265 | nm | % | ||||
Net decrease in cash and cash equivalents | $ | (26,941) | $ | (1,820) | $ | (25,121) | 1,380.3 | % | ||||
nm - not meaningful | ||||||||||||
Operating activities
We generated $25.6 million in cash flows from operating activities during the year ended December 31, 2023, resulting from our net income of $9.3 million, adjusted by non-cash items of $25.8 million, and offset by $9.5 million of cash used in working capital activities. Cash used in working capital activities decreased from the comparative period primarily reflecting stronger collections and improved cash flow management. Cash flows from operating activities also includes $1.5 million of cash outflow related to the payment to FTV Fund IV in the second quarter of 2023.
We generated $14.2 million in cash flows from operating activities during the year ended December 31, 2022, resulting from our net loss of $13.3 million, adjusted by non-cash items of $38.2 million, and offset by $10.7 million of cash used in working capital activities.
Investing activities
Net cash used in investing activities for the years ended December 31, 2023 and 2022 was $9.7 million and $7.9 million. For the year ended December 31, 2023, cash outflows included $5.2 million of capitalized software development
54
costs and $4.5 million of property and equipment purchases. For the year ended December 31, 2022, cash outflows included $3.9 million of capitalized software development costs and $4.0 million of property and equipment purchases.
Financing activities
We used $43.1 million in cash flows from financing activities during the year ended December 31, 2023, primarily including $60.4 million in payment of withholding taxes on stock-based compensation and $1.2 million in payments of debt issuance costs associated with the New Credit Agreement. This was partially offset by $17.3 million in net stock issuance proceeds and a $1.5 million refund from the Internal Revenue Service in the second quarter of 2023.
We used $8.0 million in cash flows from financing activities during the year ended December 31, 2022, resulting from payment of withholding taxes on stock-based compensation.
Indebtedness
On September 15, 2023, we entered into the New Credit Agreement with Bank of America and a syndicate of lending institutions. The New Credit Agreement provides for a senior secured revolving loan facility in an aggregate principal amount of up to $100.0 million, including a $10.0 million sublimit for the issuance of letters of credit and a swingline subfacility of up to $10.0 million. The New Credit Agreement also includes an uncommitted accordion feature that allows for up to $50.0 million of additional borrowing capacity, subject to obtaining lender commitments and the satisfaction of certain customary conditions. As of December 31, 2023, we were in compliance with all loan covenants and requirements and had no outstanding borrowings under the New Credit Agreement.
Concurrent with entering into the New Credit Agreement on September 15, 2023, the Company terminated its $5.0 million Prior Credit Agreement with Silicon Valley Bank, which by its terms was scheduled to mature on December 17, 2025. At the time of termination, there were no borrowings outstanding under the Prior Credit Agreement.
Refer to Note 7, Debt, to our consolidated financial statements, included elsewhere in this Annual Report on Form 10-K for more information on the New Credit Agreement.
Contractual Obligations and Commitments and Off-Balance Sheet Arrangements
As of December 31, 2023, we have operating lease agreements and have service agreements for the use of data processing facilities, which are also leases under ASC 842, Leases. Refer to Note 6, Leases, to our consolidated financial statements, included elsewhere in this Annual Report on Form 10-K.
As of December 31, 2023, we did not have any material off-balance sheet arrangements that have or are reasonably likely to have a current or future effect on our financial condition, changes in financial condition, revenues or expenses, results of operations, liquidity, capital expenditures, or capital resources that may be material to investors.
Dividend policy
Assuming Enfusion Ltd. LLC makes distributions to its members in any given year, the determination to pay dividends, if any, to our Class A common stockholders out of the portion, if any, of such distributions remaining after our payment of taxes, Tax Receivable Agreement payments, and expenses will be made at the sole discretion of our board of directors. We currently intend to retain all available funds and future earnings and do not anticipate declaring or paying any cash dividends in the foreseeable future. Our board of directors may change our dividend policy at any time.
Tax Receivable Agreement
The payment obligation under the Tax Receivable Agreement is an obligation of Enfusion, Inc. and not of Enfusion Ltd. LLC. We expect that as a result of the size of the existing tax basis and basis adjustments acquired in the IPO, the increase in existing tax basis and the anticipated tax basis adjustment of the tangible and intangible assets of Enfusion Ltd. LLC upon the purchase or exchange (or deemed exchange) of Common Units for shares of Class A common
55
stock or distributions (or deemed distributions) with respect to Common Units and our possible utilization of certain tax attributes, the payments that we may make under the Tax Receivable Agreement will be substantial. As of December 31, 2023, we estimate the total TRA attributes to be approximately $323.6 million. If all of the Pre-IPO Common Unitholders had exchanged or sold to us all of their outstanding Common Units as of December 31, 2023, we would have recognized a deferred tax asset of approximately $148.5 million and a liability under the Tax Receivable Agreement of approximately $126.2 million, assuming: (i) all exchanges or purchases occurred on the same day, (ii) a price of $9.70 per share, which was the price per share of Class A common stock as of December 31, 2023, (iii) a constant corporate tax rate of 29.7%, (iv) that we would have sufficient taxable income to utilize the tax benefits fully, and (v) no material changes in tax law.
There may be a material negative effect on our liquidity if, as a result of timing discrepancies or otherwise, the payments under the Tax Receivable Agreement exceed the actual cash tax benefits that Enfusion, Inc. realizes in respect of the tax attributes subject to the Tax Receivable Agreement and/or if distributions directly and/or indirectly to Enfusion, Inc. by Enfusion Ltd. LLC are not sufficient to permit Enfusion, Inc. to make payments under the Tax Receivable Agreement after it has paid taxes and other expenses. Late payments under the Tax Receivable Agreement generally will accrue interest at an uncapped rate equal to one-year LIBOR (or its successor rate) plus 100 basis points. The payments under the Tax Receivable Agreement are not conditioned upon continued ownership of us by the Pre-IPO owners.
Critical Accounting Policies and Estimates
Our consolidated financial statements are prepared in accordance with U.S. GAAP. The preparation of consolidated financial statements requires management to make estimates and assumptions that affect the amounts of assets and liabilities at the date of the consolidated financial statement and amounts of revenues and expenses reported during the period. We evaluate our estimates and assumptions on an ongoing basis. Our estimates are based on historical experience and various other assumptions that we believe to be reasonable under the circumstances.
For a description of our significant accounting policies, see Note 3, Summary of Significant Accounting Policies, in the accompanying notes to the consolidated financial statements included in Part II, Item 8. Financial Statements and Supplementary Data of this Annual Report on Form 10-K.
Critical Accounting Policies
Revenue Recognition
The Company recognizes revenue in accordance with Accounting Standards Codification 606 (“ASC 606”), Revenue from Contracts with Customers. The Company derives its revenues primarily from fees for platform subscriptions and managed services provided to clients. Revenues are recognized when control of these services are transferred to the Company’s clients in an amount that reflects the consideration the Company expects to be entitled to in exchange for these services. Revenues are recognized net of taxes that will be remitted to governmental agencies applicable to service contracts. Clients are invoiced each month for the services provided in accordance with the stated terms of their service contracts. Fees for partial term service contracts are prorated, as applicable. Payment of fees are due from clients within 30 days of the invoice date. The Company does not provide financing to clients. The Company determines revenue recognition through the following five-step framework:
● Identification of the contract, or contracts, with a client;
● Identification of the performance obligation in the contract;
● Determination of transaction price;
● Allocation of the transaction price to the performance obligations in the contract; and
● Recognition of revenue when, or as, performance obligations are satisfied.
56
Platform subscriptions revenues
Platform subscriptions revenues consist primarily of user fees to provide our clients access to our cloud-based solution. Fees consider various components such as number of users, connectivity, trading volume, data usage and product coverage. Platform subscriptions clients do not have the right to take possession of the platform’s software and do not have any general return right. Platform subscriptions revenues are recognized ratably over the period of contractually enforceable rights and obligations, beginning on the date the client gains access to the platform. Installed payments are generally invoiced at the end of each calendar month during the subscription term. There is no financing available.
Managed services revenues
Managed services revenues primarily consist of client-selected middle- and back-office, technology-powered services. Managed services revenues are recognized ratably over the period of contractually enforceable rights and obligations, beginning on the contract effective date. Clients are invoiced a set fee for managed services typically at the end of each month. Generally, invoices have a 30-day payment period in accordance with the associated contract. There is no financing available.
Other revenues
Other revenues consist of non-subscription-based revenues primarily data conversion. The Company recognizes revenues as these services are performed with invoicing generally occurring at the end of each month.
Service contracts with multiple performance obligations
Certain of the Company’s contracts provide for customers to be charged a fee for implementation services. In determining whether the implementation services, which frequently include configuration and/or interfacing, customer reporting, customizing user permissions and acceptance testing, end-user training, and establishing connections with third-party interfaces, are distinct from its platform subscription services, the Company considers, in addition to their complexity and level of customization, that these services are integral in delivering the customer desired output and are necessary for the customer to access and begin to use the hosted application. The implementation provider must be intimately familiar with its platform to effectively execute the customization required, and no other entities have access to the source code. The Company has concluded that the implementation services in its service contracts with multiple performance obligations are not distinct, and therefore, the Company recognizes fees for implementation services ratably over the non-cancelable term of the contract.
Critical Accounting Estimates
Tax Receivable Agreement
In connection with the Reorganization Transactions and the IPO, we entered into the Tax Receivable Agreement with certain of our Pre-IPO Owners that provides for the payment by Enfusion, Inc. to such Pre-IPO Owners of 85% of the benefits, if any, that Enfusion, Inc. actually realizes, or is deemed to realize (calculated using certain assumptions), as a result of: (i) existing tax basis acquired in the IPO; (ii) increases in existing tax basis and adjustments to the tax basis of the tangible and intangible assets of Enfusion Ltd. LLC as a result of sales or exchanges (or deemed exchanges) of Common Units for shares of Class A common stock or distributions (or deemed distributions) with respect to Common Units; (iii) Enfusion, Inc.’s utilization of certain tax attributes of the Blocker Companies; and (iv) certain other tax benefits related to entering into the Tax Receivable Agreement, including tax benefits attributable to payments under the Tax Receivable Agreement. The existing tax basis, increases in existing tax basis and the tax basis adjustments generated over time may increase (for tax purposes) the depreciation and amortization deductions available to Enfusion, Inc. and, therefore, may reduce the amount of U.S. federal, state and local tax that Enfusion, Inc. would otherwise be required to pay in the future, although the IRS may challenge all or part of the validity of that tax basis, and a court could sustain such a challenge.
57
The Company accounts for amounts payable under the Tax Receivable Agreement in accordance with ASC 450, Contingencies. The amounts payable under the Tax Receivable Agreement will vary depending upon a number of factors, including the amount, character, and timing of the taxable income of the Company in the future. The actual tax benefits realized by the Company may differ from tax benefits calculated under the Tax Receivable Agreement as a result of the use of certain assumptions in the agreement. Any such changes in these factors or changes in the Company’s determination of the need for a valuation allowance related to the tax benefits acquired under the Tax Receivable Agreement could adjust the Tax Receivable Agreement liabilities recognized on the consolidated balance sheets. Subsequent changes in the fair value of the Tax Receivable Agreement liabilities between reporting periods, as well as any interest accrued on the Tax Receivable Agreement between annual tax filing date and the Tax Receivable Agreement payment date, are recognized in the consolidated statements of operations.
Recent Accounting Pronouncements
See Note 3, Summary of Significant Accounting Policies, in the accompanying notes to the consolidated financial statements included in Part II, Item 8. Financial Statements and Supplementary Data of this Annual Report on Form 10-K.
Emerging Growth Company Status
We are an “emerging growth company,” as defined in the JOBS Act, and, for so long as we continue to be an emerging growth company, we may take advantage of certain exemptions from various reporting requirements that are applicable to other public companies that are not emerging growth companies including, but not limited to, not being required to comply with the auditor attestation requirements of Section 404, reduced disclosure obligations regarding executive compensation in our periodic reports and proxy statements and exemptions from the requirements of holding a nonbinding advisory vote on executive compensation and shareholder approval of any golden parachute payments not previously approved.
In addition, under the JOBS Act, emerging growth companies can delay adopting new or revised accounting standards issued subsequent to the enactment of the JOBS Act until such time as those standards apply to private companies. We have elected to use this extended transition period to enable us to comply with new or revised accounting standards that have different effective dates for public and private companies until the earlier of the date we: (i) are no longer an emerging growth company; or (ii) affirmatively and irrevocably opt out of the extended transition period provided in the JOBS Act. As a result, our financial statements may not be comparable to companies that comply with new or revised accounting pronouncements as of public company effective dates.
Item 7A. Quantitative and Qualitative Disclosures about Market Risk
We are exposed to market risks in the ordinary course of our business. Market risk represents the risk of loss that may impact our financial position due to adverse changes in financial market prices and rates. Our market risk exposure is primarily the result of fluctuations in foreign currency exchange rates.
Foreign Currency Exchange Rate Risk
Our reporting currency is the U.S. dollar, and the functional currency of each of our subsidiaries is generally the local currency. Gains or losses due to transactions in foreign currencies are included in other expense in our consolidated statements of operations. We have not engaged in the hedging of foreign currency transactions to date, although we may choose to do so in the future. As of December 31, 2023 and December 31, 2022, we do not believe that a 10% increase or decrease in the relative value of the U.S. dollar to other currencies would have a material effect on operating results.
58
Item 8. Financial Statements and Supplementary Data
ENFUSION, INC.
Index to Consolidated Financial Statements
Page | |
Audited Consolidated Financial Statements of Enfusion, Inc. | |
Report of Independent Registered Public Accounting Firm (PCAOB ID: | F-2 |
Consolidated Balance Sheets as of December 31, 2023 and December 31, 2022 | F-3 |
Consolidated Statements of Operations for the Years Ended December 31, 2023, 2022, and 2021 | F-4 |
F-5 | |
F-6 | |
Consolidated Statements of Cash Flows for the Years Ended December 31, 2023, 2022, and 2021 | F-7 |
F-8 |
F-1
Report of Independent Registered Public Accounting Firm
To the Stockholders and the Board of Directors of Enfusion, Inc.
Opinion on the Financial Statements
We have audited the accompanying consolidated balance sheets of Enfusion, Inc. (the Company) as of December 31, 2023 and 2022, the related consolidated statements of operations, comprehensive income (loss), preferred units, stockholders’ equity and members’ deficit and cash flows for each of the three years in the period ended December 31, 2023, and the related notes (collectively referred to as the “consolidated financial statements”). In our opinion, the consolidated financial statements present fairly, in all material respects, the financial position of the Company at December 31, 2023 and 2022, and the results of its operations and its cash flows for each of the three years in the period ended December 31, 2023, in conformity with U.S. generally accepted accounting principles.
Basis for Opinion
These financial statements are the responsibility of the Company's management. Our responsibility is to express an opinion on the Company’s financial statements based on our audits. We are a public accounting firm registered with the Public Company Accounting Oversight Board (United States) (PCAOB) and are required to be independent with respect to the Company in accordance with the U.S. federal securities laws and the applicable rules and regulations of the Securities and Exchange Commission and the PCAOB.
We conducted our audits in accordance with the standards of the PCAOB. Those standards require that we plan and perform the audit to obtain reasonable assurance about whether the financial statements are free of material misstatement, whether due to error or fraud. The Company is not required to have, nor were we engaged to perform, an audit of its internal control over financial reporting. As part of our audits, we are required to obtain an understanding of internal control over financial reporting but not for the purpose of expressing an opinion on the effectiveness of the Company's internal control over financial reporting. Accordingly, we express no such opinion.
Our audits included performing procedures to assess the risks of material misstatement of the financial statements, whether due to error or fraud, and performing procedures that respond to those risks. Such procedures included examining, on a test basis, evidence regarding the amounts and disclosures in the financial statements. Our audits also included evaluating the accounting principles used and significant estimates made by management, as well as evaluating the overall presentation of the financial statements. We believe that our audits provide a reasonable basis for our opinion.
/s/
We have served as the Company’s auditor since 2020.
March 12, 2024
F-2
ENFUSION, INC.
CONSOLIDATED BALANCE SHEETS
(dollars and shares in thousands, except per share amounts)
December 31, | ||||||
2023 |
| 2022 | ||||
ASSETS |
|
|
| |||
Current assets: |
|
|
| |||
Cash and cash equivalents | $ | | $ | | ||
Accounts receivable, net |
| |
| | ||
Prepaid expenses |
| |
| | ||
Other current assets | | | ||||
Total current assets |
| |
| | ||
Property, equipment, and software, net |
| |
| | ||
Right-of-use-assets, net | | | ||||
Other assets |
| |
| | ||
Total assets | $ | | $ | | ||
LIABILITIES AND STOCKHOLDERS’ EQUITY |
|
|
|
| ||
Current liabilities: |
|
|
|
| ||
Accounts payable | $ | | $ | | ||
Accrued expenses and other current liabilities | | | ||||
Current portion of lease liabilities |
| |
| | ||
Total current liabilities |
| |
| | ||
Lease liabilities, net of current portion | | | ||||
Total liabilities |
| |
| | ||
Commitment and contingencies (Note 8) | ||||||
Stockholders’ Equity: |
|
|
|
| ||
Preferred stock, $ | ||||||
Class A common stock, $ | | | ||||
Class B common stock, $ | | | ||||
Additional paid-in capital |
| |
| | ||
Accumulated deficit | ( | ( | ||||
Accumulated other comprehensive loss |
| ( |
| ( | ||
Total stockholders’ equity attributable to Enfusion, Inc. |
| |
| | ||
Non-controlling interests | | | ||||
Total stockholders’ equity | | | ||||
Total liabilities and stockholders’ equity | $ | | $ | | ||
See Notes to Consolidated Financial Statements.
F-3
ENFUSION, INC.
CONSOLIDATED STATEMENTS OF OPERATIONS
(dollars and shares in thousands, except per share amounts)
Year Ended December 31, | |||||||||
2023 |
| 2022 | 2021 | ||||||
REVENUES: |
|
|
|
| |||||
Platform subscriptions | $ | | $ | | $ | | |||
Managed services |
| |
| |
| | |||
Other |
| |
| |
| | |||
Total revenues |
| |
| |
| | |||
COST OF REVENUES: |
|
|
|
|
|
| |||
Platform subscriptions |
| |
| |
| | |||
Managed services |
| |
| |
| | |||
Other |
| |
| |
| | |||
Total cost of revenues |
| |
| |
| | |||
Gross profit |
| |
| |
| | |||
OPERATING EXPENSES: |
|
|
|
|
|
| |||
General and administrative |
| |
| |
| | |||
Sales and marketing |
| |
| |
| | |||
Technology and development |
| |
| |
| | |||
Total operating expenses |
| |
| |
| | |||
Income (loss) from operations |
| |
| ( |
| ( | |||
NON-OPERATING INCOME (EXPENSE): |
|
|
|
|
|
| |||
Payment to related party | ( | — | — | ||||||
Interest income (expense), net | | | ( | ||||||
Other expense, net |
| ( |
| ( |
| ( | |||
Total non-operating income (expense) |
| ( |
| ( |
| ( | |||
Income (loss) before income taxes |
| |
| ( |
| ( | |||
Income taxes |
| |
| |
| | |||
Net income (loss) | | ( | ( | ||||||
Net income (loss) attributable to non-controlling interests | | ( | ( | ||||||
Net income (loss) attributable to Enfusion, Inc. | $ | | $ | ( | $ | ( | |||
Net income (loss) per Class A common shares attributable to Enfusion, Inc.: | |||||||||
Basic | $ | | $ | ( | $ | ( | |||
Diluted | $ | | $ | ( | $ | ( | |||
Weighted Average number of Class A common shares outstanding: | |||||||||
Basic | | | | ||||||
Diluted | | | | ||||||
See Notes to Consolidated Financial Statements.
F-4
ENFUSION, INC.
CONSOLIDATED STATEMENTS OF COMPREHENSIVE INCOME (LOSS)
(dollars in thousands)
Year Ended December 31, | |||||||||
2023 |
| 2022 |
| 2021 | |||||
Net income (loss) | $ | | $ | ( | $ | ( | |||
Other comprehensive income (loss), net of income tax: |
|
|
|
|
|
| |||
Foreign currency translation income (loss) |
| |
| ( |
| ( | |||
Total other comprehensive income (loss) |
| |
| ( |
| ( | |||
Comprehensive income (loss) attributable to non-controlling interests | | ( | ( | ||||||
Total comprehensive income (loss) attributable to Enfusion, Inc. | $ | | $ | ( | $ | ( | |||
See Notes to Consolidated Financial Statements.
F-5
ENFUSION, INC.
Consolidated Statements of Preferred Units, Stockholders’ Equity and Members’ Deficit
(dollars and shares in thousands)
|
| Accumulated | ||||||||||||||||||||||||||||||||||||||
Class A | Class B | Additional | Other | Non- | Total | |||||||||||||||||||||||||||||||||||
Preferred Units | Members' Deficit | Preferred Stock | Common Stock | Common Stock | Paid-in | Accumulated | Comprehensive | Controlling | Stockholders’ | |||||||||||||||||||||||||||||||
Units | Amount | Units | Amount | Shares | Amount | Shares |
| Amount |
| Shares |
| Amount |
| Capital |
| Deficit |
| Loss |
| Interest |
| Equity | ||||||||||||||||||
January 1, 2021 | | $ | | | $ | ( | — | $ | — |
| — | $ | — | — | $ | — | $ | — | $ | — | $ | ( | $ | — | $ | ( | ||||||||||||||
Activity prior to the Reorganization Transactions: | ||||||||||||||||||||||||||||||||||||||||
Net income | — | | — | | — | — |
| — | — | — | — | — | — |
| — | — |
| | ||||||||||||||||||||||
Foreign currency translation | — | — | — | — | — | — |
| — | — | — | — | — | — | ( | — | ( | ||||||||||||||||||||||||
Distributions to members | — | ( | — | ( | — | — |
| — | — | — | — | — | — | — | — | ( | ||||||||||||||||||||||||
| $ | | | $ | ( | — | $ | — |
| — | $ | — | — | $ | — | $ | — | $ | — | $ | ( | $ | — | $ | ( | |||||||||||||||
Activity subsequent to the Reorganization Transactions: | ||||||||||||||||||||||||||||||||||||||||
Effect of the Reorganization Transactions | ( | ( | ( | | — | — | | | | | ( | — | — | ( | | |||||||||||||||||||||||||
Issuance of Class A common stock in the IPO, net of issuance costs | — | — | — | — | — | — | | | — | — | | — | — | | | |||||||||||||||||||||||||
Purchase of Pre-IPO common unit holders and retirement of Class B common shares | — | — | — | — | — | — | — | — | ( | ( | ( | — | — | ( | ( | |||||||||||||||||||||||||
Net Loss | — | — | — | — | — | — | — | — | — | — | — | ( | — | ( | ( | |||||||||||||||||||||||||
Stock-based compensation | — | — | — | — | — | — | — | — | — | — | | — | — | | | |||||||||||||||||||||||||
Foreign currency translation | — | — | — | — | — | — |
| — | — | — | — | — | — |
| | |
| | ||||||||||||||||||||||
December 31, 2021 | — | $ | — | — | $ | — | — | $ | — |
| | $ | | | $ | | $ | | $ | ( | $ | ( | $ | | $ | | ||||||||||||||
Net loss | — | — |
| — | — | — | — | — | ( |
| — | ( |
| ( | ||||||||||||||||||||||||||
Stock-based compensation | — | — | — | — | — | — | — | — | — | — | | — | — | | | |||||||||||||||||||||||||
Share exchange | — | — | — | — | — | — | | | ( | ( | | — | — | ( | — | |||||||||||||||||||||||||
Issuance of IPO vested Class A common stock and share-based awards | — | — | — | — | — | — | | | — | — | ( | — | — | — | — | |||||||||||||||||||||||||
Tax withholdings related to net share settlements of stock-based compensation awards | — | — | — | — | — | — | ( | ( | — | — | ( | — | — | ( | ( | |||||||||||||||||||||||||
Foreign currency translation | — | — | — | — | — | — | — | — | — | — | — | — |
| ( | ( |
| ( | |||||||||||||||||||||||
Other | — | — | — | — | — | — |
| — | — | — | — | | — | — | — | | ||||||||||||||||||||||||
December 31, 2022 | — | $ | — | — | $ | — | — | $ | — |
| | $ | | | $ | | $ | | $ | ( | $ | ( | $ | | $ | | ||||||||||||||
Net income | — | — | — | — | — | — |
| — | — | — | — | — | |
| — | |
| | ||||||||||||||||||||||
Stock-based compensation | — | — | — | — | — | — | — | — | — | — | | — | — | | | |||||||||||||||||||||||||
Share exchange | — | — | — | — | — | — | | | ( | ( | | — | — | ( | — | |||||||||||||||||||||||||
Issuance of IPO vested Class A common stock and share-based awards | — | — | — | — | — | — | | | — | — | | — | — | ( | — | |||||||||||||||||||||||||
Issuance of Class A common stock, net of issuance costs | — | — | — | — | — | — | | | — | — | | — | — | | | |||||||||||||||||||||||||
Cumulative impact of adopting ASU 2016-13 | — | — | — | — | — | — | — | — | — | — | — | ( | — | ( | ( | |||||||||||||||||||||||||
Tax withholdings related to net share settlements of stock-based compensation awards | — | — | — | — | — | — | — | — | — | — | ( | — | — | ( | ( | |||||||||||||||||||||||||
Foreign currency translation | — | — | — | — | — | — | — | — | — | — | — | — |
| | |
| | |||||||||||||||||||||||
Other | — | — | — | — | — | — |
| — | — | — | — | ( | — | — | ( | ( | ||||||||||||||||||||||||
December 31, 2023 | — | $ | — | — | $ | — | — | $ | — |
| | $ | | | $ | | $ | | $ | ( | $ | ( | $ | | $ | | ||||||||||||||
See Notes to Consolidated Financial Statements.
F-6
ENFUSION, INC.
CONSOLIDATED STATEMENTS OF CASH FLOWS
(dollars in thousands)
Year Ended December 31, | |||||||||
2023 |
| 2022 |
| 2021 | |||||
Cash flows from operating activities: |
|
|
|
|
| ||||
Net income (loss) | $ | | $ | ( | $ | ( | |||
Adjustments to reconcile net income (loss) to net cash provided by (used in) operating activities: |
|
|
|
|
|
| |||
Non-cash lease expense | | | — | ||||||
Depreciation and amortization |
| |
| | | ||||
Provision for credit losses |
| |
| | | ||||
Amortization of debt-related costs |
| |
| | | ||||
Loss on extinguishment of debt | | — | | ||||||
Stock-based compensation expense | | | | ||||||
Change in operating assets and liabilities: |
|
| |||||||
Accounts receivable |
| ( |
| ( | ( | ||||
Prepaid expenses and other assets |
| ( |
| ( | ( | ||||
Accounts payable |
| |
| ( | | ||||
Accrued compensation | ( | | ( | ||||||
Accrued expenses and other liabilities | | ( | ( | ||||||
Lease liabilities | ( | ( | — | ||||||
Net cash provided by (used in) operating activities |
| |
| |
| ( | |||
Cash flows from investing activities: |
|
|
|
|
|
| |||
Purchases of property and equipment |
| ( |
| ( |
| ( | |||
Capitalization of software development costs | ( | ( | ( | ||||||
Net cash used in investing activities |
| ( |
| ( |
| ( | |||
Cash flows from financing activities: |
|
|
|
|
|
| |||
Payment of debt issuance costs | ( | — | — | ||||||
Settlement of tax receivable acquired in reorganization transactions | | — | — | ||||||
Issuance of Class A common stock, net of issuance costs | | — | | ||||||
Payment of withholding taxes on stock-based compensation | ( | ( | ( | ||||||
Repayment of term loan | — | — | ( | ||||||
Payment of member distributions | — | — | ( | ||||||
Purchases of common units from Pre-IPO common unit holders | — | — | ( | ||||||
Other financing activities | ( | — | — | ||||||
Net cash (used in) provided by financing activities |
| ( |
| ( |
| | |||
Effect of exchange rate changes on cash and cash equivalents |
| |
| ( |
| ( | |||
Net (decrease) increase in cash and cash equivalents |
| ( |
| ( |
| | |||
Cash and cash equivalents, beginning of period |
| |
| |
| | |||
Cash and cash equivalents, end of period | $ | | $ | | $ | | |||
Supplemental disclosure of cash flow information: |
|
|
|
| |||||
Income taxes paid in cash | $ | | $ | | $ | | |||
Interest paid in cash | $ | — | $ | — | $ | | |||
Supplemental disclosure of non-cash activities: | |||||||||
Right-of-use assets obtained in exchange for lease liabilities | $ | | $ | | $ | — | |||
Capitalized stock-based compensation expense | $ | | $ | | $ | — | |||
Accrued property, equipment, and software, net | $ | | $ | — | $ | — | |||
Effect of the Reorganization Transactions | $ | — | $ | — | $ | | |||
IPO costs included in accrued expenses and other liabilities | $ | — | $ | — | $ | | |||
Other | $ | — | $ | | $ | — | |||
See Notes to Consolidated Financial Statements.
F-7
ENFUSION, INC.
Notes to Consolidated Financial Statements
Note 1 Organization and Description of Business
Enfusion is a leading provider of cloud-based order and execution management, portfolio management and risk systems. Enfusion’s clients include large global hedge fund managers, institutional asset managers, family offices and other institutional investors. Enfusion provides its clients with innovative real-time performance, risk calculations, and accounting capabilities for some of the most sophisticated financial products. The Company is headquartered in Chicago, Illinois and has offices in New York City, London, Dublin, Hong Kong, Singapore, Mumbai, Bengaluru, and Sydney.
Enfusion, Inc. was incorporated in Delaware on June 11, 2021 for the purpose of facilitating an initial public offering, which was completed on October 25, 2021, and other related transactions in order to carry on the business of Enfusion Ltd. LLC. Enfusion, Inc. is a holding company and, through its control over the managing member of Enfusion Ltd. LLC, operates and controls Enfusion Ltd. LLC. Enfusion, Inc.’s principal asset consists of Common Units.
Enfusion, Inc. has
Note 2 Basis of Presentation
Principles of Consolidation
These statements have been prepared in conformity with U.S. GAAP. All intercompany balances and transactions are eliminated in consolidation.
Use of Estimates
The preparation of consolidated financial statements in conformity with U.S. GAAP requires management to make estimates and assumptions that affect the reported amounts of assets and liabilities and disclosure of contingent assets and liabilities at the date of the consolidated financial statements and the reported amounts of revenue and expenses during the reporting period. We base our estimates on historical experience and various other assumptions believed to be reasonable. These estimates and assumptions include, but are not limited to, judgments affecting the measurement of the payable to related parties pursuant to the Tax Receivable Agreement, amortization periods, certain assumptions used in the valuation of stock-based compensation, assessment of the allowance for credit losses, and accounting for income taxes and assessment of valuation allowances. Actual results could differ from those estimates.
The Company’s results can also be affected by economic, political, legislative, regulatory, and legal actions, including but not limited to health epidemics and pandemics and the resulting economic impact. Economic conditions, such as recessionary trends, inflation, interest and monetary exchange rates, and government fiscal policies can have a significant effect on operations. While the Company maintains reserves for anticipated liabilities and carries various levels of insurance, the Company could be affected by civil, criminal, regulatory, or administrative actions, claims, or proceedings.
F-8
Reclassifications
Certain amounts in prior periods have been reclassified to conform with the current period presentation.
Segments
Operating segments are defined as components of an entity for which separate financial information is available and that is regularly reviewed by the Chief Operating Decision Maker (“CODM”) in deciding how to allocate resources to an individual segment and in assessing performance. The Company’s Chief Executive Officer is the CODM. While the Company operates in multiple countries, the Company’s business operates as
Note 3 Summary of Significant Accounting Policies
The significant accounting policies of the Company and its subsidiaries are summarized below.
Cash and Cash Equivalents
The Company considers all highly liquid investments purchased with an initial maturity date of three months or less to be cash equivalents. Funds held as investments in money market funds are included within cash and cash equivalents. As of December 31, 2023 and 2022, respectively, the Company had $
Accounts Receivable
Accounts receivable includes billed and unbilled receivables, net of allowances, including the allowance for credit losses. Billed accounts receivable are initially recorded upon the invoicing to clients with payment due within
The Company maintains an allowance for credit losses at an amount estimated to be sufficient to provide adequate protection against losses resulting from extending credit to its clients. The Company regularly determines the adequacy of the allowance based on its assessment of the collectability of the accounts receivable by considering the age of each outstanding invoice, the collection history of each client, an evaluation of the current expected risk of credit loss, and other client-specific factors with a bearing on receivables. The Company assesses collectability by reviewing accounts receivable on an aggregated basis where similar characteristics exist and on an individual basis for specific clients with historical collectability issues or known financial difficulties. Increases to the allowance are recognized as a charge to credit losses included in general and administrative expenses in the consolidated statements of operations. Accounts receivable deemed uncollectible are charged against the allowance for credit losses when identified.
F-9
The Company's allowance for credit losses is as follows (in thousands):
Balance at December 31, 2021 | $ | | |
Changes to the provision |
| | |
Accounts written off, net of recoveries | ( | ||
Balance at December 31, 2022 | | ||
Adoption of ASU 2016-13 | | ||
Changes to the provision | | ||
Accounts written off, net of recoveries | ( | ||
Balance at December 31, 2023 | $ | |
Leases
The Company determines at contract inception if the contract is or contains a lease. The Company records right-of-use (“ROU”) assets and lease obligations for its leases, which are initially recognized at the commencement date based on the discounted future lease payments over the term of the lease. As the rates implicit in the Company’s leases are not readily determinable, the Company determines the present value of the lease liability using its incremental borrowing rate at the lease commencement date. Incremental borrowing rates for domestic currency leases are calculated using the Company’s credit adjusted risk-free rate. Foreign-denominated lease payments are discounted using country-specific treasury rates adjusted for credit spread.
The Company does not record an ROU asset and lease obligation for its short-term leases, which are defined as leases with an initial term of 12 months or less. The Company has elected not to separate lease and non-lease components.
Property, Equipment, and Software, Net
Property, equipment, and software is stated at historical cost, net of accumulated depreciation and amortization. Depreciation and amortization are computed using the straight-line method over the estimated useful lives of the individual assets, except for leasehold improvements, which are depreciated over the shorter of the estimated useful life of the asset or the underlying lease term. Also included in property, equipment, and software are capitalized costs of software developed for internal use. The useful lives of property, equipment, and software are as follows:
Property, Equipment, and Software Asset Type | Estimated Useful Lives |
Software development costs | |
Computers | |
Furniture, fixtures, and equipment | |
Leasehold improvements |
Maintenance and repairs are expensed as incurred. Upon retirement or disposition, the cost and related accumulated depreciation or amortization is removed from the accounts and any gain or loss is included in operating income.
Software Development Costs
The Company capitalizes certain qualifying costs, including stock-based compensation expense, incurred in the development of and major enhancements to the Company's cloud-based software as a service (“SaaS”) platform and related software products. Capitalized software development costs related to the Company's platform are amortized on a straight-line basis over the developed software's estimated useful life of three years, and the related amortization expense is recorded in cost of revenues within our consolidated statements of operations.
F-10
Costs incurred in the preliminary stages of development are expensed as incurred. Costs incurred for post-implementation activities, training, maintenance, and minor upgrades and enhancements without adding additional functionality are expensed as incurred within technology and development expense in our consolidated statements of operations.
Impairment of Long-Lived Assets
The Company evaluates the carrying value of long-lived assets in accordance with the accounting standard for impairment or disposal of long-lived assets, which requires recognition of impairment of long-lived assets in the event that circumstances indicate impairment may have occurred and when the net carrying value of such asset group exceeds the future undiscounted cash flows attributed to such asset group. The Company assesses the impairment of long-lived assets whenever events or changes in circumstances indicate that the carrying value may not be recoverable.
Fair Value of Financial Instruments
Fair value is defined as the price that would be received to sell an asset or paid to transfer a liability (i.e., the exit price) in an orderly transaction between market participants at the measurement date. Accounting standards establish a hierarchal framework, which prioritizes and ranks the level of market price observability used in measuring assets and liabilities at fair value. Market price observability is impacted by a number of factors, including the type of investment and the characteristics specific to the investment. Observable inputs are inputs that market participants would use in pricing the asset or liability developed based on market data obtained from independent sources. Unobservable inputs are inputs that reflect the assumptions market participants would use in pricing the asset or liability developed based on the best information available. Assets and liabilities measured and reported at fair value are classified and disclosed in one of the following categories:
Level 1 | Inputs are quoted prices for identical instruments in active markets; |
Level 2 | Inputs are quoted prices for similar instruments in active markets; quoted prices for identical or similar instruments in markets that are not active; and model-derived valuations in which all significant inputs are observable in active markets; |
Level 3 | Inputs are valuations derived from valuation techniques in which one or more significant inputs are unobservable. |
Financial assets and liabilities are classified in their entirety based on the lowest level of input that is significant to the fair value measurement.
The Company has investments in money market accounts, which are included in cash and cash equivalents on the consolidated balance sheets. Fair value inputs for these investments are considered Level 1 measurements within the fair value hierarchy, as money market account fair values are known and observable through daily published floating net asset values.
Annual Bonus Incentive Plan
Annual bonuses payable by the Company to its officers and employees may be funded through a combination of cash and equity, at the discretion of the Company’s Compensation Committee. We accrue and record the related corporate bonus amounts payable in cash in the period in which it is earned by the recipient. The Compensation Committee may make incentive awards based on such terms, conditions, and criteria as it considers appropriate. Stock awards issued in connection with these bonuses may or may not be subject to additional vesting conditions at the time of grant, which are subject to determination by the Compensation Committee.
F-11
For annual bonuses settled in cash, the Company accrues over the course of the year the annual bonuses earned by employees but paid in the following year. For annual bonuses settled in stock, in accordance with ASC 718, Stock Compensation, the Company views the authorization of the award to be the date that all approval requirements are completed (e.g., action by the Compensation Committee approving the awards and determining the number of equity instruments to be issued), and therefore, the service inception to begin at grant date. As such, stock-based compensation cost related to the Annual Bonus Incentive Plan is recognized on the grant date to the extent such awards are not subject to additional vesting conditions.
Revenue Recognition
The Company recognizes revenue in accordance with Accounting Standards Codification 606 (“ASC 606”), Revenue from Contracts with Customers. The Company derives its revenues primarily from fees for platform subscriptions and managed services provided to clients. Revenues are recognized when control of these services are transferred to the Company’s clients in an amount that reflects the consideration the Company expects to be entitled to in exchange for these services. Revenues are recognized net of taxes that will be remitted to governmental agencies applicable to service contracts. Clients are invoiced each month for the services provided in accordance with the stated terms of their service contracts. Fees for partial term service contracts are prorated, as applicable. Payment of fees are due from clients within
● Identification of the contract, or contracts, with a client;
● Identification of the performance obligation in the contract;
● Determination of transaction price;
● Allocation of the transaction price to the performance obligations in the contract; and
● Recognition of revenue when, or as, performance obligations are satisfied.
Platform subscriptions revenues
Platform subscriptions revenues consist primarily of user fees to provide our clients access to our cloud-based solution. Fees consider various components such as number of users, connectivity, trading volume, data usage and product coverage. Platform subscriptions clients do not have the right to take possession of the platform’s software and do not have any general return right. Platform subscriptions revenues are recognized ratably over the period of contractually enforceable rights and obligations, beginning on the date the client gains access to the platform. Installed payments are generally invoiced at the end of each calendar month during the subscription term. There is no financing available.
Managed services revenues
Managed services revenues primarily consist of client-selected middle- and back-office, technology-powered services. Managed services revenues are recognized ratably over the period of contractually enforceable rights and obligations, beginning on the contract effective date. Clients are invoiced a set fee for managed services typically at the end of each month. Generally, invoices have a 30-day payment period in accordance with the associated contract. There is no financing available.
Other revenues
Other revenues consist of non-subscription-based revenues primarily data conversion. The Company recognizes revenues as these services are performed with invoicing generally occurring at the end of each month.
F-12
Service contracts with multiple performance obligations
Certain of the Company’s contracts provide for customers to be charged a fee for implementation services. In determining whether the implementation services, which frequently include configuration and/or interfacing, customer reporting, customizing user permissions and acceptance testing, end-user training, and establishing connections with third-party interfaces, are distinct from its platform subscription services, the Company considers, in addition to their complexity and level of customization, that these services are integral in delivering the customer desired output and are necessary for the customer to access and begin to use the hosted application. The implementation provider must be intimately familiar with its platform to effectively execute the customization required, and no other entities have access to the source code. The Company has concluded that the implementation services in its service contracts with multiple performance obligations are not distinct, and therefore, the Company recognizes fees for implementation services ratably over the non-cancelable term of the contract.
Remaining performance obligations
For the Company’s contracts that exceed one year and do not include a termination for convenience clause, the amount of the transaction price allocated to remaining performance obligations as of December 31, 2023 was $
Remaining Performance Obligation | December 31, 2023 | ||
$ | | ||
| | ||
| | ||
| | ||
2028 | — | ||
Total | $ | | |
Disaggregation of revenue
The Company’s total revenues by geographic region, based on the client’s physical location is presented in the following table (in thousands):
Year Ended December 31, | ||||||||||||||||
2023 | 2022 | 2021 | ||||||||||||||
Geographic Region |
| Amount |
| Percent |
| Amount |
| Percent | Amount |
| Percent | |||||
Americas* | $ | |
| | % | $ | |
| | % | $ | |
| | % | |
Europe, Middle East, and Africa (EMEA) |
| |
| | % |
| |
| | % |
| |
| | % | |
Asia Pacific (APAC) |
| |
| | % |
| |
| | % |
| |
| | % | |
Total revenues | $ | |
| | % | $ | |
| | % | $ | |
| | % | |
* | Includes revenues from clients based in the United States (country of domicile) of $ |
Deferred commissions
The Company pays sales commissions for initial contracts and expansions of existing contracts with customers. These commissions earned by certain of its sales force are considered incremental and recoverable costs of obtaining a contract with a customer. Sales commissions paid where the amortization period is one year or less are expensed as incurred. All other sales commissions are deferred and then amortized on a straight-line basis over a period of benefit that the Company has determined to be three years. The Company determined the period of benefit by taking into consideration
F-13
its standard contract terms and conditions, rate of technological change, and other factors. Amortization expense is included in sales and marketing expenses in the accompanying consolidated statements of operations.
The balance of deferred commissions as of December 31, 2023 and December 31, 2022 was $
Cost of Revenues
Cost of revenues consists primarily of personnel-related costs associated with the delivery of the Company’s software and services, including base salaries, bonuses, employee benefits and related costs. Additionally, cost of revenues includes amortization of capitalized software development costs, allocated overhead and certain direct data and hosting costs.
Technology and Development
Technology and development expenses consist primarily of employee-related expenses for the Company’s software development. Additional expenses include costs related to the development, maintenance, quality assurance and testing of new technologies, and ongoing refinement of the Company’s existing solutions. Technology and development expenses, other than software development costs qualifying for capitalization, including costs associated with preliminary project stage activities, training, maintenance, and all other post-implementation stage activities are expensed as incurred.
Advertising Costs
The Company expenses advertising costs as incurred. Advertising costs incurred were approximately $
Stock-Based Compensation
In October 2021, in connection with the IPO, the Company adopted the 2021 Stock Option and Incentive Plan, (the “2021 Plan”). The 2021 Plan allows the Company’s Compensation Committee to make incentive awards to its officers, employees, directors, and service providers. The Company also adopted the 2021 Employee Stock Purchase Plan (the “2021 ESPP”). The Company measures stock-based compensation expense for its share-based payment awards at fair value on the grant date. The fair value of share-based payment awards is determined using the fair market value of the underlying Class A common stock on the date of grant. The Company applied a discount for lack of marketability, estimated using the Finnerty Model, to the fair value of awards with post-vesting restrictions, which includes the vested shares of Class A common stock and the Contingently Issuable Shares (as defined below) issued on the IPO effectiveness date (as defined below).
For restricted stock units (“RSUs”) for which vesting is subject to the achievement of a market condition, the Company determines the fair value of these RSUs using the Monte Carlo method. The Monte Carlo simulations used to estimate the fair value include subjective assumptions, including the fair value of the underlying common stock, expected volatility of the price of the Company’s common stock, risk-free interest rate, expected dividend yield of common stock, and the Company’s cost of equity capital.
The Company records forfeitures as they occur. The cost of services received from employees and non-employees in exchange for awards of equity instruments is recognized in the consolidated statements of operations based on the estimated fair value of those awards on the grant date or reporting date, if required to be remeasured, and amortized on a straight-line basis over the requisite service period.
F-14
Income (Loss) Per Share
Income (loss) per share is computed by dividing net income (loss) attributable to the Company by the number of weighted average shares of Class A common stock outstanding during the period. Diluted income (loss) per share is computed by dividing net income (loss) attributable to the Company by the number of weighted-average shares of Class A common stock outstanding during the period after adjusting for the impact of securities that would have a dilutive effect on income (loss) per share. See Note 12, Income (Loss) Per Class A Common Share, for further discussion.
All income (loss) for the period prior to the IPO were entirely allocable to Enfusion Ltd. LLC. and its historic non-controlling interest. Due to the impact of the Reorganization Transactions, the Company’s capital structure for the pre- and post-IPO periods is not comparable. As a result, the presentation of income (loss) per share for the periods prior to the IPO and Reorganizational Transactions is not meaningful and only income (loss) per share for the period subsequent to the IPO and Reorganizational Transactions is presented herein.
Non-Controlling Interest
Non-controlling interests represent the portion of profit or loss, net assets, and comprehensive income (loss) of its consolidated subsidiaries that are not allocable to the Company based on its percentage of ownership of such entities. As noted above, in October of 2021, Enfusion US 1, Inc., a newly-formed wholly owned subsidiary of Enfusion, Inc., became the sole managing member of Enfusion Ltd. LLC in connection with the Reorganization Transactions. As of December 31, 2023, the Company holds approximately
Income Taxes
The Company accounts for income taxes under the asset and liability method, and deferred tax assets and liabilities are recognized for the future tax consequences attributable to differences between the financial statement carrying values of existing assets and liabilities and their respective tax bases. Deferred tax assets and liabilities are measured using enacted tax rates in effect for the year in which those temporary differences are expected to be recovered or settled. The effect of a change in tax rates on deferred tax assets and deferred tax liabilities is recognized in income in the period that includes the enactment date.
The Company recognizes deferred tax assets to the extent that it is believed that these assets are more likely than not to be realized. In making such a determination, the Company considers all available positive and negative evidence, including future reversals of existing taxable temporary differences, projected future taxable income, tax-planning strategies, carryback potential if permitted under the tax law, and results of recent operations. A valuation allowance is provided if it is determined that it is more likely than not that the deferred tax asset will not be realized.
The Company evaluates and accounts for uncertain tax positions using a two-step approach. Recognition (step one) occurs when the Company concludes that a tax position, based solely on its technical merits, is more-likely-than-not to be sustainable upon examination. Measurement (step two) determines the amount of tax benefit that is greater than 50% likely to be realized upon ultimate settlement with a taxing authority that has full knowledge of all relevant information. Derecognition of a tax position that was previously recognized would occur when the Company subsequently determines that a tax position no longer meets the more-likely-than-not threshold of being sustained. The Company records interest (and penalties where applicable), net of any applicable related income tax benefit, on potential income tax contingencies as a component of income tax expense in the consolidated statements of operations.
F-15
Tax Receivable Agreement (TRA)
The Company accounts for amounts payable under the Tax Receivable Agreement in accordance with ASC 450, Contingencies. The amounts payable under the Tax Receivable Agreement will vary depending upon a number of factors, including the amount, character, and timing of the taxable income of the Company in the future. Actual tax benefits realized by the Company may differ from tax benefits calculated under the Tax Receivable Agreement as a result of the use of certain assumptions in the agreement. Any such changes in these factors or changes in the Company’s determination of the need for a valuation allowance related to the tax benefits acquired under the Tax Receivable Agreement could adjust the Tax Receivable Agreement liabilities recognized on the consolidated balance sheets. Subsequent changes in the Tax Receivable Agreement liabilities between reporting periods, as well as any interest accrued on the Tax Receivable Agreement between the Company's annual tax filing date and the Tax Receivable Agreement payment date, are recognized in the consolidated statements of operations. As of December 31, 2023 and 2022, the Company has not recorded a liability under the Tax Receivable Agreement.
Concentration of Risk
Deposits with Financial Institutions
The Company has concentrated its credit risk for cash by maintaining deposits in several financial institutions, which may at times exceed amounts covered by insurance provided by the Federal Deposit Insurance Corporation. The Company has not experienced any losses in such accounts and believes it is not exposed to any significant credit risk related to cash.
Accounts Receivable
As of December 31, 2023, the Company had
Translation of Foreign Currencies
Assets and liabilities denominated in the functional currency of the Company’s international subsidiaries are translated to its reporting currency using the exchange rates in effect at the balance sheet date. Results from operations are translated using the average exchange rates prevailing throughout the year. The effects of exchange rate fluctuations on translating foreign currency assets and liabilities into U.S. dollars are accumulated as part of the foreign currency translation adjustment in accumulated other comprehensive loss in the consolidated balance sheets.
Foreign currency balances for monetary assets and liabilities are remeasured into the entity’s functional currency at the balance sheet date, and fluctuations in value are recorded within other income (expense) in the consolidated statements of operations.
Recently Adopted Accounting Pronouncements
In June 2016, the FASB issued ASU 2016-13 and ASU 2018-19, Financial Instruments-Credit Losses (Topic 326): Measurement of Credit Losses on Financial Instruments (“ASU No. 2016-13”), which requires that a financial asset (or a group of financial assets) measured at an amortized cost basis be presented at the net amount expected to be collected. This approach to estimating credit losses applies to most financial assets measured at amortized cost and certain other instruments, including but not limited to, trade and other receivables. The Company adopted this guidance effective January 1, 2023 and made changes to its accounting policies related to credit loss calculations, including the consideration of forecasted economic data and the pooling of financial assets with similar risk profiles. The Company adopted the new allowance for credit losses accounting standard on by means of a cumulative-effect adjustment, where it
F-16
recognized the cumulative effect of initially applying the guidance as a $
Recent Accounting Pronouncements Not Yet Adopted
In November 2023, the FASB issued ASU 2023-07, Segment Reporting (Topic 280): Improvements to Reportable Segment Disclosures (“ASU No. 2023-07”), to expand the annual and interim disclosure requirements for reportable segments, including public entities with a single reportable segment, primarily through enhanced disclosures about significant segment expenses. ASU No. 2023-07 is effective for fiscal years beginning after December 15, 2023, and for interim periods beginning after December 15, 2024, with early adoption permitted. The Company is currently evaluating the impact of adopting this standard.
In December 2023, the FASB issued ASU 2023-09, Income Taxes (Topics 740): Improvements to Income Tax Disclosures (“ASU No. 2023-09”), to expand the disclosures in an entity’s income tax rate reconciliation table and income taxes paid both in U.S. and foreign jurisdictions. ASU No. 2023-09 is effective for fiscal years beginning after December 15, 2024, with early adoption permitted. The Company is currently evaluating the impact of adopting this standard.
Note 4 Property, Equipment, and Software, Net
Property, equipment, and software, net consists of the following (in thousands):
December 31, | ||||||
2023 |
| 2022 | ||||
Computer equipment | $ | | $ | | ||
Software development costs |
| |
| | ||
Leasehold improvements |
| |
| | ||
Furniture and fixtures |
| |
| | ||
Total property, equipment, and software, cost |
| |
| | ||
Less accumulated depreciation and amortization |
| ( |
| ( | ||
Total property, equipment, and software, net | $ | | $ | | ||
As of December 31, 2023 and 2022, property, equipment, and software, net located in the United States was $
Depreciation expense related to property and equipment, excluding software development costs, was $
F-17
Note 5 Accrued Expenses and Other Current Liabilities
Accrued expenses and other current liabilities consisted of the following (in thousands):
December 31, | ||||||
2023 |
| 2022 | ||||
Accrued compensation | $ | | $ | | ||
Accrued expenses and other |
| |
| | ||
Accrued taxes |
| |
| | ||
Total accrued expenses and other current liabilities | $ | | $ | | ||
Accrued compensation includes bonuses due to employees of $
Note 6 Leases
The Company enters into leases for office space and data centers. A number of the leases include one or more options to
All of the Company’s leases are considered operating leases. The Company had
The Company has entered into operating leases for international office spaces that are yet to commence as of December 31, 2023.
Lease commitments as of December 31, 2023 were as follows:
Amount | |||
2024 | | ||
2025 | | ||
2026 | | ||
2027 | | ||
2028 | | ||
Thereafter | | ||
Total lease commitments | $ | | |
Less: Interest | ( | ||
Present value of lease liabilities | $ | |
F-18
The components of the Company’s operating lease cost for the twelve months ended December 31, 2023 and 2022, respectively, were as follows:
December 31, | ||||||
2023 | 2022 | |||||
Operating lease cost | $ | | $ | | ||
Variable lease cost | | | ||||
Short-term lease cost | | — | ||||
Total lease cost | $ | | $ | | ||
Variable lease costs are comprised of the Company’s proportionate share of actual costs for utilities, common area maintenance, property taxes, and insurance, which are not included in the lease liability and are recognized in the period in which they are incurred.
As of December 31, 2023 and 2022, respectively, the weighted-average remaining lease terms and weighted-average discount rates were as follows:
December 31, | ||||||
2023 | 2022 | |||||
Weighted-average remaining lease term - operating leases | ||||||
Weighted-average discount rate - operating leases | ||||||
Under Accounting Standards Codification 840, the previous lease standard, total expense for lease arrangements and service agreements was $
Note 7 Debt
New Credit Agreement
On September 15, 2023, the Company entered into the New Credit Agreement with Bank of America N.A. and a syndicate of lending institutions. The New Credit Agreement provides for a senior secured revolving loan facility in an aggregate principal amount of up to $
Revolving loans under the New Credit Agreement will bear interest, at the Company’s option, at an annual rate benchmarked to (1) the Secured Overnight Financing Rate (“SOFR”) or (2) a “Base Rate” that is equal to the highest of (a) the federal funds rate plus
The New Credit Agreement contains certain customary covenants with which the Company must comply, including financial covenants relating to a net leverage ratio covenant and an interest coverage ratio. As part of the New
F-19
Credit Agreement, the Company is required to establish within
Issuance costs associated with the New Credit Agreement were capitalized and included in other assets on the accompanying consolidated balance sheets.
As of December 31, 2023, the Company had
Prior Credit Agreement
Concurrent with entering into the New Credit Agreement, on September 15, 2023, the Company terminated its $
Note 8 Commitments and Contingencies
The Company records accruals for contingencies when it is probable that a liability will be incurred, and the amount of loss can be reasonably estimated. A description of a contingent payment arrangement under the Company’s Tax Receivable Agreement is included in Note 13, Income Taxes. Accruals for contingencies recorded as of December 31, 2023 and December 31, 2022, respectively, were immaterial.
Note 9 Stockholders’ Equity
Prior to the Reorganization Transactions, Enfusion Ltd. LLC was organized as a limited liability company owned by its members, each of whose membership interests consisted of an equal number of: (i) “Economic Units,” which represented a member’s economic interest in Enfusion Ltd. LLC; and (ii) “Participation Units,” which represented a member’s right to participate (vote) in the affairs of Enfusion Ltd. LLC.
As a limited liability company, Enfusion Ltd. LLC issued more than one class of units. The Class A units were considered to be members’ equity, whereas all of the other unit classes were considered to be preferred units because of provisions in the Company’s former Operating Agreement that conferred certain rights and privileges to the members owning these units, such as voting rights, redemption rights and liquidation preferences.
Holders of the Class C-1, C-2, and D preferred units had the option to require the Company to redeem their units. In accordance with the guidance in ASC 480, Distinguishing Liabilities from Equity, outstanding Class C-1, C-2, and D preferred units were classified outside of permanent equity and within temporary equity due to their optional redemption features and liquidation preferences.
In connection with the Reorganization Transactions, the Sixth Amended and Restated Operating Agreement of Enfusion Ltd. LLC was amended and restated to, among other things, modify its capital structure by reclassifying each of the outstanding Class A units and C-1, C-2, and D preferred units into the Common Units through a stock split on a
F-20
On June 15, 2023, the company sold
On August 14, 2023, the Company sold
On February 21, 2023, March 28, 2023, July 19, 2023, and August 1, 2023, pursuant to the terms of the LLC Operating Agreement, Pre-IPO Common Unitholders respectively surrendered
Amended and Restated of Certificate of Incorporation
The Amended and Restated Certificate of Incorporation of Enfusion, Inc. provides for
Each share of the Company’s Class A common stock is entitled to
Preferred Stock
The Company’s board of directors have the authority, without further action by the Company’s stockholders, to issue up to
Note 10 Management Incentive Plan and Stock-Based Compensation
2021 Stock Option and Incentive Plan
In conjunction with the IPO, the Company established the 2021 Stock Option and Incentive Plan (the “2021 Plan”), which became effective upon the date immediately preceding the IPO effectiveness date (as defined below). The Company has initially reserved
F-21
Control Bonus Plan (as defined below). The 2021 Plan provides that the number of shares of Class A common stock reserved and available for issuance under the 2021 Plan increased on January 1, 2022 and will continue to increase each January 1 thereafter, by
Pre-IPO Change in Control Bonus Plan
Prior to the IPO, Enfusion Ltd. LLC had a Pre-IPO Change in Control Bonus Plan (the “pre-IPO Change in Control Bonus Plan”) for certain members of management (“Plan Participants”) that provided for the payment of a cash bonus based on a specified number of Award Units in the event of a change in control (“CiC”) transaction (i.e., a liquidity event), as defined by the LLC Operating Agreement.
In anticipation of the Company’s IPO, in October 2021, the Company's board of managers elected to terminate the Pre-IPO Change in Control Bonus Plan (and all Award Units issued thereunder) upon effectiveness of the registration statement for the IPO (the “IPO effectiveness date”). Holders of Award Units that were still employed as of the IPO effectiveness date were granted one or more of the following:
| ● | The vested shares of Class A common stock as of IPO effectiveness date (“IPO vested Class A common stock”) are shares that were all issued to Plan Participants prior to the second anniversary of the IPO. No future service was required to receive the IPO vested Class A common stock. Because there was no ongoing service requirement associated with these awards, the Company recognized stock-based compensation expense for these awards on the IPO effectiveness date. The amount of stock-based compensation expense recognized for these awards was $ |
| ● | Shares of Class A common stock that vested within |
| ● | RSUs granted to executive and non-executive employees that will vest ratably over a period of up to |
| ● | Performance-based restricted stock units (“PSUs”) that will vest ratably over a period of up to |
F-22
| recognizes stock-based compensation expense on a straight-line basis over the implied service period for each tranche of the award, as if the award were in-substance multiple awards. |
In addition to the shares of Class A common stock, RSUs, and PSUs granted to employees that were Plan Participants in the Pre-IPO Change in Control Bonus Plan, the Company agreed to issue
For the IPO vested Class A common stock and the Contingently Issuable Shares granted on the IPO effectiveness date, the Company applied a discount for lack of marketability, estimated using the Finnerty Model, to the fair value of awards with post-vesting restrictions. All IPO vested Class A common stock and Contingently Issuable Shares were issued to Plan Participants prior to the second anniversary of the IPO.
Restricted Stock Units
The Company measures stock-based compensation expense for its share-based payment awards at fair value on the grant date. For RSUs for which vesting is not subject to the achievement of a market condition or achievement of a specified share price, the fair value of share-based payment awards is determined using the fair market value of the underlying Class A common stock on the date of grant (i.e. share price at closing).
The Company recognizes stock-based compensation expense for these RSUs on a straight-line basis over requisite service period for the entire award.
Stock Options
The expected fair value and term of the Company’s stock options was determined utilizing the simplified method, due to lack of historical exercise data. The expected volatility was determined using a weighted-average of the historical volatility measures of a group of guideline companies and the Company's own historical volatility.
During the year ended December 31, 2023, there were
Assumptions | 2023 | 2022 | ||
Expected volatility | ||||
Expected term of award | ||||
Risk-free rate | ||||
Dividend yield |
The shares of common stock to be issued and/or sold upon the exercise of stock options are made available from authorized and unissued common stock.
F-23
Performance-based Restricted Stock Units
For PSUs for which vesting is subject to the achievement of a market condition or specified price of the Company’s shares, the Company determines the fair value of these PSUs using the Monte Carlo method. The Monte Carlo simulations used to estimate the fair value include subjective assumptions, including the fair value of the underlying common stock, expected volatility of the price of the Company’s common stock, risk-free interest rate, expected dividend yield of common stock, and the Company’s cost of equity capital.
In the fourth quarter of 2023,
Assumptions | 2023 | 2022 | 2021 | |||
Fair value of common stock (per share) | $ | $ | $ | |||
Expected volatility | ||||||
Risk-free rate | ||||||
Dividend yield | ||||||
Cost of equity capital |
As of December 31, 2023, the total compensation cost related to unvested awards not yet recognized was $
Stock-Based Compensation
The Company’s stock-based compensation expense was recognized in the following captions within the consolidated statements of operations:
Year Ended December 31, | |||||||||
(in thousands) | 2023 | 2022 | 2021 | ||||||
Cost of revenues | $ | | $ | | $ | | |||
General and administrative | | | | ||||||
Sales and marketing | ( | | | ||||||
Technology and development | | | | ||||||
Total stock-based compensation expense | $ | | $ | | $ | | |||
The Company recognized total stock-based compensation expense, including RSUs and stock options, for the years ended December 31, 2023, 2022, and 2021 of $
The Company capitalized $
Total unrecognized stock-based compensation expense related to unvested RSUs and stock options was $
F-24
The following summarizes the Company’s share-based payment award activity for all IPO vested Class A common stock, RSUs, Contingently Issuable Shares and stock options for the years ended December 31, 2023 and 2022, respectively:
| IPO Vested Class A Common Stock, Contingently Issuable Shares and RSUs | Options | ||||||||||
Number of Units |
| Weighted-Average Grant-Date Fair Value |
| Number of Options |
| Weighted-Average Exercise Price | Weighted-Average Remaining Contractual Term (in years) | |||||
Outstanding as of December 31, 2022 | | $ | | | | |||||||
Vested as of December 31, 2022 | | - | - | |||||||||
Unvested as of December 31, 2022 | | | | |||||||||
Granted during the period | | $ | | | | |||||||
Forfeited during the period | ( | | ( | | ||||||||
Vested and issued during the period (a) | ( | | - | - | ||||||||
Outstanding as of December 31, 2023 (b) | | $ | | | $ | | ||||||
(a) Includes shares issued and net settled to satisfy tax withholding obligations. | ||||||||||||
(b) December 31, 2023 balance is all unvested. | ||||||||||||
Note 11 Employee Benefit Plans
The Company sponsors a 401(k) Plan that covers substantially all full-time United States employees who meet eligibility requirements. The Company makes matching contributions equal to
Note 12 Net Income (Loss) Per Class A Common Share
Basic income (loss) per share is computed by dividing net income (loss) attributable to Enfusion, Inc. by the weighted-average number of shares of Class A common stock outstanding during the period. Diluted income (loss) per share is computed giving effect to all potentially dilutive shares.
Prior to the IPO, the Enfusion Ltd. LLC membership structure included Common Units and multiple classes of preferred Units. The Company analyzed the calculation of earnings per unit for periods prior to the IPO using the two-class method and determined that it resulted in values that would not be meaningful to the users of these consolidated financial statements. Therefore, earnings per share information has not been presented for periods prior to the IPO on October 20, 2021. The basic and diluted earnings per share represent only the years ended December 31, 2023 and 2022, and the period from October 21, 2021 to December 31, 2021.
F-25
A reconciliation of the numerator and denominator used in the calculation of basic and diluted net income (loss) per share of Class A common stock is as follows:
Year Ended December 31, | |||||||||
(in thousands, except per share amounts) | 2023 |
| 2022 | 2021 | |||||
Net income (loss) | $ | | $ | ( | $ | ( | |||
Less: Net income attributable to Enfusion, Inc. prior to the IPO | - | - | ( | ||||||
Less: Net (income) loss attributable to non-controlling interests | ( | | | ||||||
Net income (loss) attributable to Enfusion, Inc. | $ | | $ | ( | $ | ( | |||
Numerator: | |||||||||
Net income (loss) attributable to Enfusion, Inc. | $ | | $ | ( | $ | ( | |||
Adjustment to loss attributable to common stockholders | | ( | ( | ||||||
Numerator for Basic Earnings per Share | $ | | $ | ( | $ | ( | |||
Adjustment to Income for Dilutive Shares | | - | - | ||||||
Numerator for Diluted Earnings per Share | $ | | $ | ( | $ | ( | |||
Denominator: | |||||||||
Weighted-average shares of Class A common stock outstanding | | | | ||||||
Vested shares of Class A common stock and RSUs | | | | ||||||
Weighted-average shares of Class A common stock outstanding--basic | | | | ||||||
Add: Dilutive Shares | | - | - | ||||||
Weighted-average shares of Class A common stock outstanding--diluted | | | | ||||||
Net income (loss) per share of Class A common stock--Basic | $ | | $ | ( | $ | ( | |||
Net income (loss) per share of Class A common stock--Diluted | $ | | $ | ( | $ | ( | |||
The following number of potentially dilutive shares were excluded from the calculation of diluted loss per share because the effect of including such potentially dilutive shares would have been antidilutive:
Year Ended December 31, | |||||||||
(in thousands) | 2023 |
| 2022 | 2021 | |||||
Class B common stock | - | | | ||||||
Contingently issuable shares of Class A common stock | - | - | | ||||||
Restricted stock units | | | | ||||||
Stock options | | | - | ||||||
| | | |||||||
Shares of Class B common stock do not share in earnings and are not participating securities. Accordingly, separate presentation of loss per share of Class B common stock under the two-class method has not been presented. Shares of Class B common stock are, however, considered potentially dilutive shares of Class A common stock. After evaluating the potential dilutive effect under both the treasury stock method and if-converted method, shares of Class B common stock were determined to be dilutive and have therefore been included in the computation of diluted earnings per share of Class A common stock for the year ended December 31, 2023.
Note 13 Income Taxes
The Company is taxed as a corporation for income tax purposes and is subject to federal, state, and local taxes on the income allocated to it from Enfusion Ltd. LLC based upon the Company’s economic interest in Enfusion Ltd. LLC. The Company controls the sole managing member of Enfusion Ltd. LLC and, as a result, consolidates the financial results of Enfusion Ltd. LLC.
F-26
Enfusion Ltd. LLC is a limited liability company taxed as a partnership for income tax purposes. Enfusion Ltd. LLC does not pay any federal income taxes, as income or loss is included in the tax returns of the individual members. Additionally, certain wholly-owned entities taxed as corporations are subject to federal, state, and foreign income taxes in the jurisdictions in which they operate, and accruals for such taxes are included in the consolidated financial statements. For periods prior to the IPO, the Company’s taxes represent those of Enfusion Ltd. LLC.
The components of income (loss) before income taxes were as follows (in thousands):
Year Ended December 31, | |||||||||
2023 |
| 2022 | 2021 | ||||||
U.S. | $ | | $ | ( | $ | ( | |||
Foreign |
| |
| |
| ( | |||
Total | $ | | $ | ( | $ | ( | |||
The income (loss) before income taxes above includes the pre- and post-IPO periods for the year ended December 31, 2021.
Prior to the IPO, the Company, through its subsidiary, Enfusion Ltd. LLC, was structured as a partnership and therefore, was primarily subject to foreign income taxes and generally not subject to U.S. income taxes.
Year Ended December 31, | |||||||||
2023 |
| 2022 | 2021 | ||||||
Current: | |||||||||
U.S. Federal | $ | ( | $ | — | $ | — | |||
State & Local | | — | — | ||||||
Foreign | | | | ||||||
Total Current Income Tax Expense | | | | ||||||
Deferred: | |||||||||
U.S. Federal | — | — | — | ||||||
State & Local | — | — | — | ||||||
Foreign | ( | ( | | ||||||
Total Deferred Income Tax Expense (Benefit) |
| ( |
| ( |
| | |||
Total | $ | | $ | | $ | | |||
F-27
A reconciliation of income taxes computed at the U.S. federal statutory income tax rate of
Year Ended December 31, | ||||||||||
2023 |
| 2022 | 2021 | |||||||
At U.S. Federal Statutory Tax Rate | | % | | % | | % | ||||
State Tax, Net of Federal Benefit | | % | | % | | % | ||||
Non-controlling Interest | ( | % | ( | % | ( | % | ||||
Foreign Branch Taxes | | % | ( | % | ( | % | ||||
Stock-Based Compensation | | % | ( | % | ( | % | ||||
Foreign Rate Differential | | % | | % | — | % | ||||
Valuation Allowance | ( | % | | % | ( | % | ||||
Change in Tax Rates | | % | ( | % | — | % | ||||
Return to Provision | | % | | % | | % | ||||
Unrecognized Tax Benefit | | % | — | % | — | % | ||||
Pass-through Loss (Income) | — | % | — | % | | % | ||||
Other | | % | ( | % | — | % | ||||
Total | | % | ( | % | ( | % | ||||
The Company’s effective tax rate for the years ended December 31, 2023, 2022, and 2021 was
State Tax, Net of Federal Benefit
The Company’s state taxes, net of federal benefit, include the effects of state taxes currently payable and changes in state deferred income taxes, exclusive of the valuation allowance. The significant increase in state taxes, net of federal benefit, in the year ended December 31, 2023, is primarily due to the U.S. state deferred tax effect of non-deductible equity-based compensation and related tax deduction deficiencies. For the years ended December 31, 2023, 2022, and 2021, the Company recorded state tax expenses (benefit) of $
Noncontrolling Interest
The Company’s sole material asset is a financial interest in Enfusion Ltd. LLC. While the Company consolidates Enfusion Ltd. LLC for financial reporting purposes, the Company will only be taxed on (benefit from) its share of earnings (losses) of Enfusion Ltd. LLC not attributed to the noncontrolling interest holders. Since noncontrolling interest holders will continue to bear (benefit from) their share of income tax expense (benefit) on its allocable earnings (losses) of Enfusion Ltd. LLC, that share of income tax expense (benefit) is not reported by the Company in its consolidated financial statements. The U.S. federal tax (benefit) expense associated with the allocation of earnings (losses) to noncontrolling interest holders for the years ended December 31, 2023, 2022, and 2021 was $(
Stock-Based Compensation
As a result of the Reorganization Transactions, a significant portion of the Company’s certain stock-based compensation expenses will be allocated to the noncontrolling interest holders and therefore will not be deductible to the Company. The remaining portion of these expenses will be subject to the tax deduction limitations as established by the U.S. tax law in respect of the executive compensation. The Company recognizes an excess tax benefit or tax deficiency when the deduction for the stock-based compensation expense of a stock award for tax purposes differs from the cumulative stock-based compensation expense recognized in the financial statements. The U.S. federal tax impact of non-deductible stock-based compensation, including tax deficiencies, for the years ended December 31, 2023, 2022, and 2021 was $
F-28
Valuation Allowance
The Company’s net deferred tax benefit (expense) for the years ended December 31, 2023, 2022, and 2021 of $(
Foreign Branch Taxes
The Company has foreign operations that are treated as branches for U.S. tax purposes and are also subject to income taxes in those foreign jurisdictions. For the years ended December 31, 2023, 2022, and 2021, the Company recorded $
Return to Provision
For the years ended December 31, 2023, 2022, and 2021 the Company recorded a tax expense (benefit) of $
Change in Tax Rates
For the years ended December 31, 2023, and 2022, the Company reduced its deferred tax assets by $
Deferred Tax Assets
The components of deferred tax assets and liabilities are as follows (in thousands):
December 31, | ||||||
2023 |
| 2022 | ||||
Deferred Tax Assets: | ||||||
Investment in Enfusion Ltd. LLC | $ | | $ | | ||
Stock-Based Compensation | | | ||||
Net Operating Losses | | | ||||
Other | | | ||||
Total Deferred Tax Assets | | | ||||
Valuation Allowance | ( | ( | ||||
Total Deferred Tax Assets Net of Valuation Allowance | — | | ||||
Deferred Tax Liabilities: | ||||||
Property and Equipment | ( | ( | ||||
Total Deferred Tax Liabilities |
| ( |
| ( | ||
Net Deferred Tax Assets | $ | ( | $ | | ||
The Company’s deferred tax assets are primarily comprised of basis differences in the investment in Enfusion Ltd. LLC, stock-based compensation, and tax attribute carryforwards. The ultimate realization of deferred tax assets is dependent upon the generation of sufficient future taxable income to realize the deferred tax assets on the Company’s income tax returns. Management determined that it is more likely than not going that the Company’s deferred tax assets will not be realized due to the Company’s three-year cumulative loss position and the generation of future taxable income is uncertain.
F-29
The changes in the Company’s valuation allowance for deferred tax assets were as follows (in thousands):
Year Ended December 31, 2021 | $ | | |
Charged to Income Tax Expense | ( | ||
Charged to Stockholders' Equity |
| | |
Year Ended December 31, 2022 | $ | | |
Charged to Income Tax Expense | ( | ||
Charged to Stockholders' Equity | | ||
Year Ended December 31, 2023 | $ | |
As of December 31, 2023 and 2022, the Company had U.S. federal net operating losses of $
As of December 31, 2023, the Company is not indefinitely reinvested on undistributed earnings from its foreign operations. Due to the Company's structure, the foreign operations do not qualify for the indefinite reinvestment exceptions under ASC 740-30 as the earnings from the foreign operations are subject to U.S. taxation. However, the exception may still apply to foreign withholding taxes due to dividend distributions of earnings from the Company's foreign affiliates. The Company has no plans to make distributions from its foreign operations in the future and, therefore, a deferred tax liability has not been recognized. A determination of the unrecognized deferred taxes is not practicable.
A summary of the Company’s unrecognized tax benefits are as follows (in thousands):
Year Ended December 31, | |||||||||
2023 |
| 2022 | 2021 | ||||||
Beginning balance | $ | | $ | | $ | — | |||
Increases for tax positions related to the current year | — | | | ||||||
Increases (decreases) for tax positions of prior years |
| |
| |
| | |||
Expiration of statute of limitations | ( | | — | ||||||
Ending balance | $ | | $ | | $ | | |||
Interest and penalties | | | | ||||||
The Company’s policy is to include interest and penalties related to unrecognized tax benefits in income tax expense. As of December 31, 2023, the Company accrued has $
The Company files tax returns in the United States and various foreign jurisdictions. The Company is currently being audited in the U.S. and India. However, the Company is no longer subject to examination by those taxing authorities with respect to the years ended prior to 2017. Although the outcome of tax audits is always uncertain and could result in significant cash tax payments, the Company does not believe the outcome of these audits will have a material adverse effect on its consolidated financial position or results of operations.
Tax Receivable Agreement
The Company expects to obtain an increase in its share of the tax basis in the net assets of Enfusion Ltd. LLC when Common Units are redeemed from or exchanged by the Pre-IPO Common Unitholders. The Company intends to treat any redemptions and exchanges of Common Units as direct purchases of Common Units for U.S. income tax purposes. These increases in tax basis may reduce the amounts that the Company would otherwise pay in the future to U.S. federal and state tax authorities. They may also decrease gains (or increase losses) on future dispositions of certain capital assets to the extent tax basis is allocated to those capital assets.
F-30
In connection with the IPO, the Company entered into the Tax Receivable Agreement with Enfusion Ltd. LLC, the Pre-IPO Owners that will provide for the payment by the Company to the Pre-IPO Owners of
In the years ended December 31, 2023, and 2022, the Company purchased an aggregate of
As of December 31, 2023 and 2022, the Company has not recorded a liability under the Tax Receivable Agreement related to the tax benefits originating from the Reorganization Transactions, IPO, and subsequent purchase of Common Units, as it is not probable that the Company will realize such tax benefits. To the extent the Company had determined that it would have been able to realize the tax benefits associated with the basis adjustments, it would have recorded a liability under the Tax Receivable Agreement of $
The amounts payable under the Tax Receivable Agreement will vary depending upon a number of factors, including the amount, character, and timing of the taxable income of the Company in the future. Should the Company determine that the Tax Receivable Agreement liability be considered probable at a future date based on new information, any changes will be recorded at that time.
Note 14 Related Party Transactions
Parties are considered to be related if one party has the ability to control or exercise significant influence over the other party in making financial or operating decisions. Since transactions with related parties may raise potential or actual conflicts of interest between the related party and the Company, upon the completion of the IPO, the Company implemented a related party transaction policy that requires related party transactions to be reviewed and approved by its nominating and corporate governance committee.
On June 15, 2023, the Company sold
In the first quarter of 2023, the Company received approximately $
F-31
obtained the right to this refund as a result of the merger of FTV Enfusion with and into one of the Company’s subsidiaries as part of the Reorganization Transactions (which did not take into account the value of the tax refund). On June 27, 2023, the Company distributed approximately $
Note 15 Subsequent Events
Share Exchange
On January 4, 2024, a Pre-IPO Common Unitholder delivered an exchange notice pursuant to Article XII of the LLC Operating Agreement. Pursuant to the terms of the LLC Operating Agreement, on January 11, 2024, the Pre-IPO Common Unitholder surrendered
F-32
Item 9. Changes in and Disagreements with Accountants on Accounting and Financial Disclosure
None.
Item 9A. Controls and Procedures
Evaluation of Disclosure Controls and Procedures
We carried out an evaluation required by the Exchange Act, under the supervision and with the participation of our Chief Executive Officer and Chief Financial Officer, of the effectiveness of the design and operation of our disclosure controls and procedures, as defined in Rule 13a-15(e) of the Exchange Act, as of December 31, 2023. Based on this evaluation, our Chief Executive Officer and Chief Financial Officer concluded that, as of December 31, 2023, our disclosure controls and procedures were effective to provide reasonable assurance that information required to be disclosed by us in the reports that we file or submit under the Exchange Act is recorded, processed, summarized, and reported within the time periods specified in the SEC’s rules and forms and to provide reasonable assurance that such information is accumulated and communicated to our management, including our Chief Executive Officer and Chief Financial Officer, as appropriate to allow timely decisions regarding required disclosure.
Management's Report on Internal Control over Financial Reporting
Our management is responsible for establishing and maintaining adequate internal control over financial reporting (as defined in Rules 13a-15(f) and 15d-15(f) under the Exchange Act).
Our management, with the participation of our Chief Executive Officer and Chief Financial Officer and the oversight of our audit committee, has evaluated the effectiveness of our internal control over financial reporting as of December 31, 2023. In assessing the effectiveness of our internal control over financial reporting, our management used the framework established in Internal Control Integrated Framework (2013) issued by the Committee of Sponsoring Organizations of the Treadway Commission (COSO). Based on that evaluation, our management has concluded that our internal control over financial reporting was effective as of December 31, 2023.
Our independent registered public accounting firm was not required to perform an evaluation of our internal control over financial reporting as of December 31, 2023 because as an “emerging growth company” we are exempt from Section 404(b) of the Sarbanes-Oxley Act.
Changes in Internal Control over Financial Reporting
There were no changes in our internal control over financial reporting during the quarter ended December 31, 2023 that materially affected, or are reasonably likely to materially affect, our internal control over financial reporting.
Limitations on Effectiveness of Controls and Procedures
Our management, including our Chief Executive Officer and Chief Financial Officer, does not expect that our internal controls will prevent or detect all errors and all fraud. A control system, no matter how well designed and operated, can provide only reasonable, not absolute, assurance that the objectives of the control system are met. Further, the design of a control system must reflect the fact that there are resource constraints, and the benefits of controls must be considered relative to their costs. Because of the inherent limitations in all control systems, no evaluation of internal controls can provide absolute assurance that all control issues and instances of fraud, if any, have been detected. Also, any evaluation of the effectiveness of controls in future periods are subject to the risk that those internal controls may become inadequate because of changes in business conditions, or that the degree of compliance with the policies or procedures may deteriorate.
59
Item 9B. Other Information
Trading Arrangements
Item 9C. Disclosure Regarding Foreign Jurisdictions that Prevent Inspections
Not applicable.
PART III
Item 10. Directors, Executive Officers, and Corporate Governance
The information required by this item is incorporated by reference to the definitive Proxy Statement for our 2024 Annual Meeting of Stockholders, which will be filed with the SEC, no later than 120 days after December 31, 2023.
Item 11. Executive Compensation
The information required by this item is incorporated by reference to the definitive Proxy Statement for our 2024 Annual Meeting of Stockholders, which will be filed with the SEC, no later than 120 days after December 31, 2023.
Item 12. Security Ownership of Certain Beneficial Owners and Management and Related Stockholder Matters
The information required by this item is incorporated by reference to the definitive Proxy Statement for our 2024 Annual Meeting of Stockholders, which will be filed with the SEC, no later than 120 days after December 31, 2023.
Item 13. Certain Relationships and Related Transactions, and Director Independence
The information required by this item is incorporated by reference to the definitive Proxy Statement for our 2024 Annual Meeting of Stockholders, which will be filed with the SEC, no later than 120 days after December 31, 2023.
Item 14. Principal Accountant’s Fees and Services
The information required by this item is incorporated by reference to the definitive Proxy Statement for our 2024 Annual Meeting of Stockholders, which will be filed with the SEC, no later than 120 days after December 31, 2023.
PART IV
Item 15. Exhibits and Financial Statement Schedules
The following documents are filed as a part of this Annual Report on Form 10-K:
(a) Financial Statements
Our consolidated financial statements are listed in the “Index to Consolidated Financial Statements” under Part II, Item 8 of this Annual Report on Form 10-K.
60
(b) Financial Statement Schedules
All financial statement schedules are omitted because the information called for is not required or is shown either in the consolidated financial statements or in the notes thereto.
(c) Exhibits
The documents listed in the exhibit index of this Annual Report on Form 10-K are incorporated by reference or are filed with this Annual Report on Form 10-K, in each case as indicated herein (numbered in accordance with Item 601 of Regulation S-K).
Item 16. Form 10-K Summary
None.
61
Exhibit |
| Description |
3.1 | ||
3.2 | ||
4.1 | ||
4.2 | ||
4.3 | ||
10.1# | ||
10.2 | ||
10.3 | ||
10.4# | ||
10.5# | ||
10.6# | ||
10.7*#† | ||
10.8*#† | ||
10.9#† | ||
10.10*#† | ||
10.11*#† | ||
10.12*#† | ||
10.13† |
62
10.14 | ||
21.1* | ||
23.1* | Consent of Ernst & Young LLP, independent registered public accounting firm. | |
24.1* | ||
31.1* | ||
31.2* | ||
32.1** | ||
32.2** | ||
97* | ||
101.INS* | Inline XBRL Instance Document. | |
101.SCH* | Inline XBRL Taxonomy Extension Schema Document. | |
101.CAL* | Inline XBRL Taxonomy Extension Calculation Linkbase Document. | |
101.DEF* | Inline XBRL Taxonomy Extension Definition Linkbase Document. | |
101.LAB* | Inline XBRL Taxonomy Extension Labels Linkbase Document. | |
101.PRE* | Inline XBRL Taxonomy Extension Presentation Linkbase Document. | |
104* | Cover Page Interactive Data File (formatted as inline XBRL and contained in Exhibit 101). |
63
SIGNATURES
Pursuant to the requirements of Section 13 or 15(d) of the Securities Exchange Act of 1934, as amended, the registrant has duly caused this report to be signed on its behalf by the undersigned, thereunto duly authorized, in Chicago, Illinois, on March 12, 2024.
ENFUSION, INC. | ||
By: | /s/ Oleg Movchan | |
Oleg Movchan Chief Executive Officer (Principal Executive Officer) | ||
By: | /s/ Bradley Herring | |
Bradley Herring Chief Financial Officer (Principal Financial Officer) | ||
POWER OF ATTORNEY
KNOW ALL PERSONS BY THESE PRESENTS, that each person whose signature appears below constitutes and appoints Oleg Movchan and Bradley Herring, and each of them, as his or her true and lawful attorney-in-fact and agent with full power of substitution and resubstitution, for such individual in any and all capacities, to sign any and all amendments to this Annual Report on Form 10-K, and to file the same, with all exhibits thereto and other documents in connection therewith, with the Securities and Exchange Commission, granting unto said attorneys-in-fact and agents, and each of them, full power and authority to do and perform each and every act and thing requisite and necessary to be done in connection therewith, as fully for all intents and purposes as he or she might or could do in person, hereby ratifying and confirming all that said attorneys-in-fact and agents, or any of them, or the individual's substitute, may lawfully do or cause to be done by virtue hereof.
64
Pursuant to the requirements of the Securities Exchange Act of 1934, as amended, this report has been signed below on March 12, 2024 by the following persons on behalf of the registrant and in the capacities and on the dates indicated:
Signature |
| Title | Date |
/s/ Oleg Movchan | Chief Executive Officer and Director | March 12, 2024 | |
Oleg Movchan | (Principal Executive Officer) | ||
/s/ Bradley Herring | Chief Financial Officer | March 12, 2024 | |
Bradley Herring | (Principal Financial Officer) | ||
/s/ Valeria F. Gutowski | Chief Accounting Officer | March 12, 2024 | |
Valeria Gutowski | (Principal Accounting Officer) | ||
/s/ Michael Spellacy | Chair and Director | March 12, 2024 | |
Michael Spellacy | |||
/s/ Bradford E. Bernstein | Director | March 12, 2024 | |
Bradford E. Bernstein | |||
/s/ Kathleen Traynor DeRose | Director | March 12, 2024 | |
Kathleen Traynor DeRose | |||
/s/ Jan R. Hauser | Director | March 12, 2024 | |
Jan R. Hauser | |||
/s/ Lawrence Leibowitz | Director | March 12, 2024 | |
Lawrence Leibowitz | |||
/s/ Roy Luo | Director | March 12, 2024 | |
Roy Luo | |||
/s/ Deirdre Somers | Director | March 12, 2024 | |
Deirdre Somers |
65