UNITED STATES SECURITIES AND EXCHANGE COMMISSION
Washington, D.C. 20549
FORM 10-Q
For the quarterly period ended March 31, 2024
Commission File Number 001-33289

ENSTAR GROUP LIMITED
(Exact name of Registrant as specified in its charter)
| BERMUDA | N/A | ||||
| (State or other jurisdiction of incorporation or organization) | (I.R.S. Employer Identification No.) | ||||
(Address of principal executive offices, including zip code)
Registrant’s telephone number, including area code: (441 ) 292-3645
Securities registered pursuant to Section 12(b) of the Act:
| Title of Each Class | Trading Symbol(s) | Name of Each Exchange on Which Registered | |||||||||
| LLC | |||||||||||
| LLC | |||||||||||
| Fixed-to-Floating Rate Perpetual Non-Cumulative Preferred Share, Series D, Par Value $1.00 Per Share | |||||||||||
| LLC | |||||||||||
| Perpetual Non-Cumulative Preferred Share, Series E, Par Value $1.00 Per Share | |||||||||||
Indicate by check mark whether the registrant (1) has filed all reports required to be filed by Section 13 or 15(d) of the Securities Exchange Act of 1934 during the preceding 12 months (or for such shorter period that the registrant was required to file such reports), and (2) has been subject to such filing requirements for the past 90 days. Yes ☒ No ☐
Indicate by check mark whether the registrant has submitted electronically every Interactive Data File required to be submitted pursuant to Rule 405 of Regulation S-T during the preceding 12 months (or for such shorter period that the registrant was required to submit such files). Yes ☒ No ☐
Indicate by check mark whether the registrant is a large accelerated filer, an accelerated filer, a non-accelerated filer, a smaller reporting company or an emerging growth company. See the definitions of “large accelerated filer,” “accelerated filer,” “smaller reporting company” and "emerging growth company" in Rule 12b-2 of the Exchange Act.
| ☒ | Accelerated filer | ☐ | Non-accelerated filer | ☐ | Smaller reporting company | Emerging growth company | |||||||||||||||||||||||||||||||||||
If an emerging growth company, indicate by check mark if the registrant has elected not to use the extended transition period for complying with any new or revised financial accounting standards provided pursuant to Section 13(a) of the Exchange Act. ☐
Indicate by check mark whether the registrant is a shell company (as defined in Rule 12b-2 of the Exchange Act). Yes ☐ No ☒
As at May 1, 2024, the registrant had outstanding 15,229,358 voting ordinary shares, par value $1.00 per share.
1
Enstar Group Limited
Quarterly Report on Form 10-Q
For the Period Ended March 31, 2024
Table of Contents
| Page | ||||||||
| PART I | ||||||||
| Item 1. | ||||||||
| Item 2. | ||||||||
| Item 3. | ||||||||
| Item 4. | ||||||||
| PART II | ||||||||
| Item 1. | ||||||||
| Item 1A. | ||||||||
| Item 2. | ||||||||
| Item 3. | ||||||||
| Item 4. | ||||||||
| Item 5. | ||||||||
| Item 6. | ||||||||
2
GLOSSARY OF KEY TERMS
| A&E | Asbestos and environmental | |||||||
| Acquisition costs | Costs that are directly related to the successful efforts of acquiring new insurance contracts or renewing existing insurance contracts, and which principally consist of incremental costs such as: commissions, brokerage expenses, premium taxes and other fees incurred at the time that a contract or policy is issued. | |||||||
| ADC | Adverse development cover – A retrospective reinsurance arrangement that will insure losses in excess of an established reserve and provide protection up to a contractually agreed amount. | |||||||
| Adjusted RLE | Adjusted run-off liability earnings - Non-GAAP financial measure calculated by dividing adjusted prior period development by average adjusted net loss reserves. See “Non-GAAP Financial Measures” for reconciliation. | |||||||
| Adjusted ROE | Adjusted return on equity - Non-GAAP financial measure calculated by dividing adjusted operating income (loss) attributable to Enstar ordinary shareholders by adjusted opening Enstar ordinary shareholders’ equity. See “Non-GAAP Financial Measures” for reconciliation. | |||||||
| Adjusted TIR | Adjusted total investment return - Non-GAAP financial measure calculated by dividing adjusted total investment return by average adjusted total investable assets. See “Non-GAAP Financial Measures” for reconciliation. | |||||||
| AFS | Available-for-sale | |||||||
| Allianz | Allianz SE | |||||||
| AmTrust | AmTrust Financial Services, Inc. | |||||||
Annualized | Calculation of the quarterly result or year-to-date result multiplied by four and then divided by the number of quarters elapsed within the applicable year-to-date period. | |||||||
| AOCI | Accumulated other comprehensive income | |||||||
APIC | Additional Paid-in Capital | |||||||
| ASC | Accounting Standards Codification | |||||||
| ASU | Accounting Standards Update | |||||||
| Arden | Arden Reinsurance Company Ltd. | |||||||
| Atrium | Atrium Underwriting Group Limited | |||||||
bps | Basis point(s) | |||||||
| BMA | Bermuda Monetary Authority | |||||||
| BSCR | Bermuda Solvency Capital Requirement | |||||||
| BVPS | Book value per ordinary share - GAAP financial measure calculated by dividing Enstar ordinary shareholders’ equity by the number of ordinary shares outstanding. | |||||||
| Cavello | Cavello Bay Reinsurance Limited, a wholly-owned subsidiary | |||||||
| Citco | Citco III Limited | |||||||
| CLO | Collateralized loan obligation | |||||||
| Core Specialty | Core Specialty Insurance Holdings, Inc. | |||||||
| DCo | DCo LLC | |||||||
| Defendant A&E liabilities | Defendant asbestos and environmental liabilities - Non-insurance liabilities relating to amounts for indemnity and defense costs for pending and future claims, as well as amounts for environmental liabilities associated with properties. | |||||||
| DCA | Deferred charge asset - The amount by which estimated ultimate losses payable exceed the consideration received at the inception of a retroactive reinsurance agreement and that are subsequently amortized over the estimated loss settlement period. | |||||||
DGL | Deferred gain liability - The amount by which consideration received exceeds estimated ultimate losses payable at the inception of a retroactive reinsurance agreement and that are subsequently amortized over the estimated loss settlement period. | |||||||
| EB Trust | Enstar Group Limited Employee Benefit Trust | |||||||
| Enhanzed Re | Enhanzed Reinsurance Ltd. | |||||||
| Enstar | Enstar Group Limited and its consolidated subsidiaries | |||||||
3
| Enstar Finance | Enstar Finance LLC | |||||||
| Exchange Transaction | The exchange of a portion of our indirect interest in Northshore for all of the Trident V Funds’ indirect interest in StarStone U.S. | |||||||
| FAL | Funds at Lloyd's - A deposit in the form of cash, securities, letters of credit or other approved capital instrument that satisfies the capital requirement to support the Lloyd's syndicate underwriting capacity. | |||||||
FDBVPS | Fully diluted book value per ordinary share - Non-GAAP financial measure calculated by dividing Enstar ordinary shareholders’ equity by the number of ordinary shares outstanding, adjusted for equity awards granted and not yet vested (similar to the calculation of diluted earnings per share). See “Non-GAAP Financial Measures” in Item 7 for reconciliation. | |||||||
| Funds held | The account created with premium due to the reinsurer pursuant to the reinsurance agreement, the balance of which is credited with investment income and losses paid are deducted. | |||||||
| Funds held by reinsured companies | Funds held, as described above, where we receive a fixed crediting rate of return or other contractually agreed return on the assets held. | |||||||
| Funds held - directly managed | Funds held, as described above, where we receive the actual investment portfolio return on the assets held. | |||||||
| Future policyholder benefits | The liability relating to life reinsurance contracts, which are based on the present value of anticipated future cash flows and mortality rates. | |||||||
| IBNR | Incurred but not reported - The estimated liability for unreported claims that have been incurred, as well as estimates for the possibility that reported claims may settle for amounts that differ from the established case reserves as well as the potential for closed claims to re-open. | |||||||
| Investable assets | The sum of total investments, cash and cash equivalents, restricted cash and cash equivalents and funds held | |||||||
| JSOP | Joint Share Ownership Plan | |||||||
| LAE | Loss adjustment expenses | |||||||
| Lloyd's | This term may refer to either the society of individual and corporate underwriting members that pool and spread risks as members of one or more syndicates, or the Corporation of Lloyd’s, which regulates and provides support services to the Lloyd’s market | |||||||
| LOC | Letters of credit | |||||||
| LPT | Loss Portfolio Transfer - Retroactive reinsurance transaction in which loss obligations that are already incurred are ceded to a reinsurer, subject to any stipulated limits | |||||||
Monument Midco | Monument Midco Limited, a wholly owned subsidiary of Monument Re | |||||||
| Monument Re | Monument Insurance Group Limited | |||||||
| Morse TEC | Morse TEC LLC | |||||||
| NAV | Net asset value | |||||||
| NCI | Noncontrolling interests | |||||||
| New business | Material transactions, which generally take the form of reinsurance or direct business transfers, or business acquisitions. | |||||||
| Northshore | Northshore Holdings Limited | |||||||
| OLR | Outstanding loss reserves - Provisions for claims that have been reported and accrued but are unpaid at the balance sheet date. | |||||||
| Parent Company | Enstar Group Limited, excluding its consolidated subsidiaries | |||||||
| pp | Percentage point(s) | |||||||
| PPD | Prior period development - Changes to loss estimates recognized in the current calendar year that relate to loss reserves established in previous calendar years. | |||||||
| Private equity funds | Investments in limited partnerships and limited liability companies | |||||||
QBE | QBE Insurance Group Limited | |||||||
RACQ | RACQ Insurance Limited | |||||||
| Reinsurance to close (RITC) | A business transaction to transfer estimated future liabilities attached to a given year of account of a Lloyd's syndicate into a later year of account of either the same or different Lloyd's syndicate in return for a premium. | |||||||
4
| Reserves for losses and LAE | Management's best estimate of the ultimate cost of settling losses as of the balance sheet date. This includes OLR and IBNR. | |||||||
| Retroactive reinsurance | Contracts that provide indemnification for losses and LAE with respect to past loss events. | |||||||
| RLE | Run-off liability earnings – GAAP-based financial measure calculated by dividing prior period development by average net loss reserves. | |||||||
| RNCI | Redeemable noncontrolling interests | |||||||
| ROE | Return on equity - GAAP-based financial measure calculated by dividing net income (loss) attributable to Enstar ordinary shareholders by opening Enstar ordinary shareholders’ equity | |||||||
| Run-off | A line of business that has been classified as discontinued by the insurer that initially underwrote the given risk | |||||||
| Run-off portfolio | A group of insurance policies classified as run-off. | |||||||
| SEC | U.S. Securities and Exchange Commission | |||||||
| SGL No. 1 | SGL No. 1 Limited | |||||||
| StarStone International | StarStone's non-U.S. operations | |||||||
| StarStone U.S. | StarStone U.S. Holdings, Inc. and its subsidiaries | |||||||
| Stone Point | Stone Point Capital LLC | |||||||
| TIR | Total investment return - GAAP financial measure calculated by dividing total investment return, including other comprehensive income, for the applicable period by average total investable assets | |||||||
| Trident V Funds | Trident V, L.P., Trident V Parallel Fund, L.P. and Trident V Professionals Fund, L.P. | |||||||
| U.S. GAAP | Accounting principles generally accepted in the United States of America | |||||||
| ULAE | Unallocated loss adjustment expenses - Loss adjustment expenses relating to run-off costs for the estimated payout of the run-off, such as internal claim management or associated operational support costs. | |||||||
Unearned premium | The unexpired portion of policy premiums that will be earned over the remaining term of the insurance contract. | |||||||
| VIE | Variable interest entities | |||||||
5
CAUTIONARY STATEMENT REGARDING FORWARD-LOOKING STATEMENTS
This quarterly report and the documents incorporated by reference herein contain statements that constitute "forward-looking statements" within the meaning of Section 21E of the Securities Exchange Act of 1934, as amended, or the Exchange Act, with respect to our financial condition, results of operations, business strategies, operating efficiencies, competitive positions, growth opportunities, plans and objectives of our management, as well as the markets for our securities and the insurance and reinsurance sectors in general.
Statements that include words such as "estimate," "project," "plan," "intend," "expect," "anticipate," "believe," "would," "should," "could," "seek," "may" and similar statements of a future or forward-looking nature identify forward-looking statements for purposes of the federal securities laws or otherwise.
All forward-looking statements are necessarily estimates or expectations, and not statements of historical fact, reflecting the best judgment of our management and involve a number of risks and uncertainties that could cause actual results to differ materially from those suggested by the forward-looking statements.
These forward looking statements should, therefore, be considered in light of various important factors, including those set forth in this report and in our Annual Report on Form 10-K for the year ended December 31, 2023, which could cause actual results to differ materially from those suggested by the forward-looking statements. These risk factors include:
•the adequacy of our loss reserves and the need to adjust such reserves as claims develop over time, including due to the impact of emerging claim and coverage issues and disputes that could impact reserve adequacy;
•risks relating to our acquisitions, including our ability to evaluate opportunities, successfully price acquisitions, address operational challenges, support our planned growth and assimilate acquired portfolios and companies into our internal control system in order to maintain effective internal controls, provide reliable financial reports and prevent fraud;
•risks relating to climate change and its potential impact on the returns from our run-off business and our investments;
•changes in tax laws or regulations applicable to us or our subsidiaries, including the Bermuda Corporate Income Tax, or the risk that we or one of our non-U.S. subsidiaries become subject to significant, or significantly increased, income taxes in the U.S. or elsewhere;
•the risk that U.S. persons who own our ordinary shares might become subject to adverse U.S. tax consequences as a result of related person insurance income;
•risks relating to our ability to obtain regulatory approvals, including the timing, terms and conditions of any such approvals, and to satisfy other closing conditions in connection with our acquisition agreements, which could affect our ability to complete acquisitions;
•risks relating to the variability of statutory capital requirements and the risk that we may require additional capital in the future, which may not be available or may be available only on unfavorable terms;
•the risk that our reinsurance subsidiaries may not be able to provide the required collateral to ceding companies pursuant to their reinsurance contracts, including through the use of letters of credit;
•risks relating to the availability and collectability of our ceded reinsurance;
•the ability of our subsidiaries to distribute funds to us and the resulting impact on our liquidity;
•losses due to foreign currency exchange rate fluctuations;
•the risk that the value of our investment portfolios and the investment income that we receive from these portfolios may decline materially as a result of market fluctuations and economic conditions, including those related to interest rates, credit spreads and equity prices (including the risk that we may realize losses related to declines in the value of our investments portfolios if we elect to, or are required to, sell investments with unrealized losses);
•risks relating to our ability to structure our investments in a manner that recognizes our liquidity needs;
•risks relating to our strategic investments in alternative asset classes and joint ventures, which are illiquid and may be volatile;
6
•risks relating to our ability to accurately value our investments, which requires methodologies, estimates and assumptions that can be highly subjective, and the inaccuracy of which could adversely affect our financial condition;
•risks relating to our liquidity demands and the structure of our investment portfolios, which may adversely affect the performance of our investment portfolio and financial results;
•risks relating to the complex regulatory environment in which we operate, including that ongoing or future industry regulatory developments will disrupt our business, affect the ability of our subsidiaries to operate in the ordinary course or to make distributions to us, or mandate changes in industry practices in ways that increase our costs, decrease our revenues or require us to alter aspects of the way we do business;
•risks relating to laws and regulations regarding sanctions and foreign corrupt practices, the violation of which could adversely affect our financial condition and results of operations;
•loss of key personnel;
•the risk that some of our directors, large shareholders and their affiliates have interests that can create conflicts of interest through related party transactions;
•the risk that outsourced providers could breach their obligations to us which could adversely affect our business and results of operations;
•operational risks, including cybersecurity events, external hazards, human failures or other difficulties with our information technology systems that could disrupt our business or result in the loss of critical and confidential information, increased costs; and
•risks relating to the ownership of our shares resulting from certain provisions of our bye-laws and our status as a Bermuda company.
The factors listed above should not be construed as exhaustive and should be read in conjunction with the Risk Factors that are included in our Annual Report on Form 10-K for the year ended December 31, 2023. We undertake no obligation to publicly update or review any forward-looking statement, whether to reflect any change in our expectations with regard thereto, or as a result of new information, future developments or otherwise, except as required by law.
7
PART I — FINANCIAL INFORMATION
ITEM 1. FINANCIAL STATEMENTS
| CONDENSED CONSOLIDATED FINANCIAL STATEMENTS | Page | ||||
Unaudited Condensed Consolidated Statements of Operations for the three months ended March 31, 2024 and 2023 | |||||
Unaudited Condensed Consolidated Statements of Cash Flows for the three months ended March 31, 2024 and 2023 | |||||
Enstar Group Limited | First Quarter 2024 | Form 10-Q 8
ENSTAR GROUP LIMITED
UNAUDITED CONDENSED CONSOLIDATED BALANCE SHEETS
As of March 31, 2024 and December 31, 2023
| March 31, 2024 | December 31, 2023 | ||||||||||
| (expressed in millions of U.S. dollars, except share data) | |||||||||||
| ASSETS | |||||||||||
| Short-term investments, trading, at fair value | $ | $ | |||||||||
Short-term investments, available-for-sale, at fair value (amortized cost: 2024 — $ | |||||||||||
| Fixed maturities, trading, at fair value | |||||||||||
Fixed maturities, available-for-sale, at fair value (amortized cost: 2024 — $ | |||||||||||
| Funds held | |||||||||||
Equities, at fair value (cost: 2024 — $ | |||||||||||
Other investments, at fair value (includes consolidated variable interest entity: 2024 - $ | |||||||||||
| Equity method investments | |||||||||||
Cash and cash equivalents (includes consolidated variable interest entity: 2024 — $ | |||||||||||
| Restricted cash and cash equivalents | |||||||||||
| Accrued interest receivable | |||||||||||
Reinsurance balances recoverable on paid and unpaid losses (net of allowance: 2024 — $ | |||||||||||
| Other assets | |||||||||||
| TOTAL ASSETS | $ | $ | |||||||||
| LIABILITIES | |||||||||||
| $ | $ | ||||||||||
| Insurance and reinsurance balances payable | |||||||||||
| Debt obligations | |||||||||||
Other liabilities (includes consolidated variable interest entity: 2024 — $ | |||||||||||
| TOTAL LIABILITIES | |||||||||||
Voting ordinary shares (par value $ | |||||||||||
| Preferred Shares: | |||||||||||
Series C Preferred Shares (issued and held in treasury 2024 and 2023: | |||||||||||
Series D Preferred Shares (issued and outstanding 2024 and 2023: | |||||||||||
Series E Preferred Shares (issued and outstanding 2024 and 2023: | |||||||||||
| Treasury shares, at cost: | |||||||||||
Series C Preferred shares (2024 and 2023: | ( | ( | |||||||||
Joint Share Ownership Plan (voting ordinary shares, held in trust 2024 and 2023: | ( | ( | |||||||||
| Additional paid-in capital | |||||||||||
| Accumulated other comprehensive loss | ( | ( | |||||||||
| Retained earnings | |||||||||||
| Total Enstar Shareholders’ Equity | |||||||||||
| TOTAL SHAREHOLDERS’ EQUITY | |||||||||||
| TOTAL LIABILITIES AND SHAREHOLDERS’ EQUITY | $ | $ | |||||||||
Enstar Group Limited | First Quarter 2024 | Form 10-Q 9
ENSTAR GROUP LIMITED
UNAUDITED CONDENSED CONSOLIDATED STATEMENTS OF OPERATIONS
For the Three Months Ended March 31, 2024 and 2023
| Three Months Ended March 31, | |||||||||||
| 2024 | 2023 | ||||||||||
| (expressed in millions of U.S. dollars, except share and per share data) | |||||||||||
| REVENUES | |||||||||||
| Net premiums earned | $ | $ | |||||||||
| Net investment income | |||||||||||
| Net realized losses | ( | ( | |||||||||
| Fair value changes in trading securities, funds held and other investments | |||||||||||
| Other income | |||||||||||
| Total revenues | |||||||||||
| EXPENSES | |||||||||||
| Net incurred losses and loss adjustment expenses | |||||||||||
| Current period | |||||||||||
| Prior periods | ( | ( | |||||||||
| Total net incurred losses and loss adjustment expenses | ( | ||||||||||
| Amortization of net deferred charge assets | |||||||||||
| Acquisition costs | |||||||||||
| General and administrative expenses | |||||||||||
| Interest expense | |||||||||||
| Net foreign exchange gains | ( | ( | |||||||||
| Total expenses | |||||||||||
| INCOME BEFORE INCOME TAXES | |||||||||||
| Income tax (expense) benefit | ( | ||||||||||
| (Loss) income from equity method investments | ( | ||||||||||
| NET INCOME | |||||||||||
| Net income attributable to noncontrolling interests | ( | ||||||||||
| NET INCOME ATTRIBUTABLE TO ENSTAR | |||||||||||
| Dividends on preferred shares | ( | ( | |||||||||
| NET INCOME ATTRIBUTABLE TO ENSTAR ORDINARY SHAREHOLDERS | $ | $ | |||||||||
| Earnings per ordinary share attributable to Enstar Ordinary Shareholders: | |||||||||||
| Basic | $ | $ | |||||||||
| Diluted | $ | $ | |||||||||
| Weighted average ordinary shares outstanding: | |||||||||||
| Basic | |||||||||||
| Diluted | |||||||||||
See accompanying notes to the unaudited condensed consolidated financial statements.
Enstar Group Limited | First Quarter 2024 | Form 10-Q 10
ENSTAR GROUP LIMITED
UNAUDITED CONDENSED CONSOLIDATED STATEMENTS OF COMPREHENSIVE INCOME
For the Three Months Ended March 31, 2024 and 2023
| Three Months Ended March 31, | |||||||||||
| 2024 | 2023 | ||||||||||
| (expressed in millions of U.S. dollars) | |||||||||||
| NET INCOME | $ | $ | |||||||||
| Other comprehensive income (loss), net of income taxes: | |||||||||||
| Unrealized (losses) gains on fixed maturities, available-for-sale arising during the period | ( | ||||||||||
| Reclassification adjustment for change in allowance for credit losses recognized in net income | ( | ||||||||||
| Reclassification adjustment for net realized losses included in net income | |||||||||||
| Unrealized (losses) gains arising during the period, net of reclassification adjustments | ( | ||||||||||
| Reclassification adjustment for remeasurement of future policyholder benefits included in net income | ( | ||||||||||
| Change in currency translation adjustment | ( | ||||||||||
| Total other comprehensive loss | ( | ( | |||||||||
| Comprehensive income | |||||||||||
| Comprehensive loss attributable to noncontrolling interests | |||||||||||
| COMPREHENSIVE INCOME ATTRIBUTABLE TO ENSTAR | $ | $ | |||||||||
See accompanying notes to the unaudited condensed consolidated financial statements.
Enstar Group Limited | First Quarter 2024 | Form 10-Q 11
ENSTAR GROUP LIMITED
UNAUDITED CONDENSED CONSOLIDATED STATEMENTS OF CHANGES IN SHAREHOLDERS’ EQUITY
For the Three Months Ended March 31, 2024 and 2023
| Share Capital | |||||||||||||||||||||||||||||||||||||||||||||||||||||||||||||||||||||||||||||||||||
| Non-voting Convertible Ordinary Shares | Preferred Shares | Treasury Shares | |||||||||||||||||||||||||||||||||||||||||||||||||||||||||||||||||||||||||||||||||
| Voting Ordinary Shares | Series C | Series E | Series C Convertible Participating Non-Voting | Series D | Series E | Series C Preferred Shares | JSOP | APIC | AOCI | Retained Earnings | Total Enstar Shareholders' Equity | NCI | Total Shareholders' Equity | ||||||||||||||||||||||||||||||||||||||||||||||||||||||||||||||||||||||
| (in millions of U.S. dollars) | |||||||||||||||||||||||||||||||||||||||||||||||||||||||||||||||||||||||||||||||||||
| Three Months Ended March 31, 2024 | |||||||||||||||||||||||||||||||||||||||||||||||||||||||||||||||||||||||||||||||||||
| Balance as at December 31, 2023 | $ | $ | $ | $ | $ | $ | $ | ( | $ | ( | $ | $ | ( | $ | $ | $ | $ | ||||||||||||||||||||||||||||||||||||||||||||||||||||||||||||||||||
| Net income attributable to Enstar or noncontrolling interests | — | — | — | — | — | — | — | — | — | — | — | ||||||||||||||||||||||||||||||||||||||||||||||||||||||||||||||||||||||||
| Dividends on preferred shares | — | — | — | — | — | — | — | — | — | — | ( | ( | — | ( | |||||||||||||||||||||||||||||||||||||||||||||||||||||||||||||||||||||
| Amortization of share-based compensation | — | — | — | — | — | — | — | — | — | — | — | ||||||||||||||||||||||||||||||||||||||||||||||||||||||||||||||||||||||||
| Other comprehensive loss, net of tax | — | — | — | — | — | — | — | — | — | ( | — | ( | — | ( | |||||||||||||||||||||||||||||||||||||||||||||||||||||||||||||||||||||
| Other | — | — | — | — | — | — | — | — | ( | — | — | ( | ( | ||||||||||||||||||||||||||||||||||||||||||||||||||||||||||||||||||||||
| Balance as at March 31, 2024 | $ | $ | $ | $ | $ | $ | $ | ( | $ | ( | $ | $ | ( | $ | $ | $ | $ | ||||||||||||||||||||||||||||||||||||||||||||||||||||||||||||||||||
| Three Months Ended March 31, 2023 | |||||||||||||||||||||||||||||||||||||||||||||||||||||||||||||||||||||||||||||||||||
| Balance as at December 31, 2022 | $ | $ | $ | $ | $ | $ | $ | ( | $ | ( | $ | $ | ( | $ | $ | $ | $ | ||||||||||||||||||||||||||||||||||||||||||||||||||||||||||||||||||
| Net income attributable to Enstar or noncontrolling interests | — | — | — | — | — | — | — | — | — | — | |||||||||||||||||||||||||||||||||||||||||||||||||||||||||||||||||||||||||
| Dividends on preferred shares | — | — | — | — | — | — | — | — | — | — | ( | ( | — | ( | |||||||||||||||||||||||||||||||||||||||||||||||||||||||||||||||||||||
| Ordinary shares repurchased | — | ( | — | — | — | — | — | — | ( | — | — | ( | — | ( | |||||||||||||||||||||||||||||||||||||||||||||||||||||||||||||||||||||
| Amortization of share-based compensation | — | — | — | — | — | — | — | — | — | — | — | ||||||||||||||||||||||||||||||||||||||||||||||||||||||||||||||||||||||||
| Acquisition of noncontrolling shareholders' interest in subsidiary | — | — | — | — | — | — | — | — | — | — | ( | ( | |||||||||||||||||||||||||||||||||||||||||||||||||||||||||||||||||||||||
| Other comprehensive loss, net of tax | — | — | — | — | — | — | — | — | — | ( | — | ( | ( | ( | |||||||||||||||||||||||||||||||||||||||||||||||||||||||||||||||||||||
| Other | — | — | — | — | — | — | — | — | ( | — | — | ( | — | ( | |||||||||||||||||||||||||||||||||||||||||||||||||||||||||||||||||||||
| Balance as at March 31, 2023 | $ | $ | $ | $ | $ | $ | $ | ( | $ | ( | $ | $ | ( | $ | $ | $ | $ | ||||||||||||||||||||||||||||||||||||||||||||||||||||||||||||||||||
See accompanying notes to the unaudited condensed consolidated financial statements.
Enstar Group Limited | First Quarter 2024 | Form 10-Q 12
ENSTAR GROUP LIMITED
UNAUDITED CONDENSED CONSOLIDATED STATEMENTS OF CASH FLOWS
For the Three Months Ended March 31, 2024 and 2023
| Three Months Ended March 31, | |||||||||||
| 2024 | 2023 | ||||||||||
| (expressed in millions of U.S. dollars) | |||||||||||
| OPERATING ACTIVITIES: | |||||||||||
| Net income | $ | $ | |||||||||
| Adjustments to reconcile net income to cash flows provided by operating activities: | |||||||||||
| Realized losses on investments | |||||||||||
| Fair value changes in trading securities, funds held and other investments | ( | ( | |||||||||
| Amortization of net deferred charge assets | |||||||||||
| Depreciation, accretion and other amortization | ( | ||||||||||
| Net gain on Enhanzed Re novation | ( | ||||||||||
| Loss (income) from equity method investments | ( | ||||||||||
| Other adjustments | ( | ( | |||||||||
| Changes in: | |||||||||||
| Reinsurance balances recoverable on paid and unpaid losses | ( | ||||||||||
| Losses and loss adjustment expenses | ( | ( | |||||||||
| Defendant asbestos and environmental liabilities | ( | ( | |||||||||
| Insurance and reinsurance balances payable | |||||||||||
| Other operating assets and liabilities | ( | ||||||||||
| Funds held | |||||||||||
| Cash from/to operating activities: | |||||||||||
| Cash consideration for the Enhanzed Re novation | |||||||||||
| Sales and maturities of trading securities | |||||||||||
| Purchases of trading securities | ( | ( | |||||||||
| Net cash flows (used in) provided by operating activities | ( | ||||||||||
| INVESTING ACTIVITIES: | |||||||||||
| Sales and maturities of available-for-sale securities | |||||||||||
| Purchase of available-for-sale securities | ( | ( | |||||||||
| Purchase of other investments | ( | ( | |||||||||
| Proceeds from other investments | |||||||||||
| Other investing activities | |||||||||||
| Net cash flows provided by investing activities | |||||||||||
| FINANCING ACTIVITIES: | |||||||||||
| Dividends on preferred shares | ( | ( | |||||||||
| Repurchase of shares | ( | ||||||||||
| Other | |||||||||||
| Net cash flows used in financing activities | ( | ( | |||||||||
| EFFECT OF EXCHANGE RATE CHANGES ON FOREIGN CURRENCY CASH AND CASH EQUIVALENTS | ( | ||||||||||
| NET DECREASE IN CASH AND CASH EQUIVALENTS | ( | ( | |||||||||
| CASH, CASH EQUIVALENTS AND RESTRICTED CASH, BEGINNING OF PERIOD | |||||||||||
| CASH, CASH EQUIVALENTS AND RESTRICTED CASH, END OF PERIOD | $ | $ | |||||||||
Enstar Group Limited | First Quarter 2024 | Form 10-Q 13
| Supplemental Cash Flow Information: | |||||||||||
| Income taxes (received) paid, net of refunds | $ | ( | $ | ||||||||
| Interest paid | $ | $ | |||||||||
| Reconciliation to Consolidated Balance Sheets: | |||||||||||
| Cash and cash equivalents | $ | $ | |||||||||
| Restricted cash and cash equivalents | |||||||||||
| Cash, cash equivalents and restricted cash | $ | $ | |||||||||
| Non-cash operating activities: | |||||||||||
| Novation of future policy holder benefits | |||||||||||
| Funds held directly managed transferred in exchange on novation of future policy holder benefits | ( | ||||||||||
| Other assets / liabilities transferred on novation of future policy holder benefits | ( | ||||||||||
| Losses and loss adjustment expenses transferred in connection with settlement of participation in Atrium's Syndicate 609 | |||||||||||
| Investments transferred in connection with settlement of participation in Atrium's Syndicate 609 | ( | ||||||||||
| Non-cash investing activities: | |||||||||||
| Unsettled purchases of available-for-sale securities and other investments | $ | $ | |||||||||
| Unsettled sales of available-for-sale securities and other investments | ( | ( | |||||||||
See accompanying notes to the unaudited condensed consolidated financial statements.
Enstar Group Limited | First Quarter 2024 | Form 10-Q 14
ENSTAR GROUP LIMITED
NOTES TO THE UNAUDITED CONDENSED CONSOLIDATED FINANCIAL STATEMENTS
1. BASIS OF PRESENTATION
Enstar Group Limited ("Enstar") is a leading global (re)insurance group that offers innovative capital release solutions through its network of group companies in Bermuda, the United States, the United Kingdom, Continental Europe and Australia. Our core focus is acquiring and managing (re)insurance companies and portfolios of (re)insurance business in run-off.
The results of operations for any interim period are not necessarily indicative of results for the full year. These unaudited condensed consolidated financial statements and related notes should be read in conjunction with the consolidated financial statements and related notes included in our Annual Report on Form 10-K for the year ended December 31, 2023.
Recently Issued Accounting Pronouncements Not Yet Adopted
ASU 2023-07 - Improvements to Reportable Segment Disclosures
In November 2023, the FASB issued ASU 2023-07, which includes the following amendments to Topic 280 Segment Reporting:
•Disclose, on an annual and interim basis, significant segment expenses that are regularly provided to the chief operating decision maker (“CODM”) and included within the segment measure of profit or loss;
•Disclose, on an annual and interim basis, an amount for other segment items by reportable segment and a description of its composition;
•Disclose, on an interim basis, all annual disclosures about a reportable segment’s profit or loss and assets currently required by Topic 280;
•Clarify that an entity is not precluded from reporting one or more additional measure(s) of segment profit or loss if the CODM uses more than one measure in assessing segment performance and deciding how to allocate resources;
•Disclose the title and position of the CODM and an explanation of how the CODM uses the reported measure(s) of segment profit or loss in assessing segment performance and deciding how to allocate resources; and
•Require an entity with a single reportable segment to provide all disclosures required by the amendments in ASU 2023-07 and all existing segment disclosures in Topic 280.
These amendments are effective for annual reporting periods beginning after December 15, 2023 and interim reporting periods beginning after December 15, 2024, and must be applied retrospectively to all prior periods presented. Early adoption is permitted.
Adopting ASU 2023-07 will require us to expand our segment disclosures. We are currently determining the period in which the new guidance will be adopted.
ASU 2023-09 - Improvements to Income Tax Disclosures
In December 2023, the FASB issued ASU 2023-09, which includes the following amendments to Topic 740 Income Taxes:
•Disclose, on an annual basis, specific categories in the rate reconciliation;
Enstar Group Limited | First Quarter 2024 | Form 10-Q 15
Item 1 | Notes to the Unaudited Condensed Consolidated Financial Statements | Note 1. Basis of Presentation
•Disclose, on an annual basis, additional information for reconciling items that meet a quantitative threshold (if the effect of those reconciling items is equal to or greater than 5% of the amount computed by multiplying pretax income (or loss) by the applicable statutory income tax rate);
•Disclose, on an annual basis, the amount of income taxes paid (net of refunds received) disaggregated by federal (national), state, and foreign taxes;
•Disclose, on an annual basis, the amount of income taxes paid (net of refunds received) disaggregated by individual jurisdictions in which income taxes paid (net of refunds received) is equal to or greater than 5% of total income taxes paid (net of refunds received);
•Disclose income (or loss) from continuing operations before income tax expense (or benefit) disaggregated between domestic and foreign;
•Disclose income tax expense (or benefit) from continuing operations disaggregated by federal (national), state, and foreign;
•Eliminates the requirement to disclose the nature and estimate of the range of the reasonably possible change in the unrecognized tax benefits balance in the next 12 months or make a statement that an estimate of the range cannot be made; and
•Eliminates the requirement to disclose the cumulative amount of each type of temporary difference when a deferred tax liability is not recognized because of the exceptions to comprehensive recognition of deferred taxes related to subsidiaries and corporate joint ventures.
These amendments are effective for annual reporting periods beginning after December 15, 2024, and should be applied prospectively, however retrospective application is permitted. Early adoption is permitted.
Adopting ASU 2023-09 will require us to expand our income tax disclosures. We are currently determining the period in which the new guidance will be adopted.
2. SEGMENT INFORMATION
Our segment structure is aligned with how our CODM, our Chief Executive Officer, views our business, assesses performance and allocates resources to our business components. Effective January 1, 2024, our business is organized into two reportable segments: (i) Run-off and (ii) Investments. In addition, our Corporate and other activities, which do not qualify as an operating segment, include income and expense items that are not directly attributable to our reportable segments and activities from the former Assumed Life and Legacy Underwriting reportable segments.
Effective January 1, 2024, each of our Assumed Life and Legacy Underwriting reportable segments were determined to no longer meet the definition of reportable segments as they no longer engage in any active business activities following the series of commutation and novation transactions in Enhanzed Re and the settlement of the arrangements between SGL No. 1, Arden, and Atrium. Given the cessation of business activities and that all remaining activities are not expected to be material, all residual income or expense of the former Assumed Life and Legacy Underwriting reportable segments will be prospectively included within our Corporate and other activities.
The Assumed Life segment previously included Enhanzed Re’s life and property aggregate excess of loss (catastrophe) business. In August 2022, Enhanzed Re entered into a Master Agreement with Cavello Bay Reinsurance Limited (“Cavello”), a wholly-owned subsidiary of Enstar, and Allianz, pursuant to which a series of commutation and novation agreements were completed which ceased any continuing reinsurance obligations for this segment. We recognized the impact of transactions that closed in the fourth quarter of 2022 in the first quarter of 2023 due to the quarter lag in reporting.
The Legacy Underwriting segment previously included participation in direct underwriting activities, including a 25 % participation within 2020 and prior underwriting years of Atrium's Syndicate 609 at Lloyd's, offset by the contractual transfer of the results of that business to the Atrium entities that were divested in an exchange transaction. All remaining contractual arrangements were settled in the second quarter of 2023. Other than the settlement of these amounts, no other transactions were recorded in the Legacy Underwriting segment in 2023.
Enstar Group Limited | First Quarter 2024 | Form 10-Q 16
Item 1 | Notes to the Unaudited Condensed Consolidated Financial Statements | Note 2. Segment Information
Our assets are reviewed on a consolidated basis by management for decision making purposes since they support business operations across both of our reportable segments as well as our Corporate and other activities. We do not allocate assets to our reportable segments with the exception of (re)insurance balances recoverable on paid and unpaid losses and goodwill (all goodwill is attributable to the Run-off segment) that are directly attributable to our reportable segments.
The following table sets forth select unaudited condensed consolidated statements of operations results by segment and our Corporate and other activities:
| Three Months Ended | |||||||||||
| March 31, | |||||||||||
| 2024 | 2023 | ||||||||||
| (in millions of U.S. dollars) | |||||||||||
| Revenues | |||||||||||
| Run-off | $ | $ | |||||||||
| Investments | |||||||||||
Assumed Life (1) | |||||||||||
| Subtotal | |||||||||||
Corporate and other (1) | ( | ||||||||||
| Total revenues | $ | $ | |||||||||
| (Loss) income from equity method investments | |||||||||||
| Investments | $ | ( | $ | ||||||||
| Segment net income (loss) | |||||||||||
Run-off | $ | ( | $ | ( | |||||||
Investments | |||||||||||
Assumed Life (1) | |||||||||||
| Total segment net income | |||||||||||
Corporate and other (1): | |||||||||||
Other expense (2) | ( | ||||||||||
Net incurred losses and loss adjustment expenses (“LAE”) (3) | ( | ||||||||||
| Amortization of net deferred charge assets | ( | ( | |||||||||
| General and administrative expenses | ( | ( | |||||||||
| Interest expense | ( | ( | |||||||||
| Net foreign exchange gains | |||||||||||
| Income tax (expense) benefit | ( | ||||||||||
| Net income attributable to noncontrolling interests | ( | ||||||||||
| Dividends on preferred shares | ( | ( | |||||||||
Total - Corporate and other loss | ( | ( | |||||||||
| Net income attributable to Enstar Ordinary Shareholders | $ | $ | |||||||||
(1) Effective January 1, 2024, Assumed Life and Legacy Underwriting were determined to no longer meet the definition of reportable segments and their residual income and loss activities were prospectively included in Corporate and other activities. Activities prior to January 1, 2024 are recorded in their respective segments. In addition, Legacy Underwriting had no revenue or income activity for the three months ended March 31, 2024 and 2023 and therefore is excluded from the table above.
(2) Other expense for Corporate and other activities includes the amortization of fair value adjustments associated with the acquisition of DCo and Morse TEC.
(3) Net incurred losses and LAE for Corporate and other activities includes fair value adjustments associated with the acquisition of companies and the changes in the discount rate and risk margin components of the fair value of assets and liabilities related to our assumed retroactive reinsurance contracts for which we have elected the fair value option.
Enstar Group Limited | First Quarter 2024 | Form 10-Q 17
Item 1 | Notes to the Unaudited Condensed Consolidated Financial Statements | Note 3. Investments
3. INVESTMENTS
Short-term and Fixed Maturity Investments
Asset Types
The fair values of the following underlying asset categories are set out below:
| March 31, 2024 | |||||||||||||||||||||||||||||
| Short-term investments, trading | Short-term investments, AFS | Fixed maturities, trading | Fixed maturities, AFS | Total | |||||||||||||||||||||||||
| (in millions of U.S. dollars) | |||||||||||||||||||||||||||||
| U.S. government and agency | $ | $ | $ | $ | $ | ||||||||||||||||||||||||
| U.K. government | |||||||||||||||||||||||||||||
| Other government | |||||||||||||||||||||||||||||
| Corporate | |||||||||||||||||||||||||||||
| Municipal | |||||||||||||||||||||||||||||
| Residential mortgage-backed | |||||||||||||||||||||||||||||
| Commercial mortgage-backed | |||||||||||||||||||||||||||||
| Asset-backed | |||||||||||||||||||||||||||||
| Total fixed maturity and short-term investments | $ | $ | $ | $ | $ | ||||||||||||||||||||||||
| December 31, 2023 | |||||||||||||||||||||||||||||
| Short-term investments, trading | Short-term investments, AFS | Fixed maturities, trading | Fixed maturities, AFS | Total | |||||||||||||||||||||||||
| (in millions of U.S. dollars) | |||||||||||||||||||||||||||||
| U.S. government and agency | $ | $ | $ | $ | $ | ||||||||||||||||||||||||
| U.K. government | |||||||||||||||||||||||||||||
| Other government | |||||||||||||||||||||||||||||
| Corporate | |||||||||||||||||||||||||||||
| Municipal | |||||||||||||||||||||||||||||
| Residential mortgage-backed | |||||||||||||||||||||||||||||
| Commercial mortgage-backed | |||||||||||||||||||||||||||||
| Asset-backed | |||||||||||||||||||||||||||||
| Total fixed maturity and short-term investments | $ | $ | $ | $ | $ | ||||||||||||||||||||||||
Included within residential mortgage-backed securities as of March 31, 2024 were securities issued by U.S. governmental agencies with a fair value of $278 million (December 31, 2023: $306 million).
Included within commercial mortgage-backed securities as of March 31, 2024 were securities issued by U.S. governmental agencies with a fair value of $66 million (December 31, 2023: $73 million).
Enstar Group Limited | First Quarter 2024 | Form 10-Q 18
Item 1 | Notes to the Unaudited Condensed Consolidated Financial Statements | Note 3. Investments
Contractual Maturities
The contractual maturities of our short-term and fixed maturity investments, classified as trading and AFS are shown below. Actual maturities may differ from contractual maturities because issuers may have the right to call or prepay obligations with or without call or prepayment penalties.
| As of March 31, 2024 | Amortized Cost | Fair Value | % of Total Fair Value | |||||||||||||||||
| (in millions of U.S. dollars) | ||||||||||||||||||||
| One year or less | $ | $ | % | |||||||||||||||||
| More than one year through five years | % | |||||||||||||||||||
| More than five years through ten years | % | |||||||||||||||||||
| More than ten years | % | |||||||||||||||||||
| Residential mortgage-backed | % | |||||||||||||||||||
| Commercial mortgage-backed | % | |||||||||||||||||||
| Asset-backed | % | |||||||||||||||||||
| $ | $ | % | ||||||||||||||||||
Unrealized Gains and Losses on AFS Short-term and Fixed Maturity Investments
The amortized cost, unrealized gains and losses, allowance for credit losses and fair values of our short-term and fixed maturity investments classified as AFS were as follows:
| Gross Unrealized Gains | Gross Unrealized Losses | |||||||||||||||||||||||||||||||
| As of March 31, 2024 | Amortized Cost | Non-Credit Related Losses | Allowance for Credit Losses | Fair Value | ||||||||||||||||||||||||||||
| (in millions of U.S. dollars) | ||||||||||||||||||||||||||||||||
| U.S. government and agency | $ | $ | $ | ( | $ | $ | ||||||||||||||||||||||||||
| U.K. government | ( | |||||||||||||||||||||||||||||||
| Other government | ( | |||||||||||||||||||||||||||||||
| Corporate | ( | ( | ||||||||||||||||||||||||||||||
| Municipal | ( | |||||||||||||||||||||||||||||||
| Residential mortgage-backed | ( | |||||||||||||||||||||||||||||||
| Commercial mortgage-backed | ( | ( | ||||||||||||||||||||||||||||||
| Asset-backed | ( | |||||||||||||||||||||||||||||||
| $ | $ | $ | ( | $ | ( | $ | ||||||||||||||||||||||||||
| Gross Unrealized Gains | Gross Unrealized Losses | |||||||||||||||||||||||||||||||
As of December 31, 2023 | Amortized Cost | Non-Credit Related Losses | Allowance for Credit Losses | Fair Value | ||||||||||||||||||||||||||||
| (in millions of U.S. dollars) | ||||||||||||||||||||||||||||||||
| U.S. government and agency | $ | $ | $ | ( | $ | $ | ||||||||||||||||||||||||||
| U.K. government | ( | |||||||||||||||||||||||||||||||
| Other government | ( | |||||||||||||||||||||||||||||||
| Corporate | ( | ( | ||||||||||||||||||||||||||||||
| Municipal | ( | |||||||||||||||||||||||||||||||
| Residential mortgage-backed | ( | |||||||||||||||||||||||||||||||
| Commercial mortgage-backed | ( | ( | ||||||||||||||||||||||||||||||
| Asset-backed | ( | |||||||||||||||||||||||||||||||
| $ | $ | $ | ( | $ | ( | $ | ||||||||||||||||||||||||||
Enstar Group Limited | First Quarter 2024 | Form 10-Q 19
Item 1 | Notes to the Unaudited Condensed Consolidated Financial Statements | Note 3. Investments
Gross Unrealized Losses on AFS Short-term and Fixed Maturity Investments
The following tables summarizes our short-term and fixed maturity investments classified as AFS that were in a gross unrealized loss position, for which an allowance for credit losses has not been recorded, as explained below:
| 12 Months or Greater | Less Than 12 Months | Total | ||||||||||||||||||||||||||||||||||||
| As of March 31, 2024 | Fair Value | Gross Unrealized Losses | Fair Value | Gross Unrealized Losses | Fair Value | Gross Unrealized Losses | ||||||||||||||||||||||||||||||||
| (in millions of U.S. dollars) | ||||||||||||||||||||||||||||||||||||||
| U.S. government and agency | $ | $ | ( | $ | $ | ( | $ | $ | ( | |||||||||||||||||||||||||||||
| U.K. government | ( | ( | ||||||||||||||||||||||||||||||||||||
| Other government | ( | ( | ( | |||||||||||||||||||||||||||||||||||
| Corporate | ( | ( | ( | |||||||||||||||||||||||||||||||||||
| Municipal | ( | ( | ||||||||||||||||||||||||||||||||||||
| Residential mortgage-backed | ( | ( | ( | |||||||||||||||||||||||||||||||||||
| Commercial mortgage-backed | ( | ( | ( | |||||||||||||||||||||||||||||||||||
| Asset-backed | ( | ( | ( | |||||||||||||||||||||||||||||||||||
| Total short-term and fixed maturity investments | $ | $ | ( | $ | $ | ( | $ | $ | ( | |||||||||||||||||||||||||||||
| 12 Months or Greater | Less Than 12 Months | Total | ||||||||||||||||||||||||||||||||||||
| As of December 31, 2023 | Fair Value | Gross Unrealized Losses | Fair Value | Gross Unrealized Losses | Fair Value | Gross Unrealized Losses | ||||||||||||||||||||||||||||||||
| (in millions of U.S. dollars) | ||||||||||||||||||||||||||||||||||||||
| U.S. government and agency | $ | $ | ( | $ | $ | ( | $ | $ | ( | |||||||||||||||||||||||||||||
| U.K. government | ( | ( | ||||||||||||||||||||||||||||||||||||
| Other government | ( | ( | ||||||||||||||||||||||||||||||||||||
| Corporate | ( | ( | ( | |||||||||||||||||||||||||||||||||||
| Municipal | ( | ( | ||||||||||||||||||||||||||||||||||||
| Residential mortgage-backed | ( | ( | ( | |||||||||||||||||||||||||||||||||||
| Commercial mortgage-backed | ( | ( | ( | |||||||||||||||||||||||||||||||||||
| Asset-backed | ( | ( | ( | |||||||||||||||||||||||||||||||||||
| Total short-term and fixed maturity investments | $ | $ | ( | $ | $ | ( | $ | $ | ( | |||||||||||||||||||||||||||||
As of March 31, 2024 and December 31, 2023, the number of securities classified as AFS in an unrealized loss position for which an allowance for credit loss is not recorded was 2,363 and 2,156 , respectively. Of these securities, the number of securities that had been in an unrealized loss position for twelve months or longer was 1,549 and 1,736 , respectively.
Enstar Group Limited | First Quarter 2024 | Form 10-Q 20
Item 1 | Notes to the Unaudited Condensed Consolidated Financial Statements | Note 3. Investments
Allowance for Credit Losses on AFS Fixed Maturity Investments
The following table provides a reconciliation of the beginning and ending allowance for credit losses on our AFS debt securities:
| Three Months Ended March 31, | |||||||||||||||||||||||||||||||||||
| 2024 | 2023 | ||||||||||||||||||||||||||||||||||
| Corporate | Commercial mortgage backed | Total | Other government | Corporate | Total | ||||||||||||||||||||||||||||||
| (in millions of U.S. dollars) | |||||||||||||||||||||||||||||||||||
| Allowance for credit losses, beginning of period | $ | ( | $ | ( | $ | ( | $ | ( | $ | ( | $ | ( | |||||||||||||||||||||||
| Allowances for credit losses on securities for which credit losses were not previously recorded | ( | ( | |||||||||||||||||||||||||||||||||
| Reductions for securities sold during the period | |||||||||||||||||||||||||||||||||||
| (Increase) decrease to the allowance for credit losses on securities that had an allowance recorded in the previous period | ( | ( | |||||||||||||||||||||||||||||||||
| Allowance for credit losses, end of period | $ | ( | $ | ( | $ | ( | $ | $ | ( | $ | ( | ||||||||||||||||||||||||
During the three months ended March 31, 2024 and 2023, we did not have any write-offs charged against the allowance for credit losses or any recoveries of amounts previously written off.
Equity Investments
The following table summarizes our equity investments:
| March 31, 2024 | December 31, 2023 | ||||||||||
| (in millions of U.S. dollars) | |||||||||||
| Equity Investments | |||||||||||
| Publicly traded equity investments in common and preferred stocks | $ | $ | |||||||||
| Exchange-traded funds | |||||||||||
| Privately held equity investments in common and preferred stocks | |||||||||||
| $ | $ | ||||||||||
Other Investments
The following table summarizes our other investments carried at fair value:
| March 31, 2024 | December 31, 2023 | ||||||||||
| (in millions of U.S. dollars) | |||||||||||
| Other Investments | |||||||||||
| Private equity funds | $ | $ | |||||||||
| Private credit funds | |||||||||||
| Hedge funds | |||||||||||
| Fixed income funds | |||||||||||
| Real estate funds | |||||||||||
| CLO equity funds | |||||||||||
| CLO equities | |||||||||||
| Equity funds | |||||||||||
| $ | $ | ||||||||||
Enstar Group Limited | First Quarter 2024 | Form 10-Q 21
Item 1 | Notes to the Unaudited Condensed Consolidated Financial Statements | Note 3. Investments
Other investments, including equities measured at fair value using NAV as a practical expedient
We use NAV as a practical expedient to fair value certain of our other investments, including equities.
The table below details the estimated period by which proceeds would be received if we had provided notice of our intent to redeem or initiated a sales process as of March 31, 2024 for our investments measured at fair value using NAV as a practical expedient:
| Less than 1 Year | 1-2 years | 2-3 years | More than 3 years | Not Eligible/ Restricted | Total | Redemption Frequency (1) | |||||||||||||||||||||||||||||||||||
| (in millions of U.S. dollars) | |||||||||||||||||||||||||||||||||||||||||
| Equities | |||||||||||||||||||||||||||||||||||||||||
| Privately held equity investments | $ | $ | $ | $ | $ | $ | not eligible/ restricted | ||||||||||||||||||||||||||||||||||
| Other investments | |||||||||||||||||||||||||||||||||||||||||
| Private equity funds | $ | $ | $ | $ | $ | $ | quarterly for unrestricted amount | ||||||||||||||||||||||||||||||||||
| Hedge funds | monthly to bi-annually | ||||||||||||||||||||||||||||||||||||||||
| Fixed income funds | monthly to quarterly | ||||||||||||||||||||||||||||||||||||||||
| Private credit funds | not eligible/ restricted | ||||||||||||||||||||||||||||||||||||||||
| Real estate funds | not eligible/ restricted | ||||||||||||||||||||||||||||||||||||||||
| CLO equity funds | quarterly to bi-annually | ||||||||||||||||||||||||||||||||||||||||
| $ | $ | $ | $ | $ | $ | ||||||||||||||||||||||||||||||||||||
(1) Redemption frequency relates to unrestricted amounts.
Equity Method Investments
The table below shows our equity method investments:
| March 31, 2024 | December 31, 2023 | |||||||||||||||||||||||||
| Ownership % | Carrying Value | Ownership % | Carrying Value | |||||||||||||||||||||||
| (in millions of U.S. dollars) | ||||||||||||||||||||||||||
Monument Re (1) | % | % | ||||||||||||||||||||||||
| Core Specialty | % | % | ||||||||||||||||||||||||
| Other | % | |||||||||||||||||||||||||
| $ | $ | |||||||||||||||||||||||||
(1) As of March 31, 2024, we own 24.6 % of the common shares in Monument Re. We converted all of our preferred shares in Monument Midco to common shares in Monument Re on January 2, 2024. As of December 31, 2023, we owned 20.0 % of the common shares in Monument Re as well as preferred shares in Monument Midco which had fixed dividend yields (where declared). Losses for the three months ended March 31, 2024 include an other-than-temporary impairment charge.
Funds Held
Under funds held arrangements, the reinsured company has retained funds that would otherwise have been remitted to us. The funds held balance is credited with investment income and losses paid are deducted.
| March 31, 2024 | December 31, 2023 | ||||||||||
| (in millions of U.S. dollars) | |||||||||||
| Funds held - directly managed | $ | $ | |||||||||
| Funds held by reinsured companies | |||||||||||
| Total funds held | $ | $ | |||||||||
Enstar Group Limited | First Quarter 2024 | Form 10-Q 22
Item 1 | Notes to the Unaudited Condensed Consolidated Financial Statements | Note 3. Investments
Funds Held - Directly Managed
The following table summarizes the components of the investments collateralizing the funds held - directly managed:
| March 31, 2024 | December 31, 2023 | ||||||||||
| (in millions of U.S. dollars) | |||||||||||
| Funds held - directly managed, at cost | $ | $ | |||||||||
| Fair value changes in: | |||||||||||
| Accumulated change in fair value - embedded derivative accounting | ( | ( | |||||||||
| Funds held - directly managed, at fair value | $ | $ | |||||||||
The majority of our funds held - directly managed is comprised of short-term and fixed maturities. The $166 million decrease in funds held - directly managed from December 31, 2023 to March 31, 2024 was primarily driven by net paid losses.
Funds Held by Reinsured Companies
The following table summarizes the components of our funds held by reinsured companies:
| March 31, 2024 | December 31, 2023 | ||||||||||
| (in millions of U.S. dollars) | |||||||||||
| Funds held by reinsurance companies, at amortized cost | $ | $ | |||||||||
Fair value of embedded derivative (1) | |||||||||||
| Funds held by reinsured companies | $ | $ | |||||||||
The $205 million decrease in funds held by reinsured companies from December 31, 2023 to March 31, 2024 was primarily driven by net paid losses specific to the Aspen LPT.
Net Investment Income
Major categories of net investment income are summarized as follows:
| Three Months Ended | |||||||||||
| March 31, | |||||||||||
| 2024 | 2023 | ||||||||||
| (in millions of U.S. dollars) | |||||||||||
| Fixed maturity investments | $ | $ | |||||||||
| Short-term investments and cash and cash equivalents | |||||||||||
| Funds held | |||||||||||
| Investment income from fixed maturities and cash and cash equivalents | |||||||||||
| Equity investments | |||||||||||
| Other investments | |||||||||||
| Investment income from equities and other investments | |||||||||||
| Gross investment income | |||||||||||
| Investment expenses | ( | ( | |||||||||
| Net investment income | $ | $ | |||||||||
Enstar Group Limited | First Quarter 2024 | Form 10-Q 23
Item 1 | Notes to the Unaudited Condensed Consolidated Financial Statements | Note 3. Investments
Net Realized Gains (Losses) and Fair Value Changes
Investment purchases and sales are recorded on a trade-date basis. Realized gains and losses on the sale of investments are based upon specific identification of the cost of investments. Components of net realized gains (losses) and fair value changes are recorded within our unaudited condensed consolidated statements of operations were as follows:
| Three Months Ended | |||||||||||
| March 31, | |||||||||||
| 2024 | 2023 | ||||||||||
| (in millions of U.S. dollars) | |||||||||||
| Net realized losses on sales: | |||||||||||
| Gross realized gains on fixed maturity securities, AFS | $ | $ | |||||||||
| Gross realized losses on fixed maturity securities, AFS | ( | ( | |||||||||
| (Increase) decrease in allowance for expected credit losses on fixed maturity securities, AFS | ( | ||||||||||
| Total net realized losses on sales | $ | ( | $ | ( | |||||||
| Fair value changes in trading securities, funds held and other investments: | |||||||||||
| Fixed maturity securities, trading | $ | ( | $ | ||||||||
| Funds held - directly managed | ( | ||||||||||
| Equity securities | |||||||||||
| Other investments | |||||||||||
| Investment derivatives | |||||||||||
| Total fair value changes in trading securities, funds held and other investments | $ | $ | |||||||||
| Net realized gains and fair value changes in trading securities, funds held and other investments | $ | $ | |||||||||
The gross realized gains and losses on AFS investments for the three months ended March 31, 2024 and 2023 included in the table above resulted from sales of AFS investments of $436 million and $656 million, respectively.
For the three months ended March 31, 2024 and 2023, fair value changes in trading securities, funds held and other investments recorded within the statement of operations relating to equity securities still held on the balance sheet date were $37 million and $43 million, respectively.
Restricted Assets
The carrying value of our restricted assets, including restricted cash of $310 million and $266 million, as of March 31, 2024 and December 31, 2023, respectively, was as follows:
| March 31, 2024 | December 31, 2023 | ||||||||||
| (in millions of U.S. dollars) | |||||||||||
| Collateral in trust for third party agreements | $ | $ | |||||||||
| Assets on deposit with regulatory authorities | |||||||||||
| Collateral for secured letter of credit facilities | |||||||||||
Funds at Lloyd's (1) | |||||||||||
| $ | $ | ||||||||||
Enstar Group Limited | First Quarter 2024 | Form 10-Q 24
Item 1 | Notes to the Unaudited Condensed Consolidated Financial Statements | Note 4. Derivatives and Hedging Instruments
4. DERIVATIVES AND HEDGING INSTRUMENTS
Accounting for Derivatives
Freestanding Derivatives
Freestanding derivatives are recorded on trade-dates and carried on the consolidated balance sheet either as assets within other assets or as liabilities within other liabilities at estimated fair value. We do not offset the estimated fair value amounts recognized for derivatives executed with the same counterparty under the same master netting agreement.
If a derivative is not designated as an accounting hedge or its use in managing risk does not qualify for hedge accounting, changes in the estimated fair value of the derivative are reported in fair value changes in trading securities, funds held and other investments included in our consolidated statements of operations.
Hedge Accounting
To qualify for hedge accounting, at the inception of the hedging relationship, we formally document the risk management objective and strategy for undertaking the hedging transaction, as well as the designation of the hedge.
We have qualifying net investment in foreign operation (“NIFO”) hedges. We recognize changes in the estimated fair value of the hedging derivatives within OCI, consistent with the translation adjustment for the hedged net investment in the foreign operation.
Our documentation sets forth how the hedging instrument is expected to hedge the designated risks related to the hedged item and also sets forth the method that will be used to retrospectively and prospectively assess the hedging instrument’s effectiveness. A derivative designated as a hedging instrument must be assessed as being highly effective in offsetting the designated risk of the hedged item. Hedge effectiveness is formally assessed at inception and at least quarterly throughout the life of the designated hedging relationship. Assessments of hedge effectiveness are also subject to interpretation and estimation and different interpretations or estimates may have a material effect on the amount reported in net income.
When hedge accounting is discontinued pursuant to a NIFO hedge (due to a revaluation, payment of a dividend or the disposal of our investment in a foreign operation), the derivative continues to be carried on the balance sheet at its estimated fair value. Deferred gains and losses recorded in OCI pursuant to a discontinued NIFO hedge are recognized immediately in net foreign exchange losses (gains) in our consolidated statements of operations.
Embedded Derivatives
We are party to certain reinsurance agreements that have embedded derivatives. We also have embedded derivatives on our convertible bond portfolio, recorded within fixed maturities, trading on the consolidated balance sheets. We assess each identified embedded derivative to determine whether it is required to be bifurcated. The embedded derivative is bifurcated from the host contract and accounted for as a freestanding derivative if:
•the combined instrument is not accounted for in its entirety at estimated fair value with changes in estimated fair value recorded in net income;
•the terms of the embedded derivative are not clearly and closely related to the economic characteristics of the host contract; and
•a separate instrument with the same terms as the embedded derivative would qualify as a derivative instrument.
Such embedded derivatives are carried on the consolidated balance sheet at estimated fair value with the host contract and changes in their estimated fair value are generally reported within fair value changes in trading securities, funds held and other investments.
Derivative Strategies
We are exposed to various risks relating to our ongoing business operations, including interest rate, foreign currency exchange rate, credit and equity price risks. We use a variety of strategies to manage these risks, including the use of derivatives.
Derivatives are financial instruments with values derived from interest rates, foreign currency exchange rates, credit spreads and/or other financial indices. The types of derivatives we use include swaps and forwards.
Enstar Group Limited | First Quarter 2024 | Form 10-Q 25
Item 1 | Notes to the Unaudited Condensed Consolidated Financial Statements | Note 4. Derivatives and Hedging Instruments
Foreign Currency Derivatives
We use foreign currency exchange rate derivatives, including foreign currency forwards, to reduce the risk from fluctuations in foreign currency exchange rates associated with our assets and liabilities denominated in foreign currencies. We also use foreign currency derivatives to hedge the foreign currency exchange rate risk associated with certain of our net investments in foreign operations.
In a foreign currency forward transaction, we agree with another party to deliver a specified amount of an identified currency at a specified future date. The price is agreed upon at the time of the contract and payment for such a contract is made at the specified future date. We utilize foreign currency forwards in fair value, NIFO hedges and nonqualifying hedging relationships.
Interest Rate Derivatives
We use interest rate derivatives, specifically interest rate swaps, to reduce our exposure to changes in interest rates.
Interest rate swaps are used by us primarily to reduce market risks from changes in interest rates and to alter interest rate exposure arising from mismatches between assets and liabilities (duration mismatches). In an interest rate swap, we agree with another party to exchange, at specified intervals, the difference between fixed rate and floating rate interest amounts as calculated by reference to an agreed notional amount. We utilize interest rate swaps in nonqualifying hedging relationships.
In February 2023, we entered into a two-month forward interest rate swap, receiving a fixed rate and paying a floating rate with a notional value of $800 million to partially mitigate the risk that interest rates could decrease prior to our receipt of the cash consideration for the QBE LPT transaction. Following the expiration of the forward period in April 2023, we took delivery of a three-year receive fixed, pay floating interest rate swap. The notional value of the swap was subsequently partially unwound as the consideration received was invested. The swap was fully unwound in July 2023. As of March 31, 2024 and December 31, 2023, we had no interest rate swaps.
The following table presents the gross notional amounts and estimated fair values of our derivatives recorded within and on the consolidated balance sheets as of March 31, 2024 and December 31, 2023:
| March 31, 2024 | December 31, 2023 | ||||||||||||||||||||||||||||||||||
| Gross Notional Amount | Fair Value | Gross Notional Amount | Fair Value | ||||||||||||||||||||||||||||||||
| Assets | Liabilities | Assets | Liabilities | ||||||||||||||||||||||||||||||||
| (in millions of U.S. dollars) | |||||||||||||||||||||||||||||||||||
| Derivatives designated as hedging instruments | |||||||||||||||||||||||||||||||||||
| Foreign currency forward contracts | $ | $ | $ | $ | $ | $ | |||||||||||||||||||||||||||||
| Derivatives not designated as hedging instruments | |||||||||||||||||||||||||||||||||||
| Foreign currency forward contracts | |||||||||||||||||||||||||||||||||||
| Others | |||||||||||||||||||||||||||||||||||
| Total | $ | $ | $ | $ | $ | $ | |||||||||||||||||||||||||||||
The following table presents the net gains and losses relating to our derivative instruments for the three months ended March 31, 2024 and 2023:
| Amount of Net Gains (Losses) | |||||||||||||||||
| Location of gain (loss) recognized on derivatives | Three Months Ended | ||||||||||||||||
| March 31, 2024 | March 31, 2023 | ||||||||||||||||
| (in millions of U.S. dollars) | |||||||||||||||||
| Derivatives designated as hedging instruments | |||||||||||||||||
| Foreign currency forward contracts | Accumulated other comprehensive income (loss) | $ | $ | ( | |||||||||||||
| Derivatives not designated as hedging instruments | |||||||||||||||||
| Foreign currency forward contracts | Net foreign exchange gains | ||||||||||||||||
| Interest rate swap | Fair value changes in trading securities, funds held and other investments | ||||||||||||||||
Enstar Group Limited | First Quarter 2024 | Form 10-Q 26
Item 1 | Notes to the Unaudited Condensed Consolidated Financial Statements | Note 5. Deferred Charge Assets and Deferred Gain Liabilities
5. DEFERRED CHARGE ASSETS AND DEFERRED GAIN LIABILITIES
If, at the inception of a retroactive reinsurance contract, the estimated liabilities for losses and LAE exceed the consideration received, a deferred charge asset (“DCA”) is recorded for this difference. In contrast, if the consideration received is in excess of the estimated undiscounted ultimate losses payable, a deferred gain liability (“DGL”) is recorded.
We amortize the net DCA balances over the estimated claim payment period of the related contracts with the amortization prospectively adjusted at each reporting period to reflect new estimates of the pattern and timing of remaining losses and LAE payments.
The following table presents a summary of the DCA balances and related activity for the three months ended March 31, 2024 and 2023 (there were no
| Three Months Ended March 31, | |||||||||||
| 2024 | 2023 | ||||||||||
| (in millions of U.S. dollars) | |||||||||||
| Beginning carrying value | $ | $ | |||||||||
| Amortization | ( | ( | |||||||||
| Ending carrying value | $ | $ | |||||||||
Enstar Group Limited | First Quarter 2024 | Form 10-Q 27
Item 1 | Notes to the Unaudited Condensed Consolidated Financial Statements | Note 6. Losses and Loss Adjustment Expenses
6. LOSSES AND LOSS ADJUSTMENT EXPENSES
The liability for losses and LAE, also referred to as loss reserves, represents our gross estimates before reinsurance for unpaid reported losses (Outstanding Loss Reserves, or "OLR") and includes losses that have been incurred but not yet reported ("IBNR") using a variety of actuarial methods. We recognize an asset for the portion of the liability that we expect to recover from reinsurers. LAE reserves include allocated LAE ("ALAE") and unallocated LAE ("ULAE"). ALAE are linked to the settlement of an individual claim or loss, whereas ULAE are based on our estimates of future costs to administer the claims. IBNR includes amounts for unreported claims, development on known claims and reopened claims.
Our loss reserves cover multiple lines of business, including asbestos, environmental, general casualty, workers' compensation, marine, aviation and transit, construction defect, professional indemnity/directors and officers, motor, property and other non-life lines of business. We complete most of our annual loss reserve studies in the fourth quarter of each year and, as a result, tend to record the largest movements, both favorable and adverse, to net incurred losses and LAE in this period.
Enstar Group Limited | First Quarter 2024 | Form 10-Q 28
Item 1 | Notes to the Unaudited Condensed Consolidated Financial Statements | Note 6. Losses and Loss Adjustment Expenses
The table below provides a consolidated reconciliation of the beginning and ending liability for losses and LAE:
| Three Months Ended | |||||||||||
| March 31, | |||||||||||
| 2024 | 2023 | ||||||||||
| (in millions of U.S. dollars) | |||||||||||
| Balance as of beginning of period | $ | $ | |||||||||
| Reinsurance reserves recoverable on unpaid losses | ( | ( | |||||||||
| Net balance as of beginning of period | |||||||||||
| Net incurred losses and LAE: | |||||||||||
| Current period: | |||||||||||
| Increase in estimates of net ultimate losses | |||||||||||
| Total current period | |||||||||||
| Prior periods: | |||||||||||
| Reduction in estimates of net ultimate losses | ( | ( | |||||||||
| Reduction in provisions for ULAE | ( | ( | |||||||||
| Amortization of fair value adjustments | |||||||||||
Changes in fair value - fair value option (1) | ( | ||||||||||
| Total prior periods | ( | ( | |||||||||
| Total net incurred losses and LAE | ( | ||||||||||
| Net paid losses: | |||||||||||
| Current period | ( | ||||||||||
| Prior periods | ( | ( | |||||||||
| Total net paid losses | ( | ( | |||||||||
| Other changes: | |||||||||||
| Effect of exchange rate movement | ( | ||||||||||
Ceded business (2) | ( | ||||||||||
| Total other changes | ( | ( | |||||||||
Net balance as of March 31 | |||||||||||
| Reinsurance reserves recoverable on unpaid losses | |||||||||||
Balance as of March 31 | $ | $ | |||||||||
| As of | |||||||||||
| March 31, 2024 | December 31, 2023 | ||||||||||
| (in millions of U.S. dollars) | |||||||||||
| Reconciliation to Consolidated Balance Sheets: | |||||||||||
| Losses and loss adjustment expenses | $ | $ | |||||||||
| Losses and loss adjustment expenses, at fair value | |||||||||||
| Total losses and loss adjustment expenses | $ | $ | |||||||||
| Reinsurance balances recoverable on paid and unpaid losses | $ | $ | |||||||||
| Reinsurance balances recoverable on paid and unpaid losses - fair value option | |||||||||||
| Total reinsurance balances recoverable on paid and unpaid losses | |||||||||||
| Less: Paid losses recoverable | ( | ( | |||||||||
| Reinsurance reserves recoverable on unpaid losses | $ | $ | |||||||||
(1) Comprises discount rate and risk margin components.
(2) Represents the settlement of our participation in Atrium’s Syndicate 609 relating to the 2020 and prior underwriting years, comprised of losses and LAE expenses of $173 million, net of reinsurance reserves recoverable of $34 million.
Enstar Group Limited | First Quarter 2024 | Form 10-Q 29
Item 1 | Notes to the Unaudited Condensed Consolidated Financial Statements | Note 6. Losses and Loss Adjustment Expenses
Prior Period Development
Reduction in Estimates of Net Ultimate Losses
The following table summarizes the change in estimates of net ultimate losses related to prior years in our Run-off segment by line of business:
| Three Months Ended | |||||||||||
| March 31, 2024 | March 31, 2023 | ||||||||||
| (in millions of U.S. dollars) | |||||||||||
| Asbestos | $ | ( | $ | ||||||||
| Environmental | |||||||||||
| General casualty | |||||||||||
| Workers' compensation | ( | ( | |||||||||
| Marine, aviation and transit | ( | ||||||||||
| Construction defect | |||||||||||
| Professional indemnity/Directors and Officers | ( | ||||||||||
| Motor | |||||||||||
| Property | ( | ( | |||||||||
| All Other | ( | ||||||||||
| Total | $ | ( | $ | ( | |||||||
Three Months Ended March 31, 2024:
The prior period reduction in estimates of net ultimate losses of $6 million was driven by favorable development across multiple lines of business. The primary drivers included favorable development on our Professional Indemnity/Directors and Officers line of business of $29 million, driven by favorable claims experience and favorable development on our Asbestos line of business of $24 million resulting from actuarial analysis. These were partially offset by adverse development on our General Casualty line of business of $18 million driven by adverse claims experience and adverse development on our Environmental line of business of $25 million due to results from actuarial reviews in the period.
Three Months Ended March 31, 2023:
The reduction in estimates of net ultimate losses of $15 million related to prior periods was primarily due to the workers’ compensation line of business as a result of continued favorable claims experience, most notably in the 2021 acquisition year.
Reduction in Provisions for ULAE
Three Months Ended March 31, 2024 and 2023:
The favorable reduction in provisions for ULAE for the three months ended March 31, 2024 and 2023 was driven by ULAE provision adjustments, due to the corresponding reductions in loss reserves and the associated estimated cost of managing such liabilities.
Changes in Fair Value - Fair Value Option
Three Months Ended March 31, 2024 and 2023:
PPD for the three months ended March 31, 2024 was favorably impacted by changes in the fair value of liabilities for which we have elected the fair value option of $4 million, which was primarily driven by an increase in U.K. corporate bond yields during the first quarter of 2024. The corporate bond yields, which form a component of the discount rate used to calculate the fair value of the liabilities, are matched to the original currencies of the underlying loss portfolios, of which GBP is the predominant currency for those portfolios that we have elected to measure at fair value using the fair value option.
Enstar Group Limited | First Quarter 2024 | Form 10-Q 30
Item 1 | Notes to Consolidated Financial Statements | Note 7. Future Policyholder Benefits
7. FUTURE POLICYHOLDER BENEFITS
The provision for future policyholder benefits includes provisions for life contingent liabilities assumed as well as other policy benefits for insureds. The future policyholder benefits are equal to the present value of the future benefits payments and related expenses less the present value of future net premiums.
The assumed liabilities for future policyholder benefits are comprised primarily of in-payment annuity contract liabilities, which are classified as limited-payment contracts. The balances of and changes in liability for future policyholder benefits is as follows:
| Three Months Ended March 31, | ||||||||
| 2023 | ||||||||
| (in millions of U.S. dollars) | ||||||||
| Beginning Balance | $ | |||||||
| Benefits paid | ( | |||||||
| Effect of exchange rate movement | ||||||||
Derecognition (1) | ( | |||||||
| Balance as of March 31 | ||||||||
There were no gross premiums recognized for the three months ended March 31, 2023.
The effects of actual variances from expected policyholder behavior experience were not material for the three month period ended March 31, 2023.
Novation of Future Policyholder Benefits
In November 2022, Enhanzed Re completed a novation of the reinsurance of a closed block of life annuity policies to Monument Re Limited, a subsidiary of Monument Insurance Group Limited (“Monument Re”). We settled the life liabilities and the related assets at carrying value in return for cash consideration of $94 million as of the closing date and recorded other income of $275 million. This amount consists of a reclassification adjustment of the component of AOCI related to the unlocking of the discount rate assumption from the adoption of ASU 2018-12 into earnings. Our net income attributable to Enstar was reduced by the amount attributable to Allianz’s 24.9 % noncontrolling interest in Enhanzed Re at the time of the transaction and our other income recorded was subject to deferral as profits emerge from the underlying novated business, which is generally over the expected settlement period of the life annuity policies, to account for our 20 % ownership interest in Monument Re at the time of the transaction.
Enstar Group Limited | First Quarter 2024 | Form 10-Q 31
Item 1 | Notes to Consolidated Financial Statements | Note 7. Future Policyholder Benefits
The following table illustrates the calculation of the gain as of the closing date of the novation:
| (in millions of U.S. dollars) | ||||||||
| Calculation of carrying value as of transaction closing: | ||||||||
| Funds held - directly managed and other assumed reinsurance recoverables | $ | |||||||
| Future policyholder benefits (corresponds to derecognition referenced above) | ( | |||||||
| Other assumed reinsurance liabilities | ( | |||||||
| Carrying value of net assets | $ | |||||||
| Calculation of gain on novation (recorded in first quarter 2023): | ||||||||
| Cash consideration received | $ | |||||||
| Less: carrying value of net assets | ( | |||||||
Add: reclassification of remeasurement of future policyholder benefits from AOCI and NCI (1) | ||||||||
Amount deferred relating to | ( | |||||||
Gain on novation (3) | ||||||||
| Net income attributable to noncontrolling interest | ( | |||||||
Gain on novation attributable to Enstar (4) | $ | |||||||
(1) Comprised of $273 million from AOCI and $90 million from NCI.
(2) Calculated as 20 % of the net Enstar transaction gain of $243 million (representing $324 million, consisting of the $39 million loss when comparing cash consideration to carrying value plus the $363 million reclassification benefit, less Allianz’s 24.9 % share equal to $81 million).
(3) Recognized in other income in our unaudited condensed consolidated statements of operations.
Enstar Group Limited | First Quarter 2024 | Form 10-Q 32
Item 1 | Notes to the Unaudited Condensed Consolidated Financial Statements | Note 8. Defendant Asbestos and Environmental Liabilities
8. DEFENDANT ASBESTOS AND ENVIRONMENTAL LIABILITIES
The carrying value of the defendant asbestos and environmental liabilities (“defendant A&E liabilities”), insurance recoveries, future estimated expenses and the fair value adjustments related to DCo and Morse TEC was as follows:
| March 31, 2024 | December 31, 2023 | ||||||||||
| (in millions of U.S. dollars) | |||||||||||
| Defendant A&E liabilities: | |||||||||||
| Defendant asbestos liabilities | $ | $ | |||||||||
| Defendant environmental liabilities | |||||||||||
| Estimated future expenses | |||||||||||
| Fair value adjustments | ( | ( | |||||||||
| Defendant A&E liabilities | |||||||||||
| Insurance balances recoverable: | |||||||||||
Insurance recoverables related to defendant asbestos liabilities (net of allowance: 2024 and 2023 - $ | |||||||||||
| Fair value adjustments | ( | ( | |||||||||
| Insurance balances recoverable | |||||||||||
| Net liabilities relating to defendant A&E exposures | $ | $ | |||||||||
The table below provides a consolidated reconciliation of the beginning and ending liability for defendant A&E liabilities:
| Three Months Ended | |||||||||||
| March 31, | |||||||||||
| 2024 | 2023 | ||||||||||
| (in millions of U.S. dollars) | |||||||||||
| Balance as of beginning of period | $ | $ | |||||||||
| Insurance balances recoverable | ( | ( | |||||||||
| Net balance as of beginning of period | |||||||||||
| Total paid claims | ( | ( | |||||||||
| Amounts recorded in other expense (income): | |||||||||||
| Reduction in estimates of ultimate net liabilities | ( | ||||||||||
| Reduction in estimated future expenses | ( | ( | |||||||||
| Amortization of fair value adjustments | |||||||||||
| Total other expense | |||||||||||
Net balance as of March 31 | |||||||||||
| Insurance balances recoverable | |||||||||||
Balance as of March 31 | $ | $ | |||||||||
Enstar Group Limited | First Quarter 2024 | Form 10-Q 33
Item 1 | Notes to the Unaudited Condensed Consolidated Financial Statements | Note 9. Fair Value Measurements
Fair Value Hierarchy
Fair value is defined as the price that would be received to sell an asset or paid to transfer a liability (i.e. the "exit price") in an orderly transaction between market participants. We use a fair value hierarchy that gives the highest priority to quoted prices in active markets and the lowest priority to unobservable data. The hierarchy is broken down into three levels as follows:
•Level 1 - Valuations based on unadjusted quoted prices in active markets that we have the ability to access for identical assets or liabilities. Valuation adjustments and block discounts are not applied to Level 1 instruments.
•Level 2 - Valuations based on quoted prices in active markets for similar assets or liabilities, quoted prices for identical assets or liabilities in inactive markets, or significant inputs that are observable (e.g. interest rates, yield curves, prepayment speeds, default rates, loss severities, etc.) or can be corroborated by observable market data.
•Level 3 - Valuations based on unobservable inputs where there is little or no market activity. Unadjusted third party pricing sources or management's assumptions and internal valuation models may be used to determine the fair values.
In addition, certain of our other investments are measured at fair value using net asset value ("NAV") per share (or its equivalent) as a practical expedient and have not been classified within the fair value hierarchy as defined above.
There have been no material changes in our valuation techniques during the period represented by these unaudited condensed consolidated financial statements.
Enstar Group Limited | First Quarter 2024 | Form 10-Q 34
Item 1 | Notes to the Unaudited Condensed Consolidated Financial Statements | Note 9. Fair Value Measurements
We have categorized our assets and liabilities that are recorded at fair value on a recurring and nonrecurring basis among levels based on the observability of inputs, or at fair value using NAV per share (or its equivalent) as follows:
| March 31, 2024 | |||||||||||||||||||||||||||||
| Quoted Prices in Active Markets for Identical Assets (Level 1) | Significant Other Observable Inputs (Level 2) | Significant Unobservable Inputs (Level 3) | Measured Using NAV as Practical Expedient | Total Fair Value | |||||||||||||||||||||||||
| (in millions of U.S. dollars) | |||||||||||||||||||||||||||||
| Investments: | |||||||||||||||||||||||||||||
| Short-term and fixed maturity investments: | |||||||||||||||||||||||||||||
| U.S. government and agency | $ | $ | $ | $ | — | $ | |||||||||||||||||||||||
| U.K. government | — | ||||||||||||||||||||||||||||
| Other government | — | ||||||||||||||||||||||||||||
| Corporate | — | ||||||||||||||||||||||||||||
| Municipal | — | ||||||||||||||||||||||||||||
| Residential mortgage-backed | — | ||||||||||||||||||||||||||||
| Commercial mortgage-backed | — | ||||||||||||||||||||||||||||
| Asset-backed | — | ||||||||||||||||||||||||||||
| $ | $ | $ | $ | — | $ | ||||||||||||||||||||||||
Funds held (1) | $ | $ | $ | $ | $ | ||||||||||||||||||||||||
| Equities: | |||||||||||||||||||||||||||||
| Publicly traded equity investments | $ | $ | $ | $ | — | $ | |||||||||||||||||||||||
| Exchange-traded funds | — | ||||||||||||||||||||||||||||
| Privately held equity investments | |||||||||||||||||||||||||||||
| $ | $ | $ | $ | $ | |||||||||||||||||||||||||
| Other investments: | |||||||||||||||||||||||||||||
| Private equity funds | |||||||||||||||||||||||||||||
| Private credit funds | |||||||||||||||||||||||||||||
| Hedge funds | $ | $ | $ | $ | $ | ||||||||||||||||||||||||
| Fixed income funds | |||||||||||||||||||||||||||||
| Real estate debt fund | |||||||||||||||||||||||||||||
| CLO equity funds | |||||||||||||||||||||||||||||
| CLO equities | |||||||||||||||||||||||||||||
| Equity funds | |||||||||||||||||||||||||||||
| $ | $ | $ | $ | $ | |||||||||||||||||||||||||
| Total Investments | $ | $ | $ | $ | $ | ||||||||||||||||||||||||
| Reinsurance balances recoverable on paid and unpaid losses: | $ | $ | $ | $ | — | $ | |||||||||||||||||||||||
| Other Assets: | |||||||||||||||||||||||||||||
| Derivatives qualifying as hedging | $ | $ | $ | $ | — | $ | |||||||||||||||||||||||
| Derivatives not qualifying as hedging | — | ||||||||||||||||||||||||||||
| Derivative instruments | $ | $ | $ | $ | — | $ | |||||||||||||||||||||||
| Losses and LAE: | $ | $ | $ | $ | — | $ | |||||||||||||||||||||||
(1) The difference in the amount of funds held shown at fair value and the funds held shown in our unaudited condensed consolidated balance sheet relates to the $2.5 billion of funds held by reinsured companies carried at amortized cost as of March 31, 2024.
Enstar Group Limited | First Quarter 2024 | Form 10-Q 35
Item 1 | Notes to the Unaudited Condensed Consolidated Financial Statements | Note 9. Fair Value Measurements
| December 31, 2023 | ||||||||||||||||||||||||||||||||
| Quoted Prices in Active Markets for Identical Assets (Level 1) | Significant Other Observable Inputs (Level 2) | Significant Unobservable Inputs (Level 3) | Measured Using NAV as Practical Expedient | Total Fair Value | ||||||||||||||||||||||||||||
| (in millions of U.S. dollars) | ||||||||||||||||||||||||||||||||
| Investments: | ||||||||||||||||||||||||||||||||
| Short-term and fixed maturity investments: | ||||||||||||||||||||||||||||||||
| U.S. government and agency | $ | $ | $ | $ | — | $ | ||||||||||||||||||||||||||
| U.K government | — | |||||||||||||||||||||||||||||||
| Other government | — | |||||||||||||||||||||||||||||||
| Corporate | — | |||||||||||||||||||||||||||||||
| Municipal | — | |||||||||||||||||||||||||||||||
| Residential mortgage-backed | — | |||||||||||||||||||||||||||||||
| Commercial mortgage-backed | — | |||||||||||||||||||||||||||||||
| Asset-backed | — | |||||||||||||||||||||||||||||||
| — | ||||||||||||||||||||||||||||||||
Funds held (1) | $ | $ | $ | $ | $ | |||||||||||||||||||||||||||
| Equities: | ||||||||||||||||||||||||||||||||
| Publicly traded equity investments | $ | $ | $ | $ | — | $ | ||||||||||||||||||||||||||
| Exchange-traded funds | — | |||||||||||||||||||||||||||||||
| Privately held equity investments | ||||||||||||||||||||||||||||||||
| $ | $ | $ | $ | $ | ||||||||||||||||||||||||||||
| Other investments: | ||||||||||||||||||||||||||||||||
| Private equity funds | $ | $ | $ | $ | $ | |||||||||||||||||||||||||||
| Private credit funds | ||||||||||||||||||||||||||||||||
| Fixed income funds | ||||||||||||||||||||||||||||||||
| Hedge funds | ||||||||||||||||||||||||||||||||
| Real estate debt fund | ||||||||||||||||||||||||||||||||
| CLO equity funds | ||||||||||||||||||||||||||||||||
| CLO equities | ||||||||||||||||||||||||||||||||
| Equity funds | ||||||||||||||||||||||||||||||||
| $ | $ | $ | $ | $ | ||||||||||||||||||||||||||||
| Total Investments | $ | $ | $ | $ | $ | |||||||||||||||||||||||||||
| Reinsurance balances recoverable on paid and unpaid losses: | $ | $ | $ | $ | — | $ | ||||||||||||||||||||||||||
| Other Assets: | ||||||||||||||||||||||||||||||||
| Derivatives qualifying as hedging | $ | $ | $ | $ | — | $ | ||||||||||||||||||||||||||
| Derivatives not qualifying as hedging | — | |||||||||||||||||||||||||||||||
| Derivative instruments | $ | $ | $ | $ | — | $ | ||||||||||||||||||||||||||
| Losses and LAE: | $ | $ | $ | $ | — | $ | ||||||||||||||||||||||||||
| Other Liabilities: | ||||||||||||||||||||||||||||||||
| Derivatives qualifying as hedging | $ | $ | $ | $ | — | $ | ||||||||||||||||||||||||||
| Derivatives not qualifying as hedging | — | |||||||||||||||||||||||||||||||
| Derivative instruments | $ | $ | $ | $ | — | $ | ||||||||||||||||||||||||||
(1) The difference in the amount of funds held shown at fair value and the funds held shown in our consolidated balance sheet relates to the $2.7 billion of funds held by reinsured companies carried at amortized cost as of December 31, 2023.
Enstar Group Limited | First Quarter 2024 | Form 10-Q 36
Item 1 | Notes to the Unaudited Condensed Consolidated Financial Statements | Note 9. Fair Value Measurements
Level 3 Measurements and Changes in Leveling
Transfers into or out of levels are recorded at their fair values as of the end of the reporting period, consistent with the date of determination of fair value.
Investments
The following table presents a reconciliation of the beginning and ending balances for all investments measured at fair value on a recurring basis using Level 3 inputs:
| Three Months Ended | |||||||||||||||||||||||||||||||||||||||||
| March 31, 2024 | March 31, 2023 | ||||||||||||||||||||||||||||||||||||||||
| Fixed maturity investments | Equities | Total | Equities | Total | |||||||||||||||||||||||||||||||||||||
| Corporate | Asset-backed | Privately-held Equities | Public Equities | Privately-held Equities | |||||||||||||||||||||||||||||||||||||
| (in millions of U.S. dollars) | |||||||||||||||||||||||||||||||||||||||||
| Beginning fair value | $ | $ | $ | $ | $ | $ | $ | ||||||||||||||||||||||||||||||||||
Total fair value changes in trading securities, funds held and other investments (1) | — | — | ( | — | ( | ( | ( | ||||||||||||||||||||||||||||||||||
| Transfer into Level 3 from Level 2 | — | — | — | — | |||||||||||||||||||||||||||||||||||||
| Ending fair value | $ | $ | $ | $ | $ | $ | $ | ||||||||||||||||||||||||||||||||||
(1) Fair value changes in trading securities, funds held and other investments included in our unaudited condensed consolidated statements of operations is equal to the change in fair value changes in trading securities, funds held and other investments relating to assets held at the end of the reporting period.
Fair value changes in trading securities, funds held and other investments related to Level 3 assets in the tables above are included in fair value changes in trading securities, funds held and other investments in our unaudited condensed consolidated statements of operations.
Transfers into Level 3 are primarily attributable to the lack of observable market transactions and price information and the use of unobservable inputs within valuation methodologies.
Enstar Group Limited | First Quarter 2024 | Form 10-Q 37
Item 1 | Notes to the Unaudited Condensed Consolidated Financial Statements | Note 9. Fair Value Measurements
Valuation Techniques and Inputs
The table below presents the quantitative information related to the fair value measurements for our fixed maturity and equity investments measured at fair value on a recurring basis using Level 3 inputs:
| Qualitative Information about Level 3 Fair Value Measurements | ||||||||||||||||||||
| Valuation Techniques | Fair Value as of March 31, 2024 | Unobservable Input | Range (Average) (1) | |||||||||||||||||
| (in millions of U.S. dollars) | ||||||||||||||||||||
| Fixed maturities | ||||||||||||||||||||
| Corporate | YTM | |||||||||||||||||||
| Discounted cash flow | $ | |||||||||||||||||||
| Asset-backed | ||||||||||||||||||||
| Discounted cash flow | ||||||||||||||||||||
| Cost | ||||||||||||||||||||
| Total fixed maturities | $ | |||||||||||||||||||
| Privately held equity investments | ||||||||||||||||||||
| Guideline company methodology; Option pricing model | $ | P/BV multiple P/BV (excluding AOCI) multiple Expected term | ||||||||||||||||||
Guideline companies method | P/BV multiple Price/2024 earnings | |||||||||||||||||||
| Guideline companies method; Earnings | LTM Enterprise Value/ EBITDA multiples LTM EV/Revenue multiples Multiple on earnings | |||||||||||||||||||
| Dividend discount model | Discount rate | |||||||||||||||||||
| Publicly traded equity investments | ||||||||||||||||||||
| Discounted cash flow | Implied total yield | |||||||||||||||||||
| Total equity investments | $ | |||||||||||||||||||
(1) The average represents the arithmetic average of the inputs and is not weighted by the relative fair value.
Funds Held by Reinsured Companies - Embedded Derivative
As described in Note 3, we have an embedded derivative in relation to the Aspen LPT transaction to account for the fair value of the full crediting rate we expect to earn on the funds withheld received as consideration.
The following table presents a reconciliation of the beginning and ending balances for the embedded derivative measured at fair value on a recurring basis using Level 3 inputs:
| Three Months Ended March 31, | |||||||||||
| 2024 | 2023 | ||||||||||
| (in millions of U.S. dollars) | |||||||||||
| Beginning fair value | $ | $ | |||||||||
| Total fair value changes | ( | ||||||||||
| Ending fair value | $ | $ | |||||||||
Fair value changes in trading securities, funds held and other investments in the table above are included in fair value changes in trading securities, funds held and other investments in our unaudited condensed consolidated statements of operations.
Enstar Group Limited | First Quarter 2024 | Form 10-Q 38
Item 1 | Notes to the Unaudited Condensed Consolidated Financial Statements | Note 9. Fair Value Measurements
Valuations Techniques and Inputs
The table below presents the qualitative information related to the fair value measurements for the embedded derivative on our funds held by reinsured companies measured at fair value on a recurring basis using Level 3 inputs:
| Qualitative Information about Level 3 Fair Value Measurements | ||||||||||||||||||||
| Valuation Techniques | Fair Value as of March 31, 2024 | Unobservable Input | Average | |||||||||||||||||
| (in millions of U.S. dollars) | ||||||||||||||||||||
| Monte Carlo simulation model; Discounted cash flow analysis | $ | Volatility rate; Expected Loss Payments | $ | |||||||||||||||||
Insurance Contracts - Fair Value Option
The following table presents a reconciliation of the beginning and ending balances for all insurance contracts measured at fair value on a recurring basis using Level 3 inputs:
| Three Months Ended March 31, | |||||||||||||||||||||||||||||||||||
| 2024 | 2023 | ||||||||||||||||||||||||||||||||||
| Liability for losses and LAE | Reinsurance balances recoverable | Net | Liability for losses and LAE | Reinsurance balances recoverable | Net | ||||||||||||||||||||||||||||||
| (in millions of U.S. dollars) | |||||||||||||||||||||||||||||||||||
| Beginning fair value | $ | $ | $ | $ | $ | $ | |||||||||||||||||||||||||||||
| Incurred losses and LAE: | |||||||||||||||||||||||||||||||||||
| Increase (reduction) in estimates of ultimate losses | ( | ( | |||||||||||||||||||||||||||||||||
| Reduction in provisions for ULAE | ( | ( | ( | ( | |||||||||||||||||||||||||||||||
| Changes in fair value due to changes in: | |||||||||||||||||||||||||||||||||||
| Average payout | |||||||||||||||||||||||||||||||||||
| Corporate bond yield | ( | ( | ( | ||||||||||||||||||||||||||||||||
| Risk cost of capital | |||||||||||||||||||||||||||||||||||
| Total change in fair value | ( | ( | ( | ||||||||||||||||||||||||||||||||
| Total incurred losses and LAE | ( | ( | ( | ||||||||||||||||||||||||||||||||
| Paid losses | ( | ( | ( | ( | ( | ( | |||||||||||||||||||||||||||||
| Effect of exchange rate movements | ( | ( | |||||||||||||||||||||||||||||||||
| Ending fair value | $ | $ | $ | $ | $ | $ | |||||||||||||||||||||||||||||
Below is a summary of the quantitative information regarding the significant observable and unobservable inputs used in the internal model to determine fair value on a recurring basis:
| Valuation Technique | March 31, 2024 | December 31, 2023 | ||||||||||||
| Unobservable (U) and Observable (O) Inputs | Weighted Average | |||||||||||||
| Internal model | Corporate bond yield (O) | A Rated | A Rated | |||||||||||
| Internal model | Credit spread for Instrument-specific credit risk (U) | |||||||||||||
| Internal model | Risk cost of capital (U) | |||||||||||||
| Internal model | Weighted average cost of capital (U) | |||||||||||||
| Internal model | Average payout - liability (U) | |||||||||||||
| Internal model | Average payout - reinsurance balances recoverable on paid and unpaid losses (U) | |||||||||||||
The fair value of the liability for losses and LAE and reinsurance balances recoverable on paid and unpaid losses may increase or decrease due to changes in the corporate bond rate, the credit spread for non-performance risk, the risk cost of capital, the weighted average cost of capital and the estimated payment pattern.
In addition, the estimate of the capital required to support the liabilities is based upon current industry standards for capital adequacy.
Enstar Group Limited | First Quarter 2024 | Form 10-Q 39
Item 1 | Notes to the Unaudited Condensed Consolidated Financial Statements | Note 9. Fair Value Measurements
Changes in the fair value due to changes in average payout and corporate bond yields are included in net incurred losses and loss adjustment expenses in our unaudited condensed consolidated statements of earnings. Changes in the fair value due to changes in credit spread for Instrument-specific credit risk are classified to other comprehensive income.
Disclosure of Fair Values for Financial Instruments Carried at Cost
Senior and Junior Subordinated Notes
The following table presents the fair values of our Senior and Junior Subordinated Notes carried at amortized cost:
| March 31, 2024 | ||||||||||||||
| Amortized Cost | Fair Value | |||||||||||||
| (in millions of U.S. dollars) | ||||||||||||||
| $ | $ | |||||||||||||
| Total Senior Notes | $ | $ | ||||||||||||
| $ | $ | |||||||||||||
| Total Junior Subordinated Notes | $ | $ | ||||||||||||
The fair value of our Senior Notes and our Junior Subordinated Notes was based on observable market pricing from a third party pricing service.
Both the Senior Notes and Junior Subordinated Notes are classified as Level 2.
Insurance Contracts
Disclosure of fair value of amounts relating to insurance contracts is not required, except those for which we elected the fair value option, as described above.
Remaining Financial Assets and Liabilities
Our remaining financial assets and liabilities were generally carried at cost or amortized cost, which due to their short-term nature approximates fair value as of March 31, 2024 and December 31, 2023.
Enstar Group Limited | First Quarter 2024 | Form 10-Q 40
Item 1 | Notes to the Unaudited Condensed Consolidated Financial Statements | Note 10. Variable Interest Entities
10. VARIABLE INTEREST ENTITIES
We have investments in certain limited partnership funds which are deemed to be variable interest entities ("VIEs"). The activities of these VIEs are generally limited to holding investments and our involvement in these entities is passive in nature. We consolidate all VIEs in which we are considered to be the primary beneficiary.
GCM Fund
In July 2022, we entered into an agreement to become a limited partner of GCM Blue Sails Infrastructure Offshore Opportunities Fund, L.P. (“GCM Fund”), with an initial commitment of $150 million. At that time, we performed an assessment and concluded that as a result of being a limited partner and having no substantive kick-out or participating rights, the GCM Fund is a VIE. We also concluded that we are the primary beneficiary, as our 99.5 % economic interest in the GCM Fund is disproportionately greater than our lack of stated power to direct the activities of the GCM Fund that will most significantly impact the GCM Fund’s economic performance. As a result, we have consolidated the results of the GCM Fund. There was no gain or loss recognized on consolidation.
We recognize the results of the GCM Fund on a one quarter lag. As of March 31, 2024, $100 million of the initial commitment has been called. The carrying amounts of the assets and liabilities of the GCM Fund are presented within existing captions on our consolidated balance sheet as of March 31, 2024. Net investment income, changes in the fair value of assets and liabilities of the GCM Fund and management fees are presented within existing captions in the consolidated statements of operations.
We recognized fair value changes in trading securities, funds held and other investments of $1 million for the three months ended March 31, 2024. Such amounts were less than $1 million for the three months ended March 31, 2023.
Our exposure to risk of loss is limited to the amount of our investment, in accordance with the limited partnership agreement. We have not committed to provide any financial support to the general partner of the GCM Fund. In addition, we have not committed to provide any additional financial support to the GCM Fund in excess of previously funded capital commitments and all undistributed profits and income.
The assets of Enstar are not available to the creditors of the GCM Fund.
Nonconsolidated VIEs
The tables below present the fair value of our investments in nonconsolidated VIEs as well as our maximum exposure to loss associated with these VIEs:
| March 31, 2024 | December 31, 2023 | ||||||||||||||||||||||||||||||||||
| Fair Value | Unfunded Commitments | Maximum Exposure to Loss | Fair Value | Unfunded Commitments | Maximum Exposure to Loss | ||||||||||||||||||||||||||||||
| (in millions of U.S. dollars) | |||||||||||||||||||||||||||||||||||
| Equities | |||||||||||||||||||||||||||||||||||
| Publicly traded equity investment in common stock | $ | $ | $ | $ | $ | $ | |||||||||||||||||||||||||||||
| Privately Held Equity | |||||||||||||||||||||||||||||||||||
| Total | $ | $ | $ | $ | $ | $ | |||||||||||||||||||||||||||||
| Other investments | |||||||||||||||||||||||||||||||||||
| Hedge funds | $ | $ | $ | $ | $ | $ | |||||||||||||||||||||||||||||
| Fixed income funds | |||||||||||||||||||||||||||||||||||
| Private equity funds | |||||||||||||||||||||||||||||||||||
| CLO equity funds | |||||||||||||||||||||||||||||||||||
| Private credit funds | |||||||||||||||||||||||||||||||||||
| Real estate funds | |||||||||||||||||||||||||||||||||||
| Total | $ | $ | $ | $ | $ | $ | |||||||||||||||||||||||||||||
| Total investments in nonconsolidated VIEs | $ | $ | $ | $ | $ | $ | |||||||||||||||||||||||||||||
Enstar Group Limited | First Quarter 2024 | Form 10-Q 41
Item 1 | Notes to the Unaudited Condensed Consolidated Financial Statements | Note 11. Noncontrolling Interests
11. NONCONTROLLING INTERESTS
Redeemable Noncontrolling Interests
In December 2023, we entered into a Purchase Agreement with Trident V Funds and Dowling Capital Partners (together, the “RNCI Holders”) to purchase their remaining equity interest in StarStone Specialty Holdings Limited (“SSHL”). Following the completion of the transaction in December 2023, SSHL became a wholly-owned subsidiary and all redeemable non-controlling interests (“RNCI”) within our unaudited condensed consolidated balance sheets were redeemed.
The following is a reconciliation of the beginning and ending carrying amount of the equity attributable to the RNCI in the prior year period (as of December 2023 we no longer held any RNCI):
| Three Months Ended | |||||
| March 31, | |||||
| 2023 | |||||
| (in millions of U.S. dollars) | |||||
| Balance at beginning of period | $ | ||||
| Net income attributable to RNCI | |||||
| Change in unrealized gains on AFS investments attributable to RNCI | |||||
Balance as of March 31 | $ | ||||
Noncontrolling Interests
As of March 31, 2024 and December 31, 2023, we had $114 million and $113 million, respectively, of non-controlling interests (“NCI”) primarily related to external interests in our subsidiaries.
In December 2022, Enhanzed Re repurchased the entire 24.9 % ownership interest Allianz held in Enhanzed Re for $175 million. We recorded the impact of reclassifying the carrying value of the NCI acquired to Enstar shareholders’ equity in our first quarter 2023 results, as we report the results of Enhanzed Re on a one quarter reporting lag.
A reconciliation of the beginning and ending carrying amount of the equity attributable to NCI is included in the unaudited condensed consolidated statements of changes in shareholder's equity.
Enstar Group Limited | First Quarter 2024 | Form 10-Q 42
Item 1 | Notes to the Unaudited Condensed Consolidated Financial Statements | Note 12. Shareholders' Equity
12. SHAREHOLDERS' EQUITY
Ordinary Shares
The following is a reconciliation of our beginning and ending ordinary shares:
| Total Voting Ordinary Shares | |||||
Balance as of December 31, 2023 | |||||
Shares issued (1) | |||||
Balance as of March 31, 2024 | |||||
(1) Ordinary Shares issued in relation to share-based compensation plan awards and the Employee Share Purchase Plan.
Non-voting Ordinary Shares
Strategic Share Repurchases
In March 2023, we repurchased 1,597,712 of our non-voting convertible ordinary shares held by Canada Pension Plan Investment Board (“CPP Investments”) for an aggregate $341 million, representing a price per share of $213.13 and a 5 % discount to the trailing 10 -day volume weighted average price of our voting ordinary shares as at the agreed March 2023 measurement date. The shares comprised all of our outstanding Series C and Series E non-voting ordinary shares.
There were no non-voting ordinary shares repurchased during the three months ended March 31, 2024.
Dividends on Preferred Shares
During the three months ended March 31, 2024 and 2023, we declared and paid dividends on Series D Preferred Shares of $7 2
Accumulated Other Comprehensive Income (Loss)
The following tables present a roll forward of accumulated other comprehensive income (loss):
| Three Months Ended | |||||||||||||||||||||||
March 31, | |||||||||||||||||||||||
| 2024 | |||||||||||||||||||||||
| Unrealized gains (losses) arising during the year | Cumulative Currency Translation Adjustment | Insurance contracts - net liability for losses and LAE at fair value - Instrument-specific credit risk | Total | ||||||||||||||||||||
| (in millions of U.S. dollars) | |||||||||||||||||||||||
| Balance December 31, 2023, net of tax | $ | ( | $ | $ | $ | ( | |||||||||||||||||
| Unrealized losses on fixed maturities, AFS arising during the period | ( | — | — | ( | |||||||||||||||||||
| Reclassification adjustment for change in allowance for credit losses recognized in net income | — | — | |||||||||||||||||||||
| Reclassification adjustment for net realized losses included in net income | — | — | |||||||||||||||||||||
| Change in currency translation adjustment | — | ( | — | ( | |||||||||||||||||||
| Other comprehensive loss | ( | ( | ( | ||||||||||||||||||||
| Balance March 31, 2024, net of tax | $ | ( | $ | $ | $ | ( | |||||||||||||||||
Enstar Group Limited | First Quarter 2024 | Form 10-Q 43
Item 1 | Notes to the Unaudited Condensed Consolidated Financial Statements | Note 12. Shareholders' Equity
| Three Months Ended | |||||||||||||||||||||||
March 31, | |||||||||||||||||||||||
| 2023 | |||||||||||||||||||||||
| Unrealized gains (losses) on available-for-sale investments | Cumulative currency translation adjustment | Remeasurement of future policyholder benefits - change in discount rate | Total | ||||||||||||||||||||
| (in millions of U.S. dollars) | |||||||||||||||||||||||
| Balance December 31, 2022, net of tax | $ | ( | $ | $ | $ | ( | |||||||||||||||||
| Unrealized gains on fixed maturities, AFS arising during the period | — | — | |||||||||||||||||||||
| Reclassification adjustment for change in allowance for credit losses recognized in net income | ( | — | — | ( | |||||||||||||||||||
| Reclassification adjustment for net realized losses included in net income | — | — | |||||||||||||||||||||
| Change in currency translation adjustment | — | — | |||||||||||||||||||||
| Reclassification adjustment for remeasurement of future policyholder benefits included in net income | — | — | ( | ( | |||||||||||||||||||
| Other comprehensive income (loss) | ( | ( | |||||||||||||||||||||
| Other comprehensive (income) loss attributable to NCI and RNCI | ( | ||||||||||||||||||||||
| Balance March 31, 2023, net of tax | $ | ( | $ | $ | $ | ( | |||||||||||||||||
The following table presents details about the tax effects allocated to each component of other comprehensive income (loss):
| Three Months Ended | |||||||||||||||||||||||||||||||||||
March 31, | |||||||||||||||||||||||||||||||||||
| 2024 | 2023 | ||||||||||||||||||||||||||||||||||
| Before Tax Amount | Tax (Expense) Benefit | Net of Tax Amount | Before Tax Amount | Tax (Expense) Benefit | Net of Tax Amount | ||||||||||||||||||||||||||||||
| (in millions of U.S. dollars) | |||||||||||||||||||||||||||||||||||
| Unrealized (losses) gains on fixed maturities, AFS arising during the period | $ | ( | $ | $ | ( | $ | $ | ( | $ | ||||||||||||||||||||||||||
| Reclassification adjustment for change in allowance for credit losses recognized in net income | — | ( | — | ( | |||||||||||||||||||||||||||||||
| Reclassification adjustment for net realized losses included in net income | — | — | |||||||||||||||||||||||||||||||||
| Change in currency translation adjustment | ( | — | ( | — | |||||||||||||||||||||||||||||||
| Remeasurement of future policyholder benefits - change in interest rate | — | — | — | ( | — | ( | |||||||||||||||||||||||||||||
| Other comprehensive loss | $ | ( | $ | $ | ( | $ | ( | $ | ( | $ | ( | ||||||||||||||||||||||||
The following tables present details of amounts reclassified from accumulated other comprehensive loss:
| Three Months Ended | ||||||||||||||
March 31, | ||||||||||||||
| Details about AOCI components | 2024 | 2023 | Affected Line Item in Statement where Net Income are presented | |||||||||||
| (in millions of U.S. dollars) | ||||||||||||||
| Unrealized losses on fixed maturities, AFS | $ | ( | $ | ( | Net realized losses | |||||||||
| ( | ( | Net of tax | ||||||||||||
| Remeasurement of future policyholder benefits | Other income | |||||||||||||
| Total reclassifications for the period, net of tax | $ | ( | $ | |||||||||||
Enstar Group Limited | First Quarter 2024 | Form 10-Q 44
Item 1 | Notes to the Unaudited Condensed Consolidated Financial Statements | Note 12. Shareholders' Equity
Changes in Ownership of Consolidated Subsidiaries
The following table summarizes changes in the ownership interest in consolidated subsidiaries during the periods presented:
| Three Months Ended | |||||||||||
March 31, | |||||||||||
| 2024 | 2023 | ||||||||||
| (in millions of U.S. dollars) | |||||||||||
| Net income attributable to Enstar ordinary shareholders | $ | $ | |||||||||
| Transfers from noncontrolling interests: | |||||||||||
Increase in Enstar’s additional paid-in capital for purchase of noncontrolling interest (1) | |||||||||||
| Change from net income attributable to Enstar ordinary shareholders and net transfers from noncontrolling interests | $ | $ | |||||||||
Enstar Group Limited | First Quarter 2024 | Form 10-Q 45
Item 1 | Notes to the Unaudited Condensed Consolidated Financial Statements | Note 13. Earnings Per Share
The following table sets forth the computation of basic and diluted net earnings per ordinary share:
| Three Months Ended | |||||||||||
| March 31, | |||||||||||
| 2024 | 2023 | ||||||||||
| (in millions of U.S. dollars, except share and per share data) | |||||||||||
| Numerator: | |||||||||||
| Net income attributable to Enstar ordinary shareholders: | $ | $ | |||||||||
| Denominator: | |||||||||||
Weighted-average ordinary shares outstanding — basic (1) | |||||||||||
| Effect of dilutive securities: | |||||||||||
Share-based compensation plans (2) | |||||||||||
| Weighted-average ordinary shares outstanding — diluted | |||||||||||
| Earnings per share attributable to Enstar ordinary shareholders: | |||||||||||
| Basic | $ | $ | |||||||||
| Diluted | $ | $ | |||||||||
(1) Weighted-average ordinary shares for basic earnings per share includes ordinary shares (voting and non-voting), but excludes ordinary shares held in the Enstar Group Limited Employee Benefit Trust (the "EB Trust") in respect of Joint Share Ownership Plan ("JSOP") awards, which, as a result of us consolidating the EB trust, are classified as treasury shares.
Enstar Group Limited | First Quarter 2024 | Form 10-Q 46
Item 1 | Notes to the Unaudited Condensed Consolidated Financial Statements | Note 14. Related Party Transactions
The following tables summarize our related party balances and transactions. Additional details about the nature of our relationships and transactions are disclosed in Note 24 to the consolidated financial statements in our Annual Report on Form 10-K for the year ended December 31, 2023.
As of March 31, 2024 | Stone Point (1) (2) | Monument | AmTrust | Citco | Core Specialty | Other (3) | |||||||||||||||||||||||||||||
| (in millions of U.S. dollars) | |||||||||||||||||||||||||||||||||||
| Assets | |||||||||||||||||||||||||||||||||||
| Fixed maturities, trading, at fair value | $ | $ | — | $ | — | $ | — | $ | — | $ | — | ||||||||||||||||||||||||
| Fixed maturities, AFS, at fair value | — | — | — | — | — | ||||||||||||||||||||||||||||||
| Equities, at fair value | — | — | — | — | |||||||||||||||||||||||||||||||
| Funds held | — | — | — | — | — | ||||||||||||||||||||||||||||||
| Other investments, at fair value | — | — | — | — | |||||||||||||||||||||||||||||||
| Equity method investments | — | — | |||||||||||||||||||||||||||||||||
| Total investments | |||||||||||||||||||||||||||||||||||
| Cash and cash equivalents | — | — | — | — | — | ||||||||||||||||||||||||||||||
| Other assets | — | — | — | — | |||||||||||||||||||||||||||||||
| Liabilities | |||||||||||||||||||||||||||||||||||
| Losses and LAE | — | — | — | — | — | ||||||||||||||||||||||||||||||
| Insurance and reinsurance balances payable | — | — | — | — | — | ||||||||||||||||||||||||||||||
| Other liabilities | — | — | — | — | — | ||||||||||||||||||||||||||||||
| Net assets | $ | $ | $ | $ | $ | $ | |||||||||||||||||||||||||||||
(1) As of March 31, 2024, investment funds managed by Stone Point Capital LLC ("Stone Point") own 1,451,196 of our Voting Ordinary Shares, which constitutes 9.5 % of our outstanding Voting Ordinary Shares.
(2) As of March 31, 2024, we had unfunded commitments of $137 million to other investments, and $12 million to privately held equity managed by Stone Point and its affiliated entities.
(3) Other related party investments include investments in limited partnerships and partnership-like limited liabilities companies, for which had we not elected the fair value option, would be accounted for as equity method investments. We have disclosed our investments in these entities on an aggregated basis as they are individually immaterial.
| As of December 31, 2023 | Stone Point | Monument | AmTrust | Citco | Core Specialty | Other | |||||||||||||||||||||||||||||
| (in millions of U.S. dollars) | |||||||||||||||||||||||||||||||||||
| Assets | |||||||||||||||||||||||||||||||||||
| Fixed maturities, trading, at fair value | $ | $ | — | $ | — | $ | — | $ | — | $ | — | ||||||||||||||||||||||||
| Fixed maturities, AFS, at fair value | — | — | — | — | — | ||||||||||||||||||||||||||||||
| Equities, at fair value | — | — | — | — | |||||||||||||||||||||||||||||||
| Funds held | — | — | — | — | — | ||||||||||||||||||||||||||||||
| Other investments, at fair value | — | — | — | — | |||||||||||||||||||||||||||||||
| Equity method investments | — | — | |||||||||||||||||||||||||||||||||
| Total investments | |||||||||||||||||||||||||||||||||||
| Cash and cash equivalents | — | — | — | — | — | ||||||||||||||||||||||||||||||
| Other assets | — | — | — | — | |||||||||||||||||||||||||||||||
| Liabilities | |||||||||||||||||||||||||||||||||||
| Losses and LAE | — | — | — | — | — | ||||||||||||||||||||||||||||||
| Net assets | $ | $ | $ | $ | $ | $ | |||||||||||||||||||||||||||||
Enstar Group Limited | First Quarter 2024 | Form 10-Q 47
Item 1 | Notes to the Unaudited Condensed Consolidated Financial Statements | Note 14. Related Party Transactions
| Three Months Ended | |||||||||||||||||||||||||||||||||||
| March 31, 2024 | |||||||||||||||||||||||||||||||||||
| Stone Point | Monument | AmTrust | Citco | Core Specialty | Other | ||||||||||||||||||||||||||||||
| (in millions of U.S. dollars) | |||||||||||||||||||||||||||||||||||
| REVENUES | |||||||||||||||||||||||||||||||||||
| Net premiums earned | $ | — | $ | — | $ | — | $ | — | $ | $ | — | ||||||||||||||||||||||||
| Net investment income | — | — | |||||||||||||||||||||||||||||||||
| Fair value changes in trading securities, funds held and other investments | — | ( | — | — | |||||||||||||||||||||||||||||||
| Total revenues | |||||||||||||||||||||||||||||||||||
| EXPENSES | |||||||||||||||||||||||||||||||||||
| Net incurred losses and LAE | — | — | — | — | — | ||||||||||||||||||||||||||||||
| Total expenses | |||||||||||||||||||||||||||||||||||
| (Loss) income from equity method investments | — | ( | — | ( | |||||||||||||||||||||||||||||||
| Total net (loss) income | $ | $ | ( | $ | $ | $ | $ | ||||||||||||||||||||||||||||
| Three Months Ended | |||||||||||||||||||||||||||||||||||
| March 31, 2023 | |||||||||||||||||||||||||||||||||||
| Stone Point | Monument | AmTrust | Citco | Core Specialty | Other | ||||||||||||||||||||||||||||||
| (in millions of U.S. dollars) | |||||||||||||||||||||||||||||||||||
| REVENUES | |||||||||||||||||||||||||||||||||||
| Net investment income | — | — | — | ||||||||||||||||||||||||||||||||
| Net realized gains | — | — | — | — | — | ||||||||||||||||||||||||||||||
| Fair value changes in trading securities, funds held and other investments | — | ( | — | — | |||||||||||||||||||||||||||||||
| Total revenues | |||||||||||||||||||||||||||||||||||
| EXPENSES | |||||||||||||||||||||||||||||||||||
| Net incurred losses and LAE | — | — | — | — | ( | — | |||||||||||||||||||||||||||||
| Total expenses | ( | ||||||||||||||||||||||||||||||||||
| (Loss) income from equity method investments | — | ( | — | — | |||||||||||||||||||||||||||||||
| Total net income (loss) | $ | $ | ( | $ | $ | $ | $ | ||||||||||||||||||||||||||||
Enstar Group Limited | First Quarter 2024 | Form 10-Q 48
Item 1 | Notes to the Unaudited Condensed Consolidated Financial Statements | Note 15. Commitments and Contingencies
Concentration of Credit Risk
We are subject to credit risk principally in relation to our:
i.investments, including equity method investments;
ii.cash and cash equivalents and restricted cash and cash equivalents;
iii.assets pledged to ceding companies under reinsurance contracts;
iv.(re)insurance balances recoverable on paid and unpaid losses; and
v.funds held by reinsured companies and funds held - directly managed (together funds held).
As of March 31, 2024, we had funds held concentrations to reinsurance counterparties exceeding 10% of shareholders’ equity of $4.5 billion (December 31, 2023: $4.8 billion) in aggregate. However, we generally have the contractual ability to offset any shortfall in the payment of the funds held balances with amounts owed by us.
We limit the amount of credit exposure to any one counterparty, and none of our counterparty credit exposures, excluding U.S. government and agency instruments and the reinsurance counterparties noted above, exceeded 10% of shareholders’ equity as of March 31, 2024. As of March 31, 2024, our credit exposure to the U.S. government and agency instruments was $848 million (December 31, 2023: $932 million).
Legal Proceedings
We are, from time to time, involved in various legal proceedings in the ordinary course of business, including litigation and arbitration regarding claims. Estimated losses relating to claims arising in the ordinary course of business, including the anticipated outcome of any pending arbitration or litigation, are included in the liability for losses and LAE in our unaudited condensed consolidated balance sheets. In addition to claims litigation, we may be subject to other lawsuits and regulatory actions in the normal course of business, which may involve, among other things, allegations of underwriting errors or omissions, employment claims or regulatory activity. We do not believe that the resolution of any currently pending legal proceedings, either individually or taken as a whole, will have a material effect on our business, results of operations or financial condition. We anticipate that, similar to the rest of the (re)insurance industry, we will continue to be subject to litigation and arbitration proceedings in the ordinary course of business, including litigation generally related to the scope of coverage with respect to A&E and other claims.
Unfunded Investment Commitments
As of March 31, 2024, we had unfunded commitments of $1.6 billion to other investments, and $12 million to privately held equity.
Guarantees
Enstar Group Limited | First Quarter 2024 | Form 10-Q 49
Item 1 | Notes to the Unaudited Condensed Consolidated Financial Statements | Note 16. Subsequent Events
16. SUBSEQUENT EVENTS
Transactions
SiriusPoint
Enstar Group Limited | First Quarter 2024 | Form 10-Q 50
ITEM 2. MANAGEMENT’S DISCUSSION AND ANALYSIS OF FINANCIAL CONDITION AND RESULTS OF OPERATIONS
Unless the context indicates otherwise, the terms "Enstar," "we," "us" or "our" mean Enstar Group Limited and its consolidated subsidiaries.
The following discussion and analysis of our financial condition as of March 31, 2024 and our results of operations for the three months ended March 31, 2024 and 2023 should be read in conjunction with our unaudited condensed consolidated financial statements and the related notes included elsewhere in this quarterly report and the audited consolidated financial statements and notes thereto included in our Annual Report on Form 10-K for the year ended December 31, 2023.
Some of the information contained in this discussion and analysis or included elsewhere in this quarterly report, including information with respect to our plans and strategy for our business, includes forward-looking statements that involve risks, uncertainties and assumptions. Our actual results and the timing of events could differ materially from those anticipated by these forward-looking statements as a result of many factors, including those discussed under "Cautionary Statement Regarding Forward-Looking Statements" and Item 1A of our Annual Report on Form 10-K for the year ended December 31, 2023.
Table of Contents
| Section | Page | |||||||
Consolidated Results of Operations — for the Three Months Ended March 31, 2024 and 2023 | ||||||||
Results of Operations by Segment — for the Three Months Ended March 31, 2024 and 2023 | ||||||||
Enstar Group Limited | First Quarter 2024 | Form 10-Q 51
Operational Highlights
Our consolidated results for the three months ended March 31, 2024 reflect our continued progress on providing capital release solutions to our clients by acquiring and managing their run-off portfolios.
Capital Activity
In March 2024 Cavello Bay Reinsurance Limited (“Cavello”), a wholly owned subsidiary of Enstar, was assigned an S&P Insurer Financial Strength Rating of ‘A’ with stable outlook. Cavello is Enstar’s primary non-life run-off consolidator, and a Class 3B reinsurer.
Enstar Group Limited | First Quarter 2024 | Form 10-Q 52
Consolidated Results of Operations - For the Three Months Ended March 31, 2024 and 2023
Primary GAAP Financial Measures
We use the following GAAP measures to manage the company and monitor our performance:
•Net income and net income attributable to Enstar ordinary shareholders, collectively provide a measure of our performance focusing on underwriting, investment and expense results;
•Comprehensive income attributable to Enstar, which provides a measure of the total return, including unrealized gains and losses on fixed maturities, AFS investments, as well as other elements of other comprehensive income;
•Book value per share (“BVPS”), which we use to measure the value of our company over time;
•Return on equity (“ROE”), which measures our profitability by dividing our net income attributable to Enstar ordinary shareholders by opening Enstar ordinary shareholders’ equity;
•Total investment return (“TIR”), which measures the rate of return we obtain, realized, unrealized and fair value changes, on our investments; and
•Run-off liability earnings (“RLE”) and RLE %, which measure both the dollar amount of prior period development on our acquired portfolios (RLE) and the percentage of prior period development relative to average net loss reserves, calculated by dividing our prior period development by our average net loss reserves (RLE %).
Enstar Group Limited | First Quarter 2024 | Form 10-Q 53
The following table sets forth certain condensed consolidated financial information:
| Three Months Ended | |||||||||||||||||
| March 31, | $ / pp Change | ||||||||||||||||
| 2024 | 2023 | ||||||||||||||||
| (in millions of U.S. dollars, except per share data) | |||||||||||||||||
| Technical Results | |||||||||||||||||
| Net premiums earned | $ | 11 | $ | 8 | $ | 3 | |||||||||||
| Net incurred losses and LAE | |||||||||||||||||
| Current period | 5 | 10 | (5) | ||||||||||||||
| Prior period | (24) | (10) | (14) | ||||||||||||||
| Total net incurred losses and LAE | (19) | — | (19) | ||||||||||||||
| Acquisition costs | 1 | 2 | (1) | ||||||||||||||
| Investment Results | |||||||||||||||||
| Net investment income | 160 | 156 | 4 | ||||||||||||||
| Net realized losses | (6) | (18) | 12 | ||||||||||||||
| Fair value changes in trading securities, funds held and other investments | 85 | 206 | (121) | ||||||||||||||
| (Loss) income from equity method investments | (5) | 11 | (16) | ||||||||||||||
| Other income | — | 280 | (280) | ||||||||||||||
| Amortization of net deferred charge assets | 30 | 17 | 13 | ||||||||||||||
| General and administrative expenses | 87 | 89 | (2) | ||||||||||||||
| NET INCOME | 128 | 519 | (391) | ||||||||||||||
| Net income attributable to noncontrolling interests | — | (86) | 86 | ||||||||||||||
| NET INCOME ATTRIBUTABLE TO ENSTAR ORDINARY SHAREHOLDERS | $ | 119 | $ | 424 | $ | (305) | |||||||||||
| COMPREHENSIVE INCOME ATTRIBUTABLE TO ENSTAR | $ | 100 | $ | 239 | $ | (139) | |||||||||||
| GAAP measures: | |||||||||||||||||
| ROE | 2.4 | % | 9.5 | % | (7.1) | pp | |||||||||||
| Annualized ROE | 9.5 | % | 38.0 | % | (28.5) | pp | |||||||||||
| Annualized TIR | 4.9 | % | 9.5 | % | (4.6) | pp | |||||||||||
| RLE | 0.2 | % | 0.1 | % | 0.1 | pp | |||||||||||
| Non-GAAP measures: | |||||||||||||||||
| Adjusted ROE* | 2.6 | % | 6.8 | % | (4.2) | pp | |||||||||||
| Annualized Adjusted ROE* | 10.5 | % | 27.3 | % | (16.8) | pp | |||||||||||
| Annualized Adjusted TIR* | 5.5 | % | 6.3 | % | (0.8) | pp | |||||||||||
| Adjusted RLE * | 0.2 | % | 0.3 | % | (0.1) | pp | |||||||||||
| As of | $ Change | ||||||||||||||||
| March 31, 2024 | December 31, 2023 | ||||||||||||||||
| GAAP measure: | |||||||||||||||||
| BVPS | $ | 349.41 | $ | 343.45 | $ | 5.96 | |||||||||||
| Non-GAAP measure: | |||||||||||||||||
| Fully diluted BVPS* | $ | 341.53 | $ | 336.72 | $ | 4.81 | |||||||||||
pp - Percentage point(s)
*Non-GAAP measure; refer to "Non-GAAP Financial Measures" section for reconciliation to the applicable GAAP financial measure.
Enstar Group Limited | First Quarter 2024 | Form 10-Q 54
Overall Results
Three Months Ended March 31, 2024 versus 2023:
Net income attributable to Enstar ordinary shareholders for the three months ended March 31, 2024 was $119 million, in comparison to net income of $424 million in the comparative quarter, as a result of:
•A decrease in other income of $280 million largely driven by the first quarter 2023 net gain recognized from the novation of the Enhanzed Re reinsurance closed block of life annuity policies included in the comparative quarter.
•An increase in the amortization of net deferred charge assets of $13 million, driven by an increase in net DCA balances as a result of transactions completed subsequent to March 31, 2023.
•Total investment returns recognized in income of $234 million for the three months ended March 31, 2024, in comparison to $355 million for the comparative quarter, consisting of the aggregate of net investment income, net realized losses, fair value changes in trading securities, funds held and other investments and (loss) income from equity method investments. The total investment returns in each period were driven by:
◦Fair value changes in our fixed maturities resulting in a $19 million loss for the three months ended March 31, 2024 compared with a gain of $59 million in the comparative quarter;
◦Fair value changes in our other investments, including equities resulting in a of $104 million gain for the three months ended March 31, 2024 compared with $147 million in the comparative quarter;
◦Net investment income of $160 million for the three months ended March 31, 2024 compared to $156 million in the comparative quarter, consistent with the increasing investment income we have earned, primarily due to reinvestment of fixed maturities at higher yields, deployment of consideration received from deals closed over the past 12 months and the impact of rising interest rates on our floating rate fixed maturities; and
◦Net realized losses on our fixed maturities of $6 million, for the three months ended March 31, 2024 compared to $18 million in the comparative quarter.
This was partially offset by:
•An increase of $14 million in favorable development in net incurred losses and LAE for prior periods. Net favorable development of $24 million in the current period was primarily due to a reduction in our estimates of net ultimate losses and provisions for ULAE of $23 million and a $4 million decrease in the fair value of our 2017 and 2018 LPT liabilities where we elected the fair value option, partially offset by amortization of fair value adjustments of $3 million. First quarter 2023 net favorable development of $10 million was primarily due to a reduction in our estimates of net ultimate losses and provisions for ULAE of $33 million, partially offset by amortization of fair value adjustments of $3 million and a $20 million increase in the fair value of liabilities where we elected the fair value option due to a decrease in interest rates. This resulted in RLE of 0.2% for the three months ended March 31, 2024 in comparison to RLE of 0.1% in the comparative quarter; and
•A decrease in net income attributable to non-controlling interests of $86 million, as a result of recording the portion of the gain on novation of the Enhanzed Re reinsurance closed block of life annuity policies attributable to Allianz’s equity interest in Enhanzed Re in the comparative quarter.
The above factors contributed to net income of $128 million for the three months ended March 31, 2024 as compared to $519 million in the comparative quarter, as well as net income attributable to Enstar ordinary shareholders of $119 million as compared to $424 million in the comparative quarter. Consequently, our ROE was 2.4% in the current quarter compared to 9.5% in the comparative quarter.
Comprehensive income attributable to Enstar for the three months ended March 31, 2024 was $100 million as compared to $239 million in the comparative quarter. The first quarter 2024 comprehensive income was primarily due to net income of $128 million partially offset by unrealized losses on fixed maturities, AFS, net of reclassification adjustments, of $27 million. The unrealized losses on our fixed maturities, AFS, combined with our favorable investment results, described above, contributed to a net favorable Annualized TIR of 4.9% for the three months ended March 31, 2024, in comparison to a Annualized TIR of 9.5% in the comparative quarter.
BVPS and FDBVPS* increased by 1.7% and 1.4%, respectively, from December 31, 2023 to March 31, 2024, primarily due to comprehensive income attributable to Enstar for the quarter ended which contributed to both BVPS and FDBVPS*.
Enstar Group Limited | First Quarter 2024 | Form 10-Q 55
The cumulative unrealized loss and fair value changes in our fixed maturities portfolio and funds held was $789 million as of March 31, 2024, which has adversely impacted BVPS by $53.82 per share and FDBVPS* by $52.61 per share. This compares to $994 million of cumulative unrealized loss and fair value changes in our fixed maturities portfolio and funds held as of March 31, 2023.
*Non-GAAP measure; refer to "Non-GAAP Financial Measures" section for reconciliation to the applicable GAAP financial measure.
Enstar Group Limited | First Quarter 2024 | Form 10-Q 56
Overall Measures of Performance
BVPS and Fully Diluted BVPS*

BVPS and Fully Diluted BVPS* increased by 1.7% and 1.4%, respectively, from December 31, 2023 to March 31, 2024, primarily as a result of comprehensive income attributable to Enstar of $100 million. The cumulative unrealized loss and fair value changes in our fixed maturities portfolio and funds held was $789 million as of March 31, 2024, which adversely impacted BVPS by $53.82 per share and FDBVPS* by $52.61 per share. | ||
ROE and Adjusted ROE

Three Months Ended March 31, 2024 versus 2023: ROE decreased by 7.1 pp for the three months ended March 31, 2024 primarily due to:
i.decreased other income, comprised primarily of the gain recognized on the novation of the Enhanzed Re reinsurance closed block of life annuity policies in the comparative quarter, which contributed 6.3 pp to the decrease in ROE;
ii.fair value changes in trading securities, funds held and other investments which contributed 2.9 pp to the decrease in ROE;
These factors were partially offset by:
iii. increased favorable prior period development, or RLE, which offset the decrease in ROE by 0.3 pp; and
iv. decreased net income attributable to noncontrolling interests, which offset the decrease in ROE by 1.9 pp.
Adjusted ROE* decreased by 4.2 pp for the three months ended March 31, 2024, as it excludes the impact of net realized losses and changes in the fair value of fixed maturities.
*Non-GAAP measure; refer to “Non-GAAP Financial Measures” section for reconciliation to the applicable GAAP financial measure.
Enstar Group Limited | First Quarter 2024 | Form 10-Q 57
We discuss the results of our operations by aggregating certain captions from our unaudited condensed consolidated statements of operations, as we believe it provides a more meaningful view of our results and eliminates repetition that would arise if captions were discussed on an individual basis.
In order to facilitate analysis, we have grouped the discussion into the following captions:
•Technical results: includes net premiums earned, net incurred losses and LAE and acquisition costs.
•Investment results: includes net investment income, net realized (losses) gains, fair value changes in trading securities, funds held and other investments, unrealized (losses) gains on fixed maturities, AFS (recorded through the unaudited condensed consolidated statements of other comprehensive income) and income (losses) from equity method investments.
•General and administrative results: includes general and administrative expenses.
Technical Results
Our strategy is focused on effectively managing (re)insurance portfolios underwritten in previous years that we assume through our provision of capital release solutions and acquisition of portfolios and businesses in run-off.
Net premiums earned and the associated current period net incurred losses and LAE and acquisition costs are the result of the recognition of unearned premiums from transactions completed in recent years.
Premiums earned in the Run-off segment are generally offset by the related current period net incurred losses and LAE and acquisition costs.
The components of technical results are as follows:
| Three Months Ended March 31, | |||||||||||||||||||||||||||||||||||
| 2024 | 2023 | ||||||||||||||||||||||||||||||||||
| Run-off | Corporate and other | Total | Run-off | Corporate and other | Total | ||||||||||||||||||||||||||||||
| (in millions of U.S. dollars) | |||||||||||||||||||||||||||||||||||
| Net premiums earned | $ | 11 | $ | — | $ | 11 | $ | 8 | $ | — | $ | 8 | |||||||||||||||||||||||
| Net incurred losses and LAE: | |||||||||||||||||||||||||||||||||||
| Current period | 5 | — | 5 | 10 | — | 10 | |||||||||||||||||||||||||||||
| Prior periods | (23) | (1) | (24) | (33) | 23 | (10) | |||||||||||||||||||||||||||||
| Total net incurred losses and LAE | (18) | (1) | (19) | (23) | 23 | — | |||||||||||||||||||||||||||||
| Acquisition costs | 1 | — | 1 | 2 | — | 2 | |||||||||||||||||||||||||||||
| Technical results | $ | 28 | $ | 1 | $ | 29 | $ | 29 | $ | (23) | $ | 6 | |||||||||||||||||||||||
Enstar Group Limited | First Quarter 2024 | Form 10-Q 58
Prior Periods - RLE - Three Months Ended March 31, 2024 and 2023
The following tables summarize RLE, RLE %, Adjusted RLE* and Adjusted RLE %* by acquisition year for the three months ended March 31, 2024 and 2023, which management believes is useful in measuring and monitoring performance of our claims management activity on the portfolios that we have acquired. This permits comparability between acquisition years of different loss reserve volumes.
Refer to the table below for a summary of RLE, RLE %, Adjusted RLE* and Adjusted RLE %* for the three months ended March 31, 2024:
| Three Months Ended March 31, 2024 | |||||||||||||||||||||||||||||||||||
| RLE | Adjusted RLE* | ||||||||||||||||||||||||||||||||||
| Acquisition Year | RLE / PPD | Average net loss reserves | RLE % | Adjusted RLE / PPD* | Average adjusted net loss reserves* | Adjusted RLE %* | |||||||||||||||||||||||||||||
| (in millions of U.S. dollars) | |||||||||||||||||||||||||||||||||||
| 2014 and prior | $ | (12) | $ | 1,274 | $ | (8) | $ | 939 | |||||||||||||||||||||||||||
| 2015 | 1 | 412 | 1 | 237 | |||||||||||||||||||||||||||||||
| 2016 | 5 | 581 | 5 | 643 | |||||||||||||||||||||||||||||||
| 2017 | (3) | 571 | (8) | 784 | |||||||||||||||||||||||||||||||
| 2018 | (11) | 762 | (9) | 614 | |||||||||||||||||||||||||||||||
| 2019 | (3) | 653 | (3) | 1,450 | |||||||||||||||||||||||||||||||
| 2020 | (12) | 1,667 | (12) | 367 | |||||||||||||||||||||||||||||||
| 2021 | 39 | 2,551 | 38 | 3,207 | |||||||||||||||||||||||||||||||
| 2022 | 19 | 1,826 | 19 | 2,164 | |||||||||||||||||||||||||||||||
| 2023 | 1 | 909 | 1 | 1,706 | |||||||||||||||||||||||||||||||
| Total | $ | 24 | $ | 11,206 | 0.2 | % | $ | 24 | $ | 12,111 | 0.2 | % | |||||||||||||||||||||||
*Non-GAAP measure; refer to “Non-GAAP Financial Measures” section for reconciliation to the applicable GAAP financial measure.
Three Months Ended March 31, 2024:
Our RLE % was 0.2% for the three months ended March 31, 2024, as favorable reductions in estimates of net ultimate losses, reductions in provisions for ULAE and net favorable changes in the fair value of liabilities for which we have elected the fair value option were partially offset by amortization of fair value adjustments.
Acquisition years 2021 and 2022 provided favorable results, driven by our professional indemnity/directors and officers, workers’ compensation and general casualty lines of business, as a result of favorable claims experience. Partially offsetting this, acquisition years 2020 and prior were unfavorably impacted by increased settlement activity in general casualty.
Our Adjusted RLE %* was marginally impacted by the net reduction in estimates of net ultimate losses and reductions in provisions for ULAE. It also excludes the impact of the changes in the discount rate upon the fair value of liabilities where we have elected the fair value option and the amortization of fair value adjustments relating to purchased subsidiaries.
Enstar Group Limited | First Quarter 2024 | Form 10-Q 59
Refer to the table below for a summary of RLE, RLE %, Adjusted RLE* and Adjusted RLE %* for the three months ended March 31, 2023:
| Three Months Ended March 31, 2023 | |||||||||||||||||||||||||||||||||||
| RLE | Adjusted RLE* | ||||||||||||||||||||||||||||||||||
| Acquisition Year | RLE / PPD | Average net loss reserves | RLE % | Adjusted RLE / PPD* | Average adjusted net loss reserves* | Adjusted RLE %* | |||||||||||||||||||||||||||||
| (in millions of U.S. dollars) | |||||||||||||||||||||||||||||||||||
| 2014 and prior | $ | 9 | $ | 1,263 | $ | 7 | $ | 772 | |||||||||||||||||||||||||||
| 2015 | 1 | 287 | 1 | 305 | |||||||||||||||||||||||||||||||
| 2016 | — | 681 | 2 | 750 | |||||||||||||||||||||||||||||||
| 2017 | (12) | 573 | 1 | 799 | |||||||||||||||||||||||||||||||
| 2018 | (10) | 745 | (2) | 833 | |||||||||||||||||||||||||||||||
| 2019 | (1) | 1,047 | — | 1,576 | |||||||||||||||||||||||||||||||
| 2020 | 13 | 562 | 14 | 565 | |||||||||||||||||||||||||||||||
| 2021 | 7 | 3,394 | 10 | 3,881 | |||||||||||||||||||||||||||||||
| 2022 | 3 | 3,067 | 3 | 3,073 | |||||||||||||||||||||||||||||||
| Total | $ | 10 | $ | 11,619 | 0.1 | % | $ | 36 | $ | 12,554 | 0.3 | % | |||||||||||||||||||||||
*Non-GAAP measure; refer to “Non-GAAP Financial Measures” section for reconciliation to the applicable GAAP financial measure.
Three Months Ended March 31, 2023:
Our RLE % was almost flat for the three months ended March 31, 2023, as favorable reductions in estimates of net ultimate losses and reductions in provisions for ULAE were largely offset by unfavorable changes in the fair value of liabilities for which we have elected the fair value option.
Unfavorable RLE in the 2017 and 2018 acquisition years was driven predominantly by an increase in the fair value of liabilities for which we have elected the fair value option. Acquisition year 2018 was also adversely impacted by adverse to expected claims experience on certain of our general casualty portfolios.
Favorable RLE in the 2020 acquisition year was driven by a release of $10 million relating to COVID-19 exposures on our general casualty line of business.
Favorable RLE in the 2021 acquisition year was driven by continued favorable claims experience to expected on our workers’ compensation line of business.
Our Adjusted RLE %* was positively impacted by the net reduction in estimates of net ultimate losses and the reduction in provisions for ULAE relating to the Run-off segment. It excludes the impact of the changes in the discount rate upon the fair value of liabilities where we have elected the fair value option and the amortization of fair value adjustments relating to purchased subsidiaries.
Enstar Group Limited | First Quarter 2024 | Form 10-Q 60
Investment Results
We strive to structure our investment holdings and the duration of our investments in a manner that recognizes our liquidity needs, including our obligation to pay losses and LAE liabilities.
The components of our investment results split between our fixed income assets (which includes our short-term and fixed maturities classified as trading and AFS, funds held, cash and cash equivalents and restricted cash and cash equivalents, collectively our “Fixed Income” assets) and other investments (which includes equities and equity method investments, collectively our “Other Investments”) for the three months ended March 31, 2024 and 2023 are as follows:
| Three Months Ended March 31, | |||||||||||||||||||||||||||||||||||
| 2024 | 2023 | ||||||||||||||||||||||||||||||||||
| Fixed Income | Other Investments | Total | Fixed Income | Other Investments | Total | ||||||||||||||||||||||||||||||
| (in millions of U.S. dollars) | |||||||||||||||||||||||||||||||||||
| Net investment income | $ | 140 | $ | 20 | $ | 160 | $ | 132 | $ | 24 | $ | 156 | |||||||||||||||||||||||
| Net realized losses | (6) | — | (6) | (18) | — | (18) | |||||||||||||||||||||||||||||
| Fair value changes in trading securities, funds held and other investments | (19) | 104 | 85 | 59 | 147 | 206 | |||||||||||||||||||||||||||||
| (Loss) income from equity method investments | — | (5) | (5) | — | 11 | 11 | |||||||||||||||||||||||||||||
| Other comprehensive income: | |||||||||||||||||||||||||||||||||||
| Unrealized (losses) gains on fixed maturities, AFS, net of reclassification adjustments, excluding foreign exchange | (12) | — | (12) | 87 | — | 87 | |||||||||||||||||||||||||||||
| TIR ($) | $ | 103 | $ | 119 | $ | 222 | $ | 260 | $ | 182 | $ | 442 | |||||||||||||||||||||||
| Annualized TIR % | 3.2 | % | 9.5 | % | 4.9 | % | 7.6 | % | 14.7 | % | 9.5 | % | |||||||||||||||||||||||
| Annualized Adjusted TIR %* | 4.1 | % | 9.5 | % | 5.5 | % | 3.5 | % | 14.7 | % | 6.3 | % | |||||||||||||||||||||||
*Non-GAAP measure; refer to “Non-GAAP Financial Measures” section for reconciliation to the applicable GAAP financial measure.
Net Investment Income
The below chart is in millions of U.S. dollars.

Three Months Ended March 31, 2024 versus 2023: Net investment income increased primarily due to:
•an increase in our annualized investment book yield of 78 basis points due to a combination of investment of new premium and reinvestment of fixed maturities at higher yields and the impact of rising interest rates on the $3.1 billion of our fixed maturities that are subject to floating interest rates. Our floating rate investments generated net investment income of $58 million, an increase of $2 million in comparison to the prior period.
Enstar Group Limited | First Quarter 2024 | Form 10-Q 61
Fair Value Changes, Net Realized Losses and Unrealized (Losses) Gains included in Comprehensive Income
The below chart is in millions of U.S. dollars.


Three Months Ended March 31, 2024 versus 2023: The net reduction of $208 million when comparing fair value changes, realized losses and unrealized (losses) gains on fixed maturities, AFS for the three months ended March 31, 2024 to the comparative period was the result of:
•the current period overall loss from the total of fair value changes, realized losses and unrealized losses, AFS on fixed maturities of $37 million, compared to the overall gain from the comparative quarter of $128 million. The variance of $165 million was primarily driven by increases in interest rates across U.S., U.K. and European markets in the current period, in comparison to decreases in interest rates in the prior period; and
•the current period gain from fair value changes on other investments, including equities, of $104 million, compared to $147 million in the comparative period. The decrease of $43 million was primarily driven by:
◦a decrease in the gain on fair value change in other investments of $18 million for the three months ended March 31, 2024, primarily driven by variance in the fair value change of an embedded derivative in relation to the Aspen LPT, partially offset by increases in the fair value change related to CLO equity funds, private equity funds and high yield bond and loan funds relative to the comparative quarter; and
◦a decrease in the gain in fair value changes in equities of $16 million for the three months ended March 31, 2024, largely as a result of the reduced amount of equities within the investment portfolio relative to the comparative quarter.
(Loss) income from equity method investments
The below chart is in millions of U.S. dollars.
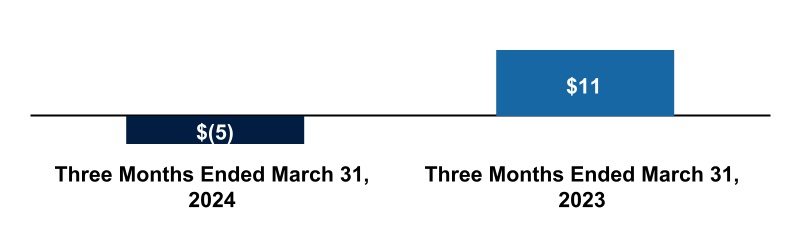
Three Months Ended March 31, 2024 versus 2023: The unfavorable movement in income from equity method investments of $16 million was primarily due to a $29 million increase in the loss from our investment in Monument Re, partially offset by an increase in our income from our investment in Core Specialty of $15 million.
Enstar Group Limited | First Quarter 2024 | Form 10-Q 62
Investable Assets
Investable assets and adjusted investable assets* decreased by 3.1% and 2.6%, respectively, from December 31, 2023 to March 31, 2024, primarily due to the impact of net paid losses, partially offset by investment income and the fair value change in our fixed maturities.
*Non-GAAP measure; refer to "Non-GAAP Financial Measures" section for reconciliation to the applicable GAAP financial measures.
Duration and average credit rating on fixed maturities, cash and cash equivalents and fixed maturities included in funds held - directly managed
The fair value, duration and average credit rating of investments (all attributable to our Run-off segment) is as follows:
| March 31, 2024 | December 31, 2023 | |||||||||||||||||||||||||||||||||||||
Fair Value ($) (1) | Average Duration (in years) (2) | Average Credit Rating (3) | Fair Value ($) (1) | Average Duration (in years) (2) | Average Credit Rating (3) | |||||||||||||||||||||||||||||||||
| Total | $ | 9,733 | 3.91 | A+ | $ | 10,320 | 4.04 | A+ | ||||||||||||||||||||||||||||||
(1) The fair value by segment of our fixed maturities, cash and cash equivalents and fixed maturities included in funds held-directly managed portfolios does not include the carrying value of cash and cash equivalents within our funds held-directly managed portfolios.
(2) The average duration calculation includes cash and cash equivalents, short-term investments and fixed maturities, as well as the fixed maturities and cash and cash equivalents within our funds held-directly managed portfolios.
(3) The average credit rating calculation includes cash and cash equivalents, short-term investments, fixed maturities and the fixed maturities within our funds held - directly managed portfolios.
The overall decrease in the balance of our fixed maturities and cash and cash equivalents of $587 million when comparing March 31, 2024 to December 31, 2023 was primarily driven by the impact of net paid losses.
As of both March 31, 2024 and December 31, 2023, our fixed maturities and cash and cash equivalents had an average credit quality rating of A+ .
As of March 31, 2024 and December 31, 2023, our fixed maturities that were non-investment grade (i.e. rated lower than BBB- and non-rated securities) comprised $506 million, or 5.6%, and $456 million, or 4.8%, of our total fixed maturities portfolio, respectively.
General and Administrative Expenses for the Three Months Ended March 31, 2024 and 2023
The below chart is in millions of U.S. dollars.

Three Months Ended March 31, 2024 versus 2023: The $2 million decrease in general and administrative expenses was primarily driven by a decrease in lower professional fees, partially offset by increases in salaries and benefits and other expenses.
Enstar Group Limited | First Quarter 2024 | Form 10-Q 63
Non-GAAP Financial Measures
In addition to our key financial measures presented in accordance with GAAP, we present other non-GAAP financial measures that we use to manage our business, compare our performance against prior periods and against our peers, and as performance measures in our incentive compensation program.
These non-GAAP financial measures provide an additional view of our operational performance over the long-term and provide the opportunity to analyze our results in a way that is more aligned with the manner in which our management measures our underlying performance.
The presentation of these non-GAAP financial measures, which may be defined and calculated differently by other companies, is used to enhance the understanding of certain aspects of our financial performance. It is not meant to be considered in isolation, superior to, or as a substitute for the directly comparable financial measures prepared in accordance with GAAP.
Some of the adjustments reflected in our non-GAAP measures are recurring items, such as the exclusion of adjustments to net realized (gains)/losses and fair value changes on fixed maturity investments recognized in our statements of operations, the fair value of certain of our loss reserve liabilities for which we have elected the fair value option, and the amortization of fair value adjustments.
Management makes these adjustments in assessing our performance so that the changes in fair value due to interest rate movements, which are applied to some but not all of our assets and liabilities as a result of preexisting accounting elections, do not impair comparability across reporting periods.
It is important for the readers of our periodic filings to understand that these items will recur from period to period.
However, we exclude these items for the purpose of presenting a comparable view across reporting periods of the impact of our underlying claims management and investments without the effect of interest rate fluctuations on assets that we anticipate to hold to maturity and non-cash changes to the fair value of our reserves.
Similarly, our non-GAAP measures reflect the exclusion of certain items that we deem to be nonrecurring, unusual or infrequent when the nature of the charge or gain is such that it is not reasonably likely that such item may recur within two years, nor was there a similar charge or gain in the preceding two years. This includes adjustments related to bargain purchase gains on acquisitions of businesses, net gains or losses on sales of subsidiaries, net assets of held for sale or disposed subsidiaries classified as discontinued operations and other items that we separately disclose.
The following table presents more information on each non-GAAP measure. The results and GAAP reconciliations for these measures are set forth further below.
| Non-GAAP Measure | Definition | Purpose of Non-GAAP Measure over GAAP Measure | ||||||||||||
| Fully diluted book value per ordinary share | Total Enstar ordinary shareholders' equity Divided by Number of ordinary shares outstanding, adjusted for: -the ultimate effect of any dilutive securities (which include restricted shares, restricted share units, directors’ restricted share units and performance share units) on the number of ordinary shares outstanding | Increases the number of ordinary shares to reflect the exercise of equity awards granted but not yet vested as, over the long term, this presents both management and investors with a more economically accurate measure of the realizable value of shareholder returns by factoring in the impact of share dilution. We use this non-GAAP measure in our incentive compensation program. | ||||||||||||
Enstar Group Limited | First Quarter 2024 | Form 10-Q 64
| Adjusted return on equity (%) | Adjusted operating income (loss) attributable to Enstar ordinary shareholders divided by adjusted opening Enstar ordinary shareholder's equity | Calculating the operating income (loss) as a percentage of our adjusted opening Enstar ordinary shareholders' equity provides a more consistent measure of the performance of our business by enabling comparison between the financial periods presented. We eliminate the impact of fair value changes and net realized (gains) losses on fixed maturities and funds held-directly managed and the change in fair value of insurance contracts for which we have elected the fair value option, as: •we typically hold most of our fixed maturities until the earlier of maturity or the time that they are used to fund any settlement of related liabilities which are generally recorded at cost; and •removing the fair value option improves comparability since there are limited acquisition years for which we elected the fair value option. Therefore, we believe that excluding their impact on our net income improves comparability of our core operational performance across periods. We include fair value adjustments as non-GAAP adjustments to the adjusted operating income (loss) attributable to Enstar ordinary shareholders as they are non-cash charges that are not reflective of the impact of our claims management strategies on our loss portfolios. We eliminate the net gain (loss) on the purchase and sales of subsidiaries and net income from discontinued operations, as these items are not indicative of our ongoing operations. We use this non-GAAP measure in our incentive compensation program. | ||||||||||||
Adjusted operating income (loss) attributable to Enstar ordinary shareholders (numerator) | Net income (loss) attributable to Enstar ordinary shareholders, adjusted for: -fair value changes and net realized (gains) losses on fixed maturities and funds held-directly managed, -change in fair value of insurance contracts for which we have elected the fair value option (1), -amortization of fair value adjustments, -net gain/loss on purchase and sales of subsidiaries (if any), -net income from discontinued operations (if any), -tax effects of adjustments, and -adjustments attributable to noncontrolling interests | |||||||||||||
Adjusted opening Enstar ordinary shareholders' equity (denominator) | Opening Enstar ordinary shareholders' equity, less: -fair value changes on fixed maturities and funds held-directly managed, -fair value of insurance contracts for which we have elected the fair value option (1), -fair value adjustments, and -net assets of held for sale or disposed subsidiaries classified as discontinued operations (if any) | |||||||||||||
Enstar Group Limited | First Quarter 2024 | Form 10-Q 65
| Adjusted run-off liability earnings (%) | Adjusted PPD divided by average adjusted net loss reserves. | Calculating the RLE as a percentage of our adjusted average net loss reserves provides a more meaningful and comparable measurement of the impact of our claims management strategies on our loss portfolios across acquisition years and also to our overall financial periods. We use this measure to evaluate the impact of our claims management strategies because it provides visibility into our ability to settle our claims obligations for amounts less than our initial estimate at the point of acquiring the obligations. The following components of periodic recurring net incurred losses and LAE and net loss reserves are not considered key components of our claims management performance for the following reasons: •Prior to the settlement of the contractual arrangements, the results of our Legacy Underwriting segment were economically transferred to a third party primarily through use of reinsurance and a Capacity Lease Agreement(3); as such, the results were not a relevant contribution to Adjusted RLE, which is designed to analyze the impact of our claims management strategies(2); •The change in fair value of insurance contracts for which we have elected the fair value option(1) has been removed to support comparability between the two acquisition years for which we elected the fair value option in reserves assumed and the acquisition years for which we did not make this election (specifically, this election was only made in the 2017 and 2018 acquisition years and the election of such option is irrevocable); and •The amortization of fair value adjustments are non-cash charges that obscure our trends on a consistent basis. We include our performance in managing claims and estimated future expenses on our defendant A&E liabilities because such performance is relevant to assessing our claims management strategies even though such liabilities are not included within the loss reserves. We use this measure to assess the performance of our claim strategies and part of the performance assessment of our past acquisitions. | ||||||||||||
Adjusted prior period development (numerator) | Prior period net incurred losses and LAE, adjusted to: Remove: -Legacy Underwriting(2) operations -amortization of fair value adjustments, -change in fair value of insurance contracts for which we have elected the fair value option (1), and Add: -the reduction/(increase) in estimates of net ultimate liabilities and reduction in estimated future expenses of our defendant A&E liabilities. | |||||||||||||
Adjusted net loss reserves (denominator) | Net losses and LAE, adjusted to: Remove: -Legacy Underwriting(2) net loss reserves -current period net loss reserves -net fair value adjustments associated with the acquisition of companies, -the fair value adjustments for contracts for which we have elected the fair value option (1) and Add: -net nominal defendant A&E liability exposures and estimated future expenses. | |||||||||||||
| Adjusted total investment return (%) | Adjusted total investment return (dollars) recognized in net income for the applicable period divided by period average adjusted total investable assets. | Provides a key measure of the return generated on the capital held in the business and is reflective of our investment strategy. Provides a consistent measure of investment returns as a percentage of all assets generating investment returns. We adjust our investment returns to eliminate the impact of the change in fair value of fixed maturities (both credit spreads and interest rates), as we typically hold most of these investments until the earlier of maturity or used to fund any settlement of related liabilities which are generally recorded at cost. | ||||||||||||
Adjusted total investment return ($) (numerator) | Total investment return (dollars), adjusted for: -fair value changes in fixed maturities, trading and funds held-directly managed; and -unrealized (gains) losses on fixed maturities, AFS included within OCI, net of reclassification adjustments and excluding foreign exchange. | |||||||||||||
Adjusted average aggregate total investable assets (denominator) | Total average investable assets, adjusted for: -net unrealized (gains) losses on fixed maturities, AFS included within AOCI -fair value changes on fixed maturities, trading and funds held - directly managed | |||||||||||||
(1) Comprises the discount rate and risk margin components.
(2) As of January 1, 2024, not applicable. Refer to Note 2 - "Segment Information" for more detail.
(3) The reinsurance contractual arrangements (including the Capacity Lease Agreement) described in Note 6 to our consolidated financial statements in our Annual Report on Form 10-K for the year ended December 31, 2023 were settled during the second quarter of 2023, and we did not record any transactions in the Legacy Underwriting segment in 2023.
Enstar Group Limited | First Quarter 2024 | Form 10-Q 66
Reconciliation of GAAP to Non-GAAP Measures
The table below presents a reconciliation of BVPS to Fully Diluted BVPS*:
| March 31, 2024 | December 31, 2023 | ||||||||||||||||||||||||||||||||||
Equity (1) | Ordinary Shares | Per Share Amount | Equity (1) | Ordinary Shares | Per Share Amount | ||||||||||||||||||||||||||||||
| (in millions of U.S. dollars, except share and per share data) | |||||||||||||||||||||||||||||||||||
| Book value per ordinary share | $ | 5,122 | 14,658,801 | $ | 349.41 | $ | 5,025 | 14,631,055 | $ | 343.45 | |||||||||||||||||||||||||
| Non-GAAP adjustment: | |||||||||||||||||||||||||||||||||||
| Share-based compensation plans | 338,576 | 292,190 | |||||||||||||||||||||||||||||||||
| Fully diluted book value per ordinary share* | $ | 5,122 | 14,997,377 | $ | 341.53 | $ | 5,025 | 14,923,245 | $ | 336.72 | |||||||||||||||||||||||||
(1) Equity comprises Enstar ordinary shareholders' equity, which is calculated as Enstar shareholders' equity less preferred shares ($510 million) prior to any non-GAAP adjustments.
The table below presents a reconciliation of ROE to Adjusted ROE* and Annualized ROE to Annualized Adjusted ROE*:
| Three Months Ended | |||||||||||||||||||||||||||||||||||||||||||||||
| March 31, 2024 | March 31, 2023 | ||||||||||||||||||||||||||||||||||||||||||||||
Net income (loss) (1) | Opening equity (1) | (Adj) ROE | Annualized (Adj) ROE | Net income (loss) (1) | Opening equity (1) | (Adj) ROE | Annualized (Adj) ROE | ||||||||||||||||||||||||||||||||||||||||
| (in millions of U.S. dollars) | |||||||||||||||||||||||||||||||||||||||||||||||
Net income/Opening equity/ROE/Annualized ROE (1) | $ | 119 | $ | 5,025 | 2.4 | % | 9.5 | % | $ | 424 | $ | 4,464 | 9.5 | % | 38.0 | % | |||||||||||||||||||||||||||||||
| Non-GAAP adjustments for loss (gains): | |||||||||||||||||||||||||||||||||||||||||||||||
Net realized losses on fixed maturities, AFS (2) / Cumulative fair value changes to fixed maturities, AFS (3) | 6 | 380 | 18 | 647 | |||||||||||||||||||||||||||||||||||||||||||
Fair value changes on fixed maturities, trading (2) / Fair value changes on fixed maturities, trading (3) | 14 | 234 | (40) | 400 | |||||||||||||||||||||||||||||||||||||||||||
Fair value changes on funds held - directly managed (2) / Fair value changes on funds held - directly managed (3) | 5 | 111 | (19) | 780 | |||||||||||||||||||||||||||||||||||||||||||
Change in fair value of insurance contracts for which we have elected the fair value option / Fair value of insurance contracts for which we have elected the fair value option (4) | (4) | (246) | 20 | (294) | |||||||||||||||||||||||||||||||||||||||||||
| Amortization of fair value adjustments / Fair value adjustments | 3 | (107) | 3 | (124) | |||||||||||||||||||||||||||||||||||||||||||
Tax effects of adjustments (5) | (2) | — | (3) | — | |||||||||||||||||||||||||||||||||||||||||||
Adjustments attributable to noncontrolling interests (6) | — | — | (2) | — | |||||||||||||||||||||||||||||||||||||||||||
| Adjusted net income (loss)/Adjusted opening equity/Adjusted ROE/Annualized adjusted ROE* | $ | 141 | $ | 5,397 | 2.6 | % | 10.5 | % | $ | 401 | $ | 5,873 | 6.8 | % | 27.3 | % | |||||||||||||||||||||||||||||||
(1) Net income (loss) comprises net income (loss) attributable to Enstar ordinary shareholders, prior to any non-GAAP adjustments. Opening equity comprises Enstar ordinary shareholders' equity, which is calculated as opening Enstar shareholders' equity less preferred shares ($510 million), prior to any non-GAAP adjustments.
(2) Net realized gains (losses) on fixed maturities, AFS are included in net realized gains (losses) in our unaudited condensed consolidated statements of operations. Fair value changes in our fixed maturities, trading and funds held - directly managed are included in fair value changes in trading securities, funds held and other investments in our unaudited condensed consolidated statements of operations.
(3) Our fixed maturities are held directly on our balance sheet and also within the "Funds held" balance.
(4) Comprises the discount rate and risk margin components.
(5) Represents an aggregation of the tax expense or benefit associated with the specific country to which the pre-tax adjustment relates, calculated at the applicable jurisdictional tax rate.
Enstar Group Limited | First Quarter 2024 | Form 10-Q 67
(6) Represents the impact of the adjustments on the net income (loss) attributable to noncontrolling interests associated with the specific subsidiaries to which the adjustments relate.
*Non-GAAP measure.
The tables below present a reconciliation of RLE to Adjusted RLE*:
| Three Months Ended | As of | Three Months Ended | |||||||||||||||||||||||||||
| March 31, 2024 | March 31, 2024 | December 31, 2023 | March 31, 2024 | March 31, 2024 | |||||||||||||||||||||||||
| RLE / PPD | Net loss reserves | Net loss reserves | Average net loss reserves | RLE % | |||||||||||||||||||||||||
| (in millions of U.S. dollars) | |||||||||||||||||||||||||||||
| PPD/net loss reserves/RLE % | $ | 24 | $ | 10,827 | $ | 11,585 | $ | 11,206 | 0.2 | % | |||||||||||||||||||
| Non-GAAP adjustments for expenses (income): | |||||||||||||||||||||||||||||
| Net loss reserves incurred in the current period | — | (5) | — | (3) | |||||||||||||||||||||||||
| Amortization of fair value adjustments / Net fair value adjustments associated with the acquisition of companies | 3 | 103 | 107 | 105 | |||||||||||||||||||||||||
Changes in fair value - fair value option / Net fair value adjustments for contracts for which we have elected the fair value option (1) | (4) | 249 | 246 | 248 | |||||||||||||||||||||||||
| Change in estimate of net ultimate liabilities - defendant A&E / Net nominal defendant A&E liabilities | — | 516 | 527 | 522 | |||||||||||||||||||||||||
| Reduction in estimated future expenses - defendant A&E / Estimated future expenses - defendant A&E | 1 | 32 | 33 | 33 | |||||||||||||||||||||||||
| Adjusted PPD/Adjusted net loss reserves/Adjusted RLE %* | $ | 24 | $ | 11,722 | $ | 12,498 | $ | 12,111 | 0.2 | % | |||||||||||||||||||
(1) Comprises the discount rate and risk margin components.
*Non-GAAP measure.
| Three Months Ended | As of | Three Months Ended | |||||||||||||||||||||||||||
| March 31, 2023 | March 31, 2023 | December 31, 2022 | March 31, 2023 | March 31, 2023 | |||||||||||||||||||||||||
| RLE / PPD | Net loss reserves | Net loss reserves | Average net loss reserves | RLE % | |||||||||||||||||||||||||
| (in millions of U.S. dollars) | |||||||||||||||||||||||||||||
| PPD/net loss reserves/RLE % | $ | 10 | $ | 11,226 | $ | 12,011 | $ | 11,619 | 0.1 | % | |||||||||||||||||||
| Non-GAAP adjustments for expenses (income): | |||||||||||||||||||||||||||||
| Net loss reserves incurred in the current period | — | (9) | — | (5) | |||||||||||||||||||||||||
Legacy Underwriting | — | — | (139) | (70) | |||||||||||||||||||||||||
| Amortization of fair value adjustments / Net fair value adjustments associated with the acquisition of companies | 3 | 121 | 124 | 123 | |||||||||||||||||||||||||
Changes in fair value - fair value option / Net fair value adjustments for contracts for which we have elected the fair value option (1) | 20 | 278 | 294 | 286 | |||||||||||||||||||||||||
| Change in estimate of net ultimate liabilities - defendant A&E / Net nominal defendant A&E liabilities | 2 | 560 | 572 | 566 | |||||||||||||||||||||||||
| Reduction in estimated future expenses - defendant A&E / Estimated future expenses - defendant A&E | 1 | 34 | 35 | 35 | |||||||||||||||||||||||||
| Adjusted PPD/Adjusted net loss reserves/Adjusted RLE %* | $ | 36 | $ | 12,210 | $ | 12,897 | $ | 12,554 | 0.3 | % | |||||||||||||||||||
(1) Comprises the discount rate and risk margin components.
*Non-GAAP measure.
Enstar Group Limited | First Quarter 2024 | Form 10-Q 68
The tables below present a reconciliation of our Annualized TIR to our Annualized Adjusted TIR*:
| Three Months Ended | |||||||||||||||||||||||||||||||||||
March 31, | |||||||||||||||||||||||||||||||||||
| 2024 | 2023 | ||||||||||||||||||||||||||||||||||
| Fixed Income | Other Investments | Total | Fixed Income | Other Investments | Total | ||||||||||||||||||||||||||||||
| (in millions of U.S. dollars) | |||||||||||||||||||||||||||||||||||
| Net investment income | $ | 140 | $ | 20 | $ | 160 | $ | 132 | $ | 24 | $ | 156 | |||||||||||||||||||||||
| Net realized losses | |||||||||||||||||||||||||||||||||||
| Fixed maturities, AFS | (6) | — | (6) | (18) | — | (18) | |||||||||||||||||||||||||||||
| Net realized losses | (6) | — | (6) | (18) | — | (18) | |||||||||||||||||||||||||||||
| Fair value changes | |||||||||||||||||||||||||||||||||||
| Fixed maturities, trading | (14) | — | (14) | 40 | — | 40 | |||||||||||||||||||||||||||||
| Funds held | (5) | — | (5) | 19 | — | 19 | |||||||||||||||||||||||||||||
| Equity securities | — | 37 | 37 | — | 53 | 53 | |||||||||||||||||||||||||||||
| Other investments | — | 67 | 67 | — | 85 | 85 | |||||||||||||||||||||||||||||
| Investment derivatives | — | — | — | — | 9 | 9 | |||||||||||||||||||||||||||||
| Fair value changes | (19) | 104 | 85 | 59 | 147 | 206 | |||||||||||||||||||||||||||||
| (Loss) income from equity method investments | — | (5) | (5) | — | 11 | 11 | |||||||||||||||||||||||||||||
| Other comprehensive income: | |||||||||||||||||||||||||||||||||||
| Unrealized (losses) gains on fixed maturities, AFS, net of reclassification adjustments excluding foreign exchange | (12) | — | (12) | 87 | — | 87 | |||||||||||||||||||||||||||||
| TIR ($) | $ | 103 | $ | 119 | $ | 222 | $ | 260 | $ | 182 | $ | 442 | |||||||||||||||||||||||
| Non-GAAP adjustments: | |||||||||||||||||||||||||||||||||||
| Net realized losses (gains) on fixed maturities, AFS and fair value changes in trading and funds held - directly managed | 25 | — | 25 | (41) | — | (41) | |||||||||||||||||||||||||||||
| Net unrealized losses (gains) on fixed maturities, AFS, net of reclassification adjustments excluding foreign exchange | 12 | — | 12 | (87) | — | (87) | |||||||||||||||||||||||||||||
| Adjusted TIR ($)* | $ | 140 | $ | 119 | $ | 259 | $ | 132 | $ | 182 | $ | 314 | |||||||||||||||||||||||
| Total investments | $ | 11,835 | $ | 5,082 | $ | 16,917 | $ | 11,725 | $ | 4,905 | $ | 16,630 | |||||||||||||||||||||||
| Cash and cash equivalents, including restricted cash and cash equivalents | 760 | — | 760 | 1,143 | — | 1,143 | |||||||||||||||||||||||||||||
| Total investable assets | $ | 12,595 | $ | 5,082 | $ | 17,677 | $ | 12,868 | $ | 4,905 | $ | 17,773 | |||||||||||||||||||||||
Average aggregate invested assets, at fair value (1) | 13,035 | 4,986 | 18,021 | 13,676 | 4,939 | 18,615 | |||||||||||||||||||||||||||||
Annualized TIR % (2) | 3.2 | % | 9.5 | % | 4.9 | % | 7.6 | % | 14.7 | % | 9.5 | % | |||||||||||||||||||||||
| Non-GAAP adjustment: | |||||||||||||||||||||||||||||||||||
| Net unrealized losses on fixed maturities, AFS included within AOCI and fair value changes on fixed maturities, trading and funds held - directly managed | 789 | — | 789 | 994 | — | 994 | |||||||||||||||||||||||||||||
| Adjusted investable assets* | $ | 13,384 | $ | 5,082 | $ | 18,466 | $ | 13,862 | $ | 4,905 | $ | 18,767 | |||||||||||||||||||||||
Adjusted average aggregate invested assets, at fair value* (3) | $ | 13,792 | $ | 4,986 | $ | 18,778 | $ | 15,081 | $ | 4,939 | $ | 20,020 | |||||||||||||||||||||||
Annualized adjusted TIR %* (4) | 4.1 | % | 9.5 | % | 5.5 | % | 3.5 | % | 14.7 | % | 6.3 | % | |||||||||||||||||||||||
Annualized income from fixed income assets (5) | 600 | — | 600 | 544 | — | 544 | |||||||||||||||||||||||||||||
Average aggregate fixed income assets, at cost (5)(6) | 13,769 | — | 13,769 | 15,199 | — | 15,199 | |||||||||||||||||||||||||||||
Annualized Investment book yield (7) | 4.36 | % | — | % | 4.36 | % | 3.58 | % | — | % | 3.58 | % | |||||||||||||||||||||||
(1) This amount is a two period average of the total investable assets, as presented above, and is comprised of amounts disclosed in our quarterly and annual U.S. GAAP consolidated financial statements.
(2) Annualized TIR % is calculated by dividing the annualized TIR ($) by average aggregate invested assets, at fair value.
(3) This amount is a two period average of the adjusted investable assets*, as presented above.
(4) Annualized adjusted TIR %* is calculated by dividing the annualized adjusted TIR* ($) by adjusted average aggregate invested assets, at fair value*.
(5) Fixed income assets include fixed maturities and cash and restricted cash, and funds held by reinsured companies.
(6) These amounts are a two period average of the amounts disclosed in our quarterly and annual U.S. GAAP consolidated financial statements.
(7) Annualized investment book yield % is calculated by dividing the annualized income from fixed income assets by average aggregate fixed income assets, at cost.
*Non-GAAP measure.
Enstar Group Limited | First Quarter 2024 | Form 10-Q 69
Results of Operations by Segment - For the Three Months Ended March 31, 2024 and 2023
Effective January 1, 2024, our business is organized into two reportable segments: (i) Run-off and (ii) Investments. In addition, our Corporate and other activities, which do not qualify as an operating segment, include income and expense items that are not directly attributable to our reportable segments and activities from the former Assumed Life and Legacy Underwriting reportable segments.
Effective January 1, 2024, Assumed Life and Legacy Underwriting are no longer reportable segments as they ceased all business activities following the series of commutation and novation transactions in Enhanzed Re and the settlement of the arrangements between SGL No. 1, Arden, and Atrium. Any residual activities of the former Assumed Life and Legacy Underwriting reportable segments will be prospectively included within our Corporate and other activities (all of which are expected to be immaterial). See Note 2 to the consolidated financial statements for additional information.
The following is a discussion of our results of operations by segment.
Run-off Segment
| Three Months Ended | |||||||||||||||||
| March 31, | $ Change | ||||||||||||||||
| 2024 | 2023 | ||||||||||||||||
| REVENUES | (in millions of U.S. dollars) | ||||||||||||||||
| Net premiums earned | $ | 11 | $ | 8 | $ | 3 | |||||||||||
| Other income: | |||||||||||||||||
| Reduction in estimates of net ultimate defendant A&E liabilities - prior periods | — | 2 | (2) | ||||||||||||||
| Reduction in estimated future defendant A&E expenses | 1 | 1 | — | ||||||||||||||
| All other income | 2 | 2 | — | ||||||||||||||
| Total other income | 3 | 5 | (2) | ||||||||||||||
| Total revenues | 14 | 13 | 1 | ||||||||||||||
| EXPENSES | |||||||||||||||||
| Net incurred losses and LAE: | |||||||||||||||||
| Current period | 5 | 10 | (5) | ||||||||||||||
| Prior periods: | |||||||||||||||||
| Reduction in estimates of net ultimate losses | (6) | (15) | 9 | ||||||||||||||
| Reduction in provisions for ULAE | (17) | (18) | 1 | ||||||||||||||
| Total prior periods | (23) | (33) | 10 | ||||||||||||||
| Total net incurred losses and LAE | (18) | (23) | 5 | ||||||||||||||
| Acquisition costs | 1 | 2 | (1) | ||||||||||||||
| General and administrative expenses | 42 | 39 | 3 | ||||||||||||||
| Total expenses | 25 | 18 | 7 | ||||||||||||||
| SEGMENT NET LOSS | $ | (11) | $ | (5) | $ | (6) | |||||||||||
Overall Results
Three Months Ended March 31, 2024 versus 2023: Net loss from our Run-off segment was $11 million compared to net loss of $5 million in the comparative quarter, primarily due to:
•A $10 million decrease in favorable PPD in the current quarter, mainly driven by a $9 million increase in the reduction in estimates of net ultimate losses in the comparative quarter.
◦During the first quarter of 2024, the net favorable development was primarily due to favorable development on our Professional Indemnity/Directors and Officers line of business of $29 million driven by favorable claims experience and favorable development on our Asbestos line of business of $24 million resulting from actuarial analysis. These were partially offset by adverse development on our General Casualty line of business of $18 million driven by adverse claims experience and adverse development on our Environmental line of business of $25 million due to results from actuarial reviews in the period.
Enstar Group Limited | First Quarter 2024 | Form 10-Q 70
Item 2 | Management's Discussion and Analysis | Results of Operations by Segment | Run-off Segment
◦In comparison, during the first quarter of 2023 we recognized favorable development of $11 million on our workers’ compensation line of business as a result of favorable claims experience, most notably in the 2021 acquisition year.
•A net favorable change in current period net incurred losses and LAE and acquisition costs of $6 million.
Enstar Group Limited | First Quarter 2024 | Form 10-Q 71
Item 2 | Management's Discussion and Analysis | Results of Operations by Segment | Investments Segment
Investments Segment
The following is a discussion and analysis of the results of operations for our Investments segment.
| Three Months Ended | |||||||||||||||||
| March 31, | $ Change | ||||||||||||||||
| 2024 | 2023 | ||||||||||||||||
| (in millions of U.S. dollars) | |||||||||||||||||
| REVENUES | |||||||||||||||||
| Net investment income: | |||||||||||||||||
| Fixed maturities | $ | 142 | $ | 131 | $ | 11 | |||||||||||
| Cash and restricted cash | 8 | 5 | 3 | ||||||||||||||
| Other investments, including equities | 20 | 24 | (4) | ||||||||||||||
| Less: Investment expenses | (10) | (4) | (6) | ||||||||||||||
| Total net investment income | 160 | 156 | 4 | ||||||||||||||
| Net realized losses: | |||||||||||||||||
| Fixed maturities | (6) | (18) | 12 | ||||||||||||||
| Total net realized losses | (6) | (18) | 12 | ||||||||||||||
| Fair value changes in: | |||||||||||||||||
| Fixed maturities, trading | (19) | 59 | (78) | ||||||||||||||
| Other investments, including equities | 104 | 147 | (43) | ||||||||||||||
| Total fair value changes in trading securities and other investments | 85 | 206 | (121) | ||||||||||||||
| Total revenues | 239 | 344 | (105) | ||||||||||||||
| EXPENSES | |||||||||||||||||
| General and administrative expenses | 10 | 11 | (1) | ||||||||||||||
| Total expenses | 10 | 11 | (1) | ||||||||||||||
| (Loss) income from equity method investments | (5) | 11 | (16) | ||||||||||||||
| SEGMENT NET INCOME | $ | 224 | $ | 344 | $ | (120) | |||||||||||
Overall Results
Three Months Ended March 31, 2024 versus 2023: Net income from our Investments segment was $224 million for the three months ended March 31, 2024 compared to net income of $344 million for the three months ended March 31, 2023. The variance of $120 million was primarily due to:
•a decrease in the gain from fair value changes in fixed maturities of $78 million, primarily as a result of increases in interest rates across U.S., U.K. and European markets in the current period, in comparison to decreases in interest rates in the comparative period;
•fair value change in other investments, including equities, of $104 million, compared to $147 million in the comparative period. The decrease of $43 million was primarily driven by:
◦a decrease in gain in the fair value change in other investments of $18 million for the three months ended March 31, 2024, primarily driven by an unfavorable variance in the fair value change of an embedded derivative in relation to the Aspen LPT, partially offset by increases in the fair value change related to CLO equity funds, private equity funds, real estate funds and high yield bond and loan funds relative to the comparative quarter; and
◦a decrease in the gain in fair value changes in equities of $16 million for the three months ended March 31, 2024, largely as a result of the reduced amount of equities within the investment portfolio relative to the comparative quarter.
•an increase in our net investment income of $4 million, which is primarily due to the reinvestment of fixed maturities at higher yields, deployment of consideration received from deals closed over the past 12 months and
Enstar Group Limited | First Quarter 2024 | Form 10-Q 72
Item 2 | Management's Discussion and Analysis | Results of Operations by Segment | Investments Segment
the impact of rising interest rates on the $3.1 billion of our average fixed maturities outstanding during the current period that are subject to floating interest rates. Our floating rate investments generated net investment income of $58 million, an increase of $2 million in comparison to the comparative quarter.
Total Investments
Fixed maturities
Refer to the below tables for the fair value, duration, and credit rating of our fixed maturities in our Run-off segment:
| March 31, 2024 | December 31, 2023 | ||||||||||||||||||||||||||||||||||||||||||||||
| Fair Value | % | Duration (years) (1) | Credit Rating (1) | Fair Value | % | Duration (years) (1) | Credit Rating (1) | ||||||||||||||||||||||||||||||||||||||||
| (in millions of U.S. dollars, except percentages) | |||||||||||||||||||||||||||||||||||||||||||||||
| Fixed maturity and short-term investments, trading and AFS | |||||||||||||||||||||||||||||||||||||||||||||||
| U.S. government & agency | $ | 291 | 3.2 | % | 4.8 | AA+ | $ | 326 | 3.4 | % | 4.5 | AA+ | |||||||||||||||||||||||||||||||||||
| U.K. government | 60 | 0.7 | % | 10.5 | A+ | 72 | 0.8 | % | 10.3 | A+ | |||||||||||||||||||||||||||||||||||||
| Other government | 364 | 4.1 | % | 4.9 | AA | 391 | 4.1 | % | 5.0 | AA | |||||||||||||||||||||||||||||||||||||
| Corporate | 3,927 | 43.7 | % | 5.3 | A- | 4,131 | 43.5 | % | 5.4 | A- | |||||||||||||||||||||||||||||||||||||
| Municipal | 132 | 1.5 | % | 7.0 | AA- | 142 | 1.5 | % | 7.6 | AA- | |||||||||||||||||||||||||||||||||||||
| Residential mortgage-backed | 465 | 5.2 | % | 5.1 | AA | 487 | 5.1 | % | 5.2 | AA | |||||||||||||||||||||||||||||||||||||
| Commercial mortgage-backed | 856 | 9.5 | % | 1.5 | AA- | 841 | 8.9 | % | 1.6 | AA- | |||||||||||||||||||||||||||||||||||||
| Asset-backed | 860 | 9.6 | % | 1.2 | A | 884 | 9.3 | % | 1.0 | A | |||||||||||||||||||||||||||||||||||||
| Total - Fixed maturity and short-term investments, trading and AFS | 6,955 | 77.5 | % | 4.4 | A | 7,274 | 76.6 | % | 4.5 | A | |||||||||||||||||||||||||||||||||||||
| Fixed maturities included in funds held - directly managed | 2,019 | 22.5 | % | 4.2 | A | 2,216 | 23.4 | % | 4.3 | A | |||||||||||||||||||||||||||||||||||||
| $ | 8,974 | 100.0 | % | 4.3 | A | $ | 9,490 | 100.0 | % | 4.4 | A | ||||||||||||||||||||||||||||||||||||
(1) The average duration and average credit ratings calculation includes short-term investments, fixed maturities and the fixed maturities within our funds held-directly managed portfolios.
The overall decrease in our fixed maturities of $516 million when comparing March 31, 2024 to December 31, 2023 was primarily driven by the impact of net paid losses and fair value changes.
Other investments, including equities
Refer to the below table for the composition of our other investments, including equities:
| March 31, 2024 | December 31, 2023 | ||||||||||
| (in millions of U.S. dollars) | |||||||||||
| Equities | |||||||||||
| Publicly traded equities | $ | 310 | $ | 275 | |||||||
| Exchange-traded funds | 84 | 82 | |||||||||
| Privately held equities | 344 | 344 | |||||||||
| Total | $ | 738 | $ | 701 | |||||||
| Other investments | |||||||||||
| Hedge funds | $ | 559 | $ | 491 | |||||||
| Fixed income funds | 550 | 605 | |||||||||
| Equity funds | 4 | 4 | |||||||||
| Private equity funds | 1,706 | 1,617 | |||||||||
| CLO equities | 60 | 60 | |||||||||
| CLO equity funds | 161 | 182 | |||||||||
| Private credit funds | 642 | 625 | |||||||||
| Real estate debt funds | 336 | 269 | |||||||||
| Total | $ | 4,018 | $ | 3,853 | |||||||
Our equities increased by $37 million and other investments increased by $165 million from December 31, 2023 to March 31, 2024, primarily due to fair value changes and the funding of various asset strategies, in line with our strategic asset allocation.
Enstar Group Limited | First Quarter 2024 | Form 10-Q 73
Item 2 | Management's Discussion and Analysis | Results of Operations by Segment | Investments Segment
Equity Method Investments
Refer to the below table for a summary of our equity method investments, which does not include those investments we have elected to measure under the fair value option:
| As of | Three Months Ended | As of | Three Months Ended | |||||||||||||||||||||||||||||||||||
| March 31, 2024 | March 31, 2024 | December 31, 2023 | March 31, 2023 | |||||||||||||||||||||||||||||||||||
| Ownership % | Carrying Value | Income (loss) from Equity Method Investments | Ownership % | Carrying Value | Income (loss) from Equity Method Investments | |||||||||||||||||||||||||||||||||
| (in millions of U.S. dollars) | ||||||||||||||||||||||||||||||||||||||
Citco (1) | — | % | $ | — | $ | — | — | % | $ | — | $ | 1 | ||||||||||||||||||||||||||
Monument Re (2) | 24.6 | % | 63 | (30) | 20.0 | % | 95 | (1) | ||||||||||||||||||||||||||||||
| Core Specialty | 19.9 | % | 251 | 26 | 19.9 | % | 225 | 11 | ||||||||||||||||||||||||||||||
| Other | 27.0 | % | 12 | (1) | 27.0 | % | 14 | — | ||||||||||||||||||||||||||||||
| $ | 326 | $ | (5) | $ | 334 | $ | 11 | |||||||||||||||||||||||||||||||
(1) Prior to the sale of our entire equity interest in Citco during the fourth quarter of 2023, we owned 31.9% of the common shares in HH CITCO Holdings Limited which in turn owns 15.4% of the convertible preferred shares, amounting to a 6.2% interest in the total equity of Citco.
(2) As of March 31, 2024, we own 24.6% of the common shares in Monument Re. We converted all of our preferred shares in Monument Midco to common shares in Monument Re on January 2, 2024. As of December 31, 2023, we owned 20.0% of the common shares in Monument Re as well as preferred shares in Monument Midco which had fixed dividend yields (where declared) and whose balances were included in the Investment amount.
Carrying Value and (Loss) Income from Equity Method Investments
The carrying value of our equity method investments decreased from December 31, 2023 primarily due to $5 million in loss from equity method investments for the three months ended March 31, 2024, which included a $30 million loss from our equity method investment in Monument, offset by earnings of $26 million from our equity method investment in Core Specialty.
Enstar Group Limited | First Quarter 2024 | Form 10-Q 74
Item 2 | Management's Discussion and Analysis | Results of Operations by Segment | Assumed Life Segment
Assumed Life Segment
The Assumed Life segment consisted of life and property aggregate excess of loss (catastrophe) business relating to Enhanzed Re.
During 2022, Enhanzed Re entered into a Master Agreement, through which we completed a series of commutation and novation agreements that allowed us to unwind Enhanzed Re’s operations in an orderly manner.
Transactions completed in the fourth quarter of 2022 were recognized in the first quarter of 2023, including the novation of our reinsurance of a closed block of life annuity policies to Monument Re and the repurchase of the remaining 24.9% interest in Enhanzed Re from Allianz.
Overall Results
Three Months Ended March 31, 2023: Net income from our Assumed Life segment of $275 million for the three months ended March 31, 2023 was primarily due to the net gain recognized on the completion of the novation of the Enhanzed Re reinsurance of a closed block of life annuity policies.
The $275 million gain calculated as of the completion date of the novation, prior to noncontrolling interests, was comprised of three components:
•the reclassification benefit to income of $363 million from AOCI related to the settlement of the novated liabilities (in accordance with our adoption of ASU 2018-12, the discount rate assumption for our long-duration liabilities was required to be periodically adjusted for changes in interest rates, which had the effect of reducing our future policyholder benefit liabilities and increasing the net assets transferred in the novation);
•the loss of $39 million on the carrying value of the net assets of $133 million as of the closing date of the transaction in exchange for cash consideration of $94 million (as noted above, the retrospective adoption of ASU 2018-12 resulted in an increase in net assets which gave rise to the transactional loss prior to our realization of the $363 million reclassification benefit); and
•a deferral of a portion of the net gain, $49 million, to account for our preexisting 20% ownership interest in Monument Re, calculated from the total gain of $324 million less Allianz’s 24.9% interest equal to $81 million (the deferred gain will be amortized over the expected settlement period for the life annuity policies to account).
Our net income attributable to Enstar was further reduced by $81 million, the amount attributable to Allianz’s 24.9% noncontrolling interest in Enhanzed Re at the time of the transaction. This amount has been recorded within our “Corporate and other activities”.
Our total first quarter 2023 net income attributable to Enstar from this novation transaction was $194 million.
Enstar Group Limited | First Quarter 2024 | Form 10-Q 75
Item 2 | Management's Discussion and Analysis | Results of Operations by Segment | Legacy Underwriting Segment
Legacy Underwriting Segment
The former Legacy Underwriting segment previously consisted of direct underwriting activities.
Overall Results
Three Months Ended March 31, 2023:
The Legacy Underwriting segment results comprised of SGL No.1 Limited’s (“SGL No.1”) 25% gross share of the 2020 and prior underwriting years of Atrium’s Syndicate 609 at Lloyd’s, less the impact of reinsurance agreements with Arden and a Syndicate 609 Capacity Lease Agreement with Atrium 5 Limited.
The contractual arrangements between SGL No. 1, Arden and Atrium relating to the reinsurance agreements and the Capacity Lease Agreement settled in the second quarter of 2023 for the economic benefit of Atrium, and there was no net retention by Enstar. As a result of the settlement, we did not record and do not expect to record any transactions in the Legacy Underwriting segment in 2023 and 2024, respectively.
Enstar Group Limited | First Quarter 2024 | Form 10-Q 76
Item 2 | Management's Discussion and Analysis | Results of Operations by Segment | Corporate and other
Corporate and other
The following is a discussion and analysis of our results of operations for our Corporate and other activities.
| Three Months Ended | |||||||||||||||||
March 31, | $ Change | ||||||||||||||||
| 2024 | 2023 | ||||||||||||||||
| REVENUES | (in millions of U.S. dollars) | ||||||||||||||||
| Other income: | |||||||||||||||||
Amortization of fair value adjustments (1) | $ | (4) | $ | (4) | $ | — | |||||||||||
| All other income | 1 | 4 | (3) | ||||||||||||||
| Total revenues | (3) | — | (3) | ||||||||||||||
| EXPENSES | |||||||||||||||||
| Net incurred losses and LAE - prior periods: | |||||||||||||||||
| Amortization of fair value adjustments | 3 | 3 | — | ||||||||||||||
Changes in fair value - fair value option (2) | (4) | 20 | (24) | ||||||||||||||
| Total net incurred losses and LAE - prior periods | (1) | 23 | (24) | ||||||||||||||
| Amortization of net deferred charge assets | 30 | 17 | 13 | ||||||||||||||
| General and administrative expenses | 35 | 39 | (4) | ||||||||||||||
| Total expenses | 64 | 79 | (15) | ||||||||||||||
| Interest expense | (22) | (23) | 1 | ||||||||||||||
| Net foreign exchange gains | 9 | 6 | 3 | ||||||||||||||
| Income tax (expense) benefit | (5) | 1 | (6) | ||||||||||||||
| Net income attributable to noncontrolling interests | — | (86) | 86 | ||||||||||||||
| Dividends on preferred shares | (9) | (9) | — | ||||||||||||||
| NET LOSS ATTRIBUTABLE TO ENSTAR ORDINARY SHAREHOLDERS | $ | (94) | $ | (190) | $ | 96 | |||||||||||
(1) Amortization of fair value adjustments relates to the acquisition of DCo and Morse TEC.
(2) Comprises the discount rate and risk margin components.
Overall Results
Three Months Ended March 31, 2024 versus 2023: Net loss attributable to Enstar ordinary shareholders from our Corporate and other activities was $94 million and $190 million for the three months ended March 31, 2024 and 2023, respectively, primarily due to:
•a decrease in net income attributable to noncontrolling interests of $86 million, that was primarily a result of attributing $81 million of the gain on novation of the Enhanzed Re reinsurance closed block of life annuity policies to Allianz’s 24.9% equity interest in Enhanzed Re at the time of the transaction, in the comparative quarter; and
•changes in the fair value of the 2017 and 2018 portfolios where we elected the fair value option which resulted in a $4 million reduction in liabilities in the first quarter of 2024 primarily driven by an increase in U.K. corporate bond yields during the first quarter of 2024. The corporate bond yields, which form a component of the discount rate used to calculate the fair value of the liabilities, are matched to the original currencies of the underlying loss portfolios, of which GBP is the predominant currency for those portfolios that we have elected to measure at fair value using the fair value option. In comparison, we recognized a $20 million increase of such liabilities in the first quarter 2023 due to a decline in interest rates; partially offset by
•An increase in the amortization of net deferred charge assets of $13 million, driven by an increase in net DCA balances as a result of transactions completed subsequent to March 31, 2023.
Enstar Group Limited | First Quarter 2024 | Form 10-Q 77
Current Outlook
Run-off Outlook
Transactions
On April 30, 2024, one of our wholly owned subsidiaries reached an agreement for a loss portfolio transfer with a subsidiary of SiriusPoint Ltd. (“SiriusPoint”) to reinsure a portfolio of workers compensation business covering underwriting years 2018 to 2023. SiriusPoint will cede $400 million of net reserves and our subsidiary will provide $200 million of additional cover in excess of the ceded reserves. The closing of the transaction is subject to regulatory approval and other closing conditions.
We continue to evaluate transactions in our active pipeline including LPTs, ADCs, and other transaction types including acquisitions. We seek opportunities to execute on creative and accretive transactions by offering innovative capital release solutions that enable our clients to meet their capital and risk management objectives.
Should we execute additional transactions, our mix of loss reserves by line of business, asset mix and both rate and timing of earnings may be impacted in the medium to long term.
Seasonality
We complete most of our annual loss reserve studies in the fourth quarter of each year and, as a result, tend to record the largest movements, both favorable and adverse, to net incurred losses and LAE in this period.
In the interim periods where a reserve study has not been completed, we perform quarterly reviews to ascertain whether changes to claims paid or case reserves have varied from our expectations developed during the last annual reserve review. In this event, we consider the timing and magnitude of the actual versus expected development, and we may record an interim adjustment to our recorded reserves if, and when, warranted.
Investment Outlook
We expect global financial markets to remain uncertain throughout 2024 due to the lagged impact of higher interest rates and tighter financial conditions, a potential economic recession, resilient inflation, US Presidential elections and the macroeconomic effects of ongoing geopolitical conflicts and tensions.
Market expectations around the future path of interest rates will represent a continued source of volatility, as global central banks attempt to engineer a soft landing by normalizing interest rates while closely monitoring inflation. If interest rates rise and/or credit spreads widen, we may recognize unrealized losses and fair value changes on our fixed maturities and incur a higher rate of borrowing and interest costs if we renew or borrow under credit facilities in the current environment.
Despite this, elevated interest rates can represent an opportunity for us in the medium to long term, notably;
•As of March 31, 2024, we hold 17.4% of our portfolio, or $3.1 billion, in fixed maturity investments with floating interest rates which, should interest rates remain elevated, would be accretive to future investment book yields. We have earned $58 million and $56 million of net investment income from our floating rate investments for the three months ended March 31, 2024 and 2023, respectively, which were generally indexed to LIBOR1 through June 30, 2023 and SOFR thereafter.
•Higher interest rates have provided us with the opportunity to reinvest at higher yields as our securities mature or as we invest a significant portion of consideration received from new business in fixed maturities.
We expect that the cumulative unrealized losses and fair value changes we have recognized on our fixed maturities since 2022 will be recouped as these assets get closer to their maturity and the prices pull to par, assuming we do not, or are otherwise not required to, sell such investments prior to maturity. We may also undertake tactical repositioning of our portfolio as opportunities arise to achieve better alignment with our investment strategy, rather than waiting for certain fixed maturities to pull to par, which may result in the recognition of previously unrealized losses within our income statement with a corresponding reclassification adjustment in other comprehensive income. Such adjustments would be neutral to equity since the unrealized losses are recorded as a component of
1 LIBOR was ceased on June 30, 2023 and replaced by the Secured Overnight Financing Rate (“SOFR”).
Enstar Group Limited | First Quarter 2024 | Form 10-Q 78
accumulated other comprehensive income. Any investment repositioning may also have a corresponding impact to our investment book yield.
We expect global equity markets to remain volatile in 2024, and this, combined with our reporting lag on certain investments, may impact the valuation of our risk investments. We invest in public and private assets, which may vary in the magnitude of their exposure to any potential economic recession and other macroeconomic factors.
Despite these challenges, we remain committed to our strategic asset allocation and expect our investments to provide attractive risk adjusted returns and diversification benefits over the medium to long term.
Inflation
We continue to monitor the inflationary impacts resulting from pandemic-related government stimulus and labor force supply pressures on our loss cost trends.
Commencing in 2021, economic inflation rose significantly before peaking in mid-2022 and returning to low single digits in late 2023 and early 2024. During this period our net loss reserves have not been significantly impacted by these inflationary pressures.
Social inflation has been a persistent headwind for the industry for some time. We continue to monitor and seek to actively resolve claims in difficult judicial districts. We closely follow these trends and proactively set appropriate reserves.
As described above, global economic policy responses to inflation have contributed to increases in interest rates, which, in the short term, have had a significant impact on our investments, in particular our fixed maturities. Any further rise in interest rates will have further negative impacts on our fixed maturities in the form of unrealized losses and fair value changes.
There remains uncertainty around the future of inflation. We continue to monitor liquidity, capital and the potential earnings impact of these changes but remain focused on medium to long term asset allocation decisions.
We expect to continue to benefit from our allocation to investments with inflationary pass-through components, including investments in private equity, private credit, real estate, and infrastructure asset classes.
Inflation, tight labor conditions and higher service costs continue to put pressure on wages and prices, which could impact our general and administrative expenses as we remain focused on being a competitive employer in our market.
Geopolitical Conflicts
Heightened geopolitical conflicts, including the Russian invasion of Ukraine and the more recent conflicts in the Middle East, are directly and indirectly (through comprehensive sanctions regimes) contributing to increased commodity prices, disrupted supply chains, global financial market volatility and significant industry losses.
We continue to monitor our direct investment and underwriting risks and our acquisition pipeline as a result of these ongoing conflicts. To date, we are not aware of operational disruption to us or our third party service providers as a result of these conflicts, and we have not identified any significant direct impacts from these events. We also continue to monitor for, and respond to, all changes in the global sanctions regime, updating our procedures accordingly.
Minimum Corporate Income Tax
In December 2021, the OECD released the final model rules on Pillar II, an initiative proposing a global minimum tax rate of 15% designed to ensure large multinational enterprises pay a minimum level of tax on the income arising in each jurisdiction where they operate. We have several subsidiaries in jurisdictions that have enacted, or intend to enact, Pillar II legislation, including particularly the U.K., Australia and Belgium.
In response to Pillar II initiatives, the government of Bermuda enacted a 15% corporate income tax in December 2023 that will become effective January 1, 2025. Based on our substantial operations in Bermuda, we expect a meaningful portion of our income will be subject to the Bermuda corporate income tax. However, the Bermuda Corporate income tax will mitigate the impact of Pillar II.
Enstar Group Limited | First Quarter 2024 | Form 10-Q 79
We continue to monitor ongoing developments relating to these new tax regimes.
Enstar Group Limited | First Quarter 2024 | Form 10-Q 80
Liquidity and Capital Resources
Overview
We aim to generate cash flows from our (re)insurance operations and investments, preserve sufficient capital for future acquisitions and new business, and develop relationships with lenders who provide borrowing capacity at competitive rates.
Liquidity and Capital Resources Highlights
Uses of Cash During the Three Months Ended March 31, 2024:
•We paid $9 million of cash dividends on our Series D and E Preferred Shares; and
•We paid $32 million of interest coupon payments on our Publicly Issued Notes.
As of March 31, 2024 we had $450 million of cash and cash equivalents, excluding restricted cash, that supports (re)insurance operations. Included in this amount was $234 million held by our foreign subsidiaries outside of Bermuda.
We closed 2023 with an estimated solvency capital ratio of 195%. Based upon our strong financial fundamentals and funding sources available to us, we continue to believe we have access to adequate liquidity and capital resources to meet business requirements under current market conditions and reasonably possible stress scenarios for the foreseeable future. We continuously monitor our liquidity and capital positions and adjust as required by market conditions. The following represent our total capitalization and capitalization attributable to Enstar as of March 31, 2024 and December 31, 2023.


Under the eligible capital rules of the Bermuda Monetary Authority (“BMA”), our Preferred Shares qualify as Tier 2 capital when considering the Bermuda Solvency Capital Requirements (“BSCR”).
For purposes of the financial covenants in our credit facilities, total debt excludes hybrid capital (defined as our Junior Subordinated Notes) not exceeding 15% of total capital attributable to Enstar. As of March 31, 2024, we were in compliance with the financial covenants in our credit facilities.
Enstar Group Limited | First Quarter 2024 | Form 10-Q 81
Liquidity and Capital Resources of Holding Company and subsidiaries
Holding Company Liquidity
We conduct substantially all of our operations through our subsidiaries. As such, the potential sources of liquidity to Enstar as a holding company consist of cashflows from our subsidiaries, including dividends, advances and loans, and interest income on loans to our subsidiaries. We have available borrowing capacity under our revolving credit facility, and we have obtained funding through the issuance of senior notes and preferred shares. The holding company also guaranteed our Junior Subordinated Notes issued by one of our subsidiaries in prior years.
As of March 31, 2024, we had $800 million of available unutilized capacity under our unsecured revolving credit agreement, which expires in May 2028. We may request additional commitments under the facility up to an aggregate amount of $200 million, which the existing lenders, in their discretion, or new lenders, may provide. To date, we have not requested any additional commitments under the facility.
We use cash to fund new acquisitions of companies. We also utilize cash for our operating expenses associated with being a public company and to pay dividends on our preferred shares and interest and principal on loans from subsidiaries and debt obligations, including loans under our credit facilities, our Senior Notes and our Junior Subordinated Notes.
We may, from time to time, raise capital from the issuance of equity, debt or other securities as we continuously evaluate our strategic opportunities. We filed an automatic shelf registration statement in March 2023 with the SEC to allow us to conduct future offerings of certain securities, if desired, including debt, equity and other securities.
As we are a holding company and have no substantial operations of our own, our assets consist primarily of investments in subsidiaries and our loans and advances to subsidiaries. Dividends from our (re)insurance subsidiaries are restricted by (re)insurance laws and regulations, as described below. The ability of all of our subsidiaries to make distributions and transfers to us may also be restricted by, among other things, other applicable laws and regulations and the terms of our credit facilities and our subsidiaries' bank loans and other issued debt instruments.
Based on our group's current corporate structure with a Bermuda domiciled parent company and the jurisdictions in which we operate, if the cash and cash equivalents held by our foreign subsidiaries were to be distributed to us, as dividends or otherwise, such amount would not be subject to incremental income taxes; however, in certain circumstances withholding taxes may be imposed by some jurisdictions, including by the United States.
Based on existing tax laws, regulations and our current intentions, there were no accruals as of March 31, 2024 for any material withholding taxes on dividends or other distributions.
Sources and Uses of Cash
Cash and cash equivalents decreased by $70 million during the three months ended March 31, 2024, which was largely due to cash used in operating and financing activities of $168 million and $8 million, respectively, partially offset by cash provided by investing activities of $102 million.
Cash and cash equivalents decreased by $187 million during the three months ended March 31, 2023, which was largely due to cash used in financing activities of $349 million, partially offset by cash provided by operating activities and investing activities of $70 million and $94 million, respectively.
Enstar Group Limited | First Quarter 2024 | Form 10-Q 82
| Analysis of Sources and Uses of Cash | |||||||||||||||||
| Three Months Ended March 31, | |||||||||||||||||
| 2024 | 2023 | $ Change | |||||||||||||||
| (in millions of U.S. dollars) | |||||||||||||||||
| Operating Cash Flow Activities | |||||||||||||||||
| Net paid losses | $ | (670) | $ | (677) | $ | 7 | |||||||||||
| Net sales and maturities of trading securities | 66 | 323 | (257) | ||||||||||||||
| Net investment income | 161 | 116 | 45 | ||||||||||||||
| Cash consideration received for novation | — | 94 | (94) | ||||||||||||||
| Other sources | 275 | 214 | 61 | ||||||||||||||
| Net cash flows (used in) provided by operating activities | (168) | 70 | (238) | ||||||||||||||
| Investing Cash Flow Activities | |||||||||||||||||
| Net sales of AFS securities | 184 | 147 | 37 | ||||||||||||||
| Net purchases of other investments | (83) | (54) | (29) | ||||||||||||||
| Other sources | 1 | 1 | — | ||||||||||||||
| Net cash flows provided by investing activities | 102 | 94 | 8 | ||||||||||||||
| Financing Cash Flow Activities | |||||||||||||||||
| Preferred share dividends | (9) | (9) | — | ||||||||||||||
| Share repurchases | — | (340) | 340 | ||||||||||||||
| Other | 1 | — | 1 | ||||||||||||||
| Net cash flows used in financing activities | $ | (8) | $ | (349) | $ | 341 | |||||||||||
Analysis of Sources and Uses of Cash
Operating Cash Flow Activities
2024 vs 2023: Cash used in operating activities of $168 million for the three months ended March 31, 2024 was driven by net paid losses of $670 million, partially offset by net sales and maturities of trading securities of $66 million, $161 million from receipt of net investment income and other sources of $275 million, which was largely generated by the release of funds held balances to cover net paid claims on certain portfolios. In comparison, cash provided by operating activities of $70 million for the three months ended March 31, 2023 was driven by net sales and maturities of trading securities of $323 million and other sources of $214 million, which was largely generated by the release of funds held balances to cover net paid claims on certain portfolios, net investment income received of $116 million, and cash consideration for the Enhanzed Re gain on novation of $94 million. These net inflows were partially offset by net paid losses of $677 million.
Investing Cash Flow Activities
2024 vs 2023: Cash provided by investing activities of $102 million for the three months ended March 31, 2024 was primarily due to net sales of fixed maturities, AFS of $184 million, partially offset by net purchases of other investments of $83 million. In comparison, cash provided by investing activities of $94 million for the three months ended March 31, 2023 was primarily due to net sales of fixed maturities, AFS of $147 million, partially offset by net purchases of other investments of $54 million.
Financing Cash Flow Activities
2024 vs 2023: Cash used in financing activities of $8 million for the three months ended March 31, 2024 was primarily driven by the payment of preferred share dividends of $9 million. In comparison, cash used in financing activities of $349 million for the three months ended March 31, 2023 was largely driven by share repurchases of $340 million, as a result of our strategic repurchase of our non-voting convertible ordinary shares during the first quarter of 2023.
Enstar Group Limited | First Quarter 2024 | Form 10-Q 83
U.S. Finance Company Liquidity
Enstar Finance is a wholly-owned finance subsidiary under which we have issued our Junior Subordinated Notes. Similar to our holding company, Enstar Finance is dependent upon funds from other subsidiaries to pay any amounts due under the Junior Subordinated Notes in the form of distributions or loans, which may be restricted by, among other things, other applicable laws and regulations and the terms of our credit facilities and our subsidiaries’ bank loans and other issued debt instruments.
Liquidity in Operating Companies
We expect that our operating companies will generate sufficient liquidity, together with our existing capital base and cash and investments acquired and from new business transactions, to meet cash requirements and to operate our business.
Sources of funds to our operating companies primarily consist of cash and investment portfolios acquired on the completion of acquisitions and new business, investment income earned, proceeds from sales and maturities of investments and collection of reinsurance recoverables. We also collect small amounts of premiums and fee and commission income.
Cash balances acquired upon the purchase of (re)insurance companies are classified as cash provided by investing activities, whereas cash from new business is classified as cash provided by operating activities.
The primary uses of funds by our operating companies are claims payments, investment purchases, operating expenses and collateral requirements.
The ability of our (re)insurance subsidiaries to pay dividends and make other distributions is limited by the applicable laws and regulations of the jurisdictions in which our (re)insurance subsidiaries operate, including Bermuda, the United Kingdom, the United States, Australia and Continental Europe, which subject these subsidiaries to significant regulatory restrictions.
These laws and regulations require, among other things, certain of our (re)insurance subsidiaries to maintain minimum capital requirements and limit the amount of dividends and other payments that these subsidiaries can pay to us, which in turn may limit our ability to pay dividends and make other payments.
As of March 31, 2024, to our knowledge, all of our (re)insurance subsidiaries’ capital requirement levels were in excess of the minimum levels required for their respective regulatory jurisdictions.
Our subsidiaries' ability to pay dividends and make other forms of distributions may also be limited by our repayment obligations under certain of our outstanding credit facility agreements and other debt instruments. Variability in ultimate loss payments and collateral amounts required may also result in increased liquidity requirements for our subsidiaries.
Debt Obligations
Our debt obligations as of March 31, 2024 and December 31, 2023 were as follows:
| Facility | Origination Date | Term | March 31, 2024 | December 31, 2023 | ||||||||||||||||||||||
| (in millions of U.S. dollars) | ||||||||||||||||||||||||||
| 4.95% Senior Notes due 2029 | May 2019 | 10 years | $ | 496 | $ | 496 | ||||||||||||||||||||
| 3.10% Senior Notes due 2031 | August 2021 | 10 years | 496 | 496 | ||||||||||||||||||||||
| Total Senior Notes | 992 | 992 | ||||||||||||||||||||||||
| 5.75% Junior Subordinated Notes due 2040 | August 2020 | 20 years | 346 | 345 | ||||||||||||||||||||||
| 5.50% Junior Subordinated Notes due 2042 | January 2022 | 20 years | 494 | 494 | ||||||||||||||||||||||
| Total Junior Subordinated Notes | 840 | 839 | ||||||||||||||||||||||||
| Total debt obligations | $ | 1,832 | $ | 1,831 | ||||||||||||||||||||||
Under the eligible capital rules of the BMA, the Senior Notes qualify as Tier 3 capital and the Junior Subordinated Notes qualify as Tier 2 capital when considering the BSCR.
Enstar Group Limited | First Quarter 2024 | Form 10-Q 84
We may from time to time seek to retire or purchase our outstanding debt through cash purchases, redemptions and/or exchanges for other securities, in open market purchases, privately negotiated transactions or otherwise. Any such repurchases, redemptions or exchanges will be dependent upon several factors, including our liquidity requirements, contractual restrictions, general market conditions and applicable regulatory, legal and accounting factors.
Credit Ratings
The following table presents our credit ratings as of May 2, 2024:
Credit ratings (1) | Standard and Poor’s | Fitch Ratings | ||||||||||||
| Long-term issuer | BBB+ (Outlook: Stable) | BBB+ (Outlook: Stable) | ||||||||||||
| 2029 Senior Notes | BBB+ | BBB | ||||||||||||
| 2031 Senior Notes | BBB | BBB | ||||||||||||
| 2040 and 2042 Junior Subordinated Notes | BBB- | BBB- | ||||||||||||
| Series D and E Preferred Shares | BBB- | BBB- | ||||||||||||
(1) Credit ratings are provided by third parties, Standard & Poor’s and Fitch Ratings, and are subject to certain limitations and disclaimers. For information on these ratings, refer to the rating agencies’ websites and other publications.
Agency ratings are not a recommendation to buy, sell or hold any of our securities and may be revised or withdrawn at any time by the issuing organization. Each agency's rating should be evaluated independently of any other agency's rating2.
Contractual Obligations
Reserves for Losses and LAE
We generally attempt to match the duration of our investment portfolio to the duration of our general liability profile and generally seek to maintain investment portfolios that are shorter or of equivalent duration to the liabilities in order to provide liquidity for the settlement of losses and, where possible, to avoid having to liquidate longer-dated investments. The settlement of liabilities also has the potential to accelerate the natural payout of losses and policyholder benefits, which may require additional liquidity. As of March 31, 2024 and December 31, 2023, the weighted average estimated durations of our Run-off segment gross reserves for losses and LAE were 4.69 and 4.72 years, respectively.
Share Repurchases and Dividends
We believe that the best investment is in our business, by funding future transactions and meeting our financing obligations. We may choose to return value to shareholders in the form of share repurchases or dividends. To date, we have not declared any dividends on our ordinary shares. We may re-evaluate this strategy from time to time based on overall market conditions and other factors.
We have 16,000 Series D Preferred Shares with an aggregate liquidation value of $400 million and 4,400 Series E Preferred Shares with an aggregate liquidation value of $110 million. The dividends on both Series of Preferred Shares are non-cumulative and may be paid quarterly in arrears, only when, as and if declared.
Any payment of common or preferred dividends must be approved by our Board. Our ability to pay ordinary and preferred dividends is subject to certain restrictions.
2 For information on risks related to our credit ratings, refer to "Item 1A. Risk Factors - Risks Relating to Liquidity and Capital Resources" and "Item 1A. Risk Factors - Risks Relating to Ownership of our Shares" in our Annual Report on Form 10-K for the year ended December 31, 2023.
Enstar Group Limited | First Quarter 2024 | Form 10-Q 85
Off-Balance Sheet Arrangements
As of March 31, 2024, we have entered into certain investment commitments and parental guarantees. We do not believe it is reasonably likely that these arrangements will have a material unplanned current or future effect on our financial condition as they are considered in normal course of business and on-going stress testing.
We also utilize unsecured and secured letters of credit3 (“LOCs”) and a deposit facility.
The following table represents our outstanding unfunded investment commitments and LOCs by duration as of March 31, 2024:
| Short-Term | Long-Term | |||||||||||||||||||
| Less than 1 Year | More than 1 Year | Total | ||||||||||||||||||
| (in millions of U.S. dollars) | ||||||||||||||||||||
| Investing Activities | ||||||||||||||||||||
| Unfunded investment commitments | $ | 335 | $ | 1,237 | $ | 1,572 | ||||||||||||||
| Financing Activities | ||||||||||||||||||||
| Letters of credit | $ | — | $ | 1,769 | 1,769 | |||||||||||||||
3 Refer to Note 18 to our consolidated financial statements included in our Annual Report on Form 10-K for the year ended December 31, 2023 for further details.
Enstar Group Limited | First Quarter 2024 | Form 10-Q 86
ITEM 3. QUANTITATIVE AND QUALITATIVE DISCLOSURES ABOUT MARKET RISK
We are principally exposed to four types of market risk: interest rate risk, credit risk, equity price risk and foreign currency risk. For the three months ended March 31, 2024, there were no material changes to these market risks or our policies to address these market risks, as disclosed in “Part II, Item 7A. Quantitative and Qualitative Disclosures about Market Risk” in our Annual Report on Form 10-K for the year ended December 31, 2023.
Enstar Group Limited | First Quarter 2024 | Form 10-Q 87
ITEM 4. CONTROLS AND PROCEDURES
Evaluation of Disclosure Controls and Procedures
Under the supervision and with the participation of management, including our Chief Executive Officer and our Chief Financial Officer, we evaluated the effectiveness of our disclosure controls and procedures (as defined in Rules 13a-15(e) and 15d-15(e) of the Exchange Act) as of March 31, 2024. Based on that evaluation, our Chief Executive Officer and our Chief Financial Officer have concluded that we maintained effective disclosure controls and procedures to provide reasonable assurance that information required to be disclosed by us in reports that we file or submit under the Exchange Act is recorded, processed, summarized and timely reported as specified in the rules and forms of the U.S. Securities and Exchange Commission and is accumulated and communicated to our management, including the Chief Executive Officer and Chief Financial Officer, as appropriate, to allow timely decisions regarding required disclosure.
Changes in Internal Controls Over Financial Reporting
There were no changes in our internal controls over financial reporting that occurred during the three months ended March 31, 2024 that have materially affected, or are reasonably likely to materially affect, our internal controls over financial reporting.
Enstar Group Limited | First Quarter 2024 | Form 10-Q 88
PART II — OTHER INFORMATION
ITEM 1. LEGAL PROCEEDINGS
For a discussion of legal proceedings, see Note 15 to our unaudited condensed consolidated financial statements, which is incorporated herein by reference.
ITEM 1A. RISK FACTORS
Our results of operations and financial condition are subject to numerous risks and uncertainties described in “Risk Factors” included in Item 1A of our Annual Report on Form 10-K for the year ended December 31, 2023. The risk factors identified therein have not materially changed.
ITEM 2. UNREGISTERED SALES OF EQUITY SECURITIES AND USE OF PROCEEDS
Issuer Purchases of Equity Securities
There were no ordinary shares acquired by the Company during the three months ended March 31, 2024.
ITEM 3. DEFAULTS UPON SENIOR SECURITIES
None.
ITEM 4. MINE SAFETY DISCLOSURES
Not applicable.
ITEM 5. OTHER INFORMATION
During the three months ended March 31, 2024, no director or officer of the Company adopted terminated
Enstar Group Limited | First Quarter 2024 | Form 10-Q 89
ITEM 6. EXHIBITS
EXHIBIT INDEX
| Exhibit No. | Description | |||||||
| Memorandum of Association of Enstar Group Limited (incorporated by reference to Exhibit 3.1 of the Company’s Form 10-K/A filed on May 2, 2011). | ||||||||
| Sixth Amended and Restated Bye-Laws of Enstar Group Limited (incorporated by reference to Exhibit 3.1 of the Company’s Form 8-K filed on June 15, 2021). | ||||||||
| Certificate of Designations of Series C Participating Non-Voting Perpetual Preferred Stock (incorporated by reference to Exhibit 3.1 of the Company’s Form 8-K filed on June 17, 2016). | ||||||||
| Certificate of Designations of 7.00% fixed-to-floating rate perpetual non-cumulative preference shares, Series D (incorporated by reference to Exhibit 4.1 of the Company’s Form 8-K filed on June 27, 2018). | ||||||||
| Certificate of Designations of 7.00% perpetual non-cumulative preference shares, Series E (incorporated by reference to Exhibit 4.1 of the Company’s Form 8-K filed on November 21, 2018). | ||||||||
| Amended and Restated Employment Agreement, dated June 6, 2023, by and between Enstar (US), Inc. and Nazar Alobaidat. | ||||||||
| Amendment No. 2 to the Employment Agreement, dated April 4, 2024, between Enstar (US), Inc. and Paul Brockman. | ||||||||
| Contract of Employment, dated April 4, 2024, between Enstar (EU) Limited and Paul Brockman. | ||||||||
31.1* | Certification of Chief Executive Officer pursuant to Rule 13a-14(a) or Rule 15d-14(a) of the Securities Exchange Act of 1934 as adopted under Section 302 of the Sarbanes-Oxley Act of 2002. | |||||||
31.2* | Certification of Chief Financial Officer pursuant to Rule 13a-14(a) or Rule 15d-14(a) of the Securities Exchange Act of 1934 as adopted under Section 302 of the Sarbanes-Oxley Act of 2002. | |||||||
32.1** | Certification of Chief Executive Officer pursuant to 18 U.S.C. Section 1350, as adopted pursuant to Section 906 of the Sarbanes-Oxley Act of 2002. | |||||||
32.2** | Certification of Chief Financial Officer pursuant to 18 U.S.C. Section 1350, as adopted pursuant to Section 906 of the Sarbanes-Oxley Act of 2002. | |||||||
| 101.INS | XBRL Instance Document - the instance document does not appear in the Interactive Data File because its XBRL tags are embedded within the Inline XBRL document. | |||||||
| 101.SCH | XBRL Taxonomy Extension Schema | |||||||
| 101.CAL | XBRL Taxonomy Extension Calculation Linkbase | |||||||
| 101.LAB | XBRL Taxonomy Extension Label Linkbase | |||||||
| 101.DEF | XBRL Taxonomy Extension Definition Linkbase | |||||||
| 101.PRE | XBRL Taxonomy Extension Presentation Linkbase | |||||||
| 104 | Cover page Interactive Data File (embedded within the Inline XBRL document and included in Exhibit 101) | |||||||
_______________________________
* filed herewith
** furnished herewith
+ denotes management contract or compensatory arrangement
s certain of the schedules and similar attachments are not filed but Enstar Group Limited undertakes to furnish a copy of the schedules or similar attachments to the SEC upon request
Enstar Group Limited | First Quarter 2024 | Form 10-Q 90
SIGNATURES
Pursuant to the requirements of the Securities Exchange Act of 1934, the registrant has duly caused this report to be signed on its behalf by the undersigned, thereunto duly authorized on May 2, 2024.
| ENSTAR GROUP LIMITED | |||||
| By: | /s/ Matthew Kirk | ||||
| Matthew Kirk Chief Financial Officer, Authorized Signatory and Principal Financial Officer | |||||
| By: | /s/ Girish Ramanathan | ||||
| Girish Ramanathan Chief Accounting Officer and Principal Accounting Officer | |||||
Enstar Group Limited | First Quarter 2024 | Form 10-Q 91