UNITED STATES
SECURITIES AND EXCHANGE COMMISSION
WASHINGTON, DC 20549
FORM 10-Q
| QUARTERLY REPORT PURSUANT TO SECTION 13 OR 15(d) OF THE SECURITIES EXCHANGE ACT OF 1934 | |||||
For the quarterly period ended October 28, 2023
OR
| TRANSITION REPORT PURSUANT TO SECTION 13 OR 15(d) OF THE SECURITIES EXCHANGE ACT OF 1934 | |||||
For the transition period from ______ to ______
Commission File Number 001-34742
(Exact name of registrant as specified in its charter)
| (State or other jurisdiction of incorporation or organization) | (I.R.S. Employer Identification No.) | |||||||
| Address of principal executive offices and Zip Code | ||||||||
Telephone: (614 ) 474-4001
Registrant’s telephone number, including area code
Securities registered pursuant to Section 12(b) of the Act:
| Title of each class | Trading Symbol(s) | Name of each exchange on which registered | ||||||||||||
Indicate by check mark whether the registrant (1) has filed all reports required to be filed by Section 13 or 15(d) of the Securities Exchange Act of 1934 during the preceding 12 months (or for such shorter period that the registrant was required to file such reports) and (2) has been subject to such filing requirements for the past 90 days. Yes ☒ No ☐
Indicate by check mark whether the registrant has submitted electronically every Interactive Data File required to be submitted pursuant to Rule 405 of Regulation S-T (§232.405 of this chapter) during the preceding 12 months (or for such shorter period that the registrant was required to submit such files). Yes ☒ No ☐
Indicate by check mark whether the registrant is a large accelerated filer, an accelerated filer, a non-accelerated filer, a smaller reporting company, or an emerging growth company. See the definitions of “large accelerated filer,” “accelerated filer,” “smaller reporting company,” and “emerging growth company” in Rule 12b-2 of the Exchange Act.
| Large accelerated filer | ☐ | ☒ | |||||||||
| Non-accelerated filer | ☐ | Smaller reporting company | |||||||||
| Emerging growth company | |||||||||||
If an emerging growth company, indicate by check mark if the registrant has elected not to use the extended transition period for complying with any new or revised financial accounting standards provided pursuant to Section 13(a) of the Exchange Act. ☐
Indicate by check mark whether the registrant is a shell company (as defined in Rule 12b-2 of the Exchange Act). Yes ☐ No ☒
The number of outstanding shares of the registrant’s common stock was 3,746,258 as of December 5, 2023.
EXPRESS, INC. | Q3 2023 Form 10-Q | 1
EXPRESS, INC.
INDEX TO FORM 10-Q
EXPRESS, INC. | Q3 2023 Form 10-Q | 2
FORWARD-LOOKING STATEMENTS
This Quarterly Report on Form 10-Q (“Quarterly Report”) contains forward-looking statements within the “safe harbor” provisions of the Private Securities Reform Act of 1995 that are subject to risks and uncertainties. All statements other than statements of historical fact included in this Quarterly Report are forward-looking statements. Forward-looking statements give our current expectations and projections relating to our financial condition, results of operations, plans, objectives, future performance, and business. You can identify forward-looking statements by the fact that they do not relate strictly to historical or current facts. These statements may include words such as “anticipate,” “estimate,” “expect,” “project,” “plan,” “potential,” “intend,” “believe,” “may,” “will,” “should,” “can have,” “likely,” "continue to," and other words and terms of similar meaning in connection with any discussion of the timing or nature of future operating or financial performance or other events. For example, all statements we make relating to our estimated and projected costs, expenditures, liquidity, cash flows, and financial results, our plans and objectives for future operations, growth, initiatives, or strategies, the anticipated financial benefits (and the timing of the realization of such benefits) from our cost reduction actions, plans to repurchase shares of our common stock, the expected outcome or impact of pending or threatened litigation, or our strategic partnership with WHP Global or any transactions arranged as part of that partnership, including the Bonobos acquisition, and the anticipated benefits or effects of such transactions, are forward-looking statements. All forward-looking statements are subject to risks and uncertainties that may cause actual results to differ materially from those that we expected, including:
Operational and Industry Risks | ||
▪general economic conditions and changes in consumer spending, including as a result of recent high inflation and fears of a potential recession or instability in the financial markets and banking industry; | ||
▪customer traffic at malls, shopping centers, and at our stores; | ||
▪the COVID-19 pandemic has had, and may in the future have, an adverse effect on our business operations, financial condition, liquidity and cash flow; | ||
▪competition from other retailers; | ||
▪our dependence upon independent third parties to manufacture all of our merchandise; | ||
▪changes in the availability and cost of raw materials, labor, and freight; | ||
▪labor shortages; | ||
▪supply chain disruption and increased tariffs; | ||
▪geopolitical risks, including impacts from the ongoing conflict between Russia and Ukraine and increased tensions between China and Taiwan; | ||
▪difficulties associated with our third-party owned distribution facilities; | ||
▪natural disasters, extreme weather, public health issues, including pandemics, fire, and other events that cause business interruption; and | ||
▪our reliance on third parties to provide us with certain key services for our business. | ||
Strategic Risks | ||
▪our ability to identify and respond to new and changing fashion trends, customer preferences, and other related factors including selling through inventory at an appropriate price; | ||
▪fluctuations in our sales, results of operations, and cash levels on a seasonal basis and due to a variety of other factors, including our product offerings relative to customer demand, the mix of merchandise we sell, promotions, inventory levels, and sales mix between stores and eCommerce; | ||
▪our dependence on a strong brand image; | ||
▪our ability to adapt to changes in consumer behavior and develop and maintain a relevant and reliable omnichannel experience for our customers; | ||
▪our ability to realize the expected strategic and financial benefits of the Bonobos acquisition; | ||
▪our dependence upon key executive management; and | ||
▪our ability to execute our growth strategy, including but not limited to, achieving profitable growth in our core Express business, optimizing our omnichannel platform, accelerating our growth and profitability through the WHP strategic partnership and operating with financial discipline. | ||
Risks Related to Our Strategic Partnership with WHP | ||
▪our ability to realize success in our strategic partnership with WHP and the potential for the relationship with WHP to divert resources away from existing operations or expose us to liabilities; and | ||
▪our inability to realize the benefits and synergies of the strategic partnership or any transactions arranged as part of that partnership. | ||
EXPRESS, INC. | Q3 2023 Form 10-Q | 3
Information Technology Risks | ||
▪the failure or breach of information systems upon which we rely; | ||
▪the increase of our employees working remotely and use of technology for work functions; and | ||
▪our ability to protect our customer data from fraud and theft. | ||
Financial Risks | ||
▪our substantial lease obligations; | ||
▪the financial and other effects of our workforce reduction and other cost reduction actions, including our ability to realize the benefits from such actions within the anticipated timeframe; | ||
▪restrictions imposed on us under the terms of our current credit facilities, including asset based requirements related to inventory levels, ability to make additional borrowings, and restrictions on our ability to repurchase shares of our common stock; | ||
▪our inability to maintain compliance with covenants in our current credit facilities; and | ||
▪impairment charges on property and equipment and our right of use assets. | ||
Legal, Regulatory and Compliance Risks | ||
▪claims made against us resulting in litigation or changes in laws and regulations applicable to our business; | ||
▪our inability to protect our trademarks or other intellectual property rights that may preclude the use of our trademarks or other intellectual property around the world; | ||
▪changes in tax requirements, results of tax audits, and other factors including timing of tax refund receipts, that may cause fluctuations in our effective tax rate and operating results; and | ||
▪our failure to maintain adequate internal controls. | ||
Stock Ownership Risk Factors | ||
▪our inability to pay dividends and repurchase shares; | ||
▪our charter documents and applicable law may discourage or delay acquisition attempts; | ||
▪our failure to maintain compliance with the continued listing requirements of the New York Stock Exchange could result in the delisting of our common stock; | ||
▪our shares of common stock may experience extreme volatility and purchases of our common stock could incur substantial losses; | ||
▪our stock price may incur rapid and substantial increases or decreases that may not coincide in timing with the disclosure of news or developments affecting us; | ||
▪potential short squeezes related to our common stock have led to, and could again lead to, extreme price volatility in shares of our common stock; and | ||
▪information available in public media that is published by third parties, including blogs, articles, message boards and social and other media may include statements not attributable to us and may not be reliable or accurate. | ||
We derive many of our forward-looking statements from our operating budgets and forecasts, which are based upon many detailed assumptions. While we believe that our assumptions are reasonable, we caution that it is very difficult to predict the impact of known factors, and it is impossible for us to anticipate all factors that could affect our actual results. For a discussion of these risks and other risks and uncertainties that could cause actual results to differ materially from those contained in our forward-looking statements, please refer to “Item 1A. Risk Factors” included elsewhere in this Quarterly Report and in our Annual Report on Form 10-K for the year ended January 28, 2023 (“Annual Report”), filed with the Securities and Exchange Commission (“SEC”) on March 31, 2023. The forward-looking statements included in this Quarterly Report are made only as of the date hereof. We undertake no obligation to publicly update or revise any forward-looking statement as a result of new information, future events, or otherwise, except as required by law.
EXPRESS, INC. | Q3 2023 Form 10-Q | 4
PART I – FINANCIAL INFORMATION
ITEM 1.FINANCIAL STATEMENTS.
EXPRESS, INC.
CONSOLIDATED BALANCE SHEETS
(Amounts in Thousands, Except Per Share Amounts) (Unaudited)
| October 28, 2023 | January 28, 2023 | ||||||||||
| ASSETS | |||||||||||
| Current Assets: | |||||||||||
| Cash and cash equivalents | $ | $ | |||||||||
| Receivables, net | |||||||||||
| Income tax receivable | |||||||||||
| Inventories | |||||||||||
| Prepaid royalty | |||||||||||
| Prepaid rent | |||||||||||
| Other | |||||||||||
| Total current assets | |||||||||||
| Right of Use Asset, Net | |||||||||||
| Property and Equipment | |||||||||||
| Less: accumulated depreciation | ( | ( | |||||||||
| Property and equipment, net | |||||||||||
| Non-Current Income Tax Receivable | |||||||||||
| Equity Method Investment | |||||||||||
| Other Assets | |||||||||||
| TOTAL ASSETS | $ | $ | |||||||||
| LIABILITIES AND STOCKHOLDERS’ EQUITY | |||||||||||
| Current Liabilities: | |||||||||||
| Short-term lease liability | $ | $ | |||||||||
| Accounts payable | |||||||||||
| Deferred royalty income | |||||||||||
| Deferred revenue | |||||||||||
| Short-term debt | |||||||||||
| Accrued expenses | |||||||||||
| Total current liabilities | |||||||||||
| Long-Term Lease Liability | |||||||||||
| Long-Term Debt | |||||||||||
| Other Long-Term Liabilities | |||||||||||
| Total Liabilities | |||||||||||
| Stockholders’ Equity: | |||||||||||
Preferred stock – $ | |||||||||||
Common stock – $ | |||||||||||
| Additional paid-in capital | |||||||||||
| Retained earnings | |||||||||||
Treasury stock – at average cost; | ( | ( | |||||||||
| Total stockholders’ equity | |||||||||||
| TOTAL LIABILITIES AND STOCKHOLDERS' EQUITY | $ | $ | |||||||||
EXPRESS, INC. | Q3 2023 Form 10-Q | 5
EXPRESS, INC.
CONSOLIDATED STATEMENTS OF INCOME AND COMPREHENSIVE INCOME
(Amounts in Thousands, Except Per Share Amounts) (Unaudited)
| Thirteen Weeks Ended | Thirty-Nine Weeks Ended | |||||||||||||||||||||||||||||||
| October 28, 2023 | October 29, 2022 | October 28, 2023 | October 29, 2022 | |||||||||||||||||||||||||||||
| Net Sales | $ | $ | $ | $ | ||||||||||||||||||||||||||||
| Cost of Goods Sold, Buying and Occupancy Costs | ||||||||||||||||||||||||||||||||
| GROSS PROFIT | ||||||||||||||||||||||||||||||||
| Operating Expenses (Income): | ||||||||||||||||||||||||||||||||
| Selling, general, and administrative expenses | ||||||||||||||||||||||||||||||||
| Royalty income | ( | ( | ||||||||||||||||||||||||||||||
| Other operating expense (income), net | ( | ( | ||||||||||||||||||||||||||||||
| TOTAL OPERATING EXPENSES | ||||||||||||||||||||||||||||||||
| OPERATING LOSS | ( | ( | ( | ( | ||||||||||||||||||||||||||||
| Interest Expense, Net | ||||||||||||||||||||||||||||||||
| Other Income, Net | ( | ( | ||||||||||||||||||||||||||||||
| LOSS BEFORE INCOME TAXES | ( | ( | ( | ( | ||||||||||||||||||||||||||||
| Income Tax Expense | ||||||||||||||||||||||||||||||||
| NET LOSS | $ | ( | $ | ( | $ | ( | $ | ( | ||||||||||||||||||||||||
| COMPREHENSIVE LOSS | $ | ( | $ | ( | $ | ( | $ | ( | ||||||||||||||||||||||||
| EARNINGS PER SHARE: | ||||||||||||||||||||||||||||||||
| Basic | $ | ( | $ | ( | $ | ( | $ | ( | ||||||||||||||||||||||||
| Diluted | $ | ( | $ | ( | $ | ( | $ | ( | ||||||||||||||||||||||||
| WEIGHTED AVERAGE SHARES OUTSTANDING: | ||||||||||||||||||||||||||||||||
| Basic | ||||||||||||||||||||||||||||||||
| Diluted | ||||||||||||||||||||||||||||||||
EXPRESS, INC. | Q3 2023 Form 10-Q | 6
EXPRESS, INC.
CONSOLIDATED STATEMENTS OF CHANGES IN STOCKHOLDERS' EQUITY
(Amounts in Thousands) (Unaudited)
| Common Stock | Treasury Stock | |||||||||||||||||||||||||
| Shares Outstanding | Par Value | Additional Paid-in Capital | Retained Earnings | Accumulated Other Comprehensive Loss | Shares | At Average Cost | Total | |||||||||||||||||||
| BALANCE, January 28, 2023 | $ | $ | $ | $ | $ | ( | $ | |||||||||||||||||||
| Net loss | — | — | — | ( | — | — | — | ( | ||||||||||||||||||
| Exercise of stock options and vesting of restricted stock units | — | ( | ( | — | ( | |||||||||||||||||||||
| Share-based compensation | — | — | — | — | — | — | ||||||||||||||||||||
| Repurchase of common stock | ( | — | — | — | — | ( | ( | |||||||||||||||||||
| BALANCE, April 29, 2023 | $ | $ | $ | $ | $ | ( | $ | |||||||||||||||||||
| Net loss | — | — | — | ( | — | — | — | ( | ||||||||||||||||||
| Exercise of stock options and vesting of restricted stock units | — | ( | ( | — | ( | |||||||||||||||||||||
| Share-based compensation | — | — | ( | — | — | — | — | ( | ||||||||||||||||||
| Repurchase of common stock | — | — | — | — | — | — | ( | ( | ||||||||||||||||||
| BALANCE, July 29, 2023 | $ | $ | $ | $ | $ | ( | $ | |||||||||||||||||||
| Net loss | — | — | — | ( | — | — | — | ( | ||||||||||||||||||
| Exercise of stock options and vesting of restricted stock units | — | ( | ( | — | ( | |||||||||||||||||||||
| Share-based compensation | — | — | ( | — | — | — | — | ( | ||||||||||||||||||
| Repurchase of common stock | ( | — | — | — | — | ( | ( | |||||||||||||||||||
| BALANCE, October 28, 2023 | $ | $ | $ | $ | $ | ( | $ | |||||||||||||||||||
| Common Stock | Treasury Stock | |||||||||||||||||||||||||
| Shares Outstanding | Par Value | Additional Paid-in Capital | Retained Earnings | Accumulated Other Comprehensive Loss | Shares | At Average Cost | Total | |||||||||||||||||||
| BALANCE, January 29, 2022 | $ | $ | $ | $ | $ | ( | $ | |||||||||||||||||||
| Net loss | — | — | — | ( | — | — | — | ( | ||||||||||||||||||
| Exercise of stock options and vesting of restricted stock units | — | ( | ( | — | ( | |||||||||||||||||||||
| Share-based compensation | — | — | — | — | — | — | ||||||||||||||||||||
| Repurchase of common stock | ( | — | — | — | — | ( | ( | |||||||||||||||||||
| BALANCE, April 30, 2022 | $ | $ | $ | $ | $ | ( | $ | ( | ||||||||||||||||||
| Net income | — | — | — | — | — | — | ||||||||||||||||||||
| Exercise of stock options and vesting of restricted stock units | — | ( | ( | — | ( | |||||||||||||||||||||
| Share-based compensation | — | — | — | — | — | — | ||||||||||||||||||||
| Repurchase of common stock | ( | — | — | — | — | ( | ( | |||||||||||||||||||
| BALANCE, July 30, 2022 | $ | $ | $ | $ | $ | ( | $ | ( | ||||||||||||||||||
| Net loss | — | — | — | ( | — | — | — | ( | ||||||||||||||||||
| Exercise of stock options and vesting of restricted stock units | — | ( | ( | — | ( | |||||||||||||||||||||
| Share-based compensation | — | — | — | — | — | — | ||||||||||||||||||||
| Repurchase of common stock | ( | — | — | — | — | ( | ( | |||||||||||||||||||
| BALANCE, October 29, 2022 | $ | $ | $ | $ | $ | ( | $ | ( | ||||||||||||||||||
EXPRESS, INC. | Q3 2023 Form 10-Q | 7
EXPRESS, INC.
CONSOLIDATED STATEMENTS OF CASH FLOWS
(Amounts in Thousands) (Unaudited)
| Thirty-Nine Weeks Ended | |||||||||||
| October 28, 2023 | October 29, 2022 | ||||||||||
| CASH FLOWS FROM OPERATING ACTIVITIES: | |||||||||||
| Net loss | $ | ( | $ | ( | |||||||
Adjustments to reconcile net loss to net cash used in operating activities: | |||||||||||
| Depreciation and amortization | |||||||||||
| Loss on disposal of property and equipment | |||||||||||
| Impairment of property, equipment and lease assets | |||||||||||
| Share-based compensation | ( | ||||||||||
| Landlord allowance amortization | ( | ( | |||||||||
| Changes in operating assets and liabilities: | |||||||||||
| Receivables, net | ( | ( | |||||||||
| Income tax receivable | ( | ||||||||||
| Prepaid royalty | |||||||||||
| Inventories | ( | ( | |||||||||
| Deferred royalty income | ( | ||||||||||
| Accounts payable, deferred revenue, and accrued expenses | ( | ||||||||||
| Other assets and liabilities | ( | ( | |||||||||
NET CASH USED IN OPERATING ACTIVITIES | ( | ( | |||||||||
| CASH FLOWS FROM INVESTING ACTIVITIES: | |||||||||||
| Capital expenditures | ( | ( | |||||||||
| Acquisition, net of cash acquired | ( | ||||||||||
| Costs related to WHP transaction | ( | ||||||||||
NET CASH USED IN INVESTING ACTIVITIES | ( | ( | |||||||||
| CASH FLOWS FROM FINANCING ACTIVITIES: | |||||||||||
| Proceeds from borrowings under the revolving credit facility | |||||||||||
| Repayment of borrowings under the revolving credit facility | ( | ( | |||||||||
| Proceeds from term loan facility | |||||||||||
| Repayment of borrowings under prior term loan facility | ( | ||||||||||
| Costs incurred in connection with debt arrangements | ( | ||||||||||
| Repurchase of common stock for tax withholding obligations | ( | ( | |||||||||
NET CASH PROVIDED BY FINANCING ACTIVITIES | |||||||||||
NET DECREASE IN CASH AND CASH EQUIVALENTS | ( | ( | |||||||||
| CASH AND CASH EQUIVALENTS, BEGINNING OF PERIOD | |||||||||||
| CASH AND CASH EQUIVALENTS, END OF PERIOD | $ | $ | |||||||||
EXPRESS, INC. | Q3 2023 Form 10-Q | 8
| EXPRESS, INC. | ||||||||||||||
NOTES TO UNAUDITED CONSOLIDATED FINANCIAL STATEMENTS | ||||||||||||||
Page | |||||||||||
EXPRESS, INC. | Q3 2023 Form 10-Q | 9
NOTE 1 | DESCRIPTION OF BUSINESS AND BASIS OF PRESENTATION | ||||||||||||||
Business Description
Express, Inc., together with its subsidiaries (“Express” or the “Company”), is a multi-brand fashion retailer. The Company operates an omnichannel platform, including both physical and online stores. The Company’s two brand-based operating segments are Express, which includes UpWest, and Bonobos.
| Brand | Description | |||||||
| Express | Grounded in a belief that style, quality and value should all be found in one place, Express is a brand with a purpose - We Create Confidence. We Inspire Self-Expression. - powered by a styling community. | |||||||
| UpWest | UpWest is an apparel, accessories and home goods brand with a purpose to provide comfort for people and planet. | |||||||
| Bonobos | Bonobos is a menswear brand known for exceptional fit and an innovative retail model. | |||||||
As of October 28, 2023, the Company operated 600 stores in the United States and Puerto Rico, the express.com online store, the Express mobile app, the bonobos.com online store and the upwest.com online store. As of October 28, 2023, the composition of Express operated stores was as follows:
| Store Count | |||||
| Express | |||||
| Retail stores | |||||
| Outlet stores | |||||
| Edit stores | |||||
| Total retail and outlet stores | |||||
| UpWest | |||||
| Bonobos | |||||
| Total stores | |||||
Bonobos Acquisition
On May 23, 2023, the Company completed the acquisition of the operating assets of Bonobos, a menswear brand known for exceptional fit and an innovative retail model. The acquisition is intended to expand the Company's brand portfolio and leverage the Company's fully integrated omnichannel operating platform to drive financial efficiencies, operational synergies and additional economies of scale. Refer to Note 6 for further discussion regarding the acquisition.
WHP Strategic Partnership
In the fourth quarter of 2022, Express closed the strategic partnership transaction with WHP Global (“WHP”), a leading global brand management firm. The mutually transformative strategic partnership advances the Company's omnichannel platform, which is expected to drive accelerated, long-term growth through the acquisition and operation of a portfolio of brands. In connection with the closing of this transaction in January 2023, the Company and WHP also formed an intellectual property joint venture (the “Joint Venture”), intended to scale the Express brand through new domestic category licensing and international expansion opportunities. Refer to Note 5 for further discussion regarding the WHP strategic partnership.
Reverse Stock Split and Recasting of Per-Share Amounts
On August 14, 2023, the Company’s Board of Directors (the "Board") approved the implementation of a 1-for-20 reverse stock split of the Company’s common stock, par value $0.01 per share (“Common Stock”), and a corresponding proportional reduction in the number of authorized shares of Common Stock. The reverse stock split was effected after market close on August 30, 2023 (the “Effective Date”), and shares of Common Stock began trading on a split-adjusted basis as of market open on August 31, 2023.
EXPRESS, INC. | Q3 2023 Form 10-Q | 10
All shares of Common Stock, stock option awards and per share amounts contained in the unaudited Consolidated Financial Statements and Notes have been retroactively adjusted to reflect the 1-for-20 reverse stock split. Refer to Note 12 for further discussion regarding the reverse stock split.
Restructuring Costs
On July 14, 2023 and August 17, 2023, the company announced and implemented respective phases of a workforce reduction. During the thirty-nine weeks ended October 28, 2023, in connection with the restructuring of the Company’s work force, the Company recognized $4.7 million in restructuring and related reorganization charges with $2.7 million recorded in cost of goods sold, buying and occupancy costs and $2.0 million recorded in selling, general and administrative expense in the unaudited Consolidated Statements of Income and Comprehensive Income. The charges were primarily related to employee severance and benefit costs.
CEO Transition
The Board appointed Stewart Glendinning as President and Chief Executive Officer of the Company effective September 15, 2023, to succeed Timothy Baxter who resigned from the Company on September 6, 2023.
Fiscal Year
The Company's fiscal year ends on the Saturday closest to January 31. Fiscal years are designated in the unaudited Consolidated Financial Statements and Notes, as well as the remainder of this Quarterly Report, by the calendar year in which the fiscal year commences. All references herein to the Company's fiscal years are as follows:
| Fiscal Year | Year Ended | Number of Weeks | ||||||||||||
| 2023 | February 3, 2024 | 53 | ||||||||||||
| 2022 | January 28, 2023 | 52 | ||||||||||||
All references herein to “the third quarter of 2023” and “the third quarter of 2022” represent the thirteen weeks ended October 28, 2023 and October 29, 2022, respectively.
Basis of Presentation
The accompanying unaudited Consolidated Financial Statements have been prepared in accordance with generally accepted accounting principles in the United States of America (“GAAP”) for interim financial information and with the instructions to Form 10-Q and the U.S. Securities and Exchange Commission’s Article 10, Regulation S-X and therefore do not include all of the information or footnotes required for complete financial statements. In the opinion of management, the accompanying unaudited Consolidated Financial Statements reflect all adjustments (which are of a normal recurring nature) necessary to state fairly the financial position, results of operations, and cash flows for the interim periods, but are not necessarily indicative of the results of operations to be anticipated for the Company's future interim periods or 2023 fiscal year. Therefore, these statements should be read in conjunction with the Consolidated Financial Statements and Notes thereto for the year ended January 28, 2023, included in the Annual Report.
Express, Inc., through its indirect, wholly owned subsidiaries, including Express Fashion Operations, LLC, conducts the operations of the Company and Express Fashion Investments, LLC which owns a 40 % economic interest with significant influence in the Joint Venture.
Principles of Consolidation
EXPRESS, INC. | Q3 2023 Form 10-Q | 11
Segment Reporting
Use of Estimates in the Preparation of Financial Statements
The preparation of financial statements in conformity with GAAP requires management to make estimates and assumptions that affect the reported amounts of assets and liabilities at the date of the unaudited Consolidated Financial Statements and the reported amounts of revenue and expense during the reporting period, as well as the related disclosure of contingent assets and liabilities as of the date of the unaudited Consolidated Financial Statements. Actual results may differ from those estimates. The Company revises its estimates and assumptions as new information becomes available.
Accounting Pronouncements Not Yet Adopted
In November 2023, the Financial Accounting Standards Board issued Accounting Standards Update ("ASU") 2023-07, Segment Reporting (Topic 280): Improvements to Reportable Segment Disclosures. The ASU expands public entities’ segment disclosures by requiring disclosure of significant segment expenses that are regularly provided to the chief operating decision maker and included within each reported measure of segment profit or loss, an amount and description of its composition for other segment items, and interim disclosures of a reportable segment’s profit or loss and assets. All disclosure requirements under ASU 2023-07 are also required for public entities with a single reportable segment. The ASU is effective for the Company’s Annual Report on Form 10-K for the fiscal year ended February 1, 2025, and subsequent interim periods, with early adoption permitted. The Company is currently evaluating the impact of adopting this ASU on its consolidated financial statements and disclosures.
Going Concern Assessment and Management’s Plans
The Company’s revenues, results of operations and cash flows have been materially adversely impacted by negative macroeconomic factors beginning in the third and fourth quarters of 2022 and throughout 2023. The persistently challenging macroeconomic and retail apparel environments, including reduced consumer spending and increased price sensitivity in discretionary categories, have significantly impacted the Company's performance. Net sales during the thirty-nine weeks ended October 28, 2023 decreased approximately $77.2 million compared to the thirty-nine weeks ended October 29, 2022, despite the addition of $93.0 million of Bonobos net sales. This decline, coupled with aggressive promotional activity, drove gross margin and operating loss below the Company's expectations. For the thirty-nine weeks ended October 28, 2023, the Company reported a net operating loss of $138.4 million and negative operating cash flows of $131.4 million.
As of October 28, 2023, the Company was in compliance with the financial covenants under the agreements governing its indebtedness, however, due to ongoing negative macroeconomic factors and their uncertain impacts on the Company’s business, results of operations and cash flows, the Company could experience further material decreases to net sales and operating cash flows and materially higher operating losses and may experience difficulty remaining in compliance with such covenants. Refer to Note 9 for further details regarding the terms of the ABL Credit Agreement (as defined therein), the Revolving Credit Facility provided to the Company thereunder and the FILO Term Loan.
Under GAAP, management is required to perform an initial assessment of an entity’s ability to continue as a going concern. When conditions and events, in the aggregate, raise substantial doubt about an entity's ability to continue as a going concern, management considers the mitigating effect of its plans to the extent it is probable that the plans will be effectively implemented within the assessment period and, when implemented, it is probable the plans will mitigate the relevant conditions or events and alleviate substantial doubt.
Management's plans are focused on improving its results of operations, operating cash flows and liquidity through expense reduction initiatives and improved sales trends during the balance of fiscal year 2023 and fiscal year 2024. Additionally, the Company has hired a new Chief Executive Officer and is continuing to conduct a comprehensive review of its business model to identify actions that are expected to further meaningfully reduce pre-tax costs and
EXPRESS, INC. | Q3 2023 Form 10-Q | 12
enable a more efficient and effective organization and has engaged external advisors to assist in this effort. Additionally, the Company has contingency plans which would further reduce or defer additional expenses and cash outlays should its results of operations weaken beyond management’s current forecasts. On September 5, 2023, the Company entered into a definitive loan agreement for a $65.0 million first-in-last-out asset-based term loan in further support of expanding liquidity access. Based on expense saving initiatives already identified and implemented for fiscal year 2023 and fiscal year 2024, including expense savings realized to date, together with the proceeds from the new FILO Term Loan (refer to Note 9 for further details regarding the terms of the FILO Term Loan), management believes these plans are being effectively implemented and, when implemented, that it is probable they will mitigate the negative impacts of the current ongoing negative macroeconomic conditions on the Company’s business.
Consequently, management believes that cash flows from operations, together with borrowing capacity under the Revolving Credit Facility, will provide adequate cash flows to support the Company’s ongoing operations and to meet its obligations as they become due under the agreements governing its indebtedness for at least one year following the date these interim financial statements are issued.
The accompanying unaudited Consolidated Financial Statements are prepared in accordance with generally accepted accounting principles applicable to a going concern, which contemplates the realization of assets and the satisfaction of liabilities in the normal course of business.
NOTE 2 | REVENUE RECOGNITION | ||||||||||||||
All revenues are recognized in net sales in the unaudited Consolidated Statements of Income and Comprehensive Income.
The following is information regarding the Company’s major product categories and sales channels:
| Thirteen Weeks Ended | Thirty-Nine Weeks Ended | |||||||||||||||||||||||||||||||
| October 28, 2023 | October 29, 2022 | October 28, 2023 | October 29, 2022 | |||||||||||||||||||||||||||||
| (in thousands) | ||||||||||||||||||||||||||||||||
| Apparel | $ | $ | $ | $ | ||||||||||||||||||||||||||||
| Accessories and other | ||||||||||||||||||||||||||||||||
| Other revenue | ||||||||||||||||||||||||||||||||
| Total net sales | $ | $ | $ | $ | ||||||||||||||||||||||||||||
| Thirteen Weeks Ended | Thirty-Nine Weeks Ended | |||||||||||||||||||||||||||||||
| October 28, 2023 | October 29, 2022 | October 28, 2023 | October 29, 2022 | |||||||||||||||||||||||||||||
| (in thousands) | ||||||||||||||||||||||||||||||||
| Retail | $ | $ | $ | $ | ||||||||||||||||||||||||||||
| Outlet | ||||||||||||||||||||||||||||||||
| Other revenue | ||||||||||||||||||||||||||||||||
| Total net sales | $ | $ | $ | $ | ||||||||||||||||||||||||||||
Other revenue consists primarily of revenue earned from our private label credit card agreement, shipping and handling revenue related to eCommerce activity, sell-off revenue related to marked-out-of-stock inventory sales to third parties and revenue from gift card breakage.
Merchandise Sales
The Company recognizes sales for in-store purchases at the point-of-sale. Revenue related to eCommerce transactions is recognized upon shipment based on the fact that control transfers to the customer at that time. The Company has made a policy election to treat shipping and handling as costs to fulfill the contract, and as a result, any amounts received from customers are included in the transaction price allocated to the performance obligation of providing goods with a corresponding amount accrued within cost of goods sold, buying and occupancy costs in the unaudited Consolidated Statements of Income and Comprehensive Income for amounts paid to applicable
EXPRESS, INC. | Q3 2023 Form 10-Q | 13
carriers. Associate discounts on merchandise purchases are classified as a reduction of net sales. Net sales excludes sales tax collected from customers and remitted to governmental authorities.
Loyalty Program
The Company maintains a customer loyalty program in which customers earn points toward rewards for qualifying purchases and other marketing activities. Upon reaching specified point values, customers are issued a reward, which they may redeem on merchandise purchases at the Company’s stores or on its website. Generally, rewards earned must be redeemed within 60 days from the date of issuance. The Company defers a portion of merchandise sales based on the estimated standalone selling price of the points earned. This deferred revenue is recognized as certificates are redeemed or expire. To calculate this deferral, the Company makes assumptions related to loyalty point and certificate redemption rates based on historical experience. The loyalty liability is included in deferred revenue on the unaudited Consolidated Balance Sheets.
| Thirteen Weeks Ended | Thirty-Nine Weeks Ended | |||||||||||||||||||||||||
| October 28, 2023 | October 29, 2022 | October 28, 2023 | October 29, 2022 | |||||||||||||||||||||||
| (in thousands) | ||||||||||||||||||||||||||
| Beginning balance loyalty deferred revenue | $ | $ | $ | $ | ||||||||||||||||||||||
| Reduction in revenue/(revenue recognized) | ( | ( | ||||||||||||||||||||||||
| Ending balance loyalty deferred revenue | $ | $ | $ | $ | ||||||||||||||||||||||
Sales Returns Reserve
The Company reduces net sales and provides a reserve for projected merchandise returns based on prior experience. Merchandise returns are often resalable merchandise and are refunded by issuing the same payment tender as the original purchase. The sales returns reserve was $14.4 million and $9.0 million as of October 28, 2023 and January 28, 2023, respectively, and is included in accrued expenses on the unaudited Consolidated Balance Sheets. The asset related to projected returned merchandise is included in other assets on the unaudited Consolidated Balance Sheets.
Gift Cards
The Company sells gift cards in its stores, on its eCommerce website, and through third parties. These gift cards do not expire or lose value over periods of inactivity. The Company accounts for gift cards by recognizing a liability at the time a gift card is sold. The gift card liability balance was $29.4 million and $25.6 million, as of October 28, 2023 and January 28, 2023, respectively, and is included in deferred revenue on the unaudited Consolidated Balance Sheets. As part of the acquisition of Bonobos, the Company acquired $7.5 million in gift card liability. Refer to Note 6 for further discussion regarding the acquisition. During the thirteen weeks ended October 28, 2023 and October 29, 2022, the Company recognized approximately $2.4 million and $2.9 million of revenue, respectively, that was previously included in the beginning gift card contract liability. During the thirty-nine weeks ended October 28, 2023 and October 29, 2022, the Company recognized approximately $11.3 million and $10.4 million of revenue, respectively, that was previously included in the beginning gift card contract liability. The Company recognizes revenue from gift cards when they are redeemed by the customer. The Company also recognizes income on unredeemed gift cards, referred to as “gift card breakage.” Gift card breakage is recognized proportionately using a time-based attribution method from issuance of the gift card to the time when it can be determined that the likelihood of the gift card being redeemed is remote and that there is no legal obligation to remit unredeemed gift cards to relevant jurisdictions. The gift card breakage rate is based on historical redemption patterns. Gift card breakage is included within the other revenue component of net sales in the unaudited Consolidated Statements of Income and Comprehensive Income.
EXPRESS, INC. | Q3 2023 Form 10-Q | 14
| Thirteen Weeks Ended | Thirty-Nine Weeks Ended | |||||||||||||||||||||||||||||||
| October 28, 2023 | October 29, 2022 | October 28, 2023 | October 29, 2022 | |||||||||||||||||||||||||||||
| (in thousands) | ||||||||||||||||||||||||||||||||
| Beginning gift card liability | $ | $ | $ | $ | ||||||||||||||||||||||||||||
| Issuances and acquired | ||||||||||||||||||||||||||||||||
| Redemptions | ( | ( | ( | ( | ||||||||||||||||||||||||||||
| Gift card breakage | ( | ( | ( | ( | ||||||||||||||||||||||||||||
| Ending gift card liability | $ | $ | $ | $ | ||||||||||||||||||||||||||||
Private Label Credit Card
The Company has an agreement with Comenity Bank (the “Bank”) to provide customers with private label credit cards (as amended, the “Card Agreement”). The term of the Card Agreement expires on December 31, 2024. Each private label credit card bears the logo of the Express brand and can only be used at the Company’s store locations and eCommerce channel. The Bank is the sole owner of the accounts issued under the private label credit card program and absorbs the losses associated with non-payment by the private label card holders and a portion of any fraudulent usage of the accounts.
Pursuant to the Card Agreement, the Company receives amounts from the Bank during the term based on a percentage of private label credit card sales and is also eligible to receive incentive payments for the achievement of certain performance targets. These funds are recorded within the other revenue component of net sales in the unaudited Consolidated Statements of Income and Comprehensive Income. The Company also receives reimbursement funds from the Bank for certain expenses the Company incurs. These reimbursement funds are used by the Company to fund marketing and other programs associated with the private label credit card. The reimbursement funds received related to private label credit cards are recorded within the other revenue component of net sales in the Consolidated Statements of Income and Comprehensive Income.
In connection with the Card Agreement, the Bank paid the Company a $20.0 million refundable payment which the Company recognized upon receipt as deferred revenue within other long-term liabilities in the Consolidated Balance Sheets and began to recognize into income on a straight-line basis commencing January of 2018. As of October 28, 2023, the deferred revenue balance of $3.4 million will be recognized over the remaining term of the Card Agreement within the other revenue component of net sales.
| Thirteen Weeks Ended | Thirty-Nine Weeks Ended | |||||||||||||||||||||||||||||||
| October 28, 2023 | October 29, 2022 | October 28, 2023 | October 29, 2022 | |||||||||||||||||||||||||||||
| (in thousands) | ||||||||||||||||||||||||||||||||
| Beginning balance refundable payment liability | $ | $ | $ | $ | ||||||||||||||||||||||||||||
| Recognized in revenue | ( | ( | ( | ( | ||||||||||||||||||||||||||||
| Ending balance refundable payment liability | $ | $ | $ | $ | ||||||||||||||||||||||||||||
EXPRESS, INC. | Q3 2023 Form 10-Q | 15
NOTE 3 | EARNINGS PER SHARE | ||||||||||||||
The following table provides a reconciliation between basic and diluted weighted-average shares used to calculate basic and diluted earnings per share. All shares of Common Stock in the table below have been retrospectively restated to reflect the effect of the reverse stock split:
| Thirteen Weeks Ended | Thirty-Nine Weeks Ended | |||||||||||||||||||||||||||||||
| October 28, 2023 | October 29, 2022 | October 28, 2023 | October 29, 2022 | |||||||||||||||||||||||||||||
| (in thousands) | ||||||||||||||||||||||||||||||||
| Weighted-average shares - basic | ||||||||||||||||||||||||||||||||
| Dilutive effect of stock options and restricted stock units | ||||||||||||||||||||||||||||||||
| Weighted-average shares - diluted | ||||||||||||||||||||||||||||||||
Equity awards representing 0.2 0.2 million and 0.3 million shares of Common Stock were excluded from the computation of diluted earnings per share for the thirteen and thirty-nine weeks ended October 29, 2022, respectively, as the inclusion of these awards would have been anti-dilutive.
Additionally, for the thirteen weeks ended October 28, 2023, equity awards representing 0.2 million shares of Common Stock were excluded from the computation of diluted weighted average shares because the number of shares of Common Stock that will ultimately be issued is contingent on the Company’s performance compared to pre-established performance goals which had not been achieved as of October 28, 2023.
NOTE 4 | FAIR VALUE MEASUREMENTS | ||||||||||||||
Fair value is defined as the price that would be received to sell an asset or paid to transfer a liability in an orderly transaction between market participants at the measurement date. Assets and liabilities measured at fair value are classified using the following hierarchy, which is based upon the transparency of inputs to the valuation as of the measurement date.
■Level 1 - Valuation is based upon quoted prices (unadjusted) for identical assets or liabilities in active markets.
■Level 2 - Valuation is based upon quoted prices for similar assets and liabilities in active markets or other inputs that are observable for the asset or liability, either directly or indirectly, for substantially the full term of the financial instrument.
■Level 3 - Valuation is based upon other unobservable inputs that are significant to the fair value measurement.
Financial Assets
The following table presents the Company's financial assets, recorded in cash and cash equivalents on the unaudited Consolidated Balance Sheets, measured at fair value on a recurring basis as of October 28, 2023 and January 28, 2023, aggregated by the level in the fair value hierarchy.
EXPRESS, INC. | Q3 2023 Form 10-Q | 16
| October 28, 2023 | |||||||||||||||||
| Level 1 | Level 2 | Level 3 | |||||||||||||||
| (in thousands) | |||||||||||||||||
| Money market funds | $ | $ | $ | ||||||||||||||
| January 28, 2023 | |||||||||||||||||
| Level 1 | Level 2 | Level 3 | |||||||||||||||
| (in thousands) | |||||||||||||||||
| Money market funds | $ | $ | $ | ||||||||||||||
The money market funds are valued using quoted market prices in active markets.
Non-Financial Assets
The Company's non-financial assets, which include fixtures, equipment, improvements, right of use assets, and an equity method investment, are not required to be measured at fair value on a recurring basis. However, if certain triggering events occur indicating the carrying value of these assets may not be recoverable, or annually in the case of indefinite-lived intangibles, an impairment test is required to be performed by the Company.
The carrying amounts reflected on the unaudited Consolidated Balance Sheets for the remaining cash, cash equivalents, receivables, prepaid expenses, and payables as of October 28, 2023 and January 28, 2023 approximated their fair values. The equity method investment is reflected at cost and is the result of a market participant transaction with WHP whereby the Company received proceeds of $260.0 million and a 40 % ownership interest in the Joint Venture in exchange for contributing certain intellectual property to the Joint Venture.
The Company reviews its equity method investment by comparing its fair value to its carrying value. If the carrying value of the investment exceeds its fair value and the loss in value is other than temporary, the investment is considered impaired and reduced to fair value, and the impairment is recognized in the period identified. Factors providing evidence of such a loss include changes in the investee's operations or financial condition, significant continuing losses, significant negative economic conditions or a significant decrease in the market value. Impairment charges are recorded in other expense (income), net in the unaudited Consolidated Statements of Income and Comprehensive Income. During the thirteen and thirty-nine weeks ended October 28, 2023, there were no
Store Asset Impairment
Property and equipment, including the right of use assets, are not required to be measured at fair value on a recurring basis. However, if certain triggering events occur indicating the carrying value of these assets may not be recoverable, an impairment test is required. These events include, but are not limited to, material adverse changes in projected revenues, present cash flow losses combined with a history of cash flow losses and a forecast that demonstrates significant continuing losses, significant negative economic conditions, a significant decrease in the market value of an asset and store closure or relocation decisions. The reviews are conducted at the store level, the lowest identifiable level of cash flow.
Stores that display an indicator of impairment are subjected to an impairment assessment. Such stores are tested for recoverability by comparing the sum of the estimated future undiscounted cash flows to the carrying amount of the asset. This recoverability test requires management to make assumptions and judgments related, but not limited, to management’s expectations for future cash flows from operating the store.
▪The key assumption used in the undiscounted future store cash flow models is the sales growth rate.
An impairment loss may be recognized when these undiscounted future cash flows are less than the carrying amount of the asset group. In the circumstance of impairment, any loss would be measured as the excess of the carrying amount of the asset group over its fair value. Fair value of the store-related assets is determined at the individual store level based on the highest and best use of the asset group.
▪The key assumptions used in the fair value analysis may include discounted estimates of future store cash flows from operating the store and/or comparable market rents.
EXPRESS, INC. | Q3 2023 Form 10-Q | 17
Impairment charges are recorded in cost of goods sold, buying and occupancy costs in the unaudited Consolidated Statements of Income and Comprehensive Income.
During the thirteen and thirty-nine weeks ended October 28, 2023 and October 29, 2022, the Company recognized impairment charges as follows:
| Thirteen Weeks Ended | Thirty-Nine Weeks Ended | |||||||||||||||||||||||||||||||
| October 28, 2023 | October 29, 2022 | October 28, 2023 | October 29, 2022 | |||||||||||||||||||||||||||||
| (in thousands) | ||||||||||||||||||||||||||||||||
| Right of use asset impairment | $ | $ | $ | $ | ||||||||||||||||||||||||||||
| Property and equipment asset impairment | ||||||||||||||||||||||||||||||||
| Total asset impairment | $ | $ | $ | $ | ||||||||||||||||||||||||||||
NOTE 5 | EQUITY METHOD INVESTMENT | ||||||||||||||
The following table is a summary of the Company’s equity method investment with WHP:
| % of Ownership | Balance Sheet Location | October 28, 2023 | |||||||||
| (in thousands) | |||||||||||
| EXP Topco, LLC | Equity Method Investment | $ | |||||||||
The Company accounts for its 40 % economic interest in the Joint Venture, through which it exercises significant influence but does not have control over the investee, under the equity method. Under the equity method, the Company records its investment in the investee on the balance sheet initially at cost, and subsequently adjusts the carrying amount based on its share of the investee's net income or loss. Royalty distributions received from the investee are recognized as a reduction of the carrying amount of the investment. The Company's share of equity (income) losses and other adjustments associated with this equity method investment is included in royalty income in the unaudited Consolidated Statements of Income and Comprehensive Income. The carrying value for the Company's equity investment is reported in Equity Method Investment on the unaudited Consolidated Balance Sheets. The Company reports its share of earnings using a one-month lag because results are not available in time for it to record them in the concurrent period. This convention has not historically materially impacted the Company's results.
Equity Method Investment with WHP
On January 25, 2023, the Company closed the strategic partnership transaction with WHP. In connection with the closing of this transaction, the Company and WHP formed the Joint Venture. The Company contributed certain intellectual property of the Company in exchange for 40 % ownership of the Joint Venture and $235.0 million. WHP paid the $235.0 million for a 60 % ownership of the Joint Venture, implying a fair value of the Company’s 40 % interest in the Joint Venture of approximately $156.7 million.
During the fourth quarter of 2022, under the derecognition guidance from Accounting Standards Codification ("ASC") Topic 810, Consolidation, the Company derecognized the intellectual property assets at their carrying amount upon their contribution to the Joint Venture. Because the carrying amount of the contributed intellectual property assets was zero , a $391.7 million gain was recognized at the time of contribution, of which $156.7 million was related to the Company’s 40 % interest in the Joint Venture. The gain was recorded in gain on transaction with WHP on the Consolidated Statements of Income and Comprehensive Income. Transaction costs capitalized in the cost of the equity method investment totaled $9.4 million.
Separately, on December 8, 2022, the Company and WH Borrower, LLC, an affiliate of WHP ("WH Borrower) entered into an investment agreement (the “Investment Agreement”) pursuant to which the Company issued and sold 5.4 million newly issued shares of Common Stock to WH Borrower in private placement for a purchase price of $4.60 per share, or an aggregate purchase price of approximately $25.0 million, representing an approximate pro forma ownership of 7.4 % of the outstanding shares of Common Stock. The difference between the purchase price paid and the trading price of the Common Stock on the day of the completion of the transaction resulted in a gain of
EXPRESS, INC. | Q3 2023 Form 10-Q | 18
$17.8 million and was recorded in gain on transaction with WHP on the Consolidated Statements of Income and Comprehensive Income.
In connection with the strategic partnership with WHP, on January 25, 2023, the Company and the Joint Venture entered into an Intellectual Property License Agreement (the “License Agreement”). The License Agreement provides the Company with an exclusive license in the United States to the intellectual property contributed in connection with the membership interest purchase agreement and certain other intellectual property. The initial term of the License Agreement is 10 years, and the License Agreement automatically renews for successive renewal terms of 10 years (unless the Company provides notice of non-renewal at least 24 months prior to the end of the initial or applicable renewal term). Except for the Company’s right not to renew the License Agreement, the License Agreement is not terminable by either party. The Company will pay the Joint Venture a royalty on net sales of certain licensed goods and will commit to an annual guaranteed minimum annual royalty during the term of the License Agreement (i.e., $60.0 million in the first contract year, increasing by $1.0 million per year for the next contract years, and remaining at $65.0 million following the sixth contract year). The Company will pay the Joint Venture royalties at a rate of (i) 3.25 % of net sales arising from retail sales of certain licensed goods in the first through fifth contract years (and 3.5 % thereafter), and (ii) 8 % of net sales arising from wholesale sales of such goods. The Company prepaid the Joint Venture’s first contract year guaranteed minimum royalty of $60.0 million with a portion of the transaction proceeds, which was recorded as a prepaid royalty on the Consolidated Balance Sheets.
Pursuant to the agreement governing the operations of the Joint Venture (the “Operating Agreement”), cash earnings of the Joint Venture will be distributed quarterly to the Company and WH Borrower on a pro rata basis based on their respective equity ownership interests.
As the Chairman and Chief Executive Officer of WHP was appointed to the Company’s board of directors upon the closing of the Investment Agreement discussed above, the agreements entered into in connection with the WHP strategic partnership transaction, including the Operating Agreement, the Investment Agreement and the License Agreement (including related royalty payments) are considered related party transactions.
During the thirteen and thirty-nine weeks ended October 28, 2023, the Company recognized $5.4 million and $16.0 million of royalty income, respectively, from the Joint Venture, which is recorded in royalty income in the unaudited Consolidated Statements of Income and Comprehensive Income.
Summary Financial Information for Equity Method Investment
Summarized financial information related to the Company's equity method investment on a one-month lag is reflected below:
Thirteen Weeks Ended October 28, 20231 | Thirty-Nine Weeks Ended October 28, 20231 | ||||||||||
| (in thousands) | |||||||||||
| Revenue | $ | $ | |||||||||
| Gross profit | |||||||||||
| Operating expenses | |||||||||||
| Interest income | ( | ( | |||||||||
| Income before taxes | |||||||||||
| Net income | $ | $ | |||||||||
| Income attributable to the equity method investment | $ | $ | |||||||||
1.Reflects a one-month
EXPRESS, INC. | Q3 2023 Form 10-Q | 19
October 28, 20231 | |||||
| (in thousands) | |||||
| Current assets | $ | ||||
| Non-current assets | |||||
| Total assets | $ | ||||
| Current liabilities | |||||
| Non-current liabilities | |||||
| Total liabilities | $ | ||||
| Equity method investment | $ | ||||
1.Reflects a one-month lag
NOTE 6 | ACQUISITIONS | ||||||||||||||
The Company accounts for business combinations in accordance with ASC Topic 805, Business Combinations. Consistent with ASC Topic 805, the Company accounts for each business combination by applying the acquisition method. Under the acquisition method, the Company records the identifiable assets acquired and liabilities assumed at their respective fair values on the acquisition date. There are various estimates and judgments related to the valuation of identifiable assets acquired and liabilities assumed. These estimates and judgments have the potential to materially impact the Company’s unaudited Consolidated Financial Statements.
The acquisition method permits the Company a period of time after the acquisition date during which the Company may adjust the provisional amounts recognized in a business combination. This period of time is referred to as the “measurement period”. The measurement period provides an acquirer with a reasonable time, generally not to exceed one year, to obtain the information necessary to identify and measure the assets acquired and liabilities assumed. If the initial accounting for a business combination is incomplete by the end of the reporting period in which the combination occurs, the Company reports in its consolidated financial statements provisional amounts for the items for which the accounting is incomplete. Accordingly, the Company is required to recognize adjustments to the provisional amounts in the reporting period in which the adjustments to the provisional amounts are determined. Thus, the Company would adjust its consolidated financial statements as needed as a result of the change to the provisional amounts calculated as if the accounting had been completed at the acquisition date.
Acquisition-related costs are costs the Company incurs to affect a business combination. Those costs may include such items as finder’s fees, advisory, legal, accounting, valuation, and other professional or consulting fees, and general administrative costs. The Company accounts for such acquisition-related costs as expenses in the period in which the costs are incurred and the services are received.
Bonobos Asset Acquisition
On May 23, 2023, the Company completed the acquisition of the operating assets and liabilities of Bonobos, a menswear brand known for exceptional fit and an innovative retail model, for total cash consideration of approximately $28.3 million, which represents (i) the $25.0 million purchase price, plus (ii) $2.0 million of certain customary adjustments related to net working capital and $1.3 million of prepaid rent expense. The acquisition was funded with borrowings under the Revolving Credit Facility described in Note 9. The acquisition is intended to provide the following strategic and financial benefits:
•The Company plans to unlock additional growth for the Bonobos brand by leveraging its strength in men’s to address underpenetrated categories, and its strength in marketing to drive greater awareness and customer acquisition
•Bonobos expands the Company's brand portfolio, accelerating the Company’s sales growth and profitability
•The Company expects to leverage its fully integrated omnichannel operating platform to drive financial efficiencies, operational synergies and additional economies of scale across Production & Sourcing, Logistics, Real Estate, Technology, and other areas of its existing and new businesses
EXPRESS, INC. | Q3 2023 Form 10-Q | 20
Bonobos License Agreement
On May 23, 2023, the Company and WHP entered into a license agreement that provides the Company with an exclusive license in the United States to intellectual property related to the Bonobos brand, including intellectual property rights for the Bonobos brand that was separately acquired by WHP (the “Bonobos License Agreement”). The Bonobos License Agreement has an initial term of 10 years from its effective date, and automatically renews for successive renewal terms of 10 years unless (i) the Company provides notice of non-renewal at least 24 months prior to the end of the initial or applicable renewal term, or (ii) WHP exercises its right to not renew in the event of certain failures by the Company to pay the annual guaranteed minimum royalty. Except for such non-renewal rights, the Bonobos License Agreement is not terminable by either party. The Company will pay WHP a royalty on net sales of certain licensed goods and is committed to pay an annual guaranteed minimum royalty during the term of the Bonobos License Agreement (ranging from $6.5 million in the first contract year to $11.5 million in the tenth contract year and each contract year thereafter). The Company will pay royalties at a rate of (i) 3.25 % of net sales arising from retail sales of certain licensed goods in the first through the fifth contract years (and 3.5 % thereafter), and (ii) 8 % of net sales arising from wholesale sales of such goods. Refer to Note 5 for further details regarding the Company’s equity method investment with WHP.
Purchase Price Allocation
The Bonobos acquisition was accounted for as a business combination in accordance with ASC Topic 805. Consistent with ASC Topic 805, Bonobos was consolidated into the Company's unaudited Consolidated Financial Statements starting on the closing date of the acquisition. The purchase price allocation as of the closing date of the acquisition was based on a preliminary valuation and is subject to change as more detailed analyses are completed and additional information about the fair value of assets acquired and liabilities assumed becomes available. The purchase price consideration was allocated to assets acquired and liabilities assumed based on their respective fair values as follows:
| Bonobos | |||||
| (in thousands) | |||||
| Purchase Price | |||||
| Cash paid | $ | ||||
| Allocation | |||||
| Receivables, net | $ | ||||
| Inventory | |||||
| Right of use asset, net | |||||
| Property and equipment, net | |||||
| Other assets acquired | |||||
| Assets acquired | $ | ||||
| Short-term lease liability | ( | ||||
| Accounts payable | ( | ||||
| Deferred revenue | ( | ||||
| Long-term lease liability | ( | ||||
| Accrued expenses and other liabilities assumed | ( | ||||
| Liabilities assumed | $ | ( | |||
| Net cash paid | $ | ||||
The Company recorded an allocation of the purchase price to the tangible assets acquired and liabilities assumed based on their fair value at the acquisition date. The fair value of inventories, which is made up of finished goods, was determined based on market assumptions for realizing a reasonable profit after selling costs. Goodwill is determined as the excess of the purchase price over the fair value of the net assets acquired. The Company recognized an immaterial amount of goodwill recognized related to the acquisition.
During the thirty-nine weeks ended October 28, 2023, the Company incurred $5.0 million of acquisition-related and integration costs in connection with the acquisition of Bonobos, which was included in selling, general and
EXPRESS, INC. | Q3 2023 Form 10-Q | 21
administrative expenses in the unaudited Consolidated Statements of Income and Comprehensive Income and are included in pro forma earnings.
Pro Forma Financial Information (unaudited)
The aggregate net sales and net income of Bonobos was $52.1 million and $2.1 million for the thirteen weeks ended October 28, 2023, respectively. The aggregate net sales and net income of Bonobos was $93.0 million and $4.4 million for the thirty-nine weeks ended October 28, 2023, respectively. The following financial information presents the Company's consolidated results as if the acquisition had occurred on January 30, 2022:
| Thirteen Weeks Ended | Thirty-Nine Weeks Ended | |||||||||||||||||||||||||||||||
| October 28, 2023 | October 29, 2022 | October 28, 2023 | October 29, 2022 | |||||||||||||||||||||||||||||
| (in thousands) | ||||||||||||||||||||||||||||||||
| Net sales | $ | $ | $ | $ | ||||||||||||||||||||||||||||
| Net loss | $ | ( | $ | ( | $ | ( | $ | ( | ||||||||||||||||||||||||
The Company did not have any nonrecurring pro forma adjustments directly attributable to the Bonobos acquisition included in the reported pro forma earnings and revenue.
These pro forma results have been calculated after applying the Company's accounting policies. These pro forma results were based on estimates and assumptions, which the Company believes are reasonable. They are not the results that would have been realized had the acquisition actually occurred on January 30, 2022 and are not necessarily indicative of the Company's consolidated results of operations in future periods. The pro forma results include adjustments related to purchase accounting.
NOTE 7 | INCOME TAXES | ||||||||||||||
The provision for income taxes is based on a current estimate of the annual effective tax rate, adjusted to reflect the effect of discrete items. The Company’s effective income tax rate may fluctuate from quarter to quarter as a result of a variety of factors, including the estimate of annual pre-tax income, the related changes in the estimate, and the effect of discrete items. The impact of these items on the effective tax rate will be greater at lower pre-tax levels.
The Company evaluates whether deferred tax assets are realizable on a quarterly basis. The Company considers all available positive and negative evidence, including past operating results and expectations of future operating income. Accordingly, the Company maintains a valuation allowance against the amount of deferred tax assets not expected to be realized as of October 28, 2023.
The Company’s effective tax rate was (5.4 )% and (2.3 )% for the thirteen weeks ended October 28, 2023 and October 29, 2022, respectively. The effective tax rate for the thirteen weeks ended October 28, 2023 reflects the impact of the Company's 2022 tax return filing, the corresponding effects to a refund claim made under the Coronavirus Aid, Relief, and Economic Security Act ("CARES Act"), and the recording of an additional valuation allowance against the Company's current year losses. The effective tax rate for the thirteen weeks ended October 29, 2022 reflects the impact of non-deductible executive compensation and the recording of an additional valuation allowance against the Company's deferred tax assets.
The Company’s effective tax rate was (1.9 )% and (1.4 )% for the thirty-nine weeks ended October 28, 2023 and October 29, 2022, respectively. The effective tax rate for the thirty-nine weeks ended October 28, 2023 reflects the impact of the Company's 2022 tax return filing, the corresponding effects to a refund claim made under the CARES Act, and the recording of an additional valuation allowance against the Company's current year losses. The effective tax rate for the thirty-nine weeks ended October 29, 2022 reflects the impact of non-deductible executive compensation and the recording of an additional valuation allowance against the Company's current year losses.
The Company's unaudited Consolidated Balance Sheets as of October 28, 2023 and January 28, 2023 reflect $45.1 million and $52.3 million of income tax receivable related to a refund claim made under the CARES Act, respectively.
EXPRESS, INC. | Q3 2023 Form 10-Q | 22
NOTE 8 | LEASES | ||||||||||||||
The Company leases all of its store locations and its corporate headquarters, which also includes its distribution center, under operating leases. The store leases typically have initial terms of 5 to 10 years; however, most of the leases that are coming to the end of their lease lives are being renegotiated with shorter terms. The current lease term for the corporate headquarters expires in 2026, with one optional five-year extension period. The Company also leases certain equipment and other assets under operating leases, typically with initial terms of 3 to 5 years. The lease term includes the initial contractual term as well as any options to extend the lease when it is reasonably certain that the Company will exercise that option. Leases with an initial term of 12 months or less (short-term leases) are not recorded on the balance sheet. The Company does not currently have any material short-term leases. The Company is generally obligated for the cost of property taxes, insurance and other landlord costs, including common area maintenance charges, relating to its leases. If these charges are fixed, they are combined with lease payments in determining the lease liability; however, if such charges are not fixed, they are considered variable lease costs and are expensed as incurred. The variable payments are not included in the measurement of the lease liability or asset. The Company’s finance leases are immaterial.
Certain lease agreements include rental payments based on a percentage of retail sales over contractual levels and others include rental payments adjusted periodically for inflation. The Company’s lease agreements do not contain any material residual value guarantees or material restrictive covenants.
The Company’s lease agreements do not provide an implicit rate, so the Company uses an estimated incremental borrowing rate, which is derived from third-party information available at the lease commencement date, in determining the present value of lease payments. The rate used is for a secured borrowing of a similar term as the lease.
Supplemental cash flow information related to leases is as follows:
| Thirty-Nine Weeks Ended | ||||||||
| October 28, 2023 | October 29, 2022 | |||||||
| (in thousands) | ||||||||
| Cash paid for amounts included in the measurement of lease liabilities: | ||||||||
Operating cash flows for operating leases | $ | $ | ||||||
| Right of use assets obtained in exchange for operating lease liabilities | $ | $ | ||||||
NOTE 9 | DEBT | ||||||||||||||
The following table summarizes the Company's outstanding debt as of the dates indicated:
| October 28, 2023 | January 28, 2023 | ||||||||||||||||
| (in thousands) | |||||||||||||||||
| Revolving Credit Facility | $ | $ | |||||||||||||||
| FILO Term Loan | |||||||||||||||||
| Total outstanding borrowings | |||||||||||||||||
| Less: unamortized debt issuance costs | ( | ||||||||||||||||
| Total debt, net | |||||||||||||||||
| Less: current portion of long-term debt | |||||||||||||||||
| Total long-term debt, net | $ | $ | |||||||||||||||
| Outstanding letters of credit | $ | $ | |||||||||||||||
EXPRESS, INC. | Q3 2023 Form 10-Q | 23
Revolving Credit Facility
Express, LLC (the "Borrower") and its subsidiaries are party to an Asset-Based Loan Credit Agreement (the "ABL Credit Agreement") entered into with the lenders party thereto, Wells Fargo Bank, National Association, as administrative agent and collateral agent ("Wells Fargo"), and Bank of America, N.A., as documentation agent (“Bank of America”) pursuant to which revolving loans, up to a maximum borrowing amount of $290.0 million (the “Revolving Credit Facility”), may be borrowed, repaid and reborrowed until the maturity date of November 26, 2027, at which time all amounts borrowed must be repaid. Amounts borrowed under the Revolving Credit Facility bear interest at a variable rate indexed to SOFR (as defined in the ABL Credit Agreement) plus a pricing margin ranging from 1.75 % to 2.25 % per annum, as determined in accordance with the provisions of the ABL Credit Agreement based on average daily excess availability, as of any date of determination, for the most recently ended fiscal quarter, commencing April 30, 2023.
On September 5, 2023, the Loan Parties entered into a Fifth Amendment to the ABL Credit Agreement, which, among other things, permitted the entry by the Loan Parties into the Term Loan Agreement (defined below) on a second-priority basis to the Revolving Credit Facility.
Amounts borrowed under the Revolving Credit Facility are subject to a borrowing base which is calculated based on specified percentages of eligible inventory, credit card receivables and cash, less certain reserves. Commitment reductions and termination of the Revolving Credit Facility prior to the maturity date is permitted, subject in certain instances to a prepayment fee. As of October 28, 2023, the interest rate on the approximately $212.7 million in outstanding borrowings under the Revolving Credit Facility was approximately 8.0 %.
The unused line fee payable under the Revolving Credit Facility is 0.25 % per annum regardless of the average daily excess availability, payable in arrears monthly on the first day of each calendar month. The Borrower is also obligated to pay other customary closing fees, arrangement fees, administration fees and letter of credit fees for a credit facility of this size and type.
The ABL Credit Agreement requires the Borrower to maintain minimum excess availability of at least the greater of (i) $25.0 million or (ii) 10 % of the sum of the Revolving Credit Facility loan cap. From and after the date on which EBITDA (as defined in the ABL Credit Agreement) has exceeded $50.0 million for two consecutive fiscal quarters (each of which consecutive fiscal quarters shall have commenced after November 2, 2024), at any time the excess availability is less than the greater of (i) $25.0 million or (ii) 10 % of the Revolving Credit Facility loan cap, and until the excess availability exceeds such amount for consecutive days, the Borrower is required to maintain a fixed charge coverage ratio (as further described in the ABL Credit Agreement) of at least 1.00 :1.00, calculated as of the last day of each fiscal quarter (as further described in the ABL Credit Agreement).
The ABL Credit Agreement includes customary events of default that, include among other things, non-payment defaults, inaccuracy of representations and warranties, covenant defaults, cross-default to material indebtedness, bankruptcy and insolvency defaults, material judgment defaults, ERISA defaults, structural defaults under the loan documents and a change of control default. The occurrence of an event of default could result in the acceleration of the Borrower’s obligations under the Revolving Credit Facility. Under certain circumstances, a default interest rate will apply on any amounts payable under the Revolving Credit Facility during the existence of an event of default at a per annum rate equal to 2.00 % above the applicable interest rate for any principal and 2.00 % above the rate applicable for base rate loans for any other interest.
All obligations under the Revolving Credit Facility are guaranteed by the loan parties (other than the Borrower) and secured by a first priority lien on substantially all of the Loan Parties’ assets, subject to certain permitted liens.
As of October 28, 2023, the Company had approximately $212.7 million in borrowings outstanding under the Revolving Credit Facility and approximately $21.7 million remained available for borrowing under the Revolving Credit Facility as of such date after giving effect to outstanding letters of credit in the amount of $20.1 million and subject to certain borrowing base limitations as further discussed above. The fair value of the outstanding borrowings under the Revolving Credit Facility is estimated using Level 2 inputs and at October 28, 2023 and January 28, 2023 was $201.5 million and $115.0 million, respectively.
FILO Term Loan
On September 5, 2023, the Company, the Borrower and certain other direct or indirect, wholly-owned subsidiaries of the Company (collectively, the “Loan Parties”) entered into an asset-based term loan agreement (the “Term Loan
EXPRESS, INC. | Q3 2023 Form 10-Q | 24
Agreement”) with ReStore Capital LLC, as administrative agent, collateral agent and lender, and the other lenders from time to time party thereto. The Term Loan Agreement provides the Borrower with a $65.0 million “first-in, last-out” term loan (the “FILO Term Loan”). The Borrower received $32.5 million in gross proceeds upon entering into the Term Loan Agreement, with the remaining $32.5 million principal amount from the FILO Term Loan received on September 13, 2023. The net proceeds of the FILO Term Loan were used to pay down outstanding borrowings under the ABL Credit Agreement without corresponding commitment reductions.
The FILO Term Loan will mature on the earlier of (a) November 26, 2027 and (b) the date of termination of the commitments under the ABL Credit Agreement. The FILO Term Loan will bear interest at a variable rate based on the Secured Overnight Financing Rate (“SOFR”) plus an applicable margin of 10.00 %.
The FILO Term Loan Agreement requires the Borrower to maintain certain financial covenants and also contains customary affirmative and negative covenants and events of default. Obligations under the Term Loan Agreement are guaranteed by the Loan Parties (other than the Borrower) and secured by a second priority lien on substantially all personal property of the Loan Parties, including cash, accounts receivable, and inventory, and share the same collateral as the Revolving Credit Facility.
As of October 28, 2023, the aggregate outstanding principal amount of the FILO Term Loan was $65.0 million. The fair value of the $65.0 million aggregate outstanding principal amount of the FILO Term Loan at October 28, 2023 was $40.2 million.
Amounts borrowed under the FILO Term Loan will be repaid in quarterly installments, commencing with the first day of the fiscal quarter beginning on October 29, 2023, in the principal amount of $0.7 million, and thereafter, on the first day of each fiscal quarter in the principal amount of $1.2 million. All remaining principal amount of the FILO Term Loan, together with all accrued and unpaid interest, is due on the Maturity Date. Voluntary prepayment of the FILO Term Loan is permitted at any time upon proper notice, subject to a prepayment fee prior to the third anniversary of the closing date. Principal amounts repaid or prepaid under the FILO Term Loan may not be reborrowed.
Amounts borrowed under the FILO Term Loan bear interest at a variable rate indexed to the SOFR plus a pricing margin of 10.0 % per annum. Interest is payable monthly in arrears and due on the first day of each calendar month. As of October 28, 2023, the interest rate on the outstanding principal balance of the FILO Term Loan was 15.4 %.
The Term Loan Agreement requires the Borrower to maintain minimum excess availability of at least the greater of (i) $25.0 million or (ii) 10.0 % of the sum of (x) the Revolving Credit Facility loan cap (calculated without giving effect to the pushdown reserve under the Term Loan Agreement) plus (y) the lesser of (A) the outstanding principal balance of the FILO Term Loan and (B) a term loan borrowing base based on specified percentages of eligible inventory and credit card receivables. In addition, the Term Loan Agreement contains customary affirmative and negative covenants, including those which (subject to certain exceptions and dollar thresholds) limit the Loan Parties’ ability to incur additional indebtedness or liens; issue negative pledges or guarantees; make investments or loans; engage in asset sales, mergers, acquisitions; prepay other debt; make distributions, pay dividends or repurchase capital stock; engage in transactions with affiliates; and engage in any line of business not related to their current line of business.
The Term Loan Agreement also includes customary events of default that include, among other things, non-payment defaults, inaccuracy of representations and warranties, covenant defaults, cross-default to material indebtedness, bankruptcy and insolvency defaults, material judgment defaults, ERISA defaults, structural defaults under the loan documents and a change of control default. The occurrence of an event of default could result in the acceleration of the obligations under the Term Loan Agreement. Under certain circumstances, a default interest rate will apply on any amount payable under the Term Loan Agreement during the existence of an event of default at a per annum rate equal to 3.0 % above the otherwise then applicable interest rate.
All obligations under the Term Loan Agreement are guaranteed by the Loan Parties (other than the Borrower) and secured by a second priority lien on substantially all personal property of the Loan Parties, including cash, accounts receivable, and inventory, and share the same collateral as the Revolving Credit Facility.
The Company recorded deferred financing costs associated with the issuance of the FILO Term Loan. The unamortized balance of such deferred costs was $3.1 million as of October 28, 2023. These costs will be amortized over the respective contractual terms of the Term Loan Agreement or written off ratably as the outstanding principal
EXPRESS, INC. | Q3 2023 Form 10-Q | 25
balance under the FILO Term Loan is extinguished. The aggregate outstanding principal amount of the FILO Term Loan is presented on the Consolidated Balance Sheets, net of the unamortized fees.
Letters of Credit
From time to time, the Company may enter into various trade letters of credit ("trade LCs") in favor of certain vendors to secure merchandise. These trade LCs are issued for a defined period of time, for specific shipments, and generally expire three weeks after the merchandise shipment date. As of October 28, 2023 and January 28, 2023, there were no 20.1 million and $19.6 million, respectively.
NOTE 10 | LONG-TERM INCENTIVE COMPENSATION | ||||||||||||||
The Company records the fair value of share-based payments to employees in the unaudited Consolidated Statements of Income and Comprehensive Income as compensation expense, net of forfeitures, over the requisite service period. The Company issues shares of Common Stock from treasury, at average cost, upon exercise of stock options and vesting of restricted stock units, including those with performance conditions.
Long-Term Incentive Compensation
The following summarizes long-term incentive compensation expense:
| Thirteen Weeks Ended | Thirty-Nine Weeks Ended | |||||||||||||||||||||||||||||||
| October 28, 2023 | October 29, 2022 | October 28, 2023 | October 29, 2022 | |||||||||||||||||||||||||||||
| (in thousands) | ||||||||||||||||||||||||||||||||
| Restricted stock units | $ | $ | $ | $ | ||||||||||||||||||||||||||||
| Stock options | ||||||||||||||||||||||||||||||||
| Performance-based restricted stock units | ( | ( | ||||||||||||||||||||||||||||||
| Total share-based compensation | $ | ( | $ | $ | ( | $ | ||||||||||||||||||||||||||
| Cash-settled awards | ||||||||||||||||||||||||||||||||
| Total long-term incentive compensation | $ | ( | $ | $ | $ | |||||||||||||||||||||||||||
The stock compensation related income tax benefit, excluding consideration of valuation allowances, recognized by the Company during the thirteen weeks ended October 28, 2023 was $0.1 million. The stock compensation related income tax benefit, excluding consideration of valuation allowances, recognized by the Company during the thirty-nine weeks ended October 28, 2023 was $4.2 million. The stock compensation related income tax benefit, excluding consideration of valuation allowances, recognized by the Company during the thirteen and thirty-nine weeks ended October 29, 2022 was $0.1 million and $3.0 million, respectively.
The valuation allowance associated with the tax benefit for the thirteen weeks ended October 28, 2023 was $0.1 million. The valuation allowance associated with the tax benefit for the thirty-nine weeks ended October 28, 2023 was $4.2 million. The valuation allowances associated with these tax benefits were $0.1 million and $3.0 million for the thirteen and thirty-nine weeks ended October 29, 2022, respectively.
Equity Awards
Restricted Stock Units
During the thirty-nine weeks ended October 28, 2023, the Company granted restricted stock units (“RSUs”) under the Second Amended and Restated Express, Inc. 2018 Incentive Compensation Plan (the "Plan"). The fair value of RSUs is generally determined based on the Company’s closing stock price on the day prior to the grant date in accordance with the Plan. The RSUs granted generally vest ratably over to three years and the expense related to these RSUs is recognized using the straight-line attribution method over this vesting period.
EXPRESS, INC. | Q3 2023 Form 10-Q | 26
The Company’s activity with respect to RSUs for the thirty-nine weeks ended October 28, 2023 was as follows:
Number of Shares | Grant Date Weighted Average Fair Value Per Share | |||||||
| (in thousands, except per share amounts) | ||||||||
Unvested - January 28, 2023 | $ | |||||||
| Granted | $ | |||||||
| Vested | ( | $ | ||||||
| Forfeited | ( | $ | ||||||
Unvested - October 28, 2023 | $ | |||||||
The total fair value of RSUs that vested during the thirty-nine weeks ended October 28, 2023 and October 29, 2022 was $3.5 million and $5.2 million, respectively. As of October 28, 2023, there was approximately $0.1 million of total unrecognized compensation expense related to unvested RSUs, which is expected to be recognized over a remaining weighted-average period of approximately 1.1 years.
Stock Options
The Company’s activity with respect to stock options during the thirty-nine weeks ended October 28, 2023 was as follows:
Number of Shares | Grant Date Weighted Average Exercise Price Per Share | Weighted-Average Remaining Contractual Life (in years) | Aggregate Intrinsic Value | ||||||||||||||||||||
| (in thousands, except per share amounts and years) | |||||||||||||||||||||||
Outstanding - January 28, 2023 | $ | ||||||||||||||||||||||
| Granted | $ | ||||||||||||||||||||||
| Exercised | $ | ||||||||||||||||||||||
| Forfeited or expired | ( | $ | |||||||||||||||||||||
Outstanding - October 28, 2023 | $ | $ | |||||||||||||||||||||
Expected to vest at October 28, 2023 | $ | $ | |||||||||||||||||||||
Exercisable at October 28, 2023 | $ | $ | |||||||||||||||||||||
As of October 28, 2023, there was no unrecognized compensation expense related to stock options.
Performance-Based Restricted Stock Units
During 2022, the Company granted performance-based RSUs to a limited number of senior executive-level employees, which entitle these employees to receive a specified number of shares of the Common Stock upon vesting based upon the achievement of certain performance conditions. The number of shares of Common Stock earned could range between 0 % and 200 % of the target amount of shares underlying the award depending upon performance achieved over a three-year performance period. The performance conditions of the awards include adjusted earnings before interest, taxes, depreciation, and amortization ("Adjusted EBITDA") targets and the Company's total shareholder return ("TSR") relative to a select group of peer companies. A Monte Carlo valuation model was used to determine the fair value of the awards. The TSR performance condition is a market condition. Therefore, the fair value of the portion of the awards which vest based on the TSR performance condition is fixed at the measurement date and is not revised based on actual performance during the three-year vesting period. The number of shares of Common Stock underlying the portion of the awards which vest based on the Company’s Adjusted EBITDA performance in relation to the pre-established targets will change during the three-year vesting period based on estimates.
During the thirteen weeks ended October 28, 2023, as a material inducement to accept employment with the Company, the Company granted its new Chief Executive Officer an award consisting of 0.15 million performance-based RSUs. The RSUs will become eligible to vest (with a maximum payout of 200 % of target) on the last day of fiscal year 2026 based on the Company’s average stock price performance, relative to a pre-determined goal,
EXPRESS, INC. | Q3 2023 Form 10-Q | 27
during the period between the grant date and the last day of fiscal year 2026. A Monte Carlo valuation model was used to determine the fair value of the inducement award. Because the stock price performance condition is a market condition, the fair value the award is measured and fixed at the grant date and is not revised based on actual performance during the performance period.
As of October 28, 2023, $0.3 million of total unrecognized compensation cost is expected to be recognized on outstanding performance-based RSUs over a remaining weighted-average period of 3.3 years.
Cash-Settled Awards
Time-Based Cash-Settled Awards
During the thirty-nine weeks ended October 28, 2023, the Company granted time-based cash-settled awards to employees that vest ratably over three years . These awards are classified as liabilities and do not vary based on changes in the Company's stock price or financial performance. The expense related to these awards will be accrued using a straight-line method over this vesting period. As of October 28, 2023, $9.8 million of total unrecognized compensation cost is expected to be recognized on outstanding cash-settled awards over a remaining weighted-average period of 1.4 years.
Performance-Based Cash-Settled Awards
During the thirty-nine weeks ended October 28, 2023, the Company granted performance-based cash-settled awards to a limited number of senior executive-level employees. These awards are classified as liabilities, are valued based on the fair value of the award at the grant date and are remeasured at each reporting date until settlement with compensation expense being recognized in proportion to the completed requisite service period up until date of settlement. The amount of cash earned ranges between 0 % and 200 % of the target amount depending upon performance achieved over a three-year performance period commencing on the first day of the Company’s 2023 fiscal year and ending on the last day of the Company’s 2025 fiscal year. The performance conditions of the award include Adjusted EBITDA targets and the Company's TSR relative to a select group of peer companies. The fair value of the awards will change based on estimates of the Company’s Adjusted EBITDA performance in relation to the pre-established targets. A Monte Carlo valuation model was used to determine the fair value of the awards. As of October 28, 2023, $1.3 million of total unrecognized compensation cost is expected to be recognized on outstanding performance-based cash-settled awards over a remaining weighted-average period of 2.5 years.
NOTE 11 | COMMITMENTS AND CONTINGENCIES | ||||||||||||||
The Company is presently, and from time to time, subject to various claims and contingencies arising in the normal course of its business. The Company currently believes that the ultimate liability arising from such claims and contingencies, if any, is not likely to have a material adverse effect on the Company’s results of operations, financial condition or cash flows.
In a complaint filed in January 2017 by Mr. Jorge Chacon in the Superior Court for the State of California for the County of Orange, certain subsidiaries of the Company were named as defendants in a representative action alleging violations of California state wage and hour statutes and other labor standards. The lawsuit sought unspecified monetary damages and attorneys’ fees.
In July 2018, former associate Ms. Christie Carr filed suit in Alameda County Superior Court for the State of California naming certain subsidiaries of the Company as defendants in a representative action alleging violations of California State wage and hour statutes and other labor standard violations. The lawsuit sought unspecified monetary damages and attorneys’ fees.
On January 29, 2019, Mr. Jorge Chacon filed a second representative action in the Superior Court for the State of California for the County of Orange alleging violations of California state wage and hour statutes and other labor standard violations, which was removed to federal court by the Company. The lawsuit sought unspecified monetary damages and attorneys' fees. In June 2021, a portion of Mr. Chacon’s claims in this action were certified as a class action. The plaintiff and the Company both filed Motions for Summary Judgment on February 28, 2022.
EXPRESS, INC. | Q3 2023 Form 10-Q | 28
In June 2022, as a result of a mediation process overseen by an independent mediator, the parties agreed, subject to approval by the District Court, to settle these matters for an amount not material to the Company. The proposed settlement will resolve the Chacon and Carr matters in their entirety and also provide for a broad release of claims asserted therein on behalf of the Company’s current and former employees in California for wage and hour violations. On August 18, 2023, the Court granted preliminary approval of the settlement. A final approval hearing is scheduled in January 2024.
Any legal proceedings are subject to inherent uncertainties, and the Company’s view of these matters and their potential effects may change in the future. In accordance with applicable accounting standards, the Company establishes an accrued liability for loss contingencies related to legal proceedings when the loss is both probable and reasonably estimable. As of October 28, 2023, the Company's unaudited Consolidated Balance Sheet includes an estimated liability based on its best estimate of the outcome of the unresolved matters.
NOTE 12 | STOCKHOLDERS' EQUITY | ||||||||||||||
Share Repurchase Program
On November 28, 2017, the Company's Board of Directors ("Board") approved a share repurchase program that authorizes the Company to repurchase up to $150.0 million of Common Stock using available cash (the "Repurchase Program"). The Company may repurchase shares on the open market, including through Rule 10b5-1 plans, in privately negotiated transactions, through block purchases, or otherwise in compliance with applicable laws, including Rule 10b-18 of the Exchange Act of 1934, as amended (the "Exchange Act"). The timing and amount of stock repurchases will depend on a variety of factors, including business and market conditions as well as corporate and regulatory considerations. The Repurchase Program may be suspended, modified, or discontinued at any time and the Company has no obligation to repurchase any amount of Common Stock under the program. During the thirteen and thirty-nine weeks ended October 28, 2023 and October 29, 2022, the Company did no 34.2 million remaining under this Board authorization.
Reverse Stock Split
On August 30, 2023, the Company filed a Certificate of Amendment to the Company’s Certificate of Incorporation, as amended, with the Secretary of State of the State of Delaware to effect a 1-for-20 reverse stock split of the Common Stock. Pursuant to the Certificate of Amendment, effective as of 5:00 p.m., Eastern Time, on August 30, 2023, (i) every 20 shares of Common Stock issued and outstanding, including shares of Common Stock held by the Company as treasury shares, were automatically combined into one share of Common Stock, and (ii) the number of authorized shares of Common Stock was reduced from 500.0 million authorized shares to 25.0 million authorized shares of Common Stock. The Company’s stockholders of record will receive a cash payment (without interest) in lieu of any fractional shares they would have otherwise been entitled to receive in the reverse stock split.
Shares of the Common Stock began trading on a split-adjusted basis at market open on August 31, 2023. Shares of the Common Stock continue to trade on New York Stock Exchange ("NYSE") under the symbol “EXPR” with the CUSIP number, 30219E 202. Based on the resulting increase in the per share trading price of the Common Stock following the implementation of the reverse stock split, on September 11, 2023, the Company was notified that it had regained compliance with the minimum price criteria set forth in the continued listing standards of the NYSE. The $0.01 par value per share of Common Stock and any other rights associated the Common Stock were not affected by the reverse stock split.
All shares of Common Stock, stock option awards and per share amounts in the accompanying unaudited Consolidated Financial Statements and related Notes have been retrospectively restated to reflect the effect of the reverse stock split.
Preferred shares outstanding were not affected by the reverse stock split and as such, those shares have not been adjusted.
EXPRESS, INC. | Q3 2023 Form 10-Q | 29
ITEM 2. MANAGEMENT’S DISCUSSION AND ANALYSIS OF FINANCIAL CONDITION AND RESULTS OF OPERATIONS.
The following discussion summarizes the significant factors affecting the consolidated operating results, financial condition, liquidity, and cash flows of the Company as of the dates and for the periods presented below. The following discussion and analysis should be read in conjunction with our Annual Report and our unaudited Consolidated Financial Statements and the related Notes included in Item 1 of this Quarterly Report. This discussion contains forward-looking statements that are based on the beliefs of our management, as well as assumptions made by, and information currently available to, our management. Actual results could differ materially from those discussed in or implied by forward-looking statements as a result of various factors. See “Forward-Looking Statements.”
All references herein to “the third quarter of 2023” and “the third quarter of 2022” represent the thirteen weeks ended October 28, 2023 and October 29, 2022, respectively.
Our management's discussion and analysis of financial condition and results of operations is presented in the following sections:
Page | |||||
\
OVERVIEW | ||||||||||||||
Express is a multi-brand fashion retailer. We operate an omnichannel platform, including both physical and online stores. Our two brand-based operating segments are Express, which includes UpWest, and Bonobos. We operate 600 stores in the United States and Puerto Rico, the express.com online store, the Express mobile app, the bonobos.com online store and the upwest.com online store.
| Brand | Description | |||||||
| Express | Grounded in a belief that style, quality and value should all be found in one place, Express is a brand with a purpose - We Create Confidence. We Inspire Self-Expression. - powered by a styling community. | |||||||
| UpWest | UpWest is an apparel, accessories and home goods brand with a purpose to provide comfort for people and planet. | |||||||
| Bonobos | Bonobos is a menswear brand known for exceptional fit and an innovative retail model. | |||||||
Acquisition
On May 23, 2023, we completed the acquisition of the operating assets of Bonobos. The acquisition is intended to provide the following strategic and financial benefits:
•We plan to unlock additional growth for the Bonobos brand by leveraging its strength in men’s to address underpenetrated categories, and its strength in marketing to drive greater awareness and customer acquisition
•Bonobos expands our brand portfolio, accelerating our sales growth and profitability
•We expect to leverage our fully integrated omnichannel operating platform to drive financial efficiencies, operational synergies and additional economies of scale across Production & Sourcing, Logistics, Real Estate, Technology, and other areas of its existing and new businesses
EXPRESS, INC. | Q3 2023 Form 10-Q | 30
Refer to Note 6 included elsewhere in this Quarterly Report for further discussion regarding the acquisition.
WHP Strategic Partnership
On January 25, 2023, we closed the strategic partnership transaction with WHP Global ("WHP"), a leading global brand management firm. Pursuant to the transaction, WHP acquired 5.4 million newly issued shares of our common stock at a purchase price of $4.60 per share, or $25.0 million in the aggregate, representing approximately 7.4% of our outstanding shares of Common Stock, on a pro forma basis, as of the closing of the transaction. The mutually transformative strategic partnership advances our omnichannel platform, which is expected to drive accelerated, long-term growth through the acquisition and operation of a portfolio of brands. The Company and WHP also formed a Joint Venture valued at approximately $400.0 million, with WHP committing $235.0 million to the Joint Venture for 60% ownership of the Joint Venture and the Company contributing certain intellectual property in exchange for 40% ownership of the Joint Venture. The Joint Venture is intended to scale the Express brand through new domestic category licensing and international expansion opportunities. Refer to Note 5 included elsewhere in this Quarterly Report for further discussion regarding the WHP strategic partnership.
1-for-20 Reverse Stock Split
On August 14, 2023, our Board of Directors (the "Board") approved the implementation of a 1-for-20 reverse stock split of our common stock, par value $0.01 per share (“Common Stock”), and a corresponding proportional reduction in the number of authorized shares of Common Stock. The reverse stock split was effected after market close on August 30, 2023 (the “Effective Date”), and shares of Common Stock began trading on a split-adjusted basis as of market open on August 31, 2023.
All shares of Common Stock, stock option awards and per share amounts contained in the unaudited Consolidated Financial Statements have been retroactively adjusted to reflect the 1-for-20 reverse stock split. Refer to Note 12 included elsewhere in this Quarterly Report for further discussion regarding the reverse stock split.
CEO Transition
Our Board appointed Stewart Glendinning as President and Chief Executive Officer of the Company effective September 15, 2023, to succeed Timothy Baxter who resigned from the Company on September 6, 2023.
\
BUSINESS TRENDS | ||||||||||||||
Macroeconomic Outlook
The macroeconomic environment in which we operate remains uncertain as a result of numerous factors, including inflationary pressures, higher interest rates, declines in consumer spending behavior and aggressive promotional activity. Given uncertainty related to the impact of ongoing negative macroeconomic factors and their impact on our business, results of operations and cash flows, we are implementing plans to mitigate these adverse conditions, including actions to reduce expenses and improve the operating efficiency of our business, including identifying and implementing significant additional expense savings.
We have hired a new Chief Executive Officer and are continuing to conduct a comprehensive review of our business model to identify actions that are expected to further meaningfully reduce pre-tax costs and enable a more efficient and effective organization and have engaged external advisors to assist in this effort. We are reiterating our stated goal to deliver over $200 million in annualized savings by 2025 versus 2022.
We are reiterating that we will realize $80 million of cost reductions for fiscal year 2023 versus fiscal year 2022. In the third quarter of 2023, we delivered $30 million of expense savings from reductions in our marketing and store labor costs, as well as a reduction in force in our corporate office that was implemented in August.
In addition, we are reiterating $120 million in annualized expense reductions for fiscal year 2024 versus fiscal year 2022 have been identified and implemented, which are inclusive of the savings effectuated for fiscal year 2023. We are also aggressively pursuing at least $50 million in gross margin expansion opportunities by leveraging efficiencies in sourcing, production and the supply chain.
EXPRESS, INC. | Q3 2023 Form 10-Q | 31
The continued effect of these macroeconomic conditions may impact mid-term and longer-term consumer discretionary spending behavior and the promotional landscape in which we operate. We believe that these macroeconomic and other factors have contributed to the slowdown in demand that we have experienced in our business over the last several fiscal quarters and could result in further material decreases to net sales and operating cash flows and materially higher operating losses.
For additional information regarding risks related to these related operational and industry risks, see “Item 1A. Risk Factors: Operational and Industry Risk Factors” in our Annual Report.
FINANCIAL DETAILS FOR THE THIRD QUARTER OF 2023 | ||||||||||||||
•Consolidated net sales increased 5% to $454.1 million, including $52.1 million of Bonobos net sales, from $434.1 million in the third quarter of 2022 | ||
•Consolidated comparable sales decreased 6% compared to the third quarter of 2022 | ||
•Comparable retail sales (includes both retail stores and eCommerce sales) decreased 4% compared to the third quarter of 2022 | ||
•Comparable outlet sales decreased 13% compared to the third quarter of 2022 | ||
•Consolidated gross margin was 24.1% of net sales compared to 27.8% of net sales in last year's third quarter, a decrease of approximately 370 basis points | ||
•Consolidated operating loss was $28.7 million compared to operating loss of $29.5 million in the third quarter of 2022 | ||
•Consolidated net loss was $36.8 million, or a loss of $9.83 per diluted share, compared to net loss of $34.4 million, or $10.09 per diluted share, in the third quarter of 2022 | ||
Key Performance Metrics
The following charts show key performance metrics for the third quarter of 2023 compared to the third quarter of 2022.
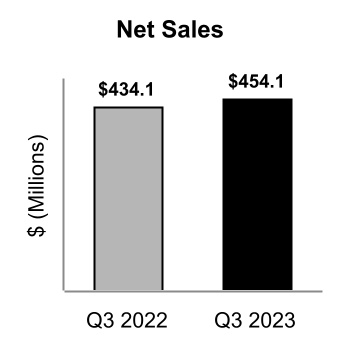
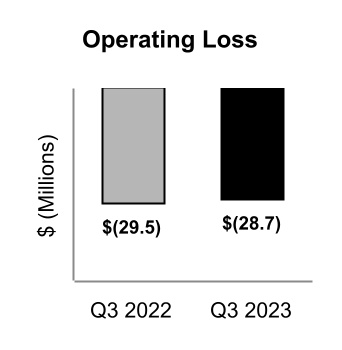
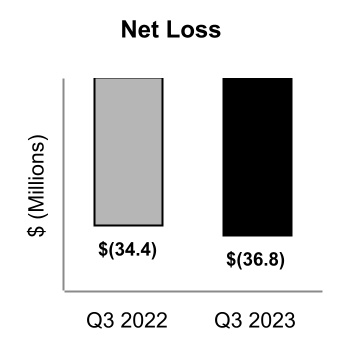
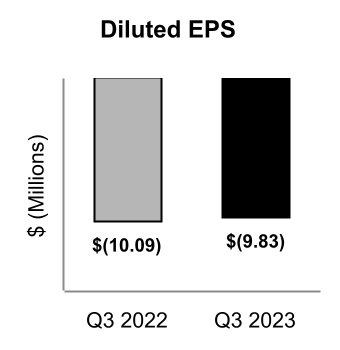
THIRD QUARTER UPDATE & OUTLOOK | ||||||||||||||
We are focused on transforming Express to return to profitability and create long-term shareholder value guided by a refined corporate strategy, inclusive of the following four key areas:
•Achieving profitable growth and delivering positive free cash flow in our core Express business
•Leveraging our omnichannel platform
•Accelerating our growth and profitability through the WHP strategic partnership
•Operating with financial discipline
Achieve Profitable Growth and Delivering Positive Free Cash Flow in Our Core Express Business
The first component of our new corporate strategy is achieving profitable growth and delivering positive free cash flow in our core Express business. We expect to achieve profitable growth in our core Express business through our EXPRESSway Forward strategy which has four foundational pillars:
EXPRESS, INC. | Q3 2023 Form 10-Q | 32
| PRODUCT | BRAND | CUSTOMER | EXECUTION | ||||||||||||||
Product
We are committed to being a product-first organization and our design and merchandising approach is to edit the best of now for real-life versatility. The best of now speaks to our history as a trend-right brand, and versatility is about covering the full spectrum of a customer's wearing occasions and wardrobe requirements. Express customers expect newness, versatility, quality, and value and providing these qualities drives our decisions around product.
During the third quarter of 2023, we continued to take corrective actions designed to address the three most significant challenges we have faced. First, poor results in our women’s business due to imbalances across the assortment. Second, challenging comparable sales in our men’s business and outlet stores as we lap record top-and bottom-line performances in 2022 as well as traffic softness in both retail and outlet stores. And third, the ongoing consumer environment for the Express brand remaining highly competitive.
Brand
We are transforming Express from being known as a store in the mall to a brand with a purpose, powered by a styling community. We have created a compelling brand purpose: We Create Confidence. We Inspire Self-Expression. We believe we can accomplish this by editing the best of now for real life versatility.
The Express styling community is an authentic way to bring our brand purpose to life. Members of the Express styling community - customers, associates, Style Editors, content creators, influencers and brand partners - interact with each other in the physical and digital worlds. Building, activating and amplifying this styling community is one of our key priorities in 2023.
Customer
We continually aim to successfully engage existing customers and acquire new ones. Loyalty program members are our best customers, making over two more visits and spending over twice as much per year as non-loyalty customers.
Execution
We have hired a new Chief Executive Officer and are continuing to conduct a comprehensive review of our business model to identify further actions to meaningfully reduce pre-tax costs and enable a more efficient and effective organization and have engaged external advisors to assist in this effort. We are reiterating our stated goal to deliver over $200 million in annualized savings by 2025 versus 2022.
We are reiterating that we will realize $80 million of cost reductions for fiscal year 2023 versus fiscal year 2022. In the third quarter of 2023, we delivered $30 million of expense savings from reductions in our marketing and store labor costs, as well as a reduction in force in our corporate office that was implemented in August.
In addition, we are reiterating $120 million in annualized expense reductions for fiscal year 2024 versus fiscal year 2022 have been identified and implemented, which are inclusive of the savings effectuated for fiscal year 2023. We are also aggressively pursuing at least $50 million in gross margin expansion opportunities by leveraging efficiencies in sourcing, production and the supply chain.
Within our eCommerce channel, the advancements we have made to our express.com website and mobile app over the last three years have strengthened our omnichannel offering. Through website and mobile app enhancements, new features, personalization, user-generated content, and other initiatives, we believe we have more seamlessly connected our channels and built a platform on which all parts of the Express styling community can connect.
We design our stores to create a distinctive, engaging shopping environment and project our image of Express as a fashion authority. Our stores are located primarily in high-traffic shopping malls, lifestyle centers, outlet centers, and street locations. Our Express Edit stores present a highly curated and uniquely merchandised product assortment to customers in key fashion and influencer markets, with each store's presentation tailored to the relevant location.
EXPRESS, INC. | Q3 2023 Form 10-Q | 33
Leveraging our Omnichannel Platform
The second component of our new corporate strategy is to leverage our fully integrated omnichannel platform, with the aim of operating and growing a portfolio of fashion brands. We expect to leverage our existing strengths and capabilities in production and sourcing, logistics, technology, real estate, finance, legal and HR to achieve synergies and drive efficiencies across this portfolio.
We are now a platform company operating a portfolio of omnichannel brands that is comprised today of Express, Bonobos, and UpWest. We have positioned Express to generate positive free cash flow which will be strategically reinvested in our existing business and future acquisitions, while both Bonobos and UpWest will be top and bottom-line growth engines. As previously disclosed, we expect to deliver at least $50.0 million in gross margin expansion through efficiencies in sourcing, production, and the supply chain.
Accelerate Growth and Profitability Through Our Strategic Partnership with WHP
The third component of our new corporate strategy is to accelerate our growth and profitability through our strategic partnership with WHP through domestic non-core category and international licensing opportunities. In May 2023, we and WHP completed our joint acquisition of Bonobos, with Express acquiring the operating assets (and assuming the related liabilities) of the Bonobos business and licensing the intellectual property acquired by WHP for the operation of the Bonobos business in the U.S. Bonobos launched in 2007 as a digitally native menswear brand and quickly became known for exceptional fit and an innovative guide shop retail model. We intend to build upon Bonobos' strengths in eCommerce, marketing and customer loyalty, leverage our expertise in product design and merchandising and omnichannel retail, and unlock additional growth for Bonobos by extending the brand into underpenetrated categories. We also plan to grow Bonobos through WHP's expertise in licensing and international distribution. Bonobos sales exceeded our expectations during the third quarter of 2023 and delivered operating income accretive to our total. We expect it to be accretive to operating income and to deliver positive free cash flow for the full year 2023. Bonobos is a good example of the highly disciplined financial approach we intend to take with any future acquisition and represents a significant growth opportunity for Express.
Operate with Financial Discipline
The fourth component of our new corporate strategy is operating with financial discipline. We plan to build upon a foundation of strong, rigorous financial discipline and redesign the financial architecture of our Company to create a more agile expense framework that will allow us to be more flexible in a dynamic macroeconomic environment.
EXPRESS, INC. | Q3 2023 Form 10-Q | 34
HOW WE ASSESS THE PERFORMANCE OF OUR BUSINESS | ||||||||||||||
In assessing the performance of our business, we consider a variety of performance and financial measures. These key measures include net sales, comparable sales, eCommerce demand, transactions, cost of goods sold, buying and occupancy costs, gross profit/gross margin, and selling, general, and administrative expenses. The following table describes and discusses these measures.
| Net Sales | ||||||||
| Description | ||||||||
| Revenue from the sale of merchandise, less returns and discounts, as well as shipping and handling revenue related to eCommerce, revenue from the rental of our LED sign in Times Square, gift card breakage and revenue earned from our private label credit card agreement. | ||||||||
| Discussion | ||||||||
| Our business is seasonal, and we have historically realized a higher portion of our net sales in the third and fourth quarters, due primarily to the impact of the holiday season. Generally, approximately 45% of our annual net sales occur in the Spring season (first and second quarters) and 55% occur in the Fall season (third and fourth quarters). | ||||||||
| Comparable Sales | ||||||||
| Description | ||||||||
Comparable sales is a measure of the amount of sales generated in a period relative to the amount of sales generated in the comparable prior year period. Comparable sales for the third quarter of 2023 was calculated using the thirteen weeks ended October 28, 2023 as compared to the thirteen weeks ended October 29, 2022. Comparable retail sales includes: •Sales from retail stores that were open 12 months or more as of the end of the reporting period •eCommerce shipped sales Comparable outlet sales includes: •Sales from outlet stores that were open 12 months or more as of the end of the reporting period, including conversions Comparable sales excludes: •Sales from stores where the square footage has changed by more than 20% due to remodel or relocation activity •Sales from stores in a phased remodel where a portion of the store is under construction and therefore not productive selling space •Sales from stores where the store cannot open due to weather damage or other catastrophes, including pandemics | ||||||||
| Discussion | ||||||||
| Our business and our comparable sales are subject, at certain times, to calendar shifts, which may occur during key selling periods close to holidays such as Easter, Thanksgiving, and Christmas, and regional fluctuations for events such as sales tax holidays. We believe comparable sales provides a useful measure for investors by removing the impact of new stores and closed stores. Management considers comparable sales a useful measure in evaluating continuing store performance. | ||||||||
| eCommerce Demand | ||||||||
| Description | ||||||||
| eCommerce demand is defined as gross orders for Express and/or third party merchandise that originate through our eCommerce platform, including the website, app, and buy online pick-up in store. | ||||||||
| Discussion | ||||||||
| We believe eCommerce demand is a useful operational metric for investors and management as it provides visibility for orders placed but not yet shipped. | ||||||||
EXPRESS, INC. | Q3 2023 Form 10-Q | 35
| Transactions | ||||||||
| Description | ||||||||
| Transactions are defined as the number of customer point of sale interactions with customers. | ||||||||
| Discussion | ||||||||
| We believe this metric is useful as it provides a better indicator of the acceptance of our product. | ||||||||
| Cost of Goods Sold, Buying and Occupancy Costs | ||||||||
| Description | ||||||||
Includes the following: •Direct cost of purchased merchandise •Inventory shrink and other adjustments •Inbound and outbound freight •Royalties paid to the Joint Venture •Merchandising, design, planning and allocation, and manufacturing/production costs •Occupancy costs related to store operations (such as rent and common area maintenance, utilities, and depreciation on assets) •Logistics costs associated with our eCommerce business •Impairments on long-lived assets and right of use lease assets | ||||||||
| Discussion | ||||||||
| Our cost of goods sold typically increases in higher volume quarters because the direct cost of purchased merchandise is tied to sales. The primary drivers of the costs of individual goods are raw materials, labor in the countries where our merchandise is sourced, and logistics costs associated with transporting our merchandise. Buying and occupancy costs related to stores are largely fixed and do not necessarily increase as volume increases. Changes in the mix of products sold by type of product or by channel may also impact our overall cost of goods sold, buying and occupancy costs. Extended periods of declined business and sales could result in additional impairment of our assets. | ||||||||
| Gross Profit/Gross Margin | ||||||||
| Description | ||||||||
Gross profit is net sales minus cost of goods sold, buying and occupancy costs. Gross margin measures gross profit as a percentage of net sales. | ||||||||
| Discussion | ||||||||
| Gross profit/gross margin is impacted by the price at which we are able to sell our merchandise and the cost of our product. We review our inventory levels on an on-going basis in order to identify slow-moving merchandise and generally use markdowns to clear such merchandise. The timing and level of markdowns are driven primarily by seasonality and customer acceptance of our merchandise and have a direct effect on our gross margin. Any marked down merchandise that is not sold is marked-out-of-stock. We use third-party vendors to dispose of this marked-out-of-stock merchandise. | ||||||||
| Selling, General, and Administrative Expenses | ||||||||
| Description | ||||||||
Includes operating costs not included in cost of goods sold, buying and occupancy costs such as: •Payroll and other expenses related to operations at our corporate offices •Store expenses other than occupancy costs •Marketing expenses, including production, mailing, print, and digital advertising costs, among other things | ||||||||
| Discussion | ||||||||
| With the exception of store payroll, certain marketing expenses, and incentive compensation, selling, general, and administrative expenses generally do not vary proportionally with net sales. As a result, selling, general, and administrative expenses as a percentage of net sales are usually higher in lower volume quarters and lower in higher volume quarters. | ||||||||
EXPRESS, INC. | Q3 2023 Form 10-Q | 36
RESULTS OF OPERATIONS | ||||||||||||||
The Third Quarter of 2023 compared to the Third Quarter of 2022
The financial results of Bonobos have been included in our results from the closing date of the acquisition on May 23, 2023.
Store Activity
The following table shows store activity for the stated periods:
| Thirteen Weeks Ended October 28, 2023 | Thirteen Weeks Ended October 29, 2022 | ||||||||||||||||||||||||||||||||||||||||||||||||||||
Retail1 | Outlet | UpWest | Bonobos3 | Total | Retail2 | Outlet | UpWest | Total | |||||||||||||||||||||||||||||||||||||||||||||
| Beginning stores | 336 | 194 | 11 | 60 | 601 | 348 | 202 | 14 | 564 | ||||||||||||||||||||||||||||||||||||||||||||
| New stores | — | 1 | 1 | — | 2 | 4 | — | 1 | 5 | ||||||||||||||||||||||||||||||||||||||||||||
| Closed stores | (1) | (1) | — | (1) | (3) | (1) | — | (2) | (3) | ||||||||||||||||||||||||||||||||||||||||||||
| Ending stores | 335 | 194 | 12 | 59 | 600 | 351 | 202 | 13 | 566 | ||||||||||||||||||||||||||||||||||||||||||||
| Gross square footage at end of period (in thousands) | 4,549 | 4,683 | |||||||||||||||||||||||||||||||||||||||||||||||||||
1.As of October 28, 2023, ending retail store count includes 11 Express Edit stores
2.As of October 29, 2022, ending retail store count includes 9 Express Edit stores
3.Bonobos stores were acquired on May 23, 2023
Net Sales
The following table shows net sales and comparable sales for the stated periods:
| Thirteen Weeks Ended | |||||||||||
| October 28, 2023 | October 29, 2022 | ||||||||||
| Express | $ | 401,971 | $ | 434,145 | |||||||
| Bonobos | 52,092 | — | |||||||||
| Net sales (in thousands) | $ | 454,063 | $ | 434,145 | |||||||
| Dollar change compared to prior year | $ | 19,918 | |||||||||
| Percentage change compared to prior year | 4.6 | % | |||||||||
| Consolidated comparable retail sales | (4) | % | (11) | % | |||||||
| Consolidated comparable outlet sales | (13) | % | — | % | |||||||
| Total consolidated comparable sales percentage change | (6) | % | (8) | % | |||||||
Net sales in the third quarter of 2023 increased approximately $19.9 million as compared to the third quarter of 2022 due to the addition of Bonobos sales. The decrease in Express sales was primarily attributable to challenging comparable sales in our men's business against the backdrop of record performance in 2022. This was coupled with traffic softness in both retail and outlet stores along with the ongoing consumer environment for the Express brand remaining highly competitive with increased promotional activity. We continue to face challenges with the Express brand including declines in our customer file and store traffic. This was driven by missteps in our merchandise strategy where we were out of balance across categories, price points and wearing occasions. The misalignment between our assortment architectures and customer demand significantly impacted our sales.
EXPRESS, INC. | Q3 2023 Form 10-Q | 37
Gross Profit
The following table shows cost of goods sold, buying and occupancy costs, gross profit in dollars, and gross margin percentage for the stated periods:
| Thirteen Weeks Ended | |||||||||||
| October 28, 2023 | October 29, 2022 | ||||||||||
| (in thousands, except percentages) | |||||||||||
| Cost of goods sold, buying and occupancy costs | $ | 344,546 | $ | 313,528 | |||||||
| Gross profit | $ | 109,517 | $ | 120,617 | |||||||
| Gross margin percentage | 24.1 | % | 27.8 | % | |||||||
| Dollar change compared to prior year | $ | (11,100) | |||||||||
The 370 basis point decrease in gross margin percentage, or gross profit as a percentage of net sales, in the third quarter of 2023 as compared to the third quarter of 2022 was comprised of a decrease in merchandise margin of 440 basis points and a decrease in buying and occupancy costs as a percentage of net sales of 70 basis points. The decrease in merchandise margin was primarily driven by increased promotional activity and 370 basis points of royalty expense related to the Joint Venture. Buying and occupancy was positively impacted by the Bonobos acquisition. In addition, buying and occupancy was also impacted by $1.1 million due to an impairment charge of certain long-lived store related assets and right of use assets. Refer to Note 4 in our unaudited Consolidated Financial Statements included elsewhere in this Quarterly Report for further discussion regarding the impairment charges.
Selling, General, and Administrative Expenses
The following table shows selling, general, and administrative expenses ("SG&A") in dollars and as a percentage of net sales for the stated periods:
| Thirteen Weeks Ended | |||||||||||
| October 28, 2023 | October 29, 2022 | ||||||||||
| (in thousands, except percentages) | |||||||||||
| Selling, general, and administrative expenses | $ | 143,645 | $ | 150,090 | |||||||
| Selling, general, and administrative expenses, as a percentage of net sales | 31.6 | % | 34.6 | % | |||||||
| Dollar change compared to prior year | $ | (6,445) | |||||||||
The $6.4 million decrease in SG&A in the third quarter of 2023 as compared to the third quarter of 2022 was primarily driven by our expense savings initiatives, including reductions in marketing spend, store labor costs, and a reduction in force in our corporate office that was implemented during the third quarter of 2023, as well as lower long-term incentive compensation.
Royalty Income
The following table shows royalty income in dollars and as a percentage of net sales for the stated periods:
| Thirteen Weeks Ended | |||||||||||
| October 28, 2023 | October 29, 2022 | ||||||||||
| (in thousands, except percentages) | |||||||||||
| Royalty income | $ | (5,387) | $ | — | |||||||
| Royalty income, as a percentage of net sales | (1.2) | % | — | % | |||||||
| Dollar change compared to prior year | $ | (5,387) | |||||||||
The $5.4 million increase in royalty income in the third quarter of 2023 as compared to third quarter of 2022 was due to our share of equity income associated with our equity investment with WHP. Refer to Note 5 in our unaudited Consolidated Financial Statements included elsewhere in this Quarterly Report for further discussion of our equity investment.
EXPRESS, INC. | Q3 2023 Form 10-Q | 38
Interest Expense, Net
The following table shows interest expense in dollars and as a percentage of net sales for the stated periods:
| Thirteen Weeks Ended | |||||||||||
| October 28, 2023 | October 29, 2022 | ||||||||||
| (in thousands, except percentages) | |||||||||||
| Interest expense, net | $ | 6,170 | $ | 4,668 | |||||||
| Interest expense, as a percentage of net sales | 1.4 | % | 1.1 | % | |||||||
| Dollar change compared to prior year | $ | 1,502 | |||||||||
The $1.5 million increase in interest expense in the third quarter of 2023 as compared to the third quarter of 2022 was the result of higher aggregate amounts borrowed and higher variable interest rates on our outstanding indebtedness. Refer to Note 9 in our unaudited Consolidated Financial Statements included elsewhere in this Quarterly Report for further discussion regarding our debt instruments.
Income Tax Expense
The following table shows income tax expense in dollars and as a percentage of net sales for the stated periods:
| Thirteen Weeks Ended | |||||||||||
| October 28, 2023 | October 29, 2022 | ||||||||||
| (in thousands, except percentages) | |||||||||||
| Income tax expense | $ | 1,899 | $ | 780 | |||||||
| Income tax expense, as a percentage of net sales | 0.4 | % | 0.2 | % | |||||||
| Dollar change compared to prior year | $ | 1,119 | |||||||||
The effective tax rate was (5.4)% and (2.3)% for the third quarter of 2023 and third quarter of 2022, respectively. The effective tax rate for the third quarter of 2023 reflects the impact of our 2022 tax return filing, the corresponding effects to a refund claim made under the Coronavirus Aid, Relief, and Economic Security Act ("CARES Act") and the recording of an additional valuation allowance against our current year losses. The effective tax rate for the third quarter of 2022 reflects the impact of non-deductible executive compensation and the recording of an additional valuation allowance against our fiscal year 2022 losses.
EXPRESS, INC. | Q3 2023 Form 10-Q | 39
The Thirty-Nine Weeks Ended October 28, 2023 compared to the Thirty-Nine Weeks Ended October 29, 2022
The financial results of Bonobos have been included in our results from the closing date of the acquisition on May 23, 2023.
Store Activity
The following table shows store activity for the stated periods:
| Thirty-Nine Weeks Ended October 28, 2023 | Thirty-Nine Weeks Ended October 29, 2022 | ||||||||||||||||||||||||||||||||||||||||||||||||||||
Retail1 | Outlet | UpWest | Bonobos3 | Total | Retail2 | Outlet | UpWest | Total | |||||||||||||||||||||||||||||||||||||||||||||
| Beginning stores | 342 | 198 | 13 | 0 | 553 | 351 | 203 | 7 | 561 | ||||||||||||||||||||||||||||||||||||||||||||
| New stores | 1 | 1 | 2 | 60 | 64 | 5 | — | 8 | 13 | ||||||||||||||||||||||||||||||||||||||||||||
| Closed stores | (8) | (5) | (3) | (1) | (17) | (5) | (1) | (2) | (8) | ||||||||||||||||||||||||||||||||||||||||||||
| Ending stores | 335 | 194 | 12 | 59 | 600 | 351 | 202 | 13 | 566 | ||||||||||||||||||||||||||||||||||||||||||||
| Gross square footage at end of period (in thousands) | 4,549 | 4,683 | |||||||||||||||||||||||||||||||||||||||||||||||||||
1.As of October 28, 2023, ending retail store count includes 11 Express Edit stores
2.As of October 29, 2022, ending retail store count includes 9 Express Edit stores
3.Bonobos stores were acquired on May 23, 2023
Net Sales
The following table shows net sales and comparable sales for the stated periods:
| Thirty-Nine Weeks Ended | |||||||||||
| October 28, 2023 | October 29, 2022 | ||||||||||
| Express | $ | 1,179,644 | $ | 1,349,849 | |||||||
| Bonobos | 93,020 | — | |||||||||
| Net sales (in thousands) | $ | 1,272,664 | $ | 1,349,849 | |||||||
| Dollar change compared to prior year | $ | (77,185) | |||||||||
| Percentage change compared to prior year | (5.7) | % | |||||||||
| Consolidated comparable retail sales | (10) | % | 5 | % | |||||||
| Consolidated comparable outlet sales | (16) | % | 9 | % | |||||||
| Total consolidated comparable sales percentage change | (12) | % | 6 | % | |||||||
Net sales for the thirty-nine weeks ended October 28, 2023 decreased approximately $77.2 million as compared to the thirty-nine weeks ended October 29, 2022, partially offset by sales from the addition of Bonobos. The decrease in Express sales was primarily attributable to challenging comparable sales in both our women's and men's business. This was driven by traffic softness in both retail and outlet stores along with reduced consumer spending, increased price sensitivity in discretionary categories and aggressive promotional activity across the industry that began in fiscal year 2022 and persisted throughout fiscal year 2023 to date. We continue to face challenges with the Express brand including declines in our customer file and store traffic, driven by missteps in our merchandise strategy where we were out of balance across categories, price points and wearing occasions. The misalignment between our assortment architectures and customer demand significantly impacted our sales.
EXPRESS, INC. | Q3 2023 Form 10-Q | 40
Gross Profit
The following table shows cost of goods sold, buying and occupancy costs, gross profit in dollars, and gross margin percentage for the stated periods:
| Thirty-Nine Weeks Ended | |||||||||||
| October 28, 2023 | October 29, 2022 | ||||||||||
| (in thousands, except percentages) | |||||||||||
| Cost of goods sold, buying and occupancy costs | $ | 998,985 | $ | 944,031 | |||||||
| Gross profit | $ | 273,679 | $ | 405,818 | |||||||
| Gross margin percentage | 21.5 | % | 30.1 | % | |||||||
| Dollar change compared to prior year | $ | (132,139) | |||||||||
The 860 basis point decrease in gross margin percentage, or gross profit as a percentage of net sales, for the thirty-nine weeks ended October 28, 2023 compared to the thirty-nine weeks ended October 29, 2022 was comprised of a decrease in merchandise margin of 660 basis points and an increase in buying and occupancy costs as a percentage of net sales of 200 basis points. The decrease in merchandise margin was primarily driven by the challenging macroeconomic and highly promotional retail environment as well as 350 basis points of royalty expense related to the Joint Venture. Buying and occupancy deleveraged due to the decline in comparable sales. In addition, buying and occupancy was also impacted by $2.7 million of severance charges related to our restructuring and $2.1 million due to an impairment charge of certain long-lived store related assets and right of use assets. Refer to Note 4 in our unaudited Consolidated Financial Statements included elsewhere in this Quarterly Report for further discussion regarding the impairment charges.
Selling, General, and Administrative Expenses
The following table shows SG&A in dollars and as a percentage of net sales for the stated periods:
| Thirty-Nine Weeks Ended | |||||||||||
| October 28, 2023 | October 29, 2022 | ||||||||||
| (in thousands, except percentages) | |||||||||||
| Selling, general, and administrative expenses | $ | 429,084 | $ | 434,461 | |||||||
| Selling, general, and administrative expenses, as a percentage of net sales | 33.7 | % | 32.2 | % | |||||||
| Dollar change compared to prior year | $ | (5,377) | |||||||||
The $5.4 million decrease in SG&A for the thirty-nine weeks ended October 28, 2023 as compared to the thirty-nine weeks ended October 29, 2022 was primarily driven by our expense savings initiatives, including reductions in marketing spend, store labor costs, and a reduction in force in our corporate office that was implemented during the third quarter of 2023, as well as lower long-term incentive compensation. This was partially offset by the consolidation of Bonobos, as well as acquisition-related and integration costs incurred in connection with the acquisition and severance charges related to our restructuring.
Royalty Income
The following table shows royalty income in dollars and as a percentage of net sales for the stated periods:
| Thirty-Nine Weeks Ended | |||||||||||
| October 28, 2023 | October 29, 2022 | ||||||||||
| (in thousands, except percentages) | |||||||||||
| Royalty income | $ | (16,020) | $ | — | |||||||
| Royalty income, as a percentage of net sales | (1.3) | % | — | % | |||||||
| Dollar change compared to prior year | $ | (16,020) | |||||||||
The $16.0 million increase in royalty income during the thirty-nine weeks ended October 28, 2023 as compared to thirty-nine weeks ended October 29, 2022 was due to our share of equity income associated with our equity
EXPRESS, INC. | Q3 2023 Form 10-Q | 41
investment with WHP. Refer to Note 5 in our unaudited Consolidated Financial Statements included elsewhere in this Quarterly Report for further discussion of our equity investment.
Interest Expense, Net
The following table shows interest expense in dollars and as a percentage of net sales for the stated periods:
| Thirty-Nine Weeks Ended | |||||||||||
| October 28, 2023 | October 29, 2022 | ||||||||||
| (in thousands, except percentages) | |||||||||||
| Interest expense, net | $ | 12,987 | $ | 11,962 | |||||||
| Interest expense, as a percentage of net sales | 1.0 | % | 0.9 | % | |||||||
| Dollar change compared to prior year | $ | 1,025 | |||||||||
The $1.0 million increase in interest expense for the thirty-nine weeks ended October 28, 2023 as compared to the thirty-nine weeks ended October 29, 2022 was the result of higher aggregate amounts borrowed and higher variable interest rates on our outstanding indebtedness. Refer to Note 9 in our unaudited Consolidated Financial Statements included elsewhere in this Quarterly Report for further discussion regarding our debt instruments.
Income Tax Expense
The following table shows income tax expense in dollars and as a percentage of net sales for the stated periods:
| Thirty-Nine Weeks Ended | |||||||||||
| October 28, 2023 | October 29, 2022 | ||||||||||
| (in thousands, except percentages) | |||||||||||
| Income tax expense | $ | 2,879 | $ | 549 | |||||||
| Income tax expense, as a percentage of net sales | 0.2 | % | — | % | |||||||
| Dollar change compared to prior year | $ | 2,330 | |||||||||
The effective tax rate was (1.9)% and (1.4)% for the thirty-nine weeks ended October 28, 2023 and October 29, 2022, respectively. The effective tax rate for the thirty-nine weeks ended October 28, 2023 reflects the impact of our 2022 tax return filing, the corresponding effects to a refund claim made under the CARES Act, and the recording of an additional valuation allowance against our current year losses. The effective tax rate for the thirty-nine weeks ended October 29, 2022 reflects the impact of non-deductible executive compensation and the recording of an additional valuation allowance against our fiscal year 2022 losses.
Reconciliation of Non-GAAP Financial Measures to GAAP Measures
We supplement the reporting of our financial information determined under United States generally accepted accounting principles ("GAAP") with certain non-GAAP financial measures such as earnings before interest, taxes, depreciation, and amortization ("EBITDA"). We strongly encourage investors and stockholders to review our financial statements and publicly-filed reports in their entirety and not to rely on any single financial measure.
Adjusted Operating Income (Loss), Adjusted Net Income (Loss) and Adjusted Diluted Earnings Per Share | ||||||||||||||
Adjusted operating income (loss), adjusted net income (loss), and adjusted diluted earnings per share exclude the impact of certain items that we do not believe are directly related to our underlying operations.
How These Measures Are Useful
We believe that these non-GAAP measures provide additional useful information to assist stockholders in understanding our financial results and assessing our prospects for future performance. Management believes adjusted operating income (loss), adjusted net income (loss), and adjusted diluted earnings per share are important indicators of our business performance because they exclude items that may not be indicative of, or are unrelated to, our underlying operating results, and may provide a better baseline for analyzing trends in the business.
EXPRESS, INC. | Q3 2023 Form 10-Q | 42
Limitations of the Usefulness of These Measures
Because non-GAAP financial measures are not standardized, adjusted operating income (loss), adjusted net income (loss), and adjusted diluted earnings per share may differ from similarly titled measures used by other companies due to different methods of calculation. These adjusted financial measures should not be considered in isolation or as a substitute for reported operating income (loss), net income (loss), or diluted earnings per share. These non-GAAP financial measures reflect an additional way of viewing our operations that, when viewed together with the GAAP results, provide a more complete understanding of our business. A reconciliation of adjusted operating income (loss), adjusted net income (loss) and adjusted diluted earnings per share to the most directly comparable GAAP measure is set forth below:
| Thirty-Nine Weeks Ended October 28, 2023 | |||||||||||||||||||||||||||||
| (in thousands, except per share amounts) | Operating Loss | Income Tax Impact(a) | Net Loss | Diluted Earnings per Share | Weighted Average Diluted Shares Outstanding(e) | ||||||||||||||||||||||||
| Reported GAAP Measure | $ | (138,428) | $ | (154,294) | $ | (41.42) | 3,725 | ||||||||||||||||||||||
Impact of restructuring(b) | 4,658 | — | 4,658 | 1.25 | |||||||||||||||||||||||||
Acquisition-related and integration costs(c) | 4,595 | — | 4,595 | 1.23 | |||||||||||||||||||||||||
Impairment of property, equipment and lease assets(d) | 996 | — | 996 | 0.27 | |||||||||||||||||||||||||
| Adjusted Non-GAAP Measure | $ | (128,179) | $ | (144,045) | $ | (38.67) | |||||||||||||||||||||||
a.Items tax effected at the applicable deferred or statutory rate offset by the recording of a non-cash valuation allowance.
b.Represents restructuring charges primarily related to employee severance and benefits of which $2.7 million was recorded in cost of goods sold, buying and occupancy costs and $2.0 million was recorded in selling, general and administrative expenses in the unaudited Consolidated Statements of Income and Comprehensive Income.
c.Represents acquisition-related and integration costs incurred in connection with the acquisition of Bonobos, which were recorded in selling, general and administrative expenses in the unaudited Consolidated Statements of Income and Comprehensive Income.
d.Represents a non-cash impairment charge taken against certain long-lived store related assets and right of use assets, which was recorded in cost of goods sold, buying and occupancy costs in the unaudited Consolidated Statements of Income and Comprehensive Income.
e.Share amount reflects the Company’s 1-for-20 reverse stock split which was effected after the close of market on August 30, 2023.
EBITDA | ||||||||||||||
EBITDA is defined as net income (loss) before interest expense (net of interest income), income tax expense and depreciation and amortization expense.
How This Measure Is Useful
When used in conjunction with GAAP financial measures, EBITDA is a supplemental measure of operating performance that we believe is a useful measure to facilitate comparisons to historical performance. EBITDA is used as a performance measure in our long-term executive compensation program for purposes of determining the number of equity awards that are ultimately earned and is also a metric used in our short-term cash incentive compensation plan.
Limitations of the Usefulness of This Measure
Because non-GAAP financial measures are not standardized, EBITDA may differ from similarly titled measures used by other companies due to different methods of calculation. Presentation of EBITDA is not intended to be considered in isolation or as a substitute for the financial information prepared and presented in accordance with GAAP. Therefore, this measure may not provide a complete understanding of our performance and should be reviewed in conjunction with the GAAP financial measures. A reconciliation of EBITDA to the most directly comparable GAAP measures, is set forth below:
EXPRESS, INC. | Q3 2023 Form 10-Q | 43
| Thirteen Weeks Ended | Thirty-Nine Weeks Ended | ||||||||||||||||||||||
| (in thousands) | October 28, 2023 | October 29, 2022 | October 28, 2023 | October 29, 2022 | |||||||||||||||||||
| Net loss | $ | (36,811) | $ | (34,448) | $ | (154,294) | $ | (39,326) | |||||||||||||||
| Interest expense, net | 6,170 | 4,668 | 12,987 | 11,962 | |||||||||||||||||||
| Income tax expense | 1,899 | 780 | 2,879 | 549 | |||||||||||||||||||
| Depreciation and amortization | 11,679 | 14,550 | 40,800 | 43,763 | |||||||||||||||||||
| EBITDA (Non-GAAP Measure) | $ | (17,063) | $ | (14,450) | $ | (97,628) | $ | 16,948 | |||||||||||||||
LIQUIDITY AND CAPITAL RESOURCES | ||||||||||||||
Forward-Looking Liquidity Discussion
Our liquidity position benefits from the fact that we generally collect cash from sales to customers the same day or, in the case of credit or debit card transactions, within three to five days of the related sale, and we have up to 75 days to pay certain merchandise vendors and 45 days to pay the majority of our non-merchandise vendors. We also have commitments under lease agreements and debt agreements that will require future cash outlays.
Based upon the sales and results of operations seen during the thirty-nine weeks ended October 28, 2023, and expense reduction and other measures planned and taken to date, we were in compliance with the financial covenants under the Revolving Credit Facility and FILO Term Loan as of October 28, 2023. However, due to the uncertainty related to the challenging macroeconomic, consumer and competitive environments we could experience material changes to our forecasted revenues and cash flows and may experience difficulty remaining in compliance with financial covenants. We plan to continue enhancing our liquidity by selling through our inventory at appropriate retail prices and identifying and implementing additional expense savings.
We have hired a new Chief Executive Officer and are continuing to conduct a comprehensive review of our business model to identify actions that are expected to further meaningfully reduce pre-tax costs and enable a more efficient and effective organization and have engaged external advisors to assist in this effort. We are reiterating our stated goal to deliver over $200 million in annualized savings by 2025 versus 2022.
We are reiterating that we will realize $80 million of cost reductions for fiscal year 2023 versus fiscal year 2022. In the third quarter of 2023, we delivered $30 million of expense savings from reductions in our marketing and store labor costs, as well as a reduction in force in our corporate office that was implemented in August.
In addition, we are reiterating $120 million in annualized expense reductions for fiscal year 2024 versus fiscal year 2022 have been identified and implemented, which are inclusive of the savings effectuated for fiscal year 2023. We are also aggressively pursuing at least $50 million in gross margin expansion opportunities by leveraging efficiencies in sourcing, production and the supply chain.
We believe this will provide adequate cash flows to support our ongoing operations and to meet our financial covenant requirements under the Revolving Credit Facility for at least twelve months following the date that these unaudited Consolidated Financial Statements in Part I, Item 1 of this Quarterly Report are issued.
To fund our normal working capital requirements, we plan to continue to utilize available borrowing capacity under the Revolving Credit Facility, which was $21.7 million as of October 28, 2023. On September 5, 2023, we entered into a definitive loan agreement for a $65.0 million first-in-last-out asset-based term loan in further support of expanding liquidity access. Please refer to Note 9 in our unaudited Consolidated Financial Statements included elsewhere in this Quarterly Report for further details regarding the term loan. We currently have (and in the future may continue to have) a negative working capital balance, meaning our current liabilities exceed our current assets (including cash balances). Our current liabilities include current operating lease liabilities, for which the corresponding operating right of use assets are recorded as non-current on our unaudited Consolidated Balance Sheets. The ABL Credit Agreement contains certain affirmative and negative covenants. Refer to Note 9 in our unaudited Consolidated Financial Statements included elsewhere in this Quarterly Report for further details regarding the Revolving Credit Facility and the ABL Credit Agreement.
EXPRESS, INC. | Q3 2023 Form 10-Q | 44
Analysis of Cash Flows
A summary of cash provided by or used in operating, investing and financing activities is shown in the following table:
| Thirty-Nine Weeks Ended | |||||||||||
| October 28, 2023 | October 29, 2022 | ||||||||||
| (in thousands) | |||||||||||
| Used in operating activities | $ | (131,367) | $ | (95,869) | |||||||
| Used in investing activities | (51,692) | (24,340) | |||||||||
| Provided by financing activities | 152,090 | 103,625 | |||||||||
Decrease in cash and cash equivalents | (30,969) | (16,584) | |||||||||
| Cash and cash equivalents at end of period | $ | 34,643 | $ | 24,592 | |||||||
Operating Activities
Our business relies on cash flows from operations as our primary source of liquidity, with the majority of those cash flows being generated in the fourth quarter of the fiscal year. Our primary operating cash needs are for merchandise inventories, payroll, store rent and marketing. For the thirty-nine weeks ended October 28, 2023, our cash flows used in operating activities were $131.4 million compared to cash used of $95.9 million for the thirty-nine weeks ended October 29, 2022. The $35.5 million decrease in cash flows from operating activities for the thirty-nine weeks ended October 28, 2023 as compared to the same period in 2022 was primarily driven by changes in working capital and operating loss.
Investing Activities
Investing activities consists of cash outlays for acquisitions, capital expenditures and equity method investments. Net cash used in investing activities was $51.7 million for the thirty-nine weeks ended October 28, 2023 compared to cash used of $24.3 million for the thirty-nine weeks ended October 29, 2022. The $27.4 million decrease in cash flows from investing activities for the thirty-nine weeks ended October 28, 2023 as compared to the same period in 2022 was primarily driven by cash paid for the acquisition of Bonobos. Refer to Note 6 in our unaudited Consolidated Financial Statements included elsewhere in this Quarterly Report for further discussion regarding the acquisition.
We had capital expenditures of approximately $23.3 million for the thirty-nine weeks ended October 28, 2023 and $24.3 million for the thirty-nine weeks ended October 29, 2022. Our capital expenditures consisted primarily of new and remodeled store construction and fixtures and investments in information technology. The $1.1 million decrease in capital expenditures for the thirty-nine weeks ended October 28, 2023 as compared to the same period in 2022 was primarily driven by intentional reductions in our capital expenditures in response to our business results and redeployment of capital to fund the Bonobos transaction and to support our cost reduction initiatives. We expect capital expenditures for the remainder of fiscal year 2023 to be approximately $2.0 million, primarily driven by new and remodeled store construction and further investments in information technology.
Financing Activities
Debt Arrangements
During the thirty-nine weeks ended October 28, 2023, we borrowed a net additional $90.6 million under the Revolving Credit Facility to fund normal working capital needs as well as capital expenditures for stores, our eCommerce platform and other information technology investments. In addition, during that period, we received $65.0 million in net proceeds from the FILO Term Loan.
As of October 28, 2023, the net aggregate principal amount outstanding under our debt arrangements was $274.7 million, of which $4.2 million was classified as short-term debt and $270.5 million was classified as long-term debt on the unaudited Consolidated Balance Sheet, net of unamortized costs, and approximately $21.7 million was available for additional borrowing under the Revolving Credit Facility subject to certain borrowing base limitations and after giving effect to outstanding letters of credit in the aggregate amount of $20.1 million, primarily related to a third party logistics contract. Refer to Note 9 of our unaudited Consolidated Financial Statements included elsewhere in this Quarterly Report for additional information on the Revolving Credit Facility and FILO Term Loan.
EXPRESS, INC. | Q3 2023 Form 10-Q | 45
CRITICAL ACCOUNTING POLICIES | ||||||||||||||
Management has determined that our most critical accounting policies are those related to store asset impairment, merchandise inventory valuation and valuation allowance on deferred tax assets. We continue to monitor our accounting policies to ensure proper application of current rules and regulations. There have been no significant changes to the policies discussed in our Annual Report.
ITEM 3. QUANTITATIVE AND QUALITATIVE DISCLOSURES ABOUT MARKET RISK.
INTEREST RATE RISK | ||||||||||||||
Outstanding borrowings under the Revolving Credit Facility and FILO Term Loan bear interest at variable rates. See Note 9 to our unaudited Consolidated Financial Statements included elsewhere in this Quarterly Report for further information on the calculation of the rates. The nature and amount of our long-term debt can be expected to vary as a result of our future business requirements, market conditions, and other factors.
As of October 28, 2023, we had approximately $212.7 million in borrowings outstanding under our Revolving Credit Facility and $65.0 million in aggregate outstanding principal amount under the FILO Term Loan. Based on our debt balances at October 28, 2023, we estimate that a hypothetical 100 basis point increase or decrease in underlying interest rates would increase or decrease annual interest expense by approximately $2.8 million. This hypothetical analysis may differ from the actual change in interest expense due to potential changes in the reference interest rates applicable to each debt instrument or aggregate outstanding principal amount under the Revolving Credit Facility and the FILO Term Loan.
With the exception of the changes in the levels of outstanding borrowings under the Revolving Credit Facility and the FILO Term Loan, discussed in Note 9 of our unaudited Consolidated Financial Statements included elsewhere in this Quarterly Report, there have been no material changes in our quantitative and qualitative market risks from those disclosed in our Annual Report.
ITEM 4. CONTROLS AND PROCEDURES.
EVALUATION OF DISCLOSURE CONTROLS AND PROCEDURES | ||||||||||||||
We maintain disclosure controls and procedures (as defined in Rule 13a-15(e) and Rule 15d-15(e) promulgated under the Exchange Act) that are designed to provide reasonable assurance that information required to be disclosed in our Exchange Act reports is recorded, processed, summarized, and reported within the time periods specified in the SEC’s rules and forms and that such information is accumulated and communicated to our management, including our principal executive officer and principal financial officer, as appropriate, to allow timely decisions regarding required disclosure. In evaluating the effectiveness of the design and operation of our disclosure controls and procedures, management recognizes that any controls and procedures, no matter how well designed and operated, can provide only reasonable, and not absolute, assurance of achieving the desired control objectives. In reaching a reasonable level of assurance, management necessarily was required to apply its judgment in evaluating the cost-benefit relationship of possible controls and procedures.
Management plans to exclude Bonobos from its assessment of internal control over financial reporting as of February 3, 2024 because it was acquired in a business combination in the current fiscal year. Bonobos' total assets and total revenues both represent approximately 7%, respectively, of our total assets and total revenues, as of and for the thirty-nine weeks ended October 28, 2023.
Under the supervision and with the participation of our management, including our principal executive officer and principal financial officer, we conducted an evaluation prior to filing this Quarterly Report of the effectiveness of the design and operation of our disclosure controls and procedures. Based on this evaluation, our principal executive officer and our principal financial officer concluded that our disclosure controls and procedures were effective at the reasonable assurance level as of October 28, 2023.
EXPRESS, INC. | Q3 2023 Form 10-Q | 46
CHANGES IN INTERNAL CONTROL OVER FINANCIAL REPORTING | ||||||||||||||
There were no changes in our internal control over financial reporting (as defined in Rules 13a-15(f) and 15d-15(f) under the Exchange Act) that occurred during the third quarter of 2023 that materially affected, or are reasonably likely to materially affect, our internal control over financial reporting.
PART II - OTHER INFORMATION
ITEM 1. LEGAL PROCEEDINGS.
The Company is subject to various claims and contingencies arising in the normal course of its business. Except with respect to the legal proceedings set forth in Note 11 to our unaudited Consolidated Financial Statements included in Part I of this Quarterly Report and incorporated herein by reference, the Company believes that the ultimate liability arising from such claims and contingencies, if any, is not likely to have a material adverse effect on the Company’s results of operations, financial conditions or cash flows.
ITEM 1A. RISK FACTORS.
In addition to the other information set forth in this Quarterly Report, careful consideration should be given to the risk factors set forth in “Item 1A. Risk Factors” of our Annual Report, any of which could materially affect our business, operations, financial position, stock price, or future results. The risks described herein and in our Annual Report, are important to an understanding of the statements made in this Quarterly Report, in our other filings with the SEC, and in any other discussion of our business. These risk factors, which contain forward-looking information, should be read in conjunction with “Item 2. Management’s Discussion and Analysis of Financial Condition and Results of Operations”, and the unaudited Consolidated Financial Statements and related Notes included in this Quarterly Report. Except as set forth below, there have been no material changes to the risk factors described in our Annual Report.
We may not realize the potential benefits of the acquisition of operating assets from Bonobos.
On May 23, 2023, the Company completed the acquisition of the operating assets of the Bonobos business (the “Bonobos Assets”) for a purchase price of $25.0 million. The success of this acquisition, including the expected strategic and financial benefits, will depend, among other things, on our ability to unlock additional growth opportunities for the Bonobos brand and successfully leverage our fully integrated omnichannel operating platform to drive financial synergies and additional economies of scale. We may fail to realize the benefits of the acquisition of the Bonobos assets for a variety of reasons, including: (i) our failure to retain Bonobos’ customers, drive awareness and customer acquisition, (ii) our failure to successfully manage relationships with suppliers; (iii) our failure to fully integrate Bonobos into the Company’s omnichannel operating platform or at a cost or timeline that is greater than originally anticipated; and (iv) our failure to combine product offerings and purchase experiences efficiently and effectively. Failure to achieve the anticipated strategic and financial benefits of the Bonobos acquisition could adversely affect our results of operations, financial condition and cash flows, decrease or delay the accretive effect of the acquisition and negatively impact the price of our common stock.
We may not realize the expected financial benefits from our workforce reduction and other cost reduction actions, including within the anticipated timeline.
Our strategic initiatives include identifying and implementing actions designed to significantly reduce our pre-tax costs and to enable a more efficient and effective organization. We recently announced a goal to deliver over $200.0 million in annualized savings by 2025, which includes $150.0 million in annualized expense reductions by fiscal year 2025 versus fiscal year 2022 and at least $50.0 million in gross margin expansion by leveraging efficiencies in sourcing, production and the supply chain. As of this date of this report, the Company has identified and implemented $80.0 million of annualized cost reductions expected to be realized for fiscal year 2023, and $120.0 million of annualized cost reductions expected to be realized for fiscal year 2024, compared to fiscal year 2022, including annualized cost reductions of approximately $30.0 million from an August 2023 restructuring of the Company’s workforce.
EXPRESS, INC. | Q3 2023 Form 10-Q | 47
We may not be able to fully implement these cost reduction actions or realize their benefits, including within the anticipated timeline, nor may we be able to identify and/or implement additional cost reductions actions and/or gross margin expansion opportunities necessary to achieve our $200.0 million annualized savings goal, including potentially as a result of factors outside of our control. In addition, the implementation of these cost reduction actions and the restructuring of the Company’s work force could have unintended consequences to us, including negatively impacting our sales as a result of lower marketing and other previously budgeted spend, management diversion, employee attrition beyond the workforce reduction, and lower employee morale among our current employees. If we are not able to fully achieve the expected financial benefits of our cost reduction actions within the anticipated timeline, we may not be able to effectively mitigate the negative impacts of the current ongoing negative macroeconomic conditions on the Company’s business, which in turn, could weaken the Company’s ability to support its ongoing operations, satisfy the financial covenants under the agreements governing its indebtedness and otherwise meet its obligations as they become due, and further, cause management to change its assessment of the Company’s ability to continue as a going concern (refer to Note 4 in our unaudited Consolidated Financial Statements included elsewhere in this Quarter Report for further discussion of management’s current assessment).
Our failure to fully realize the expected financial benefits from our cost reduction actions could also lead to the implementation of additional restructuring-related activities in the future, which could exacerbate these risks or introduce new risks which could materially adversely affect our business, financial position, liquidity and results of operations.
ITEM 2. UNREGISTERED SALES OF EQUITY SECURITIES AND USE OF PROCEEDS.
The following table provides information regarding the purchase of shares of our common stock made by or on behalf of the Company or any “affiliated purchaser” as defined in Rule 10b-18(a)(3) under the Exchange Act, during each month of the quarterly period ended October 28, 2023:
| Month | Total Number of Shares Purchased(1) | Average Price Paid per Share | Total Number of Shares Purchased as Part of Publicly Announced Plans or Programs | Approximate Dollar Value of Shares that May Yet Be Purchased under the Plans or Programs(2) | ||||||||||||||||||||||
| (in thousands, except per share amounts) | ||||||||||||||||||||||||||
| July 30, 2023 - August 26, 2023 | 0.3 | $ | 15.20 | — | $ | 34,215 | ||||||||||||||||||||
| August 27, 2023 - September 30, 2023 | 0.4 | $ | 9.74 | — | $ | 34,215 | ||||||||||||||||||||
| October 1, 2023 - October 28, 2023 | 0.1 | $ | 8.40 | — | $ | 34,215 | ||||||||||||||||||||
| Total | 0.8 | — | ||||||||||||||||||||||||
1.Represents shares purchased in connection with employee tax withholding obligations under the Second Amended and Restated Express, Inc. 2018 Incentive Compensation Plan.
2.On November 30, 2017, the Company announced that the Board approved a share repurchase program that authorizes the Company to repurchase up to $150.0 million of the Company’s outstanding common stock using available cash. The Company may repurchase shares on the open market, including through Rule 10b5-1 plans, in privately negotiated transactions, through block purchases, or otherwise in compliance with applicable laws, including Rule 10b-18 of the Exchange Act. The timing and amount of stock repurchases, if any, will depend on a variety of factors, including business and market conditions as well as corporate and regulatory considerations. The share repurchase program may be suspended, modified, or discontinued at any time, and the Company has no obligation to repurchase any amount of its common stock under the program.
ITEM 3. DEFAULTS UPON SENIOR SECURITIES.
Not applicable.
ITEM 4. MINE SAFETY DISCLOSURES.
Not applicable.
EXPRESS, INC. | Q3 2023 Form 10-Q | 48
ITEM 5. OTHER INFORMATION.
Insider Trading Arrangements
During the most recent fiscal quarter, none of our directors or officers subject to Section 16 of the Exchange Act adopted terminated
EXPRESS, INC. | Q3 2023 Form 10-Q | 49
ITEM 6. EXHIBITS.
The following exhibits are filed or furnished as part of this Quarterly Report or are incorporated herein by reference.
Exhibit Number | Exhibit Description | |||||||
| Certificate of Incorporation of Express, Inc. (incorporated by reference to Exhibit 4.1 to the Registration Statement on Form S-8, filed with the SEC on July 14, 2010). | ||||||||
| Certificate of Amendment of Certificate of Incorporation of Express, Inc. (incorporated by reference to Exhibit 3.1 to the Current Report on Form 8-K, filed with the SEC on June 11, 2013). | ||||||||
| Certificate of Amendment of Certificate of Incorporation of Express, Inc. (incorporated by reference to Exhibit 3.1 to the Current Report on Form 8-K, filed with the SEC on September 1, 2023). | ||||||||
| Term Loan Agreement, by and among Express, Inc., Express, LLC, certain other direct or indirect, wholly-owned subsidiaries of Express, Inc., ReStore Capital LLC, as administrative agent, collateral agent and lender, and the other lenders from time to time party thereto, dated as of September 5, 2023 (incorporated by reference to Exhibit 10.1 to the Current Report on Form 8-K, filed with the SEC on September 6, 2023). | ||||||||
| Fifth Amendment to Second Amended and Restated Asset-Based Loan Credit Agreement, by and among Express, Inc., Express, LLC, certain other direct or indirect, wholly-owned subsidiaries of Express, Inc., Wells Fargo Bank, National Association, as administrative agent and collateral agent, and the lenders party thereto, dated as of September 5, 2023 (incorporated by reference to Exhibit 10.2 to the Current Report on Form 8-K, filed with the SEC on September 6, 2023). | ||||||||
| Separation Agreement, dated as of September 11, 2023, by and between Express, Inc., Express, LLC and Timothy Baxter (incorporated by reference to Exhibit 10.1 to the Current Report on Form 8-K, filed with the SEC on September 11, 2023). | ||||||||
| Employment Agreement, dated September 6, 2023, by and among Express, Inc., Express, LLC and Stewart Glendinning (incorporated by reference to Exhibit 10.2 to the Current Report on Form 8-K, filed with the SEC on September 11, 2023). | ||||||||
| Form of Employment Inducement Award Agreement (Performance-Based Restricted Stock Units) (incorporated by reference to Exhibit 99.1 to the Form S-8, filed with the SEC on October 11, 2023). | ||||||||
31.1* | Certification pursuant to Section 302 of the Sarbanes-Oxley Act of 2002. | |||||||
31.2* | Certification pursuant to Section 302 of the Sarbanes-Oxley Act of 2002. | |||||||
32.1* | Certification pursuant to Section 906 of the Sarbanes-Oxley Act of 2002. | |||||||
| 101.INS* | Inline XBRL Instance Document (the instance document does not appear in the Interactive Data File because its XBRL tags are embedded within the Inline XBRL document). | |||||||
| 101.SCH* | Inline XBRL Taxonomy Extension Schema Document. | |||||||
| 101.CAL* | Inline XBRL Taxonomy Extension Calculation Linkbase Document. | |||||||
| 101.DEF* | Inline XBRL Taxonomy Extension Definition Linkbase Document. | |||||||
| 101.LAB* | Inline XBRL Taxonomy Extension Label Linkbase Document. | |||||||
| 101.PRE* | Inline XBRL Taxonomy Extension Presentation Linkbase Document. | |||||||
| 104* | Cover Page Interactive Data File (formatted as Inline XBRL and contained in Exhibit 101). | |||||||
| * Filed herewith. | ||||||||
EXPRESS, INC. | Q3 2023 Form 10-Q | 50
SIGNATURES
Pursuant to the requirements of the Securities Exchange Act of 1934, the registrant has duly caused this report to be signed on its behalf by the undersigned, thereunto duly authorized.
| Date: | December 7, 2023 | EXPRESS, INC. | |||||||||
| By: | /s/ Mark Still | ||||||||||
| Mark Still | |||||||||||
| Senior Vice President, Interim Chief Financial Officer and Treasurer (Principal Financial Officer and Authorized Signatory) | |||||||||||
EXPRESS, INC. | Q3 2023 Form 10-Q | 51