UNITED STATES
SECURITIES AND EXCHANGE COMMISSION
Washington, D.C. 20549
FORM
(Mark One)
ANNUAL REPORT PURSUANT TO SECTION 13 OR 15(d) OF THE SECURITIES EXCHANGE ACT OF 1934 |
For the fiscal year ended
OR
TRANSITION REPORT PURSUANT TO SECTION 13 OR 15(d) OF THE SECURITIES EXCHANGE ACT OF 1934 FOR THE TRANSITION PERIOD FROM TO |
Commission File Number
(Exact name of Registrant as specified in its Charter)
(State or other jurisdiction of incorporation or organization) |
(I.R.S. Employer Identification No.) |
(Address of principal executive offices) |
(Zip Code) |
Registrant’s telephone number, including area code: (
Securities registered pursuant to Section 12(b) of the Act:
Title of each class |
|
Trading Symbol(s) |
|
Name of each exchange on which registered |
|
|
Securities registered pursuant to Section 12(g) of the Act: None
Indicate by check mark if the Registrant is a well-known seasoned issuer, as defined in Rule 405 of the Securities Act.
Indicate by check mark if the Registrant is not required to file reports pursuant to Section 13 or Section 15(d) of the Act. Yes ☐
Indicate by check mark whether the Registrant: (1) has filed all reports required to be filed by Section 13 or 15(d) of the Securities Exchange Act of 1934 during the preceding 12 months (or for such shorter period that the Registrant was required to file such reports), and (2) has been subject to such filing requirements for the past 90 days.
Indicate by check mark whether the Registrant has submitted electronically every Interactive Data File required to be submitted pursuant to Rule 405 of Regulation S-T (§232.405 of this chapter) during the preceding 12 months (or for such shorter period that the Registrant was required to submit such files).
Indicate by check mark whether the registrant is a large accelerated filer, an accelerated filer, a non-accelerated filer, a smaller reporting company, or an emerging growth company. See the definitions of “large accelerated filer,” “accelerated filer,” “smaller reporting company,” and “emerging growth company” in Rule 12b-2 of the Exchange Act.
|
☒ |
|
Accelerated filer |
|
☐ |
|
Non-accelerated filer |
|
☐ |
|
Smaller reporting company |
|
|
Emerging growth company |
|
|
|
|
|
If an emerging growth company, indicate by check mark if the registrant has elected not to use the extended transition period for complying with any new or revised financial accounting standards provided pursuant to Section 13(a) of the Exchange Act. ☐
Indicate by check mark whether the registrant has filed a report on and attestation to its management’s assessment of the effectiveness of its internal control over financial reporting under Section 404(b) of the Sarbanes-Oxley Act (15 U.S.C. 7262(b)) by the registered public accounting firm that prepared or issued its audit report.
If securities are registered pursuant to Section 12(b) of the Act, indicate by check mark whether the financial statements of the registrant included in the filing reflect the correction of an error to previously issued financial statements.
Indicate by check mark whether any of those error corrections are restatements that required a recovery analysis of incentive-based compensation received by any of the registrant’s executive officers during the relevant recovery period pursuant to §240.10D-1(b). ☐
Indicate by check mark whether the Registrant is a shell company (as defined in Rule 12b-2 of the Exchange Act). Yes ☐ No
As of June 30, 2023, the aggregate market value of the registrant’s common stock held by non-affiliates of the registrant was $
DOCUMENTS INCORPORATED BY REFERENCE
Portions of the registrant’s definitive Proxy Statement relating to its 2024 Annual Meeting of Stockholders to be filed with the SEC within 120 days after the end of the fiscal year ended December 31, 2023 are incorporated herein by reference in Part III.
Table of Contents
|
|
Page |
PART I |
|
|
Item 1. |
6 |
|
Item 1A. |
18 |
|
Item 1B. |
38 |
|
Item 1C. |
38 |
|
Item 2. |
39 |
|
Item 3. |
39 |
|
Item 4. |
39 |
|
|
|
|
PART II |
|
|
Item 5. |
40 |
|
Item 6. |
41 |
|
Item 7. |
Management’s Discussion and Analysis of Financial Condition and Results of Operations |
42 |
Item 7A. |
63 |
|
Item 8. |
64 |
|
Item 9. |
Changes in and Disagreements With Accountants on Accounting and Financial Disclosure |
64 |
Item 9A. |
64 |
|
Item 9B. |
65 |
|
Item 9C. |
Disclosure Regarding Foreign Jurisdictions that Prevent Inspections |
65 |
|
|
|
PART III |
|
|
Item 10. |
66 |
|
Item 11. |
66 |
|
Item 12. |
Security Ownership of Certain Beneficial Owners and Management and Related Stockholder Matters |
66 |
Item 13. |
Certain Relationships and Related Transactions, and Director Independence |
66 |
Item 14. |
66 |
|
|
|
|
PART IV |
|
|
Item 15. |
67 |
|
Item 16. |
70 |
2
Glossary of Selected Terminology
The following terms are used in this Annual Report, unless otherwise noted or indicated by the context:
Certain monetary amounts, percentages, and other figures included in this Annual Report on Form 10-K (“Annual Report”) have been subject to rounding adjustments. Percentage amounts included in this Annual Report have not in all cases been calculated on the basis of such rounded figures, but on the basis of such amounts prior to rounding. For this reason, percentage amounts in this Annual Report may vary from those obtained by performing the same calculations using the figures in our consolidated financial statements included elsewhere in this Annual Report. Certain other amounts that appear in this Annual Report may not sum due to rounding.
Cautionary Notice Regarding Forward-Looking Statements
This Annual Report contains “forward-looking statements” within the meaning of the Private Securities Litigation Reform Act of 1995. These forward-looking statements reflect our current views with respect to, among other things, our operations and financial performance. Forward-looking statements include all statements that are not historical facts. These forward-looking statements are included throughout this Annual Report and relate to matters such as our industry, business strategy, goals and expectations concerning our market position, future operations, margins, profitability, capital expenditures, liquidity and capital resources and other financial and operating information. In some cases, you can identify these forward-looking statements by the use of words such as “anticipate,” “assume,” “believe,” “continue,” “could,” “estimate,” “expect,” “intend,” “may,” “plan,” “potential,” “predict,” “project,” “future,” “will,” “seek,” “foreseeable,” the negative version of these words, or similar terms and phrases.
These forward-looking statements are subject to various risks, uncertainties, assumptions or changes in circumstances that are difficult to predict or quantify. These factors should not be construed as exhaustive and should be read in conjunction with the other cautionary statements that are included in this Annual Report. Should one or more of these risks or uncertainties materialize, or should any of our assumptions prove incorrect, our actual results may vary in material respects from those projected in these forward-looking statements. Factors or events that could cause our actual results to differ may emerge from time to time, and it is not possible for us to predict all of them. We may not actually achieve the plans, intentions or expectations disclosed in our forward-looking statements and you should not place undue reliance on our forward-looking statements. Our forward-looking statements do not reflect the potential impact of any future acquisitions, mergers, dispositions, joint ventures, investments or other strategic transactions we may make.
For additional information on these and other factors that could cause First Advantage’s actual results to differ materially from expected results, please see “Risk Factors” in Part I, Item 1A. in this Annual Report, as such factors may be updated from time to time in our periodic filings with the SEC, which are accessible on the SEC’s website at www.sec.gov. The forward-looking statements included in this Annual Report speak only as of the date of this Annual Report, and we undertake no obligation to publicly update or review any forward-looking statement, whether as a result of new information, future developments, or otherwise, except as required by law.
3
Summary Risk Factors
Our business is subject to numerous risks and uncertainties, including those described in Part I, Item 1A. “Risk Factors” in this Annual Report. You should carefully consider these risks and uncertainties when investing in our common stock. The principal risks and uncertainties affecting our business include the following:
4
Trademarks, Service Marks, and Tradenames
We own a number of registered and common law trademarks and pending applications for trademark registrations in the United States and other countries, including, for example: First Advantage, Profile Advantage, Enterprise Advantage, Insight Advantage, Verified!, HEAL, RoadReady, and Corporate Screening, among others. Unless otherwise indicated, all trademarks, tradenames, and service marks appearing in this Annual Report are proprietary to us, our affiliates, and/or licensors. This Annual Report also contains trademarks, tradenames, and service marks of other companies, which are the property of their respective owners. Solely for convenience, the trademarks, tradenames, and service marks referred to in this Annual Report may appear without the ® and TM symbols, but such references are not intended to indicate, in any way, that we will not assert, to the fullest extent under applicable law, our rights or the rights of the applicable licensors to these trademarks, tradenames, and service marks. We do not intend our use or display of other parties’ trademarks, tradenames, or service marks to imply, and such use or display should not be construed to imply, a relationship with, or endorsement or sponsorship of us by, these other parties.
5
PART I
Item 1. Business.
Our Company
First Advantage is a leading provider of employment background screening, identity, and verification solutions. We deliver innovative services and insights that help our customers manage risk and hire the best talent. Enabled by our proprietary technology, we help companies protect their brands and provide safer environments for their customers and their most important resources: employees, contractors, contingent workers, tenants, and drivers.
We manage one of the earliest and most important interactions between an applicant and our customer. Most applicants view their screening experience as a reflection of the hiring organization and its onboarding process. Our comprehensive product suite includes criminal background checks, drug / health screening, extended workforce screening, biometrics and identity, education / work verifications, resident screening, fleet / driver compliance, executive screening, data analytics, continuous monitoring, social media monitoring, and hiring tax incentives. We derive a substantial majority of our revenues from pre-onboarding screening and perform screens in over 200 countries and territories, enabling us to serve as a one-stop-shop provider to both multinational companies and growth companies. In 2023, we performed approximately 100 million screens on behalf of more than 30,000 customers spanning the globe and all major industry verticals. We often have multiple stakeholders within our customers, including Executive Management, Human Resources, Talent Acquisition, Compliance, Risk, Legal, Safety, and Vendor Management, who rely on our products and solutions.
We seek to grow market share by focusing on high volume hiring industries and companies, increasing our share with existing customers, upselling and cross-selling new products and solutions, and winning new customers.
Our verticalized go-to-market strategy delivers highly relevant solutions for targeted industry sectors. This approach enables us to build a diversified customer portfolio and effectively serve many of the largest, most sophisticated, and fastest-growing companies in the world. We have built a powerful and efficient customer-centric sales model fueled by frequent engagement with our customers and deep subject matter expertise in industry-specific compliance and regulatory requirements, which allows us to create tailored solutions and drive consistent upsell and cross-sell opportunities. Our sales engine is powered by dedicated Sales and Solutions Engineering professionals working alongside Customer Success team members who have successfully maintained high customer satisfaction, retention, and growth, as evidenced by our industry-leading net promoter score (“NPS”), average 12-year tenure of our top 100 customers, and gross retention rate of approximately 97% as of December 31, 2023. Our go-to-market strategy continues to drive particular strength with Enterprise customers in sectors with attractive secular trends such as e-commerce, retail, transportation, warehousing, healthcare, and staffing.
We have designed our technology to be highly configurable, scalable, and extensible. Our platform is embedded in our customers’ core enterprise workflows and interfaces with more than 75 third-party Human Capital Management (“HCM”) software platforms, including Applicant Tracking Systems (“ATS”), providing us with real-time visibility and input into our customers’ human resources processes. We leverage our proprietary internal databases—which include over 765 million criminal, education, and work history observations as of December 31, 2023—and an extensive and highly curated network of more than 3,900 automated and/or integrated third-party data providers and robotic process automation (“RPA”) bots. Third-party data providers include federal, state, and local government entities; court runners; drug and health testing labs and collection sites; credit bureaus; and education and work history data providers. Our platform efficiently and intelligently integrates data from these proprietary internal databases as well as external data sources using automation, APIs, and machine learning. Our investments in RPA further enables rapid turnaround times. For example, in 2023 alone, approximately 90% of our criminal searches in the United States were completed within one day. Our platform prioritizes data privacy and compliance and is powered by robust compliance functionality. This enables us to address each customer’s unique requirements in an efficient and automated manner while also ensuring compliance with complex data usage guidelines and regulatory requirements across global jurisdictions and industry-specific regulatory frameworks.
Our focus on innovative products and technologies has been critical to our growth. Using agile software development methodologies, we have consistently enhanced existing products and been early to market with new and innovative products, including offerings for biometrics and identity, continuous criminal monitoring, extended workforce screening, and instant oral drug testing. In addition, we continue to expand our proprietary internal databases that extend our competitive advantage, enhance turnaround times for customers, and offer potential future monetization upside opportunities. Our hundreds of millions of criminal, education, and work history records in our proprietary internal databases, amassed and curated over many years, accelerate screening turnaround times and reduce costs by using internal data sources before accessing third-party data sources or performing a manual verification.
6
Pending Acquisition of Sterling Check Corp.
On February 28, 2024, we entered into an Agreement and Plan of Merger (the “Merger Agreement”), by and among First Advantage, Sterling Check Corp., a Delaware corporation (“Sterling”), and Starter Merger Sub, Inc., a Delaware corporation and an indirect, wholly owned subsidiary of First Advantage (“Merger Sub”). The Merger Agreement provides that, upon the terms and subject to the conditions set forth therein, Merger Sub will be merged with and into Sterling, with Sterling continuing as the surviving corporation in such merger and becoming an indirect, wholly owned subsidiary of First Advantage. The cash-and-stock transaction (the “Acquisition”) values Sterling at approximately $2.2 billion.
In connection with the execution of the Merger Agreement, First Advantage Holdings, LLC, a subsidiary of the Company (the “Borrower”), entered into a commitment letter with certain financial institutions that committed to provide, subject to the terms and conditions of the commitment letter, an incremental term loan in an aggregate principal amount of $1.820 billion and incremental revolving commitments in an aggregate principal amount of $150 million, in each case, under the Borrower’s existing credit agreement. Such financial institutions also agreed to extend the maturity date of the Borrower’s revolving credit facility from July 31, 2026 to the date that is the fifth anniversary of the closing date of the Acquisition.
The Acquisition is subject to satisfaction or waiver of customary closing conditions, including, among others, adoption of the Merger Agreement by Sterling stockholders, the expiration or termination of the waiting period under the Hart-Scott-Rodino Antitrust Improvement Act of 1976 (the “HSR Act”) and clearance under the antitrust or foreign direct investment laws of certain other jurisdictions, and the effectiveness of a registration statement on Form S-4 to be filed by First Advantage in connection with the Acquisition.
Our Market Opportunity
The importance of human capital and its associated risks to brand, reputation, safety, and compliance are ever-increasing in today’s interconnected, fast-paced world. Along with broader environmental, social, and governance (“ESG”) considerations, these issues increasingly have become priorities at the highest executive and oversight levels of our customers worldwide. Key constituents, including C-Suite executives, boards of directors, external auditors, business owners, property managers, educators, volunteer organizations, and franchisors all face a heightened level of public scrutiny and accountability. Significant technological and societal trends include fraud and cyber-attacks; sexual harassment and workplace violence; and the prevalence of social media impacting companies’ brands. These have driven a significant increase in the need for screening, verifications, and ongoing monitoring. Our products and solutions are critical tools that companies depend on to provide safer environments for their customers and workers, maintain regulatory compliance, and protect their property, reputation, and brands.
We believe several key trends are generating significant growth opportunities in our markets and increasing demand for our products and solutions:
7
8
Our Growth Strategy
We intend to continue to grow our business profitably by pursuing the following strategies:
9
The First Advantage Product Suite
Our comprehensive product suite enables our customers across all industry sectors to perform pre-onboarding screening and post-onboarding monitoring of employees, contractors, contingent workers, tenants, and drivers. We generally classify our products and solutions into three categories: pre-onboarding, post-onboarding, and adjacent products, each of which is enabled by our technology, proprietary internal databases, and data analytics capabilities. Historically, we have derived a substantial majority of our revenues from pre-onboarding products and solutions.
Pre-Onboarding
We offer an extensive array of products and solutions that customers utilize to enhance their applicant evaluation process, ensure compliance from the time applicant information is initially requested and submitted to an applicant’s successful onboarding, and enhance workplace safety. Our technology is flexibly tailored to each customer’s requirements, which could include a wide array of search categories such as Social Security number verification, education and employment verification, federal criminal checks, statewide criminal checks, country criminal checks, sex offender registry, and global sanctions. Our pre-onboarding products include:
10
Post-Onboarding
Companies face a heightened responsibility to ensure safety and comply with laws, regulations, and licensing requirements after the initial screening and onboarding of an applicant. To assist those needs, we provide our customers with continuous monitoring and re-screening solutions that are important tools to help keep their end customers, workforces, and other stakeholders safe, productive, and compliant. Continuous monitoring solutions allow customers to be proactively alerted as soon as relevant information, which may require immediate attention and action, becomes available. Our post-onboarding solutions include:
Adjacent Products
We also offer adjacent products that complement our pre-onboarding and post-onboarding products and solutions:
Our suite of products is available individually or through packaged solutions configured and tailored according to our customers’ needs. For example, through our RoadReady solution, we provide comprehensive driver and fleet solutions to assist with compliance and asset management. Our driver compliance products include pre-onboarding background checks, MVRs, drug tests, driver files, and post-onboarding monitoring. Our asset management products related to vehicle compliance include title management, registration, fuel and gas tax, permits, transponder management, and ongoing data analytics.
Analytics Through Insight Advantage
In addition to the products described above, we provide customers with actionable, data-driven analytics and insights that help inform decisions related to human capital more generally, as well as optimize their screening programs. We deliver these insights and analytics through Insight Advantage. This powerful and dynamic tool enables customers to analyze their program’s performance and benchmark it against industry data, such as hiring volumes by geography, as well as evaluate their screening program against industry best practices. Our customers can also identify the scope of the pool of qualified applicants in a specified geography, which informs their decision as to whether to expand operations in such geography. In addition, our customers can dynamically adjust the stringency of their screening criteria to view and assess the expected impact on hire rates, turnaround times, and screening costs. Insight Advantage’s dashboard reports and real-time queries help customers quickly identify opportunities to remedy potential issues before they may impact their screening and onboarding process. We believe our ability to provide these data-driven insights, enabled by our sophisticated and differentiated technology, sets us apart from our competitors.
11
Our Differentiated Technology
Background screening involves complex workflows, disparate internal and external data sources, and numerous integrations with third-party software providers. We believe our differentiated technology provides us with a strong competitive advantage. Our front-end technology, including our powerful UI/UX design, creates a superior applicant and customer experience, leveraging artificial intelligence (“AI”) and machine learning to optimize workflows and minimize applicant data capture errors and missing information. Our back-end technology and processing engine seamlessly integrate interactions with customer HCM platforms and other software, government, and third-party data sources, as well as internal Operations and Customer Care teams. We have been, and will continue to be, pioneers in using automation and intelligent routing technologies to optimize turnaround times, quality, and touchless end-to-end screening. Our compliance functionality governs all aspects of our technology and is designed to meet ever-changing global regulatory and compliance requirements.
Our customers and their applicants access our technology through intuitive, easy-to-use user interfaces – Profile Advantage, Enterprise Advantage, and Insight Advantage.
We have designed our technology architecture for extensibility. We receive data directly from the applicant through Profile Advantage and from our customers through their third-party HCM and ATS software platforms. This data is supplemented by our proprietary internal databases and external data sources as we perform screenings and verifications. Our proprietary internal databases of over 765 million records include our National Criminal Records File, which includes approximately 655 million criminal records with thousands of new records added daily, and Verified!, our repository of nearly 110 million prior education and work history records. These proprietary internal databases allow us to complete our processes quickly and cost-effectively, which accelerates the onboarding process for our customers and improves the applicant experience. We also obtain data directly from federal, state, and local government entities, laboratories and collection sites, credit bureaus, and education and work history verification providers, as well as from third-party, independent compilers of public records. Our API integrations, either through our Standard API or our REST API, allow for real-time, bidirectional, and secure data flows between us and our customers’ software platforms and external data sources, creating a seamless and integrated screening process. Our technology interfaces with more than 75 third-party HCM and ATS software platforms and more than 3,900 automated and/or integrated external data providers and RPA tools to deliver results to our customers with high speed and consistency.
Background screening and verification requirements vary from customer to customer, depending on the size and geographic footprint of the business as well as the industry vertical in which the customer operates. For example, customers in the transportation, logistics, and home delivery industry may have screening requirements relating to transportation regulatory bodies, including the DOT, FMCSA, FAA, and IFTA, that customers in other industries do not require. In addition, the laws and regulations on the use of certain information vary significantly from jurisdiction to jurisdiction and are constantly evolving. We have designed our technology to be highly configurable, allowing us to provide our customers with tailored solutions that meet their specific needs.
12
Our flexible, scalable, and highly integrated technology, enhanced by our investments in automation and AI, has driven significant operational efficiencies and enabled us to achieve one of the highest customer satisfaction ratings among our competitors for quality, accuracy, and turnaround times. We will continue to innovate using agile software development methodologies, focusing on user-centered design, to bring leading products and solutions to the market.
Sales and Marketing
We believe we have a differentiated, verticalized sales, customer success, and marketing approach that sets us apart from our competitors and positions us to capture additional market share. Our Sales team is vertically aligned and organized into groups that target new accounts and additional opportunities within existing accounts. We train and educate our sales professionals to ensure they are highly knowledgeable in the industry-specific screening requirements and can deliver value-added, industry-targeted solutions to existing and new customers.
Our Sales team is augmented by Customer Success professionals, who are similarly organized to deliver solutions specific to existing customers within each industry vertical. Our Customer Success team members are located across geographies to foster deep relationships with customers and build local expertise in compliance and screening standards. Our Customer Success teams maintain ongoing interactions with key customer users and program owners and hold regular formal customer account reviews to ensure high performance, satisfaction, and retention. They also organize our customer advisory boards and events to uncover product insights, drive product innovation, and share screening and compliance best practices with our customers. This further drives our industry-leading customer satisfaction scores and high customer retention rates and helps us identify and execute additional opportunities with existing customers.
We believe the extensive coordination between our Sales, Customer Success, and Product teams is a driving force behind our continued expansion. These teams also enhance our value proposition by working closely with our Compliance, Marketing, Solutions Engineering, and Business Development teams.
Our relationships with HCM software providers are an important aspect of our Sales and Marketing strategy. Our technology is tightly integrated with major HCM and ATS platforms, which offers greater speed and efficiency and enhances the value of our solutions to our customers. Maintaining a strong relationship with these third-party software providers is critical in generating new sales leads and providing market validation to our offerings.
We also market our products and solutions through indirect channels, including traditional and online marketing activities designed to provide sales leads, increase market awareness, and enhance the perception of our brand and offerings. We leverage referral partners, channel partnerships, digital advertising, search engine optimization, webinars, social media, thought leadership, and various event-based marketing. We participate in industry conferences and are published frequently in the industry press. Additionally, our annual customer conference, Collaborate has featured presentations by subject matter experts and our customers on a wide range of industry topics. Collaborate facilitates discussions and serves as a great resource on industry best practices. We believe we are able to capitalize on the network effects as we build goodwill through customer reviews and testimonials, word-of-mouth referrals, and references from other industry participants.
Customers
We serve a diversified customer base with more than 30,000 customers globally in 2023. Our customer base ranges from small businesses with fewer than 100 employees to multinational corporations with workforces numbering in the hundreds of thousands. We have executed a concerted go-to-market strategy to target customers with large, complex workforces and have built a leading customer portfolio in this area as a result. While our customers operate in diverse industries across almost all facets of the global economy, we have strength in sectors with favorable secular trends such as e-commerce, retail, transportation, warehousing, and healthcare. We have maintained a gross retention rate of approximately 97% in 2023 and achieved an average tenure of 12 years amongst our top 100 customers.
For the year ended December 31, 2023, we had one customer that accounted for approximately 12% of our revenues. No other customer accounted for 10% or more of our total revenues for such period. As of December 31, 2023, we performed screens in over 200 countries and territories, with a major presence in the United States, the United Kingdom, and India. Approximately 87% of our total revenues for the year ended December 31, 2023 were derived from our Americas business.
13
Competition
The global background screening and verifications industry is fragmented and competitive. There are many local, single-country companies but few multinational companies that operate with scale and reach. Our competitors vary based on customer size, industry vertical, geography, and product focus.
We compete with large players with broad capabilities and product suites, vertical-focused specialist firms that target customers operating in select industries, mid-size players and competitors that serve small and medium-sized business (“SMB”) customers. Some competitors are aligned to a specific product in certain pre- and post-onboarding product lines, such as drug / health screening and executive screening. In our adjacent products market, we compete with certain companies specializing in fleet / vehicle compliance, hiring tax credits and incentives, resident / tenant screening, employment eligibility, and investigative research.
The market for our products and solutions is subject to constant change, sources of competition are numerous, and new competitors frequently arise.
The principal competitive factors affecting our markets include:
We believe we compete favorably based on these factors. However, our ability to remain competitive will depend on our continued ability to perform in the areas listed above. For additional information, see “Risk Factors—Risks Related to Our Business—We operate in a penetrated and competitive market.”
14
Government Regulations
Due to the nature of our business, we are subject to significant and extensive U.S. federal, state, local, and foreign laws and regulations. These laws and regulations include national, international, state, and local cybersecurity, privacy and data protection, health, taxation, anti-corruption and anti-money laundering, antitrust / competition, enterprise credit reporting agencies and environmental, health and safety protection. Taking commercially reasonable steps to comply with such laws and regulations is an important priority for us.
Regulators worldwide have adopted or proposed national, international, state, and local laws that regulate consumer protection, cybersecurity, privacy, data protection, and/or business credit reporting. These laws impact, among other things, the collection, use, disclosure, sale, transfer, receipt, storage, transmission, destruction, and other processing of personal data (collectively, “Processing”). The principal laws and regulations that impact our business include, but are not limited to:
These laws and regulations, which are generally designed to protect individuals’ privacy and prevent the misuse of personal data or unauthorized access to data, are complex, subject to ongoing changes in regulations and amendments, and inconsistent between jurisdictions. We proactively manage our compliance with laws and regulations through the use of a number of resources, including our in-house legal and compliance department, external law firms, trade associations, and local suppliers and partners to understand the legal and regulatory requirements and practices that may impact the delivery of our products and solutions as well as our customers’ use of the same in light of employment, privacy and other laws and regulations. Our General Counsel leads our legal department with a Chief Global Compliance Officer reporting to the General Counsel. The compliance team consists of four regional compliance officers globally, with local compliance officers reporting through that hierarchy. Through the legal and compliance functions, we train our team members with respect to compliance with our policies and procedures, monitor changes to relevant material laws and regulations, and meet with regulators and legislators, as necessary and appropriate, to establish transparency of our operations and build trust.
Public concern is high with respect to the processing of personal data, including Social Security numbers, financial information, and medical information. In the future, additional legislative or regulatory efforts in the United States and internationally could further regulate the processing of personal data that we process in the conduct of our business. For additional information, see the section titled “Risk Factors—Risks Related to Our Business—If regulatory regimes continue to heighten their scrutiny over personal data and data security, it could lead to increased restrictions, loss of revenue opportunity, greater costs of compliance, and lost efficiency” and “— Any damage to our reputation or our brand could adversely affect our business, financial condition, and results of operations.”
15
Intellectual Property
Our success depends, in part, on developing, maintaining, protecting and enforcing our proprietary technology and intellectual property rights. We own and control various intellectual property rights, such as confidential information, trade secrets, trademarks, service marks, trade names, domain names, copyrights, patents, and U.S. and foreign registrations and applications in the foregoing. We are licensed to use certain technology and other intellectual property rights owned and controlled by others, and certain third parties are licensed to use certain technology and other intellectual property rights owned and controlled by us.
Obtaining, maintaining, protecting and enforcing our intellectual property and proprietary rights is an important aspect of our business. We rely on a combination of statutory (e.g., copyright, trademark, trade secret, patent), contract, and liability safeguards (e.g., confidentiality and invention assignment agreements with our employees and contractors and nondisclosure agreements with our vendors) to protect our intellectual property in the United States, and other jurisdictions. We currently have patent and trademark applications pending in several jurisdictions. Filing these applications does not guarantee patents will be issued or that our trademark applications will proceed to registration without challenge, but may provide us with legal defense and allow us to pursue the protection of our intellectual property to the extent we believe it would be beneficial and cost-effective.
While we believe that our intellectual property, in the aggregate, is generally important to our business and operations, we do not regard any aspect of our business as being dependent upon any single patent, group of patents or other intellectual property right. However, the First Advantage name and related trade names, marks, and logos are of material importance to our business, and their loss could have a significant negative impact on us.
See the section titled “Risk Factors” for a more comprehensive description of risks related to our intellectual property and proprietary rights.
Seasonality
We experience seasonality with respect to certain industries due to fluctuations in hiring volumes and other economic activity. For example, pre-onboarding revenues generated from our customers in the retail and transportation industries are historically highest during the months of October and November, leading up to the U.S. holiday season and lowest in December and at the beginning of the new year, following the U.S. holiday hiring season. Certain customers across various industries also historically increase their hiring throughout the second quarter of the year as winter concludes, commercial activity tied to outdoor activities increases, and the school year ends, giving rise to student and graduate hiring. We expect that further growth in e-commerce, the continued digital transformation of the economy, and other economic forces may impact future seasonality, but we are unable to predict these potential shifts and how our business may be impacted.
Human Capital
Central to our strategy is attracting, developing and retaining the best talent globally with the right skills to drive our success. The capabilities of the Company’s workforce have continued to evolve along with its business and strategy. Key focus areas of the Company’s human capital management strategy are described below, and additional information can be found in its Sustainability Report, available on the Company’s website (which is not incorporated by reference herein).
As of December 31, 2023, we had approximately 5,000 employees in 17 countries. Our workforce also engages third-party contractors as an ongoing part of our business where appropriate. None of our employees are subject to a collective bargaining agreement, and no work stoppages have been experienced. We consider our relationship with our employees to be good.
Global Code of Conduct and Ethics
The quality of our products and operations affects our reputation, productivity, profitability, and market position. Our objective is to create a work environment that allows and encourages all employees to perform their duties in an efficient, effective manner. We have established a Global Code of Conduct and Ethics (“Code”). Compliance with the provisions of the Code is a basic condition of employment at First Advantage.
Equal Employment
We strive for all of our employees to work in an environment where we are treated with dignity and respect. We are an equal opportunity employment employer and are committed to providing a workplace that is free of discrimination of all types from abusive, offensive, or harassing behavior. We are committed to creating such an environment because it brings out the full potential in each of our employees, which, in turn, contributes directly to our business success.
16
Diversity, Equity, and Inclusion
The success of our Company and the value we can provide to our customers lies in the strength of our global inclusive workforce. We are committed to enhancing diversity among our workforce and demonstrating that commitment to our employees, customers, and community. We maintain active, dynamic diversity, equity, and inclusion (“DE&I”) programs that continue to promote an environment that celebrates each individual and aims to provide for equitable opportunity. Our efforts to promote DE&I include, among other things, our (1) talent attraction programs and practices to provide equal employment opportunities for all applicants and employees, such as implementing strategies to build diverse candidate pools and pipelines and promoting equitable recruitment and hiring practices, (2) employee development and training and (3) efforts building an inclusive business culture, through mentoring and inclusivity programs.
We promote diversity by developing policies, programs, and procedures that foster a work environment where differences are respected and all employees are treated fairly. We act on, and believe that, promoting diversity plays an important role in attracting the most expansive pool of qualified applicants, fostering greater innovation and creativity, and enhancing our communication and relationships with all of our stakeholders. Our goal is to attract, develop, and retain the best and brightest from all walks of life and backgrounds. This requires an organization to have a culture of inclusion where all individuals feel respected, are treated fairly, and are provided work-life balance and an opportunity to excel in their chosen careers.
Supplier Diversity
We are committed to developing mutually beneficial relationships with small, minority-owned, women-owned, disadvantaged, veteran-owned, HUBZONE, LGBTQIA, and local business enterprises. Our supplier diversity policy reflects our desire to create an opportunity for suppliers to market their products to the Company. When all business considerations are determined to be equal among competitive suppliers, the Company will award contracts to such businesses.
Additional Information
First Advantage Corporation, a Delaware corporation, was incorporated in November 2019. We completed our initial public offering (“IPO”) of our common stock in June 2021.
We use our websites (https://fadv.com/ and https://investors.fadv.com/) to distribute company information. We make available free of charge a variety of information for investors, including our Annual Report on Form 10-K, quarterly reports on Form 10-Q, current reports on Form 8-K, and any amendments to those reports, as soon as reasonably practicable after we electronically file that material with or furnish it to the Securities and Exchange Commission (“SEC”). The information we post on our websites may be deemed material. Accordingly, investors should monitor our websites, in addition to following our press releases, filings with the SEC, and public conference calls and webcasts. In addition, you may opt in to automatically receive email alerts and other information about First Advantage when you enroll your email address by visiting the “Email Alerts” section of our investor website at https://investors.fadv.com/. The contents of our websites and social media channels are not, however, a part of this Annual Report.
17
Item 1A. Risk Factors.
You should carefully consider the following risk factors and all of the information contained in this Annual Report. If any of the following risks occur, our business, financial condition, and results of operations could be materially and adversely affected.
Risks Related to Our Business
Macroeconomic factors beyond our control, including the state of the economy, could impact demand and the fulfillment costs for our products and solutions.
Macroeconomic developments such as the global or regional economic effects resulting from inflation and related economic curtailment initiatives, interest rate volatility, foreign exchange rate fluctuations, geopolitical developments, wars in Europe and the Middle East, evolving trade policies between the U.S. and international trade partners, or the occurrence of similar events in other countries that lead to uncertainty or instability in economic, political, or market conditions could negatively affect our business, operating results, financial condition, and outlook.
In addition, international, regional, or domestic political unrest and the related potential impact on global stability, terrorist attacks, and the potential for other hostilities in various parts of the world, public health crises, and natural disasters continue to contribute to a climate of economic and political uncertainty that could adversely affect our results of operations and financial condition, including our revenue growth and profitability.
Global credit and capital markets have experienced significant volatility and disruption due to the above factors. A substantial majority of our revenues are derived from pre-onboarding screening products, which is heavily influenced by hiring volumes. The businesses of some of our largest customers and their decision to hire depend in part on favorable macroeconomic conditions, including consumer spending, the general availability of credit, the level and volatility of interest rates, and inflation levels. To the extent these macroeconomic factors are at suboptimal levels, our existing and potential customers could delay or defer onboarding new or replacement workers, reduce the size of their workforce, or seek to decrease spending on their screening programs. As a result, our products could face reduced demand and our business, results of operations, and financial condition could slow or decline. Similarly, demand for our tenant screening products is subject to trends in real estate rental markets, which may be affected by macroeconomic factors beyond our control, including housing markets, stock market volatility, recession, job losses and unemployment levels, debt levels, and uncertainty about the future.
We operate in a highly regulated industry and are subject to numerous and evolving laws and regulations.
As a provider of technology solutions for screening and verifications, we are subject to numerous and evolving international, federal, state, and local laws and regulations, including, without limitation, in the areas of consumer protection, privacy, and data protection. See “Business—Government Regulations” and “—Continued scrutiny of collection, use, and processing of personal data and data security could lead to increased restrictions, loss of revenue opportunity, greater costs of compliance, and lost efficiency.” We expect that these laws and regulations will continue to evolve, change, and expand and, in most instances, become more stringent and complex with time. Compliance with these laws and regulations requires significant expense and resources, which could increase significantly as these laws and regulations evolve. Further, regulations are often the product of administrative interpretation and judicial construction, which could result in inconsistent implementation across jurisdictions. We must reconcile the many potential differences between the laws and regulations among the various domestic and international jurisdictions that may be involved in the provision of our solutions. A failure to identify, comply, and reconcile the many laws and regulations we are subject to could result in the imposition of penalties and fines, restrictions on our operations, breach of contract or indemnification claims against us, loss of revenues, and could otherwise adversely affect our business, results of operations, and financial condition. Further, we acquired a company in 2013 that was subject to multiple FTC consent decrees that had been imposed on it in the years prior to our acquisition and to which we now remain subject. The consent decrees require us to comply with the FCRA and to maintain a comprehensive information security program to be audited biennially. Under these circumstances, failure to comply with the decrees and/or relevant law or regulations may subject us to increased risk.
18
Changes in laws, regulations, and the interpretation of such laws and regulations on both the state and federal level could also affect certain of our businesses and result in restrictions on our ability to offer certain products and solutions. For example, several states and smaller local jurisdictions have implemented “fair chance” hiring laws or ordinances that limit or restrict employers from inquiring or using an applicant’s criminal history to make employment decisions. In addition, under the FCRA in the United States, both our customers and we are required to comply with many requirements under the FCRA as well as state-level laws regarding the use and delivery of consumer reports. The enactment of new restrictive legislation and the requirements, restrictions, and limitations imposed by changing interpretations and court decisions on such laws and regulations could prevent our customers from using the full functionality of our products, which may reduce demand for our products and solutions. We could also be required to adapt our products to meet these evolving and complex requirements, such as adding or changing disclosures, authorizations, or forms provided to applicants. In addition, we believe it is critical for us to keep abreast of evolving laws and interpretations in applicable jurisdictions and inform our customers of changes to their ability to use our products and solutions and their and our obligations. These efforts require time, expense, and resources, and in some instances, reliance on third parties such as law firms and trade associations.
Continued scrutiny of collection, use, and processing of personal data and data security could lead to increased restrictions, loss of revenue opportunity, greater costs of compliance, and lost efficiency.
Our products and solutions are subject to various complex laws and regulations governing cybersecurity, privacy, and data protection on the federal, state, and local levels, and in foreign jurisdictions. The regulatory framework for privacy issues is rapidly evolving and is likely to remain uncertain and inconsistently enforced for the foreseeable future. Many federal, state, and foreign governmental bodies and agencies have adopted or are considering adopting laws and regulations regarding collecting, processing, handling, maintenance, storage, use, disclosure, sale, and transmission of personal and other sensitive information, including mandatory consumer notification should the unauthorized access of consumer information occur, and further expansion of requirements is possible. It is possible that these restrictions could limit our current or future service offerings, reduce our profitability, or otherwise materially and adversely affect our ability to conduct our business or to do so economically. Further, if our practices or products are perceived to violate applicable laws or regulations, we may be subject to increased scrutiny and public criticism, litigation, investigation, fines, and reputational harm, which could disrupt our business and expose us to liability. Given the nature of our business and the volume data processed in the ordinary course of our operations, it is possible for breaches to occur, whether intentionally from hackers or other third parties, or unintentionally, for example, if we inadvertently send or otherwise make available information to an unauthorized recipient.
In the United States, we are subject to numerous federal and state laws governing the collection, processing, use, transmission, disclosure, and sale of personal data (which may also be referred to as personal information, personally identifiable information, and/or non-public personal information). For example, in California, the CCPA, provides for enhanced consumer protections for California residents, a private right of action for data breaches of certain personal information and statutory fines and damages for such data breaches or other CCPA violations, as well as a requirement of “reasonable” cybersecurity. In addition, in November 2020, California voters passed the California Privacy Rights and Enforcement Act of 2020, which amends and expands the California Consumer Privacy Act with additional data privacy compliance requirements and establishes a regulatory agency dedicated to enforcing those requirements. Other states also have or are in the process of imposing similar privacy obligations. In addition, laws such as the Biometric Information Privacy Act in Illinois have also restricted the use of biometric information. These and other laws and regulations require us to continuously review our data processing practices and policies, may cause us to incur substantial costs with respect to compliance, and could require us to adapt our products and solutions, which may reduce their utility to our customers.
Outside of the United States, we are subject to foreign rules and regulations. For example, we are subject to enhanced compliance and operational requirements under the GDPR, which expanded the scope of data protection in the European Union (“EU”) to foreign companies who process the personal data of EU residents, imposed a strict data protection compliance regime with stringent penalties for noncompliance and included new rights for data subjects such as the “portability” of personal data. In particular, under the GDPR, fines of up to 20 million euros, or up to 4% of the annual global revenue of the noncompliant company, whichever is greater, could be imposed for violations of certain of the GDPR’s requirements. If we were found to be in breach of the GDPR, the potential penalties we might face could have a material adverse impact on our business, financial condition, results of operations, and cash flows. Compliance with the GDPR requires time and expense and may require us to make changes to our business operations.
While the GDPR applies uniformly across the EU, each EU member state is permitted to issue nation-specific data protection legislation, which has created inconsistencies on a country-by-country basis. The decision by the U.K. to leave the EU (“Brexit”) has resulted in a new U.K. data privacy and protection law that essentially tracks the GDPR but is applicable in the U.K. which is no longer a part of the EU. The European Commission has adopted an adequacy decision for the U.K., allowing for transfer of most personal data from the European Economic Area (“EEA”) to the U.K, subject to a “sunset clause,” which limits the duration of adequacy to four years. However, there will likely be increasing scope for divergence in application, interpretation and enforcement of the data protection law as between the U.K. and EEA.
19
The effects of U.S. state, U.S. federal, local, and international laws and regulations that are currently in effect or that may go into effect in the future are significant and may require us to modify our data processing practices and policies, cease offering certain products and solutions, and incur substantial costs and potential liability in an effort to comply with such laws and regulations. Any actual or perceived failure to comply with these and other cybersecurity, privacy, and data protection laws and regulations could result in regulatory scrutiny or investigation and increased exposure to the risk of litigation or the imposition of consent orders, resolution agreements, requirements to take particular actions with respect to training, policies or other activities, and civil and criminal penalties, including fines, which could have an adverse effect on our business, results of operations, and financial condition. Moreover, allegations of non-compliance, whether or not true, could be costly, time-consuming, and distracting to management and cause reputational harm.
We may not be able to identify and successfully implement our growth strategies on a timely basis or at all.
We cannot guarantee that we will succeed in appropriately identifying and successfully executing our strategic plans to grow our businesses, and our inability to do so may be the result of external factors beyond our control. Our ability to grow our business will depend, in large part, on our ability to further penetrate our existing markets, attract new customers, and identify and effectively invest in growing industry verticals. The success of any enhancement of our current products and solutions or any new product or solution depends on several factors, including the timely completion, introduction, and market acceptance of enhanced or new products and solutions, adaptation to new industry standards and technological changes, the ability to maintain and to develop relationships with third parties, and the ability to attract, retain, and effectively train sales and marketing personnel. Our growth could be limited if we fail to innovate or adapt to market trends and product innovations adequately. Any new products and solutions we develop or acquire may not be introduced in a timely or cost-effective manner and may not achieve the market acceptance necessary to generate significant revenues, and any new markets in which we attempt to sell our products and solutions, including new countries or regions, may not be receptive or implementation may be delayed. Our future growth will be adversely affected if we do not identify and invest in faster-growing industry verticals. In addition, any expansion into new markets will require an investment in the continuous monitoring of local laws and regulations, which increases our costs and the risk of the products or service failing to comply with such local laws or regulations. We may also incur costs associated with such plans that are above anticipated amounts.
To successfully manage our growth, we will also need to maintain appropriate staffing levels and update our operating, financial and other systems, procedures, and controls accordingly. Our efforts to grow our business and execute our business strategy may place significant demands on and strain our personnel and organizational structure, including our management, staff, and information systems. If we fail to effectively manage our growth, our business, results of operations, and financial condition could be materially adversely affected.
Social, ethical, and legal issues relating to the use of new and evolving technologies, such as artificial intelligence and machine learning, in our offerings may result in reputational harm and liability.
A quickly evolving legal and regulatory environment may cause us to incur increased research and development costs, or divert resources from other development efforts, to address social, ethical, and legal issues related to artificial intelligence and machine learning. We are increasingly building artificial intelligence and machine learning into many of our offerings and utilize data gathered from various sources in our services to train our machine-learning models.
As with many cutting-edge innovations, artificial intelligence and machine learning present new risks and challenges, and existing laws and regulations may apply to us in new ways, the nature and extent of which are difficult to predict. The continuous development, maintenance and operation of our machine-learning models is expensive and complex, and may involve unforeseen difficulties including material performance problems, and undetected defects or errors with new machine-learning or other artificial intelligence capabilities. Some of those difficulties could arise from undetected or uncorrected inaccuracies or unrepresentative tendencies in the data. We may encounter technical obstacles, and it is possible that we may discover additional problems that prevent our machine-learning models from operating properly. If our machine-learning models do not function reliably, we may incorrectly process background checks or suffer extended processing times and other failures of our services, which could result in customer dissatisfaction. The risks and challenges presented by artificial intelligence and machine learning could undermine public confidence in artificial intelligence and machine learning which could slow its adoption and affect our business.
Generally, machine-learning models use data about past decisions in a particular situation to create algorithms that make a new decision in a similar situation. If the past decisions on which our machine-learning models are based were affected by a disparate impact based on any legally prohibited classification (such as race or sex), then decisions made by our machine-learning models could have a similarly disparate impact. Consistently making decisions that result in disparate impact could subject us or our customers to legal or regulatory liability. In light of these risks and evolving concerns about the fairness of the effects of use of artificial intelligence, we expect there to be an increased focus on laws and regulations related to our business, because of the growing policy concerns with regard to the collection, use, accuracy, correction and sharing of personal information, and the use of algorithms, artificial intelligence and machine learning in business processes. Failure to adequately address these ethical, social, and legal issues that may arise with such use cases could negatively affect the adoption of our solutions and subject us to reputational harm, regulatory action, or legal liability, which may harm our financial condition and operating results.
20
Any damage to our reputation or our brand could adversely affect our business, financial condition, and results of operations.
Developing, protecting, and maintaining our strong reputation among customers, applicants, and third-party partners and vendors is critical to our success. The importance of our brand may increase if competitors offer more products similar to ours or if more competitors enter the market. Our brand may suffer if our service quality declines or if our customer initiatives are not successful. Additionally, the successful protection and maintenance of our brand will depend on our ability to obtain, maintain, protect, and enforce trademark and other intellectual property protection for our brand. If we fail to successfully promote, protect, and maintain our brand, we may lose our existing customers to our competitors or be unable to attract new customers.
The value of our intellectual property and other proprietary rights associated with our brand could diminish if others assert rights in or ownership of trademarks or service marks that are similar to our trademarks or service marks. Our registered or unregistered trademarks or trade names may be challenged, infringed, circumvented or declared generic or determined to be infringing on other marks. Opposition or cancellation proceedings may be filed against our trademarks, which may not survive such proceedings. We may be unable to prevent competitors or other third parties from acquiring or using trademarks or service marks that are similar to, infringe upon, misappropriate, dilute, or otherwise violate or diminish the value of our trademarks and service marks, thereby impeding our ability to build brand identity and possibly leading to market confusion. Damage to our reputation or our brand or loss of confidence in our products and solutions could result in decreased demand for our products and solutions, and our business, financial condition, and results of operations may be materially adversely affected.
To the extent our customers reduce their operations, downsize their screening programs, or otherwise demand fewer of our products and solutions, our business could be adversely impacted.
Demand for our products and solutions is subject to our customers’ continual evaluation of their need for our products and solutions and is impacted by several factors, including their budget availability, hiring and workforce needs, and a changing regulatory landscape. Demand for our offerings is also dependent on the size of our customers’ operations. Our customers could reduce their operations for a variety of reasons, including general economic slowdown, divestitures and spin-offs, business model disruption, poor financial performance, or as a result of increasing workforce automation. Demand for drug screenings may decline as a result of evolving U.S. drug laws. For example, the legalization of cannabis in several U.S. states has led to a decrease in orders for marijuana screenings. Our revenues may be significantly reduced should our customers decide to downsize their screening programs or take such programs in-house.
We operate in a penetrated and competitive market.
The global market for our screening, verifications, and adjacent products is fragmented and competitive. Our competitors vary based on their targeted customer size, industry vertical, geography, and product focus. We compete with large players with broad capabilities and product suites, vertical-focused specialist firms that target customers operating in select industries, mid-size players and competitors that serve SMB customers. Some competitors are aligned to a specific product in certain pre-onboarding product lines, such as drug / health screening and executive screening. In our adjacent products market, we compete with certain companies specializing in fleet / vehicle compliance, hiring tax credits and incentives, resident / tenant screening, employment eligibility, and investigative research.
New entrants to the market have in the past emerged, both as start-ups as well as participants in adjacent sectors such as applicant tracking systems and payroll processing companies that seek to integrate background screening into their onboarding products and solutions, and may emerge in the future, which would further increase competition. Additionally, our customers may also decide to insource work that has been traditionally outsourced to us.
In our competitive market environment, we primarily compete on the basis of brand and awareness, accuracy, compliance, turnaround time, and price. We must continue to innovate and ensure market acceptance of our products and solutions in order to maintain and grow our business and market share. We are continually subject to the risk that our competitors may develop products and technologies that are superior to ours or achieve greater market acceptance than ours. Continuing strong competition could result in increased pricing pressure, increased sales and marketing expenses, loss of customers, and greater investments in research and development, each of which could negatively impact our results of operations. The revenues of our competitors and the resources they have available vary depending on size, specialty, and geographic footprint. Some competitors may be able to allocate resources more efficiently than we can or anticipate and respond to existing and emerging market trends, customer preferences, and technologies due to their size and resources. If we fail to compete successfully, our business, financial position, and results of operations could be materially and adversely affected.
21
We rely on third-party data and service providers. If they are unable to deliver or perform as expected, our ability to operate effectively may be impaired, and our business may be materially and adversely affected.
We rely extensively on data, information, and services provided by or derived from a variety of external sources, including our suppliers, customers, strategic partners, various public filings, credit bureaus, publicly available information, and government authorities. Our suppliers could at any point decline to continue providing data or provide untimely or inaccurate data. These data sources have in the past increased the costs for their services, and we expect they will continue to do so from time to time. It may not be possible for us to recover any or all of the costs of any increases in fees by passing such costs along to our customers. If we try to do so, it could have a negative impact on customer relationships. In addition, the increase in such costs could cause our customers to choose to forgo certain services, thereby reducing demand for our products and solutions. Our suppliers could also request or require us to enter into minimum order contracts with clawback enforcement provisions. Some suppliers, such as certain criminal data suppliers and drug testing laboratories and collection sites we use, are also owned or may in the future be acquired by one or more of our competitors, which could make us especially vulnerable to unforeseen price increases or outright declinations to continue our relationships. Because our agreements with third-party data providers are generally non-exclusive, we are subject to the risk they may choose to enter into an exclusive arrangement with one of our competitors or maintain an exclusive proprietary database that is not shared with us. These risks could be exacerbated if our customers request we engage with a particular provider for their orders. We cannot guarantee that we will be able to identify and engage replacement providers on acceptable terms or obtain data from alternative sources in the event our suppliers are no longer able or are unwilling to provide us with certain data or services. If we were to lose access to external data or if our access or use were restricted or were to become less economical or desirable, our ability to timely complete requested services and products at a level of quality acceptable to our customers could be negatively impacted, which could adversely affect our business, results of operations and financial condition.
Data collection and verification by screening providers is dependent on access to databases run by government and law enforcement agencies, including the FBI, state, and federal courthouses, and records systems. If we were to lose or face diminished access to one or more of these data sources, or if government personnel were unable or unwilling to access these data sources on our behalf, our operations could be negatively impacted, and our sales could suffer. Such interruptions could result from government shutdowns or slowdowns, changing laws and regulations, or natural disasters such as earthquakes, hurricanes, or floods. The inability to access or a delay in accessing essential information could result in lengthened and unsatisfactory turnaround times or our inability to offer certain of our products and solutions.
Due to the sensitive and privacy-driven nature of our products and solutions, we could face liability and legal or regulatory proceedings, which could be costly and time-consuming to defend and may not be fully covered by insurance.
The nature of the products and solutions we provide and the information and data collected, processed, transmitted, disclosed, used, and reported by us (including personal information, confidential information, and other sensitive and/or regulated information) subjects us to potential liability from customers, consumers, data subjects, third parties, and government authorities relating to claims of legal or regulatory non-compliance, defamation, invasion of privacy, false light, negligence, intellectual property infringement, misappropriation or other violation and/or other related causes of action. Such liability may depend on actions or events beyond our control, such as how our customers use the information we provide or the veracity of the data we are provided by third parties. For example, we may from time to time be subject to legal claims by applicants for allegedly failing to comply with the FCRA in relation to issues regarding the accuracy of our reports. Likewise, our customers may seek indemnification for losses allegedly caused by negligent hiring or retention by asserting our reports failed to disclose information that would have resulted in an adverse employment decision had it been reported or if we improperly interpret a customer’s custom processing instructions. Such lawsuits and other proceedings could divert resources from our management and potentially subject us to equitable remedies. In addition, punitive damages are available as a remedy under the FCRA, which we are subject to and are generally not covered by insurance. We may also face adverse publicity in connection with such incidents, which could have a negative effect on our reputation and business.
22
Our business, brand, and reputation may be harmed as a result of security breaches, cyber-attacks, employee or other internal misconduct, computer viruses, or the mishandling of personal data.
Our products entail the collection, use, processing, disclosure, storage, and transmission of personal information, confidential information, and other sensitive and/or regulated information of individuals, including personal data.
In general, we utilize encryption and other technologies designed to provide system security for the transmission of confidential or personal data. There is no assurance that our use of applications and other technologies designed for data security, or that of our third-party vendors and service providers, will effectively counter security risks from hackers, computer viruses, and/or other intrusions or incidents. If one of more of our or our vendors’ facilities, computer networks, or databases were to experience a security breach, we could face a risk of loss of, or unauthorized access to and use of, personal data, confidential information, and other sensitive and/or regulated data, which could harm our business and reputation and result in a loss of customers or the imposition of fines or other penalties by governmental agencies, in addition to potential legal claims by our customers and their applicants and employees. Although we have put in place a number of controls and automated redundancies, our protocols and processes can also be violated due to human error, including as a result of phishing and other attempts by others to fraudulently induce the improper disclosure of sensitive information.
The techniques utilized and planned by hackers, bad actors, and other unauthorized entrants are varied and constantly evolving and may not be detected until a breach has occurred. As a result, despite our efforts, it may be difficult or impossible for us to implement measures that fully prevent such attacks or react in a timely manner. Unauthorized parties may in the future attempt to gain access to our systems or facilities through various means, including, among others, hacking into our or our consumers’ systems or facilities, or attempting to fraudulently induce our employees, consumers or others into disclosing usernames, passwords, or other sensitive information, which may, in turn, be used to access our information technology systems and gain access to our data or other confidential, proprietary, or sensitive information. Such efforts may be state-sponsored and supported by significant financial and technological resources, making them even more difficult to detect and prevent.
Further, certain of our employees have access to sensitive information about the applicants whom we perform background screenings and verifications on. In addition, certain of our third-party service providers and vendors have access to limited portions of our IT systems and may also be subject to such attempts, which then can be used to attempt to infiltrate our systems. Because we cannot control our vendors or the processing of data by our vendors, other than through our contractual relationships, our ability to monitor our vendors’ data security may be very limited such that we cannot ensure the integrity or security of measures they take to protect and prevent the loss of our or our consumers’ data. As a result, we are subject to the risk that cyber-attacks on, or other security incidents affecting, our vendors may adversely affect our business even if an attack or breach does not directly impact our systems. It is also possible that security breaches sustained by, or other security incidents affecting, our competitors could result in negative publicity for our entire industry that indirectly harms our reputation and diminishes demand for our products and solutions.
Furthermore, international, federal and state regulators and many international, federal and state laws and regulations require notice of certain data security breaches that involve personal information, which, if applicable, could lead to widespread negative publicity, which may cause our customers to lose confidence in the effectiveness of our data security measures. In addition, we may incur significant costs and operational consequences in connection with investigating, mitigating, remediating, eliminating, and putting in place additional measures designed to prevent future actual or perceived security incidents, as well as in connection with complying with any notification or other obligations resulting from any security incidents.
Our insurance policies may not be adequate to reimburse us for losses caused by security breaches, and we may not be able to collect fully, if at all, under these insurance policies. The successful assertion of one or more large claims against us that exceed available insurance coverage, or the occurrence of changes in our insurance policies, including premium increases or the imposition of large deductible or co-insurance requirements, could adversely affect our business. Furthermore, we cannot be certain that insurance coverage will continue to be available on acceptable terms or at all, or that the insurer will not deny coverage as to any future claim.
If we are unable to fully protect the security and privacy of our data and electronic transactions, or if we or our third-party service providers are unable to prevent any data security breach, incident, unauthorized access, and/or misuse of our information by our customers, employees, vendors, or hackers, it could result in significant liability (including litigation and regulatory actions and fines), cause lasting harm to our brand and reputation, and cause us to lose existing customers and fail to win new customers.
23
Our international business exposes us to a number of risks.
We perform screenings and verifications internationally, including helping businesses screen their applicants with backgrounds that include international jurisdictions outside of the business’ domestic base of operations. In 2023, we performed screens for our customers on individuals from over 200 countries and territories, and we seek to continue to expand our international operations. The laws and regulations governing our international operations are numerous, varied, and evolving. It may be difficult to correctly identify, interpret, and ensure compliance with these laws and regulations, and we cannot be certain we will avoid liability for noncompliance or improper compliance with such laws and regulations. Any such cost or liability could have a material adverse effect on our business, financial condition, and results of operations. See “—We operate in a highly regulated industry and are subject to numerous and evolving laws and regulations” and “—If regulatory regimes continue to heighten their scrutiny over personal data and data security, it could lead to increased restrictions, loss of revenue opportunity, greater costs of compliance, and lost efficiency.”
Because we generate a portion of our revenues and operating income outside of the United States, we are exposed to market risk from changes in foreign currency exchange rates that could impact our results of operations, financial position, and cash flows. Such fluctuations could have a negative or positive impact on our revenues and results of operations in any given period, which may make it difficult to compare our operating results across different periods. Foreign currency exchange rate fluctuations may also adversely impact third-party vendors we rely on for services, which may be passed along to us in the form of price increases.
In addition, as a result of our international footprint, our business, financial condition, and results of operations could be subject to factors beyond our control, including, but not limited to:
Real or perceived errors, failures, or bugs in our products could adversely affect our business, results of operations, financial condition, and growth prospects.
Our products are complex, and therefore undetected errors, failures, bugs, or defects may be present in our products or occur in the future in our products, our technology, or our software, or technology or software we license in from third parties, including open source software, especially when updates or new products are released. Such software and technology are used in IT environments with different operating systems, system management software, devices, databases, servers, storage, middleware, custom, and third-party applications and equipment and networking configurations, which may cause errors, failures, bugs, or defects in the IT environment into which such software and technology are deployed. This diversity increases the likelihood of errors, failures, bugs, or defects in those IT environments. Despite testing by us, real or perceived errors, failures, bugs, or defects may not be found until our customers use our products. Real or perceived errors, failures, bugs or defects in our products could result in negative publicity, loss of or delay in market acceptance of our products and harm to our brand, weakening of our competitive position, claims by customers for losses sustained by them or failure to meet the stated service level commitments in our customer agreements. In such an event, we may be required, or may choose, for customer relations or other reasons, to expend significant additional resources in order to help correct the problem. Any real or perceived errors, failures, bugs, or defects in our products could also impair our ability to attract new customers, retain existing customers or expand their use of our products, which would adversely affect our business, results of operations, and financial condition.
24
Additionally, if customers fail to adequately deploy protection measures or update our products, customers and the public may erroneously believe that our products are especially susceptible to cyber-attacks. Real or perceived security breaches against our products could cause disruption or damage to our customers’ networks or other negative consequences and could result in negative publicity to us, damage to our reputation, lead to other customer relations issues and adversely affect our revenue and results of operations. We may also be subject to liability claims for damages related to real or perceived errors, failures, bugs, or defects in our products. A material liability claim or other occurrence that harms our reputation or decreases market acceptance of our products may harm our business and results of operations. Finally, since some of our customers use our products for compliance reasons, any errors, failures, bugs, defects, disruptions in service, or other performance problems with our products may damage our customers’ business and could hurt our reputation.
The failure to complete our acquisition of Sterling Check Corp. may adversely affect our business and our stock price.
Consummation of the Acquisition is subject to the satisfaction or waiver of customary closing conditions, including, among others, (i) adoption of the Merger Agreement by Sterling stockholders, (ii) the expiration or termination of the waiting period under the HSR Act and clearance under the antitrust and foreign direct investment laws of certain other jurisdictions, (iii) and the effectiveness of a registration statement on Form S-4 to be filed by First Advantage in connection with the Acquisition. There can be no assurance that these or other closing conditions will be satisfied in a timely manner or at all. Any delay in completing the Acquisition could cause us not to realize some or all of the anticipated benefits when expected, if at all. If the Acquisition is not completed, our stock price could decline to the extent that such stock price reflects an assumption that we will complete the Acquisition and derive benefits therefrom. Furthermore, if the Acquisition is not completed, we may suffer other consequences that could adversely affect our business, results of operations and stock price, including incurring significant acquisition costs that we would be unable to recover, negative publicity and a negative impression of us in the investment community.
Failure to realize the benefits expected from the Acquisition could adversely affect the value of our common stock.
Although we expect significant benefits to result from the Acquisition, there can be no assurance that we will actually realize any of them, or realize them within the anticipated timeframe. Achieving these benefits will depend, in part, on our ability to integrate Sterling’s business successfully and efficiently. The challenges involved in this integration, which will be complex and time consuming, include the following:
If we do not successfully manage these risks and the other challenges inherent in integrating an acquired business, then we may not achieve the anticipated benefits of the Acquisition on our anticipated timeframe or at all and our revenue, expenses, operating results, financial condition and stock price could be materially adversely affected. The successful integration of the Sterling business will require significant management attention both before and after the completion of the Acquisition, and may divert the attention of management from our business and operational issues.
We may not be able to identify attractive acquisition targets and strategic partnerships or successfully complete such transactions.
Part of our strategy is to selectively pursue complementary acquisitions and strategic partnerships. Opportunities to grow our business through acquisitions, joint ventures, and other alliances may not be available to us in the future. We cannot guarantee that we will be able to identify attractive targets that are a strategic fit with our business or that we will be able to agree upon acceptable terms. Our ability to successfully identify and complete future acquisitions with reasonable valuations may also be affected by factors out of our control, including general market conditions, volatility in the capital and debt markets, and other macroeconomic and geopolitical risks. Furthermore, a number of our competitors expand and diversify through acquisitions, and we likely will experience competition in our effort to execute our acquisition strategy. As a result, we may be unable to continue to make acquisitions or may be forced to pay more for the companies we are able to acquire.
25
We may not be able to integrate or manage acquired businesses, including the digital identity and biometric solutions company we acquired in September 2023 and Sterling, if the Acquisition is completed, and strategic partnerships so as to produce returns that justify the investment. Integrating acquisitions or other business relationships, including the Acquisition, may result in unforeseen operating difficulties and expenditures, disrupt our ongoing business, divert our resources, and require significant management attention that would otherwise be available for the ongoing development of our business. In particular, it may prove difficult to integrate the personnel, operations, intellectual property, and/or technology systems of any acquired organizations, and to maintain uniform standards, policies, and procedures across multiple platforms and locations, including for those located outside of the United States. This may result in a greater than anticipated increase in the transaction, remediation, and integration costs and could discourage us from entering into acquisitions where the potential for such costs outweigh the perceived benefit. Further, although we conduct due diligence with respect to the business and operations of each of the companies we acquire, we may not have identified all material facts concerning these companies, including Sterling, which could result in unanticipated events or liabilities. We cannot guarantee that any acquisitions we seek to enter into will be carried out on favorable terms or that the anticipated benefits of any acquisition, investment, or business relationship, including the Acquisition, will materialize as intended or that no unanticipated liabilities will arise.
Failure to comply with anti-corruption, economic and trade sanctions, and anti-money laundering laws and regulations could have an adverse effect on our business.
We are subject to evolving anti-corruption laws, economic and trade sanctions, and anti-money laundering rules in several jurisdictions in which we operate, including the U.S. FCPA and the U.K. Bribery Act. The evolution of this regulatory regime has generally brought about more aggressive investigations and enforcement, which, if targeted towards us, could materially adversely impact our business. We have policies and procedures in place to assist us with monitoring the evolution of these laws and ensuring our ongoing compliance. We are continuously in the process of reviewing, upgrading, and enhancing these protocols. However, we cannot guarantee that our employees, consultants, or agents will not take actions that amount to a violation of these laws and regulations for which we may be ultimately responsible or that our policies and procedures will be adequate in protecting us from liability. Further, our services agreements with several customers contain contractual provisions mandating our ongoing compliance with applicable anti-corruption, economic, and trade sanctions or anti-money laundering laws or regulations. If we are deemed to be in violation of any such rules, our business activities could be restricted or terminated. In addition, we could face civil and criminal penalties, including fines, which could damage our reputation and customer relationships and materially impact our results of operations or financial condition.
Disruptions at our Global Operating Center and other operational sites could adversely impact our business.
Our Global Operating Center in Bangalore, India provides critical support for our operations by processing screening requests, undertaking a manual review of records and verifications work, handling certain customer calls and interactions, and completing certain internal shared service support functions. We also have other important operational sites, including Fishers, Indiana; Atlanta, Georgia; Manila, Philippines; and Mumbai, India. If our operations at our Global Operating Center or such other sites are disrupted, even for a brief period of time, whether due to malevolent acts, defects, computer viruses, climate change, natural disasters such as earthquakes, fires, hurricanes or floods, power or telecommunications failures, or other external events beyond our control, it could result in interruptions in service to our customers, damage to our reputation, harm to our customer relationships, and reduced revenues and profitability. In addition, strikes, wars, terrorism, and other geopolitical unrest could cause disruptions in our business and lead to interruptions, delays, or loss of critical data. We may not have sufficient protection or recovery plans in certain circumstances, such as a significant natural disaster, and our business interruption insurance may be insufficient to compensate us for losses that occur. In the case of such an event, customers could elect to terminate our relationship, delay or withhold payment to us, or even make claims against us.
We are not guaranteed exclusivity or volumes in our contracts with our customers and our customers may experience major business changes that impact our current or future revenue streams.
We enjoy long-standing relationships with many of our customers, but our customer contracts and services agreements do not typically require our customers to use our products exclusively or commit to minimum engagement or order volumes. As a result, we rely on our customers’ continuing demand for our products and solutions, our technology, our value proposition, and our brand and reputation to compete. Our customers can stop doing business with us for any reason at any time with minimal notice and without penalty, which they may leverage to renegotiate our arrangements on terms less favorable to us. The loss of a significant customer or any reduced demand for our products and solutions by our customers, especially our large customers, would have a negative impact on our business. For the year ended December 31, 2023, we had one customer who accounted for approximately 12% of our revenues. We cannot guarantee that we will maintain relationships with any of our customers on acceptable terms or at all or retain, renew or expand upon our existing agreements. The failure to do so could negatively affect our business, financial condition, and results of operations.
26
Disruptions with our technology and network infrastructure, including our data centers, servers, and third-party cloud and internet providers, and our migration to the cloud, could have an adverse impact on our business.
Our operating model depends on the efficient and unimpeded operation of our global technology and data processing systems. We currently operate data centers and servers around the world and rely on our third-party cloud providers to host certain of our websites, databases, and web-based services. Our property and business interruption insurance coverage may not be adequate to fully compensate us for losses that may occur. Severe impairment or total destruction of our data centers could occur, and recovery could be difficult and may not be possible at all. In the event of an accessibility outage or other incident at our data centers or with respect to our third-party cloud providers, our operations could be disrupted, data could be lost, our systems or the quality of our products and solutions could be compromised, and we could suffer financial loss, reputation damage, potential liability, or customer loss, any of which could have an adverse impact on our business, results of operations, and financial condition. Such outages may be impossible to predict, plan for, or avoid.
Because we rely on such third-party cloud providers, we are subject to risks that we can neither control nor mitigate, including their vulnerability to damage from climate change, earthquakes, hurricanes, floods, acts of terrorism, power loss, telecommunications and other service failures, break-ins, human error, and similar events. Our current or future third-party cloud providers could decide to close their facilities without adequate notice or otherwise cease doing business with us. We cannot guarantee that our current or future third-party cloud providers will keep up with our increasing capacity needs or customer demand. In addition, our users depend on internet service providers, online service providers, and other website operators for access to our systems. These providers could experience outages, delays, and other difficulties due to system failures unrelated to our systems, events which are beyond our control, or mitigation. Any changes in service levels by our current or future third-party cloud providers could result in loss or damage to our stored information and result in operational delays. Any of these events could seriously harm our business, results of operations, and financial condition.
We are currently transitioning towards hosting certain of our software and systems on cloud-based technology. This transition is complex and will require significant changes to our platforms. Scaling and adapting our technology will require a significant lead time and investment in financial and human capital. We cannot guarantee that this transition will be without operational interruptions or other forms of disruption, including loss of information, delayed turnaround times, and deficiencies in our design, implementation, or maintenance of the system. If we experience outages or interruptions in the products and solutions we provide for extended periods of time, our customers could face accessibility issues which would have an adverse impact on our business, results of operations, and financial condition.
If we fail to continue to integrate our platforms and solutions with that of human resource software providers or if our relationships with human resource software providers deteriorate, our business could be adversely affected.
We engage and integrate with many third-party human resource software providers, including applicant tracking systems and human capital management systems, to ensure that customers benefit from an integrated solution that allows them to easily perform both human resource functions and screenings and verifications through a core platform. This depends on our ability to seamlessly integrate our platforms and systems with those of the human resource software providers. If our engagement or arrangements with such providers are terminated for any reason, we risk losing the opportunity for continued integration with the software applications of these companies, which could jeopardize our ability to provide a seamless interface for our customers, result in service disruptions, increase costs and reduce the quality of our products, and ultimately put us at a competitive disadvantage in maintaining our customer relationships and obtaining new ones. Further, if a provider updates its products without providing sufficient notice to us, there could be disruptions to the integration, which could result in errors, delays, and interruptions.
In addition, these third-party human resource software providers are often sources of positive references when a customer is looking to make a purchase or contract renewal decision and may also be a source of new business referrals. If our relationships with these third parties were to deteriorate or if our arrangements with them were to expire, our business and our ability to win new customers and retain existing customers may be adversely affected.
We are subject to risks relating to public opinion, which may be magnified by incidents or adverse publicity concerning our industry or operations.
We operate in an industry that involves the risk of negative publicity, especially relating to cybersecurity, privacy, and data protection, and adverse developments with respect to our industry may also, by association, negatively impact our reputation. For example, when information services companies are involved in high-profile events involving data theft, these events could result in increased legal and regulatory scrutiny, adverse publicity, and potential litigation concerning the commercial use of such information for our industry in general. If there is a perception that the practices of our business or our industry constitute an invasion of privacy, our business and results of operations may be negatively impacted. There have been and may continue to be perception issues, social stigmas, and negative media attention regarding the collection, use, accuracy, correction, and sharing of personal data, which could materially adversely affect our business, results of operations, and financial condition.
27
We rely on third-party vendors to carry out certain portions of our operations. If they cannot deliver or perform as expected or if our relationships with them are terminated or otherwise change, our business operations and results of operations could be materially and adversely affected.
Our ability to deliver products to our customers effectively requires us to work with certain third-party vendors and service providers. For example, we engage third-party vendors to maintain and upgrade portions of our software and technology. In addition, from time to time and in certain geographic locations, we engage third-party support service providers depending on demand requirements on our operations and customer service call centers. Our business, therefore, depends on such third parties meeting our expectations and the expectations of our customers in timeliness, quality, and volume. We cannot guarantee our third-party providers will be able to do so on a cost-effective basis or at all due to a number of factors. Some of the third-party vendors that we rely on conduct operations outside of the United States, which subjects us to the risk that economic, political, and military events in foreign jurisdictions might cause an interruption to our operations. We may not be able to ensure that our third-party vendors perform in accordance with agreed-upon, regulated, and expected standards. We could be held accountable for their failure to do so, which may subject us to fines or other sanctions. If our third-party vendors do not meet our expectations and those of our customers, it could negatively affect our reputation, harm our relationships with existing customers, and hamper our ability to win new customers.
While we have entered into agreements with some of these third-party service providers, they have no obligation to renew their agreements with us on commercially reasonable terms or at all. If any one of our third-party service provider’s ability to perform their obligations was impaired, we may not be able to find an alternative supplier in a timely manner or on acceptable financial terms, which could result in operational interruptions.
In addition, any shift in business strategy, corporate reorganization, or financial difficulties, such as bankruptcy faced by our third-party providers, may have negative effects on our ability to implement our business strategy.
Any termination of our agreements with, or disruption in the performance of, one or more of these third-party providers could result in operational disruptions and delayed turnaround times. This could adversely impact our relationships with our existing customers, reduce our ability to attract new customers, impact our ability to innovate and introduce new products and solutions, and result in an inability to meet our obligations or require us to seek alternative service providers on less favorable terms, any of which can adversely affect our business, results of operations, and financial condition.
Our continued success depends in large part on the service of our key executives and our ability to find and retain qualified employees.
We depend to a large degree on the personal efforts, abilities, and performance of the members of our senior leadership team and other key personnel. Over the past several years, our management team has driven strategic and transformational initiatives across operations, product, engineering, and sales to accelerate growth and product development. Although we maintain employment contracts with certain of our officers, the possibility remains they may terminate their employment relationship with us at any time. If any of our key personnel were unable or unwilling to continue in their present positions, it may be difficult to replace them, and their departure could adversely affect our business, financial condition, and results of operations.
Our ability to grow our business and provide our customers with the products and solutions they have grown to expect from us is also dependent on our ability to attract and retain highly motivated and qualified people. Competition for skilled employees in our industry is intense and, if we are unable to attract and retain an able workforce, our business, results of operations, and financial condition may suffer. Any unplanned turnover or sustained labor shortage, or failure to attract, develop, and maintain a highly skilled and diverse workforce, including key capabilities such as product development, sales, customer success, and operations, can deplete our institutional knowledge base, erode our competitive advantage or result in increased costs due to increased competition for employees, higher employee turnover or increased employee benefit costs.
28
If we are unable to obtain, maintain, protect and enforce our intellectual property and other proprietary information, or if we infringe, misappropriate or violate the intellectual property rights of others, the value of our brands and other intangible assets may be diminished, and our business may be adversely affected.
Our intellectual property rights and other proprietary rights are important to our business, and our ability to compete and our success depend, in part, on obtaining, maintaining, protecting, and enforcing such rights. In particular, the technology solutions we have created to deliver screening solutions, automate and integrate our platforms with third-party human capital management and applicant tracking systems, and gather and process information from various data sources and suppliers are critical to the success of our business. We rely on a combination of patent, copyright, trademark, and trade secret laws, as well as licensing agreements, intellectual property assignment agreements, third-party nondisclosure agreements, and other confidentiality agreements with our employees, customers, vendors, partners, and others to protect our intellectual property rights. These protections may not be adequate to prevent our competitors from copying our products and solutions or otherwise infringing on, misappropriating, or violating our intellectual property rights, and we may need to devote significant additional resources and time to ensure our intellectual property rights are adequately protected, including by bringing litigation against third parties to enforce our intellectual property rights. We cannot guarantee that we will be successful in prevailing in any such matters, regardless of our expenditures and efforts. Our efforts to enforce our intellectual property and other proprietary rights may be met with defenses, counterclaims, and countersuits attacking the validity and enforceability of our intellectual property and other proprietary rights, and if such defenses, counterclaims, or countersuits are successful, it could diminish or we could otherwise lose valuable intellectual property and other proprietary rights. In addition, some of the laws in foreign markets in which we operate do not protect intellectual property and other proprietary rights to the same level of protection as do the laws of the United States, and the mechanisms for enforcement of intellectual property and other proprietary rights in such countries may be inadequate.
In addition, our competitors and other third parties may also design around or independently develop similar technology or otherwise duplicate or mimic our products such that we would not be able to successfully assert our intellectual property or other proprietary rights against them. We cannot assure that any future patent, trademark, or service mark registrations will be issued for our pending or future applications or that any of our current or future patents, copyrights, trademarks, or service marks (whether registered or unregistered) will be valid, enforceable, sufficiently broad in scope, provide adequate protection of our intellectual property or other proprietary rights, or provide us with any competitive advantage.
Furthermore, we may also be subject to claims of intellectual property infringement, misappropriation, or violation by third parties, including our competitors. Even if we are unaware of such rights, we may be found by courts to be infringing upon, misappropriating, or violating them. If successfully asserted against us or if we decide to settle such matters, we could be required to pay substantial damages or ongoing royalty payments, obtain licenses, which may not be available on commercially reasonable terms, or at all, modify our products and solutions (including our applications), or discontinue certain products. We may also be obligated to indemnify applicants, customers, vendors, or partners in connection with any such claim or litigation. Even if we prevail in a dispute, any litigation regarding intellectual property could be costly, time-consuming, and require the deployment of significant resources, and could result in lasting harm being done to our brand and reputation, results of operations or financial condition, or have other adverse consequences.
If we are unable to maintain, protect and enforce the confidentiality of our trade secrets, our business and competitive position would be harmed.
In order to safeguard our innovations and competitive advantages, we partially rely on trade secrets. We cannot guarantee that we will be successful in maintaining, protecting, or enforcing the confidentiality of our trade secrets or that our non-disclosure agreements will provide sufficient protection of our trade secrets, know-how, or other proprietary information in the event of any unauthorized use, misappropriation, or other disclosure. Although we have taken steps to protect our trade secrets, including entering into confidentiality agreements with third parties and confidential information and inventions agreements with employees, consultants, and advisors, we cannot provide any assurances that any of these parties may not breach the agreements and disclose our proprietary information, including our trade secrets. For example, if a party to one of our non-disclosure agreements were to breach said agreement, we cannot guarantee that adequate remedies will be available to rectify any subsequent damages or losses of confidential and proprietary information. Enforcing a claim that a party illegally disclosed or misappropriated a trade secret is difficult, expensive, and time-consuming, and the outcome is unpredictable. In addition, some courts inside and outside of the United States are less willing or unwilling to protect trade secrets. It is also possible that our trade secrets will become known by some other mechanism or independently developed by our competitors, and we would have no right to prevent them from using that technology or information to compete with us. For example, a significant portion of our proprietary databases is assembled from publicly available information sources, and third parties, including our competitors, could compile similar or competing databases by accessing the same publicly available information sources.
29
The use of open-source software in our applications may expose us to additional risks and harm our intellectual property rights.
We have in the past incorporated, and may in the future continue to incorporate, certain “open-source” software into our codebase and our products and solutions. Open-source software is generally licensed by its authors or other third parties under open-source licenses, which typically do not provide any representations, warranties, or indemnity coverage by the licensor. Some of these licenses provide that combinations of open source software with a licensee’s proprietary software are subject to the open source license and require that the combination be made available to third parties in source code form, at no cost, or subject to other unfavorable conditions. Some open-source licenses may also require the licensee to grant licenses under certain of its own intellectual property to third parties. From time to time, there have been claims challenging the ownership of open-source software against companies that incorporate such software into their products or applications. The terms of various open-source licenses have not been interpreted by courts, and there is a risk that such licenses could be construed in a manner that imposes unanticipated conditions or restrictions on our use of open-source software or our proprietary rights. In addition, if we were to combine our applications with open-source software in a certain manner, we could, under certain of the open-source licenses, be required to publicly release or license, at no cost, our products that incorporate the open-source software or the affected portions of our source code, which could allow our competitors or other third parties to create similar products and solutions with lower development effort, time, and costs, and could ultimately result in a loss of transaction volume for us. If we inappropriately use open-source software, we may be required to redesign our applications, seek licenses from third parties in order to continue offering our products, which may not be available on commercially reasonable terms, or at all, discontinue the sale of our products or solutions, or take other remedial actions, each of which could reduce or eliminate the value of our technologies and could adversely impact our business, operating results, or financial condition.
We cannot ensure that we have not incorporated open-source software in our software in a manner that is inconsistent with the terms of the applicable license or our current policies, and we may inadvertently use open source in a manner that we do not intend, or that could expose us to claims for breach of contract or intellectual property infringement, misappropriation, or other violation. If we fail to comply, or are alleged to have failed to comply, with the terms and conditions of our open-source licenses, we could be required to incur significant legal expenses defending such allegations, be subject to significant damages, be enjoined from the sale of our products and solutions, and be required to comply with onerous conditions or restrictions on our products and solutions, any of which could be materially disruptive to our business. Litigation could be costly for us to defend, have a negative effect on our operating results and financial condition, or require us to devote additional development resources to change our applications.
Seasonality may cause our operating results to fluctuate from quarter to quarter.
We experience seasonality with respect to certain industries we service due to fluctuations in hiring volumes and other economic activity. For example, pre-onboarding revenues generated from our customers in the retail and transportation industries are historically highest during the months of October and November leading up to the U.S. holiday season and lowest in December and at the beginning of the first quarter following the U.S. holiday hiring season. Certain customers across various industries also historically increase their hiring throughout the second quarter of the year as winter concludes, commercial activity tied to outdoor activities increases, and the school year ends, giving rise to student and graduate hiring.
In addition, customers may elect to complete post-onboarding screening such as workforce re-screens and other products at different periods and intervals during any given year. It is not always possible to accurately forecast the timing and magnitude of these programs.
Further, digital transformation, growth in e-commerce, and other economic, demographic, and labor market shifts can impact seasonality trends, making it difficult for us to predict how our seasonality may evolve in the future. As a result, it may be difficult to forecast our results of operations accurately, and there can be no assurance that the results of any particular quarter or other period will serve as an indication of our future performance.
The interpretation of tax laws may have a material adverse effect on our business.
Tax laws and related interpretations with respect to income taxation are frequently reviewed and amended by governmental bodies, officials, and regulatory agencies in the United States and other jurisdictions in which we do business. In 2023, we fully utilized our remaining U.S. Federal income tax net operating loss carryforward. As a result, income taxes have become a material use of funds. Our provision for income taxes and liquidity may therefore be adversely affected by changes to our operating model, changes in the mix of income and expenses in countries with differing tax rates, changes in the valuation of deferred tax assets and liabilities, or changes in tax laws, regulations, or administrative interpretations. For example, there are several proposals to change the current tax law, including changes in global intangible low-taxed income (“GILTI”). Additionally, the Inflation Reduction Act was enacted on August 16, 2022, and includes a new 15% minimum tax on “adjusted financial statement income” beginning with the Company’s fiscal year 2024, and a new 1% excise tax on stock repurchases after December 31, 2022. While these tax law changes and proposals had no immediate material effect, if any or all of these (or similar) proposals are ultimately enacted into law, in whole or in part, they could have a negative impact on our effective tax rate. It cannot be predicted whether or when tax laws, regulations, and rulings may be enacted, issued, or amended that could materially and adversely impact our financial position, results of operations, or cash flows.
30
Our implementation cycles can be lengthy and variable, depend upon factors outside our control, and could cause us unexpected delays in generating revenues or result in lower than anticipated revenues.
Unexpected delays and difficulties can occur as customers implement and test our products and solutions. Implementation typically involves integration with our customers’ and third-party systems and internal processes, as well as adding customer and third-party data to our platforms. This can be complex and time-consuming for our customers and can result in delays. We provide our customers with upfront estimates regarding the duration and resources associated with the implementation of our products and solutions. However, delays may occur due to discoveries made during the implementation process, such as unique or unusual customer requirements or our internal limitations. If we are unable to resolve these issues and we fail to meet the upfront estimates and the expectations of our customers, it could result in customer dissatisfaction, loss of customers, delays in generating revenues, or negative brand perception about us and our products and solutions. Our implementation cycles could also be disrupted by factors outside of our control, such as deficiencies in the platform of our customers or third-party ATS or HCM systems, which could adversely affect our business, results of operations, and financial condition.
Risks Related to Our Indebtedness
Our failure to comply with the agreements relating to our outstanding indebtedness, including as a result of events beyond our control, could result in an event of default that could materially adversely affect our business, results of operations, and financial condition.
If there were an event of default under any of the agreements relating to our outstanding debt, the holders of the defaulted debt could cause all amounts outstanding with respect to that debt to be due and payable immediately. Our assets or cash flow may not be sufficient to fully repay borrowing under our outstanding debt instruments if accelerated upon an event of default. Further, if we are unable to repay, refinance or restructure our secured debt, the holders of such debt could proceed against the collateral securing such debt. In addition, any event of default or declaration of acceleration under one debt instrument could also result in an event of default under one or more of our other debt instruments. As a result, any default by us on our debt could have a materially adverse effect on our business, results of operations, and financial condition.
Our indebtedness could adversely affect our ability to raise additional capital to fund our operations, limit our ability to react to changes in the economy or our industry, and prevent us from meeting our obligations.
We have a significant amount of indebtedness. As of December 31, 2023, we had $564.7 million of total debt outstanding. We expect to incur approximately $1.820 billion of indebtedness to finance the Acquisition.
Our indebtedness increases the risk that we may be unable to generate cash sufficient to pay amounts due in respect of our indebtedness. Our indebtedness could have other important consequences to us, including:
In addition, the credit agreement governing our term loan facility and revolving credit facility contains, and the agreements governing future indebtedness may contain, restrictive covenants that limit our ability to engage in activities that may be in our long-term best interests. Our failure to comply with those covenants could result in an event of default that, if not cured or waived, could result in the acceleration of all of our indebtedness.
31
We may incur significant additional indebtedness in the future. Although the credit agreement governing our term loan facility and revolving credit facility contain restrictions on the incurrence of additional indebtedness by us, such restrictions are subject to a number of qualifications and exceptions, and the indebtedness incurred in compliance with these restrictions could be substantial. Also, these restrictions do not prohibit us from incurring obligations that do not constitute indebtedness as defined therein. To the extent that we incur additional indebtedness or such other obligations, the risk associated with our indebtedness described above will increase. See “Management’s Discussion and Analysis of Financial Condition and Results of Operations—Liquidity and Capital Resources—Long-Term Debt.”
We will require a significant amount of cash to service our debt, and our ability to generate cash depends on many factors beyond our control, and any failure to meet our debt service obligations could materially adversely affect our business, results of operations, and financial condition.
Our ability to make payments on and to refinance our indebtedness and to fund working capital needs and planned capital expenditures will depend on our ability to generate cash in the future. This, to a certain extent, is subject to general economic, financial, competitive, business, legislative, regulatory, and other factors that are beyond our control.
If our business does not generate sufficient cash flow from operations or if future borrowings are not available to us in an amount sufficient to enable us to pay our indebtedness or to fund our other liquidity needs, we may need to refinance all or a portion of our indebtedness on or before the maturity thereof, sell assets, reduce or delay capital investments or seek to raise additional capital, any of which could have a material adverse effect on our operations. In addition, we may not be able to effect any of these actions, if necessary, on commercially reasonable terms or at all. Our ability to restructure or refinance our indebtedness will depend on the condition of the capital markets and our financial condition at such time. Any refinancing of our debt could be at higher interest rates and may require us to comply with more onerous covenants, which could further restrict our business operations. The terms of existing or future debt instruments, including the credit agreement governing our term loan facility and revolving credit facility, may limit or prevent us from taking any of these actions. In addition, any failure to make scheduled payments of interest and principal on our outstanding indebtedness would likely result in a reduction of our credit rating, which could harm our ability to incur additional indebtedness on commercially reasonable terms or at all. Our inability to generate sufficient cash flow to satisfy our debt service obligations, or to refinance or restructure our obligations on commercially reasonable terms or at all, would have an adverse effect, which could be material, on our business, results of operations, and financial condition, as well as on our ability to satisfy our obligations in respect of our term loan facility and revolving credit facility.
Our debt instruments restrict our current and future operations, particularly our ability to respond to changes or take certain actions.
The credit agreement governing our term loan facility and revolving credit facility impose significant operating and financial restrictions and limit our ability to:
As a result of these covenants and restrictions, we are and will be limited in how we conduct our business, and we may be unable to raise additional debt or equity financing to compete effectively or to take advantage of new business opportunities. In addition, we are required to maintain specified financial ratios and satisfy other financial condition tests. The terms of any future indebtedness we may incur could include more restrictive covenants. We cannot guarantee that we will be able to maintain compliance with these covenants in the future and, if we fail to do so, that we will be able to obtain waivers from the lenders and/or amend the covenants.
32
Our failure to comply with the restrictive covenants described above as well as others contained in our future debt instruments from time to time could result in an event of default, which, if not cured or waived, could result in our being required to repay these borrowings before their due date. If we are forced to refinance these borrowings on less favorable terms, our results of operations and financial condition could be adversely affected.
Risks Related to Ownership of Our Common Stock
We cannot guarantee that our stock repurchase program will be fully implemented or that it will enhance long-term stockholder value.
In 2022, our Board of Directors approved our share repurchase program (“Repurchase Program”) totaling $150.0 million which expired on December 31, 2023. In 2023, our Board of Directors further increased the total available amount under the Repurchase Program to $200.0 million and extended the authorization through December 31, 2024. We are not obligated to repurchase any specific number of shares, and the timing, manner, value, and actual number of shares repurchased will depend on a variety of factors, including the Company’s stock price and liquidity requirements, other business considerations and general market and economic conditions. Our Repurchase Program may be modified, suspended or terminated at any time and, even if fully implemented, may not enhance long-term stockholder value. In connection with the execution of the Merger Agreement, the Company will be suspending purchases under its Repurchase Program.
Silver Lake controls us and its interests may conflict with yours in the future.
Silver Lake beneficially owned 61.7% of our outstanding common stock as of December 31, 2023. As a result, Silver Lake is able to control the election and removal of our directors and thereby determine our corporate and management policies, including potential mergers or acquisitions, payment of dividends, asset sales, amendment of our certificate of incorporation or bylaws and other significant corporate transactions for so long as Silver Lake and its affiliates retain significant ownership of us. This concentration of our ownership may delay or deter possible changes in control of the Company, which may reduce the value of an investment in our common stock. So long as Silver Lake continues to own a significant amount of our combined voting power, even if such amount is less than 50%, Silver Lake will continue to be able to strongly influence or effectively control our decisions and, so long as Silver Lake and its affiliates collectively own at least 5% of all outstanding shares of our stock entitled to vote generally in the election of directors, Silver Lake will be able to nominate individuals to our Board of Directors under our stockholders’ agreement. In addition, the stockholders’ agreement grants to Silver Lake and its affiliates and certain of their transferees certain governance rights for as long as Silver Lake and its affiliates and certain of their transferees maintain ownership of at least 25% of our outstanding common stock, including rights of approval over the entry into joint ventures or similar business alliances having a fair market value of more than $100 million, incurrence of debt for borrowed money in excess of $100 million, the increase or reduction in the size of our Board of Directors, initiation of any liquidation, dissolution, bankruptcy or other insolvency proceeding, the appointment or termination of our chief executive officer, or any material change in the nature of our business. The interests of Silver Lake may not coincide with the interests of other holders of our common stock.
In the ordinary course of their business activities, Silver Lake and its affiliates may engage in activities where their interests conflict with our interests or those of our stockholders. Our certificate of incorporation provides that Silver Lake, any of its affiliates or any director who is not employed by us (including any non-employee director who serves as one of our officers in both his or her director and officer capacities) or his or her affiliates will not have any duty to refrain from engaging, directly or indirectly, in the same business activities or similar business activities or lines of business in which we operate. Silver Lake also may pursue acquisition opportunities that may be complementary to our business and, as a result, those acquisition opportunities may not be available to us. In addition, Silver Lake may have an interest in pursuing acquisitions, divestitures and other transactions that, in their judgment, could enhance its investment, even though such transactions might involve risks to you.
In addition, Silver Lake and its affiliates are able to determine the outcome of all matters requiring stockholder approval and are able to cause or prevent a change of control of the Company or a change in the composition of our Board of Directors and could preclude any acquisition of the Company. Further, under the stockholders’ agreement, so long as Silver Lake and its affiliates and certain of their transferees maintain ownership of at least 25% of our outstanding common stock, they will have approval rights of any change of control transaction, which could preclude any unsolicited acquisition of our shares. This concentration of voting control could deprive you of an opportunity to receive a premium for your shares of common stock as part of a sale of the Company and ultimately might affect the market price of our common stock.
33
Our stock price may be highly volatile or may decline regardless of our operating performance, and you may not be able to resell shares of our common stock at or above the price you paid or at all, and you could lose all or part of your investment as a result.
The trading price of our common stock may be highly volatile and may be adversely affected due to a number of factors, most of which we cannot control, including those listed elsewhere under this “Risk Factors” section, and the following:
Furthermore, the stock market may experience extreme volatility that, in some cases, may be unrelated or disproportionate to the operating performance of particular companies. These broad market and industry fluctuations may adversely affect the market price of our common stock, regardless of our actual operating performance. In addition, price volatility may be greater if the public float and trading volume of our common stock is low.
In the past, following periods of market volatility, stockholders have instituted securities class action litigation. If we were to become involved in securities litigation, it could have a substantial cost and divert resources and the attention of executive management from our business regardless of the outcome of such litigation.
34
We do not intend to pay dividends for the foreseeable future.
We currently intend to retain any future earnings to finance the operation and expansion of our business and we do not expect to declare or pay any dividends in the foreseeable future. The Company’s payment of a one-time special cash dividend of $1.50 per share in August 2023 should not be regarded as any indication of an intention to pay dividends in future. The declaration, amount and payment of any future dividends will be at the sole discretion of our Board of Directors, and will depend on, among other things, general and economic conditions, our results of operations and financial condition, our available cash and current and anticipated cash needs, capital requirements, contractual, legal, tax and regulatory restrictions and implications on the payment of dividends by us to our stockholders or by our subsidiaries to us, including restrictions under our credit agreement and other indebtedness we may incur, and such other factors as our Board of Directors may deem relevant. See “Dividend Policy.”
As a result, you may not receive any return on an investment in our common stock unless you sell our common stock for a price greater than your purchase price.
First Advantage Corporation is a holding company with no operations of its own and, as such, it depends on its subsidiaries for cash to fund all of its operations and expenses, including future dividend payments, if any.
Our operations are conducted entirely through our subsidiaries and our ability to generate cash to meet our debt service obligations or to make future dividend payments, if any, is highly dependent on the earnings and the receipt of funds from our subsidiaries via dividends or intercompany loans. We currently do not intend to pay dividends on our common stock; however, to the extent that we determine in the future to pay dividends on our common stock, the agreements governing our indebtedness may restrict the ability of our subsidiaries to pay dividends or otherwise transfer assets to us. In addition, Delaware law may impose requirements that may restrict our ability to pay dividends to holders of our common stock.
We qualify as a “controlled company” within the meaning of Nasdaq rules and the rules of the SEC and, as a result, qualify for exemptions from certain corporate governance requirements.
Silver Lake controls a majority of the voting power of our outstanding common stock. As a result, we qualify as a “controlled company” within the meaning of the corporate governance standards of Nasdaq. Under these rules, a company of which more than 50% of the voting power is held by an individual, group, or another company is a “controlled company” and may elect not to comply with certain corporate governance requirements, including the requirement that:
Although we are not relying on the exemptions from these corporate governance requirements, if we do rely on such exemptions in the future, you will not have the same protections afforded to stockholders of companies that are subject to all of the corporate governance requirements of Nasdaq.
You may be diluted by the future issuance of additional common stock in connection with our incentive plans, acquisitions or otherwise.
As of December 31, 2023, we had approximately 854,925,198 shares of authorized but unissued common stock. Our amended and restated certificate of incorporation authorizes us to issue these shares of common stock and securities relating to common stock for the consideration and on the terms and conditions established by our Board of Directors in its sole discretion, whether in connection with acquisitions (including the Acquisition) or otherwise. We have reserved shares for issuance under the 2021 Equity Plan and the ESPP. Any common stock that we issue, including under the 2021 Equity Plan or the ESPP or other equity incentive plans that we may adopt in the future, would dilute the percentage ownership held by the investors who purchase common stock. In the future, we may also issue our securities in connection with investments or acquisitions. The amount of shares of our common stock issued in connection with an investment or acquisition could constitute a material portion of our then-outstanding shares of our common stock. Any issuance of additional securities in connection with investments or acquisitions may result in additional dilution to you.
35
Future sales, or the perception of future sales, of our common stock, by us or our existing stockholders in the public market could cause the market price for our common stock to decline.
The sale of substantial amounts of shares of our common stock in the public market, or the perception that such sales could occur, including sales by Silver Lake, could harm the prevailing market price of shares of our common stock. These sales, or the possibility that these sales may occur, also might make it more difficult for us to sell equity securities in the future at a time and at a price that we deem appropriate.
Shares held by Silver Lake and certain of our directors, officers and employees are eligible for resale, subject to volume, manner of sale and other limitations under Rule 144, and subject to transfer restrictions applicable to certain members of our management and Silver Lake who are party to our stockholders’ agreement. In addition, pursuant to our stockholders’ agreement, Silver Lake has the right, subject to certain conditions, to require us to register the sale of their shares of our common stock under the Securities Act of 1933 (as amended, the “Securities Act”). Certain of our stockholders will also have “piggyback” registration rights with respect to future registered offerings of our common stock.
If such registration rights are exercised, the market price of our shares of common stock could drop significantly. This could also make it more difficult for us to raise additional funds through future offerings of our shares of common stock or other securities.
Anti-takeover provisions in our organizational documents could delay or prevent a change of control.
Certain provisions of our amended and restated certificate of incorporation and amended and restated bylaws may have an anti-takeover effect and may delay, defer or prevent a merger, acquisition, tender offer, takeover attempt, or other change of control transaction that a stockholder might consider in its best interest, including those attempts that might result in a premium over the market price for the shares held by our stockholders.
These provisions provide for, among other things:
These anti-takeover provisions could make it more difficult for a third party to acquire us, even if the third party’s offer may be considered beneficial by many of our stockholders. As a result, our stockholders may be limited in their ability to obtain a premium for their shares.
Our Board of Directors is authorized to issue and designate shares of our preferred stock in additional series without stockholder approval.
Our amended and restated certificate of incorporation authorizes our Board of Directors, without the approval of our stockholders, to issue 250,000,000 shares of our preferred stock, subject to limitations prescribed by applicable law, rules and regulations and the provisions of our amended and restated certificate of incorporation, as shares of preferred stock in series, to establish from time to time the number of shares to be included in each such series and to fix the designation, powers, preferences and rights of the shares of each such series and the qualifications, limitations or restrictions thereof. The powers, preferences and rights of these additional series of preferred stock may be senior to or on parity with our common stock, which may reduce its value.
36
Our amended and restated certificate of incorporation provides, subject to limited exceptions, that state and federal courts (as appropriate) located within the State of Delaware will be the sole and exclusive forum for certain stockholder litigation matters, which could limit our stockholders’ ability to obtain a favorable judicial forum for disputes with us or our directors, officers, employees or stockholders.
Our amended and restated certificate of incorporation provides, subject to limited exceptions, that unless we consent to the selection of an alternative forum, the state or federal courts (as appropriate) located within the State of Delaware shall, to the fullest extent permitted by law, be the sole and exclusive forum for any (i) derivative action or proceeding brought on behalf of our company, (ii) action asserting a claim of breach of a fiduciary duty owed by any director, officer, or other employee or stockholder of our company to the Company or our stockholders, creditors or other constituents, (iii) action asserting a claim against the Company or any director or officer of the Company arising pursuant to any provision of the Delaware General Corporation Law, or the DGCL, or our amended and restated certificate of incorporation or our amended and restated bylaws or as to which the DGCL confers jurisdiction on the Court of Chancery of the State of Delaware, or (iv) action asserting a claim against the Company or any director or officer of the Company governed by the internal affairs doctrine. The choice of forum provision described in the preceding sentence does not apply to claims brought under the Securities Act or the Securities Exchange Act of 1934 (as amended, the “Exchange Act”), meaning that nothing in our amended and restated certificate of incorporation or amended and restated by-laws will preclude stockholders that assert claims under the Securities Act or the Exchange Act, from bringing such claims in state or federal court, subject to applicable law. Our exclusive forum provision shall not relieve the Company of its duties to comply with the federal securities laws and the rules and regulations thereunder, and our stockholders will not be deemed to have waived our compliance with these laws, rules and regulations. Further, stockholders may not waive their rights under the Exchange Act, including their right to bring suit.
Any person or entity purchasing or otherwise acquiring any interest in shares of our capital stock shall be deemed to have notice of and consented to the forum provisions in our amended and restated certificate of incorporation. This choice of forum provision may limit a stockholder’s ability to bring a claim in a judicial forum that it finds favorable for disputes with us or any of our directors, officers, other employees or stockholders which may discourage lawsuits with respect to such claims. Alternatively, if a court were to find the choice of forum provision contained in our amended and restated certificate of incorporation to be inapplicable or unenforceable in an action, we may incur additional costs associated with resolving such action in other jurisdictions, which could harm our business, operating results, and financial condition.
General Risk Factors
Failure to comply with requirements to design, implement and maintain effective internal controls could have a material adverse effect on our business and stock price, and any failure to maintain financial controls could result in our financial statements becoming unreliable.
As a public company, we have significant requirements for enhanced financial reporting and internal controls. We have made, and will continue to make, changes to our internal controls and procedures for financial reporting and accounting systems to meet our reporting obligations as a public company. The process of designing and implementing effective internal controls is a continuous effort that requires us to anticipate and react to changes in our business and the economic and regulatory environments and to expend significant resources to maintain a system of internal controls that is adequate to satisfy our reporting obligations as a public company. The measures we may take may not be sufficient to satisfy our obligations as a public company and if we are unable to establish or maintain appropriate internal financial reporting controls and procedures, it could cause us to fail to meet our reporting obligations on a timely basis, result in material misstatements in our consolidated financial statements, and harm our operating results. The rules governing the standards that must be met for our management to assess our internal control over financial reporting are complex and require significant documentation, testing and possible remediation. Testing and maintaining internal controls may divert our management’s attention from other matters that are important to our business.
In connection with the implementation of the necessary procedures and practices related to internal control over financial reporting, we may identify deficiencies, and we may encounter problems or delays in completing the remediation of any such deficiencies that we identify or that are identified by our independent registered public accounting firm in connection with the issuance of their attestation report. Our testing, or the subsequent testing (if required) by our independent registered public accounting firm, may reveal deficiencies in our internal controls over financial reporting that are deemed to be material weaknesses. Any material weaknesses could result in a material misstatement of our annual or quarterly consolidated financial statements or disclosures that may not be prevented or detected.
We may not be able to conclude on an ongoing basis that we have effective internal control over financial reporting in accordance with Section 404 or our independent registered public accounting firm may not issue an unqualified opinion. If either we are unable to conclude that we have effective internal control over financial reporting or our independent registered public accounting firm is unable to provide us with an unqualified report (to the extent it is required to issue a report), investors could lose confidence in our reported financial information, which could have a material adverse effect on the trading price of our common stock.
37
If securities or industry analysts do not publish research or reports about our business or if they downgrade our stock or our sector, our stock price and trading volume could decline.
The trading market for our common stock relies in part on the research and reports that industry or financial analysts publish about us or our business. We do not control these analysts. Furthermore, if one or more of the analysts who cover us downgrade our stock or our industry, or change their views regarding the stock of any of our competitors, or publish inaccurate or unfavorable research about our business, or if we fail to meet their expectations for our financial results, the price of our stock could decline. If one or more of these analysts ceases coverage of the Company or fails to publish reports on us regularly, we could lose visibility in the market, which in turn could cause our stock price or trading volume to decline.
Climate change may have a long-term impact on our business.
While we seek to partner with organizations that mitigate their business risks associated with climate change, we recognize that there are inherent risks wherever business is conducted. Access to clean water and reliable energy in the communities where we conduct our business, whether for our offices or for our vendors, is a priority. Our major sites in the United States and India are vulnerable to climate change effects. While this danger has a low-assessed risk of disrupting normal business operations, it has the potential impact on employees’ abilities to commute to work or to work from home and stay connected effectively. Climate-related events, including the increasing frequency of extreme weather events and their impact on the United States, India and other major regions’ critical infrastructure, have the potential to disrupt our business, our third-party suppliers and/or the business of our customers, and may cause us to experience higher attrition, losses and additional costs to maintain or resume operations.
Item 1B. Unresolved Staff Comments.
None.
Item 1C. Cybersecurity.
Risk Management and Strategy
We have processes in place for assessing, identifying, and managing material risks from potential unauthorized occurrences on or through our electronic information systems that could adversely affect the confidentiality, integrity, or availability of our information systems or the information residing on those systems. These include a wide variety of mechanisms, controls, technologies, methods, systems, and other processes that are designed to prevent, detect, mitigate or remediate data loss, theft, misuse, unauthorized access, or other security incidents or vulnerabilities affecting the data. The data includes confidential, proprietary, and business and personal information that we collect, process, store, and transmit as part of our business, including on behalf of third parties. We also use systems and processes designed to reduce the impact of a security incident impacting our data at a third-party vendor or customer. Additionally, we use processes to oversee and identify material risks from cybersecurity threats associated with our use of third-party technology and systems, including: technology and systems we use for encryption and authentication; employee email; content delivery to customers; back-office support; and other functions.
Our cybersecurity team is led by our interim chief information security officer (“CISO”), who directs a unified cross-functional team that is responsible for implementing and maintaining centralized cybersecurity and data protection practices at First Advantage. Our interim CISO has numerous years of experience at First Advantage and other organizations managing security infrastructure, providing a variety of security services, and overseeing incident response and management, escalation of security events, vulnerability scanning, and security defect management. Collectively, the interim CISO and our cybersecurity team act in close coordination with senior leadership and other teams across First Advantage. In addition to our extensive in-house cybersecurity capabilities, we engage assessors, consultants, auditors, or other third parties to help assess, identify, and manage cybersecurity risks.
Our cybersecurity risk management process forms a critical component of our overall risk management and business strategy. As part of our risk management process, we conduct application security assessments, vulnerability management, penetration testing, security audits, and ongoing risk assessments. Additionally, we utilize data encryption and access control, single sign-on and multi-factor authentication, and malware protection within our control environment. We also maintain a variety of incident response plans that are utilized when incidents are detected. These plans are designed to be flexible so that they may be adapted to an array of potential scenarios and provide for the creation of cross-functional cybersecurity incident response teams in the event of a cybersecurity incident. We regularly review our incident response plans and conduct multiple incident response exercises each year, including sessions with management, to test and assess our preparedness to respond to a cybersecurity incident. Additionally, we require employees with access to our information systems, including all corporate employees, to undertake data protection and cybersecurity training and compliance programs annually.
38
As part of our incident detection and response processes, we have established internal teams to investigate and escalate notification of cybersecurity incidents. Pursuant to this process, cybersecurity incidents are reported to appropriate personnel within First Advantage (including the interim CISO, Chief Financial Officer, and General Counsel) and to the Audit Committee and Board of Directors based on incident materiality. We track incidents through resolution, conduct post-incident analysis and update our processes and procedures if areas for improvement are identified. On a monthly basis, a summary of prior period cybersecurity investigation escalations is reviewed by management, including our head of Internal Audit, our interim CISO, our Chief Global Compliance Officer, and our General Counsel.
Governance
Our cybersecurity risks and associated mitigations are evaluated by senior leadership, including as part of our enterprise risk assessments that are reviewed by the Audit Committee and our Board of Directors. Such risks and related mitigation activities are also subject to oversight by the Audit Committee of our Board of Directors. The Audit Committee, which is comprised of independent directors, oversees our policies and procedures for protecting our cybersecurity infrastructure and for compliance with applicable data protection and security regulations, and related risks, including management’s response to any significant cybersecurity incidents. The Audit Committee receives regular reports, from our interim CISO and Chief Technology Officer, regarding the cybersecurity control environment, including remediation updates, control posture analyses and other recurring items, and reports to the Board of Directors at least quarterly.
Our business strategy, results of operations and financial condition have not been materially affected by risks from cybersecurity threats, including as a result of previously identified cybersecurity incidents, but we cannot provide assurance that they will not be materially affected in the future by such risks or any future material incidents.
Additional information about cybersecurity risks we face is discussed in Item 1A of Part I, “Risk Factors,” under the heading “Our business, brand, and reputation may be harmed as a result of security breaches, cyber-attacks, employee or other internal misconduct, computer viruses, or the mishandling of personal data” should be read in conjunction with the information above.
Item 2. Properties.
Our corporate office is located at 1 Concourse Parkway NE, Suite 200, Atlanta, GA 30328 under a lease agreement that expires on January 31, 2030, with one five-year renewal option. This property also houses our executive offices. We also lease office space in Bangalore, India, where our Global Operating Center is located. Additionally, we lease office space in Fishers, Indiana; Nottingham, United Kingdom; Manila, Philippines; and Mumbai, India for certain significant operational and support functions. We believe that our executive and other offices are adequate for our immediate needs and that we will obtain additional or substitute space, as needed, on commercially reasonable terms.
In addition to leveraging public cloud vendors, we maintain data centers across the globe. Our public cloud vendors and data centers are fully PCI compliant and equipped with redundant power, cooling, and fire suppression. We also ensure that our data centers maintain connectivity to major internet service providers and are protected and surveilled by our Global Network Operations Center. In the event of a disaster or emergency, each data center can rely on a backup located outside of the primary site’s region where all critical data is replicated. In the event of a service failure, critical customer-facing solutions are set to resume service at the designated backup location.
Item 3. Legal Proceedings.
The information required under this Item 3 is set forth in Note 13 within “Notes to Consolidated Financial Statements” included in Part IV, Item 15 of this Annual Report and is incorporated herein by this reference.
Item 4. Mine Safety Disclosures.
Not applicable.
39
PART II
Item 5. Market for Registrant’s Common Equity, Related Stockholder Matters and Issuer Purchases of Equity Securities.
Market Information for Common Stock
On June 23, 2021, our common stock began trading on the Nasdaq under the symbol “FA.” Prior to that time, there was no public market for our common stock.
Holders of Record
As of February 23, 2024, the closing price of our common stock on the Nasdaq was $17.27 per share and we had 13 holders of record of our common stock. The actual number of stockholders is greater than this number of record holders, and includes stockholders who are beneficial owners but whose shares are held in street name by brokers and other nominees.
Dividend Policy
On August 8, 2023, the Company’s Board of Directors declared a one-time special cash dividend of $1.50 per share to stockholders of record at the close of business on August 21, 2023. The cash dividend was paid on August 31, 2023. Any further determination to pay dividends on our capital stock will be at the discretion of our Board of Directors, subject to applicable laws, and will depend on our financial condition, operating results, capital requirements, general business conditions, and other factors that our Board of Directors considers relevant.
Purchases of Equity Securities by the Issuer or Affiliated Purchaser
On August 2, 2022, the Company’s Board of Directors authorized the repurchase of up to $50.0 million of the Company’s common stock over the 12-month period ending August 2, 2023.
On November 8, 2022, the Company’s Board of Directors authorized an increase to the total available amount under its Repurchase Program to $150.0 million and extended the program through December 31, 2023.
On February 28, 2023, the Company’s Board of Directors authorized an increase to the total available amount under its Repurchase Program to $200.0 million.
On September 14, 2023, the Company announced that its Board of Directors approved a one-year extension of its share repurchase authorization, extending the previously authorized $200.0 million program through December 31, 2024.
As of February 23, 2024, the Company has repurchased 9.0 million shares of common stock for $119.5 million under the Repurchase Program. All share repurchases were made under the Company's publicly announced program, and there are no other programs under which the Company repurchases shares. The following information relates to the Company’s purchase of its common stock during each month within the fourth quarter of 2023:
Period |
|
Total Number of Shares Purchased |
|
|
Average Price |
|
|
Total Number of Shares Purchased as Part of Publicly Announced Plans or Programs |
|
|
Maximum Dollar Value of Shares that May Yet Be Purchased Under the Plans or Programs |
|
||||
October 1, 2023 through October 31, 2023 |
|
|
80,825 |
|
|
$ |
13.19 |
|
|
|
80,825 |
|
|
$ |
82,486,396 |
|
November 1, 2023 through November 30, 2023 |
|
|
151,535 |
|
|
$ |
13.25 |
|
|
|
151,535 |
|
|
$ |
80,478,639 |
|
December 1, 2023 through December 31, 2023 |
|
|
— |
|
|
$ |
— |
|
|
|
— |
|
|
$ |
80,478,639 |
|
Total |
|
|
232,360 |
|
|
$ |
13.23 |
|
|
|
232,360 |
|
|
$ |
80,478,639 |
|
Stock repurchases may be effected through open market repurchases at prevailing market prices, including through the use of block trades and trading plans intended to qualify under Rule 10b5-1 under the Exchange Act, privately-negotiated transactions, through other transactions in accordance with applicable securities laws, or a combination of these methods on such terms and in such amounts as the Company deems appropriate and will be funded from available capital. The Company is not obligated to repurchase any specific number of shares, and the timing, manner, value, and actual number of shares repurchased will depend on a variety of factors, including the Company’s stock price and liquidity requirements, other business considerations and general market and economic conditions. No shares will be purchased from SLP Fastball Aggregator, L.P. and its affiliates. The Company may discontinue or modify purchases without notice at any time. In connection with the execution of the Merger Agreement, the Company will be suspending purchases under its Repurchase Program.
40
Performance Graph
The following performance graph and related information shall not be deemed “soliciting material” or to be “filed” with the SEC, nor shall such information be incorporated by reference into any future filing under the Securities Act or the Exchange Act, whether made before or after the date hereof and irrespective of any general incorporation language in any such filing, or otherwise subject to the liabilities under the Securities Act or Exchange Act, except to the extent that we specifically incorporate it by reference into such filing.
The following graph depicts the total cumulative stockholder return on our common stock from the closing price on June 23, 2021, the first day of trading of our common stock on the Nasdaq, through December 31, 2023, relative to the performance of the Russell 2000 and S&P 500 Index. The graph assumes an initial investment of $100.00 at the close of trading on June 23, 2021 and that all dividends paid by the Company and the companies included in these indices have been reinvested. The performance shown in the graph below is not intended to forecast or be indicative of future stock price performance.
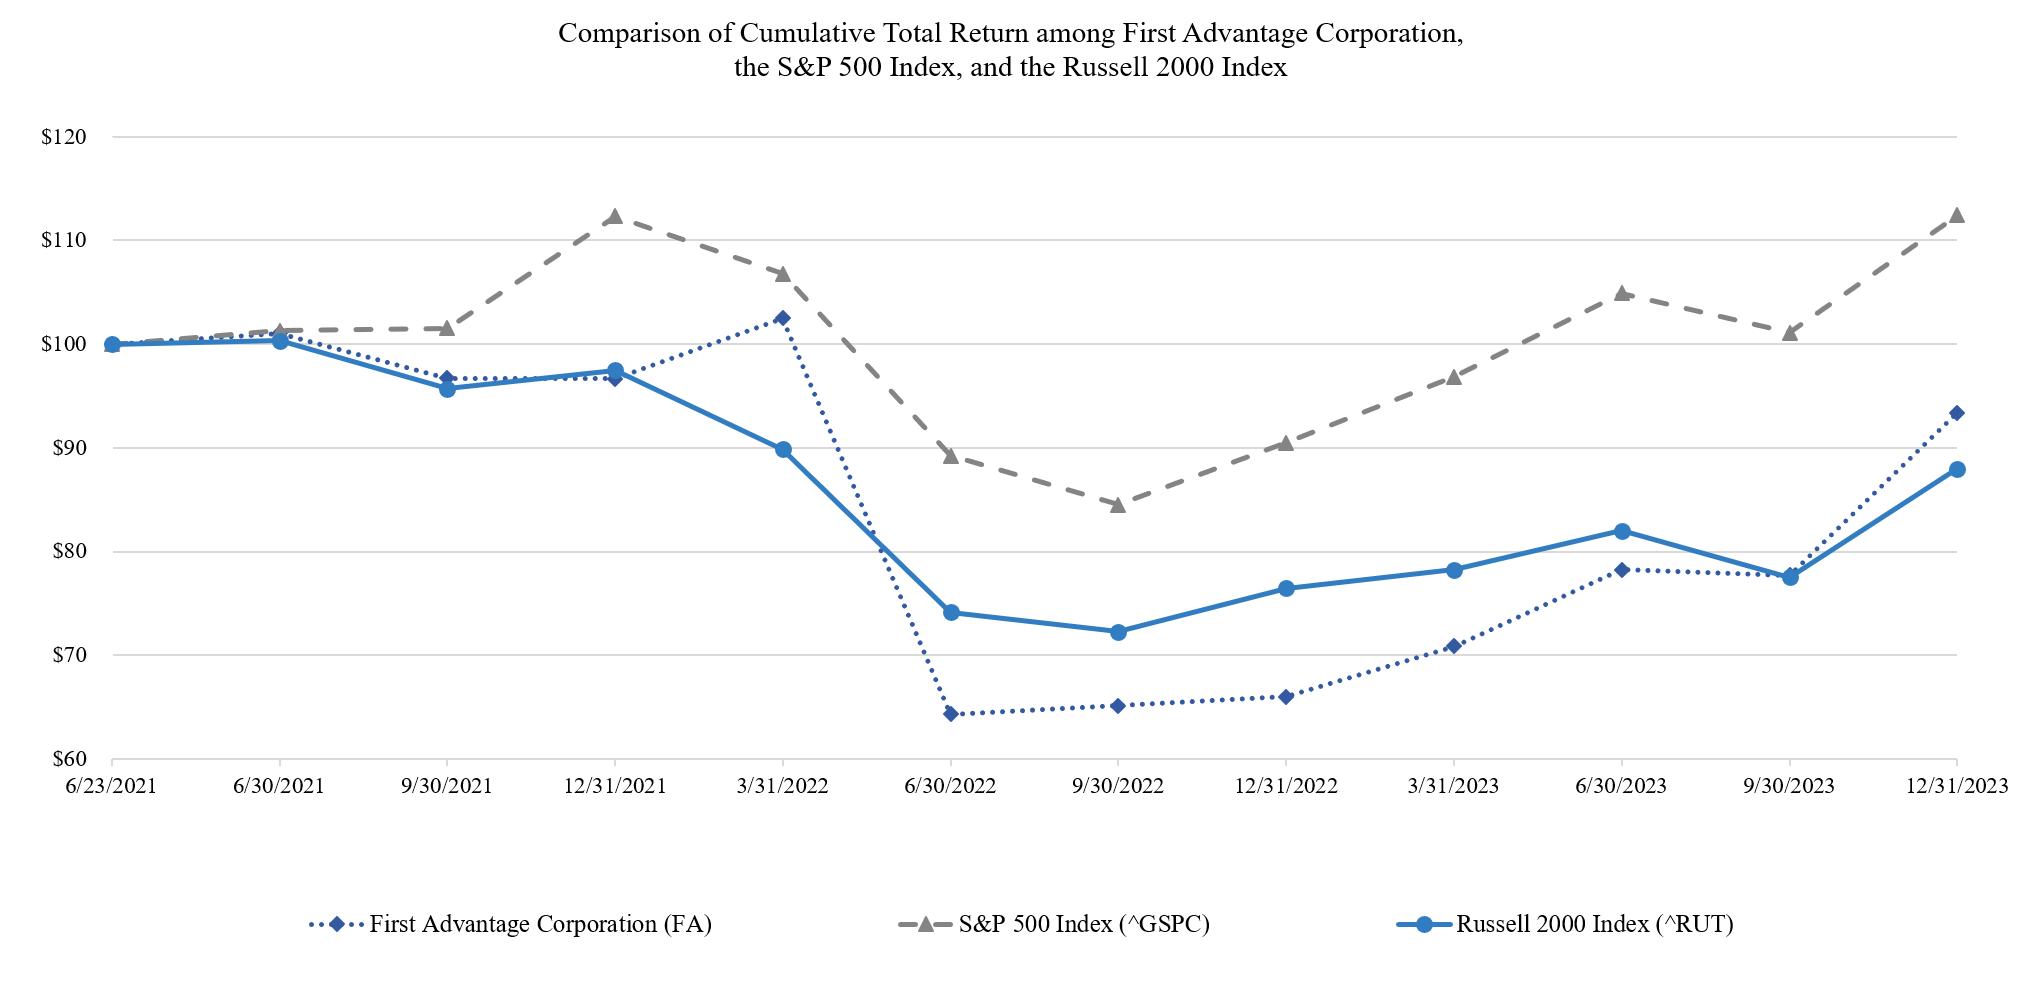
Item 6. [Reserved]
41
Item 7. Management’s Discussion and Analysis of Financial Condition and Results of Operations.
The following discussion and analysis is intended to help the reader understand the results of operations and financial condition of First Advantage and should be read in conjunction with our consolidated financial statements included elsewhere in this Annual Report. The discussion contains forward-looking statements involving risks, uncertainties and assumptions that could cause our results to differ materially from expectations. See “Cautionary Notice Regarding Forward-Looking Statements.” Factors that might cause such differences include those described in Item 1A. “Risk Factors” and elsewhere in this Annual Report.
Numerical figures included in this Annual Report have been subject to rounding adjustments. Accordingly, numerical figures shown as totals in various tables may not be arithmetic aggregations of the figures that precede them.
Overview
First Advantage is a leading provider of employment background screening, identity, and verification solutions. We deliver innovative services and insights that help our customers manage risk and hire the best talent. Enabled by our proprietary technology, we help companies protect their brands and provide safer environments for their customers and their most important resources: employees, contractors, contingent workers, tenants, and drivers.
Our comprehensive product suite includes criminal background checks, drug / health screening, extended workforce screening, biometrics and identity, education / work verifications, resident screening, fleet / driver compliance, executive screening, data analytics, continuous monitoring, social media monitoring, and hiring tax incentives. We derive a substantial majority of our revenues from pre-onboarding screening and perform screens in over 200 countries and territories, enabling us to serve as a one-stop-shop provider to both multinational companies and growth companies. Our more than 30,000 customers are global enterprises, mid-sized companies, and small companies, and our products and solutions are used by personnel in recruiting, human resources, risk, compliance, vendor management, safety, and/or security.
Our products are sold both individually and packaged. The First Advantage platform offers flexibility for customers to specify which products to include in their screening package, such as Social Security numbers, criminal records, education and work verifications, sex offender registry, and global sanctions. Generally, our customers order a background screening package or selected combination of screens related to a single individual before they onboard that individual. The type and mix of products and solutions we sell to a customer vary by customer size, their screening requirements, and industry vertical. Therefore, order volumes are not comparable across both customers and periods. Pricing can also vary considerably by customer depending on the product mix in their screening packages, order volumes, screening requirements and preferences, pass-through and third-party out of pocket costs, and bundling of products.
We enter into contracts with our customers that are typically three years in length. These contracts set forth the general terms and pricing of our products and solutions but generally do not include minimum order volumes or committed order volumes. Accordingly, contracts do not provide guarantees of future revenues. Due to our contract terms and the nature of the background screening industry, we determined our contract terms for ASC 606 purposes are less than one year. We typically bill our customers at the end of each month and recognize revenues as completed orders are reported or otherwise made available to our customers. Approximately 90% of the criminal searches performed in the United States are completed the same day they are submitted.
We generated revenues of $763.8 million for the year ended December 31, 2023, which represents a decline of 5.7% as compared to $810.0 million for the year ended December 31, 2022. Approximately 87% of our revenues for the year ended December 31, 2023 was generated in the Americas, predominantly in the U.S., while the remaining 13% was generated internationally. Other than the United States, no single country accounted for 10% or more of our total revenues for the year ended December 31, 2023.
Segments
We manage our business and report our financial results in two reportable segments, Americas and International:
42
Recent Developments
Pending Acquisition of Sterling Check Corp.
On February 28, 2024, we entered into the Merger Agreement providing for the acquisition of Sterling in a cash-and-stock transaction that values Sterling at approximately $2.2 billion.
In connection with the execution of the Merger Agreement, the Borrower, entered into a commitment letter with certain financial institutions that committed to provide, subject to the terms and conditions of the commitment letter, an incremental term loan in an aggregate principal amount of $1.820 billion and incremental revolving commitments in an aggregate principal amount of $150 million, in each case, under the Borrower’s existing credit agreement. Such financial institutions also agreed to extend the maturity date of the Borrower’s revolving credit facility from July 31, 2026 to the date that is the fifth anniversary of the closing date of the Acquisition.
The Acquisition is subject to satisfaction or waiver of customary closing conditions, including, among others, adoption of the Merger Agreement by Sterling stockholders, the expiration or termination of the waiting period under the HSR Act and clearance under the antitrust or foreign direct investment laws of certain other jurisdictions, and the effectiveness of a registration statement on Form S-4 to be filed by First Advantage in connection with the Acquisition.
Current Economic Conditions
Macroeconomic factors, including inflation, interest rates, recent declines in hiring activity and job openings, stability of the global banking system, global health crises, global supply chain constraints, and global economic and geopolitical developments, have negatively impacted significant portions of the global economy, and created volatility in the financial markets.
If the economic uncertainty is sustained or increases, we may experience a negative impact on new business, customer renewals and demand levels, sales and marketing efforts, revenues growth rates, customer deployments, customer collections, product development, or other financial metrics. Any of these factors could harm our business, financial condition, and operating results.
Despite the continuing uncertainty associated with these events, we are confident in the overall long-term health of our business, the strength of our product offerings, and our ability to continue to execute on our strategy and help our customers hire smarter and onboard faster. Our ability to deliver innovative products and solutions that enhance workplace safety and address compliance risks has contributed to the durability of our financial results.
For additional information, see Part I, Item 1A, “Risk Factors—Risks Related to Our Business—Macroeconomic factors beyond our control, including the state of the economy, could impact demand and the fulfillment costs for our products and solutions.”
Factors Affecting Operating Results
We believe that the future growth and profitability of our business depend on numerous factors, including the following:
Acquiring New Customers
We are focused on continuing to grow our customer base, particularly with respect to high-growth Enterprise customers in attractive industry verticals. In 2023, we performed approximately 100 million screens on behalf of more than 30,000 customers, spanning the globe and all major industry verticals. Our customer acquisition strategy depends on our ability to continue to cost-effectively offer innovative and comprehensive products and solutions, execute our verticalized go-to-market strategy, and maintain our reputation and brand. New customers typically begin generating revenues within one to three months of executing a contract and increase order volumes over the subsequent three to five month period. We believe there is opportunity to continue to increase our domestic and international market share, grow our international customer base, and increase adoption and expansion of screening and verification products and solutions.
43
M&A
We selectively evaluate acquisitions as a means to expand our business and to enter new markets. Over the last three years, we have completed the following acquisitions, including those that impact the comparability of our results between periods:
In March 2021, the Company completed its acquisition of selected assets and specified liabilities comprising the United Kingdom background screening business unit of a United Kingdom-based company. Results of operations have been included in our International segment from the date of the acquisition.
In November 2021, the Company acquired 100% of the equity interest of MultiLatin Advisors, S.A. de C.V. (“MultiLatin”), a Mexico-based background screening and verifications provider. This acquisition strategically expands the Company’s presence and screening capabilities in Latin America. Results of operations have been included in our Americas segment from the date of the acquisition.
In November 2021, the Company acquired 100% of the equity interest of Corporate Screening Services, LLC (“Corporate Screening”), a U.S.-based healthcare and higher education focused screening and compliance solutions provider headquartered in Cleveland, Ohio. Results of operations have been included in our Americas segment from the date of the acquisition.
In January 2022, the Company completed its asset acquisition of Form I-9 Compliance (“Form I-9”), a U.S.-based technology solution and consulting service provider for I-9 and E-Verify compliance. The acquisition was effective as of January 1, 2022 and strategically expands the Company’s product suite offerings through the addition of new I-9 and employment eligibility solutions. Results of operations have been included in our Americas segment from the effective date of the acquisition.
In September 2023, the Company acquired 100% of the equity interest of a U.S.-based digital identity and biometrics solutions company. The acquired company operates under the trade name Infinite ID. The acquisition expands the Company’s network and portfolio of identity solutions in the United States. Results of operations have been included in our Americas segment from the date of the acquisition.
As discussed above under “—Recent Developments—Pending Acquisition of Sterling Check Corp.,” we have entered into an agreement to acquire all of the outstanding shares of Sterling, which will impact the comparability of our results of operations in the future if consummated.
Expanding Wallet Share with Existing Customers
Our growth in revenues depends on our ability to sell more products and solutions to existing customers. We typically grow our revenues over time with customers as their underlying screening volumes grow and as they roll out our products and solutions to new divisions or geographies, increase our wallet share in multi-provider programs, perform more extensive screens, and purchase additional products and solutions such as identity solutions, continuous screening, hiring tax credits, employment eligibility, and fleet solutions. Our Customer Success teams work closely with our customers to further develop their screening, compliance, and risk management programs within their organization and in doing so, frequently identify opportunities to expand their relationship with First Advantage. Our revenue growth with existing customers is also dependent upon our ability to retain customers. We achieved a gross retention rate of approximately 97% for 2023.
Maintaining Performance Through Macroeconomic Environments
Our results are also impacted by our customers’ underlying business performance and hiring trends, which drive their demand for background screening and adjacent products. Our customers’ business can be affected by a variety of factors, including general economic conditions, hiring velocity and turnover, and other industry-related trends. We are also exposed to macroeconomic cyclicality, as companies typically reduce employee hiring and flexible workforces in weaker economic environments, which can impact demand for our products and solutions. Our ability to grow our business will also depend on the long-term strength, diversity, and durability of the verticals that we focus on and rely upon to drive our revenues.
Developing New Products to Expand Our Revenue Opportunity with Existing Customers
We plan to continue to expand our data solutions and adjacent sources of revenues. For example, we are currently investing in criminal and verifications data products and identity services. In addition, we are developing innovative solutions that align with our capabilities in areas such as biometric verification, fraud mitigation, driver and vehicle compliance, franchise screening programs, and remote drug testing.
44
Profitably Managing our Growth
Our ability to grow profitably depends on our ability to manage our cost structure. Our costs are affected by third-party costs including government fees and data vendors, as these third parties have discretion to adjust pricing, although these third-party fees are typically invoiced to our customers as pass-through costs. Continued pricing increases in third-party fees may lead our existing and potential customers to reduce the scope of their spending.
Our historical margin expansion has been largely driven by increased automation and deployment of RPA technologies in the background screening process, which has increased our speed, efficiency, quality, and operating leverage. Additionally, we have gained operating leverage from efficiencies and managing general and administrative costs. In order to grow profitably, we make strategic investments that generate incremental revenues and enable us to deliver our products and solutions and support our customers in a cost-effective manner. Our ability to innovate and drive future reductions of operating costs through automation and digitization does require upfront investment.
Recently Issued Accounting Standards
See Note 2 to the audited consolidated financial statements included elsewhere in this Annual Report for disclosure of the impact that recent accounting pronouncements may have on the consolidated financial statements.
Components of our Results of Operations
Revenues
The Company derives revenues from a variety of background screening and adjacent products that cover all phases of the workforce lifecycle from pre-onboarding screening services to post-onboarding and ongoing monitoring services, covering employees, contractors, contingent workers, tenants, and drivers. We generally classify our products and solutions into three major categories: pre-onboarding, post-onboarding, and adjacent products, each of which is enabled by our technology, proprietary internal databases, and data analytics capabilities. Pre-onboarding products, which comprise the substantial majority of our revenues, span an extensive array of products that customers typically utilize to enhance their applicant evaluation process and ensure compliance with their workforce onboarding criteria from the time an application is submitted to an applicant’s successful onboarding. Post-onboarding products are comprised of continuous monitoring, re-screening, and other solutions to help our customers keep their end customers, workforces, and other stakeholders safer, more productive, and more compliant. Adjacent products include products that complement our pre-onboarding and post-onboarding solutions such as fleet / vehicle compliance, hiring tax credits and incentives, resident / tenant screening, employment eligibility, and investigative research.
Our suite of products is available individually or through packaged solutions that can be configured and tailored according to our customers’ needs. We typically bill our customers at the end of each month and recognize revenues after completed orders are reported or otherwise made available to our customers, with a substantial majority of our customers’ orders completed the same day they are submitted. We recognize revenues for other products over time as the customer simultaneously receives and consumes the benefits of the products and solutions delivered.
Operating Expenses
We incur the following expenses related to our cost of revenues and operating expenses:
45
We have a flexible cost structure that allows our business to adjust quickly to the impacts of macroeconomic events and scale to meet the needs of large new customers. Operating expenses are influenced by the amount of revenues, customer mix, and product mix that contribute to our revenues for any given period. As revenues grow, we would generally expect cost of services to grow in a similar fashion, albeit influenced by the effects of automation, productivity, and other efficiency initiatives as well as customer and product mix shifts and third-party pass-through costs. We regularly review expenses and investments in the context of revenues growth and any shifts we identify in the business in order to align with our overall financial objectives. While we expect operating expenses to increase in absolute dollars to support our continued growth, we believe that, in the long term, operating expenses as a percentage of total revenues will decline gradually in the future as our business grows and our operating efficiency and automation initiatives continue to advance.
Other Expense, Net
Our other expense, net consists of the following:
Provision for Income Taxes
Provision for income taxes consists of domestic and foreign corporate income taxes related to earnings from our sale of services, with statutory tax rates that differ by jurisdiction. Our effective tax rate may be affected by many other factors including changes in tax laws, regulations or rates, new interpretations of existing laws or regulations, shifts in the allocation of income earned throughout the world, and changes in overall levels of income before tax.
46
Results of Operations
Comparison of Results of Operations for the Year Ended December 31, 2023 compared to the Year Ended December 31, 2022 and for the Year Ended December 31, 2022 compared to the Year Ended December 31, 2021
|
|
Year Ended December 31, |
|
|||||||||
(in thousands, except percentages) |
|
2023 |
|
|
2022 |
|
|
2021 |
|
|||
Revenues |
|
$ |
763,761 |
|
|
$ |
810,023 |
|
|
$ |
712,295 |
|
|
|
|
|
|
|
|
|
|
|
|||
Operating Expenses: |
|
|
|
|
|
|
|
|
|
|||
Cost of services (exclusive of depreciation and amortization below) |
|
|
386,777 |
|
|
|
408,928 |
|
|
|
352,170 |
|
Product and technology expense |
|
|
49,263 |
|
|
|
51,931 |
|
|
|
45,507 |
|
Selling, general, and administrative expense |
|
|
116,732 |
|
|
|
116,640 |
|
|
|
107,980 |
|
Depreciation and amortization |
|
|
129,473 |
|
|
|
138,246 |
|
|
|
142,815 |
|
Total operating expenses |
|
|
682,245 |
|
|
|
715,745 |
|
|
|
648,472 |
|
Income from operations |
|
|
81,516 |
|
|
|
94,278 |
|
|
|
63,823 |
|
|
|
|
|
|
|
|
|
|
|
|||
Other Expense, Net: |
|
|
|
|
|
|
|
|
|
|||
Interest expense, net |
|
|
33,040 |
|
|
|
9,199 |
|
|
|
24,972 |
|
Loss on extinguishment of debt |
|
|
— |
|
|
|
— |
|
|
|
13,938 |
|
Total other expense, net |
|
|
33,040 |
|
|
|
9,199 |
|
|
|
38,910 |
|
Income before provision for income taxes |
|
|
48,476 |
|
|
|
85,079 |
|
|
|
24,913 |
|
Provision for income taxes |
|
|
11,183 |
|
|
|
20,475 |
|
|
|
8,862 |
|
Net income |
|
$ |
37,293 |
|
|
$ |
64,604 |
|
|
$ |
16,051 |
|
Net income margin |
|
|
4.9 |
% |
|
|
8.0 |
% |
|
|
2.3 |
% |
47
Revenues
|
|
Year Ended December 31, |
|
|||||||||
(in thousands) |
|
2023 |
|
|
2022 |
|
|
2021 |
|
|||
Revenues |
|
|
|
|
|
|
|
|
|
|||
Americas |
|
$ |
673,075 |
|
|
$ |
694,865 |
|
|
$ |
604,413 |
|
International |
|
|
96,832 |
|
|
|
122,599 |
|
|
|
114,009 |
|
Eliminations |
|
|
(6,146 |
) |
|
|
(7,441 |
) |
|
|
(6,127 |
) |
Total revenues |
|
$ |
763,761 |
|
|
$ |
810,023 |
|
|
$ |
712,295 |
|
Revenues were $763.8 million for the year ended December 31, 2023, compared to $810.0 million for the year ended December 31, 2022. Revenues for the year ended December 31, 2023 decreased by $46.3 million, or 5.7%, compared to the year ended December 31, 2022.
The decrease in revenues was primarily due to a net decrease of $84.3 million, or 10.4%, in existing customer revenues, primarily driven by reduced demand from our customers more impacted by the macroeconomic conditions in 2023 (as compared to 2022), the elevated levels of growth experienced in the first half of 2022 due to the post-pandemic recovery that was not sustained into 2023, and the impact of lost accounts. In the Americas segment, certain industry verticals were impacted by reduced hiring activity, resulting in lower revenues. In the International segment, declines were more significantly experienced in the India and APAC markets relative to other markets in that segment. These consolidated decreases were partially offset by ongoing strength in upselling and cross-selling to existing customers, contributing $36.9 million, or 4.6%, of additional revenues, and increased revenues from certain existing customers that were impacted by macroeconomic conditions to a lesser extent as compared to other existing customers.
The decrease in existing customer revenues was offset by:
Pricing remained relatively stable across all periods.
Revenues were $810.0 million for the year ended December 31, 2022, compared to $712.3 million for the year ended December 31, 2021. Revenues for the year ended December 31, 2022 increased by $97.7 million, or 13.7%, compared to the year ended December 31, 2021.
The increase in revenues was primarily due to:
In 2022, the Company experienced growing demand among customers across numerous industry verticals and account sizes in both its Americas and International segments. However, during the second half of 2022, certain industry verticals in the Americas segment and select International segment markets experienced reduced revenue volumes as a result of macro-economic headwinds and negative foreign currency impacts due to strengthening of the U.S. Dollar. Pricing remained relatively stable across all periods.
48
Cost of Services
|
|
Year Ended December 31, |
|
|||||||||
(in thousands, except percentages) |
|
2023 |
|
|
2022 |
|
|
2021 |
|
|||
Cost of services |
|
$ |
386,777 |
|
|
$ |
408,928 |
|
|
$ |
352,170 |
|
Revenues |
|
|
763,761 |
|
|
|
810,023 |
|
|
|
712,295 |
|
Cost of services as a % of revenue |
|
|
50.6 |
% |
|
|
50.5 |
% |
|
|
49.4 |
% |
Cost of services was $386.8 million for the year ended December 31, 2023, compared to $408.9 million for the year ended December 31, 2022. Cost of services for the year ended December 31, 2023 decreased by $22.2 million, or 5.4%, compared to the year ended December 31, 2022.
The decrease in cost of services was primarily due to:
The decrease in cost of services was partially offset by foreign currency exchange losses of $1.6 million due to the impact of foreign exchange rate volatility.
Cost of services as a percentage of revenues was 50.6% for the year ended December 31, 2023, compared to 50.5% for the year ended December 31, 2022. The cost of services percentage of revenues for the year ended December 31, 2023 was impacted by increases in certain third-party data costs, primarily due to variation in customer ordering mix. This increase was partially offset by cost savings from the Company’s continued implementation of automation and other process efficiencies, as well as certain cost savings actions taken by the Company.
Cost of services was $408.9 million for the year ended December 31, 2022, compared to $352.2 million for the year ended December 31, 2021. Cost of services for the year ended December 31, 2022 increased by $56.8 million, or 16.1%, compared to the year ended December 31, 2021.
The increase in cost of services was primarily due to:
The increase in cost of services was partially offset by foreign currency exchange gains of $1.8 million due to the impact of foreign exchange rate volatility.
Cost of services as a percentage of revenues was 50.5% for the year ended December 31, 2022, compared to 49.4% for the year ended December 31, 2021. The cost of services percentage of revenues for the year ended December 31, 2022 was impacted by increases in certain third-party data costs, variation in customer ordering mix to lower margin products, and acquisitions having a larger mix of third-party data expenses. This increase was partially offset by cost savings from the Company’s continued implementation of automation and other process efficiencies, as well as certain cost savings actions taken by the Company in 2022.
49
Product and Technology Expense
|
|
Year Ended December 31, |
|
|||||||||
(in thousands) |
|
2023 |
|
|
2022 |
|
|
2021 |
|
|||
Product and technology expense |
|
$ |
49,263 |
|
|
$ |
51,931 |
|
|
$ |
45,507 |
|
Product and technology expense was $49.3 million for the year ended December 31, 2023, compared to $51.9 million for the year ended December 31, 2022. Product and technology expense for the year ended December 31, 2023 decreased by $2.7 million, or 5.1%, compared to the year ended December 31, 2022.
The decrease in product and technology expense was primarily due to a $2.9 million decrease in personnel expenses, primarily due to cost savings actions taken by the Company and decreases in incentive compensation, partially offset by increased share-based compensation expense.
The decrease in product and technology expense was partially offset by a $1.1 million increase in software licensing related expenses.
Product and technology expense was $51.9 million for the year ended December 31, 2022, compared to $45.5 million for the year ended December 31, 2021. Product and technology expense for the year ended December 31, 2022 increased by $6.4 million, or 14.1%, compared to the year ended December 31, 2021.
The increase in product and technology expense was primarily due to a $5.9 million increase in software licensing related expenses.
50
Selling, General, and Administrative Expense
|
|
Year Ended December 31, |
|
|||||||||
(in thousands) |
|
2023 |
|
|
2022 |
|
|
2021 |
|
|||
Selling, general, and administrative expense |
|
$ |
116,732 |
|
|
$ |
116,640 |
|
|
$ |
107,980 |
|
Selling, general, and administrative expense was $116.7 million for the year ended December 31, 2023, compared to $116.6 million for the year ended December 31, 2022. Selling, general, and administrative expense for the year ended December 31, 2023 increased by $0.1 million, or 0.1%, compared to the year ended December 31, 2022.
Selling, general, and administrative expense increased primarily due to:
The increase in selling, general, and administrative expense was partially offset by:
Selling, general, and administrative expense was $116.6 million for the year ended December 31, 2022, compared to $108.0 million for the year ended December 31, 2021. Selling, general, and administrative expense for the year ended December 31, 2022 increased by $8.7 million, or 8.0%, compared to the year ended December 31, 2021.
Selling, general, and administrative expense increased primarily due to:
The increase in selling, general, and administrative expense was partially offset by:
51
Depreciation and Amortization
|
|
Year Ended December 31, |
|
|||||||||
(in thousands) |
|
2023 |
|
|
2022 |
|
|
2021 |
|
|||
Depreciation and amortization |
|
$ |
129,473 |
|
|
$ |
138,246 |
|
|
$ |
142,815 |
|
Depreciation and amortization was $129.5 million for the year ended December 31, 2023, compared to $138.2 million for the year ended December 31, 2022. Depreciation and amortization for the year ended December 31, 2023 decreased by $8.8 million, or 6.3% compared to the year ended December 31, 2022. This decrease was partially offset by increases in depreciation related to assets placed in service during the year ended December 31, 2023.
Depreciation and amortization was $138.2 million for the year ended December 31, 2022, compared to $142.8 million for the year ended December 31, 2021. Depreciation and amortization for the year ended December 31, 2022 decreased by $4.6 million, or 3.2% compared to the year ended December 31, 2021. This decrease was partially offset by increases in depreciation related to assets placed in service during the year ended December 31, 2022.
Interest Expense, Net
|
|
Year Ended December 31, |
|
|||||||||
(in thousands) |
|
2023 |
|
|
2022 |
|
|
2021 |
|
|||
Interest expense, net |
|
$ |
33,040 |
|
|
$ |
9,199 |
|
|
$ |
24,972 |
|
Interest expense, net was $33.0 million for the year ended December 31, 2023, compared to $9.2 million for the year ended December 31, 2022. Interest expense, net for the year ended December 31, 2023 increased by $23.8 million, or 259.2%, compared to the year ended December 31, 2022.
The increase in interest expense was primarily attributable to higher interest expense on the First Lien Credit Facility as a result of increasing interest rates and fluctuations in unrealized gains and losses on the Company’s interest swaps resulting from interest rate volatility. Increases in interest expense were offset by interest income of $13.4 million earned on cash held within interest bearing accounts.
Interest expense, net was $9.2 million for the year ended December 31, 2022, compared to $25.0 million for the year ended December 31, 2021. Interest expense, net for the year ended December 31, 2022 decreased by $15.8 million, or 63.2%, compared to the year ended December 31, 2021.
The decrease in interest expense, net was primarily attributable to $12.4 million of unrealized gains on the interest rate swap as a result of the increased interest rate volatility observed in 2022. This decrease was further impacted by the Company’s February 2021 refinancing of the First Lien Credit Facility, early repayment of the Second Lien Credit Facility, and the prepayment of $200.0 million of the First Lien Credit Facility in June 2021, resulting in interest rate savings due to lower principal and more favorable interest rate margins, and $5.0 million of interest income earned on cash held within interest bearing accounts. These decreases were partially offset by higher interest expense on the First Lien Credit Facility as a result of rising interest rates in 2022.
Loss on Extinguishment of Debt
|
|
Year Ended December 31, |
|
|||||||||
(in thousands) |
|
2023 |
|
|
2022 |
|
|
2021 |
|
|||
Loss on extinguishment of debt |
|
$ |
— |
|
|
$ |
— |
|
|
$ |
13,938 |
|
Loss on extinguishment of debt for the year ended December 31, 2021 relates to expenses stemming from the write-off of debt issuance costs associated with the February 2021 refinancing of the First Lien Credit Facility.
52
Provision for Income Taxes
|
|
Year Ended December 31, |
|
|||||||||
(in thousands) |
|
2023 |
|
|
2022 |
|
|
2021 |
|
|||
Provision for income taxes |
|
$ |
11,183 |
|
|
$ |
20,475 |
|
|
$ |
8,862 |
|
Our provision for income taxes was $11.2 million for the year ended December 31, 2023, compared to $20.5 million for the year ended December 31, 2022. Our provision for income taxes for the year ended December 31, 2023 decreased by $9.3 million, compared to the year ended December 31, 2022.
The decrease in our provision for income taxes was primarily due to the decrease of income before income taxes during the year ended December 31, 2023, as compared to the year ended December 31, 2022, and the decrease of GILTI inclusion.
Our provision for income taxes was $20.5 million for the year ended December 31, 2022, compared to $8.9 million for the year ended December 31, 2021. Our provision for income taxes for the year ended December 31, 2022 increased by $11.6 million, compared to the year ended December 31, 2021.
The increase in our provision for income taxes was primarily due to the increase of income before income taxes during the year ended December 31, 2022, as compared to the year ended December 31, 2021, due to higher levels of pre-tax income as well as increases due to increased GILTI inclusion and lower research and development credits.
Net Income and Net Income Margin
|
|
Year Ended December 31, |
|
|||||||||
(in thousands, except percentages) |
|
2023 |
|
|
2022 |
|
|
2021 |
|
|||
Net income |
|
$ |
37,293 |
|
|
$ |
64,604 |
|
|
$ |
16,051 |
|
Net income margin |
|
|
4.9 |
% |
|
|
8.0 |
% |
|
|
2.3 |
% |
Net income was $37.3 million for the year ended December 31, 2023, compared to $64.6 million for the year ended December 31, 2022. Net income for the year ended December 31, 2023 decreased by $27.3 million, or 42.3%, compared to the year ended December 31, 2022.
Net income margin was 4.9% for the year ended December 31, 2023, compared to 8.0% the year ended December 31, 2022, as reduced demand from customers more impacted by macroeconomic events contributed to lower revenues and increasing interest rates resulting from interest rate volatility resulted in lower profitability.
Net income was $64.6 million for the year ended December 31, 2022, compared to $16.1 million for the year ended December 31, 2021. Net income for the year ended December 31, 2022 increased by $48.6 million, or 302.5%, compared to the year ended December 31, 2021.
Net income margin was 8.0% for the year ended December 31, 2022, compared to 2.3% the year ended December 31, 2021. The improvement in our net income margin is attributable to our ability to leverage operating efficiencies to control our overall expenses while increasing revenues as well as reducing interest and other debt related expenses incurred as a result of the February 2021 refinancing.
Key Operating and Financial Metrics
In addition to our results determined in accordance with GAAP, we believe certain measures are useful in evaluating our operating performance. Management believes these non-GAAP measures are useful to investors in highlighting trends in our operating performance, while other measures can differ significantly depending on long-term strategic decisions regarding capital structure, the tax jurisdictions in which we operate, and capital investments. Management uses Adjusted EBITDA, Adjusted EBITDA Margin, Adjusted Net Income, and Adjusted Diluted Earnings Per Share to supplement GAAP measures of performance in the evaluation of the effectiveness of our business strategies, to make budgeting decisions, to establish discretionary annual incentive compensation, and to compare our performance against that of other peer companies using similar measures. Management supplements GAAP results with non-GAAP financial measures to provide a more complete understanding of the factors and trends affecting the business than GAAP results alone.
The presentations of these measures have limitations as analytical tools and should not be considered in isolation or as a substitute for analysis of our results as reported under GAAP. Because not all companies use identical calculations, the presentations of these measures may not be comparable to other similarly titled measures of other companies and can differ significantly from company to company. A reconciliation is provided below for each non-GAAP financial measure to the most directly comparable financial measure stated in accordance with GAAP.
53
Adjusted EBITDA and Adjusted EBITDA Margin
Management believes that Adjusted EBITDA is a strong indicator of our overall operating performance and is useful to management and investors as a measure of comparative operating performance from period to period. We define Adjusted EBITDA as net income before interest, taxes, depreciation, and amortization, and as further adjusted for loss on extinguishment of debt, share-based compensation, transaction and acquisition-related charges, integration and restructuring charges, and other non-cash charges. We exclude the impact of share-based compensation because it is a non-cash expense and we believe that excluding this item provides meaningful supplemental information regarding performance and ongoing cash generation potential. We exclude loss on extinguishment of debt, transaction and acquisition related charges, integration and restructuring charges, and other charges because such expenses are episodic in nature and have no direct correlation to the cost of operating our business on an ongoing basis.
Adjusted EBITDA was $237.6 million, $248.9 million, and $226.3 million for the years ended December 31, 2023, 2022, and 2021, respectively. This represented an Adjusted EBITDA Margin of 31.1%, 30.7%, and 31.8% for the years ended December 31, 2023, 2022, and 2021, respectively.
Adjusted EBITDA for the year ended December 31, 2023 decreased by $11.4 million, or 4.6%, compared to the year ended December 31, 2022, as macroeconomic events impacted our revenues attributed to existing customers. Decreases were further impacted by the effects of changes in foreign currencies. These decreases were partially offset by increased revenues from certain existing and new customers, including ongoing strength in upselling and cross-selling, cost structure benefits due to increased automation, operational efficiencies, and certain other cost savings actions taken by the Company in late 2022 and into 2023.
Adjusted EBITDA for the year ended December 31, 2022 increased by $22.6 million, or 10.0%, compared to the year ended December 31, 2021. For the year ended December 31, 2022, Adjusted EBITDA increased due to revenues growth attributed to new and existing customers, primarily driven by strength across our business during the first half of the year and further supported by certain cost reductions implemented primarily in the second half of the year. These positive factors were partially offset by increases in insurance premiums and third-party data verification costs, additional investments in technology and sales, the effects of changes in foreign currencies, and lower margin revenues from our acquisitions.
The following table presents a reconciliation of Adjusted EBITDA for the periods presented.
|
|
Year Ended December 31, |
|
|||||||||
(in thousands) |
|
2023 |
|
|
2022 |
|
|
2021 |
|
|||
Net income |
|
$ |
37,293 |
|
|
$ |
64,604 |
|
|
$ |
16,051 |
|
Interest expense, net |
|
|
33,040 |
|
|
|
9,199 |
|
|
|
24,972 |
|
Provision for income taxes |
|
|
11,183 |
|
|
|
20,475 |
|
|
|
8,862 |
|
Depreciation and amortization |
|
|
129,473 |
|
|
|
138,246 |
|
|
|
142,815 |
|
Loss on extinguishment of debt |
|
|
— |
|
|
|
— |
|
|
|
13,938 |
|
Share-based compensation(a) |
|
|
15,265 |
|
|
|
7,856 |
|
|
|
9,530 |
|
Transaction and acquisition-related charges(b) |
|
|
4,364 |
|
|
|
6,018 |
|
|
|
9,314 |
|
Integration, restructuring, and other charges(c) |
|
|
6,938 |
|
|
|
2,512 |
|
|
|
812 |
|
Adjusted EBITDA |
|
$ |
237,556 |
|
|
$ |
248,910 |
|
|
$ |
226,294 |
|
We define Adjusted EBITDA Margin as Adjusted EBITDA divided by total revenues. The following table presents the calculation of Adjusted EBITDA Margin for the periods presented.
|
|
Year Ended December 31, |
|
|||||||||
(in thousands, except percentages) |
|
2023 |
|
|
2022 |
|
|
2021 |
|
|||
Adjusted EBITDA |
|
$ |
237,556 |
|
|
$ |
248,910 |
|
|
$ |
226,294 |
|
Revenues |
|
|
763,761 |
|
|
|
810,023 |
|
|
|
712,295 |
|
Adjusted EBITDA Margin |
|
|
31.1 |
% |
|
|
30.7 |
% |
|
|
31.8 |
% |
54
The following table presents a calculation of Adjusted EBITDA and Adjusted EBITDA Margin by segment for the periods presented. Refer to Note 17 to the consolidated financial statements included elsewhere in this Annual Report for a reconciliation of Adjusted EBITDA for the periods presented by segment.
|
|
Year Ended December 31, |
|
|||||||||
(in thousands, except percentages) |
|
2023 |
|
|
2022 |
|
|
2021 |
|
|||
Adjusted EBITDA (1) |
|
|
|
|
|
|
|
|
|
|||
Americas |
|
$ |
221,645 |
|
|
$ |
221,655 |
|
|
$ |
198,473 |
|
International |
|
|
15,911 |
|
|
|
27,255 |
|
|
|
27,821 |
|
Adjusted EBITDA |
|
$ |
237,556 |
|
|
$ |
248,910 |
|
|
$ |
226,294 |
|
|
|
|
|
|
|
|
|
|
|
|||
Revenues |
|
|
|
|
|
|
|
|
|
|||
Americas |
|
$ |
673,075 |
|
|
$ |
694,865 |
|
|
$ |
604,413 |
|
International |
|
|
96,832 |
|
|
|
122,599 |
|
|
|
114,009 |
|
Less: intersegment eliminations |
|
|
(6,146 |
) |
|
|
(7,441 |
) |
|
|
(6,127 |
) |
Total revenues |
|
$ |
763,761 |
|
|
$ |
810,023 |
|
|
$ |
712,295 |
|
|
|
|
|
|
|
|
|
|
|
|||
Adjusted EBITDA Margin |
|
|
|
|
|
|
|
|
|
|||
Americas |
|
|
32.9 |
% |
|
|
31.9 |
% |
|
|
32.8 |
% |
International |
|
|
16.4 |
% |
|
|
22.2 |
% |
|
|
24.4 |
% |
Adjusted EBITDA Margin |
|
|
31.1 |
% |
|
|
30.7 |
% |
|
|
31.8 |
% |
Adjusted Net Income and Adjusted Diluted Earnings Per Share
Similar to Adjusted EBITDA, management believes that Adjusted Net Income and Adjusted Diluted Earnings Per Share are strong indicators of our overall operating performance and are useful to our management and investors as measures of comparative operating performance from period to period. We define Adjusted Net Income for a particular period as net income before taxes adjusted for debt-related costs, acquisition-related depreciation and amortization, share-based compensation, transaction and acquisition related charges, integration and restructuring charges, and other non-cash charges, to which we then apply the related effective tax rate. We define Adjusted Diluted Earnings Per Share as Adjusted Net Income divided by adjusted weighted average number of shares outstanding—diluted.
Adjusted Net Income was $145.8 million, $156.5 million, and $142.4 million for the years ended December 31, 2023, 2022, and 2021, respectively. Adjusted Diluted Earnings Per Share was $1.00, $1.03, and $1.01 for the years ended December 31, 2023, 2022, and 2021, respectively.
Adjusted Net Income for the year ended December 31, 2023 decreased by $10.7 million, or 6.8%, compared to the year ended December 31, 2022. Adjusted Diluted Earnings Per Share for the year ended December 31, 2023 decreased by $0.03, or 2.9%, compared to the year ended December 31, 2022. Adjusted Net Income and Adjusted Diluted Earnings Per Share declined during the year ended December 31, 2023, as reduced demand from customers more impacted by macroeconomic events contributed to lower revenues and profitability. Adjusted Net Income and Adjusted Diluted Earnings Per Share were further impacted by changes in acquisition-related depreciation and amortization and changes in our capital structure that are captured in interest expense. Gains or losses and actual cash payments and receipts on the Company’s interest rate swaps impact the comparability of Adjusted Net Income and Adjusted Diluted Earnings Per Share across historical periods. Adjusted Diluted Earnings Per Share is further impacted by shares repurchased under the Company’s Repurchase Program.
Adjusted Net Income for the year ended December 31, 2022 increased by $14.1 million, or 9.9%, compared to the year ended December 31, 2021. Adjusted Diluted Earnings Per Share for the year ended December 31, 2022 increased by $0.02, or 2.0%, compared to the year ended December 31, 2021. Adjusted Net Income and Adjusted Diluted Earnings Per Share were impacted by changes in acquisition-related depreciation and amortization and changes in our capital structure that are captured in interest expense across all periods, the impacts of which were offset by the factors contributing to Adjusted EBITDA growth year over year. The prepayment of the Company’s First Lien and Second Lien debt and gains or losses and actual cash payments and receipts on the Company’s interest rate swaps impact the comparability of Adjusted Net Income and Adjusted Diluted Earnings Per Share across historical periods.
55
The following table presents a reconciliation of Adjusted Net Income for the periods presented.
|
|
Year Ended December 31, |
|
|||||||||
(in thousands) |
|
2023 |
|
|
2022 |
|
|
2021 |
|
|||
Net income |
|
$ |
37,293 |
|
|
$ |
64,604 |
|
|
$ |
16,051 |
|
Provision for income taxes |
|
|
11,183 |
|
|
|
20,475 |
|
|
|
8,862 |
|
Income before provision for income taxes |
|
|
48,476 |
|
|
|
85,079 |
|
|
|
24,913 |
|
Debt-related charges(a) |
|
|
12,845 |
|
|
|
(9,569 |
) |
|
|
20,143 |
|
Acquisition-related depreciation and amortization(b) |
|
|
102,659 |
|
|
|
115,944 |
|
|
|
126,865 |
|
Share-based compensation(c) |
|
|
15,265 |
|
|
|
7,856 |
|
|
|
9,530 |
|
Transaction and acquisition-related charges(d) |
|
|
4,364 |
|
|
|
6,018 |
|
|
|
9,314 |
|
Integration, restructuring, and other charges(e) |
|
|
6,938 |
|
|
|
2,512 |
|
|
|
812 |
|
Adjusted Net Income before income tax effect |
|
|
190,547 |
|
|
|
207,840 |
|
|
|
191,577 |
|
Less: Adjusted income taxes(f) |
|
|
44,759 |
|
|
|
51,378 |
|
|
|
49,178 |
|
Adjusted Net Income |
|
$ |
145,788 |
|
|
$ |
156,462 |
|
|
$ |
142,399 |
|
The following table presents the calculation of Adjusted Diluted Earnings Per Share for the periods presented.
|
|
Year Ended December 31, |
|
|||||||||
|
|
2023 |
|
|
2022 |
|
|
2021 |
|
|||
Diluted net income per share (GAAP) |
|
$ |
0.26 |
|
|
$ |
0.43 |
|
|
$ |
0.11 |
|
Adjusted Net Income adjustments per share |
|
|
|
|
|
|
|
|
|
|||
Provision for income taxes |
|
|
0.08 |
|
|
|
0.13 |
|
|
|
0.06 |
|
Debt-related charges(a) |
|
|
0.09 |
|
|
|
(0.06 |
) |
|
|
0.14 |
|
Acquisition-related depreciation and amortization(b) |
|
|
0.70 |
|
|
|
0.76 |
|
|
|
0.90 |
|
Share-based compensation(c) |
|
|
0.10 |
|
|
|
0.05 |
|
|
|
0.07 |
|
Transaction and acquisition-related charges(d) |
|
|
0.03 |
|
|
|
0.04 |
|
|
|
0.07 |
|
Integration, restructuring, and other charges(e) |
|
|
0.05 |
|
|
|
0.02 |
|
|
|
0.01 |
|
Adjusted income taxes(f) |
|
|
(0.31 |
) |
|
|
(0.34 |
) |
|
|
(0.35 |
) |
Adjusted Diluted Earnings Per Share (Non-GAAP) |
|
$ |
1.00 |
|
|
$ |
1.03 |
|
|
$ |
1.01 |
|
|
|
|
|
|
|
|
|
|
|
|||
Weighted average number of shares outstanding used in computation of Adjusted Diluted Earnings Per Share: |
|
|
|
|
|
|
|
|
|
|||
Weighted average number of shares outstanding—diluted (GAAP and Non-GAAP) |
|
|
146,226,096 |
|
|
|
151,807,139 |
|
|
|
141,687,384 |
|
56
Liquidity and Capital Resources
Liquidity
The Company’s primary liquidity requirements are for working capital, continued investments in software development and other capital expenditures, and other strategic investments, including the Acquisition. In 2023, the Company fully utilized its remaining U.S. Federal income tax net operating loss carryforwards. As a result, income taxes will become a material use of funds, depending on our future profitability, and future tax rates. The Company’s liquidity needs are met primarily through existing balance sheet cash, cash flows from operations, as well as funds available under our revolving credit facility and proceeds from our term loan borrowings, including incremental term loan borrowings expected to be incurred to fund the Acquisition pursuant to a commitment letter entered into with certain financial institutions. Our cash flows from operations include cash received from customers, less cash costs to provide services to our customers, which includes general and administrative costs and interest payments.
As of December 31, 2023, we had $213.8 million in cash and cash equivalents and $100.0 million available under our revolving credit facility. As of December 31, 2023, we had $564.7 million of total debt outstanding. We believe our cash on hand, together with amounts available under our revolving credit facility, and cash provided by operating activities are and will continue to be adequate to meet our operational and business needs in the next twelve months. To the extent additional funds are necessary to meet our long-term liquidity needs as we continue to execute our business strategy, we anticipate that they will be obtained through the incurrence of additional indebtedness, additional equity financings or a combination of these potential sources of funds. In the event that we need access to additional cash, we may not be able to access the credit markets on commercially acceptable terms or at all. Our ability to fund future operating expenses and capital expenditures and our ability to meet future debt service obligations or refinance our indebtedness will depend on our future operating performance, which will be affected by general economic, financial, and other factors that may be beyond our control, including those described under “Risk Factors.”
Share Repurchase Program
On August 2, 2022, the Company’s Board of Directors authorized the repurchase of up to $50.0 million of the Company’s common stock over the 12-month period ending August 2, 2023. Stock repurchases may be effected through open market repurchases at prevailing market prices, including through the use of block trades and trading plans intended to qualify under Rule 10b5-1 under the Securities Exchange Act of 1934, as amended, privately-negotiated transactions, through other transactions in accordance with applicable securities laws, or a combination of these methods on such terms and in such amounts as the Company deems appropriate and will be funded from available capital. The Company is not obligated to repurchase any specific number of shares, and the timing, manner, value, and actual number of shares repurchased will depend on a variety of factors, including the Company’s stock price and liquidity requirements, other business considerations and general market and economic conditions. No shares will be purchased from SLP Fastball Aggregator, L.P. and its affiliates. The Company may discontinue or modify purchases without notice at any time. The Company has used and plans to use its existing cash to fund repurchases made under the share repurchase program.
On November 8, 2022, the Company’s Board of Directors authorized an increase to the total available amount under its Repurchase Program to $150.0 million and extended the program through December 31, 2023. On February 28, 2023, the Company’s Board of Directors authorized an increase to the total available amount under its Repurchase Program to $200.0 million. On September 14, 2023, the Company announced that its Board of Directors approved a one-year extension of its share repurchase authorization, extending the previously authorized $200.0 million program through December 31, 2024. Through February 23, 2023, the Company repurchased approximately $119.5 million of shares under the Repurchase Program. In connection with the execution of the Merger Agreement, the Company will be suspending purchases under its Repurchase Program.
Dividend
On August 8, 2023, the Company’s Board of Directors declared a one-time special cash dividend of $1.50 per share to stockholders of record at the close of business on August 21, 2023. An aggregate cash dividend of $217.7 million was paid on August 31, 2023 with cash from the balance sheet.
57
Long-Term Debt
In February 2020, a new financing structure was established consisting of a new First Lien Credit Agreement (“First Lien Agreement”) and a new Second Lien Credit Agreement (“Second Lien Agreement”) (collectively, the “Credit Agreements”). The First Lien Agreement provided financing in the form of a $670.0 million term loan due January 31, 2027 (“First Lien Credit Facility”) and a $75.0 million new revolving credit facility due January 31, 2025 (“Revolver”). The Second Lien Agreement provided financing in the form of a $145.0 million term loan due January 31, 2028 (“Second Lien Credit Facility”).
On February 1, 2021, we amended the First Lien Agreement to fund $100.0 million of additional first lien term loans and reduce the applicable margins by 0.25%. The refinancing resulted in a loss on extinguishment of debt of $5.1 million, composed of the write-off of $4.5 million of unamortized deferred financing costs and $0.6 million of accrued interest and miscellaneous fees. In addition, we fully repaid the outstanding Second Lien Agreement and recorded a loss on extinguishment of debt of $8.9 million, composed of the write-off of $7.3 million of unamortized deferred financing costs plus a $1.5 million prepayment premium, and $0.1 million of accrued interest and other miscellaneous fees.
In connection with the IPO, the Company entered into an amendment to increase the borrowing capacity under the Revolver from $75.0 million to $100.0 million and extend the maturity date from January 31, 2025 to July 31, 2026.
Borrowings under the First Lien Agreement bear interest at a rate per annum equal to an applicable margin plus, at our option, either (a) a base rate or (b) LIBOR, which is subject to a floor of 0.00% per annum. In June 2023, the Credit Agreement was amended to transition the reference rate from LIBOR to SOFR (the Secured Overnight Financing Rate as administered by the Federal Reserve Bank of New York), with the addition of an applicable margin. The applicable margins under the First Lien Agreement are subject to stepdowns based on our first lien net leverage ratio. In connection with the closing of the IPO, each applicable margin was reduced further by 0.25%. In addition, the borrower, First Advantage Holdings, LLC, which is an indirect wholly-owned subsidiary of the Company, is required to pay a commitment fee on any unutilized commitments under the revolving credit facility. The commitment fee rate ranges between 0.25% and 0.50% per annum based on our first lien net leverage ratio. The borrower is also required to pay customary letter of credit fees. The First Lien Credit Facility amortizes in equal quarterly installments in aggregate annual amounts equal to 1.00% of the principal amount. The Revolver has no amortization.
The First Lien Credit Facility requires the borrower to prepay outstanding term loans, subject to certain exceptions, with certain proceeds from non-ordinary course asset sales, issuance of debt not permitted by the credit agreement to be incurred and annual excess cash flows. In addition, any voluntary prepayment of term loans in connection with certain repricing transactions on or prior to August 1, 2021 were subject to a 1.00% prepayment premium. Otherwise, the borrower may voluntarily repay outstanding loans without premium or penalty, other than customary “breakage” costs.
In connection with the closing of the IPO, on June 30, 2021 the Company repaid $200.0 million of the First Lien Credit Facility outstanding, of which $44.3 million was applied to all of the remaining quarterly amortizing principal payments due under the First Lien Agreement. The remaining $564.7 million term loan is scheduled to mature on January 31, 2027. As a result of the prepayment, the Company recorded additional interest expense of $3.7 million associated with the accelerated amortization of the related deferred financing costs.
The First Lien Agreement is unconditionally guaranteed by Fastball Parent, Inc., a wholly-owned subsidiary of the Company and the direct parent of the borrower, and material wholly owned domestic restricted subsidiaries of Fastball Parent, Inc. The First Lien Agreement and the guarantees of such obligations, are secured, subject to permitted liens and other exceptions, by (1) a first priority security interest in certain tangible and intangible assets of the borrower and the guarantors and (2) a first-priority pledge of 100% of the capital stock of the borrower and of each wholly-owned material restricted subsidiary of the borrower and the guarantors (which pledge, in the case of any non-U.S. subsidiary of a U.S. subsidiary, does not include more than 65% of the voting stock of such non-U.S. subsidiary).
The First Lien Agreement contains customary affirmative covenants, negative covenants and events of default (including upon a change of control). The First Lien Agreement also includes a “springing” first lien net leverage ratio test, applicable only to the Revolver, that requires such ratio to be no greater than 7.75:1.00 on the last day of any fiscal quarter if more than 35.0% of the Revolver is utilized on such date.
58
Cash Flow Analysis
Comparison of Cash Flows for the Year Ended December 31, 2023 compared to the Year Ended December 31, 2022 and for the Year Ended December 31, 2022 compared to the Year Ended December 31, 2021
The following table is a summary of our cash flow activity for the periods presented:
|
|
Year Ended December 31, |
|
|||||||||
(in thousands) |
|
2023 |
|
|
2022 |
|
|
2021 |
|
|||
Net cash provided by operating activities |
|
$ |
162,820 |
|
|
$ |
212,770 |
|
|
$ |
148,677 |
|
Net cash used in investing activities |
|
|
(66,847 |
) |
|
|
(48,596 |
) |
|
|
(72,427 |
) |
Net cash (used in) provided by financing activities |
|
|
(273,556 |
) |
|
|
(59,154 |
) |
|
|
63,848 |
|
Cash Flows from Operating Activities
For the years ended December 31, 2023, 2022, and 2021, net cash provided by operating activities was $162.8 million, $212.8 million, and $148.7 million, respectively.
Cash flows from operating activities for the year ended December 31, 2023 were impacted by the continuation of more modest hiring activity from our customers in the Americas and softness internationally, resulting from the ongoing uncertainty from the economic environment that began to impact hiring demand in late 2022. Additionally, cash flows from operating activities in 2023 were impacted by a $9.7 million outflow due to working capital.
Cash flows from operating activities for the year ended December 31, 2022 were positively impacted by the Company’s revenue growth from existing customers, new customer go-lives, recent acquisitions and lower accounts receivable driven by cash collections from customers. These were partially offset with other changes in working capital, primarily accrued compensation.
Cash flows from operating activities for the year ended December 31, 2021 were positively impacted by increased profitability related to the Company’s revenue growth from existing customers, new customer go-lives, and the 2021 acquisitions. This was offset in part by the use of cash for working capital primarily due to the high level of revenue growth acceleration that remained in receivables at December 31, 2021, consistent with normal payment terms offered to our customers.
Cash Flows from Investing Activities
For the years ended December 31, 2023, 2022, and 2021, net cash used in investing activities was $66.8 million, $48.6 million, and $72.4 million, respectively.
The cash flows used in investing activities for the year ended December 31, 2023 were primarily impacted by the $41.1 million Infinite ID acquisition, net of cash acquired and other transaction adjustments. The remaining investing cash flows are driven primarily by capitalized software development costs and purchases of property and equipment as the Company continued to make incremental investments in its technology platform.
The cash flows used in investing activities for the year ended December 31, 2022 included the $19.1 million acquisition of Form I-9 Compliance, net of cash acquired. The remaining investing cash flows were driven primarily by capitalized software development costs and purchases of property and equipment, which increased in 2022 as the Company continued to make incremental investments in its technology platform.
The cash flows used in investing activities for the year ended December 31, 2021 included an aggregate of $48.9 million in purchase price for the three 2021 acquisitions. The remaining use of investing cash flows were driven primarily by capitalized software development costs and purchases of property and equipment, which increased in 2021 as we continued to make incremental investments in our technology and operations.
59
Cash Flows from Financing Activities
For the years ended December 31, 2023, 2022, and 2021, net cash (used in) provided by financing activities was $(273.6) million, $(59.2) million, and $63.8 million, respectively.
Net cash used in financing activities for the year ended December 31, 2023 were impacted by the Company’s one-time special cash dividend of $1.50 per share and shares repurchased under the Company’s Repurchase Program. An aggregate cash dividend of $217.7 million was paid on August 31, 2023. During the year ended December 31, 2023, the Company repurchased 4.4 million shares for a total cost of $59.0 million. These outflows were offset partially by cash inflows related to share-based compensation activity.
Net cash used in financing activities for the year ended December 31, 2022 were primarily driven by shares repurchased under the Company’s Repurchase Program. During the year ended December 31, 2022, 4.7 million shares were repurchased under the program at a total cost of $60.5 million. Additionally, the Company had additional outflows related to payments on capital lease obligations and deferred purchase of a software platform. These outflows were partially offset by share-based compensation activity.
Net cash provided by financing activities for the year ended December 31, 2021 was primarily driven by the Company’s completion of its IPO on June 25, 2021. Cash inflows related to the IPO were $320.6 million, partially offset by the use of proceeds which consisted of a $200.0 million repayment of the Company’s First Lien Credit Facility and $4.0 million of offering costs.
Net cash provided by financing activities for the year ended December 31, 2021 was incrementally driven by the Company’s February 2021 debt refinancing which consisted of a refinancing of the First Lien Credit Facility and the full repayment of the Second Lien Credit Facility. Cash outflows related to this refinancing were $308.5 million, partially offset by cash inflows of $261.4 million. As part of the refinancing, the Company paid $1.3 million related to new debt issuance costs. The remaining outflows primarily consisted of principal payments due under the First Lien Credit Facility, payments on capital lease obligations, a deferred purchase of a software platform, and share-based compensation activity.
Contractual Obligations and Commitments
Contractual obligations for the Company are comprised of debt, leases, and purchase obligations. The following sections provide details of material cash requirements from known contractual and other obligations as of December 31, 2023.
Debt
As of December 31, 2023, the Company had $564.7 million outstanding under its First Lien Credit Facility due January 31, 2027. No principal payments are due within the next twelve months, as detailed further in Note 6 to the audited consolidated financial statements included elsewhere in this Annual Report. Future interest payments associated with the First Lien Credit Facility total $127.6 million, with $40.0 million payable within the next twelve months. Estimated future interest payments are based on the actual interest rates on individual debt, interest rate collar, and swap agreements outstanding at December 31, 2023. Actual interest rates on our variable rate debt, interest rate collar and swap agreements, and the actual amount of our variable indebtedness could vary from the amounts used to compute the amounts.
As of December 31, 2023, we had no borrowings outstanding under our Revolver.
Leases
As of December 31, 2023, total contractual obligations for operating leases were $11.0 million. This includes operating leases with original maturities of less than one year, which are not recorded in our consolidated balance sheet. As of December 31, 2023, no outstanding amounts were due under finance lease agreements.
For further information, see Note 14 to the audited consolidated financial statements included elsewhere in this Annual Report.
Purchase Obligations
The Company has entered into a one-year contract with a third-party service provider which contains a minimum volume commitment. The Company expects to exceed the stipulated minimum volume of purchases required in 2024 through the ordinary course of business.
The Company has accrued approximately $1.0 million for uncertain tax positions and accrued interest and penalties of $0.5 million related to the uncertain tax positions as of December 31, 2023. See Note 8 to the audited consolidated financial statements included elsewhere in this Annual Report for further information.
At December 31, 2023, the Company had accrued $5.2 million relating to legal proceedings in which the Company believes a loss is both probable and estimable. See Note 13 to the audited consolidated financial statements included elsewhere in this Annual Report for further information.
60
Recent Accounting Pronouncements
See Note 2 to the audited consolidated financial statements included elsewhere in this Annual Report for a full description of recent accounting pronouncements.
Critical Accounting Policies and Estimates
Our audited consolidated financial statements and the related notes thereto included elsewhere in this Annual Report are prepared in accordance with GAAP. The preparation of consolidated financial statements also requires us to make estimates and assumptions that affect the reported amounts of assets, liabilities, revenue, costs and expenses and related disclosures. We base our estimates on historical experience and on various other assumptions that we believe to be reasonable under the circumstances. Actual results could differ significantly from our estimates. To the extent that there are differences between our estimates and actual results, our future financial statement presentation, financial condition, results of operations and cash flows will be affected.
We believe that the accounting policies described below involve a significant degree of judgment and complexity. Accordingly, we believe these are the most critical to aid in fully understanding and evaluating our consolidated financial condition and results of operations. For further information, see Note 2 to the audited consolidated financial statements included elsewhere in this Annual Report.
Revenue Recognition
The Company’s primary source of revenues is derived from pre-onboarding background screening and related products provided to our customers on a transactional basis, in which a background screening package or selection of products is ordered by a customer related to a single applicant. Substantially all of the Company’s customers are employers, staffing companies, and other businesses or organizations. The Company’s revenues are mostly comprised of a significant volume of low-dollar services fulfilled by multiple highly automated, proprietary systems and applications. The processing of transactions and recording of revenue is based on contractual terms with the Company’s customers. The Company satisfies its performance obligations and recognizes revenues for its products as the orders are completed and the completed results or reports are transmitted, or otherwise made available. The Company’s remaining products, substantially consisting of post-onboarding monitoring, tax consulting, fleet management, and driver qualification services, are delivered over time as the customer simultaneously receives and consumes the benefits of the products and solutions delivered. To measure the Company’s performance over time, the output method is utilized to measure the value to the customer based on the transfer to date of the services promised, with no rights of return once consumed. In these cases, revenues on transactional contracts with a defined price but an undefined quantity is recognized utilizing the right to invoice expedient resulting in revenues being recognized when the service is provided and becomes billable. Additionally, under this practical expedient, the Company is not required to estimate the transaction price. The Company records third-party pass- through fees incurred as part of screening related products on a gross revenue basis, with the related expense recorded as a cost of service expense, as the Company has control over the transaction and is therefore considered to be acting as a principal. The Company records motor vehicle registration and other tax payments paid on behalf of the Company’s fleet management customers on a net revenue basis as the Company does not have control over the transaction and therefore is considered to be acting as an agent of the customer. Amounts received from fleet management customers are recorded in cash and cash equivalents in the accompanying consolidated balance sheets as the funds are not legally restricted.
Business Combinations
We record business combinations using the acquisition method of accounting in accordance with ASC 805, Business Combinations. Under the acquisition method of accounting, identifiable assets acquired and liabilities assumed are recorded at their acquisition-date fair values. The excess of the purchase price over the estimated fair value is recorded as goodwill. Changes in the estimated fair values of net assets recorded for acquisitions prior to the finalization of more detailed analysis, but not to exceed one year from the date of acquisition, will adjust the amount of the purchase price allocable to goodwill. Measurement period adjustments are recorded in the period in which they occur.
Long-Lived Assets
We review long-lived assets held and used by us—including property and equipment primarily consisting of capitalized internal use software, and finite-lived intangible assets—for impairment whenever events or changes in business circumstances indicate that the carrying amount of an asset or asset group may not be fully recoverable. If an impairment is determined to exist, we calculate any related impairment loss based on the difference between the fair value and carrying values of the respective assets or asset groups.
Internal use software development costs are capitalized during the application development stage of initial development or during development of new features and enhancements. The Company amortizes these costs using the straight-line method over the estimated useful life of the software, generally three years. Software costs not meeting the criteria for capitalization are expensed as incurred.
61
Goodwill
We assess goodwill for impairment annually or more frequently if events or changes in business circumstances indicate that it is more likely than not that the carrying value of a reporting unit exceeds its fair value. In performing these assessments, management relies on various factors, including operating results, business plans, economic projections, anticipated future cash flows and other market data. There are inherent uncertainties related to these factors and judgment is required in applying them to the goodwill impairment test. Our annual goodwill impairment test is performed on October 31. We perform additional tests throughout the year when required.
For quantitative goodwill impairment tests, the fair value for each reporting unit is determined using a discounted cash flow method. Key assumptions for computing fair value include discount rate, long term growth rate, foreign currency exchange rate, and cash flow projections for each reporting unit. No goodwill impairment was recognized for 2023. See Note 2 to the audited consolidated financial statements included elsewhere in this Annual Report for more information on our goodwill impairment testing.
Income Taxes
In determining taxable income for our consolidated financial statements, we must make certain estimates and judgments. These estimates and judgments affect the calculation of certain tax liabilities and the determination of the recoverability of certain of the deferred tax assets, which arise from temporary differences between the tax and financial statement recognition of revenues and expenses.
In evaluating our ability to recover our deferred tax assets, we consider all available positive and negative evidence including our past operating results, the existence of cumulative losses in the most recent years and our forecast of future taxable income. In estimating future taxable income, we develop assumptions including the amount of future pre-tax operating income, the reversal of temporary differences and the implementation of feasible and prudent tax planning strategies. These assumptions require significant judgment about the forecasts of future taxable income and are consistent with the plans and estimates we are using to manage our underlying businesses.
ASC 740 requires a valuation allowance to reduce the deferred income tax assets recorded if, based on the weight of the evidence, it is more likely than not, that some or all of the deferred income tax assets will not be realized. The Company evaluates all of the positive and negative evidence annually to determine the need for a valuation allowance. After consideration of all of the evidence, the Company has determined that a valuation allowance of $1.9 million and $1.5 million is necessary at December 31, 2023 and 2022, respectively.
Changes in tax laws and rates could also affect recorded deferred tax assets and liabilities in the future. We record the effect of a tax rate or law change on our deferred tax assets and liabilities in the period of enactment. Future tax rate or law changes could have a material effect on our results of operations, financial condition, or cash flows.
In addition, the calculation of our tax liabilities involves dealing with uncertainties in the application of complex tax regulations in the United States and elsewhere. We recognize potential liabilities and record tax liabilities for anticipated tax audit issues in the U.S. and other tax jurisdictions based on estimates of whether, and the extent to which, additional taxes will be due in accordance with the authoritative guidance regarding the accounting for uncertain tax positions. These tax liabilities are reflected net of related tax loss carryforwards. We adjust these reserves in light of changing facts and circumstances; however, due to the complexity of some of these uncertainties, the ultimate resolution may result in a payment that is materially different from our current estimate of the tax liabilities. If our estimate of tax liabilities proves to be less than the ultimate assessment, an additional charge to expense would result. If payment of these amounts ultimately proves to be less than the recorded amounts, the reversal of the liabilities would result in tax benefits being recognized in the period when we determine the liabilities are no longer necessary. The Company classifies interest and penalties associated with its unrecognized tax benefits as a component of income tax expense (see Note 8 to the audited consolidated financial statements included elsewhere in this Annual Report).
62
Item 7A. Quantitative and Qualitative Disclosures About Market Risk.
As a global company, we are exposed to a variety of market risks, including the effects of changes in interest rates and foreign currency exchange rates. We monitor and manage these financial exposures as an integral part of our overall risk management program. We use derivative financial instruments for hedging purposes only. We do not use derivatives for speculation purposes.
Interest Rate Risk
We had cash and cash equivalents of $213.8 million and $391.7 million as of December 31, 2023 and 2022, respectively. We also had short-term investments of $2.0 million at December 31, 2022. Our cash and cash equivalents consist primarily of bank demand deposits. Our short-term investments consist of fixed time deposits having a maturity date within twelve months. We hold cash, cash equivalents, and short-term investments for working capital purposes. We do not enter into investments for trading or speculative purposes.
We do not have material exposure to market risk with respect to our cash, cash equivalents, or short-term investments as these consist primarily of highly liquid investments purchased with original maturities of twelve months or less at December 31, 2023 and 2022.
Our debt includes variable-rate debt and a revolving credit facility that bear interest based on SOFR. As a result, we are exposed to fluctuations in interest rates on our long-term debt. The carrying value of our long-term debt, excluding capital lease and other long-term obligations, was $558.5 million as of December 31, 2023. The fair value of our long-term debt, excluding finance lease and other long-term obligations, was approximately the same as its carrying value of $558.5 million as of December 31, 2023. As of December 31, 2023, a hypothetical 100 basis point increase or decrease in interest rates would change the fair value of our debt by less than $0.1 million. The exposure associated with our variable-rate borrowings to a hypothetical 100 basis point increase or decrease in interest rates would, therefore, not be material to earnings, fair values, or cash flows. See Note 6 to the audited consolidated financial statements included elsewhere in this Annual Report for more information on our debt offerings and any outstanding debt.
To help manage borrowing costs, we may from time to time enter into interest rate derivative transactions with financial institutions acting as principal counterparties. In 2020, the Company entered into an interest rate collar agreement with a notional amount of $405.0 million through February 2022 that was reduced to $300.0 million from March 2022 through February 2024, with a maturity date of February 29, 2024. In the agreement, we and the counterparty bank agreed to a one-month LIBOR floor of 0.48% and cap of 1.50% on a portion of our term loan facility. In June 2023, the Company transitioned the reference rate from one-month LIBOR to one-month SOFR and reduced the cap to 1.47%.
In February 2023, the Company entered into an interest rate swap agreement with a notional amount of $100.0 million that matures on February 28, 2026. The interest rate swap hedged our floating LIBOR rate outstanding debt with a fixed rate of 4.36%. In June 2023, the Company transitioned the reference rate from one-month LIBOR to one-month SOFR and reduced the fixed rate to 4.32%.
In December 2023, the Company entered into two interest rate swap agreements, each with a notional amount of $150.0 million. Effective December 29, 2023, the first interest rate swap agreement hedged our floating SOFR rate outstanding debt with a fixed rate of 3.86%. Effective March 1, 2024, the second interest rate swap agreement will hedge our floating SOFR rate outstanding debt with a fixed rate of 3.76%. Both interest rate swap agreements mature on December 31, 2026.
Refer to Note 7 to the consolidated financial statements included elsewhere in this Annual Report for more information about our interest rate collar agreement.
Foreign Currency Risk
We have exposure to the effects of foreign currency exchange rate fluctuations due to our global operations. The functional currency of all of the Company’s foreign subsidiaries is the applicable local currency. Principal foreign currency exposures relate primarily to the Indian Rupee, British Pound Sterling, and to a lesser extent the Hong Kong Dollar, Australian Dollar, and Chinese Renminbi.
Balance sheet adjustments resulting from the translation of foreign currency-denominated subsidiary financial statements are accumulated in a separate component of equity. Gains or losses resulting from foreign currency transactions are included in the Company’s consolidated statements of operations and comprehensive income, except for gains or losses relating to intercompany transactions of a long-term investment nature, which are presented in a separate component of equity as accumulated other comprehensive loss.
We historically have not hedged our investments in foreign subsidiaries or our exposure to transaction gains or losses resulting from fluctuations in foreign currency exchange rates. Currency translation income (loss) included in other comprehensive income (loss) were approximately $1.2 million, $(20.7) million, and $(4.1) million, for the years ended December 31, 2023, 2022, and 2021, respectively.
63
Impact of Inflation
We do not believe that inflation has had a material effect on our business, results of operations or financial condition. Nonetheless, if our costs were to become subject to significant inflationary pressures, we may not be able to fully offset such higher costs. Our inability or failure to do so could harm our business, financial condition and results of operations.
Item 8. Financial Statements and Supplementary Data.
The financial statements required to be filed pursuant to this Item 8 are appended to this report. An index of those financial statements is found in Item 15 of Part IV of this Annual Report.
Item 9. Changes in and Disagreements With Accountants on Accounting and Financial Disclosure.
None.
Item 9A. Controls and Procedures.
Evaluation of Disclosure Controls and Procedures
Our management, with the participation of our Chief Executive Officer (principal executive officer) and Chief Financial Officer (principal financial officer), has evaluated the effectiveness of the Company’s disclosure controls and procedures as of the end of the period covered by this report. The term “disclosure controls and procedures” as defined in Rules 13a-15(e) and 15d-15(e) under the Exchange Act, as amended means controls and other procedures of a company that are designed to ensure that information required to be disclosed by a company in the reports that it files or submits under the Exchange Act is recorded, processed, summarized, and reported, within the time periods specified in the SEC’s rules and forms and that such information is accumulated and communicated to management including the Chief Executive Officer and Chief Financial Officer, as appropriate, to allow timely discussions regarding required disclosures.
Management recognizes that any controls and procedures, no matter how well designed and operated, can provide only reasonable, not
absolute, assurance of achieving their desired control objectives. Based on the evaluation of management’s disclosure controls and
procedures as of the end of the period covered by this report, our Chief Executive Officer and Chief Financial Officer concluded that,
as of such date, the disclosure controls and procedures were effective at a reasonable assurance level.
Changes in Internal Control Over Financial Reporting
There were no changes in our internal control over financial reporting identified in management’s evaluation pursuant to Rules 13a-15(d) or 15d-15(d) of the Exchange Act that occurred during the quarter ended December 31, 2023 that materially affected, or are reasonably likely to materially affect, our internal control over financial reporting.
64
Management's Report on Internal Control Over Financial Reporting
Our management is responsible for establishing and maintaining adequate internal control over financial reporting. Internal control over financial reporting is defined in Rules 13a-15(f) and 15d-15(f) under the Exchange Act as a process designed by, or under the supervision of, our Chief Executive Officer (principal executive officer) and Chief Financial Officer (principal financial officer), and effected by our Board of Directors, management, and other personnel, to provide reasonable assurance regarding the reliability of financial reporting and the preparation of financial statements for external purposes in accordance with generally accepted accounting principles and includes those policies and procedures that:
Because of its inherent limitations, internal control over financial reporting may not prevent or detect misstatements. Projections of any evaluation of effectiveness to future periods are subject to the risk that controls may become inadequate because of changes in conditions, or that the degree of compliance with the policies or procedures may deteriorate.
Our management assessed the effectiveness of the Company’s internal control over financial reporting as of December 31, 2023 using the criteria set forth by the Committee of Sponsoring Organizations of the Treadway Commission in Internal Control—Integrated Framework (2013). Based on this assessment using those criteria, our management concluded that, as of December 31, 2023, the Company’s internal control over financial reporting was effective. Management reviewed the results of its assessment with the Audit Committee of its Board of Directors. The effectiveness of the Company’s internal control over financial reporting as of December 31, 2023 has been audited by Deloitte & Touche LLP, the Company’s independent registered public accounting firm, as stated in their report, which appears in “Item 8. Financial Statements and Supplementary Data” of this Form 10-K.
Item 9B. Other Information.
During the three months ended December 31, 2023, none of our directors or officers (as defined in Rule 16a-1(f) of the Exchange Act) adopted, terminated, or modified a
Item 9C. Disclosure Regarding Foreign Jurisdictions that Prevent Inspections.
Not Applicable.
65
PART III
Item 10. Directors, Executive Officers, and Corporate Governance.
We are committed to promoting high standards of ethical business conduct and compliance with applicable laws, rules and regulations. As part of this commitment, we have adopted a written Global Code of Conduct and Ethics that applies to all of our directors, officers, and employees, including our Chief Executive Officer, Chief Financial Officer, and Chief Accounting Officer. Our Global Code of Conduct and Ethics is posted under the “Governance” section on our website, https://investors.fadv.com/. Our Global Code of Conduct and Ethics is a “code of ethics,” as defined in Item 406(b) of Regulation S-K. We will make any legally required disclosures regarding amendments to, or waivers of, provisions of our code of ethics on our website.
The remaining information required by this Item is incorporated by reference to the definitive Proxy Statement for our 2024 Annual Meeting of Stockholders, which will be filed with the SEC no later than 120 days after December 31, 2023.
Item 11. Executive Compensation.
The information required by this Item is incorporated by reference to the definitive Proxy Statement for our 2024 Annual Meeting of Stockholders, which will be filed with the SEC no later than 120 days after December 31, 2023.
Item 12. Security Ownership of Certain Beneficial Owners and Management and Related Stockholder Matters.
The information required by this Item is incorporated by reference to the definitive Proxy Statement for our 2024 Annual Meeting of Stockholders, which will be filed with the SEC no later than 120 days after December 31, 2023.
Item 13. Certain Relationships and Related Transactions, and Director Independence.
The information required by this Item is incorporated by reference to the definitive Proxy Statement for our 2024 Annual Meeting of Stockholders, which will be filed with the SEC no later than 120 days after December 31, 2023.
Item 14. Principal Accountant Fees and Services.
The information required by this Item is incorporated by reference to the definitive Proxy Statement for our 2024 Annual Meeting of Stockholders, which will be filed with the SEC no later than 120 days after December 31, 2023.
66
PART IV
Item 15. Exhibits and Financial Statement Schedules.
(a)(1) Financial Statements
Our consolidated financial statements are included in this Annual Report beginning on page F-1.
(a)(2) Financial Statement Schedules
All financial statement schedules have been omitted because they are not applicable, not material or because the information required is already included in the consolidated financial statements or the notes thereto.
(a)(3) Exhibits
The exhibits listed below are filed as part of this Annual Report or are incorporated herein by reference, in each case as indicated below.
67
Exhibit Index
Exhibit Number |
|
Description |
3.1 |
|
|
3.2 |
|
|
4.1 |
|
|
10.1 † |
|
|
10.2 † |
|
|
10.3 † |
|
|
10.4 † |
|
|
10.5 † |
|
|
10.6 † |
|
|
10.7 † |
|
|
10.8 † |
|
|
10.9 † |
|
|
10.10 † |
|
|
10.11 † |
|
|
10.12 † |
|
|
10.13 † |
|
|
10.14 † |
|
|
10.15 † |
|
|
10.16 † |
|
|
10.17 † |
|
|
10.18 † |
|
68
Exhibit Number |
|
Description |
10.19 † |
|
|
10.20 † |
|
|
10.21 † |
|
|
10.22 † |
|
|
10.23 † |
|
|
10.24 † |
|
|
10.25 † |
|
|
10.26 † |
|
|
10.27 † |
|
|
10.28† |
|
|
10.29 |
|
|
10.30 |
|
|
10.31 |
|
|
10.32 |
|
|
10.33 |
|
|
10.34 |
|
|
21.1 |
|
|
23.1 |
|
69
Exhibit Number |
|
Description |
31.1 |
|
|
31.2 |
|
|
32.1 |
|
|
32.2 |
|
|
97.1 |
|
First Advantage Corporation Incentive Compensation Clawback Policy. |
101.INS |
|
Inline XBRL Instance Document – the instance document does not appear in the Interactive Data File because XBRL tags are embedded within the Inline XBRL document. |
101.SCH |
|
Inline XBRL Taxonomy Extension Schema With Embedded Linkbase Documents. |
104 |
|
Cover Page Interactive Data File (embedded within the Inline XBRL document). |
† Compensatory arrangements for director(s) and/or executive officer(s).
Item 16. Form 10-K Summary
None.
70
SIGNATURES
Pursuant to the requirements of Section 13 or 15(d) of the Securities Exchange Act of 1934, as amended, the Registrant has duly caused this Report to be signed on its behalf by the undersigned, thereunto duly authorized.
|
|
FIRST ADVANTAGE CORPORATION |
|
|
|
|
|
Date: February 29, 2024 |
|
By: |
/s/ David L. Gamsey |
|
|
|
David L. Gamsey |
|
|
|
Executive Vice President & Chief Financial Officer |
Pursuant to the requirements of the Securities Exchange Act of 1934, as amended, this Report has been signed below by the following persons on behalf of the Registrant in the capacities and on the dates indicated.
Name |
|
Title |
|
Date |
|
|
|
|
|
/s/ Scott Staples |
|
Chief Executive Officer |
|
February 29, 2024 |
Scott Staples |
|
(principal executive officer) |
|
|
|
|
|
|
|
/s/ David L. Gamsey |
|
Executive Vice President & Chief Financial Officer |
|
February 29, 2024 |
David L. Gamsey |
|
(principal financial officer) |
|
|
|
|
|
|
|
/s/ Steven Marks |
|
Chief Accounting Officer |
|
February 29, 2024 |
Steven Marks |
|
(principal accounting officer) |
|
|
|
|
|
|
|
/s/ Joseph Osnoss |
|
Director |
|
February 29, 2024 |
Joseph Osnoss |
|
|
|
|
|
|
|
|
|
/s/ Susan R. Bell |
|
Director |
|
February 29, 2024 |
Susan R. Bell |
|
|
|
|
|
|
|
|
|
/s/ James L. Clark |
|
Director |
|
February 29, 2024 |
James L. Clark |
|
|
|
|
|
|
|
|
|
/s/ Bridgett R. Price |
|
Director |
|
February 29, 2024 |
Bridgett R. Price |
|
|
|
|
|
|
|
|
|
/s/ John Rudella |
|
Director |
|
February 29, 2024 |
John Rudella |
|
|
|
|
|
|
|
|
|
/s/ Judith Sim |
|
Director |
|
February 29, 2024 |
Judith Sim |
|
|
|
|
|
|
|
|
|
/s/ Bianca Stoica |
|
Director |
|
February 29, 2024 |
Bianca Stoica |
|
|
|
|
71
INDEX TO CONSOLIDATED FINANCIAL STATEMENTS
Reports of Independent Registered Public Accounting Firm (PCAOB ID: |
F-2 |
F-5 |
|
Consolidated Statements of Operations and Comprehensive Income |
F-6 |
F-7 |
|
F-8 |
|
F-9 |
F-1
Report of Independent Registered Public Accounting Firm
To the stockholders and the Board of Directors of First Advantage Corporation
Opinion on Internal Control over Financial Reporting
We have audited the internal control over financial reporting of First Advantage Corporation and subsidiaries (the “Company”) as of December 31, 2023, based on criteria established in Internal Control — Integrated Framework (2013) issued by the Committee of Sponsoring Organizations of the Treadway Commission (COSO). In our opinion, the Company maintained, in all material respects, effective internal control over financial reporting as of December 31, 2023, based on criteria established in Internal Control — Integrated Framework (2013) issued by COSO.
We have also audited, in accordance with the standards of the Public Company Accounting Oversight Board (United States) (PCAOB), the consolidated financial statements as of and for the year ended December 31, 2023, of the Company and our report dated February 29, 2024, expressed an unqualified opinion on those financial statements.
Basis for Opinion
The Company’s management is responsible for maintaining effective internal control over financial reporting and for its assessment of the effectiveness of internal control over financial reporting, included in the accompanying Management’s Report on Internal Control Over Financial Reporting. Our responsibility is to express an opinion on the Company’s internal control over financial reporting based on our audit. We are a public accounting firm registered with the PCAOB and are required to be independent with respect to the Company in accordance with the U.S. federal securities laws and the applicable rules and regulations of the Securities and Exchange Commission and the PCAOB.
We conducted our audit in accordance with the standards of the PCAOB. Those standards require that we plan and perform the audit to obtain reasonable assurance about whether effective internal control over financial reporting was maintained in all material respects. Our audit included obtaining an understanding of internal control over financial reporting, assessing the risk that a material weakness exists, testing and evaluating the design and operating effectiveness of internal control based on the assessed risk, and performing such other procedures as we considered necessary in the circumstances. We believe that our audit provides a reasonable basis for our opinion.
Definition and Limitations of Internal Control over Financial Reporting
A company’s internal control over financial reporting is a process designed to provide reasonable assurance regarding the reliability of financial reporting and the preparation of financial statements for external purposes in accordance with generally accepted accounting principles. A company’s internal control over financial reporting includes those policies and procedures that (1) pertain to the maintenance of records that, in reasonable detail, accurately and fairly reflect the transactions and dispositions of the assets of the company; (2) provide reasonable assurance that transactions are recorded as necessary to permit preparation of financial statements in accordance with generally accepted accounting principles, and that receipts and expenditures of the company are being made only in accordance with authorizations of management and directors of the company; and (3) provide reasonable assurance regarding prevention or timely detection of unauthorized acquisition, use, or disposition of the company’s assets that could have a material effect on the financial statements.
Because of its inherent limitations, internal control over financial reporting may not prevent or detect misstatements. Also, projections of any evaluation of effectiveness to future periods are subject to the risk that controls may become inadequate because of changes in conditions, or that the degree of compliance with the policies or procedures may deteriorate.
/s/
February 29, 2024
We have served as the Company's auditor since 2013.
F-2
Report of Independent Registered Public Accounting Firm
To the stockholders and the Board of Directors of First Advantage Corporation
Opinion on the Financial Statements
We have audited the accompanying consolidated balance sheets of First Advantage Corporation and subsidiaries (the "Company") as of December 31, 2023 and 2022, the related consolidated statements of operations and comprehensive income, cash flows, and changes in stockholders’ equity for years ended December 31, 2023, 2022 and 2021 and the related notes (collectively referred to as the "financial statements"). In our opinion, the financial statements present fairly, in all material respects, the financial position of the Company as of December 31, 2023 and 2022, and the results of its operations and its cash flows for the years ended December 31, 2023, 2022, and 2021, in conformity with accounting principles generally accepted in the United States of America.
We have also audited, in accordance with the standards of the Public Company Accounting Oversight Board (United States) (PCAOB), the Company's internal control over financial reporting as of December 31, 2023, based on criteria established in Internal Control — Integrated Framework (2013) issued by the Committee of Sponsoring Organizations of the Treadway Commission and our report dated February 29, 2024, expressed an unqualified opinion on the Company's internal control over financial reporting.
Basis for Opinion
These financial statements are the responsibility of the Company's management. Our responsibility is to express an opinion on the Company's financial statements based on our audits. We are a public accounting firm registered with the PCAOB and are required to be independent with respect to the Company in accordance with the U.S. federal securities laws and the applicable rules and regulations of the Securities and Exchange Commission and the PCAOB.
We conducted our audits in accordance with the standards of the PCAOB. Those standards require that we plan and perform the audit to obtain reasonable assurance about whether the financial statements are free of material misstatement, whether due to error or fraud. Our audits included performing procedures to assess the risks of material misstatement of the financial statements, whether due to error or fraud, and performing procedures that respond to those risks. Such procedures included examining, on a test basis, evidence regarding the amounts and disclosures in the financial statements. Our audits also included evaluating the accounting principles used and significant estimates made by management, as well as evaluating the overall presentation of the financial statements. We believe that our audits provide a reasonable basis for our opinion.
F-3
Critical Audit Matter
Revenue – Refer to Notes 2 and 9 to the consolidated financial statements
Critical Audit Matter Description
A substantial majority of the Company’s revenues are derived from pre-onboarding background screening and related services provided to the Company’s customers on a transactional basis, in which an individual background screening package or selection of services is ordered by a customer related to a single individual. The Company’s revenues are mostly comprised of a significant volume of low-dollar services fulfilled by multiple highly automated, proprietary systems and applications. The processing of transactions and recording of revenue is based on contractual terms with the Company’s customers.
We identified revenue as a critical audit matter because the Company’s systems to process and record revenue are highly automated. This required an increased extent of effort including the need for us to involve professionals with expertise in information technology (IT) to identify, test, and evaluate the Company’s systems, software applications, and automated controls.
How the Critical Audit Matter Was Addressed in the Audit
Our primary audit procedures related to the Company’s systems to process revenue transactions included the following, among others:
/s/ Deloitte & Touche LLP
Atlanta, Georgia
February 29, 2024
We have served as the Company's auditor since 2013.
F-4
First Advantage Corporation
Consolidated Balance Sheets
|
|
December 31, |
|
|||||
(in thousands, except share and per share amounts) |
|
2023 |
|
|
2022 |
|
||
ASSETS |
|
|
|
|
|
|
||
CURRENT ASSETS |
|
|
|
|
|
|
||
Cash and cash equivalents |
|
$ |
|
|
$ |
|
||
Restricted cash |
|
|
|
|
|
|
||
Short-term investments |
|
|
|
|
|
|
||
Accounts receivable (net of allowance for doubtful accounts of $ |
|
|
|
|
|
|
||
Prepaid expenses and other current assets |
|
|
|
|
|
|
||
Income tax receivable |
|
|
|
|
|
|
||
Total current assets |
|
|
|
|
|
|
||
Property and equipment, net |
|
|
|
|
|
|
||
Goodwill |
|
|
|
|
|
|
||
Trade names, net |
|
|
|
|
|
|
||
Customer lists, net |
|
|
|
|
|
|
||
Other intangible assets, net |
|
|
|
|
|
|
||
Deferred tax asset, net |
|
|
|
|
|
|
||
Other assets |
|
|
|
|
|
|
||
TOTAL ASSETS |
|
$ |
|
|
$ |
|
||
LIABILITIES AND EQUITY |
|
|
|
|
|
|
||
CURRENT LIABILITIES |
|
|
|
|
|
|
||
Accounts payable |
|
$ |
|
|
$ |
|
||
Accrued compensation |
|
|
|
|
|
|
||
Accrued liabilities |
|
|
|
|
|
|
||
Current portion of operating lease liability |
|
|
|
|
|
|
||
Income tax payable |
|
|
|
|
|
|
||
Deferred revenues |
|
|
|
|
|
|
||
Total current liabilities |
|
|
|
|
|
|
||
Long-term debt (net of deferred financing costs of $ |
|
|
|
|
|
|
||
Deferred tax liability, net |
|
|
|
|
|
|
||
Operating lease liability, less current portion |
|
|
|
|
|
|
||
Other liabilities |
|
|
|
|
|
|
||
Total liabilities |
|
|
|
|
|
|
||
) |
|
|
|
|
|
|
||
EQUITY |
|
|
|
|
|
|
||
Common stock - $ |
|
|
|
|
|
|
||
Additional paid-in-capital |
|
|
|
|
|
|
||
Accumulated deficit |
|
|
( |
) |
|
|
( |
) |
Accumulated other comprehensive loss |
|
|
( |
) |
|
|
( |
) |
Total equity |
|
|
|
|
|
|
||
TOTAL LIABILITIES AND EQUITY |
|
$ |
|
|
$ |
|
||
The accompanying notes are an integral part of these consolidated financial statements.
F-5
First Advantage Corporation
Consolidated Statements of Operations and Comprehensive Income
|
|
Year Ended December 31, |
|
|||||||||
(in thousands, except share and per share amounts) |
|
2023 |
|
|
2022 |
|
|
2021 |
|
|||
REVENUES |
|
$ |
|
|
$ |
|
|
$ |
|
|||
|
|
|
|
|
|
|
|
|
|
|||
OPERATING EXPENSES: |
|
|
|
|
|
|
|
|
|
|||
Cost of services (exclusive of depreciation and amortization below) |
|
|
|
|
|
|
|
|
|
|||
Product and technology expense |
|
|
|
|
|
|
|
|
|
|||
Selling, general, and administrative expense |
|
|
|
|
|
|
|
|
|
|||
Depreciation and amortization |
|
|
|
|
|
|
|
|
|
|||
Total operating expenses |
|
|
|
|
|
|
|
|
|
|||
INCOME FROM OPERATIONS |
|
|
|
|
|
|
|
|
|
|||
|
|
|
|
|
|
|
|
|
|
|||
OTHER EXPENSE, NET: |
|
|
|
|
|
|
|
|
|
|||
Interest expense, net |
|
|
|
|
|
|
|
|
|
|||
Loss on extinguishment of debt |
|
|
— |
|
|
|
|
|
|
|
||
Total other expense, net |
|
|
|
|
|
|
|
|
|
|||
INCOME BEFORE PROVISION FOR INCOME TAXES |
|
|
|
|
|
|
|
|
|
|||
Provision for income taxes |
|
|
|
|
|
|
|
|
|
|||
NET INCOME |
|
$ |
|
|
$ |
|
|
$ |
|
|||
|
|
|
|
|
|
|
|
|
|
|||
Foreign currency translation income (loss) |
|
|
|
|
|
( |
) |
|
|
( |
) |
|
COMPREHENSIVE INCOME |
|
$ |
|
|
$ |
|
|
$ |
|
|||
|
|
|
|
|
|
|
|
|
|
|||
NET INCOME |
|
$ |
|
|
$ |
|
|
$ |
|
|||
Basic net income per share |
|
$ |
|
|
$ |
|
|
$ |
|
|||
Diluted net income per share |
|
$ |
|
|
$ |
|
|
$ |
|
|||
Weighted average number of shares outstanding - basic |
|
|
|
|
|
|
|
|
|
|||
Weighted average number of shares outstanding - diluted |
|
|
|
|
|
|
|
|
|
|||
The accompanying notes are an integral part of these consolidated financial statements.
F-6
First Advantage Corporation
Consolidated Statements of Cash Flows
|
|
Year Ended December 31, |
|
|||||||||
(in thousands) |
|
2023 |
|
|
2022 |
|
|
2021 |
|
|||
CASH FLOWS FROM OPERATING ACTIVITIES |
|
|
|
|
|
|
|
|
|
|||
Net income |
|
$ |
|
|
$ |
|
|
$ |
|
|||
Adjustments to reconcile net income to net cash provided by operating activities: |
|
|
|
|
|
|
|
|
|
|||
Depreciation and amortization |
|
|
|
|
|
|
|
|
|
|||
Loss on extinguishment of debt |
|
|
|
|
|
|
|
|
|
|||
Amortization of deferred financing costs |
|
|
|
|
|
|
|
|
|
|||
Bad debt (recovery) expense |
|
|
( |
) |
|
|
|
|
|
( |
) |
|
Deferred taxes |
|
|
( |
) |
|
|
|
|
|
( |
) |
|
Share-based compensation |
|
|
|
|
|
|
|
|
|
|||
Loss (gain) on foreign currency exchange rates |
|
|
|
|
|
|
|
|
( |
) |
||
Loss on disposal of fixed assets and impairment of ROU assets |
|
|
|
|
|
|
|
|
|
|||
Change in fair value of interest rate swaps |
|
|
|
|
|
( |
) |
|
|
( |
) |
|
Changes in operating assets and liabilities: |
|
|
|
|
|
|
|
|
|
|||
Accounts receivable |
|
|
|
|
|
|
|
|
( |
) |
||
Prepaid expenses and other assets |
|
|
|
|
|
|
|
|
( |
) |
||
Accounts payable |
|
|
( |
) |
|
|
|
|
|
|
||
Accrued compensation and accrued liabilities |
|
|
( |
) |
|
|
( |
) |
|
|
|
|
Deferred revenues |
|
|
|
|
|
|
|
|
|
|||
Operating lease liabilities |
|
|
( |
) |
|
|
( |
) |
|
|
|
|
Other liabilities |
|
|
|
|
|
|
|
|
( |
) |
||
Income taxes receivable and payable, net |
|
|
( |
) |
|
|
( |
) |
|
|
|
|
Net cash provided by operating activities |
|
|
|
|
|
|
|
|
|
|||
CASH FLOWS FROM INVESTING ACTIVITIES |
|
|
|
|
|
|
|
|
|
|||
Acquisitions of businesses, net of cash acquired |
|
|
( |
) |
|
|
( |
) |
|
|
( |
) |
Purchases of property and equipment |
|
|
( |
) |
|
|
( |
) |
|
|
( |
) |
Capitalized software development costs |
|
|
( |
) |
|
|
( |
) |
|
|
( |
) |
Other investing activities |
|
|
|
|
|
( |
) |
|
|
|
||
Net cash used in investing activities |
|
|
( |
) |
|
|
( |
) |
|
|
( |
) |
CASH FLOWS FROM FINANCING ACTIVITIES |
|
|
|
|
|
|
|
|
|
|||
Cash dividends paid |
|
|
( |
) |
|
|
|
|
|
|
||
Share repurchases |
|
|
( |
) |
|
|
( |
) |
|
|
|
|
Proceeds from issuance of common stock under share-based compensation plans |
|
|
|
|
|
|
|
|
|
|||
Payments on deferred purchase agreements |
|
|
( |
) |
|
|
( |
) |
|
|
( |
) |
Net settlement of share-based compensation plan awards |
|
|
( |
) |
|
|
( |
) |
|
|
( |
) |
Payments on capital and finance lease obligations |
|
|
( |
) |
|
|
( |
) |
|
|
( |
) |
Proceeds from issuance of common stock in initial public offering, net of underwriting discounts and commissions |
|
|
|
|
|
|
|
|
|
|||
Borrowings from First Lien Credit Facility |
|
|
|
|
|
|
|
|
|
|||
Repayments of First Lien Credit Facility |
|
|
|
|
|
|
|
|
( |
) |
||
Repayment of Second Lien Credit Facility |
|
|
|
|
|
|
|
|
( |
) |
||
Payments of initial public offering issuance costs |
|
|
|
|
|
|
|
|
( |
) |
||
Payments of debt issuance costs |
|
|
|
|
|
|
|
|
( |
) |
||
Shareholder distribution |
|
|
|
|
|
|
|
|
( |
) |
||
Capital contributions |
|
|
|
|
|
|
|
|
|
|||
Net cash (used in) provided by financing activities |
|
|
( |
) |
|
|
( |
) |
|
|
|
|
Effect of exchange rate on cash, cash equivalents, and restricted cash |
|
|
( |
) |
|
|
( |
) |
|
|
( |
) |
(Decrease) increase in cash, cash equivalents, and restricted cash |
|
|
( |
) |
|
|
|
|
|
|
||
Cash, cash equivalents, and restricted cash at beginning of period |
|
|
|
|
|
|
|
|
|
|||
Cash, cash equivalents, and restricted cash at end of period |
|
$ |
|
|
$ |
|
|
$ |
|
|||
|
|
|
|
|
|
|
|
|
|
|||
SUPPLEMENTAL DISCLOSURES OF CASH FLOW INFORMATION: |
|
|
|
|
|
|
|
|
|
|||
Cash paid for income taxes, net of refunds received |
|
$ |
|
|
$ |
|
|
$ |
|
|||
Cash paid for interest |
|
$ |
|
|
$ |
|
|
$ |
|
|||
NON-CASH INVESTING AND FINANCING ACTIVITIES: |
|
|
|
|
|
|
|
|
|
|||
Property and equipment acquired on account |
|
$ |
|
|
$ |
|
|
$ |
|
|||
Excise taxes on share repurchases incurred but not paid |
|
$ |
|
|
$ |
|
|
$ |
|
|||
Dividends declared but not paid |
|
$ |
|
|
$ |
|
|
$ |
|
|||
The accompanying notes are an integral part of these consolidated financial statements.
F-7
First Advantage Corporation
Consolidated Statements of Changes in Stockholders’ Equity
(in thousands) |
|
Common Stock |
|
|
Additional |
|
|
Accumulated |
|
|
Accumulated Other |
|
|
Total Stockholders’ |
|
|||||
BALANCE – December 31, 2020 |
|
$ |
|
|
$ |
|
|
$ |
( |
) |
|
$ |
|
|
$ |
|
||||
Share-based compensation |
|
|
— |
|
|
|
|
|
|
— |
|
|
|
— |
|
|
|
|
||
Capital contributions |
|
|
— |
|
|
|
|
|
|
— |
|
|
|
— |
|
|
|
|
||
Issuance of common stock in connection with initial public offering, net of offering costs, underwriting discounts and commissions |
|
|
|
|
|
|
|
|
— |
|
|
|
— |
|
|
|
|
|||
Proceeds from issuance of common stock under share-based compensation plans |
|
|
— |
|
|
|
|
|
|
— |
|
|
|
— |
|
|
|
|
||
Common stock withheld for tax obligations and net settlement of stock option exercise |
|
|
— |
|
|
|
( |
) |
|
|
— |
|
|
|
— |
|
|
|
( |
) |
Shareholder distribution |
|
|
— |
|
|
|
( |
) |
|
|
— |
|
|
|
— |
|
|
|
( |
) |
Foreign currency translation |
|
|
— |
|
|
|
— |
|
|
|
— |
|
|
|
( |
) |
|
|
( |
) |
Net income |
|
|
— |
|
|
|
— |
|
|
|
|
|
|
— |
|
|
|
|
||
BALANCE – December 31, 2021 |
|
$ |
|
|
$ |
|
|
$ |
( |
) |
|
$ |
( |
) |
|
$ |
|
|||
Share-based compensation |
|
|
— |
|
|
|
|
|
|
— |
|
|
|
— |
|
|
|
|
||
Repurchases of common stock |
|
|
( |
) |
|
|
— |
|
|
|
( |
) |
|
|
— |
|
|
|
( |
) |
Proceeds from issuance of common stock under share-based compensation plans |
|
|
|
|
|
|
|
— |
|
|
|
— |
|
|
|
|
||||
Common stock withheld for tax obligations on restricted stock unit and option settlement |
|
|
|
|
( |
) |
|
|
— |
|
|
|
— |
|
|
|
( |
) |
||
Foreign currency translation |
|
|
— |
|
|
|
— |
|
|
|
— |
|
|
|
( |
) |
|
|
( |
) |
Net income |
|
|
— |
|
|
|
— |
|
|
|
|
|
|
— |
|
|
|
|
||
BALANCE – December 31, 2022 |
|
$ |
|
|
$ |
|
|
$ |
( |
) |
|
$ |
( |
) |
|
$ |
|
|||
Share-based compensation |
|
|
— |
|
|
|
|
|
|
— |
|
|
|
— |
|
|
|
|
||
Repurchases of common stock |
|
|
( |
) |
|
|
— |
|
|
|
( |
) |
|
|
— |
|
|
|
( |
) |
Cash dividends declared, $ |
|
|
— |
|
|
|
( |
) |
|
|
— |
|
|
|
— |
|
|
|
( |
) |
Proceeds from issuance of common stock under share-based compensation plans |
|
|
|
|
|
|
|
|
— |
|
|
|
— |
|
|
|
|
|||
Common stock withheld for tax obligations on restricted stock unit and option settlement |
|
|
( |
) |
|
|
( |
) |
|
|
— |
|
|
|
— |
|
|
|
( |
) |
Foreign currency translation |
|
|
— |
|
|
|
— |
|
|
|
— |
|
|
|
|
|
|
|
||
Net income |
|
|
— |
|
|
|
— |
|
|
|
|
|
|
— |
|
|
|
|
||
BALANCE – December 31, 2023 |
|
$ |
|
|
$ |
|
|
$ |
( |
) |
|
$ |
( |
) |
|
$ |
|
|||
The accompanying notes are an integral part of these consolidated financial statements.
F-8
First Advantage Corporation
Notes to Consolidated Financial Statements
Note 1. Organization, Nature of Business, and Basis of Presentation
First Advantage Corporation, a Delaware corporation, was formed on November 15, 2019. Hereafter, First Advantage Corporation and its subsidiaries will collectively be referred to as the “Company.”
The Company derives its revenues from a variety of background check and compliance services performed across all phases of the workforce lifecycle from pre-onboarding services to post-onboarding and ongoing monitoring services, covering employees, contractors, contingent workers, tenants, and drivers. We generally classify our service offerings into three categories: pre-onboarding, post-onboarding, and adjacent products.
Pre-onboarding services are comprised of an extensive array of products and solutions that customers typically utilize to enhance their evaluation process and support compliance from the time a job or other application is submitted to a successful applicant’s onboarding date. This includes searches such as criminal background checks, drug / health screenings, extended workforce screening, biometrics and identity checks, education / workforce verification, driver records and compliance, healthcare credentials, and executive screening.
Post-onboarding services are comprised of continuous monitoring and re-screening solutions which are important tools to help keep their end customers, workforces, and other stakeholders safer, more productive, and more compliant. Our post-monitoring solutions include criminal records, healthcare sanctions, motor vehicle records, social media, and global sanctions screening continuously or at regular intervals selected by our customers.
Adjacent products include products that complement our pre-onboarding and post-onboarding products and solutions. This includes fleet / vehicle compliance, hiring tax credits and incentives, resident / tenant screening, employment eligibility, and investigative research.
Basis of Presentation — The accompanying consolidated financial statements have been prepared in accordance with accounting principles generally accepted in the United States of America (“GAAP”) and include the accounts of the Company and its wholly owned subsidiaries. All significant intercompany transactions and balances have been eliminated. The Company includes the results of operations of acquired companies prospectively from the date of acquisition.
The Company has historically experienced seasonality with respect to certain customer industries as a result of fluctuations in hiring volumes and other economic activities. Generally, the Company’s highest revenues have historically occurred between October and November of each year, driven by many customers’ pre-holiday season hiring initiatives.
Segments — Operating segments are businesses for which separate financial information is available and evaluated regularly by our chief operating decision maker (“CODM”) in deciding how to allocate resources and assess performance.
During the first quarter of 2022, the Company made organizational changes and modified information provided to its CODM to better align with how its CODM assesses performance and allocates resources. As a result, the Company has two reportable segments, Americas and International:
Prior period results were recast to conform to the current presentation of segments.
The Company’s segment disclosure is intended to provide the users of its consolidated financial statements with a view of the business that is consistent with management of the Company. Details of segment results are discussed in Note 17, “Reportable Segments.”
Use of Estimates — The preparation of the consolidated financial statements in accordance with GAAP requires management to make estimates and assumptions that affect the reported amounts of assets and liabilities and disclosure of contingent assets and liabilities at the date of the financial statements and the reported amounts of revenues and expenses during the reported period. Changes in these estimates and assumptions may have a material impact on the consolidated financial statements and accompanying notes.
F-9
Significant estimates, judgments, and assumptions, include, but are not limited to, the determination of the fair value and useful lives of assets acquired and liabilities assumed through business combinations, goodwill impairment, revenue recognition, capitalized software, assumptions used for purposes of determining share-based compensation, and income tax liabilities and assets. The Company bases its estimates on historical experience and on various other assumptions that are believed to be reasonable under the circumstances. Actual results could differ from these estimates.
Note 2. Summary of Significant Accounting Policies
Fair Value of Financial Instruments — Certain financial assets and liabilities are reported at fair value in the accompanying consolidated balance sheets in accordance with Financial Accounting Standards Board (“FASB”) Accounting Standards Codification (“ASC”) 820, Fair Value Measurement. ASC 820 establishes a framework for measuring fair value and expands disclosures about fair value measurements. ASC 820 defines fair value as the price that would be received upon sale of an asset or paid to transfer a liability in an orderly transaction between market participants at the measurement date. The valuation techniques required by ASC 820 are based upon observable and unobservable inputs. Observable inputs reflect market data obtained from independent sources, while unobservable inputs reflect internal market assumptions. These two types of inputs create the following fair value hierarchy:
Level 1 — Quoted prices for identical instruments in active markets.
Level 2 — Quoted prices for similar instruments in active markets, quoted prices for identical or similar instruments in markets that are not active, and model-derived valuations whose inputs are observable or whose significant value drivers are observable.
Level 3 — Significant inputs to the valuation model are unobservable (supported by little or no market activities). These inputs may be used with internally developed methodologies that reflect the Company’s best estimate of fair value from a market participant.
The fair value of an asset is considered to be the price at which the asset could be sold in an orderly transaction between unrelated knowledgeable and willing parties. A liability’s fair value is defined as the amount that would be paid to transfer the liability to a new obligor, rather than the amount that would be paid to settle the liability with the creditor. Assets and liabilities recorded at fair value are measured using a three-tier fair value hierarchy, which prioritizes the inputs used in measuring fair value.
The carrying amounts of cash and cash equivalents, short-term investments, receivables, and accounts payable approximate fair value due to the short-term maturities of these financial instruments (Level 1). The fair values and carrying values of the Company’s long-term debt are disclosed in Note 6.
The following table presents information about the Company’s financial assets and liabilities that are measured at fair value on a recurring basis and their assigned levels within the valuation hierarchy as of December 31, 2023 (in thousands):
|
|
Level 1 |
|
|
Level 2 |
|
|
Level 3 |
|
|||
Assets |
|
|
|
|
|
|
|
|
|
|||
Interest rate collars |
|
$ |
|
|
$ |
|
|
$ |
|
|||
Liabilities |
|
|
|
|
|
|
|
|
|
|||
Interest rate swaps |
|
$ |
|
|
$ |
|
|
$ |
|
|||
Assets and Liabilities Measured at Fair Value on a Nonrecurring Basis
Other intangible assets are subject to nonrecurring fair value measurement as the result of business acquisitions. The fair values of these assets were estimated using the present value of expected future cash flows through unobservable inputs (Level 3).
Cash and Cash Equivalents — The Company considers cash equivalents to be cash and all short-term investments that have an original maturity of ninety days or less. Interest income earned on short-term investments and interest bearing accounts is included in interest expense, net in the accompanying consolidated statements of operations and comprehensive income. The Company recorded $
Restricted Cash — Restricted cash represents monies held in trust for a specific purpose as contractually required under the respective arrangement.
Short-Term Investments — Short-term investments represents fixed time deposits having a maturity date within twelve months.
F-10
Accounts Receivable — Accounts receivable are due from customers in a broad range of industries located throughout the United States and internationally. Credit is extended based on evaluation of the customer’s financial condition, and generally, collateral is not required.
The allowance for all uncollectible receivables is based on a combination of historical data, cash payment trends, specific customer issues, write-off trends, general economic conditions, and other factors. These factors are continuously monitored by management to arrive at the estimate for the amount of accounts receivable that may be ultimately uncollectible. In circumstances where the Company is aware of a specific customer’s inability to meet its financial obligations, the Company records a specific allowance for doubtful accounts against amounts due in order to reduce the net recognized receivable to the amount it reasonably believes will be collected. The Company believes that the allowance for doubtful accounts at December 31, 2023 and 2022 is reasonably stated.
Property and Equipment — Property and equipment are recorded at cost. Property and equipment include computer software for internal uses either developed internally, acquired by business combination or otherwise purchased. Software development costs, including internal personnel and third-party professional services, are capitalized during the application development stage of initial development or during development of new features and enhancements. The Company amortizes purchased software using the straight-line method over the estimated useful life of the software and software acquired by business combination on an accelerated basis over its expected useful life of
Depreciation on leasehold improvements is computed on the straight-line method over the shorter of the life of the asset, or the lease term, ranging from one to fifteen years. Depreciation on data processing equipment and furniture and equipment is computed using the straight-line method over their estimated useful lives ranging from three to ten years.
Business Combinations — The Company records business combinations using the acquisition method of accounting in accordance with ASC 805, Business Combinations. Under the acquisition method of accounting, identifiable assets acquired and liabilities assumed are recorded at their acquisition-date fair values. The excess of the purchase price over the estimated fair value is recorded as goodwill. Changes in the estimated fair values of net assets recorded for acquisitions prior to the finalization of more detailed analysis, but not to exceed one year from the date of acquisition, will adjust the amount of the purchase price allocable to goodwill. Measurement period adjustments are reflected in the period in which they occur.
Goodwill, Trade Names, Customer Lists, and Other Intangible Assets — The Company tests goodwill for impairment annually as of October 31 or more frequently if an event occurs or circumstances change that would more likely than not reduce the fair value of a reporting unit or indefinite-lived intangible asset below its carrying value. During 2023, the Company changed its annual impairment testing date from December 31 to October 31. The Company believes the new date is preferable because it aligns the impairment test with the budgeting processes. The Company applied the change in accounting principle prospectively. The change in the annual impairment testing date did not delay, accelerate, or avoid an impairment charge. Goodwill is tested for impairment at the reporting unit level using a fair value approach. At October 31, 2023, the Company had
The Company’s trade names are amortized on an accelerated basis over their expected useful life of
Customer lists are amortized on an accelerated basis based upon their estimated useful lives, ranging from to years.
The Company recorded $
F-11
The Company’s other intangible assets are amortized on a
The Company regularly evaluates the amortization period assigned to each intangible asset to determine whether there have been any events or circumstances that warrant revised estimates of useful lives. No impairment charges have been required.
Income Taxes — The Company is a U.S. domiciled corporation for tax purposes. Accordingly, the Company has followed ASC 740, Income Taxes, which provides for income taxes using the liability method, which requires an asset and liability based approach in accounting for income taxes for all periods presented. Deferred income taxes reflect the net tax effect on future years of temporary differences in the carrying amount of assets and liabilities between financial statements and income tax purposes. Valuation allowances are established when the Company determines that it is more likely than not that some portion or the entire deferred tax asset will not be realized. The Company evaluates its effective tax rates regularly and adjusts them when appropriate based on currently available information relative to statutory rates, apportionment factors and the applicable taxable income in the jurisdictions in which the Company operates, among other factors.
The Company calculates additional tax provisions, where applicable, related to accounting for uncertainty in income taxes, which prescribe a recognition threshold and measurement attribute for the financial statement recognition and measurement of tax positions taken or expected to be taken in a tax return.
Impairment of Long-Lived Assets — The Company regularly evaluates whether events and circumstances have occurred that indicate the carrying amount of property and equipment, ROU assets, and finite-life intangible assets may not be recoverable. Conditions that could indicate an impairment assessment is needed include a significant decline in the observable market value of an asset or asset group, a significant change in the extent or manner in which an asset or asset group is used, or a significant adverse change that would indicate that the carrying amount of an asset or asset group is not recoverable. When factors indicate that these long-lived assets or asset groups should be evaluated for possible impairment, the Company assesses the potential impairment by determining whether the carrying value of such long-lived assets or asset groups will be recovered through the future undiscounted cash flows expected from use of the asset or asset group and its eventual disposition. If the carrying amount of the asset or asset group is determined not to be recoverable, an impairment charge is recorded based on the excess, if any, of the carrying amount over fair value. Fair values are determined based on quoted market values or discounted cash flows analyses as applicable. The Company regularly evaluates whether events and circumstances have occurred that indicate the useful lives of property and equipment, right of use (“ROU”) assets, and finite-life intangible assets may warrant revision. The Company determined that triggering events occurred for certain leases exited during the years ended December 31, 2023 and 2022 which required an impairment review of ROU assets. Based on the results of the analysis, the Company recorded non-cash impairment charges of $
Leases — The Company accounts for leases in accordance with ASC 842, Leases. The Company measures ROU assets and liabilities based on the present value of the future minimum lease payments over the lease term at the commencement date. Minimum lease payments include the fixed lease and non-lease components of the agreement, as well as any variable rent payments that depend on an index, initially measured using the index at the lease commencement date. ROU assets are adjusted for any initial direct costs incurred less any lease incentives received, in addition to payments made on or before the commencement date of the lease. The Company recognizes lease expense for leases on a straight-line basis over the lease term.
As the implicit rate is not readily determinable for most of the Company’s lease agreements, the Company uses its estimated incremental borrowing rate to determine the initial present value of lease payments.
The Company determines if a contract is or contains a lease at inception. The Company has operating and finance leases for office space, data centers, and equipment. Leases with an initial term of
Some leases include one or more options to renew, with renewal terms that can extend the lease term from
F-12
Advertising Costs — Advertising costs are expensed as incurred and are included in selling, general and administrative expense in the accompanying consolidated statements of operations and comprehensive income. Advertising costs were $
Derivative Instruments — The Company is exposed to certain risks relating to its ongoing business operations and mitigates interest rate risk through the use of derivative instruments. Interest rate swaps have been entered into to manage a portion of the interest rate risk associated with the Company’s variable-rate borrowings.
In accordance with ASC 815, Derivatives and Hedging, the derivative instruments are recognized and subsequently measured on the balance sheet at fair value. The Company reviewed its interest rate swaps and determined they do not meet the definition of cash flow hedges. Therefore, the guidance requires that the change in fair value of the interest rate swaps be recognized as a component of income or expense in the consolidated statements of operations and comprehensive income (see Note 7).
Concentrations of Credit Risk — Financial instruments which potentially subject the Company to concentrations of credit risk consist principally of cash and cash equivalents and accounts receivable. Cash is deposited with major financial institutions and, at times, such balances with each financial institution may be in excess of insured limits. The Company has not experienced, and does not anticipate, any losses with respect to its cash deposits. Accounts receivable represent credit granted to customers for services provided. The Company performs ongoing credit evaluations of its customers’ financial condition and generally does not require collateral on accounts receivable.
The Company had
The Company has entered into interest rate derivative agreements with a counterparty bank to reduce its exposure to interest rate volatility. The Company has determined the counterparty bank to be a high credit quality institution. The Company does not enter into financial instruments for trading or speculative purposes.
Revenue Recognition — Revenues are recognized when control of the Company’s services is transferred to customers, in an amount that reflects the consideration the Company expects to be entitled to in exchange for those services. In accordance with ASC 606, Revenue from Contracts with Customers, which was adopted as of January 1, 2019 using the modified retrospective method, revenues are recognized based on the following steps:
A substantial majority of the Company’s revenues are derived from pre-onboarding and related services to our customers on a transactional basis, in which an individual background screening package or selection of services is ordered by a customer related to a single individual. Substantially all of the Company’s customers are employers, staffing companies, and other businesses or organizations. The Company’s revenues are mostly comprised of a significant volume of low-dollar services fulfilled by multiple highly automated, proprietary systems and applications. The processing of transactions and recording of revenue is based on contractual terms with the Company’s customers. The Company satisfies its performance obligations and recognizes revenues for services rendered as the orders are completed and the completed reports are transmitted, or otherwise made available. The Company’s remaining services, substantially consisting of tax consulting, fleet management, and driver qualification services, are delivered over time as the customer simultaneously receives and consumes the benefits of the services delivered. To measure the Company’s performance over time, the output method is utilized to measure the value to the customer based on the transfer to date of the services promised, with no rights of return once consumed. In these cases, revenues on transactional contracts with a defined price but an undefined quantity are recognized utilizing the right to invoice expedient resulting in revenues being recognized when the service is provided and becomes billable. Additionally, under this practical expedient, the Company is not required to estimate the transaction price.
The Company considers negotiated and anticipated incentives and estimated adjustments, including historical collections experience, when recording revenues.
F-13
The Company’s contracts with customers generally include standard commercial payment terms acceptable in each region, and do not include any financing components. The Company does not have any significant obligations for refunds, warranties, or similar obligations. The Company records revenues net of sales taxes. Due to the Company’s contract terms and the nature of the background screening industry, the Company determined its contract terms for ASC 606 purposes are less than one year. As a result, the Company uses the practical expedient which allows it to expense incremental costs of obtaining a contract, primarily consisting of sales commissions, as incurred.
The Company records third-party pass-through fees incurred as part of screening related services on a gross revenue basis, with the related expense recorded as a cost of services expense, as the Company has control over the transaction and is therefore considered to be acting as a principal. The Company records motor vehicle registration and other tax payments paid on behalf of the Company’s fleet management customers on a net revenue basis as the Company does not have control over the transaction and therefore, is considered to be acting as an agent of the customer. Amounts received from fleet management customers are recorded in cash and cash equivalents in the accompanying consolidated balance sheets as the funds are not legally restricted.
Foreign Currency — The functional currency of all of the Company’s foreign subsidiaries is the applicable local currency. The translation of the applicable foreign currencies into U.S. dollars is performed for balance sheet accounts using current exchange rates in effect at the balance sheet date and for revenues and expense accounts using average exchange rates prevailing during the fiscal year. Adjustments resulting from the translation of foreign currency financial statements are accumulated net of tax in a separate component of equity. Currency translation income (loss) included in accumulated other comprehensive income (loss) were approximately $
Gains or losses resulting from foreign currency transactions are included in the accompanying consolidated statements of operations and comprehensive income, except for those relating to intercompany transactions of a long-term investment nature, which are captured in a separate component of equity as accumulated other comprehensive income (loss). Currency transaction (loss) income included in the accompanying consolidated statements of operations and comprehensive income was approximately $(
Share-based Compensation — Prior to the Company’s Initial Public Offering (“IPO”), all share-based awards were issued by a parent of the Company under individual grant agreements and the partnership agreement (collectively the “2020 Equity Plan”). Following the IPO, share-based awards are issued to employees and non-employee directors under the 2021 Omnibus Incentive Plan (as amended by the First Amendment, dated as of May 10, 2023, the “2021 Equity Plan”). Both plans were designed with the intention of promoting the long-term success of the Company by attracting, motivating, and retaining key employees of the Company.
The Company accounts for awards issued under both plans in accordance with ASC 718, Compensation — Stock Compensation. Management expects to allow its employees granted awards under the 2020 Equity Plan and 2021 Equity Plan to bear the risks and rewards normally associated with equity ownership for a reasonable period of time when all requisite vesting requirements have been rendered. No outstanding awards are callable, and therefore, the related share-based awards are classified as equity.
The calculation of share-based employee compensation expense involves estimates that require management’s judgment. These estimates include the fair value of each of the share-based awards granted, which is estimated on the date of grant using a Black-Scholes option-pricing model. There are four inputs into the Black-Scholes option-pricing model: expected volatility, risk-free interest rates, expected term, and estimated fair value of the underlying unit. The Company estimates expected volatility based on an analysis of guidelines of publicly traded peer companies’ historical volatility. The risk-free interest rate is based on the treasury constant maturities rate based on data published by the U.S. Federal Reserve. The expected term of share-based awards granted is derived from historical exercise experience under the Company’s share-based plans and represents the period of time that awards granted are expected to be outstanding. Because of the limitations on the sale or transfer of our equity as a privately held company and a lack of historical option exercises as a public company, the Company does not believe our historical exercise pattern is indicative of the pattern we will experience in future periods. The Company has consequently used the simplified method to calculate the expected term, which is the average of the contractual term and vesting period, and plans to continue to use the simplified method until we have sufficient exercise and pricing history. Finally, prior to the IPO, the estimated fair value of the underlying equity was determined using either a transaction valuation or a blend of income and market approaches. After the IPO, the estimated fair value of the underlying equity was based on the observable market price of the Company’s equity.
F-14
The assumptions used in calculating the fair value of share-based payment awards represent management’s best estimates, but these estimates involve inherent uncertainties and the application of management’s judgment. As a result, if factors change and the Company uses different assumptions, share-based compensation expenses could be materially different in the future. In addition, for awards with a service condition, the Company has elected to account for forfeitures as they occur. Therefore, the Company will reverse compensation costs previously recognized when an unvested award is forfeited. For awards with a performance condition, the Company is required to estimate the expected forfeiture rate, and only recognize expenses for those shares expected to vest. The Company estimates the expected forfeiture rate based on the Company’s historical data, grant terms, and anticipated plan participant turnover. If the Company’s actual forfeiture rate is materially different from its estimate, the share-based compensation expense could be significantly different from what the Company has recorded in the current period.
Comprehensive Income — Comprehensive income includes gains and losses from foreign currency translation adjustments, net.
Net Income Per Share of Equity — Basic net income per share are computed by dividing net income by the weighted average number of common shares outstanding during the period. Basic weighted-average shares outstanding excludes nonvested restricted stock. Diluted net income per share is computed by dividing net income by the weighted average number of shares outstanding during the period after adjusting for the impact of securities that would have a dilutive effect on net income per share. Diluted weighted average shares outstanding, is similar to basic weighted-average shares outstanding, except that the weighted-average number of shares is increased to include the number of additional common shares that would have been outstanding if the potentially dilutive common share had been issued, including the dilutive impact of nonvested restricted stock. The Company uses the treasury stock method to incorporate potentially dilutive securities in diluted net income per share.
The potentially dilutive securities outstanding during the years ended December 31, 2023, 2022, and 2021 had a dilutive effect and were included in the calculation of diluted net income per share for the period.
Recent Accounting Pronouncements — In October 2023, the Financial Accounting Standards Board (“FASB”) issued Accounting Standards Update (“ASU”), Disclosure Improvements - Codification Amendment in Response to the SEC’s Disclosure Update and Simplification Initiative. The ASU incorporates several disclosure and presentation requirements currently residing in the SEC Regulations S-X and S-K. The amendments are to be applied prospectively and are effective when the SEC removes the related requirements from Regulations S-X or S-K. Any amendments not removed by the SEC by June 30, 2027 will not be effective. The Company does not expect ASU 2023-06 to have a material effect on its consolidated financial statements or related disclosures.
In November 2023, the FASB issued ASU 2023-07, Segment Reporting – Improvements to Reportable Segments Disclosures. The amendments improve reportable segment disclosure requirements through enhanced disclosures over significant segment expenses regularly provided to the CODM, extending certain annual disclosures to interim periods, and through permitting more than one measure of segment profit or loss to be reported under certain conditions. This guidance is effective for annual reporting periods beginning after December 15, 2023 and interim reporting periods beginning after December 31, 2024. Early adoption of the amendment is permitted, including adoption in any interim periods for which financial statements have not been issued. The Company is currently evaluating the guidance and its impact to the financial statements.
In December 2023, the FASB issued ASU 2023-09, Income Taxes (Topic 740): Improvements to Income Tax Disclosures, which requires a public business entity to disclose specific categories in its annual effective tax rate reconciliation and disaggregated information about significant reconciling items by jurisdiction and by nature. The ASU also requires entities to disclose their income tax payments (net of refunds) to international, federal, and state and local jurisdictions. This guidance is effective for fiscal years beginning after December 15, 2024, and requires prospective application with the option to apply it retrospectively. Early adoption is permitted. The Company is currently evaluating the guidance and its impact to the financial statements.
Recently Adopted Accounting Pronouncements — In October 2021, the FASB issued ASU 2021-08, Business Combinations (Topic 805): Accounting for Contract Assets and Contract Liabilities from Contracts with Customers, which requires contract assets and contract liabilities acquired in a business combination to be recognized and measured by the acquirer on the acquisition date in accordance with ASC 606, Revenue from Contracts with Customers. Prior to the issuance of this guidance, contract assets and contract liabilities were recognized by the acquirer at fair value on the acquisition date. This guidance is effective for annual reporting periods beginning after December 15, 2022 including interim periods therein. Adoption of this standard on January 1, 2023 did not have a material impact on the consolidated financial statements. However, if the Company acquires material customer contracts in the future, this standard will impact the accounting for those arrangements which may have a material effect on future results.
In March 2020, the FASB issued ASU No. 2020-04, Reference Rate Reform (Topic 848): Facilitation of the Effects of Reference Rate Reform on Financial Reporting and in January 2021 issued ASU No. 2021-01, Reference Rate Reform (Topic 848): Scope. These ASUs provide temporary optional expedients and exceptions to existing guidance on contract modifications and hedge accounting to facilitate the market transition from existing reference rates, such as the London Inter-bank Offered Rate (“LIBOR”), to alternate reference rates, such as the Secured Overnight Financing Rate (“SOFR”). These standards were effective upon issuance and allowed application to contract changes as early as January 1, 2020. Adoption of this standard in June 2023 did not have a material impact on the consolidated financial statements.
F-15
Note 3. Acquisitions
2023 Acquisition
On September 1, 2023, the Company acquired
The allocation of the purchase price is based on the fair value of assets acquired and liabilities assumed as of the acquisition date.
Consideration |
|
|
|
|
Cash purchase price |
|
$ |
|
|
Other transaction adjustments |
|
|
|
|
Total fair value of consideration transferred |
|
$ |
|
|
Current assets |
|
$ |
|
|
Property and equipment, including software developed for internal use |
|
|
|
|
Trade name |
|
|
|
|
Customer lists |
|
|
|
|
Other intangible assets |
|
|
|
|
Other assets |
|
|
|
|
Total liabilities |
|
|
( |
) |
Total identifiable net assets |
|
$ |
|
|
Goodwill |
|
$ |
|
|
Goodwill recognized is not expected to be deductible for tax purposes. Results of operation have been included in the consolidated financial statements of the Company’s Americas segment since the date of acquisition.
As of the date these consolidated financial statements were issued, the purchase accounting related to this acquisition was incomplete as the valuation of certain working capital balances, deferred taxes, and certain customary transaction adjustments were not yet finalized. The Company has reflected the provisional amounts in these consolidated financial statements. As such, the above balances may be adjusted in a future period as the valuation is finalized and these adjustments may be material to the consolidated financial statements.
2022 Acquisition
On January 1, 2022, the Company completed its asset purchase of Form I-9 Compliance, a U.S.-based technology solution and consulting service provider for I-9 and E-Verify compliance, for cash consideration of approximately $
2021 Acquisitions
On March 31, 2021, the Company completed its acquisition of selected assets and specified liabilities comprising the United Kingdom background screening business unit of a United Kingdom based company for cash consideration of $
On November 30, 2021, the Company completed its acquisition of a background screening and verification provider based in Mexico. Goodwill recognized as result of this acquisition was not deductible for tax purposes. Results of operations have been included in the consolidated financial statements of the Company’s Americas segment since the date of the acquisition.
F-16
On November 30, 2021, the Company, through one of its wholly-owned subsidiaries in the United States, entered into an agreement to acquire
Note 4. Property and Equipment, net
Property and equipment, net as of December 31, 2023 and 2022 consisted of the following (in thousands):
|
|
December 31, |
|
|||||
|
|
2023 |
|
|
2022 |
|
||
Furniture and equipment |
|
$ |
|
|
$ |
|
||
Capitalized software for internal use, acquired by business combination |
|
|
|
|
|
|
||
Capitalized software for internal use, developed internally or otherwise purchased |
|
|
|
|
|
|
||
Leasehold improvements |
|
|
|
|
|
|
||
Total property and equipment |
|
|
|
|
|
|
||
Less: accumulated depreciation and amortization |
|
|
( |
) |
|
|
( |
) |
Property and equipment, net |
|
$ |
|
|
$ |
|
||
Depreciation and amortization expense of property and equipment was approximately $
F-17
Note 5. Goodwill, Trade Names, Customer Lists, and Other Intangible Assets
The changes in the carrying amount of goodwill for the years ended December 31, 2023 and 2022 by reportable segment were as follows (in thousands):
|
|
Americas |
|
|
International |
|
|
Total |
|
|||
Balance – December 31, 2021 |
|
$ |
|
|
$ |
|
|
$ |
|
|||
Acquisitions |
|
|
|
|
|
|
|
|
|
|||
Adjustments to initial purchase price allocations |
|
|
( |
) |
|
|
|
|
|
( |
) |
|
Foreign currency translation |
|
|
|
|
|
( |
) |
|
|
( |
) |
|
Balance – December 31, 2022 |
|
$ |
|
|
$ |
|
|
$ |
|
|||
Acquisition |
|
|
|
|
|
|
|
|
|
|||
Foreign currency translation |
|
|
|
|
|
|
|
|
|
|||
Balance – December 31, 2023 |
|
$ |
|
|
$ |
|
|
$ |
|
|||
The following summarizes the gross carrying value and accumulated amortization for the Company’s trade names, customer lists, and other intangible assets as of December 31, 2023 and 2022 (in thousands):
|
|
December 31, 2023 |
||||||||||||
|
|
Gross |
|
|
Accumulated |
|
|
Net Carrying |
|
|
Useful Life |
|||
Trade names |
|
$ |
|
|
$ |
( |
) |
|
$ |
|
|
|||
Customer lists |
|
|
|
|
|
( |
) |
|
|
|
|
|||
Other intangible assets |
|
|
|
|
|
( |
) |
|
|
|
|
|||
Total |
|
$ |
|
|
$ |
( |
) |
|
$ |
|
|
|
||
|
|
December 31, 2022 |
||||||||||||
|
|
Gross |
|
|
Accumulated |
|
|
Net Carrying |
|
|
Useful Life |
|||
Trade names |
|
$ |
|
|
$ |
( |
) |
|
$ |
|
|
|||
Customer lists |
|
|
|
|
|
( |
) |
|
|
|
|
|||
Total |
|
$ |
|
|
$ |
( |
) |
|
$ |
|
|
|
||
Amortization expense of trade names, customer lists, and other intangible assets was approximately $
Amortization expense relating to trade names, customer lists, and other intangible assets is expected to be as follows (in thousands):
Years Ending December 31, |
|
|
|
|
2024 |
|
$ |
|
|
2025 |
|
|
|
|
2026 |
|
|
|
|
2027 |
|
|
|
|
2028 |
|
|
|
|
Thereafter |
|
|
|
|
|
|
$ |
|
|
F-18
Note 6. Long-term Debt
The fair value of the Company’s long-term debt obligation approximated its book value as of December 31, 2023 and 2022 and consisted of the following (in thousands):
|
|
December 31, |
|
|||||
|
|
2023 |
|
|
2022 |
|
||
First Lien Credit Facility |
|
$ |
|
|
$ |
|
||
Less: Deferred financing costs |
|
|
( |
) |
|
|
( |
) |
Long-term debt, net |
|
$ |
|
|
$ |
|
||
In February 2020, a new financing structure was established consisting of a new First Lien Credit Agreement (“First Lien Agreement”) and a new Second Lien Credit Agreement (“Second Lien Agreement”) (collectively, the “Credit Agreements”). The First Lien Agreement provided financing in the form of a $
In February 2021, the Company refinanced its First Lien Credit Facility at an increased principal amount of $
In connection with the closing of the Company’s IPO, on June 30, 2021, the Company repaid $
Additionally, in connection with the closing of the IPO, the Company entered into an amendment that increased the borrowing capacity under the Revolver from $
Scheduled maturities of long-term debt as of December 31, 2023, are as follows (in thousands):
Years Ending December 31, |
|
|
|
|
2024 |
|
$ |
|
|
2025 |
|
|
|
|
2026 |
|
|
|
|
2027 |
|
|
|
|
2028 |
|
|
|
|
Thereafter |
|
|
|
|
|
|
$ |
|
|
F-19
Note 7. Derivatives
To reduce exposure to variability in expected future cash outflows on variable rate debt attributable to the changes in one-month LIBOR, the Company has historically entered into interest rate derivative instruments to economically offset a portion of this risk and may do so in the future. In June 2023, the Company transitioned the reference rate for its interest rate derivative agreements from one-month LIBOR to one-month SOFR.
As of December 31, 2023, the Company had the following outstanding derivatives that were not designated as a hedge in qualifying hedging relationships:
Product |
|
Effective Date |
|
Maturity Date |
|
Notional |
|
Rate |
Interest rate collars (a) |
|
|
|
$ |
|
|||
Interest rate swap (b) |
|
|
|
$ |
|
|||
Interest rate swap |
|
|
|
$ |
|
|||
Interest rate swap |
|
|
|
$ |
|
Derivatives not designated as hedges are not speculative and are used to manage the Company’s exposure to interest rate movements; however, the Company has not elected to apply hedge accounting for these instruments.
The following is a summary of location and fair value of the financial positions recorded related to the derivative instruments (in thousands):
|
|
|
|
Fair Value |
|
|||||
|
|
|
|
As of December 31, |
|
|||||
Derivatives not designated |
|
Balance Sheet Location |
|
2023 |
|
|
2022 |
|
||
Interest rate collars |
|
Prepaid expenses and other current assets |
|
$ |
|
|
$ |
|
||
Interest rate swaps |
|
Accrued liabilities |
|
$ |
|
|
$ |
|
||
The following is a summary of location and amount of gains and (losses) recorded related to the derivative instruments (in thousands):
|
|
|
|
Gain/(Loss) |
|
|||||||||
|
|
|
|
Year Ended December 31, |
|
|||||||||
Derivatives not designated |
|
Income Statement Location |
|
2023 |
|
|
2022 |
|
|
2021 |
|
|||
Interest rate collars |
|
|
$ |
|
|
$ |
|
|
$ |
|
||||
Interest rate swaps |
|
|
$ |
( |
) |
|
$ |
|
|
$ |
|
|||
F-20
Note 8. Income Taxes
The Company is a U.S. domiciled corporation for tax purposes. The Company’s income tax expense and balance sheet accounts reflect the results of the Company and its subsidiaries.
The domestic and foreign components of income before provision for income taxes for the years ended December 31, 2023, 2022, and 2021, respectively, were as follows (in thousands):
|
|
Year Ended December 31, |
|
|||||||||
|
|
2023 |
|
|
2022 |
|
|
2021 |
|
|||
Income (loss) before provision for income taxes from United States operations |
|
$ |
|
|
$ |
|
|
$ |
( |
) |
||
Income before provision for income taxes from foreign operations |
|
|
|
|
|
|
|
|
|
|||
Income before provision for income taxes |
|
$ |
|
|
$ |
|
|
$ |
|
|||
The domestic and foreign components of the provision for income taxes for the years ended December 31, 2023, 2022, and 2021, respectively, were as follows (in thousands):
|
|
Year Ended December 31, |
|
|||||||||
|
|
2023 |
|
|
2022 |
|
|
2021 |
|
|||
Current: |
|
|
|
|
|
|
|
|
|
|||
Federal |
|
$ |
|
|
$ |
|
|
$ |
|
|||
State |
|
|
|
|
|
|
|
|
|
|||
Foreign |
|
|
|
|
|
|
|
|
|
|||
Total Current |
|
$ |
|
|
$ |
|
|
$ |
|
|||
|
|
|
|
|
|
|
|
|
|
|||
Deferred: |
|
|
|
|
|
|
|
|
|
|||
Federal |
|
$ |
( |
) |
|
$ |
|
|
$ |
|
||
State |
|
|
( |
) |
|
|
|
|
|
( |
) |
|
Foreign |
|
|
( |
) |
|
|
( |
) |
|
|
|
|
Total Deferred |
|
$ |
( |
) |
|
$ |
|
|
$ |
( |
) |
|
Total |
|
$ |
|
|
$ |
|
|
$ |
|
|||
The following table reconciles the U.S. statutory federal tax rate of
|
|
Year Ended December 31, |
|
|||||||||
|
|
2023 |
|
|
2022 |
|
|
2021 |
|
|||
U.S. statutory federal tax rate |
|
|
% |
|
|
% |
|
|
% |
|||
State and local income taxes – net of federal tax benefits |
|
|
|
|
|
|
|
|
( |
) |
||
Foreign rate difference |
|
|
|
|
|
|
|
|
|
|||
Change in valuation allowances |
|
|
|
|
|
( |
) |
|
|
( |
) |
|
GILTI inclusion |
|
|
|
|
|
|
|
|
|
|||
Transaction cost |
|
|
|
|
|
|
|
|
|
|||
Share-based compensation |
|
|
|
|
|
|
|
|
|
|||
Rate change impact |
|
|
( |
) |
|
|
( |
) |
|
|
|
|
US research and development credit |
|
|
( |
) |
|
|
( |
) |
|
|
( |
) |
Withholding tax |
|
|
|
|
|
|
|
|
|
|||
Return-to-provision adjustment |
|
|
( |
) |
|
|
|
|
|
|
||
Other |
|
|
|
|
|
|
|
|
( |
) |
||
Effective tax rate |
|
|
% |
|
|
% |
|
|
% |
|||
As of December 31, 2023, the Company had approximately $
F-21
The primary components of temporary differences that give rise to the Company’s net deferred tax liability as of December 31, 2023 and 2022 consist of the following (in thousands):
|
|
December 31, |
|
|||||
|
|
2023 |
|
|
2022 |
|
||
Deferred tax assets: |
|
|
|
|
|
|
||
Federal net operating loss carryforwards |
|
$ |
|
|
$ |
|
||
State net operating loss carryforwards |
|
|
|
|
|
|
||
Foreign net operating loss carryforwards |
|
|
|
|
|
|
||
Deferred revenues |
|
|
|
|
|
|
||
Bad debt reserves |
|
|
|
|
|
|
||
Employee benefits |
|
|
|
|
|
|
||
Share-based compensation |
|
|
|
|
|
|
||
Accrued expenses and loss reserves |
|
|
|
|
|
|
||
Section 267 adjustment |
|
|
|
|
|
|
||
Other deferred tax assets |
|
|
|
|
|
|
||
Less: Valuation allowances |
|
|
( |
) |
|
|
( |
) |
Total deferred tax asset |
|
$ |
|
|
$ |
|
||
Deferred tax liabilities: |
|
|
|
|
|
|
||
Trade names |
|
$ |
( |
) |
|
$ |
( |
) |
Goodwill |
|
|
( |
) |
|
|
( |
) |
Depreciable and other amortizable assets |
|
|
( |
) |
|
|
( |
) |
Other deferred liabilities |
|
|
( |
) |
|
|
( |
) |
Total deferred tax liability |
|
$ |
( |
) |
|
$ |
( |
) |
Net deferred tax liability |
|
$ |
( |
) |
|
$ |
( |
) |
Based upon the weight of all available evidence, the Company does not maintain a valuation allowance against its deferred tax assets in the United States.
As of December 31, 2023 and 2022, the Company believes that federal, state, and foreign net operating loss carryforwards will be available to reduce future taxable income after taking into account various federal and foreign limitations on the utilization of such net operating loss carryforwards.
|
|
December 31, |
|
|||||
|
|
2023 |
|
|
2022 |
|
||
Federal |
|
$ |
|
|
$ |
|
||
State |
|
|
|
|
|
|
||
Foreign |
|
|
|
|
|
|
||
|
|
$ |
|
|
$ |
|
||
If not utilized, certain foreign net operating losses will begin to expire in
The Company has fully utilized the research and development credit carryforward as of December 31, 2023. The Company had $
After consideration of all of the evidence, the Company has determined that a valuation allowance of approximately $
F-22
The aggregate changes in the balance of our gross unrecognized tax benefits, excluding accrued interest, for the years ended December 31, 2023, 2022, and 2021, were as follows (in thousands):
|
|
Year Ended December 31, |
|
|||||||||
|
|
2023 |
|
|
2022 |
|
|
2021 |
|
|||
Balance, beginning of period |
|
$ |
|
|
$ |
|
|
$ |
|
|||
Increases for tax positions related to prior years |
|
|
|
|
|
|
|
|
|
|||
Decreases for tax positions related to prior years |
|
|
|
|
|
( |
) |
|
|
|
||
Balance, end of period |
|
$ |
|
|
$ |
|
|
$ |
|
|||
An income tax benefit of approximately $
On August 16, 2022, the Inflation Reduction Act (“IRA”) was signed into law in the U.S. Some of the key provisions included in the IRA include implementation of a new alternative minimum tax, an excise tax on stock buybacks, and significant tax incentives for energy and climate initiatives. The Company incurred $
On December 15, 2022, the European Union (EU) Member States formally adopted the EU’s Pillar Two Directive, which generally provides for a minimum effective tax rate of
Note 9. Revenues
Performance obligations
Substantially all of the Company’s revenues are recognized at a point in time when the orders are completed and the completed reports are reported, or otherwise made available. For revenues delivered over time, the output method is utilized to measure the value to the customer based on the transfer to date of the services promised, with no rights of return once consumed. In these cases, revenues on transactional contracts with a defined price but an undefined quantity is recognized utilizing the right to invoice expedient resulting in revenues being recognized when the service is provided and becomes billable. Additionally, under this practical expedient, the Company is not required to estimate the transaction price.
Accordingly, in any period, the Company does not recognize a significant amount of revenues from performance obligations satisfied or partially satisfied in prior periods and the amount of such revenues recognized for the years ended December 31, 2023, 2022, and 2021, were immaterial.
Contract assets and liabilities
The contract asset balance was $
F-23
Note 10. Share-based Compensation
Share-based compensation expense is recognized in cost of services, product and technology expense, and selling, general, and administrative expense, in the accompanying consolidated statements of operations and comprehensive income as follows (in thousands):
|
|
Year Ended December 31, |
|
|||||||||
|
|
2023 |
|
|
2022 |
|
|
2021 |
|
|||
Share-based compensation expense |
|
|
|
|
|
|
|
|
|
|||
Cost of services |
|
$ |
|
|
$ |
|
|
$ |
|
|||
Product and technology expense |
|
|
|
|
|
|
|
|
|
|||
Selling, general, and administrative expense |
|
|
|
|
|
|
|
|
|
|||
Total share-based compensation expense |
|
$ |
|
|
$ |
|
|
$ |
|
|||
Prior to the IPO, all share-based awards were issued by Fastball Holdco, L.P., the Company’s previous parent company, under individual grant agreements and the partnership agreement of such parent company under the 2020 Equity Plan. In connection with the IPO, the Company adopted the 2021 Equity Plan.
In May 2023, the Company’s Board of Directors approved a modification of the vesting terms of outstanding unvested and unearned performance-based options, restricted stock units, and restricted stock (collectively, “Performance Awards”) previously issued under its equity plans. The modification, effective May 10, 2023, allowed for unvested and unearned Performance Awards outstanding as of the date of the modification, to vest based on time on the fourth, fifth, and sixth anniversaries of the relevant vesting commencement date, as set forth in each grant agreement (the “Vesting Commencement Date”), while preserving the eligibility to vest upon the Company’s investors receiving a targeted money-on-money return, subject to continued service. As of the modification date, unrecognized pre-tax non-cash compensation expense related to the Performance Awards, after accounting for the modification, was $
The fair value of the modified restricted stock units and restricted stock was estimated using the closing stock price on the date of modification.
|
|
Options |
|
|
Expected stock price volatility |
|
|
% |
|
Risk-free interest rate |
|
|
% |
|
Expected term (in years) |
|
|
|
|
Fair-value of the underlying unit |
|
$ |
|
|
In connection with the Company’s declared one-time special cash dividend in August 2023, the exercise price of outstanding stock option awards and stock purchases under the Company’s employee stock purchase plan (“ESPP”) was reduced by $
2020 Equity Plan
Awards issued under the 2020 Equity Plan consist of options and profits interests and vest based on two criteria: (1) Time — awards vest over
A summary of the profits interest unit activity under the 2020 Equity Plan for the year ended December 31, 2021 is as follows:
|
|
|
|
Class C Units |
|
|
December 31, 2020 |
|
Grants outstanding |
|
|
|
|
|
|
Exchanged for common stock in the Company |
|
|
( |
) |
|
|
Exchanged for restricted stock in the Company |
|
|
( |
) |
December 31, 2021 |
|
Grants outstanding |
|
|
|
|
F-24
A summary of the option unit activity under the 2020 Plan for the year ended December 31, 2021 is as follows:
|
|
|
|
Options |
|
|
Weighted Average Exercise Price |
|
||
December 31, 2020 |
|
Grants outstanding |
|
|
|
|
$ |
|
||
|
|
Exercised |
|
|
( |
) |
|
$ |
|
|
|
|
Forfeited |
|
|
( |
) |
|
$ |
|
|
|
|
Exchanged for options in the Company |
|
|
( |
) |
|
$ |
|
|
December 31, 2021 |
|
Grants outstanding |
|
|
|
|
$ |
|
||
In connection with the Company’s IPO, the Company’s parent was dissolved. Awards issued by the Company’s parent were converted in accordance with non-discretionary anti-dilution provisions of the 2020 Equity Plan grants as follows:
A summary of the option activity for the year ended December 31, 2023 is as follows:
|
|
|
|
Options |
|
|
Weighted Average Exercise Price |
|
|
Weighted Average Remaining Contractual Term |
|
Aggregate Intrinsic Value |
||
December 31, 2022 |
|
Grants outstanding |
|
|
|
|
$ |
|
|
|
|
|
||
|
|
Grants exercised |
|
|
( |
) |
|
$ |
|
|
|
|
|
|
|
|
Grants cancelled/forfeited |
|
|
( |
) |
|
$ |
|
|
|
|
|
|
December 31, 2023 |
|
Grants outstanding |
|
|
|
|
$ |
|
|
|
$ |
|||
December 31, 2023 |
|
Grants vested |
|
|
|
|
$ |
|
|
|
$ |
|||
December 31, 2023 |
|
Grants unvested |
|
|
|
|
$ |
|
|
|
|
|
||
The total intrinsic value of options exercised during the years ended December 31, 2023, 2022, and 2021 was $
A summary of changes in outstanding options and the related weighted-average exercise price per share for the years ended December 31, 2022 and 2021 is as follows:
|
|
December 31, |
|
|||||||||||||
|
|
2022 |
|
|
2021 |
|
||||||||||
|
|
Options |
|
|
Weighted Average Exercise Price |
|
|
Options |
|
|
Weighted Average Exercise Price |
|
||||
Grants outstanding at the beginning of the year |
|
|
|
|
$ |
|
|
|
|
|
$ |
|
||||
Grants issued in exchange for options in the Company’s Parent |
|
|
|
|
$ |
|
|
|
|
|
$ |
|
||||
Grants exercised |
|
|
( |
) |
|
$ |
|
|
|
( |
) |
|
$ |
|
||
Grants cancelled/forfeited |
|
|
( |
) |
|
$ |
|
|
|
( |
) |
|
$ |
|
||
Grants outstanding at the end of the year |
|
|
|
|
$ |
|
|
|
|
|
$ |
|
||||
Grants vested |
|
|
|
|
$ |
|
|
|
|
|
$ |
|
||||
Grants unvested |
|
|
|
|
$ |
|
|
|
|
|
$ |
|
||||
F-25
2021 Equity Plan
The 2021 Equity Plan is intended to provide a means through which to attract and retain key personnel and to provide a means whereby our directors, officers, employees, consultants, and advisors can acquire and maintain an equity interest in us, or be paid incentive compensation, including incentive compensation measured by reference to the value of our common stock, thereby strengthening their commitment to our welfare and aligning their interests with those of our stockholders. The 2021 Equity Plan provides for the grant of awards of stock options, stock appreciation rights, restricted shares, restricted stock units, and other equity-based or cash-based awards as determined by the Company’s Compensation Committee. The 2021 Equity Plan initially had a total of
Stock Options
Stock options issued immediately prior to the IPO vest based on two criteria: (1) Time — awards vest annually over
The fair value for stock options granted for the years ended December 31, 2023, 2022, and 2021 was estimated at the date of grant using the Black-Scholes option-pricing model with the following weighed average assumptions:
|
|
Year Ended December 31, |
|
|||||||||
|
|
2023 |
|
|
2022 |
|
|
2021 |
|
|||
Expected stock price volatility |
|
|
% |
|
|
% |
|
|
% |
|||
Risk-free interest rate |
|
|
% |
|
|
% |
|
|
% |
|||
Expected term (in years) |
|
|
|
|
|
|
|
|
|
|||
Fair-value of the underlying unit |
|
$ |
|
|
$ |
|
|
$ |
|
|||
A summary of the option activity for the year ended December 31, 2023 is as follows:
|
|
|
|
Options |
|
|
Weighted Average Exercise Price |
|
|
Weighted Average Remaining Contractual Term |
|
Aggregate Intrinsic Value |
||
December 31, 2022 |
|
Grants outstanding |
|
|
|
|
$ |
|
|
|
|
|
||
|
|
Grants issued |
|
|
|
|
$ |
|
|
|
|
|
||
|
|
Grants exercised |
|
|
( |
) |
|
$ |
|
|
|
|
|
|
|
|
Grants cancelled/forfeited |
|
|
( |
) |
|
$ |
|
|
|
|
|
|
December 31, 2023 |
|
Grants outstanding |
|
|
|
|
$ |
|
|
|
$ |
|||
December 31, 2023 |
|
Grants vested |
|
|
|
|
$ |
|
|
|
$ |
|||
December 31, 2023 |
|
Grants unvested |
|
|
|
|
$ |
|
|
|
|
|
||
The total intrinsic value of options exercised during the year ended December 31, 2023 was $
A summary of changes in outstanding options and the related weighted-average exercise price per share for the years ended December 31, 2022 and 2021 is as follows:
|
|
December 31, |
|
|||||||||||||
|
|
2022 |
|
|
2021 |
|
||||||||||
|
|
Options |
|
|
Weighted Average Exercise Price |
|
|
Options |
|
|
Weighted Average Exercise Price |
|
||||
Grants outstanding at the beginning of the year |
|
|
|
|
$ |
|
|
|
|
|
$ |
|
||||
Grants issued |
|
|
|
|
$ |
|
|
|
|
|
$ |
|
||||
Grants cancelled/forfeited |
|
|
( |
) |
|
$ |
|
|
|
|
|
$ |
|
|||
Grants outstanding at the end of the year |
|
|
|
|
$ |
|
|
|
|
|
$ |
|
||||
Grants vested |
|
|
|
|
$ |
|
|
|
|
|
$ |
|
||||
Grants unvested |
|
|
|
|
$ |
|
|
|
|
|
$ |
|
||||
F-26
Restricted Stock Units
Restricted stock units (“RSU”) generally vest annually over to
A summary of the RSU activity for the years ended December 31, 2023, 2022, and 2021 is as follows:
|
|
|
|
Shares |
|
|
Weighted Average Grant Date Fair Value |
|
||
December 31, 2020 |
|
Nonvested RSUs |
|
|
|
|
$ |
|
||
|
|
Granted |
|
|
|
|
$ |
|
||
December 31, 2021 |
|
Nonvested RSUs |
|
|
|
|
$ |
|
||
|
|
Granted |
|
|
|
|
$ |
|
||
|
|
Vested |
|
|
( |
) |
|
$ |
|
|
|
|
Forfeited |
|
|
( |
) |
|
$ |
|
|
December 31, 2022 |
|
Nonvested RSUs |
|
|
|
|
$ |
|
||
|
|
Granted |
|
|
|
|
$ |
|
||
|
|
Vested |
|
|
( |
) |
|
$ |
|
|
|
|
Forfeited |
|
|
( |
) |
|
$ |
|
|
December 31, 2023 |
|
Nonvested RSUs |
|
|
|
|
$ |
|
||
Restricted Stock
The following table summarizes the restricted stock issued by the Company. These include grants of unvested 2020 Equity Plan profits interests grants that were converted into restricted stock as described above, as well as restricted stock issued to new recipients. The restricted stock granted as a result of the conversion of 2020 Equity Plan profits interests retain the vesting attributes (including original service period vesting start date) of the original award.
A summary of the restricted stock activity for the years ended December 31, 2023, 2022, and 2021 is as follows:
|
|
|
|
Shares |
|
|
Weighted Average |
|
||
December 31, 2020 |
|
Nonvested restricted stock |
|
|
|
|
$ |
|
||
|
|
Grants issued in exchange for unvested profits interests in the Company’s Parent |
|
|
|
|
$ |
|
||
|
|
Vested |
|
|
( |
) |
|
$ |
|
|
December 31, 2021 |
|
Nonvested restricted stock |
|
|
|
|
$ |
|
||
|
|
Vested |
|
|
( |
) |
|
$ |
|
|
December 31, 2022 |
|
Nonvested restricted stock |
|
|
|
|
$ |
|
||
|
|
Vested |
|
|
( |
) |
|
$ |
|
|
December 31, 2023 |
|
Nonvested restricted stock |
|
|
|
|
$ |
|
||
As of December 31, 2023, the Company had approximately $
2021 Employee Stock Purchase Plan
On June 25, 2021, in connection with the IPO, the Company adopted the First Advantage Corporation 2021 Employee Stock Purchase Plan (“ESPP”) that allows eligible employees to voluntarily make after-tax contributions of up to
Excess Tax Benefits
F-27
Note 11. Defined Contribution Plan
The Company sponsors a defined contribution plan that principally consists of a contributory 401(k) savings plan. The Company makes discretionary matching contributions to the 401(k) savings plan based on a percentage of employee contributions. The expense recognized related to the Company’s contributions to the 401(k) savings plan for the years ended December 31, 2023, 2022, and 2021 was approximately $
Note 12. Equity
Common and Preferred Stock
On June 25, 2021, the Company completed its IPO of
Immediately prior to the completion of the IPO, the Company filed an Amended and Restated Certificate of Incorporation, which authorized a total of
On November 15, 2021, the Company completed a follow-on offering (“November 2021 Follow-On”) where certain existing stockholders sold an aggregate of
As of December 31, 2023,
Share Repurchase Program
On August 2, 2022, the Company’s Board of Directors authorized the repurchase of up to $
Stock repurchases may be effected through open market repurchases at prevailing market prices, including through the use of block trades and trading plans intended to qualify under Rule 10b5-1 under the Securities Exchange Act of 1934, as amended, privately-negotiated transactions, through other transactions in accordance with applicable securities laws, or a combination of these methods on such terms and in such amounts as the Company deems appropriate and will be funded from available capital. The Company is not obligated to repurchase any specific number of shares, and the timing, manner, value, and actual number of shares repurchased will depend on a variety of factors, including the Company’s stock price and liquidity requirements, other business considerations and general market and economic conditions. No shares will be purchased from SLP Fastball Aggregator, L.P. and its affiliates. The Company may discontinue or modify purchases without notice at any time.
F-28
A summary of the stock repurchase activity under the Repurchase Program, is summarized as follows (in thousands, except share and per share amounts):
|
|
Year Ended December 31, |
|
|||||
|
|
2023 |
|
|
2022 |
|
||
Shares repurchased |
|
|
|
|
|
|
||
Average price per share |
|
$ |
|
|
$ |
|
||
Costs recorded to accumulated deficit |
|
|
|
|
|
|
||
Total repurchase costs |
|
$ |
|
|
$ |
|
||
Additional associated costs |
|
|
|
|
|
|
||
Total costs recorded to accumulated deficit |
|
$ |
|
|
$ |
|
||
As of December 31, 2023, the remaining authorized value of shares available to be repurchased under the Repurchase Program was approximately $
Repurchased shares of common stock are retired. The par value of repurchased shares is deducted from common stock and the excess repurchase price over par value is reflected as a reduction to accumulated deficit. Additional associated costs include the related brokerage commissions and excise taxes on share repurchases.
Dividend
On
Note 13. Commitments and Contingencies
Litigation
The Company is involved in litigation from time to time in the ordinary course of business. At times, the Company, given the nature of its background screening business, could become subject to lawsuits, or potential class action lawsuits, in multiple jurisdictions, related to claims brought primarily by consumers or individuals who were the subject of its screening services.
For all pending matters, the Company believes it has meritorious defenses and intends to defend vigorously or otherwise seek indemnification from other parties as appropriate. However, the Company has recorded a liability of $
In June 2014 and September 2015, two separate class action cases were filed against the Company in the State of California. The two cases were coordinated together under a single judge and a single settlement agreement for both cases as coordinated together was approved by the court in December 2021. As a result, the Company recorded a total liability of $
Additionally, the Company maintains liability insurance programs to manage its litigation risks and the Company’s insurers had agreed to a single deductible to be applied to the two cases. As a result, the Company recorded a total insurance receivable of $
The Company will continue to evaluate information as it becomes known and will record an estimate for losses at the time when it is both probable that a loss has been incurred and the amount of the loss is reasonably estimable.
F-29
Note 14. Leases
The Company has operating and finance leases for office facilities and equipment. Certain of our leases include rental payments that will adjust periodically for inflation or certain adjustments based on step increases. An insignificant number of our leases contain residual value guarantees and none of our agreements contain material restrictive covenants. Variable rent expenses consist primarily of maintenance, property taxes, and charges based on usage.
The Company rents or subleases certain real estate to third parties. The Company’s sublease portfolio consists of operating leases.
The components of lease costs are as follows (in thousands):
|
|
Year Ended December 31, |
|
|||||
|
|
2023 |
|
|
2022 |
|
||
Operating lease costs |
|
|
|
|
|
|
||
Fixed |
|
$ |
|
|
$ |
|
||
Short-term |
|
|
|
|
|
|
||
Variable |
|
|
|
|
|
|
||
Sub-leases |
|
|
( |
) |
|
|
( |
) |
Total operating lease costs |
|
$ |
|
|
$ |
|
||
|
|
|
|
|
|
|
||
Finance lease costs |
|
|
|
|
|
|
||
Amortization of leased assets |
|
$ |
|
|
$ |
|
||
Interest on lease liabilities |
|
|
|
|
|
|
||
Total finance lease costs |
|
$ |
|
|
$ |
|
||
Total lease cost |
|
$ |
|
|
$ |
|
||
Supplemental balance sheet information related to leases is as follows (in thousands):
|
|
|
|
December 31, |
|
|||||
|
|
Classification |
|
2023 |
|
|
2022 |
|
||
Assets |
|
|
|
|
|
|
|
|
||
Operating leases |
|
|
|
|
|
|
|
|
||
Right of use operating lease assets |
|
|
$ |
|
|
$ |
|
|||
Finance leases |
|
|
|
|
|
|
|
|
||
Property and equipment, gross |
|
Property and equipment, net |
|
|
|
|
|
|
||
Accumulated depreciation |
|
Property and equipment, net |
|
|
( |
) |
|
|
( |
) |
Property and equipment, net |
|
Property and equipment, net |
|
|
|
|
|
|
||
Total lease assets |
|
|
|
$ |
|
|
$ |
|
||
|
|
|
|
|
|
|
|
|
||
Liabilities |
|
|
|
|
|
|
|
|
||
Operating leases |
|
|
|
|
|
|
|
|
||
Other current |
|
Current portion of operating lease liability |
|
$ |
|
|
$ |
|
||
Non-current |
|
Operating lease liability, less current portion |
|
|
|
|
|
|
||
Total operating liabilities |
|
|
|
|
|
|
|
|
||
Finance leases |
|
|
|
|
|
|
|
|
||
Other current |
|
|
|
|
|
|
|
|||
Total finance liabilities |
|
|
|
|
|
|
|
|
||
Total lease liabilities |
|
|
|
$ |
|
|
$ |
|
||
F-30
Maturities of lease liabilities are as follows (in thousands):
Years Ending December 31, |
|
Operating Leases |
|
|
2024 |
|
$ |
|
|
2025 |
|
|
|
|
2026 |
|
|
|
|
2027 |
|
|
|
|
2028 |
|
|
|
|
Thereafter |
|
|
|
|
Total minimum lease payments |
|
$ |
|
|
Less: Imputed interest |
|
|
( |
) |
Present value of minimum lease payments |
|
$ |
|
|
Lease term and discount rates are as follows:
|
|
Year Ended December 31, |
|
|||||
|
|
2023 |
|
|
2022 |
|
||
Weighted average remaining lease term |
|
|
|
|
|
|
||
Operating leases |
|
|
|
|
||||
Finance leases |
|
|
— |
|
|
|
||
|
|
|
|
|
|
|
||
Weighted average discount rate |
|
|
|
|
|
|
||
Operating leases |
|
|
% |
|
|
% |
||
Finance leases |
|
|
— |
|
|
|
% |
|
Supplemental cash flow information related to leases was as follows (in thousands):
|
|
Year Ended December 31, |
|
|||||
|
|
2023 |
|
|
2022 |
|
||
Cash paid for amounts included in measurement of lease liabilities: |
|
|
|
|
|
|
||
Operating cash flows from operating leases |
|
$ |
|
|
$ |
|
||
Operating cash flows from finance leases |
|
|
|
|
|
|
||
Financing cash flows from finance leases |
|
|
|
|
|
|
||
Right-of-use assets obtained in exchange for lease obligations: |
|
|
|
|
|
|
||
Operating leases |
|
$ |
|
|
$ |
|
||
Amortization: |
|
|
|
|
|
|
||
Amortization of right-of-use operating lease assets (1) |
|
$ |
|
|
$ |
|
||
Rent expense under fixed operating leases was $
Note 15. Related Party Transactions
The Company had
F-31
Note 16. Net Income Per Share
Basic and diluted net income per share was calculated as follows:
|
|
Year Ended December 31, |
|
|||||||||
(in thousands, except share and per share amounts) |
|
2023 |
|
|
2022 |
|
|
2021 |
|
|||
Basic net income per share |
|
$ |
|
|
$ |
|
|
$ |
|
|||
Diluted net income per share |
|
$ |
|
|
$ |
|
|
$ |
|
|||
Numerator: |
|
|
|
|
|
|
|
|
|
|||
Net income |
|
|
|
|
|
|
|
|
|
|||
Denominator: |
|
|
|
|
|
|
|
|
|
|||
Weighted average number of shares outstanding - basic |
|
|
|
|
|
|
|
|
|
|||
Add options and restricted stock units to purchase units |
|
|
|
|
|
|
|
|
|
|||
Weighted average number of shares outstanding - diluted |
|
|
|
|
|
|
|
|
|
|||
For the years ended December 31, 2023, 2022, and 2021,
Note 17. Reportable Segments
We have
We define Adjusted EBITDA as net income before interest, taxes, depreciation, and amortization, and as further adjusted for loss on extinguishment of debt, share-based compensation, transaction and acquisition-related charges, integration and restructuring charges, and other non-cash charges. We exclude the impact of share-based compensation because it is a non-cash expense and we believe that excluding this item provides meaningful supplemental information regarding performance and ongoing cash generation potential. We exclude loss on extinguishment of debt, transaction and acquisition related charges, integration and restructuring charges, and other charges because such expenses are episodic in nature and have no direct correlation to the cost of operating our business on an ongoing basis.
The segment financial information below aligns with how we report information to our CODM to assess operating performance and how the Company manages the business. Corporate costs are generally allocated to the segments based upon estimated revenue levels and other assumptions that management considers reasonable. The CODM does not review the Company’s assets by segment; therefore, such information is not presented. The accounting policies of the segments are the same as described in Note 2, “Summary of Significant Accounting Policies” and Note 9, “Revenues.”
The following is a description of our two reportable segments:
Americas. This segment performs a variety of background check and compliance services across all phases of the workforce lifecycle from pre-onboarding services to post-onboarding and ongoing monitoring services, covering employees, contractors, contingent workers, tenants, and drivers. We generally classify our service offerings into three categories: pre-onboarding, post-onboarding, and adjacent products. We deliver our solutions across multiple industry verticals in the United States, Canada, and Latin America markets.
International. The International segment provides services similar to our Americas segment in regions outside of the Americas. We primarily deliver our solutions across multiple industry verticals in the Europe, India, and Asia Pacific markets.
F-32
A reconciliation of Segment Adjusted EBITDA to net income for the years ended December 31, 2023, 2022, and 2021 is as follows (in thousands):
|
|
Year Ended December 31, |
|
|||||||||
|
|
2023 |
|
|
2022 |
|
|
2021 |
|
|||
Adjusted EBITDA |
|
|
|
|
|
|
|
|
|
|||
Americas |
|
$ |
|
|
$ |
|
|
$ |
|
|||
International |
|
|
|
|
|
|
|
|
|
|||
Total |
|
$ |
|
|
$ |
|
|
$ |
|
|||
Adjustments to reconcile to net income: |
|
|
|
|
|
|
|
|
|
|||
Interest expense, net |
|
|
|
|
|
|
|
|
|
|||
Provision for income taxes |
|
|
|
|
|
|
|
|
|
|||
Depreciation and amortization |
|
|
|
|
|
|
|
|
|
|||
Loss on extinguishment of debt |
|
|
|
|
|
|
|
|
|
|||
Share-based compensation |
|
|
|
|
|
|
|
|
|
|||
Transaction and acquisition-related charges (a) |
|
|
|
|
|
|
|
|
|
|||
Integration, restructuring, and other charges (b) |
|
|
|
|
|
|
|
|
|
|||
Net income |
|
$ |
|
|
$ |
|
|
$ |
|
|||
Geographic Information
The Company bases revenues by geographic region in which the revenues and invoicing are recorded. Other than the United States,
The following summarizes revenues by geographical region (in thousands):
|
|
Year Ended December 31, |
|
|||||||||
|
|
2023 |
|
|
2022 |
|
|
2021 |
|
|||
Revenues |
|
|
|
|
|
|
|
|
|
|||
Americas |
|
$ |
|
|
$ |
|
|
$ |
|
|||
International |
|
|
|
|
|
|
|
|
|
|||
Eliminations |
|
|
( |
) |
|
|
( |
) |
|
|
( |
) |
Total revenues |
|
$ |
|
|
$ |
|
|
$ |
|
|||
The following table sets forth net long-lived assets by geographic area (in thousands):
|
|
December 31, |
|
|||||
|
|
2023 |
|
|
2022 |
|
||
Long-lived assets, net |
|
|
|
|
|
|
||
United States, country of domicile |
|
$ |
|
|
$ |
|
||
All other countries |
|
|
|
|
|
|
||
Total long-lived assets, net |
|
$ |
|
|
$ |
|
||
F-33
Note 18. Subsequent Events
On February 28, 2024, we entered into an Agreement and Plan of Merger (the “Merger Agreement”), by and among First Advantage, Sterling Check Corp., a Delaware corporation (“Sterling”), and Starter Merger Sub, Inc., a Delaware corporation and an indirect, wholly owned subsidiary of First Advantage (“Merger Sub”). The Merger Agreement provides that, upon the terms and subject to the conditions set forth therein, Merger Sub will be merged with and into Sterling, with Sterling continuing as the surviving corporation in such merger and becoming an indirect, wholly owned subsidiary of First Advantage. The cash-and-stock transaction (the “Acquisition”) values Sterling at approximately $
In connection with the execution of the Merger Agreement, First Advantage Holdings, LLC, a subsidiary of the Company (the “Borrower”), entered into a commitment letter with certain financial institutions that committed to provide, subject to the terms and conditions of the commitment letter, an incremental term loan in an aggregate principal amount of $
The Acquisition is subject to satisfaction or waiver of customary closing conditions, including, among others, adoption of the Merger Agreement by Sterling stockholders, the expiration or termination of the waiting period under the Hart-Scott-Rodino Antitrust Improvement Act of 1976 (the “HSR Act”) and clearance under the antitrust or foreign direct investment laws of certain other jurisdictions, and the effectiveness of a registration statement on Form S-4 to be filed by First Advantage in connection with the Acquisition.
F-34
Note 19. Condensed Financial Information of Registrant
FIRST ADVANTAGE CORPORATION
(PARENT COMPANY ONLY)
CONDENSED BALANCE SHEETS
(in thousands, except share and per share data)
|
|
As of December 31, |
|
|||||
|
|
2023 |
|
|
2022 |
|
||
ASSETS |
|
|
|
|
|
|
||
Investments in subsidiaries |
|
$ |
|
|
$ |
|
||
LIABILITIES AND EQUITY |
|
|
|
|
|
|
||
Liabilities |
|
$ |
|
|
$ |
|
||
EQUITY |
|
|
|
|
|
|
||
Common stock - $ |
|
|
|
|
|
|
||
Additional paid-in-capital |
|
|
|
|
|
|
||
Accumulated deficit |
|
|
( |
) |
|
|
( |
) |
Accumulated other comprehensive income |
|
|
( |
) |
|
|
( |
) |
Total equity |
|
|
|
|
|
|
||
TOTAL LIABILITIES AND EQUITY |
|
$ |
|
|
$ |
|
||
The accompanying note is an integral part of these condensed financial statements.
FIRST ADVANTAGE CORPORATION
(PARENT COMPANY ONLY)
CONDENSED STATEMENTS OF OPERATIONS AND COMPREHENSIVE (LOSS)
(in thousands, except share and per share data)
|
|
For the Year Ended December 31, |
|
|||||||||
|
|
2023 |
|
|
2022 |
|
|
2021 |
|
|||
Equity in net income of subsidiaries |
|
$ |
|
|
$ |
|
|
$ |
|
|||
NET INCOME |
|
|
|
|
|
|
|
|
|
|||
Foreign currency translation adjustments |
|
|
|
|
|
( |
) |
|
|
( |
) |
|
COMPREHENSIVE INCOME |
|
$ |
|
|
$ |
|
|
$ |
|
|||
|
|
|
|
|
|
|
|
|
|
|||
NET INCOME |
|
$ |
|
|
$ |
|
|
$ |
|
|||
Basic net income per share |
|
$ |
|
|
$ |
|
|
$ |
|
|||
Diluted net income per share |
|
$ |
|
|
$ |
|
|
$ |
|
|||
Weighted average number of shares outstanding - basic |
|
|
|
|
|
|
|
|
|
|||
Weighted average number of shares outstanding - diluted |
|
|
|
|
|
|
|
|
|
|||
A statement of cash flows has not been presented as First Advantage Corporation (parent company) did not have any cash as of, or at any point in time during, the years ended December 31, 2023, 2022 or 2021.
The accompanying note is an integral part of these condensed financial statements.
F-35
Note to Condensed Financial Statements of Registrant (Parent Company Only)
Basis of Presentation
Fastball Intermediate, Inc. was formed on November 15, 2019. In March 2021, Fastball Intermediate, Inc. changed its name to First Advantage Corporation.
These condensed parent company-only financial statements have been prepared in accordance with Rule 12-04, Schedule I of Regulation S-X, as the restricted net assets of the subsidiaries of First Advantage Corporation (as defined in Rule 4-08(e)(3) of Regulation S-X) exceed the specified threshold amount of the consolidated net assets of the Company. Because we have a consolidated accumulated deficit, the
These condensed parent company-only financial statements have been prepared using the same accounting principles and policies described in the notes to the consolidated financial statements, with the only exception being that the parent company accounts for its subsidiaries using the equity method. These condensed parent company-only financial statements should be read in conjunction with the consolidated financial statements and related notes thereto included elsewhere in this Annual Report.
F-36