UNITED STATES
SECURITIES AND EXCHANGE COMMISSION
Washington, D.C. 20549
FORM
For the Fiscal Year Ended
OR
For the transition period from to
Commission File Number
(Exact Name of Registrant as Specified in its Charter)
(State or Other Jurisdiction of Incorporation) | (I.R.S. Employer Identification No.) |
(Address of Principal Executive Offices) | (Zip Code) |
(
(Registrant’s telephone number, including area code)
Securities Registered pursuant to Section 12(b) of the Act:
Title of each class: | Trading Symbol(s) | Name of each exchange on which registered: | ||
Securities Registered pursuant to Section 12(g) of the Act:
None
Indicate by check mark if the registrant is a well-known seasoned issuer, as defined in Rule 405 of the Securities Act.
Indicate by check mark if the registrant is not required to file reports pursuant to Section 13 or 15(d) of the Act. Yes ☐
Indicate by check mark whether the registrant: (1) has filed all reports required to be filed by Section 13 or 15(d) of the Securities Exchange Act of 1934 during the preceding 12 months (or for such shorter period that the registrant was required to file such reports), and (2) has been subject to such filing requirements for the past 90 days.
Indicate by check mark whether the registrant has submitted electronically every Interactive Data File required to be submitted pursuant to Rule 405 of Regulation S-T (Section 232.405 of this chapter) during the preceding 12 months (or for such shorter period that the registrant was required to submit such files).
Indicate by check mark whether the registrant is a large accelerated filer, an accelerated filer, a non-accelerated filer, a smaller reporting company, or an emerging growth company. See the definitions of “large accelerated filer,” “accelerated filer,” “smaller reporting company,” and “emerging growth company” in Rule 12b-2 of the Exchange Act.
Accelerated filer ☐ | ||
Non-accelerated filer ☐ | Smaller reporting company Emerging growth company |
If an emerging growth company, indicate by check mark if the registrant has elected not to use the extended transition period for complying with any new or revised financial accounting standards provided pursuant to Section 13(a) of the Exchange Act. ☐
Indicate by check mark whether the registrant has filed a report on and attestation to its management’s assessment of the effectiveness of its internal control over financial reporting under Section 404(b) of the Sarbanes-Oxley Act (15 U.S.C. 7262(b)) by the registered public accounting firm that prepared or issued its audit report.
If securities are registered pursuant to Section 12(b) of the Act, indicate by check mark whether the financial statements of the registrant included in the filing reflect the correction of an error to previously issued financial statements.
Indicate by check mark whether any of those error corrections are restatements that required a recovery analysis of incentive-based compensation received by any of the registrant’s executive officers during the relevant recovery period pursuant to §240.10D-1(b). ☐
Indicate by check mark whether the registrant is a shell company (as defined in Rule 12b-2 of the Act).
As of June 30, 2023, the aggregate market value of the registrant’s voting shares held by non-affiliates was approximately $
As of February 9, 2024, there were
DOCUMENTS INCORPORATED BY REFERENCE
Portions of the First Hawaiian, Inc. Proxy Statement for its 2024 Annual Meeting of Stockholders are incorporated by reference in this Form 10-K in response to Part III, Items 10, 11, 12, 13 and 14. Such Proxy Statement will be filed within 120 days of First Hawaiian, Inc.’s fiscal year ended December 31, 2023.
TABLE OF CONTENTS
FIRST HAWAIIAN, INC.
FORM 10-K ANNUAL REPORT
Part I | Page No. | ||||
|
|
| 2 | ||
|
|
| 16 | ||
|
|
| 42 | ||
|
| 42 | |||
|
|
| 45 | ||
|
|
| 45 | ||
|
|
| 45 | ||
|
|
|
|
|
|
Part II |
|
| |||
|
|
| 46 | ||
47 | |||||
|
| Management's Discussion and Analysis of Financial Condition and Results of Operations | 48 | ||
|
|
| 92 | ||
|
|
| 93 | ||
|
| Changes in and Disagreements With Accountants on Accounting and Financial Disclosure | 175 | ||
|
|
| 175 | ||
|
|
| 178 | ||
|
| Disclosure Regarding Foreign Jurisdictions that Prevent Inspections |
| 178 | |
Part III |
|
| |||
|
|
| 178 | ||
|
|
| 178 | ||
|
| Security Ownership of Certain Beneficial Owners and Management and Related Stockholder Matters | 179 | ||
|
| Certain Relationships and Related Transactions, and Director Independence |
| 179 | |
|
|
| 179 | ||
|
|
|
|
|
|
Part IV |
|
| |||
|
|
| 180 | ||
|
|
| 180 | ||
| 184 | ||||
1
PART I
ITEM 1. BUSINESS
General
First Hawaiian, Inc. (“FHI” or the “Parent”), a bank holding company, owns 100% of the outstanding common stock of First Hawaiian Bank (“FHB” or the “Bank”). References to “we,” “our,” “us,” or the “Company” refer to the Parent and its wholly-owned subsidiary, FHB, for purposes of discussion in this Annual Report on Form 10-K.
FHI is a bank holding company incorporated in the state of Delaware and headquartered in Honolulu, Hawaii. Our wholly-owned bank subsidiary, FHB, was founded in 1858 under the name Bishop & Company and was the first successful banking partnership in the Kingdom of Hawaii and the second oldest bank formed west of the Mississippi River. As of December 31, 2023, FHB is the largest full-service bank headquartered in Hawaii as measured by assets, loans, deposits and net income. As of December 31, 2023, we had $24.9 billion of assets, $14.4 billion of gross loans and leases, $21.3 billion of deposits and $2.5 billion of stockholders’ equity. We generated $235.0 million of net income or diluted earnings per share of $1.84 per share for the year ended December 31, 2023.
Through the Bank, we operate a network of 50 branches in Hawaii (45 branches), Guam (3 branches) and Saipan (2 branches). We provide a diversified range of banking services to consumer and commercial customers, including deposit products, lending services and wealth management and trust services. Through our distribution channels, we offer a variety of deposit products to our customers, including checking and savings accounts and other types of deposit accounts. We offer comprehensive commercial banking services to middle market and large Hawaii-based businesses with strong balance sheets and high-quality collateral. We provide commercial and industrial lending, including auto dealer flooring, commercial real estate and construction lending. We also offer comprehensive consumer lending services focused on residential real estate lending, indirect auto financing and other consumer loans to individuals and small businesses through our branch, online and mobile distribution channels. Our wealth management business provides an array of trust services, private banking and investment management services. We also offer consumer and commercial credit cards and merchant processing.
We seek to develop comprehensive, long-term banking relationships by offering a diverse array of products and services, cross-selling those products and services and delivering high quality customer service. Our service culture and emphasis on repeat positive customer experiences are integral to our banking strategy and exemplified by our longstanding customer relationships.
We operate our business through three operating segments: Retail Banking, Commercial Banking and Treasury and Other. See “Item 7. Management’s Discussion and Analysis of Financial Condition and Results of Operations (“MD&A”) – Analysis of Business Segments” and “Note 22. Reportable Operating Segments” in the notes to the consolidated financial statements included in Item 8. Financial Statements and Supplementary Data for more information.
Human Capital Resources
As of December 31, 2023, we had over 2,000 employees, which included full time employees, part time employees and temporary employees, primarily located in our key markets of Hawaii, Guam and Saipan. As of December 31, 2023, the average tenure of employees at our Company is 11.5 years.
The Company’s success depends, in large part, on its ability to attract, develop and retain skilled employees. The Company recognizes that supporting and engaging with its workforce is key to meeting evolving corporate and customer needs. Through ongoing employee development, fostering a diverse and inclusive workforce and a focus on health, safety and employee wellbeing, we strive to help our employees in all aspects of their lives. We believe our relationship with our employees to be generally good. None of our employees are parties to a collective bargaining agreement and we do not expect a significant change in the number of our employees in the near future.
2
Training and Development
Learning and development are foundational to our purpose as an institution. We invest in attracting, developing and retaining the best talent. Our innovative talent development and employee learning courses are woven into our strategy and corporate culture. As of the date of this report, we offer 12 leadership development programs in total and over 20,000 professional development courses for employees through an Online Learning Center.
Diversity and Inclusion
We believe that employing a diverse workforce enhances our ability to serve our customers and our communities. By promoting a workforce that we believe is reflective of our customers and communities, we believe that we may better understand the financial needs of our customers and provide them with relevant financial service products.
Our commitment to diversity and inclusion starts at the top with a diverse board. As of the date of this report, the FHI Board of Directors includes three women, representing 33% of directors, and six ethnically diverse individuals, representing 67% of directors. As of December 31, 2023, 63% of our employees were women, 54% of all management positions were held by women, and 86% of our workforce were ethnically diverse.
Health, Safety and Wellness
We recognize that each employee’s benefit needs may differ and have designed our benefits program to be flexible. We offer healthcare options for employees aimed at reducing out-of-pocket costs. Additionally, the Bank utilizes plexiglass barriers and provides hand-sanitizing stations within our facilities. The Company will continue to monitor and take measures that it considers to be appropriate to protect the safety and health of its employees.
Our Products and Services
The Bank is a full-service community bank focused on building relationships with our customers. We provide a variety of deposit accounts and lending services to commercial and consumer customers, as well as credit card products, wealth management services and merchant processing services. We offer a comprehensive range of commercial lending services including commercial and industrial lending, auto dealer flooring, commercial real estate lending and construction lending. Our primary consumer lending services are mortgage lending, auto finance, small business loans, personal installment loans and credit cards. Our wealth management business offers individuals investment and financial planning services, insurance protection, trust and estate services and private banking.
Competition
We operate in the highly competitive financial services industry and face significant competition for customers from financial institutions located both within and beyond our principal markets. We compete with commercial banks, savings banks, credit unions, non-bank financial services companies and other financial institutions operating within or near the areas we serve. Additionally, certain large banks headquartered on the U.S. mainland and large community banking institutions target the same customers we do. In addition, as customer preferences and expectations continue to evolve, technology has lowered barriers to entry and made it possible for banks to expand their geographic reach by providing services over the Internet and for non-banks, such as financial technology firms, to offer products and services traditionally provided by banks, such as automatic transfers and automatic payment systems, without the need of physical branches. In addition, the Company’s ability to continue to compete effectively also depends on its ability to attract new employees and retain and motivate existing employees, while managing compensation and other costs.
3
Organizational History and Structure
In August 2016, FHI completed our initial public offering (“IPO”), and shares of FHI’s common stock began trading on the NASDAQ Global Select Market (“NASDAQ”) under the ticker symbol “FHB”.
Prior to our IPO, we were an indirect wholly owned subsidiary of BNP Paribas (“BNPP”), a global financial institution based in France. On April 1, 2016, BNPP effected a series of reorganization transactions (“Reorganization Transactions”), as a part of which we amended our certificate of incorporation to change our name to First Hawaiian, Inc., with First Hawaiian Bank remaining our only direct wholly owned subsidiary.
In February 2019, BNPP fully exited its ownership position in FHI common stock.
Supervision and Regulation
We are subject to extensive regulation under federal and state banking laws that establish a comprehensive framework for our operations. This regulatory framework may materially impact our growth potential and financial performance and is intended primarily for the protection of the safety and soundness of financial institutions, maintenance of the federal deposit insurance system and the protection of consumers or classes of consumers, rather than the protection of stockholders or other investors. Statutes, regulations and policies applicable to banks or bank holding companies are continually under review by Congress and state legislatures and federal and state regulatory agencies.
Significant elements of the statutes, regulations and policies applicable to the Company are described below.
Regulatory Agencies
FHI is a bank holding company under the U.S. Bank Holding Company Act of 1956 (the “BHC Act”) and has elected to be treated as a financial holding company under the BHC Act. Consequently, FHI and its subsidiaries are subject to the supervision, regulation, examination and reporting requirements of the Board of Governors of the Federal Reserve System (the “Federal Reserve”). The BHC Act provides generally for “umbrella” regulation of bank holding companies by the Federal Reserve and functional regulation of holding company subsidiaries by applicable regulatory agencies. The BHC Act, however, authorizes the Federal Reserve to examine any subsidiary of a bank holding company, other than a depository institution, that is engaged in activities permissible for a depository institution. The Federal Reserve is also granted the authority, in certain circumstances, to require reports of, examine and adopt rules applicable to any holding company subsidiary.
In general, the BHC Act limits the activities permissible for bank holding companies. Bank holding companies electing to be treated as financial holding companies, however, may engage in additional activities under the BHC Act as described below under “— Permissible Activities under the BHC Act”. For a bank holding company to be eligible to elect financial holding company status, all of its subsidiary insured depository institutions must be well-capitalized and well-managed, as described below under “— Prompt Corrective Action Framework”, and must have received at least a “Satisfactory” rating on such institution’s most recent examination under the Community Reinvestment Act (the “CRA”), as described below under “—Community Reinvestment Act of 1977”. The bank holding company itself must also be well-capitalized and well-managed in order to be eligible to elect financial holding company status. If a financial holding company fails to continue to meet any of the well-capitalized and well-managed prerequisites for financial holding company status, the Federal Reserve may place limitations on the company’s ability to conduct the broader financial activities permissible for financial holding companies or impose limitations or conditions on the conduct or activities of the bank holding company or its affiliates. In addition, the bank holding company must enter into an agreement with the Federal Reserve to comply with all applicable capital and management requirements. If the company does not return to compliance within 180 days, the Federal Reserve may order the company to divest its subsidiary banks or the company may be required to discontinue or divest investments in companies engaged in activities permissible only for a bank holding company electing to be treated as a financial holding company. In addition, if any insured depository institution subsidiary of a financial holding company fails to maintain a CRA rating of at least “Satisfactory,” the financial holding company will be subject to restrictions on certain new activities and acquisitions.
4
FHB is a Federal Deposit Insurance Corporation (the “FDIC”) insured bank chartered under the laws of the State of Hawaii. FHB is not a member of the Federal Reserve System. Consequently, the FDIC and the Hawaii Department of Financial Institutions (the “Hawaii DFI”) are the primary regulators of FHB and also regulate its subsidiaries. FHB’s branch operations in Guam are also subject to regulation by the Banking and Insurance Commissioner of the Government of Guam Department of Revenue and Taxation (the “Guam Banking and Insurance Commissioner”). FHB’s branch operation in Saipan, which is one of the principal islands of the Commonwealth of the Northern Mariana Islands (“CNMI”), is subject to the regulatory jurisdiction of the Division of Banking of the CNMI Department of Commerce. In addition, as the owner of a Hawaii-chartered bank, FHI is registered as a financial institution holding company under the Hawaii Code of Financial Institutions (the “Hawaii Code”) and is subject to the registration, reporting and examination requirements of the Hawaii Code, as well as supervision and examination by the Hawaii DFI.
The Company offers certain insurance, investment and trust products through FHB and its subsidiary, Bishop Street Capital Management Corporation, a registered investment adviser with the SEC. Bishop Street Capital Management Corporation is subject to the disclosure and regulatory requirements of the Investment Advisers Act of 1940, as administered by the SEC. FHB is also registered as a municipal securities advisor with the Municipal Securities Rulemaking Board (“MSRB”) and the SEC and is subject to the disclosure and regulatory requirements of the MSRB and the SEC. FHB’s insurance brokerage activities in Hawaii are conducted under its insurance producer license by appointed agents (licensed insurance producers) and those licensees are subject to regulation by the Insurance Division of the State of Hawaii Department of Commerce and Consumer Affairs (the “DCCA Insurance Division”). FHB’s trust services in Hawaii are subject to regulation by the FDIC and the Hawaii DFI. FHB’s insurance activities in Guam are conducted under a general agent’s license issued by the Guam Banking and Insurance Commissioner and FHB is therefore subject to regulation by the insurance branch of the regulatory division of the Guam Department of Revenue and Taxation.
FHB and its affiliates are also subject to supervision, regulation, examination and enforcement by the Consumer Financial Protection Bureau (the “CFPB”), with respect to consumer protection laws and regulations. In addition, FHI is subject to the disclosure and regulatory requirements of the U.S. Securities and Exchange Act of 1934 (“Exchange Act”) administered by the SEC and the rules adopted by NASDAQ applicable to listed companies. The Company is subject to numerous other statutes and regulations that affect its business activities and operations.
Permissible Activities under the BHC Act
In general, the BHC Act limits the business of bank holding companies to banking, managing or controlling banks and other activities that the Federal Reserve has determined to be so closely related to banking as to be a proper incident thereto.
Bank holding companies that qualify and elect to be treated as “financial holding companies,” like us, may engage in, or acquire and retain the shares of a company engaged in, a broad range of additional activities that are (i) financial in nature, as determined by the Federal Reserve in consultation with the Secretary of the Treasury, or incidental to such financial activities or (ii) complementary to a financial activity and do not pose a substantial risk to the safety and soundness of depository institutions or the financial system generally. These activities include securities underwriting and dealing, insurance underwriting and brokerage and making merchant banking investments.
The BHC Act does not place territorial restrictions on permissible non-banking activities of bank holding companies. The Federal Reserve has the power to order any bank holding company or its subsidiaries to terminate any activity or to terminate its ownership or control of any subsidiary when the Federal Reserve has reasonable grounds to believe that continuing such activity, ownership or control constitutes a serious risk to the financial soundness, safety or stability of any bank subsidiary of the bank holding company.
Permissible Activities for Banks
As a Hawaii-chartered bank, FHB’s business is generally limited to activities permitted by Hawaii law and applicable federal laws. Under the Hawaii Code, the Bank may generally engage in all usual banking activities, including accepting deposits; extending loans and lines of credit; borrowing money; issuing, confirming and advising letters of credit; entering into repurchase agreements; buying and selling foreign currency and, subject to certain limitations, making investments. Subject to prior approval by the Commissioner of the Hawaii DFI and by the DCCA Insurance Division, the Bank may also permissibly engage in activities related to a trust business, activities relating to insurance and annuities and any activity permissible for a national banking association.
5
Hawaii law also imposes restrictions on the Bank’s activities and corporate governance requirements intended to ensure the safety and soundness of the Bank. For example, the Hawaii Code requires that at least one of the directors of the Bank, as well as the Chief Executive Officer of the Bank, be residents of the State of Hawaii. FHB is also restricted under the Hawaii Code to investing in certain types of investments and is generally limited in the amount of money it can lend to a single borrower or invest in securities issued by a single issuer (in each case, 20% of FHB’s common stock and additional paid-in capital).
Acquisitions by Bank Holding Companies
The BHC Act, the Bank Merger Act, the Hawaii Code and other federal and state statutes regulate acquisitions of bank holding companies, banks and other FDIC-insured depository institutions. The Company must obtain the prior approval of the Federal Reserve before (i) acquiring direct or indirect ownership or control of any voting shares of any bank or bank holding company, if after such acquisition, it will directly or indirectly own or control 5% or more of any class of voting shares of the institution, (ii) acquiring all or substantially all of the assets of any bank (other than directly through the Bank) or (iii) merging or consolidating with any other bank holding company. Under the Bank Merger Act, the prior approval of the FDIC is required for the Bank to merge with another bank or purchase all or substantially all of the assets or assume any of the deposits of another FDIC-insured depository institution. In reviewing applications seeking approval of merger and acquisition transactions, bank regulators consider, among other things, the competitive effect and public benefits of the transactions, the capital position and managerial resources of the combined organization, the risks to the stability of the U.S. banking or financial system, the applicant’s performance record under the CRA, the applicant’s compliance with applicable laws, including fair housing and other consumer protection laws and the effectiveness of all organizations involved in combating money laundering activities. In addition, failure to implement or maintain adequate compliance programs could cause bank regulators not to approve an acquisition where regulatory approval is required or to prohibit an acquisition even if approval is not required. In addition, the federal bank regulators will consider the extent to which a proposed transaction would result in greater or more concentrated risks to the stability of the U.S. banking or financial system. In addition, under applicable laws, the Company may not be permitted to acquire any bank in Hawaii because it controls more than 30% of the total amount of deposits in the Hawaii market. As a result, any further growth in the Hawaii market will most likely have to occur organically rather than by acquisition.
Dividends and Repurchases
FHI is a legal entity separate and distinct from the Bank and its subsidiaries. Virtually all of FHI’s income comes from dividends from the Bank, which is also the primary source of FHI’s liquidity and funds to pay dividends on its equity and, if FHI were to incur debt in the future, interest and principal on its debt. There are statutory and regulatory limitations on the payment of dividends by the Bank to FHI, as well as by FHI to its stockholders.
Federal bank regulators are authorized to determine, under certain circumstances relating to the financial condition of a bank holding company or a bank, that the payment of dividends would be an unsafe or unsound practice and to prohibit payment thereof. In particular, federal bank regulators have stated that paying dividends that deplete a banking organization’s capital base to an inadequate level would be an unsafe and unsound banking practice and that banking organizations should generally pay dividends only out of current operating earnings. In addition, the ability of banks and bank holding companies to pay dividends, and the contents of their respective dividend policies, could be affected by a range of regulatory changes.
6
Payment of Dividends by the Bank. In addition to the restrictions discussed above, the Bank is subject to limitations under Hawaii law regarding the amount of dividends that it may pay to the Parent. In general, under Hawaii law, dividends from a bank may not exceed the bank’s retained earnings provided that the bank will, after the dividend, have the minimum paid-in common stock and additional paid-in capital required under Hawaii law, which, for a bank which has trust operations, is $6.5 million. Hawaii law also effectively restricts a bank from paying a dividend, or the amount of the dividend, unless that bank’s common stock and additional paid-in capital is $6.5 million multiplied by 133%, or $8.6 million. This amount is not necessarily indicative of amounts that may be paid or available to be paid in future periods. Under Hawaii banking law, for example, paying “excessive dividends” in relation to a bank’s capital position, earnings capacity and asset quality could be deemed to be an unsafe and unsound banking practice. Under the Hawaii Business Corporation Act, a dividend or other distribution may not be made if a bank would not be able to pay its debts as they become due in the ordinary course of business or if its total assets would be less than the sum of its total liabilities and the amounts that would be needed to satisfy shareholders with preferential rights of distribution. In addition, under the Federal Deposit Insurance Act of 1950 (“FDIA”), an insured depository institution may not pay a dividend if payment would cause it to become undercapitalized or if it already is undercapitalized. See “— Prompt Corrective Action Framework” below.
Payment of Dividends and Common Stock Repurchases by FHI. As a bank holding company, FHI is subject to oversight by the Federal Reserve. In particular, the dividend policies and share repurchases of the Company are reviewed by the Federal Reserve and will be assessed against, among other things, the FHI’s ability to achieve the required capital ratios under applicable capital rules (including the applicable capital conservation buffer). See “— Regulatory Capital Requirements” below. In addition, the Federal Reserve has indicated generally that it may be an unsafe or unsound practice for bank holding companies to pay dividends unless a bank holding company’s net income is sufficient to fund the dividends and the expected rate of earnings retention is consistent with the organization’s capital needs, asset quality and overall financial condition. Federal Reserve guidance also directs bank holding companies to inform the Federal Reserve reasonably in advance of declaring or paying a dividend that exceeds earnings for the period for which the dividend is being paid.
In certain circumstances, FHI’s repurchases of its common stock may be subject to a prior approval or notice requirement under other regulations or policies of the Federal Reserve. Redemption or repurchase of preferred stock or subordinated debt is subject to the prior approval of the Federal Reserve.
Transactions with Affiliates and Insiders
Transactions between the Bank and its subsidiaries, on the one hand, and the Company or any other affiliate of the Bank, on the other hand, are regulated under federal banking law. The Federal Reserve Act generally requires those transactions to be on terms at least as favorable to the Bank as if the transaction were conducted with an unaffiliated third party and imposes quantitative limits, collateral requirements and qualitative requirements on “covered transactions” by the Bank with, or for the benefit of, its affiliates. “Covered transactions” are defined by statute to include a loan or extension of credit, as well as a purchase of securities issued by an affiliate, a purchase of assets (unless otherwise exempted by the Federal Reserve) from the affiliate, the acceptance of securities issued by the affiliate as collateral for a loan, the issuance of a guarantee, acceptance or letter of credit on behalf of an affiliate, and credit exposure arising under derivative transactions, repurchase and reverse repurchase agreements, and securities borrowing and lending transactions. In general, any such transaction by the Bank or its subsidiaries must be limited to certain thresholds on an individual and aggregate basis and, for credit transactions with any affiliate, must be secured by designated amounts of specified collateral.
Federal law also limits a bank’s authority to extend credit to its directors, executive officers, principal shareholders (generally defined as persons that beneficially own or control more than 10% of any class of the bank’s voting stock), as well as to entities owned or controlled by such persons. Among other things, extensions of credit to such insiders are required to be made on terms that are substantially the same as, and follow credit underwriting procedures that are not less stringent than, those prevailing for comparable transactions with non-insiders. Also, the terms of such extensions of credit may not involve more than the normal risk of non-repayment or present other unfavorable features and may not exceed certain limitations on the amount of credit extended to such persons individually and in the aggregate. Certain extensions of credit also require the approval of the Bank’s board of directors.
7
Source of Strength
Federal law requires bank holding companies to act as a source of financial and managerial strength to their subsidiary banks. Under this requirement, FHI is expected to commit resources to support the Bank, including at times when FHI may not be in a financial position to provide such resources, and it may not be in its, or its stockholders’ or creditors’, best interests to do so. In addition, any capital loans FHI makes to the Bank are subordinate in right of payment to depositors and to certain other indebtedness of the Bank. In the event of FHI’s bankruptcy, any commitment by FHI to a federal bank regulatory agency to maintain the capital of the Bank will be assumed by the bankruptcy trustee and entitled to priority of payment.
Regulatory Capital Requirements
Capital Requirements Applicable to Top-Tier Holding Companies in an Organizational Structure. The Federal Reserve monitors the capital adequacy of the Company, and the FDIC and the Hawaii DFI monitor the capital adequacy of the Bank. The bank regulators currently use a combination of risk-based ratios and a leverage ratio to evaluate capital adequacy. The Company and the Bank are subject to the federal bank regulators’ final rules implementing Basel III and various provisions of the Dodd-Frank Act (the “Capital Rules”).
The Capital Rules, among other things, impose a capital measure called “Common Equity Tier 1” (“CET1”), to which most deductions/adjustments to regulatory capital must be made. In addition, the Capital Rules specify that Tier 1 capital consists of CET1 and “Additional Tier 1 capital” instruments meeting certain specified requirements.
Under the Capital Rules, the minimum capital ratios are as follows:
• | 4.5% CET1 to risk-weighted assets, |
• | 6.0% Tier 1 capital (that is, CET1 plus Additional Tier 1 capital) to risk-weighted assets, |
• | 8.0% total capital (that is, Tier 1 capital plus Tier 2 capital) to risk-weighted assets, and |
• | 4.0% Tier 1 capital to average quarterly assets. |
The Capital Rules also require a 2.5% capital conservation buffer designed to absorb losses during periods of economic stress. The capital conservation buffer is composed entirely of CET1, on top of these minimum risk-weighted asset ratios. Both the Company and the Bank are required to maintain such additional capital conservation buffer of 2.5% of CET1, effectively resulting in minimum ratios of (i) 7% CET1 to risk-weighted assets, (ii) 8.5% Tier 1 capital to risk-weighted assets, and (iii) 10.5% total capital to risk-weighted assets.
Banking institutions with a ratio of CET1 to risk-weighted assets above the minimum but below the capital conservation buffer face constraints on dividends, equity repurchases and certain discretionary compensation based on the amount of the shortfall and the institution’s “eligible retained income” (defined as the greater of (i) net income for the four preceding quarters, net of distributions and associated tax effects not reflected in net income; and (ii) the average of net income over the preceding four quarters), with progressively more stringent constraints as the Company approaches the minimum ratios.
The Capital Rules provide for a number of deductions from and adjustments to CET1. As a “non-advanced approaches” firm under the Capital Rules, the Company is subject to rules that provide for simplified capital requirements relating to the threshold deductions for mortgage servicing rights, deferred tax assets arising from temporary differences that a banking organization could not realize through net operating loss carry backs, and investments in the capital of non-consolidated financial institutions, as well as the inclusion of minority interests in regulatory capital.
8
In December 2017, the Basel Committee published standards that it described as the finalization of the Basel III post-crisis regulatory reforms. Among other things, these standards revise the Basel Committee’s standardized approach for credit risk (including recalibrating risk weights and introducing new capital requirements for certain “unconditionally cancellable commitments,” such as unused credit card and home equity lines of credit) and provide a new standardized approach for operational risk capital. Under the current U.S. Capital Rules, operational risk capital requirements and a capital floor apply only to advanced approaches institutions, and not to the Company or the Bank.
On July 27, 2023, the federal banking regulators proposed revisions to the Capital Rules to implement the Basel Committee’s 2017 standards and make other changes to the Capital Rules. The proposal introduces revised credit risk, equity risk, operational risk, credit valuation adjustment risk and market risk requirements, among other changes. However, the revised capital requirements of the proposed rule would not apply to FHI or the Bank because they have less than $100 billion in total consolidated assets and trading assets and liabilities below the threshold for market risk requirements.
Prompt Corrective Action Framework
The FDIA requires the federal bank regulators to take prompt corrective action in respect of depository institutions that fail to meet specified capital requirements. The FDIA establishes five capital categories (“well-capitalized”, “adequately capitalized”, “undercapitalized”, “significantly undercapitalized” and “critically undercapitalized”). The federal bank regulators are required to take certain mandatory supervisory actions, and are authorized to take other discretionary actions, with respect to institutions that are undercapitalized, significantly undercapitalized or critically undercapitalized, with supervisory actions progressively becoming more severe as the institution’s capital category declines.
To be “well capitalized” an insured depository institution must not be subject to any order or written agreement or directive requiring a specific capital level and must maintain the following minimum capital ratios:
• Total capital ratio of at least 10.0%, |
• CET1 capital ratio of at least 6.5%, |
• Tier 1 capital ratio of at least 8.0%, and |
• Tier 1 leverage ratio of at least 5.0%. |
A bank will be “adequately capitalized” if the institution has a total risk-based capital ratio of 8.0% or greater, a CET1 capital ratio of 4.5% or greater, a Tier 1 risk-based capital ratio of 6.0% or greater, and a leverage ratio of 4.0% or greater and is not “well capitalized.”
An institution may be downgraded to, or deemed to be in, a capital category that is lower than indicated by its capital ratios if it is determined to be in an unsafe or unsound condition or if it receives an unsatisfactory examination rating with respect to certain matters. A bank’s capital category is determined solely for the purpose of applying prompt corrective action regulations, and the capital category may not constitute an accurate representation of the bank’s overall financial condition or prospects for other purposes.
As of December 31, 2023, the Bank met all capital ratio requirements to be well-capitalized with both a CET1 capital ratio and a Tier 1 capital ratio of 12.30%, total capital ratio of 13.48% and Tier 1 leverage ratio of 8.57%, in each case calculated under the Capital Rules.
9
The FDIA’s prompt corrective action provisions apply only to depository institutions such as the Bank, and not to bank holding companies. Under the Federal Reserve’s regulations, a bank holding company, such as FHI, is considered “well capitalized” if the bank holding company (i) has a total risk based capital ratio of at least 10%, (ii) has a Tier 1 risk-based capital ratio of at least 6%, and (iii) is not subject to any written agreement order, capital directive or prompt corrective action directive to meet and maintain a specific capital level for any capital measure. The Company meets all capital ratio requirements to be well-capitalized under the Federal Reserve’s regulations, and, although the prompt corrective action provisions apply only to depository institutions and not to bank holding companies, if the provisions applied to bank holding companies, the Company would meet all capital ratio requirements to be well-capitalized. As of December 31, 2023, the Company’s CET1 capital ratio and Tier 1 capital ratio were each 12.39%, its total capital ratio was 13.57%, and its Tier 1 leverage ratio was 8.64%, in each case calculated under the Capital Rules. For more information on the Company’s and the Bank’s capital ratios, see “Item 7. Management’s Discussion and Analysis of Financial Condition — Capital” and “Note 12. Regulatory Capital Requirements” in the notes to the consolidated financial statements included in Item 8. Financial Statements and Supplementary Data.
An institution that is categorized as undercapitalized, significantly undercapitalized or critically undercapitalized is required to submit an acceptable capital restoration plan to its appropriate federal bank regulator. Under the FDIA, in order for the capital restoration plan to be accepted by the appropriate federal banking agency, a bank holding company must guarantee that a subsidiary depository institution will comply with its capital restoration plan, subject to certain limitations. The bank holding company must also provide appropriate assurances of performance. The obligation of a controlling bank holding company under the FDIA to fund a capital restoration plan is limited to the lesser of 5% of an undercapitalized subsidiary’s assets or the amount required to meet regulatory capital requirements. An undercapitalized institution is also generally prohibited from increasing its average total assets, making acquisitions, establishing any branches or engaging in any new line of business, except in accordance with an accepted capital restoration plan or with the approval of the FDIC. Institutions are also generally prohibited from making any capital distributions (including payment of a dividend) or paying any management fee to its parent holding company if the institution is or would thereafter become undercapitalized. Institutions that are undercapitalized or significantly undercapitalized and either fail to submit an acceptable capital restoration plan or fail to implement an approved capital restoration plan may be subject to a number of requirements and restrictions, including orders to sell sufficient voting stock to become adequately capitalized, orders to elect new boards of directors, requirements to reduce total assets and cessation of receipt of deposits from correspondent banks. Critically undercapitalized institutions are generally subject to appointment of a receiver or conservator.
Brokered Deposits
The FDIA prohibits insured depository institutions from accepting brokered deposits, unless it is well capitalized or is adequately capitalized and receives a waiver from the FDIC. Under FDIC regulations governing brokered deposits and interest rate restrictions, a depository institution that is adequately capitalized and accepts brokered deposits under a waiver from the FDIC may not pay an interest rate on any such deposit that, at the time any such deposit is accepted, is (i) in excess of 75 basis points over certain national rates described in the FDIC’s regulations, or (ii) 90% of the highest interest rate paid on a particular deposit product in the depository institution’s local market area if the institution provides notice to the FDIC and evidence of such local interest rate. The FDIA imposes no such restrictions on a bank that is well capitalized.
10
Safety and Soundness Standards
The FDIA requires the federal bank regulators to prescribe standards, by regulations or guidelines, relating to internal controls, information systems and internal audit systems, loan documentation, credit underwriting, interest rate risk exposure, asset growth, asset quality, earnings, stock valuation and compensation, fees and benefits, and such other operational and managerial standards as the agencies deem appropriate. Guidelines adopted by the federal bank regulatory agencies establish general standards relating to internal controls and information systems, internal audit systems, loan documentation, credit underwriting, interest rate exposure, asset growth and compensation, fees and benefits. In general, these guidelines require, among other things, appropriate systems and practices to identify and manage the risk and exposures specified in the guidelines. These guidelines also prohibit excessive compensation as an unsafe and unsound practice and describe compensation as excessive when the amounts paid are unreasonable or disproportionate to the services performed by an executive officer, employee, director or principal stockholder. In addition, the agencies adopted regulations that authorize, but do not require, an agency to order an institution that has been given notice by an agency that it is not satisfying any of such safety and soundness standards to submit a compliance plan. If, after being so notified, an institution fails to submit an acceptable compliance plan or fails in any material respect to implement an acceptable compliance plan, the bank regulator must issue an order directing action to correct the deficiency and may issue an order directing other actions of the types to which an undercapitalized institution may be subject under the FDIA. See “— Prompt Corrective Action Framework” above. If an institution fails to comply with such an order, the bank regulator may seek to enforce such order in judicial proceedings and to impose civil money penalties.
Deposit Insurance
FDIC Insurance Assessments. As an FDIC-insured bank, FHB must pay deposit insurance assessments to the FDIC based on its average total assets minus its average tangible equity. For institutions with $10 billion or more in assets, such as FHB, the FDIC uses a performance score and a loss-severity score that are used to calculate an initial assessment rate. In calculating these scores, the FDIC uses a bank’s capital level and supervisory ratings and certain financial measures to assess an institution’s ability to withstand asset-related stress and funding-related stress. The FDIC also has the ability to make discretionary adjustments to the total score based upon significant risk factors that are not adequately captured in the calculations. In addition to ordinary assessments described above, the FDIC has the ability to impose special assessments in certain instances.
Under the FDIA, the FDIC may terminate deposit insurance upon a finding that the institution has engaged in unsafe and unsound practices, is in an unsafe or unsound condition to continue operations, or has violated any applicable law, regulation, rule, order or condition imposed by the FDIC. In addition, the FDIC is authorized to conduct examinations of and require reporting by FDIC-insured institutions.
On October 18, 2022, the FDIC adopted a final rule that increased initial base deposit insurance assessment rates by 2 basis points, beginning in the first quarterly assessment period of 2023. The FDIC, as required under the FDIA, established a plan in September 2020 to restore the reserve ratio of FDIC’s Deposit Insurance Fund (the “DIF”) to meet or exceed the statutory minimum of 1.35 percent within eight years. The increased assessment is intended to improve the likelihood that the DIF reserve ratio would reach the required minimum by the statutory deadline of September 30, 2028.
On November 16, 2023, the FDIC finalized a rule that imposes special assessments to recover the losses to the deposit insurance fund (“DIF”) resulting from the FDIC’s use, in March 2023, of the systemic risk exception to the least-cost resolution test under the Federal Deposit Insurance Act in connection with the receiverships of Silicon Valley Bank and Signature Bank. The FDIC estimated in approving the rule that those assessed losses total approximately $16.3 billion. The rule provides that this loss estimate will be periodically adjusted, which will affect the amount of the special assessment. Under the rule, the assessment base is the estimated uninsured deposits that an insured depository institution (“IDI”) reported in its December 31, 2022 Call Report, excluding the first $5 billion in estimated uninsured deposits. The special assessments will be collected at an annual rate of approximately 13.4 basis points per year (3.36 basis points per quarter) over eight quarters in 2024 and 2025, with the first assessment period beginning January 1, 2024. Because the estimated loss pursuant to the systemic risk determination will be periodically adjusted, the FDIC retains the ability to cease collection early, extend the special assessment collection period and impose a final shortfall special assessment on a one-time basis. The Company expects the special assessments to be tax deductible. The total of the assessments for the Bank is estimated at $16.3 million, and such amount was recorded as an expense in the quarter of adoption (the quarter ending December 31, 2023).
11
The Volcker Rule
The Dodd-Frank Act and the implementing regulations of the federal regulators generally prohibit banks and their affiliates from engaging in proprietary trading and investing in and sponsoring hedge funds and private equity funds (the “Volcker Rule”). The Volcker Rule has not had a material effect on the Company’s operations, as the Company does not have any significant engagement in the businesses prohibited by the Volcker Rule. The Company has incurred costs to adopt additional policies and systems to ensure compliance with the Volcker Rule, but such costs have not been material.
Depositor Preference
Under federal law, depositors (including the FDIC with respect to the subrogated claims of insured depositors) and certain claims for administrative expenses of the FDIC as receiver would be afforded a priority over other general unsecured claims against such an institution in the “liquidation or other resolution” of such an institution by any receiver.
Consumer Financial Protection
The Company is subject to a number of federal and state consumer protection laws that extensively govern the Company’s relationship with its customers. These laws include, but are not limited to, the Equal Credit Opportunity Act, the Fair Credit Reporting Act, the Truth in Lending Act, the Truth in Savings Act, the Electronic Fund Transfer Act, the Expedited Funds Availability Act, the Home Mortgage Disclosure Act, the Fair Housing Act, the Real Estate Settlement Procedures Act, the Service Members Civil Relief Act and these laws’ respective state-law counterparts, as well as state usury laws and laws regarding unfair and deceptive acts and practices. These and other federal and state laws require, among other things, disclosures of the cost of credit and terms of deposit accounts, provide substantive consumer rights, prohibit discrimination in credit transactions, regulate the use of credit report information, provide financial privacy protections, prohibit unfair, deceptive and abusive practices and subject the Company to substantial regulatory oversight. Violations of applicable consumer protection laws can result in significant potential liability from litigation brought by customers, including actual damages, restitution and attorneys’ fees. Federal bank regulators, state attorneys general and state and local consumer protection agencies may also seek to enforce consumer protection requirements and obtain these and other remedies, including regulatory sanctions, customer rescission rights, action by the state and local attorneys general in each jurisdiction in which the Company operates and civil money penalties. Failure to comply with consumer protection requirements may also result in significant reputational harm as well as failure to obtain any required bank regulatory approval for merger or acquisition transactions the Company may wish to pursue or the Company’s prohibition from engaging in such transactions even if approval is not required.
The CFPB is a federal agency with broad rulemaking, supervisory and enforcement powers under federal consumer financial protection laws and has examination and enforcement authority over banks with assets of $10 billion or more, as well as their affiliates. The CFPB’s authority includes the ability to require reimbursements and other payments to customers for alleged legal violations and to impose significant penalties, as well as injunctive relief that prohibits lenders from engaging in allegedly unlawful practices. The CFPB also has the authority to obtain cease and desist orders providing for affirmative relief or monetary penalties.
Under CFPB rules relating to residential mortgage loans, banks are required to: (i) develop and implement procedures to ensure compliance with a “reasonable ability to repay” test and identify whether a loan meets a new definition for a “qualified mortgage”, in which case a rebuttable presumption exists that the creditor extending the loan has satisfied the reasonable ability to repay test; (ii) implement disclosures, policies and procedures for originating and servicing mortgages including, but not limited to, integrated loans estimate and closing disclosures, pre-loan counseling, early intervention with delinquent borrowers and specific loss mitigation procedures for loans secured by a borrower’s principal residence; (iii) comply with additional restrictions on mortgage loan originator hiring and compensation; (iv) comply with disclosure requirements and standards for appraisals and certain financial products; and (v) maintain escrow accounts for higher-priced mortgage loans for a longer period of time.
12
On October 19, 2023, the CFPB proposed a new rule that would require a provider of payment accounts or products, such as a bank, to make data available to consumers upon request regarding the products or services they obtain from the provider. Any such data provider would also have to make such data available to third parties, with the consumer’s express authorization and through an interface that satisfies formatting, performance and security standards, for the purpose of such third parties providing the consumer with financial products or services requested by the consumer. Data that would be required to be made available under the rule would include transaction information, account balance, account and routing numbers, terms and conditions, upcoming bill information, and certain account verification data. The proposed rule is intended to give consumers control over their financial data, including with whom it is shared, and encourage competition in the provision of consumer financial products or services. For banks that hold between $850 million and $50 billion in total assets, compliance with the proposed rule’s requirements would be required approximately two and a half years after adoption of the final rule.
In October 2023, the Federal Reserve proposed amendments to its rules on interchange fees. Interchange fees, or “swipe” fees, are charges that merchants pay to card-issuing banks, such as FHB, for processing electronic payment transactions. The current interchange fee limitations establish a maximum possible fee for many types of debit interchange transactions that is equal to no more than 21 cents per transaction plus five basis points multiplied by the value of the transaction. The proposed changes would establish a maximum permissible interchange fee of no more than 14.4 cents per transaction plus four basis points multiplied by the value of the transaction. The current rules allow a debit card issuer to recover one cent per transaction for fraud prevention purposes if the issuer complies with certain fraud-related requirements. Under the proposed changes, the fraud prevention adjustment would be increased to 1.3 cents per transaction. The proposed rule would also establish an automatic update of the interchange fee cap every other year based on a survey of debit card issuers.
On January 17, 2024, the CFPB proposed significant reforms to the regulatory framework governing overdraft practices applicable to banks such as FHB that have more than $10 billion in assets. The proposed rule would modify or eliminate several long-standing exclusions from requirements generally applicable to consumer credit that previously exempted certain overdraft practices. The proposal would also generally require banks to restructure many overdraft fees, overdraft lines of credit, and other overdraft practices as separate consumer credit accounts that would be subject to those requirements. These changes to the regulatory framework could result in the Bank, among other things, facing higher compliance costs in charging overdraft fees, experiencing a decreased ability to recover amounts extended as overdraft protection, reducing the availability of overdraft protection, and/or charging lower overdraft fees.
The Dodd-Frank Act does not prevent states from adopting stricter consumer protection standards. State regulation of financial products and potential enforcement actions could also adversely affect the Company’s business, financial condition or results of operations.
Community Reinvestment Act of 1977
Under the CRA, the Bank has an obligation, consistent with safe and sound operations, to help meet the credit needs of the market areas where it operates, which include low- and moderate-income individuals and communities. In connection with its examination of the Bank, the FDIC is required to assess the Bank’s CRA performance in the areas of lending, investments and services. FHB’s CRA performance could, among other things, result in the denial or delay in certain corporate applications filed by the Parent or the Bank, including applications for branch openings or relocations and applications to acquire, merge or consolidate with another banking institution or holding company. FHB received a rating of “Outstanding” in its most recently completed CRA examination.
In October 2023, the OCC, the Federal Reserve and the FDIC jointly issued a final rule to modernize the federal bank regulators’ regulations implementing the CRA. The final rule introduces new tests under which the performance of banks with over $2 billion in assets will be assessed. The new rule also includes data collection and reporting requirements, some of which are applicable only to banks with over $10 billion in assets, such as the Bank. Most provisions of the final rule will become effective on January 1, 2026, and the data reporting requirements will become effective on January 1, 2027.
13
Financial Privacy and Cybersecurity
The federal bank regulators have adopted rules limiting the ability of banks and other financial institutions to disclose non-public information about consumers to unaffiliated third parties. These limitations require disclosure of privacy policies to consumers and, in some circumstances, allow consumers to prevent disclosure of certain personal information to an unaffiliated third party. These regulations affect how consumer information is transmitted through diversified financial companies and conveyed to outside vendors. In addition, consumers may also prevent disclosure of certain information among affiliated companies that is assembled or used to determine eligibility for a product or service, such as that shown on consumer credit reports and asset and income information from applications. Consumers also have the option to direct banks and other financial institutions not to share information about transactions and experiences with affiliated companies for the purpose of marketing products or services.
Federal banking regulators regularly issue guidance regarding cybersecurity intended to enhance cyber risk management standards among financial institutions. A financial institution is expected to establish multiple lines of defense and to ensure their risk management processes address the risk posed by potential threats to the institution. A financial institution’s management is expected to maintain sufficient processes to effectively respond and recover the institution’s operations after a cyberattack. A financial institution is also expected to develop appropriate processes to enable recovery of data and business operations if a critical service provider of the institution falls victim to this type of cyberattack. The Bank has adopted an information security program that has been approved by its board of directors and reviewed by its regulators.
In November 2021, the federal bank regulatory agencies issued a final rule regarding notification requirements for banking organizations related to significant computer security incidents. Under the final rule, a bank holding company, such as FHI, and an FDIC-supervised insured depository institution, such as FHB, would be required to notify the Federal Reserve or FDIC, respectively, within 36 hours of any incident that has materially disrupted or degraded, or is reasonably likely to materially disrupt or degrade, the banking organization’s ability to deliver services to a material portion of its customer base, jeopardize the viability of key operations of the banking organization, or pose a threat to the financial stability of the United States.
State regulators have also been increasingly active in implementing privacy and cybersecurity standards and regulations. Recently, several states have adopted regulations requiring certain financial institutions to implement cybersecurity programs and providing detailed requirements with respect to these programs, including data encryption requirements. Many states have also recently implemented or modified their data breach notification and data privacy requirements. For example, the California Consumer Privacy Act became effective on January 1, 2020 and the Colorado Privacy Act and Virginia Consumer Data Protection Act were enacted in 2021. We expect this trend of state-level activity in those areas to continue and are continually monitoring developments in the states in which our customers are located.
Anti-Money Laundering and the USA PATRIOT Act
A major focus of governmental policy on financial institutions in recent years has been aimed at combating money laundering and terrorist financing. Anti-money laundering laws, including the Bank Secrecy Act (the “BSA”), as amended by the USA PATRIOT Act, impose compliance and due diligence obligations, and financial institutions must take certain steps to assist government agencies in detecting and preventing money laundering and report certain types of suspicious transactions. Financial institutions are also prohibited from entering into specified financial transactions and account relationships and must use enhanced due diligence procedures in their dealings with certain types of high-risk customers and implement a written customer identification program. Regulatory authorities routinely examine financial institutions for compliance with these requirements, and failure of a financial institution to maintain and implement adequate programs to combat money laundering and terrorist financing, or to comply with all of the relevant laws or regulations, could have serious financial, legal and reputational consequences for the institution, including the imposition of civil money penalties or causing applicable bank regulatory authorities not to approve merger or acquisition transactions when regulatory approval is required or to prohibit such transactions even if approval is not required. Regulatory authorities have imposed cease and desist orders and civil money penalties against institutions found to be violating these requirements.
14
In January 2021, the Anti-Money Laundering Act of 2020 (“AMLA”), which amends the BSA, was enacted. The AMLA is intended to comprehensively reform and modernize U.S. anti-money laundering laws. Among other things, the AMLA codifies a risk-based approach to anti-money laundering compliance for financial institutions; requires the development of standards by the U.S. Department of the Treasury for evaluating technology and internal processes for BSA compliance; and expands enforcement- and investigation-related authority, including a significant expansion in the available sanctions for certain BSA violations and instituting BSA whistleblower incentives and protections. In June 2021, FinCEN issued the priorities for anti-money laundering and countering the financing of terrorism policy, as required under the AMLA. The priorities include corruption, cybercrime, terrorist financing, fraud, transnational crime, drug trafficking, human trafficking, and proliferation financing. Many of the statutory provisions in the AMLA will require additional rulemakings, reports and other measures, and the impact of the AMLA will depend on, among other things, rulemaking and implementation guidance.
Office of Foreign Assets Control (“OFAC”) Regulation
The U.S. Treasury Department’s OFAC administers and enforces economic and trade sanctions against targeted foreign countries and regimes, under authority of various laws, including designated foreign countries, nationals and others. OFAC publishes lists of specially designated targets and countries. The Company and the Bank are responsible for, among other things, blocking accounts of, and transactions with, such targets and countries, prohibiting unlicensed trade and financial transactions with them and reporting blocked transactions after their occurrence. Failure to comply with these sanctions could have serious financial, legal and reputational consequences, including causing applicable bank regulatory authorities not to approve merger or acquisition transactions when regulatory approval is required or to prohibit such transactions even if approval is not required. Regulatory authorities have imposed significant penalties, including cease and desist orders and civil money penalties against institutions found to be violating these sanctions.
Incentive Compensation
The Federal Reserve will review, as part of the regular, risk-focused examination process, the incentive compensation arrangements of banking organizations, such as the Company, that are not “large, complex banking organizations.” These reviews will be tailored to each organization based on the scope and complexity of the organization’s activities and the prevalence of incentive compensation arrangements. The findings of the supervisory initiatives will be included in reports of examination. Deficiencies will be incorporated into the organization’s supervisory ratings, which can affect the organization’s ability to make acquisitions and take other actions. Enforcement actions may be taken against a banking organization if its incentive compensation arrangements, or related risk management control or governance processes, pose a risk to the organization’s safety and soundness and the organization is not taking prompt and effective measures to correct the deficiencies.
Under Federal Reserve and FDIC guidance, which covers all employees that have the ability to materially affect the risk profile of an organization, either individually or as part of a group, a banking organization’s incentive compensation arrangements should (i) provide incentives that appropriately balance risk and financial results in a manner that does not encourage employees to expose their organizations to imprudent risk, (ii) be compatible with effective internal controls and risk management and (iii) be supported by strong corporate governance, including active and effective oversight by the organization’s board of directors. These three principles are incorporated into the proposed joint compensation regulations under the Dodd-Frank Act, discussed below.
During 2016, the federal bank regulatory agencies and the SEC proposed revised rules on incentive-based payment arrangements at specified regulated entities having at least $1 billion of total assets. These proposed rules have not been finalized.
In October 2022, the SEC adopted a final rule directing national securities exchanges and associations, including NASDAQ, to require policies mandating the recovery or “clawback” of excess incentive-based compensation earned by a current or former executive officer during the three fiscal years preceding a required accounting restatement, including to correct an error that would result in a material misstatement if the error were corrected in the current period or left uncorrected in the current period. The excess compensation would be based on the amount the executive officer would have received had the incentive-based compensation been determined using the restated financials. NASDAQ’s listing standards pursuant to the SEC’s rule became effective October 2, 2023. The Company’s clawback policy adopted in accordance with these listing standards is included as Exhibit 97.1.
15
Climate-Related and Other ESG Developments
In recent years, federal, state and international lawmakers and regulators have increased their focus on financial institutions’ and other companies’ risk oversight, disclosures and practices in connection with climate change and other environmental, social and governance (“ESG”) matters. For example, on March 21, 2022, the SEC issued a proposed rule on the enhancement and standardization of climate-related disclosures for investors. The proposed rule would require public issuers, including the Company, to significantly expand the scope of climate-related disclosures in their SEC filings. The SEC has also announced plans to propose rules to require enhanced disclosure regarding human capital management and board diversity for public issuers.
Future Legislation and Regulation
Congress may enact, modify or repeal legislation from time to time that affects the regulation of the financial services industry, and state legislatures may enact, modify or repeal legislation from time to time affecting the regulation of financial institutions chartered by or operating in those states. Federal and state regulatory agencies also periodically propose and adopt changes to their regulations or change the manner in which existing regulations are applied. The substance or impact of pending or future legislation or regulation, or the application thereof, cannot be predicted, although enactment of proposed legislation, or modification or repeal of existing legislation, could impact the regulatory structure under which the Company operates and may significantly increase its costs, impede the efficiency of its internal business processes, require the Company to increase its regulatory capital and modify its business strategy, and limit its ability to pursue business opportunities in an efficient manner. The Company’s business, financial condition, results of operations or prospects may be adversely affected, perhaps materially, as a result.
Securities Exchange Act Reports and Additional Information
Our annual report on Form 10-K, quarterly reports on Form 10-Q, current reports on Form 8-K and all amendments to those reports can be found free of charge on our website at www.fhb.com, under Investor Relations, as soon as reasonably practicable after such material is electronically filed with or furnished to the U.S. Securities and Exchange Commission (“SEC”). These reports are also available free of charge on the SEC’s website at www.sec.gov.
Information on our Investor Relations website, our main website and other websites referred to in this report is not incorporated by reference into this report or any other report filed with or furnished to the SEC. We have included such website addresses only as inactive textual references and do not intend them to be active links.
ITEM 1A. RISK FACTORS
Ownership of our common stock involves a significant degree of risk and uncertainty. The material risks and uncertainties that management believes affect us are described below. Any of the following risks, as well as risks that we do not know or currently deem immaterial, could have a material adverse effect on our business, financial condition or results of operations. To the extent that any of the information in this Form 10-K constitutes forward-looking statements, the risk factors below are cautionary statements identifying important factors that could cause actual results to differ materially from those expressed in any forward-looking statements made by us or on our behalf. See “Item 7. Management’s Discussion and Analysis of Financial Condition and Results of Operations – Cautionary Note Regarding Forward-Looking Statements.”
16
Summary of Risk Factors
The following is a summary of the most significant risks and uncertainties that we believe could adversely affect our business, financial condition or results of operations. In addition to the following summary, you should consider the other information set forth in this “Risk Factors” section and the other information contained in this report before investing in our securities.
Market Risks
| • | Our business may be adversely affected by conditions in the financial markets and economic conditions generally and in Hawaii, Guam and Saipan in particular. |
| • | A sustained period of high inflation could pose a risk to the economy and the financial performance of the Bank. |
| • | Our business is significantly dependent on the real estate markets in which we operate, as a significant percentage of our loan portfolio is secured by real estate. |
| • | Our business is subject to risk arising from conditions in the commercial real estate market. |
| • | Concentrated exposures to certain asset classes and individual obligors may unfavorably impact our operations. |
| • | Our business is subject to interest rate risk and fluctuations in interest rates may adversely affect our earnings. |
| • | The value of the investment securities we own may decline in the future. |
Credit Risks
| • | Our business, profitability and liquidity may be adversely affected by deterioration in the credit quality of, or defaults by, third parties who owe us money, securities or other assets or whose securities or obligations we hold. |
| • | We might underestimate the credit losses inherent in our loan and lease portfolio and have credit losses in excess of the amount we reserve for loan and lease losses. |
Liquidity Risks
| • | Loss of deposits could increase our funding costs. |
| • | Our liquidity is dependent on dividends from First Hawaiian Bank. |
Operational Risks
| • | Our ability to maintain, attract and retain customer relationships is highly dependent on our reputation. |
| • | We may not be able to attract and retain key personnel and other skilled employees. |
| • | If our techniques for managing risk are ineffective, we may be exposed to material unanticipated losses. |
| • | We are dependent on the use of data and modeling both in our management decision-making generally and in meeting regulatory expectations in particular. |
| • | The appraisals and other valuation techniques we use in evaluating and monitoring loans secured by real property, other real estate owned (“OREO”) and repossessed personal property may not accurately describe the net value of the asset. |
| • | The occurrence of fraudulent activity, breaches or failures of our information security controls or cybersecurity-related incidents could have a material adverse effect on our business, financial condition or results of operations. |
| • | The development and use of AI present risks and challenges that may adversely impact our business. |
| • | Employee misconduct or mistakes could expose us to significant legal liability and reputational harm. |
| • | We may be adversely affected by changes in the actual or perceived soundness or condition of other financial institutions. |
| • | Consumer protection initiatives related to the foreclosure process could materially affect our ability as a creditor to obtain remedies. |
| • | We are subject to a variety of risks in connection with any sale of loans we may conduct. |
| • | Our operations could be interrupted if certain external vendors on which we rely experience difficulty, terminate their services or fail to comply with banking laws and regulations. |
| • | We depend on the accuracy and completeness of information about customers and counterparties. |
| • | Our accounting estimates and risk management processes and controls rely on analytical and forecasting techniques and models and assumptions, and actual results may differ from these estimates. |
| • | Changes in our accounting policies or in accounting standards could materially affect how we report our financial results and condition. |
17
Strategic Risks
| • | Geographic concentration in our existing markets may unfavorably impact our operations. |
| • | We operate in a highly competitive industry and market area. |
| • | New lines of business, products, product enhancements or services may subject us to additional risks. |
| • | We have dealer-centric automotive finance businesses, and a change in the key role of dealers within the automotive industry or our ability to maintain or build relationships with them could have an adverse effect on our business, results of operations, financial condition, or prospects. |
| • | We continually encounter technological change. |
Legal, Regulatory and Compliance Risks
| • | The banking industry is highly regulated, and the regulatory framework, together with any future legislative or regulatory changes, may have a significant adverse effect on our operations. |
| • | Fee revenues from overdraft protection programs constitute a portion of our noninterest income and may be subject to increased supervisory scrutiny. |
| • | We are required to act as a source of financial and managerial strength for our bank in times of stress. |
| • | We are subject to capital adequacy requirements and may be subject to more stringent capital requirements. |
| • | We may not pay dividends on our common stock in the future. |
| • | Rulemaking changes implemented by the CFPB have in the past resulted and may in the future result in higher regulatory and compliance costs that may adversely affect our results of operations. |
| • | Litigation and regulatory actions, including possible enforcement actions, could subject us to significant fines, penalties, judgments or other requirements resulting in increased expenses or restrictions on our business activities. |
| • | Increases in FDIC insurance premiums may adversely affect our earnings. |
| • | Non-compliance with the USA PATRIOT Act, the Bank Secrecy Act or other laws and regulations could result in fines or sanctions against us. |
| • | Regulations relating to privacy, information security and data protection could increase our costs, affect or limit how we collect and use personal information and adversely affect our business opportunities. |
| • | Differences in regulation can affect our ability to compete effectively. |
| • | Our use of third-party vendors and our other ongoing third-party business relationships are subject to increasing regulatory requirements and attention. |
| • | We are subject to environmental liability risk associated with our bank branches and any real estate collateral we acquire upon foreclosure. |
| • | We may be subject to litigation risk pertaining to our fiduciary responsibilities. |
Other Risks Affecting Our Business
| • | Severe weather, hurricanes, tsunamis, natural disasters, pandemics, acts of war or terrorism or other external events could significantly impact our business. |
| • | Climate change could have a material negative impact on us and our customers. |
| • | We may be subject to unexpected income tax liabilities in connection with the Reorganization Transactions. BWHI is required to pay us for any unexpected income tax liabilities that arise in connection with the Reorganization Transactions. However, in the event that BWHI does not satisfy its payment obligations, we could be subject to significantly higher federal and/or state and local income tax liabilities than currently anticipated. |
Risks Related to Our Common Stock
| • | Our stock price may be volatile, and you could lose part or all of your investment as a result. |
| • | Future sales and issuances of our common stock, including sales as part of our equity-based compensation plans, could result in dilution of the percentage ownership of our stockholders and could lower our stock price. |
| • | Certain banking laws and certain provisions of our certificate of incorporation may have an anti-takeover effect. |
18
Market Risks
Our business may be adversely affected by conditions in the financial markets and economic conditions generally and in Hawaii, Guam and Saipan in particular.
We provide banking and financial services to customers primarily in Hawaii, Guam and Saipan. Our financial performance generally, and the ability of our borrowers to pay interest on and repay principal of outstanding loans and the value of collateral securing those loans in particular, as well as demand for loans and other products and services we offer, is highly dependent upon the business environment in the markets in which we operate. Economic conditions in our markets depend mainly on tourism, U.S. military and defense products and services, real estate, government and other service-based industries. In addition, Hawaii’s economy depends significantly on conditions of the U.S. economy and key international economies, particularly Japan. Declines in the economic conditions in these markets, tourism, fluctuations in the strength of currencies such as the U.S. dollar and the Japanese yen, the inability of the Hawaii economy to absorb continuing construction expansion, increases in levels of underemployment, increases in energy costs, and other inflationary conditions, high interest rates, the availability of affordable air transportation, supply chain disruptions, pandemics or other widespread health emergency (or concerns over the possibility of such an emergency), real or threatened acts of war or terrorism, adverse weather, natural disasters and local or national budget issues, among other factors, may impact consumer and corporate spending. As a result, these events may contribute to a deterioration in Hawaii’s general economic condition, which, as a result of our geographic concentration, could adversely impact us and our borrowers.
Commercial lending represents approximately 54% of our total loan and lease portfolio as of December 31, 2023, and we generally make loans to small to mid-sized businesses whose financial performance depends on the regional economy. These businesses generally have fewer financial resources in terms of capital or borrowing capacity than larger entities and may expose us to greater credit risks. We also engage in mortgage lending and automobile financing, as well as other forms of consumer lending. Adverse economic and business conditions in our market areas could reduce our growth rate, affect our borrowers’ ability to repay their loans or the value of the collateral underlying their loans and consequently, adversely affect our financial condition and performance.
The U.S. military has a major presence in Hawaii and Guam and, as a result, is an important aspect of the economies in which we operate. The funding of the U.S. military occurs as part of the overall U.S. government budget and appropriation process which is driven by numerous factors, including geopolitical events, macroeconomic conditions and the ability of the U.S. government to enact legislation such as appropriations bills. Cuts to defense and other security spending could have an adverse impact on the economy in our markets.
Other economic conditions that affect our financial performance include short-term and long-term interest rates, the prevailing yield curve, inflation and price levels (particularly for real estate), monetary policy, unemployment and the strength of the domestic economy as a whole. Unfavorable market conditions can result in a deterioration in the credit quality of our borrowers and the demand for our products and services, an increase in the number of loan delinquencies, defaults and charge-offs, additional provisions for loan losses, adverse asset values and an overall material adverse effect on the quality of our loan portfolio. Unfavorable or uncertain economic and market conditions can be caused by declines in economic growth, business activity or investor or business confidence, limitations on the availability or increases in the cost of credit and capital, increases in inflation or interest rates, high unemployment, natural disasters or a combination of these or other factors. Evolving responses from federal and state governments and other regulators, and our customers or our third-party partners or vendors, to new challenges such as climate change have impacted and could continue to impact the economic and political conditions under which we operate.
19
In addition, federal budget deficit concerns and the potential for political conflict over legislation to fund U.S. government operations and raise the U.S. government's debt limit may increase the possibility of a default by the U.S. government on its debt obligations, related credit-rating downgrades, or an economic recession in the United States. Many of our investment securities are issued by the U.S. government and government agencies and sponsored entities. As a result of uncertain domestic political conditions, including potential future federal government shutdowns, the possibility of the federal government defaulting on its obligations for a period of time due to debt ceiling limitations or other unresolved political issues, investments in financial instruments issued or guaranteed by the federal government pose liquidity risks. In connection with prior political disputes over U.S. fiscal and budgetary issues leading to the U.S. government shutdown in 2011, S&P lowered its long term sovereign credit rating on the U.S. from AAA to AA+. A further downgrade, or a downgrade by other rating agencies, as well as sovereign debt issues facing the governments of other countries, could have a material adverse impact on financial markets and economic conditions in the U.S. and worldwide.
A sustained period of high inflation could pose a risk to the economy and the financial performance of the Bank.
In recent periods, the increase in inflationary conditions accelerated due to, among other factors, global supply chain disruptions, changes in the labor market and geopolitical tensions. Higher commodity prices, labor shortages and supply chain disruptions, including those resulting from Russia’s ongoing invasion of Ukraine and the conflict in the Middle East, are also contributing to higher inflation levels, which could, in turn, adversely affect the U.S. economy, the demand for our products and creditworthiness of our borrowers. A sustained period of inflation could impact the Bank in many ways. Higher cost could reduce our profit margins. Aggressive action by monetary authorities to combat inflation could lead to higher rates which could negatively affect economic growth. Higher rates could make less creditworthy customers less able to meet their payment obligations. Higher rates could also lead to reduced valuations on long duration financial assets and real estate and impact the value of collateral pledged for loans. Finally, higher rates could result in deposit outflows or higher deposit costs.
Our business is significantly dependent on the real estate markets in which we operate, as a significant percentage of our loan portfolio is secured by real estate.
As of December 31, 2023, our real estate loans represented approximately $10.7 billion, or 75% of our total loan and lease portfolio. Our real estate loans consist primarily of residential loans, including home equity loans (representing 38% of our total loan and lease portfolio) and commercial and construction loans (representing 37% of our total loan and lease portfolio), with the significant majority of these loans concentrated in Hawaii. Real property values in Hawaii may be affected by a variety of factors outside of our control and the control of our borrowers, including national and local economic conditions generally. Declines in real property prices, including prices for homes and commercial properties, in Hawaii, Guam or Saipan could result in a deterioration of the credit quality of our borrowers, an increase in the number of loan delinquencies, defaults and charge-offs, and reduced demand for our products and services generally.
In addition, nearly all residential mortgage loans and home equity lines of credit and loans outstanding are for residences located in Hawaii, Guam or Saipan. These island locales are susceptible to a wide array of potential natural disasters including, but not limited to, hurricanes, floods, earthquakes and tsunamis, like the May 2023 super typhoon that struck Guam and August 2023 Maui wildfires. Finally, declines in real property values in the areas in which we operate, particularly Hawaii, whether as a result of these or other factors, could result in a deterioration of the credit quality of our borrowers, an increase in the number of loan delinquencies, defaults and charge-offs, and reduced demand for our products and services generally. Additionally, such declines in real property values could reduce the value of any collateral we realize following a default on these loans and could adversely affect our ability to continue to grow our loan portfolio consistent with our underwriting standards. Our failure to mitigate these risks effectively could have a material adverse effect on our business, financial condition or results of operations.
20
Our business is subject to risk arising from conditions in the commercial real estate market.
As of December 31, 2023, our commercial real estate loans represented approximately $4.3 billion or 30% of our total loan and lease portfolio. Commercial real estate loans may have a greater risk of loss than residential mortgage loans, in part because these loans are generally larger or more complex to underwrite and are characterized by having a limited supply of real estate at commercially attractive locations, long delivery time frames for development and high interest rate sensitivity. As payments on loans secured by commercial real estate often depend upon the successful operation and management of the properties and the businesses which operate from within them, repayment of such loans may be affected by factors outside the borrower’s control, such as adverse conditions in the real estate market or the economy or changes in government regulation. In recent years, commercial real estate markets have been experiencing substantial growth, and increased competitive pressures have contributed significantly to historically low capitalization rates and rising property values. Commercial real estate markets have been particularly impacted by the economic disruption resulting from the COVID-19 pandemic and a reduced demand for office space driven by the implications of hybrid work arrangements. Accordingly, federal banking regulatory agencies have expressed concerns about weaknesses in the current commercial real estate market. Our failure to adequately implement risk management policies, procedures and controls could adversely affect our ability to increase this portfolio going forward and could result in an increased rate of delinquencies in, and increased losses from, this portfolio.
Concentrated exposures to certain asset classes and individual obligors may unfavorably impact our operations.
We have naturally developed concentrated exposures to those asset classes and industries in which we have specific knowledge or competency, such as commercial real estate lending and dealer financing. In management’s judgment, our extensive experience within these concentration areas, and our strategic relationships within such areas, allows us to better evaluate the associated risks and price credit accordingly. However, the presence of similar exposures concentrated in certain asset classes leaves us exposed to the risk of a focused downturn or increased competitive pressures within a concentration area. Additionally, we have cultivated relationships with market leaders that result in relatively larger exposures to select single obligors than would be typical for an institution of our size in a larger operating market. For example, our top five dealer relationships represented approximately 39% of our outstanding dealer flooring commitments as of December 31, 2023. The failure to properly anticipate and address risks associated with these concentrated exposures could have a material adverse effect on our business, financial condition or results of operations.
Our business is subject to interest rate risk and fluctuations in interest rates may adversely affect our earnings.
Fluctuations in interest rates have in the past negatively impacted and may in the future negatively impact our banking business and demand for some of our products. Our earnings and cash flows are largely dependent on net interest income, which is the difference between the interest income we receive from interest-earning assets (e.g., loans and investment securities) and the interest expense we pay on interest-bearing liabilities (e.g., deposits and borrowings). The level of net interest income is primarily a function of the average balance of interest-earning assets, the average balance of interest-bearing liabilities and the spread between the yield on such assets and the cost of such liabilities. These factors are influenced by both the pricing and mix of interest-earning assets and interest-bearing liabilities. Interest rates are volatile and highly sensitive to many factors that are beyond our control, such as economic conditions, inflationary trends, changes in government spending and debt issuances and policies of various governmental and regulatory agencies, and, in particular the monetary policy of the Federal Open Market Committee of the Federal Reserve System (the “FOMC”).
21
Interest rates in the United States fell dramatically during the first quarter of 2020 and remained low through 2021, which adversely affected our net interest income. The Federal Reserve raised benchmark interest rates throughout 2022 and 2023 and may continue to raise interest rates, or maintain them at elevated levels by recent historical standards, in response to economic conditions, particularly inflationary pressures. When interest rates are increasing, we can generally be expected to earn higher net interest income. However, higher interest rates can also lead to fewer originations of loans, less liquidity in the financial markets, and higher funding costs, each of which could adversely affect our revenues, liquidity and capital levels. Higher interest rates can also negatively affect the payment performance on loans that are linked to variable interest rates. If borrowers of variable rate loans are unable to afford higher interest payments, those borrowers may reduce or stop making payments, thereby causing us to incur losses and increased operational costs related to servicing a higher volume of delinquent loans.
Changes in monetary policy, including changes in interest rates, could influence not only the interest we receive on loans and securities and the amount of interest we pay on deposits and borrowings, but also our ability to originate loans and deposits. Changes in interest rates also have a significant impact on (i) the carrying value of certain assets, including loans, real estate and investment securities, on our balance sheet, and may result in material differences between the values of our assets and liabilities, and (ii) the level of loan refinancing activity in our portfolio, which impacts the amount of prepayment penalty income we receive on loans we hold. In addition, we may incur debt in the future, and that debt may also be sensitive to interest rates.
The cost of our deposits is largely based on short-term interest rates, the level of which is driven primarily by the FOMC’s actions. However, the yields generated by our loans and securities are often difficult to re-price and are typically driven by longer-term interest rates, which are set by the market or, at times, the FOMC’s actions, and vary over time. The level of net interest income is therefore influenced by movements in such interest rates and the pace at which such movements occur. If the interest rates paid on our deposits and other borrowings increase at a faster pace than the interest rates on our loans and other investments, our net interest income may decline and, with it, a decline in our earnings may occur. Our net interest income and earnings would be similarly affected if the interest rates on our interest-earning assets declined at a faster pace than the interest rates on our deposits and other borrowings. Any substantial, unexpected, prolonged change in market interest rates could have a material adverse effect on our business, financial condition or results of operations.
As of December 31, 2023, we had $7.6 billion of noninterest-bearing demand deposits and $13.7 billion of interest-bearing deposits. If market conditions were to change, including as a result of monetary policy or the competitive environment, in a manner that caused us to offer higher interest rates on core deposit accounts to maintain current clients or attract new clients, our interest expense will increase, perhaps materially. Furthermore, if we fail to offer interest in a sufficient amount to keep these deposits, our deposits may be reduced, which would require us to obtain funding in other ways or risk slowing our future asset growth.
The value of the investment securities we own may decline in the future.
As of December 31, 2023, we owned investment securities with a carrying value of $6.3 billion, which largely consisted of our positions in obligations of the U.S. government and government-sponsored enterprises. We evaluate our investment securities on at least a quarterly basis, and more frequently when economic and market conditions warrant such an evaluation. For available-for-sale debt securities in an unrealized loss position, we assess whether we intend to sell, or it is more likely than not that we will be required to sell the security before recovery of its amortized cost basis. If either of the criteria regarding intent or requirement to sell is met, the security’s amortized cost basis is written down to fair value through income. Because of changing economic and market conditions affecting issuers, we may be required to recognize losses in future periods, which could adversely affect our business, results of operations or financial condition. Additionally, significant unrealized losses could negatively impact market and/or customer perceptions of the Company, which could lead to a loss of depositor confidence and an increase in deposit withdrawals, particularly among those with uninsured deposits.
22
Credit Risks
Our business, profitability and liquidity may be adversely affected by deterioration in the credit quality of, or defaults by, third parties who owe us money, securities or other assets or whose securities or obligations we hold.
A number of our products expose us to credit risk. We are exposed to the risk that third parties that owe us money, securities or other assets will not perform their obligations. These parties may default on their obligations to us due to bankruptcy, lack of liquidity, operational failure or other reasons. A failure of a significant market participant, or even concerns about a default by such an institution, could lead to significant liquidity problems, losses or defaults by other institutions or regulatory responses, including additional special assessments under the FDIA, which in turn could adversely affect us.
We are also subject to the risk that our rights against third parties may not be enforceable in all circumstances or that there is a deterioration in the credit quality of third parties whose securities or obligations we hold, including a deterioration in the value of collateral posted by third parties to secure their obligations to us under derivatives contracts and loan agreements. A deterioration in credit quality of such obligors, could result in losses and/or adversely affect our ability to rehypothecate or otherwise use those securities or obligations for liquidity purposes.
We might underestimate the credit losses inherent in our loan and lease portfolio and have credit losses in excess of the amount we reserve for loan and lease losses.
We maintain an allowance for credit losses (“ACL”), which is a reserve established through a provision for credit losses (the “Provision”) charged to expense representing management’s best estimate of lifetime expected credit losses within our existing portfolio of loans and leases. The level of the ACL reflects management’s continuing evaluation of specific credit risks, the quality of the loan and lease portfolio, the value of the underlying collateral, the level of non-accruing loans and leases, the unidentified losses inherent in the current loan and lease portfolio, and economic, political and regulatory conditions.
For our commercial loans, we perform an internal loan review and grade loans on an ongoing basis, and we estimate and establish reserves for credit risks and credit losses inherent in our credit exposure (including unfunded lending commitments). The objective of our loan review and grading procedures is to identify existing or emerging credit quality problems so that appropriate steps can be initiated to avoid or minimize future losses. This process, which is critical to our financial results and condition, requires difficult, subjective and complex judgments of loan collectibility, including forecasts of economic conditions and how these economic predictions might impair the ability of the Company’s borrowers to repay their loans. The Company may not be able to accurately predict these economic conditions and/or some or all of their effects, which may, in turn, negatively impact the reliability of the process. Accordingly, as is the case with any such assessments, there is always the chance that we will fail to identify the proper factors or that we will fail to accurately estimate the impacts of factors that we identify.
Although our management has established an ACL it believes is adequate, we could sustain credit losses that are significantly higher than the amount of our ACL. Higher credit losses could arise for a variety of reasons, such as growth in our loan and lease portfolio, changes in economic conditions affecting borrowers, new information regarding our loans and leases and other factors within and outside our control. If real estate values were to decline or if economic conditions in our markets were to deteriorate unexpectedly, additional loan and lease losses not incorporated in the existing ACL might occur. Losses in excess of the existing ACL will reduce our net income and could have a material adverse effect on our business, financial condition or results of operations. A severe downturn in the economy generally, in our markets specifically or affecting the business and assets of individual customers would generate increased charge-offs and a need for higher reserves. While we believe that our ACL was adequate as of December 31, 2023, there is no assurance that it will be sufficient to cover all incurred credit losses. In the event of significant deterioration in economic conditions, we may be required to increase reserves in future periods, which would reduce our earnings.
Bank regulatory agencies will periodically review our ACL and the value attributed to non-accrual loans and leases or to real estate we acquire through foreclosure. Such regulatory agencies may require us to adjust our determination of the value for these items, increase our ACL or reduce the carrying value of owned real estate, reducing our net income. Further, if charge-offs in future periods exceed the ACL, we may need additional adjustments to increase the ACL. These adjustments could have a material adverse effect on our business, financial condition or results of operations.
23
Liquidity Risks
Loss of deposits could increase our funding costs.
Like many banking companies, we rely on customer deposits to meet a considerable portion of our funding, and we continue to seek customer deposits to maintain this funding base. We accept deposits directly from consumer and commercial customers and, as of December 31, 2023, we had $21.3 billion in deposits. Deposits are subject to potentially dramatic fluctuations in availability or price due to certain factors outside our control, such as a loss of confidence by customers in us or the banking sector generally, customer perceptions of our financial health and general reputation, increasing competitive pressures from other financial services firms for consumer or corporate customer deposits, changes in interest rates and returns on other investment classes, which could result in significant outflows of deposits within short periods of time or significant changes in pricing necessary to maintain current customer deposits or attract additional deposits. In addition, if the Company’s competitors raise the rates they pay on deposits, the Company’s funding costs may increase, either because the Company raises its rates to avoid losing deposits or because the Company loses deposits and must rely on more expensive sources of funding. Higher funding costs could reduce the Company’s net interest margin and net interest income and could have a material adverse effect on the Company’s business, financial condition, and results of operations. For example, we could be subject to sudden withdrawals of deposits, including as a result of negative media coverage, which may be spread through social media, regarding the financial services industry generally, a subset of financial institutions, or the Company specifically. Online and mobile banking have made it easier for customers to withdraw their deposits or transfer funds to other accounts with short notice. This may make retaining deposits during periods of stress more difficult. Further, depositors of certain types of deposits, such as uninsured or uncollateralized deposits, may be more likely to withdraw their deposits or do so more quickly. Any such withdrawals could result in higher funding costs for us as we lose a lower cost source of funding, and significant unanticipated withdrawals could materially and adversely affect our liquidity, financial condition, and results of operations.
Our liquidity is dependent on dividends from First Hawaiian Bank.
We are a legal entity separate and distinct from our banking and other subsidiaries. Dividends from the Bank provide virtually all of our cash flow, including cash flow to pay dividends on our common stock and principal and interest on any debt we may incur. Various federal and state laws and regulations limit the amount of dividends that our bank may pay to us. For example, we are subject to regulatory capital requirements which may limit the Bank’s ability to pay dividends to us, and Hawaii law only permits our bank to pay dividends out of retained earnings as defined under Hawaii banking law, which differs from retained earnings calculated under GAAP. Also, our right to participate in a distribution of assets upon a subsidiary’s liquidation or reorganization is subject to the prior claims of the subsidiary’s creditors. In the event the Bank is unable to pay dividends to us, we may not be able to service any debt we may incur, pay obligations or pay dividends on our common stock. The inability to receive dividends from the Bank could have a material adverse effect on our business, financial condition, liquidity or results of operations.
Operational Risks
Our ability to maintain, attract and retain customer relationships is highly dependent on our reputation.
As the parent company of Hawaii’s oldest and largest bank, we rely in part on our bank’s reputation for superior financial services to retain our customer relationships. Damage to our reputation could undermine the confidence of our current and potential customers in our ability to provide high-quality financial services. Such damage could also impair the confidence of our counterparties and vendors and ultimately affect our ability to effect transactions. Maintenance of our reputation depends not only on our success in maintaining our service-focused culture and controlling and mitigating the various risks described in this Form 10-K, but also on our success in identifying and appropriately addressing issues that may arise in areas such as potential conflicts of interest, anti-money laundering, customer personal information and privacy issues, customer and other third party fraud, record-keeping, regulatory investigations, any litigation that may arise from any failure or perceived failure on our part to comply with legal and regulatory requirements and ESG matters, including climate risk, hiring practices, the diversity of our work force, and racial and social justice issues involving our personnel, customers and third parties with whom we otherwise do business. Maintaining our reputation also depends on our ability to successfully prevent third parties from infringing on the “First Hawaiian Bank” brand and associated trademarks and our other intellectual property. Defense of our reputation, trademarks and other intellectual property, including through litigation, could result in costs that could have a material adverse effect on our business, financial condition or results of operations.
24
We may not be able to attract and retain key personnel and other skilled employees.
Our success depends, in large part, on the skills of our management team and our ability to retain, recruit and motivate key officers and employees. Competition for qualified employees and personnel in the financial services and banking industry is intense and there are a limited number of qualified persons with knowledge of, and experience in, the regional banking industry, especially in the communities served by our branch network. A substantial number of our employees have considerable tenure with the Bank and some will be nearing retirement in the next few years, which makes succession planning important to the continued operation of our business. We need to continue to attract and retain key personnel and to recruit qualified individuals to succeed existing key personnel to ensure the continued growth and successful operation of our business. Leadership changes will occur from time to time, and we cannot predict whether significant retirements or resignations will occur or whether we will be able to recruit additional qualified personnel. The cost of hiring, incentivizing and retaining skilled personnel may continue to increase, which could have a material adverse effect on our business, financial condition or results of operations. In addition, our ability to effectively compete for senior executives and other qualified personnel by offering competitive compensation and benefit arrangements may be restricted by applicable banking laws and regulations, including any restrictions that may in the future be adopted by U.S. regulatory agencies, including the Federal Reserve and FDIC. The loss of the services of any senior executive or other key personnel, the inability to recruit and retain qualified personnel in the future or the failure to develop and implement a viable succession plan, could have a material adverse effect on our business, financial condition or results of operations.
If our techniques for managing risk are ineffective, we may be exposed to material unanticipated losses.
In order to manage the significant risks inherent in our business, we must maintain effective policies, procedures and systems that enable us to identify, monitor and control our exposure to material risks, such as credit, operational, legal and reputational risks. Our risk management methods may prove to be ineffective due to their design, their implementation or the degree to which we adhere to them, or as a result of the lack of adequate, accurate or timely information or otherwise. If our risk management efforts are ineffective, we could suffer losses that could have a material adverse effect on our business, financial condition or results of operations. In addition, we could be subject to litigation, particularly from our customers, and sanctions or fines from regulators. Our techniques for managing the risks we face may not fully mitigate the risk exposure in all economic or market environments, including exposure to risks that we might fail to identify or anticipate.
We are dependent on the use of data and modeling both in our management decision-making generally and in meeting regulatory expectations in particular.
The use of statistical and quantitative models and other quantitatively-based analyses is central to bank decision-making and regulatory compliance processes, and the employment of such analyses is becoming increasingly widespread in our operations. Liquidity stress testing, interest rate sensitivity analysis, the automated extension of credit based on defined criteria and the identification of possible violations of anti-money laundering regulations are all examples of areas in which we are dependent on models and the data that underlies them. We anticipate that model-derived insights will penetrate further into bank decision-making, and particularly risk management efforts, as the capacities developed to meet rigorous stress testing requirements are able to be employed more widely. While these quantitative techniques and approaches improve our decision-making, they also create the possibility that faulty data or flawed quantitative approaches could yield adverse outcomes or regulatory scrutiny. Additionally, because of the complexity inherent in these approaches, misunderstanding or misuse of their outputs could similarly result in suboptimal decision-making.
25
The appraisals and other valuation techniques we use in evaluating and monitoring loans secured by real property, OREO and repossessed personal property may not accurately describe the net value of the asset.
In considering whether to make a loan secured by real property, we generally require an appraisal of the property. However, an appraisal is only an estimate of the value of the property at the time the appraisal is made, and as real estate values may change significantly in value in relatively short periods of time (especially in periods of heightened economic uncertainty), this estimate may not accurately describe the net value of the real property collateral after the loan is made. As a result, we may not be able to realize the full amount of any remaining indebtedness when we foreclose on and sell the relevant property. In addition, we rely on appraisals and other valuation techniques to establish the value of our OREO and personal property that we acquire through foreclosure proceedings and to determine certain loan impairments. If any of these valuations are inaccurate, our consolidated financial statements may not reflect the correct value of our OREO, and our allowance for credit losses may not reflect accurate loan impairments. This could have a material adverse effect on our business, financial condition or results of operations.
The occurrence of fraudulent activity, breaches or failures of our information security controls or cybersecurity-related incidents could have a material adverse effect on our business, financial condition or results of operations.
As a financial institution, we are susceptible to fraudulent activity, information security breaches and cybersecurity-related incidents that may be committed against us or our clients, which may result in financial losses or increased costs to us or our clients, disclosure, loss or misuse of our information or our client information, misappropriation of assets, privacy breaches against our clients, litigation or damage to our reputation. Such fraudulent activity may take many forms, including check fraud, electronic fraud, wire fraud, phishing, social engineering and other dishonest acts. Information security breaches and cybersecurity-related incidents may include fraudulent or unauthorized access to systems used by us or our clients, denial or degradation of service attacks, and malware or other cyberattacks. These types of threats may derive from human error, fraud or malice on the part of external or internal parties or may result from accidental technological failure. In recent periods, several large corporations, including financial institutions and retail companies, have suffered major data breaches, in some cases exposing not only confidential and proprietary corporate information, but also sensitive financial and other personal information of their customers and employees and subjecting them to potentially fraudulent activity. Some of our clients may have been affected by these breaches, which increase their risks of identity theft, credit card fraud and other fraudulent activity that could involve their accounts with us. We are regularly the target of attempted electronic fraudulent activity, security breaches and cybersecurity-related attacks. Consistent with industry trends, we may face an increasing number of attempted cyberattacks as we expand our mobile and other internet-based products and services, and we provide more of these services to a greater number of individual customers. The increased use of mobile and cloud technologies can heighten these and other operational risks. Further, the use of artificial intelligence (“AI”) by cybercriminals may increase the frequency and severity of cybersecurity attacks against us or our service providers and others on whom we rely.
We also face risks related to cyberattacks and other security breaches in connection with credit card transactions that typically involve the transmission of sensitive information regarding our customers through various third parties, including merchant acquiring banks, payment processors, payment card networks and our processors. Some of these parties have in the past been the target of security breaches and cyberattacks, and because the transactions involve third parties and environments such as the point of sale that we do not control or secure, future security breaches or cyberattacks affecting any of these third parties could impact us through no fault of our own, and in some cases we may have exposure and suffer losses for breaches or attacks relating to them.
26
Information pertaining to us and our customers is maintained, and transactions are executed, on networks and systems maintained by us, our customers and certain of our third-party partners, such as our online banking or reporting systems. The secure maintenance and transmission of confidential information, as well as execution of transactions over these systems, are essential to protect us and our customers against fraud and security breaches and to maintain our customers’ confidence. Breaches of information security also may occur, and in infrequent cases, have occurred through intentional or unintentional acts by those having access to our systems or our customers’ or counterparties’ confidential information, including employees. In addition, increases in criminal activity levels and sophistication, advances in computer capabilities, new discoveries, vulnerabilities in third-party technologies (including browsers and operating systems) or other developments could result in a compromise or breach of the technology, processes and controls that we use to prevent fraudulent transactions and to protect data about us, our customers and underlying transactions, as well as the technology used by our customers to access our systems. Although we have developed, and continue to invest in, systems and processes that are designed to detect and prevent security breaches and cyberattacks and periodically test our security, our inability to anticipate, or failure to adequately mitigate, breaches of security could result in: losses to us or our customers; our loss of business and/or customers; damage to our reputation; the incurrence of additional expenses; disruption to our business; our inability to grow our online services or other businesses; additional regulatory scrutiny or penalties; or our exposure to civil litigation and possible financial liability — any of which could have a material adverse effect on our business, financial condition or results of operations. Additionally, we may not be able to ensure that our third-party vendors have appropriate controls in place to protect the confidentiality of the information they receive from us and our business, financial condition or results of operations could be adversely affected by a material breach of, or disruption to, the security of any of our or our vendors’ systems.
Because the investigation of any information security breach is inherently unpredictable and would require substantial time to complete, the Company may not be able to quickly remediate the consequences of any breach, which may increase the costs, and enhance the negative consequences associated with a breach. In addition, to the extent the Company’s insurance covers aspects of any breach, such insurance may not be sufficient to cover all of the Company’s losses.
The development and use of AI present risks and challenges that may adversely impact our business.
We or our third-party vendors, clients or counterparties may develop or incorporate AI technology in certain business processes, services or products. The development and use of AI present a number of risks and challenges to our business. The legal and regulatory environment relating to AI is uncertain and rapidly evolving, both in the U.S. and internationally, and includes regulatory schemes targeted specifically at AI as well as provisions in intellectual property, privacy, consumer protection, employment and other laws applicable to the use of AI. These evolving laws and regulations could require changes in our implementation of AI technology and increase our compliance costs and the risk of non-compliance. AI models, particularly generative AI models, may produce output or take action that is incorrect, that result in the release of private, confidential or proprietary information, that reflect biases included in the data on which they are trained, infringe on the intellectual property rights of others, or that is otherwise harmful. In addition, the complexity of many AI models makes it challenging to understand why they are generating particular outputs. This limited transparency increases the challenges associated with assessing the proper operation of AI models, understanding and monitoring the capabilities of the AI models, reducing erroneous output, eliminating bias and complying with regulations that require documentation or explanation of the basis on which decisions are made. Further, we may rely on AI models developed by third parties, and, to that extent, would be dependent in part on the manner in which those third parties develop and train their models, including risks arising from the inclusion of any unauthorized material in the training data for their models, and the effectiveness of the steps these third parties have taken to limit the risks associated with the output of their models, matters over which we may have limited visibility. Any of these risks could expose us to liability or adverse legal or regulatory consequences and harm our reputation and the public perception of our business or the effectiveness of our security measures.
In addition to our use of AI technologies, we are exposed to risks arising from the use of AI technologies by bad actors to commit fraud and misappropriate funds and to facilitate cyberattacks. Generative AI, if used to perpetrate fraud or launch cyberattacks, could create panic at a particular financial institution or exchange, which could pose a threat to financial stability.
27
Employee misconduct or mistakes could expose us to significant legal liability and reputational harm.
We are vulnerable to reputational harm because we operate in an industry in which integrity and the confidence of our customers are of critical importance. Our employees could engage in misconduct that adversely affects our business. For example, if an employee were to engage in fraudulent, illegal or suspicious activities, we could be subject to regulatory sanctions and suffer serious harm to our reputation (as a consequence of the negative perception resulting from such activities), financial position, customer relationships and ability to attract new customers. Our business often requires that we deal with confidential information. If our employees were to improperly use or disclose this information, even if inadvertently, we could suffer serious harm to our reputation, financial position and current and future business relationships. It is not always possible to deter employee misconduct, and the precautions we take to detect and prevent this activity may not always be effective. Misconduct by our employees, or even unsubstantiated allegations of misconduct, could result in a material adverse effect on our business, financial condition or results of operations. In addition, employee errors, such as inadvertent use or disclosure of confidential information, calculation errors, mistakes in addressing communications or data inputs, errors in developing, implementing or applying information technology systems or simple errors in judgment, could also have similar adverse effects.
We may be adversely affected by changes in the actual or perceived soundness or condition of other financial institutions.
Financial services institutions may be interconnected as a result of trading, investment, liquidity management, clearing, counterparty and other relationships. Within the financial services industry, loss of public confidence, including through default by any one institution, could lead to liquidity challenges or to defaults by other institutions. Concerns about, or a default by, one institution could lead to significant liquidity problems and losses or defaults by other institutions, as the commercial and financial soundness of many financial institutions is closely related as a result of these credit, trading, clearing and other relationships. Even the perceived lack of creditworthiness of, or questions about, a counterparty may lead to market-wide liquidity problems and losses or defaults by various institutions. For example, we could be subject to sudden withdrawals of deposits. Online and mobile banking have made it easier for customers to withdraw their deposits or transfer funds to other accounts with short notice. This may make retaining deposits during periods of stress more difficult. This systemic risk may adversely affect financial intermediaries, such as clearing agencies, banks and exchanges with which we interact on a daily basis or key funding providers such as the Federal Home Loan Banks (“FHLB”), any of which could have a material adverse effect on our access to liquidity or otherwise have a material adverse effect on our business, financial condition or results of operations.
Consumer protection initiatives related to the foreclosure process could materially affect our ability as a creditor to obtain remedies.
Historically, Hawaii rules provided for nonjudicial, or out-of-court, foreclosures, a process that is less expensive and quicker than going through the court foreclosure process. However, as a result of rule changes, many lenders now forgo nonjudicial foreclosures and file all foreclosures in court, which has created a backlog and slowed the judicial foreclosure process. Following a joint federal-state settlement regarding foreclosure practices, mortgage servicers have implemented new programs to assist borrowers with loss mitigation options. Federal and state loss mitigation requirements are now part of our annual audit requirements.
We are subject to a variety of risks in connection with any sale of loans we may conduct.
When we sell mortgage loans, we are required to make customary representations and warranties to the purchaser about the mortgage loans and the manner in which they were originated and serviced. If any of these representations and warranties are incorrect, we may be required to indemnify the purchaser for any related losses, or we may be required to repurchase or provide substitute mortgage loans for part or all of the affected loans. We may also be required to repurchase loans as a result of borrower fraud or in the event of early payment default by the borrower on a loan we have sold. If the level of repurchase and indemnity activity becomes material, it could have a material adverse effect on our liquidity, business, financial condition or results of operations. Mortgage lending is highly regulated. Our inability to comply with all federal and state regulations and investor guidelines regarding the origination, underwriting documentation and servicing of mortgage loans may impact our ability to sell mortgage loans in the future.
28
In addition, we must report as held for sale any loans which we have undertaken to sell, whether or not a purchase agreement for the loans has been executed. We may therefore be unable to ultimately complete a sale for part or all of the loans we classify as held for sale. We must exercise our judgment in determining when loans must be reclassified from held for investment status to held for sale status under applicable accounting guidelines. Any failure to accurately report loans as held for sale could result in regulatory investigations and monetary penalties. Any of these actions could have a material adverse effect on our business, financial condition or results of operations. Our policy is to carry loans held for sale at the lower of cost or fair value. As a result, prior to being sold, any loans classified as held for sale may be adversely affected by market conditions, including changes in interest rates, and by changes in the borrower’s creditworthiness, and the value associated with these loans, including any loans originated for sale in the secondary market, may decline prior to being sold. We may be required to reduce the value of any loans we mark held for sale as a result, which could have a material adverse effect on our business, financial condition or results of operations.
Our operations could be interrupted if certain external vendors on which we rely experience difficulty, terminate their services or fail to comply with banking laws and regulations.
We depend, to a significant extent, on relationships with third-party service providers that provide services, primarily information technology services, that are critical to our operations. We utilize third-party core banking services and receive credit card and debit card services, Internet banking services, various information services and services complementary to our banking products from various third-party service providers. We are also exposed to the risk that a cyberattack, security breach or other information technology incident at a common vendor to our third-party service providers could impede their ability to provide services to us. We may not be able to effectively monitor or mitigate operational risks relating to the use of common vendors by third-party service providers. If any of our third-party service providers experience difficulties or terminate their services and we are unable to replace our service providers with other service providers, our operations could be interrupted. It may be difficult for us to replace some of our third-party vendors, particularly vendors providing our core banking, credit card and debit card services and information services, in a timely manner if they are unwilling or unable to provide us with these services in the future for any reason. If an interruption were to continue for a significant period of time, it could have a material adverse effect on our business, financial condition or results of operations. Even if we are able to replace them, it may be at higher cost to us, which could have a material adverse effect on our business, financial condition or results of operations. In addition, if a third-party provider fails to provide the services we require, fails to meet contractual requirements, such as compliance with applicable laws and regulations, or suffers a cyberattack or other security breach, our business could suffer economic and reputational harm that could have a material adverse effect on our business, financial condition or results of operations.
We depend on the accuracy and completeness of information about customers and counterparties.
In deciding whether to extend credit or enter into other transactions, and in evaluating and monitoring our loan portfolio on an ongoing basis, we may rely on information furnished by or on behalf of customers and counterparties, including financial statements, credit reports and other financial information. We may also rely on representations of those customers or counterparties or of other third parties, such as independent auditors, as to the accuracy and completeness of that information. Reliance on inaccurate, incomplete, fraudulent or misleading financial statements, credit reports or other financial or business information, or the failure to receive such information on a timely basis, could result in loan losses, reputational damage or other effects that could have a material adverse effect on our business, financial condition or results of operations.
Our accounting estimates and risk management processes and controls rely on analytical and forecasting techniques and models and assumptions, and actual results may differ from these estimates.
Our accounting policies and methods are fundamental to how we record and report our financial condition and results of operations. Our management must exercise judgment in selecting and applying many of these accounting policies and methods so they comply with GAAP and reflect management’s judgment of the most appropriate manner to report our financial condition and results. In some cases, management must select the accounting policy or method to apply from two or more alternatives, any of which may be reasonable under the circumstances, yet which may result in our reporting materially different results than would have been reported under a different alternative.
29
Certain accounting policies are critical to presenting our financial condition and results of operations. They require management to make difficult, subjective or complex judgments about matters that are uncertain. Materially different amounts could be reported under different conditions or using different assumptions or estimates. These critical accounting policies include the allowance for credit losses, goodwill, fair value measurements, pension and postretirement benefit obligations and income taxes. Because of the uncertainty of estimates involved in these matters, we may be required to do one or more of the following: significantly increase the allowance for credit losses or sustain credit losses that are significantly higher than the reserve provided; record an impairment on all or a portion of our goodwill balance; reduce the carrying value of an asset measured at fair value; or significantly increase our accrued tax liability. Any of these could have a material adverse effect on our business, financial condition or results of operations. See “Item 7. Management’s Discussion and Analysis of Financial Condition and Results of Operations – Critical Accounting Policies” for more information.
Our internal controls, disclosure controls, processes and procedures, and corporate governance policies and procedures are based in part on certain assumptions and can provide only reasonable (not absolute) assurances that the objectives of the system are met. Any failure or circumvention of our controls, processes and procedures or failure to comply with regulations related to controls, processes and procedures could necessitate changes in those controls, processes and procedures, which may increase our compliance costs, divert management’s attention from our business or subject us to regulatory actions and increased regulatory scrutiny. Any of these could have a material adverse effect on our business, financial condition or results of operations.
Changes in our accounting policies or in accounting standards could materially affect how we report our financial results and condition.
From time to time, the FASB and the SEC change the financial accounting and reporting standards that govern the preparation of our financial statements. As a result of changes to financial accounting or reporting standards, whether required by the FASB or other regulators, we could be required to change certain of the assumptions or estimates we have previously used in preparing our financial statements, which could negatively impact how we record and report our results of operations and financial condition generally. For a discussion of the expected impact of accounting pronouncements recently issued but not adopted by us as of December 31, 2023, see “Note 1. Organization and Summary of Significant Accounting Policies – Recent Accounting Pronouncements” in the notes to the consolidated financial statements included in Item 8. Financial Statements and Supplementary Data for more information.
Strategic Risks
Geographic concentration in our existing markets may unfavorably impact our operations.
A substantial majority of our business is with customers located within Hawaii. Our operations are heavily concentrated in Hawaii, as well as in Guam and Saipan. As a result of this geographic concentration, our results depend largely on economic conditions in these and surrounding areas. As discussed below, deterioration in economic conditions in Hawaii, Guam and Saipan would have a material adverse effect on our business, financial condition or results of operations.
In addition, continued, long-term growth may be unsustainable, given the concentration of our operations and customer base in Hawaii, Guam and Saipan. Moreover, under applicable laws, we may not be permitted to acquire any bank in Hawaii because we control more than 30% of the total amount of deposits in the Hawaii market. As a result, any further growth in the Hawaii market will most likely have to occur organically rather than by acquisition. Our inability to manage our growth successfully or to continue to expand into new markets could have a material adverse effect on our business, financial condition or results of operations.
30
We operate in a highly competitive industry and market area.
We operate in the highly competitive financial services industry and face significant competition for customers from financial institutions located both within and beyond our principal markets. We compete with commercial banks, savings banks, credit unions, non-bank financial services companies and other financial institutions operating within or near the areas we serve. Additionally, certain large banks headquartered on the U.S. mainland and large community banking institutions target the same customers we do. In addition, as customer preferences and expectations continue to evolve, technology has lowered barriers to entry and made it possible for banks to expand their geographic reach by providing services over the Internet and for non-banks to offer products and services traditionally provided by banks, such as automatic transfer and automatic payment systems. The emergence, adoption and evolution of new technologies that do not require intermediation, including distributed ledgers such as digital assets and blockchain, as well as advances in robotic process automation or AI, could significantly affect the competition for financial services. The banking industry is experiencing rapid changes in technology, and, as a result, our future success will depend in part on our ability to address our customers’ needs by using technology. Customer loyalty can be influenced by a competitor’s new products, especially offerings that could provide cost savings or a higher return to the customer. We continue to face increased competitive pressures on loan rates and terms for high-quality credits. We may not be able to compete successfully with other financial institutions in our markets, and we may have to pay higher interest rates to attract deposits, accept lower yields to attract loans and pay higher wages for new employees, resulting in lower net interest margins and reduced profitability.
Many of our non-bank competitors are not subject to the same extensive regulations that govern our activities and may have greater flexibility in competing for business. The financial services industry could become even more competitive as a result of legislative, regulatory and technological changes and continued consolidation. In addition, some of our current commercial banking customers may seek alternative banking sources as they develop needs for credit facilities larger than we may be able to accommodate. Our inability to compete successfully in the markets in which we operate could have a material adverse effect on our business, financial condition or results of operations.
New lines of business, products, product enhancements or services may subject us to additional risks.
From time to time, we may implement new lines of business or offer new products and product enhancements as well as new services within our existing lines of business. There are substantial risks and uncertainties associated with these efforts, particularly in instances where the markets are not fully developed. In implementing, developing or marketing new lines of business, products, product enhancements or services, we may invest significant time and resources, although we may not assign the appropriate level of resources or expertise necessary to make these new lines of business, products, product enhancements or services successful or to realize their expected benefits. Further, initial timetables for the introduction and development of new lines of business, products, product enhancements or services may not be achieved, and price and profitability targets may not prove feasible. External factors, such as compliance with regulations, competitive alternatives and shifting market preferences, may also impact the ultimate implementation of a new line of business or offerings of new products, product enhancements or services. Furthermore, any new line of business, product, product enhancement or service could have a significant impact on the effectiveness of our system of internal controls. Failure to successfully manage these risks in the development and implementation of new lines of business or offerings of new products, product enhancements or services could have a material adverse effect on our business, financial condition or results of operations.
31
We have dealer-centric automotive finance businesses, and a change in the key role of dealers within the automotive industry or our ability to maintain or build relationships with them could have an adverse effect on our business, results of operations, financial condition, or prospects.
Our automotive finance business depends on the continuation of the key role of dealers within the automotive industry, the maintenance of our existing relationships with dealers, and our creation of new relationships with dealers. A number of trends are affecting the automotive industry and the role of dealers within it. These include challenges to the dealer’s role as intermediary between manufacturers and purchasers, shifting financial and other pressures exerted by manufacturers on dealers, the rise of vehicle sharing and ride hailing, the development of autonomous and alternative-energy vehicles, the impact of demographic shifts on attitudes and behaviors toward vehicle ownership and use, changing expectations around the vehicle buying experience, adjustments in the geographic distribution of new and used vehicle sales, and advancements in communications technology. While it is not currently clear how and how quickly these trends may develop, any one or more of them could adversely affect the key role of dealers and their business models, profitability, and viability, and if this were to occur, our dealer-centric automotive finance businesses could suffer as well.
Our share of commercial wholesale financing remains at risk of decreasing in the future as a result of intense competition and other factors. If we are not able to maintain existing relationships with significant automotive dealers or if we are not able to develop new relationships for any reason—including if we are not able to provide services on a timely basis, offer products and services that meet the needs of the dealers, compete successfully with the products and services of our competitors, or effectively counter the influence that captive automotive finance companies have in the marketplace or the exclusivity privileges that some competitors have with automotive manufacturers—our wholesale funding volumes, and the number of dealers with whom we have funding relationships, could decline in the future. If this were to occur, our business, results of operations, financial condition, or prospects could be adversely affected.
We continually encounter technological change.
The financial services industry is continually undergoing rapid technological change with frequent introductions of new, technology-driven products and services. The effective use of technology increases efficiency and enables financial institutions to better serve customers and to reduce costs. Our future success depends, in part, upon our ability to address the needs of our customers by using technology to provide products and services that will satisfy customer demands, as well as to create additional efficiencies in our operations. Certain of our competitors have substantially greater resources to invest in technological improvements than we do. We may not be able to effectively implement new, technology-driven products and services or implement them as quickly as our competitors do or be successful in marketing these products and services to our customers. In addition, the implementation of technological changes and upgrades to maintain current systems and integrate new systems may also cause service interruptions, transaction processing errors and system conversion delays and may cause us to fail to comply with applicable laws or may otherwise result in an increase, potentially a material increase, in our expenses. Failure to successfully keep pace with technological change affecting the financial services industry and failure to avoid interruptions, errors and delays could cause us to lose customers or have a material adverse effect on our business, financial condition or results of operations.
We expect that new technologies and business processes applicable to the consumer credit industry will continue to emerge, and these new technologies and business processes may be better than those we currently use. Because the pace of technological change is high and our industry is intensely competitive, we may not be able to sustain our investment in new technology as critical systems and applications become obsolete or as better ones become available. A failure to maintain current technology and business processes could cause disruptions in our operations or cause our products and services to be less competitive, all of which could have a material adverse effect on our business, financial condition or results of operations.
32
Legal, Regulatory and Compliance Risks
The banking industry is highly regulated, and the regulatory framework, together with any future legislative or regulatory changes, may have a significant adverse effect on our operations.
The banking industry is extensively regulated and supervised under both federal and state laws and regulations that are intended primarily for the protection of depositors, customers, federal deposit insurance funds and the banking system as a whole, not for the protection of our stockholders and creditors other than insured depositors. FHI is subject to regulation and supervision by the Federal Reserve and the Bank is subject to regulation and supervision by the FDIC, the CFPB and the Hawaii DFI. The laws and regulations applicable to us govern a variety of matters, including permissible types, amounts and terms of loans and investments we may make, the maximum interest rate that may be charged, the amount of reserves we must hold against deposits we take, the types of deposits we may accept, maintenance of adequate capital and liquidity, changes in the control of us and our bank, restrictions on dividends and establishment of new offices. We must obtain approval from our regulators before engaging in certain activities, and there is the risk that such approvals may not be obtained, either in a timely manner or at all. In some cases, governmental authorities have required criminal pleas or other extraordinary terms, including admissions of wrongdoing and the imposition of monitors, as part of settlements. Our failure to comply with any applicable laws or regulations, or regulatory policies and interpretations of such laws and regulations, in some cases, even if such noncompliance was inadvertent, could result in sanctions by regulatory agencies, civil money penalties, related litigation by private plaintiffs, or damage to our reputation, all of which could have a material adverse effect our business, financial condition or results of operations.
We expect that our business will remain subject to extensive regulation and supervision and that the level of scrutiny and the enforcement environment may fluctuate over time, based on numerous factors, including changes in the United States presidential administration or one or both houses of Congress and public sentiment regarding financial institutions (which can be influenced by scandals and other incidents that involve participants in the financial services industry). In particular, we anticipate increased regulatory scrutiny, in the course of routine examinations and otherwise, and new regulations in response to recent negative developments in the banking industry, which may increase our cost of doing business and reduce our profitability. Among other things, there may be increased focus by both regulators and investors on deposit composition, the level of uninsured deposits, brokered deposits, unrealized losses in securities portfolios, liquidity, commercial real estate loan composition and concentrations, and capital as well as general oversight and control of the foregoing. We could face increased scrutiny or be viewed as higher risk by regulators and/or the investor community, which could have a material adverse effect on our business, financial condition and results of operations.
In addition, changes in key personnel at the agencies that regulate the Company, including the federal banking regulators, may result in differing interpretations of existing rules and guidelines and potentially more stringent enforcement and more severe penalties than previously experienced. New regulations and modifications to existing regulations and supervisory expectations have increased, and may in the future increase, our costs over time, result in decreased revenues and net income, reduce our ability to compete effectively (particularly with non-bank financial institutions that may not be subject to the same laws and regulations), make it less attractive for us to continue providing certain products and services, or require changes to our existing regulatory compliance and risk management structure. Any future changes in federal and state law and regulations, as well as the interpretations and implementations, or modifications or repeals, of such laws and regulations, could affect us in substantial and unpredictable ways, including those listed above or other ways that could have a material adverse effect on our business, financial condition or results of operations.
33
Fee revenues from overdraft protection programs constitute a portion of our noninterest income and may be subject to increased supervisory scrutiny.
Revenues derived from transaction fees associated with overdraft protection programs offered to our customers are included in noninterest income. Members of Congress and the leadership of the OCC and CFPB have expressed a heightened interest in bank overdraft protection programs. On January 17, 2024, the CFPB proposed a rule that would significantly reform the regulatory framework governing overdraft practices applicable to banks such as FHB that have more than $10 billion in assets. If adopted as proposed, the proposed rule would likely result in decreased revenue from overdraft transaction fees for FHB. See “Item 1. Business — Supervision and Regulation — Consumer Financial Protection” herein for more information about this proposed rule. These actions are a component of the CFPB’s broader supervision and enforcement initiative targeting so-called consumer “junk fees.” In addition, the Comptroller of the Currency has identified potential options for reform of national bank overdraft protection practices, including providing a grace period before the imposition of a fee, refraining from charging multiple fees in a single day and eliminating fees altogether.
In response to this increased congressional and regulatory scrutiny, and in anticipation of enhanced supervision and enforcement of overdraft protection practices in the future, certain banking organizations have modified their overdraft protection programs, including by discontinuing the imposition of overdraft transaction fees. These competitive pressures from our peers, as well as any adoption by our regulators of new rules or supervisory guidance or more aggressive examination and enforcement policies in respect of banks’ overdraft protection practices, could cause us to modify our program and practices in ways that may have a negative impact on our revenue and earnings, which, in turn, could have an adverse effect on our financial condition and results of operations. In addition, as supervisory expectations and industry practices regarding overdraft protection programs change, our continued offering of overdraft protection may result in negative public opinion and increased reputation risk.
We are required to act as a source of financial and managerial strength for our bank in times of stress.
Under federal law, we are required to act as a source of financial and managerial strength to our bank, and to commit resources to support our bank if necessary. We may be required to commit additional resources to our bank at times when we may not be in a financial position to provide such resources or when it may not be in our, or our stockholders’ or our creditors’ best interests to do so. Providing such support is more likely during times of financial stress for us and our bank, which may make any capital we are required to raise to provide such support more expensive than it might otherwise be. In addition, any capital loans we make to our bank are subordinate in right of payment to depositors and to certain other indebtedness of our bank. In the event of our bankruptcy, any commitment by us to a federal banking regulator to maintain the capital of our bank will be assumed by the bankruptcy trustee and entitled to priority of payment.
We are subject to capital adequacy requirements and may be subject to more stringent capital requirements.
We are subject to regulatory requirements relating to capital, which are subject to change from time to time. If we fail to meet applicable requirements, we may be restricted in the types of activities we may conduct, and we may be prohibited from taking certain capital actions, such as paying dividends and repurchasing capital securities. See “Item 1. Business — Supervision and Regulation — Regulatory Capital Requirements” for more information.
While we expect to continue to meet the requirements of the Capital Rules, we may fail to do so. In addition, these requirements could have a negative impact on our ability to lend, grow deposit balances, make acquisitions or make capital distributions in the form of dividends and share repurchases. Higher capital levels could also lower our return on equity.
34
We may not pay dividends on our common stock in the future.
Holders of our common stock are entitled to receive only such dividends as our board of directors may declare out of funds legally available for such payments. Our board of directors may, in its sole discretion, change the amount or frequency of dividends or discontinue the payment of dividends entirely. In addition, we are a bank holding company, and our ability to declare and pay dividends is dependent on certain federal regulatory considerations, including the guidelines of the Federal Reserve regarding capital adequacy and dividends. It is the policy of the Federal Reserve that bank holding companies should generally pay dividends on common stock only out of earnings, and only if prospective earnings retention is consistent with the organization’s expected future needs, asset quality and financial condition.
Further, if we are unable to satisfy the capital requirements applicable to us for any reason, we may not be able to make, or may have to reduce or eliminate, the payment of dividends on our common stock. Any change in the level of our dividends or the suspension of the payment thereof could have a material adverse effect on the market price of our common stock. See “Liquidity Risks – Our liquidity is dependent on dividends from First Hawaiian Bank” for additional information on our reliance on dividends paid to us by the Bank.
Rulemaking changes implemented by the CFPB have in the past resulted and may in the future result in higher regulatory and compliance costs that may adversely affect our results of operations.
The CFPB is a federal agency responsible for implementing, examining and enforcing compliance with federal consumer financial protection laws. The CFPB also has examination and primary enforcement authority with respect to depository institutions with $10 billion or more in assets, their service providers and certain non-depository entities such as debt collectors and consumer reporting agencies. Consumer protection laws and regulation, and the examination, supervision and enforcement of those laws and regulations, by the CFPB have created a complex environment for consumer finance regulation. See “Item 1. Business — Supervision and Regulation — Consumer Financial Protection.” The ultimate impact of this heightened scrutiny is uncertain but could result in changes to pricing, practices, products and procedures. It could also result in increased costs related to regulatory oversight, supervision and examination, additional remediation efforts and possible penalties. We may also be required to add additional compliance personnel or incur other significant compliance-related expenses. Our business, results of operations or competitive position may be adversely affected as a result.
Litigation and regulatory actions, including possible enforcement actions, could subject us to significant fines, penalties, judgments or other requirements resulting in increased expenses or restrictions on our business activities.
Our business is subject to increased litigation and regulatory risks as a result of a number of factors, including the highly regulated nature of the financial services industry and the focus of civil government attorneys on banks and the financial services industry generally, and in particular practices and requirements, including foreclosure practices, applicable consumer protection laws, classification of held for sale assets and compliance with anti-money laundering statutes, the Bank Secrecy Act and sanctions administered by OFAC. In addition, a single event or issue may give rise to numerous and overlapping investigations and proceedings, including by multiple federal and state regulators and other governmental authorities.
35
In the normal course of business, from time to time, we may be named as a defendant in various legal actions, including arbitrations, class actions and other litigation, arising in connection with our business activities. Certain of the legal actions have included, and may in the future include, claims for substantial compensatory or punitive damages or claims for indeterminate amounts of damages. In addition, while the arbitration provisions in certain of our customer agreements historically have limited our exposure to consumer class action litigation, there can be no assurance that we will be successful in enforcing our arbitration clause in the future. We may also, from time to time, be the subject of subpoenas, requests for information, reviews, investigations and proceedings (both formal and informal) by governmental and self-regulatory agencies regarding our business. Any such legal or regulatory actions may subject us to substantial compensatory or punitive damages, significant fines, penalties, obligations to change our business practices or other requirements resulting in increased expenses, diminished income and damage to our reputation. Our involvement in any such matters, even if the matters are ultimately determined in our favor, could also cause significant harm to our reputation and divert management’s attention from the operation of our business. Directives issued to enforce such actions may be confidential and thus, in some instances, we are not permitted to publicly disclose these actions. Further, any settlement, consent order or adverse judgment in connection with any formal or informal proceeding or investigation by government agencies may result in litigation, investigations or proceedings as other litigants and government agencies begin independent reviews of the same activities. As a result, the outcome of legal and regulatory actions could be material to our business, results of operations, financial condition and cash flows depending on, among other factors, the level of our earnings for that period, and could have a material adverse effect on our business, financial condition or results of operations.
Increases in FDIC insurance premiums may adversely affect our earnings.
Our bank’s deposits are insured by the FDIC up to legal limits and, accordingly, our bank is subject to FDIC deposit insurance assessments. We generally cannot control the amount of premiums our bank will be required to pay for FDIC insurance. Beginning in the first quarterly assessment period of 2023, the FDIC increased the initial base deposit insurance assessment rate schedules by 2 basis points, and the FDIC may in the future further increase assessment rates to meet the FDIC’s designated reserve ratio, which is currently maintained at 2% of insured deposits. Future increases of FDIC insurance premiums or special assessments could have a material adverse effect on our business, financial condition or results of operations. See “Item 1. Business — Supervision and Regulation — Deposit Insurance.”
Non-compliance with the USA PATRIOT Act, the Bank Secrecy Act or other laws and regulations could result in fines or sanctions against us.
The USA PATRIOT Act of 2001 and the Bank Secrecy Act require financial institutions to design and implement programs to prevent financial institutions from being used for money laundering and terrorist activities. If such activities are detected, financial institutions are obligated to file suspicious activity reports with the U.S. Treasury Department’s Office of Financial Crimes Enforcement Network. These rules require financial institutions to establish procedures for identifying and verifying the identity of customers seeking to open new financial accounts. Federal and state bank regulators also have focused heavily on compliance with Bank Secrecy Act and anti-money laundering regulations in recent years. Failure to comply with these regulations could result in fines or sanctions, including restrictions on conducting acquisitions or establishing new branches, significant reputational harm and increased exposure to civil litigation. In recent years, several banking institutions have received large fines for non-compliance with these laws and regulations, and, in some cases, governmental authorities have required as part of settlements criminal pleas or other extraordinary terms, including admissions of wrongdoing and the impositions of monitors. While we have developed policies and procedures designed to assist in compliance with these laws and regulations, these policies and procedures may not be effective in preventing violations of these laws and regulations. Failure to maintain and implement adequate programs to combat money laundering and terrorist financing could also have serious reputational consequences for us, which could have a material adverse effect on our business, financial condition or results of operations.
36
Regulations relating to privacy, information security and data protection could increase our costs, affect or limit how we collect and use personal information and adversely affect our business opportunities.
We are subject to various privacy, information security and data protection laws, including requirements concerning security breach notification, and we could be negatively impacted by these laws. For example, our business is subject to the Gramm-Leach-Bliley Act which, among other things: (i) imposes certain limitations on our ability to share nonpublic personal information about our customers with nonaffiliated third parties; (ii) requires that we provide certain disclosures to customers about our information collection, sharing and security practices and afford customers the right to “opt out” of any information sharing by us with nonaffiliated third parties (with certain exceptions) and (iii) requires that we develop, implement and maintain a written comprehensive information security program containing safeguards appropriate based on our size and complexity, the nature and scope of our activities, and the sensitivity of customer information we process, as well as plans for responding to data security breaches. Various state and federal banking regulators and states have also proposed or enacted data security breach notification requirements with varying levels of individual, consumer, regulatory or law enforcement notification in certain circumstances in the event of a security breach. Moreover, legislators and regulators in the United States are increasingly adopting or revising privacy, information security and data protection laws that potentially could have a significant impact on our current and planned privacy, data protection and information security-related practices, our collection, use, sharing, retention and safeguarding of consumer or employee information, and some of our current or planned business activities. As new privacy-related laws and regulations, such as the California Consumer Privacy Act and any future laws and regulations which will be modeled after those laws, are implemented, the time and resources needed for us to comply with such laws and regulations, as well as our potential liability for non-compliance and reporting obligations in the case of data breaches, may significantly increase. This could result from, among other things, increased privacy-related enforcement activity at the federal level, by the Federal Trade Commission, as well as at the state level, such as with regard to mobile applications.
Compliance with current or future privacy, data protection and information security laws (including those regarding security breach notification) to which we are subject could result in higher compliance and technology costs and could restrict our ability to provide certain products and services, which could have a material adverse effect on our business, financial conditions or results of operations. Our failure to comply with privacy, data protection and information security laws could result in potentially significant regulatory or governmental investigations or actions, litigation, fines, sanctions and damage to our reputation, which could have a material adverse effect on our business, financial condition or results of operations.
Differences in regulation can affect our ability to compete effectively.
The content and application of laws and regulations applicable to financial institutions vary according to the size of the institution, the jurisdictions in which the institution is organized and operates and other factors. Some of our non-bank competitors are not subject to the same extensive regulations we are, and, as a result, may be able to compete more effectively for business. In particular, the activity of marketplace lenders and other financial technology companies (“fintechs”) has grown significantly over recent years and is expected to continue to grow. Fintechs have and may continue to offer bank or bank-like products. For example, a number of fintechs have applied for, and in some cases received, bank or industrial loan charters. In addition, other fintechs have partnered with existing banks to allow them to offer deposit products to their customers. Regulatory changes may also make it easier for fintechs to partner with banks and offer deposit products. Other regulation has reduced the regulatory burden of large bank holding companies, and raised the asset thresholds at which more onerous requirements apply, which could cause certain large bank holding companies with less than $250 billion in total consolidated assets, which were previously subject to more stringent enhanced prudential standards, to become more competitive or to pursue expansion more aggressively.
37
Our use of third-party vendors and our other ongoing third-party business relationships are subject to increasing regulatory requirements and attention.
We regularly use third-party vendors as part of our business. We also have substantial ongoing business relationships with other third parties. These types of third-party relationships are subject to increasingly demanding regulatory requirements and attention by our federal bank regulators, as well as heightened supervisory expectations regarding our due diligence, ongoing monitoring and control over our third-party vendors and other ongoing third-party business relationships. In certain cases, we may be required to renegotiate our agreements with these vendors to meet these enhanced requirements, which could increase our costs. We expect that our regulators will hold us responsible for deficiencies in our oversight and control of our third-party relationships and in the performance of the parties with which we have these relationships. As a result, if our regulators conclude that we have not exercised adequate oversight and control over our third-party vendors or other ongoing third-party business relationships or that such third parties have not performed appropriately, we could be subject to enforcement actions, including civil money penalties or other administrative or judicial penalties or fines as well as requirements for customer remediation, any of which could have a material adverse effect on our business, financial condition or results of operations.
We are subject to environmental liability risk associated with our bank branches and any real estate collateral we acquire upon foreclosure.
During the ordinary course of business, we may foreclose on and take title to properties securing certain loans that we have originated or acquired. We also have an extensive branch network, owning separate branch locations throughout the areas we serve. For any real property that we may possess, there is a risk that hazardous or toxic substances could be found on these properties. If hazardous or toxic substances are found, we may be liable for remediation costs, as well as for personal injury and property damage and costs of complying with applicable environmental regulatory requirements. Failure to comply with such requirements can result in penalties. Environmental laws may require us to incur substantial expenses and may materially reduce the affected property’s value or limit our ability to use, sell or lease the affected property. In addition, future laws or more stringent interpretations or enforcement policies with respect to existing laws may increase our exposure to environmental liability. The remediation costs and any other financial liabilities associated with an environmental hazard could have a material adverse effect on our business, financial condition or results of operations.
We may be subject to litigation risk pertaining to our fiduciary responsibilities.
Some of the services we provide, such as trust and investment services, require us to act as fiduciaries for our customers and others. From time to time, third parties make claims and take legal action against us pertaining to the performance of our fiduciary responsibilities. If these claims and legal actions are not resolved in a manner favorable to us, we may be exposed to significant financial liability or our reputation could be damaged. Either of these results may adversely impact demand for our products and services or otherwise have a material adverse effect on our business, financial condition or results of operations.
38
Other Risks Affecting Our Business.
Severe weather, hurricanes, tsunamis, natural disasters, pandemics, acts of war or terrorism or other external events could significantly impact our business.
Severe weather, hurricanes, tsunamis, natural disasters, widespread disease or pandemics or other severe health emergencies, or concerns over the possibility of such an emergency, acts of war or terrorism or other adverse external events could have a significant impact on our business. Additionally, financial markets may be adversely affected by the current or anticipated impact of military conflict, including Russia’s ongoing invasion of Ukraine and the conflict in the Middle East, terrorism or other geopolitical events. Such events could affect the stability of our deposit base, impair the ability of borrowers to repay outstanding loans, impair the value of collateral securing loans, cause significant property damage, result in loss of revenue and/or cause us to incur additional expenses. Furthermore, the occurrence of any such event in the future could have a material adverse effect on our business, which, in turn, could have a material adverse effect on our financial condition and results of operations. Because Hawaii’s economy is heavily dependent on the tourism industry, which is in turn heavily influenced by the affordability and desirability of air travel, any related safety concerns or limitations and the prevailing weather patterns in the region, we could be disproportionately affected relative to others in the case of external events such as acts of war or terrorism, severe weather, natural disasters or pandemics or other actual or perceived severe health emergencies, including travel restrictions as a result of actual or perceived health emergencies that impact markets on which we depend. The occurrence of any of these events in the future could have a material adverse effect on our business, financial condition or results of operations.
We own the building in Honolulu in which our principal office and headquarters are located. Given that we derive a portion of our income from leasing space in our principal office building and that a large concentration of our employees is located in our principal office building, depending on the intensity and longevity of the event, a catastrophic event impacting our Honolulu office building, including a terrorist attack, extreme weather event or other hostile or catastrophic event, could negatively affect our business and reputation and could have a material adverse effect on our business, financial condition or results of operations.
Climate change could have a material negative impact on us and our customers.
Our business, as well as the operations and activities of our customers, could be negatively impacted by climate change. Climate change presents both immediate and long-term risks to us and our customers and these risks are expected to increase over time. Climate changes presents multi-faceted risks, including (i) operational risk from the physical effects of climate events on our facilities and other assets as well as those of our customers; (ii) credit risk from borrowers with significant exposure to climate risk; and (iii) reputational risk from stakeholder concerns about our practices related to climate change, our carbon footprint and our business relationships with customers who operate in carbon-intensive industries.
For instance, climate change exposes us and our customers to physical risk as its effects may lead to more frequent and more extreme weather events, such as prolonged droughts or flooding, tornados, hurricanes, wildfires and extreme seasonal weather; and longer-term shifts, such as increasing average temperatures, ozone depletion and rising sea levels. As our primary markets are located on islands in the Pacific Ocean, they may be particularly susceptible to certain of these risks or other risks resulting from climate change, including those relating to rising sea levels. Such events and long-term shifts may also have a significant impact on our customers, which could amplify credit risk by diminishing borrowers’ repayment capacity or collateral values, and other businesses and counterparties with whom we transact, which could have a broader impact on the economy, supply chains and distribution networks.
39
Climate change may also result in new and/or more stringent regulatory requirements for the Company, which could materially affect the Company’s results of operations by requiring the Company to take costly measures to comply with any new laws or regulations related to climate change that may be forthcoming. New regulations or guidance, or the attitudes of regulators, shareholders and employees regarding climate change, may affect the activities in which the Company engages and the products that the Company offers. In addition, an increasing perspective that financial institutions, including the Company, play an important role in managing risks related to climate change, including indirectly with respect to their customers, may result in increased pressure on the Company to take additional steps to disclose and manage its climate risks and related lending and other activities. Risks associated with climate change are continuing to evolve rapidly, making it difficult to assess the effects of climate change on the Company, and the Company expects that climate change-related risks will continue to evolve and increase over time. If our actual or perceived action or inaction in response to these climate change-related risks are, or are perceived to be, ineffective or insufficient, or if we participate in, or decide not to participate in, certain industries or activities perceived to be associated with causing or exacerbating climate change, we could be subject to enforcement and other supervisory or government actions, reputational damage, a loss of customer or investor confidence, difficulty retaining or attracting talented employees, or other harm.
We may be subject to unexpected income tax liabilities in connection with the Reorganization Transactions. BWHI is required to pay us for any unexpected income tax liabilities that arise in connection with the Reorganization Transactions. However, in the event that BWHI does not satisfy its payment obligations, we could be subject to significantly higher federal and/or state and local income tax liabilities than currently anticipated.
BNPP, BWHI and we expect that no U.S. federal income taxes will be imposed on us in connection with the Reorganization Transactions. However, we paid state and local income taxes of approximately $95.4 million in June 2016 (which was partially offset by a federal tax reduction of approximately $33.4 million received through the intercompany settlement of estimated taxes in April 2017) in connection with the Reorganization Transactions (the “Expected Taxes”). BNPP, BWHI and we reported a total tax liability in connection with the Reorganization Transactions of $92.1 million (the “Return Taxes”) in the tax returns of various state and local jurisdictions. Pursuant to the Tax Sharing Agreement, we reimbursed BWHI approximately $2.1 million due to the Return Taxes being lower than the Expected Taxes. Such amount was recorded as an adjustment to additional paid-in capital. We could be subject to higher income tax liabilities in the event that the Internal Revenue Service (the “IRS”) or state and local tax authorities successfully assert that our income tax liabilities in respect of the Reorganization Transactions are higher than the Return Taxes. Under the terms of the Tax Sharing Agreement, BWHI is required to pay us for any such additional taxes on an “after-tax basis” (which means an amount determined by reducing the payment amount by any tax benefits derived by the Company and increasing the payment amount by any tax costs, including additional taxes, incurred by the Company as a result of such additional taxes and/or payments). See “Certain Related Party Transactions” in the Company’s Proxy Statement is incorporated herein by reference. If, however, our income tax liabilities with respect to the Reorganization Transactions are higher than the Return Taxes and BWHI fails to satisfy its payment obligations under the Tax Sharing Agreement, we could be liable for significantly higher federal and/or state income tax liabilities. We have not sought and will not seek any rulings from the IRS or state and local tax authorities regarding our expected tax treatment of the Reorganization Transactions.
In addition, under the U.S. Internal Revenue Code of 1986, as amended (the “Code”) and related rules and regulations, each entity that was a member of the BancWest combined tax reporting group during any taxable period or portion of any taxable period ending on or before the effective time of the Reorganization Transactions is jointly and severally liable for the U.S. federal income tax liability of the entire combined tax reporting group for such taxable period. Although the Tax Sharing Agreement allocates the responsibility for prior period taxes of the combined tax reporting group in accordance with the existing tax allocation agreements, if BWHI were unable to pay any such prior period taxes for which it is responsible, we could be required to pay the entire amount of such taxes, and such amounts could be significant. Other provisions of federal, state or local tax law may establish similar liability for other matters, including laws governing tax qualified pension plans, as well as other contingent liabilities.
40
Risks Related to Our Common Stock
Our stock price may be volatile, and you could lose part or all of your investment as a result.
Stock price volatility may make it more difficult for you to resell your common stock when you want and at prices you find attractive. Our stock price may fluctuate significantly in response to a variety of factors including, among other things:
| ● | Actual or anticipated variations in our results of operations; |
| ● | Recommendations or research reports about us or the financial services industry in general published by securities analysts; |
| ● | The failure of securities analysts to cover, or continue to cover, us; |
| ● | Operating and stock price performance of other companies that investors deem comparable to us; |
| ● | News reports relating to trends, concerns and other issues in the financial services industry; |
| ● | Future sales of our common stock; |
| ● | Departure of our management team or other key personnel; |
| ● | New technology used, or services offered, by competitors; |
| ● | Significant acquisitions or business combinations, strategic partnerships, joint ventures or capital commitments by or involving us or our competitors; |
| ● | Changes or proposed changes in laws or regulations, or differing interpretations thereof affecting our business, or enforcement of these laws and regulations; |
| ● | Litigation and governmental investigations; and |
| ● | Geopolitical conditions such as acts or threats of terrorism or military conflicts and government shutdowns. |
If any of the foregoing occurs, it could cause our stock price to fall and may expose us to litigation that, even if our defense is successful, could distract our management and be costly to defend. General market fluctuations, industry factors and general economic and political conditions and events — such as economic slowdowns or recessions, interest rate changes or credit loss trends — could also cause our stock price to decrease regardless of operating results.
Future sales and issuances of our common stock, including sales as part of our equity-based compensation plans, could result in dilution of the percentage ownership of our stockholders and could lower our stock price.
The market price of our common stock could decline as a result of sales of a large number of shares of our common stock or from the perception that such sales could occur. These sales, or the possibility that these sales may occur, also may make it more difficult for us to raise additional capital by selling equity securities in the future, at a time and price that we deem appropriate. As of February 9, 2024 we had a total of 127,622,503 shares of common stock outstanding.
We have filed a registration statement to register 6,253,385 shares of our common stock for issuance pursuant to awards granted under the equity incentive and employee stock purchase plans. In April 2021, our stockholders approved an amendment and restatement of the First Hawaiian, Inc. 2016 Non-Employee Director Plan principally to increase the total number of shares of common stock that may be awarded under that plan by 193,941 shares. We have granted awards covering 3,335,948 shares of our common stock under these plans as of December 31, 2023. We may increase the number of shares registered for this purpose from time to time, subject to stockholder approval. Once we register and issue these shares, their holders will be able to sell them in the public market, subject to applicable transfer restrictions.
41
We cannot predict the size of future issuances or sales of our common stock or the effect, if any, that future issuances or sales of shares of our common stock may have on the market price of our common stock. Sales or distributions of substantial amounts of our common stock (including shares issued in connection with an acquisition), or the perception that such sales could occur, may cause the market price of our common stock to decline.
Certain banking laws and certain provisions of our certificate of incorporation may have an anti-takeover effect.
Provisions of federal banking laws, including regulatory approval requirements, could make it difficult for a third party to acquire us, even if doing so would be perceived to be beneficial to our stockholders. Acquisition of 10% or more of any class of voting stock of a bank holding company or depository institution, including shares of our common stock, generally creates a rebuttable presumption that the acquirer “controls” the bank holding company or depository institution. Also, a bank holding company must obtain the prior approval of the Federal Reserve before, among other things, acquiring direct or indirect ownership or control of more than 5% of the voting shares of any bank, including our bank.
There also are provisions in our second amended and restated certificate of incorporation, which we refer to as our certificate of incorporation, and fourth amended and restated bylaws, which we refer to as our bylaws, such as limitations on the ability to call a special meeting of our stockholders and restrictions on stockholders’ ability to act by written consent, that may be used to delay or block a takeover attempt. In addition, our board of directors is authorized under our certificate of incorporation to issue shares of our preferred stock, and determine the rights, terms conditions and privileges of such preferred stock, without stockholder approval. These provisions may effectively inhibit a non-negotiated merger or other business combination, which, in turn could have a material adverse effect on the market price of our common stock.
ITEM 1B. UNRESOLVED STAFF COMMENTS
Not applicable.
ITEM 1C. CYBERSECURITY
Risk Management and Strategy
The Company recognizes the critical importance of developing, implementing and maintaining robust cybersecurity measures to safeguard our information systems and protect the confidentiality, integrity, and availability of our data.
Managing Material Risks and Integrated Overall Risk Management
The Company has implemented a risk-based approach to identify and assess the cybersecurity threats that could affect our business and information systems. Our cybersecurity program is designed to align with industry standards and best practices, such as the National Institute of Standards and Technology (“NIST”) Cybersecurity Framework. We use various tools and methodologies to manage cybersecurity risk that are tested on a regular cadence. We also monitor and evaluate our cybersecurity posture and performance on an ongoing basis through regular vulnerability scans, third-party conducted penetration tests and network monitoring. We also provide security awareness training for employees and contractors, maintain a cybersecurity insurance policy and invest in new security capabilities designed to address emerging threats.
In addition, the Company has a set of enterprise-wide policies, standards, and procedures concerning cybersecurity matters, which include an information security policy and program reviewed and approved by senior management and the Board of Directors. Additionally, technical standards and procedures related to incident response and use of Bank systems and devices are in place, as well as standards for critical security operational functions related to encryption, endpoint protection, vulnerability management, remote access, multifactor authentication, handling confidential information, use of internet, social media, email, and wireless devices. Policies and standards are subject to an internal review process and are approved by senior management.
42
The Company has strategically integrated cybersecurity risk management into our enterprise-wide risk management framework in alignment with the three lines of defense model to promote an enterprise-wide culture of cybersecurity risk management. This integration aims to provide that cybersecurity considerations are an integral part of our decision-making processes at every level. Our risk management team works closely with our enterprise technology and cybersecurity management teams to evaluate and address cybersecurity risks in alignment with our business objectives, regulatory requirements and operational needs.
Engaging Third Parties on Risk Management
Recognizing the complexity and evolving nature of cybersecurity threats, the Company engages with a range of external experts, including cybersecurity service providers, assessors, advisors and consultants, in evaluating and testing our cybersecurity program. These partnerships enable us to leverage specialized knowledge and insights to ensure our cybersecurity strategies and processes are aligned to industry best practices. Our collaboration with these third parties includes threat assessments and consultation on security improvements, program maturity and regulatory compliance. Additionally, we conduct multiple penetration tests annually and retain an external consultant to periodically evaluate the overall state of our program.
Overseeing Third-Party Risk
The Company has processes in place to oversee and manage risks associated with third-party service providers, including risks related to data breaches or other security incidents. This includes conducting security due diligence reviews of critical third-party providers, subjecting third parties to periodic risk assessments and requiring third parties to sign standard contractual provisions before receiving sensitive information from the Company.
Risks from Cybersecurity Threats
Like all financial institutions, we, as well as our third-party service providers, are the target of various evolving and adaptive security threats, including malware, ransomware, phishing, credential validation and distributed denial-of-service attacks. Cyber-attacks have also focused on targeting online applications and services, such as online banking, as well as cloud-based and other products and services provided by third parties. Operational failures and breaches of security from such attempts could lead to the loss or disclosure of confidential information or personal data belonging to the Company or our employees and customers. These failures and breaches could result in business interruption or malfunction and lead to legal or regulatory actions that could result in a material adverse impact on the Company’s operations, reputation and financial results.
See “Item 1A. Risk Factors” in this Form 10-K for further information about information and cybersecurity risk.
Governance
The Company’s Board of Directors is aware of the critical nature of managing risks associated with cybersecurity threats and the significance of these threats to our operational integrity and stakeholder confidence. Accordingly, the Board of Directors has established oversight mechanisms to ensure effective governance in managing these risks.
Board of Directors Oversight
As part of its responsibility to oversee the management, business, and strategy of the Company, the Board of Directors, through its Risk Committee, reviews and approves the Company’s risk management framework, including reviewing the overall risk appetite, risk management strategy and policies and practices established by management to identify and manage the risks we face. In addition, other Board committees are responsible for overseeing certain risks under their respective charters.
The Board’s Risk Committee is central to the Board’s oversight of cybersecurity risks and bears the primary oversight responsibility for this domain. The Risk Committee is composed of Board members with diverse expertise, including audit and finance and technology experience, equipping them to oversee cybersecurity risks effectively. The Risk Committee actively participates in strategic decisions related to cybersecurity, offering review and guidance on, among other things, program design, the Company’s cybersecurity risk profile and the effectiveness of its risk management strategies.
43
The Board Risk Committee reviews and receives regular briefings from the Chief Information Officer, Chief Information Security Officer (the “CISO”), Chief Technology Officer, Chief Operating Officer, Chief Risk Officer, Senior Vice President – Enterprise Information Security, Chief Audit Officer, and Chief Executive Officer on information security and technology risks, including discussions of the Company’s information security and cybersecurity risk management programs. The Board also receives regular reports on cybersecurity risks, vulnerabilities, incidents, staff security awareness training and overall progress to improve the Company’s cybersecurity risk profile.
Management’s Role in Managing Risk
Senior management is responsible for creating and recommending for approval to the Board of Directors risk appetite metrics related to cybersecurity, reflecting the aggregate levels and types of risk the Company is willing to accept in connection with the operation of our business and pursuit of our business objectives.
Primary responsibility for assessing, monitoring and managing our cybersecurity risks rests with our CISO, our Vice President – Cyber Risk Governance and our Senior Vice President – Enterprise Information Security. The management team is highly experienced in cybersecurity matters. The CISO has over 20 years of experience in cybersecurity including working at a global bank and leading cybersecurity vendors, and holds Certified Information Systems Security Professional (“CISSP”) and Certified Information Privacy Professional certifications for security and privacy, respectively. The CISO has a bachelor’s, master’s, and law degrees. The Vice President – Cyber Risk Governance has advanced degrees and certifications related to cybersecurity and over 15 years of experience with the federal government in a similar role. The Senior Vice President – Enterprise Information Security has more than 20 years of information security risk management experience, including serving as a bank CISO, and has bachelor’s and master’s degrees and holds the CISSP certification.
The CISO is responsible for developing and implementing the Company’s cybersecurity and information security program, reporting on cybersecurity matters to the Board and senior management, ensuring compliance with standards, remediating known risks, overseeing incident detection and response and leading the employee cybersecurity awareness training program. The Vice President – Cyber Risk Governance is responsible for third party cybersecurity risk management and cybersecurity risk and controls governance. The Senior Vice President – Enterprise Information Security provides regular updates to senior management and the Board’s Risk Committee regarding the effectiveness of security controls and the state of the Company’s cybersecurity program and risk level.
The Bank maintains a three lines of defense structure with the Cybersecurity Division as the primary security control owner, Enterprise Information Security providing review, assessment and challenge of risk management policies and processes, and an Internal Audit team providing independent review of the first and second lines of defense. The CISO facilitates communication across business lines to support effective and consistent information security risk identification and control infrastructure, maintaining an ongoing dialogue regarding emerging or potential cybersecurity risks, receiving updates on significant developments in the cybersecurity domain and ensuring that the Board’s oversight is proactive and responsive.
The CISO, Senior Vice President – Enterprise Information Security, and Vice President – Cyber Risk Governance regularly inform the Chief Executive Officer, the Chief Operating Officer, the Chief Risk Officer, the Chief Information Officer, the Chief Technology Officer, and the Chief Audit Officer of all concerns related to cybersecurity risks and incidents, including the status of projects to strengthen our information security systems, assessments of the information security program and the emerging threat landscape. This aims to ensure that senior management is kept up to date on the cybersecurity posture and potential risks facing the Company. Furthermore, significant cybersecurity matters and strategic risk management decisions are escalated to the Company’s Board of Directors, ensuring that they have comprehensive information and can provide oversight with respect to critical cybersecurity issues.
44
Monitoring Cybersecurity Incidents
In addition to the monitoring and reporting described above, the Company maintains an Enterprise Information Security Response Program, which includes regular monitoring of information systems through deployment of security controls designed to detect and identify threats and sets forth immediate actions to mitigate the impact of cybersecurity incidents. The Company maintains a vulnerability management program to identify and remediate critical security vulnerabilities. An after-incident report is done to review critical events so as to inform long-term strategies for remediation and prevention of future incidents.
ITEM 2. PROPERTIES
Our corporate headquarters and main branch are located at 999 Bishop Street, Honolulu, Hawaii 96813. Inclusive of our main branch, we operated 50 branch offices located on the islands of Oahu, Maui, Hawaii, Kauai, Lanai, Guam and Saipan as of December 31, 2023. We lease 30 of our branch offices and own the remainder of our offices, including our corporate headquarters and main branch which is located in the First Hawaiian Center. We believe our current facilities are adequate to meet our needs; however, we have closed and may close branches in certain circumstances.
ITEM 3. LEGAL PROCEEDINGS
We operate in a highly regulated environment. From time to time, we are a party to various litigation matters incidental to the conduct of our business. We are not presently party to any legal proceedings the resolution of which we believe would have a material adverse effect on our business, prospects, financial condition, liquidity, results of operation, cash flows, or capital levels. For additional information, see the discussion related to contingencies in “Note 17. Commitments and Contingent Liabilities” in the notes to the consolidated financial statements included in Item 8. Financial Statements and Supplementary Data.
ITEM 4. MINE SAFETY DISCLOSURES
Not applicable.
45
PART II
ITEM 5. MARKET FOR REGISTRANT’S COMMON EQUITY, RELATED STOCKHOLDER MATTERS AND ISSUER PURCHASES OF EQUITY SECURITIES
FHI’s common stock is listed on the NASDAQ under the symbol “FHB” and is quoted daily in leading financial publications.
As of February 9, 2024, there were 20 common registered shareholders of record. A registered shareholder of record is a shareholder whose share ownership in a company is recorded directly on the records of the company’s stock transfer agent. If one owns company shares through a bank, broker or other intermediary, then that shareholder is considered a “beneficial” shareholder. These holdings are considered to be held in “street name” through a bank, broker, or other intermediary and in the aggregate, are registered as a single shareholder of record.
Purchases of Equity Securities by the Issuer
There were no purchases of shares of the Company’s common stock made by or on behalf of us or any “affiliated purchaser” (as defined in Rule 10b-18(a)(3) under the Securities Exchange Act of 1934) during the three months ended December 31, 2023.
On January 24, 2024, the Company’s Board of Directors adopted a stock repurchase program for up to $40 million of its outstanding common stock during 2024. Repurchases of shares of the Company’s common stock under the stock repurchase program may be conducted through open-market purchases, which may include purchases under a trading plan adopted pursuant to Securities and Exchange Commission Rule 10b5-1, or through privately negotiated transactions. The timing and exact amount of share repurchases, if any, will be subject to management’s discretion and various factors, including the Company’s capital position and financial performance, as well as market conditions. The repurchase program may be suspended, terminated or modified at any time for any reason.
Information relating to compensation plans under which our equity securities are authorized for issuance is presented in Item 12. Security Ownership of Certain Beneficial Owners and Management and Related Stockholder Matters.
46
Performance Graph
The following graph displays the cumulative total stockholder return on our common stock based on the market price of the common stock compared to the cumulative total returns for the Standard & Poor’s (“S&P”) 500 Index and the KBW Regional Banking Index (“KRX”). The graph assumes that $100 was invested at the closing price on December 31, 2018, in our common stock, the S&P 500 Index and the KRX. The cumulative total return on each investment is as of December 31 of each subsequent five years and assumes reinvestment of dividends.
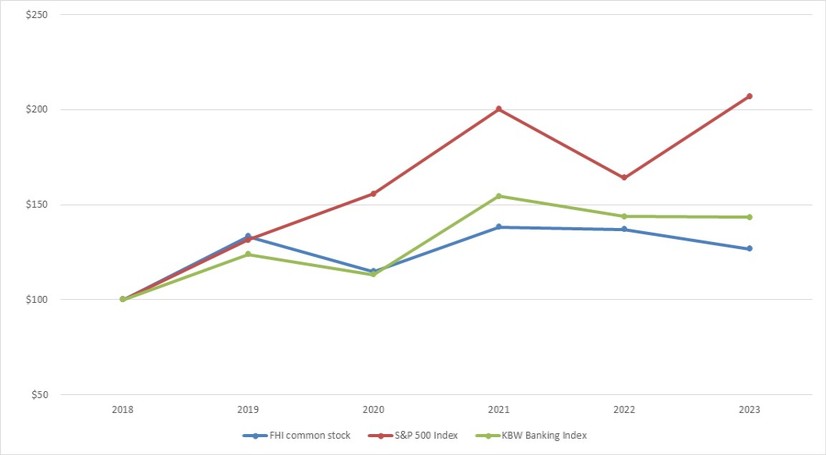
| 2018 | 2019 | 2020 | 2021 | 2022 | 2023 | ||||||||||||
First Hawaiian, Inc. Common Stock | $ | 100 | $ | 133 | $ | 115 | $ | 138 | $ | 137 | $ | 127 | ||||||
S&P 500 Index | 100 | 131 | 156 | 200 | 164 | 207 | ||||||||||||
KBW Regional Banking Index | 100 | 124 | 113 | 155 | 144 | 143 | ||||||||||||
The stock performance depicted in the graph above should not be relied upon as indicative of future performance.
ITEM 6. RESERVED
Not applicable.
47
ITEM 7. MANAGEMENT’S DISCUSSION AND ANALYSIS OF FINANCIAL CONDITION AND RESULTS OF OPERATIONS
Cautionary Note Regarding Forward-Looking Statements
This Annual Report on Form 10-K, including the documents incorporated by reference herein, contains, and from time to time our management may make, forward-looking statements within the meaning of the Private Securities Litigation Reform Act of 1995. These forward-looking statements reflect our current views with respect to, among other things, future events and our financial performance. These statements are often, but not always, made through the use of words or phrases such as “may,” “might,” “should,” “could,” “predict,” “potential,” “believe,” “expect,” “continue,” “will,” “anticipate,” “seek,” “estimate,” “intend,” “plan,” “projection,” “would,” “annualized” and “outlook,” or the negative version of those words or other comparable words or phrases of a future or forward-looking nature. These forward-looking statements are not historical facts, and are based on current expectations, estimates and projections about our industry, management's beliefs and certain assumptions made by management, many of which, by their nature, are inherently uncertain and beyond our control. Accordingly, we caution you that any such forward-looking statements are not guarantees of future performance and are subject to risks, assumptions, estimates and uncertainties that are difficult to predict. Although we believe that the expectations reflected in these forward-looking statements are reasonable as of the date made, actual results may prove to be materially different from the results expressed or implied by the forward-looking statements.
A number of important factors could cause our actual results to differ materially from those indicated in these forward-looking statements, including the following: the geographic concentration of our business; current and future market and economic conditions generally or in Hawaii, Guam and Saipan in particular, including inflationary pressures and interest rate environment; our dependence on the real estate markets in which we operate; concentrated exposures to certain asset classes and individual obligors; the effect of changes in interest rates on our business, including our net interest income, net interest margin, the fair value of our investment securities, and our mortgage loan originations, mortgage servicing rights and mortgage loans held for sale; the future value of the investment securities that we own; the possibility of a deterioration in credit quality in our portfolio; the possibility we might underestimate the credit losses inherent in our loan and lease portfolio; our ability to attract and retain customer deposits; our inability to receive dividends from our bank, pay dividends to our common stockholders and satisfy obligations as they become due; our access to sources of liquidity and capital to address our liquidity needs; our ability to attract and retain skilled employees or changes in our management personnel; our ability to maintain our Bank's reputation; the failure to properly use and protect our customer and employee information and data; the possibility of employee misconduct or mistakes; the effectiveness of our risk management and internal disclosure controls and procedures; our ability to keep pace with technological changes; any failure or interruption of our information and communications systems; our ability to effectively compete with other financial services companies and the effects of competition in the financial services industry on our business; our ability to identify and address cybersecurity risks; the occurrence of fraudulent activity or effect of a material breach of, or disruption to, the security of any of our or our vendors’ systems; our ability to successfully develop and commercialize new or enhanced products and services; changes in the demand for our products and services; risks associated with the sale of loans and with our use of appraisals in valuing and monitoring loans; the possibility that actual results may differ from estimates and forecasts; fluctuations in the fair value of our assets and liabilities and off-balance sheet exposures; the effects of the failure of any component of our business infrastructure provided by a third party; the potential for environmental liability; the risk of being subject to litigation and the outcome thereof; the impact of, and changes in, applicable laws, regulations and accounting standards and policies; possible changes in trade, monetary and fiscal policies of, and other activities undertaken by, governments, agencies, central banks and similar organizations; the effects of severe weather, geopolitical instability, including war, terrorist attacks, pandemics or other severe health emergencies and man-made natural disasters; our ability to maintain consistent growth, earnings and profitability; the impact of any pandemic, epidemic or health-related crisis; our likelihood of success in, and the impact of, litigation or regulatory actions; our ability to continue to pay dividends on our common stock; contingent liabilities and unexpected tax liabilities that may be applicable to us as a result of the Reorganization Transactions; and damage to our reputation from any of the factors described above.
48
The foregoing factors should not be considered an exhaustive list and should be read together with the other cautionary statements set forth under “Item 1A. Risk Factors” in this Annual Report on Form 10-K. If one or more events related to these or other risks or uncertainties materialize, or if our underlying assumptions prove to be incorrect, actual results may differ materially from what we anticipate. Accordingly, you should not place undue reliance on any such forward-looking statements. Any forward-looking statement speaks only as of the date on which it is made, and we do not undertake any obligation to update or review any forward-looking statement, whether as a result of new information, future developments or otherwise, except as required by applicable law.
Company Overview
FHI, a bank holding company, owns 100% of the outstanding common stock of FHB. FHB was founded in 1858 under the name Bishop & Company and was the first successful banking partnership in the Kingdom of Hawaii and the second oldest bank formed west of the Mississippi River.
As of December 31, 2023, we were the largest full-service bank headquartered in Hawaii as measured by assets, loans and leases, deposits and net income. As of December 31, 2023, we had $24.9 billion of assets, $14.4 billion of gross loans and leases and $21.3 billion of deposits. We also generated $235.0 million of net income or diluted earnings per share of $1.84 per share for the year ended December 31, 2023. We operate our business through three operating segments: Retail Banking, Commercial Banking and Treasury and Other. See “Note 22. Reportable Operating Segments” in the notes to the consolidated financial statements included in Item 8. Financial Statements and Supplementary Data for more information.
Hawaii Economy
Hawaii’s economy reflects some decline during the year ended December 31, 2023 but remains relatively resilient in the wake of the wildfires that affected the island of Maui in early August and high consumer prices. According to the State of Hawaii Department of Labor and Industrial Relations, the statewide seasonally adjusted unemployment rate decreased to 2.9% at December 31, 2023, compared to 3.2% at December 31, 2022. Nationally, the seasonally adjusted unemployment rate was 3.7% at December 31, 2023 compared to 3.5% at December 31, 2022.
Visitor arrivals to Maui are slowly increasing as West Maui (with the exception of Lahaina Town) reopened to tourism, with visitors in December 2023 at a 75% increase as compared to August 2023. Domestic visitor arrivals for the entire state continue to remain strong. The average daily domestic passenger counts for the twelve months of 2023 were approximately 4.4% higher than the average daily passenger counts during the twelve months of 2022, according to the Hawaii Tourism Authority.
The housing market has slowed compared to the prior year but is still trending upwards overall. Both volume of real estate sales and housing prices decreased when comparing the twelve months of 2023 with the twelve months of 2022. According to the Honolulu Board of Realtors, the volume of single-family home sales decreased by 26.3%, while condominium sales decreased by 28%, as compared to the same period in 2022. The median price of a single-family home sold on Oahu in the twelve months of 2023 was $1,050,000, a decrease of 5.0% from the same period in 2022, but an increase of 6.1% from the same period in 2021. The median price of a condominium sold on Oahu in the twelve months of 2023 was $508,500, a decrease of 0.3% from the same period in 2022, but an increase of 7.1% from the same period in 2021. As of December 31, 2023, months of inventory of single-family homes and condominiums on Oahu remained low at approximately 2.8 and 3.2 months, respectively.
State general excise and use tax revenues increased by 4.9% for the year ended December 31, 2023 as compared to the same period in 2022, according to the Hawaii Department of Business, Economic Development & Tourism.
49
Effect of Recent Natural Disasters
In early August of 2023, wildfires swept across several areas of Maui, impacting residents in upcountry Maui and devastating the historic town of Lahaina. Relief efforts from across the State of Hawaii commenced and continue to this day to aid those who have lost their homes, businesses, and loved ones. We have contributed $250,000 to the Hawaii Community Foundation’s Maui Strong Fund, granted loan payment deferrals for our borrowers affected by the wildfires, waived all ATM fees on Maui, and assisted affected employees with financial aid for temporary housing. Our operations on Maui also recovered quickly. Although the Lahaina branch and ATM were fully burned down, our vault withstood the fire and we were able to account for safe deposit box contents and return them to our customers. The remaining branches in Maui have remained fully operational and we are in process of re-opening a temporary location for the Lahaina branch.
The outstanding balance of real estate-secured loans in the Maui fire zones totaled approximately $112 million as of December 31, 2023. We require our borrowers to maintain adequate levels of insurance, including fire insurance on residential mortgages. We do not currently know how long it will be before rebuilding can start, the amounts of available insurance coverage, the availability of government assistance for our borrowers in the long run or whether our borrowers’ longer-term ability to repay their loans has been diminished. There was no exposure to the electric utility as of December 31, 2023.
We expect that the aftermath of the wildfires will continue to impact commercial activity throughout the island of Maui, but there remains much uncertainty as to how long it will take Maui to rebuild, return tourism to historic levels, and recover economically. Since there is significant uncertainty with respect to the full extent of the negative impacts due to the nature of the wildfires, the Company’s estimates concerning the impact of the wildfires, including those with respect to the loan portfolio potentially impacted, are based on judgment as of the date of this report and subject to change as conditions evolve. We will continue to closely monitor the impact that the wildfires has on our customers and will adjust the means by which we assist our customers during this period of financial and emotional hardship.
Effect of Inflation, Interest Rates and Changing Prices
The consolidated financial statements and related financial data presented in this Form 10-K have been prepared according to generally accepted accounting principles in the United States, which require the measurement of financial positions and operating results in terms of historical dollars without considering the change in the relative purchasing power of money over time due to inflation.
Although inflation is no longer rising as quickly as it did in previous periods, prices remain high due to, among other factors, continued global supply chain disruptions, changes in the labor market and geopolitical tensions.
The closures and adverse developments affecting certain banks in the first half of 2023 resulted in heightened levels of market activity and volatility, as well as the potential for increased regulation and more stringent capital requirements going forward. In response to the deterioration in the operating environment and funding conditions for U.S. banks, in April 2023, Moody’s lowered the macro profile of the U.S. banking system and downgraded the credit ratings of the Bank, among other regional banks.
In November 2023, the FDIC approved the final rule on a special assessment to replenish the deposit insurance fund following the recent bank failures. The Company fully recognized the special assessment in the fourth quarter of 2023. In light of the ongoing volatility in the capital markets and economic disruptions, we continue to carefully monitor our capital and liquidity positions.
As of December 31, 2023, the Company was “well-capitalized” and met all applicable regulatory capital requirements, including a Common Equity Tier 1 capital ratio of 12.39%, compared to the minimum requirement of 4.50%. For additional discussions regarding our capital and liquidity positions and related risks, refer to the sections titled “Liquidity and Capital Resources” and “Capital” in this MD&A.
Other key factors could impact our profitability in future reporting periods. See Item 1A. Risk Factors, beginning in the section captioned “Summary of Risk Factors.”
50
Selected Financial Data:
Our financial highlights for the years indicated are presented in Table 1:
Financial Highlights | Table 1 | ||||||||
For the Year Ended | |||||||||
December 31, | |||||||||
(dollars in thousands, except per share data) | 2023 |
| 2022 |
| 2021 |
| |||
Income Statement Data: | |||||||||
Interest income | $ | 923,579 | $ | 663,220 | $ | 549,311 | |||
Interest expense | 287,452 | 49,671 | 18,752 | ||||||
Net interest income | 636,127 | 613,549 | 530,559 | ||||||
Provision for credit losses | 26,630 | 1,392 | (39,000) | ||||||
Net interest income after provision for credit losses | 609,497 | 612,157 | 569,559 | ||||||
Noninterest income | 200,815 | 179,525 | 184,916 | ||||||
Noninterest expense | 501,138 | 440,471 | 405,479 | ||||||
Income before provision for income taxes | 309,174 | 351,211 | 348,996 | ||||||
Provision for income taxes | 74,191 | 85,526 | 83,261 | ||||||
Net income | $ | 234,983 | $ | 265,685 | $ | 265,735 | |||
Basic earnings per share | $ | 1.84 | $ | 2.08 | $ | 2.06 | |||
Diluted earnings per share | $ | 1.84 | $ | 2.08 | $ | 2.05 | |||
Basic weighted-average outstanding shares | 127,567,547 | 127,489,889 | 128,963,131 | ||||||
Diluted weighted-average outstanding shares | 127,915,873 | 127,981,699 | 129,537,922 | ||||||
Dividends declared per share | $ | 1.04 | $ | 1.04 | $ | 1.04 | |||
Dividend payout ratio | 56.52 | % | 50.00 | % | 50.73 | % | |||
Other Financial Information / Performance Ratios: | |||||||||
Net interest margin | 2.92 | % | 2.78 | % | 2.43 | % | |||
Efficiency ratio | 59.48 | % | 55.20 | % | 56.45 | % | |||
Return on average total assets | 0.95 | % | 1.06 | % | 1.09 | % | |||
Return on average tangible assets (non-GAAP)(1) | 0.99 | % | 1.11 | % | 1.13 | % | |||
Return on average total stockholders' equity | 10.01 | % | 11.44 | % | 9.81 | % | |||
Return on average tangible stockholders' equity (non-GAAP)(1) | 17.39 | % | 20.03 | % | 15.51 | % | |||
Noninterest expense to average assets | 2.04 | % | 1.76 | % | 1.66 | % | |||
December 31, | |||||||
(dollars in thousands, except per share data) |
| 2023 | 2022 | ||||
Balance Sheet Data: | |||||||
Cash and cash equivalents | $ | 1,739,897 | $ | 526,624 | |||
Investment securities available-for-sale | 2,255,336 | 3,151,133 | |||||
Investment securities held-to-maturity | 4,041,449 | 4,320,639 | |||||
Loans and leases | 14,353,497 | 14,092,012 | |||||
Allowance for credit losses for loans and leases | 156,533 | 143,900 | |||||
Goodwill | 995,492 | 995,492 | |||||
Total assets | 24,926,474 | 24,577,223 | |||||
Total deposits | 21,332,657 | 21,689,029 | |||||
Short-term borrowings | 500,000 | 75,000 | |||||
Total liabilities | 22,440,408 | 22,308,218 | |||||
Total stockholders' equity | 2,486,066 | 2,269,005 | |||||
Book value per share | $ | 19.48 | $ | 17.82 | |||
Tangible book value per share (non-GAAP)(1) | $ | 11.68 | $ | 10.00 | |||
Asset Quality Ratios: | |||||||
Non-accrual loans and leases / total loans and leases | 0.13 | % | 0.08 | % | |||
Allowance for credit losses for loans and leases / total loans and leases | 1.09 | % | 1.02 | % | |||
Net charge-offs / average total loans and leases | 0.09 | % | 0.08 | % | |||
51
December 31, | December 31, | ||||||
Capital Ratios: |
| 2023 | 2022 | ||||
Common Equity Tier 1 Capital Ratio |
| 12.39 | % |
| 11.82 | % | |
Tier 1 Capital Ratio | 12.39 | % | 11.82 | % | |||
Total Capital Ratio | 13.57 | % | 12.92 | % | |||
Tier 1 Leverage Ratio | 8.64 | % | 8.11 | % | |||
Total stockholders' equity to total assets | 9.97 | % | 9.23 | % | |||
Tangible stockholders' equity to tangible assets (non-GAAP)(1) | 6.23 | % | 5.40 | % | |||
| (1) | Return on average tangible assets, return on average tangible stockholders’ equity, tangible book value per share and tangible stockholders’ equity to tangible assets are non-GAAP financial measures. We compute our return on average tangible assets as the ratio of net income to average tangible assets. We compute our return on average tangible stockholders’ equity as the ratio of net income to average tangible stockholders’ equity. We compute our tangible book value per share as the ratio of tangible stockholders’ equity to outstanding shares. We compute our tangible stockholders’ equity to tangible assets as the ratio of tangible stockholders’ equity to tangible assets. We believe that these financial measures are useful for investors, regulators, management and others to evaluate financial performance and capital adequacy relative to other financial institutions. Although these non-GAAP financial measures are frequently used by shareholders in the evaluation of a company, they have limitations as analytical tools and should not be considered in isolation or as a substitute for analyses of results as reported under GAAP. |
52
The following table provides a reconciliation of these non-GAAP financial measures with their most closely related GAAP measures for the years indicated:
GAAP to Non-GAAP Reconciliation | Table 2 | |||||||||
For the Years Ended | ||||||||||
December 31, | ||||||||||
(dollars in thousands) |
| 2023 |
| 2022 |
| 2021 |
| |||
Income Statement Data: | ||||||||||
Noninterest expense | $ | 501,138 | $ | 440,471 | $ | 405,479 | ||||
Net income | $ | 234,983 | $ | 265,685 | $ | 265,735 | ||||
Average total stockholders' equity | $ | 2,346,713 | $ | 2,321,606 | $ | 2,708,370 | ||||
Less: average goodwill | 995,492 | 995,492 | 995,492 | |||||||
Average tangible stockholders' equity | $ | 1,351,221 | $ | 1,326,114 | $ | 1,712,878 | ||||
Average total assets | $ | 24,625,445 | $ | 24,964,422 | $ | 24,426,258 | ||||
Less: average goodwill | 995,492 | 995,492 | 995,492 | |||||||
Average tangible assets | $ | 23,629,953 | $ | 23,968,930 | $ | 23,430,766 | ||||
Return on average total stockholders' equity | 10.01 | % | 11.44 | % | 9.81 | % | ||||
Return on average tangible stockholders' equity (non-GAAP) | 17.39 | % | 20.03 | % | 15.51 | % | ||||
Return on average total assets | 0.95 | % | 1.06 | % | 1.09 | % | ||||
Return on average tangible assets (non-GAAP) | 0.99 | % | 1.11 | % | 1.13 | % | ||||
Noninterest expense to average assets | 2.04 | % | 1.76 | % | 1.66 | % | ||||
December 31, | ||||||
(dollars in thousands, except per share data) | 2023 | 2022 | ||||
Balance Sheet Data: | ||||||
Total stockholders' equity | $ | 2,486,066 | $ | 2,269,005 | ||
Less: goodwill | 995,492 | 995,492 | ||||
Tangible stockholders' equity | $ | 1,490,574 | $ | 1,273,513 | ||
Total assets | $ | 24,926,474 | $ | 24,577,223 | ||
Less: goodwill | 995,492 | 995,492 | ||||
Tangible assets | $ | 23,930,982 | $ | 23,581,731 | ||
Shares outstanding | 127,618,761 | 127,363,327 | ||||
Total stockholders' equity to total assets | 9.97 | % | 9.23 | % | ||
Tangible stockholders' equity to tangible assets (non-GAAP) | 6.23 | % | 5.40 | % | ||
Book value per share | $ | 19.48 | $ | 17.82 | ||
Tangible book value per share (non-GAAP) | $ | 11.68 | $ | 10.00 | ||
Financial Highlights
Net income was $235.0 million for the year ended December 31, 2023, a decrease of $30.7 million or 12% as compared to 2022. Basic and diluted earnings per share were both $1.84 per share for the year ended December 31, 2023, a decrease of $0.24 per share or 12% as compared to 2022. The decrease in net income was primarily due to a $60.7 million increase in noninterest expense and a $25.2 million increase in the provision for credit losses (the “Provision”). This was partially offset by a $22.6 million increase in net interest income, a $21.3 million increase in noninterest income and an $11.3 million decrease in the provision for income taxes.
53
Net income was $265.7 million for the year ended December 31, 2022, a decrease of $0.1 million as compared to 2021. Basic earnings per share was $2.08 per share for the year ended December 31, 2022, an increase of $0.02 per share or 1% as compared to 2021. Diluted earnings per share was $2.08 for the year ended December 31, 2022, an increase of $0.03 or 1% as compared to 2021. Net income includes a $83.0 million increase in net interest income driven by the rising interest rate environment. The decrease in net income was primarily due to a $35.0 million increase in noninterest expense, a $5.4 million decrease in noninterest income, a $2.3 million increase in the provision for income taxes and a Provision of $1.4 million for the year ended December 31, 2022, compared to a negative Provision of $39.0 million for the year ended December 31, 2021.
Our return on average total assets was 0.95% for the year ended December 31, 2023, a decrease of 11 basis points as compared to 2022, and our return on average total stockholders’ equity was 10.01% for the year ended December 31, 2023, a decrease of 143 basis points as compared to 2022. Our return on average tangible assets was 0.99% for the year ended December 31, 2023, a decrease of 12 basis points as compared to 2022, and our return on average tangible stockholders’ equity was 17.39% for the year ended December 31, 2023, a decrease of 264 basis points as compared to 2022. Our efficiency ratio was 59.48% for the year ended December 31, 2023 as compared to 55.20% in 2022. Return on average tangible assets and return on average tangible stockholders’ equity are non-GAAP financial measures. For a reconciliation to the most directly comparable GAAP financial measures for return on average tangible assets and return on average tangible stockholders’ equity, see Table 2, GAAP to Non-GAAP Reconciliation.
Our return on average total assets was 1.06% for the year ended December 31, 2022, a decrease of three basis points as compared to 2021, and our return on average total stockholders’ equity was 11.44% for the year ended December 31, 2022, an increase of 163 basis points as compared to 2021. Our return on average tangible assets was 1.11% for the year ended December 31, 2022, a decrease of two basis points as compared to 2021, and our return on average tangible stockholders’ equity was 20.03% for the year ended December 31, 2022, an increase of 452 basis points as compared to 2021. Our efficiency ratio was 55.20% for the year ended December 31, 2022 as compared to 56.45% in 2021. Return on average tangible assets and return on average tangible stockholders’ equity are non-GAAP financial measures. For a reconciliation to the most directly comparable GAAP financial measures for return on average tangible assets and return on average tangible stockholders’ equity, see Table 2, GAAP to Non-GAAP Reconciliation.
Our results for the December 31, 2023 were highlighted by the following:
| ● | Net interest income was $636.1 million for the year ended December 31, 2023, an increase of $22.6 million or 4% as compared to 2022. Our net interest margin was 2.92% for the year ended December 31, 2023, an increase of 14 basis points as compared to 2022. The increase in net interest income was primarily due to higher yields and average balances in our loan and lease portfolio and higher yields on interest-bearing deposits in other banks, primarily attributable to the rising interest rate environment in the period. This was partially offset by higher deposit funding costs and higher borrowing costs. |
| ● | The Provision was $26.6 million for the year ended December 31, 2023, an increase of $25.2 million as compared to 2022. The Provision of $26.6 million for the year ended December 31, 2023, was primarily due to increases in the provision for consumer loans, construction loans, commercial and industrial loans, residential mortgage loans and commercial real estate loans and the provision for unfunded commercial and industrial and construction commitments. This was partially offset by a decrease in the provision for unfunded home equity line commitments. The Provision is recorded to maintain the ACL and the reserve for unfunded commitments at levels deemed adequate to absorb lifetime expected credit losses in our loan and lease portfolio and unfunded loan and lease commitments as of the balance sheet date. |
| ● | Noninterest income was $200.8 million for the year ended December 31, 2023, an increase of $21.3 million or 12% as compared to 2022. The increase was primarily due to a $14.1 million increase in bank-owned life insurance (“BOLI”) income, a $5.5 million increase in other noninterest income, a $2.0 million increase in trust and investment services income, a $0.8 million increase in service charges on deposits accounts and a $0.8 million increase in net gains on the sale of investment securities, partially offset by a $2.1 million decrease in credit and debit card fees. |
54
| ● | Noninterest expense was $501.1 million for the year ended December 31, 2023, an increase of $60.7 million or 14% as compared to 2022. The increase in noninterest expense was primarily due to a $26.6 million increase in salaries and employee benefits, a $22.5 million increase in regulatory assessment and fees, a $10.6 million increase in equipment expense and a $5.7 million increase in other noninterest expense. This was partially offset by a $3.6 million decrease in contracted services and professional fees and a $1.4 million decrease in occupancy expense. |
Our results for the year ended December 31, 2022 were highlighted by the following:
| ● | Net interest income was $613.5 million for the year ended December 31, 2022, an increase of $83.0 million or 16% as compared to 2021. Our net interest margin was 2.78% for the year ended December 31, 2022, an increase of 35 basis points as compared to 2021. The increase in net interest income was primarily due to higher yields in most loan categories, higher yields and average balances in our investment securities portfolio and higher yields on interest-bearing deposits in other banks, primarily attributable to the rising interest rate environment in the period. This was partially offset by higher deposit funding costs. |
| ● | The Provision was $1.4 million for the year ended December 31, 2022, compared to a negative Provision of $39.0 million for the year ended December 31, 2021. The negative Provision in 2021 was primarily due to lower expected credit losses as a result of the economic recovery and easing of restrictions related to the COVID-19 pandemic and the impact of the pandemic on Hawaii’s economy, key industries, businesses and our customers. The Provision is recorded to maintain the ACL and the reserve for unfunded commitments at levels deemed adequate to absorb lifetime expected credit losses in our loan and lease portfolio and unfunded loan and lease commitments as of the balance sheet date. |
| ● | Noninterest income was $179.5 million for the year ended December 31, 2022, a decrease of $5.4 million or 3% as compared to 2021. The decrease was primarily due to an $11.9 million decrease in bank-owned life insurance (“BOLI”) income and a $1.5 million decrease in other service charges and fees. This was partially offset by a $2.7 million increase in other noninterest income, a $2.4 million increase in credit and debit card fees, a $1.7 million increase in trust and investment services income and a $1.3 million increase in service charges on deposit accounts. |
| ● | Noninterest expense was $440.5 million for the year ended December 31, 2022, an increase of $35.0 million or 9% as compared to 2021. The increase in noninterest expense was primarily due to a $16.7 million increase in salaries and employee benefits, a $9.8 million increase in equipment expense, a $6.7 million increase in contracted services and professional fees, a $5.7 million increase in card rewards program expenses, a $1.9 million increase in advertising and marketing expense, a $1.7 million increase in occupancy expense and a $1.4 million increase in regulatory assessment and fees. This was partially offset by an $8.9 million decrease in other noninterest expense. |
Balance sheet highlights consisted of the following:
| ● | Total loans and leases were $14.4 billion as of December 31, 2023, an increase of $261.5 million or 2% as compared to December 31, 2022. This increase was primarily due to increases in commercial real estate loans, residential real estate loans, lease financing and construction loans, partially offset by decreases in consumer loans and commercial and industrial loans. |
| ● | The ACL was $156.5 million as of December 31, 2023, an increase of $12.6 million or 9% from December 31, 2022. The ratio of our ACL to total loans and leases outstanding was 1.09% as of December 31, 2023, an increase of seven basis points compared to December 31, 2022. The overall level of the ACL was commensurate with our stable credit risk profile, loan portfolio growth and composition and a stable Hawaii economy. |
55
| ● | Our investment portfolio is comprised of high-grade investment securities, primarily collateralized mortgage obligations issued by the Government National Mortgage Association (“Ginnie Mae”), the Federal National Mortgage Association (“Fannie Mae”) and the Federal Home Loan Mortgage Corporation (“Freddie Mac”) and mortgage-backed securities issued by Ginnie Mae, Freddie Mac, Fannie Mae, Municipal Housing Authorities and non-agency entities. The total carrying value of our investment securities portfolio was $6.3 billion as of December 31, 2023, a decrease of $1.2 billion or 16% from December 31, 2022. The decrease in investment securities was driven by sales, maturities and payments during the year ended December 31, 2023, which was used to fund loan growth and offset a decline in deposits. |
| ● | Total deposits were $21.3 billion as of December 31, 2023, a decrease of $356.4 million or 2% from December 31, 2022. This decrease was primarily due to a $1.3 billion decrease in demand deposits and a $117.6 million decrease in money market deposit balances, partially offset by a $980.1 million increase in time deposit balances and a $62.2 million increase in savings deposit balances. |
| ● | Total borrowings consisted of $500.0 million of short-term borrowings as of December 31, 2023, compared to $75.0 million of short-term borrowings as of December 31, 2022. For information with respect to the financial terms of such advances, see “ – Analysis of Financial Condition – Short-term Borrowings.” |
| ● | Total stockholders’ equity was $2.5 billion as of December 31, 2023, an increase of $217.1 million or 10% from December 31, 2022. This increase was primarily due to earnings for the year ended December 31, 2023 of $235.0 million and a $109.0 million increase in accumulated other comprehensive income, net of tax, partially offset by dividends declared and paid to the Company’s stockholders of $132.6 million. |
Analysis of Results of Operations
Net Interest Income
For the years ended December 31, 2023, 2022, and 2021, average balances, related income and expenses, on a fully taxable-equivalent basis, and resulting yields and rates are presented in Table 3. An analysis of the change in net interest income, on a fully taxable-equivalent basis, is presented in Table 4.
56
Average Balances and Interest Rates | Table 3 | |||||||||||||||||||||||||
Year Ended | Year Ended | Year Ended | ||||||||||||||||||||||||
December 31, 2023 | December 31, 2022 | December 31, 2021 | ||||||||||||||||||||||||
Average | Income/ | Yield/ | Average | Income/ | Yield/ | Average | Income/ | Yield/ | ||||||||||||||||||
(dollars in millions) |
| Balance |
| Expense |
| Rate |
| Balance |
| Expense |
| Rate |
| Balance |
| Expense |
| Rate |
| |||||||
Earning Assets |
|
|
|
|
|
|
|
|
|
| ||||||||||||||||
Interest-Bearing Deposits in Other Banks | $ | 512.3 | $ | 26.5 | 5.18 | % | $ | 867.6 | $ | 10.3 | 1.19 | % | $ | 1,723.0 | $ | 2.3 | 0.14 | % | ||||||||
Available-for-Sale Investment Securities | ||||||||||||||||||||||||||
Taxable | 2,871.8 | 73.8 | 2.57 | 4,650.1 | 83.2 | 1.79 | 6,608.9 | 93.3 | 1.41 | |||||||||||||||||
Non-Taxable | 10.2 | 0.6 | 5.55 | 180.0 | 4.9 | 2.74 | 481.9 | 10.2 | 2.12 | |||||||||||||||||
Held-to-Maturity Investment Securities | ||||||||||||||||||||||||||
Taxable | 3,579.0 | 60.7 | 1.70 | 2,728.2 | 45.5 | 1.67 | — | — | — | |||||||||||||||||
Non-Taxable | 607.7 | 15.9 | 2.61 | 460.6 | 12.5 | 2.71 | — | — | — | |||||||||||||||||
Total Investment Securities | 7,068.7 | 151.0 | 2.14 | 8,018.9 | 146.1 | 1.82 | 7,090.8 | 103.5 | 1.46 | |||||||||||||||||
Loans Held for Sale | 0.4 | — | 6.63 | 0.6 | — | 3.14 | 3.6 | 0.1 | 2.24 | |||||||||||||||||
Loans and Leases(1) | ||||||||||||||||||||||||||
Commercial and industrial | 2,182.3 | 141.0 | 6.46 | 2,019.5 | 78.4 | 3.88 | 2,586.8 | 82.2 | 3.18 | |||||||||||||||||
Commercial real estate | 4,257.9 | 266.0 | 6.25 | 3,895.3 | 153.2 | 3.93 | 3,456.7 | 101.6 | 2.94 | |||||||||||||||||
Construction | 877.7 | 62.1 | 7.08 | 755.0 | 32.5 | 4.30 | 804.5 | 25.4 | 3.16 | |||||||||||||||||
Residential: | ||||||||||||||||||||||||||
Residential mortgage | 4,308.0 | 156.4 | 3.63 | 4,200.2 | 145.5 | 3.46 | 3,836.6 | 138.3 | 3.60 | |||||||||||||||||
Home equity line | 1,131.1 | 39.3 | 3.47 | 965.0 | 26.5 | 2.75 | 834.3 | 22.2 | 2.66 | |||||||||||||||||
Consumer | 1,178.6 | 71.5 | 6.07 | 1,218.9 | 65.3 | 5.35 | 1,275.5 | 67.8 | 5.31 | |||||||||||||||||
Lease financing | 330.7 | 14.1 | 4.26 | 260.9 | 9.7 | 3.69 | 239.9 | 7.6 | 3.14 | |||||||||||||||||
Total Loans and Leases | 14,266.3 | 750.4 | 5.26 | 13,314.8 | 511.1 | 3.84 | 13,034.3 | 445.1 | 3.42 | |||||||||||||||||
Other Earning Assets | 104.3 | 1.3 | 1.20 | 70.9 | 0.6 | 0.89 | 69.4 | 1.1 | 1.54 | |||||||||||||||||
Total Earning Assets(2) | 21,952.0 | 929.2 | 4.23 | 22,272.8 | 668.1 | 3.00 | 21,921.1 | 552.1 | 2.52 | |||||||||||||||||
Cash and Due from Banks | 265.1 | 289.0 | 289.3 | |||||||||||||||||||||||
Other Assets | 2,408.3 | 2,402.6 | 2,215.9 | |||||||||||||||||||||||
Total Assets | $ | 24,625.4 | $ | 24,964.4 | $ | 24,426.3 | ||||||||||||||||||||
Interest-Bearing Liabilities | ||||||||||||||||||||||||||
Interest-Bearing Deposits | ||||||||||||||||||||||||||
Savings | $ | 6,124.7 | $ | 71.5 | 1.17 | % | $ | 6,741.5 | $ | 19.2 | 0.29 | % | $ | 6,581.1 | $ | 2.5 | 0.04 | % | ||||||||
Money Market | 3,869.1 | 86.1 | 2.22 | 4,068.8 | 16.6 | 0.41 | 3,831.4 | 2.1 | 0.05 | |||||||||||||||||
Time | 3,040.0 | 100.6 | 3.31 | 1,826.7 | 13.4 | 0.73 | 2,005.0 | 9.3 | 0.47 | |||||||||||||||||
Total Interest-Bearing Deposits | 13,033.8 | 258.2 | 1.98 | 12,637.0 | 49.2 | 0.39 | 12,417.5 | 13.9 | 0.11 | |||||||||||||||||
Federal Funds Purchased | 17.2 | 0.8 | 4.45 | 11.5 | 0.5 | 4.08 | — | — | — | |||||||||||||||||
Other Short-Term Borrowings | 261.9 | 13.0 | 4.98 | — | — | — | — | — | — | |||||||||||||||||
Long-Term Borrowings | 261.6 | 12.5 | 4.78 | — | — | — | 177.5 | 4.9 | 2.76 | |||||||||||||||||
Other Interest-Bearing Liabilities | 57.1 | 3.0 | 5.15 | — | — | — | — | — | — | |||||||||||||||||
Total Interest-Bearing Liabilities | 13,631.6 | 287.5 | 2.11 | 12,648.5 | 49.7 | 0.39 | 12,595.0 | 18.8 | 0.15 | |||||||||||||||||
Net Interest Income | $ | 641.7 | $ | 618.4 | $ | 533.3 | ||||||||||||||||||||
Interest Rate Spread(3) | 2.12 | % | 2.61 | % | 2.37 | % | ||||||||||||||||||||
Net Interest Margin(4) | 2.92 | % | 2.78 | % | 2.43 | % | ||||||||||||||||||||
Noninterest-Bearing Demand Deposits | 8,126.4 | 9,421.5 | 8,594.1 | |||||||||||||||||||||||
Other Liabilities | 520.7 | 572.8 | 528.8 | |||||||||||||||||||||||
Stockholders' Equity | 2,346.7 | 2,321.6 | 2,708.4 | |||||||||||||||||||||||
Total Liabilities and Stockholders' Equity | $ | 24,625.4 | $ | 24,964.4 | $ | 24,426.3 | ||||||||||||||||||||
| (1) | Non-performing loans and leases are included in the respective average loan and lease balances. Income, if any, on such loans and leases is recognized on a cash basis. |
| (2) | Interest income includes taxable-equivalent basis adjustments of $5.6 million, $4.9 million and $2.8 million for the years ended December 31, 2023, 2022 and 2021, respectively. |
| (3) | Interest rate spread is the difference between the average yield on earning assets and the average rate paid on interest-bearing liabilities, on a fully taxable-equivalent basis. |
| (4) | Net interest margin is net interest income, on a fully taxable-equivalent basis, divided by average total earning assets. |
57
Analysis of Change in Net Interest Income | Table 4 | |||||||||||||||||
Year Ended December 31, 2023 | Year Ended December 31, 2022 | |||||||||||||||||
Compared to December 31, 2022 | Compared to December 31, 2021 | |||||||||||||||||
(dollars in millions) |
| Volume |
| Rate |
| Total(1) |
| Volume |
| Rate |
| Total(1) | ||||||
Change in Interest Income: | ||||||||||||||||||
Interest-Bearing Deposits in Other Banks | $ | (5.8) | $ | 22.0 | $ | 16.2 | $ | (1.7) | $ | 9.7 | $ | 8.0 | ||||||
Available-for-Sale Investment Securities | ||||||||||||||||||
Taxable | (38.3) | 28.9 | (9.4) | (31.6) | 21.5 | (10.1) | ||||||||||||
Non-Taxable | (6.9) | 2.6 | (4.3) | (7.7) | 2.4 | (5.3) | ||||||||||||
Held-to-Maturity Investment Securities | ||||||||||||||||||
Taxable | 14.4 | 0.8 | 15.2 | 45.5 | — | 45.5 | ||||||||||||
Non-Taxable | 3.9 | (0.5) | 3.4 | 12.5 | — | 12.5 | ||||||||||||
Total Investment Securities | (26.9) | 31.8 | 4.9 | 18.7 | 23.9 | 42.6 | ||||||||||||
Loans Held for Sale | — | — | — | (0.1) | — | (0.1) | ||||||||||||
Loans and Leases | ||||||||||||||||||
Commercial and industrial | 6.8 | 55.8 | 62.6 | (20.0) | 16.2 | (3.8) | ||||||||||||
Commercial real estate | 15.4 | 97.4 | 112.8 | 14.1 | 37.5 | 51.6 | ||||||||||||
Construction | 5.9 | 23.7 | 29.6 | (1.6) | 8.7 | 7.1 | ||||||||||||
Residential: | ||||||||||||||||||
Residential mortgage | 3.7 | 7.2 | 10.9 | 12.7 | (5.5) | 7.2 | ||||||||||||
Home equity line | 5.1 | 7.7 | 12.8 | 3.5 | 0.8 | 4.3 | ||||||||||||
Consumer | (2.3) | 8.5 | 6.2 | (3.0) | 0.5 | (2.5) | ||||||||||||
Lease financing | 2.8 | 1.6 | 4.4 | 0.7 | 1.4 | 2.1 | ||||||||||||
Total Loans and Leases | 37.4 | 201.9 | 239.3 | 6.4 | 59.6 | 66.0 | ||||||||||||
Other Earning Assets | 0.4 | 0.3 | 0.7 | — | (0.5) | (0.5) | ||||||||||||
Total Change in Interest Income | 5.1 | 256.0 | 261.1 | 23.3 | 92.7 | 116.0 | ||||||||||||
Change in Interest Expense: | ||||||||||||||||||
Interest-Bearing Deposits | ||||||||||||||||||
Savings | (1.9) | 54.2 | 52.3 | — | 16.7 | 16.7 | ||||||||||||
Money Market | (0.9) | 70.4 | 69.5 | 0.1 | 14.4 | 14.5 | ||||||||||||
Time | 13.8 | 73.4 | 87.2 | (0.8) | 4.9 | 4.1 | ||||||||||||
Total Interest-Bearing Deposits | 11.0 | 198.0 | 209.0 | (0.7) | 36.0 | 35.3 | ||||||||||||
Federal Funds Purchased | 0.2 | 0.1 | 0.3 | 0.5 | — | 0.5 | ||||||||||||
Other Short-Term Borrowings | 13.0 | — | 13.0 | — | — | — | ||||||||||||
Long-Term Borrowings | 12.5 | — | 12.5 | (2.5) | (2.4) | (4.9) | ||||||||||||
Other Interest-Bearing Liabilities | 3.0 | — | 3.0 | — | — | — | ||||||||||||
Total Change in Interest Expense | 39.7 | 198.1 | 237.8 | (2.7) | 33.6 | 30.9 | ||||||||||||
Change in Net Interest Income | $ | (34.6) | $ | 57.9 | $ | 23.3 | $ | 26.0 | $ | 59.1 | $ | 85.1 | ||||||
| (1) | The change in interest income and expense not solely due to changes in volume or rate has been allocated on a pro-rata basis to the volume and rate columns. |
Net interest income, on a fully taxable-equivalent basis, was $641.7 million for the year ended December 31, 2023, an increase of $23.3 million or 4% as compared to 2022. Our net interest margin was 2.92% for the year ended December 31, 2023, an increase of 14 basis points as compared to 2022. The increase in net interest income, on a fully taxable-equivalent basis, was driven by the rising interest rate environment and was primarily due to higher yields and average balances in our loan and lease portfolio and higher yields on our interest-bearing deposits in other banks. This was partially offset by higher deposit funding cost and higher borrowing costs. Yields on our loans and leases were 5.26% for the year ended December 31, 2023, an increase of 142 basis points as compared to 2022. We experienced an increase in our yields from total loans and leases primarily due to increases in yields from our adjustable-rate commercial real estate loans, commercial and industrial loans and construction loans, which are largely based on the SOFR. For the year ended December 31, 2023, the average balance of our loan and lease portfolio was $14.3 billion, an increase of $951.5 million or 7% compared to the same period in 2022. The increase in the average balance of our loans and leases reflected increases in most loan categories. Yields on our interest-bearing deposits in other banks were 5.18% for the year ended December 31, 2023, an increase of 399 basis points compared to 2022. Deposit funding costs were $258.2 million for the year ended December 31, 2023, an increase of $209.0 million compared to 2022. Rates paid on our interest-bearing deposits were 198 basis points for the year ended December 31, 2023, an increase of 159 basis points compared to 2022. Total borrowing costs were $26.3 million for the year ended December 31, 2023, an increase of $25.8 million compared to 2022, primarily due to the FHLB repo advances and FHLB fixed-rate advances that originated during 2023.
58
Net interest income, on a fully taxable-equivalent basis, was $618.4 million for the year ended December 31, 2022, an increase of $85.1 million or 16% as compared to 2021. Our net interest margin was 2.78% for the year ended December 31, 2022, an increase of 35 basis points as compared to 2021. The increase in net interest income, on a fully taxable-equivalent basis, was primarily due to higher yields in most loan categories, higher yields and average balances in our investment securities portfolio and higher yields on our interest-bearing deposits in other banks. This was partially offset by higher deposit funding costs. Yields on our loans and leases were 3.84% for the year ended December 31, 2022, an increase of 42 basis points as compared to 2021. We experienced an increase in our yield from total loans primarily due to increases in our commercial real estate and commercial and industrial loans. The increase in our adjustable rate commercial and industrial and commercial real estate loans are typically based on LIBOR. Fees are accelerated into net interest income upon the forgiveness of PPP loans. Net interest income for the years ended December 31, 2022 and 2021, included $5.1 million and $31.6 million, respectively, of fees from PPP loans. As of December 31, 2022, there were approximately $0.3 million of additional fees remaining on our PPP loans that had not yet been recognized into income. For the year ended December 31, 2022, the average balance of our investment securities portfolio increased $928.1 million or 13% to $8.0 billion. Yields on our investment securities portfolio were 1.82% for the year ended December 31, 2022, an increase of 36 basis points compared to 2021. Deposit funding costs were $49.2 million for the year ended December 31, 2022, an increase of $35.3 million compared to 2021. Rates paid on our interest-bearing deposits were 39 basis points for the year ended December 31, 2022, an increase of 28 basis points compared to 2021.
The Federal Reserve influences the general market rates of interest, including the deposit and loan rates offered by many financial institutions. Our loan portfolio is affected by changes in the prime interest rate. The prime rate began in 2021 at 3.25%, where it remained at through the end of the year. During 2022, the prime rate increased a total of 425 basis points (25 basis points in March, 50 basis points in May, 75 basis points in each month of June, July, September and November, and 50 basis points in December) to end the year at 7.50%. During 2023, the prime rate increased 100 basis points (25 basis points each in February, March, May and July) to end 2023 at 8.50%. As noted above, our loan portfolio is also impacted by changes in the SOFR. At December 31, 2023, the one-month and three-month CME Term SOFR interest rates were 5.35% and 5.33%, respectively. At December 31, 2022, the one-month and three-month CME Term SOFR interest rates were 4.36% and 4.59%, respectively. At December 31, 2021, the one-month and three-month CME Term SOFR interest rates were 0.05% and 0.09%, respectively. The target range for the federal funds rate, which is the cost of immediately available overnight funds, began in 2021 at 0.00% to 0.25% where it remained at through the end of the year. During 2022, the federal funds rate increased 425 basis points to end the year at 4.25% to 4.50%. During 2023, the federal funds rate increased 100 basis points to end the year at 5.25% to 5.50%.
Provision for Credit Losses
The Provision was $26.6 million for the year ended December 31, 2023 compared to a Provision of $1.4 million in 2022. For the year ended December 31, 2023, the Provision included $24.9 million in provision for credit losses for loans and leases, compared to a negative $2.1 million in provision for credit losses for loans and leases in 2022, and $1.8 million in provision for credit losses for the reserve for unfunded commitments, compared to $3.5 million in provision for credit losses for the reserve for unfunded commitments in 2022. The Provision of $26.6 million was primarily due to increases in the provision for consumer loans, construction loans, commercial and industrial loans, residential mortgage loans and commercial real estate loans and the provision for unfunded commercial and industrial and construction commitments. This was partially offset by a decrease in the provision for unfunded home equity line commitments. We recorded net charge-offs of $12.2 million and $11.2 million for the years ended December 31, 2023 and 2022, respectively. This represented net charge-offs of 0.09% and 0.08% of total average loans and leases for the years ended December 31, 2023 and 2022, respectively. The ACL was $156.5 million and $143.9 million as of December 31, 2023 and 2022, respectively, and represented 1.09% of total outstanding loans and leases as of December 31, 2023, compared to 1.02% of total outstanding loans and leases as of December 31, 2022. The reserve for unfunded commitments was $35.6 million as of December 31, 2023, compared to $33.8 million as of December 31, 2022. The Provision is recorded to maintain the ACL and the reserve for unfunded commitments at levels deemed adequate by management based on the factors noted in the “Risk Governance and Quantitative and Qualitative Disclosures About Market Risk — Credit Risk” section of this MD&A.
59
Noninterest Income
Table 5 presents the major components of noninterest income for the years ended December 31, 2023, 2022 and 2021:
Noninterest Income | Table 5 | ||||||||||||||||||||
Year Ended December 31, | Change | Change | |||||||||||||||||||
(dollars in thousands) |
| 2023 |
| 2022 |
| 2021 |
| 2023 | vs. | 2022 |
|
| 2022 | vs. | 2021 | ||||||
Service charges on deposit accounts | $ | 29,647 | $ | 28,809 | $ | 27,510 | $ | 838 | 3 | % | $ | 1,299 | 5 | % | |||||||
Credit and debit card fees | 63,888 | 66,028 | 63,580 | (2,140) | (3) | 2,448 | 4 | ||||||||||||||
Other service charges and fees | 37,299 | 37,036 | 38,578 | 263 | 1 | (1,542) | (4) | ||||||||||||||
Trust and investment services income | 38,449 | 36,465 | 34,719 | 1,984 | 5 | 1,746 | 5 | ||||||||||||||
Bank-owned life insurance | 15,326 | 1,248 | 13,185 | 14,078 | n/m | (11,937) | (91) | ||||||||||||||
Investment securities gains, net | 792 | — | 102 | 792 |
| n/m | (102) |
| n/m | ||||||||||||
Other | 15,414 | 9,939 | 7,242 | 5,475 | 55 | 2,697 | 37 | ||||||||||||||
Total noninterest income | $ | 200,815 | $ | 179,525 | $ | 184,916 | $ | 21,290 | 12 | % | $ | (5,391) | (3) | % | |||||||
n/m – Denotes a variance that is not a meaningful metric to inform the change in noninterest income from the year ended December 31, 2023 to the same period in 2022 and from the year ended December 31, 2022 to the same period in 2021.
Total noninterest income was $200.8 million for the year ended December 31, 2023, an increase of $21.3 million or 12% as compared to 2022. Total noninterest income was $179.5 million for the year ended December 31, 2022, a decrease of $5.4 million or 3% as compared to 2021.
Service charges on deposit accounts were $29.6 million for the year ended December 31, 2023, an increase of $0.8 million or 3% as compared to 2022. This increase was primarily due to a $0.9 million increase in dormant account fees, a $0.7 million increase in account analysis service charges and a $0.6 million increase in overdraft and checking account fees, partially offset by a $1.1 million decrease in checking account service fees. Service charges on deposit accounts were $28.8 million for the year ended December 31, 2022, an increase of $1.3 million or 5% as compared to 2021. This increase was primarily due to a $1.8 million increase in overdraft and checking account fees, a $1.0 million increase in dormant account fees and a $0.6 million increase in account analysis service charges, partially offset by a $2.0 million decrease in checking account service fees.
Credit and debit card fees were $63.9 million for the year ended December 31, 2023, a decrease of $2.1 million or 3% as compared to 2022. This decrease was primarily due to a $3.1 million increase in network association dues, a $2.1 million decrease in merchant service revenues and a $1.0 million decrease in ATM interchange and surcharge fees, partially offset by a $3.1 million increase in interchange settlement fees and a $1.0 million increase in debit card interchange fees. Credit and debit card fees were $66.0 million for the year ended December 31, 2022, an increase of $2.4 million or 4% as compared to 2021. This increase was primarily due to a $3.3 million increase in interchange settlement fees and a $1.7 million increase in merchant service revenues, partially offset by a $1.6 million increase in network association dues and a $0.9 million decrease in ATM interchange and surcharge fees.
Other service charges and fees were $37.3 million for the year ended December 31, 2023, an increase of $0.3 million or 1% as compared to 2022. Other service charges and fees were $37.0 million for the year ended December 31, 2022, a decrease of $1.5 million or 4% as compared to 2021. This decrease was primarily due to a $1.0 million decrease in miscellaneous service fees, a $1.0 million decrease in service fees related to participation loans, a $0.4 million decrease in fees from standby letters of credit arrangements, a $0.3 million decrease in insurance income, a $0.3 million decrease in traveler’s check processing fees and a $0.2 million decrease in safe deposit box rental fees. This was partially offset by a $1.9 million increase in fees from annuities and securities.
Trust and investment services income was $38.4 million for the year ended December 31, 2023, an increase of $2.0 million or 5% as compared to 2022. This increase was primarily due to a $1.1 million increase in investment management fees and a $1.1 million increase in business cash management fees. Trust and investment services income was $36.5 million for the year ended December 31, 2022, an increase of $1.7 million or 5% as compared to 2021. This increase was primarily due to a $2.5 million increase in business cash management fees and a $0.5 million increase in investment management fees. This was partially offset by a $0.4 million decrease in irrevocable trust fees, a $0.3 million decrease in trust service fees and a $0.3 million decrease in pension plan fees.
60
BOLI income was $15.3 million for the year ended December 31, 2023, an increase of $14.1 million as compared to 2022. This increase was due to an $11.0 million increase in BOLI earnings and a $3.1 million increase in death benefit proceeds from life insurance policies. BOLI income was $1.2 million for the year ended December 31, 2022, a decrease of $11.9 million or 91% as compared to 2021. This decrease was due to a $9.7 million decrease in BOLI earnings and a $2.3 million decrease in death benefit proceeds from life insurance policies.
Net gains on the sale of investment securities were $0.8 million for the year ended December 31, 2023, an increase in net gains of $0.8 million as compared to the same period in 2022. The net gains were primarily due to a $40.8 million net realized gain on the sale of the Company’s remaining approximately 120,000 Visa Class B restricted shares, partially offset by $40.0 million of net realized losses on sales of available-for-sale investment securities. Net gains on the sale of investment securities were nil for the year ended December 31, 2022.
Other noninterest income was $15.4 million for the year ended December 31, 2023, an increase of $5.5 million or 55% as compared to 2022. This increase was primarily due to a $7.9 million gain on the sale of a bank property in 2023, a $2.5 million increase in income due to adjustments to certain liabilities assumed as a result of the Reorganization Transactions, a $2.4 million increase in market adjustments on mutual funds purchased, a $1.5 million increase in volume-based incentives and a $0.9 million increase in net mortgage servicing rights income. This was partially offset by a $7.0 million increase in net losses recognized in income related to derivative contracts, a $1.2 million tax refund received during the year ended December 31, 2022, a $0.7 million decrease in customer-related interest rate swap fees and a $0.4 million decrease in debit card merchant discount fees. Other noninterest income was $9.9 million for the year ended December 31, 2022, an increase of $2.7 million or 37% as compared to 2021. This increase was primarily due to a $5.2 million decrease in net losses recognized in income related to derivative contracts, a $1.2 million tax refund received, a $0.7 million increase in net mortgage servicing rights income, a $0.5 million increase in vendor bonuses received and a $0.4 million increase in market adjustments for foreign exchange transactions. This was partially offset by a $2.2 million decrease in gains on the sale of bank properties, a $1.6 million decrease in gains on the sale of residential loans to government-sponsored enterprises and a $1.5 million decrease in market adjustments on mutual funds purchased.
Noninterest Expense
Table 6 presents the major components of noninterest expense for the years ended December 31, 2023, 2022 and 2021:
Noninterest Expense | Table 6 | ||||||||||||||||||||
Year Ended December 31, | Change | Change | |||||||||||||||||||
(dollars in thousands) |
| 2023 |
| 2022 |
| 2021 |
| 2023 | vs. | 2022 |
|
| 2022 | vs. | 2021 | ||||||
Salaries and employee benefits | $ | 225,755 | $ | 199,129 | $ | 182,384 | $ | 26,626 | 13 | % | $ | 16,745 | 9 | % | |||||||
Contracted services and professional fees | 66,423 | 70,027 | 63,349 | (3,604) | (5) | 6,678 | 11 | ||||||||||||||
Occupancy | 29,608 | 31,034 | 29,348 | (1,426) | (5) | 1,686 | 6 | ||||||||||||||
Equipment | 45,109 | 34,506 | 24,719 | 10,603 | 31 | 9,787 | 40 | ||||||||||||||
Regulatory assessment and fees | 32,073 | 9,603 | 8,245 | 22,470 | n/m | 1,358 | 16 | ||||||||||||||
Advertising and marketing | 7,615 | 7,996 | 6,108 | (381) | (5) | 1,888 | 31 | ||||||||||||||
Card rewards program | 31,627 | 30,990 | 25,244 | 637 | 2 | 5,746 | 23 | ||||||||||||||
Other | 62,928 | 57,186 | 66,082 | 5,742 | 10 | (8,896) | (13) | ||||||||||||||
Total noninterest expense | $ | 501,138 | $ | 440,471 | $ | 405,479 | $ | 60,667 | 14 | % | $ | 34,992 | 9 | % | |||||||
n/m – Denotes a variance that is not a meaningful metric to inform the change in noninterest expense from the year ended December 31, 2023 to the same period in 2022.
Total noninterest expense was $501.1 million for the year ended December 31, 2023, an increase of $60.7 million or 14% as compared to 2022. Total noninterest expense was $440.5 million for the year ended December 31, 2022, an increase of $35.0 million or 9% as compared to 2021.
61
Salaries and employee benefits expense was $225.8 million for the year ended December 31, 2023, an increase of $26.6 million or 13% as compared to 2022. This increase was primarily due to a $12.7 million increase in base salaries and related payroll taxes, a $10.7 million decrease in payroll and benefit costs being deferred as loan origination costs, a $4.3 million increase in other compensation, primarily related to adjustments made to the deferred compensation plan as a result of market conditions and nonrecurring separation agreements and severance costs, a $1.3 million increase in retirement plan expenses, a $1.1 million increase in state unemployment tax expense and a $0.8 million increase in group health plan costs. This was partially offset by a $2.2 million decrease in incentive compensation, a $1.1 million decrease in temporary help expenses and a $0.9 million decrease in employee overtime pay expense. Salaries and employee benefits expense was $199.1 million for the year ended December 31, 2022, an increase of $16.7 million or 9% as compared to 2021. This increase was primarily due to a $15.4 million decrease in payroll and benefit costs being deferred as loan origination costs, an $11.7 million increase in base salaries and related payroll taxes, a $0.6 million increase in employee overtime pay expense and a $0.4 million increase in incentive compensation. This was partially offset by a $7.9 million decrease in other compensation, primarily related to adjustments made to the deferred compensation plan as a result of market conditions and a nonrecurring severance cost of $1.2 million recorded during the year ended December 31, 2021, as well as a $1.6 million decrease in temporary help expenses, a $1.1 million decrease in retirement plan expenses and a $0.9 million decrease in group health plan costs.
Contracted services and professional fees were $66.4 million for the year ended December 31, 2023, a decrease of $3.6 million or 5% as compared to 2022. This decrease was primarily due to a $6.2 million decrease in contracted data processing expenses and a $3.2 million decrease in audit, legal and consultant fees. This was partially offset by a $5.8 million increase in outside services, primarily attributable to technology-related projects, marketing and new customer services. Contracted services and professional fees were $70.0 million for the year ended December 31, 2022, an increase of $6.7 million or 11% as compared to 2021. This increase was primarily due to an $11.6 million increase in outside services, primarily attributable to technology-related projects, marketing and new customer services, and a $3.2 million increase in audit, legal and consultant fees. This was partially offset by an $8.0 million decrease in contracted data processing expenses.
Occupancy expense was $29.6 million for the year ended December 31, 2023, a decrease of $1.4 million or 5% as compared to 2022. This decrease was due to a $0.9 million decrease in building depreciation, a $0.7 million decrease in building maintenance expense and a $0.5 million decrease in utilities expense, partially offset by a $0.8 million decrease in net sublease rental income. Occupancy expense was $31.0 million for the year ended December 31, 2022, an increase of $1.7 million or 6% as compared to 2021. This increase was due to a $1.6 million increase in utilities expense and a $0.9 million increase in building maintenance expense, partially offset by a $0.4 million decrease in rental expense and a $0.3 million decrease in real property tax expense.
Equipment expense was $45.1 million for the year ended December 31, 2023, an increase of $10.6 million or 31% as compared to 2022. This increase was primarily due to an $11.8 million increase in technology-related amortization and licensing and maintenance fees, partially offset by a $0.9 million decrease in furniture and equipment depreciation. Equipment expense was $34.5 million for the year ended December 31, 2022, an increase of $9.8 million or 40% as compared to 2021. This increase was primarily due to a $10.5 million increase in technology-related amortization and licensing and maintenance fees, partially offset by a $0.5 million decrease in furniture and equipment depreciation.
Regulatory assessment and fees were $32.1 million for the year ended December 31, 2023, an increase of $22.5 million as compared to 2022. This increase was primarily due to increases in the FDIC insurance assessment. In October 2022, the FDIC adopted a final rule to increase the initial base deposit insurance assessment rate schedules by 2 basis points beginning with the first quarterly assessment period of 2023. In May 2023, the FDIC issued a notice of proposed rulemaking for a special assessment to replenish the deposit insurance fund following the recent bank failures. In November 2023, the FDIC approved a final rule to implement the special assessment and we recorded a $16.3 million loss in December 2023. Regulatory assessment and fees were $9.6 million for the year ended December 31, 2022, an increase of $1.4 million or 16% as compared to 2021. This increase was primarily due to a $1.4 million increase in the FDIC insurance assessment.
Advertising and marketing expense was $7.6 million for the year ended December 31, 2023, a decrease of $0.4 million or 5% as compared to 2022. Advertising and marketing expense was $8.0 million for the year ended December 31, 2022, an increase of $1.9 million or 31% as compared to 2021. This increase was primarily due to a $1.5 million increase in advertising costs.
62
Card rewards program expense was $31.6 million for the year ended December 31, 2023, an increase of $0.6 million or 2% as compared to 2022. This increase was primarily due to a $2.1 million increase in credit card cash reward redemptions and a $1.2 million increase in interchange fees paid to our credit card partners, partially offset by a $2.5 million decrease in priority rewards card redemptions. Card rewards program expense was $31.0 million for the year ended December 31, 2022, an increase of $5.7 million or 23% as compared to 2021. This increase was primarily due to a $3.8 million increase in priority rewards card redemptions, a $1.3 million increase in interchange fees paid to our credit card partners and a $0.6 million increase in credit card cash reward redemptions.
Other noninterest expense was $62.9 million for the year ended December 31, 2023, an increase of $5.7 million or 10% as compared to 2022. This increase was primarily due to a one-time settlement expense in connection to a lawsuit against the Company, a $2.7 million increase in charitable contributions and increases in postage expenses, signature-based card fraud expenses and travel expenses. This was partially offset by a $1.4 million decrease in pension-related expenses, and decreases in activity charges assessed on the Company’s bank accounts, general and administrative expenses primarily around supplies, insurance, meals and entertainment and shipping and delivery, software amortization expense, mortgage loan charges and other tax expense. Other noninterest expense was $57.2 million for the year ended December 31, 2022, a decrease of $8.9 million or 13% as compared to 2021. This decrease was primarily due to $9.0 million in prepayment fees to terminate the Company’s FHLB fixed-rate advances recorded during the year ended December 31, 2021, a $3.1 million decrease in software amortization expense, and a $1.3 million decrease in pension-related expenses. This was partially offset by a $1.9 million increase in general and administrative expenses primarily around supplies, insurance, meals and entertainment and shipping and delivery, a $1.4 million increase in charitable contributions, a $0.7 million increase in travel expenses and a $0.5 million increase in activity charges assessed on the Company’s bank accounts.
Provision for Income Taxes
The provision for income taxes was $74.2 million (reflecting an effective tax rate of 24.00%) for the year ended December 31, 2023, compared with a provision for income taxes of $85.5 million (reflecting an effective tax rate of 24.35%) in 2022. Additional information about the provision for income taxes is presented in “Note 15. Income Taxes” in the notes to the consolidated financial statements included in Item 8. Financial Statements and Supplementary Data.
Analysis of Business Segments
Our business segments are Retail Banking, Commercial Banking, and Treasury and Other. Table 7 summarizes net income (loss) from our business segments for the years ended December 31, 2023, 2022 and 2021. Additional information about operating segment performance is presented in “Note 22. Reportable Operating Segments” in the notes to the consolidated financial statements included in Item 8. Financial Statements and Supplementary Data.
Business Segment Net Income (Loss) | Table 7 | |||||||||
Year Ended December 31, | ||||||||||
(dollars in thousands) |
| 2023 |
| 2022 |
| 2021 |
| |||
Retail Banking | $ | 183,055 | $ | 179,640 | $ | 186,936 | ||||
Commercial Banking | 95,200 | 95,757 | 119,773 | |||||||
Treasury and Other | (43,272) | (9,712) | (40,974) | |||||||
Total | $ | 234,983 | $ | 265,685 | $ | 265,735 | ||||
Retail Banking. Our Retail Banking segment includes the financial products and services we provide to consumers and small businesses. Loan and lease products offered include residential and commercial mortgage loans, home equity lines of credit and loans, automobile loans and leases, secured and unsecured lines of credit, installment loans, and small business loans and leases. Deposit products offered include checking, savings and time deposit accounts. Our Retail Banking segment also includes our wealth management services. Products and services from Retail Banking are delivered to customers through 50 banking locations throughout the State of Hawaii, Guam and Saipan.
63
Net income for the Retail Banking segment was $183.1 million for the year ended December 31, 2023, an increase of $3.4 million or 2% as compared to 2022. The increase in net income for the Retail Banking segment was primarily due to a $21.9 million increase in net interest income and a $3.6 million increase in noninterest income. This was partially offset by an $11.2 million increase in noninterest expense and a Provision of $9.9 million for the year ended December 31, 2023, compared to a negative Provision of $1.0 million for the year ended December 31, 2022. The increase in net interest income was primarily due to higher deposit spreads, partially offset by lower loan spreads. The increase in noninterest income was primarily due to increases in trust and investment services income, net mortgage servicing rights income and service charges on deposit accounts. The increase in noninterest expense was primarily due to increases in salaries and employee benefits expense, regulatory assessments and fees, occupancy expense and costs related to natural disaster events, partially offset by lower overall expenses that were allocated to the Retail Banking segment. The increase in the Provision was primarily due to an increase in our provision for credit losses for loans and leases allocated to the Retail Banking segment. The increase in total assets for the Retail Banking segment was primarily due to increases in our residential real estate and commercial real estate loan portfolios.
Net income for the Retail Banking segment was $179.6 million for the year ended December 31, 2022, a decrease of $7.3 million or 4% as compared to 2021. The decrease in net income for the Retail Banking segment was primarily due to a $45.6 million increase in noninterest expense and a negative Provision of $1.0 million for the year ended December 31, 2022, compared to a negative Provision of $16.3 million for the year ended December 31, 2021. This was partially offset by a $50.6 million increase in net interest income and a $2.4 million increase in noninterest income. The increase in noninterest expense was primarily due to higher overall expenses that were allocated to the Retail Banking segment and increases in salaries and employee benefits expense, occupancy expense and contracted services and professional fees. The increase in the Provision was primarily due to higher expected credit losses as a result of the risk of economic recession due to inflation resulting from higher oil prices and the continued impact of the COVID-19 pandemic on Hawaii’s economy, key industries, businesses and our customers. The increase in net interest income was primarily due to higher deposit credit rates paid to the Retail Banking segment, partially offset by higher earnings charges on our consumer, residential real estate and commercial loans. The increase in noninterest income was primarily due to increases in trust and investment services income, service charges on deposit accounts and net mortgage servicing rights income, partially offset by a decrease in gains on the sale of residential loans to government-sponsored enterprises. The increase in total assets for the Retail Banking segment was primarily due to an increase in our residential real estate loan portfolio.
Commercial Banking. Our Commercial Banking segment includes our corporate banking related products, residential and commercial real estate loans, commercial lease financing, secured and unsecured lines of credit, automobile loans and auto dealer financing, business deposit products and credit cards. Commercial lending and deposit products are offered primarily to middle-market and large companies locally, nationally and internationally.
Net income for the Commercial Banking segment was $95.2 million for the year ended December 31, 2023, a decrease of $0.6 million or 1% as compared to 2022. The decrease in net income for the Commercial Banking segment was primarily due to a Provision of $15.0 million for the year ended December 31, 2023, compared to a negative Provision of $1.2 million for the year ended December 31, 2022, in addition to a $2.9 million increase in noninterest expense and a $2.2 million decrease in noninterest income. This was partially offset by an $18.4 million increase in net interest income and a $2.2 million decrease in the provision for income taxes. The increase in the Provision was primarily due to an increase in our provision for credit losses for loans and leases allocated to the Commercial Banking segment. The increase in noninterest expense was primarily due to an increase in regulatory assessment and fees, a one-time settlement expense in connection to a lawsuit against the Company, and increases in salaries and benefits expense and card rewards program expense, partially offset by lower overall expenses that were allocated to the Commercial Banking segment. The decrease in noninterest income was primarily due to a decrease in credit and debit card fees. The increase in net interest income was primarily due to higher loan average balances and spreads, partially offset by a decrease in loan fees. The decrease in the provision for income taxes was primarily due to the decrease in pretax income. The increase in total assets for the Commercial Banking segment was primarily due to increases in our commercial real estate loan and lease financing portfolios, partially offset by a decrease in our consumer loan portfolio.
64
Net income for the Commercial Banking segment was $95.8 million for the year ended December 31, 2022, a decrease of $24.0 million or 20% as compared to 2021. The decrease in net income for the Commercial Banking segment was primarily due to a negative Provision of $1.2 million for the year ended December 31, 2022, compared to a negative Provision of $22.5 million for the year ended December 31, 2021. The decrease in net income for the Commercial Banking segment also stemmed from a $9.0 million increase in noninterest expense and a $5.9 million decrease in net interest income, partially offset by a $7.4 million decrease in the provision for income taxes and a $4.8 million increase in noninterest income. The increase in the Provision was primarily due to higher expected credit losses as a result of the risk of economic recession due to inflation resulting from higher oil prices and the continued impact of the COVID-19 pandemic on Hawaii’s economy, key industries, businesses and our customers. The increase in noninterest expense was primarily due to an increase in card rewards program expense and higher overall expenses that were allocated to the Commercial Banking segment, partially offset by a decrease in salaries and benefits expense. The decrease in net interest income was primarily due to a decrease in loan fees in our commercial and industrial portfolio from PPP loans, partially offset by higher deposit credit rates paid to the Commercial Banking segment. The decrease in the provision for income taxes was primarily due to the decrease in pretax income. The increase in noninterest income was primarily due to an increase in credit and debit card fees, a tax refund received during the year ended December 31, 2022, an increase in service charges on deposit accounts and vendor bonuses received, partially offset by a decrease in other service charges and fees. The increase in total assets for the Commercial Banking segment was primarily due to increases in our commercial real estate, commercial and industrial and lease financing loan portfolios.
Treasury and Other. Our Treasury and Other segment includes our treasury business, which consists of corporate asset and liability management activities, including interest rate risk management. The assets and liabilities (and related interest income and expense) of our treasury business consist of interest-bearing deposits, investment securities, federal funds sold and purchased, government deposits, short and long-term borrowings and bank-owned properties. Our primary sources of noninterest income are from BOLI, net gains from the sale of investment securities, foreign exchange income related to customer driven cross-border wires for business and personal reasons and management of bank-owned properties in Hawaii and Guam. The net residual effect of the transfer pricing of assets and liabilities is included in Treasury and Other, along with the elimination of intercompany transactions.
Other organizational units (Technology, Operations, Credit and Risk Management, Human Resources, Finance, Administration, Marketing, and Corporate and Regulatory Administration) provide a wide range of support to our other income earning segments. Expenses incurred by these support units are charged to the applicable business segments through an internal cost allocation process.
Net loss for the Treasury and Other segment was $43.3 million for the year ended December 31, 2023, an increase in net loss of $33.6 million as compared to 2022. The increase in net loss was primarily due to a $46.6 million increase in noninterest expense and a $17.8 million decrease in net interest income, partially offset by a $19.9 million increase in noninterest income, a $9.1 million increase in the benefit for income taxes and a $1.7 million decrease in the Provision. The increase in noninterest expense was primarily due to lower overall credits that were allocated to the Treasury and Other segment and increases in equipment expense, salaries and employee benefits expense and regulatory assessment and fees. This was partially offset by decreases in contracted services and professional fees and occupancy expense. The decrease in net interest income was primarily due to an increase in interest expense from public deposits and higher borrowing costs, partially offset by an increase in net transfer pricing credits that reside in the Treasury and Other segment and higher yields on our interest-bearing deposits in other banks. The increase in noninterest income was primarily due to increases in BOLI income, a gain on the sale of a bank property in 2023, market adjustments on mutual funds purchased, income due to adjustments to certain liabilities assumed as a result of the Reorganization Transactions and net gains on the sale of investment securities, partially offset by an increase in net losses recognized in income related to derivative contracts. The increase in the benefit for income taxes was primarily due to the increase in pretax loss. The decrease in the Provision was primarily due to the decrease in the provision for unfunded home equity line commitments. The increase in total assets for the Treasury and Other segment was primarily due to an increase in our interest-bearing deposits in other banks, partially offset by a decrease in our investment securities portfolio.
65
Net loss for the Treasury and Other segment was $9.7 million for the year ended December 31, 2022, a decrease in net loss of $31.3 million or 76% as compared to 2021. The decrease in net loss was primarily due to a $38.3 million increase in net interest income and a $19.6 million decrease in noninterest expense, partially offset by a $12.6 million decrease in noninterest income, a $3.8 million increase in the Provision and a $10.3 million decrease in the benefit for income taxes. The increase in net interest income was primarily due to higher average balances and yields on our investment securities portfolio, partially offset by an increase in net transfer pricing charges that reside in the Treasury and Other segment. The decrease in noninterest expense was primarily due to higher overall credits that were allocated to the Treasury and Other segment and prepayment termination fees paid in 2021 that did not occur in 2022. This was partially offset by increases in equipment expense, contracted services and professional fees, salaries and employee benefits expense and advertising and marketing expense. The decrease in noninterest income was primarily due to decreases in BOLI income, gains on the sale of bank properties, market adjustments on mutual funds purchased and service charges on deposit accounts, partially offset by a decrease in net losses recognized in income related to derivative contracts. The increase in the Provision was due to the increase in the reserve for unfunded commitments for the year ended December 31, 2022. The decrease in the benefit for income taxes was primarily due to the decrease in pretax loss. The decrease in total assets for the Treasury and Other segment was primarily due to decreases in our investment securities portfolio and interest-bearing deposits in other banks.
Analysis of Financial Condition
Liquidity and Capital Resources
Liquidity refers to our ability to maintain cash flow that is adequate to fund operations and meet present and future financial obligations through either the sale or maturity of existing assets or by obtaining additional funding through liability management. We consider the effective and prudent management of liquidity to be fundamental to our health and strength. Our objective is to manage our cash flow and liquidity reserves so that they are adequate to fund our obligations and other commitments on a timely basis and at a reasonable cost.
Liquidity is managed to ensure stable, reliable and cost-effective sources of funds to satisfy demand for credit, deposit withdrawals and investment opportunities. Funding requirements are impacted by loan originations and refinancings, deposit balance changes, liability issuances and settlements and off-balance sheet funding commitments. We consider and comply with various regulatory and internal guidelines regarding required liquidity levels and periodically monitor our liquidity position in light of the changing economic environment and customer activity. Based on periodic liquidity assessments, we may alter our asset, liability and off-balance sheet positions. The Company’s Asset Liability Management Committee (“ALCO”) monitors sources and uses of funds and modifies asset and liability positions as liquidity requirements change. This process, combined with our ability to raise funds in money and capital markets and through private placements, provides flexibility in managing the exposure to liquidity risk.
Immediate liquid resources are available in cash which is primarily on deposit with the Federal Reserve Bank of San Francisco (the “FRB”). As of December 31, 2023 and 2022, cash and cash equivalents were $1.7 billion and $0.5 billion, respectively. Potential sources of liquidity also include investment securities in our available-for-sale portfolio and held-to-maturity portfolio. The carrying values of our available-for-sale investment securities and held-to-maturity investment securities were $2.3 billion and $4.0 billion as of December 31, 2023, respectively. The carrying values of our available-for-sale investment securities and held-to-maturity investment securities were $3.2 billion and $4.3 billion as of December 31, 2022, respectively. As of December 31, 2023 and 2022, we maintained our excess liquidity primarily in collateralized mortgage obligations issued by Ginnie Mae, Fannie Mae and Freddie Mac and mortgage-backed securities issued by Ginnie Mae, Freddie Mac, Fannie Mae, Municipal Housing Authorities and non-agency entities. As of December 31, 2023, our available-for-sale investment securities portfolio was comprised of securities with a weighted average life of approximately 4.2 years and our held-to-maturity investment securities portfolio was comprised of securities with a weighted average life of approximately 7.9 years. These funds offer substantial resources to meet either new loan demand or to help offset reductions in our deposit funding base as they provide quick sources of liquidity by pledging to obtain secured borrowings and repurchase agreements or sales of our available-for-sale securities portfolio. Liquidity is further enhanced by our ability to pledge loans to access secured borrowings from the FHLB and the FRB. As of December 31, 2023, we have borrowing capacity of $2.5 billion from the FHLB and $3.3 billion from the FRB based on the amount of collateral pledged.
66
Our core deposits have historically provided us with a long-term source of stable and relatively lower cost of funding. Our core deposits, defined as all deposits exclusive of time deposits exceeding $250,000, totaled $19.5 billion and $20.2 billion as of December 31, 2023 and 2022, which represented 91% and 93%, respectively, of our total deposits as of December 31, 2023 and 2022, respectively. These core deposits are normally less volatile, often with customer relationships tied to other products offered by the Company; however, deposit levels could decrease if interest rates increase significantly or if corporate customers increase investing activities, including alternative investment options, that reduce deposit balances.
In March 2023, to enhance liquidity as a precaution in light of recent volatility in the banking sector, the Bank took $500.0 million in FHLB advances. For information with respect to the financial terms of such advances, see “ – Short-term Borrowings.” We also utilize short-term advances to help manage liquidity needs that may arise from time to time.
Our material cash requirements from our current and long-term contractual obligations as of December 31, 2023 are summarized in the following table:
Contractual Obligations | Table 8 | ||||||||||||||
Less Than | After | ||||||||||||||
(dollars in thousands) |
| One Year |
| 1 - 3 Years |
| 4 - 5 Years |
| 5 Years |
| Total | |||||
Contractual Obligations | |||||||||||||||
Time certificates of deposits | $ | 3,262,048 | $ | 143,534 | $ | 50,166 | $ | 410 | $ | 3,456,158 | |||||
Short-term borrowings | 500,000 | — | — | — | 500,000 | ||||||||||
Noncancelable operating leases | 8,009 | 10,785 | 8,451 | 62,557 | 89,802 | ||||||||||
Postretirement benefit contributions | 1,220 | 2,743 | 3,068 | 7,863 | 14,894 | ||||||||||
Purchase obligations | 97,391 | 104,204 | 33,259 | 4,832 | 239,686 | ||||||||||
Affordable housing commitments | 49,686 | 29,667 | 248 | 1,104 | 80,705 | ||||||||||
Total Contractual Obligations | $ | 3,918,354 | $ | 290,933 | $ | 95,192 | $ | 76,766 | $ | 4,381,245 | |||||
Commitments to extend credit, standby letters of credit and commercial letters of credit do not necessarily represent future cash requirements in that these commitments often expire without being drawn upon; therefore, these items are not included in the table above. Purchase obligations arise from agreements to purchase goods or services that are enforceable and legally binding. Other contracts included in purchase obligations primarily consist of service agreements for various systems and applications supporting bank operations, including the systems and applications in the Bank’s core system. Postretirement benefit contributions represent the minimum expected contribution to the postretirement benefit plan. Actual contributions may differ from these estimates.
Our liability for unrecognized tax benefits (“UTBs”) as of December 31, 2023 and 2022 was $212.0 million and $206.2 million, respectively. The increase in UTB was primarily due to additions related to previously identified tax positions. We are unable to reasonably estimate the period of cash settlement with the respective taxing authority. As a result, our liability for UTBs is not disclosed in the table above.
See the discussion of credit, lease and other contractual commitments in “Note 4. Loans and Leases” and “Note 17. Commitments and Contingent Liabilities” in the notes to the consolidated financial statements included in Item 8. Financial Statements and Supplementary Data.
Other material cash requirements include general corporate operating activities, stock repurchases, and capital to be returned to our shareholders.
We expect to meet these obligations from dividends paid by the Bank to the Parent. Additional sources of liquidity available to us include selling residential real estate loans in the secondary market, taking out short- and long-term borrowings and issuing long-term debt and equity securities. We believe that our existing cash, cash equivalents, investments, and cash expected to be generated from operations, will be sufficient to meet our cash requirements within the next twelve months and beyond.
Potential Demands on Liquidity from Off-Balance Sheet Arrangements
We have off-balance sheet arrangements, such as variable interest entities, guarantees, and certain financial instruments with off-balance sheet risk, that may affect the Company’s financial condition, changes in financial condition, revenues or expenses, results of operations, liquidity, capital expenditures or capital resources.
67
Variable Interest Entities
We hold interests in several unconsolidated variable interest entities (“VIEs”). These unconsolidated VIEs are primarily low-income housing tax credit investments in partnerships and limited liability companies. Variable interests are defined as contractual ownership or other interests in an entity that change with fluctuations in an entity’s net asset value. The primary beneficiary consolidates the VIE. Based on our analysis, we have determined that the Company is not the primary beneficiary of these entities. As a result, we do not consolidate these VIEs. Unfunded commitments to fund these low-income housing tax credit investments were $80.7 million and $47.2 million as of December 31, 2023 and 2022, respectively.
Guarantees
We sell residential mortgage loans in the secondary market primarily to Fannie Mae or Freddie Mac. The agreements under which we sell residential mortgage loans to Fannie Mae or Freddie Mac contain provisions that include various representations and warranties regarding the origination and characteristics of the residential mortgage loans. Although the specific representations and warranties vary among investors, insurance or guarantee agreements, they typically cover: ownership of the loan; validity of the lien securing the loan; the absence of delinquent taxes or liens against the property securing the loan; compliance with loan criteria set forth in the applicable agreement; compliance with applicable federal, state, and local laws; and other matters. As of December 31, 2023 and 2022, the unpaid principal balance of our portfolio of residential mortgage loans sold was $1.3 billion and $1.4 billion, respectively. The agreements under which we sell residential mortgage loans require delivery of various documents to the investor or its document custodian. Although these loans are primarily sold on a non-recourse basis, we may be obligated to repurchase residential mortgage loans or reimburse investors for losses incurred if a loan review reveals that underwriting and documentation standards were potentially not met in the origination of those loans. Upon receipt of a repurchase request, we work with investors to arrive at a mutually agreeable resolution. Repurchase demands are typically reviewed on an individual loan by loan basis to validate the claims made by the investor to determine if a contractually required repurchase event has occurred. We manage the risk associated with potential repurchases or other forms of settlement through our underwriting and quality assurance practices and by servicing mortgage loans to meet investor and secondary market standards. For the year ended December 31, 2023, there was one residential mortgage loan repurchase totaling $0.2 million and there were no pending repurchase requests.
In addition to servicing loans in our portfolio, substantially all of the loans we sell to investors are sold with servicing rights retained. We also service loans originated by other mortgage loan originators. As servicer, our primary duties are to: (1) collect payments due from borrowers; (2) advance certain delinquent payments of principal and interest; (3) maintain and administer any hazard, title, or primary mortgage insurance policies relating to the mortgage loans; (4) maintain any required escrow accounts for payment of taxes and insurance and administer escrow payments; and (5) foreclose on defaulted mortgage loans, or loan modifications or short sales. Each agreement under which we act as servicer generally specifies a standard of responsibility for actions taken by the Company in such capacity and provides protection against expenses and liabilities incurred by the Company when acting in compliance with the respective servicing agreements. However, if we commit a material breach of obligations as servicer, we may be subject to termination if the breach is not cured within a specified period following notice. The standards governing servicing and the possible remedies for violations of such standards vary by investor. These standards and remedies are determined by servicing guides issued by the investors as well as the contract provisions established between the investors and the Company. Remedies could include repurchase of an affected loan. For the year ended December 31, 2023, we had no repurchase requests related to loan servicing activities, nor were there any pending repurchase requests as of December 31, 2023.
Although to date repurchase requests related to representation and warranty provisions and servicing activities have been limited, it is possible that requests to repurchase mortgage loans may increase in frequency as investors more aggressively pursue all means of recovering losses on their purchased loans. However, as of December 31, 2023, management believes that this exposure is not material due to the historical level of repurchase requests and loss trends and thus has not established a liability for losses related to mortgage loan repurchases. As of December 31, 2023, 99% of our residential mortgage loans serviced for investors were current. We maintain ongoing communications with investors and continue to evaluate this exposure by monitoring the level and number of repurchase requests as well as the delinquency rates in loans sold to investors.
68
Financial Instruments with Off-Balance Sheet Risk
The Company is a party to financial instruments with off-balance sheet risk in the normal course of business to meet the financing needs of its customers. These financial instruments include commitments to extend credit and standby and commercial letters of credit which are not reflected in the consolidated financial statements.
See “Note 17. Commitments and Contingent Liabilities” in the notes to the consolidated financial statements included in Item 8. Financial Statements and Supplementary Data for more information on our financial instruments with off-balance sheet risk.
Investment Securities
Table 9 presents the estimated fair value of our available-for-sale investment securities portfolio and amortized cost of our held-to-maturity investment securities portfolio as of December 31, 2023 and 2022:
Investment Securities | Table 9 | |||||
| December 31, | December 31, | ||||
(dollars in thousands) | 2023 |
| 2022 | |||
U.S. Treasury and government agency debt securities |
| $ | 32,503 | $ | 150,982 | |
Government-sponsored enterprises debt securities | 19,592 | 44,301 | ||||
Mortgage-backed securities: | ||||||
Residential - Government agency | 10,182 | 59,723 | ||||
Residential - Government-sponsored enterprises | 783,297 | 1,160,455 | ||||
Commercial - Government agency | 218,674 | 237,853 | ||||
Commercial - Government-sponsored enterprises | 86,431 | 119,573 | ||||
Commercial - Non-agency | 21,683 | 21,471 | ||||
Collateralized mortgage obligations: | ||||||
Government agency | 471,150 | 653,322 | ||||
Government-sponsored enterprises | 363,970 | 462,132 | ||||
Collateralized loan obligations | 247,854 | 241,321 | ||||
Total available-for-sale securities | $ | 2,255,336 | $ | 3,151,133 | ||
Government agency debt securities |
| $ | 52,051 | $ | 54,318 | |
Mortgage-backed securities: | ||||||
Residential - Government agency | 43,885 | 46,302 | ||||
Residential - Government-sponsored enterprises | 99,379 | 106,534 | ||||
Commercial - Government agency | 30,795 | 30,544 | ||||
Commercial - Government-sponsored enterprises | 1,129,738 | 1,150,449 | ||||
Collateralized mortgage obligations: | ||||||
Government agency | 989,130 | 1,080,492 | ||||
Government-sponsored enterprises | 1,642,274 | 1,798,178 | ||||
Debt securities issued by states and political subdivisions | 54,197 | 53,822 | ||||
Total held-to-maturity securities | $ | 4,041,449 | $ | 4,320,639 | ||
69
Table 10 presents the maturity distribution at amortized cost and weighted-average yield to maturity of our investment securities portfolio as of December 31, 2023:
Maturities and Weighted-Average Yield on Securities(1) | Table 10 | |||||||||||||||||||||||||||
1 Year or Less | After 1 Year - 5 Years | After 5 Years - 10 Years | Over 10 Years | Total | ||||||||||||||||||||||||
Weighted | Weighted | Weighted | Weighted | Weighted | ||||||||||||||||||||||||
Average | Average | Average | Average | Average | Fair | |||||||||||||||||||||||
(dollars in millions) |
| Amount |
| Yield | Amount |
| Yield | Amount |
| Yield | Amount |
| Yield | Amount |
| Yield | Value | |||||||||||
As of December 31, 2023 |
|
|
|
|
|
| ||||||||||||||||||||||
Available-for-sale securities | ||||||||||||||||||||||||||||
U.S. Treasury and government agency debt securities | $ | 25.1 | 1.48 | % | $ | 8.1 | 0.89 | % | $ | — | — | % | $ | — | — | % | $ | 33.2 |
| 1.33 | % | $ | 32.5 | |||||
Government-sponsored enterprises debt securities |
| — | — | 20.0 | 3.33 | — | — | — | — | 20.0 | 3.33 | 19.6 | ||||||||||||||||
Mortgage-backed securities: | ||||||||||||||||||||||||||||
Residential - Government agency(2) | — | — | — | — | 11.3 | 2.84 | — | — | 11.3 | 2.84 | 10.2 | |||||||||||||||||
Residential - Government-sponsored enterprises(2) | — | — | 895.4 | 1.33 | — | — | — | — | 895.4 | 1.33 | 783.3 | |||||||||||||||||
Commercial - Government agency(2) | 4.1 | 3.18 | 232.0 | 1.88 | 32.8 | 1.76 | — | — | 268.9 | 1.89 | 218.7 | |||||||||||||||||
Commercial - Government-sponsored enterprises(2) | 28.3 | 2.97 | 65.2 | 1.32 | — | — | — | — | 93.5 | 1.82 | 86.4 | |||||||||||||||||
Commercial - Non-agency | — | — | — | — | — | — | 22.0 | 6.02 | 22.0 | 6.02 | 21.7 | |||||||||||||||||
Collateralized mortgage obligations(2): | ||||||||||||||||||||||||||||
Government agency | 5.6 | 1.81 | 225.2 | 1.85 | 307.9 | 1.79 | — | — | 538.7 | 1.81 | 471.1 | |||||||||||||||||
Government-sponsored enterprises | 5.7 | 1.51 | 260.7 | 1.27 | 159.4 | 1.82 | — | — | 425.8 | 1.48 | 364.0 | |||||||||||||||||
Collateralized loan obligations | — | — | 9.3 | 6.26 | 97.7 | 6.14 | 142.9 | 5.71 | 249.9 | 5.90 | 247.8 | |||||||||||||||||
Total available-for-sale securities as of December 31, 2023 | $ | 68.8 | 2.22 | % | $ | 1,715.9 | 1.51 | % | $ | 609.1 | 2.51 | % | $ | 164.9 | 5.75 | % | $ | 2,558.7 | 2.04 | % | $ | 2,255.3 | ||||||
Held-to-maturity securities | ||||||||||||||||||||||||||||
Government agency debt securities | $ | — | — | % | $ | — | — | % | $ | — | — | % | $ | 52.0 | 1.58 | % | $ | 52.0 |
| 1.58 | % | $ | 47.5 | |||||
Mortgage-backed securities(2): | ||||||||||||||||||||||||||||
Residential - Government agency | — | — | — | — | 43.9 | 2.15 | — | — | 43.9 | 2.15 | 38.7 | |||||||||||||||||
Residential - Government-sponsored enterprises | — | — | — | — | 46.3 | 1.42 | 53.1 | 1.75 | 99.4 | 1.59 | 88.4 | |||||||||||||||||
Commercial - Government agency | — | — | 6.3 | 1.64 | 24.5 | 2.02 | — | — | 30.8 | 1.94 | 23.8 | |||||||||||||||||
Commercial - Government-sponsored enterprises | — | — | 167.8 | 1.80 | 538.8 | 1.74 | 423.1 | 2.40 | 1,129.7 | 2.00 | 999.2 | |||||||||||||||||
Collateralized mortgage obligations(2): | ||||||||||||||||||||||||||||
Government agency | — | — | — | — | 865.4 | 1.40 | 123.7 | 1.36 | 989.1 | 1.39 | 879.7 | |||||||||||||||||
Government-sponsored enterprises | — | — | 206.3 | 1.60 | 1,335.2 | 1.49 | 100.8 | 1.43 | 1,642.3 | 1.50 | 1,448.4 | |||||||||||||||||
Debt securities issued by state and political subdivisions | — | — | — | — | 22.1 | 2.13 | 32.1 | 2.37 | 54.2 | 2.27 | 49.2 | |||||||||||||||||
Total held-to-maturity securities as of December 31, 2023 | $ | — | — | % | $ | 380.4 | 1.69 | % | $ | 2,876.2 | 1.53 | % | $ | 784.8 | 2.01 | % | $ | 4,041.4 | 1.64 | % | $ | 3,574.9 | ||||||
| (1) | Weighted-average yields were computed on a fully taxable-equivalent basis. |
| (2) | Maturities for mortgage-backed securities and collateralized mortgage obligations anticipate future prepayments. |
The carrying value of our investment securities portfolio was $6.3 billion as of December 31, 2023, a decrease of $1.2 billion or 16% compared to December 31, 2022. The lower balances in investment securities were driven by sales, maturities, and payments during the year ended December 31, 2023, which were used to fund loan growth and offset a decline in deposits. Our available-for-sale investment securities are carried at fair value with changes in fair value reflected in other comprehensive income (loss) or through the Provision. Our held-to-maturity investment securities are carried at amortized cost.
During the year ended December 31, 2022, we reclassified at fair value $4.6 billion in available-for-sale investment securities to the held-to-maturity category. The related total unrealized after-tax losses of approximately $372.4 million remained in accumulated other comprehensive loss to be amortized over the estimated remaining life of the securities as an adjustment of yield, offsetting the related accretion of the discount on the transferred securities. No gains or losses were recognized at the time of reclassification. In addition, we consider the held-to-maturity classification of these investment securities to be appropriate as there is both the positive intent and ability to hold these securities to maturity. There were no securities transferred from available-for-sale investment securities to the held-to-maturity category during the year ended December 31, 2023.
As of December 31, 2023, we maintained all of our investment securities in either the available-for-sale category (recorded at fair value) or the held-to-maturity category (recorded at amortized cost) in the consolidated balance sheets, with $3.5 billion invested in collateralized mortgage obligations issued by Ginnie Mae, Fannie Mae and Freddie Mac. Our investment securities portfolio also included $2.4 billion in mortgage-backed securities issued by Ginnie Mae, Fannie Mae, Freddie Mac and Municipal Housing Authorities and non-agency entities, $247.9 million in collateralized loan obligations, $104.1 million in debt securities issued by the U.S. Treasury, government agencies (U.S. International Development Finance Corporation bonds) and government-sponsored enterprises and $54.2 million in debt securities issued by states and political subdivisions.
70
We continually evaluate our investment securities portfolio in response to established asset/liability management objectives, changing market conditions that could affect profitability and the level of interest rate risk to which we are exposed. These evaluations may cause us to change the level of funds we deploy into investment securities and change the composition of our investment securities portfolio.
Gross unrealized gains in our investment securities portfolio were $0.2 million and $0.1 million as of December 31, 2023 and 2022, respectively. Gross unrealized losses in our investment securities portfolio were $770.2 million and $904.3 million as of December 31, 2023 and 2022. The lower gross unrealized loss position was primarily due to paydowns in our investment securities portfolio.
For our available-for-sale investment securities, we conduct a regular assessment of our investment securities portfolio to determine whether any securities are impaired. If this assessment indicates that a credit loss exists, the present value of cash flows expected to be collected from the security is compared to the amortized cost basis of the security. If the present value of cash flows expected to be collected is less than the amortized cost basis, a credit loss exists and an allowance for credit losses is recorded for the credit loss, limited by the amount that the fair value is less than the amortized cost basis. Any impairment that has not been recorded through the allowance for credit losses is recognized in other comprehensive income. For the years ended December 31, 2023 and 2022, we did not record any credit losses related to our available-for-sale investment securities portfolio.
For our held-to-maturity investment securities, we utilize the Current Expected Credit Loss (“CECL”) approach to estimate lifetime expected credit losses. Substantially all of our held-to-maturity securities are issued by the U.S. Government, its agencies and government-sponsored enterprises. These securities have a long history of no credit losses and carry the explicit or implicit guarantee of the U.S. government. Therefore, as of December 31, 2023 and 2022, we did not record an allowance for credit losses related to our held-to-maturity investment securities portfolio.
We are required to hold non-marketable equity securities, comprised of FHLB stock, as a condition of our membership in the FHLB system. Our FHLB stock is accounted for at cost, which equals par or redemption value. As of December 31, 2023 and 2022, we held $32.6 million and $10.1 million in FHLB stock, respectively, which is recorded as a component of other assets in our consolidated balance sheets.
See “Note 3. Investment Securities” in the notes to the consolidated financial statements included in Item 8. Financial Statements and Supplementary Data for more information on our investment securities portfolio.
Loans and Leases
Table 11 presents the composition of our loan and lease portfolio by major categories as of December 31, 2023 and 2022:
Loans and Leases | Table 11 | |||||
December 31, | December 31, | |||||
(dollars in thousands) |
| 2023 |
| 2022 | ||
Commercial and industrial: |
| |||||
Commercial and industrial excluding Paycheck Protection Program loans | $ | 2,156,872 | $ | 2,217,604 | ||
Paycheck Protection Program loans | 8,477 | 18,293 | ||||
Total commercial and industrial | 2,165,349 | 2,235,897 | ||||
Commercial real estate | 4,340,243 | 4,132,309 | ||||
Construction | 900,292 | 844,643 | ||||
Residential: | ||||||
Residential mortgage | 4,283,315 | 4,302,788 | ||||
Home equity line | 1,174,588 | 1,055,351 | ||||
Total residential | 5,457,903 | 5,358,139 | ||||
Consumer | 1,109,901 | 1,222,934 | ||||
Lease financing | 379,809 | 298,090 | ||||
Total loans and leases | $ | 14,353,497 | $ | 14,092,012 | ||
71
Total loans and leases were $14.4 billion as of December 31, 2023, an increase of $261.5 million or 2% from December 31, 2022, with increases in commercial real estate loans, construction loans, residential real estate loans and lease financing, partially offset by decreases in commercial and industrial loans and consumer loans.
Commercial and industrial loans are made primarily to corporations, middle market and small businesses for the purpose of financing equipment acquisition, expansion, working capital and other general business purposes. We also offer a variety of automobile dealer flooring lines to our customers in Hawaii and California to assist with the financing of their inventory. Commercial and industrial loans were $2.2 billion as of December 31, 2023, a decrease of $70.5 million or 3% from December 31, 2022.
Commercial real estate loans are secured by first mortgages on commercial real estate at loan to value (“LTV”) ratios generally not exceeding 75% and a minimum debt service coverage ratio of 1.20 to 1. The commercial properties are predominantly apartments, neighborhood and grocery anchored retail, industrial, office, and to a lesser extent, specialized properties such as hotels. The primary source of repayment for investor property and owner occupied property is cash flow from the property and the operating cash flow from the business, respectively. Commercial real estate loans were $4.3 billion as of December 31, 2023, an increase of $207.9 million or 5% from December 31, 2022. This increase was primarily due to completed construction loans that were converted to commercial real estate loans during the year.
Construction loans are for the purchase or construction of a property for which repayment will be generated by the property. Loans in this portfolio are primarily for the purchase of land, as well as for the development of commercial properties, single family homes and condominiums. We classify loans as construction until the completion of the construction phase. Following construction, if a loan is retained by the Bank, the loan is reclassified to the commercial real estate or residential real estate classes of loans. Construction loans were $900.3 million as of December 31, 2023, an increase of $55.6 million or 7% from December 31, 2022. The increase in construction loans was primarily due to draws on existing lines, partially offset by the completion of construction loans mentioned above during the year.
Residential real estate loans are generally secured by 1-4 unit residential properties and are underwritten using traditional underwriting systems to assess the credit risks and financial capacity and repayment ability of the consumer. Decisions are primarily based on LTV ratios, debt-to-income (“DTI”) ratios, liquidity and credit scores. LTV ratios generally do not exceed 80%, although higher levels are permitted with mortgage insurance. We offer fixed rate mortgage products and variable rate mortgage products including HELOC. Since our transition from LIBOR in late 2021, we now offer variable rate mortgage products based on SOFR with interest rates that are subject to change every six months after the third, fifth, seventh or tenth year, depending on the product. Prior to this, we offered variable rate mortgage products based on LIBOR with interest rates that were subject to change every year after the first, third, fifth or tenth year, depending on the product. Variable rate residential mortgage loans are underwritten at fully-indexed interest rates. We generally do not offer interest-only, payment-option facilities, Alt-A loans or any product with negative amortization. Residential real estate loans were $5.5 billion as of December 31, 2023, an increase of $99.8 million or 2% from December 31, 2022.
Consumer loans consist primarily of open- and closed-end direct and indirect credit facilities for personal, automobile and household purchases as well as credit card loans. We seek to maintain reasonable levels of risk in consumer lending by following prudent underwriting guidelines, which include an evaluation of personal credit history, cash flow and collateral values based on existing market conditions. Consumer loans were $1.1 billion as of December 31, 2023, a decrease of $113.0 million or 9% from December 31, 2022. This decrease was primarily due to a $115.0 million decrease in indirect automobile loans, partially offset by a slight increase in credit card balances.
Lease financing consists of commercial single investor leases and leveraged leases. Underwriting of new lease transactions is based on our lending policy, including but not limited to an analysis of customer cash flows and secondary sources of repayment, including the value of leased equipment, the guarantors’ cash flows and/or other credit enhancements. No new leveraged leases are being added to the portfolio and all remaining leveraged leases are running off. Lease financing was $379.8 million as of December 31, 2023, an increase of $81.7 million or 27% from December 31, 2022. The increase was primarily due to the closing of several large lease transactions during the year.
See “Note 4. Loans and Leases” in the notes to the consolidated financial statements included in Item 8. Financial Statements and Supplementary Data and the discussion in “Analysis of Financial Condition — Allowance for Credit Losses” of this MD&A for more information on our loan and lease portfolio.
72
The Company’s loan and lease portfolio includes adjustable-rate loans, primarily tied to SOFR and Prime, hybrid rate loans, for which the initial rate is fixed for a period from one year to as much as ten years, and fixed rate loans, for which the interest rate does not change through the life of the loan or the remaining life of the loan. Table 12 presents the recorded investment in our loan and lease portfolio as of December 31, 2023:
Loans and Leases by Rate Type | Table 12 | ||||||||||||||||||||||||||||||
December 31, 2023 | |||||||||||||||||||||||||||||||
Adjustable Rate | |||||||||||||||||||||||||||||||
Hybrid | Fixed | ||||||||||||||||||||||||||||||
(dollars in thousands) |
| Treasury |
| LIBOR |
| BSBY |
| Prime |
| SOFR (1) |
| Other |
| Total |
| Rate |
| Rate |
| Total | |||||||||||
Commercial and industrial | $ | — | $ | — | $ | 40,636 | $ | 289,544 | $ | 885,392 | $ | 640,555 | $ | 1,856,127 | $ | 24,153 | $ | 285,069 | $ | 2,165,349 | |||||||||||
Commercial real estate | — | — | 84,935 | 483,260 | 2,384,924 | 904,599 | 3,857,718 | 145,953 | 336,572 | 4,340,243 | |||||||||||||||||||||
Construction | 9 | — | 26,298 | 96,807 | 603,457 | 14,395 | 740,966 | 5,173 | 154,153 | 900,292 | |||||||||||||||||||||
Residential: | |||||||||||||||||||||||||||||||
Residential mortgage | 6,033 | 86,461 | — | 11,542 | 147,441 | 71,514 | 322,991 | 552,275 | 3,408,049 | 4,283,315 | |||||||||||||||||||||
Home equity line | 91 | — | — | 534 | — | — | 625 | 920,577 | 253,386 | 1,174,588 | |||||||||||||||||||||
Total residential | 6,124 | 86,461 | — | 12,076 | 147,441 | 71,514 | 323,616 | 1,472,852 | 3,661,435 | 5,457,903 | |||||||||||||||||||||
Consumer | 1,020 | — | 50 | 337,088 | — | 1,134 | 339,292 | 729 | 769,880 | 1,109,901 | |||||||||||||||||||||
Lease financing | — | — | — | — | — | — | — | — | 379,809 | 379,809 | |||||||||||||||||||||
Total loans and leases | $ | 7,153 | $ | 86,461 | $ | 151,919 | $ | 1,218,775 | $ | 4,021,214 | $ | 1,632,197 | $ | 7,117,719 | $ | 1,648,860 | $ | 5,586,918 | $ | 14,353,497 | |||||||||||
% by rate type at December 31, 2023 | 1 | % | 1 | % | 1 | % | 8 | % | 28 | % | 11 | % | 50 | % | 11 | % | 39 | % | 100 | % | |||||||||||
| (1) | Includes $3.3 billion in CME Term SOFR loans. |
Tables 13 and 14 present the geographic distribution of our loan and lease portfolio as of December 31, 2023 and 2022:
Geographic Distribution of Loan and Lease Portfolio | Table 13 | ||||||||||||||
December 31, 2023 | |||||||||||||||
U.S. | Guam & | Foreign & | |||||||||||||
(dollars in thousands) |
| Hawaii |
| Mainland(1) |
| Saipan |
| Other |
| Total | |||||
Commercial and industrial | $ | 862,698 | $ | 1,179,343 | $ | 97,416 | $ | 25,892 | $ | 2,165,349 | |||||
Commercial real estate | 2,353,847 | 1,599,984 | 386,412 | — | 4,340,243 | ||||||||||
Construction | 392,328 | 459,314 | 48,650 | — | 900,292 | ||||||||||
Residential: | |||||||||||||||
Residential mortgage | 4,134,062 | 2,682 | 146,571 | — | 4,283,315 | ||||||||||
Home equity line | 1,130,999 | 313 | 43,276 | — | 1,174,588 | ||||||||||
Total residential | 5,265,061 | 2,995 | 189,847 | — | 5,457,903 | ||||||||||
Consumer | 761,328 | 38,577 | 307,358 | 2,638 | 1,109,901 | ||||||||||
Lease financing | 171,629 | 193,740 | 14,440 | — | 379,809 | ||||||||||
Total Loans and Leases | $ | 9,806,891 | $ | 3,473,953 | $ | 1,044,123 | $ | 28,530 | $ | 14,353,497 | |||||
Percentage of Total Loans and Leases | 68% | 24% | 7% | 1% | 100% | ||||||||||
| (2) | For secured loans and leases, classification as U.S. Mainland is made based on where the collateral is located. For unsecured loans and leases, classification as U.S. Mainland is made based on the location where the majority of the borrower's business operations are conducted. |
73
Geographic Distribution of Loan and Lease Portfolio | Table 14 | ||||||||||||||
December 31, 2022 | |||||||||||||||
U.S. | Guam & | Foreign & | |||||||||||||
(dollars in thousands) |
| Hawaii |
| Mainland(1) |
| Saipan |
| Other |
| Total | |||||
Commercial and industrial | $ | 917,232 | $ | 1,192,766 | $ | 98,601 | $ | 27,298 | $ | 2,235,897 | |||||
Commercial real estate | 2,306,075 | 1,435,512 | 390,722 | — | 4,132,309 | ||||||||||
Construction | 361,899 | 475,744 | 7,000 | — | 844,643 | ||||||||||
Residential: | |||||||||||||||
Residential mortgage | 4,152,272 | 452 | 150,064 | — | 4,302,788 | ||||||||||
Home equity line | 1,020,538 | — | 34,813 | — | 1,055,351 | ||||||||||
Total residential | 5,172,810 | 452 | 184,877 | — | 5,358,139 | ||||||||||
Consumer | 877,550 | 41,647 | 300,324 | 3,413 | 1,222,934 | ||||||||||
Lease financing | 90,755 | 193,423 | 13,912 | — | 298,090 | ||||||||||
Total Loans and Leases | $ | 9,726,321 | $ | 3,339,544 | $ | 995,436 | $ | 30,711 | $ | 14,092,012 | |||||
Percentage of Total Loans and Leases | 69% | 23% | 7% | 1% | 100% | ||||||||||
| (1) | For secured loans and leases, classification as U.S. Mainland is made based on where the collateral is located. For unsecured loans and leases, classification as U.S. Mainland is made based on the location where the majority of the borrower's business operations are conducted. |
Our lending activities are concentrated primarily in Hawaii. However, we also have lending activities on the U.S. mainland, Guam and Saipan. Our commercial lending activities on the U.S. mainland include automobile dealer flooring activities in California, participation in the Shared National Credits Program and selective commercial real estate projects based on existing customer relationships. Our lease financing portfolio includes commercial leveraged and single investor lease financing activities both in Hawaii and on the U.S. mainland. However, no new leveraged leases are being added to the portfolio and all remaining leveraged leases are running off. Our consumer lending activities are concentrated primarily in Hawaii and to a smaller extent, Guam and Saipan.
Table 15 presents the contractual maturities of our loan and lease portfolio by major categories and the sensitivities to changes in interest rates as of December 31, 2023:
Maturities for Loan and Lease Portfolio(1) | Table 15 | ||||||||||||||
December 31, 2023 | |||||||||||||||
Due in One | Due After One | Due After Five | Due After | ||||||||||||
(dollars in thousands) |
| Year or Less |
| to Five Years |
| to Fifteen Years |
| Fifteen Years |
| Total | |||||
Commercial and industrial | $ | 709,528 | $ | 1,161,302 | $ | 220,928 | $ | 73,591 | $ | 2,165,349 | |||||
Commercial real estate | 711,807 | 2,161,736 | 1,439,768 | 26,932 | 4,340,243 | ||||||||||
Construction | 283,216 | 497,980 | 88,193 | 30,903 | 900,292 | ||||||||||
Residential: | |||||||||||||||
Residential mortgage | 15,368 | 48,057 | 454,488 | 3,765,402 | 4,283,315 | ||||||||||
Home equity line | 18,903 | 104,408 | 150,736 | 900,541 | 1,174,588 | ||||||||||
Total residential | 34,271 | 152,465 | 605,224 | 4,665,943 | 5,457,903 | ||||||||||
Consumer | 177,501 | 757,675 | 174,725 | — | 1,109,901 | ||||||||||
Lease financing | 21,235 | 148,253 | 147,122 | 63,199 | 379,809 | ||||||||||
Total Loans and Leases | $ | 1,937,558 | $ | 4,879,411 | $ | 2,675,960 | $ | 4,860,568 | $ | 14,353,497 | |||||
Total of loans and leases with: | |||||||||||||||
Adjustable interest rates | $ | 1,756,286 | $ | 3,593,548 | $ | 1,510,697 | $ | 257,188 | $ | 7,117,719 | |||||
Hybrid interest rates | 47,461 | 186,323 | 136,877 | 1,278,199 | 1,648,860 | ||||||||||
Fixed interest rates | 133,811 | 1,099,540 | 1,028,386 | 3,325,181 | 5,586,918 | ||||||||||
Total Loans and Leases | $ | 1,937,558 | $ | 4,879,411 | $ | 2,675,960 | $ | 4,860,568 | $ | 14,353,497 | |||||
| (1) | Based on contractual maturities, including extension and renewal options that are not unconditionally cancellable by the Company. |
74
Credit Quality
We evaluate certain loans and leases, including commercial and industrial loans, commercial real estate loans and construction loans, individually for impairment and non-accrual status. A loan is considered to be impaired when it is probable that we will be unable to collect all amounts due according to the contractual terms of the loan. We generally place a loan on non-accrual status when management believes that collection of principal or interest has become doubtful or when a loan or lease becomes 90 days past due as to principal or interest, unless it is well secured and in the process of collection. Loans on non-accrual status are generally classified as impaired, but not all impaired loans are necessarily placed on non-accrual status. See “Note 5. Allowance for Credit Losses” in the notes to consolidated financial statements included in Item 8. Financial Statements and Supplementary Data for more information about our credit quality indicators.
For purposes of managing credit risk and estimating the ACL, management has identified three portfolio segments (commercial, residential and consumer) that we use to develop our systematic methodology to determine the ACL. The categorization of loans for the evaluation of credit risk is specific to our credit risk evaluation process and these loan categories are not necessarily the same as the loan categories used for other evaluations of our loan portfolio. See “Note 5. Allowance for Credit Losses” in the notes to the consolidated financial statements included in Item 8. Financial Statements and Supplementary Data for more information about our approach to estimating the ACL.
The following tables and discussion address non-performing assets and loans and leases that are 90 days past due but are still accruing interest.
Non-Performing Assets and Loans and Leases Past Due 90 Days or More and Still Accruing Interest
Table 16 presents information on our Non-Performing Assets (“NPAs”) and Accruing Loans and Leases Past Due 90 Days or More as of December 31, 2023 and 2022:
Non-Performing Assets and Accruing Loans and Leases Past Due 90 Days or More | Table 16 | ||||||
December 31, | |||||||
(dollars in thousands) |
| 2023 | 2022 | ||||
Non-Performing Assets | |||||||
Non-Accrual Loans and Leases | |||||||
Commercial Loans: | |||||||
Commercial and industrial | $ | 970 | $ | 1,215 | |||
Commercial real estate | 2,953 | 727 | |||||
Total Commercial Loans | 3,923 | 1,942 | |||||
Residential Loans: | |||||||
Residential mortgage | 7,620 | 6,166 | |||||
Home equity line | 7,052 | 3,797 | |||||
Total Residential Loans | 14,672 | 9,963 | |||||
Total Non-Accrual Loans and Leases | 18,595 | 11,905 | |||||
Other Real Estate Owned ("OREO") | — | 91 | |||||
Total Non-Performing Assets | $ | 18,595 | $ | 11,996 | |||
Accruing Loans and Leases Past Due 90 Days or More | |||||||
Commercial Loans: | |||||||
Commercial and industrial | $ | 494 | $ | 291 | |||
Commercial real estate | 300 | — | |||||
Total Commercial Loans | 794 | 291 | |||||
Residential mortgage | — | 58 | |||||
Consumer | 2,702 | 2,885 | |||||
Total Accruing Loans and Leases Past Due 90 Days or More | $ | 3,496 | $ | 3,234 | |||
Total Loans and Leases | $ | 14,353,497 | $ | 14,092,012 | |||
Ratio of Non-Accrual Loans and Leases to Total Loans and Leases | 0.13 | % | 0.08 | % | |||
Ratio of Non-Performing Assets to Total Loans and Leases and OREO | 0.13 | % | 0.09 | % | |||
Ratio of Non-Performing Assets and Accruing Loans and Leases Past Due 90 Days or More to Total Loans and Leases and OREO | 0.15 | % | 0.11 | % | |||
75
Table 17 presents the activity in NPAs for the years ended December 31, 2023 and 2022:
Non-Performing Assets | Table 17 | |||||
Year Ended December 31, | ||||||
(dollars in thousands) |
| 2023 |
| 2022 | ||
Balance at beginning of year | $ | 11,996 | $ | 7,257 | ||
Additions | 13,238 | 8,527 | ||||
Reductions | ||||||
Payments | (3,684) | (1,906) | ||||
Return to accrual status | (2,571) | (760) | ||||
Sales of other real estate owned | (91) | (314) | ||||
Transfers to loans held for sale | — | (288) | ||||
Charge-offs/write-downs | (293) | (520) | ||||
Total Reductions | (6,639) | (3,788) | ||||
Balance at end of year | $ | 18,595 | $ | 11,996 | ||
The level of NPAs represents an indicator of the potential for future credit losses. NPAs consist of non-accrual loans and leases and OREO. Changes in the level of non-accrual loans and leases typically represent increases for loans and leases that reach a specified past due status, offset by reductions for loans and leases that are charged-off, paid down, sold, transferred to held for sale classification, transferred to OREO or are no longer classified as non-accrual because they have returned to accrual status as a result of continued performance and an improvement in the borrower’s financial condition and loan repayment capabilities.
Total NPAs were $18.6 million as of December 31, 2023, an increase of $6.6 million or 55% from December 31, 2022. The ratio of our NPAs to total loans and leases and OREO was 0.13% as of December 31, 2023, a four basis point increase from December 31, 2022. The increase in total NPAs was due to a $3.3 million increase in home equity lines, a $2.2 million increase in commercial real estate loans and a $1.5 million increase in residential mortgage loans, offset by a $0.2 million decrease in commercial and industrial loans and a $0.1 million decrease in OREO.
The largest component of our NPAs continues to be residential mortgage loans. The level of these NPAs remains elevated due to a lengthy judicial foreclosure process in Hawaii. As of December 31, 2023, residential mortgage non-accrual loans were $7.6 million, an increase of $1.5 million or 24% from December 31, 2022. This increase was primarily due to additions in residential mortgage loans of $3.3 million, offset by $1.0 million in payments, $0.8 million in returns to accrual status and a $0.1 million transfer to OREO. As of December 31, 2023, our residential mortgage non-accrual loans were comprised of 37 loans with a weighted average current loan-to-value (“LTV”) ratio of 37%.
Home equity line non-accrual loans were $7.1 million as of December 31, 2023, an increase of $3.3 million or 86% from December 31, 2022. This increase was due to additions in home equity lines of $7.0 million, offset by returns to accrual status of $1.8 million, payments of $1.6 million and charge-offs of $0.3 million.
Commercial and industrial non-accrual loans were $1.0 million as of December 31, 2023, a decrease of $0.2 million or 20% from December 31, 2022, primarily due to payments during the year.
Commercial real estate non-accrual loans were $3.0 million as of December 31, 2023, an increase of $2.2 million from December 31, 2022. This increase was due to additions in commercial real estate loans of $2.9 million, offset by $0.7 million in payments.
OREO represents property acquired as a result of borrower defaults on loans. OREO is recorded at fair value, less estimated selling costs, at the time of foreclosure. On an ongoing basis, properties are appraised as required by market conditions and applicable regulations. There was no OREO held as of December 31, 2023. OREO was $0.1 million as of December 31, 2022, which was comprised of one residential property.
Loans and Leases Past Due 90 Days or More and Still Accruing Interest. Loans and leases in this category are 90 days or more past due, as to principal or interest, and are still accruing interest because they are well secured and in the process of collection.
76
Loans and leases past due 90 days or more and still accruing interest were $3.5 million as of December 31, 2023, an increase of $0.3 million or 8% as compared to December 31, 2022. This increase was due to increases in commercial real estate loans of $0.3 million, commercial and industrial loans of $0.2 million, offset by a decrease in consumer loans of $0.2 million that were past due 90 days or more and still accruing interest as of December 31, 2023.
Allowance for Credit Losses for Loans and Leases & Reserve for Unfunded Commitments
Table 18 presents an analysis of our ACL for the years ended December 31, 2023 and 2022:
Allowance for Credit Losses and Reserve for Unfunded Commitments | Table 18 | ||||||
December 31, | |||||||
(dollars in thousands) |
| 2023 |
| 2022 | |||
Balance at Beginning of Year | $ | 177,735 | $ | 187,584 | |||
Loans and Leases Charged-Off | |||||||
Commercial Loans: | |||||||
Commercial and industrial | (3,482) | (2,012) | |||||
Commercial real estate | (2,500) | (750) | |||||
Total Commercial Loans | (5,982) | (2,762) | |||||
Residential Loans: | |||||||
Residential mortgage | (122) | (103) | |||||
Home equity line | (292) | (1,175) | |||||
Total Residential Loans | (414) | (1,278) | |||||
Consumer | (17,110) | (16,848) | |||||
Total Loans and Leases Charged-Off | (23,506) | (20,888) | |||||
Recoveries on Loans and Leases Previously Charged-Off | |||||||
Commercial Loans: | |||||||
Commercial and industrial | 3,346 | 897 | |||||
Commercial real estate | — | 14 | |||||
Lease financing | — | 60 | |||||
Total Commercial Loans | 3,346 | 971 | |||||
Residential Loans: | |||||||
Residential mortgage | 141 | 418 | |||||
Home equity line | 702 | 713 | |||||
Total Residential Loans | 843 | 1,131 | |||||
Consumer | 7,090 | 7,545 | |||||
Total Recoveries on Loans and Leases Previously Charged-Off | 11,279 | 9,647 | |||||
Net Loans and Leases Charged-Off | (12,227) | (11,241) | |||||
Provision for Credit Losses | 26,630 | 1,392 | |||||
Balance at End of Year | $ | 192,138 | $ | 177,735 | |||
Components: | |||||||
Allowance for Credit Losses | $ | 156,533 | $ | 143,900 | |||
Reserve for Unfunded Commitments | 35,605 | 33,835 | |||||
Total Allowance for Credit Losses and Reserve for Unfunded Commitments | $ | 192,138 | $ | 177,735 | |||
Average Loans and Leases Outstanding | $ | 14,266,291 | $ | 13,314,821 | |||
Ratio of Net Loans and Leases Charged-Off to Average Loans and Leases Outstanding | 0.09 | % | 0.08 | % | |||
Ratio of Allowance for Credit Losses for Loans and Leases to Loans and Leases Outstanding | 1.09 | % | 1.02 | % | |||
Ratio of Allowance for Credit Losses for Loans and Leases to Non-accrual Loans and Leases | 8.42x | 12.09x | |||||
77
Tables 19 and 20 present the allocation of the ACL by loan category, in both dollars and as a percentage of total loans and leases outstanding, as of December 31, 2023 and 2022:
Allocation of the Allowance for Credit Losses by Loan and Lease Category | Table 19 | |||||||
December 31, 2023 | ||||||||
Allocated | Loan | |||||||
ACL as | category as | |||||||
% of loan or | % of total | |||||||
lease | loans and | |||||||
(dollars in thousands) |
| Amount | category |
| leases | |||
Commercial and industrial | $ | 14,956 | 0.69 | % | 15.09 | % | ||
Commercial real estate | 43,944 | 1.01 | 30.24 | |||||
Construction | 10,392 | 1.15 | 6.27 | |||||
Lease financing | 1,754 | 0.46 | 2.65 | |||||
Total commercial | 71,046 | 0.91 | 54.25 | |||||
Residential mortgage | 36,880 | 0.86 | 29.84 | |||||
Home equity line | 11,728 | 1.00 | 8.18 | |||||
Total residential | 48,608 | 0.89 | 38.02 | |||||
Consumer | 36,879 | 3.32 | 7.73 | |||||
Total | $ | 156,533 | 1.09 | % | 100.00 | % | ||
Allocation of the Allowance for Credit Losses by Loan and Lease Category | Table 20 | |||||||
December 31, 2022 | ||||||||
Allocated | Loan | |||||||
ACL as | category as | |||||||
% of loan or | % of total | |||||||
lease | loans and | |||||||
(dollars in thousands) |
| Amount |
| category |
| leases |
| |
Commercial and industrial | $ | 14,564 | 0.65 | % | 15.87 | % | ||
Commercial real estate | 43,810 | 1.06 | 29.31 | |||||
Construction | 5,843 | 0.69 | 5.99 | |||||
Lease financing | 1,551 | 0.52 | 2.13 | |||||
Total commercial | 65,768 | 0.88 | 53.30 | |||||
Residential mortgage | 35,175 | 0.82 | 30.53 | |||||
Home equity line | 8,296 | 0.79 | 7.49 | |||||
Total residential | 43,471 | 0.81 | 38.02 | |||||
Consumer | 34,661 | 2.83 | 8.68 | |||||
Total | $ | 143,900 | 1.02 | % | 100.00 | % | ||
Table 21 presents the net charge-offs (recoveries) to average loans and leases by category during the years ended December 31, 2023 and 2022:
Net Charge-Offs (Recoveries) to Average Loans and Leases By Category | Table 21 | ||||||
December 31, | |||||||
| 2023 |
| 2022 |
| |||
Commercial and industrial | 0.01 | % | 0.06 | % | |||
Commercial real estate | 0.06 | 0.02 | |||||
Construction | — | — | |||||
Lease financing | — | (0.02) | |||||
Total commercial | 0.03 | 0.03 | |||||
Residential mortgage | — | (0.01) | |||||
Home equity line | (0.04) | 0.05 | |||||
Total residential | (0.01) | — | |||||
Consumer | 0.85 | 0.76 | |||||
Total loans and leases | 0.09 | % | 0.08 | % | |||
78
As of December 31, 2023, the ACL was $156.5 million or 1.09% of total loans and leases outstanding, compared with an ACL of $143.9 million or 1.02% of total loans and leases outstanding as of December 31, 2022. The level of the Allowance was commensurate with our stable credit risk profile, loan portfolio growth and composition and a stable Hawaii economy.
Net charge-offs of loans and leases were $12.2 million or 0.09% of total average loans and leases for the year ended December 31, 2023 compared to $11.2 million or 0.08% for 2022. Net charge-offs in our commercial lending portfolio were $2.6 million for the year ended December 31, 2023 compared to net charge-offs of $1.8 million for 2022. Net recoveries in our residential lending portfolio were $0.4 million for the year ended December 31, 2023 compared to net charge-offs of $0.1 million for 2022. Net charge-offs in our consumer lending portfolio were $10.0 million for the year ended December 31, 2023 compared to net charge-offs of $9.3 million for 2022. Net charge-offs in our consumer portfolio segment include those related to credit card, automobile loans, installment loans and small business lines of credit and reflect the inherent risk associated with these loans.
Although we determine the amount of each component of the ACL separately, the ACL as a whole was considered appropriate by management as of December 31, 2023 and 2022. Furthermore, as of December 31, 2023, the ACL was considered adequate based on our ongoing analysis of estimated expected credit losses, credit risk profiles, current economic outlook, coverage ratios and other relevant factors. The ACL anticipates cyclical losses consistent with a recession and includes a qualitative overlay for potential macroeconomic impacts. We will continue to monitor factors that drive expected credit losses including the uncertainty of the economy, inflation and geopolitical instability.
See “Note 5. Allowance for Credit Losses” in the notes to the consolidated financial statements included in Item 8. Financial Statements and Supplementary Data for more information on the ACL.
Goodwill
Goodwill was $995.5 million as of both December 31, 2023 and 2022. Our goodwill originated from the acquisition of the Company by BNPP in December of 2001. Goodwill generated in that acquisition was recorded on the balance sheet of the Bank as a result of push down accounting treatment, and remains on our consolidated balance sheets.
The Company’s policy is to assess goodwill for impairment at the reporting unit level on an annual basis or between annual assessments if a triggering event occurs or circumstances change that would more likely than not reduce the fair value of a reporting unit below its carrying amount. Impairment is the condition that exists when the carrying amount of a reporting unit exceeds its fair value. The Company performed its annual assessment of the criteria included in Accounting Standards Codification Topic 350, Intangibles – Goodwill and Other, and based on such assessment, the Company concluded that there was no impairment in our goodwill for the year ended December 31, 2023. Future events, including volatility in domestic and global markets, geopolitical concerns, inflation concerns, global supply chain issues, and other factors affecting the economy, that could cause a significant decline in our expected future cash flows or a significant adverse change in our business or the business climate may necessitate taking charges in future reporting periods related to the impairment of our goodwill.
Other Assets
Other assets were $845.7 million as of December 31, 2023, an increase of $48.7 million or 6% from December 31, 2022. This increase was due to a $39.5 million increase in affordable housing and other tax credit investment partnership interests and a $14.8 million increase in variable interest securities.
Deposits
Deposits are the primary funding source for the Bank and are acquired from a broad base of local markets, including both individual and corporate customers. We obtain funds from depositors by offering a range of deposit types, including demand, savings, money market and time.
79
Table 22 presents the composition of our deposits as of December 31, 2023 and December 31, 2022:
Deposits | Table 22 | |||||
December 31, | ||||||
(dollars in thousands) |
| 2023 |
| 2022 | ||
U.S.: | ||||||
Demand | $ | 6,609,483 | $ | 7,978,046 | ||
Savings | 5,986,066 | 5,957,368 | ||||
Money Market | 3,583,191 | 3,714,244 | ||||
Time | 3,162,658 | 2,265,163 | ||||
Foreign(1): | ||||||
Demand | 974,079 | 886,600 | ||||
Savings | 459,018 | 425,542 | ||||
Money Market | 264,662 | 251,179 | ||||
Time | 293,500 | 210,887 | ||||
Total Deposits(2) | $ | 21,332,657 | $ | 21,689,029 | ||
| (1) | Foreign deposits were comprised of Guam and Saipan deposit accounts. |
| (2) | Public deposits were $1.8 billion as of December 31, 2023, a decrease of $129.2 million or 7% compared to December 31, 2022. |
Total deposits were $21.3 billion as of December 31, 2023, a decrease of $356.4 million or 2% from December 31, 2022. The decrease in deposit balances stemmed primarily from a $951.1 million decrease in non-public demand deposit balances, a $330.0 million decrease in public demand deposit balances, a $116.4 million decrease in non-public savings deposit balances and a $115.3 million decrease in non-public money market deposit balances. These decreases were partially offset by a $955.7 million increase in non-public time deposit balances, a $178.6 million increase in public savings deposit balances and a $24.4 million increase in public time deposit balances.
As of December 31, 2023 and 2022, the amount of deposits that exceeded FDIC insurance limits were estimated to be $10.8 billion, or 51% of total deposits, and $11.1 billion, or 51% of total deposits, respectively. At December 31, 2023 and 2022, the Company had $1.8 billion and $1.9 billion, respectively, of public deposits, all of which were fully collateralized with investment securities. As of December 31, 2023 and 2022, the amount of deposits excluding public deposits that exceeded FDIC insurance limits were estimated to be $9.1 billion, or 42% of total deposits, and $9.2 billion, or 42% of total deposits, respectively. As of December 31, 2023 and 2022, deposits accounts above $250,000 were estimated to be $12.6 billion and $13.3 billion, respectively. As of December 31, 2023 and 2022, deposit balances over $250,000 in corporate operating accounts were estimated to be $2.3 billion and $2.9 billion, respectively.
Table 23 presents the amount of time deposits that were in excess of the FDIC insurance limit, further segregated by time remaining until maturity, as of December 31, 2023:
Uninsured Time Deposits | Table 23 | ||
(dollars in thousands) |
| December 31, 2023 | |
Three months or less | $ | 910,680 | |
Over three through six months | 315,844 | ||
Over six through twelve months | 426,165 | ||
Over twelve months | 34,388 | ||
Total(1) | $ | 1,687,077 |
| (1) | Includes $0.9 billion in public time deposits that are fully collateralized with investment securities. |
Short-term Borrowings
As of December 31, 2023, the Company’s short-term borrowings consisted of $500.0 million in short-term FHLB fixed-rate advances with a weighted average interest rate of 4.71% and maturity dates in September 2024. As of December 31, 2022, the Company’s short-term borrowings consisted of $75.0 million in federal funds purchased with a 4.35% annual interest rate that matured in January 2023.
80
As of both December 31, 2023 and 2022, the Company had a remaining line of credit of $2.5 billion available from the FHLB. The FHLB borrowing capacity was secured by commercial real estate and residential real estate loan collateral as of December 31, 2023 and residential real estate loan collateral as of December 31, 2022.
Pension and Postretirement Plan Obligations
We have a qualified noncontributory defined benefit pension plan, an unfunded supplemental executive retirement plan for certain key executives (“SERP”), a directors’ retirement plan, a non-qualified pension plan for eligible directors and a postretirement benefit plan providing life insurance and healthcare benefits that we offer to our directors and employees, as applicable. The qualified noncontributory defined benefit pension plan, the SERP and the directors’ retirement plan are all frozen plans to new participants. In March 2019, the Company’s board of directors approved an amendment to the SERP to freeze the SERP, which became effective on July 1, 2019. As a result of the amendment, since the effective date, there have not been any, and there will be no, new accruals of benefits, including service accruals. Existing benefits under the SERP, as of the effective date of the amendment described above, will otherwise continue in accordance with the terms of the SERP. To calculate annual pension costs, we use the following key variables: (1) size of the employee population, length of service and estimated compensation increases; (2) actuarial assumptions and estimates; (3) expected long-term rate of return on plan assets; and (4) discount rate.
Pension and postretirement benefit plan obligations, net of pension plan assets, were $92.8 million as of December 31, 2023, a decrease of $1.1 million or 1% from December 31, 2022. The balance as of December 31, 2023 included retirement benefits payable of $103.3 million for the Company’s underfunded plans, partially offset by pension plan assets for overfunded plans, recorded as a component of other assets on the consolidated balance sheets, of $10.5 million.
See “Note 14. Benefit Plans” in the notes to the consolidated financial statements included in Item 8. Financial Statements and Supplementary Data for more information on our pension and postretirement benefit plans.
Capital
The Company and the Bank are subject to the Capital Rules, which implemented the Basel Committee on Banking Supervision’s December 2010 final capital framework for strengthening international capital standards, known as Basel III, and various provisions of the Dodd-Frank Wall Street Reform and Consumer Protection Act. The Capital Rules require bank holding companies and their bank subsidiaries to maintain substantially more capital than previously required, with a greater emphasis on common equity. The Capital Rules, among other things, (i) impose a capital measure called CET1, (ii) specify that Tier 1 capital consists of CET1 and ‘‘Additional Tier 1 capital’’ instruments meeting specified requirements, (iii) define CET1 narrowly by requiring that most deductions/adjustments to regulatory capital measures be made to CET1 and not to the other components of capital and (iv) expand the scope of the deductions/adjustments to capital as compared to existing regulations.
The Capital Rules also require a 2.5% capital conservation buffer designed to absorb losses during periods of economic stress. The capital conservation buffer is composed entirely of CET1, on top of these minimum risk weighted asset ratios, effectively resulting in minimum ratios of (i) 7% CET1 to risk-weighted assets, (ii) 8.5% Tier 1 capital to risk-weighted assets, and (iii) 10.5% total capital to risk-weighted assets.
81
As of December 31, 2023, our capital levels remained characterized as “well capitalized” under the Capital Rules. Our regulatory capital ratios, calculated in accordance with the Capital Rules, are presented in Table 24 below. There have been no conditions or events since December 31, 2023 that management believes have changed either the Company’s or the Bank’s capital classifications.
Regulatory Capital | Table 24 | ||||||
December 31, | |||||||
(dollars in thousands) |
| 2023 | 2022 | ||||
Stockholders' Equity | $ | 2,486,066 | $ | 2,269,005 | |||
Less: | |||||||
Goodwill | 995,492 | 995,492 | |||||
Accumulated other comprehensive loss, net | (530,210) | (639,254) | |||||
Common Equity Tier 1 Capital and Tier 1 Capital | $ | 2,020,784 | $ | 1,912,767 | |||
Add: | |||||||
Qualifying allowance for credit losses and reserve for unfunded commitments | 192,138 | 177,735 | |||||
Total Capital | $ | 2,212,922 | $ | 2,090,502 | |||
Risk-Weighted Assets | $ | 16,308,345 | $ | 16,182,743 | |||
FHI's Key Regulatory Capital Ratios | |||||||
Common Equity Tier 1 Capital Ratio | 12.39 | % | 11.82 | % | |||
Tier 1 Capital Ratio | 12.39 | % | 11.82 | % | |||
Total Capital Ratio | 13.57 | % | 12.92 | % | |||
Tier 1 Leverage Ratio | 8.64 | % | 8.11 | % | |||
Total stockholders’ equity was $2.5 billion as of December 31, 2023, an increase of $217.1 million or 10% from December 31, 2022. The increase in stockholders’ equity was primarily due to net unrealized gains in our investment securities portfolio, net of tax, of $105.1 million and earnings for the year ended December 31, 2023 of $235.0 million. This was partially offset by dividends declared and paid to the Company’s stockholders of $132.6 million.
In January 2023, the Company announced a stock repurchase program for up to $40.0 million of its outstanding common stock during 2023. The Company did not repurchase any common stock outstanding under this stock repurchase program during the year ended December 31, 2023. In January 2024, the Company announced a stock repurchase program for up to $40.0 million of its outstanding common stock during 2024. The timing and exact amount of stock repurchases, if any, will be subject to management’s discretion and various factors, including the Company’s capital position and financial performance, as well as market conditions. The stock repurchase program may be suspended, terminated or modified at any time for any reason.
In January 2024, the Company’s Board of Directors declared a quarterly cash dividend of $0.26 per share on our outstanding shares. The dividend is to be paid on March 1, 2024 to shareholders of record at the close of business on February 16, 2024.
Critical Accounting Policies
Our consolidated financial statements were prepared in accordance with GAAP and follow general practices within the industries in which we operate. The most significant accounting policies we follow are presented in “Note 1. Organization and Summary of Significant Accounting Policies” in the notes to the consolidated financial statements included in Item 8. Financial Statements and Supplementary Data. Application of these principles requires us to make estimates, assumptions and judgments that affect the amounts reported in the consolidated financial statements and accompanying notes. Most accounting policies are not considered by management to be critical accounting policies. Several factors are considered in determining whether or not a policy is critical in the preparation of the consolidated financial statements. These factors include among other things, whether the policy requires management to make difficult, subjective and complex judgments about matters that are inherently uncertain and because it is likely that materially different amounts would be reported under different conditions or using different assumptions. The accounting policies which we believe to be most critical in preparing our consolidated financial statements are those that are related to the determination of the ACL, goodwill, fair value estimates, pension and postretirement benefit obligations and income taxes.
82
Allowance for Credit Losses
Management’s evaluation of the adequacy of the ACL is often the most critical of accounting estimates for a financial institution. Our determination of the amount of the ACL is a critical accounting estimate as it requires significant reliance on the accuracy of credit risk ratings on individual borrowers, the use of estimates and significant judgment as to the amount and timing of expected future cash flows on impaired loans, significant reliance on estimated loss rates on portfolios and consideration of our evaluation of macro-economic factors and trends. While our methodology involves estimating an ACL for each of our commercial, residential real estate and consumer portfolio segments, the entire ACL is available to absorb credit losses in the total loan and lease portfolio.
The ACL is a valuation account that is deducted from the amortized cost basis of loans and leases to present the net amount expected to be collected from loans and leases. Loans and leases are charged-off against the ACL when management believes the loan or lease balance is deemed uncollectible. Recoveries do not exceed the aggregate of amounts previously charged-off. Changes in the ACL and, therefore, in the related Provision, can materially affect net income. In applying the judgment and review required to determine the ACL, management considers changes in economic conditions, customer behavior, and collateral value, among other factors. Economic factors or business decisions may affect the composition and mix of the loan and lease portfolio, causing management to increase or decrease the ACL.
The following are some of the significant judgments and inherent limitations which affect the estimate of the ACL:
| ● | The Accuracy of Internal Credit Risk Ratings, Monitoring of Loans Past Due and Delinquency Trends. The ACL related to our commercial portfolio segment is generally most sensitive to the accuracy of internal credit risk ratings assigned to each borrower. Commercial loan risk ratings are evaluated based on each situation by experienced senior credit officers and are subject to periodic review by an internal team of credit specialists. |
| ● | Data. We have applied considerable judgments about the sufficiency and applicability of our internal data to provide an accurate view of historical loss information. For each of our portfolio segments we have examined between 8 and 12 years of historical data. For many of our residential real estate and consumer loan classes, we have assumed that the historical loss period observed is sufficient to capture a full credit loss cycle and that the credit loss exposures observed over this historical loss period are representative of those for which we will be making estimates of future expected credit losses under CECL. In making this assumption, we have relied on the fact that the historical loss period incorporated the most recent observed recessionary period as well as the subsequent period of sustained recovery and growth. |
| ● | Reasonable and Supportable Forecast Period. For contractual periods which extend beyond the one-year reasonable and supportable forecast period, management elected an immediate reversion to the mean approach. Management will continue to assess whether a one-year reasonable and supportable forecast period is appropriate. Changes to the economic environment and uncertainty with regards to the timing and extent of an economic recovery may result in management decreasing or increasing the current reasonable and supportable forecast period. |
| ● | Economic Adjustments over the Reasonable and Supportable Forecast Period. The Company uses a one-variable regression model to estimate the impact of Management’s economic outlook over the reasonable and supportable forecast period. The model uses the economic forecast as the input and outputs modifiers that adjust the long-run default rates. The Company’s economic forecast framework allows management to use judgment in selecting the economic model input and output. |
| ● | Qualitative Adjustments. For risks not captured in the long-run default rates or in the economic forecast model, the Company applies segment level dollar adjustments. These adjustments are estimated based on the best information available as of the reporting date and may include, as appropriate, overlays to account for economic related conditions not captured in the economic forecast model but expected to potentially impact losses, adjustments for model limitations, regulatory determinants, overlays for natural disasters, and other events such as the COVID-19 pandemic and the Maui wildfires. |
83
| ● | Identification and Measurement of Individually Assessed Loans, including Loans Modified with a Borrower Experiencing Financial Difficulty. Our experienced senior credit officers may consider a loan impaired based on their evaluation of current information and events, including loans modified with a borrower experiencing financial difficulty. The measurement of impairment is typically based on an analysis of the present value of expected future cash flows. The development of these expectations requires significant management judgment and estimation. |
The ACL for loans and leases was $156.5 million as of December 31, 2023, which represented an increase of $12.6 million, compared to the ACL for loans and leases of $143.9 million as of December 31, 2022. The level of the ACL was commensurate with our stable credit risk profile, loan portfolio growth and composition and a stable Hawaii economy. The reserve for unfunded commitments was $35.6 million as of December 31, 2023, which represented an increase of $1.8 million, compared to the reserve for unfunded commitments of $33.8 million as of December 31, 2022. The ACL for loans and leases and the reserve for unfunded commitments was considered adequate based on our ongoing analysis of estimated expected credit losses, credit risk profiles, current economic outlook, coverage ratios and other relevant factors. The ACL anticipates cyclical losses consistent with a recession and includes a qualitative overlay for potential macroeconomic impacts. We will continue to monitor factors that drive expected credit losses including the uncertainty of the economy, inflation and geopolitical instability.
To illustrate the sensitivity of the Company’s ACL model to credit quality, we downgraded the internal credit risk ratings on commercial loans by one grade and reduced FICO scores on retail loans by ten points. Downgrading 1% of our commercial portfolio would increase the ACL at December 31, 2023 by approximately $1.3 million, and reducing FICO scores on the entire retail portfolio would increase the ACL at December 31, 2023 by approximately $4.1 million. These sensitivity analyses are hypothetical and have been provided only to indicate the potential impact that changes in internal credit risk ratings and FICO scores may have on the ACL estimate, with all other inputs remaining constant.
See “Note 5. Allowance for Credit Losses” in the notes to the consolidated financial statements included in Item 8. Financial Statement and Supplementary Data and “Analysis of Financial Condition — Allowance for Credit Losses for Loans and Leases & Reserve for Unfunded Commitments” for more information on the ACL.
Goodwill
Goodwill represents the cost of acquired businesses in excess of the fair value of the net assets acquired. The Company’s policy is to assess goodwill for impairment at the reporting unit level on an annual basis at December 31 or between annual assessments if a triggering event occurs or circumstances change that would more likely than not reduce the fair value of a reporting unit below its carrying amount. Goodwill is tested for impairment by comparing the estimated fair value of each reporting unit with its carrying amount. Impairment is the condition that exists when the carrying amount of a reporting unit exceeds its fair value, and an impairment loss would be recognized in an amount equal to that excess. Subsequent reversals of goodwill impairment are prohibited.
The fair value of our reporting units is estimated using valuation methods based on the market and income approaches:
| ● | The market approach primarily involves the calculation of valuation multiples of comparable public companies (e.g., based on market capitalization, net income, book equity and tangible book equity). Because the initial fair value determined under the market approach represents a noncontrolling interest, a control premium is applied to arrive at the estimated fair value on a controlling basis. The key assumptions with respect to this method are the selected multiples and control premium. |
| ● | The income approach uses a discounted cash flow (DCF) method to value a company on a going concern basis. The DCF method is based on the present value of (1) multi-period projections of free cash flows and (2) a terminal value. The sum of the present value of the cash flows from the discrete period and the present value of the terminal value represents the fair value of the reporting unit under the income approach. The projected cash flows and terminal value are converted to present value through applying a discount rate. The key assumptions with respect to this method are the determination of the free cash flows, discount rate and terminal value. |
84
The Company performed its annual quantitative impairment test in accordance with Accounting Standards Codification Topic 350, Intangibles – Goodwill and Other, and based on such assessment, the Company concluded that there was no impairment in our goodwill for the year ended December 31, 2023.
Estimating the fair value of a reporting unit requires significant judgment and often involves the use of estimates and assumptions that could have a significant effect on whether or not an impairment charge is recorded and the magnitude of such a charge. Changes in these factors, as well as downturns in economic or business conditions, including volatility in domestic and global markets, geopolitical concerns, inflation concerns, global supply chain issues, and other factors affecting the economy, could have a significant adverse impact on the fair value of our reporting units in relation to their carrying amounts and could necessitate taking charges in future reporting periods related to the impairment of our goodwill.
Because there was no impairment for the current year ended December 31, 2023, our goodwill balance remained unchanged at December 31, 2023, compared to December 31, 2022.
To illustrate a hypothetical sensitivity analysis, a 100-basis point increase in the discount rate assumption across each of the Company’s reporting units would not have resulted in a fair value below the respective reporting unit’s carrying value.
See “Note 7. Other Assets” in the notes to the consolidated financial statements included in Item 8. Financial Statements and Supplementary Data for more information on goodwill.
Fair Value Measurements
Fair value is the price that would be received to sell an asset or paid to transfer a liability in the principal or most advantageous market for an asset or liability in an orderly transaction between market participants at the measurement date. The degree of management judgment involved in determining the fair value of a financial instrument is dependent upon the availability of quoted market prices or observable market inputs. For financial instruments that are traded actively and have quoted market prices or observable market inputs, there is minimal subjectivity involved in measuring fair value. However, when quoted market prices or observable market inputs are not fully available, significant management judgment may be necessary to estimate fair value. In developing our fair value measurements, we maximize the use of observable inputs and minimize the use of unobservable inputs.
The fair value hierarchy defines Level 1 valuations as those based on quoted prices, unadjusted, for identical instruments traded in active markets. Level 2 valuations are those based on quoted prices for similar instruments in active markets, quoted prices for identical or similar instruments in markets that are not active or model-based valuation techniques for which all significant assumptions are observable in the market. Level 3 valuations are based on model-based techniques that use at least one significant assumption not observable in the market, or significant management judgment or estimation, some of which may be internally developed.
Financial assets that are recorded at fair value on a recurring basis include available for sale investment securities, and derivative financial instruments. As of December 31, 2023 and 2022, $2.3 billion or 9% and $3.2 billion or 13%, respectively, of our total assets consisted of financial assets recorded at fair value on a recurring basis and most of these financial assets consisted of available for sale investment securities measured using information from a third-party pricing service. These investments in debt securities and mortgage backed securities were classified in Level 2 of the fair value hierarchy. Financial liabilities that were recorded at fair value on a recurring basis were comprised of derivative financial instruments. As of December 31, 2023 and 2022, $4.6 million or less than 1% and $50.1 million or less than 1%, respectively, of our total liabilities, consisted of financial liabilities recorded at fair value on a recurring basis. As of December 31, 2023 and 2022, $2.3 million and $49.3 million, respectively, was classified in Level 2 of the fair value hierarchy and $2.3 million and $0.9 million, respectively, was classified in Level 3 of the fair value hierarchy. As of December 31, 2023 and 2022, the liability which was classified in Level 3 of the fair value hierarchy was related to the sale of our Visa Class B restricted shares in 2016. We recorded a derivative liability which requires payment to the buyer of the Visa Class B restricted shares in the event Visa further reduces the conversion rate to its publicly traded Visa Class A shares.
85
Our third-party pricing service makes no representations or warranties that the pricing data provided to us is complete or free from errors, omissions or defects. As a result, we have processes in place to monitor and periodically review the information provided to us by our third-party pricing service:
| (1) | Our third-party pricing service provides us with documentation by asset class of inputs and methodologies used to value securities. We review this documentation to evaluate the inputs and valuation methodologies used to place securities into the appropriate level of the fair value hierarchy. This documentation is periodically updated by our third-party pricing service. Accordingly, transfers of securities within the fair value hierarchy are made if deemed necessary. |
| (2) | On a monthly basis, management reviews the pricing information received from our third-party pricing service. This review process includes a comparison to non-binding third-party broker quotes, as well as a review of market related conditions impacting the information provided by our third-party pricing service. We also identify investment securities which may have traded in illiquid or inactive markets by identifying instances of a significant decrease in the volume or frequency of trades relative to historic levels, as well as instances of a significant widening of the bid ask spread in the brokered markets. |
| (3) | Our third-party pricing service has also established processes for us to submit inquiries regarding quoted prices. Periodically, we will challenge the quoted prices provided by our third-party pricing service. Our third-party pricing service will review the inputs to the evaluation in light of the new market data presented by us. Our third-party pricing service may then affirm the original quoted price or may update the evaluation on a going forward basis. |
Based on the composition of our investment securities portfolio, we believe that we have developed appropriate internal controls and performed appropriate due diligence procedures to prevent or detect material misstatements by our third-party pricing service. See “Note 21. Fair Value” in the notes to the consolidated financial statements included in Item 8. Financial Statements and Supplementary Data for more information on our use of fair value estimates.
Pension and Postretirement Benefit Obligations
We use the following key variables to calculate annual pension costs: (1) size of the employee population, length of service and estimated compensation increases; (2) actuarial assumptions and estimates; (3) expected long-term rate of return on plan assets; and (4) discount rate. Pension cost is directly affected by the number of employees eligible for pension benefits and their estimated compensation increases. To calculate estimated compensation increases, management reviews our salary increases each year and compares this data with industry information. For all pension and postretirement plan calculations, we use a measurement date of December 31.
The expected long-term rate of return was based on a calculated rate of return from average rates of return on various asset classes over a 20-year historical time horizon. Using long-term historical data allows the Company to capture multiple economic environments, which management believes is relevant when using historical returns. Net actuarial gains or losses that exceed a 5% corridor of the greater of the projected benefit obligation or the fair value of plan assets as of the beginning of the year are amortized from accumulated other comprehensive income into net periodic pension cost on a straight-line basis over five years.
In estimating the projected benefit obligation, an independent actuary bases assumptions on factors such as mortality rate, turnover rate, retirement rate, disability rate and other assumptions related to the population of individuals in the pension plan. If significant actuarial gains or losses occur, the actuary reviews the demographic and economic assumptions with management, at which time the Company considers revising these assumptions based on actual results.
Our determination of the pension and postretirement benefit plan obligations and net periodic benefit cost is a critical accounting estimate as it requires the use of estimates and judgment related to the amount and timing of expected future cash outflows for benefit payments and cash inflows for maturities and return on plan assets. Changes in estimates and assumptions related to mortality rates and future health care costs could also have a material impact to our financial condition or results of operations. The discount rate assumption is used to determine the present value of future benefit obligations and the net periodic benefit cost. The discount rate assumption used to value the present value of future benefit obligations as of each year end is the rate used to determine the net periodic benefit cost for the following year.
86
The projected benefit obligation for pension benefits was $153.6 million as of December 31, 2023, which represented a decrease of $2.0 million, compared to the projected benefit obligation for pension benefits of $155.6 million as of December 31, 2022. The accumulated postretirement benefit obligation for other benefits was $16.8 million as of December 31, 2023, which represented an increase of $0.4 million, compared to the accumulated postretirement benefit obligation for other benefits of $16.4 million as of December 31, 2022.
To illustrate a hypothetical sensitivity analysis, if the discount rate assumption decreased by 100 basis points, the projected benefit obligation for pension benefits and accumulated postretirement benefit obligation for other benefits at December 31, 2023 would increase by approximately $11.9 million and $1.5 million, respectively.
See “Note 14. Benefit Plans” in the notes to the consolidated financial statements included in Item 8. Financial Statements and Supplementary Data for more information on pension and postretirement benefit plan obligations.
Income Taxes
In estimating income taxes payable or receivable, we assess the relative merits and risks of the appropriate tax treatment considering statutory, judicial and regulatory guidance in the context of each tax position. Accordingly, previously estimated liabilities are regularly reevaluated and adjusted through the provision for income taxes. Changes in the estimate of income taxes payable or receivable occur periodically due to changes in tax rates, interpretations of tax law, the status of examinations being conducted by various taxing authorities, the expiration of statutes of limitations and newly enacted statutory, judicial and regulatory guidance that impact the relative merits and risks of each tax position. These changes, when they occur, may affect the provision for income taxes as well as current and deferred income taxes, and may be significant to our consolidated statements of income and balance sheets.
Management's determination of the realization of net deferred tax assets is based upon management's judgment of various future events and uncertainties, including the timing and amount of future income, as well as the implementation of various tax planning strategies to maximize realization of the deferred tax assets. A valuation allowance is provided when it is more likely than not that some portion of the deferred tax asset will not be realized.
We are also required to record a liability for UTBs for the entire amount of a tax benefit taken in a prior or future income tax return when we determine that a tax position has a less than 50% likelihood of being accepted by the taxing authority. As of December 31, 2023 and 2022, our liabilities for UTBs were $212.0 million and $206.2 million, respectively. See “Note 15. Income Taxes” in the notes to the consolidated financial statements included in Item 8. Financial Statements and Supplementary Data for more information on income taxes.
Future Application of Accounting Pronouncements
For a discussion of the expected impact of accounting pronouncements recently issued but not adopted by us as of December 31, 2023, see “Note 1. Organization and Summary of Significant Accounting Policies — Recent Accounting Pronouncements” in the notes to the consolidated financial statements included in Item 8. Financial Statements and Supplementary Data for more information.
Risk Governance and Quantitative and Qualitative Disclosures About Market Risk
Managing risk is an essential part of successfully operating our business. Management believes that the most prominent risk exposures for the Company are credit risk, market risk, liquidity risk management, capital management and operational risk. See “Analysis of Financial Condition — Liquidity” and “—Capital” sections of this MD&A for further discussions of liquidity risk management and capital management, respectively.
87
Credit Risk
Credit risk is the risk that borrowers or counterparties will be unable or unwilling to repay their obligations in accordance with the underlying contractual terms. We manage and control credit risk in the loan and lease portfolio by adhering to well-defined underwriting criteria and account administration standards established by management. Written credit policies document underwriting standards, approval levels, exposure limits and other limits or standards deemed necessary and prudent. Portfolio diversification at the obligor, industry, product, and/or geographic location levels is actively managed to mitigate concentration risk. In addition, credit risk management includes an independent credit review process that assesses compliance with commercial, real estate and consumer credit policies, risk ratings and other critical credit information. In addition to implementing risk management practices that are based upon established and sound lending practices, we adhere to sound credit principles. We understand and evaluate our customers’ borrowing needs and capacity to repay, in conjunction with their character and history.
Management has identified three categories of loans that we use to develop our systematic methodology to determine the ACL: commercial, residential and consumer.
Commercial lending is further categorized into four distinct classes based on characteristics relating to the borrower, transaction and collateral. These classes are: commercial and industrial, commercial real estate, construction and lease financing. Commercial and industrial loans are primarily for the purpose of financing equipment acquisition, expansion, working capital and other general business purposes by medium to larger Hawaii based corporations, as well as U.S. mainland and international companies. Commercial and industrial loans are typically secured by non-real estate assets whereby the collateral is trading assets, enterprise value or inventory. As with many of our customers, our commercial and industrial loan customers are heavily dependent on tourism, government expenditures and real estate values. Commercial real estate loans are secured by real estate, including but not limited to structures and facilities to support activities designated as retail, health care, general office space, warehouse and industrial space. Our Bank’s underwriting policy generally requires that net cash flows from the property be sufficient to service the debt while still maintaining an appropriate amount of reserves. Commercial real estate loans in Hawaii are characterized by having a limited supply of real estate at commercially attractive locations, long delivery time frames for development and high interest rate sensitivity. Our construction lending portfolio consists primarily of land loans, single family and condominium development loans. Financing of construction loans is subject to a high degree of credit risk given the long delivery time frames for such projects. Construction lending activities are underwritten on a project financing basis whereby the cash flows or lease rents from the underlying real estate collateral or the sale of the finished inventory is the primary source of repayment. Market feasibility analysis is typically performed by assessing market comparables, market conditions and demand in the specific lending area and general community. We require presales of finished inventory or preleasing requirements prior to loan funding. However, because this analysis is typically performed on a forward-looking basis, real estate construction projects typically present a higher risk profile in our lending activities. Lease financing activities include commercial single investor leases and leveraged leases used to purchase items ranging from computer equipment to transportation equipment. Underwriting of new leasing arrangements typically includes analyzing customer cash flows, evaluating secondary sources of repayment, such as the value of the leased asset, the guarantors’ net cash flows as well as other credit enhancements provided by the lessee.
88
Residential lending is further categorized into the following classes: residential mortgages (loans secured by 1-4 family residential properties and home equity loans) and home equity lines of credit. Our Bank’s underwriting standards typically require LTV ratios of not more than 80%, although higher levels are permitted with accompanying mortgage insurance. First mortgage loans secured by residential properties generally carry a moderate level of credit risk, with an average loan size of approximately $395,000 as of December 31, 2023. Residential mortgage loan production is added to our loan portfolio or is sold in the secondary market, based on management’s evaluation of our liquidity, capital and loan portfolio mix as well as market conditions. Changes in interest rates, the economic environment and other market factors have impacted, and will likely continue to impact, the marketability and value of collateral and the financial condition of our borrowers which impacts the level of credit risk inherent in this portfolio, although we remain in a supply constrained housing environment in Hawaii. Geographic concentrations exist for this portfolio as nearly all residential mortgage loans and home equity lines of credit are for residences located in Hawaii, Guam or Saipan. These island locales are susceptible to a wide array of potential natural disasters including, but not limited to, hurricanes, floods, tsunamis and earthquakes. We offer home equity lines of credit with variable rates; fixed rate lock options may be available post-closing. All lines are underwritten at 2% over the fully indexed rate. Our procedures for underwriting home equity lines of credit include an assessment of an applicant’s overall financial capacity and repayment ability. Decisions are primarily based on repayment ability via debt-to-income ratios, LTV ratios and an evaluation of credit history.
Consumer lending is further categorized into the following classes of loans: credit cards, automobile loans and other consumer-related installment loans. Consumer loans are either unsecured or secured by the borrower’s personal assets. The average loan size is generally small and risk is diversified among many borrowers. We offer a wide array of credit cards for business and personal use. In general, our customers are attracted to our credit card offerings on the basis of price, credit limit, reward programs and other product features. Credit card underwriting decisions are generally based on repayment ability of our borrower via DTI ratios, credit bureau information, including payment history, debt burden and credit scores, such as FICO, and analysis of financial capacity. Automobile lending activities include loans and leases secured by new or used automobiles. We originate the majority of our automobile loans and leases on an indirect basis through selected dealerships. Our procedures for underwriting automobile loans include an assessment of an applicant’s overall financial capacity and repayment ability, credit history and the ability to meet existing obligations and payments on the proposed loan or lease. Although an applicant’s creditworthiness is the primary consideration, the underwriting process also includes a comparison of the value of the collateral security to the proposed loan amount. We require borrowers to maintain full coverage automobile insurance on automobile loans and leases, with the Bank listed as either the loss payee or additional insured. Installment loans consist of open and closed end facilities for personal and household purchases. We seek to maintain reasonable levels of risk in installment lending by following prudent underwriting guidelines which include an evaluation of personal credit history and cash flow.
Market Risk
Market risk is the potential of loss arising from changes in interest rates, foreign exchange rates, equity prices and commodity prices, including the correlation among these factors and their volatility. When the value of an instrument is tied to such external factors, the holder faces market risk. We are exposed to market risk primarily from interest rate risk, which is defined as the risk of loss of net interest income or net interest margin because of changes in interest rates.
The potential cash flows, sales or replacement value of many of our assets and liabilities, especially those that earn or pay interest, are sensitive to changes in the general level of U.S. interest rates. In the banking industry, changes in interest rates can significantly impact earnings and the safety and soundness of an entity.
Interest rate risk arises primarily from our core business activities of extending loans and accepting deposits. This occurs when our interest earning loans and interest-bearing deposits mature or reprice at different times, on a different basis or in unequal amounts. Interest rates may also affect loan demand, credit losses, mortgage origination volume, pre- payment speeds and other items affecting earnings.
Many factors affect our exposure to changes in interest rates, such as general economic and financial conditions, customer preferences, historical pricing relationships and repricing characteristics of financial instruments. Our earnings are affected not only by general economic conditions, but also by the monetary and fiscal policies of the United States and its agencies, particularly the Federal Reserve. The monetary policies of the Federal Reserve can influence the overall growth of loans, investment securities and deposits and the level of interest rates earned on assets and paid for liabilities.
89
Market Risk Measurement
We primarily use net interest income simulation analysis to measure and analyze interest rate risk. We run various hypothetical interest rate scenarios and compare these results against a measured base case scenario. Our net interest income simulation analysis incorporates various assumptions, which we believe are reasonable but which may have a significant impact on results. These assumptions include: (1) the timing of changes in interest rates, (2) shifts or rotations in the yield curve, (3) re-pricing characteristics for market rate sensitive instruments on and off-balance sheet, (4) differing sensitivities of financial instruments due to differing underlying rate indices and (5) varying loan prepayment speeds for different interest rate scenarios. Because of limitations inherent in any approach used to measure interest rate risk, simulation results are not intended as a forecast of the actual effect of a change in market interest rates on our results but rather as a means to better plan and execute appropriate asset liability management strategies to manage our interest rate risk.
Table 25 presents, for the twelve months subsequent to December 31, 2023 and 2022, an estimate of the changes in net interest income that would result from ramps (gradual changes) and shocks (immediate changes) in market interest rates, moving in a parallel fashion over the entire yield curve, relative to the measured base case scenario. Ramp scenarios assume interest rates move gradually in parallel across the yield curve relative to the base case scenario. Shock scenarios assume an immediate and sustained parallel shift in interest rates across the entire yield curve, relative to the base case scenario. The base case scenario assumes that the balance sheet and interest rates are generally unchanged. We evaluate the sensitivity by using a static forecast, where the balance sheets as of December 31, 2023 and 2022 are held constant.
Net Interest Income Sensitivity Profile - Estimated Percentage Change Over 12 Months | Table 25 | ||||||||||
Static Forecast | Static Forecast | ||||||||||
December 31, 2023 | December 31, 2022 | ||||||||||
Gradual Change in Interest Rates (basis points) | |||||||||||
+100 | 1.9 | % | 3.2 | % | |||||||
+50 | 1.0 | 1.6 | |||||||||
(50) | (1.0) | (1.7) | |||||||||
(100) | (2.1) | (3.4) | |||||||||
Immediate Change in Interest Rates (basis points) |
|
| |||||||||
+100 | 3.6 | % | 5.8 | % | |||||||
+50 | 1.8 | 2.9 | |||||||||
(50) | (2.0) | (3.1) | |||||||||
(100) | (4.0) | (6.3) | |||||||||
The table above shows the effects of a simulation which estimates the effect of a gradual and immediate sustained parallel shift in the yield curve of −100, −50, +50 and +100 basis points in market interest rates over a twelve-month period on our net interest income.
Currently, our interest rate profile, assuming a constant balance sheet, is such that we project net interest income will benefit from higher interest rates as our assets would reprice faster and to a greater degree than our liabilities, while in the case of lower interest rates, our assets would reprice downward and to a greater degree than our liabilities. Other factors such as changes in balance sheet composition or deposit rate behavior could result in a change in repricing sensitivity.
Under the static balance sheet forecast as of December 31, 2023, our net interest income sensitivity profile is lower in higher interest rate scenarios compared to similar forecasts as of December 31, 2022. The sensitivity outcomes described above are primarily due to the impact of accelerated deposit repricing as compared with December 31, 2022.
The comparisons above provide insight into the potential effects of changes in interest rates on net interest income. The Company believes that its approach to interest rate risk has appropriately considered its susceptibility to both rising and falling rates and has adopted strategies which minimize the impact of such risks.
90
We also have longer term interest rate risk exposures which may not be appropriately measured by net interest income simulation analysis. We use market value of equity (“MVE”) sensitivity analysis to study the impact of long-term cash flows on earnings and capital. MVE involves discounting present values of all cash flows of on-balance sheet and off-balance sheet items under different interest rate scenarios. The discounted present value of all cash flows represents our MVE. MVE analysis requires modifying the expected cash flows in each interest rate scenario, which will impact the discounted present value. The amount of base case measurement and its sensitivity to shifts in the yield curve allow management to measure longer term repricing option risk in the balance sheet.
Limitations of Market Risk Measures
The results of our simulation analyses are hypothetical, and a variety of factors might cause actual results to differ substantially from what is depicted. For example, if the timing and magnitude of interest rate changes differ from those projected, our net interest income might vary significantly. Non-parallel yield curve shifts such as a flattening or steepening of the yield curve or changes in interest rate spreads would also cause our net interest income to be different from that depicted. An increasing interest rate environment could reduce projected net interest income if deposits and other short-term liabilities re-price faster than expected or faster than our assets re-price. Actual results could differ from those projected if we grow assets and liabilities faster or slower than estimated, if we experience a net outflow of deposits or if our mix of assets and liabilities otherwise changes. For example, while we maintain relatively high levels of liquidity, a faster than expected withdrawal of deposits out of the bank may cause us to seek higher cost sources of funding. Actual results could also differ from those projected if we experience substantially different prepayment speeds in our loan portfolio than those assumed in the simulation analyses. Finally, these simulation results do not consider all the actions that we may undertake in response to potential or actual changes in interest rates, such as changes to our loan, investment, deposit, funding or hedging strategies.
Market Risk Governance
We seek to achieve consistent growth in net interest income and capital while managing volatility arising from changes in market interest rates. The objective of our interest rate risk management process is to increase net interest income while operating within acceptable limits established for interest rate risk and maintaining adequate levels of funding and liquidity.
To manage the impact on net interest income, we manage our exposure to changes in interest rates through our asset and liability management activities within guidelines established by our ALCO and approved by our board of directors. The ALCO has the responsibility for approving and ensuring compliance with the ALCO management policies, including interest rate risk exposures. The objective of our interest rate risk management process is to maximize net interest income while operating within acceptable limits established for interest rate risk and maintaining adequate levels of funding and liquidity.
Through review and oversight by the ALCO, we attempt to engage in strategies that neutralize interest rate risk as much as possible. Our use of derivative financial instruments, as detailed in “Note 16. Derivative Financial Instruments” in the notes to the consolidated financial statements included in Item 8. Financial Statements and Supplementary Data, has generally been limited. This is due to natural on balance sheet hedges arising out of offsetting interest rate exposures from loans and investment securities with deposits and other interest-bearing liabilities. In particular, the investment securities portfolio is utilized to manage the interest rate exposure and sensitivity to within the guidelines and limits established by the ALCO. We utilize natural and offsetting economic hedges in an effort to reduce the need to employ off-balance sheet derivative financial instruments to hedge interest rate risk exposures. Expected movements in interest rates are also considered in managing interest rate risk. Thus, as interest rates change, we may use different techniques to manage interest rate risk.
Management uses the results of its various simulation analyses to formulate strategies to achieve a desired risk profile within the parameters of our capital and liquidity guidelines.
91
In addition, our business relied upon a large volume of loans, derivative contracts and other financial instruments with attributes that are either directly or indirectly dependent on LIBOR to establish their interest rate and/or value. According to the United Kingdom’s Financial Conduct Authority, which regulates LIBOR, U.S. Dollar LIBOR settings have ceased to be provided or ceased to be representative after June 30, 2023. The publication of all other LIBOR settings ceased to be provided or ceased to be representative as of December 31, 2021. We transitioned our financial instruments associated to LIBOR currencies and tenors that ceased or became nonrepresentative on December 31, 2021, to alternative reference rates (collectively, “Alternative Rates”), with limited exceptions. As such, effective December 31, 2021, we have ceased the use of U.S Dollar LIBOR as a reference rate on all new contracts and continue to increase the usage of Alternative Rates such as the Secured Overnight Financing Rate (“SOFR”). A working group of key stakeholders from throughout the Company spearheaded the transition from LIBOR to Alternative Rates. There are risks inherent with the transition to any Alternative Rate as the rate may behave differently than LIBOR in reaction to monetary, market and economic events. The working group disbanded after the conclusion of the transition in December 2023.
Our LIBOR transition plan included work to ensure that our technology systems were prepared for the transition, our loan documents that reference LIBOR-based rates were appropriately amended to reference other methods of interest rate determinations and internal and external stakeholders were apprised of the transition. We have implemented certain Prime Rate and SOFR conventions as we transitioned our products and transaction agreements to reference rates other than LIBOR. Commercial loans and investment securities have fully transitioned to SOFR rates. Residential mortgages with adjustable rates will fully transition off LIBOR to SOFR during the fourth quarter of 2024. To see the recorded investment in our loan and lease portfolio by rate type, refer to Table 12 in the section titled “Loans and Leases” in this MD&A.
Operational Risk
Operational risk is the risk of loss arising from inadequate or failed processes, people or systems, external events (such as natural disasters), or compliance, reputational or legal matters, including the risk of loss resulting from fraud, litigation and breaches in data security. Operational risk is inherent in all of our business ventures and the management of that risk is important to the achievement of our objectives. We have a framework in place that includes the reporting and assessment of any operational risk events, and the assessment of our mitigating strategies within our key business lines. This framework is implemented through our policies, processes and reporting requirements. We measure and report operational risk using the seven operational risk event types projected by the Basel Committee on Banking Supervision in Basel II: (1) external fraud; (2) internal fraud; (3) employment practices and workplace safety; (4) clients, products and business practices; (5) damage to physical assets; (6) business disruption and system failures; and (7) execution, delivery and process management. Our operational risk review process is also a core part of our assessment of material new products or activities.
ITEM 7A. QUANTITATIVE AND QUALITATIVE DISCLOSURES ABOUT MARKET RISK
See “Item 7. MD&A - Risk Governance and Quantitative and Qualitative Disclosures About Market Risk.”
92
ITEM 8. FINANCIAL STATEMENTS AND SUPPLEMENTARY DATA
REPORT OF INDEPENDENT REGISTERED PUBLIC ACCOUNTING FIRM
To the Stockholders and the Board of Directors of
First Hawaiian, Inc.
Honolulu, Hawaii
Opinion on the Financial Statements
We have audited the accompanying consolidated balance sheets of First Hawaiian, Inc. and subsidiary (the “Company”) as of December 31, 2023 and 2022, the related consolidated statements of income, comprehensive income, stockholders’ equity, and cash flows for each of the three years in the period ended December 31, 2023, and the related notes (collectively, the “financial statements”). In our opinion, the financial statements present fairly, in all material respects, the financial position of the Company as of December 31, 2023 and 2022, and the results of its operations and its cash flows for each of the three years in the period ended December 31, 2023, in conformity with accounting principles generally accepted in the United States of America.
We have also audited, in accordance with the standards of the Public Company Accounting Oversight Board (United States) (PCAOB), the Company’s internal control over financial reporting as of December 31, 2023, based on criteria established in Internal Control—Integrated Framework (2013) issued by the Committee of Sponsoring Organizations of the Treadway Commission and our report dated February 28, 2024, expressed an unqualified opinion on the Company’s internal control over financial reporting.
Basis for Opinion
These financial statements are the responsibility of the Company’s management. Our responsibility is to express an opinion on the Company’s financial statements based on our audits. We are a public accounting firm registered with the PCAOB and are required to be independent with respect to the Company in accordance with the US federal securities laws and the applicable rules and regulations of the Securities and Exchange Commission and the PCAOB.
We conducted our audits in accordance with the standards of the PCAOB. Those standards require that we plan and perform the audit to obtain reasonable assurance about whether the financial statements are free of material misstatement, whether due to error or fraud. Our audits included performing procedures to assess the risks of material misstatement of the financial statements, whether due to error or fraud, and performing procedures that respond to those risks. Such procedures included examining, on a test basis, evidence regarding the amounts and disclosures in the financial statements. Our audits also included evaluating the accounting principles used and significant estimates made by management, as well as evaluating the overall presentation of the financial statements. We believe that our audits provide a reasonable basis for our opinion.
Critical Audit Matters
The critical audit matters communicated below are matters arising from the current-period audit of the financial statements that were communicated or required to be communicated to the audit committee and that (1) relate to accounts or disclosures that are material to the financial statements and (2) involved our especially challenging, subjective, or complex judgments. The communication of critical audit matters does not alter in any way our opinion on the financial statements, taken as a whole, and we are not, by communicating the critical audit matters below, providing separate opinions on the critical audit matters or on the accounts or disclosures to which they relate.
93
Allowance for Credit Losses (ACL)—Refer to Notes 1 and 5 to the consolidated financial statements.
Critical Audit Matter Description
The Company’s methodology leverages two quantitative models: a one variable forward-looking macroeconomic model that estimates the impact of management’s economic outlook and a transition probability matrix that estimates expected losses over the long run. The quantitative estimation is overlaid with qualitative adjustments to account for current conditions and forward-looking factors not captured in the quantitative model. Qualitative adjustments that are considered include adjustments for regulatory determinants, model limitations, and other current or anticipated events that are not captured in the Company’s historical loss experience.
Determining the appropriate economic forecast and level of qualitative overlays is inherently subjective and relies on significant judgment. Given the magnitude of the impact of the economic forecast and qualitative overlays and significant amount of judgment required by management in developing these estimates, performing audit procedures to evaluate the reasonableness of the ACL required a high degree of auditor judgment, an increased extent of audit effort, and the need to involve more experienced audit professionals.
How the Critical Audit Matter Was Addressed in the Audit
Our audit procedures related to the economic forecast adjustment and qualitative overlays included the following procedures, among others:
| ● | We tested the effectiveness of controls over the ACL, including management’s controls over the respective economic forecast and qualitative overlays selected. |
| ● | We evaluated the reasonableness and conceptual soundness of the ACL modeling framework, including the selection of the economic forecast and the use of qualitative overlays. |
| ● | We tested the mathematical accuracy of the calculation of the qualitative component of the ACL, as well as the accuracy and completeness of data used as inputs to the determination of the qualitative overlays. |
| ● | We evaluated the reasonableness of the economic forecast selection, including assessing the basis for the selection and reasonable and supportable forecast period, as well as the accuracy and completeness of data used as inputs to the determination of the economic forecast. |
| ● | We evaluated the qualitative overlays to the historical loss rates, including assessing the basis for the adjustments and the reasonableness of the significant assumptions. |
| ● | We evaluated the magnitude and proportion of the overall allowance, including the directional consistency and magnitude of the qualitative overlays as compared to the prior year and prior quarters, as well as the absolute value of the ACL attributable to the qualitative overlays. |
| ● | In order to identify potential bias in the determination of the ACL, we performed analytical analysis, including retrospective review, various coverage and ratio analysis, and peer institution analysis, to evaluate the relevance of the underlying drivers used to determine qualitative overlays and the economic forecast to credit losses in the loan portfolios. |
94
Goodwill – Refer to Notes 1 and 7 to the consolidated financial statements
Critical Audit Matter Description
Goodwill is tested for impairment by comparing the estimated fair value of each reporting unit to its carrying amount. The Company estimates the fair value of its reporting units by using valuation methods based on the market and income approaches. The market approach primarily involves the calculation of valuation multiples of comparable public companies and then applies a control premium to arrive at the estimated fair value on a controlling basis. The key assumptions with respect to this method are the selected multiples and control premium. The income approach uses a discounted cash flow (“DCF”) method to value a company on a going concern basis. The DCF method is based on the present value of multi-period projections of free cash flows and a terminal value. The key assumptions with respect to this method are the determination of the free cash flows, discount rate and terminal value.
Estimating the fair value of a reporting unit requires significant judgment and often involves the use of estimates and assumptions that could have a significant effect on whether or not an impairment charge is recorded and the magnitude of such a charge.
Given the significant judgments made by management to estimate the fair value of its reporting units and the difference between the fair value and carrying value, performing audit procedures to evaluate the reasonableness of management’s estimates and assumptions related to the selection of the discount rates and forecasts of future net interest income and net income, required a high degree of auditor judgment and an increased extent of effort, including the need to involve our fair value specialists.
How the Critical Audit Matter Was Addressed in the Audit
Our audit procedures related to the discount rates and forecasts of future net interest income and net income for each reporting unit included the following procedures, among others:
| ● | We tested the effectiveness of controls over management’s goodwill impairment evaluation, including those over the determination of fair value of the Retail Banking and Commercial Banking reporting units, including controls related to management’s forecasts and selection of the discount rates and forecasts of future net interest income and net income. |
| ● | We evaluated management’s ability to accurately forecast future cash flows by comparing actual results to management’s historical forecasts. |
| ● | We evaluated the reasonableness of management’s forecasts of future cash flows by comparing the forecasts to: |
| ● | Supporting calculations of net interest income and net income. |
| ● | Internal communications to management and the Board of Directors. |
| ● | Forecasted information included in Company press releases as well as in analyst and industry reports for the Company and certain of its peer companies. |
95
| ● | With the assistance of our fair value specialists, we evaluated the reasonableness of the valuation methodology and the discount rates by: |
| ● | Testing the source information underlying the determination of the discount rates and the mathematical accuracy of the calculation. |
| ● | Developing a range of independent estimates and comparing those to the discount rates selected by management. |
| ● | We performed a sensitivity analysis to stress the assumptions used. |
/s/
February 28, 2024
We have served as the Company’s auditor since 2012.
96
FIRST HAWAIIAN, INC. AND SUBSIDIARY
CONSOLIDATED STATEMENTS OF INCOME
Year Ended December 31, | |||||||||
(dollars in thousands, except per share amounts) | 2023 |
| 2022 |
| 2021 |
| |||
Interest income | |||||||||
Loans and lease financing | $ | | $ | | $ | | |||
Available-for-sale investment securities | | | | ||||||
Held-to-maturity investment securities | | | — | ||||||
Other | | | | ||||||
Total interest income | | | | ||||||
Interest expense | |||||||||
Deposits | | | | ||||||
Short-term and long-term borrowings | | | | ||||||
Other | | — | — | ||||||
Total interest expense | | | | ||||||
Net interest income | | | | ||||||
Provision for credit losses | | | ( | ||||||
Net interest income after provision for credit losses | | | | ||||||
Noninterest income | |||||||||
Service charges on deposit accounts | | | | ||||||
Credit and debit card fees | | | | ||||||
Other service charges and fees | | | | ||||||
Trust and investment services income | | | | ||||||
Bank-owned life insurance | | | | ||||||
Investment securities gains, net | | — | | ||||||
Other | | | | ||||||
Total noninterest income | | | | ||||||
Noninterest expense | |||||||||
Salaries and employee benefits | | | | ||||||
Contracted services and professional fees | | | | ||||||
Occupancy | | | | ||||||
Equipment | | | | ||||||
Regulatory assessment and fees | | | | ||||||
Advertising and marketing | | | | ||||||
Card rewards program | | | | ||||||
Other | | | | ||||||
Total noninterest expense | | | | ||||||
Income before provision for income taxes | | | | ||||||
Provision for income taxes | | | | ||||||
Net income | $ | | $ | | $ | | |||
Basic earnings per share | $ | $ | | $ | | ||||
Diluted earnings per share | $ | $ | | $ | | ||||
Basic weighted-average outstanding shares | | | | ||||||
Diluted weighted-average outstanding shares | | | | ||||||
The accompanying notes are an integral part of these consolidated financial statements.
97
FIRST HAWAIIAN, INC. AND SUBSIDIARY
CONSOLIDATED STATEMENTS OF COMPREHENSIVE INCOME (LOSS)
Year Ended December 31, | ||||||||||
(dollars in thousands) |
| 2023 |
| 2022 |
| 2021 |
| |||
Net income | $ | |
| $ | |
| $ | | ||
Other comprehensive income (loss), net of tax: | ||||||||||
Net change in pensions and other benefits | | | | |||||||
Net change in investment securities | | ( | ( | |||||||
Net change in cash flow derivative hedges | | ( | — | |||||||
Other comprehensive income (loss) | | ( | ( | |||||||
Total comprehensive income (loss) | $ | | $ | ( | $ | | ||||
The accompanying notes are an integral part of these consolidated financial statements.
98
FIRST HAWAIIAN, INC. AND SUBSIDIARY
CONSOLIDATED BALANCE SHEETS
December 31, | December 31, | |||||
(dollars in thousands, except share amount) |
| 2023 |
| 2022 | ||
Assets | ||||||
Cash and due from banks | $ | | $ | | ||
Interest-bearing deposits in other banks | | | ||||
Investment securities: | ||||||
Available-for-sale, at fair value (amortized cost: $ | | | ||||
Held-to-maturity, at amortized cost (fair value: $ | | | ||||
Loans held for sale | | — | ||||
Loans and leases | | | ||||
Less: allowance for credit losses | | | ||||
Net loans and leases | | | ||||
Premises and equipment, net | | | ||||
Other real estate owned and repossessed personal property | — | | ||||
Accrued interest receivable | | | ||||
Bank-owned life insurance | | | ||||
Goodwill | | | ||||
Mortgage servicing rights | | | ||||
Other assets | | | ||||
Total assets | $ | | $ | | ||
Liabilities and Stockholders' Equity | ||||||
Deposits: | ||||||
Interest-bearing | $ | | $ | | ||
Noninterest-bearing | | | ||||
Total deposits | | | ||||
Short-term borrowings | | | ||||
Retirement benefits payable | | | ||||
Other liabilities | | | ||||
Total liabilities | | | ||||
Commitments and contingent liabilities (Note 17) | ||||||
Stockholders' equity | ||||||
Common stock ($ | | | ||||
Additional paid-in capital | | | ||||
Retained earnings | | | ||||
Accumulated other comprehensive loss, net | ( | ( | ||||
Treasury stock ( | ( | ( | ||||
Total stockholders' equity | | | ||||
Total liabilities and stockholders' equity | $ | | $ | | ||
The accompanying notes are an integral part of these consolidated financial statements.
99
FIRST HAWAIIAN, INC. AND SUBSIDIARY
CONSOLIDATED STATEMENTS OF STOCKHOLDERS’ EQUITY
Accumulated | ||||||||||||||||||||
Additional | Other | |||||||||||||||||||
(dollars in thousands, | Common Stock | Paid-In | Retained | Comprehensive | Treasury | |||||||||||||||
except share amounts) |
| Shares |
| Amount |
| Capital |
| Earnings |
| Income (Loss) |
| Stock |
| Total | ||||||
Balance as of December 31, 2020 | | $ | | $ | | $ | | $ | | $ | ( | $ | | |||||||
Net income | — | — | — | | — | — | | |||||||||||||
Cash dividends declared ($ | — | — | — | ( | — | — | ( | |||||||||||||
Common stock issued under Employee Stock Purchase Plan | | — | | — | — | — | | |||||||||||||
Equity-based awards | | | | ( | — | ( | | |||||||||||||
Common stock repurchased | ( | — | — | — | — | ( | ( | |||||||||||||
Other comprehensive loss, net of tax | — | — | — | — | ( | — | ( | |||||||||||||
Balance as of December 31, 2021 | | | | | ( | ( | | |||||||||||||
Net income | — | — | — | | — | — | | |||||||||||||
Cash dividends declared ($ | — | — | — | ( | — | — | ( | |||||||||||||
Common stock issued under Employee Stock Purchase Plan | | — | | — | — | — | | |||||||||||||
Equity-based awards | | | | ( | — | ( | | |||||||||||||
Common stock repurchased | ( | — | — | — | — | ( | ( | |||||||||||||
Other comprehensive loss, net of tax | — | — | — | — | ( | — | ( | |||||||||||||
Balance as of December 31, 2022 | | | | | ( | ( | | |||||||||||||
Net income | — | — | — | | — | — | | |||||||||||||
Cash dividends declared ($ | — | — | — | ( | — | — | ( | |||||||||||||
Common stock issued under Employee Stock Purchase Plan | | — | | — | — | — | | |||||||||||||
Equity-based awards | | | | ( | — | ( | | |||||||||||||
Other comprehensive income, net of tax | — | — | — | — | | — | | |||||||||||||
Balance as of December 31, 2023 | | $ | | $ | | $ | | $ | ( | $ | ( | $ | | |||||||
The accompanying notes are an integral part of these consolidated financial statements.
100
FIRST HAWAIIAN, INC. AND SUBSIDIARY
CONSOLIDATED STATEMENTS OF CASH FLOWS
Year Ended December 31, | ||||||||||
(dollars in thousands) |
| 2023 |
| 2022 |
| 2021 |
| |||
Cash flows from operating activities | ||||||||||
Net income | $ | | $ | | $ | | ||||
Adjustments to reconcile net income to net cash provided by operating activities: | ||||||||||
Provision (benefit) for credit losses | | | ( | |||||||
Depreciation, amortization and accretion, net | | | | |||||||
Deferred income tax (benefit) provision | ( | | | |||||||
Stock-based compensation | | | | |||||||
Other (gains) losses | ( | | ( | |||||||
Originations of loans held for sale | ( | ( | ( | |||||||
Proceeds from sales of loans held for sale | | | | |||||||
Net gains on investment securities | ( | — | ( | |||||||
Change in assets and liabilities: | ||||||||||
Net (increase) decrease in other assets | ( | | ( | |||||||
Net increase in other liabilities | | | | |||||||
Net cash provided by operating activities | | | | |||||||
Cash flows from investing activities | ||||||||||
Available-for-sale securities: | ||||||||||
Proceeds from maturities and principal repayments | | | | |||||||
Proceeds from calls and sales | | | | |||||||
Purchases | — | ( | ( | |||||||
Held-to-maturity securities: | ||||||||||
Proceeds from maturities and principal repayments | | | — | |||||||
Proceeds from calls | | | — | |||||||
Purchases | — | ( | — | |||||||
Other investments: | ||||||||||
Proceeds from sales | | | | |||||||
Purchases | ( | ( | ( | |||||||
Loans: | ||||||||||
Net (increase) decrease in loans and leases resulting from originations and principal repayments | ( | ( | | |||||||
Proceeds from sales of loans originated for investment | — | | | |||||||
Purchases of loans | ( | ( | ( | |||||||
Proceeds from bank-owned life insurance | | — | | |||||||
Purchases of premises, equipment and software | ( | ( | ( | |||||||
Proceeds from sales of premises and equipment | | | | |||||||
Other | | ( | | |||||||
Net cash provided by (used in) investing activities | | ( | ( | |||||||
Cash flows from financing activities | ||||||||||
Net (decrease) increase in deposits | ( | ( | | |||||||
Net (decrease) increase in short-term borrowings | ( | | — | |||||||
Proceeds from long-term borrowings | | — | — | |||||||
Repayment of long-term borrowings | — | — | ( | |||||||
Dividends paid | ( | ( | ( | |||||||
Stock tendered for payment of withholding taxes | ( | ( | ( | |||||||
Proceeds from employee stock purchase plan | | | | |||||||
Common stock repurchased | — | ( | ( | |||||||
Net cash (used in) provided by financing activities | ( | ( | | |||||||
Net increase (decrease) in cash and cash equivalents | | ( | | |||||||
Cash and cash equivalents at beginning of year | | | | |||||||
Cash and cash equivalents at end of year | $ | | $ | | $ | | ||||
Supplemental disclosures | ||||||||||
Interest paid | $ | | $ | | $ | | ||||
Income taxes paid, net of income tax refunds | | | | |||||||
Noncash investing and financing activities: | ||||||||||
Transfers from loans and leases and other assets to other real estate owned | — | | | |||||||
Operating lease right-of-use assets obtained in exchange for new lease obligations | | | | |||||||
Transfers to loans and leases from loans held for sale | — | | — | |||||||
Transfers to loans held for sale from loans and leases | | — | | |||||||
Obligation to fund low-income housing partnerships | | | | |||||||
Transfers of securities from available-for-sale to held-to-maturity | — | | — | |||||||
The accompanying notes are an integral part of these consolidated financial statements.
101
FIRST HAWAIIAN, INC. AND SUBSIDIARY
NOTES TO CONSOLIDATED FINANCIAL STATEMENTS
1. Organization and Summary of Significant Accounting Policies
Basis of Presentation
First Hawaiian, Inc. (“FHI” or the “Parent”), a bank holding company, owns
The accounting and reporting principles of First Hawaiian, Inc. and Subsidiary (the “Company”) conform to U.S. generally accepted accounting principles (“GAAP”) and prevailing practices within the financial services industry. Intercompany accounts and transactions have been eliminated in consolidation.
Transition to an Independent Public Company
Prior to FHI’s initial public offering in August 2016 (“IPO”), the Company was an indirect wholly owned subsidiary of BNP Paribas (“BNPP”), a global financial institution based in France.
On April 1, 2016, BNPP effected a series of transactions (“Reorganization Transactions”) pursuant to which FHI, which was then known as BancWest Corporation (“BancWest”), contributed Bank of the West (“BOW”), its subsidiary at the time, to BancWest Holding Inc. (“BWHI”), a newly formed bank holding company and a wholly owned subsidiary of BancWest. Following the contribution of BOW to BWHI, BancWest distributed its interest in BWHI to BNPP, and BWHI became a wholly owned subsidiary of BNPP. As part of these transactions, the Company amended its certificate of incorporation to change its name to First Hawaiian, Inc., with First Hawaiian Bank remaining its only direct wholly owned subsidiary.
On July 1, 2016, we became an indirect wholly owned subsidiary of BNP Paribas USA, Inc. (“BNP Paribas USA”), BNPP’s U.S. intermediate holding company. As part of that reorganization, the Company became a direct wholly owned subsidiary of BancWest Corporation (“BWC”), a direct wholly owned subsidiary of BNP Paribas USA.
In August 2016, FHI completed its IPO and shares of FHI’s common stock began trading on the NASDAQ Global Select Market (“NASDAQ”) under the ticker symbol “FHB” on August 4, 2016.
In 2017, 2018 and 2019, BNPP, acting through BWC, sold all of the shares of FHI common stock that it beneficially owned in underwritten public offerings and share repurchases by the Company. FHI did
Use of Estimates in the Preparation of Financial Statements
The preparation of consolidated financial statements in conformity with GAAP requires management to make estimates and assumptions that affect the reported amounts of assets and liabilities and disclosure of contingent assets and liabilities at the date of the financial statements and the reported amounts of revenues and expenses during the reporting period. Management bases its estimates on historical experience and various other assumptions believed to be reasonable. Although these estimates are based on management’s best knowledge of current events, actual results may differ from these estimates.
102
Variable Interest Entities
A variable interest entity (“VIE”) is a legal entity that lacks the ability to financially support its activities or whose equity investors lack the ability to control its activities or absorb profits and losses proportionately with their investment in the entity. The primary beneficiary consolidates the VIE. The primary beneficiary is defined as the enterprise that has both the power to direct the activities of the VIE that most significantly impact the entity’s economic performance and the obligation to absorb losses or the right to receive benefits that could be significant to the VIE.
The Company has a limited partnership interest or is a member in a limited liability company (“LLC”) in several low-income housing partnerships. These partnerships or LLCs provide funds for the construction and operation of apartment complexes that provide affordable housing to that segment of the population with lower family income. If these developments successfully attract a specified percentage of residents falling in that lower income range, state and/or federal income tax credits are made available to the partners or members. The tax credits are generally recognized over 5 or 10 years. In order to continue receiving the tax credits each year over the life of the partnership or LLC, the low-income residency targets must be maintained.
The Company generally accounts for its interests in these low-income housing partnerships using the proportional amortization method. The Company’s investments in these partnership interests are included in other assets in the consolidated balance sheets. Unfunded commitments to fund these investments were $
These low-income housing partnership and LLC entities meet the definition of a VIE; however, the Company is not the primary beneficiary of the entities, as the general partner or managing member has both the power to direct the activities that most significantly impact the economic performance of the entities and the obligation to absorb losses or the right to receive benefits that could be significant to the entities. While the partnership or LLC agreements allow the limited partners and members, through a majority vote, to remove the general partner or managing member, this right is not deemed to be substantive as the general partner or managing member can only be removed for cause.
Cash and Due from Banks
Cash and due from banks include amounts due from other financial institutions as well as in-transit clearings. Because amounts due from other financial institutions often exceed the Federal Deposit Insurance Corporation (“FDIC”) deposit insurance limit, the Company evaluates the credit risk of these institutions through periodic review of their financial condition and regulatory capital position. Under the terms of the Depository Institutions Deregulation and Monetary Control Act, the Company is required to maintain reserves with the Federal Reserve Bank of San Francisco (“FRB”) based on the amount of deposits held. Reserve requirements for all depository institutions were eliminated in March 2020. Cash and cash equivalents include cash and due from banks and interest-bearing deposits in other banks. All amounts are readily convertible to cash and have original maturities of less than 90 days.
Interest-bearing Deposits in Other Banks
Interest-bearing deposits in other banks include funds held in other financial institutions that are either fixed or variable rate instruments, including certificates of deposits. Interest income is recorded when earned and presented within other interest income in the Company’s consolidated statements of income.
Investment Securities
As of December 31, 2023 and December 31, 2022, investment securities were comprised primarily of debt securities, mortgage-backed securities and collateralized mortgage obligations issued by the U.S. Government, its agencies and government-sponsored enterprises, with under
103
As of December 31, 2023 and 2022, the Company’s investment securities were categorized as either available-for-sale (investment securities that may be sold before maturity at the discretion of management) or held-to-maturity (investment securities that management has the positive intent and ability to hold to maturity). Available-for-sale investment securities are reported at fair value, with unrealized gains and losses reported in accumulated other comprehensive income. Gains and losses realized on sales of available-for-sale investment securities are determined using the specific identification method. Held-to-maturity investment securities are reported at amortized cost and may have a realized gain or loss if the investment security is retired or redeemed before the original maturity date.
Transfers of debt securities from the available-for-sale category to the held-to-maturity category are made at fair value at the date of transfer. The unrealized holding gain or loss at the date of transfer remains in accumulated other comprehensive income and in the carrying value of the held-to-maturity investment security. Premiums or discounts on investment securities are amortized or accreted as an adjustment of yield using the interest method over the expected life of the security. Unrealized holding gains or losses that remain in accumulated other comprehensive income are also amortized or accreted over the expected life of the security as an adjustment of yield, offsetting the related amortization of the premium or accretion of the discount.
For available-for-sale debt securities in an unrealized loss position, the Company first assesses whether it intends to sell, or it is more likely than not that it will be required to sell the security before recovery of its amortized cost basis. If either of the criteria regarding intent or requirement to sell is met, the security’s amortized cost basis is written down to fair value through income. For available-for-sale debt securities that do not meet the aforementioned criteria, the Company evaluates at the individual security level whether the decline in fair value has resulted from credit losses or other factors. In making this assessment, management considers the extent to which fair value is less than amortized cost and adverse conditions specifically related to the security, among other factors. If this assessment indicates that a credit loss exists, the present value of cash flows expected to be collected from the security is compared to the amortized cost basis of the security. If the present value of cash flows expected to be collected is less than the amortized cost basis, a credit loss exists and an allowance for credit losses is recorded for the credit loss, limited by the amount that the fair value is less than the amortized cost basis. Any impairment that has not been recorded through an allowance for credit losses is recognized in other comprehensive income.
For held-to-maturity debt securities, the Company utilizes the Current Expected Credit Loss (“CECL”) approach to estimate lifetime expected credit losses. The allowance for credit losses is a valuation account that is deducted from the amortized cost basis of held-to-maturity debt securities to present the net amount expected to be collected from held-to-maturity debt securities.
Changes in the allowance for credit losses, if any, are recorded as a provision for (or reversal of) credit losses. Losses are charged against the allowance when management believes the available-for-sale or held-to-maturity investment security is deemed uncollectible or when either of the criteria regarding intent or requirement to sell an available-for-sale investment security is met. Recoveries do not exceed the aggregate of amounts previously charged-off. As of December 31, 2023 and 2022, the Company’s available-for-sale and held-to-maturity investment securities were comprised primarily of debt securities, mortgage-backed securities and collateralized mortgage obligations issued by the U.S. Government, its agencies and government-sponsored enterprises. Management has concluded that the long history with no credit losses from these issuers indicates an expectation that nonpayment of the amortized cost basis is zero, and these securities are explicitly or implicitly fully guaranteed by the U.S. government. The U.S. government can print its own currency and its currency is routinely held by central banks and other major financial institutions. The dollar is used in international commerce, and commonly is viewed as a reserve currency, all of which qualitatively indicates that historical credit loss information should be minimally affected by current conditions and reasonable and supportable forecasts. Under
Accrued interest receivable related to available-for-sale and held-to-maturity investment securities are recorded separately from the amortized cost basis of investment securities on the Company’s consolidated balance sheet.
104
Loans Held for Sale
The Company originates certain loans for individual sale or for sale as a pool of loans to government-sponsored enterprises. Loans held for sale are carried, on an aggregate basis, at the lower of cost or fair value. The fair value of loans held for sale is primarily determined based on quoted prices for similar loans in active markets. Net gains and losses on loan sales are recorded as a component of other noninterest income. Direct loan origination costs and fees are deferred at origination of the loan and are recognized in other noninterest income upon sale of the loan.
Loans and Leases
Loans are reported at amortized cost, which includes the principal amount outstanding net of unamortized and unaccreted deferred loan fees and costs, and cumulative net charge-offs. Interest income is recognized on an accrual basis. Loan origination fees, certain direct costs and unearned discounts and premiums, if any, are deferred and are generally accreted or amortized into interest income as yield adjustments using the interest method over the contractual life of the loan. Other credit-related fees are recognized as fee income, a component of noninterest income, when earned.
Direct financing leases are carried at the aggregate of lease payments receivable plus the estimated residual value of leased property, less unearned income. Unearned income on direct financing leases is amortized over the lease term by methods that approximate the interest method. Residual values on leased assets are periodically reviewed for impairment.
Accrued interest receivable related to loans and leases is recorded separately from the amortized cost basis of loans and leases on the Company’s consolidated balance sheet.
Nonaccrual Loans and Leases
The Company generally places a loan or lease on nonaccrual status when management believes that collection of principal or interest has become doubtful or when a loan or lease becomes 90 days past due as to principal or interest, unless it is well secured and in the process of collection. A full or partial charge-off is recorded in the period in which the loan or lease is deemed uncollectible. When the Company places a loan or lease on nonaccrual status, previously accrued and uncollected interest is concurrently reversed against interest income. When the Company receives an interest payment on a nonaccrual loan or lease, the payment is applied as a reduction of the principal balance. Nonaccrual loans and leases are generally returned to accrual status when they become current as to principal and interest and future payments are reasonably assured.
Loan modifications are assessed by the Company to determine: (1) whether the borrower is experiencing financial difficulty and (2) whether the Company granted the borrower a modification or combination of modifications in the form of one or more of the following modification types: principal forgiveness, an interest rate reduction, an other-than-insignificant payment delay and/or a term extension. If both criteria are met, then the loan modification is subject to additional evaluation for credit losses and enhanced disclosure requirements.
Generally, a non-accrual loan that has been modified with a borrower experiencing financial difficulty remains on nonaccrual status for at least
105
Allowance for Credit Losses
The allowance for credit losses for loans and leases (the “ACL”) is a valuation account that is deducted from the amortized cost basis of loans and leases to present the net amount expected to be collected from loans and leases. Loans and leases are charged-off against the ACL when management believes the loan or lease balance is deemed uncollectible. Recoveries do not exceed the aggregate of amounts previously charged-off. The Company’s ACL and the reserve for unfunded commitments under the Current Expected Credit Losses (“CECL”) approach consist of quantitative and qualitative estimates. The Company’s methodology leverages two quantitative models: a one variable forward-looking macroeconomic model that estimates the impact of management’s economic outlook and a transition probability matrix that estimates expected losses over the long run. The quantitative estimation is overlaid with qualitative adjustments to account for current conditions and forward-looking factors not captured in the quantitative model. Qualitative adjustments that are considered include adjustments for regulatory determinants, model limitations, and other current or anticipated events that are not captured in the Company’s historical loss experience.
The Company generally evaluates loans and leases on a collective or pool basis when similar risk characteristics exist. However, loans and leases that do not share similar risk characteristics are evaluated on an individual basis. Such loans and leases evaluated individually are excluded from the collective evaluation. Individually assessed loans are measured for estimated credit loss (“ECL”) based on the present value of expected future cash flows discounted at the loan’s effective interest rate or the fair value of the collateral, less estimated selling costs, if the loan is collateral-dependent.
Management reviews relevant available information, from internal and external sources, relating to past events, current conditions, and reasonable and supportable forecasts about the future. Historical credit loss experience provides the basis for the estimation of expected credit losses. Adjustments to historical loss information may be made for differences in current loan-specific risk characteristics such as differences in underwriting standards, portfolio mix, delinquency levels, or term as well as for changes in environmental conditions, such as changes in unemployment rates, property values, or other relevant factors.
The Company utilizes a Probability of Default (“PD”)/Loss Given Default (“LGD”) framework to estimate the ACL and the reserve for unfunded commitments. The PD represents the percentage expectation to default, measured by assessing loans and leases that migrate to default status (i.e., nonaccrual status, 90 days or more past due, partial or full charge-offs or bankruptcy). LGD is defined as the percentage of the exposure at default (“EAD”) lost at the time of default, net of any recoveries, and will be unique to each of the collateral types securing the Company’s loans. PD and LGD’s are based on past experience of the Company. The ECL on loans and leases is calculated by taking the product of the credit exposure, lifetime default probability (“LDP”) and the LGD.
The ECL model is applied to current credit exposures at the account level, using assumptions calibrated at the portfolio segment level using internal historical loan and lease data. The Company estimates the default risk of a credit exposure over the remaining life of each account using a transition probability matrix approach which captures both the average rate of up/down-grade and default transitions, as well as withdrawal rates which capture the historical rate of exposure decline due to loan and lease amortization and prepayment. To apply the transition matrices, each credit exposure’s remaining life is split into two time segments. The first time segment is for the reasonable and supportable forecast period over which the transition matrices which are applied have been adjusted to incorporate current and forecasted conditions over that period. Management has determined that using a
106
On at least a quarterly basis, management convenes the Bank’s forecasting team which is responsible for reviewing the economic forecast model inputs and outputs and approving the resulting economic adjustment. The model uses a one-variable econometric model to produce factors that modify the long-run default rate assumptions used in the CECL model. These factors are applied to calculate the economic adjustment over the Reasonable and Supportable Forecast Period. At the meeting, management is presented with the economic forecast model input and output as well as the resulting economic adjustment.
The economic forecast framework allows management to use judgment in selecting the economic model input in cases where management’s outlook diverges from the official forecasts, and to apply qualitative dollar overlays to account for other economic related conditions not captured in the economic forecast model but are expected to potentially impact losses.
To inform the qualitative overlay, the team reviews other relevant economic variables and economic factors at the time of the meeting that could potentially impact future losses. These materials are presented to the economic forecasting team as they are economic in nature. If determined to be relevant and needing to be considered in the ACL estimate, these risks will be accounted for in the ACL estimate through a qualitative dollar overlay that is determined using either quantitative analysis or qualitative judgment, or a mix of both. These other factors could include inflation indicators, personal income, or visitor arrivals, for example.
The Company has identified
Regarding accrued interest receivable, the Company made accounting policy elections to (1) not measure an ACL on accrued interest receivable, (2) write-off accrued interest receivable by reversing interest income and (3) present accrued interest receivable separately from the related financial asset on the balance sheet. Furthermore, regarding collateral-dependent financial assets, the Company elected the practical expedient to use the fair value of collateral at the reporting date when recording the net carrying amount of the asset and determining the ACL for a financial asset for which the repayment is expected to be provided substantially through the operation or sale of the collateral when the borrower is experiencing financial difficulty based on the Company’s assessment as of the reporting date.
Reserve for Unfunded Commitments
The Company estimates expected credit losses over the contractual period in which the Company is exposed to credit risk via a contractual obligation to extend credit, unless that obligation is unconditionally cancellable by the Company. The reserve for unfunded commitments, which is a component of other liabilities in the consolidated balance sheets, is adjusted through the provision for credit losses. The estimate includes consideration of the likelihood that funding will occur and an estimate of expected credit losses on commitments expected to be funded over its estimated life.
Provision for Credit Losses
The provision for credit losses (the “Provision”) represents the amount charged against current period earnings to achieve an ACL and reserve for unfunded commitments that in management’s judgment is adequate to absorb expected credit losses related to the Company’s loan and lease portfolio and off-balance sheet credit exposures. Accordingly, the Provision will vary from period to period based on management’s ongoing assessment of the overall adequacy of the ACL and reserve for unfunded commitments.
107
Premises and Equipment
Premises and equipment, including leasehold improvements, are stated at cost less accumulated depreciation and amortization. Depreciation and amortization are computed on a straight-line basis over the estimated useful lives of
On a periodic basis, long-lived assets are reviewed for impairment. An impairment loss is recognized if the carrying amount of a long-lived asset exceeds its fair value and is not recoverable. An impairment analysis is performed whenever events or changes in circumstances suggest that the carrying value of an asset or group of assets may not be recoverable.
Operating lease rental income for leased assets, primarily premises, is recognized on a straight-line basis as an offset to rental expense.
Other Real Estate Owned and Repossessed Personal Property
Other real estate owned (“OREO”) and repossessed personal property are comprised primarily of properties that the Company acquires through foreclosure proceedings. The Company values these properties at fair value less estimated costs to sell the property upon acquisition, which establishes the new carrying value. The Company charges losses arising upon the acquisition of the property against the ACL. If the fair value of the property at the time of acquisition exceeds the carrying amount of the loan, the excess is recorded either as a recovery to the ACL if a charge-off had previously been recorded, or as a gain on initial transfer in other noninterest income. After acquisition, the Company carries such properties at the lower of cost or fair value less estimated selling costs on a nonrecurring basis. Any write-downs or losses from the subsequent disposition of such properties are included in other noninterest income. Gains recognized on the sale of such properties are included in other noninterest income.
Bank-Owned Life Insurance
The Company purchases life insurance policies on the lives of certain officers and employees and is the owner and beneficiary of these policies. Bank-owned life insurance is recorded on the Company’s consolidated balance sheets at its cash surrender value (“CSV”). Changes in the CSV and any death benefits received in excess of the CSV are recognized as noninterest income in the consolidated statements of income.
Goodwill
Goodwill represents the cost of acquired businesses in excess of the fair value of the net assets acquired. The Company performs impairment testing of goodwill, an indefinite-lived intangible asset, as required under GAAP on an annual basis or when circumstances change that indicate that a potential impairment may have occurred. The Company has assigned goodwill to its operating segments for impairment testing purposes. The goodwill impairment guidance provides the option to first assess qualitative factors to determine whether the existence of events or circumstances leads to a determination that it is more likely than not that the fair value of a reporting unit is less than its carrying amount. If, after assessing the totality of events or circumstances, an entity determines it is not more likely than not that the fair value of a reporting unit is less than its carrying amount, then performing further impairment tests is unnecessary. However, if an entity concludes otherwise, or does not elect this option, it is required to perform impairment testing. The quantitative impairment test identifies potential impairments at the reporting unit level by comparing the estimated fair value of each identified reporting unit to its carrying amount. If the estimated fair value of a reporting unit exceeds its carrying amount, there is no impairment of goodwill. However, if the carrying amount exceeds the estimated fair value, an impairment exists, and an impairment loss is recognized in an amount equal to that excess. Subsequent reversals of goodwill impairment are prohibited.
Mortgage Servicing Rights
Mortgage servicing rights are recognized as assets when residential mortgage loans are sold and the rights to service those loans are retained. Mortgage servicing rights are initially recorded at fair value by using a discounted cash flow model to calculate the present value of estimated future net servicing income, incorporating assumptions that market participants would use in their estimates of fair value.
108
The Company’s mortgage servicing rights are accounted for under the amortization method and periodically assessed for impairment. The Company amortizes the mortgage servicing rights over the period of estimated net servicing income, taking into account prepayment assumptions. Any such indicated impairment is recognized in earnings during the period in which the impairment occurs. Mortgage servicing income, net of the amortization of mortgage servicing rights, is recorded as a component of other noninterest income in the consolidated statements of income.
Non-Marketable Equity Securities
The Company is required to own Federal Home Loan Bank (“FHLB”) of Des Moines stock as a condition of membership. These securities are accounted for under the cost method, which equals par value, and are included in other assets in the consolidated balance sheets. These securities do not have a readily determinable fair value as ownership is restricted and there is no market for these securities. The Company reviews these securities periodically for impairment. Management considers these securities to be long-term investments. Accordingly, when evaluating these securities for impairment, management considers the ultimate recoverability of the par value rather than recognizing temporary declines in value.
Internal-Use Software
Capitalized internal-use software, stated at cost less accumulated amortization, includes purchased software and capitalizable application development costs associated with internally developed software. Capitalized internal-use software is included as a component of other assets, net of accumulated amortization, on the consolidated balance sheets. Amortization expense is computed on a straight-line method over the estimated useful life of the software, generally up to
The Company also enters in the ordinary course of business into technology-related hosting arrangements that are service contracts. These arrangements can include capitalizable implementation costs that are amortized on a straight-line basis over the term of the hosting arrangement. Capitalized implementation costs associated with hosting arrangements that are service contracts are included as a component of other assets, net of accumulated amortization, on the consolidated balance sheets.
Pension and Other Postretirement Benefit Plans
The Company has a qualified noncontributory defined benefit pension plan, an unfunded supplemental executive retirement plan, a directors’ retirement plan, a non-qualified pension plan for eligible directors and a postretirement benefit plan providing life insurance and healthcare benefits that is offered to directors and employees, as applicable. The qualified noncontributory defined benefit pension plan, the unfunded supplemental executive retirement plan and the directors’ retirement plan are all frozen plans to new participants. To calculate annual pension costs, management uses the following key variables: (1) size of the employee population, length of service and estimated compensation increases; (2) actuarial assumptions and estimates; (3) expected long-term rate of return on plan assets; and (4) discount rate. For all pension and postretirement benefit plan calculations, the Company uses a December 31st measurement date.
The expected long-term rate of return was based on a calculated rate of return from average rates of return on various asset classes over a
In estimating the projected benefit obligation, an independent actuary bases assumptions on factors such as mortality rate, turnover rate, retirement rate, disability rate and other assumptions related to the population of individuals in the pension plan. If significant actuarial gains or losses occur, the actuary reviews the demographic and economic assumptions with management, at which time the Company considers revising these assumptions based on actual results.
109
The Company recognizes an asset on its consolidated balance sheets for a plan’s overfunded status or a liability for a plan’s underfunded status. The Company also measures the plans’ assets and obligations that determine its funded status as of the end of the year and recognizes those changes in other comprehensive income, net of tax. Periodic pension expense (or income) includes service costs, interest costs based on the assumed discount rate, the expected return on plan assets based on an actuarially derived market-related value and amortization of actuarial gains and losses. Service cost is included in salaries and employee benefits expense, while all other components of net periodic pension cost are included in other noninterest expense in the consolidated statements of income.
Income Taxes
Current income tax expense is recognized for the amount of income taxes expected to be payable or refundable for the current period, and deferred income taxes are provided to reflect the tax effect of temporary differences between financial statement carrying amounts and the corresponding tax basis of assets and liabilities. Deferred income taxes are calculated by applying enacted statutory tax rates and tax laws to future years in which temporary differences are expected to reverse. The impact on deferred tax assets and liabilities from a change in tax rates is recognized in income in the period that the tax rate change is enacted. A deferred tax valuation allowance is established if it is more likely than not that a deferred tax asset will not be realized. Interest and penalties, if any, expected to be assessed or refunded by taxing authorities relating to an underpayment or overpayment of income taxes are accrued and recorded as part of income tax expense.
Excise tax credits relating to premises and equipment are accounted for using the flow-through method, and the benefit is recognized in the year the asset is placed in service. General business and excise tax credits generated from the leasing portfolio, except for credits that are passed on to lessees, are recognized over the term of the lease for book purposes, but in the year placed in service for tax purposes.
The Company maintains reserves for unrecognized tax benefits that arise in the normal course of business. As of December 31, 2023, these positions were evaluated based on an assessment of probabilities as to the likelihood of whether a liability had been incurred. Such assessments are reviewed as events occur and adjustments to the reserves are made as appropriate. In evaluating a tax position for recognition, the Company evaluates whether it is more likely than not that a tax position will be sustained upon examination, including resolution of related appeals or litigation processes, based on the technical merits of the position. If the tax position meets the more likely than not recognition threshold, the tax position is measured and recognized in the Company’s consolidated financial statements as the largest amount of tax benefit that, in management’s judgment, is greater than 50% likely of being realized upon ultimate settlement.
Derivative Instruments and Hedging Activities
Derivatives are recognized on the consolidated balance sheets at fair value. On the date the Company enters into a derivative contract, the Company designates the derivative instrument as: (1) a hedge of the fair value of a recognized asset or liability or of an unrecognized firm commitment (“fair value hedge”); (2) a hedge of a forecasted transaction or the variability of cash flows to be received or paid related to a recognized asset or liability (“cash flow hedge”); or (3) held for trading, customer accommodation or not qualifying for hedge accounting (“free-standing derivative instrument”).
For a fair value hedge, changes in the fair value of the derivative instrument and changes in the fair value of the hedged asset or liability or of an unrecognized firm commitment attributable to interest rate risk are recorded in current period earnings. For a cash flow hedge, to the extent that the hedge is considered highly effective, changes in the fair value of the derivative instrument are recorded in other comprehensive income and subsequently reclassified to net income in the same period that the hedged transaction impacts net income. For free-standing derivative instruments, changes in fair values are reported in current period earnings.
The Company formally documents the relationship between hedging instruments and hedged items, as well as the risk management objective and strategy for undertaking various hedge transactions. This process includes linking all derivative instruments that are designated as hedges to specific assets or liabilities, unrecognized firm commitments or forecasted transactions. The Company also formally assesses, both at the inception of a hedge and on a quarterly basis, whether the derivative instruments used are highly effective in offsetting changes in fair values of, or cash flows related to, hedged items.
110
Fair Value Measurements
Fair value measurements apply whenever GAAP requires or permits assets or liabilities to be measured at fair value either on a recurring or nonrecurring basis. Fair value is defined as the price that would be received to sell an asset or paid to transfer a liability in the principal or most advantageous market for an asset or liability in an orderly transaction between market participants at the measurement date. Fair value is based on the assumptions that management believes market participants would use when pricing an asset or liability. Fair value measurement and disclosure guidance established a three-level fair value hierarchy that prioritizes the use of inputs used in valuation methodologies. Management maximizes the use of observable inputs and minimizes the use of unobservable inputs when determining fair value measurements.
Stock-Based Compensation
The Company grants stock-based awards, including restricted stock, restricted shares, performance share units, performance shares and restricted stock units. These awards are issued at no cost to the recipient. The fair value of restricted stock, restricted shares and restricted stock unit awards was based on the closing price of FHI’s common stock on the date of grant. Such awards were recognized in the Company’s consolidated statements of income on a straight-line basis over the vesting period. Recipients of performance shares and performance share units are entitled to receive shares of FHI common stock at no cost, subject to the Company’s achievement of specified market or performance conditions. The grant date fair value of the performance share units subject to the Company’s achievement of specified market conditions was estimated using a Monte Carlo simulation model. For purposes of this modeling exercise, historical volatilities of FHI common stock and members of the peer group were used. The risk-free interest rate that was used in the valuation was that of a zero-coupon U.S. Treasury note that was commensurate with the performance period. The grant date fair value of the performance share units and performance shares subject to the Company’s achievement of performance conditions was based on the closing price of FHI’s common stock on the date of grant. Forfeitures of stock-based awards are recognized as they occur.
As compensation cost is recognized, a deferred tax asset is established which represents an estimate of the future tax deduction from the release of restrictions or the achievement of performance targets. At the time that restrictions on the stock-based awards are released, the Company may be required to recognize an adjustment to income tax expense, depending on the market price of the Company’s common stock at that time.
Treasury Stock
Shares of the Parent’s common stock that were repurchased or that are used to satisfy payroll tax withholdings related to stock-based compensation are recorded in treasury stock at cost. On the date of subsequent reissuance, the treasury stock account will be reduced by the cost of such stock on a first-in, first-out basis.
Earnings per Share
Basic earnings per share are computed by dividing net income by the weighted average number of common shares outstanding for the period. Diluted earnings per share are computed by dividing net income by the weighted average number of common shares outstanding for the period, assuming conversion of potentially dilutive common stock equivalents.
Advertising and Marketing Costs
Advertising and marketing costs are expensed as incurred. Advertising and marketing costs were $
111
Accounting Standards Adopted in 2023
In March 2022, the Financial Accounting Standards Board (“FASB”) issued Accounting Standards Update (“ASU”) No. 2022-01, Derivatives and Hedging (Topic 815), Fair Value Hedging – Portfolio Layer Method. This update clarifies the guidance in Topic 815 on fair value hedge accounting of interest rate risk for portfolios of financial assets. Under current hedge accounting guidance, the “last-of-layer” method enables an entity to apply fair value hedging to a stated amount of a closed portfolio of prepayable financial assets without having to consider prepayment risk or credit risk when measuring those assets. The hedged item represents a single layer within that closed portfolio. This update expands the scope of this guidance to allow entities to apply the “portfolio layer” method to portfolios of all financial assets, including both prepayable and nonprepayable financial assets. The current model is expanded to (1) explicitly allow entities to designate multiple layers in a single portfolio as individual hedged items and (2) also allow entities the flexibility to use any type of derivative (or combination of derivatives) by applying the multiple-layer model that aligns with its risk management strategy. Although no assets may be added to a closed portfolio once it is designated in a portfolio layer method hedge, at any time after the initial hedge designation, new hedging relationships associated with the portfolio may be designated and existing hedging relationships associated with the portfolio may be dedesignated to align with an entity’s evolving strategy for managing interest rate risk on a timely basis. Under the portfolio layer method, the basis of the portfolio assets is generally adjusted at the portfolio level rather than being allocated to individual assets within the portfolio, except when the allocation of basis adjustments is required by other areas of GAAP. The intent of this update is consistent with the FASB’s efforts to better align an entity’s financial reporting with the results of its risk management strategy and to further simplify the hedge accounting model. The Company adopted the provisions of ASU No. 2022-01 on January 1, 2023, and it did not have a material impact on the Company’s consolidated financial statements.
In March 2022, the FASB issued ASU No. 2022-02, Financial Instruments – Credit Losses (Topic 326), Troubled Debt Restructurings and Vintage Disclosures. This update eliminates the accounting guidance on troubled debt restructurings (“TDRs”) for creditors in Subtopic 310-40 and amends the guidance on vintage disclosures to require disclosure of current period gross charge-offs by year of origination. This ASU also updates the requirements related to accounting for credit losses under Topic 326 and adds enhanced disclosures for creditors with respect to loan refinancings and restructurings for borrowers experiencing financial difficulty. The Company adopted the provisions of ASU No. 2022-02 on January 1, 2023, and it did not have a material impact on the Company’s consolidated financial statements. See “Note 5. Allowance for Credit Losses” for required disclosures related to this new guidance.
Enactment of the Inflation Reduction Act of 2022
On August 16, 2022, the U.S. government enacted the Inflation Reduction Act (IRA) which, among other changes, created a new corporate alternative minimum tax (AMT) based on adjusted financial statement income and imposes a 1% excise tax on corporate stock repurchases. These provisions became effective January 1, 2023. The enactment of the IRA did not have a material impact on the Company’s consolidated financial statements.
Recent Accounting Pronouncements
The following ASUs have been issued by the FASB and are applicable to the Company in future reporting periods.
In March 2023, the FASB issued ASU No. 2023-01, Leases (Topic 842), Common Control Arrangements. This update clarifies the accounting for leasehold improvements associated with common control leases. Prior to this update, Topic 842 generally required leasehold improvements to have an amortization period consistent with the shorter of the useful life of those improvements or the remaining lease term. This update will require leasehold improvements associated with common control leases to be (1) amortized by the lessee over the useful life of the leasehold improvements to the common control group (regardless of the lease term) as long as the lessee controls the use of the underlying asset (the leased asset) through a lease, and (2) accounted for as a transfer between entities under common control through an adjustment to equity if, and when, the lessee no longer controls the use of the underlying asset. In addition, this update also subjects leasehold improvements to the impairment guidance in Topic 360, Property, Plant, and Equipment. The Company adopted the provisions of ASU No. 2023-01 on January 1, 2024, and it did not have a material impact on the Company’s consolidated financial statements.
112
In March 2023, the FASB issued ASU No. 2023-02, Investments—Equity Method and Joint Ventures (Topic 323), Accounting for Investments in Tax Credit Structures Using the Proportional Amortization Method. This update expands the population of tax equity investments for which a reporting entity may elect to apply the proportional amortization method (“PAM”). Under current guidance, an entity can only elect to apply the PAM to investments in low-income housing tax credit (“LIHTC”) structures. This update permits an entity to make an election to account for tax equity investments, regardless of the tax credit program from which the income tax credits are received, using the PAM if certain conditions are met. An accounting policy election is made to apply the PAM on a tax credit program-by-program basis rather than electing to apply the PAM at the reporting entity level or to individual investments. By applying the PAM, a reporting entity must account for the receipt of the investment tax credits using the flow-through method under Topic 740, Income Taxes, even if the entity applies the deferral method for other investment tax credits received. For all tax equity investments accounted for using the PAM, this update also requires the use of the delayed equity contribution guidance. LIHTC investments not accounted for using the PAM will no longer be permitted to use the delayed equity contribution guidance. In addition, LIHTC investments accounted for using the equity method must apply the impairment guidance in Subtopic 323-10, Investments—Equity Method and Joint Ventures—Overall. Further, LIHTC investments that are not accounted for using the PAM or the equity method must use the guidance in Topic 321, Investments—Equity Securities, when accounting for equity investments. In addition, the amendments in this update require specific disclosures that must be applied to all investments that generate income tax credits and other income tax benefits from a tax credit program for which the entity has elected to apply the PAM, including investments within that elected program that do not meet the conditions to apply the PAM. Such disclosures include the nature of its tax equity investments and the effect of such investments and related income tax credits and other income tax benefits on its financial position and results of operations. The Company adopted the provisions of ASU No. 2023-02 on January 1, 2024, and it did not have a material impact on the Company’s consolidated financial statements.
In November 2023, the FASB issued ASU No. 2023-07, Segment Reporting (Topic 280), Improvements to Reportable Segment Disclosures. This update improves reportable segment disclosure requirements, primarily through enhanced disclosures about significant segment expenses. The amendments will require public entities to disclose significant segment expenses that are regularly provided to the chief operating decision maker (“CODM”) and included within segment profit or loss, an amount and description of its composition for other segment items to reconcile to segment profit or loss, and the title and position of the entity’s CODM. In addition, the amendments clarify circumstances in which an entity can disclose multiple measures of segment profit or loss, provide new segment disclosure requirements for entities with a single reportable segment, and expand interim disclosure requirements. The purpose of the amendments is to enable investors to better understand an entity’s overall performance and assess potential future cash flows. The amendments are effective for the Company’s annual periods beginning January 1, 2024 and interim periods beginning January 1, 2025, with early adoption permitted, and requires retrospective application to all prior periods presented in the financial statements. The Company is in the process of evaluating the impact that this new guidance may have on the Company’s consolidated financial statements.
In December 2023, the FASB issued ASU No. 2023-09, Income Taxes (Topic 740), Improvements to Income Tax Disclosures. This update includes amendments that further enhance the transparency and decision usefulness of income tax disclosures, primarily through standardizing and disaggregating rate reconciliation categories and income taxes paid by jurisdiction. This update is effective for the Company’s annual periods beginning January 1, 2025. Early adoption is permitted. The Company is in the process of evaluating the impact that this new guidance may have on the Company’s consolidated financial statements.
2. Transactions with Affiliates and Related Parties
In the normal course of business, the Company makes loans to executive officers and directors of the Company and its subsidiary and to entities and individuals affiliated with those executive officers and directors. These loans are made on terms no less favorable to the Company than those prevailing at the time for comparable transactions with unrelated persons or, in the case of certain residential real estate loans, on terms that are widely available to employees of the Company who are not directors or executive officers.
113
Changes in the loans to such executive officers, directors and affiliates during 2023, 2022 and 2021 were as follows:
Year Ended December 31, | |||||||||
(dollars in thousands) |
| 2023 |
| 2022 |
| 2021 | |||
Balance at beginning of year | $ | | $ | | $ | | |||
New loans made | | | | ||||||
Repayments | ( | ( | ( | ||||||
Balance at end of year | $ | | $ | | $ | | |||
There were
3. Investment Securities
As of December 31, 2023 and 2022, investment securities consisted predominantly of the following investment categories:
U.S. Treasury and debt securities – includes U.S. Treasury notes and debt securities issued by government-sponsored enterprises.
Mortgage-backed securities – includes securities backed by notes or receivables secured by mortgage assets with cash flows based on actual or scheduled payments.
Collateralized mortgage obligations – includes securities backed by a pool of mortgages with cash flows distributed based on certain rules rather than pass through payments.
Collateralized loan obligations – includes structured debt securities backed by a pool of loans, consisting of primarily non-investment grade broadly syndicated corporate loans with additional credit enhancement. These are floating rate securities that have an investment grade rating of AA or better.
Debt securities issued by states and political subdivisions – includes general obligation bonds issued by state and local governments.
114
As of December 31, 2023 and 2022, the Company’s investment securities were classified as either available-for-sale or held-to-maturity. Amortized cost, gross unrealized holding gains and losses and fair value of available-for-sale and held-to-maturity investment securities as of December 31, 2023 and 2022 were as follows:
2023 | 2022 | |||||||||||||||||||||||
Amortized | Unrealized | Unrealized | Fair | Amortized | Unrealized | Unrealized | Fair | |||||||||||||||||
(dollars in thousands) |
| Cost |
| Gains |
| Losses |
| Value |
| Cost |
| Gains |
| Losses |
| Value | ||||||||
U.S. Treasury and government agency debt securities | $ | | $ | — | $ | ( | $ | | $ | | $ | — | $ | ( | $ | | ||||||||
Government-sponsored enterprises debt securities | | — | ( | | | — | ( | | ||||||||||||||||
Mortgage-backed securities: | ||||||||||||||||||||||||
Residential - Government agency | | — | ( | | | — | ( | | ||||||||||||||||
Residential - Government-sponsored enterprises | | — | ( | | | — | ( | | ||||||||||||||||
Commercial - Government agency | | — | ( | | | — | ( | | ||||||||||||||||
Commercial - Government-sponsored enterprises | | — | ( | | | — | ( | | ||||||||||||||||
Commercial - Non-agency | | — | ( | | | — | ( | | ||||||||||||||||
Collateralized mortgage obligations: | ||||||||||||||||||||||||
Government agency | | — | ( | | | — | ( | | ||||||||||||||||
Government-sponsored enterprises | | — | ( | | | — | ( | | ||||||||||||||||
Collateralized loan obligations | | | ( | | | | ( | | ||||||||||||||||
Total available-for-sale securities | $ | | $ | | $ | ( | $ | | $ | | $ | | $ | ( | $ | | ||||||||
Government agency debt securities | $ | | $ | — | $ | ( | $ | | $ | | $ | — | $ | ( | $ | | ||||||||
Mortgage-backed securities: | ||||||||||||||||||||||||
Residential - Government agency | | — | ( | | | — | ( | | ||||||||||||||||
Residential - Government-sponsored enterprises | | — | ( | | | — | ( | | ||||||||||||||||
Commercial - Government agency | | — | ( | | | — | ( | | ||||||||||||||||
Commercial - Government-sponsored enterprises | | | ( | | | — | ( | | ||||||||||||||||
Collateralized mortgage obligations: | ||||||||||||||||||||||||
Government agency | | — | ( | | | — | ( | | ||||||||||||||||
Government-sponsored enterprises | | — | ( | | | — | ( | | ||||||||||||||||
Debt securities issued by states and political subdivisions | | — | ( | | | — | ( | | ||||||||||||||||
Total held-to-maturity securities | $ | | $ | | $ | ( | $ | | $ | | $ | — | $ | ( | $ | | ||||||||
During the year ended December 31, 2022, the Company reclassified at fair value approximately $
115
Accrued interest receivable related to available-for-sale investment securities was $
Including the 2023 sale of Visa Class B restricted shares described below, proceeds from calls and sales of investment securities were $
Interest income from taxable investment securities was $
116
The amortized cost and fair value of debt securities issued by the U.S. Treasury, government agencies, government-sponsored enterprises and states and political subdivisions, non-agency mortgage-backed securities and collateralized loan obligations as of December 31, 2023, by contractual maturity, are shown below. Mortgage-backed securities and collateralized mortgage obligations issued by government agencies and government-sponsored enterprises are disclosed separately in the table below as remaining expected maturities will differ from contractual maturities as borrowers have the right to prepay obligations.
December 31, 2023 | ||||||
Amortized | Fair | |||||
(dollars in thousands) |
| Cost |
| Value | ||
Available-for-sale securities | ||||||
Due in one year or less | $ | | $ | | ||
Due after one year through five years | | | ||||
Due after five years through ten years | | | ||||
Due after ten years | | | ||||
| | |||||
Mortgage-backed securities: | ||||||
Residential - Government agency | | | ||||
Residential - Government-sponsored enterprises | | | ||||
Commercial - Government agency | | | ||||
Commercial - Government-sponsored enterprises | | | ||||
Total mortgage-backed securities | | | ||||
Collateralized mortgage obligations: | ||||||
Government agency | | | ||||
Government-sponsored enterprises | | | ||||
Total collateralized mortgage obligations | | | ||||
Total available-for-sale securities | $ | | $ | | ||
Held-to-maturity securities | ||||||
Due in one year or less | $ | — | $ | — | ||
Due after one year through five years | — | — | ||||
Due after five years through ten years | | | ||||
Due after ten years | | | ||||
| | |||||
Mortgage-backed securities: | ||||||
Residential - Government agency | | | ||||
Residential - Government-sponsored enterprises | | | ||||
Commercial - Government agency | | | ||||
Commercial - Government-sponsored enterprises | | | ||||
Total mortgage-backed securities | | | ||||
Collateralized mortgage obligations: | ||||||
Government agency | | | ||||
Government-sponsored enterprises | | | ||||
Total collateralized mortgage obligations | | | ||||
Total held-to-maturity securities | $ | | $ | | ||
At December 31, 2023, pledged securities totaled $
The Company held
117
The following tables present the unrealized gross losses and fair values of securities in the available-for-sale portfolio by length of time that the
Time in Continuous Loss as of December 31, 2023 | ||||||||||||||||||
Less Than 12 Months | 12 Months or More | Total | ||||||||||||||||
Unrealized | Unrealized | Unrealized | ||||||||||||||||
(dollars in thousands) |
| Losses |
| Fair Value |
| Losses |
| Fair Value |
| Losses |
| Fair Value | ||||||
U.S. Treasury and government agency debt securities | $ | — | $ | — | $ | ( | $ | | $ | ( | $ | | ||||||
Government-sponsored enterprises debt securities | — | — | ( | | ( | | ||||||||||||
Mortgage-backed securities: | ||||||||||||||||||
Residential - Government agency | — | — | ( | | ( | | ||||||||||||
Residential - Government-sponsored enterprises | — | — | ( | | ( | | ||||||||||||
Commercial - Government agency | — | — | ( | | ( | | ||||||||||||
Commercial - Government-sponsored enterprises | — | — | ( | | ( | | ||||||||||||
Commercial - Non-agency | — | — | ( | | ( | | ||||||||||||
Collateralized mortgage obligations: | ||||||||||||||||||
Government agency | — | — | ( | | ( | | ||||||||||||
Government-sponsored enterprises | — | — | ( | | ( | | ||||||||||||
Collateralized loan obligations | ( | | ( | | ( | | ||||||||||||
Total available-for-sale securities with unrealized losses | $ | ( | $ | | $ | ( | $ | | $ | ( | $ | | ||||||
Time in Continuous Loss as of December 31, 2022 | ||||||||||||||||||
Less Than 12 Months | 12 Months or More | Total | ||||||||||||||||
Unrealized | Unrealized | Unrealized | ||||||||||||||||
(dollars in thousands) |
| Losses |
| Fair Value |
| Losses |
| Fair Value |
| Losses |
| Fair Value | ||||||
U.S. Treasury and government agency debt securities | $ | ( | $ | | $ | ( | $ | | $ | ( | $ | | ||||||
Government-sponsored enterprises debt securities | ( | | — | — | ( | | ||||||||||||
Mortgage-backed securities: | ||||||||||||||||||
Residential - Government agency | ( | | — | — | ( | | ||||||||||||
Residential - Government-sponsored enterprises | ( | | ( | | ( | | ||||||||||||
Commercial - Government agency | ( | | ( | | ( | | ||||||||||||
Commercial - Government-sponsored enterprises | ( | | ( | | ( | | ||||||||||||
Commercial - Non-agency | ( | | — | — | ( | | ||||||||||||
Collateralized mortgage obligations: | ||||||||||||||||||
Government agency | ( | | ( | | ( | | ||||||||||||
Government-sponsored enterprises | ( | | ( | | ( | | ||||||||||||
Collateralized loan obligations | ( | | — | — | ( | | ||||||||||||
Total available-for-sale securities with unrealized losses | $ | ( | $ | | $ | ( | $ | | $ | ( | $ | | ||||||
At December 31, 2023 and 2022, the Company did not have any available-for-sale securities with the intent to sell and determined it was more likely than not that the Company would not be required to sell the securities prior to recovery of the amortized cost basis. As the Company had the intent and ability to hold the remaining available-for-sale securities in an unrealized loss position as of December 31, 2023 and 2022, each security with an unrealized loss position in the above tables has been further assessed to determine if a credit loss exists. As of December 31, 2023 and 2022, the Company did not expect any credit losses in its available-for-sale debt securities and
118
As of December 31, 2023 and 2022, the Company’s investment securities were comprised primarily of debt securities, mortgage-backed securities and collateralized mortgage obligations issued by the U.S. Government, its agencies and government-sponsored enterprises, with under
During the year ended December 31, 2023, the Company recorded a $
4. Loans and Leases
As of December 31, 2023 and 2022, loans and leases were comprised of the following:
December 31, | December 31, | |||||
(dollars in thousands) |
| 2023 |
| 2022 | ||
Commercial and industrial | $ | | $ | | ||
Commercial real estate | | | ||||
Construction | | | ||||
Residential: | ||||||
Residential mortgage | |
| | |||
Home equity line | | | ||||
Total residential |
| | | |||
Consumer | | | ||||
Lease financing | | | ||||
Total loans and leases | $ | | $ | | ||
Outstanding loan balances are reported net of deferred loan costs and fees of $
Accrued interest receivable related to loans and leases was $
As of December 31, 2023, residential real estate loans and commercial real estate loans totaling $
Net gains related to the sales of loans, recorded as a component of other noninterest income, were $
119
In the course of evaluating the credit risk presented by a customer and the pricing that will adequately compensate the Company for assuming that risk, management may require a certain amount of collateral support. The type of collateral held varies, but may include accounts receivable, inventory, land, buildings, equipment, income-producing commercial properties and residential real estate. The Company applies the same collateral policy for loans whether they are funded immediately or on a delayed basis. The loan and lease portfolio is principally located in Hawaii and, to a lesser extent, on the U.S. Mainland, Guam and Saipan. The risk inherent in the portfolio depends upon both the economic stability of the state or territories, which affects property values, and the financial strength and creditworthiness of the borrowers.
5. Allowance for Credit Losses
The Company maintains an ACL that is deducted from the amortized cost basis of loans and leases to present the net carrying value of loans and leases expected to be collected. The measurement of expected credit losses is based on relevant information about past events, including historical experience, current conditions, and reasonable and supportable forecasts that affect the collectibility of the reported amount of loans and leases.
The Company also maintains an estimated reserve for unfunded commitments on the consolidated balance sheets. The reserve for unfunded commitments is reduced in the period in which the off-balance sheet financial instruments expire, loan funding occurs, or is otherwise settled.
Rollforward of the Allowance for Credit Losses
The following presents the activity in the ACL by class of loans and leases for the years ended December 31, 2023, 2022 and 2021:
Year Ended December 31, 2023 | ||||||||||||||||||||||||
Commercial Lending | Residential Lending | |||||||||||||||||||||||
Commercial | Commercial | Home | ||||||||||||||||||||||
and | Real | Lease | Residential | Equity | ||||||||||||||||||||
(dollars in thousands) |
| Industrial |
| Estate |
| Construction |
| Financing |
| Mortgage |
| Line |
| Consumer |
| Total | ||||||||
Allowance for credit losses: | ||||||||||||||||||||||||
Balance at beginning of year | $ | | $ | | $ | | $ | | $ | | $ | | $ | | $ | | ||||||||
Charge-offs | ( | ( | — | — | ( | ( | ( | ( | ||||||||||||||||
Recoveries | | — | — | — | | | | | ||||||||||||||||
Provision | | | | | | | | | ||||||||||||||||
Balance at end of year | $ | | $ | | $ | | $ | | $ | | $ | | $ | | $ | | ||||||||
Year Ended December 31, 2022 | ||||||||||||||||||||||||
Commercial Lending | Residential Lending | |||||||||||||||||||||||
Commercial | Commercial | Home | ||||||||||||||||||||||
and | Real | Lease | Residential | Equity | ||||||||||||||||||||
(dollars in thousands) |
| Industrial |
| Estate |
| Construction |
| Financing |
| Mortgage |
| Line |
| Consumer |
| Total | ||||||||
Allowance for credit losses: | ||||||||||||||||||||||||
Balance at beginning of year | $ | | $ | | $ | | $ | | $ | | $ | | $ | | $ | | ||||||||
Charge-offs | ( | ( | — | — | ( | ( | ( | ( | ||||||||||||||||
Recoveries | | | — | | | | | | ||||||||||||||||
Provision | ( | | ( | ( | | | | ( | ||||||||||||||||
Balance at end of year | $ | | $ | | $ | | $ | | $ | | $ | | $ | | $ | | ||||||||
Year Ended December 31, 2021 | ||||||||||||||||||||||||
Commercial Lending | Residential Lending | |||||||||||||||||||||||
Commercial | Commercial | Home | ||||||||||||||||||||||
and | Real | Lease | Residential | Equity | ||||||||||||||||||||
(dollars in thousands) |
| Industrial |
| Estate |
| Construction |
| Financing |
| Mortgage |
| Line |
| Consumer |
| Total | ||||||||
Allowance for credit losses: | ||||||||||||||||||||||||
Balance at beginning of year | $ | | $ | | $ | | $ | | $ | | $ | | $ | | $ | | ||||||||
Charge-offs | ( | ( | — | — | ( | ( | ( | ( | ||||||||||||||||
Recoveries | | | | — | | | | | ||||||||||||||||
Provision | | ( | ( | ( | ( | ( | ( | ( | ||||||||||||||||
Balance at end of year | $ | | $ | | $ | | $ | | $ | | $ | | $ | | $ | | ||||||||
120
Rollforward of the Reserve for Unfunded Commitments
The following presents the activity in the Reserve for Unfunded Commitments for the years ended December 31, 2023, 2022 and 2021:
Year Ended December 31, 2023 | |||||||||||||||||||||||||
Commercial Lending | Residential Lending | ||||||||||||||||||||||||
Commercial | Commercial | Home | |||||||||||||||||||||||
and | Real | Lease | Residential | Equity | |||||||||||||||||||||
(dollars in thousands) |
| Industrial |
| Estate |
| Construction |
| Financing |
| Mortgage |
| Line |
| Consumer |
| Total | |||||||||
Reserve for unfunded commitments: | |||||||||||||||||||||||||
Balance at beginning of year | $ | | $ | | $ | | $ | — | $ | | $ | | $ | | $ | | |||||||||
Provision | | ( | | — | ( | | | | |||||||||||||||||
Balance at end of year | $ | | $ | | $ | | $ | — | $ | | $ | | $ | | $ | | |||||||||
Year Ended December 31, 2022 | ||||||||||||||||||||||||
Commercial Lending | Residential Lending | |||||||||||||||||||||||
Commercial | Commercial | Home | ||||||||||||||||||||||
and | Real | Lease | Residential | Equity | ||||||||||||||||||||
(dollars in thousands) |
| Industrial |
| Estate |
| Construction |
| Financing |
| Mortgage |
| Line |
| Consumer |
| Total | ||||||||
Reserve for unfunded commitments: | ||||||||||||||||||||||||
Balance at beginning of year | $ | | $ | | $ | | $ | — | $ | | $ | | $ | | $ | | ||||||||
Provision | ( | ( | ( | — | | | ( | | ||||||||||||||||
Balance at end of year | $ | | $ | | $ | | $ | — | $ | | $ | | $ | | $ | | ||||||||
Year Ended December 31, 2021 | ||||||||||||||||||||||||
Commercial Lending | Residential Lending | |||||||||||||||||||||||
Commercial | Commercial | Home | ||||||||||||||||||||||
and | Real | Lease | Residential | Equity | ||||||||||||||||||||
(dollars in thousands) |
| Industrial |
| Estate |
| Construction |
| Financing |
| Mortgage |
| Line |
| Consumer |
| Total | ||||||||
Reserve for unfunded commitments: | ||||||||||||||||||||||||
Balance at beginning of year | $ | | $ | | $ | | $ | — | $ | | $ | | $ | | $ | | ||||||||
Provision | ( | | ( | — | | | | ( | ||||||||||||||||
Balance at end of year | $ | | $ | | $ | | $ | — | $ | | $ | | $ | | $ | | ||||||||
Credit Quality Information
The Company performs an internal loan review and grading or scoring procedures on an ongoing basis. The review provides management with periodic information as to the quality of the loan portfolio and effectiveness of the Company’s lending policies and procedures. The objective of the loan review and grading or scoring procedures is to identify, in a timely manner, existing or emerging credit quality issues so that appropriate steps can be initiated to avoid or minimize future losses.
Loans and leases subject to grading primarily include: commercial and industrial loans, commercial real estate loans, construction loans and lease financing. Other loans subject to grading include installment loans to businesses or individuals for business and commercial purposes, overdraft lines of credit, commercial credit cards, and other credits as may be determined. Credit quality indicators for internally graded loans and leases are generally updated on an annual basis or on a quarterly basis for those loans and leases deemed to be of potentially higher risk.
An internal credit risk rating system is used to determine loan grade and is based on borrower credit risk and transactional risk. The loan grading process is a mechanism used to determine the risk of a particular borrower and is based on the following factors of a borrower: character, earnings and operating cash flow, asset and liability structure, debt capacity, management and controls, borrowing entity, and industry and operating environment.
Pass – “Pass” (uncriticized) loans and leases are not considered to carry greater than normal risk. The borrower has the apparent ability to satisfy obligations to the Company, and therefore no loss in ultimate collection is anticipated.
Special Mention – Loans and leases that have potential weaknesses that deserves management’s close attention. If left uncorrected, these potential weaknesses may result in deterioration of the repayment prospects for assets or in the institution’s credit position at some future date. Special mention assets are not adversely classified and do not expose an institution to sufficient risk to warrant adverse classification.
121
Substandard – Loans and leases that are inadequately protected by the current financial condition and paying capacity of the obligor or by any collateral pledged. Loans and leases so classified must have a well-defined weakness or weaknesses that jeopardize the collection of the debt. They are characterized by the distinct possibility that the bank may sustain some loss if the deficiencies are not corrected.
Doubtful – Loans and leases that have weaknesses found in substandard borrowers with the added provision that the weaknesses make collection of debt in full, on the basis of currently existing facts, conditions, and values, highly questionable and improbable.
Loss – Loans and leases classified as loss are considered uncollectible and of such little value that their continuance as an asset is not warranted. This classification does not mean that the loan or lease has absolutely no recovery or salvage value, but rather that it is not practical or desirable to defer writing off this basically worthless asset even though partial recovery may be effected in the future.
Loans that are primarily monitored for credit quality using FICO scores include: residential mortgage loans, home equity lines and consumer loans. FICO scores are calculated primarily based on a consideration of payment history, the current amount of debt, the length of credit history available, a recent history of new sources of credit and the mix of credit type. FICO scores are updated on a monthly, quarterly or bi-annual basis, depending on the product type.
122
The amortized cost basis by year of origination and credit quality indicator of the Company's loans and leases as of December 31, 2023 was as follows:
Revolving | |||||||||||||||||||||||||||
Loans | |||||||||||||||||||||||||||
Converted | |||||||||||||||||||||||||||
Term Loans | Revolving | to Term | |||||||||||||||||||||||||
Amortized Cost Basis by Origination Year | Loans | Loans | |||||||||||||||||||||||||
Amortized | Amortized | ||||||||||||||||||||||||||
(dollars in thousands) | 2023 | 2022 | 2021 | 2020 | 2019 | Prior | Cost Basis | Cost Basis | Total | ||||||||||||||||||
Commercial Lending | |||||||||||||||||||||||||||
Commercial and Industrial | |||||||||||||||||||||||||||
Risk rating: | |||||||||||||||||||||||||||
Pass | $ | | $ | | $ | | $ | | $ | | $ | | $ | | $ | | $ | | |||||||||
Special Mention | | | | | | | | | | ||||||||||||||||||
Substandard | — | | | | | | | — | | ||||||||||||||||||
Other (1) | | | | | | | | — | | ||||||||||||||||||
Total Commercial and Industrial | | | | | | | | | | ||||||||||||||||||
Current period gross charge-offs | | | | | | | — | — | | ||||||||||||||||||
Commercial Real Estate | |||||||||||||||||||||||||||
Risk rating: | |||||||||||||||||||||||||||
Pass | | | | | | | | | | ||||||||||||||||||
Special Mention | | | | | | | | — | | ||||||||||||||||||
Substandard | | | | — | | | | — | | ||||||||||||||||||
Other (1) | — | — | — | — | — | | — | — | | ||||||||||||||||||
Total Commercial Real Estate | | | | | | | | | | ||||||||||||||||||
Current period gross charge-offs | | | | | | | | | | ||||||||||||||||||
Construction | |||||||||||||||||||||||||||
Risk rating: | |||||||||||||||||||||||||||
Pass | | | | | | | | — | | ||||||||||||||||||
Special Mention | — | — | — | — | | | — | — | | ||||||||||||||||||
Other (1) | | | | | | | | — | | ||||||||||||||||||
Total Construction | | | | | | | | — | | ||||||||||||||||||
Current period gross charge-offs | | | | | | | | | | ||||||||||||||||||
Lease Financing | |||||||||||||||||||||||||||
Risk rating: | |||||||||||||||||||||||||||
Pass | | | | | | | — | — | | ||||||||||||||||||
Special Mention | | | | | — | — | — | — | | ||||||||||||||||||
Substandard | | | — | — | | — | — | — | | ||||||||||||||||||
Total Lease Financing | | | | | | | — | — | | ||||||||||||||||||
Current period gross charge-offs | | | | | | | | | | ||||||||||||||||||
Total Commercial Lending | $ | | $ | | $ | | $ | | $ | | $ | | $ | | $ | | $ | | |||||||||
Current period gross charge-offs | $ | | $ | | $ | | $ | | $ | | $ | | $ | — | $ | — | $ | | |||||||||
(continued)
123
Revolving | |||||||||||||||||||||||||||
Loans | |||||||||||||||||||||||||||
Converted | |||||||||||||||||||||||||||
Term Loans | Revolving | to Term | |||||||||||||||||||||||||
Amortized Cost Basis by Origination Year | Loans | Loans | |||||||||||||||||||||||||
(continued) | Amortized | Amortized | |||||||||||||||||||||||||
(dollars in thousands) | 2023 | 2022 | 2021 | 2020 | 2019 | Prior | Cost Basis | Cost Basis | Total | ||||||||||||||||||
Residential Lending | |||||||||||||||||||||||||||
Residential Mortgage | |||||||||||||||||||||||||||
FICO: | |||||||||||||||||||||||||||
740 and greater | $ | | $ | | $ | | $ | | $ | | $ | | $ | — | $ | — | $ | | |||||||||
680 - 739 | | | | | | | — | — | | ||||||||||||||||||
620 - 679 | | | | | | | — | — | | ||||||||||||||||||
550 - 619 | | | | | | | — | — | | ||||||||||||||||||
Less than 550 | — | — | | | | | — | — | | ||||||||||||||||||
No Score (3) | | | | | | | — | — | | ||||||||||||||||||
Other (2) | | | | | | | | — | | ||||||||||||||||||
Total Residential Mortgage | | | | | | | | — | | ||||||||||||||||||
Current period gross charge-offs | | | | | | | | | | ||||||||||||||||||
Home Equity Line | |||||||||||||||||||||||||||
FICO: | |||||||||||||||||||||||||||
740 and greater | — | — | — | — | — | — | | | | ||||||||||||||||||
680 - 739 | — | — | — | — | — | — | | | | ||||||||||||||||||
620 - 679 | — | — | — | — | — | — | | | | ||||||||||||||||||
550 - 619 | — | — | — | — | — | — | | | | ||||||||||||||||||
Less than 550 | — | — | — | — | — | — | | | | ||||||||||||||||||
No Score (3) | — | — | — | — | — | — | | — | | ||||||||||||||||||
Total Home Equity Line | — | — | — | — | — | — | | | | ||||||||||||||||||
Current period gross charge-offs | | | | | | | | | | ||||||||||||||||||
Total Residential Lending | $ | | $ | | $ | | $ | | $ | | $ | | $ | | $ | | $ | | |||||||||
Current period gross charge-offs | $ | — | $ | — | $ | — | $ | — | $ | — | $ | | $ | | $ | | $ | | |||||||||
Consumer Lending | |||||||||||||||||||||||||||
FICO: | |||||||||||||||||||||||||||
740 and greater | | | | | | | | | | ||||||||||||||||||
680 - 739 | | | | | | | | | | ||||||||||||||||||
620 - 679 | | | | | | | | | | ||||||||||||||||||
550 - 619 | | | | | | | | | | ||||||||||||||||||
Less than 550 | | | | | | | | | | ||||||||||||||||||
No Score (3) | | | — | — | | | | | | ||||||||||||||||||
Other (2) | | | | | | | | — | | ||||||||||||||||||
Total Consumer Lending | $ | | $ | | $ | | $ | | $ | | $ | | $ | | $ | | $ | | |||||||||
Current period gross charge-offs | $ | | $ | | $ | | $ | | $ | | $ | | $ | | $ | | $ | | |||||||||
Total Loans and Leases | $ | | $ | | $ | | $ | | $ | | $ | | $ | | $ | | $ | | |||||||||
Current period gross charge-offs | $ | | $ | | $ | | $ | | $ | | $ | | $ | | $ | | $ | | |||||||||
| (1) | Other credit quality indicators used for monitoring purposes are primarily FICO scores. The majority of the loans in this population were originated to borrowers with a prime FICO score. |
| (2) | Other credit quality indicators used for monitoring purposes are primarily internal risk ratings. The majority of the loans in this population were graded with a “Pass” rating. |
| (3) | No FICO scores are primarily related to loans and leases extended to non-residents. Loans and leases of this nature are primarily secured by collateral and/or are closely monitored for performance. |
124
The amortized cost basis by year of origination and credit quality indicator of the Company's loans and leases as of December 31, 2022 was as follows:
Revolving | |||||||||||||||||||||||||||
Loans | |||||||||||||||||||||||||||
Converted | |||||||||||||||||||||||||||
Term Loans | Revolving | to Term | |||||||||||||||||||||||||
Amortized Cost Basis by Origination Year | Loans | Loans | |||||||||||||||||||||||||
Amortized | Amortized | ||||||||||||||||||||||||||
(dollars in thousands) | 2022 | 2021 | 2020 | 2019 | 2018 | Prior | Cost Basis | Cost Basis | Total | ||||||||||||||||||
Commercial Lending | |||||||||||||||||||||||||||
Commercial and Industrial | |||||||||||||||||||||||||||
Risk rating: | |||||||||||||||||||||||||||
Pass | $ | | $ | | $ | | $ | | $ | | $ | | $ | | $ | | $ | | |||||||||
Special Mention | | | | | | | | | | ||||||||||||||||||
Substandard | | | | | | | | | | ||||||||||||||||||
Other (1) | | | | | | | | — | | ||||||||||||||||||
Total Commercial and Industrial | | | | | | | | | | ||||||||||||||||||
Commercial Real Estate | |||||||||||||||||||||||||||
Risk rating: | |||||||||||||||||||||||||||
Pass | | | | | | | | — | | ||||||||||||||||||
Special Mention | | — | | | | | | — | | ||||||||||||||||||
Substandard | — | — | | — | | | — | — | | ||||||||||||||||||
Other (1) | — | — | — | — | — | | — | — | | ||||||||||||||||||
Total Commercial Real Estate | | | | | | | | — | | ||||||||||||||||||
Construction | |||||||||||||||||||||||||||
Risk rating: | |||||||||||||||||||||||||||
Pass | | | | | | | | — | | ||||||||||||||||||
Special Mention | — | — | — | | — | — | — | — | | ||||||||||||||||||
Substandard | — | — | — | — | | | — | — | | ||||||||||||||||||
Other (1) | | | | | | | | — | | ||||||||||||||||||
Total Construction | | | | | | | | — | | ||||||||||||||||||
Lease Financing | |||||||||||||||||||||||||||
Risk rating: | |||||||||||||||||||||||||||
Pass | | | | | | | — | — | | ||||||||||||||||||
Special Mention | — | | | | — | — | — | — | | ||||||||||||||||||
Substandard | — | — | | | | | — | — | | ||||||||||||||||||
Total Lease Financing | | | | | | | — | — | | ||||||||||||||||||
Total Commercial Lending | $ | | $ | | $ | | $ | | $ | | $ | | $ | | $ | | $ | | |||||||||
(continued)
125
Revolving | |||||||||||||||||||||||||||
Loans | |||||||||||||||||||||||||||
Converted | |||||||||||||||||||||||||||
Term Loans | Revolving | to Term | |||||||||||||||||||||||||
Amortized Cost Basis by Origination Year | Loans | Loans | |||||||||||||||||||||||||
(continued) | Amortized | Amortized | |||||||||||||||||||||||||
(dollars in thousands) | 2022 | 2021 | 2020 | 2019 | 2018 | Prior | Cost Basis | Cost Basis | Total | ||||||||||||||||||
Residential Lending | |||||||||||||||||||||||||||
Residential Mortgage | |||||||||||||||||||||||||||
FICO: | |||||||||||||||||||||||||||
740 and greater | $ | | $ | | $ | | $ | | $ | | $ | | $ | — | $ | — | $ | | |||||||||
680 - 739 | | | | | | | — | — | | ||||||||||||||||||
620 - 679 | | | | | | | — | — | | ||||||||||||||||||
550 - 619 | | | | | | | — | — | | ||||||||||||||||||
Less than 550 | — | | | — | | | — | — | | ||||||||||||||||||
No Score (3) | | | | | | | — | — | | ||||||||||||||||||
Other (2) | | | | | | | | | | ||||||||||||||||||
Total Residential Mortgage | | | | | | | | | | ||||||||||||||||||
Home Equity Line | |||||||||||||||||||||||||||
FICO: | |||||||||||||||||||||||||||
740 and greater | — | — | — | — | — | — | | | | ||||||||||||||||||
680 - 739 | — | — | — | — | — | — | | | | ||||||||||||||||||
620 - 679 | — | — | — | — | — | — | | | | ||||||||||||||||||
550 - 619 | — | — | — | — | — | — | | | | ||||||||||||||||||
Less than 550 | — | — | — | — | — | — | | | | ||||||||||||||||||
No Score (3) | — | — | — | — | — | — | | — | | ||||||||||||||||||
Total Home Equity Line | — | — | — | — | — | — | | | | ||||||||||||||||||
Total Residential Lending | $ | | $ | | $ | | $ | | $ | | $ | | $ | | $ | | $ | | |||||||||
Consumer Lending | |||||||||||||||||||||||||||
FICO: | |||||||||||||||||||||||||||
740 and greater | | | | | | | | | | ||||||||||||||||||
680 - 739 | | | | | | | | | | ||||||||||||||||||
620 - 679 | | | | | | | | | | ||||||||||||||||||
550 - 619 | | | | | | | | | | ||||||||||||||||||
Less than 550 | | | | | | | | | | ||||||||||||||||||
No Score (3) | | | — | | | | | | | ||||||||||||||||||
Other (2) | | | | | — | — | | | | ||||||||||||||||||
Total Consumer Lending | $ | | $ | | $ | | $ | | $ | | $ | | $ | | $ | | $ | | |||||||||
Total Loans and Leases | $ | | $ | | $ | | $ | | $ | | $ | | $ | | $ | | $ | | |||||||||
| (1) | Other credit quality indicators used for monitoring purposes are primarily FICO scores. The majority of the loans in this population were originated to borrowers with a prime FICO score. |
| (2) | Other credit quality indicators used for monitoring purposes are primarily internal risk ratings. The majority of the loans in this population were graded with a “Pass” rating. |
| (3) | No FICO scores are primarily related to loans and leases extended to non-residents. Loans and leases of this nature are primarily secured by collateral and/or are closely monitored for performance. |
There were
126
Past-Due Status
The Company continually updates its aging analysis for loans and leases to monitor the migration of loans and leases into past due categories. The Company considers loans and leases that are delinquent for 30 days or more to be past due. As of December 31, 2023 and 2022, the aging analysis of the amortized cost basis of the Company’s past due loans and leases was as follows:
December 31, 2023 | |||||||||||||||||||||
Past Due | Loans and | ||||||||||||||||||||
Greater | Leases Past | ||||||||||||||||||||
Than or | Due 90 Days | ||||||||||||||||||||
30-59 | 60-89 | Equal to | or More and | ||||||||||||||||||
Days | Days | 90 Days | Total | Total Loans | Still Accruing | ||||||||||||||||
(dollars in thousands) |
| Past Due |
| Past Due |
| Past Due |
| Past Due |
| Current |
| and Leases | Interest | ||||||||
Commercial and industrial | $ | | $ | | $ | | $ | | $ | | $ | | $ | | |||||||
Commercial real estate | — | | | | | | | ||||||||||||||
Construction | | — | — | | | | — | ||||||||||||||
Lease financing | — | — | — | — | | | — | ||||||||||||||
Residential mortgage | | | | | | | — | ||||||||||||||
Home equity line | | | | | | | — | ||||||||||||||
Consumer | | | | | | | | ||||||||||||||
Total | $ | | $ | | $ | | $ | | $ | | $ | | $ | | |||||||
December 31, 2022 | |||||||||||||||||||||
Past Due | Loans and | ||||||||||||||||||||
Greater | Leases Past | ||||||||||||||||||||
Than or | Due 90 Days | ||||||||||||||||||||
30-59 | 60-89 | Equal to | or More and | ||||||||||||||||||
Days | Days | 90 Days | Total | Total Loans | Still Accruing | ||||||||||||||||
(dollars in thousands) |
| Past Due |
| Past Due |
| Past Due |
| Past Due |
| Current |
| and Leases | Interest | ||||||||
Commercial and industrial | $ | | $ | | $ | | $ | | $ | | $ | | $ | | |||||||
Commercial real estate | | — | | | | | — | ||||||||||||||
Construction | | — | — | | | | — | ||||||||||||||
Lease financing | — | — | — | — | | | — | ||||||||||||||
Residential mortgage | | | | | | | | ||||||||||||||
Home equity line | | | | | | | — | ||||||||||||||
Consumer | | | | | | | | ||||||||||||||
Total | $ | | $ | | $ | | $ | | $ | | $ | | $ | | |||||||
Nonaccrual Loans and Leases
The Company generally places a loan or lease on nonaccrual status when management believes that collection of principal or interest has become doubtful or when a loan or lease becomes 90 days past due as to principal or interest, unless it is well secured and in the process of collection. The Company charges off a loan or lease when facts indicate that the loan or lease is considered uncollectible.
The amortized cost basis of loans and leases on nonaccrual status as of December 31, 2023 and 2022 and the amortized cost basis of loans and leases on nonaccrual status with no allowance for credit losses as of December 31, 2023 and 2022 were as follows:
December 31, 2023 | ||||||
Nonaccrual | ||||||
Loans | ||||||
and Leases | ||||||
With No | Nonaccrual | |||||
Allowance | Loans | |||||
(dollars in thousands) |
| for Credit Losses | and Leases | |||
Commercial and industrial | $ | — | $ | | ||
Commercial real estate | | | ||||
Residential mortgage | | | ||||
Home equity line | | | ||||
Total Nonaccrual Loans and Leases | $ | | $ | | ||
127
December 31, 2022 | ||||||
Nonaccrual | ||||||
Loans | ||||||
and Leases | ||||||
With No | Nonaccrual | |||||
Allowance | Loans | |||||
(dollars in thousands) |
| for Credit Losses | and Leases | |||
Commercial and industrial | $ | | $ | | ||
Commercial real estate | | | ||||
Residential mortgage | | | ||||
Home equity line | | | ||||
Total Nonaccrual Loans and Leases | $ | | $ | | ||
During the years ended December 31, 2023, 2022 and 2021, the Company recognized interest income of $
Collateral-Dependent Loans and Leases
Collateral-dependent loans and leases are those for which repayment (on the basis of the Company’s assessment as of the reporting date) is expected to be provided substantially through the operation or sale of the collateral and the borrower is experiencing financial difficulty. As of December 31, 2023 and 2022, the amortized cost basis of collateral-dependent loans was $
Loan Modifications to Borrowers Experiencing Financial Difficulty
The Company adopted the provisions of Accounting Standards Update (“ASU”) No. 2022-02, Financial Instruments – Credit Losses (Topic 326), Troubled Debt Restructurings and Vintage Disclosures, on January 1, 2023. This update eliminates the accounting guidance on troubled debt restructurings (“TDRs”) for creditors in Subtopic 310-40, updates the requirements related to accounting for credit losses under Topic 326 and adds enhanced disclosures for creditors with respect to loan refinancings and restructurings for borrowers experiencing financial difficulty. For additional information, see “Note 1. Organization and Summary of Significant Accounting Policies.”
Commercial and industrial loans with a borrower experiencing financial difficulty may be modified through interest rate reductions, term extensions, and converting revolving credit lines to term loans. Modifications of commercial real estate and construction loans with a borrower experiencing financial difficulty may involve reducing the interest rate for the remaining term of the loan or extending the maturity date at an interest rate lower than the current market rate for new debt with similar risk. Modifications of construction loans with a borrower experiencing financial difficulty may also involve extending the interest-only payment period. Interest continues to accrue on the missed payments and as a result, the effective yield on the loan remains unchanged. Modifications of residential real estate loans with a borrower experiencing financial difficulty may be comprised of loans where monthly payments are lowered to accommodate the borrowers’ financial needs for a period of time, including extended interest-only periods and reamortization of the balance. Modifications of consumer loans with a borrower experiencing financial difficulty may involve interest rate reductions and term extensions.
128
Loans modified with a borrower experiencing financial difficulty, whether in default or not, may already be on nonaccrual status and in some cases, partial charge-offs may have already been taken against the outstanding loan balance. Loans modified with a borrower experiencing financial difficulty are evaluated for impairment. As a result, this may have a financial effect of impacting the specific ACL associated with the loan. An ACL for impaired commercial loans, including commercial real estate and construction loans, is measured based on the present value of expected future cash flows discounted at the loan's effective interest rate or if the loan is collateral-dependent, the estimated fair value of the collateral, less any selling costs. An ACL for impaired residential real estate loans is measured based on the estimated fair value of the collateral, less any selling costs. Management exercises significant judgment in developing these estimates.
The following tables present, by class of financing receivable and type of modification granted, the amortized cost basis as of December 31, 2023, related to loans modified to borrowers experiencing financial difficulty during the year ended December 31, 2023:
Interest Rate Reduction | ||||||
Year Ended | ||||||
December 31, 2023 | ||||||
Amortized | % of Total Class | |||||
(dollars in thousands) |
|
| Cost Basis(1) | of Financing Receivable | ||
Commercial real estate | $ | | n/m | % | ||
Consumer | | | ||||
Total | $ | | | % | ||
n/m – Represents less than 0.01% of total class of financing receivable.
(1) | The amortized cost basis reflects all partial paydowns and charge-offs since the modification date and do not include loans modified to borrowers experiencing financial difficulty that have been fully paid off, charged off, or foreclosed upon by the end of the year. |
Term Extension | ||||||
Year Ended | ||||||
December 31, 2023 | ||||||
Amortized | % of Total Class | |||||
(dollars in thousands) |
|
| Cost Basis(1) | of Financing Receivable | ||
Commercial and industrial | $ | | | % | ||
Commercial real estate | | | ||||
Construction | | | ||||
Residential mortgage | | | ||||
Consumer | | | ||||
Total | $ | | | % | ||
n/m – Represents less than 0.01% of total class of financing receivable.
(1) | The amortized cost basis reflects all partial paydowns and charge-offs since the modification date and do not include loans modified to borrowers experiencing financial difficulty that have been fully paid off, charged off, or foreclosed upon by the end of the year. |
The following tables describe, by class of financing receivable and type of modification granted, the financial effect of the modifications made to borrowers experiencing financial difficulty during the year ended December 31, 2023:
Interest Rate Reduction | ||
Financial Effect | ||
Year Ended December 31, 2023 | ||
Commercial real estate | Reduced weighted-average contractual interest rate by | |
Consumer | Reduced weighted-average contractual interest rate by |
Term Extension | ||
Financial Effect | ||
Year Ended December 31, 2023 | ||
Commercial and industrial | Added a weighted-average | |
Commercial real estate | Added a weighted-average | |
Construction | Added a weighted-average | |
Residential mortgage | Added a weighted-average | |
Consumer | Added a weighted-average |
129
The following table presents, by class of financing receivable and type of modification granted, the amortized cost basis, as of December 31, 2023, of loans that had a payment default during the year ended December 31, 2023 and were modified in the 12 months before default to borrowers experiencing financial difficulty. The Company is reporting these defaulted loans based on a payment default definition of 30 days past due:
Amortized Cost Basis of Modified Loans That Subsequently Defaulted(1) | ||||||
Year Ended December 31, 2023 | ||||||
(dollars in thousands) | Interest Rate Reduction | Term Extension | ||||
Consumer | $ | | $ | | ||
Total | $ | | $ | | ||
| (1) | The amortized cost basis reflects all partial paydowns and charge-offs since the modification date and do not include loans modified to borrowers experiencing financial difficulty that have been fully paid off, charged off, or foreclosed upon by the end of the year. |
Performance of the loans that are modified to borrowers experiencing financial difficulty is monitored to understand the effectiveness of the Company’s modification efforts. As of December 31, 2023, the aging analysis of the amortized cost basis of the performance of loans that have been modified in the last 12 months related to borrowers experiencing financial difficulty was as follows:
December 31, 2023 | ||||||||||||||||||
Past Due | ||||||||||||||||||
Greater Than | ||||||||||||||||||
or Equal to | ||||||||||||||||||
30-59 Days | 60-89 Days | 90 Days | Total | |||||||||||||||
(dollars in thousands) |
| Past Due |
| Past Due |
| Past Due |
| Past Due |
| Current |
| Total | ||||||
Commercial and industrial | $ | — | $ | — | $ | — | $ | — | $ | | $ | | ||||||
Commercial real estate | — | — | — | — | | | ||||||||||||
Construction | — | — | — | — | | | ||||||||||||
Residential mortgage | — | — | — | — | | | ||||||||||||
Consumer | | | | | | | ||||||||||||
Total | $ | | $ | | $ | | $ | | $ | | $ | | ||||||
The Company had commitments to extend credit, standby letters of credit, and commercial letters of credit totaling $
Troubled Debt Restructuring Disclosures Prior to Adoption of ASU No. 2022-02
Prior to the adoption of ASU No. 2022-02, the Company accounted for a modification to the contractual terms of a loan that resulted in granting a concession to a borrower experiencing financial difficulty as a TDR. On January 1, 2023, the Company adopted ASU No. 2022-02, which eliminated TDR accounting prospectively for all restructurings occurring on or after January 1, 2023. Loans that were restructured in a TDR prior to the adoption of ASU No. 2022-02 will continue to be accounted for under the historical TDR accounting until the loan is paid off or subsequently modified. The disclosures below related to TDRs for prior periods are presented in accordance with Subtopic 310-40, Receivables—Troubled Debt Restructurings by Creditors.
Commercial and industrial loans modified in a TDR may have involved temporary interest-only payments, term extensions, and converting revolving credit lines to term loans. Modifications of commercial real estate and construction loans in a TDR may have involved reducing the interest rate for the remaining term of the loan, extending the maturity date at an interest rate lower than the current market rate for new debt with similar risk, or substituting or adding a new borrower or guarantor. Modifications of construction loans in a TDR may have also involved extending the interest-only payment period. Interest continued to accrue on the missed payments and as a result, the effective yield on the loan remained unchanged. Residential real estate loans modified in a TDR may have been comprised of loans where monthly payments were lowered to accommodate the borrowers’ financial needs for a period of time, including extended interest-only periods and reamortization of the balance. Modifications of consumer loans in a TDR may have involved temporary or permanent reduced payments, temporary interest-only payments and below-market interest rates.
130
Loans modified in a TDR may have already been on nonaccrual status and in some cases, partial charge-offs may have already been taken against the outstanding loan balance. Loans modified in a TDR were evaluated for impairment. As a result, this may have had a financial effect of impacting the specific ACL associated with the loan. An ACL for impaired commercial loans, including commercial real estate and construction loans, that had been modified in a TDR was measured based on the present value of expected future cash flows discounted at the loan’s effective interest rate or if the loan was collateral-dependent, the estimated fair value of the collateral, less any selling costs. An ACL for impaired residential real estate loans that had been modified in a TDR was measured based on the estimated fair value of the collateral, less any selling costs. Management exercised significant judgment in developing these estimates.
The following presents, by class, information related to loans modified in a TDR during the years ended December 31, 2022 and 2021, presented in accordance with Subtopic 310-40, Receivables—Troubled Debt Restructurings by Creditors:
Year Ended December 31, 2022 | ||||||||
Number of | Recorded | Related | ||||||
(dollars in thousands) |
| Contracts(1) |
| Investment(2) |
| ACL | ||
Commercial and industrial | | $ | | $ | | |||
Residential mortgage | | | | |||||
Consumer | | | | |||||
Total | | $ | | $ | | |||
Year Ended December 31, 2021 | ||||||||
Number of | Recorded | Related | ||||||
(dollars in thousands) |
| Contracts(1) |
| Investment(2) |
| ACL | ||
Commercial and industrial | | $ | | $ | | |||
Commercial real estate | | | | |||||
Construction | | | | |||||
Residential mortgage | | | | |||||
Consumer | | | | |||||
Total | | $ | | $ | | |||
| (1) | The number of contracts does not include TDRs that have been fully paid off, charged off or foreclosed upon by the end of the year. |
| (2) | The recorded investment balances reflect all partial paydowns and charge-offs since the modification date and do not include TDRs that have been fully paid off, charged off or foreclosed upon by the end of the year. |
The above loans were modified in a TDR through an extension of maturity dates, reduced payments, or below-market interest rates.
The Company had commitments to extend credit, standby letters of credit and commercial letters of credit totaling $
131
The following table presents, by class, loans modified in TDRs that have defaulted during the years ended December 31, 2022 and 2021 within 12 months of their permanent modification date for the years indicated, presented in accordance with Subtopic 310-40, Receivables—Troubled Debt Restructurings by Creditors. The Company was reporting these defaulted TDRs based on a payment default definition of 30 days past due:
Year Ended December 31, | ||||||||||
2022 |
| 2021 | ||||||||
Number of | Recorded | Number of | Recorded | |||||||
(dollars in thousands) |
| Contracts(1) |
| Investment(2) |
| Contracts(1) |
| Investment(2) | ||
Commercial and industrial | | $ | | | $ | | ||||
Construction | — | — | | | ||||||
Commercial real estate | — | — | | | ||||||
Residential mortgage | — | — | | | ||||||
Consumer | | | | | ||||||
Total | | $ | | | $ | | ||||
| (1) | The number of contracts does not include TDRs that have been fully paid off, charged off or foreclosed upon by the end of the year. |
| (2) | The recorded investment balances reflect all partial paydowns and charge-offs since the modification date and do not include TDRs that have been fully paid off, charged off or foreclosed upon by the end of the year. |
Foreclosed Property
There were
6. Premises and Equipment
At December 31, 2023 and 2022, premises and equipment were comprised of the following:
December 31, | ||||||
(dollars in thousands) |
| 2023 |
| 2022 | ||
Buildings | $ | | $ | | ||
Furniture and equipment | | | ||||
Land | | | ||||
Leasehold improvements | | | ||||
Total premises and equipment | | | ||||
Less: Accumulated depreciation and amortization | | | ||||
Net book value | $ | | $ | | ||
Depreciation and amortization expenses included in occupancy and equipment expenses for 2023, 2022 and 2021 were as follows:
Year Ended December 31, | |||||||||
(dollars in thousands) |
| 2023 |
| 2022 |
| 2021 | |||
Occupancy | $ | | $ | | $ | | |||
Equipment | | | | ||||||
Total | $ | | $ | | $ | | |||
7. Other Assets
Goodwill
Goodwill originated from the acquisition of BancWest by BNPP in December 2001. Goodwill generated in that acquisition was recorded on the Company’s consolidated balance sheets as a result of push-down accounting treatment.
132
The carrying amount of goodwill reported in
Retail | Commercial | ||||||||
(in thousands) |
| Banking |
| Banking |
| Total | |||
December 31, 2023 | $ | | $ | | $ | | |||
December 31, 2022 | | | | ||||||
There was
Mortgage Servicing Rights (“MSRs”)
Mortgage servicing activities include collecting principal, interest, tax and insurance payments from borrowers while accounting for and remitting payments to investors, taxing authorities and insurance companies. The Company also monitors delinquencies and administers foreclosure proceedings.
Mortgage loan servicing income is recorded in noninterest income as a part of other service charges and fees and amortization of the servicing assets is recorded in noninterest income as part of other income. The unpaid principal amount of residential real estate loans serviced for others was $
Amortization of MSRs was $
Estimated | |||
(dollars in thousands) |
| Amortization | |
Year ending December 31: | |||
2024 | $ | | |
2025 | | ||
2026 | | ||
2027 | | ||
2028 | | ||
The details of the Company’s MSRs are presented below:
December 31, | December 31, | |||||
(dollars in thousands) |
| 2023 |
| 2022 | ||
Gross carrying amount | $ | | $ | | ||
Less: accumulated amortization | | | ||||
Net carrying value | $ | | $ | | ||
The following table presents changes in amortized MSRs for the years indicated:
Year Ended December 31, | ||||||
(dollars in thousands) |
| 2023 |
| 2022 | ||
Balance at beginning of year | $ | | $ | | ||
Originations | | | ||||
Amortization | ( | ( | ||||
Balance at end of year | $ | | $ | | ||
Fair value of amortized MSRs at beginning of year | $ | | $ | | ||
Fair value of amortized MSRs at end of year | $ | | $ | | ||
Balance of loans serviced for others | $ | | $ | | ||
MSRs are evaluated for impairment if events and circumstances indicate a possible impairment.
133
The quantitative assumptions used in determining the lower of cost or fair value of the Company’s MSRs were as follows:
December 31, 2023 | December 31, 2022 | ||||||||||||||
Weighted | Weighted | ||||||||||||||
| Range | Average | Range | Average | |||||||||||
Conditional prepayment rate | | % | - | | % | | % | | % | - | | % | | % | |
Life in years (of the MSR) | - | - | |||||||||||||
Weighted-average coupon rate | | % | - | | % | | % | | % | - | | % | | % | |
Discount rate | | % | - | | % | | % | | % | - | | % | | % | |
The sensitivities surrounding MSRs are expected to have an immaterial impact on fair value.
Other
The Company had $
Nonmarketable equity securities include FHLB stock, which the Company holds to meet regulatory requirements. As a member of the FHLB system, the Company is required to maintain a minimum level of investment in FHLB non-publicly traded stock based on specific percentages of the Company’s total assets and outstanding advances in accordance with the FHLB’s capital plan which may be amended or revised periodically. Amounts in excess of the required minimum may be transferred at par to another member institution subject to prior approval of the FHLB. Excess stock may also be sold to the FHLB subject to a
Capitalized internal-use software was included as a component of other assets on the consolidated balance sheets. As of December 31, 2023, total capitalized internal-use software was $
Capitalized implementation costs associated with hosting arrangements that are service contracts were included as a component of other assets on the consolidated balance sheets. As of December 31, 2023, total capitalized implementation costs amounted to $
8. Transfers of Financial Assets
The Company’s transfers of financial assets with continuing interest may include pledges of collateral to secure public deposits and repurchase agreements, FHLB and FRB borrowing capacity, automated clearing house (“ACH”) transactions and interest rate swaps.
134
For public deposits and repurchase agreements, the Company enters into bilateral agreements with the entity to pledge investment securities as collateral in the event of default. The right of setoff for a repurchase agreement resembles a secured borrowing, whereby the collateral pledged by the Company would be used to settle the fair value of the repurchase agreement should the Company be in default. The counterparty has the right to sell or repledge the investment securities. The Company is required by the counterparty to maintain adequate collateral levels. In the event the collateral fair value falls below stipulated levels, the Company will pledge additional investment securities. For transfers of assets with the FHLB and the FRB, the Company enters into bilateral agreements to pledge loans and/or securities as collateral to secure borrowing capacity. For ACH transactions, the Company enters into bilateral agreements to collateralize possible daylight overdrafts. For interest rate swaps, the Company enters into bilateral agreements to pledge collateral when either party is in a negative fair value position to mitigate counterparty credit risk. Counterparties to ACH transactions, certain interest rate swaps, the FHLB and the FRB do not have the right to sell or repledge the collateral.
The carrying amounts of the assets pledged as collateral to secure public deposits, borrowing arrangements and other transactions as of December 31, 2023 and 2022 were as follows:
December 31, | ||||||
(dollars in thousands) |
| 2023 |
| 2022 | ||
Public deposits | $ | | $ | | ||
Federal Home Loan Bank | | | ||||
Federal Reserve Bank | | | ||||
ACH transactions | | | ||||
Interest rate swaps | | | ||||
Total | $ | | $ | | ||
As the Company did not enter into reverse repurchase agreements or repurchase agreements,
9. Deposits
As of December 31, 2023 and 2022, deposits were categorized as interest-bearing or noninterest-bearing as follows:
December 31, | ||||||
(dollars in thousands) |
| 2023 |
| 2022 | ||
U.S.: | ||||||
Interest-bearing | $ | | $ | | ||
Noninterest-bearing | | | ||||
Foreign: | ||||||
Interest-bearing | | | ||||
Noninterest-bearing | | | ||||
Total deposits | $ | | $ | | ||
The following table presents the maturity distribution of time certificates of deposit as of December 31, 2023:
Under | $250,000 | ||||||||
(dollars in thousands) |
| $250,000 |
| or More |
| Total | |||
Three months or less | $ | | | $ | | ||||
Over three through six months | | | | ||||||
Over six through twelve months | | | | ||||||
2025 | | | | ||||||
2026 | | | | ||||||
2027 | | | | ||||||
2028 | | | | ||||||
Thereafter | | — | | ||||||
Total | $ | | $ | | $ | | |||
135
Time certificates of deposit in denominations of $250,000 or more, in the aggregate, were $
10. Short-Term Borrowings
As of December 31, 2023 and 2022, short-term borrowings were comprised of the following:
December 31, | ||||||
(dollars in thousands) |
| 2023 |
| 2022 | ||
Federal funds purchased | $ | — | $ | | ||
Short-term FHLB fixed-rate advances(1) | | — | ||||
Total short-term borrowings | $ | | $ | | ||
| (1) | Interest is payable monthly. |
As of December 31, 2023, the Company’s short-term borrowings consisted of $
As of December 31, 2022, the Company’s short-term borrowings consisted of $
As of both December 31, 2023 and 2022, the Company had a remaining line of credit of $
136
The table below provides selected information for short-term borrowings during the years ended December 31, 2023, 2022 and 2021:
Year Ended December 31, | ||||||||||
(dollars in thousands) |
| 2023 | 2022 | 2021 | ||||||
Federal funds purchased: | ||||||||||
Weighted-average interest rate at December 31, | — | % | | % | — | % | ||||
Highest month-end balance | $ | | $ | | $ | — | ||||
Average outstanding balance | $ | | $ | | $ | — | ||||
Weighted-average interest rate paid | | % | | % | — | % | ||||
Short-term FHLB repo advance: | ||||||||||
Weighted-average interest rate at December 31, | — | % | — | % | — | % | ||||
Highest month-end balance | $ | | $ | — | $ | — | ||||
Average outstanding balance | $ | | $ | — | $ | — | ||||
Weighted-average interest rate paid | | % | — | % | — | % | ||||
Short-term FHLB fixed-rate advances: | ||||||||||
Weighted-average interest rate at December 31, | | % | — | % | — | % | ||||
Highest month-end balance | $ | | $ | — | $ | — | ||||
Average outstanding balance | $ | | $ | — | $ | — | ||||
Weighted-average interest rate paid | | % | — | % | — | % | ||||
The Company treats securities sold under agreements to repurchase as collateralized financings. The Company reflects the obligations to repurchase the same or similar securities sold as liabilities, with the dollar amount of securities underlying the agreements remaining in the asset accounts. Generally, for these types of agreements, there is a requirement that collateral be maintained with a market value equal to or in excess of the principal amount borrowed. As such, the collateral pledged may be increased or decreased over time to meet contractual obligations. The securities underlying the agreements to repurchase are held in collateral accounts with a third-party custodian. The Company did not enter into any repurchase agreements in 2023 and 2022.
137
11. Accumulated Other Comprehensive Income (Loss)
Accumulated other comprehensive income (loss) is defined as the revenues, expenses, gains and losses that are included in comprehensive income, but excluded from net income. The Company’s significant items of accumulated other comprehensive income (loss) are pension and other benefits, net unrealized gains or losses on investment securities and net unrealized gains or losses on cash flow derivative hedges. Changes in accumulated other comprehensive income (loss) for the years ended December 31, 2023, 2022 and 2021 are presented below:
Income | |||||||||
Tax | |||||||||
Pre-tax | Benefit | Net of | |||||||
(dollars in thousands) |
| Amount |
| (Expense) |
| Tax | |||
Accumulated other comprehensive loss at December 31, 2022 | $ | ( | $ | | $ | ( | |||
Year ended December 31, 2023 | |||||||||
Pension and other benefits: | |||||||||
Net actuarial losses arising during the year | ( | | ( | ||||||
Amortization of net loss included in net income | | ( | | ||||||
Net change in pension and other benefits | | ( | | ||||||
Investment securities: | |||||||||
Unrealized net gains arising during the year | | ( | | ||||||
Reclassification of net losses to net income: | |||||||||
Amortization of unrealized holding losses on held-to-maturity securities | | ( | | ||||||
Investment securities losses, net | | ( | | ||||||
Net change in investment securities | | ( | | ||||||
Cash flow derivative hedges: | |||||||||
Unrealized net losses arising during the year | ( | | ( | ||||||
Reclassification of net losses included in net income | | ( | | ||||||
Net change in cash flow derivative hedges | | ( | | ||||||
Other comprehensive income | | ( | | ||||||
Accumulated other comprehensive loss at December 31, 2023 | $ | ( | $ | | $ | ( | |||
Income | |||||||||
Tax | |||||||||
Pre-tax | Benefit | Net of | |||||||
(dollars in thousands) |
| Amount |
| (Expense) |
| Tax | |||
Accumulated other comprehensive loss at December 31, 2021 | $ | ( | $ | | $ | ( | |||
Year ended December 31, 2022 | |||||||||
Pension and other benefits: | |||||||||
Net actuarial gains arising during the year | | ( | | ||||||
Amortization of net loss included in net income | | ( | | ||||||
Net change in pension and other benefits | | ( | | ||||||
Investment securities: | |||||||||
Unrealized net losses arising during the year | ( | | ( | ||||||
Reclassification of net losses to net income: | |||||||||
Amortization of unrealized holding losses on held-to-maturity securities | | ( | | ||||||
Net change in investment securities | ( | | ( | ||||||
Cash flow derivative hedges: | |||||||||
Unrealized net losses arising during the year | ( | | ( | ||||||
Reclassification of net losses included in net income | | ( | | ||||||
Net change in cash flow derivative hedges | ( | | ( | ||||||
Other comprehensive loss | ( | | ( | ||||||
Accumulated other comprehensive loss at December 31, 2022 | $ | ( | $ | | $ | ( | |||
138
Income | |||||||||
Tax | |||||||||
Pre-tax | Benefit | Net of | |||||||
(dollars in thousands) |
| Amount |
| (Expense) |
| Tax | |||
Accumulated other comprehensive income at December 31, 2020 | $ | | $ | ( | $ | | |||
Year ended December 31, 2021 | |||||||||
Pension and other benefits: | |||||||||
Net actuarial gains arising during the year | | ( | | ||||||
Amortization of net loss included in net income | | ( | | ||||||
Net change in pension and other benefits | | ( | | ||||||
Investment securities: | |||||||||
Unrealized net losses arising during the year | ( | | ( | ||||||
Reclassification of net gains to net income: | |||||||||
Investment securities gains, net | ( | | ( | ||||||
Net change in investment securities | ( | | ( | ||||||
Other comprehensive loss | ( | | ( | ||||||
Accumulated other comprehensive loss at December 31, 2021 | $ | ( | $ | | $ | ( | |||
The following table summarizes changes in accumulated other comprehensive income (loss), net of tax, for the years indicated:
Pensions | Accumulated | ||||||||||||||
and | Available-for-Sale | Held-to-Maturity | Cash Flow | Other | |||||||||||
Other | Investment | Investment | Derivative | Comprehensive | |||||||||||
(dollars in thousands) |
| Benefits |
| Securities |
| Securities |
| Hedges |
| Income (Loss) | |||||
Year Ended December 31, 2023 | |||||||||||||||
Balance at beginning of year | $ | ( | $ | ( | $ | ( | $ | ( | $ | ( | |||||
Other comprehensive income | | | | | | ||||||||||
Balance at end of year | $ | ( | $ | ( | $ | ( | $ | ( | $ | ( | |||||
Year Ended December 31, 2022 | |||||||||||||||
Balance at beginning of year | $ | ( | $ | ( | $ | — | $ | — | $ | ( | |||||
Unrealized net losses related to the transfer of securities from available-for-sale to held-to-maturity | — | | ( | — | — | ||||||||||
Other comprehensive income (loss) | | ( | | ( | ( | ||||||||||
Balance at end of year | $ | ( | $ | ( | $ | ( | $ | ( | $ | ( | |||||
Year Ended December 31, 2021 | |||||||||||||||
Balance at beginning of year | $ | ( | $ | | $ | — | $ | — | $ | | |||||
Other comprehensive income (loss) | | ( | — | — | ( | ||||||||||
Balance at end of year | $ | ( | $ | ( | $ | — | $ | — | $ | ( | |||||
As of December 31, 2023, 2022 and 2021, the Company did not have any available-for-sale debt securities in an unrealized loss position with the intent to sell and determined it was not more likely than not that the Company would be required to sell the securities prior to recovery of the amortized cost basis. Thus, for the years ended December 31, 2023, 2022 and 2021, there was
12. Regulatory Capital Requirements
Federal and state laws and regulations limit the amount of dividends the Company may declare or pay. The Company depends primarily on dividends from FHB as the source of funds for the Company’s payment of dividends.
139
The Company and the Bank are subject to various regulatory capital requirements imposed by federal banking agencies. Failure to meet minimum capital requirements can initiate certain mandatory, and possibly additional discretionary, actions by regulators that, if undertaken, could have a direct material effect on the Company’s and the Bank’s operating activities and financial condition. Under capital adequacy guidelines and the regulatory framework for prompt corrective action, the Company and Bank must meet specific capital guidelines that involve quantitative measures of its assets and certain off-balance-sheet items. The capital amounts and classifications are also subject to qualitative judgments by the regulators about components, risk weightings and other factors.
Quantitative measures established by regulation to ensure capital adequacy require the Company and Bank to maintain minimum amounts and ratios of Common Equity Tier 1 (“CET1”) capital, Tier 1 capital and total capital to risk-weighted assets, as well as a minimum leverage ratio.
The following provides definitions for the regulatory risk-based capital ratios and leverage ratio, which are calculated as per standard regulatory guidance:
Risk-Weighted Assets — Assets are weighted for risk according to a formula used by the Federal Reserve to conform to capital adequacy guidelines. On- and off-balance sheet items are weighted for risk, with off-balance sheet items converted to balance sheet equivalents, using risk conversion factors, before being allocated a risk-adjusted weight. The off-balance sheet items comprise a minimal part of the overall calculation.
Common Equity Tier 1 Risk-Based Capital Ratio — The CET1 risk-based capital ratio is calculated as CET1 capital, divided by risk-weighted assets. CET1 is the sum of equity, adjusted for ineligible goodwill as well as certain other comprehensive income items as follows: net unrealized gains/losses on securities and derivatives, and net unrealized pension and other benefit losses.
Tier 1 Risk-Based Capital Ratio — The Tier 1 capital ratio is calculated as Tier 1 capital divided by risk-weighted assets.
Total Risk-Based Capital Ratio — The total risk-based capital ratio is calculated as the sum of Tier 1 capital and an allowable amount of the allowance for credit losses (limited to
Tier 1 Leverage Ratio — The Tier 1 leverage ratio is calculated by dividing Tier 1 capital by adjusted quarterly average total assets.
The table below sets forth those ratios at December 31, 2023 and 2022:
First Hawaiian | Minimum | Well- | |||||||||||||
First Hawaiian, Inc. | Bank | Capital | Capitalized | ||||||||||||
(dollars in thousands) |
| Amount |
| Ratio | Amount |
| Ratio | Ratio(1) |
| Ratio(1) | |||||
December 31, 2023: | |||||||||||||||
Common equity tier 1 capital to risk-weighted assets | $ | | | % | $ | | | % | | % | | % | |||
Tier 1 capital to risk-weighted assets | | | % | | | % | | % | | % | |||||
Total capital to risk-weighted assets | | | % | | | % | | % | | % | |||||
Tier 1 capital to average assets (leverage ratio) | | | % | | | % | | % | | % | |||||
December 31, 2022: | |||||||||||||||
Common equity tier 1 capital to risk-weighted assets | $ | | | % | $ | | | % | | % | | % | |||
Tier 1 capital to risk-weighted assets | | | % | | | % | | % | | % | |||||
Total capital to risk-weighted assets | | | % | | | % | | % | | % | |||||
Tier 1 capital to average assets (leverage ratio) | | | % | | | % | | % | | % | |||||
| (1) | As defined by the regulations issued by the Board of Governors of the Federal Reserve System, the Office of the Comptroller of the Currency and the FDIC. |
140
A
The Federal Deposit Insurance Act of 1950’s prompt corrective action provisions apply only to depository institutions such as the Bank, and not to bank holding companies. Under the Federal Reserve’s regulations, a bank holding company, such as FHI, is considered “well-capitalized” if the bank holding company (i) has a total risk based capital ratio of at least 10%, (ii) has a Tier 1 risk-based capital ratio of at least 6%, and (iii) is not subject to any written agreement order, capital directive or prompt corrective action directive to meet and maintain a specific capital level for any capital measure. The Company meets all capital ratio requirements to be well-capitalized under the Federal Reserve’s regulations, and, although the prompt corrective action provisions apply only to depository institutions and not to bank holding companies, if the provisions applied to bank holding companies, the Company would meet all capital ratio requirements to be well-capitalized.
As of December 31, 2023, under the bank regulatory capital guidelines, the Company and Bank were both classified as well-capitalized and exceeded the aforementioned capital conservation buffer. Management is not aware of any conditions or events that have occurred since December 31, 2023, to change the capital adequacy category of the Company or the Bank.
13. Leases
The Company, as lessee, is obligated under a number of noncancelable operating leases primarily for branch premises and related real estate. Terms of such leases extend for periods up to
The Company’s branch premises leases typically require that the Company is responsible to pay for variable lease expense, primarily maintenance expense, as well as real property taxes, property insurance and sales taxes. Maintenance expense is paid to maintain common areas and covers costs including landscaping, cleaning and general maintenance. Such variable costs are typically re-evaluated by the landlord on an annual basis and are charged to the Company based on the portion of the total building premises that is occupied by the Company.
The Company subleases certain premises and real estate to third parties. The sublease portfolio consists of operating leases for space connected with
141
The components of the Company’s net lease expense for the years ended December 31, 2023, 2022 and 2021 were as follows:
Year Ended December 31, | |||||||||
(dollars in thousands) |
| 2023 |
| 2022 |
| 2021 | |||
Operating lease expense | $ | | $ | | $ | | |||
Short-term lease expense | | | | ||||||
Variable lease expense | | | | ||||||
Finance lease expense: | |||||||||
Amortization of right-of-use assets | — |
| |
| | ||||
Total finance lease expense |
| — | | | |||||
Less: Sublease income | ( | ( | ( | ||||||
Net lease expense | $ | | $ | | $ | | |||
Other information related to the Company’s lease liabilities as of and for the years ended December 31, 2023, 2022 and 2021 were as follows:
Year Ended December 31, | ||||||||||
(dollars in thousands) |
| 2023 | 2022 | 2021 | ||||||
Supplemental Cash Flows Information | ||||||||||
Cash paid for amounts included in the measurement of lease liabilities: | ||||||||||
Operating cash flows paid for operating leases | $ | | $ | | $ | | ||||
Financing cash flows paid for finance leases | $ | — | $ | — | $ | | ||||
Right-of-use assets obtained in exchange for new lease obligations: | ||||||||||
Operating leases | $ | | $ | | $ | | ||||
Weighted Average Remaining Lease Term | ||||||||||
Operating leases (years) | ||||||||||
Finance leases (years) | ||||||||||
Weighted Average Discount Rate | ||||||||||
Operating leases | | % | | % | | % | ||||
Finance leases | — | % | — | % | | % | ||||
Operating lease right-of-use assets were $
The most significant assumption related to the Company’s application of Topic 842 was the discount rate assumption. As most of the Company’s lease agreements do not provide for an implicit interest rate, the Company used the collateralized interest rate that the Company would have to pay to borrow over a similar term to estimate the Company’s lease liabilities.
The following table sets forth future minimum rental payments under noncancelable operating leases with terms in excess of one year as of December 31, 2023:
Net Operating | |||
Lease | |||
(dollars in thousands) |
| Payments | |
Year ending December 31: | |||
2024 | $ | | |
2025 | | ||
2026 | | ||
2027 | | ||
2028 | | ||
Thereafter | | ||
Total future minimum lease payments | | ||
Less: Imputed interest | ( | ||
Total | $ | | |
142
The Company did not have any operating leases with related parties. As such, there were
The Company, as lessor, rents office space in its headquarters office building as well as office space located primarily in Hawaii to third party lessees.
The Company recognized operating lease income related to lease payments of $
Certain of the Company’s leases were with related parties for the use of space at the Company’s headquarters office building. There was
The following table sets forth future minimum rental income under noncancelable operating leases with terms in excess of one year as of December 31, 2023:
Minimum | |||
Rental | |||
(dollars in thousands) |
| Income | |
Year ending December 31: | |||
2024 | $ | | |
2025 | | ||
2026 | | ||
2027 | | ||
2028 | | ||
Thereafter | | ||
Total | $ | | |
14. Benefit Plans
Qualified Pension Plan
The Company’s employees participate in the Employees’ Retirement Plan of First Hawaiian, Inc. (the “FHI ERP”). The FHI ERP is a frozen plan whereby there are
143
Nonqualified Pension and Other Postretirement Benefit Plans
The Company also sponsors an unfunded supplemental executive retirement plan for certain key executives (“SERP”). In addition, the Company sponsors a directors’ retirement plan (“Directors’ Plan”), a non-qualified pension plan for eligible FHI and FHB directors that qualify for retirement benefits based on their years of service as a director. Both the SERP and the Directors’ Plan were frozen as of January 1, 2005 to new participants. In March 2019, the Company’s board of directors approved an amendment to the SERP to freeze the SERP, which became effective on July 1, 2019. As a result of the amendment, since the effective date, there have not been any, and there will be
A postretirement benefit plan is also offered to eligible employees that provides healthcare benefits upon retirement. The Company provides access to medical coverage for eligible retirees under age 65 at active employee premium rates and a monthly stipend to both retiree and retiree’s spouse after age 62.
The Company expects to contribute $
Defined Contribution Plans
401(k) Savings Plan and Money Purchase Pension Plan
The Company matched employee contributions to the First Hawaiian, Inc. 401(k) Savings Plan, a qualified defined contribution plan, up to
The employer contributions to the above-mentioned plans for the years ended December 31, 2023, 2022 and 2021 were $
Annual Incentive Awards for Key Executives
The Company makes cash-based annual incentive awards under the First Hawaiian, Inc. Bonus Plan (the “Bonus Plan”). The Bonus Plan limits the aggregate and individual value of the awards that could be issued in any one fiscal year. The Bonus Plan expenses totaled $
144
The following table details the amounts recognized in other comprehensive (loss) income during the years presented. Pension benefits include benefits from the qualified and non-qualified plans. Other benefits include life insurance and healthcare benefits from the postretirement benefit plan.
Pension Benefits | Other Benefits | ||||||||||||||||||
(dollars in thousands) |
| 2023 |
| 2022 |
| 2021 |
| 2023 |
| 2022 |
| 2021 |
| ||||||
Amounts arising during the year: | |||||||||||||||||||
Net (gain) loss on pension assets | $ | ( | $ | | $ | | $ | — | $ | — | $ | — | |||||||
Net loss (gain) on pension obligations | | ( | ( | ( | ( | ( | |||||||||||||
Reclassification adjustments recognized as components of net periodic benefit cost during the year: | |||||||||||||||||||
Net (gain) loss | ( | ( | ( | | | | |||||||||||||
Prior service credit | — | — | — | — | — | — | |||||||||||||
Amount recognized in other comprehensive (loss) income | $ | ( | $ | ( | $ | ( | $ | | $ | ( | $ | ( | |||||||
The following table shows the amounts within accumulated other comprehensive loss that had not yet been recognized as components of net periodic benefit cost as of December 31, 2023 and 2022:
Pension Benefits | Other Benefits | |||||||||||
(dollars in thousands) |
| 2023 |
| 2022 |
| 2023 |
| 2022 | ||||
Net actuarial loss (gain) | $ | | $ | | $ | ( | $ | ( | ||||
Prior service credit | — | — | — | — | ||||||||
Total, pretax effect | | | ( | ( | ||||||||
Tax impact | ( | ( | | | ||||||||
Ending balance in accumulated other comprehensive loss | $ | | $ | | $ | ( | $ | ( | ||||
The following tables summarize the changes to the projected benefit obligation (“PBO”) and fair value of plan assets for pension benefits and the accumulated postretirement benefit obligation (“APBO”) and fair value of plan assets for other benefits:
Pension Benefits | Other Benefits | |||||||||||
(dollars in thousands) |
| 2023 |
| 2022 |
| 2023 |
| 2022 | ||||
Benefit obligation at beginning of year | $ | | $ | | $ | | $ | | ||||
Service cost | — | — | | | ||||||||
Interest cost | | | | | ||||||||
Actuarial gain | | ( | ( | ( | ||||||||
Benefit payments | ( | ( | ( | ( | ||||||||
Benefit obligation at end of year | $ | | $ | | $ | | $ | | ||||
The actuarial gains related to changes in the Company’s PBO for pension benefits and APBO for other benefits are primarily due to changes in discount rates for both years ended December 31, 2023 and 2022.
Pension Benefits | Other Benefits | |||||||||||
(dollars in thousands) |
| 2023 |
| 2022 |
| 2023 |
| 2022 | ||||
Fair value of plan assets at beginning of year | $ | | $ | | $ | — | $ | — | ||||
Actual return on plan assets | | ( | — | — | ||||||||
Benefit payments from trust | ( | ( | — | — | ||||||||
Fair value of plan assets at end of year | $ | | $ | | $ | — | $ | — | ||||
145
The following table summarizes the funded status of the Company’s plans and amounts recognized in the Company’s consolidated balance sheets as of December 31, 2023 and 2022:
Pension Benefits | Other Benefits | |||||||||||
(dollars in thousands) |
| 2023 |
| 2022 |
| 2023 |
| 2022 | ||||
Pension assets for overfunded plans | $ | | $ | | $ | — | $ | — | ||||
Pension liabilities for underfunded plans | ( | ( | ( | ( | ||||||||
Funded status | $ | ( | $ | ( | $ | ( | $ | ( | ||||
The following table provides information regarding the PBO, accumulated benefit obligation (“ABO”), and fair value of plan assets as of December 31, 2023 and 2022:
Funded Pension Plan | Unfunded Pension Plans | Total Pension Plans | ||||||||||||||||
(dollars in thousands) |
| 2023 |
| 2022 |
| 2023 |
| 2022 |
| 2023 |
| 2022 | ||||||
Projected benefit obligation | $ | | $ | | $ | | $ | | $ | | $ | | ||||||
Accumulated benefit obligation | | | | | | | ||||||||||||
Fair value of plan assets | | | — | — | | | ||||||||||||
Overfunded (underfunded) portion of PBO/ABO | | | ( | ( | ( | ( | ||||||||||||
The Company recognizes the overfunded and underfunded status of its pension plans as an asset and liability in the consolidated balance sheets.
Unrecognized net gains or losses that exceed
The following table summarizes the change in net actuarial loss (gain) and amortization for the years ended December 31, 2023 and 2022:
Pension Benefits | Other Benefits | |||||||||||
(dollars in thousands) |
| 2023 |
| 2022 |
| 2023 |
| 2022 | ||||
Net actuarial loss (gain) at beginning of year | $ | | $ | | $ | ( | $ | ( | ||||
Amortization cost | ( | ( | | | ||||||||
Liability loss (gain) | | ( | ( | ( | ||||||||
Asset (gain) loss | ( | | — | — | ||||||||
Net actuarial loss (gain) at end of year | $ | | $ | | $ | ( | $ | ( | ||||
The following table sets forth the components of net periodic benefit cost for the years ended December 31, 2023, 2022 and 2021:
Income line item where recognized in | Pension Benefits | Other Benefits | |||||||||||||||||||
(dollars in thousands) | the consolidated statements of income |
| 2023 |
| 2022 |
| 2021 |
| 2023 |
| 2022 |
| 2021 |
| |||||||
Service cost | Salaries and employee benefits | $ | — | $ | — | $ | — | $ | | $ | | $ | | ||||||||
Interest cost | | | | | | | |||||||||||||||
Expected return on plan assets | ( | ( | ( | — | — | — | |||||||||||||||
Prior service credit | — | — | — | — | — | — | |||||||||||||||
Recognized net actuarial loss (gain) | | | | ( | ( | ( | |||||||||||||||
Total net periodic benefit cost | $ | | $ | | $ | | $ | ( | $ | | $ | | |||||||||
146
The funded pension benefit amounts included in pension benefits for the years ended December 31, 2023, 2022 and 2021 were as follows:
Funded Pension Benefits | |||||||||
(dollars in thousands) |
| 2023 |
| 2022 |
| 2021 | |||
Interest cost | $ | | $ | | $ | | |||
Expected return on plan assets | ( | ( | ( | ||||||
Recognized net actuarial loss | | | | ||||||
$ | | $ | | $ | | ||||
Assumptions
The following weighted-average assumptions were used to determine benefit obligations at December 31, 2023 and 2022:
FHI ERP Pension Benefits | SERP Pension Benefits | Other Benefits | |||||||||||
| 2023 | 2022 | 2023 | 2022 | 2023 | 2022 | |||||||
Discount rate | | % | | % | | % | | % | | % | | % | |
Rate of compensation increase | NA | NA | NA | NA | NA | NA | |||||||
Weighted-average assumptions used to determine net periodic benefit cost for the years ended December 31, 2023, 2022 and 2021 were as follows:
FHI ERP Pension Benefits | SERP Pension Benefits | Other Benefits | |||||||||||||||||
| 2023 | 2022 | 2021 | 2023 | 2022 | 2021 | 2023 | 2022 | 2021 | ||||||||||
Discount rate | | % | | % | | % | | % | | % | | % | | % | | % | | % | |
| % | | % | | % | NA | NA | NA | NA | NA | NA | ||||||||
Rate of compensation increase | NA | NA | NA | NA | NA | NA | NA | NA | NA | ||||||||||
To select the discount rate, the Company reviews the yield on high quality corporate bonds. This rate is adjusted to convert the yield to an annual discount rate basis and may be adjusted for the population of plan participants to reflect the expected duration of the benefit payments of the plan.
Assumed healthcare cost trend rates were as follows at December 31, 2023, 2022 and 2021:
| 2023 | 2022 | 2021 | ||||
Healthcare cost trend rate assumed for next year | | % | | % | | % | |
Rate to which the cost trend is assumed to decline (the ultimate trend rate) | | % | | % | | % | |
Year that the rate reaches the ultimate trend rate | 2028 | 2028 | 2026 |
Plan Assets
The Company’s pension plan assets were allocated as follows as of December 31, 2023 and 2022:
Asset Allocation | |||||
| 2023 |
| 2022 | ||
Equity securities | | % | | % | |
Debt securities | | % | | % | |
Other securities | | % | | % | |
Total | | % | | % | |
There were
147
The assets within the pension plan are managed in accordance with ERISA. The objective of the plan is to achieve, over full market cycles, a compounded annual rate of return equal to or greater than the pension plan’s expected long-term rate of return. The pension plan’s participants recognize that capital markets can be unpredictable and that any investment could result in periods where the market value of the pension plan’s assets will decline in value. Asset allocation is likely to be the primary determinant of the pension plan’s return and the associated volatility of returns for the pension plan. The Company estimated the long-term rate of return for the 2023 net periodic pension cost to be
The target asset allocation for the pension plan at December 31, 2023, was as follows:
Target | |||
| Allocation | ||
Equity securities | | % | |
Debt securities | | % | |
Other securities | | % | |
Estimated Future Benefit Payments
The following table presents benefit payments that are expected to be paid over the next ten years, giving consideration to expected future service as appropriate:
Pension | Other | |||||
(dollars in thousands) |
| Benefits |
| Benefits | ||
2024 | $ | | $ | | ||
2025 | | | ||||
2026 | | | ||||
2027 | | | ||||
2028 | | | ||||
2029 to 2033 | | | ||||
Fair Value Measurement of Plan Assets
The Company’s overall investment strategy includes a wide diversification of asset types, fund strategies and fund managers. Investments in exchange-traded funds consist primarily of investments in large-cap companies located in the United States. Fixed income securities include U.S. government agencies and corporate bonds of companies from diversified industries.
148
The fair values of the Company’s pension plan assets at December 31, 2023 and 2022, by asset class, were as follows:
December 31, 2023 | ||||||||||||
Quoted Prices | Significant | |||||||||||
In Active | Other | Significant | ||||||||||
Markets for | Observable | Unobservable | ||||||||||
Identical Assets | Inputs | Inputs | ||||||||||
(dollars in thousands) |
| (Level 1) |
| (Level 2) |
| (Level 3) |
| Total | ||||
Asset classes: | ||||||||||||
Cash and cash equivalents | $ | | $ | — | $ | — | $ | | ||||
Fixed income - U.S. Treasury securities | — | | — | | ||||||||
Fixed income - U.S. government agency securities | — | | — | | ||||||||
Fixed income - U.S. corporate securities | — | | — | | ||||||||
Fixed income - municipal securities | — | | — | | ||||||||
Fixed income - international securities | | — | — | | ||||||||
Equity - large-cap exchange-traded funds | | — | — | | ||||||||
Equity - mid-cap exchange-traded funds | | — | — | | ||||||||
Equity - small-cap exchange-traded funds | | — | — | | ||||||||
Equity - international funds | | — | — | | ||||||||
Total | $ | | $ | | $ | — | $ | | ||||
December 31, 2022 | ||||||||||||
Quoted Prices | Significant | |||||||||||
In Active | Other | Significant | ||||||||||
Markets for | Observable | Unobservable | ||||||||||
Identical Assets | Inputs | Inputs | ||||||||||
(dollars in thousands) |
| (Level 1) |
| (Level 2) |
| (Level 3) |
| Total | ||||
Asset classes: | ||||||||||||
Cash and cash equivalents | $ | | $ | — | $ | — | $ | | ||||
Fixed income - U.S. Treasury securities | — | | — | | ||||||||
Fixed income - U.S. government agency securities | — | | — | | ||||||||
Fixed income - U.S. corporate securities | — | | — | | ||||||||
Fixed income - municipal securities | — | | — | | ||||||||
Fixed income - international securities | | — | — | | ||||||||
Equity - large-cap exchange-traded funds | | — | — | | ||||||||
Equity - mid-cap exchange-traded funds | | — | — | | ||||||||
Equity - small-cap exchange-traded funds | | — | — | | ||||||||
Equity - international funds | | — | — | | ||||||||
Total | $ | | $ | | $ | — | $ | | ||||
The plan’s investments in fixed income securities represent approximately
Valuation Methodologies
Cash and cash equivalents — includes institutional money market funds, whose carrying value represents fair value because of their short-term maturities of the instruments held by these funds.
U.S. Treasury securities — includes securities issued by the U.S. government valued at fair value based on observable market prices for similar securities or other market observable inputs.
U.S. government agency securities — includes investment-grade debt securities issued by U.S. government agencies. These securities are valued at fair value based upon the quoted market values of the underlying net assets.
149
U.S. corporate securities — includes investment-grade debt securities issued by U.S. corporations. These securities are valued at fair value based on observable market prices for similar securities or other market observable inputs.
Municipal securities — includes bonds issued by a city or other local government, or their agencies. Potential issuers of municipal bonds include cities, counties, redevelopment agencies, special-purpose districts, school districts, public utility districts, publicly owned airports and seaports, and any other governmental entity (or group of governments) below the state level. Municipal bonds may be general obligations of the issuer or secured by specified revenues. These securities are valued at fair value based on observable market prices for similar securities or other market observable inputs.
International securities — includes investment-grade debt securities issued by international corporations. The fair value is based upon the quoted market values of the underlying net assets.
Large-cap exchange-traded fund — includes an exchange-traded fund which invests mainly in U.S. large-cap stocks such as those in the S&P 500 index. The fair value is based upon the quoted market values of the underlying net assets.
Mid-cap exchange-traded funds — includes broadly-diversified exchange-traded funds which invest in U.S. mid-cap stocks such as those in the S&P 400 Mid Cap index. The fair value is based upon the quoted market values of the underlying net assets.
Small-cap exchange-traded funds — includes broadly-diversified exchange-traded funds which invest in U.S. small-cap stocks such as those in the S&P 600 Small Cap index. The fair value is based upon the quoted market values of the underlying net assets.
International funds — includes well-diversified exchange-traded funds tracking broad-based international equity indexes. The fair value is based upon the quoted market values of the underlying net assets.
15. Income Taxes
For the years ended December 31, 2023, 2022 and 2021, the provision (benefit) for income taxes was comprised of the following:
Year Ended December 31, | |||||||||
(dollars in thousands) |
| 2023 |
| 2022 |
| 2021 | |||
Current: | |||||||||
Federal | $ | | $ | | $ | | |||
State and local | | | | ||||||
Total current | | | | ||||||
Deferred: | |||||||||
Federal | ( | | | ||||||
State and local | ( | | | ||||||
Total deferred | ( | | | ||||||
Total provision for income taxes | $ | | $ | | $ | | |||
The Company files Federal and state income tax returns for its subsidiaries. The Company’s subsidiary also files income tax returns in Guam, Saipan and certain other state jurisdictions. The Company had a current income tax receivable due from various jurisdictions of $
150
The components of net deferred income tax assets and liabilities at December 31, 2023 and 2022, were as follows:
December 31, | ||||||
(dollars in thousands) |
| 2023 |
| 2022 | ||
Assets: | ||||||
Deferred compensation expense | $ | | $ | | ||
Allowance for credit losses and nonperforming assets | | | ||||
Lease liabilities | | | ||||
Investment securities | | | ||||
State income taxes | | | ||||
Total deferred income tax assets before valuation allowance | | | ||||
Valuation allowance | — | ( | ||||
Total deferred income tax assets after valuation allowance | | | ||||
Liabilities: | ||||||
Leases | ( | ( | ||||
Deferred income | ( | ( | ||||
Lease right-of-use assets | ( | ( | ||||
Intangible assets | ( | ( | ||||
Other | ( | ( | ||||
Total deferred income tax liabilities | ( | ( | ||||
Net deferred income tax assets | $ | | $ | | ||
Net deferred income tax assets were included in other assets in the consolidated balance sheets as of December 31, 2023 and 2022.
Management evaluated the deferred income tax assets for recoverability by considering negative and positive evidence. Negative evidence included the uncertainty of generating future capital gains and restrictions on the ability to sell low-income housing investments during periods when carrybacks of capital losses are allowed. Positive evidence included the generation of capital gains in the current year and carryback years. Based on the weight of all available evidence, management determined a valuation allowance to offset deferred tax assets related to investments in low-income housing projects that can only be utilized to offset capital gains was required for the year ended December 31, 2022. Management further concluded it is more likely than not that the remaining deferred tax assets will be realized through carryback to taxable income in prior years, future reversals of existing taxable temporary differences, and projected future taxable income. Consequently, the remaining deferred income tax assets are not subject to a valuation allowance.
The following analysis reconciles the Federal statutory income tax rate to the effective income tax rate for the years ended December 31, 2023, 2022 and 2021:
Year Ended December 31, | ||||||||||||||||||
2023 | 2022 | 2021 | ||||||||||||||||
(dollars in thousands) |
| Amount |
| Percent |
| Amount |
| Percent |
| Amount |
| Percent | ||||||
Federal statutory income tax expense and rate | $ | | | % | $ | | | % | $ | | | % | ||||||
State and local taxes, net of federal income tax benefit | | | | | | | ||||||||||||
Tax credits | ( | ( | ( | ( | ( | ( | ||||||||||||
Nontaxable income | ( | ( | ( | ( | ( | ( | ||||||||||||
Other | | | | | ( | ( | ||||||||||||
Income tax expense and effective income tax rate | $ | | | % | $ | | | % | $ | | | % | ||||||
The Company is subject to examination by the Internal Revenue Service (“IRS”) and tax authorities in states in which the Company has significant business operations. The tax years under examination and open for examination vary by jurisdiction. The Company’s 2016 and 2017 tax returns are currently under IRS examination. In addition, refund claims and tax returns for certain years are being reviewed by state jurisdictions. No material adjustments are anticipated as a result of these examinations and reviews. The Company’s income tax returns for 2020 and subsequent tax years generally remain subject to examination by U.S. federal and foreign jurisdictions, and 2019 and subsequent years are subject to examination by state taxing authorities.
151
A reconciliation of the amount of unrecognized tax benefits is as follows for the years ended December 31, 2023, 2022 and 2021:
Year Ended December 31, | |||||||||||||||||||||||||||
2023 | 2022 | 2021 | |||||||||||||||||||||||||
Interest | Interest | Interest | |||||||||||||||||||||||||
and | and | and | |||||||||||||||||||||||||
(dollars in thousands) |
| Tax |
| Penalties |
| Total |
| Tax |
| Penalties |
| Total |
| Tax |
| Penalties |
| Total | |||||||||
Balance at beginning of year | $ | | $ | | $ | | $ | | $ | | $ | | $ | | $ | | $ | | |||||||||
Additions for current year tax positions | | — | | | — | | | — | | ||||||||||||||||||
Additions for Reorganization Transactions | — | | | — | | | | | | ||||||||||||||||||
Additions for prior years' tax positions: | |||||||||||||||||||||||||||
New uncertain tax positions identified | | — | | — | — | — | — | — | — | ||||||||||||||||||
Accrual of interest and penalties | — | | | — | | | — | | | ||||||||||||||||||
Reductions for prior years' tax positions: | |||||||||||||||||||||||||||
Expiration of statute of limitations | ( | ( | ( | ( | ( | ( | ( | ( | ( | ||||||||||||||||||
Balance at December 31, | $ | | $ | | $ | | $ | | $ | | $ | | $ | | $ | | $ | | |||||||||
Included in the balance of unrecognized tax benefits for the years ended December 31, 2023, 2022 and 2021, was $
In connection with the Reorganization Transactions discussed below, the Company recorded unrecognized tax benefits and interest and penalties of $
The Company recognizes interest and penalties attributable to both unrecognized tax benefits and undisputed tax adjustments in the provision for income taxes. For the years ended December 31, 2023, 2022 and 2021, the Company recorded $
152
Prior to the Reorganization Transactions, the Company filed consolidated U.S. Federal and combined state tax returns that incorporated the tax receivables and unrecognized tax benefits of FHB and BOW. The consummation of the Reorganization Transactions did not relieve the Company of the pre-Reorganization Transactions tax receivables and unrecognized tax benefits recognized by BOW that were included in the Company's consolidated and combined tax returns. As a result, on April 1, 2016, the Company recorded $
16. Derivative Financial Instruments
The Company enters into derivative contracts primarily to manage its interest rate risk, as well as for customer accommodation purposes. Derivatives used for risk management purposes consist of interest rate swaps and collars that are designated as either a fair value hedge or a cash flow hedge. The derivatives are recognized on the consolidated balance sheets as either assets or liabilities at fair value. Derivatives entered into for customer accommodation purposes consist of various free-standing interest rate derivative products and foreign exchange contracts. The Company is party to master netting arrangements with its financial institution counterparties; however, the Company does not offset assets and liabilities under these arrangements for financial statement presentation purposes.
The following table summarizes notional amounts and fair values of derivatives held by the Company as of December 31, 2023 and 2022:
December 31, 2023 | December 31, 2022 | |||||||||||||||||
Fair Value | Fair Value | |||||||||||||||||
Notional | Asset | Liability | Notional | Asset | Liability | |||||||||||||
(dollars in thousands) |
| Amount |
| Derivatives(1) |
| Derivatives(2) |
| Amount |
| Derivatives(1) |
| Derivatives(2) | ||||||
Derivatives designated as hedging instruments: | ||||||||||||||||||
Interest rate swaps | $ | | $ | | $ | ( | $ | | $ | | $ | ( | ||||||
Interest rate collars | | | — | | | ( | ||||||||||||
Derivatives not designated as hedging instruments: | ||||||||||||||||||
Interest rate swaps | | | ( | | | ( | ||||||||||||
Visa derivative | | — | ( | | — | ( | ||||||||||||
Foreign exchange contracts | | — | — | | — | — | ||||||||||||
| (1) | The positive fair values of derivative assets are included in other assets. |
| (2) | The negative fair values of derivative liabilities are included in other liabilities. |
153
Certain interest rate swaps noted above, are cleared through clearinghouses, rather than directly with counterparties. Those transactions cleared through a clearinghouse require initial margin collateral and variation margin payments depending on the contracts being in a net asset or liability position. As of December 31, 2023 and 2022, the amount of initial margin cash collateral posted by the Company was $
As of December 31, 2023, the Company pledged $
As of December 31, 2023 and 2022, the Company received $
Fair Value Hedges
To manage the risk related to the Company’s net interest margin, interest rate swaps are utilized to hedge certain fixed-rate loans. These swaps have maturity, amortization and prepayment features that correspond to the loans hedged and are designated and qualify as fair value hedges. Any gain or loss on the swaps, as well as the offsetting loss or gain on the hedged item attributable to the hedged risk, is recognized in current period earnings.
At December 31, 2023 and 2022, the Company carried
The following table shows the net gains and losses recognized in income related to derivatives in fair value hedging relationships for the years ended December 31, 2023, 2022 and 2021:
Gains (losses) recognized in | Year Ended | |||||||||||
the consolidated statements | December 31, | |||||||||||
(dollars in thousands) |
| of income line item |
| 2023 |
| 2022 |
| 2021 |
| |||
Gains (losses) on fair value hedging relationships recognized in interest income: | ||||||||||||
Recognized on interest rate swap | Loans and lease financing | | $ | | $ | ( | ||||||
Recognized on hedged item | Loans and lease financing | ( | ( | | ||||||||
As of December 31, 2023 and 2022, the following amounts were recorded in the consolidated balance sheets related to the cumulative basis adjustments for fair value hedges:
Cumulative Amount of Fair Value | ||||||||||||||||
Hedging Adjustment Included in the | ||||||||||||||||
Carrying Amount of the Hedged Asset | Carrying Amount of the Hedged Asset | |||||||||||||||
(dollars in thousands) |
| December 31, 2023 |
| December 31, 2022 |
| December 31, 2023 |
| December 31, 2022 | ||||||||
Line item in the consolidated balance sheets in which the hedged item is included | ||||||||||||||||
Loans and leases | $ | | $ | | $ | ( | $ | ( | ||||||||
154
Cash Flow Hedges
The Company utilized interest rate swaps to reduce asset sensitivity and enhance current yields associated with interest payments received on a pool of floating-rate loans. The Company entered into interest rate swaps paying floating rates and receiving fixed rates. The floating-rate index (Bloomberg Short-Term Bank Yield Index, or “BSBY”) corresponds to the floating-rate nature of the interest receipts being hedged (based on USD Prime). The swaps provided an initial benefit to interest income as the Company received the higher fixed rate, which persisted while the floating rate remained below the swap’s fixed rate. By hedging with interest rate swaps, the Company minimized the adverse impact on interest income previously associated with a low interest rate environment on floating-rate loans.
As of December 31, 2023 and 2022, the Company carried
The Company also utilized interest rate collars to manage interest rate risk and protect against downside risk in yields associated with interest payments received on a pool of floating-rate assets. The floating-rate index of the collars (Secured Overnight Financing Rate, or “SOFR”) corresponds to the floating-rate nature of the interest receipts being hedged (based on SOFR). Interest rate collars involve the payments of variable-rate amounts if the collar index exceeds the cap strike rate on the contract and receipts of variable-rate amounts if the collar index falls below the floor strike rate on the contract. No payments are required if the collar index falls between the cap and floor rates. By hedging with interest rate collars, the Company mitigates the adverse impact on interest income associated with possible future decreases in interest rates.
As of December 31, 2023 and 2022, the Company carried
The interest rate swaps and collars are designated and qualify as cash flow hedges. To the extent that the hedge is considered highly effective, the gain or loss on the interest rate swaps and collars is reported as a component of other comprehensive income (loss) and reclassified into earnings in the same period that the hedged transaction affects earnings.
The following table summarizes the effect of cash flow hedging relationships for the years ended December 31, 2023 and 2022:
Year Ended | ||||||
December 31, | ||||||
(dollars in thousands) |
| 2023 |
| 2022 | ||
Pretax net losses recognized in other comprehensive income on cash flow derivative hedges | $ | ( | $ | ( | ||
Pretax net losses reclassified from accumulated other comprehensive income to interest income from loans and lease financing | | | ||||
The estimated net amount to be reclassified within the next 12 months out of accumulated other comprehensive income (loss) into earnings is $
155
Free-Standing Derivative Instruments
For the derivatives that are not designated as hedges, changes in fair value are reported in current period earnings. The following table summarizes the impact on pretax earnings of derivatives not designated as hedges, as reported on the consolidated statements of income for the years ended December 31, 2023, 2022 and 2021:
Net losses recognized | Year Ended | ||||||||||
in the consolidated statements | December 31, | ||||||||||
(dollars in thousands) |
| of income line item | 2023 |
| 2022 |
| 2021 |
| |||
Derivatives Not Designated As Hedging Instruments: | |||||||||||
Interest rate swaps | Other noninterest income | $ | ( | $ | — | $ | — | ||||
Visa derivative | ( | ( | ( | ||||||||
As of December 31, 2023, the Company carried multiple interest rate swaps with notional amounts totaling $
The Company’s customer swap program is designed by offering customers a variable-rate loan that is swapped to fixed-rate through an interest-rate swap. The Company simultaneously executes an offsetting interest-rate swap with a swap dealer. Upfront fees on the dealer swap are recorded in other noninterest income and totaled $
Visa Class B Restricted Shares
In 2016, the Company recorded a $
Counterparty Credit Risk
By using derivatives, the Company is exposed to counterparty credit risk if counterparties to the derivative contracts do not perform as expected. If a counterparty fails to perform, the Company’s counterparty credit risk is equal to the amount reported as a derivative asset, net of cash or other collateral received, and net of derivatives in a loss position with the same counterparty to the extent master netting arrangements exist. The Company minimizes counterparty credit risk through credit approvals, limits, monitoring procedures, executing master netting arrangements and obtaining collateral, where appropriate. Counterparty credit risk related to derivatives is considered in determining fair value.
The Company’s interest rate swap agreements include bilateral collateral agreements with collateral requirements which begin with exposures in excess of $
156
Credit-Risk Related Contingent Features
Certain of the Company’s derivative contracts contain provisions whereby if its credit rating were to be downgraded by certain major credit rating agencies as a result of a merger or material adverse change in the Company’s financial condition, the counterparty could require an early termination of derivative instruments. The aggregate fair value of all derivative instruments with such credit-risk related contingent features that are in a net liability position was
17. Commitments and Contingent Liabilities
Contingencies
On November 2, 2020, a lawsuit was filed in Hawaii Circuit Court by a Bank customer related to the sale of credit facilities that the Bank had previously extended to the customer. The customer asserts claims against the Bank for interference with the customer’s contract and business opportunity, unfair methods of competition and declaratory and injunctive relief. As of December 31, 2023, an agreement was reached and the confidential settlement agreement was executed by all parties in January 2024.
Various other legal proceedings are pending or threatened against the Company. After consultation with legal counsel, management does not expect that the aggregate liability, if any, resulting from these proceedings would have a material effect on the Company’s consolidated financial position, results of operations or cash flows.
Financial Instruments with Off-Balance Sheet Risk
The Company is a party to financial instruments with off-balance sheet risk in the normal course of business to meet the financing needs of its customers. These financial instruments include commitments to extend credit and standby and commercial letters of credit which are not reflected in the consolidated financial statements.
Unfunded Commitments to Extend Credit
A commitment to extend credit is a legally binding agreement to lend funds to a customer, usually at a stated interest rate and for a specified purpose. Commitments are reported net of participations sold to other institutions. Such commitments have fixed expiration dates and generally require a fee. The extension of a commitment gives rise to credit risk. The actual liquidity requirements or credit risk that the Company will experience is expected to be lower than the contractual amount of commitments to extend credit because a significant portion of those commitments are expected to expire without being drawn upon. Certain commitments are subject to loan agreements containing covenants regarding the financial performance of the customer that must be met before the Company is required to fund the commitment. The Company uses the same credit policies in making commitments to extend credit as it does in making loans. In addition, the Company manages the potential credit risk in commitments to extend credit by limiting the total amount of arrangements, both by individual customer and in the aggregate, by monitoring the size and expiration structure of these portfolios and by applying the same credit standards maintained for all of its related credit activities. Commitments to extend credit are reported net of participations sold to other institutions of $
157
Standby and Commercial Letters of Credit
Standby letters of credit are issued on behalf of customers in connection with contracts between the customers and third parties. Under standby letters of credit, the Company assures that the third parties will receive specified funds if customers fail to meet their contractual obligations. The credit risk to the Company arises from its obligation to make payment in the event of a customer’s contractual default. Standby letters of credit are reported net of participations sold to other institutions of $
Financial instruments with off-balance sheet risk at December 31, 2023 and 2022 were as follows:
December 31, | ||||||
(dollars in thousands) |
| 2023 |
| 2022 | ||
Financial instruments whose contract amounts represent credit risk: | ||||||
Commitments to extend credit | $ | | $ | | ||
Standby letters of credit | | | ||||
Commercial letters of credit | | | ||||
Guarantees
The Company sells residential mortgage loans in the secondary market primarily to The Federal National Mortgage Association (“FNMA” or “Fannie Mae”) and The Federal Home Loan Mortgage Corporation (“FHLMC” or “Freddie Mac”) that may potentially require repurchase under certain conditions. This risk is managed through the Company’s underwriting practices. The Company services loans sold to investors and loans originated by other originators under agreements that may include repurchase remedies if certain servicing requirements are not met. This risk is managed through the Company’s quality assurance and monitoring procedures. Management does not anticipate any material losses as a result of these transactions.
Lease Commitments
The Company’s lease commitments are discussed in “Note 13. Leases” in the notes to the consolidated financial statements.
Foreign Exchange Contracts
The Company has forward foreign exchange contracts that represent commitments to purchase or sell foreign currencies at a future date at a specified price. The Company’s utilization of forward foreign exchange contracts is subject to the primary underlying risk of movements in foreign currency exchange rates and to additional counterparty risk should its counterparties fail to meet the terms of their contracts. Forward foreign exchange contracts are utilized to mitigate the Company’s risk to satisfy customer demand for foreign currencies and are not used for trading purposes. See “Note 16. Derivative Financial Instruments” in the notes to the consolidated financial statements for more information.
158
Reorganization Transactions
In connection with the Reorganization Transactions as discussed in “Note 1. Organization and Summary of Significant Accounting Policies” in the notes to the consolidated financial statements, FHI (formerly BancWest) distributed its interest in BWHI (including BOW) to BNPP so that BWHI was held directly by BNPP (BWHI is now held indirectly by BNPP through its intermediate holding company). As a result of the Reorganization Transactions that occurred on April 1, 2016, various tax or other contingent liabilities could arise related to the business of BOW, or related to the Company’s operations prior to the restructuring when it was known as BancWest, including its then wholly owned subsidiary, BOW. The Company is not able to determine the ultimate outcome or estimate the amounts of these contingent liabilities, if any, at this time.
18. Revenue from Contracts with Customers
In accordance with Topic 606, Revenue from Contracts with Customers, revenues are recognized when control of promised goods or services is transferred to customers in an amount that reflects the consideration the Company expects to be entitled to in exchange for those goods or services. To determine revenue recognition for arrangements that an entity determines are within the scope of Topic 606, the Company performs the following five steps: (i) identify the contract(s) with a customer; (ii) identify the performance obligations in the contract; (iii) determine the transaction price; (iv) allocate the transaction price to the performance obligations in the contract; and (v) recognize revenue when (or as) the Company satisfies a performance obligation. The Company only applies the five-step model to contracts when it is probable that the entity will collect the consideration it is entitled to in exchange for the goods or services it transfers to the customer. At contract inception, once the contract is determined to be within the scope of Topic 606, the Company assesses the goods or services that are promised within each contract and identifies those that contain performance obligations, and assesses whether each promised good or service is distinct. The Company then recognizes as revenue the amount of the transaction price that is allocated to the respective performance obligation when (or as) the performance obligation is satisfied.
Disaggregation of Revenue
The following table summarizes the Company’s revenues, which includes net interest income on financial instruments and noninterest income, disaggregated by type of service and business segments for the years ended December 31, 2023, 2022 and 2021:
Year Ended December 31, 2023 | ||||||||||||
Treasury | ||||||||||||
Retail | Commercial | and | ||||||||||
(dollars in thousands) |
| Banking |
| Banking |
| Other |
| Total | ||||
Net interest income(1) | $ | | $ | | $ | | $ | | ||||
Service charges on deposit accounts | | | | | ||||||||
Credit and debit card fees | — | | | | ||||||||
Other service charges and fees | | | | | ||||||||
Trust and investment services income | | — | — | | ||||||||
Other | | | | | ||||||||
Not in scope of Topic 606(1) | | | | | ||||||||
Total noninterest income | | | | | ||||||||
Total revenue | $ | | $ | | $ | | $ | | ||||
159
Year Ended December 31, 2022 | ||||||||||||
Treasury | ||||||||||||
Retail | Commercial | and | ||||||||||
(dollars in thousands) |
| Banking |
| Banking |
| Other |
| Total | ||||
Net interest income(1) | $ | | $ | | $ | | $ | | ||||
Service charges on deposit accounts | | | | | ||||||||
Credit and debit card fees | — | | | | ||||||||
Other service charges and fees | | | | | ||||||||
Trust and investment services income | | — | — | | ||||||||
Other | | | | | ||||||||
Not in scope of Topic 606(1) | | | ( | | ||||||||
Total noninterest income | | | | | ||||||||
Total revenue | $ | | $ | | $ | | $ | | ||||
Year Ended December 31, 2021 | ||||||||||||
Treasury | ||||||||||||
Retail | Commercial | and | ||||||||||
(dollars in thousands) |
| Banking |
| Banking |
| Other |
| Total | ||||
Net interest income(1) | $ | | $ | | $ | ( | $ | | ||||
Service charges on deposit accounts | | | | | ||||||||
Credit and debit card fees | — | | | | ||||||||
Other service charges and fees | | | | | ||||||||
Trust and investment services income | | — | — | | ||||||||
Other | | | | | ||||||||
Not in scope of Topic 606(1) | | | | | ||||||||
Total noninterest income | | | | | ||||||||
Total revenue | $ | | $ | | $ | | $ | | ||||
| (1) | Most of the Company’s revenue is not within the scope of Topic 606. The guidance explicitly excludes net interest income from financial assets and liabilities as well as other noninterest income from loans, leases, investment securities and derivative financial instruments. |
For the years ended December 31, 2023, 2022 and 2021, substantially all of the Company’s revenues under the scope of Topic 606 were related to performance obligations satisfied at a point in time.
The following is a discussion of revenues within the scope of Topic 606.
Service Charges on Deposit Accounts
Service charges on deposit accounts relate to fees generated from a variety of deposit products and services rendered to customers. Charges include, but are not limited to, overdraft fees, non-sufficient fund fees, dormant fees and monthly service charges. Such fees are recognized concurrent with the event on a daily basis or on a monthly basis depending upon the customer’s cycle date.
Credit and Debit Card Fees
Credit and debit card fees primarily represent revenues earned from interchange fees, ATM fees and merchant processing fees. Interchange and network revenues are earned on credit and debit card transactions conducted with payment networks. ATM fees are primarily earned as a result of surcharges assessed to non-FHB customers who use an FHB ATM. Merchant processing fees are primarily earned on transactions in which FHB is the acquiring bank. Such fees are generally recognized concurrently with the delivery of services on a daily basis.
160
Trust and Investment Services Fees
Trust and investment services fees represent revenue earned by directing, holding and managing customers’ assets. Fees are generally computed based on a percentage of the previous period’s value of assets under management. The transaction price (i.e., percentage of assets under management) is established at the inception of each contract. Trust and investment services fees also include broker dealer fees which represent revenue earned from buying and selling securities on behalf of customers. Such fees are recognized at the end of a valuation period or concurrently with the execution of a buy or sell transaction.
Other Fees
Other fees primarily include revenues generated from wire transfers, lockboxes, bank issuance of checks and insurance commissions. Such fees are recognized concurrent with the event or on a monthly basis.
Contract Balances
A contract liability is an entity’s obligation to transfer goods or services to a customer for which the entity has received consideration (or the amount is due) from the customer. The Company received signing bonuses from
A contract asset is the right to consideration for transferred goods or services when the amount is conditioned on something other than the passage of time. As of December 31, 2023 and 2022, there were
Other
Except for the contract liabilities noted above, the Company did
19. Earnings per Share
For the years ended 2023, 2022 and 2021, the Company made
The computations of basic and diluted earnings per share were as follows for the years ended December 31, 2023, 2022 and 2021:
Year Ended December 31, | ||||||||||
(dollars in thousands, except shares and per share amounts) |
| 2023 |
| 2022 |
| 2021 |
| |||
Numerator: | ||||||||||
Net income | $ | | $ | | $ | | ||||
Denominator: | ||||||||||
Basic: weighted-average shares outstanding | | | | |||||||
Add: weighted-average equity-based awards | | | | |||||||
Diluted: weighted-average shares outstanding | | | | |||||||
Basic earnings per share | $ | | $ | | $ | | ||||
Diluted earnings per share | $ | | $ | | $ | | ||||
161
20. Stock-Based Compensation
The Company has several stock-based compensation plans that allow for grants of restricted stock, restricted shares, performance share units, performance shares and restricted stock units to its employees and non-employee directors. The Company’s stock-based compensation plans are administered by the Compensation Committee of the Board of Directors. For the years ended December 31, 2023, 2022 and 2021, stock-based compensation expense was $
As of December 31, 2023, total shares authorized under the Company’s stock-based compensation plan for employees were
Restricted Share Awards
Restricted share awards (“Restricted Stock”) provide grantees with rights to shares of common stock contingent upon completion of a service period. Restricted Stock generally vests and any restrictions will lapse over a period of
The following presents the Company’s Restricted Stock activity for the years ended December 31, 2023, 2022 and 2021:
Weighted | ||||||
Number | Average Grant | |||||
| of Shares |
| Date Fair Value | |||
Unvested as of December 31, 2020 | | $ | | |||
Granted | — | — | ||||
Vested | ( | | ||||
Forfeited | ( | | ||||
Unvested as of December 31, 2021 | | $ | | |||
Granted | — | — | ||||
Vested | ( | | ||||
Forfeited | ( | | ||||
Unvested as of December 31, 2022 |
| |
| $ | | |
Granted | — | — | ||||
Vested | ( | | ||||
Forfeited | ( | | ||||
Unvested as of December 31, 2023 | — | $ | — |
For the years ended December 31, 2023, 2022 and 2021, the Company granted
The total grant date fair value of Restricted Stock that vested for the years ended December 31, 2023, 2022, and 2021 was $
162
Performance Share Units and Performance Share Awards
Performance share units (“PSUs”) and performance share awards (“PSAs”) (collectively, “Performance Awards”) are an award of units or shares in which the recipient’s rights in the units or shares are contingent on the achievement of pre-established performance goals. At the end of the performance period, the Compensation Committee will determine to what extent the performance goals originally outlined when the Performance Awards were granted have been achieved. Depending on the level of performance achieved,
The Performance Awards are governed by the Company’s Long-Term Incentive Plan (the “LTIP”), which is designed to reward selected key employees for their individual performance and the Company’s performance measured over multi-year performance cycles. Awards related to the LTIP provide for equity-based awards based on the Company’s profitability and market conditions that are based on the Company’s performance relative to peer groups over a
The following presents the Company’s Performance Award activity for the years ended December 31, 2023, 2022 and 2021:
Weighted | ||||||
Number | Average Grant | |||||
| of Shares |
| Date Fair Value | |||
Unvested as of December 31, 2020 | | $ | | |||
Granted | | | ||||
Vested | ( | | ||||
Forfeited | ( | | ||||
Unvested as of December 31, 2021 |
| |
| $ | | |
Granted | | | ||||
Vested | ( | | ||||
Forfeited | ( | | ||||
Unvested as of December 31, 2022 |
| |
| $ | | |
Granted | | | ||||
Vested | ( | | ||||
Forfeited | ( | | ||||
Unvested as of December 31, 2023 | | $ | |
For the years ended December 31, 2023, 2022 and 2021, the Company granted
The total grant date fair value of Performance Awards that vested for the years ended December 31, 2023, 2022 and 2021, was $
163
Restricted Stock Units
Restricted stock units (“RSUs”) are an award of units that correspond in number and value to a specified number of shares of FHI’s common stock that are subject to vesting requirements, including certain service conditions, and transferability restrictions. RSUs do not represent actual ownership of common stock and grantees have no voting rights until the shares of common stock underlying the RSUs are delivered. Following vesting, the Company will issue
The following presents the Company’s RSU activity for the years ended December 31, 2023, 2022 and 2021:
Weighted | ||||||
Number | Average Grant | |||||
| of Shares |
| Date Fair Value | |||
Unvested as of December 31, 2020 | | $ | | |||
Granted | | | ||||
Vested | ( | | ||||
Forfeited | ( | | ||||
Unvested as of December 31, 2021 |
| |
| $ | | |
Granted | | | ||||
Vested | ( | | ||||
Forfeited | ( | | ||||
Unvested as of December 31, 2022 |
| |
| $ | | |
Granted | | | ||||
Vested | ( | | ||||
Forfeited | ( | | ||||
Unvested as of December 31, 2023 | | $ | |
For the year ended December 31, 2023, the Company granted
The total grant date fair value of RSUs that vested during the years ended December 31, 2023, 2022 and 2021 was $
For all awards of PSUs, PSAs, and RSUs, dividend equivalents will accrue from the date of grant and the Company, upon delivery of the common stock, with respect to the vested PSUs and RSUs, and evidence of ownership of the shares, with respect to the vested PSAs, will pay to each grantee a cash amount equal to the product of all cash dividends paid on a share of common stock from the grant date to such delivery date and the number of shares of common stock underlying such vested PSUs, PSAs, and RSUs, as applicable, on such delivery date.
164
Employee Stock Purchase Plan
The Company also has an employee stock purchase plan (“ESPP”) which permits employees to periodically purchase Company stock on a payroll deduction basis. Participant purchases through the ESPP receive a discount of
21. Fair Value
The Company determines the fair values of its financial instruments based on the requirements established in ASC 820, Fair Value Measurements, which provides a framework for measuring fair value under GAAP and requires an entity to maximize the use of observable inputs and minimize the use of unobservable inputs when measuring fair value. ASC 820 defines fair value as the exit price, the price that would be received for an asset or paid to transfer a liability, in the principal or most advantageous market for the asset or liability in an orderly transaction between market participants on the measurement date under current market conditions.
Fair Value Hierarchy
ASC 820 establishes three levels of fair values based on the markets in which the assets or liabilities are traded and the reliability of the assumptions used to determine fair value. The levels are:
| ● | Level 1: Quoted prices (unadjusted) in active markets for identical assets or liabilities that the Company has the ability to access. |
| ● | Level 2: Observable inputs other than Level 1 prices, such as quoted prices for similar assets and liabilities; quoted prices in markets that are not active; or other inputs that are observable or can be corroborated by observable market data for substantially the full term of the assets or liabilities. |
| ● | Level 3: Valuation is generated from model-based techniques that use significant assumptions not observable in the market. These unobservable assumptions reflect the Company’s own estimates of assumptions that market participants would use in pricing the asset or liability (“Company-level data”). Level 3 assets and liabilities include financial instruments whose value is determined using unobservable inputs to pricing models, discounted cash flow methodologies, or similar techniques, as well as instruments for which the determination of fair value requires significant management judgment or estimation. |
ASC 820 requires that the Company disclose estimated fair values for certain financial instruments. Financial instruments include such items as investment securities, loans, deposits, interest rate and foreign exchange contracts, swaps and other instruments as defined by the standard. The Company has an organized and established process for determining and reviewing the fair value of financial instruments reported in the Company’s financial statements. The fair value measurements are reviewed to ensure they are reasonable and in line with market experience in similar asset and liability classes.
Additionally, the Company may be required to record at fair value other assets on a nonrecurring basis, such as other real estate owned, other customer relationships, and other intangible assets. These nonrecurring fair value adjustments typically involve the application of lower-of-cost-or-fair-value accounting or write-downs of individual assets.
Disclosure of fair values is not required for certain items such as lease financing, obligations for pension and other postretirement benefits, premises and equipment, prepaid expenses, deposit liabilities with no defined or contractual maturity, and income tax assets and liabilities.
Reasonable comparisons of fair value information with that of other financial institutions cannot necessarily be made because the standard permits many alternative calculation techniques, and numerous assumptions have been used to estimate the Company’s fair values.
165
Valuation Techniques Used in the Fair Value Measurement of Assets and Liabilities Carried at Fair Value
For the assets and liabilities measured at fair value on a recurring basis (categorized in the valuation hierarchy table below), the Company applies the following valuation techniques:
Available-for-sale securities
Available-for-sale debt securities are recorded at fair value on a recurring basis. Fair value measurement is based on quoted prices, including estimates by third-party pricing services, if available. If quoted prices are not available, fair values are measured using proprietary valuation models that utilize market observable parameters from active market makers and inter-dealer brokers whereby securities are valued based upon available market data for securities with similar characteristics. Management reviews the pricing information received from the Company’s third-party pricing service to evaluate the inputs and valuation methodologies used to place securities into the appropriate level of the fair value hierarchy and transfers of securities within the fair value hierarchy are made if necessary. On a monthly basis, management reviews the pricing information received from the third-party pricing service which includes a comparison to non-binding third-party broker quotes, as well as a review of market-related conditions impacting the information provided by the third-party pricing service. Management also identifies investment securities which may have traded in illiquid or inactive markets by identifying instances of a significant decrease in the volume or frequency of trades, relative to historical levels, as well as instances of a significant widening of the bid-ask spread in the brokered markets. The Company’s third-party pricing service has also established processes for the Company to submit inquiries regarding quoted prices. Periodically, the Company will challenge the quoted prices provided by the third-party pricing service. The Company’s third-party pricing service will review the inputs to the evaluation in light of the new market data presented by the Company. The Company’s third-party pricing service may then affirm the original quoted price or may update the evaluation on a going forward basis. The Company classifies all available-for-sale securities as Level 2.
Derivatives
Most of the Company’s derivatives are traded in over-the-counter markets where quoted market prices are not readily available. For those derivatives, the Company measures fair value on a recurring basis using proprietary valuation models that primarily use market observable inputs, such as yield curves, and option volatilities. The fair value of derivatives includes values associated with counterparty credit risk and the Company’s own credit standing. The Company classifies these derivatives, included in other assets and other liabilities, as Level 2.
Concurrent with the sale of the Visa Class B restricted shares, the Company entered into an agreement with the buyer that requires payment to the buyer in the event Visa reduces each member bank’s Class B conversion rate to unrestricted Class A common shares. During 2018 through 2023, Visa funded its litigation escrow account, thereby reducing each member bank’s Class B conversion rate to unrestricted Class A common shares from
166
Assets and Liabilities Recorded at Fair Value on a Recurring Basis
Assets and liabilities measured at fair value on a recurring basis as of December 31, 2023 and 2022 are summarized below:
| Fair Value Measurements as of December 31, 2023 | |||||||||||
Quoted Prices in | Significant | |||||||||||
Active Markets for | Other | Significant | ||||||||||
Identical Assets | Observable | Unobservable | ||||||||||
(dollars in thousands) |
| (Level 1) |
| Inputs (Level 2) |
| Inputs (Level 3) |
| Total | ||||
Assets | ||||||||||||
U.S. Treasury and government agency debt securities | $ | — | $ | | $ | — | $ | | ||||
Government-sponsored enterprises debt securities | — | | — | | ||||||||
Mortgage-backed securities: | ||||||||||||
Residential - Government agency(1) | — | | — | | ||||||||
Residential - Government-sponsored enterprises(1) | — | | — | | ||||||||
Commercial - Government agency | — | | — | | ||||||||
Commercial - Government-sponsored enterprises | — | | — | | ||||||||
Commercial - Non-agency | — | | — | | ||||||||
Collateralized mortgage obligations: | ||||||||||||
Government agency | — | | — | | ||||||||
Government-sponsored enterprises | — | | — | | ||||||||
Collateralized loan obligations | — | | — | | ||||||||
Total available-for-sale securities | — | | — | | ||||||||
Other assets(2) | | | — | | ||||||||
Liabilities | ||||||||||||
Other liabilities(3) | — | ( | ( | ( | ||||||||
Total | $ | | $ | | $ | ( | $ | | ||||
| Fair Value Measurements as of December 31, 2022 | |||||||||||
Quoted Prices in | Significant | |||||||||||
Active Markets for | Other | Significant | ||||||||||
Identical Assets | Observable | Unobservable | ||||||||||
(dollars in thousands) |
| (Level 1) |
| Inputs (Level 2) |
| Inputs (Level 3) |
| Total | ||||
Assets | ||||||||||||
U.S. Treasury and government agency debt securities | $ | — | $ | | $ | — | $ | | ||||
Government-sponsored enterprises debt securities | — | | — | | ||||||||
Mortgage-backed securities: | ||||||||||||
Residential - Government agency(1) | — | | — | | ||||||||
Residential - Government-sponsored enterprises(1) | — | | — | | ||||||||
Commercial - Government agency | — | | — | | ||||||||
Commercial - Government-sponsored enterprises | — | | — | | ||||||||
Commercial - Non-agency | — | | — | | ||||||||
Collateralized mortgage obligations: | ||||||||||||
Government agency | — | | — | | ||||||||
Government-sponsored enterprises | — | | — | | ||||||||
Collateralized loan obligations | — | | — | | ||||||||
Total available-for-sale securities | — | | — | | ||||||||
Other assets(4) | | | — | | ||||||||
Liabilities | ||||||||||||
Other liabilities(3) | — | ( | ( | ( | ||||||||
Total | $ | | $ | | $ | ( | $ | | ||||
| (1) | Backed by residential real estate. |
| (2) | Other assets classified as Level 1 include money market funds that have quoted prices in active markets and are related to the Company’s deferred compensation plans. Other assets classified as Level 2 include derivative assets. |
| (3) | Other liabilities include derivative liabilities. |
| (4) | Other assets classified as Level 1 include mutual funds and money market funds that have quoted prices in active markets and are related to the Company’s deferred compensation plans. Other assets classified as Level 2 include derivative assets. |
167
For Level 3 assets and liabilities measured at fair value on a recurring basis as of December 31, 2023 and 2022, the significant unobservable inputs used in the fair value measurements were as follows:
Quantitative Information about Level 3 Fair Value Measurements at December 31, 2023 | |||||||||
Significant | |||||||||
(dollars in thousands) | Fair value |
| Valuation Technique |
| Unobservable Input |
| Range | ||
Visa derivative | $ | ( | Expected Conversion Rate - | ||||||
Expected Term - | n/m(2) | ||||||||
Growth Rate - | - | ||||||||
Quantitative Information about Level 3 Fair Value Measurements at December 31, 2022 | |||||||||
Significant | |||||||||
(dollars in thousands) | Fair value |
| Valuation Technique |
| Unobservable Input |
| Range | ||
Visa derivative | $ | ( | Expected Conversion Rate - | ||||||
Expected Term - | |||||||||
Growth Rate - | |||||||||
| (1) | Due to the uncertainty in the movement of the conversion rate, the current conversion rate as of the respective consolidated balance sheet dates was utilized in the fair value calculation. |
| (2) | The expected term of |
| (3) | The growth rate was based on the arithmetic average of analyst price targets. |
| (4) | The expected term of |
Changes in Fair Value Levels
During the years ended December 31, 2023 and 2022, there were
The changes in Level 3 liabilities measured at fair value on a recurring basis for the years ended December 31, 2023 and 2022 are summarized below:
Visa Derivative | ||||||
(dollars in thousands) | 2023 |
| 2022 | |||
Year Ended December 31, | ||||||
Balance as of January 1, | $ | ( | $ | ( | ||
Total net losses included in other noninterest income | ( | ( | ||||
Settlements | | | ||||
Balance as of December 31, | $ | ( | $ | ( | ||
Total net losses included in net income attributable to the change in unrealized losses related to liabilities still held as of December 31, | $ | ( | $ | ( | ||
168
Assets and Liabilities Carried at Other Than Fair Value
The following tables summarize for the years indicated the estimated fair value of the Company’s financial instruments that are not required to be carried at fair value on a recurring basis, excluding leases and deposit liabilities with no defined or contractual maturity:
December 31, 2023 | |||||||||||||||
Fair Value Measurements | |||||||||||||||
Quoted Prices in | Significant | Significant | |||||||||||||
Active Markets | Other | Unobservable | |||||||||||||
for Identical | Observable | Inputs | |||||||||||||
(dollars in thousands) |
| Book Value |
| Assets (Level 1) |
| Inputs (Level 2) |
| (Level 3) |
| Total | |||||
Financial assets: | |||||||||||||||
Cash and cash equivalents | $ | | $ | | $ | | $ | — | $ | | |||||
Investment securities held-to-maturity | | — | | — | | ||||||||||
Loans held for sale | | — | | — | | ||||||||||
Loans(1) | | — | — | | | ||||||||||
Financial liabilities: | |||||||||||||||
Time deposits(2) | $ | | $ | — | $ | | $ | — | $ | | |||||
Short-term borrowings | | — | | — | | ||||||||||
December 31, 2022 | |||||||||||||||
Fair Value Measurements | |||||||||||||||
Quoted Prices in | Significant | Significant | |||||||||||||
Active Markets | Other | Unobservable | |||||||||||||
for Identical | Observable | Inputs | |||||||||||||
(dollars in thousands) |
| Book Value |
| Assets (Level 1) |
| Inputs (Level 2) |
| (Level 3) |
| Total | |||||
Financial assets: | |||||||||||||||
Cash and cash equivalents | $ | | $ | | $ | | $ | — | $ | | |||||
Investment securities held-to-maturity | | — | | — | | ||||||||||
Loans(1) | | — | — | | | ||||||||||
Financial liabilities: | |||||||||||||||
Time deposits(2) | $ | | $ | — | $ | | $ | — | $ | | |||||
Short-term borrowings | | — | | — | | ||||||||||
| (1) | Excludes financing leases of $ |
| (2) | Excludes deposit liabilities with no defined or contractual maturity of $ |
Unfunded loan and lease commitments and letters of credit are not included in the tables above. As of December 31, 2023 and 2022, the Company had $
169
Valuation Techniques Used in the Fair Value Measurement of Assets and Liabilities Carried at the Lower of Cost or Fair Value
The Company applies the following valuation techniques to assets measured at the lower of cost or fair value:
Mortgage servicing rights
MSRs are carried at the lower of cost or fair value and are therefore subject to fair value measurements on a nonrecurring basis. The fair value of MSRs is determined using models which use significant unobservable inputs, such as estimates of prepayment rates, the resultant weighted average lives of the MSRs and the option-adjusted spread levels. Accordingly, the Company classifies MSRs as Level 3.
Collateral-dependent loans
Collateral-dependent loans are those for which repayment is expected to be provided substantially through the operation or sale of the collateral. These loans are measured at fair value on a nonrecurring basis using collateral values as a practical expedient. The fair values of collateral are primarily based on real estate appraisal reports prepared by third-party appraisers less estimated selling costs. The Company measures the estimated credit losses on collateral-dependent loans by performing a lower-of-cost-or-fair-value analysis. If the estimated credit losses are determined by the value of the collateral, the net carrying amount is adjusted to fair value on a nonrecurring basis as Level 3 by recognizing an allowance for credit losses.
Other real estate owned
The Company values these properties at fair value at the time the Company acquires them, which establishes their new cost basis. After acquisition, the Company carries such properties at the lower of cost or fair value less estimated selling costs on a nonrecurring basis. Fair value is measured on a nonrecurring basis using collateral values as a practical expedient. The fair values of collateral for other real estate owned are primarily based on real estate appraisal reports prepared by third-party appraisers less disposition costs and are classified as Level 3.
Assets and Liabilities Recorded at Fair Value on a Nonrecurring Basis
The Company may be required to record certain assets at fair value on a nonrecurring basis in accordance with GAAP. These assets are subject to fair value adjustments that result from the application of lower of cost or fair value accounting or write-downs of individual assets to fair value.
There were
22. Reportable Operating Segments
The Company’s operations are organized into
170
The net interest income of the business segments reflects the results of a funds transfer pricing process that matches assets and liabilities with similar interest rate sensitivity and maturity characteristics and reflects the allocation of net interest income related to the Company’s overall asset and liability management activities on a proportionate basis. The basis for the allocation of net interest income is a function of the Company’s assumptions that are subject to change based on changes in current interest rates and market conditions. Funds transfer pricing also serves to transfer interest rate risk to Treasury.
The Company allocates the provision for credit losses from the Treasury and Other business segment (which is comprised of many of the Company’s support units) to the Retail and Commercial business segments. These allocations are based on direct costs incurred by the Retail and Commercial business segments.
Noninterest income and expense includes allocations from support units to the business segments. These allocations are based on actual usage where practicably calculated or by management’s estimate of such usage. Income tax expense is allocated to each business segment based on the consolidated effective income tax rate for the period shown.
Business Segments
Retail Banking
Retail Banking offers a broad range of financial products and services to consumers and small businesses. Loan and lease products offered include residential and commercial mortgage loans, home equity lines of credit and loans, automobile loans and leases, secured and unsecured lines of credit, installment loans and small business loans and leases. Deposit products offered include checking, savings and time deposit accounts. Retail Banking also offers wealth management services. Products and services from Retail Banking are delivered to customers through
Commercial Banking
Commercial Banking offers products that include corporate banking related products, residential and commercial real estate loans, commercial lease financing, secured and unsecured lines of credit, automobile loans and auto dealer financing, business deposit products and credit cards. Commercial lending and deposit products are offered primarily to middle-market and large companies locally, nationally and internationally.
Treasury and Other
Treasury consists of corporate asset and liability management activities including interest rate risk management. The segment’s assets and liabilities (and related interest income and expense) consist of interest-bearing deposits, investment securities, federal funds sold and purchased, government deposits, short- and long-term borrowings and bank-owned properties. The primary sources of noninterest income are from bank-owned life insurance, net gains from the sale of investment securities, foreign exchange income related to customer driven cross-border wires for business and personal reasons and management of bank-owned properties. The net residual effect of the transfer pricing of assets and liabilities is included in Treasury, along with the elimination of intercompany transactions.
Other organizational units (Technology, Operations, Credit and Risk Management, Human Resources, Finance, Administration, Marketing and Corporate and Regulatory Administration) provide a wide-range of support to the Company’s other income earning segments. Expenses incurred by these support units are charged to the business segments through an internal cost allocation process.
171
The following tables present selected business segment financial information for the years indicated:
Treasury | ||||||||||||
Retail | Commercial | and | ||||||||||
(dollars in thousands) |
| Banking |
| Banking |
| Other |
| Total | ||||
Year Ended December 31, 2023 | ||||||||||||
Net interest income | $ | | $ | | $ | | $ | | ||||
Provision for credit losses | ( | ( | ( | ( | ||||||||
Net interest income after provision for credit losses | | | | | ||||||||
Noninterest income | | | | | ||||||||
Noninterest expense | ( | ( | ( | ( | ||||||||
Income (loss) before (provision) benefit for income taxes | | | ( | | ||||||||
(Provision) benefit for income taxes | ( | ( | | ( | ||||||||
Net income (loss) | $ | | $ | | $ | ( | $ | | ||||
Total assets as of December 31, 2023 | $ | | $ | | $ | | $ | | ||||
Treasury | ||||||||||||
Retail | Commercial | and | ||||||||||
(dollars in thousands) |
| Banking |
| Banking |
| Other |
| Total | ||||
Year Ended December 31, 2022 | ||||||||||||
Net interest income | $ | | $ | | $ | | $ | | ||||
Benefit (provision) for credit losses | | | ( | ( | ||||||||
Net interest income after benefit (provision) for credit losses | | | | | ||||||||
Noninterest income | | | | | ||||||||
Noninterest expense | ( | ( | ( | ( | ||||||||
Income (loss) before (provision) benefit for income taxes | | | ( | | ||||||||
(Provision) benefit for income taxes | ( | ( | | ( | ||||||||
Net income (loss) | $ | | $ | | $ | ( | $ | | ||||
Total assets as of December 31, 2022 | $ | | $ | | $ | | $ | | ||||
Treasury | ||||||||||||
Retail | Commercial | and | ||||||||||
(dollars in thousands) |
| Banking |
| Banking |
| Other |
| Total | ||||
Year Ended December 31, 2021 | ||||||||||||
Net interest income (expense) | $ | | $ | | $ | ( | $ | | ||||
Benefit for credit losses | | | | | ||||||||
Net interest income (expense) after benefit for credit losses | | | ( | | ||||||||
Noninterest income | | | | | ||||||||
Noninterest expense | ( | ( | ( | ( | ||||||||
Income (loss) before (provision) benefit for income taxes | | | ( | | ||||||||
(Provision) benefit for income taxes | ( | ( | | ( | ||||||||
Net income (loss) | $ | | $ | | $ | ( | $ | | ||||
Total assets as of December 31, 2021 | $ | | $ | | $ | | $ | | ||||
172
23. Parent Company
The following tables present Parent Company-only condensed financial statements:
Condensed Statements of Comprehensive Income | ||||||||||
Year Ended December 31, | ||||||||||
(dollars in thousands) |
| 2023 |
| 2022 | 2021 |
| ||||
Income | ||||||||||
Dividends from FHB | $ | | $ | | $ | | ||||
Other income | | — | — | |||||||
Total income | | | | |||||||
Noninterest expense | ||||||||||
Salaries and employee benefits | | | | |||||||
Contracted services and professional fees | | | | |||||||
Equipment | | | — | |||||||
Other | | | | |||||||
Total noninterest expense | | | | |||||||
Income before benefit for income taxes and equity in undistributed income of FHB | | | | |||||||
Provision (Benefit) for income taxes | | ( | ( | |||||||
Equity in undistributed income of FHB | | | | |||||||
Net income | $ | | $ | | $ | | ||||
Comprehensive income (loss) | $ | | $ | ( | $ | | ||||
Condensed Statements of Condition | ||||||
December 31, | ||||||
(dollars in thousands) |
| 2023 |
| 2022 | ||
Assets | ||||||
Cash and cash equivalents | $ | | $ | | ||
Investment in FHB | | | ||||
Other assets | | | ||||
Total assets | $ | | $ | | ||
Liabilities and Stockholders' Equity | ||||||
Retirement benefits payable | $ | | $ | | ||
Other liabilities | | | ||||
Total liabilities | | | ||||
Total stockholders' equity | | | ||||
Total liabilities and stockholders' equity | $ | | $ | | ||
173
Condensed Statements of Cash Flows | |||||||||
Year Ended December 31, | |||||||||
(dollars in thousands) |
| 2023 |
| 2022 |
| 2021 | |||
Cash flows from operating activities | |||||||||
Net income | $ | | $ | | $ | | |||
Adjustments to reconcile net income to net cash provided by operating activities: | |||||||||
Equity in undistributed income of FHB | ( | ( | ( | ||||||
Deferred income taxes | ( | | | ||||||
Stock-based compensation | | | | ||||||
Change in assets and liabilities: | |||||||||
Net decrease (increase) in other assets | | ( | | ||||||
Net increase in other liabilities | | | | ||||||
Net cash provided by operating activities | | | | ||||||
Cash flows from financing activities | |||||||||
Dividends paid | ( | ( | ( | ||||||
Stock tendered for payment of withholding taxes | ( | ( | ( | ||||||
Proceeds from employee stock purchase plan | | | | ||||||
Common stock repurchased | — | ( | ( | ||||||
Net cash used in financing activities | ( | ( | ( | ||||||
Net (decrease) increase in cash and cash equivalents | ( | | ( | ||||||
Cash and cash equivalents at beginning of year | | | | ||||||
Cash and cash equivalents at end of year | $ | | $ | | $ | | |||
174
ITEM 9. CHANGES IN AND DISAGREEMENTS WITH ACCOUNTANTS ON ACCOUNTING AND FINANCIAL DISCLOSURE
Not applicable.
ITEM 9A. CONTROLS AND PROCEDURES
Disclosure Controls and Procedures
The Company’s management, including the Chief Executive Officer and Chief Financial Officer, conducted an evaluation of the effectiveness of the Company’s disclosure controls and procedures (as defined in Rules 13a-15(e) and 15d-15(e) under the Securities Exchange Act of 1934, as amended (the “Exchange Act”)) as of December 31, 2023. The Company’s disclosure controls and procedures are designed to ensure that information required to be disclosed by the Company in the reports that it files or submits under the Exchange Act is recorded, processed, summarized, and reported within the time periods specified in the U.S. Securities and Exchange Commission’s rules and forms, and that such information is accumulated and communicated to the Company’s management, including the Company’s Chief Executive Officer and Chief Financial Officer, to allow timely decisions regarding required disclosure. Based on this evaluation, the Chief Executive Officer and Chief Financial Officer concluded that the Company’s disclosure controls and procedures were effective as of December 31, 2023.
Management’s Annual Report on Internal Control over Financial Reporting
Management of the Company is responsible for establishing and maintaining effective internal control over financial reporting. Internal control is designed to provide reasonable assurance to the Company’s management and board of directors regarding the preparation of reliable published financial statements. Internal control over financial reporting includes self-monitoring mechanisms, and actions are taken to correct deficiencies as they are identified.
Because of inherent limitations in any system of internal control, no matter how well designed, misstatements due to error or fraud may occur and not be detected, including the possibility of the circumvention or overriding of controls. Accordingly, even effective internal control over financial reporting can provide only reasonable assurance with respect to financial statement preparation. Further, because of changes in conditions, internal control effectiveness may vary over time.
Management assessed the Company’s internal control over financial reporting as of December 31, 2023. This assessment was based on criteria for effective internal control over financial reporting described in “Internal Control – Integrated Framework” issued by the Committee of Sponsoring Organizations of the Treadway Commission (2013 framework). Based on this assessment, the Chief Executive Officer and Chief Financial Officer assert that the Company maintained effective internal control over financial reporting as of December 31, 2023 based on the specified criteria.
Attestation Report of the Company’s Independent Registered Public Accounting Firm
The effectiveness of the Company’s internal control over financial reporting as of December 31, 2023 has been audited by Deloitte & Touche LLP, the independent registered public accounting firm who also has audited the Company’s consolidated financial statements included in this Annual Report on Form 10-K. Deloitte & Touche LLP’s attestation report on the Company’s internal control over financial reporting appears on the following page and is incorporated by reference herein.
Changes in Internal Control over Financial Reporting
There were no changes in the Company’s internal control over financial reporting (as defined in Rules 13a-15(f) and 15d-15(f) under the Exchange Act) that occurred during the quarter ended December 31, 2023 that have materially affected, or are reasonably likely to materially affect, the Company’s internal control over financial reporting.
175
REPORT OF INDEPENDENT REGISTERED PUBLIC ACCOUNTING FIRM
To the Stockholders and the Board of Directors of
First Hawaiian, Inc.
Honolulu, Hawaii
Opinion on Internal Control over Financial Reporting
We have audited the internal control over financial reporting of First Hawaiian, Inc. and subsidiary (the “Company”) as of December 31, 2023, based on criteria established in Internal Control—Integrated Framework (2013) issued by the Committee of Sponsoring Organizations of the Treadway Commission (COSO). Because management’s assessment and our audit were conducted to meet the reporting requirements of Section 112 of the Federal Deposit Insurance Corporation Improvement Act (FDICIA), management’s assessment, and our audit of the Company’s internal control over financial reporting included controls over the preparation of the schedules equivalent to the basic consolidated financial statements in accordance with the instructions for the consolidated financial statements for bank holding companies (Form FR Y-9C). In our opinion, the Company maintained, in all material respects, effective internal control over financial reporting as of December 31, 2023, based on criteria established in Internal Control—Integrated Framework (2013) issued by COSO.
We have also audited, in accordance with the standards of the Public Company Accounting Oversight Board (United States) (PCAOB), the consolidated financial statements as of and for the year ended December 31, 2023, of the Company and our report dated February 28, 2024, expressed an unqualified opinion on those consolidated financial statements.
Basis for Opinion
The Company’s management is responsible for maintaining effective internal control over financial reporting and for its assessment of the effectiveness of internal control over financial reporting, included in the accompanying management’s annual report on internal control over financial reporting. Our responsibility is to express an opinion on the Company’s internal control over financial reporting based on our audit. We are a public accounting firm registered with the PCAOB and are required to be independent with respect to the Company in accordance with the US federal securities laws and the applicable rules and regulations of the Securities and Exchange Commission and the PCAOB.
We conducted our audit in accordance with the standards of the PCAOB. Those standards require that we plan and perform the audit to obtain reasonable assurance about whether effective internal control over financial reporting was maintained in all material respects. Our audit included obtaining an understanding of internal control over financial reporting, assessing the risk that a material weakness exists, testing and evaluating the design and operating effectiveness of internal control based on the assessed risk, and performing such other procedures as we considered necessary in the circumstances. We believe that our audit provides a reasonable basis for our opinion.
Definition and Limitations of Internal Control over Financial Reporting
A company’s internal control over financial reporting is a process designed to provide reasonable assurance regarding the reliability of financial reporting and the preparation of financial statements for external purposes in accordance with accounting principles generally accepted in the United States of America (“generally accepted accounting principles”). A company’s internal control over financial reporting includes those policies and procedures that (1) pertain to the maintenance of records that, in reasonable detail, accurately and fairly reflect the transactions and dispositions of the assets of the company; (2) provide reasonable assurance that transactions are recorded as necessary to permit preparation of financial statements in accordance with generally accepted accounting principles, and that receipts and expenditures of the company are being made only in accordance with authorizations of management and directors of the company; and (3) provide reasonable assurance regarding prevention or timely detection of unauthorized acquisition, use, or disposition of the company’s assets that could have a material effect on the financial statements.
176
Because of its inherent limitations, internal control over financial reporting may not prevent or detect misstatements. Also, projections of any evaluation of effectiveness to future periods are subject to the risk that controls may become inadequate because of changes in conditions, or that the degree of compliance with the policies or procedures may deteriorate.
/s/ DELOITTE & TOUCHE LLP
Honolulu, Hawaii
February 28, 2024
177
ITEM 9B. OTHER INFORMATION
During the three months ended December 31, 2023, none of the Company’s directors or officers (as defined in Rule 16a-1(f) under the Exchange Act)
ITEM 9C. DISCLOSURE REGARDING FOREIGN JURISDICTIONS THAT PREVENT INSPECTIONS
Not applicable.
PART III
ITEM 10. DIRECTORS, EXECUTIVE OFFICERS AND CORPORATE GOVERNANCE
Directors and Executive Officers
For information relating to the directors of the Company, the section captioned “Corporate Governance and Board Matters – Director Nominees” in the Company’s definitive Proxy Statement for the 2024 Annual Meeting of Stockholders (the “Proxy Statement”) to be filed with the SEC within 120 days after the end of the Company’s fiscal year is incorporated herein by reference. For information relating to the executive officers of the Company, the section captioned “Biographies of Executive Officers” in the Proxy Statement is incorporated herein by reference.
Compliance with Section 16(a) of the Securities Exchange Act of 1934
For information regarding compliance with Section 16(a) of the Securities Exchange Act of 1934, the section captioned “Stock Ownership – Security Ownership of Certain Beneficial Owners, Directors and Management – Delinquent Section 16(a) Reports” in the Proxy Statement is incorporated herein by reference.
Disclosure of Code of Ethics
For information concerning the Company’s Code of Ethics, the information contained under the section captioned “Corporate Governance and Board Matters – Board of Directors, Committees and Governance—Corporate Governance Guidelines and Code of Conduct and Ethics” in the Proxy Statement is incorporated herein by reference.
Procedures for Stockholder Nominations
For information regarding procedures for stockholder nominations, the section captioned “Other Business – Stockholder Proposals for the 2023 Annual Meeting” in the Proxy Statement is incorporated herein by reference.
Audit Committee
For information regarding the Audit Committee and its composition and the audit committee financial experts, the section captioned “Board of Directors, Committees and Governance — Committees of Our Board of Directors — Audit Committee” in the Proxy Statement is incorporated herein by reference.
ITEM 11. EXECUTIVE COMPENSATION
For information regarding executive and director compensation, the sections captioned “Executive Compensation” and “Corporate Governance and Board Matters – Board of Directors, Committees and Governance – Director Compensation” in the Proxy Statement are incorporated herein by reference.
178
For information regarding compensation committee interlocks and insider participation, the section captioned “Corporate Governance and Board Matters – Board of Directors, Committees and Governance — Compensation Committee Interlocks and Insider Participation” in the Proxy Statement is incorporated herein by reference. For our Compensation Committee Report, the section captioned “Executive Compensation — Compensation Committee Report” in the Proxy Statement is incorporated herein by reference.
ITEM 12. SECURITY OWNERSHIP OF CERTAIN BENEFICIAL OWNERS AND MANAGEMENT AND RELATED STOCKHOLDER MATTERS
For information regarding Security Ownership of Certain Beneficial Owners, Directors and Management, the section captioned “Stock Ownership” in the Proxy Statement is incorporated herein by reference.
The following table sets forth information about the Company common stock that may be issued upon the exercise of stock options, warrants and rights under all of the Company’s equity compensation plans as of December 31, 2023.
Number of securities | |||||||
Number of securities | Weighted average | remaining available | |||||
to be issued upon | exercise price of | for future issuance | |||||
exercise of outstanding | outstanding options, | under equity | |||||
Plan Category |
| options, warrants and rights |
| warrants and rights |
| compensation plans | |
Equity compensation plans approved by security holders | 1,455,029 | $ | — | 3,111,378 | |||
Equity compensation plans not approved by security holders | — | — | — | ||||
Total | 1,455,029 | $ | — | 3,111,378 | |||
ITEM 13. CERTAIN RELATIONSHIPS AND RELATED TRANSACTIONS, AND DIRECTOR INDEPENDENCE
For information regarding transactions with related persons, promoters and certain control persons, the section captioned “Corporate Governance and Board Matters – Board of Directors, Committees and Governance – Our Relationship with BNPP and Certain Other Related Party Transactions” in the Proxy Statement is incorporated herein by reference.
For information regarding director independence, the section captioned “Board of Directors, Committees and Governance — Director Independence” in the Company’s Proxy Statement is incorporated herein by reference.
ITEM 14. PRINCIPAL ACCOUNTING FEES AND SERVICES
For information regarding principal accounting fees and services, the sections captioned “Principal Accountant Fees” and “– Preapproval Policies and Procedures” in the Proxy Statement is incorporated herein by reference.
179
PART IV
ITEM 15. EXHIBITS, FINANCIAL STATEMENT SCHEDULES
| (a) | 1.Financial Statements |
The following consolidated financial statements of First Hawaiian, Inc. and Subsidiary are included in Item 8 of this report:
Report of Independent Registered Public Accounting Firm (PCAOB ID No.
Consolidated Statements of Income – For the years ended December 31, 2023, 2022 and 2021
Consolidated Statements of Comprehensive Income – For the years ended December 31, 2023, 2022 and 2021
Consolidated Balance Sheets – As of December 31, 2023 and 2022
Consolidated Statements of Stockholders’ Equity – For the years ended December 31, 2023, 2022 and 2021
Consolidated Statements of Cash Flows – For the years ended December 31, 2023, 2022 and 2021
Notes to Consolidated Financial Statements
2.Financial Statement Schedules
All schedules are omitted since the required information is either not applicable, not deemed material, or is disclosed in the Company’s consolidated financial statements.
3.Exhibits
The list of exhibits required to be filed as exhibits to this Annual Report on Form 10-K is listed below in the “Exhibit Index”.
ITEM 16. FORM 10-K SUMMARY
None.
180
EXHIBIT INDEX
Exhibit Number | |||
|---|---|---|---|
3.1 | |||
3.2 | |||
3.3 | |||
4.1 | |||
10.1 | |||
10.2 | |||
10.3 | |||
10.4 | |||
10.5 | |||
10.6 | |||
10.7 | |||
10.8 | |||
10.9 | |||
181
Exhibit Number | |||
|---|---|---|---|
10.10 | |||
10.11 | |||
10.12 | |||
10.13 | |||
10.14 | |||
10.15 | |||
10.16 | |||
10.17 | |||
10.18 | |||
10.19 | |||
10.20 | |||
10.21 | |||
10.22 | |||
10.23 | |||
10.24 | |||
182
Exhibit Number | |||
|---|---|---|---|
10.25 | |||
10.26 | |||
10.27 | |||
10.28 | |||
10.29 | |||
21.1 | |||
23.1 | |||
31.1 | |||
31.2 | |||
32.1 | |||
32.2 | |||
97.1 | |||
101.INS | XBRL Instance Document – the instance document does not appear in the Interactive Data File because its XBRL tags are embedded within the Inline XBRL document | ||
101.SCH | Inline XBRL Taxonomy Extension Schema Document | ||
101.CAL | Inline XBRL Taxonomy Extension Calculation Linkbase Document | ||
101.LAB | Inline XBRL Taxonomy Extension Label Linkbase Document | ||
101.PRE | Inline XBRL Taxonomy Extension Presentation Linkbase Document | ||
101.DEF | Inline XBRL Taxonomy Extension Definition Linkbase Document | ||
104 | Cover Page Interactive Data File – the cover page XBRL tags are embedded within the Inline XBRL document (included in Exhibit 101) | ||
183
SIGNATURES
Pursuant to the requirements of Section 13 or 15(d) of the Securities Exchange Act of 1934, the registrant has duly caused this report to be signed on its behalf by the undersigned, thereunto duly authorized.
Date: February 28, 2024 | First Hawaiian, Inc. | |
By: | /s/ Robert S. Harrison | |
Robert S. Harrison | ||
Chairman of the Board, President and Chief Executive Officer | ||
(Principal Executive Officer) |
Pursuant to the requirements of the Securities Exchange Act of 1934, this report has been signed below by the following persons on behalf of the registrant and in the capacities and on the dates indicated.
Date: February 28, 2024 | ||
/s/ Robert S. Harrison | /s/ James M. Moses | |
Robert S. Harrison Chairman of the Board, President and Chief Executive Officer (Principal Executive Officer) | James M. Moses Vice Chairman and Chief Financial Officer | |
/s/ Michael K. Fujimoto | /s/ Faye W. Kurren | |
Michael K. Fujimoto, Director | Faye W. Kurren, Director | |
/s/ James S. Moffatt | /s/ Mark M. Mugiishi | |
James S. Moffatt, Director | Mark M. Mugiishi, Director | |
/s/ Kelly A. Thompson | /s/ Allen B. Uyeda | |
Kelly A. Thompson, Director | Allen B. Uyeda, Director | |
/s/ Vanessa L. Washington | /s/ C. Scott Wo | |
Vanessa L. Washington, Director | C. Scott Wo, Director | |
184