UNITED STATES
SECURITIES AND EXCHANGE COMMISSION
Washington, D. C. 20549
FORM
ANNUAL REPORT PURSUANT TO SECTION 13 OR 15(d) OF THE
SECURITIES EXCHANGE ACT OF 1934
For fiscal year ended
Commission file number:
(Exact name of registrant as specified in its charter) |
| ||
State or other jurisdiction of incorporation or organization |
| I.R.S. Employer Identification No. |
|
|
|
| ||
Address of principal executive offices |
| Zip Code |
(
Registrant’s telephone number, including area code
Securities registered pursuant to Section 12(b) of the Act:
Title of each class | Trading Symbol(s) | Name of each exchange on which registered |
None | ||
Securities registered pursuant to Section 12(g) of the Act:
Indicate by check mark if the registrant is a well-known seasoned issuer, as defined in Rule 405 of the Sarbanes Act. Yes ☐
Indicate by check mark if the registrant is not required to file reports pursuant to Section 13 or Section 15(d) of the Act. Yes ☐
Indicate by check mark whether the registrant (1) has filed all reports required to be filed by Section 13 or 15(d) of the Securities Exchange Act of 1934 during the preceding 12 months (or for such shorter period that the registrant was required to file such reports), and (2) has been subject to such filing requirements for the past 90 days.
Indicate by check mark whether the registrant has submitted electronically every Interactive Data File required to be submitted pursuant to Rule 405 of Regulation S-T (§232.405 of this chapter) during the preceding 12 months (or for such shorter period that the registrant was required to submit such files).
Indicate by check mark whether the registrant is a large accelerated filer, an accelerated filer, a non-accelerated filer, a smaller reporting company, or an emerging growth company. See the definitions of “large accelerated filer,” “accelerated filer,” “smaller reporting company,” and “emerging growth company” in Rule 12b-2 of the Exchange Act.
Large accelerated filer | ☐ | Accelerated filer | ☐ |
☒ | Smaller reporting company | ||
|
| Emerging growth company |
If an emerging growth company, indicate by check mark if the registrant has elected not to use the extended transition period for complying with any new or revised financial accounting standards provided pursuant to Section 13(a) of the Exchange Act. ☐
Indicate by check mark whether the registrant has filed a report on and attestation to its management’s assessment of the effectiveness of its internal control over financial reporting under Section 404(b) of the Sarbanes-Oxley Act (15 U.S.C. 7262(b)) by the registered public accounting firm that prepared or issued its audit report. ☐
If securities are registered pursuant to Section 12(b) of the Act, indicate by check mark whether the financial statements of the registrant included in the filing reflect the correction of an error to previously issued financial statements. ☐
Indicate by check mark whether any of those error corrections are restatements that required a recovery analysis of incentive-based compensation received by any of the registrant’s executive officers during the relevant recovery period pursuant to §240.10D-1(b). ☐
Indicate by check mark whether the registrant is a shell company (as defined in Rule 12b-2 of the Act). Yes
The registrant’s Common Stock is quoted on the OTC Market’s OTCQX tier under the symbol FMBM. The aggregate market value of the 3,035,887 shares of Common Stock of the registrant issued and outstanding held by non-affiliates on June 30, 2023 was approximately $
As of the close of business on March 19, 2024, there were
DOCUMENTS INCORPORATED BY REFERENCE:
Part III: Portions of the Proxy Statement for the Annual Meeting of Shareholders to be held on May 18, 2024, which the registrant plans to file with the Securities and Exchange Commission subsequent to the date hereof.
Table of Contents
| 2 |
| Table of Contents |
PART I
Item 1. Business.
Business
F & M Bank Corp. (the “Company”), incorporated in Virginia in 1983, is a one-bank holding company under the Bank Holding Company Act of 1956 that has elected to become a financial holding company. The Company owns 100% of the outstanding stock of its banking subsidiary, Farmers & Merchants Bank (“Bank”) and VSTitle, LLC (“VST”). VBS Mortgage, LLC (“F&M Mortgage”), and Farmers & Merchants Financial Services, Inc. (“FMFS”) are wholly owned subsidiaries of the Bank. The Company dissolved TEB Life Insurance Company (“TEB”) on November 8, 2023. The Company’s and the Bank’s headquarters are located in Timberville, Virginia, and its primary operations centers are located in the Shenandoah Valley of Virginia.
On April 15, 1908, the Bank was chartered as a state-chartered bank under the laws of the Commonwealth of Virginia. As a commercial bank, the Bank offers a wide range of banking services including commercial and individual demand and time deposit accounts, commercial and individual loans, internet and mobile banking, drive-in banking services, ATMs, as well as a courier service for its commercial banking customers. The Bank makes various types of commercial and consumer loans and has a large portfolio of residential mortgages and indirect auto loans. The local economy is diverse with strong employment in the agricultural, manufacturing, service and governmental sectors.
On February 25, 1993, FMFS was incorporated as a Virginia chartered corporation. FMFS provides brokerage services, and commercial and personal lines of insurance to customers of the Bank.
On November 3, 2008, the Bank acquired a 70% ownership interest in F&M Mortgage. On April 30, 2020, the Bank acquired the remaining 30% interest to have 100% ownership of F&M Mortgage. F&M Mortgage originates both conventional and government agency sponsored mortgages for sale in the secondary market and to be held in the Bank’s mortgage portfolio.
On January 1, 2017, the Company acquired a 76% ownership interest in VST; F&M Mortgage owned the remaining minority interest and, on January 3, 2022, the Company purchased F&M Mortgage’s minority interest in VST to have 100% ownership. VST provides title insurance services to the customers in our market area, including F&M Mortgage and the Bank.
Filings with the SEC
The Company files annual, quarterly and other reports under the Securities Exchange Act of 1934, as amended (the “Exchange Act”) with the Securities and Exchange Commission (“SEC”). The Company’s filings are available through the SEC’s website at www.sec.gov.
Competition
The Bank's offices face strong competition in the markets it serves. The Company competes with large national and regional financial institutions, other independent community banks, nationally chartered savings banks, credit unions, consumer finance companies, mortgage companies, loan production offices, marketplace lenders and other financial technology firms and mutual funds. Competition for loans and deposits is affected by a variety of factors including interest rates, types of products offered, the number and location of branch offices, marketing strategies and the reputation of the Bank within the communities served.
Human Capital
On December 31, 2023, the Bank had 151 full-time equivalent employees. None of the Company’s employees are represented by a union or covered under a collective bargaining agreement. No one employee devotes full-time services to F&M Bank Corp.
As a financial institution, our ability to attract, develop and retain highly qualified employees is critical to our success. We believe our people provide significant value to our Company and its shareholders.
| 3 |
| Table of Contents |
Regulation and Supervision
General. The operations of the Company and the Bank are subject to extensive federal and state laws and regulations, which apply to bank holding companies, financial holding companies and state member banks of the Federal Reserve System. The common stock of the Company is registered pursuant to and subject to the periodic reporting requirements of the Exchange Act. These include, but are not limited to, the filing of annual, quarterly, and other current reports with the SEC. As an Exchange Act reporting company, the Company is directly affected by the Sarbanes-Oxley Act of 2002 (“Sarbanes-Oxley”).
The Company, as a bank holding company and a financial holding company, is subject to the provisions of the Bank Holding Company Act of 1956, as amended (the "Act") and is supervised by the Board of Governors of the Federal Reserve System (the “Federal Reserve Board”). The Act generally requires the Company to secure the prior approval of the Federal Reserve Board before the Company acquires ownership or control of more than 5% of the voting shares or substantially all the assets of another financial institution, including another bank.
As a financial holding company, the Company is required to file with the Federal Reserve Board an annual report and such additional information as it may require pursuant to the Act. The Federal Reserve Board may also conduct examinations of F & M Bank Corp. and any or all of its subsidiaries. Under the Act and the regulations of the Federal Reserve Board, a bank holding company and its subsidiaries are prohibited from engaging in certain tie-in arrangements in connection with an extension of credit, provision of credit, sale or lease of property or furnishing of services.
The permitted activities of a bank holding company are limited to managing or controlling banks, furnishing services to or performing services for its subsidiaries, and engaging in other activities that the Federal Reserve Board determines by regulation or order to be so closely related to banking or managing or controlling banks as to be a proper incident thereto. In addition, bank holding companies that qualify and elect to be financial holding companies, such as the Company, may engage in any activity, or acquire and retain the shares of a company engaged in any activity, that is either (i) financial in nature or incidental to such financial activity (as determined by the Federal Reserve Board in consultation with the Secretary of the Treasury) or (ii) complementary to a financial activity and does not pose a substantial risk to the safety and soundness of depository institutions or the financial system generally (as solely determined by the Federal Reserve Board). Activities that are financial in nature include but are not limited to securities underwriting and dealing, insurance underwriting, and making merchant banking investments. Since 1994, the Company has entered into agreements with the Virginia Community Development Corporation to purchase equity positions in several Low-Income Housing Funds; these funds provide housing for low-income individuals throughout Virginia. Approval of the Federal Reserve Board is necessary to engage in certain of the activities described above or to acquire interests in companies engaging in these activities.
The Bank, as a state member bank, is supervised and regularly examined by the Virginia Bureau of Financial Institutions and the Federal Reserve Board; such supervision and examination by the Virginia Bureau of Financial Institutions and the Federal Reserve Board is intended primarily for the protection of depositors and not the shareholders of the Company.
Payment of Dividends. The Company is a legal entity, separate and distinct from its subsidiaries. A significant portion of the revenues of the Company result from dividends paid to it by the Bank. There are various legal limitations applicable to the payment of dividends by the Bank to the Company. Under the current regulatory guidelines, prior approval from the Federal Reserve Board is required if cash dividends declared in any given year exceed net income for that year, plus retained net profits of the two preceding years. A bank also may not declare a dividend out of or in excess of its net undivided profits without regulatory approval. The payment of dividends by the Bank or the Company may also be limited by other factors, such as requirements to maintain capital above regulatory guidelines.
Bank regulatory agencies have the authority to prohibit the Bank or the Company from engaging in an unsafe or unsound practice in conducting their businesses. The payment of dividends, depending on the financial condition of the Bank, or the Company, could be deemed to constitute such an unsafe or unsound practice. Based on the Bank’s current financial condition, the Company does not expect that any of these laws will have any impact on its ability to obtain dividends from the Bank.
The Company also is subject to regulatory restrictions on payment of dividends to its shareholders. Regulators have indicated that bank holding companies should generally pay dividends only if the organization’s net income available to common shareholders over the past year has been sufficient to fully fund the dividends and the prospective rate of earnings retention appears consistent with the organization’s capital needs, asset quality, and overall financial condition. Further, a bank holding company should inform and consult with the Federal Reserve Board prior to declaring a dividend that exceeds earnings for the period (e.g., quarter) for which the dividend is being paid or that could result in a material adverse change to the organization’s capital structure.
| 4 |
| Table of Contents |
Capital Requirements. The Federal Reserve Board and other federal banking agencies have issued risk-based capital requirements for assessing bank capital adequacy. Virginia chartered banks must also satisfy the capital requirements adopted by the Bureau of Financial Institutions. At December 31, 2023, the "Basel III" capital and leverage ratios were as follows:
Ratio |
| F&M Bank |
|
| Adequately Capitalized |
|
| Minimum Capital Requirements Including Conservation Buffer |
|
| Well Capitalized Under Prompt Corrective Action |
| ||||
Common equity Tier 1 (“CET1”) |
|
| 11.68 | % |
|
| 4.50 | % |
|
| 7.00 | % |
|
| 6.50 | % |
Tier 1 risk-based capital |
|
| 11.68 | % |
|
| 6.00 | % |
|
| 8.50 | % |
|
| 8.00 | % |
Total risk-based capital |
|
| 12.58 | % |
|
| 8.00 | % |
|
| 10.50 | % |
|
| 10.00 | % |
Tier 1 leverage |
|
| 8.13 | % |
|
| 4.00 | % |
|
| 4.00 | % |
|
| 5.00 | % |
An institution will be subject to limitations on paying dividends, engaging in share repurchases, and paying discretionary bonuses if its capital level falls below the buffer amount. These limitations will establish a maximum percentage of eligible retained income that can be utilized for such activities.
The guidelines also provide that banking organizations experiencing internal growth or making acquisitions will be expected to maintain strong capital positions substantially above the minimum supervisory levels, without significant reliance on intangible assets.
In July 2023, the Federal Reserve Board and the FDIC issued proposed rules to implement the final components of the Basel III agreement, often known as the “Basel III endgame.” These proposed rules contain provisions that apply to banks with $100 billion or more in total assets and that will significantly alter how those banks calculate risk-based assets. These proposed rules do not apply to holding companies or banks with less than $100 billion in assets, such as the Company and the Bank, but the final impacts of these rules cannot yet be predicted.
As directed by the Economic Growth, Regulatory Relief and Consumer Protection Act (the “Economic Growth Act”), the federal banking regulators in 2019 jointly issued a final rule that permits qualifying banks that have less than $10 billion in total consolidated assets to elect to be subject to a 9% “community bank leverage ratio” (“CBLR”). A qualifying bank that has chosen the proposed framework would not be required to calculate the existing risk-based and leverage capital requirements and would be considered to have met the capital ratio requirements to be “well capitalized” under prompt corrective action rules, provided it has a community bank leverage ratio greater than 9%. The Bank has elected to not adopt the CBLR framework.
Pursuant to the Federal Reserve’s Small Bank Holding Company and Savings and Loan Holding Company Policy Statement, qualifying bank holding companies with total consolidated assets of less than $3 billion, such as the Company, are not subject to consolidated regulatory capital requirements.
Source of Strength. Federal Reserve Board policy has historically required bank holding companies to act as a source of financial and managerial strength to their subsidiary banks. The Dodd-Frank Act codified this policy as a statutory requirement. Under this requirement, the Company is expected to commit resources to support the Bank, including at times when the Company may not be in a financial position to provide such resources. Any capital loans by a bank holding company to any of its subsidiary banks are subordinate in right of payment to depositors and to certain other indebtedness of such subsidiary banks. In the event of a bank holding company's bankruptcy, any commitment by the bank holding company to a federal bank regulatory agency to maintain the capital of a subsidiary bank will be assumed by the bankruptcy trustee and entitled to priority of payment.
Safety and Soundness. There are a number of obligations and restrictions imposed on bank holding companies and their subsidiary banks by law and regulatory policy that are designed to minimize potential loss to the depositors of such depository institutions and the FDIC insurance fund in the event of a depository institution default. For example, under the Federal Deposit Insurance Corporation Improvement Act of 1991, to avoid receivership of an insured depository institution subsidiary, a bank holding company is required to guarantee the compliance of any subsidiary bank that may become "undercapitalized" with the terms of any capital restoration plan filed by such subsidiary with its appropriate federal bank regulatory agency up to the lesser of (i) an amount equal to 5% of the institution's total assets at the time the institution became undercapitalized or (ii) the amount that is necessary (or would have been necessary) to bring the institution into compliance with all applicable capital standards as of the time the institution fails to comply with such capital restoration plan.
Under the Federal Deposit Insurance Act, the federal bank regulatory agencies have adopted guidelines prescribing safety and soundness standards. These guidelines establish general standards relating to internal controls and information systems, internal audit systems, loan documentation, credit underwriting, interest rate exposure, asset growth and compensation, fees and benefits. In general, the guidelines require, among other things, appropriate systems and practices to identify and manage the risk and exposures specified in the guidelines.
| 5 |
| Table of Contents |
Transactions with Affiliates. Sections 23A and 23B of the Federal Reserve Act and Federal Reserve Regulation W establish parameters for a bank to conduct “covered transactions” with its affiliates, with the objective of limiting risk to the insured bank. Generally, Sections 23A and 23B (i) limit the extent to which the bank or its subsidiaries may engage in “covered transactions” with any one affiliate to an amount equal to 10% of such bank’s capital stock and surplus, and limit the aggregate of all such transactions with all affiliates to an amount equal to 20% of such capital stock and surplus and (ii) require that all such transactions be on terms substantially the same, or at least as favorable, to the bank or subsidiary as those that would be provided to a non-affiliate. The term “covered transaction” includes the making of loans to the affiliate, purchase of assets from the affiliate, issuance of a guaranty on behalf of the affiliate and several other types of transactions.
Under the Dodd-Frank Act, restrictions on transactions with affiliates are enhanced by (i) including among “covered transactions” transactions between bank and affiliate-advised investment funds; (ii) including among “covered transactions” transactions between a bank and an affiliate with respect to securities repurchase agreements and derivatives transactions; (iii) adopting stricter collateral rules; and (iv) imposing tighter restrictions on transactions between banks and their financial subsidiaries.
Transactions with Insiders. The Federal Reserve Act and related regulations impose specific restrictions on loans to directors, executive officers and principal shareholders of banks. Under Section 22(h) of the Federal Reserve Act, loans to a director, an executive officer and to a principal shareholder of a bank, and some affiliated entities of any of the foregoing, may not exceed, together with all other outstanding loans to such person and affiliated entities, the bank’s loan-to-one borrower limit. Loans in the aggregate to insiders and their related interests as a class may not exceed two times the bank’s unimpaired capital and unimpaired surplus until the bank’s total deposits equal or exceed $100,000,000, at which time the aggregate is limited to the bank’s unimpaired capital and unimpaired surplus. Section 22(h) also prohibits loans, above amounts prescribed by the appropriate federal banking agency, to directors, executive officers and principal shareholders of a bank or bank holding company, and their respective affiliates, unless such loan is approved in advance by a majority of the Board of Directors of the bank with any “interested” director not participating in the voting. The FDIC has prescribed the loan amount, which includes all other outstanding loans to such person, as to which such prior board of director approval is required, as being the greater of $25,000 or 5% of capital and surplus (up to $500,000). Section 22(h) requires that loans to directors, executive officers and principal shareholders be made on terms and underwriting standards substantially the same as offered in comparable transactions to other persons.
Limits on Incentive Compensation. The Federal Reserve reviews incentive compensation arrangements of bank holding companies such as the Company as part of the regular, risk-focused supervisory process. The federal banking agencies have also issued guidance designed to help ensure that incentive compensation policies at banking organizations do not encourage excessive risk-taking or undermine the safety and soundness of the banking organizations. The guidance, which covers all employees that have the ability to materially affect the risk profile of an organization, either individually or as part of a group, is based upon the key principles that a banking organization’s incentive compensation arrangements should (i) provide employees incentives that appropriately balance risk and reward and, thus, do not encourage risk-taking beyond the organization’s ability to effectively identify and manage risks, (ii) be compatible with effective internal controls and risk management, and (iii) be supported by strong corporate governance, including active and effective oversight by the organization’s board of directors. Any deficiencies in compensation practices that are identified may be incorporated into the organization’s supervisory ratings, which can affect its ability to make acquisitions or perform other actions. The guidance provides that enforcement actions may be taken against a banking organization if its incentive compensation arrangements or related risk-management control or governance processes pose a risk to the organization’s safety and soundness and the organization is not taking prompt and effective measures to correct the deficiencies.
Anti-Money Laundering Laws and Regulations. The Bank is subject to several federal laws that are designed to combat money laundering, terrorist financing, and transactions with persons, companies or foreign governments designated by U.S. authorities (“AML laws”). This category of laws includes the Bank Secrecy Act of 1970, the Money Laundering Control Act of 1986, the USA PATRIOT Act of 2001, and the Anti-Money Laundering Act of 2020. The Anti-Money Laundering Act of 2020, the most sweeping anti-money laundering legislation in 20 years, requires various federal agencies to promulgate regulations implementing a number of its provisions.
The AML laws and their implementing regulations require insured depository institutions, broker-dealers, and certain other financial institutions to have policies, procedures, and controls to detect, prevent, and report money laundering and terrorist financing. The AML laws and their regulations also provide for information sharing, subject to conditions, between federal law enforcement agencies and financial institutions, as well as among financial institutions, for counter-terrorism purposes. Federal banking regulators are required, when reviewing bank holding company acquisition and bank merger applications, to take into account the effectiveness of the anti-money laundering activities of the applicants. The Company believes it has implemented appropriate internal practices, procedures, and controls to comply with these obligations.
| 6 |
| Table of Contents |
Dodd-Frank Act. The Dodd-Frank Act was signed into law in July 2010. Its wide-ranging provisions affect all federal financial regulatory agencies and nearly every aspect of the American financial services industry. The Dodd-Frank Act created a new agency, the Consumer Financial Protection Bureau (“CFPB”), which has the ability to implement, examine and enforce compliance with federal consumer protection laws, which govern all financial institutions. For smaller financial institutions, such as the Company and the Bank, their primary federal regulators will continue to conduct examination activities.
The Dodd-Frank Act contains provisions designed to reform mortgage lending, which includes the requirement of additional disclosures for consumer mortgages. In addition, the Federal Reserve has issued rules that have the effect of limiting the fees charged to merchants for debit card transactions. These rules limit the amount of interchange fee income available explicitly to larger banks and indirectly to us. The Dodd-Frank Act also contains provisions that affect corporate governance and executive compensation.
In May 2018, the Economic Growth Act was enacted to modify or remove certain regulatory financial reform rules and regulations, including some of those implemented under the Dodd-Frank Act. While the Economic Growth Act maintains most of the regulatory structure established by the Dodd-Frank Act, it amends certain aspects of the regulatory framework for small depository institutions with assets of less than $10 billion, such as the Bank, and for large banks with assets of more than $50 billion.
Among other matters, the Economic Growth Act expands the definition of qualified mortgages which may be held by a financial institution with total consolidated assets of less than $10 billion, exempts community banks from the Volcker Rule, and includes additional regulatory relief regarding regulatory examination cycles, call reports, mortgage disclosures and risk weights for certain high-risk commercial real estate loans.
Consumer Financial Protection. The Bank is subject to federal and state consumer protection laws that extensively govern its relationship with its customers. These laws include the Equal Credit Opportunity Act, the Fair Credit Reporting Act, the Truth in Lending Act, the Truth in Savings Act, the Electronic Fund Transfer Act, the Expedited Funds Availability Act, the Home Mortgage Disclosure Act, the Fair Housing Act, the Real Estate Settlement Procedures Act, the Fair Debt Collection Practices Act, the Service Members Civil Relief Act, laws governing flood insurance, federal and state laws prohibiting unfair and deceptive business practices, foreclosure laws, and various regulations that implement some or all of the foregoing. These laws and regulations mandate certain disclosure requirements and regulate the manner in which financial institutions must deal with customers when taking deposits, making loans, collecting loans and providing other services.
If the Bank fails to comply with these laws and regulations, it may be subject to various penalties. Failure to comply with consumer protection requirements may also result in failure to obtain any required bank regulatory approval for merger or acquisition transactions the Company may wish to pursue or being prohibited from engaging in such transactions even if approval is not required.
On October 19, 2023, the CFPB issued a notice of proposed rulemaking to implement Section 1033 of the Dodd-Frank Act, which requires covered financial institutions to make consumer data about financial services and products more readily available to consumers and authorized third parties. The proposed rule adds consumer protection obligations on financial institutions and third parties authorized by the consumer to collect and use that data. Financial institutions would be responsible for making specified information available through an electronic interface including 24 months of transactional data available, account information (e.g., account balance, upcoming bills, basic account verification), information to initiate payment to and from accounts, and terms and conditions under which the account or card was provided. The comment period for the proposed rule closed at the end of 2023. The CFPB has not announced the timing for issuing the final rule.
On March 30, 2023, the CFPB issued the Small Business Lending Rule, which amends provisions of the Equal Credit Opportunity Act to require covered financial institutions, including the Bank, to collect and report certain data in connection with credit applications made by small businesses, including women- or minority-owned small businesses. The CFPB will create a comprehensive public database of small business lending practices (those with $5 million or less in gross annual revenue for the preceding year) with information aggregated from covered financial institutions. The final rule contains additional requirements beyond small business lending data collection and reporting including that financial institutions restrict access to demographic information about the principals of the small business to an employee involved in making any determination concerning the applicant’s credit application. The CFPB used staggered compliance dates for initiating data collection divided into three tiers depending on the number of covered originations with the first beginning on October 1, 2024. The compliance dates have been delayed while the Supreme Court decides a separate case determining the CFPB’s funding structure. We are working to comply with the provisions of the Small Business Lending Rule to meet the revised compliance dates pending the Supreme Court’s decision.
| 7 |
| Table of Contents |
Community Reinvestment Act. The Community Reinvestment Act (“CRA”) requires depository institutions to assist in meeting the credit needs of their market areas consistent with safe and sound banking practice. Under the CRA, each depository institution is required to help meet the credit needs of its market areas by, among other things, providing credit to low- and moderate-income individuals and communities. Depository institutions are periodically examined for compliance with the CRA and are assigned ratings. Banking regulators consider CRA ratings when considering approval of a proposed transaction. The Bank received a rating of “satisfactory” in its most recent CRA examination.
CRA regulations provide for certain disclosure obligations. Each institution must post a notice advising the public of its right to comment to the institution and its regulator on the institution’s CRA performance and to review the institution’s CRA public file. Each lending institution must maintain for public inspection a file that includes a listing of branch locations and services, a summary of lending activity, a map of its communities and any written comments from the public on its performance in meeting community credit needs. Applicable law requires public disclosure of a financial institution’s written CRA evaluations. This promotes enforcement of CRA requirements by providing the public with the status of a particular institution’s community reinvestment record.
Furthermore, if after becoming a financial holding company and undertaking activities not permissible for a bank holding company, the company fails to continue to meet any of the prerequisites for financial holding company status, the company must enter into an agreement with the Federal Reserve to comply with all applicable capital and management requirements. If the company does not return to compliance within 180 days, the Federal Reserve may order the company to divest its subsidiary banks or the company may discontinue or divest investments in companies engaged in activities permissible only for a bank holding company that has elected to be treated as a financial holding company.
On October 24, 2023, the federal bank regulatory agencies jointly issued a final rule to modernize CRA regulations consistent with the following key goals: (i) to encourage banks to expand access to credit, investment, and banking services in low to moderate income communities; (ii) to adapt to changes in the banking industry, including internet and mobile banking and the growth of non-branch delivery systems; (iii) to provide greater clarity and consistency in the application of the CRA regulations, including adoption of a new metrics-based approach to evaluating bank retail lending and community development financing; and (iv) to tailor CRA evaluations and data collection to bank size and type, recognizing that differences in bank size and business models may impact CRA evaluations and qualifying activities. Most of the final CRA rule’s requirements will be applicable beginning January 1, 2026, with certain requirements, including the data reporting requirements, applicable as of January 1, 2027. The Bank is evaluating the expected impact of the modified CRA regulations.
Cybersecurity. The federal banking agencies have adopted guidelines for establishing information security standards and cybersecurity programs for implementing safeguards under the supervision of a financial institution’s Board of Directors. These guidelines, along with related regulatory materials, increasingly focus on risk management and processes related to information technology and the use of third parties in the provision of financial products and services. The federal banking agencies expect financial institutions to establish lines of defense and ensure that their risk management processes also address the risk posed by compromised customer credentials, and also expect financial institutions to maintain sufficient business continuity planning processes to ensure rapid recovery, resumption and maintenance of the institution’s operations after a cyber-attack. If the Bank fails to meet the expectations set forth in this regulatory guidance, it could be subject to various regulatory actions and any remediation efforts may require significant resources of the Bank.
On November 18, 2021, the federal bank regulatory agencies issued a final rule to improve the sharing of information about cyber incidents that may affect the U.S. banking system. The rule requires a banking organization to notify its primary federal regulator of any significant computer-security incident as soon as possible and no later than 36 hours after the banking organization determines that a cyber incident has occurred. Notification is required for incidents that have materially affected—or are reasonably likely to materially affect—the viability of a banking organization’s operations, its ability to deliver banking products and services, or the stability of the financial sector. In addition, the rule requires a bank service provider to notify affected banking organization customers as soon as possible when the provider determines that it has experienced a computer-security incident that has materially affected or is reasonably likely to materially affect banking organization customers for four or more hours. The rule became effective May 1, 2022. With increased focus on cybersecurity, we are continuing to monitor legislative, regulatory, and supervisory developments related thereto. We had no material cybersecurity incidents in 2023. See “Item 1C. Cybersecurity” for more information.
| 8 |
| Table of Contents |
Future Regulation. Congress may enact legislation from time to time that affects the regulation of the financial services industry, and state legislatures may enact legislation from time to time affecting the regulation of financial institutions chartered by or operating in those states. Federal and state regulatory agencies also periodically propose and adopt changes to their regulations or change the application of existing regulations. The substance or impact of pending or future legislation or regulation, or the application thereof, cannot be predicted, although enactment of the proposed legislation could impact the regulatory structure under which the Company and the Bank operate and may significantly increase costs, impede the efficiency of internal business processes, require an increase in regulatory capital, require modifications to business strategy, and limit the ability to pursue business opportunities in an efficient manner. Management expects that financial institutions will remain heavily regulated, and that additional laws or regulations may be adopted further regulating specific banking practices.
Effect of Governmental Monetary Policies. The Company’s operations are affected not only by general economic conditions but also by the policies of various regulatory authorities. In particular, the Federal Reserve uses monetary policy tools to impact money market and credit market conditions and interest rates to influence general economic conditions. These policies have a significant impact on overall growth and distribution of loans, investments, and deposits; they affect market interest rates charged on loans or paid for deposits and can significantly influence employment and inflation rates. Federal Reserve monetary policies have had a significant effect on the operating results of commercial banks, including the Company, in the past and are expected to do so in the future.
Operating Revenue
The following table displays components that contributed 15% or more of the Company’s total operating revenue for the years ended December 31, 2023 and 2022:
Period |
| Class of Service |
| Percentage of Total Revenues |
December 31, 2023 |
| Interest and fees on loans held for investment |
| 72.14% |
December 31, 2022 |
| Interest and fees on loans held for investment |
| 66.13% |
Executive Officers of the Company
Aubrey Michael (Mike) Wilkerson, 65, has served as Chief Executive Officer of the Company and the Bank since April 2023. Prior to that he served as Executive Vice President/Chief Lending Officer from January 2022 to April 2023, and Executive Vice President/Chief Strategy Officer and Northern Shenandoah Valley Market Executive since January 2021. Mr. Wilkerson began his banking career at Wachovia Bank on January 4, 1982. Mr. Wilkerson’s banking includes experience in Dealer Financial Services, Retail Banking, Private Banking, Commercial Banking and senior strategic leadership positions. From 2012 to 2018, Mr. Wilkerson was the Business Banking Division Executive for Virginia, Maryland and Washington, DC at Wachovia. Most recently, Mr. Wilkerson served as the Commercial Banking Market Executive from 2018 through 2020 for Western Mid-Atlantic Region at Wells Fargo.
Barton E. Black, 53, has served as the Executive Vice President/Chief Operating Officer of the Company and the Bank since June 2020. Prior to that he served as Executive Vice President/Chief Strategy & Risk Officer from March 2019 to May 2020. Prior to joining the Company, he served as Managing Director at Strategic Risk Associates, a financial services consulting company based in Virginia, from August 2012 through February 2019.
Lisa F. Campbell, 56, has served as Executive Vice President/Chief Financial Officer of the Company and the Bank since October 2022. Prior to joining the Company, she served as Group Vice President and Chief Financial Officer for Fidelity Bancshares N.C., Inc. in Fuquay-Varina, North Carolina from August 2014 to October 2022. Previously, she served as Executive Vice President, Chief Operating Officer and Chief Financial Officer for New Century Bancorp, Inc. in Dunn, North Carolina from March 2000 to August 2014 and as Senior Vice President and Controller for Triangle Bancorp, Inc. in Raleigh, North Carolina from September 1997 to March 2000. Ms. Campbell also worked in public accounting from September 1990 through September 1997.
| 9 |
| Table of Contents |
Charles C. Driest, 46, has served as Executive Vice President, Chief Experience Officer since April 2023. Prior to that he served as Senior Vice President, Director of Digital Banking of the Bank and the Company from January 2022 to April 2023. Prior to joining the company, he served as Senior Vice President, Director of Digital Banking at Essex Bank from July 2017 to January 2022. Mr. Driest holds a Master of Business Administration (MBA) – Finance from St. John’s University.
Paul E. Eberly, 42, has served as Executive Vice President/Chief Development Officer since September 2022, Executive Vice President/Chief Credit Officer from September 2020 until September 2022, Senior Vice President/Agricultural & Rural Programs Leader from January 2020 until September 2020, and Vice President/Agricultural & Rural Programs Leader from January 2019 until January 2020. He also served in various sales, lending, credit, risk management and other leadership roles within the Farm Credit System from June 2005 until January 2019. Mr. Eberly has been in the banking and finance industry since 2005.
Melody Emswiler, 50, has served as Executive Vice President/Chief Human Resources Officer since January 2022, Senior Vice President/Human Resources Director from January 2019 to December 2021, Vice President/Director of Human Resources from February 2015 to December 2018, and Assistant Vice President/Human Resources Manager from February 2011 to January 2015. Ms. Emswiler has been in the human resources profession since 1997.
Kevin Russell, 47, has served as the Executive Vice President/President of Mortgage, Title and Financial Services at the Bank and the Company since June 16, 2020. Prior to that he served as the President of F&M Mortgage since 2000.
Jason C. Withers, 41, has served as Executive Vice President/Chief Credit Officer since September 2022, and Senior Vice President/Credit Manager since March 2021. Prior to joining the Company, he served as a Senior Credit Analyst at Blue Ridge Bank, from April 2017 to March 2021, and as a Credit Analyst for CresCom Bank from March 2010 to March 2017.
Item 1A. Risk Factors.
Not required.
Item 1B. Unresolved Staff Comments.
None
Item 1C. Cybersecurity.
Risk Management and Strategy
The Company recognizes the importance of a cybersecurity risk management program designed to assess, identify, and manage risk associated with cybersecurity threats. Our cybersecurity risk management program (the “Program”) is consistent with the Federal Financial Institutions Examination Council (“FFIEC”) Cybersecurity Assessment Tool, which incorporates bank regulatory guidance and principles from the National Institute of Standards and Technology Cybersecurity Framework and includes the following risk-based principles:
· | Identification, measurement, mitigation, monitoring and reporting of cybersecurity threats based on internal and external information sharing and resources; |
· | Safeguards designed to protect against identified threats, including documented policies and procedures, controls, and employee education and awareness; |
· | Processes to detect cybersecurity events and improve incident response, including routine testing of incident response, recovery and business continuity plans and processes; and |
· | Third-party risk management process to manage cybersecurity risk with service providers, suppliers, and vendors. |
The Program is designed to adapt to an evolving landscape of emerging cybersecurity threats and advancing technology to determine the Company’s cybersecurity preparedness. Through routine data gathering, emerging risks, internal incidents, technology investments and internal controls, our Program and overall cybersecurity risk strategy is adjusted as needed.
The Program is supported by regular training of information security employees and awareness training and activities for executives, directors, and employees through which we communicate our cybersecurity policies, standards, processes, and practices to foster a culture of cybersecurity risk management across the Company.
| 10 |
| Table of Contents |
Integrated Risk Management
The Program is integrated into the Company’s enterprise risk management framework and functions to identify risk, form a strategy to manage risk, implement the strategy, test the implementation, and monitor our technology environment to control risk. The information technology team works closely with stakeholders across security, risk, compliance, operations, other business stakeholders, and senior leadership to conduct an annual cybersecurity risk assessment utilizing the FFIEC Cybersecurity Assessment Tool.
Engagement of Third Parties in Connection with Risk Management
The Company engages various third parties to evaluate the effectiveness and maturity of the Program. The Company engages an independent third party to audit the cybersecurity risk strategy and preparedness. The Company also maintains cybersecurity insurance, however, the costs related to cybersecurity threats or disruptions may not be fully insured. The Company also engages third parties to perform regular penetration tests, vulnerability scans, disaster recovery tests and cyber exercises to simulate threat actor attacks. Our relationships with third parties enable us to leverage their cybersecurity expertise and industry knowledge to assess our Program and adjust as needed.
Oversight of Third-party Risks
Our third-party service providers, suppliers, and vendors face their own risks from cybersecurity threats that could impact the Company in certain circumstances. In response, we have implemented processes for overseeing and managing these risks. The processes include limiting the exposure of our information systems to external systems to the least practical amount, assessing the third parties’ information security practices before allowing them to access our information systems or data, requiring third parties to implement appropriate cybersecurity controls in our agreements with them, conducting ongoing monitoring of their compliance with those requirements, and requiring third parties to agree to contractual requirements designed to ensure cybersecurity concepts are appropriately addressed.
Risks from Cybersecurity Threats
As of the date of this report, we have not encountered any risks from cybersecurity threats, including as a result of any previous cybersecurity incidents, that have materially affected or are reasonably likely to materially affect the Company, including its business strategy, results of operations, or financial condition.
Governance
Board of Directors Oversight
Our Board’s Operational Risk Committee oversees cybersecurity risk.
Management's Role in Cybersecurity Risk Management
Given the important role of technology in the Company’s operations and customer service, the Company has established an Information Technology Steering Committee, which consists of our IT Manager, President, Chief Financial Officer, Chief Experience Officer, Director of Risk Management and Information Security Officer. The Information Technology Steering Committee reviews, monitors, aligns, and prioritizes all significant strategic information technology initiatives and security risks. The Information Technology Steering Committee reports to the Operational Risk Committee and minutes of the committee’s meetings are subsequently reported by the Operational Risk Committee to the Company’s Board of Directors. Our IT Manager, in collaboration with our Information Security Officer, makes quarterly reports to the Information Technology Steering Committee. Such reports include updates related to key metrics, key risk indicators, key performance indicators, penetration test results, risk assessment results, project updates, incident reports, compliance matters, and operational issues.
Risk Management Personnel
The Information Security Officer has the primary responsibility for managing the Program to identify, assess, manage, and control cybersecurity risk. The Information Security Officer reports directly to the President. The Information Security Officer has approximately 15 years of experience in cybersecurity, information security risk management, identity and access management, security architecture, vulnerability management, threat intelligence, security operations and incident management and response.
| 11 |
| Table of Contents |
Monitoring Cybersecurity Incidents
The Information Security Officer is continually informed of and monitors cybersecurity risks and incidents. In the event of a cybersecurity incident, the Company has developed an incident response plan to timely report cybersecurity incidents to the executive management team, the Operational Risk Committee and Board of Directors, as necessary. In addition to facilitating timely evaluation, escalation and reporting of cybersecurity incidents, this plan also sets forth the process for identifying and assessing the severity of cybersecurity incidents, as well as monitoring post-incident mitigation and remediation.
Reporting to Board of Directors
The Operational Risk Committee receives reports from the President, Information Security Officer, and Director of Risk Management, and briefings on our information security and enterprise risk management programs at least quarterly, including the results of any external audits, bank regulatory examinations and evaluations, as well as maturity assessments of our information security program.
Item 2. Properties.
The Company owns or leases buildings that are used in the normal course of business. The Company’s corporate headquarters are located at 205 South Main Street, Timberville, Virginia 22853. At December 31, 2023, the Bank operated fourteen branches and a dealer finance division in the Shenandoah Valley of Virginia. See Note 1 “Nature of Banking Activities and Significant Accounting Policies” and Note 5 “Bank Premises and Equipment” and Note 6 "Leases" in the “Notes to the Consolidated Financial Statements” of this Form 10-K for information with respect to the amounts at which bank premises and equipment are carried and commitments under long-term leases.
Item 3. Legal Proceedings.
In the normal course of business, the Company may become involved in litigation arising from banking, financial, or other activities of the Company. Management, after consultation with legal counsel, does not anticipate that the ultimate outcome in such legal proceedings, in the aggregate, will have a material adverse effect on the Company’s business, financial condition, or results of operations.
Item 4. Mine Safety Disclosures.
None.
| 12 |
| Table of Contents |
PART II
Item 5. Market for Registrant’s Common Equity, Related Shareholder Matters and Issuer Purchases of Equity Securities.
Information on Common Stock, Market Prices and Dividends.
The Company’s Common Stock is quoted on the OTC Markets Group’s OTCQX Market under the symbol “FMBM.”
As of March 11, 2024, the Company had approximately 2,583 shareholders of record.
During 2023 and 2022, the Company declared four quarterly dividends of $0.26 per share for an annual total of $1.04 per share. The Company’s Board of Directors determines the payment of dividends based on a number of factors, including the Company’s historic and projected financial condition, liquidity and results of operations, capital levels and needs, tax considerations, any acquisitions or potential acquisitions, statutory and regulatory prohibitions and other limitations, the terms of contractual arrangements that restrict the ability to pay cash dividends, general economic conditions, and other factors deemed relevant by our Board of Directors. The Company is not obligated to pay dividends on its common stock, and is subject to certain regulatory restrictions on paying dividends.
Because the Company is a financial holding company and does not engage directly in business activities of a material nature, the ability to pay dividends to shareholders depends, in large part, upon the receipt of dividends from the Bank, which is also subject to numerous limitations on the payment of dividends under federal banking laws, regulations and policies. Regulatory restrictions on the ability of the Bank to transfer funds to the Company at December 31, 2023 are set forth in Note 20 “Parent Company Financial Information,” of this Form 10-K.
There were no repurchases of the Company's common stock during 2023.
Transfer Agent and Registrar
Broadridge Corporate Issuer Solutions
PO Box 1342
Brentwood, NY 11717
| 13 |
| Table of Contents |
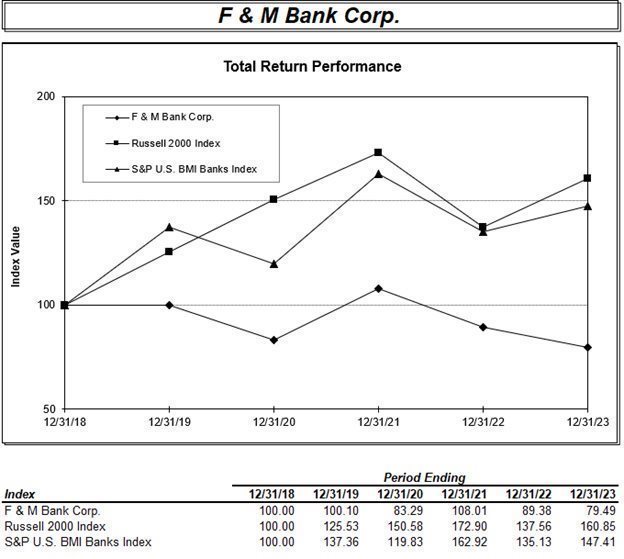
Stock Performance
The following graph compares the cumulative total return to the shareholders of the Company for the last five fiscal years with the total return of the Russell 2000 Index and the S&P U.S. BMI Banks Index, as reported by SNL Financial, LC, assuming an investment of $100 in the Company’s common stock on December 31, 2018, and the reinvestment of dividends.
Item 6. [Reserved]
| 14 |
| Table of Contents |
Item 7. Management’s Discussion and Analysis of Financial Condition and Results of Operations
Forward-Looking Statements
Certain information contained in this report may include “forward-looking statements” within the meaning of Section 27A of the Securities Act of 1933, as amended, and Section 21E of the Exchange Act. These forward-looking statements are generally identified by phrases such as “we expect,” “we believe” or words of similar import. Such forward-looking statements are subject to known and unknown risks including, but not limited to:
· | Changes in the quality or composition of our loan or investment portfolios, including adverse developments in borrower industries, declines in real estate values in our markets, or in the repayment ability of individual borrowers or issuers; |
· | The strength of the economy in our market area, as well as general economic, market, or business conditions; |
· | An insufficient allowance for credit losses as a result of inaccurate assumptions; |
· | Our ability to maintain our “well-capitalized” regulatory status; |
· | Changes in the interest rates affecting our deposits, loans and investment portfolio; |
· | Changes in our competitive position, competitive actions by other financial institutions, financial technology firms and others, the competitive nature of the financial services industry and our ability to compete effectively in our banking markets; |
· | Our ability to manage growth; |
· | Our potential growth, including our entrance or expansion into new markets, the need for sufficient capital to support that growth, difficulties or disruptions expanding into new markets or integrating the operations of acquired branches or business, and the inability to obtain the expected benefits of such growth; |
· | Our exposure to operational risk; |
· | Our ability to raise capital as needed by our business; |
· | Changes in laws, regulations and the policies of federal or state regulators and agencies; |
· | The effect of changes in accounting policies and practices, as may be adopted from time to time by bank regulatory agencies, the SEC, the Public Company Accounting Oversight Board, the FASB, or other accounting standards setting bodies; |
· | Geopolitical conditions, including acts or threats of terrorism, international hostilities, or actions taken by the U.S. or other governments in response to acts or threats of terrorism and/or military conflicts, which could impact business and economic conditions in the U.S. and abroad; |
· | The Company’s potential exposure to fraud, negligence, computer theft, and cyber-crime; |
· | Other factors identified in reports the Company files with the SEC from time to time; and |
· | Other circumstances, many of which are beyond our control. |
Although the Company believes that our expectations with respect to the forward-looking statements are based upon reliable assumptions within the bounds of our knowledge of our business and operations, there can be no assurance that our actual results, performance or achievements will not differ materially from any future results, performance or achievements expressed or implied by such forward-looking statements.
The following discussion provides information about the major components of the results of operations and financial condition, liquidity and capital resources of F&M Bank Corp. and its subsidiaries. This discussion and analysis should be read in conjunction with the Consolidated Financial Statements and the Notes to the Consolidated Financial Statements presented in Item 8, Financial Statements and Supplementary Information, of this Form 10-K.
Lending Policies
Credit Policies
The principal risk associated with each of the segments of loans in our portfolio is the creditworthiness of our borrowers. Within each segment, such risk is increased or decreased, depending on prevailing economic conditions. To manage the risk, the Bank Credit Administration Department supervises that the underwriting process follows the written policies and procedures approved by the Board of Directors. The loan policy gives loan amount approval limits to individual loan officers based on their position and level of experience and to our loan committees based on the size of the lending relationship. The risk associated with real estate and construction loans, commercial loans and consumer loans varies, based on market employment levels, fluctuations in the value of real estate and other conditions that affect the ability of borrowers to repay indebtedness. The risk associated with real estate construction loans varies, based on the supply and demand for the type of real estate under construction.
The Bank has a loan review process to monitor and manage the portfolio, identify concentrations and credit deterioration, establish loss exposure and assess compliance with the loan policy.
The Bank uses a management loan committee and a directors’ loan committee to approve loans. The management loan committee is comprised of members of senior management, credit administration and senior lenders; the directors’ loan committee is comprised of any six directors. Both committees approve new, renewed and or modified loans that exceed officer loan authorities. The directors’ loan committee also reviews any changes to the lending policies, which are then approved by the Board of Directors.
| 15 |
| Table of Contents |
Construction and Development Lending
The Bank makes construction loans, primarily residential, and land acquisition and development loans. The residential construction loans are secured by residential houses under construction and the underlying land for which the loan was obtained. The land acquisition and development loans are secured by the land for which the loan was obtained. The average life of a construction loan is approximately 12 months, and it is typically re-priced as the prime rate of interest changes. Construction lending entails significant additional risks, compared with residential mortgage lending. Construction loans often involve larger loan balances concentrated with single borrowers or groups of related borrowers. Another risk involved in construction lending is attributable to the fact that loan funds are advanced upon the security of the land or home under construction, which value is estimated prior to the completion of construction. Thus, it is more difficult to evaluate accurately the total loan funds required to complete a project and related loan-to-value ratios. To mitigate the risks associated with construction lending, loan amounts are limited to 75% to 90% of appraised value, in addition to analyzing the creditworthiness of the borrower. In addition, a first lien on the property is obtained as security for construction loans and typically requires personal guarantees from the borrower’s principal owners.
Commercial Real Estate Lending
Commercial real estate loans are secured by various types of commercial real estate in our market area, including multi-family residential buildings, commercial buildings and offices, shopping centers and churches. Commercial real estate lending entails significant additional risks, compared with residential mortgage lending. Commercial real estate loans typically involve larger loan balances concentrated with single borrowers or groups of related borrowers. Additionally, the payment experience on loans secured by income producing properties is typically dependent on the successful operation of a business or a real estate project and thus may be subject, to a greater extent, to adverse conditions in the real estate market or in the economy in general. The Bank’s commercial real estate loan underwriting criteria require an examination of debt service coverage ratios and the borrower’s creditworthiness, prior credit history and reputation; as well as an evaluation of the location of the property securing the loan and personal guarantees or endorsements of the borrower’s principal owners.
Commercial & Industry – Non-Real Estate
Business loans generally have a higher degree of risk than residential mortgage loans but have higher yields. To manage these risks, the Bank obtains appropriate collateral and personal guarantees from the borrower’s principal owners and monitors the financial condition of business borrowers. Residential mortgage loans generally are made based on the borrower’s ability to repay from employment and other income and are secured by real estate whose value tends to be readily ascertainable. In contrast, business loans typically are made based on the borrower’s ability to make repayment from cash flow from its business and are secured by business assets, such as real estate, accounts receivable, equipment and inventory. As a result, the availability of funds for the repayment of business loans is substantially dependent on the success of the business itself. Furthermore, the collateral for business loans may depreciate over time and generally cannot be appraised with as much precision as residential real estate.
Consumer Lending
The Bank offers various consumer loans, including personal loans, automobile loans, deposit account loans, installment and demand loans, and home equity loans.
The underwriting standards for consumer loans include a determination of the applicant’s payment history on other debts and an assessment of their ability to meet existing obligations and payments on the proposed loan. The stability of the applicant’s monthly income may be determined by verification of gross monthly income from primary employment and additionally from any verifiable secondary income. Although creditworthiness of the applicant is of primary consideration, the underwriting process also includes an analysis of the value of the security in relation to the proposed loan amount. For home equity lines of credit and loans the Bank requires title insurance, hazard insurance and, if required, flood insurance.
Residential Mortgage Lending
The Bank makes residential mortgage loans for the purchase or refinance of existing loans with loan-to-value limits generally ranging between 80% and 90% depending on the age of the property, the borrower’s income, and the borrower’s credit worthiness. Loans that are retained in our portfolio generally carry adjustable rates that can change every one, three or five years, based on amortization periods of twenty to thirty years.
| 16 |
| Table of Contents |
Loans Held for Sale
The Bank makes fixed rate mortgage loans with terms of typically fifteen or thirty years through its subsidiary F&M Mortgage. These loans are funded by F&M Mortgage utilizing a line of credit at the Bank until sold to investors in the secondary market or transferred to the Bank and held in the loan portfolio.
Dealer Finance Division
The Dealer Finance Division specializes in providing automobile financing through a network of automobile dealers in the Shenandoah Valley.
Critical Accounting Policies
General
The Company’s financial statements are prepared in accordance with accounting principles generally accepted in the United States of America (“GAAP”). The financial information contained within the statements is, to a significant extent, financial information that is based on measures of the financial effects of transactions and events that have already occurred. The Company’s financial position and results of operations are affected by management’s application of accounting policies, including estimates, assumptions and judgments made to arrive at the carrying value of assets and liabilities and amounts reported for revenues, expenses and related disclosures. Different assumptions in the application of these policies could result in material changes in the Company’s consolidated financial position and/or results of operations.
In addition, GAAP itself may change from one previously acceptable method to another method. Although the economics of these transactions would be the same, the timing of events that would impact these transactions could change. Following is a summary of the Company’s significant accounting policies that are highly dependent on estimates, assumptions and judgments.
Allowance for Credit Losses on Loans
The Allowance for Credit Losses on Loans (“ACLL”) represents the estimated balance that management considers adequate to absorb expected credit losses over the expected contractual life of the loan portfolio. The ACLL uses a remaining life methodology for all loans.
Effective January 1, 2023, the Company adopted Accounting Standards Update (“ASU”) 2016-13 Financial Instruments – Credit Losses (Topic 326): Measurement of Credit Losses on Financial Instruments “ASC 326”. This standard replaced the incurred loss methodology with an expected loss methodology that is referred to as the current expected credit loss (“CECL”) methodology.
Determining the appropriateness of the ACLL is complex and requires judgment by management about the effect of matters that are inherently uncertain. Subsequent evaluations of the then-existing loan portfolio, in light of the factors then prevailing, may result in significant changes in the ACLL in future periods. There are both internal factors (i.e., loan balances, credit quality, and the contractual lives of loans) and external factors (i.e., economic conditions such as trends in housing prices, interest rates, gross domestic product, inflation, and unemployment) that can impact the ACLL estimate.
Management considers the national unemployment rate, national gross domestic product, and the core inflation index as external economic variables in developing the ACLL and utilizes economic projections published by The Federal Reserve of St. Louis for reasonable and supportable forecasts. The qualitative estimate of the ACLL is sensitive to these forecasts as economic conditions are the most influential qualitative factor.
| 17 |
| Table of Contents |
Because current economic conditions and forecasts can change and future events are inherently difficult to predict, the anticipated amount of estimated credit losses on loans, and therefore the appropriateness of the ACLL, could change significantly. It is difficult to estimate how potential changes in any one economic factor or input might affect the overall ACLL because we consider a wide variety of factors and inputs in estimating the ACLL and changes in those factors and inputs may not occur at the same rate and may not be consistent across all loan types. Additionally, changes in factors and inputs may be directionally inconsistent, such that an improvement in one factor may offset deterioration in others.
Management reviews the ACLL estimation process regularly for appropriateness as the economic and internal environment are constantly changing. While the ACLL estimate represents our current estimate of expected credit losses, due to uncertainty surrounding internal and external factors, there is potential that the estimate may not be adequate over time to cover credit losses in the portfolio. Although available information is used to estimate expected losses on loans, future changes in the ACLL may be necessary based on changes in portfolio composition, portfolio credit quality, economic conditions and/or other factors.
Fair Value Measurements
Certain assets and liabilities are measured at fair value on a recurring basis, including securities and derivative instruments. Fair value estimates are inherently subjective and involve significant assumptions, adjustments, and judgment including, among others, discount rates, rates of return on assets, cash flows, default rates, loss rates, terminal values and liquidation values. A significant change in assumptions may result in a significant change in fair value, which in turn, may result in a higher degree of financial statement volatility and could result in a significant impact on results of operations, financial condition, or disclosures of fair value information.
Under ASC 820, Fair Value Measurements, there is a three-level fair value hierarchy that requires the use of inputs that are observable or unobservable, when observable inputs are not available. Observable inputs reflect market data obtained from independent sources, while unobservable inputs reflect management’s market assumptions. As such, fair value measurements, particularly in level 2 and level 3 of the hierarchy, may require management to use significant assumptions that are subject to change. A change in one assumption could have a significant impact on the fair value estimate and certain assumptions may have offsetting impacts to one another. Changes in significant assumptions could have a significant impact on the Balance Sheet, Statements of Income, and/or fair value disclosures. For more information on financial instruments and fair value assessment, refer to Note 15 “Fair Value Measurements” in this Form 10-K.
| 18 |
| Table of Contents |
|
| Five Year Summary of Selected Financial Data (Dollars and shares in thousands, except per share data) |
| |||||||||||||||||
|
| 2023 |
|
| 2022 |
|
| 2021 |
|
| 2020 |
|
| 2019 |
| |||||
Income Statement Data: |
|
|
|
|
|
|
|
|
|
|
|
|
|
|
| |||||
Interest and Dividend Income |
| $ | 56,326 |
|
| $ | 42,139 |
|
| $ | 35,576 |
|
| $ | 36,792 |
|
| $ | 38,210 |
|
Interest Expense |
|
| 24,665 |
|
|
| 7,245 |
|
|
| 4,302 |
|
|
| 5,728 |
|
|
| 6,818 |
|
Net Interest Income |
|
| 31,661 |
|
|
| 34,894 |
|
|
| 31,274 |
|
|
| 31,064 |
|
|
| 31,392 |
|
Provision for (Recovery of) Credit Losses |
|
| 1,025 |
|
|
| 866 |
|
|
| (2,821 | ) |
|
| 3,300 |
|
|
| 7,405 |
|
Net Interest Income After Provision for (Recovery of) Credit Losses |
|
| 30,636 |
|
|
| 34,028 |
|
|
| 34,095 |
|
|
| 27,764 |
|
|
| 23,987 |
|
Noninterest Income |
|
| 10,154 |
|
|
| 11,292 |
|
|
| 13,261 |
|
|
| 13,941 |
|
|
| 10,963 |
|
Noninterest Expenses |
|
| 38,765 |
|
|
| 36,522 |
|
|
| 35,295 |
|
|
| 31,670 |
|
|
| 30,561 |
|
Income before income taxes |
|
| 2,025 |
|
|
| 8,798 |
|
|
| 12,061 |
|
|
| 10,035 |
|
|
| 4,389 |
|
Income Tax Expense (Benefit) |
|
| (746 | ) |
|
| 480 |
|
|
| 1,323 |
|
|
| 1,142 |
|
|
| (250 | ) |
Net income attributable to noncontrolling interest |
|
| - |
|
|
| - |
|
|
| - |
|
|
| (105 | ) |
|
| (130 | ) |
Net Income attributable to F & M Bank Corp. |
| $ | 2,771 |
|
| $ | 8,318 |
|
| $ | 10,738 |
|
| $ | 8,788 |
|
| $ | 4,509 |
|
Per Common Share Data: |
|
|
|
|
|
|
|
|
|
|
|
|
|
|
|
|
|
|
|
|
Net Income - basic |
| $ | 0.80 |
|
| $ | 2.41 |
|
| $ | 3.25 |
|
| $ | 2.66 |
|
| $ | 1.32 |
|
Net Income - diluted |
|
| 0.80 |
|
|
| 2.41 |
|
|
| 3.12 |
|
|
| 2.56 |
|
|
| 1.30 |
|
Dividends Declared |
|
| 1.04 |
|
|
| 1.04 |
|
|
| 1.04 |
|
|
| 1.04 |
|
|
| 1.02 |
|
Book Value per Common Share |
|
| 22.47 |
|
|
| 20.48 |
|
|
| 29.42 |
|
|
| 28.43 |
|
|
| 27.11 |
|
Balance Sheet Data: |
|
|
|
|
|
|
|
|
|
|
|
|
|
|
|
|
|
|
|
|
Assets |
| $ | 1,294,596 |
|
| $ | 1,245,902 |
|
| $ | 1,219,342 |
|
| $ | 966,930 |
|
| $ | 813,999 |
|
Loans Held for Investment |
|
| 822,092 |
|
|
| 743,604 |
|
|
| 662,421 |
|
|
| 661,329 |
|
|
| 603,425 |
|
Loans Held for Sale |
|
| 1,119 |
|
|
| 1,373 |
|
|
| 4,887 |
|
|
| 58,679 |
|
|
| 66,798 |
|
Securities |
|
| 379,557 |
|
|
| 403,537 |
|
|
| 413,217 |
|
|
| 117,898 |
|
|
| 18,015 |
|
Deposits |
|
| 1,133,236 |
|
|
| 1,083,377 |
|
|
| 1,080,295 |
|
|
| 818,582 |
|
|
| 641,709 |
|
Short-Term Debt |
|
| 60,000 |
|
|
| 70,000 |
|
|
| - |
|
|
| - |
|
|
| 10,000 |
|
Long-Term Debt |
|
| 6,932 |
|
|
| 6,890 |
|
|
| 21,772 |
|
|
| 33,202 |
|
|
| 53,201 |
|
Shareholders’ Equity |
|
| 78,323 |
|
|
| 70,792 |
|
|
| 100,456 |
|
|
| 95,629 |
|
|
| 91,575 |
|
Average Common Shares Outstanding – basic |
|
| 3,476 |
|
|
| 3,449 |
|
|
| 3,245 |
|
|
| 3,200 |
|
|
| 3,189 |
|
Average Common Shares Outstanding – diluted |
|
| 3,476 |
|
|
| 3,449 |
|
|
| 3,442 |
|
|
| 3,429 |
|
|
| 3,460 |
|
Financial Ratios: |
|
|
|
|
|
|
|
|
|
|
|
|
|
|
|
|
|
|
|
|
Return on Average Assets1 |
|
| 0.22 | % |
|
| 0.67 | % |
|
| 0.98 | % |
|
| 0.95 | % |
|
| 0.57 | % |
Return on Average Equity1 |
|
| 3.85 | % |
|
| 10.48 | % |
|
| 10.84 | % |
|
| 9.46 | % |
|
| 4.93 | % |
Net Interest Margin |
|
| 2.67 | % |
|
| 3.03 | % |
|
| 3.00 | % |
|
| 3.61 | % |
|
| 4.33 | % |
Dividend Payout Ratio - Common |
|
| 131.65 | % |
|
| 43.15 | % |
|
| 32.00 | % |
|
| 39.10 | % |
|
| 77.27 | % |
Capital and Credit Quality Ratios: |
|
|
|
|
|
|
|
|
|
|
|
|
|
|
|
|
|
|
|
|
Average Equity to Average Assets1 |
|
| 5.66 | % |
|
| 6.43 | % |
|
| 9.05 | % |
|
| 10.08 | % |
|
| 11.48 | % |
Allowance for Credit Losses to Loans2 |
|
| 1.01 | % |
|
| 1.07 | % |
|
| 1.17 | % |
|
| 1.58 | % |
|
| 1.39 | % |
Nonperforming Loans to Total Loans3 |
|
| 0.79 | % |
|
| 0.30 | % |
|
| 0.83 | % |
|
| 0.99 | % |
|
| 0.95 | % |
Nonperforming Assets to Total Assets4 |
|
| 0.50 | % |
|
| 0.18 | % |
|
| 0.45 | % |
|
| 0.68 | % |
|
| 0.89 | % |
Net Charge-offs to Total Loans3 |
|
| 0.18 | % |
|
| 0.09 | % |
|
| (0.01 | )% |
|
| 0.18 | % |
|
| 0.71 | % |
1 | Ratios are primarily based on daily average balances. |
2 | Calculated based on Loans Held for Investment, excludes Loans Held for Sale. |
3 | Calculated based on 90 day past due loans and non-accrual loans to Total Loans. |
4 | Calculated based on 90 day past due loans, non-accrual loans and OREO to Total Assets. |
Overview
The Company’s net income for 2023 totaled $2.8 million or $0.79 per common share, a decrease of 66.69% from $8.3 million, or $2.41 per share, in 2022. Return on average equity decreased in 2023 to 3.85% from 10.48% in 2022, and the return on average assets decreased from 0.67% in 2022 to 0.22% in 2023. The Company’s net income per common share totaled $0.79 in 2023, a decrease from $2.41 in 2022.
| 19 |
| Table of Contents |
At year-end 2023, the Company had total assets of $1.29 billion, total loans held for investment of $822.1 million, and total deposits of $1.13 billion, compared to year-end balances for 2022 of total assets of $1.25 billion, total loans held for investment of $743.6 million, and total deposits of $1.08 billion.
Changes in Net Income per Common Share:
|
| From 2022 to 2023 |
|
| From 2021 to 2022 |
| ||
Prior Year Net Income Per Common Share |
| $ | 2.41 |
|
| $ | 3.25 |
|
Change from differences in: |
|
|
|
|
|
|
|
|
Net interest income |
|
| (0.94 | ) |
|
| 1.06 |
|
Provision for credit losses |
|
| (0.05 | ) |
|
| (1.07 | ) |
Noninterest income, excluding securities gains |
|
| 0.42 |
|
|
| (0.91 | ) |
Security gains |
|
| (0.27 | ) |
|
| 0.42 |
|
Noninterest expenses |
|
| (1.11 | ) |
|
| (0.45 | ) |
Income taxes |
|
| 0.35 |
|
|
| 0.24 |
|
Effect of preferred stock dividend |
|
| - |
|
|
| 0.06 |
|
Change in average shares outstanding |
|
| (0.02 | ) |
|
| (0.19 | ) |
Total Change |
|
| (1.62 | ) |
|
| (0.84 | ) |
Net Income Per Common Share |
| $ | 0.79 |
|
| $ | 2.41 |
|
Non-GAAP Financial Measures
This report refers to certain financial measures that are computed under a basis other than GAAP (“non-GAAP”). The Company uses certain non-GAAP financial measures to provide meaningful supplemental information regarding the Company's operating performance and to enhance investors' overall understanding of such financial performance. The methodology for determining these non-GAAP measures may differ among companies and are supplementary to our financial condition, results of operations and cash flows computed in accordance with GAAP. Details on non-GAAP measures follow.
In this discussion and in the tabular analysis of net interest income performance, entitled “Consolidated Average Balances, Yields and Rates,” the interest earned on tax exempt loans and investment securities has been adjusted to reflect the amount that would have been earned had these investments been subject to normal income taxation. This is referred to as tax-equivalent net interest income.
The following table reconciles tax equivalent net interest income, which is not a measurement under GAAP, to net interest income (dollars in thousands):
GAAP Financial Measurements: |
| 2023 |
|
| 2022 |
| ||
Interest Income – Loans |
| $ | 48,045 |
|
| $ | 34,374 |
|
Interest Income - Securities and Other Interest-Earnings Assets |
|
| 8,281 |
|
|
| 7,765 |
|
Interest Expense – Deposits |
|
| 21,177 |
|
|
| 5,735 |
|
Interest Expense - Other Borrowings |
|
| 3,488 |
|
|
| 1,510 |
|
Total Net Interest Income |
|
| 31,661 |
|
|
| 34,894 |
|
|
|
|
|
|
|
|
|
|
Non-GAAP Financial Measurements: |
|
|
|
|
|
|
|
|
Add: Tax Benefit on Tax-Exempt Interest Income – Loans and Securities |
|
| 156 |
|
|
| 143 |
|
Total Tax Benefit on Tax-Exempt Interest Income |
|
| 156 |
|
|
| 143 |
|
Tax-Equivalent Net Interest Income |
| $ | 31,817 |
|
| $ | 35,037 |
|
Net Interest Income and Net Interest Margin
In 2022 and 2023, short term interest rates rose significantly due to eleven Federal Reserve interest rate hikes totaling 525 basis points. This directly impacted the Bank’s cost of deposits and short-term borrowings, while the longer-term rates used to price loans have not increased to the same extent. For the year 2023, tax-equivalent net interest income totaled $31.8 million, a decrease of $3.2 million from 2022, as the $14.2 million increase in interest income was outpaced by a $17.4 million increase in interest expense. These factors also contributed to a 35 basis point decline in Net Interest Margin to 2.67% in 2023 from 3.02% in 2022. Tax-equivalent net income is a non-GAAP measure. See “Non-GAAP Financial Measures” above for additional information.
| 20 |
| Table of Contents |
Interest Income
Tax-equivalent income on earning assets totaled $56.5 million for 2023, an increase of $14.2 million from the prior year. The increase resulted from both a shift in the mix of earning assets and a higher earning asset yield.
Loans held for investment, expressed as a percentage of total earning assets, increased in 2023 to 65.3% as compared to 59.3% in 2022. Average loans held for investment increased by $92.1 million to $778.6 million. Average balances on commercial loans increased 25.01%, real estate loans increased 2.60%, and consumer installment loans increased 15.22%. Meanwhile, average investment securities decreased 9.8%, with average securities outstanding declining from $445.6 million to $402.1 million. Proceeds from bond maturities and paydowns were used to fund new loan originations during 2023.
The taxable-equivalent yield on earning assets increased 109 basis points from 3.65% in 2022 to 4.74% in 2023 due to the rising interest rate environment experienced in 2023. Interest income and fees on loans were $13.7 million higher and income from cash equivalents and securities was $535,000 higher due to higher rates on variable rate loans, interest bearing cash and Federal Funds Sold.
Interest Expense
Interest expense increased $17.4 million or 240.44% during 2023. Higher rates on interest bearing deposits, specifically money market and time deposit accounts, coupled with interest paid on short-term borrowings increased the Bank’s interest expense. The average cost of interest-bearing liabilities was 2.73%, an increase of 187 basis points from 2022 while average balances of interest-bearing liabilities increased $57.3 million or 6.76% during the same period. During 2023, there was a shift in deposits from non-interest bearing demand to interest-bearing deposits and the average balance of interest-bearing deposits rose by $30.1 million to $838.4 million. Interest expense on deposits increased $15.4 million or 269.26% due to the higher balances and an increase of 182 basis points in the cost of interest-bearing deposits to 2.53%. Interest expense was also impacted by an increase of $27.2 million in the average balance of other interest-bearing liabilities. The cost of those liabilities also increased by 140 basis points from 3.88% in 2022 to 5.28% in 2023.
| 21 |
| Table of Contents |
Consolidated Average Balances, Yields and Rates (dollars in thousands)1
|
| 2023 |
|
| 2022 |
| ||||||||||||||||||
|
| Balance |
|
| Interest |
|
| Rate |
|
| Balance |
|
| Interest |
|
| Rate |
| ||||||
ASSETS |
|
|
|
|
|
|
|
|
|
|
|
|
|
|
|
|
|
| ||||||
Loans2 |
|
|
|
|
|
|
|
|
|
|
|
|
|
|
|
|
|
| ||||||
Commercial |
| $ | 318,163 |
|
| $ | 20,852 |
|
|
| 6.55 | % |
| $ | 254,506 |
|
| $ | 12,437 |
|
|
| 4.89 | % |
Real estate |
|
| 303,203 |
|
|
| 16,682 |
|
|
| 5.50 | % |
|
| 295,524 |
|
|
| 13,733 |
|
|
| 4.65 | % |
Consumer |
|
| 157,265 |
|
|
| 10,468 |
|
|
| 6,66 | % |
|
| 136,495 |
|
|
| 8,149 |
|
|
| 5.97 | % |
Loans held for investment4 |
|
| 778,631 |
|
|
| 48,002 |
|
|
| 6.16 | % |
|
| 686,525 |
|
|
| 34,319 |
|
|
| 5.00 | % |
Loans held for sale |
|
| 1,246 |
|
|
| 88 |
|
|
| 7.06 | % |
|
| 3,130 |
|
|
| 106 |
|
|
| 3.39 | % |
|
|
|
|
|
|
|
|
|
|
|
|
|
|
|
|
|
|
|
|
|
|
|
|
|
Investment securities3 |
|
|
|
|
|
|
|
|
|
|
|
|
|
|
|
|
|
|
|
|
|
|
|
|
Taxable |
|
| 386,958 |
|
|
| 7,266 |
|
|
| 1.88 | % |
|
| 433,242 |
|
|
| 7,233 |
|
|
| 1.67 | % |
Tax exempt |
|
| 15,172 |
|
|
| 532 |
|
|
| 3.51 | % |
|
| 12,365 |
|
|
| 434 |
|
|
| 3.51 | % |
Total investment securities |
|
| 402,130 |
|
|
| 7,798 |
|
|
| 1.94 | % |
|
| 445,607 |
|
|
| 7,667 |
|
|
| 1.72 | % |
|
|
|
|
|
|
|
|
|
|
|
|
|
|
|
|
|
|
|
|
|
|
|
|
|
Interest bearing deposits in banks |
|
| 5,202 |
|
|
| 348 |
|
|
| 6.69 | % |
|
| 1,390 |
|
|
| 37 |
|
|
| 2.66 | % |
Federal funds sold |
|
| 4,800 |
|
|
| 246 |
|
|
| 5.13 | % |
|
| 21,763 |
|
|
| 153 |
|
|
| 0.70 | % |
Total Earning Assets |
|
| 1,192,009 |
|
|
| 56,482 |
|
|
| 4.74 | % |
|
| 1,158,415 |
|
|
| 42,282 |
|
|
| 3.65 | % |
|
|
|
|
|
|
|
|
|
|
|
|
|
|
|
|
|
|
|
|
|
|
|
|
|
Allowance for credit losses |
|
| (8,570 | ) |
|
|
|
|
|
|
|
|
|
| (7,677 | ) |
|
|
|
|
|
|
|
|
Nonearning assets |
|
| 86,920 |
|
|
|
|
|
|
|
|
|
|
| 83,604 |
|
|
|
|
|
|
|
|
|
Total Assets |
| $ | 1,270,359 |
|
|
|
|
|
|
|
|
|
| $ | 1,234,342 |
|
|
|
|
|
|
|
|
|
|
|
|
|
|
|
|
|
|
|
|
|
|
|
|
|
|
|
|
|
|
|
|
|
|
LIABILITIES AND SHAREHOLDERS’ EQUITY |
|
|
|
|
|
|
|
|
|
|
|
|
|
|
|
|
|
|
|
|
|
|
|
|
Deposits |
|
|
|
|
|
|
|
|
|
|
|
|
|
|
|
|
|
|
|
|
|
|
|
|
Demand-interest bearing |
| $ | 166,425 |
|
| $ | 3,119 |
|
|
| 1.87 | % |
| $ | 183,882 |
|
| $ | 868 |
|
|
| 0.47 | % |
Savings |
|
| 507,811 |
|
|
| 13,372 |
|
|
| 2.63 | % |
|
| 502,913 |
|
|
| 3,904 |
|
|
| 0.78 | % |
Time deposits |
|
| 164,202 |
|
|
| 4,686 |
|
|
| 2.85 | % |
|
| 121,585 |
|
|
| 963 |
|
|
| 0.79 | % |
Total interest-bearing deposits |
|
| 838,438 |
|
|
| 21,177 |
|
|
| 2.53 | % |
|
| 808,380 |
|
|
| 5,735 |
|
|
| 0.71 | % |
|
|
|
|
|
|
|
|
|
|
|
|
|
|
|
|
|
|
|
|
|
|
|
|
|
Federal funds purchased |
|
| 755 |
|
|
| 42 |
|
|
| 5.56 | % |
|
| 883 |
|
|
| 28 |
|
|
| 3.17 | % |
Short term debt |
|
| 58,430 |
|
|
| 2,987 |
|
|
| 5.11 | % |
|
| 25,241 |
|
|
| 732 |
|
|
| 2.90 | % |
Long-term debt |
|
| 6,912 |
|
|
| 459 |
|
|
| 6.64 | % |
|
| 12,748 |
|
|
| 750 |
|
|
| 5.88 | % |
Total interest-bearing liabilities |
|
| 904,535 |
|
|
| 24,665 |
|
|
| 2.73 | % |
|
| 847,252 |
|
|
| 7,245 |
|
|
| 0.86 | % |
|
|
|
|
|
|
|
|
|
|
|
|
|
|
|
|
|
|
|
|
|
|
|
|
|
Noninterest bearing deposits |
|
| 267,030 |
|
|
|
|
|
|
|
|
|
|
| 292,252 |
|
|
|
|
|
|
|
|
|
Other liabilities |
|
| 26,858 |
|
|
|
|
|
|
|
|
|
|
| 15,457 |
|
|
|
|
|
|
|
|
|
Total liabilities |
|
| 1,198,423 |
|
|
|
|
|
|
|
|
|
|
| 1,154,961 |
|
|
|
|
|
|
|
|
|
Shareholders’ equity |
|
| 71,936 |
|
|
|
|
|
|
|
|
|
|
| 79,381 |
|
|
|
|
|
|
|
|
|
Total liabilities and shareholders’ equity |
| $ | 1,270,359 |
|
|
|
|
|
|
|
|
|
| $ | 1,234,342 |
|
|
|
|
|
|
|
|
|
|
|
|
|
|
|
|
|
|
|
|
|
|
|
|
|
|
|
|
|
|
|
|
|
|
Net interest earnings |
|
|
|
|
| $ | 31,817 |
|
|
|
|
|
|
|
|
|
| $ | 35,037 |
|
|
|
|
|
|
|
|
|
|
|
|
|
|
|
|
|
|
|
|
|
|
|
|
|
|
|
|
|
|
Net yield on interest earning assets (NIM) |
|
|
|
|
|
|
|
|
|
| 2.67 | % |
|
|
|
|
|
|
|
|
|
| 3.02 | % |
1 | Income and yields are presented on a tax-equivalent basis using the applicable federal income tax rate of 21%. |
2 | Interest income on loans includes loan fees. |
3 | Average balance information is reflective of historical cost and has not been adjusted for changes in market value. |
4 | Includes nonaccrual loans. |
| 22 |
| Table of Contents |
Changes in the cost of funds attributable to rate and volume variances are reflected in the following table (dollars in thousands), which illustrates the effect of changes in interest income and interest expense, on a tax equivalent basis, and distinguishes between the changes resulting from the increases or decreases in the outstanding balances of interest-earning assets and interest-bearing liabilities (volume), and the changes resulting from increases or decreases in average interest rates on such assets and liabilities (rate). Changes related to both volume and rate have been allocated proportionally.
|
| 2023 Compared to 2022 |
| |||||||||
|
| Increase (Decrease) |
| |||||||||
|
| Due to Change |
|
| Increase |
| ||||||
|
| in Average: |
|
| Or |
| ||||||
|
| Volume |
|
| Rate |
|
| (Decrease) |
| |||
|
|
|
|
|
|
|
|
|
| |||
Interest income |
|
|
|
|
|
|
|
|
| |||
Loans held for investment |
| $ | 4,605 |
|
| $ | 9,078 |
|
| $ | 13,683 |
|
Loans held for sale |
|
| (64 | ) |
|
| 46 |
|
|
| (18 | ) |
Investment securities: |
|
|
|
|
|
|
|
|
|
|
|
|
Taxable |
|
| (773 | ) |
|
| 806 |
|
|
| 33 |
|
Tax exempt |
|
| 99 |
|
|
| (1 | ) |
|
| 98 |
|
Interest bearing deposits in banks |
|
| 101 |
|
|
| 210 |
|
|
| 311 |
|
Federal funds sold |
|
| (118 | ) |
|
| 211 |
|
|
| 93 |
|
Total Interest Income |
|
| 3,850 |
|
|
| 10,350 |
|
|
| 14,200 |
|
|
|
|
|
|
|
|
|
|
|
|
|
|
Interest expense |
|
|
|
|
|
|
|
|
|
|
|
|
Deposits: |
|
|
|
|
|
|
|
|
|
|
|
|
Demand - interest bearing |
|
| (82 | ) |
|
| 2,333 |
|
|
| 2,251 |
|
Savings |
|
| 38 |
|
|
| 9,430 |
|
|
| 9,468 |
|
Time deposits |
|
| 337 |
|
|
| 3,386 |
|
|
| 3,723 |
|
|
|
|
|
|
|
|
|
|
|
|
|
|
Federal funds purchased |
|
| (4 | ) |
|
| 18 |
|
|
| 14 |
|
Short-term debt |
|
| 962 |
|
|
| 1,293 |
|
|
| 2,255 |
|
Long-term debt |
|
| (343 | ) |
|
| 52 |
|
|
| (291 | ) |
Total Interest Expense |
|
| 908 |
|
|
| 16,512 |
|
|
| 17,420 |
|
Net Interest Income |
| $ | 2,942 |
|
| $ | (6,162 | ) |
| $ | (3,220 | ) |
Noninterest Income
Noninterest income totaled $10.2 million for the year ended December 31, 2023, a decrease of $1.1 million from the year ended December 31, 2022. The primary reasons for this decrease were reductions of $33,000 in service charges on deposit accounts, $1.1 million in mortgage banking income, and $244,000 in title insurance income. The declines in mortgage banking and title insurance income are due to the overall decrease in mortgage banking volume and a shift from loans being sold on the secondary market to portfolio adjustable rate mortgages (ARMs) and construction products. These decreases were partially offset by a $459,000 increase in income from BOLI resulting from a one-time gain received in the second quarter, an increase of $260,000 in investment services and insurance income, higher ATM and check card fees which grew by $174,000, and a $2,000 increase in other operating income. In 2022, there was a $2.9 million loss on the sale of investment securities compared to no loss in 2023. Also in 2022, the Company sold its partnership interest in Infinex Financial Holdings, Inc., resulting in a $3.8 million gain in 2022 and a second smaller milestone gain of $232,000 in December 2023.
Noninterest Expense
Noninterest expenses totaled $38.8 million in 2023, compared to $36.5 million in 2022, an increase of $2.2 million. A primary driver for this increase was the $2.3 million in pre-tax severance expenses related to the early retirement program accrued in the fourth quarter and severance accruals for two former executives earlier in 2023. These accruals contributed to the $1.9 million increase in salary expense to $18.9 million. Other significant year-over-year increases include higher equipment expense which increased $252,000, FDIC Insurance expense which increased $226,000, legal and professional fees which were $85,000 higher than last year, and higher other operating expenses, which were up $853,000. These higher expenses were partially offset by decreases in employee benefits expense and telecommunications and data processing expenses which were down $676,000 and $253,000, respectively, as well as smaller decreases in other expense categories.
| 23 |
| Table of Contents |
Balance Sheet
Total assets increased 3.91% during the year to $1.29 billion at December 31, 2023, an increase of $48.7 million from $1.25 billion at December 31, 2022. The increase was fueled by strong growth in loans held for investment that increased by $78.5 million to $822.1 million. Cash and cash equivalents decreased $11.2 million as excess funds were used to fund loan growth. Investment securities decreased by $24.0 million due to paydowns on U.S. Agency mortgage-backed securities and expected bond maturities that were partially offset by an improvement in the unrealized loss on the bond portfolio. During 2023, the net unrealized loss declined by $11.0 million to $40.2 million from $51.2 million at December 31, 2022.
Total deposits at December 31, 2023, were $1.13 billion, an increase of $49.9 million from the end of 2022, as the Bank was able to attract deposits by offering higher rates on money market and time deposit accounts, and by opening insured cash sweep accounts for new and existing customers. The additional deposits allowed us to reduce Federal Home Loan Bank (FHLB) advances by $10.0 million. At December 31, 2023, 11.60% of the Bank’s total deposits were uninsured.
Shareholders’ Equity increased by $7.5 million to $78.3 million due to net income of $2.8 million and other comprehensive income of $9.0 million, offset by a $1.2 million adjustment to retained earnings upon the adoption of the Current Expected Credit Loss (CECL) accounting standard on January 1, 2023, and dividends to shareholders of $3.6 million. Other comprehensive income includes an $8.7 million improvement in unrealized losses in the bond portfolio and a $318,000 adjustment to the pension liability.
Investment Securities
Total securities decreased $24.0 million or 5.94% in 2023 to $379.6 million at December 31, 2023 from $403.5 million at December 31, 2022. Average balances in investment securities decreased 9.76% in 2023 to $402.1 million. At year end, 33.7% of average earning assets of the Company were held as investment securities compared to 38.5% at year-end 2022. The Company has securities with a par value of $220.8 million and a market value of $196.0 million pledged to the Federal Reserve Discount Window Bank Term Funding Program (“BTFP”) as of December 31, 2023. Additionally, the Company has securities with a par value of $20.0 million and a market value of $19.5 million pledged to the Federal Reserve Discount Window. The BTFP was created in March 2023 to support American businesses and households by making additional funding available to eligible depository institutions to help assure banks have the ability to meet the needs of all their depositors. The Discount Window provides access to funding to help depository institutions manage their liquidity risks. The Bank did not borrow from the BTFP or discount window during 2023.
The Company adopted ASC 326 on January 1, 2023. Management evaluates all investments in an unrealized loss position quarterly. The Company has the intent and the ability to hold securities in the portfolio to maturity and an allowance for credit losses has not been recorded as of December 31, 2023.
Maturities and weighted average yields of securities at December 31, 2023 are presented in the table below (dollars in thousands). Amounts are shown by contractual maturity; expected maturities will differ as issuers may have the right to call or prepay obligations. Maturities of other investments are not readily determinable due to the nature of the investment; see Note 2 “Securities” of this Form 10-K for a description of these investments.
|
| Less |
|
| One to |
|
| Five to |
|
| Over |
|
|
|
|
| ||||||||||||||||||||||||
|
| Than one Year |
|
| Five Years |
|
| Ten Years |
|
| Ten Years |
|
|
|
|
| ||||||||||||||||||||||||
|
| Amount |
|
| Yield1 |
|
| Amount |
|
| Yield1 |
|
| Amount |
|
| Yield1 |
|
| Amount |
|
| Yield1 |
|
| Total |
|
| Yield1 |
| ||||||||||
Securities Available for Sale: |
| |||||||||||||||||||||||||||||||||||||||
U.S. Treasuries |
| $ | 14,629 |
|
|
| 1.15 | % |
| $ | 18,252 |
|
|
| 1.41 | % |
| $ | - |
|
|
| - |
|
| $ | - |
|
|
| - |
|
| $ | 32,881 |
|
|
| 1.29 | % |
U.S. Government sponsored enterprises |
|
| 58,370 |
|
|
| 0.97 | % |
|
| 57,186 |
|
|
| 1.43 | % |
|
| 9,147 |
|
|
| 1.69 | % |
|
| - |
|
|
| - |
|
|
| 124,703 |
|
|
| 1.23 | % |
Securities issued by States & political subdivisions of the U.S. |
|
| 484 |
|
|
| 1.72 | % |
|
| 18,455 |
|
|
| 1.57 | % |
|
| 5,542 |
|
|
| 2.11 | % |
|
| 14,280 |
|
|
| 2.74 | % |
|
| 38,761 |
|
|
| 2.08 | % |
Mortgage-backed obligations of federal agencies |
|
| - |
|
|
| - |
|
|
| 20,749 |
|
|
| 1.38 | % |
|
| 18,145 |
|
|
| 0.41 | % |
|
| 106,179 |
|
|
| 1.91 | % |
|
| 145,073 |
|
|
| 1.65 | % |
Corporate debt securities |
|
| - |
|
|
| - |
|
|
| - |
|
|
| - |
|
|
| 27,256 |
|
|
| 4.08 | % |
|
| - |
|
|
| - |
|
|
| 27,256 |
|
|
| 4.08 | % |
Total |
| $ | 73,483 |
|
|
| 1.01 | % |
| $ | 114,642 |
|
|
| 1.44 | % |
| $ | 60,090 |
|
|
| 2.43 | % |
| $ | 120,459 |
|
|
| 2.01 | % |
| $ | 368,674 |
|
|
| 1.94 | % |
1Tax equivalent yield to the earlier of the call or the maturity date. On securities without a call date, it is the stated yield.
| 24 |
| Table of Contents |
Loan Portfolio
Loans held for investment, net of deferred fees and costs, totaled $822.1 million at December 31, 2023 compared with $743.6 million at December 31, 2022. One-to-four family residential real estate and automobile loans represent the Company’s largest categories at December 31, 2023. The largest areas of growth in 2023 occurred in the farmland, real estate, and automobile portfolios. The Company is committed to solid growth by originating soundly underwritten loans to qualified borrowers. Nearly 73% of the commercial portfolio is comprised of adjustable interest rate loans. When interest rates fluctuate, these loans will reprice accordingly, giving customers an advantage when rates trend down and providing protection for the Bank if rates trend up.
The following table shows the maturity of loans and leases, outstanding as of December 31, 2023 (dollars in thousands):
|
| 1 Year or less |
|
| 1-5 Years |
|
| 5-15 Years |
|
| After 15 Years |
|
| Total |
| |||||
1-4 Family residential construction |
| $ | 18,886 |
|
| $ | 11,252 |
|
| $ | 350 |
|
| $ | - |
|
| $ | 30,488 |
|
Other construction, land development and land |
|
| 22,557 |
|
|
| 14,879 |
|
|
| 10,290 |
|
|
| 23 |
|
|
| 47,749 |
|
Secured by farmland |
|
| 33,540 |
|
|
| 21,886 |
|
|
| 26,231 |
|
|
| - |
|
|
| 81,657 |
|
Home equity – open end |
|
| 45,607 |
|
|
| - |
|
|
| 142 |
|
|
| - |
|
|
| 45,749 |
|
Real Estate |
|
| 23,064 |
|
|
| 88,748 |
|
|
| 85,326 |
|
|
| 3,491 |
|
|
| 200,629 |
|
Home equity – closed end |
|
| 634 |
|
|
| 1,273 |
|
|
| 2,928 |
|
|
| - |
|
|
| 4,835 |
|
Multi-Family |
|
| 1,235 |
|
|
| 4,634 |
|
|
| 2,334 |
|
|
| - |
|
|
| 8,203 |
|
Owner occupied commercial real estate |
|
| 38,376 |
|
|
| 33,975 |
|
|
| 20,011 |
|
|
| - |
|
|
| 92,362 |
|
Other commercial real estate |
|
| 50,279 |
|
|
| 31,919 |
|
|
| 23,983 |
|
|
| - |
|
|
| 106,181 |
|
Agricultural loans |
|
| 8,002 |
|
|
| 3,764 |
|
|
| 2,639 |
|
|
| - |
|
|
| 14,405 |
|
Commercial and industrial |
|
| 20,540 |
|
|
| 11,305 |
|
|
| 12,484 |
|
|
| - |
|
|
| 44,329 |
|
Credit cards |
|
| 3,252 |
|
|
| - |
|
|
| - |
|
|
| - |
|
|
| 3,252 |
|
Automobile loans |
|
| 1,377 |
|
|
| 38,806 |
|
|
| 82,741 |
|
|
| - |
|
|
| 122,924 |
|
Other consumer loans |
|
| 1,415 |
|
|
| 8,780 |
|
|
| 4,181 |
|
|
| - |
|
|
| 14,376 |
|
Municipal loans |
|
| 964 |
|
|
| 1,414 |
|
|
| 3,247 |
|
|
| - |
|
|
| 5,625 |
|
Less: Deferred loan fees, net of costs |
|
| - |
|
|
| - |
|
|
| - |
|
|
| - |
|
|
| (672 | ) |
Total |
| $ | 269,728 |
|
| $ | 272,635 |
|
| $ | 276,887 |
|
| $ | 3,514 |
|
| $ | 822,092 |
|
| 25 |
| Table of Contents |
At December 31, 2023, for loans and leases due after one year, interest rate information is as follows (dollars in thousands):
|
| 1-5 Years |
|
| 5-15 Years |
|
| After 15 Years |
|
| Total |
| ||||
1-4 Family residential construction |
|
|
|
|
|
|
|
|
|
|
|
| ||||
Outstanding with fixed interest rates |
| $ | 11,145 |
|
| $ | - |
|
| $ | - |
|
| $ | 11,145 |
|
Outstanding with adjustable rates |
|
| 107 |
|
|
| 350 |
|
|
| - |
|
|
| 457 |
|
Total 1-4 Family residential construction |
|
| 11,252 |
|
|
| 350 |
|
|
| - |
|
|
| 11,602 |
|
Other construction, land development and land |
|
|
|
|
|
|
|
|
|
|
|
|
|
|
|
|
Outstanding with fixed interest rates |
| $ | 6,601 |
|
| $ | 2,750 |
|
| $ | 23 |
|
| $ | 9,374 |
|
Outstanding with adjustable rates |
|
| 8,278 |
|
|
| 7,540 |
|
|
| - |
|
|
| 15,818 |
|
Total Other construction, land development & land |
|
| 14,879 |
|
|
| 10,290 |
|
|
| 23 |
|
|
| 25,192 |
|
Secured by farmland |
|
|
|
|
|
|
|
|
|
|
|
|
|
|
|
|
Outstanding with fixed interest rates |
| $ | 154 |
|
| $ | 6,582 |
|
| $ | - |
|
| $ | 6,736 |
|
Outstanding with adjustable rates |
|
| 21,732 |
|
|
| 19,649 |
|
|
| - |
|
|
| 41,381 |
|
Total Secured by farmland |
|
| 21,886 |
|
|
| 26,231 |
|
|
| - |
|
|
| 48,117 |
|
Home Equity – open end |
|
|
|
|
|
|
|
|
|
|
|
|
|
|
|
|
Outstanding with fixed interest rates |
| $ | - |
|
| $ | - |
|
| $ | - |
|
| $ | - |
|
Outstanding with adjustable rates |
|
| - |
|
|
| 142 |
|
|
| - |
|
|
| 142 |
|
Total Home Equity – open end |
|
| - |
|
|
| 142 |
|
|
| - |
|
|
| 142 |
|
Real estate |
|
|
|
|
|
|
|
|
|
|
|
|
|
|
|
|
Outstanding with fixed interest rates |
| $ | 862 |
|
| $ | 1,264 |
|
| $ | 3,491 |
|
| $ | 5,617 |
|
Outstanding with adjustable rates |
|
| 87,886 |
|
|
| 84,062 |
|
|
| - |
|
|
| 171,948 |
|
Total Real estate |
|
| 88,748 |
|
|
| 85,326 |
|
|
| 3,491 |
|
|
| 177,565 |
|
Home Equity – closed end |
|
|
|
|
|
|
|
|
|
|
|
|
|
|
|
|
Outstanding with fixed interest rates |
| $ | 123 |
|
| $ | 2,292 |
|
| $ | - |
|
| $ | 2,415 |
|
Outstanding with adjustable rates |
|
| 1,150 |
|
|
| 636 |
|
|
| - |
|
|
| 1,786 |
|
Total Home Equity – closed end |
|
| 1,273 |
|
|
| 2,928 |
|
|
| - |
|
|
| 4,201 |
|
Multifamily |
|
|
|
|
|
|
|
|
|
|
|
|
|
|
|
|
Outstanding with fixed interest rates |
| $ | - |
|
| $ | - |
|
| $ | - |
|
| $ | - |
|
Outstanding with adjustable rates |
|
| 4,634 |
|
|
| 2,334 |
|
|
| - |
|
|
| 6,968 |
|
Total Multifamily |
|
| 4,634 |
|
|
| 2,334 |
|
|
| - |
|
|
| 6,968 |
|
Owner-occupied commercial real estate |
|
|
|
|
|
|
|
|
|
|
|
|
|
|
|
|
Outstanding with fixed interest rates |
| $ | 431 |
|
| $ | 5,581 |
|
| $ | - |
|
| $ | 6,012 |
|
Outstanding with adjustable rates |
|
| 33,544 |
|
|
| 14,430 |
|
|
| - |
|
|
| 47,974 |
|
Total Owner-occupied commercial real estate |
|
| 33,975 |
|
|
| 20,011 |
|
|
| - |
|
|
| 53,986 |
|
Other commercial real estate |
|
|
|
|
|
|
|
|
|
|
|
|
|
|
|
|
Outstanding with fixed interest rates |
| $ | - |
|
| $ | 5,391 |
|
| $ | - |
|
| $ | 5,391 |
|
Outstanding with adjustable rates |
|
| 31,919 |
|
|
| 18,592 |
|
|
| - |
|
|
| 50,511 |
|
Total Other commercial real estate |
|
| 31,919 |
|
|
| 23,983 |
|
|
| - |
|
|
| 55,902 |
|
Agricultural loans |
|
|
|
|
|
|
|
|
|
|
|
|
|
|
|
|
Outstanding with fixed interest rates |
| $ | 3,597 |
|
| $ | 2,399 |
|
| $ | - |
|
| $ | 5,996 |
|
Outstanding with adjustable rates |
|
| 167 |
|
|
| 240 |
|
|
| - |
|
|
| 407 |
|
Total Agricultural loans |
|
| 3,764 |
|
|
| 2,639 |
|
|
| - |
|
|
| 6,403 |
|
Commercial and industrial |
|
|
|
|
|
|
|
|
|
|
|
|
|
|
|
|
Outstanding with fixed interest rates |
| $ | 9,975 |
|
| $ | 12,014 |
|
| $ | - |
|
| $ | 21,989 |
|
Outstanding with adjustable rates |
|
| 1,330 |
|
|
| 470 |
|
|
| - |
|
|
| 1,800 |
|
Total Commercial and industrial |
|
| 11,305 |
|
|
| 12,484 |
|
|
| - |
|
|
| 23,789 |
|
Automobile loans |
|
|
|
|
|
|
|
|
|
|
|
|
|
|
|
|
Outstanding with fixed interest rates |
| $ | 38,806 |
|
| $ | 82,741 |
|
| $ | - |
|
| $ | 121,547 |
|
Outstanding with adjustable rates |
|
| - |
|
|
| - |
|
|
| - |
|
|
| - |
|
Total Automobile loans |
|
| 38,806 |
|
|
| 82,741 |
|
|
| - |
|
|
| 121,547 |
|
Other consumer loans |
|
|
|
|
|
|
|
|
|
|
|
|
|
|
|
|
Outstanding with fixed interest rates |
| $ | 8,768 |
|
| $ | 4,181 |
|
| $ | - |
|
| $ | 12,949 |
|
Outstanding with adjustable rates |
|
| 12 |
|
|
| - |
|
|
| - |
|
|
| 12 |
|
Total Other consumer loans |
|
| 8,780 |
|
|
| 4,181 |
|
|
| - |
|
|
| 12,961 |
|
Municipal loans |
|
|
|
|
|
|
|
|
|
|
|
|
|
|
|
|
Outstanding with fixed interest rates |
| $ | 840 |
|
| $ | 923 |
|
| $ | - |
|
| $ | 1,763 |
|
Outstanding with adjustable rates |
|
| 574 |
|
|
| 2,324 |
|
|
| - |
|
|
| 2,898 |
|
Total Municipal loans |
|
| 1,414 |
|
|
| 3,247 |
|
|
| - |
|
|
| 4,461 |
|
Total outstanding with fixed interest rates |
| $ | 81,302 |
|
| $ | 126,118 |
|
| $ | 3,514 |
|
| $ | 210,934 |
|
Total outstanding with adjustable interest rates |
| $ | 191,333 |
|
| $ | 150,769 |
|
| $ | - |
|
| $ | 342,102 |
|
Total |
| $ | 272,635 |
|
| $ | 276,887 |
|
| $ | 3,514 |
|
| $ | 553,036 |
|
| 26 |
| Table of Contents |
Asset Quality
Management evaluates the loan portfolio considering national and local economic trends, changes in the nature and volume of the portfolio, changes in underlying collateral values and trends in past due, nonperforming and criticized loans. Loans past due 30-89 days and on accrual increased, while loans greater than 90 days and on accrual decreased.
Nonperforming Loans and Past Due Loans
At December 31, 2023, the Company experienced an increase of $4.3 million in nonperforming assets compared to December 31, 2022. The increase is primarily due to two commercial loans to one borrower. Approximately 85.15% of the nonperforming assets are secured by real estate and 63% have an allowance for credit losses. The Bank believes that adequate reserves have been established on nonperforming loans and continues to actively work with its customers to effect payment. As of December 31, 2023, the Company holds $55,000 of real estate acquired through foreclosure; no real estate acquired through foreclosure was held on December 31, 2022.
Past due loans on accrual increased from $5.6 million at December 31, 2022 to $7.7 million at December 31, 2023. Of the $7.7 million total past due loans still accruing interest, $31,000 or 0.004% of the total loans held for investment were loans past due 90 days or more at December 31, 2023, compared to $38,000 or 0.005% at December 31, 2022.
A summary of credit ratios for nonaccrual loans is as follows (dollars in thousands):
|
| 2023 |
|
| 2022 |
| ||
Allowance for credit losses |
| $ | 8,321 |
|
| $ | 7,936 |
|
Nonaccrual loans |
| $ | 6,438 |
|
| $ | 2,224 |
|
Nonperforming loans |
| $ | 6,469 |
|
| $ | 2,262 |
|
Nonperforming assets |
| $ | 6,524 |
|
| $ | 2,262 |
|
Total Loans |
| $ | 822,092 |
|
| $ | 743,604 |
|
|
|
|
|
|
|
|
|
|
Allowance for loan losses to Total Loans |
|
| 1.01 | % |
|
| 1.07 | % |
Nonaccrual Loans to Total Loans |
|
| 0.78 | % |
|
| 0.30 | % |
Allowance for loan losses to Nonaccrual loans |
|
| 129.25 | % |
|
| 356.83 | % |
Net Charge-offs
For the year ended December 31, 2023, net charge-offs of loans totaled $1.5 million or 0.18% of loans held for investment, compared to net charge-offs of $678,000 or 0.09% for the year ended December 31, 2022. Charge-offs occur primarily in the automobile loan segment of the portfolio. The following table summarizes the net charge-off activity by loan segment for the years ended December 31, 2023 and 2022, (dollars in thousands). Under adoption of ASC 326, there were changes to certain loan segments to better differentiate credit characteristics and align with our ACL model, see Note 3 “Loans and Credit Quality” for additional information.
As of December 31, 2023 |
| Charge-offs |
|
| Recoveries |
|
| Net Charge-offs |
|
| Net charge-offs to average loans |
| ||||
1-4 Family residential construction |
| $ | (70 | ) |
| $ | 1 |
|
| $ | (69 | ) |
|
| -0.21 | % |
Other construction, land development and land |
|
| - |
|
|
| - |
|
|
| - |
|
|
| - |
|
Secured by farmland |
|
| - |
|
|
| - |
|
|
| - |
|
|
| - |
|
Home equity – open end |
|
| - |
|
|
| 3 |
|
|
| 3 |
|
|
| 0.01 | % |
Real estate |
|
| (19 | ) |
|
| 2 |
|
|
| (17 | ) |
|
| -0.01 | % |
Home Equity – closed end |
|
| - |
|
|
| - |
|
|
| - |
|
|
| - |
|
Multifamily |
|
| - |
|
|
| - |
|
|
| - |
|
|
| - |
|
Owner-occupied commercial real estate |
|
| - |
|
|
| - |
|
|
| - |
|
|
| - |
|
Other commercial real estate |
|
| - |
|
|
| - |
|
|
| - |
|
|
| - |
|
Agricultural loans |
|
| - |
|
|
| - |
|
|
| - |
|
|
| - |
|
Commercial and industrial |
|
| (33 | ) |
|
| 2 |
|
|
| (31 | ) |
|
| -0.07 | % |
Credit Cards |
|
| (69 | ) |
|
| 37 |
|
|
| (32 | ) |
|
| -0.97 | % |
Automobile loans |
|
| (1,804 | ) |
|
| 514 |
|
|
| (1,290 | ) |
|
| -1.04 | % |
Other consumer loans |
|
| (93 | ) |
|
| 55 |
|
|
| (38 | ) |
|
| -0.26 | % |
Municipal loans |
|
| - |
|
|
| - |
|
|
| - |
|
|
| - |
|
Total |
| $ | (2,088 | ) |
| $ | 614 |
|
| $ | (1,474 | ) |
|
| -0.19 | % |
| 27 |
| Table of Contents |
As of December 31, 2022 |
| Charge-offs |
|
| Recoveries |
|
| Net Charge-offs |
|
| Net charge-offs to average loans |
| ||||
Construction/Land Development |
| $ | - |
|
| $ | - |
|
| $ | - |
|
|
| - |
|
Farmland |
|
| - |
|
|
| - |
|
|
| - |
|
|
| - |
|
Real Estate |
|
| (17 | ) |
|
| - |
|
|
| (17 | ) |
|
| -0.01 | % |
Multi-Family |
|
| - |
|
|
| - |
|
|
| - |
|
|
| - |
|
Commercial Real Estate |
|
| - |
|
|
| - |
|
|
| - |
|
|
| - |
|
Home Equity – closed end |
|
| - |
|
|
| - |
|
|
| - |
|
|
| - |
|
Home Equity – open end |
|
| (84 | ) |
|
| 130 |
|
|
| 46 |
|
|
| 0.10 | % |
Commercial & Industrial – Non-Real Estate |
|
| (46 | ) |
|
| 49 |
|
|
| 3 |
|
|
| 0.01 | % |
Consumer |
|
| (153 | ) |
|
| 84 |
|
|
| (69 | ) |
|
| -1.07 | % |
Dealer Finance |
|
| (1,280 | ) |
|
| 691 |
|
|
| (589 | ) |
|
| -0.48 | % |
Credit Cards |
|
| (66 | ) |
|
| 14 |
|
|
| (52 | ) |
|
| -1.62 | % |
Total |
| $ | (1,646 | ) |
| $ | 968 |
|
| $ | (678 | ) |
|
| -0.10 | % |
Allowance and Provision for Credit Losses
At December 31, 2023, the allowance for credit losses was $8.3 million or 1.01% of total loans held for investment, compared to an allowance of $7.9 million or 1.07% of total loans at December 31, 2022. At December 31, 2023, the allowance for credit losses on loans (“ACLL”) reflected a day one CECL impact of $777,000 which was charged to retained earnings net of taxes, $1.5 million in net charge-offs, and a provision for credit losses on loans of $1.1 million. The provision was primarily due to loan growth of $78.5 million and charge-offs in the automobile portfolio. Additionally, the provision for credit losses includes a recovery of $57,000 on the reserve for unfunded commitments. The provision for credit losses on loans and for unfunded commitments net together as reflected in the provision for credit losses on the consolidated statements of income for a provision of $1.0 million.
The following table summarizes the ACLL by loan segment and percentage of the loan portfolio that the related ALLL covers as of December 31, 2023 and 2022, (dollars in thousands):
As of December 31, 2023 |
| ACLL by Segment |
|
| Segment as a % of Total Loans |
| ||
1-4 Family residential construction |
| $ | 714 |
|
|
| 3.71 | % |
Other construction, land development and land |
|
| 1,287 |
|
|
| 5.80 | % |
Secured by farmland |
|
| 815 |
|
|
| 9.92 | % |
Home equity – open end |
|
| 180 |
|
|
| 5.56 | % |
Real estate |
|
| 810 |
|
|
| 24.39 | % |
Home Equity – closed end |
|
| 77 |
|
|
| 0.59 | % |
Multifamily |
|
| 181 |
|
|
| 1.00 | % |
Owner-occupied commercial real estate |
|
| 1,221 |
|
|
| 11.23 | % |
Other commercial real estate |
|
| 166 |
|
|
| 12.90 | % |
Agricultural loans |
|
| 20 |
|
|
| 1.75 | % |
Commercial and industrial |
|
| 1,034 |
|
|
| 5.39 | % |
Credit Cards |
|
| 81 |
|
|
| 0.40 | % |
Automobile loans |
|
| 1,443 |
|
|
| 14.94 | % |
Other consumer loans |
|
| 292 |
|
|
| 1.75 | % |
Municipal loans |
|
| - |
|
|
| 0.68 | % |
Total |
| $ | 8,321 |
|
|
| 100 | % |
| 28 |
| Table of Contents |
As of December 31, 2022 |
| ACLL by Segment |
|
| Segment as a % of Total Loans |
| ||
Construction/Land Development |
| $ | 790 |
|
|
| 9.23 | % |
Farmland |
|
| 570 |
|
|
| 9.99 | % |
Real Estate |
|
| 1,296 |
|
|
| 20.60 | % |
Multi-Family |
|
| 71 |
|
|
| 1.29 | % |
Commercial Real Estate |
|
| 2,004 |
|
|
| 26.23 | % |
Home Equity – closed end |
|
| 38 |
|
|
| 0.63 | % |
Home Equity – open end |
|
| 445 |
|
|
| 6.31 | % |
Commercial & Industrial – Non-Real Estate |
|
| 450 |
|
|
| 7.61 | % |
Consumer |
|
| 81 |
|
|
| 0.87 | % |
Dealer Finance |
|
| 1,779 |
|
|
| 16.81 | % |
Credit Cards |
|
| 68 |
|
|
| 0.44 | % |
Total |
| $ | 7,592 |
|
|
| 100.00 | % |
See “Critical Accounting Policies” on page 15, Note 1 “Nature of Banking Activities and Significant Accounting Policies” of this Form 10-K for an overview of the methodology management employs on a quarterly basis to assess the adequacy of the allowance and the provisions charged to expense. See Note 4 “Allowance for Credit Losses” of this Form 10-K for a summary of the activity in the allowance for credit losses for years ended December 31, 2023 and 2022.
Deposits
Core deposits are the Company’s primary source of funding. Demand deposits, money market accounts, savings accounts, and time deposits provide a source of fee income and opportunities to build customer relationships.
The following table shows the composition of deposits as of December 31, 2023 and 2022 (dollars in thousands):
|
| December 31, 2023 |
|
| December 31, 2022 |
| ||||||||||
|
| Balance |
|
| % of total deposits |
|
| Balance |
|
| % of total deposits |
| ||||
Noninterest-bearing demand |
| $ | 264,254 |
|
|
| 23.3 | % |
| $ | 293,596 |
|
|
| 27.1 | % |
Interest Checking |
|
| 153,308 |
|
|
| 13.5 | % |
|
| 176,677 |
|
|
| 16.3 | % |
Savings Accounts |
|
| 501,151 |
|
|
| 44.2 | % |
|
| 493,912 |
|
|
| 45.6 | % |
Time Deposits |
|
| 214,523 |
|
|
| 18.9 | % |
|
| 119,192 |
|
|
| 11.0 | % |
Total deposits |
| $ | 1,133,236 |
|
|
|
|
|
| $ | 1,083,377 |
|
|
|
|
|
As market rates and competition for deposits increased in 2023, total deposits increased $50.0 million due to attractive rates on money market and time deposit accounts and offering insured cash sweep accounts for new and existing customers. Noninterest-bearing demand deposits decreased by $29.3 million as customers moved funds into interest bearing savings and time deposit accounts.
The average deposit balances and average rates paid for 2023 and 2022 were as follows (dollars in thousands):
|
| December 31, 2023 |
|
| December 31, 2022 |
| ||||||||||
|
| Average Balance |
|
| Rate |
|
| Average Balance |
|
| Rate |
| ||||
Noninterest-bearing |
| $ | 267,030 |
|
|
| - |
|
| $ | 292,252 |
|
|
| - |
|
Interest-bearing: |
|
|
|
|
|
|
|
|
|
|
|
|
|
|
|
|
Interest Checking |
| $ | 166,425 |
|
|
| 1.87 | % |
| $ | 183,882 |
|
|
| 0.47 | % |
Savings Accounts |
|
| 507,811 |
|
|
| 2.63 | % |
|
| 502,913 |
|
|
| 0.78 | % |
Time Deposits |
|
| 164,202 |
|
|
| 2.85 | % |
|
| 121,585 |
|
|
| 0.79 | % |
Total interest-bearing deposits |
|
| 838,438 |
|
|
| 2.53 | % |
|
| 808,380 |
|
|
| 0.71 | % |
Total average deposits |
| $ | 1,105,468 |
|
|
| 1.92 | % |
| $ | 1,100,632 |
|
|
| 0.64 | % |
| 29 |
| Table of Contents |
The maturity distribution of time deposits of $250 thousand or greater outstanding at December 31, 2023 and 2022 are summarized as follows (dollars in thousands):
|
| 2023 |
|
| 2022 |
| ||
Maturing in: |
|
|
|
|
|
| ||
3 months or less |
| $ | 1,168 |
|
| $ | - |
|
Over 3 months through 6 months |
|
| 20,984 |
|
|
| 592 |
|
Over 6 months through 12 months |
|
| 9,732 |
|
|
| 8,553 |
|
Over 12 months |
|
| 5,922 |
|
|
| 3,523 |
|
|
| $ | 37,806 |
|
| $ | 12,668 |
|
Total uninsured deposits in excess of $250 thousand were $131.9 million and $157.4 million at December 31, 2023 and 2022, respectively.
Borrowings
Short-term debt totaled $60.0 million at December 31, 2023, and consisted of Federal Home Loan Bank (“FHLB”) advances which were used to fund loan growth. Long-term debt remained at $6.9 million from December 31, 2022 to December 31, 2023 and consists solely of subordinated debt. See Note 9 “Short-Term Debt” and Note 10 “Long-Term Debt” in this Form 10-K for a discussion of the rates, terms, and conversion features on these advances.
Shareholders’ Equity
Total Shareholders’ Equity increased by $7.5 million to $78.3 million due to net income of $2.8 million and other comprehensive income of $9.0 million, offset by dividends to shareholders of $3.6 million. Other comprehensive income includes $8.7 million improvement in unrealized losses in the bond portfolio and a $318,000 adjustment to the pension liability.
Market Risk Management
Market risk is the sensitivity of a financial institution’s earnings or the economic value of its capital to adverse changes in interest rates, exchange rates, and equity prices. The Company’s primary component of market risk is interest rate volatility. Interest rate fluctuations impact the amount of interest income and expense the Bank pays or receives on the majority of its assets. Rapid changes in short-term interest rates may lead to volatility in net interest income resulting in additional interest rate risk to the extent that imbalances exist between the maturities or repricing of interest-bearing liabilities and interest earning assets.
The Company manages interest rate risk through an asset and liability committee (“ALCO”) composed of members of its Board of Directors and executive management. The ALCO is responsible for monitoring and managing the Company’s interest rate risk and establishing policies to monitor and limit exposure to this risk. The Company’s Board of Directors reviews and approves the guidelines established by ALCO.
Management uses simulation analysis to measure the sensitivity of net interest income to changes in interest rates. The model calculates an earnings estimate based on current and projected balances and rates. This method is subject to the accuracy of the assumptions that underlie the process, but it provides an additional analysis of the sensitivity of the earnings to changes in interest rates to static gap analysis. Assumptions used in the model rates are derived from historical trends, peer analysis, and management’s outlook, and include loans and deposit growth rates and projected yields and rates. All maturities, calls, and prepayments in the securities portfolio are assumed to be reinvested in like instruments. Mortgage loans and mortgage-backed securities prepayment assumptions are based on industry estimates of prepayment speeds for portfolios with similar coupon ranges and seasoning. Different interest rate scenarios and yield curves are used to measure the sensitivity of earnings to changing interest rates. Interest rates on different assets and liability accounts move differently when the prime rate changes and is reflected in different rate scenarios.
| 30 |
| Table of Contents |
The following table represents interest rate sensitivity on the Company’s net interest income using different rate scenarios:
Change in Prime Rate |
| % Change in Net Interest Income |
| |
+ 400 basis points |
|
| -20.32 | % |
+ 300 basis points |
|
| -13.64 | % |
+ 200 basis points |
|
| -8.51 | % |
+ 100 basis points |
|
| -3.82 | % |
- 100 basis points |
|
| 3.21 | % |
-200 basis points |
|
| 7.43 | % |
-300 basis points |
|
| 11.19 | % |
-400 basis points |
|
| 10.60 | % |
Economic value simulation is used to calculate the estimated fair value of assets and liabilities over different interest rate environments. Market values are calculated based on discounted cash flow analysis. The net economic value is the market value of all assets minus the market value of all liabilities. The change in net economic value over different rate environments is an indication of the longer- term repricing risk in the balance sheet. The same assumptions are used in the market value simulation as in the earnings simulation.
The following table reflects the change in net economic value over different rate environments:
Change in Prime Rate |
| % Change in Net Economic Value |
| |
+400 basis points |
|
| -14.35 | % |
+ 300 basis points |
|
| -9.50 | % |
+ 200 basis points |
|
| -5.39 | % |
+ 100 basis points |
|
| -2.24 | % |
- 100 basis points |
|
| 0.23 | % |
-200 basis points |
|
| -1.03 | % |
-300 basis points |
|
| -9.72 | % |
-400 basis points |
|
| -15.36 | % |
Prudent balance sheet management requires processes that monitor and protect the Company against unanticipated or significant changes in the level of market interest rates. Net interest income stability should be maintained in changing rate environments by ensuring that interest rate risk is kept to an acceptable level. The ability to reprice our interest-sensitive assets and liabilities over various time intervals is of critical importance.
The Company uses a variety of traditional and on-balance-sheet tools to manage our interest rate risk. Gap analysis, which monitors the “gap” between interest-sensitive assets and liabilities, is one such tool. In addition, we use simulation modeling to forecast future balance sheet and income statement behavior. By studying the effects on net interest income of rising, stable, and falling interest rate scenarios, the Company can position itself to take advantage of anticipated interest rate movement, and protect us from unanticipated rate movements, by understanding the dynamic nature of our balance sheet components.
An asset-sensitive balance sheet structure implies that assets, such as loans and securities, will reprice faster than liabilities; consequently, net interest income should be positively affected in an increasing interest rate environment. Conversely, a liability-sensitive balance sheet structure implies that liabilities, such as deposits, will reprice faster than assets; consequently, net interest income should be positively affected in a decreasing interest rate environment. At December 31, 2023, the Company had $151.7 million more in liabilities repricing than assets subject to repricing in one year. This is a one-day position that is continually changing and is not necessarily indicative of our position at any other time.
Liquidity
Liquidity represents an institution’s ability to meet present and future financial obligations through either the sale or maturity of existing assets or the acquisition of additional funds through liability management. Liquid assets include cash, interest-bearing deposits with banks, money market investments, federal funds sold, LHFS, and securities and loans maturing or re-pricing within one year. Additional sources of liquidity available to the Company include its capacity to borrow additional funds when necessary through federal funds lines with several correspondent banks, a line of credit with the FHLB, credit availability at the Federal Reserve Bank, the purchase of brokered certificates of deposit, corporate line of credit with a large correspondent bank, and debt and capital issuances. Management believes the Company’s current overall liquidity is sufficient to satisfy its depositors’ requirements and to meet its customers’ credit needs.
| 31 |
| Table of Contents |
The Company closely monitors changes in the industry and market conditions that may impact the Company’s liquidity. Deposits have remained a steady source of liquidity from 2022 to 2023. The Company may use other means of borrowings or other liquidity sources to fund any liquidity needs based on declines in deposit balances. The Company is also closely tracking the potential impacts on the Company’s liquidity of declines in fair value of the Company’s securities portfolio due to rising market interest rates.
As of December 31, 2023, liquid assets totaled $97.2 million, or 7.5% of total assets, and liquid earning assets totaled $77.4 million, or 6.5% of total earning assets. Asset liquidity is also provided by managing loan and securities maturities and cash flows. The Bank is scheduled to receive $93.7 million from bond paydowns and maturities by the end of 2024 which can be used to fund future loan growth and for other purposes.
In 2023 the Bank pledged investment securities with a par value totaling $220.8 million to the Federal Reserve System’s BTFP. In March 2023, the Board of Governors of the Federal Reserve System established the BTFP to provide any U.S. federally insured depository institution, including the Bank, with a line of credit equal to the par value of securities pledged to the BTFP. Advances from the BTFP may be requested by the Bank for up to one year until March 31, 2024. The Bank also pledged securities with a market value of $19.5 million to the Federal Reserve Discount Window. The Bank did not borrow from the BTFP or the Federal Reserve Discount Window during 2023.
In addition to the BTFP, the Bank has access to off-balance sheet liquidity through unsecured Federal funds lines totaling $90.0 million December 31, 2023, and December 31, 2022. The Bank also has a secured line of credit with the FHLB with available credit of $90.1 million and $39.1 million as of December 31, 2023, and December 31, 2022, respectively. The FHLB line of credit is secured by a blanket lien on qualifying loans in the residential, commercial, agricultural real estate, and home equity portfolios.
The Bank has a Funding and Liquidity Risk Management policy that limits the amount of short-term and long-term alternative funding to no more than 25% of total assets.
Capital Resources
The Company continues to maintain capital ratios intended to support its asset growth. The federal bank regulatory agencies have implemented regulatory capital rules known as “Basel III.” The Basel III rules require a common equity Tier 1 capital to risk-weighted assets minimum ratio of 4.50%, a minimum ratio of Tier 1 capital to risk-weighted assets of 6.00%, a minimum ratio of total capital to risk-weighted assets of 8.00%, and a minimum Tier 1 leverage ratio of 4.00%. There is also a capital conservation buffer that requires banks to hold common equity Tier 1 capital in excess of minimum risk-based capital ratios by at least 2.50% to avoid limits on capital distributions and certain discretionary bonus payments to executive officers and similar employees. The Company’s accumulated other comprehensive income or loss, resulting from unrealized gains and losses, net of income tax, on investment securities available for sale, is excluded from regulatory capital.
Pursuant to the Federal Reserve’s Small Bank Holding Company Policy Statement, the Company is not required to comply with Basel III on a parent-only basis. As of December 31, 2023, the Company and its subsidiary bank continue to exceed minimum capital standards and remain well-capitalized under applicable capital adequacy rules. The Company currently expects to continue to exceed required minimum capital ratios. See Note 14 “Regulatory Matters” of this Form 10-K for more information regarding the Company’s and its subsidiary bank’s capital ratios.
Item 7A. Quantitative and Qualitative Disclosures About Market Risk.
Not Applicable.
| 32 |
| Table of Contents |
Item 8. Financial Statements and Supplementary Data

REPORT OF INDEPENDENT REGISTERED PUBLIC ACCOUNTING FIRM
To the Shareholders and the Board of Directors of F&M Bank Corp.
Opinion on the Financial Statements
We have audited the accompanying consolidated balance sheets of F&M Bank Corp. and its subsidiaries (the Company) as of December 31, 2023 and 2022, the related consolidated statements of income, comprehensive income (loss), changes in shareholders’ equity, and cash flows for the years then ended, and the related notes to the consolidated financial statements (collectively, the financial statements). In our opinion, the financial statements present fairly, in all material respects, the financial position of the Company as of December 31, 2023 and 2022, and the results of its operations and its cash flows for the years then ended, in conformity with accounting principles generally accepted in the United States of America.
Adoption of New Accounting Standard
As discussed in Notes 1 and 4 to the financial statements, the Company changed its method of accounting for credit losses in 2023 due to the adoption of Accounting Standards Update 2016-13, Financial Instruments – Credit Losses (Topic 326), Measurement of Credit Losses on Financial Instruments, including all related amendments.
Basis for Opinion
These financial statements are the responsibility of the Company’s management. Our responsibility is to express an opinion on the Company’s financial statements based on our audits. We are a public accounting firm registered with the Public Company Accounting Oversight Board (United States) (PCAOB) and are required to be independent with respect to the Company in accordance with U.S. federal securities laws and the applicable rules and regulations of the Securities and Exchange Commission and the PCAOB.
We conducted our audits in accordance with the standards of the PCAOB. Those standards require that we plan and perform the audit to obtain reasonable assurance about whether the financial statements are free of material misstatement, whether due to error or fraud. The Company is not required to have, nor were we engaged to perform, an audit of internal control over financial reporting. As part of our audits we are required to obtain an understanding of internal control over financial reporting but not for the purpose of expressing an opinion on the effectiveness of the Company’s internal control over financial reporting. Accordingly, we express no opinion.
Our audits included performing procedures to assess the risks of material misstatement of the financial statements, whether due to error or fraud, and performing procedures that respond to those risks. Such procedures included examining, on a test basis, evidence regarding the amounts and disclosures in the financial statements. Our audits also included evaluating the accounting principles used and significant estimates made by management, as well as evaluating the overall presentation of the financial statements. We believe that our audits provide a reasonable basis for our opinion.
Critical Audit Matters
The critical audit matter communicated below is a matter arising from the current period audit of the financial statements that was communicated or required to be communicated to the audit committee and that: (1) relates to accounts or disclosures that are material to the financial statements and (2) involved our especially challenging, subjective, or complex judgments. The communication of critical audit matters does not alter in any way our opinion on the financial statements, taken as a whole, and we are not, by communicating the critical audit matter below, providing a separate opinion on the critical audit matter or on the accounts or disclosures to which it relates.
| 33 |
| Table of Contents |
Allowance for Credit Losses – Loans Collectively Evaluated for Credit Losses
Description of the Matter
As discussed in Note 1 (Nature of Banking Activities and Significant Accounting Policies) and Note 4 (Allowance for Credit Losses) to the consolidated financial statements, the Company changed its method of accounting for credit losses on January 1, 2023, due to the adoption of Accounting Standards Update 2016-13, Financial Instruments – Credit Losses (Topic 326), Measurement of Credit Losses on Financial Instruments, as amended. The allowance for credit losses on loans (ACLL) is a valuation allowance that represents management’s best estimate of expected credit losses on loans measured at amortized cost considering available information, from internal and external sources, relevant to assessing collectability over the loans’ contractual terms. Loans which share common risk characteristics are pooled and collectively evaluated by the Company using historical data, as well as assessments of current conditions and reasonable and supportable forecasts of future conditions. The Company’s ACLL related to collectively evaluated loans represented $7.3 million of the total recorded ACLL of $8.3 million as of December 31, 2023. The collectively evaluated ACLL consists of quantitative and qualitative components.
The Company uses a weighted average remaining life methodology to determine the quantitative component of the collectively evaluated ACLL. Under this methodology, the Company determines future expectations of the pool balances by using a remaining life calculator. A quarterly expected loss rate based on historical information is applied to an expected remaining balance for each period to determine the unadjusted expected loss for each loan pool segment.
In addition to the quantitative component, the collectively evaluated ACLL also includes a qualitative component which aggregates management’s assessment of available information relevant to assessing collectability that is not captured in the quantitative loss estimation process. Factors considered by management in developing its qualitative estimates include: changes in lending policies and procedures; the nature and volume of the portfolio; experience and ability of management and staff; the volume and severity of delinquencies and adversely classified loan balances; concentrations of credit; the value of underlying collateral; forecasted economic conditions; loan review system; and legal or regulatory requirements and competition. This evaluation is inherently subjective as it requires estimates that are susceptible to significant revision as more information becomes available.
Management exercised significant judgment when estimating the ACLL on collectively evaluated loans. We identified the estimation of the collectively evaluated ACLL as a critical audit matter as auditing the collectively evaluated ACLL involved especially complex and subjective auditor judgment in evaluating management’s assessment of the inherently subjective estimates.
The primary audit procedures we performed to address this critical audit matter included:
· | Obtaining an understanding of the Company’s process for determining its ACLL, including the underlying methodology and significant inputs to the calculation. |
· | Substantively testing management’s process for measuring the collectively evaluated ACLL, including: |
o | Evaluating conceptual soundness, assumptions, and key data inputs of the Company’s weighted average remaining life methodology, including the identification of loan pools, inputs for the attrition rate calculation, and the historical loss information utilized to determine the quarterly expected loss rate. |
o | Evaluating the methodology and testing the accuracy of incorporating reasonable and supportable forecasts in the collectively evaluated ACLL estimate. |
o | Evaluating the completeness and accuracy of data inputs used as a basis for the qualitative factors. |
o | Evaluating the qualitative factors for directional consistency in comparison to prior periods and for reasonableness in comparison to underlying supporting data. |
o | Testing the mathematical accuracy of the ACLL for collectively evaluated loans including both the discounted cashflow and qualitative factor components of the calculations. |
/s/
We have served as the Company’s auditor since 2016.
March 27, 2024
| 34 |
| Table of Contents |
F & M Bank Corp.
Consolidated Balance Sheets (dollars in thousands)
As of December 31, 2023 and 2022
|
| 2023 |
|
| 2022 |
| ||
Assets |
|
|
|
|
|
| ||
Cash and due from banks |
| $ |
|
| $ |
| ||
Money market funds and interest-bearing deposits in other banks |
|
|
|
|
|
| ||
Federal funds sold |
|
|
|
|
|
| ||
Cash and cash equivalents |
|
|
|
|
|
| ||
|
|
|
|
|
|
|
|
|
Securities: |
|
|
|
|
|
|
|
|
Held to maturity, at amortized cost-fair value of $ |
|
|
|
|
|
| ||
Available for sale, at fair value |
|
|
|
|
|
| ||
Other investments |
|
|
|
|
|
| ||
|
|
|
|
|
|
|
|
|
Loans held for sale, at fair value |
|
|
|
|
|
| ||
|
|
|
|
|
|
|
|
|
Loans held for investment, net of deferred fees and costs |
|
|
|
|
|
| ||
Less: allowance for credit losses |
|
| ( | ) |
|
| ( | ) |
Net loans held for investment |
|
|
|
|
|
| ||
|
|
|
|
|
|
|
|
|
Bank premises and equipment, net |
|
|
|
|
|
| ||
Other real estate owned |
|
|
|
|
|
| ||
Interest receivable |
|
|
|
|
|
| ||
Goodwill |
|
|
|
|
|
| ||
Bank owned life insurance |
|
|
|
|
|
| ||
Other assets |
|
|
|
|
|
| ||
Total Assets |
| $ |
|
| $ |
| ||
|
|
|
|
|
|
|
|
|
Liabilities |
|
|
|
|
|
|
|
|
Deposits: |
|
|
|
|
|
|
|
|
Noninterest bearing |
| $ |
|
| $ |
| ||
Interest bearing |
|
|
|
|
|
| ||
Total deposits |
|
|
|
|
|
| ||
|
|
|
|
|
|
|
|
|
Short-term debt |
|
|
|
|
|
| ||
Long-term debt |
|
|
|
|
|
| ||
Other liabilities |
|
|
|
|
|
| ||
Total Liabilities |
|
|
|
|
|
| ||
|
|
|
|
|
|
|
|
|
Commitments and contingencies |
|
|
|
|
|
|
|
|
|
|
|
|
|
|
|
|
|
Shareholders’ Equity |
|
|
|
|
|
|
|
|
Common stock $ |
|
|
|
|
|
| ||
Additional paid in capital |
|
|
|
|
|
| ||
Retained earnings |
|
|
|
|
|
| ||
Accumulated other comprehensive loss |
|
| ( | ) |
|
| ( | ) |
Total Shareholders’ Equity |
|
|
|
|
|
| ||
Total Liabilities and Shareholders’ Equity |
| $ |
|
| $ |
| ||
See accompanying Notes to the Consolidated Financial Statements.
| 35 |
| Table of Contents |
F & M Bank Corp.
Consolidated Statements of Income (dollars in thousands, except per share data)
For the years ended 2023 and 2022
|
| 2023 |
|
| 2022 |
| ||
Interest and Dividend Income |
|
|
|
|
|
| ||
Interest and fees on loans held for investment |
| $ |
|
| $ |
| ||
Interest from loans held for sale |
|
|
|
|
|
| ||
Interest from money market funds and federal funds sold |
|
|
|
|
|
| ||
Interest from debt securities |
|
|
|
|
|
| ||
Total interest and dividend income |
|
|
|
|
|
| ||
|
|
|
|
|
|
|
|
|
Interest Expense |
|
|
|
|
|
|
|
|
Total interest on deposits |
|
|
|
|
|
| ||
Interest from short-term debt |
|
|
|
|
|
| ||
Interest from long-term debt |
|
|
|
|
|
| ||
Total interest expense |
|
|
|
|
|
| ||
|
|
|
|
|
|
|
|
|
Net Interest Income |
|
|
|
|
|
| ||
|
|
|
|
|
|
|
|
|
Provision for Credit Losses |
|
|
|
|
|
| ||
Net Interest Income After Provision for Credit Losses |
|
|
|
|
|
| ||
|
|
|
|
|
|
|
|
|
Noninterest Income |
|
|
|
|
|
|
|
|
Service charges on deposit accounts |
|
|
|
|
|
| ||
Investment services and insurance income |
|
|
|
|
|
| ||
Mortgage banking income |
|
|
|
|
|
| ||
Title insurance income |
|
|
|
|
|
| ||
Income on bank owned life insurance |
|
|
|
|
|
| ||
Low-income housing partnership losses |
|
| ( | ) |
|
| ( | ) |
ATM and check card fees |
|
|
|
|
|
| ||
Net investment securities losses |
|
|
|
|
| ( | ) | |
Gain on sale of limited partnership investment |
|
|
|
|
|
| ||
Other operating income |
|
|
|
|
|
| ||
Total noninterest income |
|
|
|
|
|
| ||
|
|
|
|
|
|
|
|
|
Noninterest Expense |
|
|
|
|
|
|
|
|
Salaries |
|
|
|
|
|
| ||
Employee benefits |
|
|
|
|
|
| ||
Occupancy expense |
|
|
|
|
|
| ||
Equipment expense |
|
|
|
|
|
| ||
FDIC insurance assessment |
|
|
|
|
|
| ||
Other real estate owned, net |
|
|
|
|
|
| ||
Marketing expense |
|
|
|
|
|
| ||
Legal and professional expense |
|
|
|
|
|
| ||
ATM and check card fees |
|
|
|
|
|
| ||
Telecommunication and data processing expense |
|
|
|
|
|
| ||
Directors’ fees |
|
|
|
|
|
| ||
Bank franchise tax |
|
|
|
|
|
| ||
Other operating expenses |
|
|
|
|
|
| ||
Total noninterest expense |
|
|
|
|
|
| ||
|
|
|
|
|
|
|
|
|
Income before income taxes |
|
|
|
|
|
| ||
Income tax (benefit) expense |
|
| ( | ) |
|
|
| |
Net income |
| $ |
|
| $ |
| ||
|
|
|
|
|
|
|
|
|
Per Common Share Data |
|
|
|
|
|
|
|
|
Net income (basic and diluted) |
| $ |
|
| $ |
| ||
Cash dividends on common stock |
| $ |
|
| $ |
| ||
Weighted average common shares outstanding (basic and diluted) |
|
|
|
|
|
| ||
See accompanying Notes to the Consolidated Financial Statements.
| 36 |
| Table of Contents |
F & M Bank Corp.
Consolidated Statements of Comprehensive Income (Loss) (dollars in thousands)
For the years ended 2023 and 2022
|
| Years Ended December 31, |
| |||||
|
| 2023 |
|
| 2022 |
| ||
|
|
|
|
|
|
| ||
Net Income |
| $ |
|
| $ |
| ||
|
|
|
|
|
|
|
|
|
Other comprehensive income (loss): |
|
|
|
|
|
|
|
|
Pension plan adjustment |
|
|
|
|
|
| ||
Tax effect |
|
|
|
|
|
| ||
Pension plan adjustment, net of tax |
|
|
|
|
|
| ||
|
|
|
|
|
|
|
|
|
Unrealized holding gains (losses) on available-for-sale securities |
|
|
|
|
| ( | ) | |
Tax effect |
|
|
|
|
|
| ||
Unrealized holding gains (losses), net of tax |
|
|
|
|
| ( | ) | |
|
|
|
|
|
|
|
|
|
Less: |
|
|
|
|
|
|
|
|
Reclassifications adjustment for losses included in net income |
|
|
|
|
|
| ||
Tax effect |
|
|
|
|
|
| ||
Realized losses on sale of available-for-sale securities, net |
|
|
|
|
|
| ||
|
|
|
|
|
|
|
|
|
Total other comprehensive income (loss) |
|
|
|
|
| ( | ) | |
|
|
|
|
|
|
|
|
|
Total comprehensive income (loss) |
| $ |
|
| $ | ( | ) | |
See accompanying Notes to the Consolidated Financial Statements.
| 37 |
| Table of Contents |
F & M Bank Corp.
Consolidated Statements of Changes in Shareholders’ Equity (dollars in thousands, except per share data)
For the years ended December 31, 2023 and 2022
|
| Common Stock |
|
| Additional Paid in Capital |
|
| Retained Earnings |
|
| Accumulated Other Comprehensive Loss |
|
| Total |
| |||||
|
|
|
|
|
|
|
|
|
|
|
|
|
|
|
| |||||
Balance, December 31, 2021 |
| $ |
|
| $ |
|
| $ |
|
| $ | ( | ) |
| $ |
| ||||
Net Income |
|
|
|
|
|
|
|
|
|
|
|
|
|
|
| |||||
Other comprehensive loss |
|
|
|
|
|
|
|
|
|
|
| ( | ) |
|
| ( | ) | |||
Dividends on common stock ($1.04 per share) |
|
|
|
|
|
|
|
| ( | ) |
|
|
|
|
| ( | ) | |||
Common stock issued |
|
|
|
|
|
|
|
|
|
|
|
|
|
|
| |||||
Vesting of time based stock awards issued at date of grant, net of shares withheld for payroll taxes |
|
|
|
|
|
|
|
|
|
|
|
|
|
|
| |||||
Stock-based compensation expense |
|
|
|
|
|
|
|
|
|
|
|
|
|
|
| |||||
Balance, December 31, 2022 |
| $ |
|
| $ |
|
| $ |
|
| $ | ( | ) |
| $ |
| ||||
Net Income |
|
|
|
|
|
|
|
|
|
|
|
|
|
|
| |||||
Cumulative effect adjustment due to the adoption of ASC 326, net of tax |
|
|
|
|
|
|
|
| ( | ) |
|
|
|
|
| ( | ) | |||
Other comprehensive income |
|
|
|
|
|
|
|
|
|
|
|
|
|
|
| |||||
Dividends on common stock ($1.04 per share) |
|
|
|
|
|
|
|
| ( | ) |
|
|
|
|
| ( | ) | |||
Common stock issued |
|
|
|
|
|
|
|
|
|
|
|
|
|
|
| |||||
Vesting of time based stock awards issued at date of grant, net of shares withheld for payroll taxes |
|
|
|
|
| ( | ) |
|
|
|
|
|
|
|
|
| ||||
Stock-based compensation expense |
|
|
|
|
|
|
|
|
|
|
|
|
|
|
| |||||
Balance, December 31, 2023 |
| $ |
|
| $ |
|
| $ |
|
| $ | ( | ) |
| $ |
| ||||
See accompanying Notes to the Consolidated Financial Statements.
| 38 |
| Table of Contents |
F & M Bank Corp.
Consolidated Statements of Cash Flows (dollars in thousands)
For the years ended December 31, 2023 and 2022
|
| 2023 |
|
| 2022 |
| ||
Cash Flows from Operating Activities |
|
|
|
|
|
| ||
Net income |
| $ |
|
| $ |
| ||
Adjustments to reconcile net income to net cash provided by operating activities: |
|
|
|
|
|
|
|
|
Depreciation and amortization |
|
|
|
|
|
| ||
Amortization of intangibles |
|
|
|
|
|
| ||
Amortization of securities |
|
|
|
|
|
| ||
Proceeds from loans held for sale |
|
|
|
|
|
| ||
Gain on sale of loans held for sale |
|
| ( | ) |
|
| ( | ) |
Loans held for sale originated |
|
| ( | ) |
|
| ( | ) |
Provision for credit losses |
|
|
|
|
|
| ||
Deferred tax expense (benefit) |
|
|
|
|
| ( | ) | |
Increase in interest receivable |
|
| ( | ) |
|
| ( | ) |
(Decrease) increase in other assets |
|
| ( | ) |
|
|
| |
Decrease in accrued liabilities |
|
|
|
|
|
| ||
Loss on sale of investment securities |
|
|
|
|
|
| ||
Gain on sale of limited partnership investment |
|
| ( | ) |
|
| ( | ) |
Amortization of limited partnership investments |
|
|
|
|
|
| ||
Amortization of debt issuance costs |
|
|
|
|
|
| ||
(Gain) loss on sale of fixed assets, net |
|
| ( | ) |
|
| ( | ) |
Loss on sale and valuation adjustments of other real estate owned |
|
|
|
|
|
| ||
Purchase of other real estate owned |
|
| ( | ) |
|
|
| |
Income from life insurance investment |
|
| ( | ) |
|
| ( | ) |
Gain on life insurance investment |
|
| ( | ) |
|
|
| |
Share based compensation expense |
|
|
|
|
|
| ||
Net Cash Provided by Operating Activities |
|
|
|
|
|
| ||
|
|
|
|
|
|
|
|
|
Cash Flows from Investing Activities |
|
|
|
|
|
|
|
|
Proceeds from maturities of securities available for sale |
|
|
|
|
|
| ||
Proceeds from paydowns of mortgage-backed securities |
|
|
|
|
|
| ||
Proceeds from sales of securities available for sale |
|
|
|
|
|
| ||
Purchases of securities available for sale and other investments |
|
|
|
|
| ( | ) | |
Purchases of restricted stock, net |
|
| ( | ) |
|
| ( | ) |
Proceeds from sale of limited partnership investments |
|
|
|
|
|
| ||
Investment in limited partnership investment |
|
| ( | ) |
|
| ( | ) |
Net increase in loans held for investment |
|
| ( | ) |
|
| ( | ) |
Net purchase of property and equipment |
|
| ( | ) |
|
| ( | ) |
Proceeds from sale of other real estate owned |
|
|
|
|
|
| ||
Proceeds from life insurance benefits |
|
|
|
|
|
| ||
Proceeds from the sale of property and equipment |
|
|
|
|
|
| ||
Net Cash Used in Investing Activities |
|
| ( | ) |
|
| ( | ) |
|
|
|
|
|
|
|
|
|
Cash Flows from Financing Activities |
|
|
|
|
|
|
|
|
Net change in deposits |
|
|
|
|
|
| ||
Net change in short-term debt |
|
| ( | ) |
|
|
| |
Dividends paid in cash |
|
| ( | ) |
|
| ( | ) |
Proceeds from sale of common stock |
|
|
|
|
|
| ||
Proceeds from issuance of common stock |
|
|
|
|
|
| ||
Repayments of long-term debt |
|
|
|
|
| ( | ) | |
Net Cash Provided by Financing Activities |
|
|
|
|
|
| ||
|
|
|
|
|
|
|
|
|
Net (Decrease) in Cash and Cash Equivalents |
|
| ( | ) |
|
| ( | ) |
|
|
|
|
|
|
|
|
|
Cash and Cash Equivalents, Beginning of Year |
|
|
|
|
|
| ||
Cash and Cash Equivalents, End of Year |
| $ |
|
| $ |
| ||
|
|
|
|
|
|
|
|
|
Supplemental Cash Flow information: |
|
|
|
|
|
|
|
|
Cash paid for: |
|
|
|
|
|
|
|
|
Interest |
| $ |
|
| $ |
| ||
Income taxes |
| $ |
|
| $ |
| ||
Supplemental non-cash disclosures: |
|
|
|
|
|
|
|
|
Change in unrealized loss on securities available for sale, net |
| $ |
|
| $ | ( | ) | |
Cumulative effect of the adoption of ASC 326 |
| $ |
|
| $ |
| ||
Minimum pension liability adjustment, net |
| $ |
|
| $ |
| ||
Transfer Held to Maturity security from subsidiary to Bank available for sale portfolio |
| $ |
|
| $ |
| ||
Transfer from loans to other real estate owned |
| $ |
|
| $ |
| ||
See accompanying Notes to the Consolidated Financial Statements.
| 39 |
| Table of Contents |
F & M Bank Corp.
Notes to the Consolidated Financial Statements
December 31, 2023 and 2022
NOTE 1 NATURE OF BANKING ACTIVITIES AND SIGNIFICANT ACCOUNTING POLICIES
Nature of Operations - F&M Bank Corp. (the “Company”), through its subsidiary Farmers & Merchants Bank (the “Bank”), operates under a charter issued by the Commonwealth of Virginia and provides financial products and services to consumers and businesses. As a state-chartered bank, the Bank is subject to regulation by the Virginia Bureau of Financial Institutions and the Federal Reserve Bank. The Bank provides services to customers located primarily in the counties of Rockingham, Shenandoah, and Augusta, and the cities of Harrisonburg, Staunton, Waynesboro and Winchester in Virginia. Services are provided at fourteen branch offices and a Dealer Finance Division loan production office. The Company offers mortgage lending, title insurance and financial services through its subsidiaries, Farmers & Merchants Financial Services, Inc, (“FMFS”), VBS Mortgage, LLC (dba “F&M Mortgage”) and VSTitle, LLC (“VST”). TEB Life Insurance Company (“TEB”) was dissolved on November 8, 2023.
Basis of Financial Information - The accounting and reporting policies of the Company and its subsidiaries conform to accounting principles generally accepted in the United State of America (“GAAP’) and to accepted practices within the banking industry.
The preparation of the consolidated financial statements in conformity GAAP requires management to make estimates and assumptions that affect the reported amounts of assets and liabilities and disclosure of contingent assets and liabilities at the date of the financial statements and the reported amounts of revenues and expenses during the reporting period. Actual results could differ from those estimates. Material estimates that are particularly susceptible to significant change in the near term are the determination of the allowance for credit losses and the fair value of financial instruments.
Principles of Consolidation - The consolidated financial statements include the accounts of the Company, Bank, FMFS, F&M Mortgage, and VST. Significant inter-company accounts and transactions have been eliminated.
Cash and Cash Equivalents - Cash and cash equivalents include cash, cash due from banks, money market funds and interest-bearing deposits in other banks, and federal funds sold.
Securities - At the time of purchase, debt securities are classified as held to maturity, available for sale or trading. Debt securities that the Company has both the positive intent and ability to hold to maturity are classified as held to maturity. Held to maturity securities are stated at amortized cost adjusted for amortization of premiums and accretion of discounts on purchase using a method that approximates the effective interest method. Investments classified as trading or available for sale are stated at fair value. Changes in the fair value of available for sale investments are excluded from current earnings and reported, net of taxes, as a separate component of other comprehensive income (loss).
Amortization of premiums and accretion of discounts on securities are reported as adjustments to interest income using the effective interest method. Realized gains and losses on dispositions are based on the net proceeds and the adjusted book value of the securities sold using the specific identification method. Unrealized gains and losses on investment securities available for sale are based on the difference between book value and fair value of each security. These gains and losses are credited or charged to shareholders’ equity, whereas realized gains and losses flow through the Company’s current earnings.
The fair value of investment securities available for sale is estimated based on quoted prices for similar assets determined by bid quotations received from independent pricing services. Declines in the fair value of securities below their amortized cost that are other than temporary are reflected in earnings or other comprehensive income, as appropriate. For those debt securities whose fair value is less than their amortized cost basis, the Company considers our intent to sell the security, whether it is more likely than not that we will be required to sell the security before recovery and if we do not expect to recover the entire amortized cost basis of the security. In analyzing an issuer’s financial condition, the Company may consider whether the securities are issued by the federal government or its agencies, whether downgrades by bond rating agencies have occurred and the results of reviews of the issuer’s financial condition.
Other Investments - The Company has investments in low-income housing partnerships whose primary benefit is the distribution of federal income tax credits to partners. The Company recognizes these benefits and the cost of the investments over the life of the partnership. Amortization of these investments is prorated based on the amount of benefits received in each year to the total estimated benefits over the life of the projects.
| 40 |
| Table of Contents |
Due to restrictions on the Company’s investments in the FHLB and the Federal Reserve Bank of Richmond (“FRB”), these securities are considered restricted and carried at cost. The FHLB requires the Bank to maintain stock in an amount equal to 3.75% of outstanding borrowings. The FRB requires the Company to maintain stock with a par value equal to 6% of its outstanding capital and surplus.
Accounting Standards Adopted in 2023 - On January 1, 2023, the Company adopted Accounting Standards Update (“ASU”) 2016-13 Financial Instruments – Credit Losses (Topic 326): Measurement of Credit Losses on Financial Instruments (“ASC 326”). This standard replaced the incurred loss methodology with an expected loss methodology that is referred to as the current expected credit loss (“CECL”) methodology. CECL requires an estimate of credit losses for the remaining estimated life of the financial asset using historical experience, current conditions, and reasonable and supportable forecasts and generally applies to financial assets measured at amortized cost, including loan receivables and held-to-maturity debt securities, and some off-balance sheet credit exposures such as unfunded commitments to extend credit. Financial assets measured at amortized cost will be presented at the net amount expected to be collected by using an allowance for credit losses.
In addition, CECL made changes to the accounting for available for sale debt securities. One such change is to require credit losses to be presented as an allowance rather than as a write-down on available for sale debt securities if management does not intend to sell and does not believe that it is more likely than not, they will be required to sell.
The Company adopted ASC 326 and all related subsequent amendments thereto effective January 1, 2023 using the modified retrospective approach for all financial assets measured at amortized cost and off-balance sheet credit exposures. The transition adjustment of the adoption of CECL included an increase in the allowance for credit losses on loans of $
The Company adopted ASC 326 using the prospective transition approach for debt securities for which other-than-temporary impairment had been recognized prior to January 1, 2023. As of December 31, 2022, the Company did not have any other-than-temporarily impaired investment securities. Therefore, upon adoption of ASC 326, the Company determined there was no allowance for credit losses on available for sale securities.
The Company elected not to measure an allowance for credit losses for accrued interest receivable and instead elected to reverse interest income on loans or securities that are placed on nonaccrual status, which is generally when the instrument is 90 days past due, or earlier if the Company believes the collection of interest is doubtful. The Company has concluded that this policy results in the timely reversal of uncollectible interest.
Allowance for Credit Losses – Available for Sale Securities - For available for sale securities, management evaluates all investments in an unrealized loss position on a quarterly basis, and more frequently when economic or market conditions warrant such evaluation. If the Company has the intent to sell the security or it is more likely than not that the Company will be required to sell the security, the security is written down to fair value and the entire loss is recorded in earnings.
If either of the above criteria is not met, the Company evaluates whether the decline in fair value is the result of credit losses or other factors. In making the assessment, the Company may consider various factors including the extent to which fair value is less than amortized cost, performance on any underlying collateral, downgrades in the ratings of the security by a rating agency, the failure of the issuer to make scheduled interest or principal payments and adverse conditions specifically related to the security. If the assessment indicates that a credit loss exists, the present value of cash flows expected to be collected are compared to the amortized cost basis of the security and any excess is recorded as an allowance for credit loss, limited by the amount that the fair value is less than the amortized cost basis. Any amount of unrealized loss that has not been recorded through an allowance for credit loss is recognized in other comprehensive income.
| 41 |
| Table of Contents |
Changes in the allowance for credit loss are recorded as provision for (or reversal of) credit loss expense. Losses are charged against the allowance for credit loss when management believes an available for sale security is confirmed to be uncollectible or when either of the criteria regarding intent or requirement to sell is met. As of December 31, 2023, there was no allowance for credit loss related to the available for sale portfolio.
Accrued interest receivable on available for sale debt securities totaled $
Loans - Loans that management has the intent and ability to hold for the foreseeable future or until maturity or payoff are reported at amortized cost. Amortized cost is the principal balance outstanding, net of discounts and deferred fees and costs. Accrued interest receivable related to loans totaled $
Nonaccruals, Past Dues, and Charge-offs - The policy for placing commercial and consumer loans on nonaccrual status is generally when the loan is 90 days delinquent unless the credit is well secured and in process of collection. Consumer loans are typically charged-off when management judges the loan to be uncollectible. Commercial loans are typically written down to net realizable value when it is determined that the Company will be unable to collect the principal amount in full and the amount is a confirmed loss. Loans in all segments of portfolios are considered past due or delinquent when a contractual payment has not been satisfied. Loans are placed on nonaccrual status or charged off at an earlier date if collection of principal and interest is considered doubtful and in accordance with regulatory requirements.
For both the commercial and consumer loan portfolio segments, all interest accrued but not collected for loans placed on nonaccrual status or charged-off is reversed against interest income and accrual of interest income is terminated. Payments and interest on these loans are accounted for using the cost-recovery method by applying all payments received as a reduction to the outstanding principal balance until qualifying for return to accrual. Loans are returned to accrual status when all the principal and interest amounts contractually due are brought current and future payments are reasonably assured. The determination of future payments being reasonably assured varies depending on the circumstances present with the loan; however, the timely payment of contractual amounts owed for six consecutive months is a primary indicator.
Allowance for Credit Losses – Loans - The allowance for credit losses is a valuation account that is deducted from the loans' amortized cost basis to present the net amount expected to be collected on the loans. Loans are charged off against the allowance when management believes the uncollectibility of a loan balance is confirmed. Expected recoveries do not exceed the aggregate of amounts previously charged-off and expected to be charged-off. Accrued interest receivable is excluded from the estimate of credit losses. The allowance for credit losses represents management’s estimate of lifetime credit losses inherent in loans as of the balance sheet date. The allowance for credit losses is estimated by management using relevant available information, from both internal and external sources relating to past events, current conditions, and reasonable and supportable forecasts.
The allowance for credit losses is measured on a pool basis when similar risk characteristics exist. The Company measures the allowance for credit losses using the weighted average remaining life methodology. Under this methodology, the Company uses a loss rate for each loan pool segment using historical information. Future expectations of the pool balances are determined by using a remaining life calculator. A quarterly expected loss rate is applied to an expected remaining balance for each period to determine the unadjusted expected loss for each loan pool segment.
The Company utilizes a Qualitative Scorecard (“Scorecard”) to adjust the historical loss information, as necessary, to reflect the Company’s expectations about the future. For each segment, the Scorecard calculates the difference between the quantitative expected credit loss and the high watermark average remaining maturity loss rates. This difference is the maximum qualitative adjustment that can be applied to that segment. Due to the low number of losses in the Company’s portfolio, in particular during the great financial crisis from 2008-2012, a number of pool sets will leverage peer data to calculate the overall loss rate. The Company believes that to provide a reasonable and supportable loss rate, data representative of losses during a financial downturn will provide a better representation of the perceived risk in the portfolio. In determining how to apply the weightings for the various qualitative factors, management assessed which factors would have the highest impact on potential loan losses. The economy and problem loan trends were determined to have the most significant effect on the estimated losses. The most influential factor on potential loan losses is economic conditions, with a weighting of 20%-25%. The Company will evaluate the weighting applied to each pool on an annual basis.
| 42 |
| Table of Contents |
The Company measures expected credit losses for loans on a pooled basis when similar risk characteristics exist. The Company has identified the following portfolio segments and calculates the allowance for credit losses for each using a remaining life methodology:
1-4 family residential construction. Construction loans are subject to general risks from changing housing market trends and economic conditions that may impact demand for completed properties, availability of building materials, and the costs of completion. Changes in construction costs and interest rates may impact the borrower’s ability to service the debt. These risks are measured by market-area unemployment rates, bankruptcy rates, housing and commercial building market trends, and interest rates. Risks specific to the borrower are also evaluated, including previous repayment history, debt service ability, and current and projected loan-to-value ratios for the collateral.
Other construction, land development and land. Construction and land development loans are subject to general risks from changing commercial building and housing market trends and economic conditions that may impact demand for completed properties and the costs of completion. Completed properties that do not sell or become leased within originally expected timeframes may impact the borrower’s ability to service the debt. These risks are measured by market-area unemployment rates, bankruptcy rates, housing and commercial building market trends, and interest rates. Risks specific to the borrower are also evaluated, including previous repayment history, debt service ability, and current and projected loan-to-value ratios for the collateral.
Secured by farmland. Farmland loans are loans secured by agricultural property. These loans are subject to risks associated with the value of the underlying farmland and the cash flows of the borrower’s farming operations.
Home equity - open end. The home-equity loan portfolio carries risks associated with the creditworthiness of the borrower and changes in loan-to-value ratios. The Company manages these risks through policies and procedures such as limiting loan-to-value at origination, experienced underwriting, and requiring standards for appraisers.
Real estate. Real estate loans are for consumer residential 1-4 family real estate where the credit quality is subject to risks associated with the borrower’s repayment ability and collateral value, measured generally by analyzing local unemployment and bankruptcy trends, and local housing market trends and interest rates. Risks specific to a borrower are determined by previous repayment history, loan-to-value ratios, and debt-to-income ratios.
Home equity - closed end. The home-equity closed-end loan portfolio carries risks associated with the creditworthiness of the borrower, changes in loan-to-value ratios, and subordinate lien positions. The Company manages these risks through policies and procedures such as limiting loan-to-value at origination, experienced underwriting, and requiring standards for appraisers.
Multifamily. Multifamily loans are loans secured by multi-unit residential property. These loans are subject to risks associated with the value of the underlying property, availability of rental units, as well as the successful operation and management of the property.
Owner-occupied commercial real estate. The commercial real estate segment includes loans secured by commercial real estate occupied by the owner/borrower. Loans in this segment are impacted by economic risks from changing commercial real estate markets, business bankruptcy rates, local unemployment rates and interest rate trends that would impact the businesses occupying the commercial real estate.
Other commercial real estate. The other commercial real estate segment includes loans secured by commercial real estate leased to non-owners. Loans in the commercial real estate segment are impacted by economic risks from changing commercial real estate markets, rental markets for commercial buildings, business bankruptcy rates, local unemployment rates and interest rate trends that would impact the businesses housed by the commercial real estate.
Agriculture loans. Agriculture loans are secured by agricultural equipment or are unsecured. Credit risk for these loans is subject to economic conditions, generally monitored by local agricultural/farming trends, interest rates, and borrower repayment ability and collateral value (if secured).
Commercial and industrial. Commercial and industrial loans are secured by collateral other than real estate or are unsecured. Credit risk for these loans is subject to economic conditions, generally monitored by local business bankruptcy trends, interest rates, and borrower repayment ability and collateral value (if secured).
| 43 |
| Table of Contents |
Credit cards. Credit card loan portfolios carry risks associated with the creditworthiness of the borrower and changes in the economic environment. The Company manages these risks through policies and procedures such as experienced underwriting, maximum debt-to-income ratios, and minimum borrower credit scores.
Automobile loans. Automobile loans generally carry certain risks associated with the values of the collateral and borrower’s ability to repay the loan. Lending on new and used vehicles is subject to the risk of changing values in the availability of vehicles and the resale value.
Other consumer loans. Other consumer loans may be secured or unsecured. Credit risk stems primarily from the borrower’s ability to repay. If the loan is secured, the Company analyzes loan-to-value ratios. All consumer non-real estate loans are analyzed for debt-to-income ratios and previous credit history, as well as for general risks for the portfolio, including local unemployment rates, personal bankruptcy rates and interest rates.
Municipal loans. Municipal loans are unsecured loans generally made to local towns within the Bank’s trade area. Credit risk is based on the cash flow and management of the local town’s budgets.
Additionally, the allowance for credit losses calculation includes subjective adjustments for qualitative risk factors that are likely to cause estimated credit losses to differ from historical experience. These qualitative adjustments may increase or reduce reserve levels and include adjustments for lending management experience and risk tolerance, loan review and audit results, asset quality and portfolio trends, loan portfolio growth, industry concentrations, trends in underlying collateral, external factors and economic conditions not already captured.
Loans that do not share risk characteristics are evaluated on an individual basis. Management evaluates
Allowance for Credit Losses – Unfunded Commitments - Financial instruments include off-balance sheet credit instruments, such as commitments to make loans and commercial letters of credit issued to meet customer financing needs. The Company’s exposure to credit loss in the event of nonperformance by the other party to the financial instrument for off-balance sheet loan commitments is represented by the contractual amount of those instruments. Such financial instruments are recorded when they are funded.
The Company records an allowance for credit losses on off-balance sheet credit exposures, unless the commitments to extend credit are unconditionally cancelable, through a charge to provision for credit losses in the Company’s income statements. The allowance for credit losses on off-balance sheet credit exposures is estimated by loan segment at each balance sheet date under the current expected credit loss model using the same methodologies as portfolio loans, taking into consideration the likelihood that funding will occur as well as any third-party guarantees. The allowance for unfunded commitments is included in other liabilities on the Company’s consolidated balance sheets.
Earnings per Share - Basic Earnings per Share (“EPS”) is computed by dividing net income available to common shareholders by the weighted average number of common shares outstanding. Nonvested restricted shares are included in the computation of basic earnings per share as the holder is entitled to full shareholder benefits during the vesting period, including voting rights and sharing in nonforfeitable dividends. Diluted earnings per share includes all convertible securities, such as convertible preferred stock, convertible debt, equity options, and warrants. The Company does not have any convertible securities that would dilute the earnings per share.
Other Real Estate Owned (“OREO”) - OREO is held for sale and represents real estate acquired through, or in lieu of, foreclosure. OREO is initially recorded at fair value less costs to sell when acquired, establishing a new cost basis. Physical possession of residential real estate property collateralizing a consumer mortgage loan occurs when legal title is obtained upon completion of foreclosure or when the borrower conveys all interest in the property to satisfy the loan through completion of a deed in lieu of foreclosure or through a similar legal agreement. The Company’s policy is to carry OREO on its balance sheet at the lower of cost or fair value less estimated costs to sell. If fair value declines subsequent to foreclosure, a valuation allowance is recorded through expense. Operating costs after acquisition are expensed.
Bank Premises and Equipment - Land is carried at cost. Buildings and equipment are stated at cost less accumulated depreciation. Depreciation is charged to income over the estimated useful lives of the assets on a combination of the straight-line and accelerated methods. Estimated useful lives range from
| 44 |
| Table of Contents |
Goodwill and Intangible Assets - Goodwill, the excess of purchase price over the fair value of the identifiable net assets acquired, is evaluated for impairment by comparing the fair value of a reporting unit with its carrying amount. Impairment testing is performed annually as of December 31, as well as when management reasonably believes an impairment-triggering event may have occurred. The Company performed the internal evaluation of goodwill for December 31, 2023, and based on the results, no impairment was deemed necessary.
Acquired intangible assets are separately recognized if the benefit of the assets can be sold, transferred, licensed, rented, or exchanged, and amortized over their useful lives.
Bank Owned Life Insurance - The Company has purchased life insurance on certain key employees and directors. These policies are recorded at their cash surrender value and are included in a separate line item on the Company’s Consolidated Balance Sheets. Income generated from policies is recorded as noninterest income. The Company is exposed to credit risk to the extent an insurance company is unable to fulfill its financial obligations under a policy.
Loans Held for Sale - Loans held for sale consist of one-to-four family conforming residential real estate loans originated for sale in the secondary market by F&M Mortgage. Credit risk associated with these loans is mitigated by entering sales commitments with third party investors to purchase the loans after they are originated; the Company does not service these loans after they are sold.
The Company records loans held for sale via the fair value option; see Note 15 “Derivative Instruments and Hedging Activities, Mortgage Banking Derivatives” for additional information. The change in the fair value of loans held for sale is included in “Mortgage banking income” on the Company’s Consolidated Statements of Income.
Pension Plan - The Bank has a qualified noncontributory defined benefit pension plan which covers all full-time employees hired prior to April 1, 2012. The benefits are primarily based on years of service and earnings. The Company recognizes the over-funded or under funded status of pension and other postretirement benefit plans on the balance sheet. Gains and losses, prior service costs and credits, and any remaining transition amounts that have not yet been recognized through net periodic benefit cost will be recognized in accumulated other comprehensive loss, net of tax effects, until they are amortized as a component of net periodic cost. As of February 15, 2023, the Virginia Bankers Association Defined Benefit Plan for Farmers & Merchants Bank was amended to stop the accrual of future benefits.
Income Taxes - Income tax expense is the total of the current year income tax due or refundable and the change in deferred tax assets and liabilities. Deferred income tax assets and liabilities are determined using the liability (or balance sheet) method. Under this method, the net deferred tax asset or liability is based on the tax effects of the temporary differences between the book and tax bases of assets and liabilities and gives current recognition to changes in tax rates and laws.
When the Company’s federal tax returns are filed, it is highly certain that some positions taken would be sustained upon examination by the taxing authorities, while others are subject to uncertainty about the merits of the position taken or the amount of the position that would ultimately be sustained. The benefit of a tax position is recognized in the financial statements in the period during which, based on all available evidence, management believes it is more likely than not that the position will be sustained upon examination, including the resolution of appeals or litigation processes, if any. Tax positions taken are not offset or aggregated with other positions. Tax positions that meet the more-likely-than-not recognition threshold are measured as the largest amount of tax benefit that is more likely than not to be realized upon settlement with the applicable taxing authority. The portion of the benefits associated with tax positions taken that exceeds the amount measured as described above is reflected as a liability for unrecognized tax benefits in the accompanying consolidated balance sheets along with any associated interest and penalties that would be payable to the taxing authorities upon examination. Interest and penalties, if any, associated with unrecognized tax benefits are classified as additional income taxes in the consolidated statements of income.
Advertising Costs - The Company expenses advertising costs as incurred.
Transfers of Financial Assets - Transfers of financial assets are accounted for as sales when control over the assets has been surrendered. Control over transferred assets is deemed to be surrendered when the assets have been isolated from the Company, the transferee obtains the right (free of conditions that constrain it from taking advantage of that right) to pledge or exchange the transferred assets, and the Company does not maintain effective control over the transferred assets through an agreement to repurchase them before their maturity.
| 45 |
| Table of Contents |
Loss Contingencies - Loss contingencies, including claims and legal actions arising in the ordinary course of business, are recorded as liabilities when the likelihood of loss is probable, and an amount or range of loss can be reasonably estimated. Management does not believe there are any such matters that will have a material effect on the consolidated financial statements.
Reclassifications - The accompanying consolidated financial statements and notes reflect certain immaterial reclassifications in prior periods to conform to the current presentation.
Recent Accounting Pronouncements
Accounting Standards adopted in 2023:
In June 2016, the Financial Accounting Standards Board (“FASB”) issued ASU No. 2016-13, “Financial Instruments – Credit Losses (Topic 326): Measurement of Credit Losses on Financial Instruments.” The ASU, as amended, requires an entity to measure expected credit losses for financial assets carried at amortized cost based on historical experience, current conditions, and reasonable and supportable forecasts. Among other things, the ASU also amended the impairment model for available for sale securities and addressed purchased financial assets with deterioration. ASU 2016-13 was effective for the Company on January 1, 2023. The adjustment recorded at adoption to the overall allowance for credit losses, which consisted of adjustments to the allowance for credit losses on loans, as well as an adjustment to the Company’s reserve for unfunded loan commitments, was $
In March 2022, the FASB issued Accounting Standards Update (ASU) No. 2022-02, “Financial Instruments-Credit Losses (Topic 326), Troubled Debt Restructurings and Vintage Disclosures.” ASU 2022-02 addresses areas identified by the FASB as part of its post-implementation review of the credit losses standard (ASU 2016-13) that introduced the CECL model. The amendments eliminate the accounting guidance for troubled debt restructurings by creditors that have adopted the CECL model and enhance the disclosure requirements for loan refinancings and restructurings made with borrowers experiencing financial difficulty. In addition, the amendments require a public business entity to disclose current-period gross write-offs for financing receivables and net investment in leases by year of origination in the vintage disclosures. The amendments in this ASU should be applied prospectively, except for the transition method related to the recognition and measurement of troubled debt restructurings, an entity has the option to apply a modified retrospective transition method, resulting in a cumulative-effect adjustment to retained earnings in the period of adoption. ASU 2022-02 was effective for the Company on January 1, 2023. The adoption of ASU 2022-02 did not have a material impact on the Company’s consolidated financial statements.
Accounting Standards Pending Adoption:
In December 2023, the FASB issued ASU 2023-09, “Income Taxes (Topic 740): Improvements to Income Tax Disclosures.” The amendments in this ASU require an entity to disclose specific categories in the rate reconciliation and provide additional information for reconciling items that meet a quantitative threshold, which is greater than five percent of the amount computed by multiplying pretax income by the entity’s applicable statutory rate, on an annual basis. Additionally, the amendments in this ASU require an entity to disclose the amount of income taxes paid (net of refunds received) disaggregated by federal, state, and foreign taxes and the amount of income taxes paid (net of refunds received) disaggregated by individual jurisdictions that are equal to or greater than five percent of total income taxes paid (net of refunds received). Lastly, the amendments in this ASU require an entity to disclose income (or loss) from continuing operations before income tax expense (or benefit) disaggregated between domestic and foreign and income tax expense (or benefit) from continuing operations disaggregated by federal, state, and foreign. This ASU is effective for annual periods beginning after December 15, 2024. Early adoption is permitted. The amendments should be applied on a prospective basis; however, retrospective application is permitted. The Company does not expect the adoption of ASU 2023-09 to have a material impact on its consolidated financial statements.
| 46 |
| Table of Contents |
In November 2023, the FASB issued ASU 2023-07, “Segment Reporting (Topic 280): Improvements to Reportable Segment Disclosures.” The amendments in this ASU are intended to improve reportable segment disclosure requirements primarily through enhanced disclosures about significant segment expenses. This ASU requires disclosure of significant segment expenses that are regularly provided to the chief operating decision maker (“CODM”), an amount for other segment items by reportable segment and a description of its composition, all annual disclosures required by FASB ASU Topic 280 in interim periods as well, and the title and position of the CODM and how the CODM uses the reported measures. Additionally, this ASU requires that at least one of the reported segment profit and loss measures should be the measure that is most consistent with the measurement principles used in an entity’s consolidated financial statements. Lastly, this ASU requires public business entities with a single reportable segment to provide all disclosures required by these amendments in this ASU and all existing segment disclosures in Topic 280. This ASU is effective for fiscal years beginning after December 15, 2023, and interim periods within fiscal years beginning after December 15, 2024. Early adoption is permitted. The amendments should be applied retrospectively. The Company does not expect the adoption of ASU 2023-07 to have a material impact on its consolidated financial statements.
In October 2023, the FASB issued ASU 2023-06, “Disclosure Improvements: Codification Amendments in Response to the SEC’s Disclosure Update and Simplification Initiative.” This ASU incorporates certain U.S. Securities and Exchange Commission (“SEC”) disclosure requirements into the FASB Accounting Standards Codification. The amendments in the ASU are expected to clarify or improve disclosure and presentation requirements of a variety of Codification Topics, allow users to more easily compare entities subject to the SEC’s existing disclosures with those entities that were not previously subject to the requirements, and align the requirements in the Codification with the SEC’s regulations. For entities subject to the SEC’s existing disclosure requirements and for entities required to file or furnish financial statements with or to the SEC in preparation for the sale of or for purposes of issuing securities that are not subject to contractual restrictions on transfer, the effective date for each amendment will be the date on which the SEC removes that related disclosure from its rules. For all other entities, the amendments will be effective two years later. However, if by June 30, 2027, the SEC has not removed the related disclosure from its regulations, the amendments will be removed from the Codification and not become effective for any entity. The Company does not expect the adoption of ASU 2023-06 to have a material impact on its consolidated financial statements.
In August 2023, the FASB issued ASU 2023-05, “Business Combinations – Joint Venture Formations (Subtopic 805-60): Recognition and Initial Measurement.” This ASU applies to the formation of entities that meet the definition of a joint venture (or a corporate joint venture) as defined in the FASB Accounting Standards Codification Master Glossary. While joint ventures are defined in the Master Glossary, there has been no specific guidance in the Codification that applies to the formation accounting by a joint venture in its separate financial statements. The amendments in the ASU require that a joint venture apply a new basis of accounting upon formation. As a result, a newly formed joint venture, upon formation, would initially measure its assets and liabilities at fair value (with exceptions to fair value measurement that are consistent with the business combinations guidance). This ASU is effective on a prospective basis for all joint ventures with a formation date on or after January 1, 2025. Early adoption of ASU No. 2023-05 is permitted in any interim or annual period in which financial statements have not yet been issued (or made available for issuance). A joint venture that elects to early adopt may apply ASU No. 2023-05 either prospectively or retrospectively. The Company does not expect the adoption of ASU 2023-05 to have a material impact on its consolidated financial statements.
In July 2023, the FASB issued ASU 2023-03, “Presentation of Financial Statements (Topic 205), Income Statement—Reporting Comprehensive Income (Topic 220), Distinguishing Liabilities from Equity (Topic 480), Equity (Topic 505), and Compensation—Stock Compensation (Topic 718).” This ASU amends the FASB Accounting Standards Codification for SEC paragraphs pursuant to SEC Staff Accounting Bulletin No. 120, SEC Staff Announcement at the March 24, 2022 EITF Meeting, and Staff Accounting Bulletin Topic 6.B, Accounting Series Release 280—General Revision of Regulation S-X: Income or Loss Applicable to Common Stock. ASU 2023-03 is effective upon addition to the FASB Codification. The Company does not expect the adoption of ASU 2023-03 to have a material impact on its consolidated financial statements.
In March 2023, the FASB issued ASU 2023-02, “Investments—Equity Method and Joint Ventures (Topic 323): Accounting for Investments in Tax Credit Structures Using the Proportional Amortization Method.” These amendments allow reporting entities to elect to account for qualifying tax equity investments using the proportional amortization method, regardless of the program giving rise to the related income tax credits. The ASU is effective for public business entities for fiscal years beginning after December 15, 2023, including interim periods within those fiscal years. Early adoption is permitted for all entities in any interim period. The Company does not expect the adoption of ASU 2023-02 to have a material impact on its consolidated financial statements.
| 47 |
| Table of Contents |
In March 2023, the FASB issued ASU 2023-01, “Leases (Topic 842): Common Control Arrangements.” These amendments require entities to amortize leasehold improvements associated with common control leases over the useful life to the common control group. The ASU is effective for fiscal years beginning after December 15, 2023, including interim periods within those fiscal years. Early adoption is permitted. If an entity adopts the amendments in an interim period, it must adopt them as of the beginning of the fiscal year that includes that interim period. Transition can be done either retrospectively or prospectively. The Company does not expect the adoption of ASU 2023-01 to have a material impact on its consolidated financial statements.
In December 2022, the FASB issued ASU 2022-06, “Reference Rate Reform (Topic 848): Deferral of the Sunset Date of Topic 848.” ASU 2022-06 extends the period of time preparers can utilize the reference rate reform relief guidance in Topic 848. The objective of the guidance in Topic 848 is to provide relief during the temporary transition period, so the FASB included a sunset provision within Topic 848 based on expectations of when the London Interbank Offered Rate (LIBOR) would cease being published. In 2021, the UK Financial Conduct Authority delayed the intended cessation date of certain tenors of USD LIBOR to June 30, 2023.
To ensure the relief in Topic 848 covers the period of time during which a significant number of modifications may take place, the ASU defers the sunset date of Topic 848 from December 31, 2022, to December 31, 2024, after which entities will no longer be permitted to apply the relief in Topic 848. The ASU is effective for all entities upon issuance. The Company transitioned all loan agreements, other than SWAP loans, away from LIBOR during 2022. The SWAP loans have amended Rate Protection Agreements executed by the borrower in preparation of transition away from LIBOR by the swap holder.
In June 2022, the FASB issued ASU 2022-03, “Fair Value Measurement (Topic 820): Fair Value Measurement of Equity Securities Subject to Contractual Sale Restrictions.” ASU 2022-03 clarifies that a contractual restriction on the sale of an equity security is not considered part of the unit of account of the equity security and, therefore, is not considered in measuring fair value. The ASU is effective for fiscal years, including interim periods within those fiscal years, beginning after December 15, 2023. Early adoption is permitted. The Company does not expect the adoption of ASU 2022-03 to have a material impact on its consolidated financial statements.
In March 2020, the FASB issued Accounting Standards Update (ASU) No. 2020-04 “Reference Rate Reform (Topic 848): Facilitation of the Effects of Reference Rate Reform on Financial Reporting.” These amendments provide temporary optional guidance to ease the potential burden in accounting for reference rate reform. The ASU provides optional expedients and exceptions for applying generally accepted accounting principles to contract modifications and hedging relationships, subject to meeting certain criteria, that reference LIBOR or another reference rate expected to be discontinued. It is intended to help stakeholders during the global market-wide reference rate transition period. The guidance is effective for all entities as of March 12, 2020 through December 31, 2022. Subsequently, in January 2021, the FASB issued Accounting Standards Update (ASU) No. 2021-01 “Reference Rate Reform (Topic 848): Scope.” This ASU clarifies that certain optional expedients and exceptions in Topic 848 for contract modifications and hedge accounting apply to derivatives that are affected by the discounting transition. The ASU also amends the expedients and exceptions in Topic 848 to capture the incremental consequences of the scope clarification and to tailor the existing guidance to derivative instruments affected by the discounting transition. An entity may elect to apply ASU No. 2021-01 on contract modifications that change the interest rate used for margining, discounting, or contract price alignment retrospectively as of any date from the beginning of the interim period that includes March 12, 2020, or prospectively to new modifications from any date within the interim period that includes or is subsequent to January 7, 2021, up to the date that financial statements are available to be issued. An entity may elect to apply ASU No. 2021-01 to eligible hedging relationships existing as of the beginning of the interim period that includes March 12, 2020, and to new eligible hedging relationships entered into after the beginning of the interim period that includes March 12, 2020. The Company transitioned all loan agreements, other than SWAP loans, away from LIBOR during 2022. The SWAP loans have amended Rate Protection Agreements executed by the borrower in preparation of transition away from LIBOR by the swap holder.
Other accounting standards that have been issued by the FASB or other standards-setting bodies are not expected to have a material effect on the Company’s financial position, result of operations or cash flows.
NOTE 2 SECURITIES
The amortized cost and estimated fair value of securities held to maturity along with gross unrealized gains and losses are summarized as follows (dollars in thousands):
|
| Amortized Cost |
|
| Unrealized Gains |
|
| Unrealized Losses |
|
| Fair Value |
| ||||
December 31, 2023 |
|
|
|
|
|
|
|
|
|
|
|
| ||||
U. S. Treasuries |
| $ |
|
| $ |
|
| $ |
|
| $ |
| ||||
December 31, 2022 |
|
|
|
|
|
|
|
|
|
|
|
|
|
|
|
|
U. S. Treasuries |
| $ |
|
| $ |
|
| $ |
|
| $ |
| ||||
| 48 |
| Table of Contents |
The amortized cost and estimated fair value of securities available for sale along with gross unrealized gains and losses are summarized are as follows (dollars in thousands):
December 31, 2023 |
| Amortized Cost |
|
| Unrealized Gains |
|
| Unrealized Losses |
|
| Fair Value |
| ||||
U. S. Treasuries |
| $ |
|
| $ |
|
| $ |
|
| $ |
| ||||
U. S. Government sponsored enterprises |
|
|
|
|
|
|
|
|
|
|
|
| ||||
Securities issued by States and political subdivisions of the U.S. |
|
|
|
|
|
|
|
|
|
|
|
| ||||
Mortgage-backed obligations of federal agencies |
|
|
|
|
|
|
|
|
|
|
|
| ||||
Corporate debt securities |
|
|
|
|
|
|
|
|
|
|
|
| ||||
Total Securities Available for Sale |
| $ |
|
| $ |
|
| $ |
|
| $ |
| ||||
There was no allowance for credit losses on available for sale securities.
December 31, 2022 |
| Amortized Cost |
|
| Unrealized Gains |
|
| Unrealized Losses |
|
| Fair Value |
| ||||
U. S. Treasuries |
| $ |
|
| $ |
|
| $ |
|
| $ |
| ||||
U. S. Government sponsored enterprises |
|
|
|
|
|
|
|
|
|
|
|
| ||||
Securities issued by States and political subdivisions of the U.S. |
|
|
|
|
|
|
|
|
|
|
|
| ||||
Mortgage-backed obligations of federal agencies |
|
|
|
|
|
|
|
|
|
|
|
| ||||
Corporate debt securities |
|
|
|
|
|
|
|
|
|
|
|
| ||||
Total Securities Available for Sale |
| $ |
|
| $ |
|
| $ |
|
| $ |
| ||||
The amortized cost and fair value of securities at December 31, 2023, by contractual maturity are shown below (dollars in thousands). Expected maturities will differ from contractual maturities because borrowers may have the right to call or prepay obligations with or without call or prepayment penalties.
|
| Securities Available for Sale |
| |||||
|
| Amortized Cost |
|
| Fair Value |
| ||
Due in one year or less |
| $ |
|
| $ |
| ||
Due after one year through five years |
|
|
|
|
|
| ||
Due after five years through ten years |
|
|
|
|
|
| ||
Due after ten years |
|
|
|
|
|
| ||
Total |
| $ |
|
| $ |
| ||
The following table presents the gross realized gains and losses on and the proceeds from the sale of securities during the years ended December 31, 2023 and 2022 (dollars in thousands):
|
| 2023 |
|
| 2022 |
| ||
Realized gains (losses): |
|
|
|
| ||||
Gross realized gains |
| $ |
|
| $ |
| ||
Gross realized (losses) |
|
|
|
|
| ( | ) | |
Net realized (losses) |
| $ |
|
| $ | ( | ) | |
Proceeds from sales of securities |
| $ |
|
| $ |
| ||
The following table shows the gross unrealized losses and estimated fair value of available sale securities for which an allowance for credit losses has not been recorded aggregated by category and length of time that securities have been in a continuous unrealized loss position at December 31, 2023: (dollars in thousands):
|
| Less than 12 Months |
|
| More than 12 Months |
|
| Total |
| |||||||||||||||
December 31, 2023 |
| Fair Value |
|
| Unrealized Losses |
|
| Fair Value |
|
| Unrealized Losses |
|
| Fair Value |
|
| Unrealized Losses |
| ||||||
U. S. Treasuries |
| $ |
|
| $ |
|
| $ |
|
| $ |
|
| $ |
|
| $ |
| ||||||
U. S. Government sponsored enterprises |
|
|
|
|
|
|
|
|
|
|
|
|
|
|
|
|
|
| ||||||
Securities issued by State and political subdivisions in the U.S. |
|
|
|
|
|
|
|
|
|
|
|
|
|
|
|
|
|
| ||||||
Mortgage-backed obligations of federal agencies |
|
|
|
|
|
|
|
|
|
|
|
|
|
|
|
|
|
| ||||||
Corporate debt securities |
|
|
|
|
|
|
|
|
|
|
|
|
|
|
|
|
|
| ||||||
Total |
| $ |
|
| $ |
|
| $ |
|
| $ |
|
| $ |
|
| $ |
| ||||||
| 49 |
| Table of Contents |
Unrealized losses at December 31, 2023 were generally attributable to changes in market interest rates and interest spread relationships since the investment securities were originally purchased, and not due to the credit quality concerns on the investment securities. Issuers continue to make timely principal and interest payments and the Company currently has no plans to sell the investments and it is likely that management will not be required to sell the securities prior to their anticipated recovery. The fair value is expected to recover as the bonds approach maturity.
At December 31, 2023, there were $
|
| Less than 12 Months |
|
| More than 12 Months |
|
| Total |
| |||||||||||||||
December 31, 2022 |
| Fair Value |
|
| Unrealized Losses |
|
| Fair Value |
|
| Unrealized Losses |
|
| Fair Value |
|
| Unrealized Losses |
| ||||||
U. S. Treasuries |
| $ |
|
| $ |
|
| $ |
|
| $ |
|
| $ |
|
| $ |
| ||||||
U. S. Government sponsored enterprises |
|
|
|
|
|
|
|
|
|
|
|
|
|
|
|
|
|
| ||||||
Securities issued by State and political subdivisions in the U.S. |
|
|
|
|
|
|
|
|
|
|
|
|
|
|
|
|
|
| ||||||
Mortgage-backed obligations of federal agencies |
|
|
|
|
|
|
|
|
|
|
|
|
|
|
|
|
|
| ||||||
Corporate debt securities |
|
|
|
|
|
|
|
|
|
|
|
|
|
|
|
|
|
| ||||||
Total |
| $ |
|
| $ |
|
| $ |
|
| $ |
|
| $ |
|
| $ |
| ||||||
The Company has pledged securities with a par value of $
As of December 31, 2023, other investments consist of investments in twelve low-income housing and historic equity partnerships (carrying basis of $
The primary purpose of the investment portfolio is to generate income and meet liquidity needs of the Company through readily saleable financial instruments. The portfolio includes fixed rate bonds, whose prices move inversely with rates and variable rate bonds. At the end of any accounting period, the investment portfolio has unrealized gains and losses. The Company monitors the portfolio, which is subject to liquidity needs, market rate changes and credit risk changes for any indication of credit losses. The primary concern in a loss situation is the credit quality of the issuer behind the instrument. Bonds deteriorate in value due to credit quality of the individual issuer and changes in market conditions.
NOTE 3 LOANS AND CREDIT QUALITY
Under adoption of ASC 326, there were changes to certain loan segments to better differentiate credit characteristics and align with our ACL model. Construction/land development was split into two segments: 1-4 family residential construction and other construction, land development and land. Commercial real estate was also split into two segments: owner-occupied commercial real estate and other commercial real estate. Commercial and industrial – non-real estate was divided into agricultural loans, commercial and industrial loans, and municipal loans. Dealer finance was consolidated with other automobile loans.
| 50 |
| Table of Contents |
The following is a summary of the major categories of total loans held for investment outstanding at December 31, 2023 (dollars in thousands):
December 31, 2023 |
| |||
1-4 Family residential construction |
| $ |
| |
Other construction, land development and land |
|
|
| |
Secured by farmland |
|
|
| |
Home equity – open end |
|
|
| |
Real estate |
|
|
| |
Home Equity – closed end |
|
|
| |
Multifamily |
|
|
| |
Owner-occupied commercial real estate |
|
|
| |
Other commercial real estate |
|
|
| |
Agricultural loans |
|
|
| |
Commercial and industrial |
|
|
| |
Credit Cards |
|
|
| |
Automobile loans |
|
|
| |
Other consumer loans |
|
|
| |
Municipal loans |
|
|
| |
Gross loans |
|
|
| |
Unamortized net deferred loan fees |
|
| ( | ) |
Less allowance for credit losses |
|
|
| |
Net loans |
| $ |
| |
The table above does not include loans held for sale of $
Accrued interest receivable on loans held for investment totaled $
The Company has pledged loans held for investment as collateral for borrowings with the FHLB totaling $
| 51 |
| Table of Contents |
The following is a summary of the major categories of total loans held for investment outstanding at December 31, 2022 (dollars in thousands):
|
| December 31, 2022 |
| |
Construction/Land Development |
| $ |
| |
Farmland |
|
|
| |
Real Estate |
|
|
| |
Multi-Family |
|
|
| |
Commercial Real Estate |
|
|
| |
Home Equity – closed end |
|
|
| |
Home Equity – open end |
|
|
| |
Commercial & Industrial – Non-Real Estate |
|
|
| |
Consumer |
|
|
| |
Dealer Finance |
|
|
| |
Credit Cards |
|
|
| |
Gross loans |
|
|
| |
Unamortized net deferred loan fees |
|
| ( | ) |
Less allowance for credit losses |
|
|
| |
Net loans |
| $ |
| |
Nonaccrual and Past Due Loans
The following table shows the aging of the Company’s loans held for investment, by segment (dollars in thousands):
Age Analysis of Past Due Loans and Leases As of December 31, 2023 | ||||||||||||||||||||||||
|
| Accruing Loans 30-59 Days Past due |
|
| Accruing Loans 60-89 Days Past due |
|
| Accruing Loans 90 Days or More Past due |
|
| Nonaccrual Loans |
|
| Accruing Current Loans |
|
| Total Loans |
| ||||||
1-4 Family residential construction |
| $ |
|
| $ |
|
| $ |
|
| $ |
|
| $ |
|
| $ |
| ||||||
Other construction, land development and land |
|
|
|
|
|
|
|
|
|
|
|
|
|
|
|
|
|
| ||||||
Secured by farmland |
|
|
|
|
|
|
|
|
|
|
|
|
|
|
|
|
|
| ||||||
Home equity – open end |
|
|
|
|
|
|
|
|
|
|
|
|
|
|
|
|
|
| ||||||
Real estate |
|
|
|
|
|
|
|
|
|
|
|
|
|
|
|
|
|
| ||||||
Home Equity – closed end |
|
|
|
|
|
|
|
|
|
|
|
|
|
|
|
|
|
| ||||||
Multifamily |
|
|
|
|
|
|
|
|
|
|
|
|
|
|
|
|
|
| ||||||
Owner-occupied commercial real estate |
|
|
|
|
|
|
|
|
|
|
|
|
|
|
|
|
|
| ||||||
Other commercial real estate |
|
|
|
|
|
|
|
|
|
|
|
|
|
|
|
|
|
| ||||||
Agricultural loans |
|
|
|
|
|
|
|
|
|
|
|
|
|
|
|
|
|
| ||||||
Commercial and industrial |
|
|
|
|
|
|
|
|
|
|
|
|
|
|
|
|
|
| ||||||
Credit Cards |
|
|
|
|
|
|
|
|
|
|
|
|
|
|
|
|
|
| ||||||
Automobile loans |
|
|
|
|
|
|
|
|
|
|
|
|
|
|
|
|
|
| ||||||
Other consumer loans |
|
|
|
|
|
|
|
|
|
|
|
|
|
|
|
|
|
| ||||||
Municipal loans |
|
|
|
|
|
|
|
|
|
|
|
|
|
|
|
|
|
| ||||||
Gross loans |
|
|
|
|
|
|
|
|
|
|
|
|
|
|
|
|
|
| ||||||
Less: Unamortized net deferred loan fees |
|
|
|
|
|
|
|
|
|
|
|
|
|
| ( | ) |
|
| ( | ) | ||||
Loans held for investment |
| $ |
|
| $ |
|
| $ |
|
| $ |
|
| $ |
|
| $ |
| ||||||
| 52 |
| Table of Contents |
The following table shows the aging of the Company’s loans held for investment, by segment (dollars in thousands):
Age Analysis of Past Due Loans and Leases As of December 31, 2022 | ||||||||||||||||||||||||
|
| Accruing Loans 30-59 Days Past due |
|
| Accruing Loans 60-89 Days Past due |
|
| Accruing Loans 90 Days or More Past Due |
|
| Nonaccrual Loans |
|
| Accruing Current Loans |
|
| Total Loans |
| ||||||
Construction/Land Development |
| $ |
|
| $ |
|
| $ |
|
| $ |
|
| $ |
|
| $ |
| ||||||
Farmland |
|
|
|
|
|
|
|
|
|
|
|
|
|
|
|
|
|
| ||||||
Real Estate |
|
|
|
|
|
|
|
|
|
|
|
|
|
|
|
|
|
| ||||||
Multi-Family |
|
|
|
|
|
|
|
|
|
|
|
|
|
|
|
|
|
| ||||||
Commercial Real Estate |
|
|
|
|
|
|
|
|
|
|
|
|
|
|
|
|
|
| ||||||
Home Equity – closed end |
|
|
|
|
|
|
|
|
|
|
|
|
|
|
|
|
|
| ||||||
Home Equity – open end |
|
|
|
|
|
|
|
|
|
|
|
|
|
|
|
|
|
| ||||||
Commercial & Industrial – Non- Real Estate |
|
|
|
|
|
|
|
|
|
|
|
|
|
|
|
|
|
| ||||||
Consumer |
|
|
|
|
|
|
|
|
|
|
|
|
|
|
|
|
|
| ||||||
Dealer Finance |
|
|
|
|
|
|
|
|
|
|
|
|
|
|
|
|
|
| ||||||
Credit Cards |
|
|
|
|
|
|
|
|
|
|
|
|
|
|
|
|
|
| ||||||
Less: Unamortized net deferred loan fees |
|
|
|
|
|
|
|
|
|
|
|
|
|
| ( | ) |
|
| ( | ) | ||||
Loans held for investment |
| $ |
|
| $ |
|
| $ |
|
| $ |
|
| $ |
|
| $ |
| ||||||
There were $
The following table shows the Company’s amortized cost basis of loans on nonaccrual status (dollars in thousands). Information for December 31, 2023 is presented under CECL, while information for December 31, 2022 is presented in accordance with the previously applicable incurred loss methodology.
|
| CECL |
|
| Incurred Loss |
| ||||||||||
|
| December 31, 2023 |
|
| December 31, 2022 |
| ||||||||||
|
| Nonaccrual loans with No Allowance |
|
| Nonaccrual Loans with an Allowance |
|
| Total Nonaccrual Loans |
|
| Nonaccrual Loans |
| ||||
1-4 Family residential construction |
| $ |
|
| $ |
|
| $ |
|
| $ |
| ||||
Other construction, land development and land |
|
|
|
|
|
|
|
|
|
|
|
| ||||
Secured by farmland |
|
|
|
|
|
|
|
|
|
|
|
| ||||
Home equity – open end |
|
|
|
|
|
|
|
|
|
|
|
| ||||
Real estate |
|
|
|
|
|
|
|
|
|
|
|
| ||||
Other commercial real estate |
|
|
|
|
|
|
|
|
|
|
|
| ||||
Agricultural loans |
|
|
|
|
|
|
|
|
|
|
|
| ||||
Commercial and industrial |
|
|
|
|
|
|
|
|
|
|
|
| ||||
Automobile loans |
|
|
|
|
|
|
|
|
|
|
|
| ||||
Other consumer loans |
|
|
|
|
|
|
|
|
|
|
|
| ||||
Total loans |
| $ |
|
| $ |
|
| $ |
|
| $ |
| ||||
Troubled Loan Modifications
Effective January 1, 2023, the Company refers to loan modifications where the borrower is experiencing financial difficulty and the modification is in the form of principal forgiveness, interest rate reductions, term extensions, other-than-insignificant payment delays, or a combination of the above modifications, as troubled loan modifications. The ACLL on troubled loan modifications is measured using the same method as all other loans held for investment.
The Company evaluates all loan modifications according to the accounting guidance for loan refinancing and restructuring to determine whether the modification should be accounted for as a new loan or a continuation of the existing loan. If the modification meets the criteria to be accounted for as a new loan, any deferred fees and costs remaining prior to the modification are recognized in income and any new deferred fees and costs are recorded on the loan as part of the modification. If the modification does not meet the criteria to be accounted for as a new loan, any new deferred fees and costs resulting from the modification are added to the existing amortized cost basis of the loan.
| 53 |
| Table of Contents |
The following table presents the amortized cost of loans and leases to borrowers experiencing financial difficulty modified on or after January 1, 2023, the date the Company adopted ASU 2022-02, through December 31, 2023, by class of financing receivable, type of modification, financial effect of the modification, and percentage of the amortized cost basis of modifications as compared to the amortized cost basis of each loan segment (dollars in thousands).
Amortized Cost of Basis of Loan Modifications Made to Borrowers Experiencing Financial Difficulty For the Year Ended December 31, 2023 | ||||||||||||
|
| Term Extension |
|
| Weighted Average Term Extension (in months) |
|
| % of Total Loan Type |
| |||
Owner-occupied commercial real estate |
|
|
|
|
|
|
|
| % | |||
Automobile loans |
|
|
|
|
|
|
|
| % | |||
Total Term Extension |
| $ |
|
|
|
|
|
| % | |||
The Company closely monitors the performance of the loans that are modified to borrowers experiencing financial difficulty to understand the effectiveness of its modification efforts. The Company considers a default on a troubled loan modification to occur when the borrower is 90 days past due following the modification or a foreclosure and repossession of the applicable collateral occurs. No loan or lease modifications completed on or after January 1, 2023 through December 31, 2023 to borrowers experiencing financial difficulty had a payment default during the year ended December 31, 2023. Additionally, the Company did not have any troubled loan modifications that were past due.
As of December 31, 2023, the Company did not have any unfunded commitments on loans modified and designated as troubled loan modifications since January 1, 2023.
The following table shows, by modification type, TDRs that occurred during 2022 (dollars in thousands):
|
| December 31, 2022 |
| |||||||||
|
| Number of Contracts |
|
| Pre- Modification Outstanding Recorded Investment |
|
| Post- Modification Outstanding Recorded Investment |
| |||
Extended maturity |
|
|
|
| $ |
|
| $ |
| |||
Change in terms |
|
|
|
|
|
|
|
|
| |||
Total |
|
|
|
| $ |
|
| $ |
| |||
Collateral Dependent Disclosures
The collateral method is applied to individually evaluated loans for which foreclosure is probable. The collateral method is also applied to individually evaluated loans when borrowers are experiencing financial difficulty and repayment is expected to be provided substantially through the operation or sale of the collateral. Collateral dependent loans are loans for which the repayment is expected to be provided substantially through the operation or sale of the collateral and the borrower is experiencing financial difficulty. These loans do not share common risk characteristics and are not included within the collectively evaluated loans for determining the allowance for credit losses. Under CECL, for collateral dependent loans, the Company has adopted the practical expedient to measure the allowance for credit losses based on the fair value of collateral. The allowance for credit losses is calculated on an individual loan basis based on the shortfall between the fair value of the loan's collateral, which is adjusted for liquidation costs/discounts, and amortized cost. If the fair value of the collateral exceeds the amortized cost, no allowance is required.
| 54 |
| Table of Contents |
The following table presents an analysis of collateral-dependent loans of the Company as of December 31, 2023 (dollars in thousands):
|
| Collateral Dependent Loans and Leases |
| |||||
|
| December 31, 2023 |
| |||||
|
| Real Estate |
|
| Business/ Other Assets |
| ||
1-4 Family residential construction |
| $ |
|
| $ |
| ||
Other construction, land development and land |
|
|
|
|
|
| ||
Secured by farmland |
|
|
|
|
|
| ||
Owner-occupied commercial real estate |
|
|
|
|
|
| ||
Commercial and industrial |
|
|
|
|
|
| ||
Total loans |
| $ |
|
| $ |
| ||
The following tables presents, as of December 31, 2023 and December 31, 2022 segregated by loan portfolio segment, details of the loan portfolio and the ACLL calculated in accordance with our credit loss accounting methodology for loans described above (dollars in thousands).
|
| December 31, 2023 |
| |||||||||||||||||||||
|
| Loan Balances |
|
| Allowance for Credit Losses - Loans |
| ||||||||||||||||||
|
| Loans Individually Evaluated |
|
| Loans Collectively Evaluated |
|
| Total |
|
| Loans Individually Evaluated |
|
| Loans Collectively Evaluated |
|
| Total |
| ||||||
1-4 Family residential construction |
| $ |
|
| $ |
|
| $ |
|
| $ |
|
| $ |
|
| $ |
| ||||||
Other construction, land development and land |
|
|
|
|
|
|
|
|
|
|
|
|
|
|
|
|
|
| ||||||
Secured by farmland |
|
|
|
|
|
|
|
|
|
|
|
|
|
|
|
|
|
| ||||||
Home equity – open end |
|
|
|
|
|
|
|
|
|
|
|
|
|
|
|
|
|
| ||||||
Real estate |
|
|
|
|
|
|
|
|
|
|
|
|
|
|
|
|
|
| ||||||
Home Equity – closed end |
|
|
|
|
|
|
|
|
|
|
|
|
|
|
|
|
|
| ||||||
Multifamily |
|
|
|
|
|
|
|
|
|
|
|
|
|
|
|
|
|
| ||||||
Owner-occupied commercial real estate |
|
|
|
|
|
|
|
|
|
|
|
|
|
|
|
|
|
| ||||||
Other commercial real estate |
|
|
|
|
|
|
|
|
|
|
|
|
|
|
|
|
|
| ||||||
Agricultural loans |
|
|
|
|
|
|
|
|
|
|
|
|
|
|
|
|
|
| ||||||
Commercial and industrial |
|
|
|
|
|
|
|
|
|
|
|
|
|
|
|
|
|
| ||||||
Credit Cards |
|
|
|
|
|
|
|
|
|
|
|
|
|
|
|
|
|
| ||||||
Automobile loans |
|
|
|
|
|
|
|
|
|
|
|
|
|
|
|
|
|
| ||||||
Other consumer loans |
|
|
|
|
|
|
|
|
|
|
|
|
|
|
|
|
|
| ||||||
Municipal loans |
|
|
|
|
|
|
|
|
|
|
|
|
|
|
|
|
|
| ||||||
Total loans |
| $ |
|
| $ |
|
| $ |
|
| $ |
|
| $ |
|
| $ |
| ||||||
| 55 |
| Table of Contents |
|
| December 31, 2022 |
| |||||||||
|
| Loan Receivable |
|
| Individually Evaluated for Impairment |
|
| Collectively Evaluated for Impairment |
| |||
Construction/Land Development |
| $ |
|
| $ |
|
| $ |
| |||
Farmland |
|
|
|
|
|
|
|
|
| |||
Real Estate |
|
|
|
|
|
|
|
|
| |||
Multi-Family |
|
|
|
|
|
|
|
|
| |||
Commercial Real Estate |
|
|
|
|
|
|
|
|
| |||
Home Equity – closed end |
|
|
|
|
|
|
|
|
| |||
Home Equity –open end |
|
|
|
|
|
|
|
|
| |||
Commercial & Industrial – Non-Real Estate |
|
|
|
|
|
|
|
|
| |||
Consumer |
|
|
|
|
|
|
|
|
| |||
Dealer Finance |
|
|
|
|
|
|
|
|
| |||
Credit Cards |
|
|
|
|
|
|
|
|
| |||
Gross Loans |
|
|
|
|
|
|
|
|
| |||
Less: Unamortized net deferred loan fees |
|
| ( | ) |
|
|
|
|
| ( | ) | |
Total |
| $ |
|
| $ |
|
| $ |
| |||
Prior to the adoption of ASU 2016-13, loans were considered impaired when, based on current information and events, it was probable the Company would be unable to collect all amounts due in accordance with the original contractual terms of the loan agreements. Impaired loans include loans on nonaccrual status and accruing troubled debt restructurings. When determining if the Company would be unable to collect all principal and interest payments due in accordance with the contractual terms of the loan agreement, the Company considered the borrower’s capacity to pay, which included such factors as the borrower’s current financial statements, an analysis of global cash flow sufficient to pay all debt obligations and an evaluation of secondary sources of repayment, such as guarantor support and collateral value.
The following table presents loans individually evaluated for impairment by class of loans as of December 31, 2022 (dollars in thousands). The Recorded Investment is defined as the original principal balance less principal payments, charge-offs and nonaccrual payments applied to principal.
|
| December 31, 2022 |
| |||||||||||||||||
|
|
|
|
| Unpaid |
|
|
|
| Average |
|
| Interest |
| ||||||
|
| Recorded |
|
| Principal |
|
| Related |
|
| Recorded |
|
| Income |
| |||||
|
| Investment |
|
| Balance |
|
| Allowance |
|
| Investment |
|
| Recognized |
| |||||
Impaired loans with no related allowance recorded: |
|
|
|
|
|
|
|
|
|
|
|
|
|
|
| |||||
Construction/Land Development |
| $ |
|
| $ |
|
| $ |
|
| $ |
|
| $ |
| |||||
Farmland |
|
|
|
|
|
|
|
|
|
|
|
|
|
|
| |||||
Real Estate |
|
|
|
|
|
|
|
|
|
|
|
|
|
|
| |||||
Commercial Real Estate |
|
|
|
|
|
|
|
|
|
|
|
|
|
|
| |||||
Dealer Finance |
|
|
|
|
|
|
|
|
|
|
|
|
|
|
| |||||
|
|
|
|
|
|
|
|
|
|
|
|
|
|
|
| |||||
Impaired loans with an allowance recorded: |
|
|
|
|
|
|
|
|
|
|
|
|
|
|
|
|
|
|
|
|
Construction/Land Development |
|
|
|
|
|
|
|
|
|
|
|
|
|
|
| |||||
Real Estate |
|
|
|
|
|
|
|
|
|
|
|
|
|
|
| |||||
Commercial Real Estate |
|
|
|
|
|
|
|
|
|
|
|
|
|
|
| |||||
Dealer Finance |
|
|
|
|
|
|
|
|
|
|
|
|
|
|
| |||||
|
|
|
|
|
|
|
|
|
|
|
|
|
|
|
| |||||
Total impaired loans |
| $ |
|
| $ |
|
| $ |
|
| $ |
|
| $ |
| |||||
| 56 |
| Table of Contents |
Credit Quality Indicators
The Company presents loan and lease portfolio segments and classes by credit quality indicator and vintage year. The Company defines the vintage date for the purpose of this disclosure as the date of the most recent credit decision. Renewals are categorized as new credit decisions and reflect the renewal date as the vintage date, except for renewals of loans modified for borrowers experiencing financial difficulty which are presented in the original vintage.
Upon adoption of ASC 326, the Company consolidated its internal risk ratings 1 through 5 into a "pass” category. The credit quality indicators for watch and substandard remain unchanged. Doubtful loans are charged off; dealer finance loans utilize the updated credit quality indicators. Credit cards are classified as pass or substandard.
Description of the Company’s credit quality indicators under CECL:
Pass: Loans in all classes that are part of the commercial and consumer portfolio segments that are not adversely rated, are contractually current as to principal and interest, and are otherwise in compliance with the contractual terms of the loan agreement. Management believes that there is a low likelihood of loss related to those loans that are considered pass.
Grade 6 – Watch: Loans are currently protected but are weak due to negative balance sheet or income statement trends. There may be a lack of effective control over collateral or the existence of documentation deficiencies. These loans have potential weaknesses that deserve management’s close attention. Other reasons supporting this classification include adverse economic or market conditions, pending litigation or any other material weakness. Existing loans that become 60 or more days past due are placed in this category pending a return to current status.
Grade 7 – Substandard: Loans having well-defined weaknesses where a payment default and or loss is possible, but not yet probable. Cash flow is inadequate to service the debt under the current payment, or terms, with prospects that the condition is permanent. Loans classified as substandard are inadequately protected by the current net worth and paying capacity of the borrower and there is the likelihood that collateral will have to be liquidated and/or guarantor(s) called upon to repay the debt. Generally, the loan is considered collectible as to both principal and interest, primarily because of collateral coverage, however, if the deficiencies are not corrected quickly; there is a probability of loss.
Credit cards are classified as pass or substandard. A credit card is substandard when payments of principal and interest are past due 90 days or more.
| 57 |
| Table of Contents |
The following table presents the Company’s recorded investment in loans by credit quality indicators by year of origination as of December 31, 2023 (dollars in thousands):
|
| Term Loans by Year of Origination |
|
|
|
|
|
|
| |||||||||||||||||||||||
|
| 2023 |
|
| 2022 |
|
| 2021 |
|
| 2020 |
|
| 2019 |
|
| Prior |
|
| Revolving |
|
| Total |
| ||||||||
1-4 Family residential construction |
| |||||||||||||||||||||||||||||||
Pass |
| $ |
|
| $ |
|
| $ |
|
| $ |
|
| $ |
|
| $ |
|
| $ |
|
| $ |
| ||||||||
Watch |
|
|
|
|
|
|
|
|
|
|
|
|
|
|
|
|
|
|
|
|
|
|
|
| ||||||||
Substandard |
|
|
|
|
|
|
|
|
|
|
|
|
|
|
|
|
|
|
|
|
|
|
|
| ||||||||
Total 1-4 Family residential construction |
|
|
|
|
|
|
|
|
|
|
|
|
|
|
|
|
|
|
|
|
|
|
|
| ||||||||
Current period gross write-offs |
|
|
|
|
|
|
|
|
|
|
|
|
|
|
|
|
|
|
|
|
|
|
|
| ||||||||
|
|
|
|
|
|
|
|
|
|
|
|
|
|
|
|
|
|
|
|
|
|
|
|
|
|
|
|
|
|
|
|
|
Other construction, land development and land | ||||||||||||||||||||||||||||||||
Pass |
|
|
|
|
|
|
|
|
|
|
|
|
|
|
|
|
|
|
|
|
|
|
|
| ||||||||
Watch |
|
|
|
|
|
|
|
|
|
|
|
|
|
|
|
|
|
|
|
|
|
|
|
| ||||||||
Substandard |
|
|
|
|
|
|
|
|
|
|
|
|
|
|
|
|
|
|
|
|
|
|
|
| ||||||||
Total Other construction, land development and land |
|
|
|
|
|
|
|
|
|
|
|
|
|
|
|
|
|
|
|
|
|
|
|
| ||||||||
Current period gross write-offs |
|
|
|
|
|
|
|
|
|
|
|
|
|
|
|
|
|
|
|
|
|
|
|
| ||||||||
|
|
|
|
|
|
|
|
|
|
|
|
|
|
|
|
|
|
|
|
|
|
|
|
|
|
|
|
|
|
|
|
|
Secured by farmland | ||||||||||||||||||||||||||||||||
Pass |
|
|
|
|
|
|
|
|
|
|
|
|
|
|
|
|
|
|
|
|
|
|
|
| ||||||||
Watch |
|
|
|
|
|
|
|
|
|
|
|
|
|
|
|
|
|
|
|
|
|
|
|
| ||||||||
Substandard |
|
|
|
|
|
|
|
|
|
|
|
|
|
|
|
|
|
|
|
|
|
|
|
| ||||||||
Total Secured by farmland |
|
|
|
|
|
|
|
|
|
|
|
|
|
|
|
|
|
|
|
|
|
|
|
| ||||||||
Current period gross write-offs |
|
|
|
|
|
|
|
|
|
|
|
|
|
|
|
|
|
|
|
|
|
|
|
| ||||||||
|
|
|
|
|
|
|
|
|
|
|
|
|
|
|
|
|
|
|
|
|
|
|
|
|
|
|
|
|
|
|
|
|
Home equity – open end | ||||||||||||||||||||||||||||||||
Pass |
|
|
|
|
|
|
|
|
|
|
|
|
|
|
|
|
|
|
|
|
|
|
|
| ||||||||
Watch |
|
|
|
|
|
|
|
|
|
|
|
|
|
|
|
|
|
|
|
|
|
|
|
| ||||||||
Substandard |
|
|
|
|
|
|
|
|
|
|
|
|
|
|
|
|
|
|
|
|
|
|
|
| ||||||||
Total Home equity - open end |
|
|
|
|
|
|
|
|
|
|
|
|
|
|
|
|
|
|
|
|
|
|
|
| ||||||||
Current period gross write-offs |
|
|
|
|
|
|
|
|
|
|
|
|
|
|
|
|
|
|
|
|
|
|
|
| ||||||||
|
|
|
|
|
|
|
|
|
|
|
|
|
|
|
|
|
|
|
|
|
|
|
|
|
|
|
|
|
|
|
|
|
Real estate | ||||||||||||||||||||||||||||||||
Pass |
|
|
|
|
|
|
|
|
|
|
|
|
|
|
|
|
|
|
|
|
|
|
|
| ||||||||
Watch |
|
|
|
|
|
|
|
|
|
|
|
|
|
|
|
|
|
|
|
|
|
|
|
| ||||||||
Substandard |
|
|
|
|
|
|
|
|
|
|
|
|
|
|
|
|
|
|
|
|
|
|
|
| ||||||||
Total Real estate |
|
|
|
|
|
|
|
|
|
|
|
|
|
|
|
|
|
|
|
|
|
|
|
| ||||||||
Current period gross write-offs |
|
|
|
|
|
|
|
|
|
|
|
|
|
|
|
|
|
|
|
|
|
|
|
| ||||||||
|
|
|
|
|
|
|
|
|
|
|
|
|
|
|
|
|
|
|
|
|
|
|
|
|
|
|
|
|
|
|
|
|
Home Equity – closed end | ||||||||||||||||||||||||||||||||
Pass |
|
|
|
|
|
|
|
|
|
|
|
|
|
|
|
|
|
|
|
|
|
|
|
| ||||||||
Watch |
|
|
|
|
|
|
|
|
|
|
|
|
|
|
|
|
|
|
|
|
|
|
|
| ||||||||
Substandard |
|
|
|
|
|
|
|
|
|
|
|
|
|
|
|
|
|
|
|
|
|
|
|
| ||||||||
Total Home Equity - closed end |
|
|
|
|
|
|
|
|
|
|
|
|
|
|
|
|
|
|
|
|
|
|
|
| ||||||||
Current period gross write-offs |
|
|
|
|
|
|
|
|
|
|
|
|
|
|
|
|
|
|
|
|
|
|
|
| ||||||||
|
|
|
|
|
|
|
|
|
|
|
|
|
|
|
|
|
|
|
|
|
|
|
|
|
|
|
|
|
|
|
|
|
Multifamily | ||||||||||||||||||||||||||||||||
Pass |
|
|
|
|
|
|
|
|
|
|
|
|
|
|
|
|
|
|
|
|
|
|
|
| ||||||||
Watch |
|
|
|
|
|
|
|
|
|
|
|
|
|
|
|
|
|
|
|
|
|
|
|
| ||||||||
Substandard |
|
|
|
|
|
|
|
|
|
|
|
|
|
|
|
|
|
|
|
|
|
|
|
| ||||||||
Total Multifamily |
|
|
|
|
|
|
|
|
|
|
|
|
|
|
|
|
|
|
|
|
|
|
|
| ||||||||
Current period gross write-offs |
|
|
|
|
|
|
|
|
|
|
|
|
|
|
|
|
|
|
|
|
|
|
|
| ||||||||
|
|
|
|
|
|
|
|
|
|
|
|
|
|
|
|
|
|
|
|
|
|
|
|
|
|
|
|
|
|
|
|
|
Owner-occupied commercial real estate | ||||||||||||||||||||||||||||||||
Pass |
|
|
|
|
|
|
|
|
|
|
|
|
|
|
|
|
|
|
|
|
|
|
|
| ||||||||
Watch |
|
|
|
|
|
|
|
|
|
|
|
|
|
|
|
|
|
|
|
|
|
|
|
| ||||||||
Substandard |
|
|
|
|
|
|
|
|
|
|
|
|
|
|
|
|
|
|
|
|
|
|
|
| ||||||||
Total Owner-occupied commercial real estate |
|
|
|
|
|
|
|
|
|
|
|
|
|
|
|
|
|
|
|
|
|
|
|
| ||||||||
Current period gross write-offs |
|
|
|
|
|
|
|
|
|
|
|
|
|
|
|
|
|
|
|
|
|
|
|
| ||||||||
Other commercial real estate | ||||||||||||||||||||||||||||||||
Pass |
|
|
|
|
|
|
|
|
|
|
|
|
|
|
|
|
|
|
|
|
|
|
|
| ||||||||
Watch |
|
|
|
|
|
|
|
|
|
|
|
|
|
|
|
|
|
|
|
|
|
|
|
| ||||||||
Substandard |
|
|
|
|
|
|
|
|
|
|
|
|
|
|
|
|
|
|
|
|
|
|
|
| ||||||||
Total Other commercial real estate |
|
|
|
|
|
|
|
|
|
|
|
|
|
|
|
|
|
|
|
|
|
|
|
| ||||||||
Current period gross write-offs |
|
|
|
|
|
|
|
|
|
|
|
|
|
|
|
|
|
|
|
|
|
|
|
| ||||||||
| 58 |
| Table of Contents |
|
| Term Loans by Year of Origination |
|
|
|
| ||||||||||||||||||||||||||
|
| 2023 |
|
| 2022 |
|
| 2021 |
|
| 2020 |
|
| 2019 |
|
| Prior |
|
| Revolving |
|
| Total |
| ||||||||
Agricultural loans |
|
|
|
|
|
|
|
|
|
|
|
|
|
|
|
|
|
|
|
|
|
|
|
| ||||||||
Pass |
|
|
|
|
|
|
|
|
|
|
|
|
|
|
|
|
|
|
|
|
|
|
|
| ||||||||
Watch |
|
|
|
|
|
|
|
|
|
|
|
|
|
|
|
|
|
|
|
|
|
|
|
| ||||||||
Substandard |
|
|
|
|
|
|
|
|
|
|
|
|
|
|
|
|
|
|
|
|
|
|
|
| ||||||||
Total Agricultural loans |
|
|
|
|
|
|
|
|
|
|
|
|
|
|
|
|
|
|
|
|
|
|
|
| ||||||||
Current period gross write-offs |
|
|
|
|
|
|
|
|
|
|
|
|
|
|
|
|
|
|
|
|
|
|
|
| ||||||||
|
|
|
|
|
|
|
|
|
|
|
|
|
|
|
|
|
|
|
|
|
|
|
|
|
|
|
|
|
|
|
|
|
Commercial and industrial |
|
|
|
|
|
|
|
|
|
|
|
|
|
|
|
|
|
|
|
|
|
|
|
|
|
|
|
|
|
|
|
|
Pass |
|
|
|
|
|
|
|
|
|
|
|
|
|
|
|
|
|
|
|
|
|
|
|
| ||||||||
Watch |
|
|
|
|
|
|
|
|
|
|
|
|
|
|
|
|
|
|
|
|
|
|
|
| ||||||||
Substandard |
|
|
|
|
|
|
|
|
|
|
|
|
|
|
|
|
|
|
|
|
|
|
|
| ||||||||
Total Commercial and industrial |
|
|
|
|
|
|
|
|
|
|
|
|
|
|
|
|
|
|
|
|
|
|
|
| ||||||||
Current period gross write-offs |
|
|
|
|
|
|
|
|
|
|
|
|
|
|
|
|
|
|
|
|
|
|
|
| ||||||||
|
|
|
|
|
|
|
|
|
|
|
|
|
|
|
|
|
|
|
|
|
|
|
|
|
|
|
|
|
|
|
|
|
Credit Cards | ||||||||||||||||||||||||||||||||
Pass |
|
|
|
|
|
|
|
| - |
|
|
| - |
|
|
| - |
|
|
| - |
|
|
|
|
|
|
| ||||
Substandard |
|
|
|
|
|
|
|
| - |
|
|
| - |
|
|
| - |
|
|
| - |
|
|
|
|
|
|
| ||||
Total Credit cards |
|
|
|
|
| - |
|
|
| - |
|
|
| - |
|
|
| - |
|
|
| - |
|
|
|
|
|
|
| |||
Current period gross write-offs |
|
|
|
|
| - |
|
|
| - |
|
|
| - |
|
|
| - |
|
|
| - |
|
|
|
|
|
|
| |||
|
|
|
|
|
|
|
|
|
|
|
|
|
|
|
|
|
|
|
|
|
|
|
|
|
|
|
|
|
|
|
|
|
Automobile loans | ||||||||||||||||||||||||||||||||
Pass |
|
|
|
|
|
|
|
|
|
|
|
|
|
|
|
|
|
|
|
| - |
|
|
|
| |||||||
Watch |
|
|
|
|
|
|
|
|
|
|
|
|
|
|
|
|
|
|
|
| - |
|
|
|
| |||||||
Substandard |
|
|
|
|
|
|
|
|
|
|
|
|
|
|
|
|
|
|
|
| - |
|
|
|
| |||||||
Total Automobile loans |
|
|
|
|
|
|
|
|
|
|
|
|
|
|
|
|
|
|
|
| - |
|
|
|
| |||||||
Current period gross write-offs |
|
|
|
|
|
|
|
|
|
|
|
|
|
|
|
|
|
|
|
| - |
|
|
|
| |||||||
|
|
|
|
|
|
|
|
|
|
|
|
|
|
|
|
|
|
|
|
|
|
|
|
|
|
|
|
|
|
|
|
|
Other consumer loans | ||||||||||||||||||||||||||||||||
Pass |
|
|
|
|
|
|
|
|
|
|
|
|
|
|
|
|
|
|
|
|
|
|
|
| ||||||||
Watch |
|
|
|
|
|
|
|
|
|
|
| - |
|
|
|
|
|
|
|
|
|
|
|
|
| |||||||
Substandard |
|
|
|
|
|
|
|
|
|
|
| - |
|
|
|
|
|
|
|
|
| - |
|
|
|
| ||||||
Total Other consumer loans |
|
|
|
|
|
|
|
|
|
|
|
|
|
|
|
|
|
|
|
|
|
|
|
| ||||||||
Current period gross write-offs |
|
| - |
|
|
|
|
|
|
|
|
|
|
|
|
|
|
|
|
|
| - |
|
|
|
| ||||||
|
|
|
|
|
|
|
|
|
|
|
|
|
|
|
|
|
|
|
|
|
|
|
|
|
|
|
|
|
|
|
|
|
Municipal loans | ||||||||||||||||||||||||||||||||
Pass |
|
| - |
|
|
|
|
|
|
|
|
|
|
|
|
|
|
|
|
|
| - |
|
|
|
| ||||||
Watch |
|
| - |
|
|
| - |
|
|
| - |
|
|
| - |
|
|
| - |
|
|
| - |
|
|
| - |
|
|
| - |
|
Substandard |
|
| - |
|
|
| - |
|
|
| - |
|
|
| - |
|
|
| - |
|
|
| - |
|
|
| - |
|
|
| - |
|
Total Municipal loans |
|
| - |
|
|
|
|
|
|
|
|
|
|
|
|
|
|
|
|
|
| - |
|
|
|
| ||||||
Current period gross write-offs |
|
| - |
|
|
| - |
|
|
| - |
|
|
| - |
|
|
| - |
|
|
| - |
|
|
| - |
|
|
| - |
|
|
|
|
|
|
|
|
|
|
|
|
|
|
|
|
|
|
|
|
|
|
|
|
|
|
|
|
|
|
|
|
|
|
Total loans |
| $ |
|
| $ |
|
| $ |
|
| $ |
|
| $ |
|
| $ |
|
| $ |
|
| $ |
| ||||||||
Less: Unamortized net deferred loan fees |
|
|
|
|
|
|
|
|
|
|
|
|
|
|
|
|
|
|
|
|
|
|
|
|
|
|
|
|
|
| ( | ) |
Loans held for investment |
|
|
|
|
|
|
|
|
|
|
|
|
|
|
|
|
|
|
|
|
|
|
|
|
|
|
|
|
| $ |
| |
|
|
|
|
|
|
|
|
|
|
|
|
|
|
|
|
|
|
|
|
|
|
|
|
|
|
|
|
|
|
|
|
|
Current period gross write-offs |
| $ |
|
| $ |
|
| $ |
|
| $ |
|
| $ |
|
| $ |
|
| $ |
|
| $ |
| ||||||||
| 59 |
| Table of Contents |
The following table shows the Company’s loan portfolio broken down by internal loan grade as of December 31, 2022 (dollars in thousands):
|
| Grade 1 Minimal Risk |
|
| Grade 2 Modest Risk |
|
| Grade 3 Average Risk |
|
| Grade 4 Acceptable Risk |
|
| Grade 5 Marginally Acceptable |
|
| Grade 6 Watch |
|
| Grade 7 Substandard |
|
| Grade 8 Doubtful |
|
| Total |
| |||||||||
Construction/Land Development |
| $ |
|
| $ |
|
| $ |
|
| $ |
|
| $ |
|
| $ |
|
| $ |
|
| $ |
|
| $ |
| |||||||||
Farmland |
|
|
|
|
|
|
|
|
|
|
|
|
|
|
|
|
|
|
|
|
|
|
|
|
|
|
| |||||||||
Real Estate |
|
|
|
|
|
|
|
|
|
|
|
|
|
|
|
|
|
|
|
|
|
|
|
|
|
|
| |||||||||
Multi-Family |
|
|
|
|
|
|
|
|
|
|
|
|
|
|
|
|
|
|
|
|
|
|
|
|
|
|
| |||||||||
Commercial Real Estate |
|
|
|
|
|
|
|
|
|
|
|
|
|
|
|
|
|
|
|
|
|
|
|
|
|
|
| |||||||||
Home Equity – closed end |
|
|
|
|
|
|
|
|
|
|
|
|
|
|
|
|
|
|
|
|
|
|
|
|
|
|
| |||||||||
Home Equity – open end |
|
|
|
|
|
|
|
|
|
|
|
|
|
|
|
|
|
|
|
|
|
|
|
|
|
|
| |||||||||
Commercial & Industrial - Non-Real Estate |
|
|
|
|
|
|
|
|
|
|
|
|
|
|
|
|
|
|
|
|
|
|
|
|
|
|
| |||||||||
Consumer (excluding dealer) |
|
|
|
|
|
|
|
|
|
|
|
|
|
|
|
|
|
|
|
|
|
|
|
|
|
|
| |||||||||
Gross loans |
| $ |
|
| $ |
|
| $ |
|
| $ |
|
| $ |
|
| $ |
|
| $ |
|
| $ |
|
| $ |
| |||||||||
Less: Unamortized net deferred loan fees |
|
|
|
|
|
|
|
|
|
|
|
|
|
|
|
|
|
|
|
|
|
|
|
|
|
|
|
|
|
|
|
|
|
| ( | ) |
Total |
|
|
|
|
|
|
|
|
|
|
|
|
|
|
|
|
|
|
|
|
|
|
|
|
|
|
|
|
|
|
|
|
| $ |
| |
|
| Credit Cards |
|
| Dealer Finance |
| ||
Performing |
| $ |
|
| $ |
| ||
Nonperforming |
|
|
|
|
|
| ||
Total |
| $ |
|
| $ |
| ||
Description of internal loan grades under Incurred Loss:
Grade 1 – Minimal Risk: Excellent credit, superior asset quality, excellent debt capacity and coverage, and recognized management capabilities.
Grade 2 – Modest Risk: Borrower consistently generates sufficient cash flow to fund debt service, excellent credit, above average asset quality and liquidity.
Grade 3 – Average Risk: Borrower generates sufficient cash flow to fund debt service. Employment (or business) is stable with good future trends. Credit is very good.
Grade 4 – Acceptable Risk: Borrower’s cash flow is adequate to cover debt service; however, unusual expenses or capital expenses must by covered through additional long-term debt. Employment (or business) stability is reasonable, but future trends may exhibit slight weakness. Credit history is good. No unpaid judgments or collection items appearing on credit report.
Grade 5 – Marginally acceptable: Credit to borrowers who may exhibit declining earnings, may have leverage that is materially above industry averages, liquidity may be marginally acceptable. Employment or business stability may be weak or deteriorating. May be currently performing as agreed but would be adversely affected by developing factors such as layoffs, illness, reduced hours or declining business prospects. Credit history shows weaknesses, past dues, paid or disputed collections and judgments, but does not include borrowers that are currently past due on obligations or with unpaid, undisputed judgments.
| 60 |
| Table of Contents |
Grade 6 – Watch: Loans are currently protected but are weak due to negative balance sheet or income statement trends. There may be a lack of effective control over collateral or the existence of documentation deficiencies. These loans have potential weaknesses that deserve management’s close attention. Other reasons supporting this classification include adverse economic or market conditions, pending litigation or any other material weakness. Existing loans that become 60 or more days past due are placed in this category pending a return to current status.
Grade 7 – Substandard: Loans having well-defined weaknesses where a payment default and or loss is possible, but not yet probable. Cash flow is inadequate to service the debt under the current payment, or terms, with prospects that the condition is permanent. Loans classified as substandard are inadequately protected by the current net worth and paying capacity of the borrower and there is the likelihood that collateral will have to be liquidated and/or guarantor(s) called upon to repay the debt. Generally, the loan is considered collectible as to both principal and interest, primarily because of collateral coverage. However, if the deficiencies are not corrected quickly, there is a probability of loss.
Grade 8 – Doubtful: Loans having all the characteristics of a substandard credit, but available information indicates it is unlikely the loan will be repaid in its entirety. Cash flow is insufficient to service the debt. It may be difficult to project the exact amount of loss, but the probability of some loss is great. Loans are to be placed on non-accrual status when any portion is classified doubtful.
Credit card and dealer finance loans are classified as performing or nonperforming. A loan is nonperforming when payments of principal and interest are past due 90 days or more.
NOTE 4 ALLOWANCE FOR CREDIT LOSSES
The allowance for credit losses consists of the allowance for credit losses on loans and the reserve for unfunded commitments. The Company’s ACL is governed by the Company’s ACL Committee, which reports to the Board of Directors and contains representatives from the Company’s finance, credit, and risk teams, and is responsible for calculating the Company’s estimate of expected credit losses and resulting ACL. The ACL Committee considers the quantitative model results and qualitative factors when finalizing the ACL. The Company’s ACL model is subject to the Company’s models risk management program, which is overseen by the Director of Risk Management that reports to the Company’s Board Risk Committee.
Allowance for Credit Losses on Loans
The following tables show the allowance for credit losses activity by loan segment for the years ended December 31, 2023, (dollars in thousands).
Allowance for Credit Losses and Carrying Amount of Loans For the Year Ended December 31, 2023 | ||||||||||||||||||||||||
|
| Beginning Balance |
|
| Adjustment for adoption of ASU 2016-13 |
|
| Charge-offs |
|
| Recoveries |
|
| Provision for loan credit losses |
|
| Ending Balance |
| ||||||
1-4 Family residential construction |
| $ |
|
| $ |
|
| $ |
|
| $ |
|
| $ |
|
| $ |
| ||||||
Other construction, land development and land |
|
|
|
|
|
|
|
|
|
|
|
|
|
| ( | ) |
|
|
| |||||
Secured by farmland |
|
|
|
|
|
|
|
|
|
|
|
|
|
| ( | ) |
|
|
| |||||
Home equity – open end |
|
|
|
|
| ( | ) |
|
|
|
|
|
|
|
| ( | ) |
|
|
| ||||
Real estate |
|
|
|
|
| ( | ) |
|
|
|
|
|
|
|
| ( | ) |
|
|
| ||||
Home Equity – closed end |
|
|
|
|
|
|
|
|
|
|
|
|
|
| ( | ) |
|
|
| |||||
Multifamily |
|
|
|
|
|
|
|
|
|
|
|
|
|
| ( | ) |
|
|
| |||||
Owner-occupied commercial real estate |
|
|
|
|
|
|
|
|
|
|
|
|
|
| ( | ) |
|
|
| |||||
Other commercial real estate |
|
|
|
|
| ( | ) |
|
|
|
|
|
|
|
| ( | ) |
|
|
| ||||
Agricultural loans |
|
|
|
|
| ( | ) |
|
|
|
|
|
|
|
| ( | ) |
|
|
| ||||
Commercial and industrial |
|
|
|
|
|
|
|
|
|
|
|
|
|
|
|
|
|
| ||||||
Credit Cards |
|
|
|
|
|
|
|
|
|
|
|
|
|
|
|
|
|
| ||||||
Automobile loans |
|
|
|
|
| ( | ) |
|
|
|
|
|
|
|
|
|
|
|
| |||||
Other consumer loans |
|
|
|
|
|
|
|
|
|
|
|
|
|
|
|
|
|
| ||||||
Municipal loans |
|
|
|
|
|
|
|
|
|
|
|
|
|
|
|
|
|
| ||||||
Total loans |
| $ |
|
| $ |
|
| $ |
|
| $ |
|
| $ |
|
| $ |
| ||||||
| 61 |
| Table of Contents |
Prior to the adoption of ASC 326 on January 1, 2023, the Company calculated the allowance for loan losses under the incurred loss methodology. The following tables are disclosures related to the allowance for loan losses in prior periods (dollars in thousands).
Allowance for Loan Losses and Carrying Amount of Loans and Leases For the Year Ended December 31, 2022 | ||||||||||||||||||||||||||||
December 31, 2022 |
| Beginning Balance |
|
| Charge-offs |
|
| Recoveries |
|
| Provision for (Recovery of) Loan Losses |
|
| Ending Balance |
|
| Individually Evaluated for Impairment |
|
| Collectively Evaluated for Impairment |
| |||||||
Allowance for loan losses: |
|
|
|
|
|
|
|
|
| |||||||||||||||||||
Construction/Land Development |
| $ |
|
| $ |
|
| $ |
|
| $ |
|
| $ |
|
| $ |
|
| $ |
| |||||||
Farmland |
|
|
|
|
|
|
|
|
|
|
|
|
|
|
|
|
|
|
|
|
| |||||||
Real Estate |
|
|
|
|
|
|
|
|
|
|
|
|
|
|
|
|
|
|
|
|
| |||||||
Multi-Family |
|
|
|
|
|
|
|
|
|
|
|
|
|
|
|
|
|
|
|
|
| |||||||
Commercial Real Estate |
|
|
|
|
|
|
|
|
|
|
| ( | ) |
|
|
|
|
|
|
|
|
| ||||||
Home Equity – closed end |
|
|
|
|
|
|
|
|
|
|
| ( | ) |
|
|
|
|
|
|
|
|
| ||||||
Home Equity – open end |
|
|
|
|
|
|
|
|
|
|
| ( | ) |
|
|
|
|
|
|
|
|
| ||||||
Commercial & Industrial – Non- Real Estate |
|
|
|
|
|
|
|
|
|
|
|
|
|
|
|
|
|
|
|
|
| |||||||
Consumer |
|
|
|
|
|
|
|
|
|
|
| ( | ) |
|
|
|
|
|
|
|
|
| ||||||
Dealer Finance |
|
|
|
|
|
|
|
|
|
|
|
|
|
|
|
|
|
|
|
|
| |||||||
Credit Cards |
|
|
|
|
|
|
|
|
|
|
|
|
|
|
|
|
|
|
|
|
| |||||||
Total |
| $ |
|
| $ |
|
| $ |
|
| $ |
|
| $ |
|
| $ |
|
| $ |
| |||||||
Unfunded Commitments
The Company maintains an allowance for off-balance sheet credit exposures such as unfunded balances for existing lines of credit, commitments to extend future credit, as well as both standby and commercial letters of credit when there is a contractual obligation to extend credit and when this extension of credit is not unconditionally cancellable (i.e. commitment cannot be canceled at any time). The allowance for off-balance sheet credit exposures is adjusted as a provision for credit loss expense. The estimate includes consideration of the likelihood that funding will occur, which is based on a historical funding study derived from internal information, and an estimate of expected credit losses on commitments expected to be funded over its estimated life, which are the same loss rates that are used in computing the allowance for credit losses on loans and are discussed above. The allowance for credit losses for unfunded loan commitments of $
The following table presents the balance and activity in the allowance for credit losses for unfunded loan commitments for the year ended December 31, 2023 (dollars in thousands).
|
| Total Allowance for Credit Losses – Unfunded Commitments |
| |
Balance, December 31, 2022 |
| $ |
| |
Adjustment to allowance for unfunded commitments for adoption of ASU 2016-13 |
|
|
| |
Recovery of credit losses – unfunded commitments |
|
| ( | ) |
Balance, December 31, 2023 |
| $ |
| |
NOTE 5 BANK PREMISES AND EQUIPMENT
Bank premises and equipment as of December 31 are summarized as follows (dollars in thousands):
|
| 2023 |
|
| 2022 |
| ||
Land |
| $ |
|
| $ |
| ||
Buildings and improvements |
|
|
|
|
|
| ||
Furniture and equipment |
|
|
|
|
|
| ||
Total |
|
|
|
|
|
| ||
Accumulated depreciation |
|
| ( | ) |
|
| ( | ) |
Premises and equipment, net |
| $ |
|
| $ |
| ||
| 62 |
| Table of Contents |
Depreciation expense for the years ended December 31, 2023 and 2002 was $
NOTE 6 LEASES
Lease liabilities represent the Company’s obligation to make lease payments and are presented at each reporting date as the net present value of the remaining contractual cash flows. Cash flows are discounted at the Company’s incremental borrowing rate in effect at the commencement date of the lease. Right-of-use assets represent the Company’s right to use the underlying asset for the lease term and are calculated as the sum of the lease liability and if applicable, prepaid rent, initial direct costs and any incentives received from the lessor.
The Company’s long-term lease agreements are classified as operating leases. Certain of these leases offer the option to extend the lease term and the Company has included such extensions in its calculation of the lease liabilities to the extent the options are reasonably assured of being exercised. The lease agreements do not provide for residual value guarantees and have no restrictions or covenants that would impact dividends or require incurring additional financial obligations. The Company has five operating leases for office properties.
The following tables present information about the Company’s leases (dollars in thousands):
|
| December 31, 2023 |
|
| December 31, 2022 |
| ||
Lease Liabilities (included in other liabilities) |
| $ |
|
| $ |
| ||
Right-of-use assets (included in other assets) |
| $ |
|
| $ |
| ||
Weighted average remaining lease term |
|
|
|
| ||||
Weighted average discount rate |
|
| % |
|
| % | ||
|
| 2023 |
|
| 2022 |
| ||
Lease cost |
|
|
|
|
|
|
|
|
Operating lease cost |
| $ |
|
| $ |
| ||
Total lease cost |
| $ |
|
| $ |
| ||
|
|
|
|
|
|
|
|
|
Cash paid for amounts included in the measurement of lease liabilities |
| $ |
|
| $ |
| ||
A maturity analysis of operating lease liabilities and reconciliation of the undiscounted cash flows to the total of operating lease liabilities is as follows (dollars in thousands):
Lease payments due |
| As of December 31, 2023 |
| |
Twelve months ending December 31, 2024 |
| $ |
| |
Twelve months ending December 31, 2025 |
|
|
| |
Twelve months ending December 31, 2026 |
|
|
| |
Twelve months ending December 31, 2027 |
|
|
| |
Twelve months ending December 31, 2028 |
|
|
| |
Thereafter |
|
|
| |
Total undiscounted cash flows |
| $ |
| |
Discount |
|
| ( | ) |
Lease liabilities |
| $ |
| |
NOTE 7 OTHER REAL ESTATE OWNED
The table below reflects other real estate owned (OREO) activity for 2023 and 2022 (dollars in thousands).
|
| 2023 |
|
| 2022 |
| ||
Balance as of January 1 |
| $ |
|
| $ |
| ||
Purchase of foreclosed real estate |
|
|
|
|
|
| ||
Loans transferred to OREO |
|
|
|
|
|
| ||
Sale of OREO |
|
|
|
|
| ( | ) | |
Write down of OREO and losses on sale |
|
|
|
|
| ( | ) | |
Balance as of December 31 |
| $ |
|
| $ |
| ||
| 63 |
| Table of Contents |
Expenses related to foreclosed assets include: |
| 2023 |
|
| 2022 |
| ||
Net loss on sales |
| $ |
|
| $ |
| ||
Expenses related to foreclosed assets |
| $ |
|
| $ |
| ||
There was one residential real estate property in other real estate owned properties at December 31, 2023. The loan was charged off in 2022. At December 31, 2023, the recorded investment of consumer mortgage loans secured by residential real estate properties for which formal foreclosure procedures are in process is $
NOTE 8 DEPOSITS
Time deposits that meet or exceed the FDIC insurance limit of $
2024 |
| $ |
| |
2025 |
|
|
| |
2026 |
|
|
| |
2027 |
|
|
| |
2028 |
|
|
| |
Thereafter |
|
|
| |
Total |
| $ |
|
NOTE 9 SHORT TERM DEBT
Short-term debt, all maturing within 12 months, as of December 31, 2023 and 2022 is summarized as follows (dollars in thousands).
|
| Highest Month-End Balance |
|
| Outstanding at Year End |
|
| Average Balance |
|
| Weighted Average Rate |
| ||||
2023 |
|
|
|
|
|
|
|
|
|
|
|
| ||||
Federal funds purchased |
| $ |
|
| $ |
|
| $ |
|
|
| % | ||||
FHLB short-term |
|
|
|
|
|
|
|
|
|
|
| % | ||||
Totals |
|
|
|
|
| $ |
|
| $ |
|
|
| % | |||
|
|
|
|
|
|
|
|
|
|
|
|
|
|
|
|
|
2022 |
|
|
|
|
|
|
|
|
|
|
|
|
|
|
|
|
Federal funds purchased |
| $ |
|
| $ |
|
| $ |
|
|
| % | ||||
FHLB short-term |
|
|
|
|
|
|
|
|
|
|
| % | ||||
Totals |
|
|
|
|
| $ |
|
| $ |
|
|
| % | |||
The Company utilizes short-term debt such as Federal funds purchased and FHLB short-term borrowings to support loan growth and provide liquidity. Federal funds purchased are unsecured overnight borrowings from other financial institutions. FHLB short-term debt can be a daily rate variable loan that acts as a line of credit or a fixed rate advance, depending on the needs of the Company. FHLB advances are secured by a blanket lien on the qualifying loans in the Company’s residential, commercial, agriculture, and home equity loan portfolios. Short-term debt totaled $
As of December 31, 2023, the Company had unsecured lines of credit with correspondent banks totaling $
NOTE 10 LONG-TERM DEBT
On July 29, 2020, the Company sold and issued to an institutional accredited investor $
| 64 |
| Table of Contents |
NOTE 11 COMMITMENTS AND CONTINGENCIES
The Company makes commitments to extend credit in the normal course of business and issues standby letters of credit to meet the financing needs of its customers. The amount of the commitments represents the Company's exposure to credit loss that is not included in the consolidated balance sheet. As of the December 31, 2023 and 2022, the Company had the following commitments outstanding (dollars in thousands):
|
| 2023 |
|
| 2022 |
| ||
Commitments to extend credit |
| $ |
|
| $ |
| ||
Standby letters of credit |
|
|
|
|
|
| ||
The Company uses the same credit policies in making commitments to extend credit and issue standby letters of credit as it does for the loans reflected in the consolidated balance sheet.
Commitments to extend credit are agreements to lend to a customer if there is no violation of any condition established in the contract. Commitments generally have fixed expiration dates or other termination clauses and may require payment of a fee. Since many of the commitments are expected to expire without being drawn upon, the total commitment amounts do not necessarily represent future cash requirements. The Company evaluates each customer's creditworthiness on a case-by-case basis. Collateral required, if any, upon extension of credit is based on management's evaluation of the borrower’s ability to pay. Collateral may include accounts receivable, inventory, property, plant and equipment.
As of December 31, 2023 and 2022, the Company had cash deposits in other commercial banks in excess of FDIC insurance limits totaling $
The Company grants commercial, residential real estate and consumer loans to customers located primarily in the Shenandoah Valley of Virginia. There were no loan concentration areas greater than 25% of capital. Collateral required by the Company is determined on an individual basis depending on the purpose of the loan and the financial condition of the borrower. As of December 31, 2023, approximately 75% of the loan portfolio was secured by real estate.
NOTE 12 DERIVATIVES
Mortgage Banking Derivatives
Loans Held for Sale (“LHFS”) - The Company, through the Bank’s mortgage banking subsidiary, F&M Mortgage Company, originates residential mortgage loans for sale in the secondary market. Residential mortgage loans held for sale are sold to the permanent investor with the mortgage servicing rights released. Fair value of the Company’s LHFS is based on observable market prices for the identical instruments traded in the secondary mortgage loan markets in which the Company conducts business, totaling $
Interest Rate Lock Commitments and Forward Sales Commitments - The Company, through F&M Mortgage Company, enters commitments to originate residential mortgage loans in which the interest rate on the loan is determined prior to funding, termed interest rate lock commitments (“IRLCs”). Such rate lock commitments on mortgage loans to be sold in the secondary market are derivatives. Upon entering a commitment to originate a loan, the Company protects itself from changes in interest rates during the period prior to sale by requiring a firm purchase agreement from a permanent investor before a loan can be closed (forward sales commitment).
The Company locks in the loan and rate with an investor and commits to deliver the loan if settlement occurs on a best-efforts basis, thus limiting interest rate risk. Certain additional risks exist if the investor fails to meet its purchase obligation; however, based on historical performance and the size and nature of the investors, the Company does not expect them to fail to meet their obligation. The Company determines the fair value of the IRLCs based on the price of the underlying loans obtained from an investor for loans that will be delivered on a best-efforts basis while taking into consideration the probability that the rate loan commitments will close.
| 65 |
| Table of Contents |
The fair value of these derivative instruments is reported in “Other assets” in the Consolidated Balance Sheet at December 31, 2023, and totaled $
The Company uses fair value accounting for its forward sales commitments related to IRLCs and LHFS under ASC 825-10-15-4(b). The fair value of forward sales commitments was reported in “Other Liabilities” in the Consolidated Balance Sheet at December 31, 2023 totaled $
NOTE 13 ACCUMULATED OTHER COMPREHENSIVE LOSS
The balances in accumulated other comprehensive loss are shown in the following table (dollars in thousands):
|
| Unrealized Securities Gains (Losses) |
|
| Adjustments Related to Pension Plan |
|
| Accumulated Other Comprehensive Loss |
| |||
Balance at December 31, 2021 |
| $ | ( | ) |
| $ | ( | ) |
| $ | ( | ) |
Change in unrealized securities gains (losses), net of tax benefit of $10,873 |
|
| ( | ) |
|
|
|
|
| ( | ) | |
Change in unfunded pension liability, net of tax of $992 |
|
|
|
|
|
|
|
|
| |||
Reclassification for previously unrealized net losses realized in income, net of tax benefit of $599 |
|
|
|
|
|
|
|
|
| |||
Balance at December, 31, 2022 |
| $ | ( | ) |
| $ |
|
| $ | ( | ) | |
Change in unrealized securities gains (losses), net of tax benefit of $2,307 |
|
|
|
|
|
|
|
|
| |||
Change in unfunded pension liability, net of tax of $85 |
|
|
|
|
|
|
|
|
| |||
Balance at December, 31, 2023 |
| $ | ( | ) |
| $ |
|
| $ | ( | ) | |
During 2022, there were security losses of $
NOTE 14 REGULATORY MATTERS
Banking regulators have established a uniform system to address the adequacy of capital for financial institutions. The rules require minimum capital levels based on risk-adjusted assets. Failure to meet minimum capital requirements can initiate certain mandatory and possibly additional discretionary actions by regulators that, if undertaken, could have a direct material impact on the Bank’s financial statements. Under capital adequacy guidelines and the regulatory framework for prompt corrective action, the Bank must meet specific capital guidelines that involve quantitative measures of the Bank’s assets, liabilities, and certain off balance-sheet items as calculated under regulatory accounting practices. The Bank’s capital amounts and classification are also subject to qualitative judgments by the regulators about components, risk weightings, and other factors.
| 66 |
| Table of Contents |
The minimum capital amounts and ratios are defined in the regulations and the amounts are set forth in the table below (dollars in thousands). The Bank has maintained capital levels far above the minimum requirements throughout the year, and as of December 31, 2023 and 2022, the Bank meets all capital adequacy requirements to which they are subject.
|
| Actual |
|
| Minimum Capital Requirement |
|
| Minimum to be Well Capitalized Under Prompt Corrective Action Provisions |
| |||||||||||||||
December 31, 2023 |
| Amount |
|
| Ratio |
|
| Amount |
|
| Ratio |
|
| Amount |
|
| Ratio |
| ||||||
Total risk-based ratio |
| $ |
|
|
| % |
| $ |
|
|
| % |
| $ |
|
|
| % | ||||||
Tier 1 risk-based ratio |
|
|
|
|
| % |
|
|
|
|
| % |
|
|
|
|
| % | ||||||
Common equity tier 1 |
|
|
|
|
| % |
|
|
|
|
| % |
|
|
|
|
| % | ||||||
Tier 1 leverage ratio |
|
|
|
|
| % |
|
|
|
|
| % |
|
|
|
|
| % | ||||||
|
| Actual |
|
| Minimum Capital Requirement |
|
| Minimum to be Well Capitalized Under Prompt Corrective Action Provisions |
| |||||||||||||||
December 31, 2022 |
| Amount |
|
| Ratio |
|
| Amount |
|
| Ratio |
|
| Amount |
|
| Ratio |
| ||||||
Total risk-based ratio |
| $ |
|
|
| % |
| $ |
|
|
| % |
| $ |
|
|
| % | ||||||
Tier 1 risk-based ratio |
|
|
|
|
| % |
|
|
|
|
| % |
|
|
|
|
| % | ||||||
Common equity tier 1 |
|
|
|
|
| % |
|
|
|
|
| % |
|
|
|
|
| % | ||||||
Tier 1 leverage ratio |
|
|
|
|
| % |
|
|
|
|
| % |
|
|
|
|
| % | ||||||
NOTE 15 FAIR VALUE MEASUREMENTS
Fair value is the exchange price that would be received for an asset or paid to transfer a liability (exit price) in the principal or most advantageous market for the asset or liability in an orderly transaction between market participants on the measurement date. There are three levels of inputs that may be used to measure fair values:
Level 1 – | Valuation is based on quoted prices in active markets for identical assets and liabilities. |
Level 2 – | Valuation is based on observable inputs including quoted prices in active markets for similar assets and liabilities, quoted prices for identical or similar assets and liabilities in less active markets, and model-based valuation techniques for which significant assumptions can be derived primarily from or corroborated by observable data in the market. |
Level 3 – | Valuation is based on model-based techniques that use one or more significant inputs or assumptions that are unobservable in the market. |
The following describes the valuation techniques used by the Company to measure certain financial assets and liabilities recorded at fair value on a recurring basis in the financial statements:
Available for Sale Securities (“AFS Securities”) - AFS Securities are recorded at fair value on a recurring basis. The Company’s investment portfolio is primarily valued using fair value measurements that are considered to be Level 2. The Company has contracted with a third-party portfolio accounting service vendor for valuation of its securities portfolio. No material differences were identified during the valuation for the years ended December 31, 2023 and 2022. The carrying value of restricted FRB and FHLB stock approximates fair value based upon the redemption provisions of each entity and is therefore excluded from the following table.
Loans Held for Sale - Residential loans originated for sale in the open market are carried at fair value. Fair value is based on the price secondary markets are currently offering for similar loans using observable market data which is not materially different than cost due to the short duration between origination and sale (Level 2). Gains and losses on the sale of loans are recorded within mortgage banking income on the Consolidated Statements of Income.
Derivative assets – IRLCs - The Company recognizes IRLCs at fair value based on the price of the underlying loans obtained from an investor for loans that will be delivered on a best-efforts basis while taking into consideration the probability that the rate lock commitments will close. The Company’s IRLCs are classified as Level 2.
| 67 |
| Table of Contents |
Derivative Asset/Liability – Forward Sale Commitments - The Company uses the fair value accounting for its forward sales commitments related to IRLCs and LHFS. Best-efforts sales commitments are entered into for loans intended for sale in the secondary market at the time the borrower commitment is made. The best-efforts commitments are valued using the committed price to the counterparty against the current market price of the interest rate lock commitment or mortgage loan held for sale. The Company’s forward sale commitments are classified Level 2.
The following tables present the balances of financial assets measured at fair value on a recurring basis as of December 31, 2023, and 2022 (dollars in thousands):
December 31, 2023 |
| Total |
|
| Level 1 |
|
| Level 2 |
|
| Level 3 |
| ||||
Assets: |
|
|
|
|
|
| ||||||||||
Loans held for sale, F&M Mortgage |
| $ |
|
| $ |
|
| $ |
|
| $ |
| ||||
U. S. Treasury securities |
|
|
|
|
|
|
|
|
|
|
|
| ||||
U.S. Government sponsored enterprises |
|
|
|
|
|
|
|
|
|
|
|
| ||||
Securities issued by States and political subdivisions of the US |
|
|
|
|
|
|
|
|
|
|
|
| ||||
Mortgage-backed obligations of federal agencies |
|
|
|
|
|
|
|
|
|
|
|
| ||||
Corporate debt securities |
|
|
|
|
|
|
|
|
|
|
|
| ||||
IRLC |
|
|
|
|
|
|
|
|
|
|
|
| ||||
Assets at Fair Value |
| $ |
|
| $ |
|
| $ |
|
| $ |
| ||||
|
|
|
|
|
|
|
|
|
|
|
|
|
|
|
|
|
Liabilities: |
|
|
|
|
|
|
|
|
|
|
|
|
|
|
|
|
Forward sales commitments |
| $ |
|
| $ |
|
| $ |
|
| $ |
| ||||
Liabilities at Fair Value |
| $ |
|
| $ |
|
| $ |
|
| $ |
| ||||
December 31, 2022 |
| Total |
|
| Level 1 |
|
| Level 2 |
|
| Level 3 |
| ||||
Assets: |
|
|
|
|
|
| ||||||||||
Loans held for sale, F&M Mortgage |
| $ |
|
| $ |
|
| $ |
|
| $ |
| ||||
U. S. Treasury securities |
|
|
|
|
|
|
|
|
|
|
|
| ||||
U.S. Government sponsored enterprises |
|
|
|
|
|
|
|
|
|
|
|
| ||||
Securities issued by States and political subdivisions of the US |
|
|
|
|
|
|
|
|
|
|
|
| ||||
Mortgage-backed obligations of federal agencies |
|
|
|
|
|
|
|
|
|
|
|
| ||||
Corporate debt securities |
|
|
|
|
|
|
|
|
|
|
|
| ||||
Forward sales commitments |
|
|
|
|
|
|
|
|
|
|
|
| ||||
Assets at Fair Value |
| $ |
|
| $ |
|
| $ |
|
| $ |
| ||||
|
|
|
|
|
|
|
|
|
|
|
|
|
|
|
|
|
Liabilities: |
|
|
|
|
|
|
|
|
|
|
|
|
|
|
|
|
IRLC |
| $ |
|
| $ |
|
| $ |
|
| $ |
| ||||
Liabilities at Fair Value |
| $ |
|
| $ |
|
| $ |
|
| $ |
| ||||
Certain financial assets are measured at fair value on a nonrecurring basis in accordance with GAAP. Adjustments to the fair value of these assets usually result from the application of lower-of-cost-or-market accounting or write-downs of individual assets.
The following describes the valuation techniques used by the Company to measure certain financial assets recorded at fair value on a nonrecurring basis in the financial statements:
Collateral Dependent Loans with an ACL - In accordance with ASC 326, we may determine that an individual loan exhibits unique risk characteristics which differentiate it from other loans within our loan pools. In such cases, the loans are evaluated for expected credit losses on an individual basis and excluded from the collective evaluation. Specific allocations of the allowance for credit losses are determined by analyzing the borrower’s ability to repay amounts owed, collateral deficiencies, the relative risk grade of the loan and economic conditions affecting the borrower’s industry, among other things. A loan is collateral dependent when, based upon management's assessment, the borrower is experiencing financial difficulty and repayment is expected to be provided substantially through the operation or sale of the collateral. In such cases, expected credit losses are based on the fair value of the collateral at the measurement date, adjusted for estimated selling costs if satisfaction of the loan depends on the sale of the collateral. We reevaluate the fair value of collateral supporting collateral dependent loans on a quarterly basis. The fair value of real estate collateral supporting collateral dependent loans is evaluated by appraisal services using a methodology that is consistent with the Uniform Standards of Professional Appraisal Practice.
| 68 |
| Table of Contents |
Other Real Estate Owned - Certain assets such as other real estate owned (OREO) are measured at fair value less cost to sell. Valuation of other real estate owned is determined using current appraisals from independent parties, a level two input. If current appraisals cannot be obtained prior to reporting dates, or if declines in value are identified after a recent appraisal is received, appraisal values are discounted, resulting in Level 3 estimates. If the Company markets the property with a realtor, estimated selling costs reduce the fair value, resulting in a valuation based on Level 3 inputs. The Company had OREO with a carrying value of $55 thousand at December 31, 2023 and no OREO at December 31, 2022.
The Company markets OREO independently and with local realtors. Properties marketed by realtors are discounted by selling costs. Properties that the Company markets independently are not discounted by selling costs.
The following presents the carrying amount, fair value, and placement in the fair value hierarchy of the Company’s financial instruments as of December 31, 2023 and 2022 (dollars in thousands). Fair values for December 31, 2023 and 2022 are estimated under the exit price notion in accordance with the adoption of ASU 2016-01, “Recognition and Measurement of Financial Assets and Financial Liabilities.”
The following table summarizes the Company’s financial assets that were measured at fair value on a nonrecurring basis during the period (dollars in thousands):
|
|
|
| Fair Value Measurements Using: |
| |||||||||||
Collateral dependent loans with an ACL |
| Balance at December 31, 2023 |
|
| Level 1 |
|
| Level 2 |
|
| Level 3 |
| ||||
1-4 family residential construction |
| $ |
|
| $ |
|
| $ |
|
| $ |
| ||||
Owner-occupied commercial real estate |
|
|
|
|
|
|
|
|
|
|
|
| ||||
Commercial and industrial |
|
|
|
|
|
|
|
|
|
|
|
| ||||
Total collateral dependent loans with an ACL |
| $ |
|
| $ |
|
| $ |
|
| $ |
| ||||
OREO |
| $ |
|
| $ |
|
| $ |
|
| $ |
| ||||
|
|
|
| Fair Value Measurements Using: |
| |||||||||||
Impaired Loans |
| Balance at December 31, 2022 |
|
| Level 1 |
|
| Level 2 |
|
| Level 3 |
| ||||
Construction/Land Development |
| $ |
|
| $ |
|
| $ |
|
| $ |
| ||||
Real Estate |
|
|
|
|
|
|
|
|
|
|
|
| ||||
Commercial Real Estate |
|
|
|
|
|
|
|
|
|
|
|
| ||||
Dealer Finance |
|
|
|
|
|
|
|
|
|
|
|
| ||||
Impaired loans |
| $ |
|
| $ |
|
| $ |
|
| $ |
| ||||
The following table presents information about Level 3 Fair Value Measurements for December 31, 2023 and 2022:
| Fair Value at December 31, 2023 |
| Valuation Technique |
| Significant Unobservable Inputs |
| Range |
| ||
Collateral Dependent Loans | $ | |
| Discounted appraised value |
| Discount for selling costs and marketability |
|
| ||
OREO | $ | |
| Discounted appraised value |
| Discount for selling costs and marketability |
|
| ||
|
|
|
|
|
|
|
|
|
|
|
| Fair Value at December 31, 2022 |
| Valuation Technique |
| Significant Unobservable Inputs |
| Range |
| ||
Impaired Loans | $ |
| Discounted appraised value |
| Discount for selling costs and marketability |
|
| |||
| 69 |
| Table of Contents |
|
| 2023 Fair Value Measurements using |
| |||||||||||||||||
|
|
|
|
| Quoted Prices in Active Markets for Identical Assets |
|
| Significant Other Observable Inputs |
|
| Significant Unobservable Inputs |
|
| Total Fair Value |
| |||||
|
| Carrying Value |
|
| Level 1 |
|
| Level 2 |
|
| Level 3 |
|
| Balance |
| |||||
Assets: |
|
|
|
|
|
|
|
|
|
|
|
|
|
|
| |||||
Cash and cash equivalents |
| $ |
|
| $ |
|
| $ |
|
| $ |
|
| $ |
| |||||
Securities |
|
|
|
|
|
|
|
|
|
|
|
|
|
|
| |||||
Loans held for sale |
|
|
|
|
|
|
|
|
|
|
|
|
|
|
| |||||
Loans held for investment, net |
|
|
|
|
|
|
|
|
|
|
|
|
|
|
| |||||
Interest receivable |
|
|
|
|
|
|
|
|
|
|
|
|
|
|
| |||||
Bank owned life insurance |
|
|
|
|
|
|
|
|
|
|
|
|
|
|
| |||||
IRLC |
|
|
|
|
|
|
|
|
|
|
|
|
|
|
| |||||
Liabilities: |
|
|
|
|
|
|
|
|
|
|
|
|
|
|
|
|
|
|
|
|
Deposits |
| $ |
|
| $ |
|
| $ |
|
| $ |
|
| $ |
| |||||
Short-term debt |
|
|
|
|
|
|
|
|
|
|
|
|
|
|
| |||||
Long-term debt |
|
|
|
|
|
|
|
|
|
|
|
|
|
|
| |||||
Interest payable |
|
|
|
|
|
|
|
|
|
|
|
|
|
|
| |||||
Forward sales commitments |
|
|
|
|
|
|
|
|
|
|
|
|
|
|
| |||||
|
| 2022 Fair Value Measurements using |
| |||||||||||||||||
|
|
|
|
| Quoted Prices in Active Markets for Identical Assets |
|
| Significant Other Observable Inputs |
|
| Significant Unobservable Inputs |
|
| Total Fair Value |
| |||||
|
| Carrying Value |
|
| Level 1 |
|
| Level 2 |
|
| Level 3 |
|
| Balance |
| |||||
Assets: |
|
|
|
|
|
|
|
|
|
|
|
|
|
|
| |||||
Cash and cash equivalents |
| $ |
|
| $ |
|
| $ |
|
| $ |
|
| $ |
| |||||
Securities |
|
|
|
|
|
|
|
|
|
|
|
|
|
|
| |||||
Loans held for sale |
|
|
|
|
|
|
|
|
|
|
|
|
|
|
| |||||
Loans held for investment, net |
|
|
|
|
|
|
|
|
|
|
|
|
|
|
| |||||
Interest receivable |
|
|
|
|
|
|
|
|
|
|
|
|
|
|
| |||||
Bank owned life insurance |
|
|
|
|
|
|
|
|
|
|
|
|
|
|
| |||||
Forward sales commitments |
|
|
|
|
|
|
|
|
|
|
|
|
|
|
| |||||
Liabilities: |
|
|
|
|
|
|
|
|
|
|
|
|
|
|
|
|
|
|
|
|
Deposits |
| $ |
|
| $ |
|
| $ |
|
| $ |
|
| $ |
| |||||
Short-term debt |
|
|
|
|
|
|
|
|
|
|
|
|
|
|
| |||||
Long-term debt |
|
|
|
|
|
|
|
|
|
|
|
|
|
|
| |||||
IRLC |
|
|
|
|
|
|
|
|
|
|
|
|
|
|
| |||||
Interest payable |
|
|
|
|
|
|
|
|
|
|
|
|
|
|
| |||||
NOTE 16 EMPLOYEE BENEFITS
Defined Benefit Pension Plan - The Company has a qualified noncontributory defined benefit pension plan which covers substantially all employees hired before April 1, 2012. The plan was amended on February 15, 2023 to stop the accrual of future benefits. The Company uses December 31 as the measurement date for the defined benefit pension plan.
| 70 |
| Table of Contents |
The following table provides a reconciliation of the changes in the benefit obligations and fair value of plan assets for 2023 and 2022 (dollars in thousands):
|
| 2023 |
|
| 2022 |
| ||
Change in Benefit Obligation |
|
|
|
| ||||
Benefit obligation, beginning |
| $ |
|
| $ |
| ||
Service cost |
|
|
|
|
|
| ||
Interest cost |
|
|
|
|
|
| ||
Actuarial loss |
|
|
|
|
| ( | ) | |
Benefits paid |
|
| ( | ) |
|
| ( | ) |
Decrease in Obligation due to Curtailment |
|
|
|
|
| ( | ) | |
Settlement (gain) |
|
| ( | ) |
|
|
| |
Benefit obligation, ending |
| $ |
|
| $ |
| ||
|
|
|
|
|
|
|
|
|
Change in Plan Assets |
|
|
|
|
|
|
|
|
Fair value of plan assets, beginning |
| $ |
|
| $ |
| ||
Actual return on plan assets |
|
|
|
|
| ( | ) | |
Benefits paid |
|
| ( | ) |
|
| ( | ) |
Fair value of plan assets, ending |
| $ |
|
| $ |
| ||
Funded status at the end of the year |
| $ |
|
| $ | ( | ) | |
The fair value of plan assets is measured based on the fair value hierarchy as discussed in Note 15, “Fair Value Measurements” to the Consolidated Financial Statements. The valuations are based on third party data received as of the balance sheet date. All plan assets are considered Level 1 assets, as quoted prices exist in active markets for identical assets.
|
| 2023 |
|
| 2022 |
| ||
Amount recognized in the Consolidated Balance Sheet |
|
|
|
| ||||
Prepaid benefit cost |
| $ | ( | ) |
| $ | ( | ) |
Overfunded pension benefit obligation under ASC 325-960 |
|
|
|
|
|
| ||
Deferred taxes |
|
| ( | ) |
|
| ( | ) |
|
|
|
|
|
|
|
|
|
Amount recognized in accumulated other |
|
|
|
|
|
|
|
|
comprehensive loss |
|
|
|
|
|
|
|
|
Net (gain) |
| $ | ( | ) |
| $ | ( | ) |
Prior service cost |
|
|
|
|
|
| ||
Amount recognized |
|
| ( | ) |
|
| ( | ) |
Deferred taxes |
|
|
|
|
|
| ||
Amount recognized in accumulated comprehensive (loss) |
| $ | ( | ) |
| $ | ( | ) |
|
|
|
|
|
|
|
|
|
Accrued benefit detail |
|
|
|
|
|
|
|
|
Benefit obligation |
| $ | ( | ) |
| $ | ( | ) |
Fair value of assets |
|
|
|
|
|
| ||
Unrecognized net actuarial (income) |
|
| ( | ) |
|
| ( | ) |
Accrued benefits |
| $ | ( | ) |
| $ | ( | ) |
|
|
|
|
|
|
|
|
|
Components of net periodic benefit cost |
|
|
|
|
|
|
|
|
Service cost |
| $ |
|
| $ |
| ||
Interest cost |
|
|
|
|
|
| ||
Expected return on plan assets |
|
| ( | ) |
|
| ( | ) |
Recognized net gain due to settlement |
|
| (104 | ) |
|
|
| |
Recognized net actuarial loss |
|
|
|
|
|
| ||
Net periodic benefit cost |
| $ | ( | ) |
| $ |
| |
|
|
|
|
|
|
|
|
|
Other changes in plan assets and benefit obligations recognized in other comprehensive (income) loss |
|
|
|
|
|
|
|
|
Net gain |
| $ | ( | ) |
| $ | ( | ) |
Amortization of prior service cost |
|
|
|
|
| - |
| |
Total recognized in other comprehensive income |
| $ | ( | ) |
| $ | ( | ) |
Total recognized in net periodic benefit cost and other Comprehensive (loss) income |
| $ | ( | ) |
| $ | ( | ) |
|
|
|
|
|
|
|
|
|
Additional disclosure information |
|
|
|
|
|
|
|
|
Accumulated benefit obligation |
| $ |
|
| $ |
| ||
Vested benefit obligation |
| $ |
|
| $ |
| ||
Discount rate used for net pension cost |
|
| % |
|
| % | ||
Discount rate used for disclosure |
|
| % |
|
| % | ||
Expected return on plan assets |
|
| % |
|
| % | ||
Rate of compensation increase |
|
| % |
|
| % | ||
Average remaining service (years) |
|
|
|
|
|
| ||
| 71 |
| Table of Contents |
Funding Policy - Due to the current funding status of the plan, the Company did not make a contribution in 2023 or 2022. The net periodic pension cost of the plan for 2024 will be approximately ($
Long-Term Rate of Return - The Company, as plan sponsor, selects the expected long-term rate of return on assets assumption in consultation with investment advisors and the plan actuary. This rate is intended to reflect the average rate of earnings expected to be earned on the funds invested or to be invested to provide plan benefits. Historical performance is reviewed, especially with respect to real rates of return (net of inflation) for the major asset classes held or anticipated to be held by the trust. Undue weight is not given to recent experience, which may not continue over the measurement period, with higher significance placed on current forecasts of future long-term economic conditions.
Because assets are held in a qualified trust, anticipated returns are not reduced for taxes. Further, and solely for this purpose, the plan is assumed to continue in force and not terminate during the period during which the assets are invested. However, consideration is given to the potential impact of current and future investment policy, cash flow into and out of the trust, and expenses (both investment and non-investment) typically paid from plan assets (to the extent such expenses are not explicitly estimated within periodic cost).
Asset Allocation - The trust fund is sufficiently diversified to maintain a reasonable level of risk without imprudently sacrificing return. The Investment Manager selects investment fund managers with demonstrated experience and expertise, and funds with demonstrated historical performance. Both actively and passively managed investment strategies will allocate funds across the asset classes to develop an efficient investment structure. The pension plan’s weighted-average asset allocations as of December 31, 2023 was
Estimated Future Benefit Payments, which reflect expected future service, as appropriate, as of December 31, 2023, are as follows (dollars in thousands):
2024 |
| $ |
| |
2025 |
|
|
| |
2026 |
|
|
| |
2027 |
|
|
| |
2028 |
|
|
| |
2029-2033 |
|
|
| |
|
| $ |
|
Employee Stock Ownership Plan (ESOP) - The Company sponsors an ESOP, known as the F&M Bank Corp. Stock Bonus Plan, (the “Plan”) which provides stock ownership to substantially all employees of the Company. The Plan provides total vesting upon the attainment of five years of service. Contributions to the plan are made at the discretion of the Board of Directors and are allocated based on the compensation of each employee relative to total compensation paid by the Company. All shares issued and held by the Plan are considered outstanding in the computation of earnings per share. Dividends on Company stock are allocated and paid to participants at least annually. Shares of Company stock, when distributed, have restrictions on transferability. The Company contributed $
| 72 |
| Table of Contents |
401(k) Plan - The Company sponsors a 401(k) savings plan under which eligible employees may choose to save up to 20 percent of their salary on a pretax basis, subject to certain IRS limits. Under the Federal Safe Harbor rules employees are automatically enrolled at 3% (this increases by 1% per year up to 6%) of their salary unless elected otherwise. The Company matches one hundred percent of the first 1% contributed by the employee and fifty percent from 2% to 6% of employee contributions. Vesting in the contributions made by the Company is 100% after two years of service. Contributions under the plan amounted to $
Deferred Compensation Plan - The Company has a nonqualified deferred compensation plan for its key employees and directors. The Company may make annual contributions to the plan, and the employee or director has the option to defer a portion of their salary or bonus based on qualifying annual elections. Contributions to the plan totaled $
Investments in Life Insurance Contracts - The Bank currently offers a variety of benefit plans to all full-time employees. The costs of these plans are generally tax deductible to the Bank; however, to help offset the benefit costs and to attract and retain qualified employees, the Bank purchased Bank Owned Life Insurance (“BOLI”) contracts that will provide benefits to employees during their lifetime. Dividends received on these policies are tax-deferred and the death benefits under the policies are tax exempt. Rates of return on a tax-equivalent basis are favorable when compared to other long-term investments which the Bank might make. The accrued liability related to the BOLI contracts was $
Stock Incentive Plan - The Company has a Stock Incentive Plan was adopted by the Company’s Board, effective upon shareholder approval on May 2, 2020 and will expire on March 18, 2030. The plan provides for the granting of an option, restricted stock, restricted stock unit, stock appreciation right, or stock award to employees, directors, and consultants. It authorizes the issuance of up to
The Company’s Compensation Committee of the Board of Directors administers the plan including designating employees, directors, or other recipients to whom awards are to be granted, the amount of the award or equity to be granted, and the terms and conditions applicable to each award. On March 7, 2024, the Company’s Compensation Committee awarded
The following table summarizes the status of the Company’s nonvested awards for the year ended December 31, 2023:
|
| Shares |
|
| Weighted- Average Grant Date Fair Value Per Share |
| ||
Nonvested at December 31, 2022 |
|
|
|
| $ |
| ||
Granted |
|
|
|
|
|
| ||
Vested |
|
| ( | ) |
|
|
| |
Forfeited |
|
| ( | ) |
|
|
| |
Nonvested at December 31, 2023 |
|
|
|
|
|
| ||
NOTE 17 INCOME TAX (BENEFIT) EXPENSE
The components of income tax expense were as follows (dollars in thousands):
|
| 2023 |
|
| 2022 |
| ||
Current (benefit) expense |
| $ | ( | ) |
| $ |
| |
Deferred expense (benefit) |
|
|
|
|
| ( | ) | |
Total Income Tax (Benefit) Expense |
| $ | ( | ) |
| $ |
| |
| 73 |
| Table of Contents |
The components of deferred taxes as of December 31, were as follows (dollars in thousands):
|
| 2023 |
|
| 2022 |
| ||
Deferred Tax Assets: |
|
|
|
|
|
| ||
Allowance for credit losses |
| $ |
|
| $ |
| ||
Allowance for unfunded commitments |
|
|
|
|
|
| ||
Split Dollar Life Insurance |
|
|
|
|
|
| ||
Nonqualified deferred compensation |
|
|
|
|
|
| ||
Low-income housing partnerships losses |
|
|
|
|
|
| ||
Core deposit amortization |
|
|
|
|
|
| ||
Lease Liability |
|
|
|
|
|
| ||
Prepaid pension |
|
|
|
|
|
| ||
Unvested restricted stock |
|
|
|
|
|
| ||
Net unrealized loss on securities available for sale |
|
|
|
|
|
| ||
Total Assets |
| $ |
|
| $ |
| ||
|
| 2023 |
|
| 2022 |
| ||
Deferred Tax Liabilities: |
|
|
|
|
|
| ||
Unearned low-income housing credits |
| $ |
|
| $ |
| ||
Depreciation |
|
|
|
|
|
| ||
Investment in limited liability companies |
|
|
|
|
|
| ||
Unfunded pension benefit obligation |
|
|
|
|
|
| ||
Goodwill tax amortization |
|
|
|
|
|
| ||
Right of Use Asset |
|
|
|
|
|
| ||
Total Liabilities |
|
|
|
|
|
| ||
Net Deferred Tax Asset (included in Other Assets on Balance Sheet) |
| $ |
|
| $ |
| ||
The following table summarizes the differences between the actual income tax expense and the amounts computed using the federal statutory tax rates (dollars in thousands):
|
| 2023 |
|
| 2022 |
| ||
Tax expense at federal statutory rates |
| $ |
|
| $ |
| ||
Increases (decreases) in taxes resulting from: |
|
|
|
|
|
|
|
|
Tax-exempt income |
|
| ( | ) |
|
| ( | ) |
LIH and historic credits |
|
| ( | ) |
|
| ( | ) |
Other |
|
| ( | ) |
|
| ( | ) |
Total Income Tax (Benefit) Expense |
| $ | ( | ) |
| $ |
| |
The Company has analyzed the tax positions taken or expected to be taken in its tax returns and concluded it has no liability related to uncertain tax positions in accordance with accounting guidance related to income taxes. The Company and its subsidiaries file federal income tax returns and state income tax returns. With few exceptions, the Company is no longer subject to federal or state income tax examinations by tax authorities for years before 2020.
NOTE 18 REVENUE RECOGNITION
The majority of the Company’s noninterest income is generated from short-term contracts for fees on deposit accounts, ATM and check cards, and annuity and insurance commissions that is accounted for in accordance with ASC Topic 606, Revenue from Contracts with Customers.
Service charges on deposit accounts consist of account maintenance charges and overdrawn account fees. The Company’s performance obligation is generally satisfied, and the related revenue recognized, immediately, when the transaction occurs, or by month-end. Investment services and insurance income consists primarily of commissions received on mutual funds and other investment sales that are recognized on the trade date, which is when the Company has satisfied its performance obligation. Title insurance and real estate settlement services revenue is recognized at the time the real estate transaction is completed. ATM and Check Card Fees are primarily comprised of debit and credit card income, ATM fees, merchant services income, and other service charges. The Company’s performance obligation is generally satisfied, and the related revenue recognized, immediately, when the transaction occurs, or by month-end. Interchange fees from cardholder transactions represent a percentage of the underlying transaction value and are recognized no less than monthly.
| 74 |
| Table of Contents |
Noninterest income, segregated by revenue streams in-scope and out-of-scope of ASC 606, for December 31, 2023 and 2022 consisted of the following (dollars in thousands).
|
| Twelve Months Ended December 31, |
| |||||
|
| 2023 |
|
| 2022 |
| ||
Noninterest income |
|
|
|
|
|
| ||
Service Charges on Deposits |
| $ |
|
| $ |
| ||
Investment Services and Insurance Income |
|
|
|
|
|
| ||
Title Insurance Income |
|
|
|
|
|
| ||
ATM and check card fees |
|
|
|
|
|
| ||
Other |
|
|
|
|
|
| ||
Within scope of ASC 606 |
|
|
|
|
|
| ||
Not within scope of ASC 606 |
|
|
|
|
|
| ||
Total noninterest income |
| $ |
|
| $ |
| ||
NOTE 19 RELATED PARTY TRANSACTIONS
In the ordinary course of business, the Company may have loans issued to its executive officers, directors, and principal shareholders. Pursuant to its policy, such loans are made in the ordinary course of business and do not involve more than the normal risk of collectability.
The Company’s subsidiary bank has made loans, in the normal course of business, to the directors and officers of the Company and its subsidiaries, and to their associates. The aggregate dollar amount of these loans was $
Deposits from related parties held by the Bank at December 31, 2023 and 2022 amounted to $
NOTE 20 PARENT COMPANY FINANCIAL INFORMATION
The primary source of funds for the dividends paid by F&M Bank Corp. (for this note only, the “Parent Company”) is dividends received from its subsidiaries. The payments of dividends by the Bank to the Parent Company are subject to certain statutory limitations which contemplate that the current year earnings and earnings retained for the two preceding years may be paid to the Parent Company without regulatory approval. As of December 31, 2023, the aggregate amount of unrestricted funds that could be transferred from the Bank to the Parent Company without prior regulatory approval totaled approximately $14.8 million or 18.89% of the consolidated shareholders’ equity. No dividends were paid by the Bank to the Parent Company in 2023.
| 75 |
| Table of Contents |
Financial information for the Parent Company is as follows:
PARENT COMPANY
CONDENSED BALANCE SHEETS
AS OF DECEMBER 31, 2023 and 2022
(Dollars in thousands)
|
| 2023 |
|
| 2022 |
| ||
Assets |
|
|
|
| ||||
Cash and cash equivalents |
| $ |
|
| $ |
| ||
Investment in subsidiaries |
|
|
|
|
|
| ||
Other assets |
|
|
|
|
|
| ||
Total assets |
| $ |
|
| $ |
| ||
|
|
|
|
|
|
|
|
|
Liabilities and Stockholders’ Equity |
|
|
|
|
|
|
|
|
Long-term borrowings |
|
|
|
|
|
| ||
Other liabilities |
|
|
|
|
|
| ||
Total liabilities |
|
|
|
|
|
| ||
Total shareholders' equity |
|
|
|
|
|
| ||
Total liabilities and shareholders' equity |
| $ |
|
| $ |
| ||
PARENT COMPANY
CONDENSED STATEMENTS OF INCOME
YEARS ENDED December 31, 2023 and 2022
(Dollars in thousands)
|
| 2023 |
|
| 2022 |
| ||
Income |
|
|
|
| ||||
Dividends received from subsidiaries |
| $ |
|
| $ |
| ||
Other operating income |
|
|
|
|
|
| ||
Total income |
|
|
|
|
|
| ||
Expenses |
|
|
|
|
|
|
|
|
Interest expense |
|
|
|
|
|
| ||
Other operating expenses |
|
|
|
|
|
| ||
Total expenses |
|
|
|
|
|
| ||
Net (loss) income before income taxes and equity in undistributed net income from subsidiaries |
|
| ( | ) |
|
|
| |
Income tax benefit |
|
| ( | ) |
|
| ( | ) |
Equity in undistributed net income from subsidiaries |
|
|
|
|
|
| ||
Net Income |
| $ |
|
| $ |
| ||
| 76 |
| Table of Contents |
PARENT COMPANY
CONDENSED STATEMENTS OF CASH FLOWS
YEARS ENDED DECEMBER 31, 2023 and 2022
(Dollars in thousands)
|
| 2023 |
|
| 2022 |
| ||
Operating activities: |
|
|
|
|
|
| ||
Net income |
| $ |
|
| $ |
| ||
Adjustments to reconcile net income to net cash provided by operating activities: |
|
|
|
|
|
|
|
|
Equity in undistributed net income of subsidiaries |
|
| ( | ) |
|
| ( | ) |
Amortization of debt issuance costs |
|
|
|
|
|
| ||
(Increase) decrease in other assets |
|
| ( | ) |
|
|
| |
(Decrease) increase in other liabilities |
|
| ( | ) |
|
|
| |
Share based compensation expense |
|
|
|
|
|
| ||
Net cash (used) provided by operating activities |
|
| ( | ) |
|
|
| |
|
|
|
|
|
|
|
|
|
Investing activities: |
|
|
|
|
|
|
|
|
Purchase limited liability interest |
|
| ( | ) |
|
| ( | ) |
Net cash used in investing activities |
|
| ( | ) |
|
| ( | ) |
|
|
|
|
|
|
|
|
|
Financing activities: |
|
|
|
|
|
|
|
|
Repayments of long-term borrowings |
|
|
|
|
| ( | ) | |
Proceeds from the sale of common stock |
|
|
|
|
|
| ||
Proceeds from issuance of common stock |
|
|
|
|
|
| ||
Dividends paid in cash |
|
| ( | ) |
|
| ( | ) |
Net cash used in financing activities |
|
| ( | ) |
|
| ( | ) |
|
|
|
|
|
|
|
|
|
Decrease in cash and cash equivalents |
|
| ( | ) |
|
| ( | ) |
Cash and cash equivalents, beginning of the year |
|
|
|
|
|
| ||
Cash and cash equivalents, end of the year |
| $ |
|
| $ |
| ||
NOTE 21 SUBSEQUENT EVENTS
On March 12, 2024, the Board of Directors approved an amendment to the Virginia Bankers Association Defined Benefit Plan for Farmers & Merchants Bank to terminate the plan and fully vest all Participants effective June 1, 2024. The Plan was frozen to new participants effective April 1, 2012 and benefit accruals were frozen effective February 15, 2023. All vested benefit liabilities under the Plan will be paid following receipt of Internal Revenue Service approval and the expiration of time required for the Pension Benefit Guaranty Corporation to object.
| 77 |
| Table of Contents |
Item 9. Changes in and Disagreements with Accountants on Accounting and Financial Disclosure.
None.
Item 9A. Controls and Procedures.
Disclosure Controls and Procedures
The Company's management evaluated, with the participation of the Company's principal executive officer and principal financial officer, the effectiveness of the Company's disclosure controls and procedures (as defined in Rule 13a-15(e) under the Securities Exchange Act of 1934, as amended (the "Exchange Act")) as of the end of the period covered by this report. Based on that evaluation, the Company's principal executive officer and principal financial officer concluded that the Company's disclosure controls and procedures are effective as of December 31, 2023 to ensure that information required to be disclosed in the reports that the Company files or submits under the Exchange Act is recorded, processed, summarized and reported, within the time periods specified by the Company's management, including the Company's principal executive officer and principal financial officer, as appropriate, to allow timely decisions regarding required disclosure.
There were no changes in the Company's internal control over financial reporting (as defined in Rule 13a-15(f) of the Exchange Act) during the fourth quarter ended December 31, 2023 that have materially affected, or are reasonably likely to materially affect, the Company's internal control over financial reporting.
Because of the inherent limitations in all control systems, the Company believes that no system of controls, no matter how well designed and operated, can provide absolute assurance that all control issues have been detected.
Internal Control Over Financial Reporting
Management's Report on Internal Control Over Financial Reporting
To the F&M Bank Corp.:
Management is responsible for the preparation and fair presentation of the consolidated financial statements included in this annual report. The consolidated financial statements have been prepared in conformity with accounting principles generally accepted in the United States of America and reflect management's judgments and estimates concerning effects of events and transactions that are accounted for or disclosed.
Management is also responsible for establishing and maintaining adequate internal control over financial reporting. The Company's internal control over financial reporting includes those policies and procedures that pertain to the Company's ability to record, process, summarize and report reliable financial data. Management recognizes that there are inherent limitations in the effectiveness of any internal control over financial reporting, including the possibility of human error and the circumvention or overriding of internal control. Accordingly, even effective internal control over financial reporting can provide only reasonable assurance with respect to consolidated financial statement preparation. Further, because of changes in conditions, the effectiveness of internal control over financial reporting may vary over time.
In order to ensure that the Company's internal control over financial reporting is effective, management regularly assesses such controls and did so most recently for its financial reporting as of December 31, 2023. This assessment was based on criteria for effective internal control over financial reporting described in Internal Control Integrated Framework issued by the Committee of Sponsoring Organizations (COSO, 2013) of the Treadway Commission. Based on this assessment, management believes the Company maintained effective internal control over financial reporting as of December 31, 2023. This annual report does not include an attestation report of the Company's independent registered public accounting firm regarding internal control over financial reporting. Management's report was not subject to attestation by the Company's registered public accounting firm pursuant to rules of the Securities and Exchange Commission that permit the Company to provide only management's report in its annual report.
| 78 |
| Table of Contents |
The Board of Directors, acting through its Audit Committee, is responsible for the oversight of the Company's accounting policies, financial reporting and internal control. The Audit Committee of the Board of Directors is comprised entirely of outside directors who are independent of management. The Audit Committee is responsible for the appointment and compensation of the independent registered public accounting firm and approves decisions regarding the appointment or removal of the Company's internal auditors.
It meets periodically with management, the independent registered public accounting firm and the internal auditors to ensure that they are carrying out their responsibilities.
The Audit Committee is also responsible for performing an oversight role by reviewing and monitoring the financial, accounting and auditing procedures of the Company in addition to reviewing the Company's financial reports. The independent registered public accounting firm and the internal auditors have full and unlimited access to the Audit Committee, with or without management, to discuss the adequacy of internal control over financial reporting, and any other matter which they believe should be brought to the attention of the Audit Committee.
Item 9B. Other Information.
None.
Item 9C. Disclosure Regarding Foreign Jurisdictions that Prevent Inspections.
None.
| 79 |
| Table of Contents |
PART III
Item 10. Directors, Executive Officers and Corporate Governance.
Information regarding directors, executive officers and the audit committee financial expert is incorporated by reference from the Company’s definitive proxy statement for the Company’s 2024 Annual Meeting of Shareholders to be held on May 18, 2024 (“Proxy Statement”), under the captions “Corporate Governance and the Board of Directors – Committees of the Board – Audit Committee” and “Executive Officers who are not Directors.”
Information on Section 16(a) beneficial ownership reporting compliance for the directors and executive officers of the Company is incorporated by reference from the Proxy Statement under the caption “Delinquent Section 16(a) Reports.”
The Company has adopted a broad-based code of ethics for all employees and directors. The Company has also adopted a code of ethics tailored to senior officers who have financial responsibilities. A copy of the codes may be obtained without charge by request from the corporate secretary.
Item 11. Executive Compensation.
This information is incorporated by reference from the Proxy Statement under the caption “Executive Compensation.”
Item 12. Security Ownership of Certain Beneficial Owners and Management and Related Shareholder Matters.
This information is incorporated by reference from the Proxy Statement under the captions “Security Ownership of Directors and Executive Officers,” “Security Ownership of Certain Beneficial Owners” and “Executive Compensation.”
Item 13. Certain Relationships and Related Transactions, and Director Independence.
This information is incorporated by reference from the Proxy Statement under the caption “Certain Relationships and Related Transactions” and “Corporate Governance and the Board of Directors – Independence of Directors.”
Item 14. Principal Accountant Fees and Services.
This information is incorporated by reference from the Proxy Statement under the caption “Fees of Independent Registered Public Accounting Firm.”
| 80 |
| Table of Contents |
PART IV
Item 15. Exhibit and Financial Statement Schedules.
The following financial statements are filed as a part of this report:
(a)(1) Financial Statements
The following consolidated financial statements and reports of independent auditors of the Company are in Part II, Item 8 on pages 34 thru 41:
(a)(2) Financial Statement Schedules
All schedules are omitted since they are not required, are not applicable, or the required information is shown in the consolidated financial statements or notes thereto.
| 81 |
| Table of Contents |
(a)(3) Exhibits
The following exhibits are filed as a part of this Form 10-K:
Exhibit No. |
|
|
| ||
| ||
| ||
| ||
| ||
| ||
| ||
| ||
| ||
| ||
| ||
| ||
| ||
| ||
| ||
| Certification of Chief Executive Officer pursuant to Section 302 of the Sarbanes-Oxley Act of 2002 | |
| Certification of Chief Financial Officer pursuant to Section 302 of the Sarbanes-Oxley Act of 2002 | |
| ||
101 |
| The following materials from F&M Bank Corp.’s Annual Report on Form 10-K for the year ended December 31, 2023, formatted in Extensible Business Reporting Language (XBRL), include: (i) Consolidated Balance Sheets, (ii) Consolidated Statements of Income, (iii) Consolidated Statements of Comprehensive Income (Loss), (iv) Consolidated Statements of Changes in Shareholders’ Equity, (v) Consolidated Statements of Cash Flows and (vi) related notes (furnished herewith). |
104 |
| The cover page from F&M Bank Corp.’s Annual Report or Form 10-K for the year ended December 31, 2023, formatted in Inline XBRL (included with Exhibit 101) |
+ Indicates management contract or compensatory plan
Item 16. Form 10-K Summary.
Registrants may voluntarily include a summary of information required by Form 10-K under this Item 16. We have elected not to include such summary information.
| 82 |
| Table of Contents |
SIGNATURES
Pursuant to the requirements of Section 13 or 15(d) of the Securities Exchange Act of 1934, the registrant has duly caused this report to be signed on its behalf by the undersigned, thereunto duly authorized.
|
|
| F & M Bank Corp. (Registrant) |
| |
|
|
|
|
| |
By: | /s/ Aubrey M. Wilkerson |
|
| March 27, 2024 |
|
| Aubrey M. Wilkerson |
|
| Date |
|
| Director and Chief Executive Officer |
|
|
| |
| (Principal Executive Officer) |
|
|
|
|
Pursuant to the requirements of the Securities Exchange Act of 1934, this report has been signed below by the following persons on behalf of the registrant and in the capacities and as of the date indicated.
Signature |
| Title |
| Date |
|
|
|
|
|
|
|
/s/ Aubrey M. Wilkerson |
| Director and Chief Executive Officer |
| March 27, 2024 |
|
Aubrey M. Wilkerson |
| (Principal Executive Officer) |
|
|
|
|
|
|
|
|
|
/s/ Lisa F. Campbell |
| Executive Vice President and |
| March 27, 2024 |
|
Lisa F. Campbell |
| Chief Financial Officer |
|
|
|
|
| (Principal Financial Officer and Principal Accounting Officer) |
|
|
|
|
|
|
|
|
|
/s/ Michael W. Pugh |
| Director, Chair |
| March 27, 2024 |
|
Michael W. Pugh |
|
|
|
|
|
|
|
|
|
|
|
/s/ E. Ray Burkholder |
| Director |
| March 27, 2024 |
|
E. Ray Burkholder |
|
|
|
|
|
|
|
|
|
|
|
/s/ Larry A. Caplinger |
| Director |
| March 27, 2024 |
|
Larry A. Caplinger |
|
|
|
|
|
|
|
|
|
|
|
/s/ Hannah Hutman |
| Director |
| March 27, 2024 |
|
Hannah Hutman |
|
|
|
|
|
|
|
|
|
|
|
/s/ Anne Keeler |
| Director |
| March 27, 2024 |
|
Anne Keeler |
|
|
|
|
|
|
|
|
|
|
|
/s/ Christopher S. Runion |
| Director |
| March 27, 2024 |
|
Christopher S. Runion |
|
|
|
|
|
|
|
|
|
|
|
/s/ Daphyne Thomas |
| Director |
| March 27, 2024 |
|
Daphyne Thomas |
|
|
|
|
|
|
|
|
|
|
|
/s/ John Willingham |
| Director |
| March 27, 2024 |
|
John Willingham |
|
|
|
|
|
|
|
|
|
|
|
/s/ Dean W. Withers |
| Director |
| March 27, 2024 |
|
Dean W. Withers |
|
|
|
|
|
|
|
|
|
|
|
/s/ Peter H. Wray |
| Director |
| March 27, 2024 |
|
Peter H. Wray |
|
|
|
|
|
| 83 |