UNITED STATES SECURITIES AND EXCHANGE COMMISSION
Washington, D.C. 20549
Form 10-K
For the fiscal year ended December 31 , 2023
OR
For the transition period fromto
Commission file number: 0-50231
Federal National Mortgage Association
(Exact name of registrant as specified in its charter)
Fannie Mae | ||||
Federally chartered corporation | |||||||
(State or other jurisdiction of incorporation or organization) | (I.R.S. Employer Identification No.) | (Address of principal executive offices, including zip code) | (Registrant’s telephone number, including area code) | ||||
Securities registered pursuant to Section 12(b) of the Act:
Title of each class | Trading Symbol(s) | Name of each exchange on which registered |
None | N/A | N/A |
Securities registered pursuant to Section 12(g) of the Act:
Indicate by check mark if the registrant is a well-known seasoned issuer, as defined in Rule 405 of the Securities Act. Yes ¨ No þ
Indicate by check mark if the registrant is not required to file reports pursuant to Section 13 or 15(d) of the Act. Yes ¨ No þ
Indicate by check mark whether the registrant (1) has filed all reports required to be filed by Section 13 or Section 15(d) of the Securities Exchange Act of 1934
during the preceding 12 months (or for such shorter period that the registrant was required to file such reports), and (2) has been subject to such filing
requirements for the past 90 days. Yes þ No ¨
Indicate by check mark whether the registrant has submitted electronically every Interactive Data File required to be submitted pursuant to Rule 405 of Regulation
S-T (§ 232.405 of this chapter) during the preceding 12 months (or for such shorter period that the registrant was required to submit such files). Yes þ No ¨
Indicate by check mark whether the registrant is a large accelerated filer, an accelerated filer, a non-accelerated filer, a smaller reporting company, or an emerging
growth company. See the definitions of “large accelerated filer,” “accelerated filer,” “smaller reporting company,” and “emerging growth company” in Rule 12b-2 of
the Exchange Act.
Large accelerated filer | ☐ | ☑ | ||
Non-accelerated filer | ☐ | Smaller reporting company | ||
Emerging growth company |
If an emerging growth company, indicate by check mark if the registrant has elected not to use the extended transition period for complying with any new or revised
financial accounting standards provided pursuant to Section 13(a) of the Exchange Act. o
Indicate by check mark whether the registrant has filed a report on and attestation to its management’s assessment of the effectiveness of its internal control over
financial reporting under Section 404(b) of the Sarbanes-Oxley Act (15 U.S.C. 7262(b)) by the registered public accounting firm that prepared or issued its audit
report. ☑
If securities are registered pursuant to Section 12(b) of the Act, indicate by check mark whether the financial statements of the registrant included in the filing reflect
the correction of an error to previously issued financial statements. ☐
Indicate by check mark whether any of those error corrections are restatements that required a recovery analysis of incentive-based compensation received by any
of the registrant’s executive officers during the relevant recovery period pursuant to §240.10D-1(b). ☐
Indicate by check mark whether the registrant is a shell company (as defined in Rule 12b-2 of the Act). Yes ☐ No ☑
The aggregate market value of the common stock held by non-affiliates computed by reference to the closing price of the common stock quoted on the OTCQB on
June 30, 2023 (the last business day of the registrant’s most recently completed second fiscal quarter) was approximately $510 million.
As of February 1, 2024, there were 1,158,087,567 shares of common stock of the registrant outstanding.
Table of Contents | ||
Page | ||
PART I | ||
Item 1. | Business . . . . . . . . . . . . . . . . . . . . . . . . . . . . . . . . . . . . . . . . . . . . . . . . . . . . . . . . . . . . . . . . . . . . . . . . . . . . . . . . . . . . . . | |
About Fannie Mae . . . . . . . . . . . . . . . . . . . . . . . . . . . . . . . . . . . . . . . . . . . . . . . . . . . . . . . . . . . . . . . . . . . . . . . . . . . . . | ||
Our Mission and Strategy . . . . . . . . . . . . . . . . . . . . . . . . . . . . . . . . . . . . . . . . . . . . . . . . . . . . . . . . . . . . . . . . . . . . . . . | ||
Executive Summary . . . . . . . . . . . . . . . . . . . . . . . . . . . . . . . . . . . . . . . . . . . . . . . . . . . . . . . . . . . . . . . . . . . . . . . . . . . . | ||
Business Segments . . . . . . . . . . . . . . . . . . . . . . . . . . . . . . . . . . . . . . . . . . . . . . . . . . . . . . . . . . . . . . . . . . . . . . . . . . . . | ||
Competition . . . . . . . . . . . . . . . . . . . . . . . . . . . . . . . . . . . . . . . . . . . . . . . . . . . . . . . . . . . . . . . . . . . . . . . . . . . . . . . . . . . | ||
Mortgage Securitizations . . . . . . . . . . . . . . . . . . . . . . . . . . . . . . . . . . . . . . . . . . . . . . . . . . . . . . . . . . . . . . . . . . . . . . . . | ||
Human Capital . . . . . . . . . . . . . . . . . . . . . . . . . . . . . . . . . . . . . . . . . . . . . . . . . . . . . . . . . . . . . . . . . . . . . . . . . . . . . . . . | ||
Conservatorship and Treasury Agreements . . . . . . . . . . . . . . . . . . . . . . . . . . . . . . . . . . . . . . . . . . . . . . . . . . . . . . . . | ||
Legislation and Regulation . . . . . . . . . . . . . . . . . . . . . . . . . . . . . . . . . . . . . . . . . . . . . . . . . . . . . . . . . . . . . . . . . . . . . . | ||
Where You Can Find Additional Information . . . . . . . . . . . . . . . . . . . . . . . . . . . . . . . . . . . . . . . . . . . . . . . . . . . . . . . | ||
Forward-Looking Statements . . . . . . . . . . . . . . . . . . . . . . . . . . . . . . . . . . . . . . . . . . . . . . . . . . . . . . . . . . . . . . . . . . . . | ||
Item 1A. | Risk Factors . . . . . . . . . . . . . . . . . . . . . . . . . . . . . . . . . . . . . . . . . . . . . . . . . . . . . . . . . . . . . . . . . . . . . . . . . . . . . . . . . . . | |
Risk Factors Summary . . . . . . . . . . . . . . . . . . . . . . . . . . . . . . . . . . . . . . . . . . . . . . . . . . . . . . . . . . . . . . . . . . . . . . . | ||
GSE and Conservatorship Risk . . . . . . . . . . . . . . . . . . . . . . . . . . . . . . . . . . . . . . . . . . . . . . . . . . . . . . . . . . . . . . . | ||
Credit Risk . . . . . . . . . . . . . . . . . . . . . . . . . . . . . . . . . . . . . . . . . . . . . . . . . . . . . . . . . . . . . . . . . . . . . . . . . . . . . . . . . | ||
Operational and Model Risk . . . . . . . . . . . . . . . . . . . . . . . . . . . . . . . . . . . . . . . . . . . . . . . . . . . . . . . . . . . . . . . . . . | ||
Liquidity and Funding Risk . . . . . . . . . . . . . . . . . . . . . . . . . . . . . . . . . . . . . . . . . . . . . . . . . . . . . . . . . . . . . . . . . . . . | ||
Market and Industry Risk . . . . . . . . . . . . . . . . . . . . . . . . . . . . . . . . . . . . . . . . . . . . . . . . . . . . . . . . . . . . . . . . . . . . . | ||
Legal and Regulatory Risk . . . . . . . . . . . . . . . . . . . . . . . . . . . . . . . . . . . . . . . . . . . . . . . . . . . . . . . . . . . . . . . . . . . . | ||
General Risk . . . . . . . . . . . . . . . . . . . . . . . . . . . . . . . . . . . . . . . . . . . . . . . . . . . . . . . . . . . . . . . . . . . . . . . . . . . . . . . | ||
Item 1B. | Unresolved Staff Comments . . . . . . . . . . . . . . . . . . . . . . . . . . . . . . . . . . . . . . . . . . . . . . . . . . . . . . . . . . . . . . . . . . . . . | |
Item 1C. | Cybersecurity . . . . . . . . . . . . . . . . . . . . . . . . . . . . . . . . . . . . . . . . . . . . . . . . . . . . . . . . . . . . . . . . . . . . . . . . . . . . . . . . . | |
Item 2. | Properties . . . . . . . . . . . . . . . . . . . . . . . . . . . . . . . . . . . . . . . . . . . . . . . . . . . . . . . . . . . . . . . . . . . . . . . . . . . . . . . . . . . . . | |
Item 3. | Legal Proceedings . . . . . . . . . . . . . . . . . . . . . . . . . . . . . . . . . . . . . . . . . . . . . . . . . . . . . . . . . . . . . . . . . . . . . . . . . . . . . | |
Item 4. | Mine Safety Disclosures . . . . . . . . . . . . . . . . . . . . . . . . . . . . . . . . . . . . . . . . . . . . . . . . . . . . . . . . . . . . . . . . . . . . . . . . | |
PART II | ||
Item 5. | Market for Registrant’s Common Equity, Related Stockholder Matters and Issuer Purchases of Equity Securities . . . . . . . . . . . . . . . . . . . . . . . . . . . . . . . . . . . . . . . . . . . . . . . . . . . . . . . . . . . . . . . . . . . . . . . . . . . . . . . . . . . . . | |
Item 6. | [Reserved] . . . . . . . . . . . . . . . . . . . . . . . . . . . . . . . . . . . . . . . . . . . . . . . . . . . . . . . . . . . . . . . . . . . . . . . . . . . . . . . . . . . . | |
Item 7. | Management’s Discussion and Analysis of Financial Condition and Results of Operations . . . . . . . . . . . . . . . | |
Key Market Economic Indicators . . . . . . . . . . . . . . . . . . . . . . . . . . . . . . . . . . . . . . . . . . . . . . . . . . . . . . . . . . . . . . . . . | ||
Consolidated Results of Operations . . . . . . . . . . . . . . . . . . . . . . . . . . . . . . . . . . . . . . . . . . . . . . . . . . . . . . . . . . . . . . | ||
Consolidated Balance Sheet Analysis . . . . . . . . . . . . . . . . . . . . . . . . . . . . . . . . . . . . . . . . . . . . . . . . . . . . . . . . . . . . . | ||
Retained Mortgage Portfolio . . . . . . . . . . . . . . . . . . . . . . . . . . . . . . . . . . . . . . . . . . . . . . . . . . . . . . . . . . . . . . . . . . . . . | ||
Guaranty Book of Business . . . . . . . . . . . . . . . . . . . . . . . . . . . . . . . . . . . . . . . . . . . . . . . . . . . . . . . . . . . . . . . . . . . . . | ||
Single-Family Business . . . . . . . . . . . . . . . . . . . . . . . . . . . . . . . . . . . . . . . . . . . . . . . . . . . . . . . . . . . . . . . . . . . . . . . . . | ||
Single-Family Primary Business Activities . . . . . . . . . . . . . . . . . . . . . . . . . . . . . . . . . . . . . . . . . . . . . . . . . . . . . . | ||
Single-Family Lenders and Investors . . . . . . . . . . . . . . . . . . . . . . . . . . . . . . . . . . . . . . . . . . . . . . . . . . . . . . . . . . . | ||
Single-Family Competition . . . . . . . . . . . . . . . . . . . . . . . . . . . . . . . . . . . . . . . . . . . . . . . . . . . . . . . . . . . . . . . . . . . . | ||
Single-Family Mortgage Market . . . . . . . . . . . . . . . . . . . . . . . . . . . . . . . . . . . . . . . . . . . . . . . . . . . . . . . . . . . . . . . | ||
Single-Family Mortgage-Related Securities Issuances Share . . . . . . . . . . . . . . . . . . . . . . . . . . . . . . . . . . . . . . | ||
Single-Family Business Metrics . . . . . . . . . . . . . . . . . . . . . . . . . . . . . . . . . . . . . . . . . . . . . . . . . . . . . . . . . . . . . . . | ||
Single-Family Business Financial Results . . . . . . . . . . . . . . . . . . . . . . . . . . . . . . . . . . . . . . . . . . . . . . . . . . . . . . | ||
Fannie Mae 2023 Form 10-K | i |
Single-Family Mortgage Credit Risk Management . . . . . . . . . . . . . . . . . . . . . . . . . . . . . . . . . . . . . . . . . . . . . . . | ||
Multifamily Business . . . . . . . . . . . . . . . . . . . . . . . . . . . . . . . . . . . . . . . . . . . . . . . . . . . . . . . . . . . . . . . . . . . . . . . . . . . . | ||
Multifamily Primary Business Activities . . . . . . . . . . . . . . . . . . . . . . . . . . . . . . . . . . . . . . . . . . . . . . . . . . . . . . . . . | ||
Multifamily Lenders and Investors . . . . . . . . . . . . . . . . . . . . . . . . . . . . . . . . . . . . . . . . . . . . . . . . . . . . . . . . . . . . . | ||
Multifamily Competition . . . . . . . . . . . . . . . . . . . . . . . . . . . . . . . . . . . . . . . . . . . . . . . . . . . . . . . . . . . . . . . . . . . . . . | ||
Multifamily Mortgage Market . . . . . . . . . . . . . . . . . . . . . . . . . . . . . . . . . . . . . . . . . . . . . . . . . . . . . . . . . . . . . . . . . . | ||
Multifamily Business Metrics . . . . . . . . . . . . . . . . . . . . . . . . . . . . . . . . . . . . . . . . . . . . . . . . . . . . . . . . . . . . . . . . . . | ||
Multifamily Business Financial Results . . . . . . . . . . . . . . . . . . . . . . . . . . . . . . . . . . . . . . . . . . . . . . . . . . . . . . . . . | ||
Multifamily Mortgage Credit Risk Management . . . . . . . . . . . . . . . . . . . . . . . . . . . . . . . . . . . . . . . . . . . . . . . . . . | ||
Consolidated Credit Ratios and Select Credit Information . . . . . . . . . . . . . . . . . . . . . . . . . . . . . . . . . . . . . . . . . . . | ||
Liquidity and Capital Management . . . . . . . . . . . . . . . . . . . . . . . . . . . . . . . . . . . . . . . . . . . . . . . . . . . . . . . . . . . . . . . | ||
Risk Management . . . . . . . . . . . . . . . . . . . . . . . . . . . . . . . . . . . . . . . . . . . . . . . . . . . . . . . . . . . . . . . . . . . . . . . . . . . . . . | ||
Credit Risk Management Overview . . . . . . . . . . . . . . . . . . . . . . . . . . . . . . . . . . . . . . . . . . . . . . . . . . . . . . . . . . . . | ||
Mortgage Credit Risk Management . . . . . . . . . . . . . . . . . . . . . . . . . . . . . . . . . . . . . . . . . . . . . . . . . . . . . . . . . . . . | ||
Climate and Natural Disaster Risk Management . . . . . . . . . . . . . . . . . . . . . . . . . . . . . . . . . . . . . . . . . . . . . . . . . | ||
Institutional Counterparty Credit Risk Management . . . . . . . . . . . . . . . . . . . . . . . . . . . . . . . . . . . . . . . . . . . . . . | ||
Market Risk Management, including Interest-Rate Risk Management . . . . . . . . . . . . . . . . . . . . . . . . . . . . . . | ||
Liquidity and Funding Risk Management . . . . . . . . . . . . . . . . . . . . . . . . . . . . . . . . . . . . . . . . . . . . . . . . . . . . . . . | ||
Operational Risk Management . . . . . . . . . . . . . . . . . . . . . . . . . . . . . . . . . . . . . . . . . . . . . . . . . . . . . . . . . . . . . . . . | ||
Model Risk Management . . . . . . . . . . . . . . . . . . . . . . . . . . . . . . . . . . . . . . . . . . . . . . . . . . . . . . . . . . . . . . . . . . . . . | ||
Critical Accounting Estimates . . . . . . . . . . . . . . . . . . . . . . . . . . . . . . . . . . . . . . . . . . . . . . . . . . . . . . . . . . . . . . . . . . . . | ||
Impact of Future Adoption of New Accounting Guidance . . . . . . . . . . . . . . . . . . . . . . . . . . . . . . . . . . . . . . . . . . . . . | ||
Glossary of Terms Used in This Report . . . . . . . . . . . . . . . . . . . . . . . . . . . . . . . . . . . . . . . . . . . . . . . . . . . . . . . . . . . | ||
Item 7A. | Quantitative and Qualitative Disclosures about Market Risk . . . . . . . . . . . . . . . . . . . . . . . . . . . . . . . . . . . . . . . . . . | |
Item 8. | Financial Statements and Supplementary Data . . . . . . . . . . . . . . . . . . . . . . . . . . . . . . . . . . . . . . . . . . . . . . . . . . . . | |
Item 9. | Changes in and Disagreements with Accountants on Accounting and Financial Disclosure . . . . . . . . . . . . . . . | |
Item 9A. | Controls and Procedures . . . . . . . . . . . . . . . . . . . . . . . . . . . . . . . . . . . . . . . . . . . . . . . . . . . . . . . . . . . . . . . . . . . . . . . . | |
Item 9B. | Other Information . . . . . . . . . . . . . . . . . . . . . . . . . . . . . . . . . . . . . . . . . . . . . . . . . . . . . . . . . . . . . . . . . . . . . . . . . . . . . . | |
Item 9C. | Disclosure Regarding Foreign Jurisdictions that Prevent Inspections . . . . . . . . . . . . . . . . . . . . . . . . . . . . . . . . . . | |
PART III | ||
Item 10. | Directors, Executive Officers and Corporate Governance . . . . . . . . . . . . . . . . . . . . . . . . . . . . . . . . . . . . . . . . . . . . | |
Directors . . . . . . . . . . . . . . . . . . . . . . . . . . . . . . . . . . . . . . . . . . . . . . . . . . . . . . . . . . . . . . . . . . . . . . . . . . . . . . . . . . . . . . | ||
Corporate Governance . . . . . . . . . . . . . . . . . . . . . . . . . . . . . . . . . . . . . . . . . . . . . . . . . . . . . . . . . . . . . . . . . . . . . . . . . | ||
Report of the Audit Committee of the Board of Directors . . . . . . . . . . . . . . . . . . . . . . . . . . . . . . . . . . . . . . . . . . . . . | ||
Executive Officers . . . . . . . . . . . . . . . . . . . . . . . . . . . . . . . . . . . . . . . . . . . . . . . . . . . . . . . . . . . . . . . . . . . . . . . . . . . . . . | ||
Item 11. | Executive Compensation . . . . . . . . . . . . . . . . . . . . . . . . . . . . . . . . . . . . . . . . . . . . . . . . . . . . . . . . . . . . . . . . . . . . . . . . | |
Compensation Discussion and Analysis . . . . . . . . . . . . . . . . . . . . . . . . . . . . . . . . . . . . . . . . . . . . . . . . . . . . . . . . . . . | ||
Compensation Committee Report . . . . . . . . . . . . . . . . . . . . . . . . . . . . . . . . . . . . . . . . . . . . . . . . . . . . . . . . . . . . . . . . | ||
Compensation Risk Assessment . . . . . . . . . . . . . . . . . . . . . . . . . . . . . . . . . . . . . . . . . . . . . . . . . . . . . . . . . . . . . . . . . | ||
Compensation Tables and Other Information . . . . . . . . . . . . . . . . . . . . . . . . . . . . . . . . . . . . . . . . . . . . . . . . . . . . . . | ||
Item 12. | Security Ownership of Certain Beneficial Owners and Management and Related Stockholder Matters . . . . . | |
Item 13. | Certain Relationships and Related Transactions, and Director Independence . . . . . . . . . . . . . . . . . . . . . . . . . . | |
Policies and Procedures Relating to Transactions with Related Persons . . . . . . . . . . . . . . . . . . . . . . . . . . . . . . . | ||
Transactions with Related Persons . . . . . . . . . . . . . . . . . . . . . . . . . . . . . . . . . . . . . . . . . . . . . . . . . . . . . . . . . . . . . . . | ||
Director Independence . . . . . . . . . . . . . . . . . . . . . . . . . . . . . . . . . . . . . . . . . . . . . . . . . . . . . . . . . . . . . . . . . . . . . . . . . | ||
Item 14. | Principal Accounting Fees and Services . . . . . . . . . . . . . . . . . . . . . . . . . . . . . . . . . . . . . . . . . . . . . . . . . . . . . . . . . . . | |
Fannie Mae 2023 Form 10-K | ii |
PART IV | ||
Item 15. | Exhibits, Financial Statement Schedules . . . . . . . . . . . . . . . . . . . . . . . . . . . . . . . . . . . . . . . . . . . . . . . . . . . . . . . . . . | |
Item 16. | Form 10-K Summary . . . . . . . . . . . . . . . . . . . . . . . . . . . . . . . . . . . . . . . . . . . . . . . . . . . . . . . . . . . . . . . . . . . . . . . . . . . | |
INDEX TO CONSOLIDATED FINANCIAL STATEMENTS . . . . . . . . . . . . . . . . . . . . . . . . . . . . . . . . . . . . . . . . . . . . . . . . . . . . | ||
Fannie Mae 2023 Form 10-K | iii |
PART I
This report includes forward-looking statements based on management’s current expectations that are subject to
significant uncertainties. Future events and our results may differ materially from those reflected in our forward-looking
statements due to a variety of factors, including those discussed in “Business—Forward-Looking Statements,” “Risk
Factors” and elsewhere in this report.
You can find a “Glossary of Terms Used in This Report” in “Management’s Discussion and Analysis of Financial
Condition and Results of Operations (‘MD&A’).”
Item 1. Business
About Fannie Mae
Fannie Mae is a leading source of financing for residential mortgages in the United States. We provided $369 billion in
liquidity to the mortgage market in 2023, which enabled the financing of approximately 1.5 million home purchases,
refinancings, and rental units.
We are a government-sponsored, stockholder-owned corporation, chartered by Congress to provide liquidity and
stability to the U.S. housing market and to promote access to mortgage credit. We primarily do this by buying residential
mortgage loans that are originated by lenders. We place these loans into trusts and issue guaranteed mortgage-backed
securities (“MBS” or “Fannie Mae MBS”) that global investors buy from us. We do not originate mortgage loans or lend
money directly to borrowers.
We support both single-family and multifamily housing. Our Single-Family business provides financing for properties
that have four or fewer residential units. Our Multifamily business provides financing for residential buildings with five or
more units. As of September 30, 2023 (the latest date for which information is available), Fannie Mae owned or
guaranteed an estimated 1 in 4 single-family mortgage loans in the United States and an estimated 21% of multifamily
mortgage debt outstanding in the United States.
We provide a guaranty on the MBS that we issue. If a borrower fails to make a payment on a mortgage loan that is
included in a Fannie Mae MBS, we pay the shortfall amount to the MBS investor. In exchange for providing this
guaranty, we receive a guaranty fee. Guaranty fees are the primary source of our revenues.
Because we assume the credit risk for mortgage loans in our MBS, our earnings are affected by the credit performance
of these loans. Credit risk management is therefore key to our business and financial results. To help manage our
mortgage credit risk exposure, and in response to capital requirements, we transfer some of our credit risk exposure to
third parties through credit risk transfer transactions and mortgage insurance. For a discussion of how we manage credit
risk, see “MD&A—Single-Family Business—Single-Family Mortgage Credit Risk Management” and “MD&A—Multifamily
Business—Multifamily Mortgage Credit Risk Management.”
We are in conservatorship, with the Federal Housing Finance Agency (“FHFA”) as our conservator. During
conservatorship, our Board has no fiduciary duties to the company or its stockholders, as they owe their fiduciary duties
of care and loyalty solely to FHFA as conservator. Conservatorship and our agreements with the U.S. Department of the
Treasury (“Treasury”) significantly restrict our business activities and stockholder rights. For more information about the
impact of conservatorship and these agreements on our business, stockholders, and our uncertain future, see
“Conservatorship and Treasury Agreements” and “Risk Factors—GSE and Conservatorship Risk.”
Our Mission and Strategy
Our mission is to facilitate equitable and sustainable access to homeownership and quality affordable rental housing
across America. We seek to accomplish our mission while managing risks to our company and the U.S. housing finance
system. Our 2023-2025 strategic plan objectives are to:
•Improve Access to Equitable and Sustainable Housing: Build on our mission-first culture to deliver positive
community outcomes that serve renters and homeowners.
•Enhance our Financial and Risk Positions: Ensure that we are financially secure, can earn investable returns,
and manage risk to the company and the housing finance system.
For information on how we help make access to housing in the United States more attainable, affordable, and stable for
low- and moderate-income borrowers and renters, see our 2022 Environmental, Social, and Governance report, which
is available on our website under “About Us—ESG,” and “Legislation and Regulation” in this report.
Business | About Fannie Mae | ||
Fannie Mae 2023 Form 10-K | 1 |
Executive Summary
Please read this summary together with our MD&A, our consolidated financial statements as of December 31, 2023 and
the accompanying notes.
Overview of Financial Results
Summary of Key Drivers of Financial Results
2023 vs. 2022
•Net revenues decreased $687 million in 2023 compared with 2022, primarily due to lower deferred guaranty fee
income, offset by higher income from the corporate liquidity portfolio. Higher interest rates in 2023 drove both
the decline in deferred guaranty fee income due to lower refinancing activity as well as the higher income on
securities in our corporate liquidity portfolio. Net revenues consist of net interest income and fee and other
income.
•Net income increased $4.5 billion in 2023 compared with 2022, primarily driven by a $7.9 billion shift to benefit
for credit losses in 2023 from a provision for credit losses in 2022.
•Net worth increased by $17.4 billion in 2023 to $77.7 billion as of December 31, 2023.
2022 vs. 2021
•Net revenues remained relatively flat in 2022 compared with 2021, as lower deferred guaranty fee income was
offset by higher income from portfolios and higher base guaranty fee income.
•Net income decreased $9.3 billion in 2022 compared with 2021, primarily driven by a $11.4 billion shift to
provision for credit losses in 2022 from a benefit for credit losses in 2021. Also contributing to the decline in net
income was a $1.6 billion shift to investment losses in 2022 from investment gains in 2021. These decreases
were partially offset by higher fair value gains.
•Net worth increased by $12.9 billion in 2022 to $60.3 billion as of December 31, 2022.
See “MD&A—Consolidated Results of Operations” for more information on the drivers of our financial results.
Business Segments
We conduct business in the U.S. residential mortgage markets and the global securities markets. According to the
Federal Reserve, total U.S. residential mortgage debt outstanding was estimated to be approximately $16.0 trillion as of
September 30, 2023 (the latest date for which information is available). We owned or guaranteed mortgage assets
representing approximately 26% of total U.S. residential mortgage debt outstanding as of September 30, 2023.
Business | Executive Summary | ||
Fannie Mae 2023 Form 10-K | 2 |
We have two reportable business segments: Single-Family and Multifamily. The chart below outlines the primary
business activities and drivers of revenues and expense for each of our business segments.
Single-Family Business Segment | ||
Primary Business Activities | Primary Drivers of Revenue1 | Primary Drivers of Expense1 |
Mortgage securitizations: Works with lenders to acquire single-family mortgage loans and issue MBS. Credit risk management: Prices and manages the credit risk on loans in our single-family guaranty book of business, which includes establishing underwriting and servicing standards. Enters into transactions that transfer a portion of the credit risk on some of the loans in our single-family guaranty book of business to third parties. Credit loss management: Works to reduce costs of defaulted single-family loans, including through forbearance plans, home retention solutions, foreclosure alternatives, management of foreclosures and our real- estate owned (“REO”) inventory, selling nonperforming loans, and pursuing contractual remedies from lenders, servicers and providers of credit enhancement. | Net interest income: Primary source is guaranty fees—compensation we receive for assuming the credit risk on our single- family guaranty book of business. There are two components of our single-family guaranty fee: •Base fees. Ongoing fees that factor into a mortgage loan’s interest rate, which are collected each month over the life of the mortgage loan. •Upfront fees. One-time payments made by lenders upon loan delivery to us. Includes risk-based fees (referred to as “loan-level price adjustments”) that vary based on loan and borrower attributes (such as loan size, loan-to-value (“LTV”) ratio, borrower credit score, etc.). These fees are amortized into net interest income over the life of the loan. Another source is net interest income earned from our corporate liquidity portfolio and retained mortgage portfolio. | Provision for credit losses: Consists of the provision for credit losses on loans in our single-family guaranty book of business. (In some periods, we may have a benefit for credit losses that contributes to net income if we reduce our single-family loss reserves.) Administrative expenses: Consists of salaries and benefits, occupancy costs, professional services, and other Single-Family business operations expenses. TCCA fees: Consists of a portion of our single-family guaranty fees that is paid to Treasury pursuant to the Temporary Payroll Tax Cut Continuation Act of 2011, as amended. |
Multifamily Business Segment | ||
Primary Business Activities | Primary Drivers of Revenue | Primary Drivers of Expense |
Mortgage securitizations: Works with lenders, primarily through our Delegated Underwriting and Servicing, or DUS®, program, to acquire multifamily mortgage loans and issue MBS. Credit risk management: Prices and manages the credit risk on loans in our multifamily guaranty book of business, which includes establishing underwriting and servicing standards. Lenders retain a portion (typically one-third) of the credit risk in most multifamily transactions. Enters into additional transactions that transfer a portion of the credit risk on some of the loans in our multifamily guaranty book of business to third parties. Credit loss management: Works to reduce costs of defaulted multifamily loans, including through loss mitigation strategies such as forbearance and modification, management of foreclosures and our REO inventory, and pursuing contractual remedies from lenders, servicers, borrowers, sponsors, and providers of credit enhancement. | Net interest income: Primary source is guaranty fees—compensation we receive for assuming the credit risk on our multifamily guaranty book of business. For multifamily loans, base fees are the primary component of our guaranty fee. Another source is net interest income earned from our corporate liquidity portfolio and retained mortgage portfolio. | Provision for credit losses: Consists of the provision for credit losses on loans in our multifamily guaranty book of business. (In some periods, we may have a benefit for credit losses that contributes to net income if we reduce our multifamily loss reserves.) Administrative expenses: Consists of salaries and benefits, occupancy costs, professional services, and other Multifamily business operations expenses. |
(1)See “MD&A—Single-Family Business—Single-Family Business Financial Results” and “MD&A—Multifamily Business—Multifamily
Business Financial Results” for a discussion of other drivers of our single-family and multifamily financial results. Fair value gains were a
significant driver of single-family financial results for the years ended December 31, 2023 and 2022.
Business | Business Segments | ||
Fannie Mae 2023 Form 10-K | 3 |
We primarily purchase single-family conventional loans that meet conforming loan limits in the secondary mortgage
market. Conventional loans are not insured or guaranteed by a government agency (those are generally referred to as
government-guaranteed loans). See “Legislation and Regulation—Our Charter” for a description of our conforming loan
limits.
The chart below displays the unpaid principal balance (“UPB”) of our average single-family conventional guaranty book
of business and our multifamily guaranty book of business, as well as our average single-family and multifamily charged
guaranty fee.
Guaranty Book of Business and Average Charged Guaranty Fee by Segment
(Dollars in trillions)1
Average charged guaranty fee on single-family conventional guaranty book of business (in basis points), net of TCCA fees(2) | Average charged guaranty fee on multifamily guaranty book of business (in basis points) at end of period | |||||||
Average single-family conventional guaranty book of business(3) | Multifamily guaranty book of business as of period end | |||||||
(1)Measured based on the unpaid principal balance of mortgage loans underlying Fannie Mae MBS outstanding.
(2)Excludes the impact of a 10 basis point guaranty fee increase implemented pursuant to the TCCA, the incremental revenue from which is
paid to Treasury and not retained by us.
(3)Our average single-family conventional guaranty book of business is based on quarter-end balances during the respective periods.
Our average single-family conventional guaranty book of business increased by 1.4% to $3.63 trillion in 2023 compared
with 2022, driven by an increase in the average loan size of the book. The average charged guaranty fee, net of TCCA
fees, on the single-family conventional guaranty book increased by 0.7 basis points to 46.9 basis points in 2023,
primarily as a result of higher base guaranty fees charged on new acquisitions.
Our multifamily guaranty book of business grew by 7% in 2023 to $470.4 billion driven by our acquisitions combined
with low prepayment volumes due to the high interest rate environment. The average charged guaranty fee on the
multifamily guaranty book declined by 2.4 basis points to 76.1 basis points in 2023, primarily due to lower average
charged fees on our 2023 acquisitions as compared with the existing loans in our multifamily guaranty book of business.
The chart below displays the net income for each of our business segments.
Business Segment Net Income
(Dollars in billions)
Business | Business Segments | ||
Fannie Mae 2023 Form 10-K | 4 |
See “MD&A—Single-Family Business” and “MD&A—Multifamily Business” for more information on the primary business
activities, business metrics and financial results of our Single-Family and Multifamily businesses.
Competition
We compete to acquire mortgage assets in the secondary mortgage market and to issue mortgage-related securities to
investors. Our primary competitors for the acquisition of single-family loans are Freddie Mac, private institutions (such
as U.S. banks, securities dealers, insurance companies and investment funds) and government agencies (such as the
Federal Housing Administration (“FHA”) and the Department of Veterans Affairs (“VA”)). Our primary competitors for the
issuance and/or guarantee of single-family mortgage-related securities are Freddie Mac, Ginnie Mae (which primarily
guarantees securities backed by FHA-insured loans and VA-guaranteed loans) and private market competitors. Our
primary competitors for the acquisition of multifamily mortgage assets and issuance of multifamily mortgage-related
securities are Freddie Mac, life insurers, U.S. banks and thrifts, other institutional investors, Ginnie Mae and private-
label issuers of commercial mortgage-backed securities.
Competition to acquire mortgage assets and issue mortgage-related securities is affected by many factors, including our
and our competitors’ pricing and eligibility standards, the number of residential mortgage loans offered for sale in the
secondary mortgage market (and whether sellers elect to retain loans with better credit characteristics), and investor
demand for mortgage assets. Our competitive environment also may be affected by many other factors, including: our
risk appetite; our capital requirements; our return on capital requirements; applicable housing goals and duty-to-serve
requirements; FHFA’s single-family mortgage purchase, servicing and securitization requirements aimed at aligning our
single-family MBS with Freddie Mac’s MBS; and new or existing legislation or regulations applicable to us, our lenders
or our investors. See “MD&A—Single-Family Business—Single-Family Competition” and “MD&A—Multifamily Business
—Multifamily Competition” for more information on the competition faced by our business segments. See
“Conservatorship and Treasury Agreements,” “Legislation and Regulation,” and “Risk Factors” for information on matters
that affect or could affect our competitive environment.
Mortgage Securitizations
Overview
We securitize most of the single-family and multifamily mortgage loans we acquire. The MBS that we issue are
generally fixed-income securities that are tradable in the global capital markets.
We guarantee Fannie Mae MBS so that investors in our MBS are insulated from mortgage borrower credit risk. If any
borrower whose loan is in one of our MBS trusts fails to make a monthly payment, we pay those shortfall amounts to the
MBS investors. In exchange for providing this guaranty, we receive a guaranty fee. Guaranty fees are intended to cover
the expected credit losses, administrative costs, cost of capital and return on capital targets associated with the loans
we guarantee. For single-family loans, guaranty fees also include the TCCA fees we are required to pay to Treasury.
Types of Mortgage Securitization Transactions
We engage in three broad categories of mortgage securitization transactions:
•Lender Swap Transactions: A mortgage lender delivers mortgage loans to us in exchange for Fannie Mae
MBS backed by those mortgage loans. The lender may choose to hold the MBS they receive or sell the MBS to
other investors. Our multifamily MBS generally have only one multifamily loan per MBS trust, while our single-
family MBS have multiple loans per MBS trust.
•Portfolio Securitization Transactions: A lender sells us mortgage loans for cash. When we have acquired
enough mortgage loans or in response to MBS investor requests for Fannie Mae MBS with certain
characteristics, we deliver those loans to an MBS trust in exchange for Fannie Mae MBS, which we then sell to
MBS investors. We act as trustee of our MBS trusts. Most of the single-family mortgage loans we buy for cash
are from small to mid-sized lenders. This acquisition type allows us to give small and mid-sized lenders
competitive pricing while also providing servicing and funding options that lenders can tailor to their needs.
•Structured Securitization Transactions: We create structured Fannie Mae MBS in response to requests from
lenders and dealers. In these transactions, the lender or dealer owns a mortgage-related asset (typically one or
more MBS) and transfers that asset for a structured Fannie Mae MBS we issue. The process for issuing
structured Fannie Mae MBS is similar to the process for our lender swap securitizations described above. We
receive a transaction fee from the lender or dealer for the issuance of the structured MBS securities.
Business | Business Segments | ||
Fannie Mae 2023 Form 10-K | 5 |
Common Securitization Solutions
Certain aspects of the securitization process for our single-family Fannie Mae MBS issuances are performed by
Common Securitization Solutions, LLC (“CSS”). CSS is a limited liability company we own jointly with Freddie Mac. We
do not use CSS for multifamily Fannie Mae MBS. See “Risk Factors—GSE and Conservatorship Risk” for a discussion
of risks posed by our reliance on CSS to securitize the single-family MBS we issue and for ongoing administrative
functions for our single-family MBS.
Human Capital
Overview
Our employees are key to ensuring our long-term success and meeting our strategic objectives. We had approximately
8,100 employees as of December 2023. These dedicated employees are the driving force behind delivering on our
mission, and we remain focused on attracting, engaging, retaining and developing a highly skilled workforce in this
competitive labor market. We believe many employees and potential recruits are attracted by our mission, the
compelling nature of our work and our culture of inclusivity and respect, despite our uncertain future and limitations on
the compensation we can offer. See “Risk Factors—GSE and Conservatorship Risk” for a discussion of how restrictions
on our compensation and uncertainty with respect to our future can affect our ability to recruit and retain employees.
See “Directors, Executive Officers and Corporate Governance—Corporate Governance—Human Capital Management
Oversight” for information on oversight of human capital management by our Board of Directors’ Compensation and
Human Capital Committee.
Attracting and Retaining Employees
We are committed to a comprehensive human capital management strategy aimed at attracting, engaging, retaining and
developing a highly skilled workforce. We offer a total rewards package that delivers a variety of cash and non-cash
rewards designed to motivate employees and improve company performance. We offer employee benefits that promote
personal and family wellness, and encourage involvement in personally meaningful endeavors, including those that
echo our mission. Those benefits include: a matching charitable gifts program; paid leave to engage in volunteer
activities; and broad mental, physical and financial well-being benefits. In addition, we embrace a flexible work model,
allowing most of our workforce to choose where they work within the United States and when to come into the office,
depending on business needs. This flexible work model provides us with a competitive advantage and has contributed
to our ability to attract and retain talent.
Engaging and Developing Employees
We are committed to maintaining an engaged workforce as we believe it is critical to the ongoing achievement of the
company’s and the conservator’s goals. We monitor employee engagement through regular surveys. In our final survey
of 2023, 79% of employees participated, and 92% of those who responded indicated they would recommend Fannie
Mae as a great place to work, which we consider to be a strong indicator of their engagement.
We place a strong emphasis on succession planning and talent development to attract and retain talent and improve
promotion readiness. We invest in our employees’ development to support their career aspirations. We provide training
and opportunities that enable employees to develop business, technical, leadership and other critical skills we need to
achieve our strategic objectives and fulfill our mission. We believe our succession planning approach works to mitigate
potential risk to the company posed by unexpected leadership departures.
We maintain a culture of inclusion and respect, which is reinforced by our Code of Conduct. Every new hire and existing
employee is required to annually certify their understanding of and commitment to our Code of Conduct. We also
emphasize to our employees their responsibility for, and opportunity to play a key role in, managing risk through our risk
assessment and monitoring activities, training and corporate messaging.
Diversity and Inclusion
Diversity and inclusion make us stronger. We foster an environment in which all employees are treated with dignity and
respect, can contribute to meaningful work, and have the opportunity to grow their careers in an inclusive environment
free from discrimination, harassment, and retaliation. This commitment helps us attract and retain a skilled, diverse
workforce at all levels of our organization.
Business | Human Capital | ||
Fannie Mae 2023 Form 10-K | 6 |
The charts below display the percentage of our workforce and officer-level employees that are racial or ethnic minorities
and women as of December 2023.
Employee Diversity | ||||
Racial or ethnic minorities | Women | ||||
of our workforce | of officer-level employees1 | of our workforce | of officer-level employees1 |
(1)Officers are employees with job titles that include Fellow, Vice President, Senior Vice President, Executive Vice President, President, and
CEO.
Our Chief Diversity & Inclusion Officer leads our Office of Minority and Women Inclusion, which is responsible for driving
the development of our diversity and inclusion strategic plan in partnership with leaders across the company and
reporting on our progress against the plan. We also sponsor programs and activities to cultivate an inclusive work
environment by focusing on leadership principles, talent development, enterprise accessibility, team and group
dynamics, and a consistent communications strategy that reinforces the practice of driving inclusion to achieve
innovative solutions. Our diversity and inclusion work is currently supported by ten voluntary, grassroots employee
resource groups that are open to all employees and provide a forum for members to come together for professional
growth and development, cultural awareness, education, community service, and networking across the organization.
Our officer-led Diversity Advisory Council supports the integration of our diversity and inclusion strategy throughout the
company.
Over half of Fannie Mae’s Board members are women and/or racial or ethnic minorities. See “Directors, Executive
Officers and Corporate Governance—Corporate Governance—Composition of Board of Directors” for additional
information on the diversity of our Board of Directors.
Conservatorship and Treasury Agreements
Conservatorship
In September 2008, FHFA was appointed as our conservator pursuant to authority provided by the Federal Housing
Enterprises Financial Safety and Soundness Act of 1992, as amended (the “GSE Act”). Conservatorship is a statutory
process designed to preserve and conserve our assets and property and put the company in a sound and solvent
condition. Our conservatorship has no specified termination date.
FHFA Authority As Conservator
FHFA, as conservator, succeeded to:
•all rights, titles, powers and privileges of Fannie Mae, and of any stockholder, officer or director of Fannie Mae
with respect to Fannie Mae and its assets; and
•title to the books, records and assets of any other legal custodian of Fannie Mae.
As conservator, FHFA has the authority to exercise broad powers over the company, including:
•directing us to enter into contracts or entering into contracts on our behalf; and
•transferring or selling our assets or liabilities.
Business | Human Capital | ||
Fannie Mae 2023 Form 10-K | 7 |
FHFA has broad latitude over our business while we are in conservatorship, including authority to rehabilitate us in a
way that, while not in Fannie Mae’s best interests, is beneficial to FHFA and, by extension, the public it serves.
The GSE Act provides special protections for mortgage loans and mortgage-related assets we hold in trust. Specifically,
mortgage loans and mortgage-related assets that have been transferred to a Fannie Mae MBS trust must be held by the
conservator for the beneficial owners of such MBS and cannot be used to satisfy the company’s general creditors.
Since 2012, FHFA has released annual corporate performance objectives for us, referred to as the conservatorship
scorecard. For information on FHFA’s 2024 conservatorship scorecard objectives, see our Current Report on Form 8-K
filed with the Securities and Exchange Commission (“SEC”) on February 1, 2024. For information on FHFA’s 2023
conservatorship scorecard objectives and our performance against these objectives, see “Executive Compensation—
Determination of 2023 Compensation—Assessment of Corporate Performance against 2023 Scorecard.”
Board Authority in Conservatorship
While we are operating in conservatorship, our directors:
•serve on behalf of the conservator;
•exercise their authority as directed by and with the approval (where required) of the conservator;
•owe their fiduciary duties of care and loyalty solely to the conservator, and not to either the company or the
stockholders; and
•are appointed by the conservator and not elected by stockholders.
As conservator, FHFA has issued an order authorizing our Board of Directors to exercise specified functions and
authorities, and instructions regarding matters for which conservator decision or notification is required. The conservator
retains the authority to amend or withdraw its order and instructions at any time. For more information on the functions
and authorities of our Board of Directors during conservatorship, see “Directors, Executive Officers and Corporate
Governance—Corporate Governance—Conservatorship and Board Authorities.”
Stockholder Authority in Conservatorship
The conservator has suspended stockholder meetings since conservatorship, and our common stockholders are not
empowered to vote on directors or any other matters. The conservator also eliminated dividends on our common and
preferred stock (other than dividends on the senior preferred stock issued to Treasury) during the conservatorship.
Treasury Agreements
FHFA, as conservator, entered into a senior preferred stock purchase agreement with Treasury on our behalf in
September 2008. In connection with that agreement, we issued Treasury one million shares of Variable Liquidation
Preference Senior Preferred Stock, Series 2008-2, which we refer to as the “senior preferred stock,” and a warrant to
purchase shares equal to 79.9% of our common stock, on a fully diluted basis, for a nominal price.
The senior preferred stock purchase agreement and the terms of the senior preferred stock have been amended
multiple times since 2008 by FHFA (acting on our behalf) and Treasury.
Senior Preferred Stock Purchase Agreement and Senior Preferred Stock
The senior preferred stock purchase agreement and accompanying stock certificate include key provisions that impact
us, including those described in the table below.
Treasury Funding Commitment | •On a quarterly basis, we may draw funds from Treasury to cover the amount that our total liabilities exceed our total assets for the applicable fiscal quarter (referred to as the “deficiency amount”), up to the amount of remaining funding commitment under the agreement. •As of the date of this filing: ◦$119.8 billion has been paid to us by Treasury under this funding commitment; and ◦$113.9 billion of funding commitment from Treasury remains; this amount would be reduced by any future payments by Treasury under the commitment. |
Business | Conservatorship and Treasury Agreements | ||
Fannie Mae 2023 Form 10-K | 8 |
Termination Provisions for Funding Commitment | •Treasury’s funding commitment has no specified end date, but will terminate upon: ◦our liquidation and the fulfillment of Treasury’s obligations under its funding commitment; ◦the payment in full of, or reasonable provision for, our liabilities (whether or not contingent, including guaranty obligations); or ◦Treasury funding the maximum amount under the agreement. •Treasury also may terminate its funding commitment and void the agreement if a court vacates, modifies, amends, conditions, enjoins, stays or otherwise affects the appointment of the conservator or curtails the conservator’s powers. |
Rights of Debt and MBS Holders | •Holders of our debt securities or our guaranteed MBS may file a claim in the United States Court of Federal Claims for relief if we default on our payment obligations on those securities and: ◦we and the conservator fail to exercise all rights under the agreement to draw on Treasury’s funding commitment, or ◦Treasury fails to perform its obligations under its funding commitment and we and/or the conservator are not diligently pursuing remedies for Treasury’s failure. •Holders may seek to require Treasury to fund us up to: ◦the amount necessary to cure the relevant payment defaults; ◦the deficiency amount; or ◦the amount of remaining funding under the agreement, whichever is the least. Any Treasury funding provided under these circumstances would increase the liquidation preference of the senior preferred stock. •The terms of the agreement generally may be amended or waived; however, no such amendment or waiver may decrease Treasury’s aggregate funding commitment or add conditions to Treasury’s funding commitment that would adversely affect in any material respect the holders of our debt or guaranteed MBS. |
Senior Preferred Stock Dividends | •Treasury, as the holder of the senior preferred stock, has received a total of $181.4 billion in senior preferred stock dividends through December 31, 2023. The dividends we have paid to Treasury were declared by, and paid at the direction of, our conservator. •Dividend payments we make to Treasury do not restore or increase the amount of Treasury’s funding commitment under the agreement. •We are currently not required to pay or accumulate new dividends to Treasury until our net worth exceeds the amount of adjusted total capital necessary for us to meet the capital requirements and buffers set forth in the enterprise regulatory capital framework. •Our net worth is the amount, if any, by which our total assets (excluding Treasury’s funding commitment and any unfunded amounts related to the commitment) exceed our total liabilities (excluding any obligation with respect to equity securities). •After the “capital reserve end date” (which is defined as the last day of the second consecutive fiscal quarter during which we have had and maintained capital equal to or exceeding the capital requirements and buffers set forth in the enterprise regulatory capital framework), the quarterly dividends due to Treasury under the senior preferred stock will be the lesser of (i) any quarterly increase in our net worth, and (ii) a 10% annual rate on the then-current liquidation preference of the senior preferred stock (or 12% if we fail to pay dividends to Treasury). •See “Risk Factors—GSE and Conservatorship Risk” for more information on risks associated with the resumption of dividends under the terms of the senior preferred stock. |
Business | Conservatorship and Treasury Agreements | ||
Fannie Mae 2023 Form 10-K | 9 |
Liquidation Preference | •The senior preferred stock: ◦has no par value; ◦had an aggregate initial liquidation preference of $1 billion; ◦had an aggregate liquidation preference of $195.2 billion as of December 31, 2023; ◦will have an aggregate liquidation preference of $199.2 billion as of March 31, 2024, due to the $4.0 billion increase in our net worth during the fourth quarter of 2023. •The aggregate liquidation preference of the senior preferred stock is increased by: ◦any amounts Treasury pays pursuant to its funding commitment under the agreement; ◦any quarterly commitment fees that are payable but not paid by us; ◦any senior preferred stock dividends that are payable but not paid to Treasury; and ◦for each fiscal quarter through and including the capital reserve end date, an amount equal to the increase in our net worth, if any, during the immediately prior fiscal quarter. •The senior preferred stock ranks ahead of our common and preferred stock as to both dividends and rights upon liquidation. If we are liquidated, the holder of the senior preferred stock is entitled to its then-current liquidation preference before any distributions are made on our other equity securities. |
Limits on Redemptions and Paydowns | •We may not redeem or retire the senior preferred stock prior to the termination of Treasury’s funding commitment under the agreement. •We may not reduce or pay down the liquidation preference of the senior preferred stock out of regular corporate funds, except to the extent of: ◦accumulated and unpaid dividends previously added to the liquidation preference; and ◦quarterly commitment fees previously added to the liquidation preference. •While the senior preferred stock remains outstanding, we are required to use the net cash proceeds of issuances of equity securities to pay down the liquidation preference of the senior preferred stock; however, we are permitted to retain up to $70 billion in aggregate gross cash proceeds from issuances of common stock. •The liquidation preference of the senior preferred stock may not be paid down below $1,000 per share prior to the termination of Treasury’s funding commitment. After termination, we may fully pay down the liquidation preference of the senior preferred stock. |
Commitment Fee | •The agreement provides for the payment of an unspecified quarterly commitment fee to Treasury to compensate it for its ongoing support under the agreement. •Until the capital reserve end date, the periodic commitment fee will not be set, accrue, or be payable. •No later than the capital reserve end date, we and Treasury, in consultation with the Chair of the Federal Reserve, will agree on the amount of the periodic commitment fee. |
Covenants
The senior preferred stock purchase agreement contains covenants that prohibit us (and, in one instance, FHFA) from
taking several actions without the prior written consent of Treasury or require us to take specified actions, including the
following described in the table below.
Dividends and Share Repurchases | •We may not pay dividends or make other distributions on or repurchase our equity securities (other than the senior preferred stock). |
Issuances of Equity Securities | •We may not issue equity securities, except for common stock issued: ◦upon exercise of the warrant; ◦as required by any pre-conservatorship agreements; and ◦following the satisfaction of two conditions: (a) the exercise of the warrant in full, and (b) the resolution of all currently pending significant litigation relating to the conservatorship and the August 2012 amendment to the senior preferred stock purchase agreement. |
Business | Conservatorship and Treasury Agreements | ||
Fannie Mae 2023 Form 10-K | 10 |
Termination of Conservatorship | •Neither we nor FHFA may terminate or seek to terminate the conservatorship, other than through a receivership, without the prior consent of Treasury, with one exception that allows FHFA to terminate our conservatorship without the prior consent of Treasury if the following conditions are met: ◦all currently pending significant litigation relating to the conservatorship and the August 2012 amendment to the senior preferred stock purchase agreement has been resolved; and ◦for two or more consecutive quarters, our common equity tier 1 capital (as defined in the enterprise regulatory capital framework), together with any stockholder equity that would result from a firm commitment public underwritten offering of common stock which is fully consummated concurrent with the termination of conservatorship, equals or exceeds at least 3% of our adjusted total assets (as defined in the enterprise regulatory capital framework). As of December 31, 2023, 3% of our adjusted total assets was $136.6 billion and we had a common equity tier 1 capital deficit of $74 billion. |
Asset Dispositions | •We may not sell, transfer, lease or otherwise dispose of any assets, except for dispositions for fair market value in limited circumstances, including if: ◦the transaction is in the ordinary course of business and consistent with past practice; or ◦the assets have a fair market value individually or in the aggregate of less than $250 million. |
Subordinated Debt | •We may not issue any subordinated debt securities. |
Mortgage Assets Limit | •We may not hold mortgage assets in excess of $225 billion; however, we are currently managing our business to a $202.5 billion mortgage asset cap according to FHFA instructions. |
Indebtedness Limit | •We may not have indebtedness in excess of $270 billion. |
Executive Compensation | •We may not enter into any new compensation arrangements or increase amounts or benefits payable under existing compensation arrangements with any of our executive officers (as defined by SEC rules) without the consent of the Director of FHFA, in consultation with the Secretary of the Treasury. |
Equitable Access and Offers for Single-Family Mortgage Loans | •We may not vary our pricing or acquisition terms for single-family loans based on the business characteristics of the seller, including the seller’s size, charter type, or volume of business with us. •We must offer to purchase at all times, for equivalent cash consideration and on substantially the same terms, any single-family mortgage loan that: ◦is of a class of loans that we then offer to acquire for inclusion in our MBS or for other non- cash consideration; ◦is offered by a seller that has been approved to do business with us; and ◦has been originated and sold in compliance with our underwriting standards. |
Business | Conservatorship and Treasury Agreements | ||
Fannie Mae 2023 Form 10-K | 11 |
Single-Family Loan Eligibility Program | •We must maintain a program reasonably designed to ensure that the single-family loans we acquire are limited to: ◦qualified mortgages; ◦government-backed loans; ◦loans exempt from the Consumer Financial Protection Bureau’s (the “CFPB’s”) ability-to- repay and qualified mortgage rule (other than loans secured by timeshares and home equity lines of credit, which we are not allowed to buy); ◦loans secured by an investment property; ◦refinancing loans with streamlined underwriting originated in accordance with our eligibility criteria for high LTV ratio refinancings; ◦loans originated with temporary underwriting flexibilities during times of exigent circumstances, as determined in consultation with FHFA; ◦loans secured by manufactured housing; and ◦such other loans that FHFA may designate that were eligible for purchase by us as of January 2021. |
Enterprise Regulatory Capital Framework | •We are required to comply with the enterprise regulatory capital framework rule published by FHFA in the Federal Register on December 17, 2020, disregarding any subsequent amendments or modifications to the rule. •FHFA has subsequently amended the enterprise regulatory capital framework and instructed us to comply with the framework as amended. Accordingly, we are not in compliance with this covenant. •While our compliance with the covenants in the senior preferred stock purchase agreement is not a condition of Treasury’s funding commitment under that agreement, FHFA, as our conservator and regulator, has the authority to direct compliance or impose consequences for any non-compliance with that agreement. |
Risk Management Plan | •While in conservatorship, we must provide an annual risk management plan to Treasury. |
In addition to the covenants in the chart above, the senior preferred stock purchase agreement contains covenants that
were temporarily suspended in September 2021, which are described in “Note 2, Conservatorship, Senior Preferred
Stock Purchase Agreement and Related Matters—Senior Preferred Stock Purchase Agreement—Suspended
Covenants.” Treasury can terminate this suspension upon six months’ notice to us. As of the date of this filing, we have
received no such notification from Treasury.
Common Stock Warrant
As a result of the senior preferred stock purchase agreement, in September 2008, we, through FHFA in its capacity as
conservator, issued to Treasury a warrant to purchase shares of our common stock equal to 79.9% of the total number
of shares of our common stock outstanding on a fully diluted basis on the date the warrant is exercised, for an exercise
price of $0.00001 per share. The warrant may be exercised in whole or in part at any time on or before September 7,
2028.
See “Risk Factors—GSE and Conservatorship Risk” for a description of the risks to our business relating to the
conservatorship, uncertainties regarding the future of our company and business, the senior preferred stock purchase
agreement, as well as the adverse effects of the conservatorship, the senior preferred stock and the warrant on the
rights of holders of our common stock and other series of preferred stock.
Legislation and Regulation
As a federally chartered financial institution, we are subject to substantial government regulation and oversight. FHFA,
our primary regulator, regulates our safety and soundness and our mission, and is also our conservator. FHFA is an
independent federal agency with general supervisory and regulatory authority over Fannie Mae, Freddie Mac and the
Federal Home Loan Banks (“FHLBs”). The U.S. Department of Housing and Urban Development (“HUD”) and FHFA
regulate us with respect to fair lending matters, and the SEC and Treasury regulate other aspects of our business. In
Business | Conservatorship and Treasury Agreements | ||
Fannie Mae 2023 Form 10-K | 12 |
addition, regulations by other agencies that affect the mortgage industry or the markets for our MBS, debt securities or
credit risk transfer securities could have a significant impact on us. See “Risk Factors—Legal and Regulatory Risk.”
Our Charter
Our charter, which is an act of Congress, sets forth our purposes and establishes the parameters under which we
operate, including specifying limitations on our business. We describe certain provisions of our charter below.
•Purposes. Our charter states that our operations should be financed by private capital to the maximum extent
feasible and authorizes us to:
◦provide stability in the secondary market for residential mortgages;
◦respond appropriately to the private capital market;
◦provide ongoing assistance to the secondary market for residential mortgages (including activities
relating to mortgages on housing for low- and moderate-income families involving a reasonable
economic return that may be less than the return earned on other activities) by increasing the liquidity
of mortgage investments and improving the distribution of investment capital available for residential
mortgage financing; and
◦promote access to mortgage credit throughout the nation (including central cities, rural areas and
underserved areas) by increasing the liquidity of mortgage investments and improving the distribution
of investment capital available for residential mortgage financing.
•Loan acquisitions and conforming loan limit. We may purchase and securitize mortgage loans secured by
single-family and multifamily properties. Single-family conventional (not government-insured or government-
guaranteed) mortgage loan acquisitions are subject to an annually-adjusted maximum original principal balance
limit, known as the “conforming loan limit.” The national conforming loan limit for single-family mortgages
secured by one-unit properties is $766,550 for 2024 and was $726,200 for 2023. Higher limits apply for single-
family mortgages secured by two- to four-unit properties and in four states and territories (Alaska, Hawaii,
Guam and the U.S. Virgin Islands). Higher limits of up to 150% of the loan limit also apply in certain high-cost
areas.
•Credit enhancement requirements. Credit enhancement is generally required on any single-family conventional
mortgage loan that we purchase or securitize that has an LTV ratio over 80% at the time of purchase. The
Charter Act provides three options for meeting this credit enhancement requirement: (1) obtain insurance or a
guaranty by a qualified insurer on the portion of the unpaid principal balance of the loan that exceeds an 80%
LTV ratio; (2) the seller agrees to repurchase or replace the loan in the event of default; or (3) the seller retains
at least a 10% participation interest in the loan. We primarily meet this credit enhancement requirement by
obtaining mortgage insurance.
•Additional limitations. We may not originate mortgage loans. Similarly, we may not advance funds to a
mortgage seller on an interim basis, using mortgage loans as collateral, pending the sale of the mortgages in
the secondary market.
•Exemption for our securities offerings. Our securities offerings are exempt from registration requirements under
the Securities Act of 1933. As a result, we do not file registration statements or prospectuses with the SEC for
our securities offerings. However, the Securities Exchange Act of 1934 (the “Exchange Act”) provides that our
equity securities are not exempt securities under the Exchange Act. Consequently, we are required to file
periodic and current reports with the SEC, including annual reports on Form 10-K, quarterly reports on Form
10-Q, and current reports on Form 8-K.
•Exemption from specified taxes. We are exempt from taxation by states, territories, counties, municipalities and
local taxing authorities, except for taxation by those authorities on our real property. We are not exempt from
the payment of federal corporate income taxes.
Capital Requirements
FHFA’s enterprise regulatory capital framework establishes both leverage and risk-based minimum capital
requirements. The leverage capital requirement is to maintain tier 1 capital equal to at least 2.5% of adjusted total
assets. The risk-based capital requirements are to maintain common equity tier 1 capital, tier 1 capital, and adjusted
total capital equal to at least 4.5%, 6.0%, and 8.0%, respectively, of risk-weighted assets. Compliance with these
minimum regulatory capital requirements will be required upon our exit from conservatorship or such later date as FHFA
may order. The enterprise regulatory capital framework also provides the following:
Business | Legislation and Regulation |
Fannie Mae 2023 Form 10-K | 13 |
•A requirement that we hold prescribed capital buffers that can be drawn down in periods of financial stress. In
general, once we are required to be in compliance with the capital buffers, if our capital levels fall below the
prescribed buffer amounts, we must restrict capital distributions, such as stock repurchases and dividends, as
well as discretionary bonus payments to executives, until the buffer amounts are restored. Compliance with the
capital buffers will be required upon our exit from conservatorship;
•Specific minimum risk-weights, or “floors,” on single-family and multifamily risk-weighted exposures, which can
increase the amount of capital required for loans that would otherwise have lower risk weights;
•Specific floors on the risk-weights applicable to retained portions of credit risk transfer transactions, which
decreases the capital relief obtained from these transactions;
•Risk-based capital requirements related to market risk and operational risk; and
•Additional elements based on U.S. banking regulations, such as supplemental public disclosure requirements.
To be fully capitalized under the enterprise regulatory capital framework, we must meet all applicable leverage and risk-
based minimum capital requirements, including applicable buffers, under the rule’s standardized approach. As of
December 31, 2023, we had a $243 billion shortfall of our available capital (deficit) to our required risk-based adjusted
total capital level (including buffers). As of December 31, 2023, we had a deficit in available capital even though we had
a positive net worth under U.S. generally accepted accounting principles (“GAAP”) of $77.7 billion because available
capital for purposes of the enterprise regulatory capital framework excludes the stated value of the senior preferred
stock ($120.8 billion) and other specified amounts. See “MD&A—Liquidity and Capital Management—Capital
Management—Capital Requirements” and “Note 13, Regulatory Capital Requirements” for more information about our
capital requirements and metrics under the enterprise regulatory capital framework as of December 31, 2023. See “Risk
Factors—GSE and Conservatorship Risk” for information on risks relating to our capital requirements.
In November 2023, FHFA published a final rule amending several provisions of the enterprise regulatory capital
framework, including the following:
•Reduced the risk weight for guarantees on commingled securities from 20% to 5%, and reduced the credit
conversion factor for such guarantees from 100% to 50%. A Fannie Mae commingled security is a security
we issue that is backed, in whole or in part, by collateral issued by Freddie Mac;
•Introduced a risk multiplier of 0.6 for multifamily mortgage exposures secured by properties with certain
government subsidies;
•Changed the methodology for computing exposure and risk-weighted asset amounts for derivatives and
cleared transactions; and
•Extended the compliance date for the advanced approaches of the enterprise regulatory capital framework to
January 2028, or such later date as FHFA may order.
The effective date for most of the amendments will be April 2024; however, some of the amendments—including those
relating to the method for computing exposure and risk-weighted asset amounts for derivatives and cleared transactions
—will be effective January 2026.
Receivership and Resolution Planning
Under the GSE Act, the Director of FHFA must place us into receivership if they determine that our assets are less than
our obligations (that is, we have a net worth deficit) or if we have not been paying our debts as they become due, in
either case, for a period of 60 days. FHFA has clarified that the 60-day measurement period will commence no earlier
than the SEC filing deadline for our Form 10-K or Form 10-Q for the relevant period.
Under the GSE Act we could also be put into receivership at the discretion of the Director of FHFA if the statutory
grounds for the discretionary appointment of a receiver are met. This includes: a substantial dissipation of assets or
earnings due to unsafe or unsound practices; the existence of an unsafe or unsound condition to transact business; an
inability to meet our obligations in the ordinary course of business; a weakening of our condition due to unsafe or
unsound practices or conditions; critical undercapitalization; undercapitalization and no reasonable prospect of
becoming adequately capitalized; the likelihood of losses that will deplete substantially all of our capital; or by consent.
FHFA’s resolution planning rule requires that we develop a plan for submission to FHFA that would assist FHFA’s
planning for our rapid and orderly resolution if FHFA is appointed as our receiver. We submitted our initial resolution
plan to FHFA in March 2023. The rule requires that we submit subsequent resolution plans not later than every two
years thereafter unless otherwise notified by FHFA.
The appointment of FHFA as receiver would immediately terminate the conservatorship. Placement into receivership
would likely have a material adverse effect on holders of our common stock and preferred stock, and could have a
Business | Legislation and Regulation |
Fannie Mae 2023 Form 10-K | 14 |
material adverse effect on holders of our debt securities, Fannie Mae MBS and credit risk transfer securities. Should we
be placed into receivership, different assumptions would be required to determine the carrying value of our assets,
which would likely lead to substantially different financial results. For more information on the risks to our business
relating to receivership and uncertainties regarding the future of our business, see “Risk Factors—GSE and
Conservatorship Risk.”
Stress Testing
The Dodd-Frank Wall Street Reform and Consumer Protection Act (the “Dodd-Frank Act”) requires certain financial
companies to conduct annual stress tests to determine whether the companies have the capital necessary to absorb
losses as a result of adverse economic conditions. Under FHFA regulations, each year we are required to conduct a
stress test using two different scenarios of financial conditions provided by FHFA—baseline and severely adverse—and
to publish a summary of our stress test results for the severely adverse scenario by August 15. We published our most
recent stress test results for the severely adverse scenario on our website on August 10, 2023.
Portfolio Standards
The GSE Act requires FHFA to establish standards governing our portfolio holdings, to ensure that they are backed by
sufficient capital and consistent with our mission and safe and sound operations. FHFA is also required to monitor our
portfolio and, in some circumstances, may require us to dispose of or acquire assets. In 2010, FHFA adopted, as the
standard for our portfolio holdings, the mortgage assets limit specified in the senior preferred stock purchase agreement
described under “Conservatorship and Treasury Agreements—Treasury Agreements—Covenants,” as it may be
amended from time to time. The rule is effective for as long as we remain subject to the senior preferred stock purchase
agreement.
Affordable Housing Allocations
The GSE Act requires us to set aside in each fiscal year an amount equal to 4.2 basis points for each dollar of the
unpaid principal balance of our new business purchases and to pay this amount to specified HUD and Treasury funds in
support of affordable housing. We are prohibited from passing through the cost of these allocations to the originators of
the mortgage loans that we purchase or securitize. See “Certain Relationships and Related Transactions, and Director
Independence—Transactions with Related Persons—Treasury Interest in Affordable Housing Allocations” for
information on our contribution for 2023 new business purchases. From our initial payment under this requirement in
2016 through 2023, we have paid a total of $2.7 billion to these HUD and Treasury funds.
Fair Lending
The GSE Act requires the Secretary of HUD to assure that we meet our fair lending obligations. Among other things,
HUD periodically reviews and comments on our underwriting and appraisal guidelines to ensure consistency with the
Fair Housing Act. In addition, FHFA, as our primary regulator, has broad authority to monitor and enforce our
compliance with fair lending laws and engages in comprehensive fair lending oversight of our activities. In 2021, FHFA
and HUD entered into a memorandum of understanding regarding fair housing and fair lending coordination. Among
other things, the memorandum of understanding allows HUD and FHFA to coordinate on investigations, compliance
reviews, and ongoing monitoring to ensure our compliance with the Fair Housing Act.
Housing Goals
Our housing goals, which are established by FHFA in accordance with the GSE Act, require that a specified amount of
mortgage loans we acquire meet specified standards relating to affordability or location.
Single-Family Housing Goals
For single-family housing goals, our acquisitions are measured against the lower of benchmarks set by FHFA or the
level of goal-eligible originations in the primary mortgage market. The single-family benchmarks are expressed as a
percentage of the total number of goal-eligible single-family mortgages acquired each year.
In October 2023, FHFA determined that we met all of our 2022 single-family housing goals. The table below displays
more information about our 2022 single-family housing goals and our performance against these goals. FHFA’s single-
family housing goal benchmarks for 2023 and 2024 are the same as those for 2022 noted in the table below, other than
the low-income areas home purchase goal, which is set on an annual basis as described in footnote 4 to the table.
Business | Legislation and Regulation |
Fannie Mae 2023 Form 10-K | 15 |
Single-Family Housing Goals | ||||||
2022(1) | ||||||
FHFA Benchmark | Single- Family Market Level | Result | ||||
Low-income home purchase goal(2) | 28 | % | 26.8 | % | 27.4 | % |
Very low-income home purchase goal(3) | 7 | 6.8 | 6.9 | |||
Low-income areas home purchase goal(4) | 20 | 28.0 | 29.6 | |||
Minority census tracts subgoal(5) | 10 | 12.1 | 13.5 | |||
Low-income census tracts subgoal(6) | 4 | 9.7 | 9.3 | |||
Low-income refinancing goal(7) | 26 | 37.3 | 34.7 | |||
(1)The FHFA benchmarks and our results are expressed as a percentage of the total number of goal-eligible single-family mortgages
acquired during the year. The single-family market level is the percentage of goal-eligible single-family mortgages originated in the primary
mortgage market during the year.
(2)Home purchase mortgages on single-family, owner-occupied properties to borrowers with incomes no greater than 80% of area median
income.
(3)Home purchase mortgages on single-family, owner-occupied properties to borrowers with incomes no greater than 50% of area median
income.
(4)The sum of (a) mortgages meeting the criteria for the minority census tracts subgoal described in footnote 5 below, (b) mortgages meeting
the criteria for the low-income census tracts subgoal described in footnote 6 below, and (c) home purchase mortgages on single-family,
owner-occupied properties to borrowers with incomes no greater than 100% of area median income who are located in federally-declared
disaster areas. FHFA sets the low-income areas home purchase goal benchmark annually. For 2023, FHFA has again set the low-income
areas home purchase goal benchmark at 20%.
(5) Home purchase mortgages on single-family, owner-occupied properties to borrowers with incomes no greater than 100% of area median
income in minority census tracts.
(6)(i) Home purchase mortgages on single-family, owner-occupied properties to borrowers (regardless of income) in low-income census tracts
that are not minority census tracts, and (ii) home purchase mortgages on single-family, owner-occupied properties to borrowers with
incomes greater than 100% of area median income in low-income census tracts that are also minority census tracts. Low income census
tracts are those where the median income is no greater than 80% of area median income.
(7)Refinancing mortgages on single-family, owner-occupied properties to borrowers with incomes no greater than 80% of area median
income.
We believe we met all of our 2023 single-family housing goal benchmarks other than the low-income home purchase
benchmark and the very low-income home purchase benchmark. We are in compliance with the single-family housing
goals if we meet either the benchmarks or market share measures, so we may still meet our goals. FHFA will make a
final determination regarding our 2023 single-family housing goals performance later in the year, after the release of
data reported under the Home Mortgage Disclosure Act.
If we do not meet our housing goals, FHFA determines whether the goals were feasible. If FHFA finds that our goals
were feasible, we may become subject to a housing plan that could require us to take additional steps that could have
an adverse effect on our results of operations and financial condition. The housing plan must describe the actions we
would take to meet the goal in the next calendar year and be approved by FHFA. The potential penalties for failure to
comply with housing plan requirements include a cease-and-desist order and civil money penalties.
Multifamily Housing Goals
Our multifamily housing goals for 2022 were established as a fixed number of units to be financed. For 2023 and 2024,
our multifamily housing goals are based on the percentage share of the goal-eligible units in our annual multifamily loan
acquisitions that are affordable to each income category. FHFA may adjust our 2024 multifamily housing goals
considering market conditions or for other reasons.
In October 2023, FHFA determined that we met all of our 2022 multifamily housing goals. The table below displays more
information about our 2022 multifamily housing goals and our performance against these goals, as well as our
multifamily housing goals for 2023 and 2024.
Business | Legislation and Regulation |
Fannie Mae 2023 Form 10-K | 16 |
Multifamily Housing Goals | ||||||
2022 | 2023 and 2024 | |||||
Goal | Result | Goal | ||||
(Fixed number of units) | (Percentage share of goal-eligible units) | |||||
Low-income goal(1) | 415,000 | 419,361 | 61 | % | ||
Very low-income subgoal(2) | 88,000 | 127,905 | 12 | |||
Small multifamily low-income subgoal(3) | 17,000 | 21,436 | 2.5 | |||
(1)Affordable to low-income families, defined as families with incomes no greater than 80% of area median income.
(2)Affordable to very low-income families, defined as families with incomes no greater than 50% of area median income.
(3)Units in small multifamily properties (defined as properties with 5 to 50 units) affordable to low-income families.
We believe we met all of our 2023 multifamily housing goals. FHFA will make a final determination regarding our 2023
multifamily housing goals performance later in the year.
As described in “Risk Factors—GSE and Conservatorship Risk,” the actions we may take to meet our housing goals, as
well as our duty to serve underserved markets and our Equitable Housing Finance Plan obligations described below,
may materially adversely affect our business, results of operations and financial condition.
Duty to Serve Underserved Markets
The GSE Act requires that we serve very low-, low-, and moderate-income families in three specified underserved
markets: manufactured housing, affordable housing preservation and rural housing. FHFA requires that we adopt an
underserved markets plan for each underserved market covering a three-year period that sets forth the activities and
objectives we will undertake to meet our duty to serve in that market.
FHFA has also established an annual process for evaluating our achievements under the plans, with performance
results to be reported to Congress annually. If FHFA determines that we failed to meet the requirements of an
underserved markets plan, FHFA may require us to submit a housing plan for FHFA approval that could require us to
take additional steps. In October 2023, FHFA reported its determination that we complied with our 2022 duty to serve
requirements. We believe we also met our 2023 duty to serve obligations. FHFA will determine our performance with
respect to our 2023 duty to serve obligations in 2024.
Equitable Housing Finance Plan
FHFA instructed us to submit an Equitable Housing Finance Plan to FHFA and an annual performance report on our
actions undertaken pursuant to the plan. We publicly released our first Equitable Housing Finance Plan in June 2022
and an update to the plan in April 2023. We also published our inaugural Equitable Housing Finance Plan performance
report in April 2023. The Equitable Housing Finance Plan provides a three-year roadmap for our actions to advance
greater equity in the housing finance system by working to remove significant barriers to quality affordable rental
housing and homeownership for historically underserved consumers. More information about our Equitable Housing
Finance Plan and related performance report is available on our website.
Guaranty Fees and Pricing
Our guaranty fees and pricing are subject to regulatory, legislative and conservatorship requirements, including FHFA
guidance and instruction. These requirements include the following:
•Upfront Fees. FHFA, as conservator, must approve changes to the single-family national loan-level price
adjustments (or upfront fees) that we charge and can direct us to make other changes to our guaranty fee
pricing for new single-family acquisitions.
•Base Fees. We can change our base single-family guaranty fee pricing, subject to minimum base guaranty fees
set by FHFA. These minimum fees generally apply to our acquisitions of 30-year and 15-year single-family
fixed-rate loans in lender swap transactions.
•Return Targets. For new single-family and multifamily acquisitions, FHFA has instructed us to meet minimum
return on equity targets based on the enterprise regulatory capital framework requirements (including buffers)
assuming those requirements were in effect today. FHFA also has instructed us to establish a long-term target
for returns at the enterprise level. These return targets may affect the guaranty fees we charge.
•TCCA Fees. Pursuant to the Temporary Payroll Tax Cut Continuation Act of 2011, as amended by the
Infrastructure Investment and Jobs Act of 2021, until October 1, 2032, we are required to collect 10 basis points
in guaranty fees on all single-family mortgages delivered to us and pay these amounts to Treasury. We include
Business | Legislation and Regulation |
Fannie Mae 2023 Form 10-K | 17 |
these amounts in net interest income and recognize the expense as “TCCA fees.” See “Certain Relationships
and Related Transactions, and Director Independence—Transactions with Related Persons—Transactions with
Treasury—Obligation to Pay TCCA Fees to Treasury” for additional discussion of our TCCA fees.
•UMBS®. Our ability to change our single-family guaranty fee pricing is limited by the FHFA rule described in
“FHFA Rule on Uniform Mortgage-Backed Securities” below.
In addition, under the senior preferred stock purchase agreement, we are not permitted to charge different single-family
guaranty fees based on the business characteristics of the seller, including their size, charter type or volume of business
with us.
New Products and Activities
The GSE Act requires us to notify FHFA before undertaking a new activity and to obtain prior approval before offering a
new product to the market, subject to certain exclusions. The FHFA rule implementing these provisions established a
process for the review of new activities and products by FHFA and defined a new product as any new activity that FHFA
determines merits public notice and comment about whether it is in the public interest. FHFA may approve a new
product proposed by us if FHFA determines that the new product is authorized under our charter, in the public interest
and consistent with safety and soundness. FHFA may place conditions or limitations on a new product or activity.
Executive Compensation
The amount and type of compensation we may pay our executives is subject to legal and regulatory restrictions,
particularly while we are in conservatorship, as described in “Executive Compensation—Compensation Discussion and
Analysis—Legal, Regulatory and Conservator Restrictions on Executive Compensation.”
FHFA Rule on Uniform Mortgage-Backed Securities
We and Freddie Mac issue single-family uniform mortgage-backed securities, or “UMBS.” We and Freddie Mac are
required to align our programs, policies and practices that affect the prepayment rates of to-be-announced (“TBA”)
market-eligible MBS pursuant to an FHFA rule. The rule is intended to ensure that Fannie Mae and Freddie Mac’s
programs, policies and practices that have a material effect on MBS cash flows remain aligned regardless of whether
we and Freddie Mac are in conservatorship. The rule provides a non-exhaustive list of covered programs, policies and
practices, including: single-family guaranty fees; eligibility standards for sellers, servicers, and mortgage insurers;
distressed loan servicing requirements; removal of mortgage loans from securities; servicer compensation; and
proposals that could materially change the credit risk profile of our single-family mortgages. FHFA may mandate
additional alignment efforts in the future that affect our business and our MBS. As a result of this rule, we must evaluate
each potential change to our programs, policies and practices, and if the change may cause misalignment, submit the
change to FHFA for evaluation and approval.
SEC Final Rule Prohibiting Conflicts of Interest in Certain Securitizations
In December 2023, the SEC published a final rule prohibiting conflicts of interest in certain securitization transactions.
The rule prohibits securitization participants from engaging in specified “conflicted transactions” with respect to an
asset-backed security for a period ending one year after the initial sale of that security. Securitization participants will be
required to comply with the rule effective in June 2025.
The final rule clarified that our credit risk transfer transactions are not prohibited transactions under the rule, as they fall
within an exception to the rule; however, we will be required to establish, implement, maintain, and enforce an internal
compliance program that is reasonably designed to ensure our compliance with the conditions of the exception.
Where You Can Find Additional Information
We make available free of charge through our website our annual reports on Form 10-K, quarterly reports on
Form 10‑Q, current reports on Form 8-K and all other SEC reports and amendments to those reports as soon as
reasonably practicable after we electronically file the material with, or furnish it to, the SEC. Our website address is
www.fanniemae.com. Materials that we file with the SEC are also available from the SEC’s website, www.sec.gov. You
may also request copies of any filing from us, at no cost, by calling the Fannie Mae Investor Relations & Marketing
Helpline at 1-800-2FANNIE (1-800-232-6643).
References in this report to our website or to the SEC’s website do not incorporate information appearing on those
websites unless we explicitly state that we are incorporating the information.
Business | Legislation and Regulation |
Fannie Mae 2023 Form 10-K | 18 |
Forward-Looking Statements
This report includes statements that constitute forward-looking statements within the meaning of Section 21E of the
Exchange Act. In addition, we and our senior management may from time to time make forward-looking statements in
our other filings with the SEC, our other publicly available written statements and orally to analysts, investors, the news
media and others. Forward-looking statements often include words such as “expect,” “anticipate,” “intend,” “plan,”
“believe,” “seek,” “estimate,” “forecast,” “project,” “would,” “should,” “could,” “likely,” “may,” “will” or similar words.
Examples of forward-looking statements in this report include, among others, statements relating to our beliefs and
expectations regarding the following matters:
•economic, mortgage market and housing market conditions (including expectations regarding economic growth,
home price growth, unemployment rates, loan origination volumes and interest rates), the factors that will affect
those conditions, and the impact of those conditions on our business and financial results;
•the impact of hedge accounting on the volatility of our financial results;
•our future net worth;
•the future aggregate liquidation preference of our senior preferred stock;
•our future dividend payments on the senior preferred stock;
•our business plans and strategies, and their impact, including our expectations and beliefs relating to: the use
and potential benefits of artificial intelligence; our efforts to advance greater equity in the housing finance
system; and our succession planning approach;
•the impact of changes in our pricing;
•the factors that will attract private investors in our equity securities and the impact of such factors on our ability
to exit conservatorship and on our business;
•the credit performance of the loans in our guaranty book of business (including future loan delinquencies and
foreclosures) and the factors that will affect such performance;
•the effects of our credit risk transfer transactions, as well as the factors that will affect our engagement in future
credit risk transfer transactions;
•the factors that will affect the competition we face;
•how we intend to repay our debt obligations and the factors that will affect our access to debt funding;
•the factors that will affect our credit ratings and the impact of changes in our credit ratings;
•the impact of legislation and regulation on our business, financial results or financial condition;
•our housing goals and duty-to-serve performance;
•our payments to HUD and Treasury funds under the GSE Act;
•the impact of future changes to our credit score model requirements and our credit report requirements;
•legal and regulatory proceedings;
•the risks to our business;
•our counterparty concentration and the risk of default or loss relating to specified counterparties;
•climate change and its impact; and
•cyber attacks and other information security threats, and the impact of our cybersecurity defense tools and
systems safeguards.
Forward-looking statements reflect our management’s current expectations, forecasts or predictions of future conditions,
events or results based on various assumptions and management’s estimates of trends and economic conditions in the
markets in which we are active and that otherwise impact our business plans. Forward-looking statements are not
guarantees of future performance. By their nature, forward-looking statements are subject to significant risks and
uncertainties and changes in circumstances. Our actual results and financial condition may differ, possibly materially,
from the anticipated results and financial condition indicated in these forward-looking statements.
Business | Forward-Looking Statements | ||
Fannie Mae 2023 Form 10-K | 19 |
There are a number of factors that could cause actual conditions, events or results to differ materially from those
described in our forward-looking statements, including, among others, the following:
•factors that will affect future economic conditions, including the persistence of inflationary pressures and the
risk of financial market disruptions;
•growth, deterioration and the overall health and stability of the U.S. economy, including U.S. gross domestic
product (“GDP”), unemployment rates, personal income, inflation and other indicators thereof;
•the timing and level of, as well as regional variation in, home price changes;
•the volume of mortgage originations;
•the size and our share of the U.S. mortgage market and the factors that affect them, including population
growth and household formation;
•changes in fiscal or monetary policy of the U.S. or other countries, and the impact of such changes on domestic
and international financial markets;
•domestic, regional and global political risks and uncertainties, including the impact of conflict in the Middle East,
the Russian war in Ukraine, and tensions between China and Taiwan;
•the impact of stress in the banking sector on the financial condition and business activities of our
counterparties, including stress on regional banks and on banks with significant exposure to commercial real
estate;
•future interest rates and credit spreads;
•developments that may be difficult to predict, including: market conditions that result in changes in our deferred
guaranty fee income or changes in net interest income from our portfolios; fluctuations in the estimated fair
value of our derivatives and other financial instruments that we mark to market through our earnings; and
developments that affect our loss reserves, such as changes in interest rates, home prices or accounting
standards;
•disruptions or instability in the housing and credit markets;
•changes in the demand for Fannie Mae MBS, our debt securities or our credit risk transfer securities, in general
or from one or more major groups of investors;
•constraints on our entry into new credit risk transfer transactions;
•a decrease in our credit ratings;
•limitations on our ability to access the debt capital markets;
•the size, composition, quality and performance of our guaranty book of business and retained mortgage
portfolio;
•how long loans in our guaranty book of business remain outstanding;
•our and our competitors’ future guaranty fee pricing and the impact of that pricing on our competitive
environment and guaranty fee revenues;
•the competitive environment in which we operate, including the impact of legislative, regulatory or other
developments on levels of competition in our industry and other factors affecting our market share;
•significant challenges we face in retaining and hiring qualified executives and other employees;
•our conservatorship, including any changes to or termination (by receivership or otherwise) of the
conservatorship and its effect on our business;
•the investment by Treasury, including the impact of past or potential future changes to the terms of the senior
preferred stock purchase agreement, and their effect on our business, including restrictions imposed on us by
the terms of the senior preferred stock purchase agreement, the senior preferred stock, and the warrant, as
well as the extent that these or other restrictions on our business and activities are applied to us through other
mechanisms even if we cease to be subject to these agreements and instruments;
•uncertainty regarding our future, our exit from conservatorship, our ability to raise or earn the capital needed to
meet our capital requirements, and our ability to achieve long-term return targets;
•the impact of the enterprise regulatory capital framework, as well as future legislative and regulatory
requirements or changes, governmental initiatives, or executive orders affecting us, such as the enactment of
Business | Forward-Looking Statements | ||
Fannie Mae 2023 Form 10-K | 20 |
housing finance reform legislation, including changes that limit our business activities or our footprint, impose
new mandates on us, or affect our ability to change our pricing;
•the possibility that changes in leadership at FHFA or the Administration may result in changes that affect our
company or our business;
•actions we may be required to take by FHFA, in its role as our conservator or as our regulator, such as changes
in the type of business we do, or actions relating to UMBS or our resecuritization of Freddie Mac-issued
securities;
•limitations on our business imposed by FHFA, in its role as our conservator or as our regulator;
•adverse effects from activities we undertake to support the mortgage market and help borrowers, renters,
lenders and servicers, including actions we may take to reach additional underserved borrowers or address
barriers to sustainable housing opportunities and advance equity in housing finance;
•our reliance on CSS and the common securitization platform CSS operates for a majority of our single-family
securitization activities; provisions in the CSS limited liability company agreement that permit FHFA to add
members to the CSS Board of Managers, which may limit the ability of Fannie Mae and Freddie Mac to control
decisions of the Board; and changes FHFA may require in our relationship with or in our support of CSS;
•actions by FHFA, Treasury, the Federal Reserve, the Office of the Comptroller of the Currency (“OCC”), the
Federal Deposit Insurance Corporation (“FDIC”), the Commodity Futures Trading Commission (“CFTC”), HUD,
the CFPB, the SEC or other regulators, Congress, the Executive Branch, or state or local governments that
affect our business;
•changes in the structure and regulation of the financial services industry;
•a default by the United States government on its obligations;
•a shutdown of the United States government;
•the potential impact of a change in the corporate income tax rate, which we expect would affect our net income
in the quarter of enactment;
•significant changes in forbearance, modification and foreclosure activity;
•the volume and pace of any future nonperforming and reperforming loan sales and their impact on our financial
results and serious delinquency rates;
•changes in borrower behavior;
•actions we may take to mitigate losses, and the effectiveness of our loss mitigation strategies, management of
our REO inventory and pursuit of contractual remedies;
•natural disasters, environmental disasters, terrorist attacks, widespread health emergencies or pandemics,
infrastructure failures, or other disruptive or catastrophic events;
•severe weather events, fires, floods or other climate change events or impacts, including those for which we
may be uninsured or under-insured or that may affect our counterparties, and other risks resulting from climate
change and efforts to address climate change and related risks;
•defaults by one or more of our counterparties;
•resolution or settlement agreements we may enter into with our counterparties;
•our need to rely on third parties to fully achieve some of our corporate objectives, including our reliance on
mortgage servicers;
•the effectiveness of our risk management processes and related controls, including those relating to climate
risk and model risk;
•the effectiveness of our business resiliency plans and systems;
•the stability and adequacy of the systems and infrastructure that impact our operations, including ours and
those of CSS, our other counterparties and other third parties;
•the impact of interdependence between the single-family mortgage securitization programs of Fannie Mae and
Freddie Mac in connection with UMBS;
•operational control weaknesses;
•our reliance on models and future updates we make to our models, including the data and assumptions used
by these models;
Business | Forward-Looking Statements | ||
Fannie Mae 2023 Form 10-K | 21 |
•cyber attacks or other information security breaches or threats impacting us or the third parties with which we
do business;
•changes in GAAP, guidance by the Financial Accounting Standards Board (“FASB”) and changes to our
accounting policies;
•changes in the fair value of our assets and liabilities; and
•the other factors described in “Risk Factors.”
Readers are cautioned not to unduly rely on the forward-looking statements we make and to place these forward-
looking statements into proper context by carefully considering the factors identified above and those discussed in “Risk
Factors” in this report. These forward-looking statements are representative only as of the date they are made, and we
undertake no obligation to update any forward-looking statement as a result of new information, future events or
otherwise, except as required under the federal securities laws.
Item 1A. Risk Factors
The risks we face could materially adversely affect our business, results of operations, financial condition, liquidity and
net worth, and could cause our actual results to differ materially from our past results or the results contemplated by any
forward-looking statements we make. We believe the risks described below and in the other sections of this report
referenced below are the most significant we face; however, these are not the only risks we face. We face additional
risks and uncertainties not currently known to us or that we currently believe are immaterial. Refer to “MD&A—Key
Market Economic Indicators,” “MD&A—Risk Management,” “MD&A—Single-Family Business” and “MD&A—Multifamily
Business” for more detailed descriptions of the primary risks to our business and how we seek to manage those risks.
Risk Factors Summary
The summary of risks below provides an overview of the principal risks we are exposed to in the normal course of our
business activities. This summary does not contain all of the information that may be important to you, and you should
read the more detailed discussion of risks that follows this summary.
GSE and Conservatorship Risk
•The future of our company is uncertain.
•We are significantly undercapitalized and may be unable to achieve full capitalization. Our higher capital
requirements relative to our primary competitor could materially negatively affect our business.
•FHFA, as our conservator, controls our business activities. We may be required to take actions that are difficult
to implement, reduce our profitability or expose us to additional risk.
•Our business activities are significantly affected by the senior preferred stock purchase agreement.
•Our regulator is authorized or required to place us into receivership under specified conditions, which would
result in our liquidation. Amounts recovered by our receiver may not be sufficient to pay claims outstanding
against us, repay the liquidation preference of our preferred stock or to provide any proceeds to common
stockholders.
•Our business and results of operations may be materially adversely affected if we are unable to retain and
recruit well-qualified executives and other employees. The conservatorship, the uncertainty of our future, and
limitations on our executive and employee compensation put us at a disadvantage compared to many other
companies with which we compete for talent.
•Pursuing our housing goals, duty to serve obligations, and Equitable Housing Finance Plan may materially
adversely affect our business, results of operations and financial condition.
•The conservatorship and agreements with Treasury adversely affect our common and preferred stockholders.
•The liquidity and market value of our MBS could be adversely affected by negative developments in the UMBS
market or from the loss of support from certain regulatory bodies for UMBS.
•Our issuance of UMBS and structured securities backed by Freddie Mac-issued securities exposes us to
significant operational and counterparty credit risk.
•Our reliance on CSS and the common securitization platform exposes us to significant third-party risk.
•We are limited in our ability to diversify our business and undertake activities that management believes would
benefit our business.
Business | Forward-Looking Statements | ||
Fannie Mae 2023 Form 10-K | 22 |
•An active trading market in our equity securities may cease to exist, which would adversely affect the market
price and liquidity of our common and preferred stock.
Credit Risk
•We may incur significant provisions for credit losses and write-offs on the loans in our book of business.
•The credit enhancements we use provide only limited protection against potential future credit losses. These
transactions also increase our expenses.
•We may suffer material losses if borrowers suffer property damage as a result of hazards for which the
borrowers have no or insufficient insurance.
•The occurrence of major natural or other disasters in the United States or its territories could materially
increase our provision for credit losses and our write-offs.
•Our business, financial condition and results of operations could be materially adversely affected by impacts
related to climate change.
•One or more of our institutional counterparties may fail to fulfill their contractual obligations to us, resulting in
financial losses, business disruption and decreased ability to manage risk.
•Our financial condition or results of operations may be materially adversely affected if mortgage servicers fail to
perform their obligations to us.
•We may incur losses as a result of claims under our mortgage insurance policies not being paid in full or at all.
•Mortgage fraud could result in significant financial losses and harm to our reputation.
Operational and Model Risk
•A failure in our operational systems or infrastructure, or those of third parties, could materially adversely affect
our business, impair our liquidity, cause financial losses and harm our reputation.
•A breach of the security of our systems, or those of third parties with which we do business, including as a
result of cyber attacks, could materially damage or disrupt our business or result in the disclosure or misuse of
confidential or other information (including personal information) that could materially damage our reputation,
result in material regulatory sanctions and/or result in increased costs or losses that have a material adverse
impact on our business, financial results and financial condition.
•Material weaknesses in our internal control over financial reporting could result in errors in our reported results
or disclosures that are not complete or accurate.
•Failure of our models to produce reliable results may materially adversely affect our ability to manage risk and
make effective business decisions, as well as create regulatory and reputational risk.
Liquidity and Funding Risk
•Limitations on our ability to access the debt capital markets could have a material adverse effect on our ability
to fund our operations, and our liquidity contingency plans may be difficult or impossible to execute during a
sustained liquidity crisis.
•A decrease in the credit ratings on our senior unsecured debt could increase our borrowing costs and have an
adverse effect on our ability to issue debt on reasonable terms, particularly if such a decrease were not based
on a similar action on the credit ratings of the U.S. government. A decrease in our credit ratings also could
require that we post additional collateral for our derivatives contracts.
Market and Industry Risk
•Changes in interest rates or our loss of the ability to manage interest-rate risk successfully could materially
adversely affect our financial results and condition, and increase our interest-rate risk.
•Changes in spreads could materially impact our results of operations, net worth and the fair value of our net
assets.
•Our business and financial results are affected by general economic conditions, including home prices and
employment trends, and changes in economic conditions or financial markets may materially adversely affect
our business and financial condition. Volatility or uncertainty in global, regional or domestic political conditions
also can significantly affect economic conditions and financial markets.
•Actions by the Federal Reserve can materially affect our business and financial condition, including our
business volumes and demand for our mortgage-backed securities.
Risk Factors | Risk Factors Summary | ||
Fannie Mae 2023 Form 10-K | 23 |
Legal and Regulatory Risk
•Regulatory changes in the financial services industry may negatively impact our business.
•Legislative, regulatory or judicial actions could negatively impact our business, results of operations, financial
condition, liquidity or net worth.
•Our business and financial results could be materially adversely affected by legal or regulatory proceedings.
General Risk
•Changes in accounting standards and policies can be difficult to predict and can materially impact how we
record and report our financial results.
•In many cases, our accounting policies and methods, which are fundamental to how we report our financial
condition and results of operations, require management to make judgments and estimates about matters that
are inherently uncertain. Management also relies on models in making these estimates.
GSE and Conservatorship Risk
The future of our company is uncertain.
The company faces an uncertain future, including how long we will continue to exist in our current form, the extent of our
role in the market, the level of government support of our business, how long we will be in conservatorship, what form
we will have, what ownership interest, if any, our current common and preferred stockholders will hold in us after the
conservatorship is terminated, and whether we will continue to exist following conservatorship. The conservatorship has
been in place since 2008, is indefinite in duration, and the timing, conditions and likelihood of our emerging from
conservatorship are uncertain. Our conservatorship could terminate through a receivership. Termination of the
conservatorship, other than in connection with a receivership, requires Treasury’s consent under the senior preferred
stock purchase agreement; unless (1) all currently pending significant litigation relating to the conservatorship and the
August 2012 amendment to the senior preferred stock purchase agreement has been resolved, and (2) for two or more
consecutive quarters, our common equity tier 1 capital, together with any other stockholder equity that we may issue in
a public offering, equals or exceeds 3% of our adjusted total assets (as defined in the enterprise regulatory capital
framework). See “Legal Proceedings” and “Note 17, Commitments and Contingencies” for a discussion of the pending
significant litigation relating to the amendment of the senior preferred stock purchase agreement and/or
conservatorship.
We believe that the returns on our current book of business are not sufficient to attract private investors in our equity
securities, which we believe would limit our options for exiting conservatorship. Increasing our returns to a level
sufficient to attract private investors may require substantial increases in our pricing or changes in other aspects of our
business that would likely affect our competitive position, our loan acquisition volumes and market share, the mix of
loans that we acquire or the type of business we do, including the level of support we provide to low- and moderate-
income borrowers and renters. Our ability to increase our returns may be limited given our business model and role in
the U.S. housing market. In addition, we believe that Treasury’s potential additional substantial equity ownership in our
company, along with restrictions imposed on our business and future dividends and fees we will be required to pay to
Treasury under the current terms of the senior preferred stock purchase agreement, reduces our attractiveness to
potential equity investors.
If we exit conservatorship, specified regulatory exemptions that currently apply to us or our securities would no longer
apply, such as the rule implementing the Dodd-Frank Act’s credit risk retention requirement and the Federal Reserve
Board’s single-counterparty credit limits rule. The expiration of these exemptions could result in significant changes to
our business and materially adversely affect our financial results and condition.
The Administration and Congress may consider housing finance reforms or legislation that could result in significant
changes in our structure and role in the future, including proposals that would result in Fannie Mae’s liquidation or
dissolution. Congress may consider legislation, or federal agencies such as FHFA may consider regulations or
administrative actions, to increase the competition we face, reduce our market share, further restrict our ability to
change our loan pricing, further expand our obligations to provide funds to Treasury, further constrain our business
operations, or subject us to other obligations or restrictions that may adversely affect our business. We cannot predict
the timing or content of housing finance reform legislation or other legislation, regulations or administrative actions that
will impact our activities, nor can we predict the extent of such impact.
We are significantly undercapitalized and may be unable to achieve full capitalization. Our higher capital
requirements relative to our primary competitor could materially negatively affect our business.
Our current capital levels are negative and are significantly below the levels required under the enterprise regulatory
capital framework. In addition, we may be unable to achieve full capitalization under the enterprise regulatory capital
Risk Factors | Risk Factors Summary | ||
Fannie Mae 2023 Form 10-K | 24 |
framework, as dividends to Treasury on the senior preferred stock may resume before we reach full capitalization. Our
efforts to build capital to meet our requirements can be significantly affected by the amount, type and pricing of our new
loan acquisitions, which can drive increases in our required capital that offset or even outpace increases in our available
capital.
We have higher capital requirements than our primary competitor, Freddie Mac, driven primarily by the larger size of our
guaranty book of business. These higher capital requirements relative to Freddie Mac could materially negatively affect
our ability to compete with Freddie Mac for the acquisition of mortgage loans, our market share, and the profitability and
credit characteristics of the loans we acquire. For more information on the enterprise regulatory capital framework and
our capital metrics as of December 31, 2023, see “Business—Legislation and Regulation—Capital Requirements” and
“MD&A—Liquidity and Capital Management—Capital Management—Capital Requirements.”
FHFA, as our conservator, controls our business activities. We may be required to take actions that are difficult
to implement, reduce our profitability or expose us to additional risk.
In conservatorship, our business is not managed with a strategy to maximize stockholder value. Our directors owe their
fiduciary duties of care and loyalty solely to the conservator. Thus, while we are in conservatorship, the Board has no
fiduciary duties to the company or its stockholders. The Supreme Court has interpreted FHFA’s authority as conservator
expansively, noting that “when the FHFA acts as a conservator, it may aim to rehabilitate the regulated entity in a way
that, while not in the best interests of the regulated entity, is beneficial to the Agency and, by extension, the public it
serves.” As conservator, FHFA can direct us to enter into contracts or enter into contracts on our behalf, and generally
has the power to transfer or sell any of our assets or liabilities.
Our strategic direction is subject to FHFA review and approval. FHFA also requires us to meet specified annual
corporate performance objectives referred to as the conservatorship scorecard. We face a variety of different, and
sometimes competing, business objectives and FHFA-mandated activities, such as the initiatives we have been
pursuing under the conservatorship scorecards. FHFA has and may require us to undertake activities that are costly or
difficult to implement and that increase our operational risk. FHFA also has required us to make changes to our
business that have adversely affected our financial results and could require us to make additional changes at any time.
For example, FHFA may require us to undertake some activities that: reduce our profitability; expose us to additional
credit, market, funding, operational, and other risks; or provide additional support for the mortgage market that serves
our mission, but adversely affects our financial results.
FHFA can prevent us from engaging in business activities or transactions that we believe would benefit our business
and financial results, and from time to time has done so. For example, because FHFA can direct us to make changes to
our guaranty fee pricing and can prevent us from making changes to our guaranty fee pricing, our ability to address
changing market conditions, pursue certain strategic objectives, or manage the mix of loans we acquire is constrained.
With FHFA’s broad powers as conservator, changes in leadership at FHFA, including those resulting from a change in
the Administration, could result in significant changes to the goals FHFA establishes for us and could have a material
impact on our business and financial results. The President has the power to remove the Director of FHFA for any
reason.
Our business activities are significantly affected by the senior preferred stock purchase agreement.
Even if we are released from conservatorship, we remain subject to the terms of the senior preferred stock purchase
agreement with Treasury, under which we issued the senior preferred stock and warrant. The senior preferred stock
purchase agreement can only be waived or amended with the consent of Treasury. The agreement includes a number
of covenants that significantly restrict our business activities. We believe these restrictions under the senior preferred
stock purchase agreement adversely affect our ability to attract capital from the private sector. For more information
about the covenants in the senior preferred stock purchase agreement and their potential impact on our business, see
“Business—Conservatorship and Treasury Agreements—Treasury Agreements—Covenants.”
Our regulator is authorized or required to place us into receivership under specified conditions, which would
result in our liquidation. Amounts recovered by our receiver may not be sufficient to pay claims outstanding
against us, repay the liquidation preference of our preferred stock or to provide any proceeds to common
stockholders.
The Director of FHFA is required to place us into receivership if they make a written determination that our assets are
less than our obligations or if we have not been paying our debts as they become due, in either case, for a period of
60 days after the SEC filing deadline for any of our Form 10-Ks or Form 10-Qs. Although Treasury committed to
providing us funds in accordance with the terms of the senior preferred stock purchase agreement, if we need funding
from Treasury to avoid triggering FHFA’s obligation to place us into receivership, Treasury may not be able to provide
sufficient funds to us within the required 60 days if it has exhausted its borrowing authority, if there is a government
shutdown, or if the funding we need exceeds the amount available to us under the agreement. In addition, we could be
Risk Factors | GSE and Conservatorship Risk | ||
Fannie Mae 2023 Form 10-K | 25 |
put into receivership at the discretion of the Director of FHFA at any time for the reasons set forth in the GSE Act,
including if our Board or stockholders consent to the appointment of a receiver or, if under the definitions in the GSE Act,
we are undercapitalized with no reasonable prospect of becoming adequately capitalized or we are critically
undercapitalized. Under the GSE Act, FHFA succeeded to all of the rights, titles, powers and privileges of our board of
directors and stockholders.
A receivership would terminate our conservatorship. In addition to the powers FHFA has as our conservator, the
appointment of FHFA as our receiver would terminate all rights and claims that our stockholders and creditors may have
against our assets or under our charter arising from their status as stockholders or creditors, except for their right to
payment, resolution or other satisfaction of their claims as permitted under the GSE Act. If we are placed into
receivership and do not or cannot fulfill our MBS guaranty obligations, there may be significant delays of any payments
to our MBS holders, and the MBS holders could become unsecured creditors of ours with respect to claims made under
our guaranty to the extent the mortgage collateral underlying the Fannie Mae MBS is insufficient to satisfy the claims of
the MBS holders.
In the event of a liquidation of our assets, only after payment of secured claims, administrative expenses of the receiver
and the immediately preceding conservator, other obligations of the company (other than obligations to stockholders),
and the liquidation preference of the senior preferred stock, would any liquidation proceeds be available to repay the
liquidation preference on any other series of preferred stock. Finally, only after the liquidation preference on all series of
preferred stock is repaid would any liquidation proceeds be available for distribution to the holders of our common stock.
In the event of such a liquidation, we can make no assurances that there would be sufficient proceeds to make any
distribution to holders of our preferred stock or common stock, other than to Treasury as the holder of our senior
preferred stock. As described in “Business—Conservatorship and Treasury Agreements—Treasury Agreements—
Senior Preferred Stock Purchase Agreement and Senior Preferred Stock,” under the current terms of the senior
preferred stock, until the capital reserve end date, the liquidation preference of the senior preferred stock increases
each quarter by the amount of the increase in our net worth, if any, during the immediately prior fiscal quarter. The
aggregate liquidation preference of the senior preferred stock was $195.2 billion as of December 31, 2023 and we
expect it will continue to increase as we increase our net worth.
Our business and results of operations may be materially adversely affected if we are unable to retain and
recruit well-qualified executives and other employees. The conservatorship, the uncertainty of our future, and
limitations on our executive and employee compensation put us at a disadvantage compared to many other
companies with which we compete for talent.
Our business is highly dependent on the talents and efforts of our executives and other employees. The
conservatorship, the uncertainty of our future, and limitations on executive and employee compensation have had, and
are likely to continue to have, an adverse effect on our ability to retain and recruit talent. Departures in key management
positions and challenges in finding replacements could harm our ability to manage our business effectively, to
successfully implement strategic initiatives, and ultimately could adversely affect our financial performance.
Actions taken by Congress, FHFA and Treasury to date, or that may be taken by them or other government agencies in
the future, have had, and are expected to continue to have, an adverse effect on our retention and recruitment of
executives and other employees. We are subject to significant restrictions on the amount and type of compensation we
may pay as a result of the senior preferred stock purchase agreement and conservatorship, as described in more detail
in “Executive Compensation—Compensation Discussion and Analysis—Legal, Regulatory and Conservator Restrictions
on Executive Compensation.” For example, during conservatorship direct annual compensation for our Chief Executive
Officer is limited to base salary at an annual rate of $600,000 and our senior executives are prohibited from receiving
bonuses.
As a result of the restrictions on our compensation, we have not been able to incent and reward excellent performance
with compensation structures that provide upside potential to our executives, which places us at a disadvantage
compared to many other companies in attracting and retaining executives. In addition, the restrictions on our
compensation and the uncertainty of potential action by Congress or the Administration with respect to our future—
including the potential for a new Administration to make significant changes to the goals FHFA establishes for us,
whether we will exit conservatorship, how long it may take before we exit conservatorship, or whether housing finance
reform will result in a significant restructuring of the company or the company no longer continuing to exist—also may
adversely affect our ability to retain and recruit executives and other employees.
The cap on our Chief Executive Officer compensation continues to make retention and succession planning for this
position difficult, and it may make it difficult to attract qualified candidates for this critical role in the future. We face
competition from the financial services and technology industries, and from businesses outside of these industries, for
qualified executives and other employees. If future competition for executive and employee talent is strong and if we are
unable to retain, promote and attract executives and other employees with the necessary skills and talent, we would
Risk Factors | GSE and Conservatorship Risk | ||
Fannie Mae 2023 Form 10-K | 26 |
face increased risks for operational failures. In the future, if there are several high-level departures at approximately the
same time, our ability to conduct our business could be materially adversely affected, which could have a material
adverse effect on our results of operations and financial condition.
Pursuing our housing goals, duty to serve obligations, and Equitable Housing Finance Plan may materially
adversely affect our business, results of operations and financial condition.
We are required by the GSE Act to support the housing market in ways that could materially adversely affect our
financial results and condition. For example, we are subject to housing goals that require a portion of the mortgage
loans we acquire to meet specified standards relating to affordability or location. We also have a duty to serve very low-,
low- and moderate-income families in three specified underserved markets: manufactured housing, affordable housing
preservation and rural housing. In 2021, FHFA instructed us to prepare and implement a three-year Equitable Housing
Finance Plan. This plan, which we initially published in June 2022 and updated in April 2023, is intended to advance
greater equity in the housing finance system by working to remove significant barriers to quality affordable rental
housing and homeownership for historically underserved consumers. We are taking actions to support the housing
market, including to meet our housing goals, duty to serve obligations and Equitable Housing Finance Plan, that could
materially adversely affect our profitability and our ability to meet our targeted return requirements established by FHFA.
For example, we are acquiring loans to meet our housing goals that offer lower expected returns than the returns
earned on non-housing-goal-related loans and that could materially adversely affect our ability to meet our capital
requirements. In addition, some of the loans we acquire to meet our housing goals, duty to serve obligations and
Equitable Housing Finance Plan obligations also pose a higher credit risk than the other loans we purchase, which
could materially increase our provision for credit losses and our write-offs.
If we do not meet our housing goals or duty to serve requirements, and FHFA finds that the goals or requirements were
feasible, we may become subject to a housing plan with additional requirements that could have a material adverse
effect on our results of operations and financial condition. The potential penalties for failure to comply with housing plan
requirements relating to our housing goals include a cease-and-desist order and civil money penalties. See “Business—
Legislation and Regulation” for more information on our housing goals, duty to serve underserved markets and
Equitable Housing Finance Plan.
The conservatorship and agreements with Treasury adversely affect our common and preferred stockholders.
The material adverse effects of the conservatorship on our stockholders under our agreements with Treasury include
the following:
No voting rights during conservatorship. During conservatorship, our common stockholders do not have the ability to
elect directors or to vote on other matters unless the conservator delegates this authority to them.
No dividends to common or preferred stockholders, other than to Treasury. Our conservator announced in September
2008 that we would not pay any dividends on the common stock or on any series of preferred stock, other than the
senior preferred stock, while we are in conservatorship. In addition, under the terms of the senior preferred stock
purchase agreement, dividends may not be paid to common or preferred stockholders (other than on the senior
preferred stock) without the prior written consent of Treasury, regardless of whether we are in conservatorship.
Our profits directly increase the liquidation preference of Treasury’s senior preferred stock and we will be required to
pay dividends on the senior preferred stock in the future. The senior preferred stock ranks senior to our common stock
and all other series of our preferred stock, as well as any capital stock we issue in the future, as to both dividends and
distributions upon liquidation. Accordingly, if we are liquidated, the senior preferred stock is entitled to its then-current
liquidation preference, before any distribution is made to the holders of our common stock or other preferred stock.
Under the current terms of the senior preferred stock, until the capital reserve end date, the liquidation preference of the
senior preferred stock increases each quarter by the amount of the increase in our net worth, if any, during the
immediately prior fiscal quarter. We expect the aggregate liquidation preference of the senior preferred stock will
continue to increase as we increase our net worth. In addition, the current terms of the senior preferred stock provide
that, following the capital reserve end date, we will be required to pay dividends on the senior preferred stock of the
lesser of (1) a 10% annual rate on the then-current liquidation preference of the senior preferred stock and (2) an
amount equal to the incremental increase in our net worth during the immediately prior fiscal quarter. The current terms
of the senior preferred stock also provide that dividends will resume when our net worth exceeds the amount of adjusted
total capital necessary for us to meet the capital requirements and buffers set forth in the enterprise regulatory capital
framework, which we expect will occur before the capital reserve end date because our net worth is calculated
differently than, and is higher than, our available capital under the enterprise regulatory capital framework. See
“Business—Conservatorship and Treasury Agreements—Treasury Agreements—Senior Preferred Stock Purchase
Agreement and Senior Preferred Stock” for more information on the dividend provisions and aggregate liquidation
preference of the senior preferred stock.
Risk Factors | GSE and Conservatorship Risk | ||
Fannie Mae 2023 Form 10-K | 27 |
Exercise of the Treasury warrant would substantially dilute the investment of current stockholders. If Treasury exercises
its warrant to purchase shares of our common stock equal to 79.9% of the total number of shares of our common stock
outstanding on a fully diluted basis, the ownership interest in the company of our then-existing common stockholders
will be substantially diluted.
We are not managed for the benefit of stockholders. Because we are in conservatorship, we are not managed with a
strategy to maximize stockholder returns.
The senior preferred stock purchase agreement, senior preferred stock and warrant can only be waived or amended
with the consent of Treasury. For additional description of the conservatorship and our agreements with Treasury, see
“Business—Conservatorship and Treasury Agreements.”
The liquidity and market value of our MBS could be adversely affected by negative developments in the UMBS
market or from the loss of support from certain regulatory bodies for UMBS.
The success of UMBS is largely predicated on the fungibility of UMBS issued by Fannie Mae and Freddie Mac. If
investors stop viewing Fannie Mae-issued UMBS and Freddie Mac-issued UMBS as fungible, or if investors prefer
Freddie Mac-issued UMBS over Fannie Mae-issued UMBS, it could adversely affect the liquidity and market value of
Fannie Mae MBS, the volume of our UMBS issuances and our guaranty fee revenues. FHFA adopted a rule to align
Fannie Mae and Freddie Mac programs, policies and practices that affect the prepayment rates of TBA-eligible
mortgage-backed securities to support the fungibility of Fannie Mae-issued UMBS and Freddie Mac-issued UMBS.
However, these alignment efforts may not be successful over the long term and the prepayment rates on Fannie Mae-
issued UMBS and Freddie Mac-issued UMBS could diverge in a manner that is disadvantageous for us. Our
competitiveness in purchasing single-family loans from our lenders and the volume and profitability of our single-family
business activity are directly affected by the price performance of UMBS issued by us relative to comparable Freddie
Mac-issued UMBS. If our UMBS were to trade at a discount relative to comparable Freddie Mac-issued UMBS due to
prepayment performance or other factors, such a difference in relative pricing may create an incentive for lenders to
conduct more of their single-family business with Freddie Mac.
It is possible that a liquid market for our UMBS may not be sustained, which could adversely affect their price
performance and our single-family market share. A significant reduction in our market share, and thus in the volume of
loans that we securitize, or a reduction in the trading volume of our UMBS could reduce the liquidity of our UMBS. While
we may decide to employ various strategies to support the liquidity and price performance of our UMBS, any such
strategies may fail or adversely affect our business and financial results. We may cease any such activities at any time,
or FHFA could require us to do so, which could adversely affect the liquidity and price performance of our UMBS. We
may incur costs to support our acquisition of loans and to support the liquidity and price performance of our securities.
Liquidity-related price differences could occur between UMBS issued by us and comparable Freddie Mac-issued UMBS
due to factors that are largely outside of our control. Therefore, any strategies we employ to reduce any liquidity-related
price differences may not reduce or eliminate any such price differences over the long term.
We may experience price differences with Freddie Mac on individual new production pools of TBA-eligible mortgages,
particularly with respect to specified pools and our multi-lender securities. From time to time, we may need to adjust our
pricing for a particular new production pool category or introduce new initiatives to maintain alignment and
competitiveness with Freddie Mac with respect to the acquisition of such pools. Depending on the amount of pricing
adjustments in any period, it is possible that those adjustments could adversely affect our guaranty fee revenues for that
period.
The continued support of FHFA, Treasury, the Securities Industry and Financial Markets Association, and certain other
regulatory bodies is critical to the success of UMBS. If any of these entities were to cease its support, the liquidity and
market value of Fannie Mae-issued UMBS could be adversely affected. Furthermore, if either we or Freddie Mac exits
conservatorship, it is unclear whether our and Freddie Mac’s programs, policies and practices in support of UMBS and
resecuritizations of each other’s securities would be sustained.
Our issuance of UMBS and structured securities backed by Freddie Mac-issued securities exposes us to
significant operational and counterparty credit risk.
When we resecuritize Freddie Mac-issued UMBS or other Freddie Mac securities, our guaranty of principal and interest
extends to the underlying Freddie Mac security. Although we have an indemnification agreement with Freddie Mac, in
the event Freddie Mac were to fail (for credit or operational reasons) to make a payment due on its securities underlying
a Fannie Mae-issued structured security, we would be obligated under our guaranty to fund any shortfall and make the
entire payment on the related Fannie Mae-issued structured security on that payment date. A failure by Freddie Mac to
meet its obligations under the terms of its securities that back structured securities we issue could have a material
adverse effect on our earnings and financial condition, and we could be dependent on Freddie Mac and on the senior
preferred stock purchase agreements that we and Freddie Mac each have with Treasury to avoid a liquidity event or a
Risk Factors | GSE and Conservatorship Risk | ||
Fannie Mae 2023 Form 10-K | 28 |
default under our guaranty. Our current risk exposure to Freddie Mac-issued securities is provided in “MD&A—Guaranty
Book of Business.”
In addition, UMBS have created significant interdependence between the single-family mortgage securitization
programs of Fannie Mae and Freddie Mac. Accordingly, the market value and liquidity profile of single-family Fannie
Mae MBS could be affected by financial and operational incidents relating to Freddie Mac, even if those incidents do not
directly relate to Fannie Mae or Fannie Mae MBS. Similarly, any disruption in Freddie Mac’s securitization activities or
any adverse events affecting Freddie Mac’s significant mortgage lenders and servicers also could adversely affect the
market value of single-family Fannie Mae MBS.
Our reliance on CSS and the common securitization platform exposes us to significant third-party risk.
We rely on CSS and its common securitization platform for the operation of a majority of our single-family securitization
activities. Although we jointly own CSS with Freddie Mac, there are limitations on our ability to control CSS.
The CSS Board of Managers currently has seven members—two members designated by Fannie Mae, two members
designated by Freddie Mac, the CSS CEO, the Board Chair, who is appointed by FHFA, and an additional member
appointed by FHFA. Board actions must be approved by a majority vote and the Board may not take any actions absent
the Chair’s consent. While we and Freddie Mac both remain in conservatorship, FHFA has the right to designate up to
two additional board members at its discretion. Once either Fannie Mae or Freddie Mac has exited conservatorship and
is not in receivership, the Board Chair and any board members designated by FHFA may be removed by a unanimous
vote of the Fannie Mae and Freddie Mac members and the CSS CEO. Although the limited liability company agreement
would require our approval for certain “material decisions” if either we or Freddie Mac have exited conservatorship, the
Board may approve a number of actions even after conservatorship over the objection of the members we and Freddie
Mac designate, including: approval of the annual budget and strategic plan for CSS (so long as it does not involve a
material business change); withdrawal of capital by a member; and requiring capital contributions necessary to support
CSS’s ordinary business operations. It is possible that FHFA may require us to make additional changes to the CSS
limited liability company agreement, or may otherwise impose restrictions or provisions relating to CSS or UMBS, that
may adversely affect us.
We do not currently pay service fees to CSS under our customer services agreement; its operations are funded entirely
through capital contributions from Fannie Mae and Freddie Mac pursuant to the limited liability company agreement.
During conservatorship, FHFA can direct us to enter into an amendment of the customer services agreement, or enter
such an amendment on our behalf, that could provide for a fee structure that would survive an exit from conservatorship
absent a further amendment to the customer services agreement, which a majority of the Board would have to approve.
Although implementation of any fee changes could require a further amendment to the customer services agreement,
we might not have significant leverage to negotiate that amendment and the associated fee changes given our
dependence on CSS.
Our securitization activities are complex and present significant operational and technological challenges and risks. Any
measures we take to mitigate these challenges and risks might not be sufficient to prevent a disruption to our
securitization activities. Our business activities could be adversely affected and the market for single-family Fannie Mae
MBS could be disrupted if the common securitization platform were to fail or otherwise become unavailable to us or if
CSS were unable to perform its obligations to us. Any such failure or unavailability could have a significant adverse
impact on our business and could adversely affect the liquidity or market value of our single-family MBS. In addition, a
failure by CSS to maintain effective controls and procedures could result in material errors in our reported results or
disclosures that are not complete or accurate.
We are limited in our ability to diversify our business and undertake activities that management believes would
benefit our business.
As a federally chartered corporation, we are subject to the limitations imposed by the Charter Act, extensive regulation,
supervision and examination by FHFA, and regulation by other federal agencies, including Treasury, HUD and the SEC.
The Charter Act defines our permissible business activities. For example, we may not originate mortgage loans or
purchase single-family loans in excess of the conforming loan limits, and our business is limited to the U.S. housing
finance sector. FHFA, as our regulator, may impose and has imposed additional limitations on our business. For
example, the GSE Act requires us to obtain prior approval from FHFA for new products and to provide advance notice to
FHFA of new activities. As described in “Business—Legislation and Regulation—Guaranty Fees and Pricing,” we are
also subject to a number of limitations on the guaranty fees we are permitted to charge, which is our primary source of
revenue. In addition, as described in previous risk factors, our business activities are subject to significant restrictions as
a result of the conservatorship and the senior preferred stock purchase agreement, as well as under FHFA’s UMBS rule.
The limitations on our business have and are expected to continue to delay or prevent us from undertaking some new
business activities management believes would benefit our business. Further, as a result of the limitations on our ability
Risk Factors | GSE and Conservatorship Risk | ||
Fannie Mae 2023 Form 10-K | 29 |
to diversify our operations, our financial condition and results of operations depend almost entirely on conditions in a
single sector of the U.S. economy, specifically, the U.S. housing market. Weak or unstable conditions in the U.S.
housing market can therefore have a significant adverse effect on our business that we cannot mitigate through
diversification. For a discussion of current U.S. housing market conditions, see “MD&A—Key Market Economic
Indicators.”
An active trading market in our equity securities may cease to exist, which would adversely affect the market
price and liquidity of our common and preferred stock.
Our common stock and preferred stock are now traded exclusively in the over-the-counter market, and are not currently
listed on any securities exchanges. We cannot predict the actions of market makers, investors or other market
participants, and can offer no assurances that the market for our securities will be stable. If there is no active trading
market in our equity securities, the market price and liquidity of the securities will be adversely affected. In addition, the
market price of our common stock and preferred stock is subject to significant volatility, which may be due to other
factors described in these “Risk Factors,” as well as speculation regarding our future, economic and political conditions
generally, liquidity in the over-the-counter market in which our stock trades, and other factors, many of which are
beyond our control. Such factors could cause the market price of our common stock and preferred stock to decline
significantly from their current levels, which may result in significant losses to holders of our common stock and
preferred stock.
Credit Risk
We may incur significant provisions for credit losses and write-offs on the loans in our book of business.
We are exposed to a significant amount of mortgage credit risk on our $4.1 trillion guaranty book of business. Borrowers
may fail to make required payments on mortgage loans we own or guaranty. This exposes us to the risk of credit losses.
In general, significant home price or multifamily property value declines or increased loan delinquencies could materially
increase our provision for credit losses and our write-offs. Loan delinquencies, among other factors, are influenced by
income growth rates and unemployment levels, which affect borrowers’ ability to repay their mortgage loans. Changes in
home prices or multifamily property values affect the amount of equity that borrowers have in their properties. As home
prices and multifamily property values increase, the severity of losses we incur on defaulted loans that we hold or
guarantee decreases because the amount we can recover from the properties securing the loans increases.
Conversely, declines in home prices and multifamily property values increase the losses we incur on defaulted loans. If
home prices or multifamily property values decline rapidly and a large number of borrowers default on their loans, we
could experience significant credit losses on our book of business. We may ultimately experience greater losses than
we currently expect and may have high provisions for credit losses in future periods.
Changes in interest rates can also affect our credit losses, as we describe in a risk factor below in “Market and Industry
Risk.” Also see “MD&A—Multifamily Business—Multifamily Mortgage Credit Risk Management—Multifamily Guaranty
Book Diversification and Monitoring” for a discussion of factors that are negatively affecting the credit risk profile of our
multifamily seniors housing portfolio.
Given our expectation of slower economic and home price growth in 2024 and 2025, we expect the credit performance
of the loans in our guaranty book of business may decline compared to recent performance, which is reflected in our
allowance for credit losses as of December 31, 2023. If economic conditions, home price growth or multifamily property
values are worse than we currently expect, we could experience materially higher provisions for credit losses and write-
offs. See “MD&A—Key Market Economic Indicators” for a discussion of our expectations for economic growth and home
prices.
We present detailed information about the risk characteristics of our single-family conventional guaranty book of
business in “MD&A—Single-Family Business” and our multifamily guaranty book of business in “MD&A—Multifamily
Business.”
The credit enhancements we use provide only limited protection against potential future credit losses. These
transactions also increase our expenses.
While we use certain credit enhancements to mitigate some of our potential future credit losses, we may not be able to
obtain as much protection from our credit enhancements as we would like for a number of reasons, including:
•Some of the credit enhancements we use, such as mortgage insurance, Credit Insurance Risk TransferTM
(“CIRTTM”) transactions and DUS lender loss-sharing arrangements, are subject to the risk that the
counterparties may not meet their obligations to us, which we discuss in a risk factor below.
•Our Connecticut Avenue Securities® (“CAS”) and CIRT credit risk transfer transactions have limited terms, after
which they provide limited or no further credit protection on the covered loans.
Risk Factors | GSE and Conservatorship Risk | ||
Fannie Mae 2023 Form 10-K | 30 |
•Our credit risk transfer transactions are not designed to shield us from all losses because we retain a portion of
the risk of future losses on loans covered by these transactions, including all or a portion of the first loss
position in most transactions.
•In the event of a sufficiently severe economic downturn or other adverse market conditions, we may not be able
to enter into new back-end credit risk transfer transactions for our recent acquisitions on economically
advantageous terms.
•Mortgage insurance does not protect us from all losses on covered loans. For example, mortgage insurance
does not cover property damage that is not already covered by the hazard or flood insurance we require, and
such damage may result in a reduction to, or a denial of, mortgage insurance benefits. A property damaged by
a flood that was outside a Federal Emergency Management Agency (“FEMA”)-designated Special Flood
Hazard Area, coastal barrier resources system, or otherwise protected area (collectively, a “flooding zone”),
where we require coverage, or a property damaged by an earthquake, are the most likely scenarios where
property damage may result in a default not covered by hazard insurance.
In addition, the costs associated with credit risk transfer transactions are significant and may increase. Changes in
regulatory requirements, such as those under the enterprise regulatory capital framework, may cause us to modify our
credit risk transfer activities. In addition, changes in applicable bank capital or other regulatory treatment of our credit
risk transfer securities could negatively impact investor demand for our credit risk transfer transactions or dealer
demand to create markets in those securities.
We may suffer material losses if borrowers suffer property damage as a result of hazards for which the
borrowers have no or insufficient insurance.
In general, we require borrowers to obtain and maintain property insurance to cover the risk of damage to their homes
or properties resulting from hazards such as fire, wind and, for properties in a flooding zone. Insurance would not cover
property damage as a result of a hazard for which we do not generally require insurance, such as earthquake damage
or flood damage on a property located outside a flooding zone. Additionally, there may be instances in which borrowers’
claims under insurance policies are not paid, borrowers’ insurance is insufficient to cover their losses, borrowers fail to
use insurance proceeds to make improvements to the property commensurate with the value of the damaged
improvements, or borrowers fail to maintain insurance and suffer property damage. Hazard insurers may experience
significant financial strain and be unable to make payments on related claims during a period in which significant
numbers of mortgaged properties are damaged by natural or other disasters. To the extent that borrowers suffer
property damage as a result of a hazard that is uninsured or underinsured, the borrowers may not pay their mortgage
loans. As noted in a risk factor above, if borrowers fail to make required payments on mortgage loans we own or
guarantee, we could experience significant provisions for credit losses and write-offs on the loans in our book of
business.
Only a small portion of loans in our guaranty book of business as of December 31, 2023 were located in a Special Flood
Hazard Area, for which we require flood insurance: 3.2% of loans in our single-family guaranty book of business and
6.9% of loans in our multifamily guaranty book of business. We believe that only a small portion of borrowers in most
places outside of these areas obtain flood insurance. The risk of significant flooding in places outside of a flooding zone
(that is, in locations where we do not require flood insurance) is expected to increase in the coming years as a result of
climate change. Furthermore, FEMA flood insurance rate maps may not accurately reflect the extent of flood risks in
certain areas, and do not indicate how the risk will change in the future. Single-family borrowers who obtain flood
insurance generally rely on the National Flood Insurance Program (“NFIP”), which was recently extended through March
8, 2024. If Congress fails to extend or re-authorize the program upon future expirations, FEMA may not have sufficient
funds to pay claims for flood damage, and borrowers may not be able to renew their flood insurance coverage or obtain
new policies through the NFIP. In addition, NFIP insurance does not cover temporary living expenses, and the maximum
limit of coverage available under NFIP for a single-family residential property is $250,000, which may not be sufficient to
cover all losses.
Increases in the intensity or frequency of floods or other weather-related disasters as a result of climate change are
expected to increase the foregoing risks. In some areas, some insurers have ceased writing new coverage or have
significantly increased insurance premiums for certain perils. As coverage becomes unavailable or prohibitively
expensive in an area, home prices or multifamily property values may experience considerable negative impacts,
borrowers may face increasingly significant financial strain, and fewer loans in the area may be eligible for acquisition by
Fannie Mae. Ultimately, the desirability of areas that frequently experience hurricanes, wildfires, or other natural
disasters and face chronic physical risks may diminish over time, which can depress home prices and multifamily
property values or adversely affect the region’s economy, which may negatively impact our financial results. In addition,
investors may place greater weight on climate-related risks when making investment decisions, which could increase
our cost or ability to transfer credit risk.
Risk Factors | Credit Risk | ||
Fannie Mae 2023 Form 10-K | 31 |
The occurrence of major natural or other disasters in the United States or its territories could materially
increase our provision for credit losses and our write-offs.
We conduct our business in the single-family and multifamily residential mortgage markets and own or guarantee the
performance of mortgage loans throughout the United States and its territories. The occurrence of a major natural or
environmental disaster, terrorist attack, cyber attack, pandemic, or similar event (a “major disruptive event”) in the
United States or its territories could negatively impact our provision for credit losses and our write-offs on loans in the
affected geographic area or, depending on the magnitude, scope and nature of the event, nationally, in a number of
ways.
A major disruptive event that either damages or destroys single-family or multifamily real estate securing mortgage
loans in our book of business or negatively impacts the ability of borrowers to make principal and interest payments on
mortgage loans in our book of business could increase our delinquency rates, default rates and average loan loss
severity of our book of business in the affected region or regions. Further, a major disruptive event or a long-lasting
increase in the vulnerability of an area to disasters that affects borrowers’ ability to make payments on their mortgages,
discourages housing activity, including homebuilding or home buying, or causes a deterioration in housing conditions or
the general economy in the affected region could lower the volume of originations in the mortgage market, influence
home prices and multifamily property values in the affected region or in adjacent regions and increase delinquency rates
and default rates. Any of these outcomes could generate significant provisions for credit losses and write-offs.
Our business, financial condition and results of operations could be materially adversely affected by impacts
related to climate change.
Climate change presents both immediate and long-term risks to our business, financial condition and results of
operations. We face physical risks relating to event-driven (acute) disasters and longer-term (chronic) shifts in climate
patterns. We also face risks resulting from a potential transition to a lower-carbon economy.
Recent years have seen frequent and severe natural disasters in the U.S., including wildfires, hurricanes, tornadoes,
high winds, severe flooding, mudslides, and environmental contamination. We believe the frequency and intensity of
major weather-related events in recent years are indicative of the impacts of climate change, which are expected to
persist and worsen in the future. Population growth and an increase in people living in high-risk areas, such as coastal
areas vulnerable to severe storms and flooding, have also increased the impact of these events.
Although our financial exposure from these events is mitigated to the extent our book of business is geographically
diverse, we remain exposed to risk, particularly in connection with the risk of geographically widespread weather events
and changes in weather patterns, as well as geographic areas where our book of business is more heavily
concentrated. For a description of the geographic concentration of our single-family guaranty book of business, see
“MD&A—Single-Family Business—Single-Family Mortgage Credit Risk Management—Single-Family Guaranty Book
Diversification and Monitoring,” and for our multifamily guaranty book of business, see “MD&A—Multifamily Business—
Multifamily Mortgage Credit Risk Management—Multifamily Guaranty Book Diversification and Monitoring.” As a result,
any continuation or increase in recent weather trends or their unpredictability, or any single natural disaster of significant
scope or intensity, could have a material impact on our results of operations and financial condition.
In addition to the impact of natural disasters, longer-term shifts in climate patterns could result in chronic risks such as
sustained higher temperatures, sea level rise, water scarcity and increased wildfires that negatively affect certain
regions, which could negatively affect home prices and multifamily property values in those regions, as well as the
ability of borrowers in those regions to pay their mortgage loans.
Further, legal or regulatory responses to concerns about global climate change may impact the housing markets and, as
a result, our business. Steps to address the risks of climate change could result in a potentially disruptive transition
away from carbon-intense industries. Such a transition could negatively impact certain industries and regional
economies, affecting the ability of borrowers in those industries or regions to pay their mortgage loans. Transition risks
also could include:
•a change in borrower and renter preferences for certain areas of the country or certain types of housing;
•migration of communities and individuals resulting in changes in home prices and multifamily property values in
affected regions or an increase in lower income households living in high-risk areas;
•increased housing costs driven by additional regulatory and legislative requirements; and
•increased compliance and construction costs driven by governmental actions and initiatives, such as the
introduction of new building codes, carbon taxes or energy efficiency requirements.
The timing and severity of climate change events or societal changes in reaction to them are difficult to predict. Our
business and reputation may be harmed if our response to climate change is perceived to be ineffective or insufficient.
While we are taking steps to integrate climate risk considerations into our Enterprise Risk Management framework, our
Risk Factors | Credit Risk | ||
Fannie Mae 2023 Form 10-K | 32 |
risk management strategies may not be effective in mitigating our climate risk exposure. As regulators begin to mandate
additional disclosure of climate-related information by companies, there may continue to be a lack of information needed
for robust climate-related risk analyses. Third-party exposures to climate-related risks and other data generally are
limited in availability and vary in quality. Modeling capabilities to analyze climate-related risks and interconnections are
improving but remain incomplete. We believe these limitations will affect our ability to identify and manage climate-
related risks. For a discussion on climate and natural disaster risk management, see “MD&A—Risk Management—
Climate and Natural Disaster Risk Management.”
One or more of our institutional counterparties may fail to fulfill their contractual obligations to us, resulting in
financial losses, business disruption and decreased ability to manage risk.
We rely on our institutional counterparties to provide services and credit enhancements that are critical to our business.
We face the risk that one or more of our institutional counterparties may fail to fulfill their contractual obligations to us. If
an institutional counterparty defaults on its obligations to us, it could also negatively impact our ability to operate our
business, as we outsource some of our critical functions to third parties, such as mortgage servicing, single-family
Fannie Mae MBS issuance and administration, and certain technology functions.
Our primary exposures to institutional counterparties are with:
•credit guarantors that provide credit enhancements on the mortgage assets in our guaranty book of business,
including mortgage insurers, reinsurers, and multifamily lenders with risk-sharing arrangements;
•mortgage lenders that sell loans to us and mortgage lenders and other counterparties that service our loans;
and
•the financial institutions that issue the investments held in our corporate liquidity portfolio.
We also have counterparty exposure to: derivatives counterparties; custodial depository institutions; mortgage
originators, investors and dealers; debt security dealers; central counterparty clearing institutions; and document
custodians.
The concentration of our counterparties in similar or related businesses heightens our counterparty risk exposure. We
routinely enter into a high volume of transactions with counterparties in the financial services industry, including brokers
and dealers, mortgage lenders and commercial banks, and mortgage insurers, resulting in a significant credit
concentration with respect to this industry. We may also have multiple exposures to particular counterparties, as many
of our counterparties perform several types of services for us. For example, our lenders or their affiliates may also act
as derivatives counterparties, mortgage servicers, custodial depository institutions or document custodians. Accordingly,
if one of these counterparties were to become insolvent or otherwise default on its obligations to us, it could harm our
business and financial results in a variety of ways.
An institutional counterparty may default on its obligations to us for a number of reasons, such as changes in financial
condition that affect its credit rating, changes in its servicer rating, a reduction in liquidity, operational failures, a
cybersecurity incident, or insolvency. In the event of a bankruptcy or receivership of one of our counterparties, we may
be required to establish our ownership rights to the assets these counterparties hold on our behalf to the satisfaction of
the bankruptcy court or receiver, which could result in a delay in accessing these assets causing a decline in their value.
Counterparty defaults or limitations on their ability to do business with us could result in significant financial losses or
hamper our ability to do business or manage the risks to our business. In addition, if we are unable to replace a
defaulting counterparty that performs services critical to our business, it could adversely affect our ability to conduct our
operations and manage risk. Recent lower mortgage origination volume has negatively affected the financial results and
condition of some of our institutional counterparties, particularly non-depository mortgage lenders and servicers, which
could negatively affect their ability to perform their obligations to us.
We have significant exposure to institutions in the financial services industry relating to derivatives, funding, short-term
lending, securities, and other transactions. We depend on our ability to enter into derivatives transactions with our
derivatives counterparties in order to manage the duration and prepayment risk of our retained mortgage portfolio. If we
lose access to our derivatives counterparties, it could adversely affect our ability to manage these risks.
We use clearinghouses to facilitate many of our derivative trades. If the clearinghouse or the clearing member we use to
access the clearinghouse defaults, we could lose margin that we have posted with the clearing member or
clearinghouse. We are also a clearing member of two divisions of Fixed Income Clearing Corporation (“FICC”), a central
counterparty (“CCP”). One FICC division clears our trades involving securities purchased under agreements to resell,
securities sold under agreements to repurchase, and other non-mortgage related securities. The other division clears
our forward purchase and sale commitments of mortgage-related securities, including dollar roll transactions. As a
clearing member of FICC, we are exposed to the risk of losses if the CCP or one or more of the CCP’s clearing
members fails to perform its obligations, because each FICC clearing member is required to absorb a portion of the
losses incurred by other clearing members if they fail to meet their obligations to the clearinghouse. We could also incur
Risk Factors | Credit Risk | ||
Fannie Mae 2023 Form 10-K | 33 |
losses associated with replacing transactions cleared through FICC in the event of a default by, or the financial or
operational failure of, FICC. For more information, see “MD&A—Risk Management—Institutional Counterparty Credit
Risk Management—Other Counterparties—Central Counterparty Clearing Institutions.”
Our financial condition or results of operations may be materially adversely affected if mortgage servicers fail
to perform their obligations to us.
We delegate the servicing of the mortgage loans in our guaranty book of business to mortgage servicers; we do not
have our own servicing function. Functions performed by mortgage servicers on our behalf include collecting and
delivering principal and interest payments, administering escrow accounts, monitoring and reporting delinquencies,
performing default prevention activities and other functions. A servicer’s inability or other failure to perform these
functions or to follow our requirements could negatively impact our ability to, among other things:
•manage our book of business;
•collect amounts due to us;
•actively manage troubled loans; and
•implement our homeownership assistance, foreclosure prevention and other loss mitigation efforts.
A decline in a servicer’s performance, such as delayed or missed opportunities for loan workouts, foreclosure
alternatives or foreclosures, could significantly affect our ability to mitigate credit losses and could materially adversely
affect the overall credit performance of the loans in our guaranty book of business. Servicers may experience financial
and other difficulties due to the advances they are required to make on our behalf on delinquent mortgages, including
mortgages subject to forbearance plans. We could be materially adversely affected if our servicers lack appropriate
controls, experience a failure in their controls, or experience a disruption in their ability to service loans, including as a
result of legal or regulatory actions, ratings downgrades, liquidity constraints, operational failures or cybersecurity
incidents. We have experienced losses as a result of servicers’ failure to perform their obligations.
As of December 31, 2023, over half of our single-family guaranty book was serviced by non-depository servicers and we
expect this concentration will increase further. Non-depository servicers also serviced over half of our multifamily
guaranty book as of December 31, 2023. The generally lower financial strength and liquidity of non-depository mortgage
servicers compared with depository mortgage servicers may negatively affect their ability to fully satisfy their financial
obligations or to properly service the loans on our behalf. Non-depository servicers also are generally not subject to the
same level of regulatory oversight as our mortgage servicer counterparties that are depository institutions.
Replacing a mortgage servicer can result in potentially significant increases in our costs, as well as increased
operational risks. If a mortgage servicer fails, it could result in a temporary disruption in servicing and loss mitigation
activities relating to the loans serviced by that mortgage servicer, particularly if there is a loss of experienced servicing
personnel. We may also face challenges in transferring a large servicing portfolio. Although we have contingency plans
in the event of a failure of one or more of our top mortgage servicers, there can be no assurance that we will be able to
successfully execute against those plans in times of severe economic stress in the mortgage servicing industry.
Multifamily mortgage servicing is typically performed by the lenders who sell the mortgages to us, including non-
depository servicers. We are exposed to the risk that multifamily servicers could come under financial pressure, which
could potentially result in a decline in the quality of the servicing they provide us or a default by the servicer. A decline in
servicing quality or a default by a multifamily servicer could increase our losses on multifamily loans.
The actions we have taken to mitigate our credit risk exposure to mortgage servicers may not be sufficient to prevent us
from experiencing significant financial losses or business interruptions in the event they cannot fulfill their obligations to
us.
We may incur losses as a result of claims under our mortgage insurance policies not being paid in full or at all.
We rely heavily on mortgage insurers to provide insurance against borrower defaults on single-family conventional
mortgage loans with LTV ratios over 80% at the time of acquisition. Although our primary mortgage insurer
counterparties currently approved to write new business must meet risk-based asset requirements, there is still a risk
that these counterparties may fail to fulfill their obligations to pay our claims under insurance policies. If a currently
approved mortgage insurer fails to meet its obligations to reimburse us for claims, our credit losses could increase. In
addition, if a regulator determines that a currently approved mortgage insurer lacks sufficient capital to pay all claims
when due, the regulator could take action that might affect the timing and amount of claim payments made to us by our
approved mortgage insurer counterparties. We face similar risks with respect to our credit insurance risk transfer
counterparties.
With respect to primary mortgage insurers that we have approved to write coverage on loans sold to us, we currently do
not differentiate pricing based on counterparty strength or operational performance. Additionally, we would not revoke a
Risk Factors | Credit Risk | ||
Fannie Mae 2023 Form 10-K | 34 |
primary mortgage insurer’s status as an eligible insurer unless there was a material violation of our private mortgage
insurer eligibility requirements. Further, we do not generally select the provider of primary mortgage insurance on a
specific loan, because the selection is usually made by the lender at the time the loan is originated. Accordingly, we
have limited ability to manage our concentration risk with respect to primary mortgage insurers.
On at least a quarterly basis, we assess our mortgage insurer counterparties’ respective abilities to fulfill their
obligations to us, and our loss reserves take into account this assessment. If our assessment indicates their ability to
pay claims has deteriorated significantly or if our projected claim amounts have increased, we could experience a
material increase in our provision for credit losses and write-offs.
Mortgage fraud could result in significant financial losses and harm to our reputation.
We use a process of delegated underwriting in which lenders make specific representations and warranties about the
characteristics of the mortgage loans we purchase and securitize. As a result, we do not independently verify most
borrower information that is provided to us. This exposes us to the risk that one or more of the parties involved in a
transaction (the borrower, seller, broker, appraiser, property inspector, title agent, lender or servicer) will engage in fraud
by misrepresenting facts about a mortgage loan. Similarly, we rely on delegated servicing of loans and use of a variety
of external resources to manage our REO inventory. We have experienced financial losses resulting from mortgage
fraud, including institutional fraud perpetrated by counterparties. In the future, we may experience additional financial
losses or reputational damage as a result of mortgage fraud.
Operational and Model Risk
A failure in our operational systems or infrastructure, or those of third parties, could materially adversely affect
our business, impair our liquidity, cause financial losses and harm our reputation.
Shortcomings or failures in our internal processes, people, or systems, or external events, could disrupt our business or
have a material adverse effect on our risk management, liquidity, financial statement reliability, financial condition and
results of operations. Such a failure could result in legislative or regulatory intervention or sanctions, liability to
counterparties, financial losses, business disruptions and damage to our reputation. For example, our business is highly
dependent on our ability to manage and process, on a daily basis, an extremely large number of transactions, many of
which are highly complex, across numerous and diverse markets that continuously and rapidly change and evolve.
These transactions are subject to various legal, accounting and regulatory standards. Our financial, accounting, data
processing or other operating systems and facilities may fail to operate properly or become disabled or damaged as a
result of a number of factors, including events that are wholly or partially beyond our control, adversely affecting our
ability to process these transactions or manage associated data with reliability and integrity. In addition, we rely on
information provided by third parties in processing many of our transactions; that information may be incorrect or we
may fail to properly manage or analyze it or properly monitor its data quality.
We rely upon business processes that are highly dependent on people, technology, data and the use of numerous
complex systems and models to manage our business and produce information upon which our financial statements
and risk reporting are prepared. This reliance increases the risk that we may be exposed to financial, reputational or
other losses as a result of inadequately designed internal processes or data management architecture, inflexible
technology or the failure of our systems. In addition, our use of third-party service providers for some of our business
and technology functions increases the risk that an operational failure by a third party will adversely affect us. For
example, we use third-party service providers for cloud infrastructure services. We have experienced interruptions in
access to our platforms as a result of connectivity issues with third-party cloud-based platforms and related data centers
and could experience disruptions again if there is a lapse of service, interruption of internet service provider connectivity
or damage to third-party cloud-based platforms or any related data centers. The risk of these disruptions is exacerbated
by key fourth-party relationships, in which some of our third-party service providers have engaged subcontractors to
provide key services and our ability to assess the fourth party’s operational controls is limited.
While we continue to enhance our technology, infrastructure, operational controls and organizational structure in order
to reduce our operational risk, these actions may not be effective to manage these risks. Moreover, some of our
initiatives designed to reduce our operational risk over the long term, particularly those relating to the implementation of
new technology and the transition to third-party cloud-based platforms, increase our operational risk over the short term
as we implement the changes, as many involve significant changes to our business processes, controls, systems and
infrastructure. If we fail to implement these initiatives in a well-managed, secure and effective manner, we may
experience significant unplanned service disruptions or unforeseen costs, which could result in material harm to our
business and results of operations.
Our ability to manage and aggregate data may be limited by the effectiveness of our policies, programs, processes,
systems and practices that govern how data is acquired, validated, stored, protected, processed and shared. Failure to
manage data effectively and to aggregate data in an accurate and timely manner may limit our ability to manage current
Risk Factors | Credit Risk | ||
Fannie Mae 2023 Form 10-K | 35 |
and emerging risks, as well as to manage changing business needs. The increasing use of new third-party and open
source artificial intelligence tools poses additional risks relating to the protection of data, including the potential
exposure of our proprietary confidential information to unauthorized recipients and the misuse of our intellectual
property.
We use artificial intelligence and machine learning technology to help manage some of the operational risks we face,
including with respect to business resiliency. Our use of this technology presents risks, including the potential for
outages, inefficiencies, data loss, and bias or errors in the technology’s analysis and conclusions while the technology
and our use of the technology matures. Additionally, the use of artificial intelligence within products or services that we
use or that are used by our third-party service providers may pose similar risks.
We also face the risk of operational failure, termination or capacity constraints of any of the clearing agents, paying
agents, exchanges, clearinghouses or other financial intermediaries, including the Federal Reserve, we use to facilitate
our securities and derivatives transactions. Moreover, the consolidation and interconnectivity among clearing agents,
exchanges and clearing houses increases the risk of operational failure, on both an individual basis and an industry-
wide basis. Any such failure, termination or constraint could adversely affect our ability to effect transactions or manage
our exposure to risk.
Most of our employees and business operations functions are consolidated in two metropolitan areas: Washington, DC
and Dallas, Texas. While we have reduced the risk posed by this concentration of our employees and facilities in recent
years through our business continuity strategies and our transition to a hybrid work environment, a major disruptive
event at either location could impact our ability to operate. Moreover, because of the concentration of our employees in
the Washington, DC and Dallas metropolitan areas, a regional disruption, particularly a disruption with a sustained
impact, in one of these areas could prevent our employees from accessing our facilities, working remotely, or
communicating with or traveling to other locations. Accordingly, the occurrence of one or more major disruptive events
could materially adversely affect our ability to conduct our business and lead to financial losses.
A breach of the security of our systems, or those of third parties with which we do business, including as a
result of cyber attacks, could materially damage or disrupt our business or result in the disclosure or misuse of
confidential or other information (including personal information) that could materially damage our reputation,
result in material regulatory sanctions and/or result in increased costs or losses that have a material adverse
impact on our business, financial results and financial condition.
Our operations rely on the secure, accurate and timely receipt, storage, transmission and other processing of
confidential and other information in our computer systems and networks and with our business partners, including
proprietary, confidential or personal information that is subject to privacy laws, regulations or contractual obligations.
Information security risks for large institutions like us have continued to significantly increase, in part because of the
proliferation of new technologies and the use of the Internet, telecommunications and cloud technologies to conduct or
automate financial transactions, and the increased sophistication and activities of organized crime, hackers, terrorists,
and other external parties, including foreign state-sponsored threat actors. A number of financial services companies,
consumer-based companies and other organizations have reported the unauthorized disclosure of client, customer or
other confidential information (including personal information), as well as cyber incidents involving the dissemination,
theft and destruction of corporate information, intellectual property, cash or other valuable assets. There have also been
several highly publicized cyber attacks where threat actors have requested “ransom” payments in exchange for not
disclosing stolen customer information (including personal information) or for unlocking or not disabling the target
company’s computer or other systems. In addition, there have been cyber attacks against companies where threat
actors have misled company personnel into granting unauthorized access or making unauthorized transfers of funds to
the actors’ accounts.
We have been, and expect to continue to be, the target of cyber attacks, computer viruses, malicious code,
ransomware, social engineering attacks, including phishing attacks, denial of service attacks and other information
security threats. We could also be materially adversely affected by cyber attacks or other information security incidents
that target the infrastructure of the Internet and critical service providers, as such incidents could cause widespread
unavailability of websites and applications, and degrade website and application performance. To date, cyber attacks
have not had a material impact on our business strategy, business, financial results or financial condition. However, we
could suffer material financial or other losses, as well as material reputational damage, as a result of cyber attacks.
These attacks are constantly evolving and their impacts are hard to predict. Our risk and exposure to cyber attacks
remains heightened because of, among other things:
•the evolving nature and increasing frequency of these threats, including the emergence of powerful artificial
intelligence technologies to assist threat actors in cyber attacks;
•the levels of persistence, sophistication and intensity of cybersecurity threats;
Risk Factors | Operational and Model Risk | ||
Fannie Mae 2023 Form 10-K | 36 |
•our prominent size and scale and our role in the financial services industry;
•the outsourcing of some of our business operations;
•a shortage of qualified cybersecurity professionals in the industry;
•our migration to cloud-based systems;
•our use of employee-owned devices for business communication;
•the interconnectivity and interdependence of third parties to our systems; and
•the current global economic and political environment.
Despite our efforts to ensure the integrity of our software, computers, systems and information, we may not be able to
anticipate, detect or recognize cybersecurity threats to our systems and assets, or to implement effective preventive
measures against all cybersecurity threats, especially because the techniques used in cyber attacks are increasingly
sophisticated, change frequently, are complex, and are often not recognized until launched. In addition, large-scale and
more frequent cyber attacks in recent years, as well as increases in the number of threat actors, suggest that the risk of
damaging cyber attacks impacting us and/or third parties with which we do business is increasing. We expect cyber
attack and breach incidents to continue.
We routinely identify cybersecurity threats as well as vulnerabilities in our systems and work to address or mitigate
those we have identified. Some cybersecurity vulnerabilities take a substantial amount of time to resolve or mitigate. We
continue to have cybersecurity vulnerabilities that we have identified but not resolved or mitigated. In addition, efforts to
resolve or mitigate some of our cybersecurity vulnerabilities may be unsuccessful and some cybersecurity vulnerabilities
may not be possible to resolve. Further, these efforts have involved and may continue to involve significant costs, as
cyber attack methods continue to rapidly evolve. We may also have cybersecurity vulnerabilities that we have not yet
identified.
Cyber attacks can originate from a variety of sources, including external parties who are affiliated with foreign
governments or are involved with organized crime or terrorist organizations. Cybersecurity risks also derive from human
error, fraud or malice on the part of our employees or third parties. Threat actors have attempted, and we expect will
continue to attempt, to induce employees, lenders, servicers, vendors, service providers, counterparties or other users
of our systems to disclose sensitive information or provide access to our systems or network, or to our data or that of
our counterparties or borrowers, and these types of risks are sometimes difficult to detect or prevent.
Cyber attacks, breaches, unauthorized access, misuse, computer viruses or other malicious code or other cybersecurity
events from time to time could result in the unauthorized disclosure, gathering, monitoring, misuse, corruption, loss or
destruction of confidential and other information (including personal information) that belongs to us, our lenders, our
servicers, our counterparties, third-party service providers or borrowers that is processed and stored in, and transmitted
through, our computer systems and networks. These events could also result in damage to our software, computers or
systems, or otherwise cause interruptions or malfunctions in our, our lenders’, our counterparties’ or third parties’
operations. We have experienced some of these types of cybersecurity events and some of these events have resulted
in disruptions to our systems and those of our lenders, counterparties and other third parties. While to date the impact of
these events has not been material to our business strategy, business, financial results or financial condition, cyber-
related events could result in financial losses, loss of lenders, servicers and business opportunities, reputational
damage, damage to our competitive position, litigation, regulatory fines, penalties or intervention, reimbursement or
other compensatory costs or other harms that have a material adverse impact on our business strategy, business,
financial results or financial condition.
Cyber attacks or other cybersecurity incidents can occur and persist for an extended period of time without detection.
Investigations of cyber attacks and incidents are inherently unpredictable, and it takes time to complete an investigation
and have full and reliable information. While we are investigating a cyber attack or incident, we do not necessarily know
the extent of the harm or how best to remediate it, and we can repeat or compound certain errors or actions before we
discover and remediate them. In addition, announcing that a cyber attack or cybersecurity incident has occurred
increases the risk of additional cyber attacks. All or any of these challenges could further increase the costs and
consequences of a cyber attack or incident. These factors may also inhibit our ability to provide rapid, complete and
reliable information about a cyber attack or incident to our lenders, servicers, counterparties, investors and regulators,
as well as the public.
In addition, we may be required to expend significant additional resources to modify our protective measures and to
investigate and remediate vulnerabilities or other exposures arising from operational and security risks. Although we
maintain insurance coverage relating to cybersecurity risks, our insurance may not be sufficient to provide adequate
loss coverage in all circumstances (including if the insurer denies future claims) and may not continue to be available to
us on economically reasonable terms, or at all. Further, we cannot ensure that any limitations of liability provisions in our
Risk Factors | Operational and Model Risk | ||
Fannie Mae 2023 Form 10-K | 37 |
agreements with lenders, servicers, service providers, vendors, counterparties and other third parties with which we do
business would be enforceable or adequate or would otherwise protect us from liabilities or damages with respect to a
particular claim in connection with a cyber attack or other cybersecurity incident.
Third parties with which we do business and our regulators are also sources of cybersecurity or other technological
risks. Because we are interconnected with and dependent on third-party vendors, exchanges, clearing houses, fiscal
and paying agents, and other financial intermediaries, including CSS, we could be materially adversely impacted if any
of them is subject to a successful cyber attack or other information security event. Third parties with which we do
business have experienced cybersecurity incidents. While these third-party cybersecurity incidents have not had a
material impact on our business to date, the inability of a third party with which we do business to meet its obligations to
us as a result of a cybersecurity incident or our response to such an incident could materially adversely affect our
business.
We outsource certain functions and these relationships allow for the external storage and processing of our information,
as well as lender, servicer, counterparty and borrower information, including on cloud-based systems. We also share
this type of information with regulatory agencies and their vendors. While we engage in actions to mitigate our exposure
resulting from our information-sharing activities, ongoing threats may result in unauthorized access, loss or destruction
of data or other cybersecurity incidents that could materially adversely affect our business and result in legal liabilities,
fines, regulatory action and reputational harm that have a material adverse impact on our business, financial results and
financial condition.
We routinely transmit and receive personal, confidential and proprietary information by electronic means. In addition,
our lenders and servicers maintain personal, confidential and proprietary information, including personal borrower
information. This information is subject to interception, misuse or mishandling. While we work with our lenders,
servicers, vendors, service providers, counterparties and other third parties to protect against cyber attacks, we cannot
ensure that these third parties have appropriate controls in place to protect the confidentiality of the information. An
interception, misuse or mishandling of personal, confidential or proprietary information being sent to, received from, or
maintained by a lender, servicer, vendor, service provider, counterparty or other third party could result in legal liability,
fines, regulatory action and reputational harm that have a material adverse impact on our business, financial results or
financial condition. From time to time, we and our lenders and servicers have experienced data breaches or other
cybersecurity incidents relating to our borrower information. While such breaches and incidents have not been material
to our business to date, they could result in legal liabilities, fines, regulatory action and reputational harm that have a
material adverse impact on our business, financial results and financial condition.
The legal and regulatory environment related to data privacy and cybersecurity is constantly changing. Privacy and
cybersecurity are currently areas of considerable legislative and regulatory attention, with new or modified laws,
regulations, rules and standards being frequently adopted and potentially subject to divergent interpretation or
application in different jurisdictions in a manner that may create inconsistent or conflicting requirements for businesses.
The uncertainty and compliance risks created by these legislative and regulatory developments are compounded by the
rapid pace of technology development, such as artificial intelligence and advances in data science, that affect the use or
security of data, including personal information. Privacy and cybersecurity laws and regulations often impose strict
requirements on the collection, storage, handling, use, disclosure, transfer, security, and other processing of personal
information. These laws and regulations, combined with our evolving data footprint, are expected to increase our
compliance costs and require changes to our business and operations. An actual or perceived failure by us, lenders,
servicers, vendors, service providers, counterparties or other third parties to comply with privacy, data protection and
information security laws, regulations, standards, policies and contractual obligations could result in legal liabilities,
fines, regulatory action and reputational harm that have a material adverse impact on our business, financial results and
financial condition.
Material weaknesses in our internal control over financial reporting could result in errors in our reported
results or disclosures that are not complete or accurate.
Management has determined that, as of the date of this filing, we have ineffective disclosure controls and procedures
that result in a material weakness in our internal control over financial reporting. In addition, our independent registered
public accounting firm, Deloitte & Touche LLP, has expressed an adverse opinion on our internal control over financial
reporting because of the material weakness. Our ineffective disclosure controls and procedures and material weakness
could result in errors in our reported results or disclosures that are not complete or accurate, which could have a
material adverse effect on our business and operations.
Our material weakness relates specifically to the impact of the conservatorship on our disclosure controls and
procedures. Because we are under the control of FHFA, some of the information that we may need to meet our
disclosure obligations may be solely within the knowledge of FHFA. As our conservator, FHFA has the power to take
actions without our knowledge that could be material to our stockholders and other stakeholders, and could significantly
Risk Factors | Operational and Model Risk | ||
Fannie Mae 2023 Form 10-K | 38 |
affect our financial performance or our continued existence as an ongoing business. Because FHFA currently functions
as both our regulator and our conservator, there are inherent structural limitations on our ability to design, implement,
operate and test effective disclosure controls and procedures relating to information known to FHFA. As a result, we
have not been able to update our disclosure controls and procedures in a manner that adequately ensures the
accumulation and communication to management of information known to FHFA that is needed to meet our disclosure
obligations under the federal securities laws, including disclosures affecting our financial statements. Given the
structural nature of this material weakness, we do not expect to remediate this weakness while we are under
conservatorship. See “Controls and Procedures” for further discussion of management’s conclusions on our disclosure
controls and procedures and internal control over financial reporting.
Failure of our models to produce reliable results may materially adversely affect our ability to manage risk and
make effective business decisions, as well as create regulatory and reputational risk.
We make significant use of quantitative models to measure and monitor our risk exposures and to manage our
business. For example, we use models to measure and monitor our exposures to interest rate, credit and market risks,
and to forecast credit losses. We use this information in making business decisions relating to strategies, initiatives,
transactions, pricing and products.
Models are inherently imperfect predictors of actual results because they are based on historical data and assumptions
regarding factors such as future loan demand, borrower behavior, creditworthiness and home price trends. Other
potential sources of inaccurate or inappropriate model results include errors in computer code, inaccurate or incomplete
data, misuse of data, or use of a model for a purpose outside the scope of the model’s design. Modeling often assumes
that historical data or experience can be relied upon as a basis for forecasting future events, an assumption that may be
especially tenuous in the face of unprecedented events, such as the COVID-19 pandemic and long-term climate
change.
Given the challenges of predicting future behavior, management judgment is used throughout the modeling process,
from model design decisions regarding core underlying assumptions, to interpreting and applying final model output.
When market conditions change quickly and in unforeseen ways, there is an increased risk that the model assumptions
and data inputs for our models are not representative of the most recent market conditions, which requires management
to apply its judgment to make adjustments or overrides to our models. In a rapidly changing environment, it may not be
possible to update existing models quickly enough to properly account for the most recently available data and events.
In addition, in periods of low transaction volume for certain types of assets, the limited data available may reduce the
reliability of model outputs.
We also use third-party models that expose us to additional risks beyond those for internally-developed models. We
often have limited visibility into the third-party’s model methodology and change management process. In addition, in
some instances we rely on third-party data providers to develop and provide estimates for our models. This reliance on
third-party data providers exposes us to risk should the data provider cease to provide the data going forward or change
its methodology, which would require that we find a suitable replacement for the data and could result in the need to re-
estimate our models with the new data.
We currently use artificial intelligence and machine learning techniques in our models, and expect to increase our use of
these modeling techniques. The use of new artificial intelligence and machine learning technology in our models
presents risks, such as the risk of undetected bias in the model and the limited ability to understand and challenge the
model due to a limited ability to observe the internal workings of many machine learning models.
To the extent our internal models or the third-party models that we use fail to produce reliable results on an ongoing
basis, we may not make appropriate business and risk management decisions, including decisions affecting loan
purchases, guaranty fee pricing, management of credit losses, and asset and liability management. While we employ
strategies to manage and govern the risks associated with our use of models, they have not always been fully effective.
Errors have been discovered in some of the models we use, as well as deficiencies in our current processes for
managing model risk. And we have experienced instances where model failures have adversely affected our business
and risk management decisions. As noted in “MD&A—Risk Management—Model Risk Management,” we are currently
working on a number of remediation activities relating to our models, including improving our processes for model
governance, development, implementation and testing. Until these remediation activities are completed, we face a
higher risk that we may make inappropriate business or risk management decisions based on unreliable model results,
which could negatively affect our financial results and condition.
Errors in our models can also result in errors in our external disclosures. We discovered errors in a model used to
prepare our annual stress test results that affected our previously-reported stress test results for 2022 and some prior
years. While we have resolved those errors, we could discover additional errors in our models in the future that result in
further errors in our external disclosures that create regulatory and reputational risk.
Risk Factors | Operational and Model Risk | ||
Fannie Mae 2023 Form 10-K | 39 |
Also see a risk factor below in “General Risk” for a discussion of the risks associated with the use of models in our
accounting methods.
Liquidity and Funding Risk
Limitations on our ability to access the debt capital markets could have a material adverse effect on our ability
to fund our operations, and our liquidity contingency plans may be difficult or impossible to execute during a
sustained liquidity crisis.
Our ability to fund our business depends in part on our ongoing access to the debt capital markets. Market concerns
about matters such as the extent of government support for our business and debt securities, the future of our business
(including future profitability, future structure, regulatory actions and our status as a government-sponsored enterprise)
and the creditworthiness of the U.S. government could cause a severe negative effect on our access to the unsecured
debt markets, particularly for long-term debt. We believe that our ability in recent years to issue debt of varying
maturities at attractive pricing resulted from federal government support of our business. As a result, we believe that our
status as a government-sponsored enterprise and continued federal government support are essential to maintaining
our access to debt funding. Changes or perceived changes in federal government support of our business, our debt
securities or our status as a government-sponsored enterprise could materially and adversely affect our ability to fund
our business. There can be no assurance that the government will continue to support our business or our debt
securities, or that our current level of access to debt funding will continue. If our senior preferred stock purchase
agreement with Treasury is amended to reduce its support for our debt securities issued after such amendment, it could
materially increase our borrowing costs or materially adversely affect our access to the debt capital markets.
Our debt is considered a high quality liquid asset because it can be easily and immediately converted into cash at little
or no loss of value. Any changes by investors in how they view our debt or regulatory changes causing our debt to no
longer be considered a high quality liquid asset could significantly increase our debt funding costs or reduce our ability
to issue debt.
Future changes or disruptions in the financial markets could significantly change the amount, mix and cost of funds we
obtain, as well as our liquidity position. If we are unable to issue a sufficient amount of short- and long-term debt
securities at attractive rates, it could interfere with the operation of our business and have a material adverse effect on
our liquidity, results of operations, financial condition and net worth.
Our liquidity contingency plans may be difficult or impossible to execute during a sustained market liquidity crisis. If the
financial markets experience substantial volatility in the future similar to or more intensely than in 2020, it could
significantly adversely affect the amount, mix and cost of funds we obtain, as well as our liquidity position. If we cannot
access the unsecured debt markets, our ability to repay maturing indebtedness and fund our operations could be
significantly impaired. In this event, our alternative source of liquidity, our corporate liquidity portfolio, may not be
sufficient to meet our liquidity needs.
A decrease in the credit ratings on our senior unsecured debt could increase our borrowing costs and have an
adverse effect on our ability to issue debt on reasonable terms, particularly if such a decrease were not based
on a similar action on the credit ratings of the U.S. government. A decrease in our credit ratings also could
require that we post additional collateral for our derivatives contracts.
A reduction in our credit ratings could materially adversely affect our liquidity, our ability to conduct our normal business
operations, our financial condition and our results of operations. Credit ratings on our senior unsecured debt, as well as
the credit ratings of the U.S. government, are primary factors that could affect our borrowing costs and our access to the
debt capital markets. Credit ratings on our debt are subject to revision or withdrawal at any time by the rating agencies.
Actions by governmental entities impacting the support our business or our debt securities receive from Treasury could
adversely affect the credit ratings on our senior unsecured debt. If our senior preferred stock purchase agreement with
Treasury is amended to reduce its support for our debt securities issued after such amendment, it could result in a
downgrade in the credit ratings on our senior unsecured debt.
Because we rely on the U.S. government for capital support, in recent years, when a rating agency has taken an action
relating to the U.S. government’s credit rating, they have taken a similar action relating to our ratings at approximately
the same time. S&P Global Ratings (“S&P”), Moody’s Investors Service (“Moody’s”) and Fitch Ratings (“Fitch”) have all
indicated that they would likely lower their ratings on the debt of Fannie Mae and certain other government-related
entities if they were to lower their ratings on the U.S. government. As a result, if a future government shutdown, a
default by the United States government on its obligations, or other event or circumstance results in downgrades of the
government’s credit rating, we expect our credit ratings would be similarly downgraded. For example, in August 2023,
Fitch downgraded some of our credit ratings following Fitch’s downgrade of the U.S. government’s long-term issuer
default rating. We currently cannot predict the potential impact of a future credit ratings downgrade on demand for our
securities or on our business.
Risk Factors | Operational and Model Risk | ||
Fannie Mae 2023 Form 10-K | 40 |
A reduction in our credit ratings also could cause derivatives clearing organizations or their members to demand that we
post additional collateral for our cleared derivative contracts. In addition, a reduction in our credit rating to specified
thresholds in our over-the-counter derivatives contracts could require us to provide additional collateral to or terminate
transactions with certain derivatives counterparties. Our credit ratings, ratings outlook and additional collateral
requirements are described in “MD&A—Liquidity and Capital Management—Liquidity Management—Credit Ratings”
and “Note 9, Derivative Instruments.”
Market and Industry Risk
Changes in interest rates or our loss of the ability to manage interest-rate risk successfully could materially
adversely affect our financial results and condition, and increase our interest-rate risk.
We are subject to interest-rate risk, which is the risk that movements in interest rates will adversely affect the value of
our assets or liabilities or our future earnings or capital. Our exposure to interest-rate risk primarily arises from two
sources: (1) our “net portfolio,” which we define as: our retained mortgage portfolio assets, our corporate liquidity
portfolio, outstanding debt of Fannie Mae used to fund the retained mortgage portfolio assets and corporate liquidity
portfolio, mortgage commitments and risk management derivatives; and (2) our consolidated MBS trusts. We describe
these risks in more detail in “MD&A—Risk Management—Market Risk Management, including Interest-Rate Risk
Management.” Changes in interest rates affect both the value of our mortgage and other assets and prepayment rates
on our mortgage loans, which could have a material adverse effect on our financial results and condition, as well as our
liquidity.
Our ability to manage interest-rate risk depends on our ability to issue debt instruments with a range of maturities and
other features, including call provisions, at attractive rates and to engage in derivatives transactions. We must exercise
judgment in selecting the amount, type and mix of debt and derivative instruments that will most effectively manage our
interest-rate risk. The amount, type and mix of financial instruments that are available to us may not offset possible
future changes in the spread between our borrowing costs and the interest we earn on our mortgage assets. We mark
to market changes in the estimated fair value of our derivatives through our earnings on a quarterly basis, but we do not
similarly mark to market changes in some of the financial instruments that generate our interest-rate risk exposures. As
a result, changes in interest rates, particularly significant changes, can have an adverse effect on our earnings and net
worth, depending on the nature of the changes and the derivatives and short-term investments we hold at that time.
Decreasing interest rates would likely reduce the amounts that we earn on our corporate liquidity portfolio, as we tend to
earn lower yields on this portfolio in a declining interest rate environment.
We have experienced significant fair value losses in some periods due to changes in interest rates. Our hedge
accounting program is specifically designed to address the volatility of our financial results associated with changes in
fair value related to changes in the benchmark interest rates. As such, earnings variability driven by other factors, such
as spreads or the timing of when we recognize deferred guaranty fee income, remains. We describe how the timing of
when we recognize deferred guaranty fee income is sensitive to mortgage interest rates in “MD&A—Key Market
Economic Indicators” and “MD&A—Consolidated Results of Operations—Net Interest Income.” In addition, our ability to
effectively reduce earnings volatility is dependent on having the right mix and volume of interest-rate swaps available.
As our portfolio of interest-rate swaps varies over time, our ability to reduce earnings volatility through hedge accounting
may vary as well.
Changes in interest rates also can affect our credit losses. Interest rates increased significantly during 2022 and most of
2023. While we are not currently predicting interest rates to generally increase in 2024, interest rates could increase
further. When interest rates increase, our credit losses from loans with adjustable payment terms may increase as
borrower payments increase at their reset dates, which increases the borrower’s risk of default. Rising interest rates
may also reduce the opportunity for these borrowers to refinance into a fixed-rate loan. Similarly, many borrowers may
have additional debt obligations, such as home equity lines of credit and second liens, that also have adjustable
payment terms. If a borrower’s payment on his or her other debt obligations increases due to rising interest rates or a
change in amortization, it increases the risk that the borrower may default on a loan we own or guarantee. Rising
interest rates also typically reduce expected future loan prepayments, which tends to lengthen the expected life of our
loans and therefore generally increases the probability of default on the loans and therefore our loss reserves.
Increases in interest rates may also reduce the ability of multifamily borrowers to refinance their loans, which often have
balloon balances at maturity. In addition, in a rising interest rate environment, multifamily borrowers with adjustable-rate
mortgages may have difficulty paying higher monthly payments if property operating income is not increasing at a
similar pace. While we generally require multifamily borrowers with adjustable-rate mortgages to purchase an interest
rate cap to protect against large movements in interest rates, purchasing or replacing these required interest rate caps,
especially those with longer terms and/or lower strike rates, becomes more expensive as interest rates rise. As a result,
the cost of interest rate caps increased substantially in 2022 and for most of 2023, before moderating in late 2023 as
interest rates declined.
Risk Factors | Liquidity and Funding Risk | ||
Fannie Mae 2023 Form 10-K | 41 |
Changes in interest rates also typically affect our business volume. A higher interest rate environment generally results
in lower business volumes, as fewer loans may benefit from refinancing and the higher cost of borrowing reduces
affordability, driving lower purchase mortgage volumes.
Changes in spreads could materially impact our results of operations, net worth and the fair value of our net
assets.
Spread risk is the risk from changes in an instrument’s value that relate to factors other than changes in interest rates.
We can experience losses from changes in the spreads between our mortgage assets, including mortgage purchase
and sale commitments, and the debt and derivatives we use to hedge our position. Changes in market conditions,
including changes in interest rates, liquidity, prepayment and default expectations, and the level of uncertainty in the
market for a particular asset class may cause fluctuations in spreads. Changes in mortgage spreads have contributed to
significant volatility in our financial results in certain periods, due to fluctuations in the estimated fair value of the
financial instruments that we mark to market through our earnings, and this could occur again in a future period.
Changes in mortgage spreads could cause significant fair value losses, and could adversely affect our near-term
financial results and net worth. We do not actively manage or hedge our spread risk after we purchase mortgage
assets, other than through asset monitoring and disposition.
Our business and financial results are affected by general economic conditions, including home prices and
employment trends, and changes in economic conditions or financial markets may materially adversely affect
our business and financial condition. Volatility or uncertainty in global, regional or domestic political
conditions also can significantly affect economic conditions and financial markets.
In general, a prolonged period of slow growth in the U.S. economy or any deterioration or volatility in general economic
conditions or financial markets could materially adversely affect our results of operations, net worth and financial
condition. Our business is significantly affected by the status of the U.S. economy, including home prices and
employment trends, as well as economic output levels, interest rates and inflation rates. For example, see a risk factor
above in “Credit Risk” for a discussion of how worsening economic conditions could negatively affect the credit
performance of loans in our guaranty book of business and result in materially higher provisions for credit losses and
write-offs. Deterioration in economic conditions also typically results in reduced housing market activity, which reduces
our business volume. A reduction in our business volume can reduce our net interest income and adversely affect our
financial results. As described in “MD&A—Key Market Economic Indicators,” we currently expect a slowdown in both
economic and home price growth in 2024, as well as a slight increase in the unemployment rate.
Stress in the banking sector led to some bank failures in 2023. Additional stress on the banking system—particularly on
U.S. regional banks and on banks with significant exposure to commercial real estate—due to a recession or other
economic developments, could negatively affect U.S. economic conditions, including further tightening of bank credit
conditions, dampened consumer and business confidence, and reduced consumer spending, business investment and
hiring activity.
Global economic conditions can also adversely affect our business and financial results. Changes or volatility in market
conditions resulting from deterioration in or uncertainty regarding global economic conditions can adversely affect the
value of our assets, which could materially adversely affect our results of operations, net worth and financial condition.
To the extent global economic conditions negatively affect the U.S. economy, they also could negatively affect the credit
performance of the loans in our book of business.
Volatility or uncertainty in global, regional or domestic political conditions also can significantly affect economic
conditions and financial markets. Global, regional or domestic political unrest also could affect growth and financial
markets. For example, the conflict in the Middle East and the Russian war in Ukraine may further impact the global
economy and financial markets, which could further increase inflationary pressure and interest rates, as well as
negatively affect economic growth and result in disruptions and volatility in the financial markets.
We describe above the risks to our business posed by changes in interest rates and changes in spreads. In addition,
future changes, disruptions or volatility in financial markets as a result of global, regional or domestic economic or
political conditions could significantly change the amount, mix and cost of funds we obtain, as well as our liquidity
position.
Actions by the Federal Reserve can materially affect our business and financial condition, including our
business volumes and demand for our mortgage-backed securities.
Our business is significantly affected by shifts in fiscal and monetary policies, particularly actions taken by the Federal
Reserve. In 2020 and 2021, the Federal Reserve purchased a significant amount of mortgage-backed securities issued
by us, Freddie Mac and Ginnie Mae. The Federal Reserve began to taper these purchases in November 2021 and
concluded its asset purchase program in March 2022. In June 2022, the Federal Reserve began the process of
reducing its holdings of agency mortgage-backed securities by reinvesting principal payments from agency debt and
Risk Factors | Market and Industry Risk | ||
Fannie Mae 2023 Form 10-K | 42 |
agency mortgage-backed securities into agency mortgage-backed securities only to the extent those payments exceed
specified monthly caps. We believe the Federal Reserve’s reduction in its purchases of agency mortgage-backed
securities has reduced demand for our mortgage-backed securities. At the time of this filing, the Federal Reserve has
not announced any plans to begin selling the mortgage-backed securities in its portfolio. If the Federal Reserve
announces such a plan or changes its announced strategy to reduce its mortgage-backed securities holdings, it could
further reduce demand for our mortgage-backed securities, which could adversely affect our results of operations, net
worth and financial condition.
In addition, the Federal Reserve raised the target range for the federal funds rate eleven times during 2022 and 2023 to
address inflation, raising the federal funds rate by more than five percentage points from March 2022 through July 2023.
The Federal Reserve’s actions and economic conditions contributed to the sharp rise in mortgage rates in 2022 and
2023. The increase in mortgage interest rates resulted in a slowdown in housing demand and a substantial reduction in
our business volume in 2022 and 2023 compared with the prior two years. Further interest rate increases or higher
levels of interest rate volatility could further reduce our business volume, which could adversely affect our results of
operations, net worth and financial condition. Further interest rate increases also could affect the demand for and
liquidity of our MBS or result in slowdowns in home price growth, home price declines or declines in multifamily property
values, which also could adversely affect our results of operations, net worth and financial condition. We describe above
additional risks to our business posed by changes in interest rates.
Legal and Regulatory Risk
Regulatory changes in the financial services industry may negatively impact our business.
Changes in the regulation of the financial services industry are affecting and are expected to continue to affect many
aspects of our business. Such changes could affect our business directly or indirectly if they affect our lenders and other
counterparties.
For example, changes in regulations applicable to U.S. banks could affect the volume and characteristics of mortgage
loans available in the market and could also affect demand for our MBS and debt securities, as U.S. banks purchase a
large amount of our MBS and debt securities. New or revised liquidity or capital requirements applicable to U.S. banks
could materially affect banks’ willingness to deliver loans to us and to service our loans, as well as demand by those
banks for our MBS and debt securities. In 2023, U.S. bank regulators proposed new capital rules that would apply to
U.S. banks. The proposed rules would, among other things, revise the capital treatment of mortgage-related exposures
and activities, including loan servicing. Depending on their final form, these new rules could negatively affect the amount
and credit quality of the loans we acquire, the servicing of our loans, the liquidity of UMBS, dealer appetite to make
markets in our securities, and investor demand for our MBS, debt securities and credit risk transfer securities. In
addition, developments in connection with the single-counterparty credit limit regulations, including those taken in
anticipation of our eventual exit from conservatorship, could also cause our lenders and investors to change their
business practices.
The actions of Treasury, the Federal Reserve, the OCC, the FDIC, the SEC, the CFTC, the CFPB, and international
central banking authorities directly or indirectly impact financial institutions’ cost of funds for lending, capital-raising and
investment activities, which could increase our borrowing costs or make borrowing more difficult for us. Changes in
monetary policy are beyond our control and can be difficult to anticipate.
Overall, these legislative and regulatory changes could affect us in substantial and unforeseeable ways and could have
a material adverse effect on our business, results of operations, financial condition, liquidity and net worth.
Legislative, regulatory or judicial actions could negatively impact our business, results of operations, financial
condition, liquidity or net worth.
Legislative, regulatory or judicial actions at the federal, state or local level could negatively impact our business, results
of operations, financial condition, liquidity or net worth. Legislative, regulatory or judicial actions could affect us in a
number of ways, including by imposing significant additional costs on us, diverting management attention or other
resources from other matters, or increasing our operational risk. We could also be affected by:
•Further actions taken by the U.S. Congress, Treasury, the Federal Reserve, FHFA or other national, state or
local government agencies or legislatures in response to emergencies, such as expanding or extending our
obligations to help borrowers, renters or counterparties.
•Court decisions concluding that we or our affiliates are governmental actors, which could impose additional
burdens and requirements on us.
•Designation as a systemically important financial institution by the Financial Stability Oversight Council (the
“FSOC”). We have not been designated as a systemically important financial institution; however, the FSOC
announced in 2020 that it will continue to monitor the secondary mortgage market activities of the government-
Risk Factors | Market and Industry Risk | ||
Fannie Mae 2023 Form 10-K | 43 |
sponsored enterprises to ensure potential risks to financial stability are adequately addressed. Designation as a
systemically important financial institution would result in our becoming subject to additional regulation and
oversight by the Federal Reserve Board.
•Other agencies of the U.S. government or Congress asking us to take actions to support the housing and
mortgage markets or in support of other goals. For example, in December 2011, Congress enacted the TCCA
under which we increased our guaranty fee on all single-family mortgages delivered to us by 10 basis points.
The revenue generated by this fee increase is paid to Treasury. In November 2021, the Infrastructure
Investment and Jobs Act was enacted, which extended to October 1, 2032 our obligation under the TCCA to
collect 10 basis points in guaranty fees on single-family mortgages delivered to us and pay the associated
revenue to Treasury.
Our business and financial results could be materially adversely affected by legal or regulatory proceedings.
We are a party to various claims and other legal proceedings. We are periodically involved in government
investigations. We may be required to establish accruals and to make substantial payments in the event of adverse
judgments or settlements of any such claims, investigations or proceedings, which could have a material adverse effect
on our business, results of operations, financial condition, liquidity and net worth. For example, due to a judgment
against us in two cases consolidated for trial in the U.S. District Court for the District of Columbia, which are described
in “Note 17, Commitments and Contingencies” and “Legal Proceedings,” we accrued $495 million in 2023 relating to the
jury verdict and related award of prejudgment interest. Any legal proceeding or governmental investigation, even if
resolved in our favor, could result in negative publicity, reputational harm or cause us to incur significant legal and other
expenses. In addition, responding to these matters could divert significant internal resources away from managing our
business.
In addition, a number of lawsuits have been filed against the U.S. government relating to the senior preferred stock
purchase agreement and the conservatorship. See “Note 17, Commitments and Contingencies” and “Legal
Proceedings” for a description of these lawsuits. These lawsuits, and actions Treasury or FHFA may take in response to
these lawsuits, could have a material impact on our business.
General Risk
Changes in accounting standards and policies can be difficult to predict and can materially impact how we
record and report our financial results.
Our accounting policies and methods are fundamental to how we record and report our financial condition, results of
operations and cash flows. From time to time, the FASB or the SEC changes the financial accounting and reporting
standards or the policies that govern the preparation of our financial statements. In addition, FHFA provides guidance
that affects our adoption or implementation of financial accounting or reporting standards. These changes can be
difficult to predict and expensive to implement, and can materially impact how we record and report our financial
condition, results of operations and cash flows. We could be required to apply new or revised guidance retrospectively,
which may result in the revision of prior-period financial statements by material amounts. The implementation of new or
revised accounting guidance could have a material adverse effect on our financial results or net worth.
In many cases, our accounting policies and methods, which are fundamental to how we report our financial
condition and results of operations, require management to make judgments and estimates about matters that
are inherently uncertain. Management also relies on models in making these estimates.
Our management must exercise judgment in applying many of our accounting policies and methods so that they comply
with GAAP and reflect management’s judgment of the most appropriate manner to report our financial condition and
results of operations. In some cases, management must select the appropriate accounting policy or method from two or
more acceptable alternatives, any of which might be reasonable under the circumstances but might affect the amounts
of assets, liabilities, revenues and expenses that we report. See “Note 1, Summary of Significant Accounting Policies”
for a description of our significant accounting policies.
We have identified one of our accounting estimates, allowance for loan losses, as critical to the presentation of our
financial condition and results of operations, as described in “MD&A—Critical Accounting Estimates.” We believe this
estimate is critical because it involves significant judgments and assumptions about highly complex and inherently
uncertain matters, and the use of reasonably different judgments and assumptions could have a material impact on our
reported results of operations or financial condition.
Because our financial statements involve estimates for amounts that are very large, even a small change in the estimate
can have a significant impact for the reporting period. For example, because our allowance for loan losses is so large,
even a change that has a small impact relative to the size of this allowance can have a meaningful impact on our results
for the quarter in which we make the change.
Risk Factors | Legal and Regulatory Risk | ||
Fannie Mae 2023 Form 10-K | 44 |
Many of our accounting methods involve substantial use of models, which are inherently imperfect predictors of actual
results because they are based on assumptions, including about future events. For example, we use models to
determine expected lifetime losses on loans and certain other financial instruments. Our actual results could differ
significantly from those generated by our models. As a result, the estimates that we use to prepare our financial
statements, as well as our estimates of our future results of operations, may be inaccurate, perhaps significantly. For
more discussion of the risks associated with our use of models, see a risk factor in “Operational and Model Risk” above.
Item 1B. Unresolved Staff Comments
None.
Item 1C. Cybersecurity
Cybersecurity Risk Management and Strategy
Overview
Cybersecurity risk management represents a critical component of our overall approach to risk management.
Information security risks for large institutions like us have continued to significantly increase and we and the third
parties with which we do business have been, and we expect will continue to be, the target of cyber attacks and other
information security threats. These risks are an unavoidable result of conducting our business, and managing these
risks is an inherent part of our business activities. We describe the cybersecurity risks we face in “Risk Factors—
Operational and Model Risk.”
Cybersecurity Risk Management Program
We have developed and continue to enhance our cybersecurity risk management program as we seek to protect the
security of our computer systems, software, networks and other technology assets against unauthorized attempts to
access confidential information and data or to disrupt or degrade business operations. Our cybersecurity risk
management program has evolved based on the changing needs of our business, the evolving threat environment and
FHFA regulatory guidance.
We design and assess our cybersecurity risk management program based on the National Institute of Standards and
Technology Framework for Improving Critical Infrastructure Cybersecurity (the “NIST Cybersecurity Framework”). While
we generally consult the NIST Cybersecurity Framework when designing and assessing our cybersecurity risk
management program, we have not implemented and do not plan to implement all categories and subcategories
included in the framework. We use the framework as a guide to help us identify, assess and manage cybersecurity risks
relevant to our business based on our current understanding of the cybersecurity threat environment.
In 2023, we conducted our most recent maturity assessment of our use of the NIST Cybersecurity Framework to
manage our cybersecurity risk. These assessments measure the extent to which we have implemented the framework’s
categories and subcategories, but do not specifically assess the effectiveness of our cybersecurity program. Based on
these assessments, we develop select improvements to our cybersecurity risk management program to help ensure we
maintain a program designed to align to industry benchmarks and financial services peers.
Integration into Enterprise Risk Management Framework
Our cybersecurity risk management program is integrated into our overall Enterprise Risk Management framework. Our
Enterprise Response Framework establishes the reporting structure and escalation process for managing all enterprise
incidents, including cybersecurity-related incidents. The framework defines the relationship and notification steps among
the various crisis management stakeholders, including the Board of Directors, the Management Committee, the CEO,
other members of the executive leadership team, the crisis manager and crisis management coordinators. See
“Cybersecurity Governance—Management Role” for a description of the oversight role of the Enterprise Risk
Management division, Internal Audit and the management-level Technology Risk Committee and Enterprise Risk
Committee relating to cybersecurity risk management.
Cybersecurity Risk Management Strategy
Overview and Goal. Fannie Mae has a multilayered cybersecurity defense strategy. We take a risk-based approach that
prioritizes and attempts to plan for the highest impact events first. Our cybersecurity threat operations operate with the
goal of identifying, preventing, and mitigating cybersecurity threats and responding to cybersecurity incidents in
accordance with incident response and recovery plans.
Tools and Safeguards. As part of our cybersecurity defense strategy, we employ tools and systems safeguards intended
to help secure our networks, applications, data and infrastructure, and to manage cybersecurity vulnerabilities. These
Risk Factors | General Risk | ||
Fannie Mae 2023 Form 10-K | 45 |
safeguards include network and perimeter defense, infrastructure security, endpoint protection, data protection, identity
management and network segmentation. We work to evaluate and improve on these tools and safeguards through
periodic cybersecurity assessments and the integration of cybersecurity threat intelligence.
Backup Data Storage. We have both internal and external third-party backup data storage to help protect our data from
cybersecurity incidents. We test our backup restoration process on a regular basis.
Response Plans and Procedures. We maintain cybersecurity incident response procedures that identify the activities
and escalation processes to be implemented upon detection of a cybersecurity incident, and we routinely practice these
activities and processes. We also have business and technology continuity plans and a crisis management plan, which
we test on a regular basis.
Training. We provide mandatory cybersecurity training to employees and contractors on an annual basis. Employees
also have access to supplemental online cybersecurity training. We test our employees’ response to simulated phishing
scenarios on a regular basis.
Assessments. We examine the effectiveness of our cyber defenses through various means, including internal audits,
targeted testing, maturity assessments, incident response exercises and industry benchmarking.
Insurance Coverage. We maintain insurance coverage relating to cybersecurity risks. As described in “Risk Factors—
Operational and Model Risk,” our insurance may not be sufficient to provide adequate loss coverage in all
circumstances.
Role of External Consultants, Vendors and Other Third Parties
We regularly use external consultants and vendors to assist in our management of cybersecurity risks:
•We regularly employ third parties to evaluate the security of our networks, including engaging an external
vendor to conduct penetration testing against our network.
•We engage an external vendor to review and test our cybersecurity incident response plan on at least an
annual basis, including to assist with incident response exercises.
•We engage a third party to assess the design of our cybersecurity controls and control environment, including
assisting with our 2023 NIST Cybersecurity Framework maturity assessment.
•We have external vendors on retainer to assist with cybersecurity incident response activities.
External assessments have identified gaps and suggested enhancements that we consider when making changes to
our cybersecurity risk management program.
We are also focused on building strong relationships with the appropriate government and law enforcement agencies
and with other businesses, industry groups and cybersecurity services to better understand the cybersecurity risks in
our environment, enhance our defenses and improve our resiliency against cybersecurity threats.
Third-Party Cybersecurity Risk Oversight
Our cybersecurity risk management program extends to oversight of third parties that pose a cybersecurity risk to us,
including lenders that use our systems and third-party service providers. In alignment with the NIST Cybersecurity
Framework and FHFA regulatory guidance, we have established a risk-based framework for managing third-party risk
that defines specified triggers for assessing and reporting cyber-related third-party risks and events. Pursuant to this
framework, we have implemented both preventive and detective controls to mitigate cybersecurity risks posed by third
parties.
We have identified certain third parties that pose a higher cybersecurity risk to us because they have significant access
to our systems or data. For these higher-risk third parties, we have implemented additional requirements, including:
•We assess these higher-risk third parties’ cybersecurity controls through a cybersecurity questionnaire and a
review of their cybersecurity controls, either through independent audits or by direct review of their
cybersecurity policies and practices.
•We use third-party cybersecurity monitoring and alert services to monitor these higher-risk third parties.
•We conduct periodic monitoring reviews of these higher-risk third parties’ cybersecurity policies and practices.
Cybersecurity Governance
Overview
We follow a cross-functional approach to addressing the risk from cybersecurity threats, involving management
personnel from our technology, operations, legal, enterprise risk management, internal audit and other key business
Cybersecurity | Cybersecurity Risk Management and Strategy | ||
Fannie Mae 2023 Form 10-K | 46 |
functions in an ongoing dialogue regarding cybersecurity threats and incidents. As described in “Board Oversight”
below, we also regularly report to the Board and the Risk Policy and Capital Committee of the Board on cybersecurity
risk matters. We have implemented controls and procedures for the escalation of cybersecurity incidents so that
decisions regarding the disclosure and reporting of such incidents can be made in a timely manner.
Board Oversight
Cybersecurity risk management is overseen by the full Board of Directors and by the Risk Policy and Capital Committee
of the Board. While the Board maintains oversight of cybersecurity risk, the Board has delegated oversight authority at
the management level for risk-related matters, including cybersecurity risk matters, to the Enterprise Risk Committee, as
described under “Management Role” below.
The Board and the Risk Policy and Capital Committee generally engage in discussions throughout the year with
management on cybersecurity risk matters. The Chief Information Security Officer and other members of the
management team provide reports to the Board and the Risk Policy and Capital Committee on cybersecurity risk
matters on a regular basis, including updates on our cybersecurity risk management program, recent developments in
cybersecurity and privacy regulation, evolving standards, third-party reviews, general technological trends, information
security considerations with respect to the company’s peers and third parties, the external threat environment, and the
steps the company is taking to address and mitigate the risks associated with the evolving cybersecurity threat
environment. Management also discusses cybersecurity developments with the Chair of the Risk Policy and Capital
Committee and other Board members between Board and committee meetings, as appropriate. The company has
procedures to escalate information regarding certain cybersecurity incidents to the Board Chair. At least annually, the
Board reviews and approves the company’s Cybersecurity Risk Policy and Operational Risk Policy.
Management Role
Our Information Security organization, which is headed by our Chief Information Security Officer, has primary
responsibility for assessing and managing our cybersecurity risks. Our Chief Information Security Officer is the member
of our management team who is principally responsible for overseeing the company’s cybersecurity risk management
program.
The Information Security organization works collaboratively across the company to protect the company’s information
systems from cybersecurity threats and to respond to cybersecurity threats and incidents. The Information Security
organization monitors information systems to detect anomalies, including attempted cyber attacks, as well as user
activity for access controls and risks of insider threat. The Information Security organization also monitors and
investigates cybersecurity incidents through detection tools, reports from end-users, and other cybersecurity threat and
vulnerability intelligence. The Information Security organization also shares and obtains information on cybersecurity
threats through participation in the Financial Services Information Sharing and Analysis Center, referred to as FS-ISAC,
a member-driven organization that advances cybersecurity and resilience in the global financial system.
As appropriate, multidisciplinary teams are deployed to address cybersecurity threats and to respond to cybersecurity
incidents in accordance with the company’s incident response processes. The Information Security organization and
Enterprise Risk Management are informed about and monitor the prevention, detection and mitigation of cybersecurity
incidents through risk and control assessments, targeted reviews, scenario analysis, and monitoring of risk metrics. The
company’s performance in managing cybersecurity risk is reported to the Technology Risk Committee, the Enterprise
Risk Committee and the Board of Directors.
As noted above, the Board has delegated oversight responsibility at the management level for risk-related matters to the
Enterprise Risk Committee. The Enterprise Risk Committee has delegated primary responsibility for management-level
oversight of cybersecurity risk management to the Technology Risk Committee. The Technology Risk Committee
receives reports on cybersecurity risk matters on a regular basis from the company’s Chief Information Security Officer.
The Technology Risk Committee reviews and approves the company’s management-level cybersecurity risk policies
and standards. The Technology Risk Committee also reviews and monitors metrics relating to cybersecurity risk. The
Technology Risk Committee escalates matters to the Enterprise Risk Committee as appropriate.
The company’s Enterprise Risk Management division provides risk-based independent oversight of cybersecurity risk
management performed by the Information Security organization. The Technology Risk Committee and Enterprise Risk
Committee are each chaired by a member of the Enterprise Risk Management division.
The company’s Internal Audit organization audits the Enterprise Risk Management division’s oversight of cybersecurity
risk management and also independently tests the effectiveness of the company’s cybersecurity risk management and
governance. Members of the Internal Audit organization participate as non-voting members of both the Technology Risk
Committee and the Enterprise Risk Committee.
Cybersecurity | Cybersecurity Governance | ||
Fannie Mae 2023 Form 10-K | 47 |
Management Expertise
CISO
Our Chief Information Security Officer has nearly 20 years of professional experience in information security, including
over 7 years as Fannie Mae’s Chief Information Security Officer and 1 year as Fannie Mae’s Deputy Chief Information
Security Officer. Our Chief Information Security Officer holds a graduate degree in information technology management.
Technology Risk Committee
Members of the Technology Risk Committee include officers with expertise in cybersecurity risk oversight, such as the
Chief Information Security Officer described above, the head of our Technology Risk Oversight department, and the
Chief Technology Officer. As of December 2023, approximately three-quarters of the members of the Technology Risk
Committee had prior work experience in cybersecurity, a relevant degree or certification, or other knowledge, skills or
background in cybersecurity.
Enterprise Risk Committee
Members of the Enterprise Risk Committee include senior leaders throughout the company, including our Chief Risk
Officer (who chairs the Committee and is the head of our Enterprise Risk Management division), Chief Executive Officer,
Chief Financial Officer, General Counsel, Head of Multifamily Business, Head of Single-Family Business, and Chief
Information Officer. In addition, our Chief Audit Executive is a non-voting member of the Enterprise Risk Committee. As
of December 2023, more than half of the members of the Enterprise Risk Committee had prior work experience in
cybersecurity or other knowledge, skills or background in cybersecurity.
Impact of Risks from Cybersecurity Threats
As noted above, we and the third parties with which we do business have been, and we expect will continue to be, the
target of cyber attacks and other information security threats. To date, risks from cybersecurity threats, including as a
result of previous cybersecurity incidents, have not materially affected our business, including our business strategy,
results of operations or financial condition. However, large-scale cyber attacks perpetrated against other companies in
recent years suggest that the risk of damaging cyber attacks is increasing. As a result, we continue to invest in our
cybersecurity infrastructure, including investment in prevention capabilities and response readiness.
Notwithstanding our efforts to manage cybersecurity risks as described above, we may not be successful in preventing
or mitigating a cybersecurity incident that could have a material adverse effect on our business, including our business
strategy, results of operations and financial condition. Cybersecurity threats are constantly evolving and we may not be
able to anticipate, detect or recognize cybersecurity threats to our systems and assets, or to implement effective
preventive measures against all cybersecurity threats, especially because the techniques used in cyber attacks are
increasingly sophisticated, change frequently, are complex, and are often not recognized until launched. We routinely
identify cybersecurity threats as well as vulnerabilities in our systems and work to address or mitigate those we have
identified; however, some cybersecurity vulnerabilities take a substantial amount of time to resolve or mitigate and
therefore we continue to have cybersecurity vulnerabilities that we have identified but not resolved or mitigated. As a
result, we could experience a cybersecurity incident that materially affects our business in a quarterly or annual fiscal
period. See “Risk Factors—Operational and Model Risk” for additional discussion of cybersecurity risks to our business.
Item 2. Properties
There are no physical properties that are material to us.
Item 3. Legal Proceedings
This item describes our material legal proceedings. We describe additional material legal proceedings in “Note 17,
Commitments and Contingencies,” which is incorporated herein by reference. In addition to the matters specifically
described or incorporated by reference in this item, we are involved in legal and regulatory proceedings that arise in the
ordinary course of business that we do not expect will have a material impact on our business or financial condition.
However, litigation claims and proceedings of all types are subject to many factors and their outcome and effect on our
business and financial condition generally cannot be predicted accurately.
We establish an accrual for legal claims only when a loss is probable and we can reasonably estimate the amount of
such loss. The actual costs of resolving legal claims may be substantially higher or lower than the amounts accrued for
those claims. If certain of these matters are determined against us, FHFA or Treasury, it could have a material adverse
effect on our results of operations, liquidity and financial condition, including our net worth.
Cybersecurity | Cybersecurity Governance | ||
Fannie Mae 2023 Form 10-K | 48 |
Senior Preferred Stock Purchase Agreements Litigation
Since June 2013, preferred and common stockholders of Fannie Mae and Freddie Mac filed lawsuits in multiple federal
courts against one or more of the United States, Treasury and FHFA, challenging actions taken by the defendants
relating to the Fannie Mae and Freddie Mac senior preferred stock purchase agreements and the conservatorships of
Fannie Mae and Freddie Mac. Some of these lawsuits also contain claims against Fannie Mae and Freddie Mac. The
legal claims being advanced by one or more of these lawsuits include challenges to the net worth sweep dividend
provisions of the senior preferred stock that were implemented pursuant to August 2012 amendments to the
agreements, the payment of dividends to Treasury under the net worth sweep dividend provisions, and FHFA’s decision
to require Fannie Mae and Freddie Mac to draw funds from Treasury to pay dividends to Treasury prior to the August
2012 amendments. The plaintiffs seek various forms of equitable and injunctive relief as well as damages. The cases
that remain pending or were terminated after September 30, 2023 are as follows:
District of Columbia (In re Fannie Mae/Freddie Mac Senior Preferred Stock Purchase Agreement Class Action
Litigations and Fairholme Funds v. FHFA). Fannie Mae is a defendant in two cases in the U.S. District Court for the
District of Columbia, including a consolidated class action. The cases were consolidated for trial, and on August 14,
2023, the jury returned a verdict for the plaintiffs and awarded damages of $299.4 million to Fannie Mae preferred
stockholders. On October 24, 2023, the court awarded these stockholders prejudgment interest on the damage award,
to be determined as simple interest, accruing from August 17, 2012 until the date on which judgment is entered at a
fixed rate of 5% over the Federal Reserve discount rate as of August 17, 2012. We have determined the prejudgment
interest through December 31, 2023 is $196 million. See “Note 17, Commitments and Contingencies” for additional
information.
Southern District of Texas (Collins, et al. v. Yellen, et al.). On October 20, 2016, preferred and common stockholders
filed a complaint against FHFA and Treasury in the U.S. District Court for the Southern District of Texas. On May 22,
2017, the court dismissed the case. On September 6, 2019, the U.S. Court of Appeals for the Fifth Circuit, sitting en
banc, affirmed the district court’s dismissal of claims against Treasury, but reversed the dismissal of claims against
FHFA.
On June 23, 2021, the U.S. Supreme Court held that FHFA did not exceed its statutory powers as conservator when it
agreed to the net worth sweep dividend provisions of the third amendment to the senior preferred stock purchase
agreements in August 2012. The court also held that the provision of the Housing and Economic Recovery Act of 2008
that restricts the President’s power to remove the FHFA Director without cause violates the Constitution’s separation of
powers and, thus, the FHFA Director may be removed by the President for any reason. The court rejected plaintiffs’
request to rescind the third amendment to the senior preferred stock purchase agreements. However, the Supreme
Court remanded the case to the Fifth Circuit for further proceedings on the sole issue of whether the stockholders
suffered compensable harm related to the constitutional claim during the limited time-period when a Senate-confirmed
FHFA Director was in office. On March 4, 2022, the Fifth Circuit remanded the case to the district court for further
proceedings on the compensable harm issue. On June 3, 2022, the stockholders filed an amended complaint and on
July 18, 2022, FHFA and Treasury moved to dismiss that complaint. On November 21, 2022, the district court dismissed
the case. On October 12, 2023, the Fifth Circuit Court of Appeals affirmed the district court’s dismissal. The stockholders
time to seek further review has lapsed and the case is now concluded.
Western District of Michigan (Rop et al. v. FHFA et al.). On June 1, 2017, preferred and common stockholders of Fannie
Mae and Freddie Mac filed a complaint for declaratory and injunctive relief against FHFA and Treasury in the U.S.
District Court for the Western District of Michigan. FHFA and Treasury moved to dismiss the case on September 8,
2017, and plaintiffs filed a motion for summary judgment on October 6, 2017. On September 8, 2020, the court denied
plaintiffs’ motion for summary judgment and granted defendants’ motion to dismiss. On October 4, 2022, the U.S. Court
of Appeals for the Sixth Circuit reversed the dismissal and remanded the case to the district court to determine whether
the stockholders suffered compensable harm. On February 2, 2023, plaintiffs filed a petition with the Supreme Court
seeking review of the Sixth Circuit’s decision, which the Supreme Court denied on June 12, 2023. On August 11, 2023,
plaintiffs submitted a motion for leave to file an amended complaint in the district court.
District of Minnesota (Bhatti et al. v. FHFA et al.). On June 22, 2017, preferred and common stockholders of Fannie
Mae and Freddie Mac filed a complaint for declaratory and injunctive relief against FHFA and Treasury in the U.S.
District Court for the District of Minnesota. The court dismissed the case on July 6, 2018. On October 6, 2021, the U.S.
Court of Appeals for the Eighth Circuit affirmed in part and reversed in part the district court’s ruling and remanded the
case to the district court to determine whether the stockholders suffered compensable harm. On January 26, 2022,
plaintiffs filed an amended complaint. On March 11, 2022 and March 14, 2022, Treasury and FHFA each filed motions to
dismiss the new complaint. On December 16, 2022, the district court dismissed the case and on January 9, 2023,
plaintiffs filed a notice of appeal.
Legal Proceedings | ||
Fannie Mae 2023 Form 10-K | 49 |
Eastern District of Pennsylvania (Wazee Street Opportunities Fund IV L.P. et al. v. FHFA et al.). On August 16, 2018,
common stockholders of Fannie Mae and Freddie Mac filed a complaint for declaratory and injunctive relief against
FHFA and Treasury in the U.S. District Court for the Eastern District of Pennsylvania. FHFA and Treasury moved to
dismiss the case on November 16, 2018, and plaintiffs filed a motion for summary judgment on December 21, 2018.
This case is currently stayed.
U.S. Court of Federal Claims (Fisher et al. v. United States of America). On December 2, 2013, common stockholders
of Fannie Mae filed a lawsuit against the United States that listed Fannie Mae as a nominal defendant. The plaintiffs
alleged that the net worth sweep dividend provisions of the senior preferred stock that were implemented pursuant to
the August 2012 amendment constituted a taking of Fannie Mae’s property without just compensation in violation of the
U.S. Constitution. On February 15, 2023, the court issued an order for plaintiffs to show cause why their claims should
not be dismissed, as claims similar to theirs brought by other Fannie Mae stockholders in other cases against the United
States had been dismissed by the court. On September 1, 2023, the court dismissed the case with prejudice. On
October 30, 2023, plaintiffs filed a notice of appeal.
Item 4. Mine Safety Disclosures
None.
Legal Proceedings | ||
Fannie Mae 2023 Form 10-K | 50 |
PART II
Item 5. Market for Registrant’s Common Equity, Related Stockholder
Matters and Issuer Purchases of Equity Securities
Common Stock
Our common stock is traded in the over-the-counter market and quoted on the OTCQB, operated by OTC Markets
Group Inc., under the ticker symbol “FNMA.” Over-the-counter market quotations for our common stock reflect inter-
dealer prices, without retail mark-up, mark-down or commission and may not necessarily represent actual transactions.
The transfer agent and registrar for our common stock is Computershare Trust Company, N.A., and its address is
P.O. Box 43006, Providence, RI 02940-3006 or, for overnight correspondence, 150 Royall St., Suite 101, Canton, MA
02021.
Holders
As of February 1, 2024, we had approximately 7,500 registered holders of record of our common stock. In addition, as
of February 1, 2024, Treasury held a warrant giving it the right to purchase shares of our common stock equal to 79.9%
of the total number of shares of our common stock outstanding on a fully diluted basis on the date of exercise.
Recent Sales of Unregistered Equity Securities
Under the terms of our senior preferred stock purchase agreement with Treasury, we are prohibited from selling or
issuing our equity interests, without the prior written consent of Treasury except under limited circumstances described
in “Business—Conservatorship and Treasury Agreements—Treasury Agreements—Covenants.”
During the quarter ended December 31, 2023, we did not sell any equity securities.
Information about Certain Securities Issuances by Fannie Mae
Pursuant to SEC regulations, public companies are required to disclose certain information when they incur a material
direct financial obligation or become directly or contingently liable for a material obligation under an off-balance sheet
arrangement. The disclosure must be made in a current report on Form 8-K under Item 2.03 or, if the obligation is
incurred in connection with certain types of securities offerings, in prospectuses for that offering that are filed with the
SEC.
Because the securities we issue are exempted securities under the Securities Act of 1933, we do not file registration
statements or prospectuses with the SEC with respect to our securities offerings. To comply with the disclosure
requirements of Form 8-K relating to the incurrence of material financial obligations, in accordance with a “no-action”
letter we received from the SEC staff in 2004, we report our incurrence of these types of obligations in offering circulars
or prospectuses (or supplements thereto) that we post on our website within the same time period that a prospectus for
a non-exempt securities offering would be required to be filed with the SEC. To the extent we incur a material financial
obligation that is not disclosed in this manner, we would file a Form 8-K if required to do so under applicable Form 8-K
requirements.
The website address for disclosure about our debt securities is www.fanniemae.com/debtsearch. From this address,
investors can access the offering circular and related supplements for debt securities offerings under Fannie Mae’s
universal debt facility, including pricing supplements for individual issuances of debt securities.
Disclosure about our obligations pursuant to the MBS we issue, some of which may be off-balance sheet obligations,
can be found at www.fanniemae.com/mbsdisclosure. From this address, investors can access information and
documents about our MBS, including prospectuses and related prospectus supplements.
We are providing our website address solely for your information. Information appearing on our website is not
incorporated into this report.
Our Purchases of Equity Securities
We did not repurchase any of our equity securities during the fourth quarter of 2023.
Dividends
As described in “Business—Conservatorship and Treasury Agreements,” our conservator has eliminated dividends on
our common and preferred stock (other than dividends on the senior preferred stock issued to Treasury) during the
conservatorship. In addition, under the terms of our senior preferred stock purchase agreement with Treasury, we may
Market for Registrant’s Common Equity, Related Stockholder Matters and Issuer Purchases of Equity Securities |
Fannie Mae 2023 Form 10-K | 51 |
not pay dividends or make other distributions on or repurchase our equity securities (other than the senior preferred
stock) without the prior written consent of Treasury.
Item 6. [Reserved]
Market for Registrant’s Common Equity, Related Stockholder Matters and Issuer Purchases of Equity Securities |
Fannie Mae 2023 Form 10-K | 52 |
Item 7. Management’s Discussion and Analysis of Financial Condition
and Results of Operations
You should read this MD&A together with our consolidated financial statements as of December 31, 2023 and the
accompanying notes. This MD&A does not discuss 2021 performance or a comparison of 2021 versus 2022
performance for select areas where we have determined the omitted information is not necessary to understand our
current-period financial condition, changes in our financial condition, or our results. The omitted information may be
found in our 2022 Form 10-K, filed with the SEC on February 14, 2023, in MD&A sections titled “Consolidated Results of
Operations,” “Single-Family Business,” “Multifamily Business,” and “Liquidity and Capital Management.”
Key Market Economic Indicators
Below we discuss how varying macroeconomic conditions can influence our financial results across different business
and economic environments. Our forecasts and expectations are based on many assumptions, subject to many
uncertainties and may change, perhaps substantially, from our current forecasts and expectations. See “Forward-
Looking Statements” and “Risk Factors” for a discussion of factors that could cause actual results to differ materially
from our current forecasts and expectations. For further discussion on housing activity, see “Single-Family Business—
Single-Family Mortgage Market” and “Multifamily Business—Multifamily Mortgage Market.”
Selected Benchmark Interest Rates
(1)Refers to the U.S. weekly average fixed-rate mortgage rate according to Freddie Mac’s Primary Mortgage Market Survey®. These rates are
reported using the latest available data for a given period.
(2)According to Bloomberg.
(3)Refers to the daily rate per the Federal Reserve Bank of New York.
How Interest Rates Can Affect Our Financial Results
•Net interest income. Changes in interest rates impact the timing of when we recognize certain components of
net interest income. Our primary source of net interest income is guaranty fees we receive for assuming the
credit risk on our guaranty book of business, which consists of upfront and base guaranty fees. Since we
amortize upfront guaranty fees over the contractual life of the loan, when a loan prepays, the remaining upfront
fees on the loan are recognized as income in that period. In a rising interest-rate environment, our mortgage
MD&A | Key Market Economic Indicators | ||
Fannie Mae 2023 Form 10-K | 53 |
loans generally prepay more slowly as borrowers are less likely to refinance, which typically results in lower
deferred guaranty fee income as those upfront fees are amortized into interest income over a longer period of
time. Conversely, in a declining interest-rate environment, our mortgage loans generally prepay faster as
borrowers are more likely to refinance, typically resulting in higher deferred guaranty fee income as loan
prepayments accelerate the realization of those upfront fees as interest income. However, since most of the
loans in our single-family guaranty book of business continue to have mortgage interest rates meaningfully
below the current prevailing rate as of December 31, 2023, we may not experience higher deferred guaranty
fee income in a declining interest-rate environment unless mortgage interest rates drop to a level that is low
enough to incentivize more borrowers to refinance. Interest rates also affect the amount of interest income we
earn on our assets. Our corporate liquidity portfolio and certain mortgage-related assets typically earn more
interest income in a higher interest-rate environment and less interest income in a lower interest-rate
environment. See “Consolidated Results of Operations—Net Interest Income” for a discussion of how interest
rate changes impacted our financial results and for information on the interest rates of the loans in our single-
family conventional guaranty book of business compared to the prevailing average 30-year fixed-rate mortgage
rate as of year-end 2023.
•Fair value gains (losses). We have exposure to fair value gains and losses resulting from changes in interest
rates, primarily through our trading securities, mortgage commitment derivatives and risk management
derivatives, which we mark to market through earnings. Fair value gains and losses on our mortgage
commitment derivatives fluctuate depending on how interest rates and prices move between the time a
commitment is opened and when it settles. The net position and composition across the yield curve of our risk
management derivatives changes over time. As a result, interest rate changes (increases or decreases) and
yield curve changes (parallel, steepening or flattening shifts) will generate varying amounts of fair value gains
or losses in a given period. For more information about our fair value gains (losses), see “Consolidated Results
of Operations—Fair Value Gains, Net.”
•Benefit (provision) for credit losses. When mortgage interest rates increase, our expected credit losses on
loans increases because (1) we generally expect fewer borrowers will refinance their loans, thereby extending
the expected life of the loan, which increases our expectation of loss and (2) borrowers with adjustable-rate
loans or multifamily loans with balloon balances due at maturity face increased costs and a reduced ability to
refinance. This increase in our expectation of loss contributes to our provision for credit losses. Conversely,
when mortgage interest rates decrease, our expectation of loss decreases, which reduces our provision for
credit losses. For more information on our benefit (provision) for credit losses, see “Consolidated Results of
Operations—Benefit (Provision) for Credit Losses.”
Single-Family Annual Home Price Growth Rate(1)
(1) Calculated internally using property data on loans purchased by Fannie Mae, Freddie Mac, and other third-party home sales data. Fannie
Mae’s home price index is a weighted repeat transactions index, measuring average price changes in repeat sales on the same properties.
Fannie Mae’s home price index excludes prices on properties sold in foreclosure. Fannie Mae’s home price growth rates represent
estimates based on non-seasonally adjusted preliminary data and are subject to change as additional data becomes available.
MD&A | Key Market Economic Indicators | ||
Fannie Mae 2023 Form 10-K | 54 |
How Home Prices Can Affect Our Financial Results
•Actual and forecasted home prices impact our provision or benefit for credit losses as well as the growth and
size of our guaranty book of business.
•Changes in home prices affect the amount of equity that borrowers have in their homes. Borrowers with less
equity typically have higher delinquency and default rates, particularly in times of economic stress.
•As home prices increase, the severity of losses we incur on defaulted loans that we hold or guarantee
decreases because the amount we can recover from the properties securing the loans increases. Declines in
home prices may increase the losses we incur on defaulted loans.
•As home prices rise, the principal balance of loans associated with newly acquired purchase loans may
increase, causing growth in the size of our guaranty book. Additionally, rising home prices can increase the
amount of equity borrowers have in their home, which may lead to an increase in origination volumes for cash-
out refinance loans with higher principal balances than the existing loan. Replacing existing loans with newly
acquired cash-out refinances can affect the growth and size of our guaranty book.
•Home price growth on a national basis decreased from 7.9% in 2022 to 7.1% in 2023. We expect home price
growth of 3.2% on a national basis in 2024. We also expect regional variation in the timing and rate of home
price changes.
New Housing Starts(1)
(1)According to the U.S. Census Bureau and subject to revision.
How Housing Activity Can Affect Our Financial Results
•Housing is among the most interest-rate-sensitive sectors of the economy. In addition to interest rates, two key
aspects of economic activity that can impact supply and demand for housing, and thus our business and
financial results, are the rates of household formation and housing construction.
•Household formation is a key driver of demand for both single-family and multifamily housing as a newly formed
household will either rent or purchase a home. Thus, changes in the pace of household formation can affect
home prices, multifamily property values and credit performance as well as the degree of loss on defaulted
loans.
•Growth of household formation stimulates homebuilding. Homebuilding has typically been a cyclical leader,
weakening prior to a slowdown in U.S. economic activity and accelerating prior to a recovery, which contributes
to the growth of GDP and employment.
•A decline in housing starts results in fewer new homes being available for purchase and potentially a lower
volume of mortgage originations. Construction activity can also affect credit losses through its impact on home
prices. If the growth of demand exceeds the growth of supply, prices will appreciate and impact the risk profile
of newly acquired purchase loans, depending on where in the housing cycle the market is. A reduced pace of
MD&A | Key Market Economic Indicators | ||
Fannie Mae 2023 Form 10-K | 55 |
construction is often associated with a broader economic slowdown and may signal expected increases in
delinquency and losses on defaulted loans.
•Single-family new home construction, new home sales and existing home sales declined in 2023 due to rising
interest rates for most of the year. In 2024, we expect increases in new home sales and existing home sales,
given our expectation of lower mortgage rates.
GDP, Unemployment Rate and Personal Consumption
(1)Real GDP growth (decline) and personal consumption growth (decline) are based on the quarterly series calculated by the Bureau of
Economic Analysis and are subject to revision.
(2)According to the U.S. Bureau of Labor Statistics and subject to revision.
How GDP, the Unemployment Rate and Personal Consumption Can Affect Our
Financial Results
•Changes in GDP, the unemployment rate and personal consumption can affect several mortgage market
factors, including the demand for both single-family and multifamily housing and the level of loan delinquencies,
which impacts credit losses.
•Economic growth is a key factor for the performance of mortgage-related assets. In a growing economy,
employment and income are typically rising, thus allowing borrowers to meet payment requirements, existing
homeowners to consider purchasing and moving to another home, and renters to consider becoming
homeowners. Homebuilding typically increases to meet the rise in demand. Mortgage delinquencies typically
fall in an expanding economy, thereby decreasing credit losses.
•In a slowing economy, income growth and housing activity typically slow as an early indicator of reduced
economic activity, followed by slowing employment. Typically, as an economic slowdown intensifies,
households reduce their spending. This reduction in consumption then accelerates the slowdown. An economic
slowdown can lead to employment losses, impairing the ability of borrowers and renters to meet mortgage and
rental payments, thus causing loan delinquencies to rise.
•GDP increased in 2023. We expect GDP will continue to grow in 2024, but at a slower pace than in 2023. The
unemployment rate remained relatively flat in 2023, and we expect a slight increase in the unemployment rate
for 2024. We expect our economic outlook will be influenced by a number of factors that are subject to change,
such as the persistence of inflationary pressures, changes in monetary policy and the risk of financial market
disruptions.
See “Risk Factors—Credit Risk” and “Risk Factors—Market and Industry Risk” for further discussion of risks to our
business and financial results associated with interest rates, home prices, housing activity, and economic conditions.
MD&A | Key Market Economic Indicators | ||
Fannie Mae 2023 Form 10-K | 56 |
Consolidated Results of Operations
This section discusses our consolidated results of operations and should be read together with our consolidated
financial statements and the accompanying notes.
Summary of Consolidated Results of Operations | ||||||||||||||
For the Year Ended December 31, | Variance | |||||||||||||
2023 | 2022 | 2021 | 2023 vs. 2022 | 2022 vs. 2021 | ||||||||||
(Dollars in millions) | ||||||||||||||
Net interest income | $28,773 | $29,423 | $29,587 | $(650) | $(164) | |||||||||
Fee and other income(1) | 275 | 312 | 361 | (37) | (49) | |||||||||
Net revenues | 29,048 | 29,735 | 29,948 | (687) | (213) | |||||||||
Investment gains (losses), net | (53) | (297) | 1,352 | 244 | (1,649) | |||||||||
Fair value gains, net | 1,304 | 1,284 | 155 | 20 | 1,129 | |||||||||
Administrative expenses | (3,604) | (3,329) | (3,065) | (275) | (264) | |||||||||
Benefit (provision) for credit losses | 1,670 | (6,277) | 5,130 | 7,947 | (11,407) | |||||||||
TCCA fees(2) | (3,431) | (3,369) | (3,071) | (62) | (298) | |||||||||
Credit enhancement expense(3) | (1,512) | (1,323) | (1,051) | (189) | (272) | |||||||||
Change in expected credit enhancement recoveries(4) | (193) | 727 | (194) | (920) | 921 | |||||||||
Other expenses, net(5) | (1,273) | (918) | (1,255) | (355) | 337 | |||||||||
Income before federal income taxes | 21,956 | 16,233 | 27,949 | 5,723 | (11,716) | |||||||||
Provision for federal income taxes | (4,548) | (3,310) | (5,773) | (1,238) | 2,463 | |||||||||
Net income | $17,408 | $12,923 | $22,176 | $4,485 | $(9,253) | |||||||||
Total comprehensive income | $17,405 | $12,920 | $22,098 | $4,485 | $(9,178) | |||||||||
(1)Single-family fee and other income consists primarily of compensation for engaging in structured transactions and providing other lender
services. Multifamily fee and other income consists of fees associated with certain Multifamily business activities such as credit
enhancements for tax-exempt multifamily housing revenue bonds.
(2)TCCA fees refers to the expense recognized as a result of the 10 basis point increase in guaranty fees on all single-family mortgages
delivered to us on or after April 1, 2012 pursuant to the Temporary Payroll Tax Cut Continuation Act of 2011 and as extended by the
Infrastructure Investment and Jobs Act, which we pay to Treasury.
(3)Consists of costs associated with our freestanding credit enhancements, which primarily include our CAS and CIRT programs, enterprise-
paid mortgage insurance (“EPMI”) and certain lender risk-sharing programs.
(4)Includes estimated changes in benefits, as well as any realized amounts, from our freestanding credit enhancements.
(5)Consists of debt extinguishment gains and losses, expenses associated with legal claims, foreclosed property income (expense), gains
and losses from partnership investments, housing trust fund expenses, loan subservicing costs, and servicer fees paid in connection with
certain loss mitigation activities.
Net Interest Income
Overview
Our primary source of net interest income is guaranty fees we receive for assuming the credit risk on mortgage loans
underlying Fannie Mae MBS held by third parties. We recognize almost all of our guaranty fee revenue in net interest
income because, in our consolidated balance sheets, we consolidate the substantial majority of mortgage loans
underlying our Fannie Mae MBS. Guaranty fees from these mortgage loans account for the difference between the
interest income on mortgage loans in consolidated trusts and the interest expense on the debt of consolidated trusts.
We also earn interest income from our portfolios as described below. In addition, income or expense from hedge
accounting is a component of our net interest income.
Net Interest Income from Guaranty Book of Business
For single-family mortgage loans, there are two components of our guaranty fees:
•Base fees. These fees are ongoing fees that factor into a mortgage loan’s interest rate, which are collected
each month over the life of the mortgage loan.
•Upfront fees. These fees are one-time payments made by lenders upon loan delivery to us. Upfront fees
include risk-based fees, referred to as “loan-level price adjustments,” that vary by the attributes of the loan and
the borrower (such as loan size, LTV ratio, borrower credit score, etc.). Upfront fees also include payments we
make to and receive from lenders to adjust the monthly contractual guaranty fee rate on a Fannie Mae MBS.
MD&A | Consolidated Results of Operations |
Fannie Mae 2023 Form 10-K | 57 |
These fees are initially recorded as cost basis adjustments to the mortgage loan and are then amortized into
net interest income over the life of the loan.
For multifamily mortgage loans, base fees are the primary component of our guaranty fee.
In our components of net interest income table, we display net interest income from our guaranty book of business in
three categories:
•Base guaranty fee income, which primarily consists of ongoing monthly fees that are contractually due to us for
assuming credit risk and that we collect and recognize each month over the life of the mortgage loan, excluding
the portion of those fees related to the TCCA described below.
•Base guaranty fee income related to TCCA, which is the portion of the base fees we collect that are not
retained by us but paid to Treasury pursuant to the Temporary Payroll Tax Cut Continuation Act of 2011, as
amended.
•Deferred guaranty fee income, which primarily represents income from the upfront fees described above that
are amortized into net interest income. Deferred guaranty fee income also includes the amortization of cost
basis adjustments on our mortgage loans and debt of consolidated trusts that are not associated with upfront
fees. These basis adjustments consist of premiums and discounts that are established when we initially
recognize mortgage loans and debt of consolidated trusts in our consolidated balance sheets at fair value. We
amortize these basis adjustments over the contractual life of the associated financial instrument. In our prior
Form 10-K and Form 10-Q filings, we referred to “deferred guaranty fee income” as “amortization income.”
Other Sources of Net Interest Income
Net Interest Income from Portfolios
We also recognize net interest income on the difference between interest income earned on the assets in our retained
mortgage portfolio and our corporate liquidity portfolio (collectively, our “portfolios”) and the interest expense associated
with our funding debt. See “Retained Mortgage Portfolio” and “Liquidity and Capital Management—Liquidity
Management—Corporate Liquidity Portfolio” for more information about our portfolios.
Income (Expense) from Hedge Accounting
To reduce the impact of interest-rate volatility on our financial results, we apply fair value hedge accounting. As a result,
during the hedging period, we recognize fair value changes attributable to movements in benchmark interest rates for
mortgage loans, funding debt, and the related interest-rate swaps in the hedging relationships, as a component of net
interest income. We also recognize the amortization of hedge-related basis adjustments and any related interest accrual
on the swaps as a component of net interest income. See the “Income (expense) from hedge accounting” line item in
the table below for information on the impact of hedge accounting on our net interest income.
Components of Net Interest Income
The table below displays the components of our net interest income from our guaranty book of business, from our
portfolios, as well as from hedge accounting.
Components of Net Interest Income | ||||||||||
For the Year Ended December 31, | Variance | |||||||||
2023 | 2022 | 2021 | 2023 vs. 2022 | 2022 vs. 2021 | ||||||
(Dollars in millions) | ||||||||||
Net interest income from guaranty book of business: | ||||||||||
Base guaranty fee income(1) | $16,155 | $16,072 | $14,159 | $83 | $1,913 | |||||
Base guaranty fee income related to TCCA(2) | 3,431 | 3,369 | 3,071 | 62 | 298 | |||||
Net deferred guaranty fee income(3) | 4,003 | 7,099 | 11,243 | (3,096) | (4,144) | |||||
Total net interest income from guaranty book of business | 23,589 | 26,540 | 28,473 | (2,951) | (1,933) | |||||
Net interest income from portfolios(4) | 6,173 | 2,954 | 941 | 3,219 | 2,013 | |||||
Income (expense) from hedge accounting(5) | (989) | (71) | 173 | (918) | (244) | |||||
Total net interest income | $28,773 | $29,423 | $29,587 | $(650) | $(164) | |||||
(1)Excludes revenues generated by the 10 basis point guaranty fee increase we implemented pursuant to the TCCA, the incremental revenue
from which is paid to Treasury and not retained by us.
MD&A | Consolidated Results of Operations |
Fannie Mae 2023 Form 10-K | 58 |
(2)Represents revenues generated by the 10 basis point guaranty fee increase we implemented pursuant to the TCCA, the incremental
revenue from which is paid to Treasury and not retained by us.
(3)Excludes the amortization of cost basis adjustments resulting from hedge accounting, which is included in income (expense) from hedge
accounting.
(4)Includes interest income from assets held in our retained mortgage portfolio and our corporate liquidity portfolio, as well as other assets
used to support lender liquidity. Also includes interest expense on our funding debt, including outstanding Connecticut Avenue Securities
debt.
(5)For more information about our hedge accounting program, see “Note 1, Summary of Significant Accounting Policies” and “Note 9,
Derivative Instruments.”
Net interest income decreased slightly in 2023 compared with 2022, primarily as a result of lower deferred guaranty fee
income and higher expense from hedge accounting largely offset by higher income from portfolios.
•Lower deferred guaranty fee income. Throughout most of 2023, we were in a higher interest-rate environment
and observed significantly lower volumes of refinancing activity compared with 2022. As a result, we had lower
deferred guaranty fee income in 2023 compared with 2022. For a description of how fewer mortgage loan
prepayments results typically in lower deferred guaranty fee income, refer to “Key Market Economic Indicators
—How Interest Rates Can Affect Our Financial Results—Net Interest Income.”
•Higher income from portfolios. Higher income from portfolios in 2023 compared with 2022 was primarily driven
by generally higher interest rates in 2023 than in 2022 on securities in our corporate liquidity portfolio, primarily
U.S. Treasuries and securities purchased under agreements to resell. This was partially offset by higher
interest expense on funding debt, also as a result of higher interest rates. See “Liquidity and Capital
Management—Liquidity Management—Corporate Liquidity Portfolio” for more information about our corporate
liquidity portfolio.
•Higher expenses from hedge accounting. Hedge accounting expenses increased in 2023 compared to 2022
due to higher amortization of fair value hedge-related basis adjustments. This was coupled with an increase in
interest expenses on derivatives in hedging relationships as a result of rising interest rates in the first three
quarters of 2023.
Net interest income remained relatively flat in 2022 compared with 2021. The primary offsetting drivers of net interest
income were lower deferred guaranty fee income offset by higher income from portfolios and higher base guaranty fee
income.
•Lower deferred guaranty fee income. Lower deferred guaranty fee income was driven by a higher interest rate
environment in 2022, which slowed refinancing activity driving lower prepayment volumes compared with 2021.
•Higher income from portfolios. Higher income from portfolios in 2022 compared with 2021 was primarily driven
by higher yields on assets in our corporate liquidity portfolio as a result of increases in interest rates, as well as
a decrease in interest expense on our long-term funding debt due to a decrease in the average outstanding
balance compared with 2021.
•Higher base guaranty fee income. An increase in the size of our guaranty book of business combined with
higher average charged guaranty fees were the primary drivers of the increase in base guaranty fee income in
2022 compared with 2021.
Analysis of Unamortized Deferred Guaranty Fees
The chart below presents guaranty fees that will be amortized into “deferred guaranty fee income” in future periods,
which we refer to as “unamortized deferred guaranty fees.” Deferred guaranty fees primarily result from the upfront fees
that we receive at the time of mortgage loan acquisition related to single-family loan-level price adjustments or other
fees we receive from lenders, which are recorded as cost basis adjustments to the mortgage loan. Deferred guaranty
fees also include cost basis adjustments on our mortgage loans and debt of consolidated trusts that are not associated
with upfront fees. We amortize these cost basis adjustments as deferred guaranty fee income over the remaining
contractual life of the mortgage loans or debt. As discussed in “Key Market Economic Indicators,” the timing of when we
recognize deferred guaranty fee income depends on the life of the mortgage loan, which, for single-family in particular,
is sensitive to changes in mortgage interest rates as those changes impact the borrowers’ incentive to refinance. In our
prior Form 10-K and Form 10-Q filings, we referred to “unamortized deferred guaranty fees” as “deferred amortization
income.”
MD&A | Consolidated Results of Operations |
Fannie Mae 2023 Form 10-K | 59 |
As shown in the chart below, nearly all of our single-family conventional guaranty book of business as of December 31,
2023 had an interest rate lower than the average 30-year fixed-rate mortgage rate. Per Freddie Mac’s Primary Mortgage
Market Survey®, as of December 28, 2023, the U.S. weekly average interest rate for a single-family 30-year fixed-rate
mortgage was 6.61%. Accordingly, even if interest rates decline meaningfully, most of the borrowers whose mortgage
loans are in our single-family conventional guaranty book of business still would not be incentivized to refinance.
Interest Rates of Single-Family Conventional Guaranty Book of Business Compared with Average 30-Year Fixed- Rate Mortgage Rate | Unamortized Deferred Guaranty Fees(1) |
As of December 31, 2023 | (Dollars in billions) |
— | Represents the average 30-year fixed-rate mortgage rate as of December 28, 2023, according to Freddie Mac’s Primary Mortgage Market Survey®, the last published rate for the year ending December 31, 2023. | (1) | Represents the net unamortized cost basis adjustments (consisting of premiums and discounts on mortgage loans and debt of consolidated trusts) that will be recognized through deferred guaranty fee income over the remaining contractual life of the mortgage loans or debt. Although we are in a net premium position for both mortgage loans and debt of consolidated trusts, we have a greater amount of premiums with respect to debt of consolidated trusts. Primarily as a result of the upfront fees we charge, the net amortization of these cost basis adjustments will result in income. Includes cost basis adjustments on both single- family and multifamily mortgage loans and debt of consolidated trusts. | ||
— | Represents the percentage of single-family conventional guaranty book of business by select interest rate band based on the current interest rate of the mortgage loans. |
The amount of deferred income we record can vary and is primarily impacted by: (1) the amount of upfront fees we
charge on single-family mortgage loans, and (2) changes in interest rates, which affect the premiums and discounts we
record on newly acquired mortgage loans and newly created debt of consolidated trusts. The balance of our
unamortized deferred guaranty fees decreased as of 2023, compared with 2022, primarily as a result of the amortization
of existing premiums on debt of consolidated trusts. In addition, increasing interest rates throughout most of 2023
resulted in newly added debt that is in a net discount position, which further contributed to the decrease.
MD&A | Consolidated Results of Operations |
Fannie Mae 2023 Form 10-K | 60 |
Analysis of Net Interest Income
The table below displays an analysis of our net interest income, average balances and related yields earned on assets
and incurred on liabilities. For most components of the average balances, we use a daily weighted average of unpaid
principal balance net of unamortized cost basis adjustments. When daily average balance information is not available,
such as for mortgage loans, we use monthly averages.
Analysis of Net Interest Income and Yield(1) | ||||||||||||||||||
For the Year Ended December 31, | ||||||||||||||||||
2023 | 2022 | 2021 | ||||||||||||||||
Average Balance | Interest Income/ (Expense) | Average Rates Earned/ Paid | Average Balance | Interest Income/ (Expense) | Average Rates Earned/ Paid | Average Balance | Interest Income/ (Expense) | Average Rates Earned/ Paid | ||||||||||
(Dollars in millions) | ||||||||||||||||||
Interest-earning assets: | ||||||||||||||||||
Mortgage loans of Fannie Mae | $52,074 | $2,438 | 4.68% | $60,587 | $2,835 | 4.68% | $89,603 | $2,953 | 3.30% | |||||||||
Mortgage loans of consolidated trusts | 4,082,569 | 130,796 | 3.20 | 4,019,332 | 114,978 | 2.86 | 3,746,113 | 95,977 | 2.56 | |||||||||
Total mortgage loans(2) | 4,134,643 | 133,234 | 3.22 | 4,079,919 | 117,813 | 2.89 | 3,835,716 | 98,930 | 2.58 | |||||||||
Investments in securities(3) | 112,446 | 4,158 | 3.70 | 128,245 | 1,828 | 1.41 | 168,702 | 582 | 0.34 | |||||||||
Securities purchased under agreements to resell | 40,992 | 2,120 | 5.17 | 25,374 | 524 | 2.04 | 46,165 | 21 | 0.04 | |||||||||
Advances to lenders | 3,137 | 202 | 6.44 | 5,170 | 132 | 2.52 | 9,086 | 142 | 1.54 | |||||||||
Total interest-earning assets | $4,291,218 | $139,714 | 3.25% | $4,238,708 | $120,297 | 2.84% | $4,059,669 | $99,675 | 2.46% | |||||||||
Interest-bearing liabilities: | ||||||||||||||||||
Short-term funding debt | $13,440 | $(672) | 5.00 | $4,429 | $(76) | 1.69 | $5,748 | $(4) | 0.07 | |||||||||
Long-term funding debt | 113,958 | (3,624) | 3.18 | 139,098 | (2,481) | 1.78 | 231,344 | (2,707) | 1.17 | |||||||||
CAS debt | 4,021 | (415) | 10.32 | 8,658 | (511) | 5.90 | 13,896 | (581) | 4.18 | |||||||||
Total debt of Fannie Mae | 131,419 | (4,711) | 3.58 | 152,185 | (3,068) | 2.02 | 250,988 | (3,292) | 1.31 | |||||||||
Debt securities of consolidated trusts held by third parties | 4,083,997 | (106,230) | 2.60 | 4,030,467 | (87,806) | 2.18 | 3,778,755 | (66,796) | 1.77 | |||||||||
Total interest-bearing liabilities | $4,215,416 | $(110,941) | 2.63% | $4,182,652 | $(90,874) | 2.17% | $4,029,743 | $(70,088) | 1.74% | |||||||||
Net interest income/net interest yield | $28,773 | 0.67% | $29,423 | 0.69% | $29,587 | 0.73% | ||||||||||||
(1)Includes the effects of discounts, premiums and other cost basis adjustments, including basis adjustments related to hedge accounting.
(2)Average balance includes mortgage loans on nonaccrual status. Interest income includes loan fees of $2.8 billion, $5.1 billion and $10.1
billion for the years ended 2023, 2022 and 2021, respectively. Loan fees primarily consist of yield maintenance revenue we recognized on
the prepayment of multifamily mortgage loans and the amortization of upfront cash fees exchanged when we acquire the mortgage loan.
(3)Consists of cash, cash equivalents, U.S. Treasury securities and mortgage-related securities.
MD&A | Consolidated Results of Operations |
Fannie Mae 2023 Form 10-K | 61 |
The table below displays the change in our net interest income between periods and the extent to which that variance is
attributable to: (1) changes in the volume of our interest-earning assets and interest-bearing liabilities or (2) changes in
the interest rates of these assets and liabilities.
Rate/Volume Analysis of Changes in Net Interest Income | ||||||||||||
2023 vs. 2022 | 2022 vs. 2021 | |||||||||||
Total Variance | Variance Due to:(1) | Total Variance | Variance Due to:(1) | |||||||||
Volume | Rate | Volume | Rate | |||||||||
(Dollars in millions) | ||||||||||||
Interest income: | ||||||||||||
Mortgage loans of Fannie Mae | $(397) | $(398) | $1 | $(118) | $(1,131) | $1,013 | ||||||
Mortgage loans of consolidated trusts | 15,818 | 1,834 | 13,984 | 19,001 | 7,314 | 11,687 | ||||||
Total mortgage loans | 15,421 | 1,436 | 13,985 | 18,883 | 6,183 | 12,700 | ||||||
Investments in securities(2) | 2,330 | (251) | 2,581 | 1,246 | (170) | 1,416 | ||||||
Securities purchased under agreements to resell | 1,596 | 463 | 1,133 | 503 | (14) | 517 | ||||||
Advances to lenders | 70 | (68) | 138 | (10) | (77) | 67 | ||||||
Total interest income | 19,417 | 1,580 | 17,837 | 20,622 | 5,922 | 14,700 | ||||||
Interest expense: | ||||||||||||
Short-term funding debt | (596) | (307) | (289) | (72) | 1 | (73) | ||||||
Long-term funding debt | (1,143) | 514 | (1,657) | 226 | 1,324 | (1,098) | ||||||
CAS debt | 96 | 359 | (263) | 70 | 262 | (192) | ||||||
Total debt of Fannie Mae | (1,643) | 566 | (2,209) | 224 | 1,587 | (1,363) | ||||||
Debt securities of consolidated trusts held by third parties | (18,424) | (1,181) | (17,243) | (21,010) | (4,680) | (16,330) | ||||||
Total interest expense | (20,067) | (615) | (19,452) | (20,786) | (3,093) | (17,693) | ||||||
Net interest income | $(650) | $965 | $(1,615) | $(164) | $2,829 | $(2,993) | ||||||
(1)Combined rate/volume variances are allocated between rate and volume based on the relative size of each variance.
(2)Consists of cash, cash equivalents, U.S. Treasury securities and mortgage-related securities.
Fair Value Gains, Net
The estimated fair value of our derivatives, trading securities and other financial instruments carried at fair value may
fluctuate substantially from period to period because of changes in interest rates, the yield curve, mortgage and credit
spreads and implied volatility, as well as activity related to these financial instruments.
Fair value gains, net in 2023 were primarily driven by gains on trading securities, for the reasons described below. Also
see below for the other drivers of our net fair value gains in 2023.
MD&A | Consolidated Results of Operations |
Fannie Mae 2023 Form 10-K | 62 |
The table below displays the components of our fair value gains and losses.
Fair Value Gains, Net | ||||||
For the Year Ended December 31, | ||||||
2023 | 2022 | 2021 | ||||
(Dollars in millions) | ||||||
Risk management derivatives fair value gains attributable to: | ||||||
Net contractual interest income (expense) on interest-rate swaps(1) | $(1,444) | $(492) | $227 | |||
Net change in fair value during the period | 1,311 | (1,891) | (1,284) | |||
Impact of hedge accounting(2) | 481 | 2,763 | 1,242 | |||
Risk management derivatives fair value gains, net | 348 | 380 | 185 | |||
Mortgage commitment derivatives fair value gains, net | 120 | 2,708 | 551 | |||
Credit enhancement derivatives fair value gains (losses), net | 46 | (97) | (178) | |||
Total derivatives fair value gains, net | 514 | 2,991 | 558 | |||
Trading securities gains (losses), net | 1,006 | (3,504) | (1,060) | |||
Long-term debt fair value gains (losses), net | (308) | 2,265 | 631 | |||
Other, net(3) | 92 | (468) | 26 | |||
Fair value gains, net | $1,304 | $1,284 | $155 | |||
(1)Net contractual interest income (expense) on interest-rate swaps is primarily impacted by changes in interest rates and changes in the
composition of our interest-rate swaps portfolio.
(2)The “Impact of hedge accounting” reflected in this table shows the net gain or loss from swaps in hedging relationships plus any accrued
interest during the applicable periods that are recognized in “Net interest income.” For more information about our hedge accounting
program, see “Note 1, Summary of Significant Accounting Policies” and “Note 9, Derivative Instruments.”
(3)Consists primarily of fair value gains and losses on mortgage loans held at fair value.
Risk Management Derivatives Fair Value Gains, Net
Risk management derivative instruments are an integral part of our interest-rate risk management strategy. We
supplement our issuance of debt securities with derivative instruments to further reduce duration risk, which includes
prepayment risk. We purchase option-based risk management derivatives to economically hedge prepayment risk. In
cases where options obtained through callable debt issuances are not needed for risk management derivative
purposes, we may sell options in the over-the-counter (“OTC”) derivatives market in order to offset the options obtained
in the callable debt. Our principal purpose in using derivatives is to manage our aggregate interest-rate risk profile within
prescribed risk parameters. We generally use only derivatives that are relatively liquid and straightforward to value. We
consider the cost of derivatives used in our management of interest-rate risk to be an inherent part of the cost of funding
and hedging our mortgage investments and economically similar to the interest expense that we recognize on the debt
we issue to fund our mortgage investments.
We present, by derivative instrument type, the fair value gains and losses on our derivatives in “Note 9, Derivative
Instruments.” The primary factors that may affect the fair value of our risk management derivatives include the following:
•Changes in interest rates. Our primary derivative instruments are interest-rate swaps, including pay-fixed and
receive-fixed interest-rate swaps. Pay-fixed swaps decrease in value and receive-fixed swaps increase in value
as swap rates decrease (with the opposite being true when swap rates increase). Because the composition of
our pay-fixed and receive-fixed derivatives varies across the yield curve, different yield curve changes (that is,
parallel, steepening or flattening) will generate different gains and losses. Changes in the fair value of
derivatives in hedging relationships are recorded in “Net interest income.”
•Changes in our derivative activity. The mix and balance of our derivative portfolio changes from period to period
as we enter into or terminate derivative instruments to respond to changes in interest rates and changes in the
balances and modeled characteristics of our assets and liabilities. Changes in the composition of our derivative
portfolio affect the derivative fair value gains and losses we recognize in a given period.
Additional factors that affect the fair value of our risk management derivatives include implied interest-rate volatility and
the time value of purchased or sold options.
We recognized net fair value gains on risk management derivatives in 2023 primarily as a result of increasing interest
rates in the first three quarters of 2023, partially offset by increased contractual interest expense on our interest-rate
swaps.
MD&A | Consolidated Results of Operations |
Fannie Mae 2023 Form 10-K | 63 |
We recognized net fair value gains on risk management derivatives in 2022 primarily as a result of increases in the fair
value of our pay-fixed interest-rate swaps, partially offset by decreases in the fair value of receive-fixed interest rate
swaps driven by increasing interest rates.
For additional information on our use of derivatives to manage interest-rate risk, see “Risk Management—Market Risk
Management, including Interest-Rate Risk Management—Interest-Rate Risk Management.”
Mortgage Commitment Derivatives Fair Value Gains, Net
We account for certain commitments to purchase or sell mortgage-related securities and to purchase single-family
mortgage loans as derivatives. For open mortgage commitment derivatives, we include changes in their fair value in our
consolidated statements of operations and comprehensive income. When derivative purchase commitments settle, we
include the fair value of the commitment on the settlement date in the cost basis of the loan or security we purchase.
When derivative commitments to sell securities settle, we include the fair value of the commitment on the settlement
date in the cost basis of the security we sell. Purchases of securities issued by our consolidated MBS trusts are treated
as extinguishments of debt; we recognize the fair value of the commitment on the settlement date as a component of
debt extinguishment gains and losses in “Other expenses, net.” Sales of securities issued by our consolidated MBS
trusts are treated as issuances of consolidated debt; we recognize the fair value of the commitment on the settlement
date as a component of debt in the cost basis of the debt issued.
We recognized fair value gains on our mortgage commitments in 2023 primarily due to rising interest rates in the first
three quarters of 2023. These gains were partially offset by fair value losses in the fourth quarter of 2023 due to
decreasing interest rates and tightening of the secondary spread, which is the spread between the 30-year MBS current
coupon yield and 10-year U.S. Treasury rate.
We recognized fair value gains on our mortgage commitments in 2022 primarily due to gains on commitments to sell
mortgage-related securities as prices decreased during the commitment period due to rising interest rates and widening
of the secondary spread.
Trading Securities Gains (Losses), Net
We measure trading securities at fair value in our consolidated balance sheets with subsequent changes in fair value
recorded as “Fair value gains, net” in our consolidated statements of operations and comprehensive income. The
changes in the fair value of our trading securities are included in “Trading securities gains (losses), net” in the table
above.
Gains on trading securities in 2023 were primarily driven by the decrease in U.S. Treasury yields in the fourth quarter of
2023, which resulted in a net gain on our fixed-rate securities held in our corporate liquidity portfolio.
Losses on trading securities in 2022 were primarily driven by increases in U.S. Treasury yields, which resulted in losses
on fixed-rate securities held in our corporate liquidity portfolio.
Long-Term Debt Fair Value Gains (Losses), Net
We generally elect the fair value option for our long-term debt when the accounting guidance would otherwise require us
to separate a derivative from the debt contract and record that derivative at fair value. The changes in the fair value of
our long-term debt held at fair value are included in “Long-term debt fair value gains (losses), net” in the table above.
Losses on long-term debt held at fair value in 2023 were due to an increase in the fair value of long-term debt of
consolidated trusts held at fair value, driven by decreasing interest rates and tightening of the secondary spread during
the fourth quarter of 2023.
We recognized fair value gains in 2022 due to decreases in the fair value of long-term debt of consolidated trusts held at
fair value driven by rising interest rates and widening of the secondary spread.
Benefit (Provision) for Credit Losses
Our benefit or provision for credit losses can vary substantially from period to period based on a number of factors, such
as changes in actual and forecasted home prices or multifamily property valuations, fluctuations in actual and
forecasted interest rates, the credit risk profile of our new acquisitions, borrower payment behavior, events such as
natural disasters or pandemics, the types, volume and effectiveness of our loss mitigation activities, including
forbearances and loan modifications, the volume of foreclosures completed and the volume and pricing of loans
redesignated from held for investment (“HFI”) to HFS. The benefit or provision for credit losses includes our benefit or
provision for loan losses, accrued interest receivable losses, our guaranty loss reserves and credit losses on our AFS
debt securities.
MD&A | Consolidated Results of Operations |
Fannie Mae 2023 Form 10-K | 64 |
Our benefit or provision for credit losses and our related loss reserves can also be impacted by updates to the models,
assumptions and data used in determining our allowance for loan losses. Although we believe the estimates underlying
our allowance as of December 31, 2023 are reasonable, they are subject to uncertainty. Changes in future economic
conditions and loan performance from our current expectations may result in volatility in our allowance for loan losses
and, as a result, our benefit or provision for credit losses. See “Critical Accounting Estimates” for additional information
about how our estimate of credit losses is subject to uncertainty. See “Risk Factors—Credit Risk” for a discussion of
factors that could result in significant provisions for credit losses on the loans in our book of business.
The table below provides a quantitative analysis of the drivers of our single-family and multifamily benefit or provision for
credit losses and the change in expected credit enhancement recoveries. Many of the drivers that contribute to our
benefit or provision for credit losses overlap or are interdependent. The components shown below are based on internal
allocation estimates.
Components of Benefit (Provision) for Credit Losses and Change in Expected Credit Enhancement Recoveries | ||||||
For the Year Ended December 31, | ||||||
2023 | 2022 | 2021 | ||||
(Dollars in millions) | ||||||
Single-family benefit (provision) for credit losses: | ||||||
Changes in loan activity(1)(2) | $(1,348) | $(1,347) | $201 | |||
Redesignation of loans from HFI to HFS | (616) | (306) | 1,233 | |||
Actual and forecasted home prices | 4,350 | (2,867) | 3,026 | |||
Actual and projected interest rates | 66 | (1,072) | (639) | |||
Release of economic concessions(3) | 77 | 793 | — | |||
Changes in assumptions regarding COVID-19 forbearance and loan delinquencies(2) | — | — | 713 | |||
Other(4) | (364) | (230) | 64 | |||
Single-family benefit (provision) for credit losses | 2,165 | (5,029) | 4,598 | |||
Multifamily benefit (provision) for credit losses: | ||||||
Changes in loan activity(1)(2) | (310) | (150) | (202) | |||
Actual and projected interest rates | 12 | (279) | 9 | |||
Actual and projected economic data(5) | (258) | 105 | 571 | |||
Estimated impact of the COVID-19 pandemic(2) | — | — | 119 | |||
Other(4) | 61 | (924) | 33 | |||
Multifamily benefit (provision) for credit losses | (495) | (1,248) | 530 | |||
Total benefit (provision) for credit losses(6) | $1,670 | $(6,277) | $5,128 | |||
Change in expected credit enhancement recoveries:(7) | ||||||
Single-family | $(310) | $470 | $(86) | |||
Multifamily | 117 | 257 | (108) | |||
Change in expected credit enhancement recoveries | $(193) | $727 | $(194) | |||
(1)Primarily consists of loan acquisitions, liquidations, changes in loan delinquencies and write-offs of amounts determined to be uncollectible.
For multifamily, “Changes in loan activity” also includes changes in the allowance due to loan delinquencies and the impact of changes in
debt service coverage ratios (“DSCRs”) based on updated property financial information, which is used to assess loan credit quality.
(2)Beginning January 1, 2022, changes in assumptions regarding COVID-19 forbearance and loan delinquencies are included in “Changes in
loan activity.”
(3)Represents the benefit from the release of economic concessions related to loans previously designated as troubled debt restructurings
(“TDRs”) that received loss mitigation arrangements during the period.
(4)Includes provision for allowance on accrued interest receivable and impacts of model enhancements. For single-family, also includes any
benefit or provision for our guaranty loss reserves that are not separately included in the other components.
(5)Primarily consists of changes attributed to projected property net operating income, actual and projected property values, and labor market
forecasts.
(6)For purposes of this attribution table, credit losses on AFS securities are excluded.
MD&A | Consolidated Results of Operations |
Fannie Mae 2023 Form 10-K | 65 |
(7)Beginning December 31, 2023, changes in benefits we expect to receive on inactive loans are included in “Change in expected credit
enhancement recoveries.” Prior periods have been updated in this report to conform to the current period presentation.
Single-Family Benefit (Provision) for Credit Losses
Our single-family benefit for credit losses in 2023 was primarily driven by a benefit from actual and forecasted home
price growth, partially offset by a provision from changes in loan activity and a provision relating to the redesignation of
loans from HFI to HFS, as described below:
•Benefit from actual and forecasted home price growth. During 2023, we observed stronger than expected
actual and forecasted home price appreciation. Higher home prices decrease the likelihood that loans will
default and reduce the amount of losses on loans that do default, which impacts our estimate of losses and
ultimately reduces our loss reserves and provision for credit losses. See “Key Market Economic Indicators” for
additional information about how home prices affect our credit loss estimates, including a discussion of home
price growth and our home price forecast. Also see “Critical Accounting Estimates” for more information about
our home price forecast.
•Provision from changes in loan activity, which includes provision on newly acquired loans. This was primarily
driven by the credit risk profile of our 2023 single-family acquisitions, which had a higher proportion of purchase
loans compared with our 2022 single-family acquisitions. Purchase loans generally have higher origination LTV
ratios than refinance loans. This factor drove a higher estimated risk of default and loss severity in the
allowance and therefore a higher credit loss provision for those loans at the time of acquisition.
•Provision from redesignation of loans from HFI to HFS. In 2023 we redesignated certain nonperforming and
reperforming single-family loans from HFI to HFS, as we no longer intended to hold them for the foreseeable
future or to maturity. Upon redesignation, these loans had an amortized cost of $3.3 billion with a related
allowance of $42 million. Since interest rates on the loans were below current market interest rates, their
carrying value exceeded their fair value at the time of redesignation, which resulted in a write-off against the
allowance of $658 million, with a net impact of $616 million in additional provision for credit losses.
The primary factors that contributed to our single-family provision for credit losses in 2022 were:
•Net provision from actual and forecasted home prices. Provision from home price changes was primarily driven
by our home price forecast, which estimated home price declines in 2023 and 2024. Lower forecasted home
prices increase the likelihood that loans will default and increase the amount of credit loss on loans that do
default, which increases our estimate of loss reserves and provision for credit losses.
•Provision from changes in loan activity, which includes provision on newly acquired loans. The portion of our
single-family acquisitions consisting of purchase loans increased in 2022 compared with 2021. In addition, in
2022, our credit loss provision also increased as our more negative home price forecast increased our estimate
of losses on newly acquired loans.
•Provision from higher actual and projected interest rates. As mortgage rates increased, we expected a
decrease in future prepayments on single-family loans, including modified loans accounted for as TDRs. Lower
expected prepayments extended the expected lives of these loans resulting in an increase in expected losses.
For TDR loans, longer expected lives also increased the expected impairment relating to economic
concessions provided on them, resulting in a provision for credit losses.
Multifamily Benefit (Provision) for Credit Losses
The primary factors that contributed to our multifamily provision for credit losses in 2023 were:
•Provision from changes in loan activity. This was primarily driven by new acquisitions resulting in book growth,
as well as increased delinquencies and declining DSCRs on the multifamily guaranty book, particularly in
instances where the DSCR declined to at or below a 1.0x coverage ratio.
•Provision from actual and projected economic data. Multifamily property values decreased throughout 2023,
which resulted in higher estimated LTV ratios on the loans in our multifamily guaranty book of business,
resulting in a provision for credit losses.
Our seniors housing loans were not a driver of our multifamily provision for credit losses in 2023, as our estimate of
losses related to these loans has decreased slightly since year-end 2022 as a result of loss mitigation activities
performed on this portfolio in 2023 and some recovery in property financials. However, our allowance for seniors
housing loans remained elevated as of December 31, 2023. These properties continue to be stressed from the effects of
the COVID-19 pandemic and ongoing economic trends and have not recovered to pre-pandemic levels.
MD&A | Consolidated Results of Operations |
Fannie Mae 2023 Form 10-K | 66 |
See “Multifamily Business—Multifamily Mortgage Credit Risk Management—Multifamily Portfolio Monitoring” for a
discussion of risks within specific property types that we are monitoring, including a discussion of seniors housing loans.
The primary factors that contributed to our multifamily provision for credit losses in 2022 were:
•Approximately $900 million in provision relating to our multifamily seniors housing portfolio, which is included in
“Other” in the table above. As of December 31, 2022, our estimate of credit losses reflected an increased
probability of default and greater expected severity of loss on our seniors housing portfolio. As of December 31,
2022, nearly all of the seniors housing loans in our guaranty book of business were current on their payments.
However, our seniors housing portfolio was disproportionately impacted by market conditions, which resulted in
higher expected losses on this portfolio.
Seniors housing was negatively impacted by elevated vacancy rates and higher operating costs, which were
exacerbated by inflation pressures. This reduced the net operating income on many seniors housing properties,
which in turn led to lower estimated property values. These factors, combined with increased costs associated
with adjustable-rate mortgages due to a sharp rise in short-term interest rates during the latter half of 2022, put
additional stress on our seniors housing portfolio and increased our estimate of credit losses on these loans. As
of December 31, 2022, our seniors housing portfolio had an unpaid principal balance of $16.6 billion, of which
39% were adjustable-rate mortgages.
•Provision for higher actual and projected interest rates. Rising interest rates may reduce the ability of
multifamily borrowers to refinance their loans, which often have balloon balances at maturity, increasing our
provision for credit losses. Additionally, rising interest rates increase the chance that multifamily borrowers with
adjustable-rate mortgages may default due to higher payments if the property net operating income is not
increasing at a similar pace.
Change in Expected Credit Enhancement Recoveries
Change in expected credit enhancement recoveries consists of the change in benefits recognized from our freestanding
credit enhancements, including any realized amounts. Change in expected credit enhancement recoveries switched
from income in 2022 to expense in 2023 driven by the shift from a provision for credit losses in 2022 to a benefit for
credit losses in 2023 as our allowance for loan losses decreased, which drove a decrease in our expected recoveries.
Other Expenses, Net
Other expenses, net consists of debt extinguishment gains and losses, expenses associated with legal claims,
foreclosed property income (expense), gains and losses from partnership investments, housing trust fund expenses,
loan subservicing costs, and servicer fees paid in connection with certain loss mitigation activities. The increase in other
expenses, net in 2023 was primarily due to $495 million of expense attributable to a jury verdict and an award of
prejudgment interest for Fannie Mae preferred shareholders in two cases consolidated for trial in the U.S. District Court
for the District of Columbia. See “Note 17, Commitments and Contingencies—Senior Preferred Stock Purchase
Agreements Litigation” for additional information on our senior preferred stock agreements litigation.
MD&A | Consolidated Results of Operations |
Fannie Mae 2023 Form 10-K | 67 |
Consolidated Balance Sheet Analysis
This section discusses our consolidated balance sheets and should be read together with our consolidated financial
statements and the accompanying notes.
Summary of Consolidated Balance Sheets | ||||||||
As of December 31, | ||||||||
2023 | 2022 | Variance | ||||||
(Dollars in millions) | ||||||||
Assets | ||||||||
Cash and cash equivalents and securities purchased under agreements to resell | $66,517 | $72,552 | $(6,035) | |||||
Restricted cash and cash equivalents | 32,889 | 29,854 | 3,035 | |||||
Investments in securities, at fair value | 53,116 | 50,825 | 2,291 | |||||
Mortgage loans: | ||||||||
Of Fannie Mae | 50,325 | 54,085 | (3,760) | |||||
Of consolidated trusts | 4,094,036 | 4,071,698 | 22,338 | |||||
Allowance for loan losses | (8,730) | (11,347) | 2,617 | |||||
Mortgage loans, net of allowance for loan losses | 4,135,631 | 4,114,436 | 21,195 | |||||
Deferred tax assets, net | 11,681 | 12,911 | (1,230) | |||||
Other assets | 25,603 | 24,710 | 893 | |||||
Total assets | $4,325,437 | $4,305,288 | $20,149 | |||||
Liabilities and equity | ||||||||
Debt: | ||||||||
Of Fannie Mae | $124,065 | $134,168 | $(10,103) | |||||
Of consolidated trusts | 4,098,653 | 4,087,720 | 10,933 | |||||
Other liabilities | 25,037 | 23,123 | 1,914 | |||||
Total liabilities | 4,247,755 | 4,245,011 | 2,744 | |||||
Fannie Mae stockholders’ equity: | ||||||||
Senior preferred stock | 120,836 | 120,836 | — | |||||
Other net deficit | (43,154) | (60,559) | 17,405 | |||||
Total equity | 77,682 | 60,277 | 17,405 | |||||
Total liabilities and equity | $4,325,437 | $4,305,288 | $20,149 | |||||
Cash and Cash Equivalents and Securities Purchased under Agreements to Resell
Cash and cash equivalents and securities purchased under agreements to resell decreased from December 31, 2022 to
December 31, 2023, primarily driven by redemption of corporate debt outpacing issuances, partially offset by proceeds
from the sale of securities and loans, and the continued accumulation of earnings retained from our operations. For
further discussion, see “Liquidity and Capital Management—Liquidity Management.”
Mortgage Loans, Net of Allowance
The mortgage loans reported in our consolidated balance sheets are classified as either HFS or HFI and include loans
owned by Fannie Mae and loans held in consolidated trusts.
Mortgage loans, net of allowance for loan losses increased from December 31, 2022 to December 31, 2023, driven
primarily by loan acquisitions outpacing liquidations and sales during 2023, as well as a decline in our allowance for
loan losses.
Debt
Debt of consolidated trusts represents the amount of Fannie Mae MBS issued from consolidated trusts and held by
third-party certificateholders. Debt of Fannie Mae also includes CAS debt, which we issued in connection with our
transfer of mortgage credit risk.
The decrease in debt of Fannie Mae from December 31, 2022 to December 31, 2023 was primarily due to the maturity
of long-term debt, which outpaced new issuances as our funding needs remained low. The increase in debt of
consolidated trusts from December 31, 2022 to December 31, 2023 was primarily driven by sales of Fannie Mae MBS,
which are accounted for as issuances of debt of consolidated trusts in our consolidated balance sheets, since the MBS
MD&A | Consolidated Balance Sheet Analysis | ||
Fannie Mae 2023 Form 10-K | 68 |
certificate ownership is transferred from us to a third party. See “Liquidity and Capital Management—Liquidity
Management—Debt Funding” for a summary of activity in debt of Fannie Mae and a comparison of the mix between our
outstanding short-term and long-term debt. Also see “Note 8, Short-Term and Long-Term Debt” for additional information
on our total outstanding debt.
Stockholders’ Equity
Our stockholders’ equity (also referred to as our net worth) increased to $77.7 billion as of December 31, 2023,
compared with $60.3 billion as of December 31, 2022, due to the $17.4 billion in comprehensive income recognized
during 2023.
The aggregate liquidation preference of the senior preferred stock increased to $195.2 billion as of December 31, 2023
from $180.3 billion as of December 31, 2022. The aggregate liquidation preference of the senior preferred stock will
further increase to $199.2 billion as of March 31, 2024, due to the $4.0 billion increase in our net worth in the fourth
quarter of 2023. For more information about how this liquidation preference is determined, see “Business—
Conservatorship and Treasury Agreements—Treasury Agreements—Senior Preferred Stock Purchase Agreement and
Senior Preferred Stock.”
Retained Mortgage Portfolio
We use our retained mortgage portfolio primarily to provide liquidity to the mortgage market through portfolio
securitization transactions and to support our loss mitigation activities.
Our retained mortgage portfolio consists of mortgage loans and mortgage-related securities that we own, including
Fannie Mae MBS and non-Fannie Mae mortgage-related securities. Assets held by consolidated MBS trusts that back
mortgage-related securities owned by third parties are not included in our retained mortgage portfolio.
We separate the instruments within our retained mortgage portfolio into three categories based on each instrument’s
use:
•Lender liquidity, which includes balances related to our portfolio securitization activity, supports our efforts to
provide liquidity to the single-family and multifamily mortgage markets.
•Loss mitigation supports our loss mitigation efforts through the purchase of delinquent loans from our MBS
trusts.
•Other represents assets that were previously purchased for investment purposes.
MD&A | Consolidated Balance Sheet Analysis | ||
Fannie Mae 2023 Form 10-K | 69 |
The table below displays the components of our retained mortgage portfolio. Based on the nature of the asset, these
balances are included in either “Investments in securities, at fair value” or “Mortgage loans, net of allowance for loan
losses” in our “Summary of Consolidated Balance Sheets” table above.
The increase in our retained mortgage portfolio as of December 31, 2023 compared with December 31, 2022 was
primarily due to an increase in our lender liquidity portfolio driven by higher holdings in agency securities. This was
partially offset by the continued decline in loans and securities in the other category primarily due to liquidations and
paydowns.
Retained Mortgage Portfolio | |||||
As of December 31, | |||||
2023 | 2022 | ||||
(Dollars in millions) | |||||
Lender liquidity: | |||||
Agency securities(1) | $27,823 | $16,410 | |||
Mortgage loans | 7,101 | 7,329 | |||
Total lender liquidity | 34,924 | 23,739 | |||
Loss mitigation mortgage loans(2) | 38,634 | 38,458 | |||
Other: | |||||
Reverse mortgage loans and securities(3) | 5,953 | 11,376 | |||
Other mortgage loans and securities(4) | 3,683 | 4,169 | |||
Total other | 9,636 | 15,545 | |||
Total retained mortgage portfolio | $83,194 | $77,742 | |||
Retained mortgage portfolio by segment: | |||||
Single-family mortgage loans and mortgage-related securities | $77,357 | $73,769 | |||
Multifamily mortgage loans and mortgage-related securities | $5,837 | $3,973 | |||
(1)Consists of Fannie Mae, Freddie Mac and Ginnie Mae mortgage-related securities, including Freddie Mac securities guaranteed by Fannie
Mae. Excludes Fannie Mae and Ginnie Mae reverse mortgage securities and Fannie Mae-wrapped private-label securities.
(2)Includes single-family loans on nonaccrual status of $8.1 billion and $7.1 billion as of December 31, 2023 and 2022, respectively. Also
includes multifamily loans on nonaccrual status of $2.0 billion and $243 million as of December 31, 2023 and 2022, respectively.
(3)Includes Fannie Mae and Ginnie Mae reverse mortgage securities. We stopped acquiring newly originated reverse mortgage loans in
2010.
(4)Other mortgage loans primarily include multifamily loans on accrual status and single-family loans that are not included in the loss
mitigation or lender liquidity categories. Other mortgage securities primarily include private-label securities and mortgage revenue bonds.
The amount of mortgage assets that we may own is capped at $225 billion under the terms of our senior preferred stock
purchase agreement with Treasury. In addition, we are currently required to cap our mortgage assets at $202.5 billion
per instructions from FHFA.
We include 10% of the notional value of the interest-only securities we hold in calculating the size of the retained
mortgage portfolio for the purpose of determining compliance with the senior preferred stock purchase agreement
mortgage assets cap and associated FHFA instructions. As of December 31, 2023, 10% of the notional value of our
interest-only securities was $1.6 billion, which is not included in the table above.
Under the terms of our MBS trust documents, we have the option or, in some instances, the obligation, to purchase
mortgage loans that meet specific criteria from an MBS trust. The purchase price for these loans is the unpaid principal
balance of the loan plus accrued interest. If a delinquent loan remains in a single-family MBS trust, the servicer is
responsible for advancing the borrower’s missed scheduled principal and interest payments to the MBS holders for up
to four months, after which time we must make these missed payments. In addition, we must reimburse servicers for
advanced principal and interest payments.
In support of our loss mitigation strategies, we purchased $9.5 billion of loans from our single-family MBS trusts during
2023, the substantial majority of which were delinquent, compared with $16.4 billion of loans purchased from single-
family MBS trusts during 2022. The amount of loans we bought out of trusts decreased in 2023 relative to the prior year
as loans exiting COVID-19-related forbearance drove a higher number of loan modifications in 2022.
MD&A | Retained Mortgage Portfolio |
Fannie Mae 2023 Form 10-K | 70 |
Guaranty Book of Business
Our “guaranty book of business” consists of:
•Fannie Mae MBS outstanding, excluding the portions of any structured securities we issue that are backed by
Freddie Mac securities;
•mortgage loans of Fannie Mae held in our retained mortgage portfolio; and
•other credit enhancements that we provide on mortgage assets.
“Total Fannie Mae guarantees” consists of:
•our guaranty book of business; and
•the portions of any structured securities we issue that are backed by Freddie Mac securities.
We and Freddie Mac issue single-family uniform mortgage-backed securities, or “UMBS.” We use the term “Fannie Mae
MBS” or “our MBS” to refer to any type of mortgage-backed security that we issue, including UMBS®, Supers®, Real
Estate Mortgage Investment Conduit securities (“REMICs”) and other types of single-family or multifamily mortgage-
backed securities.
Some Fannie Mae MBS that we issue are backed in whole or in part by Freddie Mac securities. When we resecuritize
Freddie Mac securities into Fannie Mae-issued structured securities, such as Supers and REMICs, our guaranty of
principal and interest extends to the underlying Freddie Mac securities. However, Freddie Mac continues to guarantee
the payment of principal and interest on the underlying Freddie Mac securities that we have resecuritized. Effective April
1, 2023, the upfront fee for commingled securities decreased from 50 basis points to 9.375 basis points on the portion of
the securities made up of Freddie Mac-issued collateral. References to our single-family guaranty book of business
exclude Freddie Mac-acquired mortgage loans underlying Freddie Mac securities that we have resecuritized.
Our issuance of structured securities backed in whole or in part by Freddie Mac securities creates additional off-balance
sheet exposure. Our guaranty extends to the underlying Freddie Mac security included in the structured security, but we
do not have control over the Freddie Mac mortgage loan securitizations. Because we do not have the power to direct
matters (primarily the servicing of mortgage loans) that impact the credit risk to which we are exposed, which constitute
control of these securitization trusts, we do not consolidate these trusts in our consolidated balance sheet, giving rise to
off-balance sheet exposure. See “Liquidity and Capital Management—Liquidity Management—Off-Balance Sheet
Arrangements” and “Note 7, Financial Guarantees” for information regarding our maximum exposure to loss on
unconsolidated Fannie Mae MBS and Freddie Mac securities.
The table below displays the composition of our guaranty book of business based on unpaid principal balance.
Composition of Fannie Mae Guaranty Book of Business | ||||||||||||
As of December 31, | ||||||||||||
2023 | 2022 | |||||||||||
Single- Family | Multifamily | Total | Single- Family | Multifamily | Total | |||||||
(Dollars in millions) | ||||||||||||
Conventional guaranty book of business(1) | $3,647,344 | $471,812 | $4,119,156 | $3,646,981 | $442,067 | $4,089,048 | ||||||
Government guaranty book of business(2) | 7,901 | 520 | 8,421 | 12,450 | 572 | 13,022 | ||||||
Guaranty book of business | 3,655,245 | 472,332 | 4,127,577 | 3,659,431 | 442,639 | 4,102,070 | ||||||
Freddie Mac securities guaranteed by Fannie Mae(3) | 215,605 | — | 215,605 | 234,023 | — | 234,023 | ||||||
Total Fannie Mae guarantees | $3,870,850 | $472,332 | $4,343,182 | $3,893,454 | $442,639 | $4,336,093 | ||||||
(1)Refers to mortgage loans and mortgage-related securities that are not guaranteed or insured, in whole or in part, by the U.S. government.
(2)Refers to mortgage loans and mortgage-related securities guaranteed or insured, in whole or in part, by the U.S. government.
(3)Consists of off-balance sheet arrangements of approximately (i) $179.6 billion and $193.9 billion in unpaid principal balance of Freddie
Mac-issued UMBS backing Fannie Mae-issued Supers as of December 31, 2023 and 2022, respectively; and (ii) $36.0 billion and $40.1
billion in unpaid principal balance of Freddie Mac securities backing Fannie Mae-issued REMICs as of December 31, 2023 and 2022,
respectively. See “Liquidity and Capital Management—Liquidity Management—Off-Balance Sheet Arrangements” for more information
regarding our maximum exposure to loss on consolidated Fannie Mae MBS and Freddie Mac securities.
The GSE Act requires us to set aside each year an amount equal to 4.2 basis points of the unpaid principal balance of
our new business purchases and to pay this amount to specified HUD and Treasury funds in support of affordable
housing. In March 2023, we paid $287 million to the funds based on our new business purchases in 2022. For 2023, we
recognized an expense of $155 million related to this obligation based on $369.2 billion in new business purchases
during the year. We expect to pay this amount to the funds in 2024.
MD&A | Guaranty Book of Business | ||
Fannie Mae 2023 Form 10-K | 71 |
Single-Family Business
Single-Family Primary Business Activities
Providing Liquidity for Single-Family Mortgage Loans
Working with lenders, our Single-Family business provides liquidity to the mortgage market primarily by acquiring single-
family loans from lenders and securitizing those loans into Fannie Mae MBS, which are either delivered to the lenders or
sold to investors or dealers. We describe our securitization transactions in “Business—Mortgage Securitizations.” Our
Single-Family business also supports liquidity in the mortgage market and the businesses of our lenders through other
activities, such as issuing structured Fannie Mae MBS backed by single-family mortgage assets and buying and selling
single-family agency mortgage-backed securities.
Our Single-Family business securitizes and purchases primarily conventional (not government-insured or government-
guaranteed) single-family fixed-rate or adjustable-rate, first-lien mortgage loans, or mortgage-related securities backed
by these types of loans. We also securitize or purchase loans insured by FHA, loans guaranteed by the VA, loans
guaranteed by the Rural Development Housing and Community Facilities Program of the U.S. Department of
Agriculture, manufactured housing mortgage loans and other mortgage-related securities.
Single-Family Mortgage Servicing
Our single-family mortgage loans are serviced by mortgage servicers on our behalf. Some loans are serviced by the
lenders that initially sold the loans to us. In other cases, loans are serviced by third-party servicers that did not originate
or sell the loans to us. For loans we own or guarantee, the lender or servicer must obtain our approval before selling
servicing rights to another servicer.
Our mortgage servicers typically collect and deliver principal and interest payments, administer escrow accounts,
monitor and report on loan performance, perform early delinquency intervention activities, evaluate transfers of
ownership interests, respond to requests for partial releases of security, and handle proceeds from casualty and
condemnation losses. Our mortgage servicers are the primary point of contact for borrowers and perform a key role in
the effective implementation of our servicing policies, negotiation of workouts for delinquent and troubled loans, and
other loss mitigation activities. If necessary, mortgage servicers inspect and preserve properties and process
foreclosures and bankruptcies. For information on the risks of our reliance on servicers, refer to “Risk Factors—Credit
Risk.”
We compensate servicers primarily by permitting them to retain a specified portion of each interest payment on a
serviced mortgage loan as a servicing fee. Servicers also generally retain assumption fees, late payment charges and
other similar charges, to the extent they are collected from borrowers, as additional servicing compensation. We also
compensate servicers for negotiating workouts on problem loans.
Our servicers are required to develop, follow and maintain written procedures relating to loan servicing and legal
compliance in accordance with our Servicing Guide. We oversee servicer compliance with our Servicing Guide
requirements and execution of our loss mitigation programs by conducting reviews of select servicers. These reviews
are designed to test a servicer’s quality control processes and compliance with our requirements across key servicing
functions. Issues identified through these Servicing Guide compliance reviews are provided to the servicer with
prescribed corrective actions and expected resolution due dates, and we monitor servicers’ remediation of their
compliance issues.
We employ a servicer performance management program, called the Servicer Total Achievement and RewardsTM
(STAR®) Program, which provides our largest servicers a transparent framework of key metrics and operational
assessments to recognize strong performance and identify areas of weakness. Performance management staff
measure, monitor and manage overall servicer performance by conducting regular servicer performance reviews in an
effort to promote optimal performance, mitigate risk and explore best practices or areas of opportunity to take action and
improve performance where necessary or appropriate.
Repercussions for poor performance by a servicer may include performance improvement plans, lost incentive income,
compensatory fees, monetary and non-monetary remedies, and reduced opportunity for STAR Program recognition. If
poor performance persists, servicing may ultimately be transferred to a different servicer.
Single-Family Credit Risk and Credit Loss Management
Our Single-Family business:
•Prices and manages the credit risk on loans in our single-family guaranty book of business through our loan
acquisition policies.
MD&A | Single-Family Business | Single-Family Primary Business Activities |
Fannie Mae 2023 Form 10-K | 72 |
•Enters into transactions that transfer a portion of the credit risk on some of the loans in our single-family
guaranty book of business through our credit risk transfer programs.
•Works to reduce costs of defaulted single-family loans, including through forbearance plans, home retention
solutions, foreclosure alternatives, management of foreclosures and our REO inventory, selling nonperforming
loans, and pursuing contractual remedies from lenders, servicers and providers of credit enhancement.
See “Single-Family Mortgage Credit Risk Management” below for discussion of our strategies for managing credit risk
and credit losses on single-family loans.
Single-Family Lenders and Investors
In support of our mission to facilitate equitable and sustainable access to homeownership and quality affordable rental
housing across America, we work with lenders that operate within the primary mortgage market where mortgage loans
are originated and funds are loaned to borrowers. Our lenders include mortgage banking companies, savings and loan
associations, savings banks, commercial banks, credit unions, community banks, private mortgage originators, and
state and local housing finance agencies. Lenders originating mortgages in the primary mortgage market often sell them
in the secondary mortgage market in the form of whole loans or in the form of mortgage-related securities.
During 2023, approximately 1,200 lenders delivered single-family mortgage loans to us. We acquire a significant portion
of our single-family mortgage loans from several large mortgage lenders. During 2023, our top five lenders, in the
aggregate, accounted for 29% of our single-family business volume, compared with 28% in 2022. No lender accounted
for 10% or more of our single-family business volume in 2023.
We have a diversified funding base of domestic and international investors. Purchasers of single-family Fannie Mae
MBS include asset managers, commercial banks, pension funds, insurance companies, Treasury, central banks,
corporations, state and local governments, and other municipal authorities. Our CAS investors include asset managers,
real estate investment trusts, hedge funds and insurance companies, while our CIRT transaction counterparties are
insurers and reinsurers.
Single-Family Competition
We compete to acquire single-family mortgage assets in the secondary mortgage market and to issue single-family
mortgage-related securities to investors. Competition in these areas is affected by many factors, including the number of
residential mortgage loans offered for sale in the secondary mortgage market by loan originators and other market
participants (and whether sellers elect to retain loans with better credit characteristics), the nature of the residential
mortgage loans offered for sale (for example, whether the loans represent refinancings), the current demand for
mortgage assets from mortgage investors, the interest-rate risk investors are willing to assume and the yields they will
require as a result, and the credit risk and prices associated with available mortgage investments.
Competition to acquire mortgage assets is significantly affected by both our and our competitors’ pricing and eligibility
standards, as well as investor demand for UMBS and for our and our competitors’ other mortgage-related securities.
Our competitive environment also may be affected by many other factors, including: our risk appetite; our capital
requirements; our return on capital requirements; applicable housing goals and duty-to-serve requirements; FHFA’s
single-family mortgage purchase, servicing and securitization requirements aimed at aligning our single-family MBS with
Freddie Mac’s MBS; and new or existing legislation or regulations applicable to us, our lenders or our investors. In
competing to acquire loans in the secondary mortgage market, we focus on understanding what drives our lenders’
execution decisions and identifying how to best deliver value while supporting our mission. See “Business—
Conservatorship and Treasury Agreements,” “Business—Legislation and Regulation,” and “Risk Factors” for information
on matters that could affect our business and competitive environment.
Our competitors for the acquisition of single-family mortgage assets are financial institutions and government agencies
that manage residential mortgage credit risk or invest in residential mortgage loans, including Freddie Mac, FHA, the
VA, the FHLBs, U.S. banks and thrifts, securities dealers, insurance companies, pension funds, investment funds and
other mortgage investors. Currently, our primary competitors for the issuance and/or guarantee of single-family
mortgage-related securities are Freddie Mac, Ginnie Mae (which primarily guarantees securities backed by FHA-insured
loans and VA-guaranteed loans) and private market competitors. Competition for investors and counterparties in our
credit risk transfer transactions comes primarily from other issuers of mortgage credit risk transfer transactions, such as
Freddie Mac and private mortgage insurers. We also compete for investor funds against other credit-related securitized
products, such as private-label residential mortgage-backed securities (“RMBS”), commercial RMBS, and collateralized
loan obligations. As noted above, the nature of our primary competitors and the overall levels of competition we face
could change as a result of a variety of factors, many of which are outside our control.
MD&A | Single-Family Business | Single-Family Primary Business Activities |
Fannie Mae 2023 Form 10-K | 73 |
Single-Family Mortgage Market
In the charts below we present macroeconomic factors that affect the single-family mortgage market in which our
Single-Family business operates. Home sales and the supply of unsold homes are indicators of the underlying demand
for mortgage loans, which impacts our acquisition volumes.
Total Single-Family Home Sales and Months’ Supply of Unsold Homes(1) | Single-Family Mortgage Originations and Mortgage Debt Outstanding(2) |
(Home sales units in thousands) | (Dollars in trillions) |
Months’ supply of new single-family unsold homes, as of year end | Fannie Mae’s percentage of total single-family mortgage debt outstanding, as of period end | ||||||
Months’ supply of existing single-family unsold homes, as of year end | Single-family U.S. mortgage debt outstanding, as of period end | ||||||
Existing home sales | Single-family U.S. mortgage loan originations | ||||||
New home sales | |||||||
(1)Total existing home sales data according to National Association of REALTORS®. New single-family home sales data according to the U.S.
Census Bureau. Certain previously reported data has been updated to reflect revised historical data from one or both of these
organizations.
(2)2023 information is as of September 30, 2023 and is based on the Federal Reserve’s December 2023 mortgage debt outstanding release,
the latest date for which the Federal Reserve has estimated mortgage debt outstanding for single-family residences. Prior-period amounts
have been changed to reflect revised historical data from the Federal Reserve.
Additional Information
•The average 30-year fixed-rate mortgage rate was 6.61% as of December 28, 2023 compared with 6.42% as of
December 29, 2022, and averaged 6.81% in 2023, compared with 5.34% in 2022, according to Freddie Mac’s
Primary Mortgage Market Survey®.
•We forecast that total originations in the U.S. single-family mortgage market in 2024 will increase from 2023
levels by approximately 28%, from an estimated $1.50 trillion in 2023 to $1.92 trillion in 2024, and the amount
of refinance originations in the U.S. single-family mortgage market will increase from an estimated $253 billion
in 2023 to $459 billion in 2024. See “Key Market Economic Indicators” for additional discussion of how housing
activity can affect our financial results and the uncertainties that may affect our forecasts and expectations.
MD&A | Single-Family Business | Single-Family Mortgage Market |
Fannie Mae 2023 Form 10-K | 74 |
Single-Family Mortgage-Related Securities Issuances Share
Our single-family Fannie Mae MBS issuances were $320 billion in 2023, compared with $628 billion in 2022 and $1.39
trillion in 2021. This decrease was driven by a significantly lower volume of refinance activity in 2023 due to higher
mortgage rates throughout most of 2023. Based on the latest data available, the charts below display our estimated
share of single-family mortgage-related securities issuances as compared with that of our primary competitors for the
issuance of single-family mortgage-related securities for the periods indicated.
Single-Family Mortgage-Related
Securities Issuances Share
Ginnie Mae | Private-label securities | ||||||
Fannie Mae | Freddie Mac | ||||||
We estimate our share of single-family mortgage-related securities issuances was 38% in 2021.
Single-Family Business Metrics
Select Business Metrics
Net interest income for our Single-Family business is driven by the guaranty fees we charge and the size of our single-
family conventional guaranty book of business. The guaranty fees we charge are based on the characteristics of the
loans we acquire. We may adjust our guaranty fees in light of market conditions and to achieve return targets. As a
result, the average charged guaranty fee on new acquisitions may fluctuate based on the credit quality and product mix
of loans acquired, as well as market conditions and other factors.
MD&A | Single-Family Business | Single-Family Mortgage-Related Securities Issuances Share |
Fannie Mae 2023 Form 10-K | 75 |
The charts below display our average charged guaranty fees, net of TCCA fees, on our single-family conventional
guaranty book of business and on new single-family conventional loan acquisitions, along with our average single-family
conventional guaranty book of business and our single-family conventional loan acquisitions for the periods presented.
Select Single-Family Business Metrics(1)
(Dollars in billions)
Average charged guaranty fee on single-family conventional guaranty book of business, net of TCCA fees(2) | Average single-family conventional guaranty book of business(3) | |||||
Average charged guaranty fee on new single-family conventional acquisitions, net of TCCA fees(2) | Single-family conventional acquisitions | |||||
(1)For information reported in this “Single-Family Business” section, our single-family conventional guaranty book of business is measured
using the unpaid principal balance of our mortgage loans underlying Fannie Mae MBS outstanding. By contrast, the single-family
conventional guaranty book of business presented in the “Composition of Fannie Mae Guaranty Book of Business” table in the “Guaranty
Book of Business” section is based on the unpaid principal balance of the Fannie Mae MBS outstanding, rather than the unpaid principal
balance of the underlying mortgage loans. These amounts differ primarily as a result of payments we receive on underlying loans that have
not yet been paid to the MBS holders or instances where we have advanced missed borrower payments on mortgage loans to make
required distributions to related MBS holders. As measured for purposes of the information reported in this section, our single-family
conventional guaranty book of business was $3,636.7 billion as of December 31, 2023, $3,635.2 billion as of December 31, 2022 and
$3,483.1 billion as of December 31, 2021.
(2)Excludes the impact of a 10 basis point guaranty fee increase implemented pursuant to the TCCA, the incremental revenue from which is
paid to Treasury and not retained by us.
(3)Our single-family conventional guaranty book of business primarily consists of single-family conventional mortgage loans underlying
Fannie Mae MBS outstanding. It also includes single-family conventional mortgage loans of Fannie Mae held in our retained mortgage
portfolio, and other credit enhancements that we provide on single-family conventional mortgage assets. Our single-family conventional
guaranty book of business does not include: (a) mortgage loans guaranteed or insured, in whole or in part, by the U.S. government; (b)
Freddie Mac-acquired mortgage loans underlying Freddie Mac-issued UMBS that we have resecuritized; or (c) non-Fannie Mae single-
family mortgage-related securities held in our retained mortgage portfolio for which we do not provide a guaranty. Our average single-
family conventional guaranty book of business is based on quarter-end balances.
Our single-family conventional loan acquisition volumes remained near historically low levels in 2023. This was primarily
driven by historically low refinance volumes due to continued higher interest rates throughout most of 2023, as few
borrowers could benefit from refinancing. In addition, housing affordability constraints and limited supply continued to
put downward pressure on the volume of purchase loans we acquired.
Average charged guaranty fee on newly acquired conventional single-family loans is a metric management uses to
measure the price we earn as compensation for the credit risk we manage and to assess our return. Average charged
guaranty fee represents, on an annualized basis, the average of the base guaranty fees charged during the period for
our single-family conventional guaranty arrangements, which we receive monthly over the life of the loan, plus the
recognition of any upfront cash payments, including loan-level price adjustments, based on an estimated average life at
MD&A | Single-Family Business | Single-Family Business Metrics |
Fannie Mae 2023 Form 10-K | 76 |
the time of acquisition. The calculation of single-family conventional charged guaranty fees at acquisition is sensitive to
changes in inputs used in the calculation, including assumptions about the weighted average life of the loan, therefore
changes in charged guaranty fees are not necessarily indicative of a change in pricing.
Our average charged guaranty fee on newly acquired conventional single-family loans, net of TCCA fees, increased in
2023 compared with 2022 and 2021, primarily as a result of higher base guaranty fees charged on new acquisitions.
Recent Price Changes
In January 2023, FHFA announced changes to our single-family pricing framework by introducing redesigned and
recalibrated upfront fee matrices for purchase, rate-term refinance, and cash-out refinance loans, in addition to a new
upfront fee for certain borrowers with debt-to-income ratios above 40%. These price changes took effect on May 1,
2023, with the exception of the new upfront fee for certain borrowers with debt-to-income ratios above 40%. FHFA
rescinded the upfront fee for certain borrowers with debt-to-income ratios above 40% prior to it going into effect.
Along with the support of FHFA, we will continue to review our pricing to ensure we operate in a safe and sound
manner, and we are positioned to fulfill our mission of providing stability and liquidity to the mortgage market. Changes
in our pricing can significantly affect our loan acquisition volumes, the credit risk profile of our acquisitions, our
competitive position, and the type and mix of loans we acquire.
Single-Family Business Financial Results
This section provides a discussion of the primary components of net income for our Single-Family Business. This
information complements the discussion of financial results in “Consolidated Results of Operations.”
Single-Family Business Financial Results(1) | ||||||||||||||
For the Year Ended December 31, | Variance | |||||||||||||
2023 | 2022 | 2021 | 2023 vs. 2022 | 2022 vs. 2021 | ||||||||||
(Dollars in millions) | ||||||||||||||
Net interest income(2) | $24,229 | $24,736 | $25,429 | $(507) | $(693) | |||||||||
Fee and other income | 205 | 224 | 269 | (19) | (45) | |||||||||
Net revenues | 24,434 | 24,960 | 25,698 | (526) | (738) | |||||||||
Investment gains (losses), net | (41) | (223) | 1,392 | 182 | (1,615) | |||||||||
Fair value gains, net | 1,231 | 1,364 | 167 | (133) | 1,197 | |||||||||
Administrative expenses | (2,993) | (2,789) | (2,557) | (204) | (232) | |||||||||
Benefit (provision) for credit losses | 2,165 | (5,029) | 4,600 | 7,194 | (9,629) | |||||||||
TCCA fees(2) | (3,431) | (3,369) | (3,071) | (62) | (298) | |||||||||
Credit enhancement expense | (1,281) | (1,062) | (812) | (219) | (250) | |||||||||
Change in expected credit enhancement recoveries(3) | (310) | 470 | (86) | (780) | 556 | |||||||||
Other expenses, net(4) | (984) | (778) | (1,208) | (206) | 430 | |||||||||
Income before federal income taxes | 18,790 | 13,544 | 24,123 | 5,246 | (10,579) | |||||||||
Provision for federal income taxes | (3,935) | (2,774) | (4,996) | (1,161) | 2,222 | |||||||||
Net income | $14,855 | $10,770 | $19,127 | $4,085 | $(8,357) | |||||||||
(1)See “Note 11, Segment Reporting” for information about our segment allocation methodology.
(2)Reflects the impact of a 10 basis point guaranty fee increase implemented pursuant to the TCCA, the incremental revenue from which is
paid to Treasury. The resulting revenue is included in “Net interest income” and the expense is recognized as “TCCA fees.”
(3)Includes estimated changes in benefits, as well as any realized amounts, from our single-family freestanding credit enhancements, which
primarily relate to our CAS and CIRT programs.
(4)Consists of debt extinguishment gains and losses, expenses associated with legal claims, foreclosed property income (expense), gains
and losses from partnership investments, housing trust fund expenses, loan subservicing costs, and servicer fees paid in connection with
certain loss mitigation activities.
MD&A | Single-Family Business | Single-Family Business Metrics |
Fannie Mae 2023 Form 10-K | 77 |
Net interest income
Single-family net interest income decreased slightly in 2023 compared with 2022, primarily as a result of lower deferred guaranty fee income and higher expense from hedge accounting largely offset by higher income from portfolios. |
_____________________________________________________________________________
Fair value gains, net
Fair value gains, net were primarily driven by gains on trading securities. U.S. Treasury yields decreased in the fourth quarter of 2023, which resulted in a net gain on our fixed-rate securities held in our corporate liquidity portfolio. |
Fair value gains, net in 2022 were primarily driven by the impact of rising interest rates and widening of the secondary spread, which led to price declines. As a result of the price declines, we recognized gains on our commitments to sell mortgage-related securities and long- term debt of consolidated trusts held at fair value. These gains were partially offset by fair value losses on fixed-rate trading securities. |
_____________________________________________________________________________
Benefit (provision) for credit losses
Benefit for credit losses in 2023 was primarily driven by a benefit from actual and forecasted home price growth, partially offset by a provision driven by the overall credit risk profile of our newly acquired loans and a provision relating to the redesignation of loans from HFI to HFS. |
Provision for credit losses in 2022 was primarily driven by decreases in forecasted home prices, the overall credit risk profile of our newly acquired loans, and rising interest rates. |
_____________________________________________________________________________
MD&A | Single-Family Business | Single-Family Business Financial Results | ||
Fannie Mae 2023 Form 10-K | 78 |
Single-Family Mortgage Credit Risk Management
Our strategy for managing single-family mortgage credit risk consists of four primary components, which we discuss in
greater detail in the sections below:
•our acquisition and servicing policies along with our underwriting and servicing standards;
•guaranty book diversification and monitoring;
•the transfer of credit risk through risk transfer transactions and the use of credit enhancements; and
•management of problem loans.
We typically obtain our single-family credit information from the lenders or servicers of the mortgage loans in our
guaranty book of business and receive representations and warranties from them as to the accuracy of the information.
While we perform various quality assurance checks by sampling loans to assess compliance with our underwriting and
eligibility criteria, we do not independently verify all reported information and we rely on lender representations and
warranties regarding the accuracy of the characteristics of loans in our guaranty book of business. See “Risk Factors”
for a discussion of the risk that we could experience mortgage fraud as a result of this reliance on lender
representations and warranties.
Single-Family Acquisition and Servicing Policies and Underwriting and Servicing
Standards
Overview
Our Single-Family business is responsible for setting underwriting and servicing standards and pricing, and managing
credit risk relating to our single-family guaranty book of business.
Underwriting and Servicing Standards
The Fannie Mae Single-Family Selling Guide (“Selling Guide”) sets forth our underwriting and eligibility guidelines, as
well as our policies and procedures related to selling single-family mortgages to us. Our Servicing Guide sets forth our
policies for servicing the loans in our single-family guaranty book.
Desktop Underwriter
Our proprietary automated underwriting system, Desktop Underwriter® (“DU®”), is used by mortgage lenders to evaluate
the substantial majority of our single-family loan acquisitions. DU measures credit risk by assessing the primary and
contributory risk factors of a mortgage and provides a comprehensive risk assessment of a borrower’s loan application
and eligibility of the loan for sale to us. Risk factors evaluated by DU include the key loan attributes described under
“Single-Family Guaranty Book Diversification and Monitoring” below. DU applies our own assessment of the borrower’s
credit data, including using trended credit data when available. DU analyzes the results of this risk and eligibility
evaluation to arrive at the underwriting recommendation for the loan case file. As part of our comprehensive risk
management approach, we periodically update DU to reflect changes to our underwriting and eligibility guidelines. As
part of normal business operations, we regularly review DU to determine whether its risk analysis and eligibility
assessment are appropriate based on the current market environment and loan performance information. We also
regularly review DU’s underlying risk assessment models and recalibrate these models to improve DU’s ability to
effectively analyze risk and avoid excessive risk layering. Factors we take into account in these evaluations include the
profile of loans delivered to us, loan performance and current market conditions.
Consistent with this risk management approach, in November 2023, we implemented updates to DU to expand access
to credit and provide support for affordable rental housing. We updated the maximum allowable LTV ratios for two- to
four-unit, principal residence purchase and limited cash-out refinance loans to 95%. This update does not apply to high-
balance mortgage loans and loans that are manually underwritten. We will continue to closely monitor loan acquisitions
and market conditions and, as appropriate, make changes to DU, including its eligibility criteria, to ensure that the loans
we acquire are consistent with our risk appetite and mission.
Other Underwriting Standards
DU was used to evaluate over 90% of the single-family loans we acquired in 2023. However, we also purchase and
securitize mortgage loans that have been underwritten using other automated underwriting systems, as well as
manually underwritten mortgage loans that meet our stated underwriting requirements or meet agreed-upon standards
that differ from our standard underwriting and eligibility criteria. The majority of loans we acquired in 2023 that were not
underwritten with DU were underwritten through a third-party automated underwriting system, such as Freddie Mac’s
Loan Product Advisor®.
MD&A | Single-Family Business | Single-Family Mortgage Credit Risk Management |
Fannie Mae 2023 Form 10-K | 79 |
Servicing Policies
Our servicing policies establish the requirements our servicers must follow in:
•processing and remitting loan payments;
•working with delinquent borrowers on loss mitigation activities;
•managing and protecting Fannie Mae’s interest in the pledged property; and
•processing bankruptcies and foreclosures.
Our goal is to ensure that our policies support credit risk management over the life of the mortgage loan by enabling
early delinquency outreach by servicers, promoting loss mitigation in the event of default and providing for the
preservation and protection of the collateral supporting the mortgage loan. See “Single-Family Primary Business
Activities—Single-Family Mortgage Servicing” above for more information on the servicing of our single-family mortgage
loans.
New Credit Score Models and Expected Change to Credit Report Requirement
Fannie Mae uses credit scores to establish a minimum credit threshold for mortgage lending, provide a foundation for
risk-based pricing, and support disclosures to investors. We currently use the “classic FICO® Score” from Fair Isaac
Corporation as our credit score model, which FHFA has approved.
In October 2022, FHFA announced the validation and approval of two new credit score models for use by Fannie Mae
and Freddie Mac: the FICO® Score 10 T credit score model and the VantageScore® 4.0 credit score model. FHFA’s
announcement stated that they expect implementation of these new credit score models will be a multiyear effort. Once
implemented, lenders will be required to deliver both FICO Score 10 T and VantageScore 4.0 credit scores with each
loan sold to us when available, replacing the classic FICO Score model. The new models are expected to improve both
the accuracy and inclusivity of borrower credit scores, including by capturing new payment histories for borrowers when
available, such as rent, utilities and telecom payments.
FHFA also announced in October 2022 that Fannie Mae and Freddie Mac will work toward changing the requirement
that lenders provide credit reports from all three nationwide consumer reporting agencies. Instead, we will require
lenders to provide credit reports from any two of the three nationwide consumer reporting agencies. FHFA expects this
change will reduce costs and encourage innovation, without introducing additional risk to Fannie Mae and Freddie Mac.
Following its announcement, FHFA has been hosting a series of stakeholder forums on the upcoming changes.
Quality Control Process
Our quality control process includes using automated tools to help us determine whether a loan meets our underwriting
and eligibility guidelines, performing in-depth reviews, and selecting random samples of performing loans for quality
control review shortly after delivery.
Repurchase Requests and Representation and Warranty Framework
If we determine that a mortgage loan did not meet our Selling Guide requirements, then our mortgage sellers and/or
servicers are obligated to repurchase the loan, reimburse us for our losses or provide other remedies, unless the loan is
eligible for relief under our representation and warranty framework. We refer to our demands that mortgage sellers and
servicers meet these obligations as repurchase requests.
Under our representation and warranty framework, lenders can obtain relief from repurchase liability for violations of
certain underwriting representations and warranties. Loans with 36 months of consecutive monthly payments and
minimal delinquencies over a specified time period or with satisfactory conclusion of a full-file quality control review are
eligible for relief. However, no relief may be granted for violations of “life of loan” representations and warranties, such
as those relating to whether a loan was originated in compliance with applicable laws or conforms to our charter
requirements. As of December 31, 2023, 48% of the outstanding loans in our single-family conventional guaranty book
of business that were acquired and are subject to this framework have obtained relief based solely on payment history
or the satisfactory conclusion of a full-file quality control review, and an additional 49% remain eligible for relief in the
future.
In addition, lenders may obtain relief from liability for violations of a more narrow set of representations and warranties
through the use of specified underwriting tools. This primarily includes relief for:
•borrower income, asset and employment data that has been validated through DU; and
•appraised property value for appraisals that have received a qualifying risk score in Collateral Underwriter®, our
appraisal review tool.
MD&A | Single-Family Business | Single-Family Mortgage Credit Risk Management |
Fannie Mae 2023 Form 10-K | 80 |
The table below shows information about issued and outstanding repurchase requests on single-family loans.
Issued and Outstanding Repurchase Requests | ||||
2023 | 2022 | |||
(Dollars in billions) | ||||
Total loans delivered for the applicable twelve-month period(1) | $380.8 | $1,048.8 | ||
Repurchase requests issued as of year end on loans delivered during the applicable twelve-month period(2) | 0.51% | 0.32% | ||
As of December 31, | ||||
2023 | 2022 | |||
(Dollars in millions) | ||||
Outstanding Repurchase Requests: | ||||
Unpaid principal balance of outstanding repurchase requests(3) | $437 | $783 | ||
As a percentage of our single-family conventional guaranty book of business | 0.01% | 0.02% | ||
Percentage of outstanding repurchase requests over 180 days outstanding | 3% | 5% | ||
(1)The applicable twelve-month period for 2023 is June 1, 2022 through May 31, 2023 and for 2022 is June 1, 2021 through May 31, 2022.
For 2023, this represents the most recent twelve-month period as of December 31, 2023 for which we have issued substantially all
repurchase demands. The 2022 period is presented on the same basis for comparability with the 2023 period.
(2)Represents repurchase requests issued as of December 31, 2023 and 2022, on loans delivered to us during the applicable twelve-month
periods referenced in the prior footnote.
(3)The dollar amounts of our outstanding repurchase requests are based on the unpaid principal balance of the loans underlying the
repurchase request, which often differs from the amount collected or reimbursed from mortgage sellers and/or servicers depending on the
type of remedy agreed upon.
Single-Family Guaranty Book Diversification and Monitoring
Overview
The composition of our single-family conventional guaranty book of business is diversified by product type, loan
characteristics and geography, all of which influence credit quality and performance and may reduce our credit risk. We
monitor various loan attributes, in conjunction with housing market and economic conditions, to determine if our pricing,
eligibility and underwriting criteria are appropriately calibrated to ensure the risk associated with loans we acquire fits
within our corporate risk appetite and meets our other mission and return objectives. In some cases, we may decide to
significantly reduce our participation in riskier loan product categories. We also review the payment performance of
loans in order to help identify potential problem loans early in the delinquency cycle and to guide the development of our
loss mitigation strategies.
The profile of our single-family conventional guaranty book of business includes the following key risk characteristics:
•LTV ratio. LTV ratio is a strong predictor of credit performance. The likelihood of default and the severity of a
loss in the event of default are typically lower as LTV ratio decreases. This also applies to estimated mark-to-
market LTV ratios, particularly those over 100%, as this indicates that the borrower’s mortgage balance
exceeds the property value.
•Product type. Certain loan product types have features that may result in increased risk. Generally,
intermediate-term, fixed-rate mortgages exhibit the lowest default rates, followed by long-term, fixed-rate
mortgages. Historically, adjustable-rate mortgages (“ARMs”), including negative-amortizing and interest-only
loans, and balloon/reset mortgages have exhibited higher default rates than fixed-rate mortgages, partly
because the borrower’s payments rose, within limits, as interest rates changed.
•Number of units. Mortgages on one-unit properties tend to have lower credit risk than mortgages on two-, three-
or four-unit properties.
•Property type. Certain property types have a higher risk of default. For example, condominiums tend to have
higher credit risk than single-family detached properties.
•Occupancy type. Mortgages on properties occupied by the borrower as a primary or secondary residence tend
to have lower credit risk than mortgages on investment properties.
MD&A | Single-Family Business | Single-Family Mortgage Credit Risk Management |
Fannie Mae 2023 Form 10-K | 81 |
•Credit score. Credit score is a measure often used by the financial services industry, including us, to assess
borrower credit quality and the likelihood that a borrower will repay future obligations as expected. A higher
credit score typically indicates lower credit risk.
•DTI ratio. DTI ratio refers to the ratio of a borrower’s outstanding debt obligations (including both mortgage debt
and certain other long-term and significant short-term debts) to that borrower’s reported or calculated monthly
income, to the extent the income is used to qualify for the mortgage. As a borrower’s DTI ratio increases, the
associated risk of default on the loan generally increases, especially if other higher-risk factors are present.
From time to time, we revise our guidelines for determining a borrower’s DTI ratio. The amount of income
reported by a borrower and used to qualify for a mortgage may not represent the borrower’s total income;
therefore, the DTI ratios we report may be higher than borrowers’ actual DTI ratios.
•Loan purpose. Loan purpose refers to how the borrower intends to use the funds from a mortgage loan—either
for a home purchase or refinancing of an existing mortgage. Cash-out refinancings have a higher risk of default
than either mortgage loans used for the purchase of a property or other refinancings that restrict the amount of
cash returned to the borrower.
•Geographic concentration. Local economic conditions affect borrowers’ ability to repay loans and the value of
collateral underlying loans. Geographic diversification reduces mortgage credit risk.
•Loan age. We monitor year of origination and loan age, which is defined as the number of years since
origination. The risk of default on mortgage loans typically does not peak until the third through fifth year
following origination; however, this range can vary based on many factors, including changes in
macroeconomic conditions and foreclosure timelines.
MD&A | Single-Family Business | Single-Family Mortgage Credit Risk Management |
Fannie Mae 2023 Form 10-K | 82 |
The following table displays our single-family conventional business volumes and our single-family conventional
guaranty book of business, based on certain key risk characteristics that we use to evaluate the risk profile and credit
quality of our single-family loans.
We provide additional information on the credit characteristics of our single-family loans in quarterly financial
supplements, which we furnish to the SEC with current reports on Form 8-K and make available on our website.
Information in our quarterly financial supplements is not incorporated by reference into this report.
Key Risk Characteristics of Single-Family Conventional Business Volume and Guaranty Book of Business(1) | |||||||||||||
Percent of Single-Family Conventional Business Volume at Acquisition(2) For the Year Ended December 31, | Percent of Single-Family Conventional Guaranty Book of Business(3) As of December 31, | ||||||||||||
2023 | 2022 | 2021 | 2023 | 2022 | 2021 | ||||||||
Original LTV ratio:(4) | |||||||||||||
<= 60% | 16 | % | 22 | % | 32 | % | 25 | % | 26 | % | 27 | % | |
60.01% to 70% | 10 | 13 | 16 | 14 | 15 | 15 | |||||||
70.01% to 80% | 34 | 33 | 31 | 33 | 33 | 33 | |||||||
80.01% to 90% | 16 | 12 | 9 | 11 | 10 | 10 | |||||||
90.01% to 95% | 18 | 15 | 9 | 12 | 11 | 10 | |||||||
95.01% to 100% | 6 | 5 | 3 | 4 | 4 | 4 | |||||||
Greater than 100% | — | — | * | 1 | 1 | 1 | |||||||
Total | 100 | % | 100 | % | 100 | % | 100 | % | 100 | % | 100 | % | |
Weighted average | 78 | % | 75 | % | 69 | % | 73 | % | 72 | % | 72 | % | |
Average loan amount | $321,205 | $301,887 | $281,530 | $207,883 | $206,049 | $198,865 | |||||||
Loan count (in thousands) | 984 | 2,037 | 4,812 | 17,494 | 17,643 | 17,515 | |||||||
Estimated mark-to-market LTV ratio:(5) | |||||||||||||
<= 60% | 68 | % | 66 | % | 61 | % | |||||||
60.01% to 70% | 14 | 16 | 19 | ||||||||||
70.01% to 80% | 10 | 10 | 13 | ||||||||||
80.01% to 90% | 5 | 5 | 5 | ||||||||||
90.01% to 100% | 3 | 3 | 2 | ||||||||||
Greater than 100% | * | * | * | ||||||||||
Total | 100 | % | 100 | % | 100 | % | |||||||
Weighted average | 51 | % | 52 | % | 54 | % | |||||||
FICO credit score at origination:(6) | |||||||||||||
< 620 | * | % | * | % | * | % | * | % | 1 | % | 1 | % | |
620 to < 660 | 3 | 4 | 3 | 4 | 4 | 4 | |||||||
660 to < 680 | 3 | 4 | 3 | 4 | 4 | 3 | |||||||
680 to < 700 | 5 | 8 | 6 | 6 | 6 | 7 | |||||||
700 to < 740 | 20 | 22 | 19 | 20 | 19 | 19 | |||||||
>= 740 | 69 | 62 | 69 | 66 | 66 | 66 | |||||||
Total | 100 | % | 100 | % | 100 | % | 100 | % | 100 | % | 100 | % | |
Weighted average | 755 | 747 | 756 | 753 | 752 | 753 | |||||||
DTI ratio at origination:(7) | |||||||||||||
<= 43% | 64 | % | 68 | % | 77 | % | 75 | % | 75 | % | 77 | % | |
43.01% to 45% | 10 | 10 | 8 | 9 | 9 | 9 | |||||||
Greater than 45% | 26 | 22 | 15 | 16 | 16 | 14 | |||||||
Total | 100 | % | 100 | % | 100 | % | 100 | % | 100 | % | 100 | % | |
Weighted average | 38 | % | 37 | % | 34 | % | 35 | % | 35 | % | 34 | % | |
MD&A | Single-Family Business | Single-Family Mortgage Credit Risk Management |
Fannie Mae 2023 Form 10-K | 83 |
Percent of Single-Family Conventional Business Volume at Acquisition(2) For the Year Ended December 31, | Percent of Single-Family Conventional Guaranty Book of Business(3) As of December 31, | ||||||||||||
2023 | 2022 | 2021 | 2023 | 2022 | 2021 | ||||||||
Product type: | |||||||||||||
Fixed-rate:(8) | |||||||||||||
Long-term | 96 | % | 90 | % | 83 | % | 87 | % | 86 | % | 84 | % | |
Intermediate-term | 3 | 9 | 16 | 12 | 13 | 15 | |||||||
Total fixed-rate | 99 | 99 | 99 | 99 | 99 | 99 | |||||||
Adjustable-rate | 1 | 1 | 1 | 1 | 1 | 1 | |||||||
Total | 100 | % | 100 | % | 100 | % | 100 | % | 100 | % | 100 | % | |
Number of property units: | |||||||||||||
1 unit | 98 | % | 98 | % | 98 | % | 98 | % | 98 | % | 97 | % | |
2-4 units | 2 | 2 | 2 | 2 | 2 | 3 | |||||||
Total | 100 | % | 100 | % | 100 | % | 100 | % | 100 | % | 100 | % | |
Property type: | |||||||||||||
Single-family homes | 91 | % | 91 | % | 91 | % | 91 | % | 91 | % | 91 | % | |
Condo/Co-op | 9 | 9 | 9 | 9 | 9 | 9 | |||||||
Total | 100 | % | 100 | % | 100 | % | 100 | % | 100 | % | 100 | % | |
Occupancy type: | |||||||||||||
Primary residence | 92 | % | 91 | % | 92 | % | 91 | % | 91 | % | 90 | % | |
Second/vacation home | 2 | 3 | 3 | 3 | 3 | 4 | |||||||
Investor | 6 | 6 | 5 | 6 | 6 | 6 | |||||||
Total | 100 | % | 100 | % | 100 | % | 100 | % | 100 | % | 100 | % | |
Loan purpose: | |||||||||||||
Purchase | 86 | % | 62 | % | 33 | % | 45 | % | 40 | % | 36 | % | |
Cash-out refinance | 10 | 25 | 24 | 20 | 22 | 21 | |||||||
Other refinance | 4 | 13 | 43 | 35 | 38 | 43 | |||||||
Total | 100 | % | 100 | % | 100 | % | 100 | % | 100 | % | 100 | % | |
Geographic concentration:(9) | |||||||||||||
Midwest | 14 | % | 13 | % | 13 | % | 14 | % | 14 | % | 14 | % | |
Northeast | 13 | 13 | 14 | 16 | 16 | 16 | |||||||
Southeast | 28 | 26 | 22 | 23 | 23 | 23 | |||||||
Southwest | 24 | 23 | 19 | 19 | 19 | 18 | |||||||
West | 21 | 25 | 32 | 28 | 28 | 29 | |||||||
Total | 100 | % | 100 | % | 100 | % | 100 | % | 100 | % | 100 | % | |
Origination year: | |||||||||||||
2017 and prior | 19 | % | 22 | % | 27 | % | |||||||
2018 | 2 | 2 | 3 | ||||||||||
2019 | 4 | 5 | 6 | ||||||||||
2020 | 24 | 25 | 30 | ||||||||||
2021 | 30 | 32 | 34 | ||||||||||
2022 | 13 | 14 | — | ||||||||||
2023 | 8 | — | — | ||||||||||
Total | 100 | % | 100 | % | 100 | % | |||||||
*Represents less than 0.5% of single-family conventional business volume or guaranty book of business.
(1)Second-lien mortgage loans held by third parties are not reflected in the original LTV or the estimated mark-to-market LTV ratios in this
table.
(2)Calculated based on the unpaid principal balance of single-family loans for each category at time of acquisition.
(3)Calculated based on the aggregate unpaid principal balance of single-family loans for each category divided by the aggregate unpaid
principal balance of loans in our single-family conventional guaranty book of business as of the end of each period.
(4)The original LTV ratio generally is based on the original unpaid principal balance of the loan divided by the appraised property value
reported to us at the time of acquisition of the loan. Excludes loans for which this information is not readily available.
MD&A | Single-Family Business | Single-Family Mortgage Credit Risk Management |
Fannie Mae 2023 Form 10-K | 84 |
(5)The aggregate estimated mark-to-market LTV ratio is based on the unpaid principal balance of the loan as of the end of each reported
period divided by the estimated current value of the property, which we calculate using an internal valuation model that estimates periodic
changes in home value. Excludes loans for which this information is not readily available.
(6)Loans with unavailable FICO credit scores represent less than 0.5% of single-family conventional business volume or guaranty book of
business, and therefore are not presented separately in this table.
(7)Excludes loans for which this information is not readily available.
(8)Long-term fixed-rate consists of mortgage loans with maturities greater than 15 years, while intermediate-term fixed-rate loans have
maturities equal to or less than 15 years.
(9)Midwest consists of IL, IN, IA, MI, MN, NE, ND, OH, SD and WI. Northeast consists of CT, DE, ME, MA, NH, NJ, NY, PA, PR, RI, VT and
VI. Southeast consists of AL, DC, FL, GA, KY, MD, MS, NC, SC, TN, VA and WV. Southwest consists of AZ, AR, CO, KS, LA, MO, NM, OK,
TX and UT. West consists of AK, CA, GU, HI, ID, MT, NV, OR, WA and WY.
Characteristics of our New Single-Family Loan Acquisitions
Refinancing activity was lower in 2023 compared to 2022 as we were in a higher interest-rate environment throughout
most of 2023, resulting in fewer borrowers who could benefit from refinancing. Accordingly, the share of our single-
family loan acquisitions consisting of refinance loans (versus home purchase loans) decreased to 14% in 2023
compared with 38% in 2022. Typically, home purchase loans have higher LTV ratios than refinance loans. This trend
contributed to an increase in the percentage of our single-family loan acquisitions with LTV ratios over 80%, from 32% in
2022 to 40% in 2023. In addition, our acquisitions of loans from first-time home buyers increased from 29% of our
single-family loan acquisitions in 2022 to 41% in 2023.
Our share of acquisitions of loans with DTI ratios above 45% increased to 26% in 2023 compared with 22% in 2022.
This increase was driven by the higher share of home purchase acquisitions, which tend to have higher DTI ratios than
refinance loan acquisitions. It also reflects the impact of higher interest rates and inflation on borrowers’ monthly
obligations.
The credit profile of our future acquisitions will depend on many factors, including:
•our future guaranty fee pricing and our competitors’ pricing, and any impact of that pricing on the volume and
mix of loans we acquire;
•our internal risk limits;
•our future eligibility standards and those of mortgage insurers, FHA and VA;
•the percentage of loan originations representing refinancings;
•changes in interest rates;
•our future objectives and activities in support of those objectives, including actions we may take to reach
additional underserved creditworthy borrowers;
•government and regulatory policy;
•market and competitive conditions; and
•our capital requirements.
We expect the ultimate performance of our loans will be affected by borrower behavior, public policy and
macroeconomic trends, including unemployment, the economy and home prices.
High-Balance Loans
The standard conforming loan limit for a one-unit property was $647,200 for 2022, $726,200 for 2023 and increased to
$766,550 for 2024. As we discuss in “Business—Legislation and Regulation—Our Charter,” we are permitted to acquire
loans with higher balances in certain areas, which we refer to as high-balance loans.
The following table displays the amount of high-balance loans in our single-family conventional guaranty book of
business.
Single-Family High-Balance Loans | ||||||
As of December 31, | ||||||
2023 | 2022 | |||||
Unpaid principal balance (in billions) | $233.3 | $237.3 | ||||
Percentage of single-family conventional guaranty book of business | 6 | % | 7 | % | ||
MD&A | Single-Family Business | Single-Family Mortgage Credit Risk Management |
Fannie Mae 2023 Form 10-K | 85 |
Adjustable-Rate Mortgages
ARMs are mortgage loans with an interest rate that adjusts periodically over the life of the mortgage based on changes
in a specified index. The table below displays the unpaid principal balance for ARMs in our single-family conventional
guaranty book of business by the year of their next scheduled contractual reset date. The contractual reset is either an
adjustment to the loan’s interest rate or a scheduled change to the loan’s monthly payment to begin to reflect the
payment of principal. The timing of the actual reset dates may differ from those presented due to a number of factors,
including refinancing or exercising of other provisions within the terms of the mortgage.
Single-Family Adjustable-Rate Mortgages(1) | |||||||||||||
Reset Year | |||||||||||||
2024 | 2025 | 2026 | 2027 | 2028 | Thereafter | Total | |||||||
(Dollars in millions) | |||||||||||||
ARMs(2) | $11,675 | $839 | $1,447 | $2,621 | $3,477 | $9,532 | $29,591 | ||||||
(1)Excludes loans for which there is not an additional reset for the remaining life of the loan.
(2)Includes $2.8 billion of interest-only and negative-amortizing loans. We have not acquired interest-only loans since 2014, and we have not
acquired negative-amortizing loans since 2007.
Single-Family Credit Enhancement and Transfer of Mortgage Credit Risk
One of the key components of our credit risk management strategy is the transfer of mortgage credit risk to third parties.
The table below displays information about the loans in our single-family conventional guaranty book of business
covered by one or more forms of credit enhancement, including mortgage insurance or a credit risk transfer transaction.
Our approved monoline mortgage insurers’ financial ability and willingness to pay claims is an important determinant of
our overall credit risk exposure. For a discussion of our exposure to and management of the counterparty credit risk
associated with the providers of these credit enhancements, see “Risk Management—Institutional Counterparty Credit
Risk Management” and “Note 14, Concentrations of Credit Risk.”
Single-Family Loans with Credit Enhancement | ||||||||
As of December 31, | ||||||||
2023 | 2022 | |||||||
Unpaid Principal Balance | Percentage of Single-Family Conventional Guaranty Book of Business | Unpaid Principal Balance | Percentage of Single-Family Conventional Guaranty Book of Business | |||||
(Dollars in billions) | ||||||||
Primary mortgage insurance and other | $763 | 21% | $754 | 21% | ||||
Connecticut Avenue Securities | 843 | 24 | 726 | 20 | ||||
Credit Insurance Risk Transfer | 399 | 11 | 323 | 9 | ||||
Lender risk-sharing | 52 | 1 | 57 | 2 | ||||
Less: Loans covered by multiple credit enhancements | (411) | (12) | (351) | (10) | ||||
Total single-family loans with credit enhancement | $1,646 | 45% | $1,509 | 42% | ||||
Mortgage Insurance
Our charter generally requires credit enhancement on any single-family conventional mortgage loan that we purchase or
securitize if it has an LTV ratio over 80% at the time of acquisition. We generally achieve this through primary mortgage
insurance. Primary mortgage insurance transfers varying portions of the credit risk associated with a mortgage loan to a
third-party insurer. For us to receive a payment in settlement of a claim under a primary mortgage insurance policy, the
insured loan must be in default and the borrower’s interest in the property securing the loan must have been
extinguished, generally in a foreclosure action, short sale or a deed-in-lieu of foreclosure. Claims are generally paid
three to six months after title to the property has been transferred. For a discussion of our policies that govern mortgage
insurers’ claim-paying obligations to us, see “Risk Management—Institutional Counterparty Credit Risk Management.”
Credit Risk Transfer Transactions
Our Single-Family business has developed other risk-sharing capabilities to transfer portions of our single-family
mortgage credit risk to the private market. Our credit risk transfer transactions are designed to transfer a portion of the
losses we expect would be incurred in an economic downturn or a stressed credit environment. Generally, loss
reimbursement payments are received after the underlying property has been liquidated and all applicable proceeds,
MD&A | Single-Family Business | Single-Family Mortgage Credit Risk Management |
Fannie Mae 2023 Form 10-K | 86 |
including private mortgage insurance benefits, have been applied to reduce the loss. We continually evaluate our credit
risk transfer transactions which, in addition to managing our credit risk, also affect our returns on capital.
In 2023, we transferred a portion of the mortgage credit risk on single-family mortgage loans with an unpaid principal
balance of $308.0 billion at the time of the transactions. When engaging in these transactions, we consider their cost,
the resulting capital relief, and the overall credit risk transfer capacity of the market. The cost of our credit risk transfer
transactions is impacted by macroeconomic and housing market sentiment, as well as the demand and capacity of the
investors and reinsurers that support these transactions. Capacity considers both the total aggregate amount of
outstanding coverage as well as the volume of new issuances available in the market. In response to all these factors,
we may choose to adjust the amount of first loss retained by Fannie Mae as a way to manage costs or market capacity
when structuring our credit risk transfer transactions.
MD&A | Single-Family Business | Single-Family Mortgage Credit Risk Management |
Fannie Mae 2023 Form 10-K | 87 |
Principal Categories of Our Single-Family Credit Risk Transfer Transactions
Transaction Description | Other Key Characteristics | |
CAS REMIC® | •We transfer to investors a portion of the mortgage credit risk associated with losses on a reference pool of mortgage loans. •We create a reference pool consisting of recently acquired single-family mortgage loans included in our guaranty book of business and create a hypothetical securitization structure with notional credit risk positions, or tranches (that is, first loss, mezzanine and senior). See the table below for additional information about the risk positions we retain. • We recognize the cost of credit protection in “Credit enhancement expense” in our consolidated statements of operations and comprehensive income. • We recognize the expected benefits from the credit protection in “Change in expected credit enhancement recoveries” in our consolidated statements of operations and comprehensive income. • CAS REMIC transactions align the timing of our recognition of credit losses with the related recovery from the CRT transaction. We record the expected benefit and the loss in the same period. | •The principal balance of the CAS REMIC decreases as a result of credit losses on loans in the related reference pool. These write downs of the principal balance reduce the total amount of payments that the CAS trust is obligated to make to investors. •Credit losses on the loans in the reference pool for a CAS transaction are first applied to the first loss tranche. If credit losses on these loans exceed the outstanding principal balance of the first loss tranche, losses are then applied to reduce the outstanding principal balance of the mezzanine loss tranche. •Transactions beginning with our October 2021 issuances were issued with a 20-year final maturity date and an optional early redemption of 5 years, or the date at which the outstanding balance of the underlying reference loans is less than or equal to 10% of the original balance. • After maturity or early redemption, if exercised, the CAS REMIC provides no further credit protection with respect to the reference loans that were previously underlying that CAS transaction. •Presents minimal counterparty risk as the CAS trust receives the proceeds that will reimburse us for certain credit events on the related loans upon the issuance of the CAS REMIC. |
CIRT | • Insurance transactions whereby we obtain actual loss coverage on pools of loans either directly from an insurance provider that retains the risk, or from an insurance provider that simultaneously cedes all of its risk to one or more reinsurers. • In CIRT deals, we generally retain an initial portion of losses on the loans in the pool (for example, the first 0.75% of the initial pool unpaid principal balance). Reinsurers cover losses above this retention amount up to a detachment point (for example, the next 4.0% of the initial pool unpaid principal balance). We retain all losses above this detachment point. • We make premium payments on CIRT deals that we recognize in “Credit enhancement expense” in our consolidated statements of operations and comprehensive income. | • The insurance layer typically provides coverage for losses on the pool that are likely to occur only in a stressed economic environment. • Insurance benefits are received after the underlying property has been liquidated and all applicable proceeds, including private mortgage insurance benefits, have been applied to the loss. • A portion of the insurers’ or reinsurers’ obligations is collateralized with highly-rated liquid assets held in a trust account initially determined according to the ratings of such insurer or reinsurer. Contractual provisions require additional collateral to be posted in the event of adverse developments with the counterparty, such as a ratings downgrade. • To date, CIRT transactions generally have been structured with 10 or 12-1/2 year terms, and covered loans that are delinquent as of the final scheduled month continue to be covered until and unless they eventually cure. The transaction term may vary based upon market execution and the capital benefit of the term under the enterprise regulatory capital framework. |
CAS Debt | CAS debt transactions are similar to CAS REMIC transactions, with some key differences: • CAS debt is recognized as “debt of Fannie Mae” in our consolidated balance sheets. CAS debt issued to investors beginning January 2016 through October 2018 is recognized at amortized cost. CAS debt we issued prior to 2016 is recognized at fair value. •We stopped issuing this form of CAS in October 2018. | • Generally issued with a stated final maturity date of either 10 or 12.5 years from issuance. • Significant lag exists between the time when we recognize a provision for credit losses and when we recognize the related recovery from the CAS debt transaction. |
MD&A | Single-Family Business | Single-Family Mortgage Credit Risk Management |
Fannie Mae 2023 Form 10-K | 88 |
The table below displays the aggregate mortgage credit risk transferred to third parties and retained by Fannie Mae
pursuant to our single-family credit risk transfer transactions. The table does not include the credit risk transferred on
single-family transactions that were cancelled or terminated as of December 31, 2023. The table below also excludes
coverage obtained through primary mortgage insurance.
Outstanding as of December 31, 2023 | ||||||||||||||||
(Dollars in billions) | ||||||||||||||||
 | Senior | Fannie Mae(1) | Outstanding Reference Pool(5)(7) | |||||||||||||
$1,238 | ||||||||||||||||
Mezzanine | Fannie Mae(1) | CIRT(2)(3) | CAS(2) | Lender Risk- Sharing(2)(4) | ||||||||||||
$5 | $14 | $12 | $4 | $1,302 | ||||||||||||
First Loss | Fannie Mae(1) | CAS(2)(6) | Lender Risk- Sharing(2)(4) | |||||||||||||
$17 | $10 | $2 | ||||||||||||||
(1)Credit risk retained by Fannie Mae in CAS, CIRT and lender risk-sharing transactions. Also includes credit risk retained in CAS Credit
Linked-Note transactions, which are similar to CAS REMICs except they allow us to allow us to obtain credit protection on reference pools
containing seasoned loans such as Refi PlusTM loans. Tranche sizes vary across programs.
(2)Credit risk transferred to third parties. Tranche sizes vary across programs.
(3)Includes mortgage pool insurance transactions covering loans with an aggregate unpaid principal balance of $248 million outstanding as of
December 31, 2023.
(4)Represents customized lender-risk sharing transactions. In most transactions, lenders invest directly in a portion of the credit risk on
mortgage loans they originate and/or service.
(5)For CIRT and some lender risk-sharing transactions, “Reference Pool” reflects a pool of covered loans.
(6)For CAS transactions, “First Loss” represents all B tranche balances. In recent deals we have retained certain subordinated class B
tranche(s) that absorb losses before the remaining class B tranches.
(7)For CAS and some lender risk-sharing transactions, represents outstanding reference pools, not the outstanding unpaid principal balance
of the underlying loans. The outstanding unpaid principal balance for all loans covered by credit risk transfer programs, including all loans
on which risk has been transferred in lender risk-sharing transactions, was $1,294 billion as of December 31, 2023.
We have designed our credit risk transfer transactions so that the principal payment and loss performance of the
transactions correspond to the performance of the loans in the underlying reference pools. Losses are applied in
reverse sequential order starting with the first loss tranche. Principal repayments may be allocated to reduce the
mezzanine amounts outstanding; however, these payments may be subject to certain lock-out periods and performance
triggers in order to build additional credit protection for the senior tranches retained by us. For CAS transactions, all
principal payments and losses assigned to the mezzanine tranches are allocated pro rata between the sold notes and
the portion we retain, when performance is above a certain threshold.
While these deals are expected to mitigate some of our potential future credit losses (generally net of any proceeds
received from front-end credit enhancements, such as primary mortgage insurance), these deals are not designed to
shield us from all losses. We retain a portion of the risk of future credit losses on loans covered by CAS and CIRT
transactions, including all or a portion of the first loss positions and all of the senior loss positions. In addition, on our
CAS transactions, we retain a pro rata share of risk equal to approximately 5% of all notes sold in mezzanine tranches.
The risk in force of these transactions, which refers to the maximum amount of losses that could be absorbed by credit
risk transfer investors, was approximately $42 billion as of December 31, 2023, compared with approximately $38 billion
as of December 31, 2022.
Our credit risk transfer transactions issued prior to 2021 were impacted by high levels of refinancing activity. As a result,
the losses on the remaining covered reference pools must generally be higher before we would receive a benefit from
those credit risk transfer transactions. In addition, home price appreciation since we entered into the transactions
reduces the likelihood that we will incur losses on the covered loans large enough to receive a benefit from these
transactions. As of December 31, 2023, approximately 33% of the outstanding risk in force of our single-family credit
risk transfer transactions was from transactions issued prior to 2021.
MD&A | Single-Family Business | Single-Family Mortgage Credit Risk Management |
Fannie Mae 2023 Form 10-K | 89 |
The following table displays information about the credit enhancement recovery receivables we have recognized within
“Other assets” in our consolidated balance sheets. The decrease in our single-family freestanding credit enhancement
receivables as of December 31, 2023 compared to December 31, 2022, was primarily a result of a decrease in our
estimate of credit losses in 2023. As our estimate for credit losses decreases, so does the benefit we expect to receive
from our freestanding credit enhancements.
Single-Family Credit Enhancement Receivables | ||||
As of December 31, | ||||
2023 | 2022 | |||
(Dollars in millions) | ||||
Freestanding credit enhancement receivables | $253 | $565 | ||
Primary mortgage insurance receivables, net of allowance(1) | 54 | 53 | ||
(1)Amount is net of a valuation allowance of $417 million and $462 million as of December 31, 2023 and December 31, 2022, respectively.
The vast majority of this valuation allowance related to deferred payment obligations associated with unpaid claim amounts for which
collectability is uncertain.
The table below displays the approximate cash paid or transferred to investors for credit risk transfer transactions. The
cash represents the portion of the guaranty fee paid to investors as compensation for taking on a share of the credit
risk.
Credit Risk Transfer Transactions | ||||
For the Year Ended December 31, | ||||
2023 | 2022 | |||
Cash paid or transferred for: | (Dollars in millions) | |||
CAS transactions(1) | $906 | $882 | ||
CIRT transactions | 409 | 325 | ||
Lender risk-sharing transactions | 133 | 154 | ||
(1)Consists of cash paid for interest expense net of LIBOR or SOFR, as applicable, on outstanding CAS debt and amounts paid for both CAS
REMIC® and CAS CLN transactions.
Cash paid or transferred to investors for CIRT transactions includes cancellation fees paid on certain CIRT transactions
where we determined that the cost of these deals exceeded the expected remaining benefit. The table excludes cash
paid upon the repurchase of legacy CAS debt. In 2023, we paid $169 million in purchase premiums in connection with
our repurchase of approximately $2 billion in CAS debt.
The following table displays the primary characteristics of the loans in our single-family conventional guaranty book of
business without credit enhancement.
Single-Family Loans Currently without Credit Enhancement | ||||||||
As of December 31, | ||||||||
2023 | 2022 | |||||||
Unpaid Principal Balance | Percentage of Single-Family Conventional Guaranty Book of Business | Unpaid Principal Balance | Percentage of Single-Family Conventional Guaranty Book of Business | |||||
(Dollars in billions) | ||||||||
Low LTV ratio or short-term(1) | $1,112 | 31% | $1,171 | 32% | ||||
Pre-credit risk transfer program inception(2) | 236 | 6 | 265 | 7 | ||||
Recently acquired(3) | 180 | 5 | 403 | 11 | ||||
Other(4) | 730 | 20 | 669 | 18 | ||||
Less: Loans in multiple categories | (267) | (7) | (382) | (10) | ||||
Total single-family loans currently without credit enhancement | $1,991 | 55% | $2,126 | 58% | ||||
(1)Represents loans with an LTV ratio less than or equal to 60% or loans with an original maturity of 20 years or less.
(2)Represents loans that were acquired before the inception of our credit risk transfer programs. Also includes Refi PlusTM loans.
(3)Represents loans that were recently acquired and have not been included in a reference pool.
MD&A | Single-Family Business | Single-Family Mortgage Credit Risk Management |
Fannie Mae 2023 Form 10-K | 90 |
(4)Includes adjustable-rate mortgage loans, loans with a combined LTV ratio greater than 97%, non-Refi Plus loans acquired after the
inception of our credit risk transfer programs that became 30 or more days delinquent prior to inclusion in a credit risk transfer transaction,
and loans that were delinquent as of December 31, 2023 or December 31, 2022. Also includes loans that were previously included in a
credit risk transfer transaction but subsequently had the coverage canceled.
Single-Family Problem Loan Management
Overview
Our problem loan management strategies focus primarily on reducing defaults to avoid losses that would otherwise
occur and pursuing foreclosure alternatives to mitigate the severity of the losses we incur. If a borrower does not make
required payments, or is in jeopardy of not making payments, we work with the loan servicer to offer workout solutions
to minimize the likelihood of foreclosure as well as the severity of loss. When appropriate, we seek to move to
foreclosure expeditiously.
Below we describe the following:
•delinquency statistics on our problem loans;
•efforts undertaken to manage our problem loans, including the role of servicers in loss mitigation, forbearance
plans, loan workouts, and sales of nonperforming and reperforming loans;
•metrics regarding our loan workout activities;
•REO management; and
•other single-family credit-related information, including our credit loss performance and credit loss
concentration metrics.
We also provide ongoing credit performance information on loans underlying single-family Fannie Mae MBS and loans
covered by single-family credit risk transfer transactions. For loans backing Fannie Mae MBS, see the “Forbearance
and Delinquency Dashboard” available in the MBS section of our Data Dynamics® tool, which is available at
www.fanniemae.com/datadynamics. For loans covered by credit risk transfer transactions, see the “Deal Performance
Data” report available in the CAS and CIRT sections of the tool. Information on our website is not incorporated into this
report. Information in Data Dynamics may differ from similar measures presented in our financial statements and other
public disclosures for a variety of reasons, including as a result of variations in the loan population covered, timing
differences in reporting and other factors.
Delinquency
The tables below display the delinquency status of loans and changes in the volume of seriously delinquent loans in our
single-family conventional guaranty book of business based on the number of loans. Single-family seriously delinquent
loans are loans that are 90 days or more past due or in the foreclosure process, expressed as a percentage of our
single-family conventional guaranty book of business based on loan count. Management monitors the single-family
serious delinquency rate as an indicator of potential future credit losses and loss mitigation activities. Serious
delinquency rates are reflective of our performance in assessing and managing credit risk associated with single-family
loans in our guaranty book of business. Typically, higher serious delinquency rates result in a higher allowance for loan
losses.
Delinquency Status and Activity of Single-Family Conventional Loans | ||||||
As of December 31, | ||||||
2023 | 2022 | 2021 | ||||
Delinquency status: | ||||||
30 to 59 days delinquent | 1.06% | 0.96% | 0.86% | |||
60 to 89 days delinquent | 0.26 | 0.23 | 0.20 | |||
Seriously delinquent (“SDQ”): | 0.55 | 0.65 | 1.25 | |||
Percentage of SDQ loans that have been delinquent for more than 180 days | 47 | 55 | 75 | |||
Percentage of SDQ loans that have been delinquent for more than two years | 10 | 16 | 9 | |||
MD&A | Single-Family Business | Single-Family Mortgage Credit Risk Management |
Fannie Mae 2023 Form 10-K | 91 |
For the Year Ended December 31, | ||||||
2023 | 2022 | 2021 | ||||
Single-family SDQ loans (number of loans): | ||||||
Beginning balance | 114,960 | 218,329 | 495,806 | |||
Additions | 169,197 | 171,437 | 232,411 | |||
Removals: | ||||||
Modifications and other loan workouts | (77,478) | (164,707) | (328,165) | |||
Liquidations and sales | (31,439) | (46,476) | (86,020) | |||
Cured or less than 90 days delinquent | (78,761) | (63,623) | (95,703) | |||
Total removals | (187,678) | (274,806) | (509,888) | |||
Ending balance | 96,479 | 114,960 | 218,329 | |||
Our single-family serious delinquency rate as of December 31, 2023 remained near historically low levels. Given our
expectation of slower economic and home price growth in 2024 and 2025, we expect the credit performance of the
loans in our single-family guaranty book of business may decline compared to recent performance, which could lead to
higher delinquencies or an increase in our single-family serious delinquency rate.
Factors that affect our single-family serious delinquency rate include:
•the percentage of our loans that receive forbearance and the length of time they remain in forbearance;
•the pace and effectiveness of payment deferrals, loan modifications and other workouts;
•the timing and volume of nonperforming loan sales we execute;
•pandemics and natural disasters;
•servicer performance; and
•changes in home prices, unemployment levels and other macroeconomic conditions.
MD&A | Single-Family Business | Single-Family Mortgage Credit Risk Management |
Fannie Mae 2023 Form 10-K | 92 |
The table below displays the serious delinquency rates for, and the percentage of our seriously delinquent single-family
conventional loans represented by, the specified loan categories. Percentage of book amounts represent the unpaid
principal balance of loans for each category divided by the unpaid principal balance of our total single-family
conventional guaranty book of business. The reported categories are not mutually exclusive.
Single-Family Conventional Seriously Delinquent Loan Concentration Analysis | |||||||||||||||||||
As of December 31, | |||||||||||||||||||
2023 | 2022 | 2021 | |||||||||||||||||
Percentage of Book Outstanding | Percentage of Seriously Delinquent Loans(1) | Serious Delinquency Rate | Percentage of Book Outstanding | Percentage of Seriously Delinquent Loans(1) | Serious Delinquency Rate | Percentage of Book Outstanding | Percentage of Seriously Delinquent Loans(1) | Serious Delinquency Rate | |||||||||||
States: | |||||||||||||||||||
California | 19% | 10% | 0.42% | 19% | 9% | 0.46% | 19% | 11% | 1.01% | ||||||||||
Florida | 6 | 9 | 0.73 | 6 | 9 | 0.90 | 6 | 8 | 1.59 | ||||||||||
Illinois | 3 | 5 | 0.70 | 3 | 5 | 0.86 | 3 | 5 | 1.55 | ||||||||||
New York | 5 | 6 | 0.92 | 5 | 7 | 1.12 | 5 | 7 | 2.24 | ||||||||||
Texas | 7 | 9 | 0.64 | 7 | 8 | 0.71 | 7 | 9 | 1.48 | ||||||||||
All other states | 60 | 61 | 0.52 | 60 | 62 | 0.62 | 60 | 60 | 1.15 | ||||||||||
Vintages: | |||||||||||||||||||
2008 and prior | 2 | 18 | 2.07 | 2 | 23 | 2.78 | 3 | 24 | 4.90 | ||||||||||
2009-2023 | 98 | 82 | 0.47 | 98 | 77 | 0.53 | 97 | 76 | 1.01 | ||||||||||
Estimated mark- to-market LTV ratio: | |||||||||||||||||||
<= 60% | 68 | 69 | 0.49 | 66 | 74 | 0.63 | 61 | 73 | 1.27 | ||||||||||
60.01% to 70% | 14 | 15 | 0.80 | 16 | 14 | 0.77 | 19 | 16 | 1.37 | ||||||||||
70.01% to 80% | 10 | 9 | 0.77 | 10 | 8 | 0.69 | 13 | 8 | 1.08 | ||||||||||
80.01% to 90% | 5 | 5 | 0.81 | 5 | 3 | 0.68 | 5 | 2 | 0.88 | ||||||||||
90.01% to 100% | 3 | 2 | 0.59 | 3 | 1 | 0.40 | 2 | 1 | 0.51 | ||||||||||
Greater than 100% | * | * | 2.05 | * | * | 4.04 | * | * | 12.41 | ||||||||||
Credit enhanced:(2) | |||||||||||||||||||
Primary MI & other(3) | 21 | 33 | 1.08 | 21 | 31 | 1.19 | 20 | 29 | 2.14 | ||||||||||
Credit risk transfer(4) | 36 | 30 | 0.54 | 31 | 28 | 0.66 | 21 | 32 | 1.80 | ||||||||||
Non-credit enhanced | 55 | 52 | 0.46 | 58 | 54 | 0.55 | 66 | 53 | 0.98 | ||||||||||
*Represents less than 0.5% of single-family conventional guaranty book of business.
(1)Calculated based on the number of single-family loans that were seriously delinquent for each category divided by the total number of
single-family conventional loans that were seriously delinquent.
(2)The credit-enhanced categories are not mutually exclusive. A loan with primary mortgage insurance that is also covered by a credit risk
transfer transaction will be included in both the “Primary MI & other” category and the “Credit risk transfer” category. As a result, the “Credit
enhanced” and “Non-credit enhanced” categories do not sum to 100%. The total percentage of our single-family conventional guaranty
book of business with some form of credit enhancement as of December 31, 2023 was 45%.
(3)Refers to loans included in an agreement used to reduce credit risk by requiring primary mortgage insurance, collateral, letters of credit,
corporate guarantees, or other agreements to provide an entity with some assurance that it will be compensated to some degree in the
event of a financial loss. Excludes loans covered by credit risk transfer transactions unless such loans are also covered by primary
mortgage insurance.
(4)Refers to loans included in reference pools for credit risk transfer transactions, including loans in these transactions that are also covered
by primary mortgage insurance. For CAS and some lender risk-sharing transactions, this represents the outstanding unpaid principal
balance of the underlying loans on the single-family mortgage credit book, not the outstanding reference pool, as of the specified date.
Loans included in our credit risk transfer transactions have all been acquired since 2009.
MD&A | Single-Family Business | Single-Family Mortgage Credit Risk Management |
Fannie Mae 2023 Form 10-K | 93 |
Forbearance Plans and Loan Workouts
As a part of our credit risk management efforts, we offer several types of loss mitigation options to help homeowners
stay in their home or to otherwise avoid foreclosure. Loss mitigation options can consist of a forbearance plan or a loan
workout. Our loan workouts reflect additional types of home retention solutions that help reinstate loans to current
status, including repayment plans, payment deferrals, and loan modifications. Our loan workouts also include
foreclosure alternatives, such as short sales and deeds in-lieu of foreclosure.
As of December 31, 2023, the unpaid principal balance of single-family loans in forbearance was $6.9 billion, or 0.2% of
our single-family conventional guaranty book of business, compared with $11.9 billion, or 0.3% of our single-family
conventional guaranty book of business, as of December 31, 2022.
We work with our servicers to implement our home retention solution and foreclosure alternative initiatives, and we
emphasize the importance of early contact with borrowers and early entry into a home retention solution. We require
that servicers first evaluate borrowers for eligibility under a workout option before considering foreclosure. The existence
of a second lien may limit our ability to provide borrowers with loan workout options, particularly those that are part of
our foreclosure prevention efforts; however, we are not required to contact a second lien holder to obtain their approval
prior to providing a borrower with a loan modification.
Home Retention Solutions
When a borrower cannot bring the loan current by reinstating the loan or through a repayment plan, we use our
payment deferral and loan modification workout options to help resolve the loan’s delinquency. A payment deferral is a
loss mitigation option which defers the repayment of the delinquent principal and interest payments and other eligible
default-related amounts that were advanced on behalf of the borrower by converting them into a non-interest-bearing
balance due at the earlier of the payoff date, the maturity date, or sale or transfer of the property. The remaining
mortgage terms, interest rate, payment schedule, and maturity date remain unchanged, and no trial period is required.
The number of months of payments deferred varies based on the types of hardships the borrower is facing.
We also offer single-family borrowers loan modifications, which contractually change the terms of the loan. Our loan
modification programs generally require completion of a trial period of three to four months where the borrower makes
reduced monthly payments prior to receiving the modification.
Our loan modifications include the following concessions:
•capitalization of past due amounts, a form of payment delay, which capitalizes interest and other eligible
default-related amounts that were advanced on behalf of the borrower that are past due into the unpaid
principal balance; and
•a term extension, which typically extends the contractual maturity date of the loan to 40 years from the effective
date of the modification.
In addition to these concessions, loan modifications may also include an interest rate reduction, which reduces the
contractual interest rate of the loan, or a principal forbearance, which is another form of payment delay that includes
forbearing repayment of a portion of the principal balance as a non-interest bearing amount that is due at the earlier of
the payoff date, the maturity date, or sale or transfer of the property.
Our primary loan modification program is currently the Flex Modification program, which offers payment relief for eligible
borrowers.
Foreclosure Alternatives
We offer foreclosure alternatives for borrowers who are unable to retain their homes. Foreclosure alternatives may be
more appropriate if the borrower has experienced a significant adverse change in financial condition due to events such
as long-term unemployment or reduced income, divorce, or unexpected issues like medical bills, and is therefore no
longer able to make the required mortgage payments. To avoid foreclosure and satisfy the first-lien mortgage obligation,
our servicers work with a borrower to:
•accept a deed-in-lieu of foreclosure, whereby the borrower voluntarily signs over the title to their property to the
servicer; or
•sell the home prior to foreclosure in a short sale, whereby the borrower sells the home for less than the full
amount owed to Fannie Mae under the mortgage loan.
These alternatives are designed to reduce our credit losses while helping borrowers avoid having to go through a
foreclosure. We work to obtain the highest price possible for the properties sold in short sales.
MD&A | Single-Family Business | Single-Family Mortgage Credit Risk Management |
Fannie Mae 2023 Form 10-K | 94 |
The chart below displays the unpaid principal balance of our completed single-family loan workouts by type, as well as
the number of loan workouts. This table does not include loans in an active forbearance arrangement, trial
modifications, loans to certain borrowers who have received bankruptcy relief and repayment plans that have been
initiated but not completed.
(1)There were approximately 16,300 loans, 15,800 loans and 39,100 loans in a trial modification period that was not yet complete as of
December 31, 2023, 2022 and 2021, respectively.
(2)Other was $516 million, $313 million and $866 million for the years ended December 31, 2023, 2022 and 2021, respectively. Other
includes repayment plans and foreclosure alternatives. Repayment plans reflect only those plans associated with loans that were 60 days
or more delinquent.
The overall decline in loan workout activity was primarily driven by fewer outstanding forbearance plans during 2023
compared with 2022 and 2021. Forbearance plans often result in a loan workout in order to resolve the loan’s
delinquency.
The total amount of principal and interest deferred to the end of the loan term for single-family loans that received a
payment deferral was $408 million for the year ended December 31, 2023, of which $248 million was deferred interest.
For the year ended December 31, 2022, the total amount of principal and interest deferred was $990 million, of which
$599 million was deferred interest. For the year ended December 31, 2021, the total amount of principal and interest
deferred was $3.9 billion, of which $2.4 billion was deferred interest.
The table below displays the percentage of our single-family loan modifications completed during 2022 and 2021 that
were current or paid off one year after modification and, for modifications completed during 2021, two years after
modification.
Percentage of Single-Family Completed Loan Modifications That Were Current or Paid Off at One and Two Years Post-Modification | ||||||||||||||||
2022 Modifications | 2021 Modifications | |||||||||||||||
Q4 | Q3 | Q2 | Q1 | Q4 | Q3 | Q2 | Q1 | |||||||||
One Year Post-Modification | 75% | 79% | 84% | 87% | 88% | 90% | 91% | 92% | ||||||||
Two Years Post-Modification | 91 | 93 | 94 | 96 | ||||||||||||
MD&A | Single-Family Business | Single-Family Mortgage Credit Risk Management |
Fannie Mae 2023 Form 10-K | 95 |
Nonperforming and Reperforming Loan Sales
We also undertake efforts to mitigate credit losses and manage our problem loans by selling our nonperforming and
reperforming loans, thereby removing them from our guaranty book of business. This problem loan management
strategy is intended to reduce: the number of seriously-delinquent loans, the severity of losses incurred on these loans,
and the capital we would be required to hold for such loans.
In February 2023, FHFA instructed us to put sales of nonperforming and reperforming loans on hold until further notice.
In June 2023, FHFA instructed us that we may resume these loan sales upon implementation of revised loan sale
requirements that enhance or expand upon certain consumer protections that existed in our prior requirements. We
resumed activity under our loan sales program in the third quarter of 2023.
Nonperforming and Reperforming Loan Sale Activity | |||||||
For the Year Ended December 31, | |||||||
2023 | 2022 | 2021 | |||||
(Dollars in millions) | |||||||
Reperforming Loan Sales: | |||||||
Number of loans sold | 11,626 | 29,676 | 94,397 | ||||
Aggregate unpaid principal balance of loan sales | $2,219 | $4,974 | $13,568 | ||||
Nonperforming Loan Sales: | |||||||
Number of loans sold | 2,265 | 8,215 | 18,250 | ||||
Aggregate unpaid principal balance of loan sales | $354 | $1,354 | $3,200 | ||||
REO Management
If a loan defaults, we may acquire the property through foreclosure or a deed-in-lieu of foreclosure. The table below
displays our REO activity by region. Regional REO acquisition trends generally follow a pattern that is similar to, but
lags, that of regional delinquency trends.
Single-Family REO Properties | |||||||
For the Year Ended December 31, | |||||||
2023 | 2022 | 2021 | |||||
Single-family REO properties (number of properties): | |||||||
Beginning of period inventory of single-family REO properties(1) | 8,779 | 7,166 | 7,973 | ||||
Acquisitions by geographic area:(2) | |||||||
Midwest | 1,265 | 1,606 | 1,166 | ||||
Northeast | 847 | 1,049 | 1,077 | ||||
Southeast | 982 | 1,136 | 1,076 | ||||
Southwest | 754 | 768 | 570 | ||||
West | 344 | 322 | 231 | ||||
Total REO acquisitions(1) | 4,192 | 4,881 | 4,120 | ||||
Dispositions of REO | (4,568) | (3,268) | (4,927) | ||||
End of period inventory of single-family REO properties(1) | 8,403 | 8,779 | 7,166 | ||||
Carrying value of single-family REO properties (dollars in millions) | $1,396 | $1,293 | $959 | ||||
Single-family foreclosure rate(3) | 0.02 | % | 0.03 | % | 0.02 | % | |
REO net sales price to unpaid principal balance(4) | 129 | % | 114 | % | 111 | % | |
REO net sales price to unpaid principal balance and capitalized expenses(5) | 97 | % | 102 | % | 97 | % | |
Short sales net sales price to unpaid principal balance(6) | 91 | % | 91 | % | 84 | % | |
(1)Includes held-for-use properties, which are reported in our consolidated balance sheets as a component of “Other assets.”
(2)See footnote 9 to the “Key Risk Characteristics of Single-Family Conventional Business Volume and Guaranty Book of Business” table for
states included in each geographic region.
MD&A | Single-Family Business | Single-Family Mortgage Credit Risk Management |
Fannie Mae 2023 Form 10-K | 96 |
(3)Reflects the total number of properties acquired through foreclosure or deeds-in-lieu of foreclosure as a percentage of the total number of
loans in our single-family conventional guaranty book of business as of the end of each period.
(4)Calculated as the amount of sale proceeds received on disposition of REO properties during the respective periods, excluding those
subject to repurchase requests made to our sellers or servicers, divided by the aggregate unpaid principal balance of the related loans at
the time of foreclosure. Net sales price represents the contract sales price less selling costs for the property and other charges paid by the
seller at closing.
(5)Calculated as the amount of sale proceeds received on disposition of REO properties during the respective periods, excluding those
subject to repurchase requests made to our sellers or servicers, divided by the aggregate unpaid principal balance of the related loans at
the time of foreclosure and costs of certain repairs that have been capitalized as part of the carrying value of the property. Net sales price
represents the contract sales price less selling costs for the property and other charges paid by the seller at closing.
(6)Calculated as the amount of sale proceeds received on properties sold in short sale transactions during the respective periods divided by
the aggregate unpaid principal balance of the related loans. Net sales price includes borrower relocation incentive payments and
subordinate lien(s) negotiated payoffs.
Our primary objectives for our REO inventory are to facilitate equitable and sustainable access to homeownership,
quality affordable rental housing, and housing for owner occupant and community-minded purchasers, while obtaining
the highest price possible. We conduct repairs on the majority of the REO properties we acquire. These improvements
help make the homes more sustainable and support sales to owner-occupant buyers.
We market and sell the majority of our foreclosed properties through local real estate professionals. In some cases, we
use alternative methods of disposition, including selling homes to municipalities, other public entities or non-profit
organizations, and selling properties through public auctions. We also engage in third-party sales at foreclosure, which
allow us to avoid maintenance and other REO expenses we would have incurred had we acquired the property.
As shown in the chart below, the majority of our REO properties are unable to be marketed at any given time because
the properties are under repair, occupied or are subject to state or local redemption or confirmation periods, which
delays the marketing and disposition of these properties.
Single-Family Credit Loss Performance Metrics and Loan Sale Performance
The single-family credit loss performance metrics and loan sale performance measures below present information about
losses or gains we realized on our single-family loans during the periods presented. For the purposes of our single-
family credit loss performance metrics, credit losses or gains represent write-offs net of recoveries and foreclosed
property income or expense. The amount of these losses or gains in a given period is driven by foreclosures, pre-
foreclosure sales, post-foreclosure REO activity, mortgage loan redesignations, and other events that trigger write-offs
and recoveries. The single-family credit loss metrics we present are not defined terms and may not be calculated in the
same manner as similarly titled measures reported by other companies. Management uses these measures to evaluate
the effectiveness of our single-family credit risk management strategies in conjunction with leading indicators such as
serious delinquency and forbearance rates, which are potential indicators of future realized single-family credit losses.
We believe these measures provide useful information about our single-family credit performance and the factors that
impact it.
MD&A | Single-Family Business | Single-Family Mortgage Credit Risk Management |
Fannie Mae 2023 Form 10-K | 97 |
The table below displays the components of our single-family credit loss performance metrics. Because sales of
nonperforming and reperforming loans have been a part of our credit loss mitigation strategy in recent periods, we also
provide information in the table below on our loan sale performance through the “Gains (losses) on sales and other
valuation adjustments” line item.
Single-Family Credit Loss Performance Metrics and Loan Sale Performance | ||||||
For the Year Ended December 31, | ||||||
2023 | 2022 | 2021 | ||||
(Dollars in millions) | ||||||
Write-offs | $(223) | $(211) | $(51) | |||
Recoveries | 210 | 288 | 430 | |||
Foreclosed property income (expense) | 10 | (55) | (14) | |||
Credit gains (losses) | (3) | 22 | 365 | |||
Write-offs on the redesignation of mortgage loans from HFI to HFS(1) | (658) | (679) | (372) | |||
Net credit gains (losses) and write-offs on redesignations | (661) | (657) | (7) | |||
Gains (losses) on sales and other valuation adjustments(2) | (52) | (207) | 1,312 | |||
Net credit gains (losses), write-offs on redesignations and gains (losses) on sales and other valuation adjustments | $(713) | $(864) | $1,305 | |||
Credit gain (loss) ratio (in bps)(3) | * | 0.1 | 1.1 | |||
Net credit gains (losses), write-offs on redesignations and gains (losses) on sales and other valuation adjustments ratio (in bps)(4) | (2.0) | (2.4) | 3.9 | |||
*Represents less than 0.05 bps.
(1)Consists of the lower of cost or fair value adjustment at time of redesignation.
(2)Consists of gains or losses realized on the sales of nonperforming and reperforming mortgage loans during the period and temporary
lower-of-cost-or-market adjustments on HFS loans, which are recognized in “Investment gains (losses), net” in our consolidated
statements of operations and comprehensive income.
(3)Calculated based on the amount of “Credit gains (losses)” divided by the average single-family conventional guaranty book of business
during the period.
(4)Calculated based on the amount of “Net credit gains (losses), write-offs on redesignations and gains (losses) on sales and other valuation
adjustments” divided by the average single-family conventional guaranty book of business during the period.
The primary driver of our net credit losses, write-offs on redesignations and losses on sales and other valuation
adjustments in 2023 was write-offs upon the redesignation of mortgage loans from HFI to HFS. During 2023, we
redesignated loans with an amortized cost of $3.3 billion. Interest rates on loans redesignated in 2023 were below
current market interest rates resulting in write-offs upon the redesignation.
For information on our benefit or provision for credit losses, which includes changes in our allowance, see “Consolidated
Results of Operations—Benefit (Provision) for Credit Losses” and “Single-Family Business Financial Results.”
MD&A | Single-Family Business | Single-Family Mortgage Credit Risk Management |
Fannie Mae 2023 Form 10-K | 98 |
The table below displays concentrations of our net single-family credit gains (losses) and write-offs on redesignations
based on geography and loan vintages.
Concentration Analysis of Net Credit Gains (Losses) and Write-offs on Redesignations | ||||||||
Percentage of Single-Family Conventional Guaranty Book of Business Outstanding(1) | Amount of Single-Family Credit Gains (Losses) and Redesignation Write-offs(2) | |||||||
As of December 31, | As of December 31, | |||||||
2023 | 2022 | 2023 | 2022 | |||||
(Dollars in millions) | ||||||||
Geographical distribution: | ||||||||
California | 19% | 19% | $(115) | $(94) | ||||
Florida | 6 | 6 | (15) | (23) | ||||
Illinois | 3 | 3 | (51) | (69) | ||||
New York | 5 | 5 | (64) | (73) | ||||
Texas | 7 | 7 | (39) | (44) | ||||
All other states | 60 | 60 | (377) | (354) | ||||
Total | 100% | 100% | $(661) | $(657) | ||||
Vintages: | ||||||||
2008 and prior | 2% | 2% | $4 | $(100) | ||||
2009 - 2023 | 98 | 98 | (665) | (557) | ||||
Total | 100% | 100% | $(661) | $(657) | ||||
(1)Calculated based on the aggregate unpaid principal balance of single-family loans for each category divided by the aggregate unpaid
principal balance of loans in our single-family conventional guaranty book of business as of the end of each period.
(2)Credit gains (losses) and write-offs on redesignations do not include gains (losses) on sales and other valuation adjustments. Excludes the
impact of recoveries resulting from resolution agreements related to representation and warranty matters and compensatory fee income
related to servicing matters that have not been allocated to specific loans.
MD&A | Single-Family Business | Single-Family Mortgage Credit Risk Management |
Fannie Mae 2023 Form 10-K | 99 |
Single-Family Maturity Information
The below table shows the contractual maturities and interest rate sensitivities of our single-family mortgage loan
portfolio as recorded on our consolidated balance sheets. Although the loans in our consolidated portfolio have varying
contractual terms (for example, 15-year, 30-year, etc.), the actual life of the loans is likely to be significantly less than
their contractual term as a result of prepayment. Therefore, the contractual term is not a reliable indicator of the loans’
expected lives. Single-family mortgages can be prepaid in whole or in part at any time without penalty.
Single-Family Loans: Maturities and Terms of the Consolidated Mortgage Loan Portfolio(1) | ||||||||||
As of December 31, 2023 | ||||||||||
Due within 1 year(2) | Greater than 1 year but within 5 years | Greater than 5 years but within 15 years | Greater than 15 years | Total | ||||||
(Dollars in millions) | ||||||||||
Single-family mortgage loans: | ||||||||||
Loans held for sale | $63 | $207 | $618 | $1,902 | $2,790 | |||||
Loans held for investment | ||||||||||
Of Fannie Mae | 4,890 | 3,909 | 11,047 | 27,242 | 47,088 | |||||
Of consolidated trusts | 127,590 | 532,819 | 1,347,371 | 1,584,310 | 3,592,090 | |||||
Total unpaid principal balance of single-family mortgage loans | 132,543 | 536,935 | 1,359,036 | 1,613,454 | 3,641,968 | |||||
Cost basis adjustments, net | 42,151 | |||||||||
Total single-family mortgage loans(3) | $132,543 | $536,935 | $1,359,036 | $1,613,454 | $3,684,119 | |||||
Single-family mortgage loans by interest rate sensitivity: | ||||||||||
Fixed-rate | $126,454 | $532,651 | $1,347,025 | $1,601,137 | $3,607,267 | |||||
Adjustable-rate | 6,089 | 4,284 | 12,011 | 12,317 | 34,701 | |||||
Total unpaid principal balance of single- family mortgage loans | $132,543 | $536,935 | $1,359,036 | $1,613,454 | $3,641,968 | |||||
(1)We report the scheduled repayments in the maturity category in which the payment is due, such that a loan’s balance may be presented
across multiple maturity categories.
(2)Due within 1 year includes reverse mortgages for which there is no defined maturity date of $5.4 billion as of December 31, 2023.
(3)Excludes accrued interest receivable. The unpaid principal balance of single family loans is based on the amount of contractual unpaid
principal balance due and excludes any write-offs for amounts deemed uncollectible. Those write-offs are presented as a component of
cost basis adjustments, net.
Multifamily Business
Multifamily Primary Business Activities
Providing Liquidity for Multifamily Mortgage Loans
Our Multifamily business provides mortgage market liquidity primarily for properties with five or more residential units,
which may be apartment communities, cooperative properties, seniors housing, dedicated student housing or
manufactured housing communities. Our Multifamily business works with our multifamily lenders to provide funds to the
mortgage market primarily by securitizing multifamily mortgage loans acquired from these lenders into Fannie Mae
MBS, which are sold to investors or dealers. We also purchase multifamily mortgage loans and provide credit
enhancement for bonds issued by state and local housing finance authorities to finance multifamily housing. Our
Multifamily business supports liquidity in the mortgage market through other activities, such as buying and selling
Fannie Mae multifamily MBS and issuing structured securities backed by Fannie Mae collateral. We also continue to
invest in multifamily low-income housing tax credit (“LIHTC”) projects to help support and preserve the supply of
affordable rental housing.
MD&A | Single-Family Business | Single-Family Mortgage Credit Risk Management |
Fannie Mae 2023 Form 10-K | 100 |
Key Characteristics of the Multifamily Business
The Multifamily business has a number of key characteristics that distinguish it from our Single-Family business.
•Collateral: Multifamily loans are collateralized by properties that generate cash flows predominantly driven by
rental income received from tenants and effectively operate as businesses.
•Borrowers and sponsors: Multifamily borrowing entities are typically owned, directly or indirectly, by for-profit
corporations, limited liability companies, partnerships, real estate investment trusts and individuals who invest
in real estate for cash flow and expected returns in excess of their original contribution of equity. Borrowing
entities are typically single-asset entities, with the property as their only asset. The ultimate owner of a
multifamily borrowing entity is referred to as the “sponsor.” We evaluate both the borrowing entity and its
sponsor when considering a new transaction and managing our business. We refer to both the borrowing
entities and their sponsors as “borrowers.” When considering a multifamily borrower, creditworthiness is
evaluated through a combination of quantitative and qualitative data, including liquid assets, net worth, number
of units owned, experience in a market and/or property type, multifamily portfolio performance, access to
additional liquidity, debt maturities, asset/property management platform, senior management experience,
reputation, and exposures to lenders and Fannie Mae.
•Non-recourse: Multifamily loans are generally non-recourse to the borrowers, meaning that we may only seek
repayment of the loan through the value of the underlying collateral.
•Lenders: During 2023, we executed multifamily transactions with 28 lenders. Of these, 24 lenders delivered
loans to us under our DUS program described below. In determining whether to partner with a multifamily
lender, we consider the lender’s financial strength, multifamily underwriting and servicing experience, portfolio
performance and willingness and ability to share in the risk of loss associated with the multifamily loans they
originate.
•Loan size: The average size of a loan (based on unpaid principal balance) in our multifamily guaranty book of
business was $16 million as of December 31, 2023.
•Underwriting process: Multifamily loans require detailed underwriting of the property’s operating cash flow. Our
underwriting standards include an evaluation of the property’s operating income compared to loan payments,
property market value, property quality and condition, market and submarket factors, and ability to refinance at
maturity.
•Term and lifecycle: In contrast to the standard 30-year single-family residential loan, multifamily loans typically
have original loan terms between 5 and 15 years.
•Prepayment terms: To protect against prepayments, most multifamily Fannie Mae loans impose prepayment
premiums, primarily yield maintenance. This is in contrast to single-family loans, which do not have prepayment
premiums.
Delegated Underwriting and Servicing Program
Fannie Mae’s DUS program is a unique business model that aligns the interests of the lender and Fannie Mae. Our
DUS lender network of 24 current members is composed of mortgage banking companies, large diversified financial
institutions, and banks. We pre-approve DUS lenders and delegate to these lenders the authority to underwrite and
service multifamily loans on our behalf in accordance with our standards and requirements. Delegation permits lenders
to respond to customers more rapidly, as the lender generally has the authority to approve a loan within our prescribed
parameters. Fannie Mae’s internal credit team assesses whether a loan’s risk profile is within our risk tolerance when
that loan’s credit characteristics do not meet established delegation criteria.
DUS lenders typically share approximately one-third of the credit risk on our multifamily loans for the life of the loans.
The servicing fees we pay to DUS lenders include compensation for the portion of credit risk they retain. See
“Multifamily Mortgage Credit Risk Management” for additional information about our lender risk sharing.
Multifamily Mortgage Servicing
Substantially all of the multifamily loans in our guaranty book of business as of December 31, 2023 and 2022 were
serviced by DUS lenders or their affiliates on our behalf. Multifamily servicers are responsible for the ongoing evaluation
of the financial condition of properties and property owners, administering various types of loan- and property-level
agreements (including agreements covering replacement reserves, completion or repair, and operations and
maintenance), as well as conducting routine property inspections. We monitor multifamily servicing relationships and
retain the right to approve servicing transfers, which are infrequent.
MD&A | Multifamily Business | Multifamily Primary Business Activities |
Fannie Mae 2023 Form 10-K | 101 |
Multifamily Credit Risk and Credit Loss Management
Our Multifamily business:
•Sets the underwriting standards and credit requirements for lenders to underwrite multifamily loans on our
behalf.
•Prices and manages the credit risk on loans in our multifamily guaranty book of business. Lenders retain a
portion of the credit risk in substantially all multifamily transactions.
•Enters into transactions that transfer an additional portion of Fannie Mae’s credit risk on some of the loans in
our multifamily guaranty book of business through back-end credit risk transfer transactions.
•Works to reduce costs of defaulted multifamily loans, including through loss mitigation strategies such as
forbearance and modification, management of foreclosures and our REO inventory, and pursuing contractual
remedies from lenders, servicers, borrowers, sponsors, and providers of credit enhancement.
See “Multifamily Mortgage Credit Risk Management” for a discussion of our strategies for managing credit risk and
credit losses on multifamily loans.
Multifamily Activities Supporting Affordable Rental Housing
Overview
A core component of Fannie Mae’s mission is to support the U.S. multifamily housing market by helping serve the
nation’s rental housing needs. We focus on supporting affordable housing, which is housing that is affordable to
households earning at or below the median income in their area, as well as on workforce housing, which is housing up
to 120% of area median income. Over 95% of the multifamily units we financed in 2023 that were potentially eligible for
housing goals credit were affordable to those earning at or below 120% of the median income in their area. The chart
below shows a breakout of multifamily acquisitions by area median income.
Multifamily Acquisitions by Area Median Income (AMI)(1)
(1)Based on rents reported at loan origination. Rents may change following loan origination. Reflects multifamily acquisitions potentially
eligible for housing goals credit, which consists of new units financed by first liens; excludes second liens on units for which we had
financed the first lien, manufactured housing communities, and manufactured housing rentals.
MD&A | Multifamily Business | Multifamily Primary Business Activities |
Fannie Mae 2023 Form 10-K | 102 |
Targeted Affordable Housing
To serve low- and very-low-income households, we have a team that focuses exclusively on relationships with lenders
financing privately-owned multifamily properties that receive public subsidies in exchange for maintaining long-term
affordable rents. We work with borrowers that may utilize housing programs and subsidies provided by local, state and
federal agencies; examples include tax incentives (such as those provided through LIHTC or tax abatement) and rent
subsidies (such as project-based Section 8 rental assistance or tenant vouchers). The public subsidy programs are
largely targeted to provide housing to those earning less than 60% of area median income (as defined by HUD) and are
structured to ensure that the low- and very low-income households who benefit from the programs pay no more than
30% of their gross monthly income for rent and utilities. As of December 31, 2023, these affordable loans represented
approximately 12% of our multifamily guaranty book of business, based on unpaid principal balance, including
$7.3 billion in bond credit enhancements.
Our acquisition of loans financing properties affordable to low- and very-low income households help us meet our
multifamily housing goals and FHFA’s requirement that a portion of our multifamily volume be focused on affordable and
underserved markets. We discuss our multifamily housing goals in “Business—Legislation and Regulation—Housing
Goals—Multifamily Housing Goals” and we discuss our requirement to focus on affordable and underserved markets in
“Multifamily Business Metrics—Multifamily New Business Volume.”
Equity Investments in Low Income Housing Tax Credit Projects
In addition to acquiring loans serving low- and very-low income households, we also make equity investments in LIHTC
projects. LIHTC encourages private equity investment in creating and preserving affordable units throughout the country
by awarding federal tax credits to affordable housing developers, who then exchange those tax credits with corporate
investors, such as Fannie Mae, in return for capital contributions. In late 2017, FHFA permitted our reentry into LIHTC
investing, capping activity at a specified annual investment limit and requiring a portion of those investments to be in
transactions identified as having difficulty attracting investors or in Duty to Serve-designated rural areas. In December
2023, FHFA increased our annual LIHTC investment limit to $1 billion beginning in 2024, with any investments above
$500 million in a given year required to be targeted towards transactions identified as having difficulty attracting
investors or in Duty to Serve-designated rural areas. We have committed approximately $4 billion in net equity to LIHTC
investments since the beginning of 2018, in line with FHFA’s annual limits.
Multifamily Lenders and Investors
In support of our mission to facilitate equitable and sustainable access to quality affordable rental housing across
America, our Multifamily business works primarily with our DUS lender network. During 2023, our top five multifamily
lenders, in the aggregate, accounted for 48% of our multifamily business volume, compared with 49% in 2022. Two of
our lenders, Walker & Dunlop and Berkadia, accounted for 13% and 10% respectively, of our 2023 multifamily business
volume. No other lenders accounted for 10% or more of our multifamily business volume in 2023.
We have a diversified funding base of domestic and international investors. Purchasers of multifamily Fannie Mae MBS
include fund managers, commercial banks, pension funds, insurance companies, corporations, state and local
governments, and other municipal authorities. We also have separate investor bases for our back-end credit risk
transactions. Our Multifamily Connecticut Avenue SecuritiesTM (“MCASTM”) investors include fund managers, hedge
funds and insurance companies, while our Multifamily CIRTTM (“MCIRTTM”) transactions are executed with insurers and
reinsurers.
Multifamily Competition
Overview
We compete to acquire multifamily mortgage assets in the secondary mortgage market and to issue multifamily
mortgage-related securities to investors. Our primary competitors for the acquisition of multifamily mortgage assets and
issuance of multifamily mortgage-related securities are Freddie Mac, life insurers, U.S. banks and thrifts, other
institutional investors, Ginnie Mae, and private-label issuers of commercial mortgage-backed securities. Competition in
these activities is significantly affected by both our and our competitors’ pricing, credit standards and loan structures,
lender preferences, investor demand for our and our competitors’ mortgage-related securities, market conditions, and
actions we take to support affordable multifamily housing. Our competitive environment also may be affected by many
other factors, including direction from FHFA; changes in our obligations under our senior preferred stock purchase
agreement with Treasury; changes in our capital requirements; and new legislation or regulation applicable to us, our
lenders or our investors. See “Business—Conservatorship and Treasury Agreements,” “Business—Legislation and
Regulation,” and “Risk Factors” for information on matters that could affect our business and competitive environment.
MD&A | Multifamily Business | Multifamily Primary Business Activities |
Fannie Mae 2023 Form 10-K | 103 |
Multifamily Mortgage-Related Securities Issuance Share
The chart below displays our estimated share of multifamily mortgage-related securities issuances during the twelve
months ended as of September 30, 2023, the latest date available, as compared with that of our primary competitors for
the issuance of multifamily mortgage-related securities.
2023 Multifamily Mortgage-Related Securities Issuances Share(1)

(1)According to the American Council of Life Insurers (“ACLI”), Trepp, Mortgage Bankers Association and Fannie Mae Multifamily Economic
Research Group. Our mortgage-related securities do not include resecuritizations issued through our Fannie Mae GeMS program.
Multifamily Mortgage Debt Outstanding
As shown in the chart below, we have remained a continuous source of liquidity in the U.S. multifamily market. Our
financing of an estimated 21% of the mortgage debt outstanding in the country represents the largest share of any
market participant.
Multifamily Mortgage Debt Outstanding(1)
(Dollars in trillions)
(1)Multifamily mortgage debt outstanding as of September 30, 2023 is based on the Federal Reserve’s December 2023 mortgage debt
outstanding release, the latest date for which the Federal Reserve has estimated mortgage debt outstanding for multifamily residences.
Prior-period amounts have been updated to reflect revised historical data from the Federal Reserve.
MD&A | Multifamily Business | Multifamily Competition |
Fannie Mae 2023 Form 10-K | 104 |
Multifamily Mortgage Market
Multifamily market fundamentals, which include factors such as vacancy rates and rent growth, softened during the
fourth quarter of 2023, due to elevated levels of new supply entering the U.S. housing market.
•Vacancy rates. Based on preliminary third-party data, we estimate that the national multifamily vacancy rate for
institutional investment-type apartment properties increased to 6.0% as of December 31, 2023, compared with
5.8% as of September 30, 2023 and 5.5% as of December 31, 2022. The estimated average national
multifamily vacancy rate over the last 15 years remained at approximately 5.8%.
•Rents. Based on preliminary third-party data, we estimate that rent growth turned negative during the fourth
quarter of 2023, declining by 0.7%, compared with an increase of 0.5% in the third quarter of 2023 and a
decline of 0.8% in the fourth quarter of 2022. As a result, rent growth for 2023 was below average at just 0.8%.
Vacancy rates and rents are important to loan performance because multifamily loans are generally repaid from the
cash flows generated by the underlying property. Several years of low vacancy rates and rising rents helped to increase
property values in most metropolitan areas, but that trend reversed starting in early 2023. Based on preliminary
multifamily property sales data, transaction volumes for the fourth quarter of 2023 remained well below average levels.
Available data suggests that multifamily property capitalization rates, the indicated rate of return on investment of a
commercial property, increased slightly in the fourth quarter of 2023 and are estimated to have increased by about 60
basis points year-over-year.
We estimate that more than 500,000 multifamily units were delivered to the U.S. housing market in 2023. Multifamily
construction underway remains elevated, with more than 1,000,000 units underway. We expect new multifamily
deliveries in 2024 will remain elevated and near 2023 levels.
We believe vacancy levels could rise later this year to 6.25% and rent growth will remain below recent averages, in the
1.0% to 1.5% range, as a result of rising levels of consumer debt, elevated new construction completions, and
anticipated slowing job growth.
Multifamily Business Metrics
Multifamily New Business Volume
The chart below displays our new loan acquisitions by unpaid principal balance and number of units financed.
Multifamily New Business Volume
(Dollars in billions)
(1)Reflects unpaid principal balance of multifamily Fannie Mae MBS issued, multifamily loans purchased, and credit enhancements provided
on multifamily mortgage assets during the period.
(2)Reflects new units financed by first liens; excludes second liens on units for which we had financed the first lien, as well as manufactured
housing rentals. Second liens and manufactured housing rentals are included in unpaid principal balance.
We are subject to an annual multifamily loan purchase cap set by FHFA. In 2023, we remained below our multifamily
volume cap of $75 billion. For 2024, FHFA has reduced our multifamily volume cap to $70 billion. Consistent with the
2023 cap, a minimum of 50% of our 2024 multifamily loan purchases must be mission-driven, focused on specified
affordable and underserved market segments. For 2024, FHFA has exempted from the volume cap loans financing
workforce housing properties meeting specified criteria that preserve long-term affordability for the properties. See “Risk
MD&A | Multifamily Business | Multifamily Mortgage Market |
Fannie Mae 2023 Form 10-K | 105 |
Factors—GSE and Conservatorship Risk” for information on how conservatorship requirements such as these may
affect our business activities.
Multifamily Securities Issuances
We securitize the vast majority of multifamily mortgage loans we acquire through lender swap transactions. We also
support liquidity in the market by issuing structured MBS backed by multifamily Fannie Mae MBS, including through our
Fannie Mae GeMSTM program.
Multifamily Fannie Mae MBS Issuances
(Dollars in billions)
(1)A portion of structured securities issuances may be backed by Fannie Mae MBS issued during the same period and held by Fannie Mae.
Structured securities backed by Fannie Mae MBS that are issued by a third party are not included in the multifamily Fannie Mae MBS
structured security issuance amounts.
MD&A | Multifamily Business | Multifamily Business Metrics |
Fannie Mae 2023 Form 10-K | 106 |
Multifamily Guaranty Book of Business and Average Charged Guaranty Fee
The chart below displays the unpaid principal balance and average charged guaranty fee related to our multifamily
guaranty book of business.
Multifamily Guaranty Book of Business and Charged Fee(1)
(Dollars in billions)
(1)For information reported in this “Multifamily Business” section, our multifamily guaranty book of business is measured using the unpaid
principal balance of mortgage loans underlying Fannie Mae MBS. By contrast, the multifamily guaranty book of business presented in the
“Composition of Fannie Mae Guaranty Book of Business” table in the “Guaranty Book of Business” section is based on the unpaid principal
balance of Fannie Mae MBS outstanding. These amounts differ primarily as a result of payments we receive on underlying loans that have
not yet been paid to the MBS holders.
(2)Our multifamily guaranty book of business primarily consists of multifamily mortgage loans underlying Fannie Mae MBS outstanding,
multifamily mortgage loans of Fannie Mae held in our retained mortgage portfolio, and other credit enhancements that we provide on
multifamily mortgage assets. It does not include non-Fannie Mae multifamily mortgage-related securities held in our retained mortgage
portfolio for which we do not provide a guaranty.
Our multifamily guaranty book of business grew 7% in 2023 to $470.4 billion, driven by our acquisitions combined with
low prepayment volumes due to the high interest rate environment.
The average charged guaranty fee on our multifamily guaranty book of business decreased in 2023 compared with
2022, primarily due to lower average charged fees on our 2023 acquisitions as compared with the existing loans in our
multifamily guaranty book of business.
Our average charged guaranty fee represents the return we earn as compensation for the credit risk we assume on our
multifamily guaranty book of business. It is impacted by the rate at which loans in our book of business turn over as well
as the guaranty fees we charge on new business volumes, which are set at the time we acquire the loans. Our
multifamily guaranty fee pricing is primarily based on the individual credit risk characteristics of the loans we acquire and
the aggregate credit risk characteristics of our multifamily guaranty book of business. Our multifamily guaranty fee
pricing is also influenced by external forces, such as the availability of other sources of liquidity, our mission-related
goals, the FHFA volume cap, interest rates, MBS spreads, and the management of the overall composition of our
multifamily guaranty book of business.
MD&A | Multifamily Business | Multifamily Business Metrics |
Fannie Mae 2023 Form 10-K | 107 |
Multifamily Business Financial Results
This section provides a discussion of the primary components of net income for our Multifamily Business.
Multifamily Business Financial Results(1) | ||||||||||||||
For the Year Ended December 31, | Variance | |||||||||||||
2023 | 2022 | 2021 | 2023 vs. 2022 | 2022 vs. 2021 | ||||||||||
(Dollars in millions) | ||||||||||||||
Net interest income | $4,544 | $4,687 | $4,158 | $(143) | $529 | |||||||||
Fee and other income | 70 | 88 | 92 | (18) | (4) | |||||||||
Net revenues | 4,614 | 4,775 | 4,250 | (161) | 525 | |||||||||
Fair value gains (losses), net | 73 | (80) | (12) | 153 | (68) | |||||||||
Administrative expenses | (611) | (540) | (508) | (71) | (32) | |||||||||
Benefit (provision) for credit losses | (495) | (1,248) | 530 | 753 | (1,778) | |||||||||
Credit enhancement expense(2) | (231) | (261) | (239) | 30 | (22) | |||||||||
Change in expected credit enhancement recoveries(3) | 117 | 257 | (108) | (140) | 365 | |||||||||
Other expenses, net(4) | (301) | (214) | (87) | (87) | (127) | |||||||||
Income before federal income taxes | 3,166 | 2,689 | 3,826 | 477 | (1,137) | |||||||||
Provision for federal income taxes | (613) | (536) | (777) | (77) | 241 | |||||||||
Net income | $2,553 | $2,153 | $3,049 | $400 | $(896) | |||||||||
(1)See “Note 11, Segment Reporting” for information about our segment allocation methodology.
(2)Primarily consists of costs associated with our MCIRT and MCAS programs as well as amortization expense for certain lender risk-sharing
programs.
(3)Consists of change in benefits recognized from our freestanding credit enhancements that primarily relate to our DUS lender risk-sharing.
(4)Consists of investment gains or losses, expenses associated with legal claims, foreclosed property income (expense), gains or losses from
partnership investments, debt extinguishment gains or losses, and other income or expenses.
Net interest income
Multifamily net interest income decreased in 2023 compared with 2022 primarily due to lower yield maintenance income as a result of fewer prepayments, as well as lower average charged guaranty fees, partially offset by an increase in our multifamily guaranty book of business. |
MD&A | Multifamily Business | Multifamily Business Financial Results | ||
Fannie Mae 2023 Form 10-K | 108 |
Benefit (provision) for credit losses
Provision for credit losses in 2023 was primarily driven by changes in loan activity and provision from actual and projected economic data, as decreasing multifamily property values throughout 2023 resulted in higher estimated LTV ratios in our multifamily guaranty book of business. |
Provision for credit losses in 2022 was primarily driven by our expectation of increased probability of default and greater expected severity of loss on our seniors housing portfolio, as well as higher actual and projected interest rates. |
Multifamily Mortgage Credit Risk Management
Our strategy for managing multifamily mortgage credit risk consists of the following primary components:
•our acquisition and servicing policies along with our underwriting and servicing standards;
•guaranty book diversification and monitoring;
•the transfer of mortgage credit risk to third parties; and
•management of problem loans.
The credit risk profile of a loan in our multifamily guaranty book of business is primarily influenced by:
•the current and anticipated cash flows from the property;
•the type and location of the property;
•the condition and value of the property;
•the financial strength of the borrower;
•market trends; and
•the structure of the financing.
These and other factors affect both the amount of expected credit loss on a given loan and the sensitivity of that loss to
changes in the economic environment. These factors and our strategy for managing multifamily mortgage credit risk are
described in more detail below.
Multifamily Acquisition Policy and Underwriting Standards
Our Multifamily business is responsible for pricing and managing the credit risk on our multifamily guaranty book of
business. Multifamily loans that we purchase or that back Fannie Mae MBS are underwritten by a Fannie Mae-approved
lender and may be subject to our underwriting review prior to closing, depending on the product type, loan size, market
and/or other factors. Our underwriting standards generally include, among other things, property cash flow analysis and
third-party appraisals. We periodically refine our underwriting standards based on changes in our risk appetite.
Our standards for multifamily loans specify maximum original LTV ratio and minimum original DSCR values that vary
based on loan characteristics. Our experience has been that original LTV ratio and DSCR values have been reliable
indicators of future credit performance. We limit acquisitions of multifamily loans with original LTV ratios greater than
80% or with original DSCRs of 1.25 or less, as they pose more credit risk than we typically seek. The percentage of our
new multifamily business volume acquired in 2023 with original LTV ratios greater than 80% was approximately 1%,
compared with less than 0.5% in 2022. The percentage of new multifamily business volume acquired in 2023 with
original DSCRs (based on actual debt service payments) of 1.25 or less was approximately 2%, compared with
approximately 3% in 2022.
Multifamily Guaranty Book Diversification and Monitoring
Diversification within our multifamily guaranty book of business by geographic concentration, term to maturity, interest
rate structure, borrower concentration, loan size, property type, and credit enhancement coverage are important factors
that influence credit performance and may help reduce our credit risk.
MD&A | Multifamily Business | Multifamily Business Financial Results | ||
Fannie Mae 2023 Form 10-K | 109 |
As part of our ongoing credit risk management process, we and our lenders monitor the performance and risk
characteristics of our multifamily loans and the underlying properties on an ongoing basis throughout the loan term at
the asset and portfolio level. We generally require lenders to provide quarterly and/or annual financial updates for
multifamily loans. We closely monitor loans with an estimated current DSCR below 1.0, as that is an indicator of
heightened default risk. We also monitor property condition, and, if issues are found through a property inspection,
borrowers are given an opportunity to remediate the issues. In infrequent cases, where the borrower chooses not to
complete the repairs, the loans may be referred to foreclosure.
We manage our exposure to interest-rate risk and monitor changes in interest rates, which can impact multiple aspects
of our multifamily loans. Interest rates increased significantly during 2022 and most of 2023. While we are not currently
predicting interest rates to generally increase in 2024, interest rates could increase further. Rising interest rates may
reduce the ability of multifamily borrowers to refinance their loans, which often have balloon balances at maturity. We
have a team that proactively manages upcoming loan maturities to minimize losses on maturing loans. This team
assists lenders and borrowers with timely and appropriate refinancing of maturing loans with the goal of reducing
defaults and foreclosures related to these loans. We provide information on the maturity schedule of our multifamily
loans in “Multifamily Problem Loan Management and Foreclosure Prevention—Multifamily Maturity information” below
and in our quarterly financial supplements, which we furnish to the SEC with current reports on Form 8-K and make
available on our website. Information in our quarterly financial supplements is not incorporated by reference into this
report.
Additionally, in a rising interest rate environment, multifamily borrowers with adjustable-rate mortgages will have higher
monthly payments, which may lower their DSCRs. We generally require multifamily borrowers with adjustable-rate
mortgages to purchase and maintain interest rate caps through the life of the loan to protect against large movements in
rates as well as maintain escrows at our servicers to reserve for the cost of replacing these caps. Purchasing or
replacing required interest rate caps, especially those with longer terms and/or lower capped interest rates, becomes
more expensive as interest rates rise. These elevated costs in recent periods have added pressure to borrowers’ ability
to make payments and contributed to the increase in our multifamily serious delinquency rate and criticized loan
population in 2023. In the recent high interest rate environment, most multifamily borrowers with adjustable-rate
mortgages have started receiving payments from their interest rate cap providers, which helps to defray the higher cost
of debt service and escrow payments. We actively monitor these interest-rate related risks as part of our risk
management process.
In addition to the factors discussed above, we track the following credit risk characteristics to determine loan credit
quality indicators, which are the internal risk categories we use and which are further discussed in “Note 4, Mortgage
Loans”:
•the physical condition of the property;
•delinquency status;
•the relevant local market and economic conditions that may signal changing risk or return profiles; and
•other risk factors.
For example, we closely monitor rental payment trends and vacancy levels in local markets, as well as capitalization
rates, to identify loans that merit closer attention or loss mitigation actions. The primary asset management
responsibilities for our multifamily loans are performed by our DUS and other multifamily lenders. We periodically
evaluate these lenders’ performance for compliance with our asset management criteria.
We also monitor for risks manifesting within specific property types. A property type we continue to monitor closely is
seniors housing. In our book of business, seniors housing is primarily comprised of independent living and assisted
living facilities, some of which may have a limited capacity devoted to memory care. Seniors housing loans constituted
3% of our multifamily guaranty book of business as of December 31, 2023, based on unpaid principal balance, of which
38% were adjustable-rate mortgages. Seniors housing properties are still recovering from being disproportionately
affected by the COVID-19 pandemic and economic trends, higher operating costs exacerbated by the increase in
inflation, and higher short-term interest rates for adjustable-rate mortgages, resulting in increased costs for these
borrowers. We continue to monitor seniors housing loans in our multifamily guaranty book of business closely and
actively manage loans that may be at risk of further deterioration or default.
MD&A | Multifamily Business | Multifamily Mortgage Credit Risk Management | ||
Fannie Mae 2023 Form 10-K | 110 |
The following table displays our multifamily business volumes and our multifamily guaranty book of business, based on
certain key risk characteristics that we use to evaluate the risk profile and credit quality of our multifamily loans.
We provide additional information on the credit characteristics of our multifamily loans in quarterly financial
supplements, which we furnish to the SEC with current reports on Form 8-K and make available on our website.
Information in our quarterly financial supplements is not incorporated by reference into this report.
Key Risk Characteristics of Multifamily Business Volume and Guaranty Book of Business | |||||||||||||
Multifamily Business Volume at Acquisition(1) For the Year Ended December 31, | Multifamily Guaranty Book of Business(2) As of December 31, | ||||||||||||
2023 | 2022 | 2021 | 2023 | 2022 | 2021 | ||||||||
LTV ratio: | |||||||||||||
Weighted-average original LTV ratio | 59 | % | 59 | % | 65 | % | 63 | % | 64 | % | 65 | % | |
DSCR: | |||||||||||||
Weighted-average DSCR(1) | 1.6 | 1.9 | 2.3 | 2.0 | 2.2 | 2.1 | |||||||
DSCR less than or equal to 1.0(1) | — | — | — | 4 | % | 3 | % | 2 | % | ||||
Loan amount and count: | |||||||||||||
Average loan amount (in millions) | $19 | $19 | $17 | $16 | $16 | $14 | |||||||
Loan count | 2,812 | 3,572 | 4,203 | 28,926 | 28,023 | 28,856 | |||||||
Interest rate type: | |||||||||||||
Fixed interest rate | 99 | % | 78 | % | 89 | % | 91 | % | 89 | % | 91 | % | |
Adjustable interest rate | 1 | 22 | 11 | 9 | 11 | 9 | |||||||
Total | 100 | % | 100 | % | 100 | % | 100 | % | 100 | % | 100 | % | |
Amortization type: | |||||||||||||
Full interest-only | 63 | % | 53 | % | 40 | % | 42 | % | 38 | % | 33 | % | |
Partial interest-only(2) | 32 | 39 | 50 | 46 | 49 | 51 | |||||||
Fully amortizing | 5 | 8 | 10 | 12 | 13 | 16 | |||||||
Total | 100 | % | 100 | % | 100 | % | 100 | % | 100 | % | 100 | % | |
Asset class type: | |||||||||||||
Conventional/co-op | 92 | % | 93 | % | 93 | % | 89 | % | 88 | % | 88 | % | |
Seniors housing | 1 | 1 | 1 | 3 | 4 | 4 | |||||||
Student housing | 1 | 2 | 1 | 3 | 3 | 4 | |||||||
Manufactured housing | 6 | 4 | 5 | 5 | 5 | 4 | |||||||
Total | 100 | % | 100 | % | 100 | % | 100 | % | 100 | % | 100 | % | |
Affordable(3) | 12 | % | 13 | % | 13 | % | 12 | % | 12 | % | 11 | % | |
Small balance loans(4) | 40 | % | 38 | % | 44 | % | 48 | % | 50 | % | 54 | % | |
Geographic concentration:(5) | |||||||||||||
Midwest | 13 | % | 15 | % | 12 | % | 12 | % | 12 | % | 11 | % | |
Northeast | 12 | 12 | 16 | 15 | 15 | 15 | |||||||
Southeast | 32 | 31 | 28 | 27 | 27 | 27 | |||||||
Southwest | 24 | 25 | 24 | 22 | 22 | 22 | |||||||
West | 19 | 17 | 20 | 24 | 24 | 25 | |||||||
Total | 100 | % | 100 | % | 100 | % | 100 | % | 100 | % | 100 | % | |
(1)For our business volumes, the DSCR is calculated using the actual debt service payments for the loan. For our book of business, our
estimates of current DSCRs are based on the latest available income information covering a 12 month period, from quarterly and annual
statements for these properties including the related debt service. When an annual statement is the latest statement available, it is used.
When operating statement information is not available, the underwritten DSCR is used. Co-op loans are excluded from this metric.
(2)Consists of mortgage loans that were underwritten with an interest-only term, regardless of whether the loan is currently in its interest-only
period.
MD&A | Multifamily Business | Multifamily Mortgage Credit Risk Management | ||
Fannie Mae 2023 Form 10-K | 111 |
(3)Represents Multifamily Affordable Housing (“MAH”) loans, which are defined as financing for properties that are under an agreement that
provides long-term affordability, such as properties with rent subsidies or income restrictions. MAH loans are included within the asset
class categories referenced above.
(4)Small balance loans refer to multifamily loans with an original unpaid principal balance of up to $9 million nationwide. We changed our
definition of small multifamily loans in the third quarter of 2023 to increase the loan amounts from up to $6 million nationwide to up to $9
million nationwide. The updated definition has been applied to all loans in the current multifamily guaranty book of business, including
loans that were acquired under previous small loan definitions. Small balance loans are included within the asset class categories
referenced above. We present this metric based on loan count rather than unpaid principal balance.
(5)Midwest consists of IL, IN, IA, MI, MN, NE, ND, OH, SD and WI. Northeast consists of CT, DE, ME, MA, NH, NJ, NY, PA, PR, RI, VT and
VI. Southeast consists of AL, DC, FL, GA, KY, MD, MS, NC, SC, TN, VA and WV. Southwest consists of AZ, AR, CO, KS, LA, MO, NM, OK,
TX and UT. West consists of AK, CA, GU, HI, ID, MT, NV, OR, WA and WY.
Transfer of Multifamily Mortgage Credit Risk
Overview
Lender risk-sharing is a cornerstone of our Multifamily business. We primarily transfer risk through our DUS program,
which is described under “Multifamily Primary Business Activities—Delegated Underwriting and Servicing Program.” To
complement our DUS front-end lender-risk sharing program, we also engage in back-end credit risk transfer
transactions through our MCIRT and MCAS programs.
Front-End Credit Risk Sharing
Our DUS model typically results in our lenders sharing approximately one-third of the credit risk on our multifamily
loans, either on a pro-rated or tiered basis. Lenders who share on a tiered basis typically absorb losses on the first 5%
of the unpaid principal balance of a loan at the time of loss settlement, and above 5% share a percentage of the loss
with us, with the maximum loss capped at 20% of the original unpaid principal balance of the loan. Among our DUS
network, bank lenders tend to use pro-rated loss sharing, as it results in more favorable regulatory capital requirements
for them, while non-depository lenders vary based on preference.
The chart below displays the percentage of credit risk retained by Fannie Mae or transferred to third parties under our
typical DUS lender risk-sharing arrangements. As of December 31, 2023, 42% of our multifamily guaranty book of
business was covered by tiered loss sharing and 57% was covered by pro-rated loss sharing.
Principal Types of Multifamily DUS Loss Sharing
Tiered | 100% of UPB | Pro-rated | ||||||||
 | 90% | 10% | 2/3 | 1/3 | ||||||
25% of UPB | ||||||||||
75% | 25% | |||||||||
5% of UPB | ||||||||||
100% | ||||||||||
Fannie Mae | DUS Lender |
In certain situations, we do not allow DUS lenders to fully share in one-third of the credit risk, but have them share in a
smaller portion, to reduce the risk that the counterparty will fail to meet its loss sharing responsibility to us. We establish
lender-specific loss-sharing limits for individual transactions based on loan size, lender financial performance, and
lender creditworthiness, among other factors. Lenders may also request lower loss sharing outside of these pre-set
limits for specific transactions, which is assessed on a case-by-case basis. When loss sharing is reduced on a loan, the
MD&A | Multifamily Business | Multifamily Mortgage Credit Risk Management | ||
Fannie Mae 2023 Form 10-K | 112 |
servicing fee we pay to the lender is reduced and our guaranty fee is increased to reflect the lower credit risk retained
by the lender.
Non-DUS lenders, which represent a small portion of our multifamily guaranty book of business, typically share or
absorb losses based on a negotiated percentage of the loan or the pool balance. As a result of our lender risk-sharing
agreements, our maximum potential loss recovery from both DUS and non-DUS loans represented approximately 24%
of the unpaid principal balance of our multifamily guaranty book of business as of December 31, 2023.
Back-End Credit Risk Sharing
Our back-end MCAS and MCIRT credit risk transfer programs transfer a portion of the credit risk associated with a
reference pool of multifamily mortgage loans to insurers, reinsurers, or investors. These credit-risk sharing transactions
were primarily designed to further reduce the capital requirements associated with loans in the reference pool, which
reflects the benefit of additional credit risk protection in the event of a stress environment. While we transfer multifamily
credit risk through front-end lender risk-sharing at the time of acquisition, our multifamily back-end credit risk transfer
activity occurs later, sometimes a year or more after acquisition.
In 2023, we entered into two new multifamily credit risk transfer transactions, transferring mortgage credit risk through
our MCIRT and MCAS programs. The factors that we expect will affect the extent to which we engage in multifamily
credit risk transfer transactions in the future and the structure of those transactions include our risk appetite, future
market conditions, the cost of the transactions, FHFA guidance or requirements (including FHFA’s scorecard), the
capital relief provided by the transactions, and our overall business and capital plans.
The table below displays the total unpaid principal balance of multifamily loans and the percentage of our multifamily
guaranty book of business, based on unpaid principal balance, that is covered by a back-end credit risk transfer
transaction. The table does not reflect front-end lender risk-sharing arrangements, as only a small portion of our
multifamily guaranty book of business is not covered by these arrangements.
Multifamily Loans in Back-End Credit Risk Transfer Transactions | ||||||||
As of December 31, | ||||||||
2023 | 2022 | |||||||
Unpaid Principal Balance | Percentage of Multifamily Guaranty Book of Business | Unpaid Principal Balance | Percentage of Multifamily Guaranty Book of Business | |||||
(Dollars in millions) | ||||||||
MCIRT | $89,517 | 19% | $87,682 | 20% | ||||
MCAS | 48,476 | 10 | 25,071 | 6 | ||||
Total | $137,993 | 29% | $112,753 | 26% | ||||
Multifamily Problem Loan Management
We employ proactive management and monitoring of our multifamily guaranty book, which are designed to keep credit
losses and delinquencies to a low level relative to our multifamily guaranty book of business.
Credit Performance Statistics on Multifamily Problem Loans
The percentage of our loans in our multifamily guaranty book of business that are criticized increased as of December
31, 2023 compared with December 31, 2022, primarily driven by the recent elevated interest-rate environment. This has
increased the number of properties reporting low DSCRs in their latest operating statement, particularly those properties
financed with adjustable-rate mortgages. The criticized loans category substantially consists of loans classified as
“Substandard” and also includes loans classified as “Special Mention” or “Doubtful.” Substandard loans are loans that
have a well-defined weakness that could impact their timely full repayment. While the majority of the substandard loans
in our multifamily guaranty book of business are currently making timely payments, we continue to monitor the
performance of our substandard loan population. For more information on our credit quality indicators, including our
population of substandard loans, see “Note 4, Mortgage Loans.”
Our multifamily serious delinquency rate consists of multifamily loans that were 60 days or more past due based on
unpaid principal balance, expressed as a percentage of our multifamily guaranty book of business. Management
monitors the multifamily serious delinquency rate as an indicator of potential future credit losses and loss mitigation
activities. Serious delinquency rates are reflective of our performance in assessing and managing credit risk associated
with multifamily loans in our guaranty book of business. Typically, higher serious delinquency rates result in a higher
allowance for loan losses.
MD&A | Multifamily Business | Multifamily Mortgage Credit Risk Management | ||
Fannie Mae 2023 Form 10-K | 113 |
Our multifamily serious delinquency rate increased to 0.46% as of December 31, 2023, compared with 0.24% as of
December 31, 2022, primarily driven by stress in our seniors housing loans. Over half of our seriously delinquent
multifamily loan population as of December 31, 2023 was comprised of seniors housing loans. The percentage of loans
in our multifamily guaranty book of business that were 180 days or more delinquent was 0.29% as of December 31,
2023 compared with 0.15% as of December 31, 2022.
We actively pursue loss mitigation actions when appropriate, such as loan workouts, which may resolve delinquencies.
If appropriate workouts cannot be achieved, the loans are foreclosed upon. Our loss mitigation actions and foreclosures
have contributed to a decline in our multifamily serious delinquency rate from 0.54% as of September 30, 2023. We
expect these activities will continue into 2024, which may further decrease our multifamily serious delinquency rate.
In addition to the credit performance information on our multifamily loans provided in this report, we provide additional
information about the performance of our multifamily loans that back MBS and whole loan REMICs in the “Data
Collections” section of our DUS Disclose® tool, available at www.fanniemae.com/dusdisclose. Information on our
website is not incorporated into this report.
Multifamily REO Management
As of December 31, 2023, we held 61 multifamily REO properties with a carrying value of $378 million, compared with
28 properties with a carrying value of $278 million as of December 31, 2022. The increase in foreclosure activity was
primarily driven by properties included in a specific seniors housing portfolio that was written off during 2023. Only a
portion of the properties associated with this portfolio completed the foreclosure process in 2023. We expect a majority
of the remaining properties in this portfolio will complete the foreclosure process in the first half of 2024; however, we
expect the foreclosure process to take longer for other properties in the portfolio that are located in certain judicial
foreclosure states with historically long foreclosure timelines.
Multifamily Credit Loss Performance Metrics
The amount of multifamily credit losses or gains we realize in a given period is driven by foreclosures, pre-foreclosure
sales, post-foreclosure REO activity and other events that trigger write-offs and recoveries. Our multifamily credit loss
performance metrics are not defined terms and may not be calculated in the same manner as similarly titled measures
reported by other companies. For the purposes of our multifamily credit loss performance metrics, credit losses or gains
represent write-offs net of recoveries and foreclosed property income or expense. We believe our multifamily credit
losses, and our multifamily credit losses net of freestanding loss-sharing arrangements, provide useful information about
our multifamily credit performance because they display our multifamily credit losses in the context of our multifamily
guaranty book of business, including changes to the benefit we expect to receive from loss-sharing arrangements.
Management views multifamily credit losses, net of freestanding loss-sharing arrangements, as a key metric related to
our multifamily business model and our strategy to share multifamily credit risk.
MD&A | Multifamily Business | Multifamily Mortgage Credit Risk Management | ||
Fannie Mae 2023 Form 10-K | 114 |
The table below displays the components of our multifamily credit loss performance metrics, as well as our multifamily
initial write-off severity rate and write-off loan count.
Multifamily Credit Loss Performance Metrics | |||||||||
For the Year Ended December 31, | |||||||||
2023 | 2022 | 2021 | |||||||
(Dollars in millions) | |||||||||
Write-offs(1) | $(401) | $(43) | $(59) | ||||||
Recoveries | 59 | 23 | 49 | ||||||
Foreclosed property expense | (174) | (40) | (19) | ||||||
Credit losses | (516) | (60) | (29) | ||||||
Change in expected benefits from freestanding loss-sharing arrangements(2) | 41 | (2) | 21 | ||||||
Credit losses, net of freestanding loss-sharing arrangements | $(475) | $(62) | $(8) | ||||||
Credit loss ratio (in bps)(3) | (11.3) | (1.4) | (0.7) | ||||||
Credit loss ratio, net of freestanding loss-sharing arrangements (in bps)(2)(3) | (10.4) | (1.5) | (0.2) | ||||||
Multifamily initial write-off severity rate(4)(5) | 8 | % | 5 | % | 13 | % | |||
Multifamily write-off loan count(6) | 18 | 9 | 26 | ||||||
(1)Represents write-offs when a loan is determined to be uncollectible prior to a liquidation event, which includes foreclosure, a deed-in-lieu of
foreclosure or a short-sale (collectively a “liquidation event”), as well as write-offs at liquidation. Write-offs associated with non-REO sales
are net of loss sharing.
(2)Represents changes to the benefit we expect to receive only from write-offs as a result of certain freestanding loss-sharing arrangements,
primarily multifamily DUS lender risk-sharing transactions. Changes to the expected benefits we will receive are recorded in “Change in
expected credit enhancement recoveries” in our consolidated statements of operations and comprehensive income.
(3)Calculated based on the amount of “Credit losses” and “Credit losses, net of freestanding loss-sharing arrangements,” divided by the
average multifamily guaranty book of business during the period.
(4)Rate is calculated as the initial write-off amount divided by the average defaulted unpaid principal balance.
(5)Consists of write-offs associated with a liquidation event. The rate excludes any costs, gains or losses associated with REO after initial
acquisition through final disposition. The rate also excludes write-offs when a loan is determined to be uncollectible prior to a liquidation
event. Write-offs are net of lender loss-sharing agreements.
(6)The multifamily write-off loan count includes only write-offs associated with a liquidation event.
Our multifamily credit losses increased in 2023 compared with 2022, primarily driven by the write-off of $300 million
related to a seniors housing portfolio during 2023 as well as an increase in foreclosed property expenses due to an
increase in multifamily REO properties in 2023, as discussed in “Multifamily REO Management.”
MD&A | Multifamily Business | Multifamily Mortgage Credit Risk Management | ||
Fannie Mae 2023 Form 10-K | 115 |
Multifamily Maturity Information
The below table shows the contractual maturities and interest rate sensitivities of our multifamily mortgage loan portfolio
as recorded on our consolidated balance sheets. Although loans in our consolidated portfolio have varying contractual
terms, the actual life of the loans may be less than their contractual term as a result of prepayment.
Multifamily Loans: Maturities and Terms of the Consolidated Mortgage Loan Portfolio(1) | ||||||||||
As of December 31, 2023 | ||||||||||
Due within 1 year | Greater than 1 year but within 5 years | Greater than 5 years but within 15 years | Greater than 15 years | Total | ||||||
(Dollars in millions) | ||||||||||
Multifamily mortgage loan portfolio:(2) | ||||||||||
Loans held for investment: | ||||||||||
Of Fannie Mae | $330 | $1,797 | $511 | $24 | $2,662 | |||||
Of consolidated trusts | 11,994 | 141,807 | 299,386 | 5,893 | 459,080 | |||||
Total unpaid principal balance of multifamily mortgage loans | 12,324 | 143,604 | 299,897 | 5,917 | 461,742 | |||||
Cost basis adjustments, net | (1,500) | |||||||||
Total multifamily mortgage loans(2) | $12,324 | $143,604 | $299,897 | $5,917 | $460,242 | |||||
Multifamily mortgage loan portfolio by interest rate sensitivity: | ||||||||||
Fixed-rate | $11,601 | $131,314 | $275,132 | $5,787 | $423,834 | |||||
Adjustable-rate | 723 | 12,290 | 24,765 | 130 | 37,908 | |||||
Total unpaid principal balance of multifamily mortgage loans | $12,324 | $143,604 | $299,897 | $5,917 | $461,742 | |||||
(1)We report the scheduled repayments in the maturity category in which the payment is due, such that a loan’s balance may be presented
across multiple maturity categories.
(2)Excludes accrued interest receivable. The unpaid principal balance of multifamily loans is based on the amount of contractual unpaid
principal balance due and excludes any write-offs for amounts deemed uncollectible. Those write-offs are presented as a component of
cost basis adjustments, net.
MD&A | Multifamily Business | Multifamily Mortgage Credit Risk Management | ||
Fannie Mae 2023 Form 10-K | 116 |
Consolidated Credit Ratios and Select Credit Information
The table below displays select credit ratios on our single-family conventional guaranty book of business and our
multifamily guaranty book of business, as well as the inputs used in calculating these ratios.
Consolidated Credit Ratios and Select Credit Information | ||||||||||||||||||
As of | ||||||||||||||||||
December 31, 2023 | December 31, 2022 | |||||||||||||||||
Single-family | Multifamily | Consolidated Total | Single-family | Multifamily | Consolidated Total | |||||||||||||
(Dollars in millions) | ||||||||||||||||||
Credit loss reserves as a percentage of: | ||||||||||||||||||
Guaranty book of business | 0.18 | % | 0.44 | % | 0.21 | % | 0.26 | % | 0.43 | % | 0.28 | % | ||||||
Nonaccrual loans at amortized cost | 28.50 | 109.21 | 34.51 | 90.69 | 86.86 | 90.03 | ||||||||||||
Nonaccrual loans as a percentage of: | ||||||||||||||||||
Guaranty book of business | 0.65 | % | 0.40 | % | 0.62 | % | 0.29 | % | 0.50 | % | 0.31 | % | ||||||
Select financial information used in calculating credit ratios: | ||||||||||||||||||
Credit loss reserves(1) | $(6,696) | $(2,064) | $(8,760) | $(9,554) | $(1,911) | $(11,465) | ||||||||||||
Guaranty book of business(2) | 3,636,735 | 470,398 | 4,107,133 | 3,635,237 | 440,424 | 4,075,661 | ||||||||||||
Nonaccrual loans at amortized cost | 23,497 | 1,890 | 25,387 | 10,535 | 2,200 | 12,735 | ||||||||||||
Components of credit loss reserves: | ||||||||||||||||||
Allowance for loan losses | $(6,671) | $(2,059) | $(8,730) | $(9,443) | $(1,904) | $(11,347) | ||||||||||||
Allowance for accrued interest receivable | (25) | — | (25) | (111) | — | (111) | ||||||||||||
Reserve for guaranty losses(3) | — | (5) | (5) | — | (7) | (7) | ||||||||||||
Total credit loss reserves(1) | $(6,696) | $(2,064) | $(8,760) | $(9,554) | $(1,911) | $(11,465) | ||||||||||||
(1)Our multifamily credit loss reserves exclude the expected benefit of freestanding credit enhancements on multifamily loans of $599 million
as of December 31, 2023 and $492 million as of December 31, 2022, which are recorded in “Other assets” in our consolidated balance
sheets.
(2)Represents conventional guaranty book of business for single-family.
(3)Reserve for guaranty losses is recorded in “Other liabilities” in our consolidated balance sheets.
Our single-family nonaccrual loans increased as of December 31, 2023 compared with December 31, 2022 as
delinquent loans that may have previously been subject to our COVID-19 nonaccrual policy, which maintained loans on
accrual status for at least six months of delinquency, no longer met the requirements of the COVID-19-related guidance
effective January 1, 2023. Under our current nonaccrual policy, we generally place a loan on nonaccrual status when
the loan is three or more months past due. As a result, the balance of loans on nonaccrual status increased.
The balance of multifamily loans on nonaccrual decreased as of December 31, 2023 compared with December 31,
2022, primarily as a result of loans returning to accrual status after the completion of a performance period. In addition,
write-offs during 2023 reduced the amortized cost of multifamily loans on nonaccrual as of December 31, 2023
compared with December 31, 2022.
Our credit loss reserves decreased as of December 31, 2023 compared with December 31, 2022 primarily as a result of
a benefit for credit losses, which reduced our allowance for loan losses, as we describe in “Consolidated Results of
Operations—Benefit (Provision) for Credit Losses.”
MD&A | Consolidated Credit Ratios and Select Credit Information | ||
Fannie Mae 2023 Form 10-K | 117 |
Consolidated Write-off Ratio and Select Credit Information | ||||||||||||||||||
For the Year Ended December 31, | ||||||||||||||||||
2023 | 2022 | 2021 | ||||||||||||||||
Single- family | Multifamily | Total | Single- family | Multifamily | Total | Single- family | Multifamily | Total | ||||||||||
(Dollars in millions) | ||||||||||||||||||
Select credit ratio: | ||||||||||||||||||
Write-offs, net of recoveries, as a percentage of the average guaranty book of business (in bps) | 1.8 | 7.5 | 2.5 | 1.7 | 0.5 | 1.6 | * | 0.2 | * | |||||||||
Select financial information used in calculating credit ratio: | ||||||||||||||||||
Write-offs(1) | $881 | $401 | $1,282 | $890 | $43 | $933 | $423 | $59 | $482 | |||||||||
Recoveries | (210) | (59) | (269) | (288) | (23) | (311) | (430) | (49) | (479) | |||||||||
Write-offs, net of recoveries | $671 | $342 | $1,013 | $602 | $20 | $622 | $(7) | $10 | $3 | |||||||||
Average guaranty book of business(2) | $3,634,426 | $455,137 | $4,089,563 | $3,585,714 | $425,695 | $4,011,409 | $3,351,036 | $401,358 | $3,752,394 | |||||||||
*Represents credit ratio of less than 0.05 bps.
(1)Represents write-offs when a loan is determined to be uncollectible. For single-family, also includes any write-offs upon the redesignation
of mortgage loans from HFI to HFS.
(2)Average guaranty book of business is based on quarter-end balances.
For discussion on the drivers of single-family write-offs for 2023, see “Single-Family Business—Single-Family Mortgage
Credit Risk Management—Single-Family Problem Loan Management—Single-Family Credit Loss Performance Metrics
and Loan Sale Performance.”
For discussion on the drivers of multifamily write-offs for 2023, see “Multifamily Business—Multifamily Mortgage Credit
Risk Management—Multifamily Credit Loss Performance Metrics.”
Liquidity and Capital Management
Liquidity Management
Our business activities require that we maintain adequate liquidity to fund our operations. Our liquidity risk management
requirements are designed to address our liquidity and funding risk, which is the risk that we will not be able to meet our
obligations when they come due, including the risk associated with the inability to access funding sources or manage
fluctuations in funding levels. Liquidity and funding risk management involves forecasting funding requirements,
maintaining sufficient capacity to meet our needs based on our ongoing assessment of financial market liquidity and
adhering to our regulatory requirements.
Primary Sources and Uses of Funds
Our liquidity depends largely on our ability to issue debt in the capital markets, including both corporate debt and sales
of our MBS securities. We believe that our status as a government-sponsored enterprise and continued federal
government support are essential to maintaining our access to the debt markets. Substantially all of our sources and
uses of funds identified below are both short-term and long-term in nature.
Our primary sources of cash include:
•issuance of long-term and short-term corporate debt;
•proceeds from the sale of mortgage-related securities, mortgage loans, corporate liquidity portfolio assets, and
foreclosed real estate assets;
MD&A | Consolidated Credit Ratios and Select Credit Information | ||
Fannie Mae 2023 Form 10-K | 118 |
•principal and interest payments received on mortgage loans, mortgage-related securities and non-mortgage
investments we own;
•guaranty fees received on Fannie Mae MBS, including the TCCA fees collected by us on behalf of Treasury;
•payments received from mortgage insurance counterparties and other providers of credit enhancement; and
•borrowings we may make under a secured intraday funding line of credit or against mortgage-related securities
and other investment securities we hold pursuant to repurchase agreements and loan agreements.
Our primary uses of funds include:
•the repayment of matured, redeemed and repurchased debt;
•the purchase of mortgage loans (including delinquent loans from MBS trusts), mortgage-related securities and
other investments;
•interest payments on outstanding debt;
•administrative expenses;
•losses, including advances for past due principal and interest, incurred in connection with our Fannie Mae MBS
guaranty obligations;
•payments of federal income taxes;
•payments of TCCA fees to Treasury; and
•payments associated with our credit risk transfer program expenses.
Liquidity and Funding Risk Management Practices and Contingency Planning
Many factors, both internal and external to our business, could influence our debt activity, affect the amount, mix and
cost of our debt funding, reduce demand for our debt securities, increase our liquidity or roll over risk, or otherwise have
a material adverse impact on our liquidity position, including:
•changes or perceived changes in federal government support of our business or our debt securities;
•changes in or the elimination of our status as a government-sponsored enterprise;
•changes by investors in how they view our debt or regulatory changes causing our debt to no longer be
considered a high-quality liquid asset;
•actions taken by FHFA, the Federal Reserve, Treasury or other government agencies;
•legislation relating to us or our business;
•a change or perceived change in the creditworthiness of the U.S. government, due to our reliance on the U.S.
government’s support;
•a U.S. government payment default on its debt obligations;
•a downgrade in the credit ratings of our senior unsecured debt or the U.S. government’s debt from the major
ratings organizations;
•future changes or disruptions in the financial markets;
•a systemic event leading to the withdrawal of liquidity from the market;
•an extreme market-wide widening of credit spreads;
•public statements by key policy makers;
•a significant decline in our net worth;
•potential investor concerns about the adequacy of funding available to us under or about changes to the senior
preferred stock purchase agreement;
•loss of demand for our debt, or certain types of our debt, from a significant number of investors;
•a significant credit or operational (including cybersecurity) event involving us or one of our major institutional
counterparties; or
•a sudden catastrophic operational failure in the financial sector.
See “Risk Factors” for a discussion of the risks we face relating to:
•the uncertain future of our company;
MD&A | Liquidity and Capital Management | ||
Fannie Mae 2023 Form 10-K | 119 |
•our reliance on the issuance of debt securities to obtain funds for our operations and the relative cost to obtain
these funds;
•our liquidity contingency plans;
•our credit ratings; and
•other factors that could adversely affect our ability to obtain adequate debt funding or otherwise negatively
impact our liquidity, including the factors listed above.
Also see “Business—Conservatorship and Treasury Agreements—Treasury Agreements.”
We maintain a liquidity management framework and conduct liquidity contingency planning to prepare for an event in
which our access to the unsecured debt markets becomes limited.
Our liquidity requirements have four components we must meet:
•a short-term cash flow metric that requires us to meet our expected cash outflows and continue to provide
liquidity to the market over a 30-day period of stress, plus an additional $10 billion buffer;
•an intermediate cash flow metric that requires us to meet our expected cash outflows and continue to provide
liquidity to the market over a 365-day period of stress;
•a specified minimum long-term debt to less-liquid asset ratio. Less-liquid assets are those that are not eligible
to be pledged as collateral to Fixed Income Clearing Corporation; and
•a requirement that we fund our assets with liabilities that have a specified minimum term relative to the term of
the assets.
As of December 31, 2023, we were in compliance with these requirements.
We execute operational testing of our ability to rely upon our U.S. Treasury collateral to obtain financing. We enter into
relatively small repurchase agreements to confirm that we have the operational and systems capability to do so. In
addition, we have positioned collateral in advance to clearing banks in the event we seek to enter into repurchase
agreements in the future. We do not, however, have committed repurchase agreements with specific counterparties, as
historically we have not relied on this form of funding. As a result, our use of such facilities and our ability to enter into
them in significant dollar amounts may be challenging in a stressed market environment. See “Corporate Liquidity
Portfolio” for further discussions of our alternative sources of liquidity if our access to the debt markets were to become
limited.
While our liquidity contingency planning attempts to address stressed market conditions and our status in
conservatorship, we believe accessing all liquidity sources in those plans could be difficult or impossible to execute
under stressed conditions for a company of our size in our circumstances. See “Risk Factors—Liquidity and Funding
Risk” for a description of the risks associated with our ability to fund operations and our liquidity contingency planning.
Debt Funding
We separately present the debt from consolidations (“Debt of consolidated trusts”) and the debt issued by us (“Debt of
Fannie Mae”) in our consolidated balance sheets. This discussion regarding debt funding focuses on the debt of Fannie
Mae. We primarily fund our business through MBS issuances, retained earnings, and the issuance of a variety of short-
term and long-term debt securities in the domestic and international capital markets. Accordingly, we are subject to “roll
over,” or refinancing, risk on our outstanding debt.
Our debt securities are actively traded in the over-the-counter market. We have a diversified funding base of domestic
and international investors. Purchasers of our debt securities are geographically diversified and include fund managers,
commercial banks, pension funds, insurance companies, foreign central banks, corporations, state and local
governments, and other municipal authorities. We compete for low-cost debt funding with institutions that hold mortgage
portfolios, including Freddie Mac and the FHLBs.
Our debt funding needs and debt funding activity may vary from period to period depending on market conditions,
including refinance volumes, our capital and liquidity management, and the size of our retained mortgage portfolio. See
“Retained Mortgage Portfolio” for information about our retained mortgage portfolio and limits on its size.
We are currently subject to a $270 billion debt limit under our senior preferred stock purchase agreement with Treasury.
The unpaid principal balance of our aggregate indebtedness was $128.2 billion as of December 31, 2023. Pursuant to
the terms of the senior preferred stock purchase agreement, we are prohibited from issuing debt without the prior
consent of Treasury if it would result in our aggregate indebtedness exceeding our outstanding debt limit. The
calculation of our indebtedness for purposes of complying with our debt limit reflects the unpaid principal balance and
excludes debt basis adjustments and debt of consolidated trusts.
MD&A | Liquidity and Capital Management | ||
Fannie Mae 2023 Form 10-K | 120 |
Outstanding Debt
Total outstanding debt of Fannie Mae includes short-term and long-term debt and excludes debt of consolidated trusts.
Short-term debt of Fannie Mae consists of borrowings with an original contractual maturity of one year or less and,
therefore, does not include the current portion of long-term debt. Long-term debt of Fannie Mae consists of borrowings
with an original contractual maturity of greater than one year.
The following chart and table display information on our outstanding short-term and long-term debt based on original
contractual maturity. Our long-term debt continued to decrease in 2023 as our funding needs remained low and were
primarily satisfied through cash and other liquid assets that accumulated in prior periods, as well as earnings retained
from our operations. As a result, we did not replace all the long-term debt that matured during the year.
Debt of Fannie Mae1
(Dollars in billions)
(1)Outstanding debt balance consists of the unpaid principal balance, premiums and discounts, fair value adjustments, hedge-related basis
adjustments and other cost basis adjustments. Reported amounts include net discount unamortized cost basis adjustments and fair value
adjustments of $4.0 billion and $5.1 billion as of December 31, 2023 and 2022, respectively.
(2)Short-term debt was $17.3 billion and $10.2 billion as of December 31, 2023 and 2022, respectively.
Selected Debt Information | |||||
As of December 31, | |||||
2023 | 2022 | ||||
(Dollars in billions) | |||||
Selected Weighted-Average Interest Rates(1) | |||||
Interest rate on short-term debt | 5.13% | 3.93% | |||
Interest rate on long-term debt, including portion maturing within one year | 2.63 | 2.23 | |||
Interest rate on callable debt | 2.41 | 1.79 | |||
Selected Maturity Data | |||||
Weighted-average maturity of debt maturing within one year (in days) | 135 | 156 | |||
Weighted-average maturity of debt maturing in more than one year (in months) | 46 | 52 | |||
Other Data | |||||
Outstanding callable debt(2) | $43.8 | $43.3 | |||
Connecticut Avenue Securities debt(3) | 2.8 | 5.2 | |||
(1)Excludes the effects of fair value adjustments and hedge-related basis adjustments.
(2)Includes short-term callable debt of $2.6 billion and $590 million as of December 31, 2023 and 2022, respectively.
(3)Represents CAS debt issued prior to November 2018. See “Single-Family Business—Single-Family Mortgage Credit Risk Management—
Single-Family Credit Enhancement and Transfer of Mortgage Credit Risk—Credit Risk Transfer Transactions” for information regarding our
Connecticut Avenue Securities.
MD&A | Liquidity and Capital Management | ||
Fannie Mae 2023 Form 10-K | 121 |
We intend to repay our short-term and long-term debt obligations as they become due primarily through cash from
business operations, the sale of assets in our corporate liquidity portfolio and the issuance of additional debt securities.
For information on the maturity profile of our outstanding long-term debt for each of the years 2024 through 2028 and
thereafter, see “Note 8, Short-Term and Long-Term Debt.”
Debt Funding Activity
The table below displays activity in debt of Fannie Mae. This activity excludes the debt of consolidated trusts and
intraday borrowing. The reported amounts of debt issued and paid off during each period represent the face amount of
the debt at issuance and redemption.
Activity in Debt of Fannie Mae | |||||
For the Year Ended December 31, | |||||
2023 | 2022 | 2021 | |||
(Dollars in millions) | |||||
Issued during the period: | |||||
Short-term: | |||||
Amount | $227,787 | $137,310 | $122,819 | ||
Weighted-average interest rate(1) | 4.86% | 1.56% | 0.01% | ||
Long-term:(2) | |||||
Amount | $8,636 | $1,961 | $2,815 | ||
Weighted-average interest rate | 5.27% | 3.54% | 0.59% | ||
Total issued: | |||||
Amount | $236,423 | $139,271 | $125,634 | ||
Weighted-average interest rate | 4.87% | 1.59% | 0.03% | ||
Paid off during the period:(3) | |||||
Short-term: | |||||
Amount | $220,645 | $129,877 | $132,199 | ||
Weighted-average interest rate(1) | 4.18% | 1.26% | 0.02% | ||
Long-term:(2) | |||||
Amount | $26,918 | $72,570 | $80,938 | ||
Weighted-average interest rate | 1.65% | 1.35% | 0.75% | ||
Total paid off: | |||||
Amount | $247,563 | $202,447 | $213,137 | ||
Weighted-average interest rate | 3.91% | 1.29% | 0.30% | ||
(1)Includes interest generated from negative interest rates on certain repurchase agreements, which offset our short-term funding costs.
(2)Includes credit risk-sharing securities issued as CAS debt prior to November 2018. For information on our credit risk transfer transactions,
see “Single-Family Business—Single-Family Mortgage Credit Risk Management—Single-Family Credit Enhancement and Transfer of
Mortgage Credit Risk—Credit Risk Transfer Transactions.”
(3)Consists of all payments on debt, including regularly scheduled principal payments, payments at maturity, payments resulting from calls
and payments for any other repurchases. Repurchases of debt and early retirements of zero-coupon debt are reported at original face
value, which does not equal the amount of actual cash payment.
MD&A | Liquidity and Capital Management | ||
Fannie Mae 2023 Form 10-K | 122 |
Corporate Liquidity Portfolio
The chart below displays information on the composition of our corporate liquidity portfolio. In previous filings, we
referred to our corporate liquidity portfolio as our “other investments portfolio.” The balance and composition of our
corporate liquidity portfolio fluctuates as a result of changes in our cash flows, liquidity in the fixed-income markets, and
our liquidity risk management framework and practices.
Corporate Liquidity Portfolio
(Dollars in billions)
(1)Cash equivalents are composed of overnight reverse repurchase agreements and U.S. Treasuries that have a maturity at the date of
acquisition of three months or less.
Off-Balance Sheet Arrangements
We enter into certain business arrangements to facilitate our statutory purpose of providing liquidity to the secondary
mortgage market and to reduce our exposure to interest rate fluctuations. Some of these arrangements are not
recorded in our consolidated balance sheets or may be recorded in amounts different from the full contract or notional
amount of the transaction, depending on the nature or structure of, and the accounting required to be applied to, the
arrangement. These arrangements are commonly referred to as “off-balance sheet arrangements” and expose us to
potential losses in excess of the amounts recorded in our consolidated balance sheets.
Our off-balance sheet arrangements result primarily from the following:
•our guaranty of mortgage loan securitization and resecuritization transactions over which we have no control,
which are reflected in our unconsolidated Fannie Mae MBS net of any beneficial ownership interest we retain,
and other financial guarantees that we do not control;
•liquidity support transactions; and
•partnership interests.
The total amount of our off-balance sheet exposure related to unconsolidated Fannie Mae MBS net of any beneficial
interest that we retain, and other financial guarantees was $227.5 billion as of December 31, 2023 and $246.7 billion as
of December 31, 2022. The majority of the other financial guarantees consists of Freddie Mac securities backing Fannie
Mae structured securities. See “Guaranty Book of Business” and “Note 7, Financial Guarantees” for more information
regarding our maximum exposure to loss on unconsolidated Fannie Mae MBS and Freddie Mac securities.
Our total outstanding liquidity commitments to advance funds for securities backed by multifamily housing revenue
bonds totaled $4.5 billion as of December 31, 2023 and $4.8 billion as of December 31, 2022. These commitments
require us to advance funds to third parties that enable them to repurchase tendered bonds or securities that are unable
to be remarketed. We hold cash and cash equivalents in our corporate liquidity portfolio in excess of these commitments
to advance funds.
MD&A | Liquidity and Capital Management | ||
Fannie Mae 2023 Form 10-K | 123 |
We make investments in various limited partnerships and similar legal entities, which consist of LIHTC investments,
community investments and other entities. When we do not have a controlling financial interest in those entities, our
consolidated balance sheets reflect only our investment rather than the full amount of the partnership’s assets and
liabilities. See “Note 3, Consolidations and Transfers of Financial Assets—Unconsolidated VIEs” for information
regarding our limited partnerships and similar legal entities.
Equity Funding
At this time, as a result of the covenants under the senior preferred stock purchase agreement, Treasury’s ownership of
the warrant to purchase up to 79.9% of the total shares of our common stock outstanding and the uncertainty regarding
our future, we do not have access to equity funding except through draws under the senior preferred stock purchase
agreement. For a description of the funding available and the covenants under the senior preferred stock purchase
agreement, see “Business—Conservatorship and Treasury Agreements—Treasury Agreements.”
Contractual Obligations
We have contractual obligations that affect our liquidity and capital resource requirements. These contractual obligations
primarily consist of debt obligations (and associated interest payment obligations) and mortgage purchase commitments
recognized on our consolidated balance sheet.
•For information about the amounts, maturities and contractual interest rates of our obligations related to debt,
see “Note 8, Short-Term and Long-Term Debt.”
•For information about our mortgage purchase commitments, leases and other purchase obligations, see “Note
17, Commitments and Contingencies.”
Our contractual obligations also include $2.2 billion in cash received as collateral, unrecognized tax benefits, and future
cash payments due under our unconditional and legally binding obligations to fund LIHTC partnership investments and
other partnerships. These amounts are recognized on our consolidated balance sheets under “Other liabilities.”
In addition, our short- and long-term liquidity and capital resource needs may be affected by our contractual obligations
to make the payments listed below. The amounts of these payments are uncertain and will depend on future events:
•payments on our obligations to stand ready to perform under our guarantees relating to Fannie Mae MBS and
other financial guarantees, including Fannie Mae commingled structured securities. The amount and timing of
payments under these arrangements are generally contingent upon the occurrence of future events. For a
description of the amount of our on- and off-balance sheet Fannie Mae MBS and other financial guarantees as
of December 31, 2023, see “Guaranty Book of Business” and “Off-Balance Sheet Arrangements;”
•payments associated with our CIRT, CAS REMIC, MCAS, and CAS CLN transactions, the amount and timing of
which are contingent upon the occurrence of future credit and prepayment events for the related reference pool
of mortgage loans. For further details on these transactions, please see “Single-Family Business—Single-
Family Mortgage Credit Risk Management—Single-Family Credit Enhancement and Transfer of Mortgage
Credit Risk—Categories of Our Credit Risk Transfer Transactions” and “Multifamily Business—Multifamily
Mortgage Credit Risk Management—Transfer of Multifamily Mortgage Credit Risk;” and
•payments related to our interest-rate risk management derivatives that may require cash settlement in future
periods, the amount and timing of which depend on changes in interest rates. For further details on these
transactions, please see “Note 9, Derivative Instruments.”
Credit Ratings
Our credit ratings from the major credit ratings organizations, as well as the credit ratings of the U.S. government, are
primary factors that could affect our ability to access the capital markets and our cost of funds. In addition, our credit
ratings are important when we seek to engage in certain long-term transactions, such as derivative transactions. S&P,
Moody’s and Fitch have all indicated that, if they were to lower the sovereign credit ratings on the U.S., they would likely
lower their ratings on the debt of Fannie Mae and certain other government-related entities. In addition, actions by
governmental entities impacting Treasury’s support for our business or our debt securities could adversely affect the
credit ratings of our senior unsecured debt. See “Risk Factors—Liquidity and Funding Risk” for a discussion of the risks
to our business relating to a decrease in our credit ratings, which could include an increase in our borrowing costs, limits
on our ability to issue debt, and additional collateral requirements under our derivatives contracts.
MD&A | Liquidity and Capital Management | ||
Fannie Mae 2023 Form 10-K | 124 |
The table below displays the credit ratings issued by the three major credit rating agencies.
Fannie Mae Credit Ratings | |||||
As of December 31, 2023 | |||||
S&P | Moody’s | Fitch | |||
Long-term senior debt | AA+ | Aaa | AA+ | ||
Short-term senior debt | A-1+ | P-1 | F1+ | ||
Preferred stock | D | Ca(hyb) | C/RR6 | ||
Outlook | Stable | Negative | Stable | ||
On August 2, 2023, Fitch downgraded our Long-Term Issuer Default Rating (“IDR”) and senior unsecured debt rating to
‘AA+’ from ‘AAA’ and our Government Support Rating (“GSR”) to ‘aa+’ from ‘aaa.’ These actions followed Fitch’s
downgrade of the U.S. Long-Term foreign and local currency IDRs to ‘AA+’ from ‘AAA’ on August 1, 2023. Fitch noted
that our Long-Term IDR and GSR are directly linked to the U.S. government’s Long-Term IDRs, based on Fitch’s view of
the U.S. government’s direct financial support of Fannie Mae.
On November 14, 2023, Moody’s changed its outlook on Fannie Mae from stable to negative. This action followed
Moody’s change of the outlook on the U.S. Government from stable to negative on November 10, 2023.
We have no covenants in our existing debt agreements that would be violated by a downgrade in our credit ratings.
However, we could be required to provide additional collateral to or terminate transactions with certain derivatives
counterparties in the event that our senior unsecured debt ratings are downgraded.
Cash Flows
Year Ended December 31, 2023. Cash, cash equivalents and restricted cash and cash equivalents decreased from
$87.8 billion as of December 31, 2022 to $68.7 billion as of December 31, 2023. The decrease was primarily driven by
cash outflows from (1) payments on outstanding debt of consolidated trusts, (2) purchases of loans held for investment,
and (3) advances to lenders.
Partially offsetting these cash outflows were cash inflows primarily from (1) proceeds from repayments of loans, and (2)
the sale of Fannie Mae MBS to third parties.
Year Ended December 31, 2022. Cash, cash equivalents and restricted cash and cash equivalents decreased from
$108.6 billion as of December 31, 2021 to $87.8 billion as of December 31, 2022. The decrease was primarily driven by
cash outflows from (1) payments on outstanding debt of consolidated trusts, (2) the redemption of funding debt, which
outpaced issuances, and (3) purchases of loans held for investment.
Partially offsetting these cash outflows were cash inflows primarily from (1) proceeds from repayments and sales of
loans, (2) the sale of Fannie Mae MBS to third parties, and (3) proceeds from our investment in U.S. Treasury
securities.
Capital Management
Capital Requirements
The table below sets forth information about our capital requirements under the standardized approach of the enterprise
regulatory capital framework. Available capital for purposes of the enterprise regulatory capital framework excludes the
stated value of the senior preferred stock ($120.8 billion) and other amounts specified in the Regulatory Capital
Components table below. Because of these exclusions, we had a deficit in available capital as of December 31, 2023
even though we had positive net worth under GAAP of $77.7 billion as of December 31, 2023. See “Business—
Legislation and Regulation—Capital Requirements” for a description of our capital requirements under the enterprise
regulatory capital framework. Although the enterprise regulatory capital framework went into effect in February 2021, we
are not required to hold capital according to the framework’s requirements until the date of termination of our
conservatorship, or such later date as may be ordered by FHFA.
We had a $243 billion shortfall of our available capital (deficit) as of December 31, 2023 as compared to the adjusted
total capital requirement (including buffers) of $188 billion under the standardized approach of the enterprise regulatory
capital framework as of December 31, 2023. Our capital shortfall decreased from $258 billion as of December 31, 2022
to $243 billion as of December 31, 2023, primarily as a result of an increase in retained earnings.
MD&A | Liquidity and Capital Management | ||
Fannie Mae 2023 Form 10-K | 125 |
Risk-weighted assets increased from $1,316 billion as of December 31, 2022 to $1,357 billion as of December 31, 2023,
primarily due to an increase in the countercyclical adjustment we are required to apply in the calculation of credit risk
weights for our single-family mortgage exposures under the enterprise regulatory capital framework and declining
property values in our multifamily book of business. The countercyclical adjustment is intended to stabilize our capital
requirements through home price cycles by adjusting mark-to-market LTV ratios for single-family mortgage loans when
national home prices are meaningfully above or below the long-term trend. These increases were partially offset by our
on-going credit risk transfer issuances, which reduce risk-weighted assets.
Capital Metrics under the Enterprise Regulatory Capital Framework as of December 31, 2023(1) | ||||||||||||
(Dollars in billions) | ||||||||||||
Stress capital buffer | $34 | |||||||||||
Stability capital buffer | 45 | |||||||||||
Adjusted total assets | $4,552 | Countercyclical capital buffer | — | |||||||||
Risk-weighted assets | 1,357 | Prescribed capital conservation buffer amount | $79 | |||||||||
Minimum Capital Ratio Requirement | Minimum Capital Requirement | Applicable Buffers(2) | Total Capital Requirement (including Buffers) | Available Capital (Deficit)(3) | Capital Shortfall(4) | |||||||
Risk-based capital: | ||||||||||||
Total capital (statutory)(5) | 8.0% | $109 | N/A | $109 | $(34) | $(143) | ||||||
Common equity tier 1 capital | 4.5 | 61 | $79 | 140 | (74) | (214) | ||||||
Tier 1 capital | 6.0 | 81 | 79 | 160 | (55) | (215) | ||||||
Adjusted total capital | 8.0 | 109 | 79 | 188 | (55) | (243) | ||||||
Leverage capital: | ||||||||||||
Core capital (statutory)(6) | 2.5 | 114 | N/A | 114 | (43) | (157) | ||||||
Tier 1 capital | 2.5 | 114 | 23 | 137 | (55) | (192) | ||||||
Capital Metrics under the Enterprise Regulatory Capital Framework as of December 31, 2022(1) | ||||||||||||
(Dollars in billions) | ||||||||||||
Stress capital buffer | $34 | |||||||||||
Stability capital buffer | 45 | |||||||||||
Adjusted total assets | $4,552 | Countercyclical capital buffer | — | |||||||||
Risk-weighted assets | 1,316 | Prescribed capital conservation buffer amount | $79 | |||||||||
Minimum Capital Ratio Requirement | Minimum Capital Requirement | Applicable Buffers(2) | Total Capital Requirement (including Buffers) | Available Capital (Deficit)(3) | Capital Shortfall(4) | |||||||
Risk-based capital: | ||||||||||||
Total capital (statutory)(5) | 8.0% | $105 | N/A | $105 | $(49) | $(154) | ||||||
Common equity tier 1 capital | 4.5 | 59 | $79 | 138 | (93) | (231) | ||||||
Tier 1 capital | 6.0 | 79 | 79 | 158 | (74) | (232) | ||||||
Adjusted total capital | 8.0 | 105 | 79 | 184 | (74) | (258) | ||||||
Leverage capital: | ||||||||||||
Core capital (statutory)(6) | 2.5 | 114 | N/A | 114 | (61) | (175) | ||||||
Tier 1 capital | 2.5 | 114 | 23 | 137 | (74) | (211) | ||||||
(1)Ratios are calculated as a percentage of risk-weighted assets for risk-based capital metrics and as a percentage of adjusted total assets
for leverage capital metrics.
(2)The prescribed capital buffers represent the amount of capital we are required to hold above the minimum risk-based and leverage capital
requirements. The applicable buffer for risk-based common equity tier 1 capital, tier 1 capital, and adjusted total capital is the prescribed
capital conservation buffer amount, or PCCBA, which is composed of a stress capital buffer, a stability capital buffer, and a countercyclical
MD&A | Liquidity and Capital Management | ||
Fannie Mae 2023 Form 10-K | 126 |
capital buffer. The PCCBA must be comprised entirely of common equity tier one capital. The applicable buffer for leverage tier 1 capital is
the prescribed leverage buffer amount, or PLBA. The stress capital buffer and countercyclical capital buffer are each calculated by
multiplying prescribed factors by adjusted total assets as of the last day of the previous calendar quarter. The stability capital buffer is
based on our share of mortgage debt outstanding. The prescribed leverage buffer for 2023 and 2022 was set at 50% of the 2023 and 2022
stability capital buffer, respectively. Going forward the stability capital buffer and the prescribed leverage buffer will be updated with an
effective date that depends on whether the stability capital buffer increases or decreases relative to the previously calculated value.
(3)Available capital (deficit) for all line items excludes the stated value of the senior preferred stock ($120.8 billion). Available capital (deficit)
for all line items except total capital and core capital also deducts a portion of deferred tax assets. Deferred tax assets arising from
temporary differences between GAAP and tax requirements are deducted from capital to the extent they exceed 10% of common equity.
As of December 31, 2023 and 2022, this resulted in the full deduction of deferred tax assets ($11.7 billion and $12.9 billion, respectively),
from our available capital (deficit). Available capital (deficit) for common equity tier 1 capital also excludes the value of the perpetual,
noncumulative preferred stock ($19.1 billion) as of December 31, 2023 and 2022.
(4)Our capital shortfall consists of the difference between the applicable capital requirement (including buffers) and the applicable available
capital (deficit).
(5)The sum of (a) core capital (see definition in footnote 6 below); and (b) a general allowance for foreclosure losses, which (i) shall include
an allowance for portfolio mortgage losses, an allowance for non-reimbursable foreclosure costs on government claims, and an allowance
for liabilities reflected on the balance sheet for estimated foreclosure losses on mortgage-backed securities; and (ii) shall not include any
reserves made or held against specific assets; and (c) any other amounts from sources of funds available to absorb losses that the
Director of FHFA by regulation determines are appropriate to include in determining total capital.
(6)The sum of (a) the stated value of our outstanding common stock (common stock less treasury stock); (b) the stated value of our
outstanding perpetual, noncumulative preferred stock; (c) our paid-in capital; and (d) our retained earnings (accumulated deficit). Core
capital does not include: (a) accumulated other comprehensive income or (b) senior preferred stock.
While it is not applicable until the date of termination of our conservatorship, our maximum payout ratio represents the
percentage of eligible retained income that we are permitted to pay out in the form of distributions or discretionary bonus
payments under the enterprise regulatory capital framework. The maximum payout ratio for a given quarter is the lowest
of the payout ratios determined by our capital conservation buffer and our leverage buffer. As a result of our capital
shortfall, our maximum payout ratio under the enterprise regulatory capital framework as of December 31, 2023 and
December 31, 2022 was 0%. See “Note 13, Regulatory Capital Requirements” for information on our capital ratios as of
December 31, 2023 and December 31, 2022 under the enterprise regulatory capital framework.
The table below presents certain components of our regulatory capital.
Regulatory Capital Components | ||||||
As of December 31, | ||||||
2023 | 2022 | |||||
(Dollars in millions) | ||||||
Total equity | $77,682 | $60,277 | ||||
Less: | ||||||
Senior preferred stock | 120,836 | 120,836 | ||||
Preferred stock | 19,130 | 19,130 | ||||
Common equity | (62,284) | (79,689) | ||||
Less: deferred tax assets arising from temporary differences that exceed 10% of common equity tier 1 capital and other regulatory adjustments | 11,681 | 12,911 | ||||
Common equity tier 1 capital (deficit) | (73,965) | (92,600) | ||||
Add: perpetual, noncumulative preferred stock | 19,130 | 19,130 | ||||
Tier 1 capital (deficit) | (54,835) | (73,470) | ||||
Tier 2 capital adjustments | — | — | ||||
Adjusted total capital (deficit) | $(54,835) | $(73,470) | ||||
MD&A | Liquidity and Capital Management | ||
Fannie Mae 2023 Form 10-K | 127 |
The table below presents certain components of our core capital.
Statutory Capital Components | ||||||
As of December 31, | ||||||
2023 | 2022 | |||||
(Dollars in millions) | ||||||
Total equity | $77,682 | $60,277 | ||||
Less: | ||||||
Senior preferred stock | 120,836 | 120,836 | ||||
Accumulated other comprehensive income (loss), net of taxes | 32 | 35 | ||||
Core capital (deficit) | (43,186) | (60,594) | ||||
Less: general allowance for foreclosure losses | (8,934) | (11,617) | ||||
Total capital (deficit) | $(34,252) | $(48,977) | ||||
Capital Activity
Under the terms governing the senior preferred stock, no dividends were payable to Treasury for the fourth quarter of
2023 and none are payable for the first quarter of 2024.
Under the terms governing the senior preferred stock, through and including the capital reserve end date, any increase
in our net worth during a fiscal quarter results in an increase in the same amount of the aggregate liquidation preference
of the senior preferred stock in the following quarter. The capital reserve end date is defined as the last day of the
second consecutive fiscal quarter during which we have had and maintained capital equal to, or in excess of, all of the
capital requirements and buffers under the enterprise regulatory capital framework.
As a result of these terms governing the senior preferred stock, the aggregate liquidation preference of the senior
preferred stock increased to $195.2 billion as of December 31, 2023 due to the $4.7 billion increase in our net worth in
the third quarter of 2023. The aggregate liquidation preference of the senior preferred stock will further increase to
$199.2 billion as of March 31, 2024, due to the $4.0 billion increase in our net worth in the fourth quarter of 2023. See
“Business—Conservatorship and Treasury Agreements—Treasury Agreements” for more information on the terms of
our senior preferred stock, including how the aggregate liquidation preference is determined.
Increases in our net worth improve our capital position and our ability to absorb losses; however, increases in our net
worth also increase the aggregate liquidation preference of the senior preferred stock by the same amount until the
capital reserve end date as discussed above.
Treasury Funding Commitment
Treasury made a commitment under the senior preferred stock purchase agreement to provide funding to us under
certain circumstances if we have a net worth deficit. As of December 31, 2023, the remaining amount of Treasury’s
funding commitment to us was $113.9 billion. See “Note 2, Conservatorship, Senior Preferred Stock Purchase
Agreement and Related Matters” for more information on Treasury’s funding commitment under the senior preferred
stock purchase agreement.
Risk Management
Overview
We manage the risks that arise from our business activities through our enterprise risk management program. Our risk
management activities are aligned with the requirements of FHFA’s Enterprise Risk Management Program Advisory
Bulletin, which are consistent with the general principles set forth by the Committee of Sponsoring Organizations of the
Treadway Commission’s (“COSO”) Enterprise Risk Management—Integrating with Strategy and Performance
framework.
Risk Categories
We are exposed to the following major risk categories:
•Credit Risk. Credit risk is the risk of loss arising from another party’s failure to meet its contractual obligations.
For financial securities or instruments, credit risk is the risk of not receiving principal, interest or other financial
obligation on a timely basis. Our credit risk exposure exists primarily in connection with our guaranty book of
business and our institutional counterparties.
MD&A | Liquidity and Capital Management | ||
Fannie Mae 2023 Form 10-K | 128 |
•Market Risk. Market risk is the risk of loss resulting from changes in the economic environment. Market risk
arises from fluctuations in interest rates, exchange rates and other market rates and prices. Market risk
includes interest-rate risk, which is the risk that movements in interest rates will adversely affect the value of
our assets or liabilities or our future earnings or capital. Market risk also includes spread risk, which is the risk
from changes in an instrument’s value that relate to factors other than changes in interest rates.
•Liquidity and Funding Risk. Liquidity and funding risk is the risk to our financial condition and resilience
arising from an inability to meet obligations when they come due, including the risk associated with the inability
to access funding sources or manage fluctuations in funding levels.
•Operational Risk. Operational risk is the risk of loss resulting from inadequate or failed internal processes,
people or systems, or disruptions from external events. Operational risk includes cyber/information security risk
and third-party risk.
•Model Risk. Model risk is the risk of potential adverse consequences (such as financial loss or reputational
damage) due to: inappropriate model design; errors in model coding, implementation, inputs or assumptions;
inadequate model performance; or incorrect use or application of model outputs or reports.
We are also exposed to these additional risk categories:
•Strategic Risk. Strategic risk is the risk of loss resulting from poor business decisions, poor implementation of
business decisions or the failure to respond appropriately to changes in the industry or external environment.
•Compliance Risk. Compliance risk is the risk of legal or regulatory sanctions, damage to current or projected
financial condition, damage to business resilience or damage to reputation resulting from nonconformance with
compliance obligations. These obligations include laws or regulations, prescribed practices, MBS trust
agreements, supervisory guidance, conservator instruction, internal policies and procedures or ethical
standards governing how we operate. Compliance risk exposes us to adverse actions by regulators, law
enforcement or other government agencies, or private civil action, and financial losses incurred through fines,
legal judgments, voiding of contracts or civil penalties. Compliance risk can result in damaged or diminished
reputation, limited business opportunities and lessened expansion potential.
•Reputational Risk. Reputational risk is the risk that substantial negative publicity may cause a decline in public
perception of us, a decline in our customer base, costly litigation, revenue reductions or losses.
We are also exposed to climate risk. We view climate risk as a cross-cutting risk that can impact a variety of our existing
risk categories, particularly credit risk. See “Climate and Natural Disaster Risk Management” for a discussion of climate
risks and climate risk management.
For a more detailed discussion of these and other risks that could materially adversely affect our business, results of
operations, financial condition, liquidity and net worth, see “Risk Factors.”
MD&A | Risk Management |
Fannie Mae 2023 Form 10-K | 129 |
Components of Risk Management
Our risk management program is composed of four inter-related components.
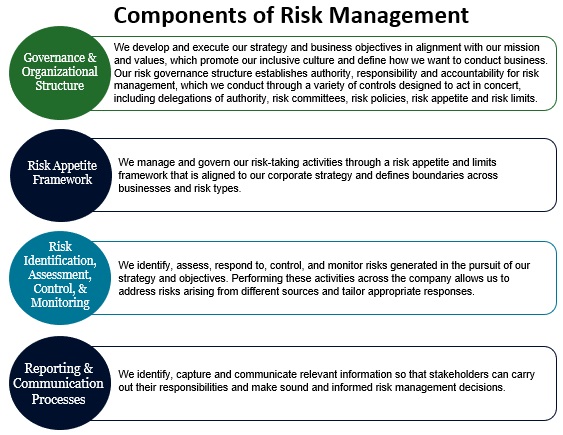
MD&A | Risk Management |
Fannie Mae 2023 Form 10-K | 130 |
Risk Management Governance
We manage risk by using the industry standard “three lines of defense” structure. Our Board of Directors and
management-level risk committees are also integral to our risk management program.
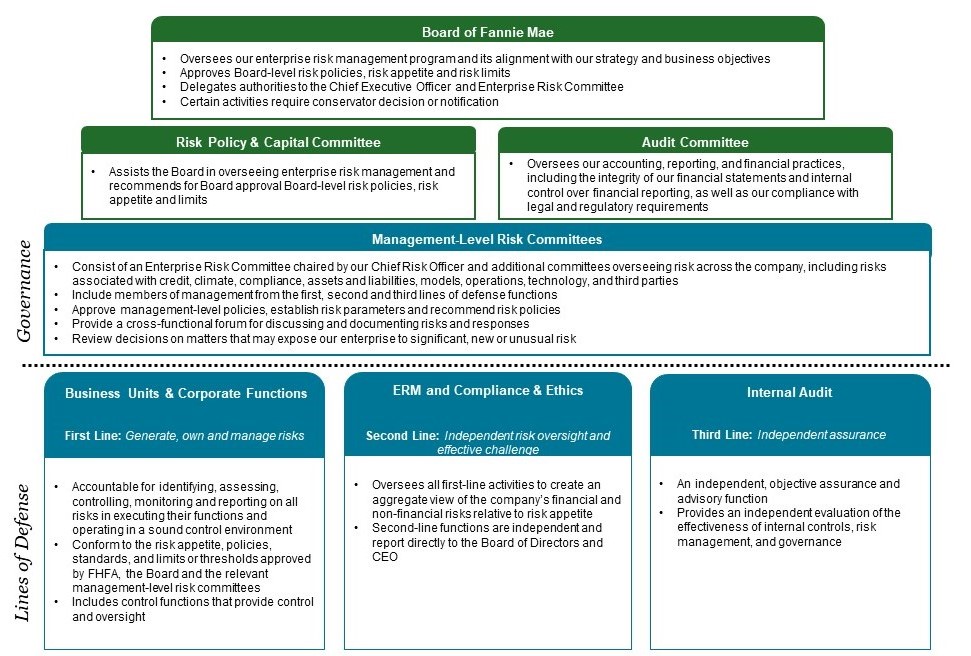
Credit Risk Management Overview
Below we discuss how we manage mortgage credit risk, climate and natural disaster risk, and institutional counterparty
credit risk.
Mortgage Credit Risk Management
Mortgage credit risk arises from the risk of loss resulting from the failure of a borrower to make required mortgage
payments. We are exposed to credit risk on our book of business because we either hold mortgage assets, have issued
a guaranty in connection with the creation of Fannie Mae MBS backed by mortgage assets or have provided other credit
enhancements on mortgage assets. For information on how we manage mortgage credit risk, see “Single-Family
Business—Single-Family Mortgage Credit Risk Management” and “Multifamily Business—Multifamily Mortgage Credit
Risk Management.”
Climate and Natural Disaster Risk Management
Overview
Climate change presents both immediate and long-term risks to our business and other stakeholders in the housing
system, including borrowers, renters, lenders, investors and insurers. Climate risks are divided into two main categories:
•Physical risks, which relate to the physical impact of climate change and include both: event-driven risks
relating to shorter-term extreme weather events, such as hurricanes, floods and tornadoes (referred to as acute
risks); or longer-term shifts in climate patterns, such as sustained higher temperatures, sea level rise, water
scarcity and increased wildfires (referred to as chronic risks).
MD&A | Risk Management |
Fannie Mae 2023 Form 10-K | 131 |
•Transition risks, which relate to a potential transition to a lower-carbon economy and may be driven by
additional regulatory and legislative requirements, adoption of new technologies and shifts in consumer
behavior.
Climate-Related Risk Exposure and Risk Mitigation
Major weather events or other natural disasters expose us to credit risk in a variety of ways, including by damaging
properties that secure mortgage loans in our book of business and by negatively impacting the ability of borrowers to
make payments on their mortgage loans. The amount of losses we incur as a result of a major weather event or natural
disaster depends significantly on the extent to which the resulting property damage is covered by hazard or flood
insurance and whether borrowers can continue making payments on their mortgages. The amount of losses we incur
can also be affected by the extent that a disaster impacts the region, especially if it depresses the local economy, and
by the availability of federal, state, or local assistance to borrowers affected by a disaster. To date, our losses from
natural disasters have been limited by geographic diversity in our book of business, the availability of insurance
coverage for damages sustained, the availability of federal, state, or local disaster assistance, and borrowers with equity
in their homes continuing to pay their mortgages. Fannie Mae, pursuant to our charter, is obligated to support residential
mortgage liquidity nationwide. We generally do not disqualify any single-family or multifamily property on the basis of its
geographic location in the U.S. (including Puerto Rico, the U.S. Virgin Islands, and Guam).
We mitigate climate-related risks, in part, through credit risk transfer and risk-sharing transactions. Our back-end credit
risk transfer transactions for single-family and multifamily loans are designed to transfer a portion of the losses we
expect would be incurred in an economic downturn or a stressed credit environment. As a result, we typically retain all
or a portion of the first loss position on loans covered by these transactions. To the extent weather and disaster-related
losses on loans covered by these transactions were to exceed the amount of the first loss we retain, a portion of those
losses would be covered by these back-end credit risk transfer transactions. We also enter into risk-sharing agreements
with multifamily lenders, primarily through the DUS program, pursuant to which the lenders typically agree to retain one-
third of the credit losses on the covered loans. For more information on our single-family credit risk transfer transactions,
see “Single-Family Business—Single-Family Mortgage Credit Risk Management—Single-Family Credit Enhancement
and Transfer of Mortgage Credit Risk—Credit Risk Transfer Transactions” and for more information on our multifamily
credit risk transfer transactions and our DUS program, see “Multifamily Business—Multifamily Mortgage Credit Risk
Management—Transfer of Multifamily Mortgage Credit Risk.”
In general, we require borrowers to obtain and maintain property insurance to cover the risk of damage to their property
resulting from hazards such as fire, wind and, for properties in areas identified by FEMA as Special Flood Hazard Areas,
coastal barrier resource systems or otherwise protected areas, flooding. At the time of origination, a borrower is required
to provide proof of such insurance, and our servicers have the right and the obligation to obtain such insurance, at the
borrower’s cost, if the borrower allows the required coverage to lapse. In addition, our servicers monitor flood maps, and
will require a flood insurance policy if a mortgaged property is remapped into a Special Flood Hazard Area at any time
during the life of the loan. We do not require property insurance to cover damages from flooding in areas outside a
Special Flood Hazard Area, coastal barrier resource system or otherwise protected area, or to cover earthquake
damage to single-family properties or to multifamily properties unless required by a seismic-risk assessment. As of
December 31, 2023, 3.2% of loans in our single-family guaranty book of business and 6.9% of loans in our multifamily
guaranty book of business were located in a Special Flood Hazard Area.
In the event of a natural or other disaster, our servicers work with affected borrowers to develop a plan that addresses
the borrower’s specific situation. Depending on the circumstances, the plan may include one or more of the following: a
payment forbearance plan; a repayment or reinstatement plan; a payment deferral; loan modification; coordination with
insurance companies and administration of insurance proceeds; and, if appropriate, foreclosure alternatives such as
short sales and deeds-in-lieu of foreclosure, or foreclosure. In addition, Fannie Mae, through its partners, offers renters
and single-family borrowers free financial counseling from HUD-approved housing counselors. These activities are
designed to assist renters and borrowers affected by disasters and also help reduce our losses, and we continue to
evaluate their impact and seek new options and resources to deploy in response to disasters.
Climate Risk Governance
The Board’s Risk Policy and Capital Committee has primary oversight of climate-related risks to the company. The
Board’s Community Responsibility and Sustainability Committee oversees development and implementation of the
company’s climate risk strategy. The Audit Committee provides oversight of ESG-related reporting, which includes
climate risk-related reporting. In 2023, we established a management-level Climate Risk Committee, chaired by our
Chief Risk Officer. The Climate Risk Committee provides executive-level engagement and oversight of climate risk. The
Climate Risk Committee supports and reports to the Enterprise Risk Committee.
MD&A | Risk Management | Climate and Natural Disaster Risk Management | ||
Fannie Mae 2023 Form 10-K | 132 |
Climate Risk Actions
Our Climate Impact team, led by our Chief Climate Officer, is actively working to understand and quantify our climate
risk exposures, and identify best practices and strategies to mitigate the impacts of climate change on our business. We
continue to integrate climate considerations into our organization. Our approach to identifying, assessing, mitigating,
and reporting on climate-related risks is informed by the recommendations of the Task Force on Climate-Related
Financial Disclosures.
We continue to focus on analyzing our physical and transition risks, while also reviewing the landscape of modeling
approaches and data needs to improve predictive results. We continue to develop our climate scenario methodologies
and assess the addition of third-party climate models.
As the risks associated with climate change become an increasing focus for our business, we are taking steps to
integrate climate risk considerations into our Enterprise Risk Management framework. We are focused on developing
and implementing a comprehensive, integrated approach to the identification, assessment, and management of climate-
related risks and opportunities.
Addressing climate and natural disaster risks will be critical to Fannie Mae’s overall housing mission. We are exploring
the role we, along with FHFA and others, can play in helping to address some of these risks. For example, we are
working with internal and external stakeholders to develop and support climate and natural disaster resiliency
standards. Given that improving the resiliency of properties will take time, we are also focused on examining insurance
requirements to promote the financial stability of households impacted by severe weather. One other consideration is
the impact of resiliency or energy efficiency standards on affordability. A key challenge will be to appropriately balance
improvements in climate resiliency and energy efficiency with affordability, particularly in historically underserved
communities. Developing solutions to these challenges is complicated by the range and diversity of affected
stakeholders, the possible need for legislative or regulatory action, industry insurance capacity, and the need to balance
risk mitigation, affordability and sustainability.
See “Risk Factors—Credit Risk” for additional information on the risks we face from the occurrence of major natural or
other disasters and the impact of climate change.
Institutional Counterparty Credit Risk Management
Overview
Institutional counterparty credit risk is the risk of loss resulting from the failure of an institutional counterparty to fulfill its
contractual obligations to us. Our primary exposure to institutional counterparty credit risk exists with our:
•credit guarantors, including mortgage insurers, reinsurers and multifamily lenders with risk sharing
arrangements;
•mortgage lenders that sell loans to us and mortgage lenders and other counterparties that service our loans;
and
•financial institutions that issue the investments held in our corporate liquidity portfolio.
We also have counterparty exposure to: derivatives counterparties, custodial depository institutions; mortgage
originators, investors and dealers; debt security dealers; central counterparty clearing institutions; and document
custodians.
We routinely enter into a high volume of transactions with counterparties in the financial services industry resulting in a
significant credit concentration with respect to this industry. We also may have multiple exposures to particular
counterparties, as many of our institutional counterparties perform several types of services for us. Accordingly, if one of
these counterparties were to become insolvent or otherwise default on its obligations to us, it could harm our business
and financial results in a variety of ways. Our overall objective in managing institutional counterparty credit risk is to
maintain individual and portfolio-level counterparty exposures within acceptable ranges based on our risk-based rating
system. We seek to achieve this objective through the following:
•establishment and observance of counterparty eligibility standards appropriate to each exposure type and level;
•establishment of risk limits;
•requiring collateralization of exposures where appropriate; and
•exposure monitoring and management.
See “Risk Factors—Credit Risk” for additional discussion of the risks to our business if one or more of our institutional
counterparties fails to fulfill their contractual obligations to us.
MD&A | Risk Management | Climate and Natural Disaster Risk Management | ||
Fannie Mae 2023 Form 10-K | 133 |
Counterparty Risk Management Framework
Establishment and Observance of Counterparty Eligibility Standards
The institutions with which we do business vary in size, complexity and geographic footprint. Because of this,
counterparty eligibility criteria vary depending upon the type and magnitude of the risk exposure incurred. We use a risk-
based approach to assess the credit risk of our counterparties through regular examination of their financial statements,
confidential communication with the management of those counterparties and regular monitoring of publicly available
credit rating information. This and other information is used to develop proprietary credit rating metrics that we use to
assess credit quality. Factors including corporate or third-party support or guarantees, our knowledge of the
counterparty and its management, reputation, quality of operations and experience are also important in determining the
initial and continuing eligibility of a counterparty.
Establishment of Risk Limits
Institutions are assigned a risk limit to ensure that our risk exposure is maintained at a level appropriate for the
institution’s credit assessment and the time horizon for the exposure, as well as to diversify exposure so that we
adequately manage our concentration risk. A corporate risk limit is first established at the counterparty level for the
aggregate of all activity and then is divided among our individual business units. Our business units may further
subdivide limits among products or activities.
Collateralization of Exposures
We may require collateral, letters of credit or investment agreements as a condition to approving exposure to a
counterparty. Collateral requirements are determined after a comprehensive review of the credit quality and the level of
risk exposure of each counterparty. We may require that a counterparty post collateral in the event of an adverse event
such as a ratings downgrade. Collateral requirements are monitored and generally adjusted each business day.
Exposure Monitoring and Management
The risk management functions of the individual business units are responsible for managing the counterparty
exposures associated with their activities within risk limits. An oversight team that reports to our Chief Risk Officer is
responsible for establishing and enforcing corporate policies and procedures regarding counterparties, establishing
corporate limits and aggregating and reporting institutional counterparty exposure. We regularly update exposure limits
for individual institutions and communicate changes to the relevant business units. We regularly report exposures
against the risk limits to the Risk Policy and Capital Committee of the Board of Directors.
Mortgage Insurers
We are generally required, pursuant to our charter, to obtain credit enhancements on single-family conventional
mortgage loans that we purchase or securitize with LTV ratios over 80% at the time of purchase. We use several types
of credit enhancements to manage our single-family mortgage credit risk, including primary and pool mortgage
insurance coverage. Our primary exposure associated with mortgage insurers is that they will fail to fulfill their
obligations to reimburse us for claims under our insurance policies.
Actions we take to manage this risk include:
•maintaining financial and operational eligibility requirements that an insurer must meet to become and remain a
qualified mortgage insurer;
•regularly monitoring our exposure to individual mortgage insurers and mortgage insurer credit ratings, including
in-depth financial reviews and analyses of the insurers’ portfolios and capital adequacy under hypothetical
stress scenarios;
•requiring certification and supporting documentation annually from each mortgage insurer; and
•performing periodic reviews of mortgage insurers to confirm compliance with eligibility requirements and to
evaluate their management, control and underwriting practices.
The master policies issued by our primary mortgage insurers govern their claim-paying obligations to us, including
circumstances in which significant underwriting or servicing defects might permit the mortgage insurer to rescind
coverage or deny a claim. Where a claim has not been properly paid as a result of lender non-compliance with their
obligation to maintain coverage, the lender is required to make us whole for losses not covered by the insurer. The risk
of coverage rescission is mitigated by the rescission relief principles we require in mortgage insurer master policies, and
may also be mitigated by the quality control standards required by private mortgage insurer eligibility requirements
(“PMIERs”). Generally, the rescission relief principles align with our representation and warranty framework and require
our primary mortgage insurers to waive their rescission rights after a mortgage has performed for at least 36 months or
if they have completed a full review of the loan and found no significant defects.
MD&A | Risk Management | Institutional Counterparty Credit Risk Management | ||
Fannie Mae 2023 Form 10-K | 134 |
In describing our mortgage insurance coverage, “insurance in force” refers to the unpaid principal balance of single-
family loans in our conventional guaranty book of business covered under the applicable mortgage insurance policies.
Our total mortgage insurance in force was $755.8 billion, or 21% of our single-family conventional guaranty book of
business, as of December 31, 2023, compared with $744.3 billion, or 20% of our single-family conventional guaranty
book of business, as of December 31, 2022.
“Risk in force” refers to the maximum potential loss recovery under the applicable mortgage insurance policies in force
and is generally based on the loan-level insurance coverage percentage and, if applicable, any aggregate pool loss
limit, as specified in the policy. As of December 31, 2023, our total mortgage insurance risk in force was $200.1 billion,
or 6% of our single-family conventional guaranty book of business, compared with $193.8 billion, or 5% of our single-
family conventional guaranty book of business, as of December 31, 2022.
Our total mortgage insurance in force and risk in force excludes insurance coverage provided by federal government
entities and credit insurance obtained through CIRT deals.
The charts below display our mortgage insurer counterparties that provided 10% or more of the risk-in-force mortgage
insurance coverage on the loans in our single-family conventional guaranty book of business.
Mortgage Insurer Concentration(1)
Mortgage Guaranty Insurance Corp. | Arch Capital Group Ltd. | Radian Guaranty, Inc. | ||||||||
Enact Mortgage Insurance Corp. | Essent Guaranty, Inc. | National Mortgage Insurance Corp. | ||||||||
Others | ||||||||||
(1)Insurance coverage amounts provided for each counterparty may include coverage provided by affiliates and subsidiaries of the
counterparty.
As of December 31, 2023, less than 1% of our total risk-in-force coverage was held with three mortgage insurers that
are in run-off, and therefore are no longer approved to write new insurance with us, compared with 1% as of December
31, 2022.
Mortgage insurers must meet and maintain compliance with PMIERs to be eligible to write mortgage insurance on loans
acquired by Fannie Mae. The PMIERs are designed to ensure that mortgage insurers have sufficient liquid assets to
pay all claims under a hypothetical future stress scenario.
See “Risk Factors—Credit Risk” for a discussion of the risks to our business of claims under our mortgage insurance
policies not being paid in full or at all.
Reinsurers
We use CIRT deals to transfer credit risk on a pool of loans to an insurance provider that retains the risk, or to an
insurance provider that simultaneously cedes all of its risk to one or more reinsurers. In CIRT transactions, we select the
insurance providers and approve the allocation of coverage that may be simultaneously transferred to reinsurers by a
MD&A | Risk Management | Institutional Counterparty Credit Risk Management | ||
Fannie Mae 2023 Form 10-K | 135 |
direct provider of our CIRT insurance coverage. We take certain steps to increase the likelihood that we will recover on
the claims we file with the insurers, including the following:
•In our approval and selection of CIRT insurers and reinsurers, we take into account the financial strength of
those companies and the concentration risk that we have with those counterparties.
•We monitor the financial strength of CIRT insurers and reinsurers to confirm compliance with our requirements
and to minimize potential exposure. Changes in the financial strength of an insurer or reinsurer may impact our
future allocation of new CIRT insurance coverage to those providers. In addition, a material deterioration of the
financial strength of a CIRT insurer or reinsurer may permit us to terminate existing CIRT coverage pursuant to
terms of the CIRT insurance policy.
•We require a portion of the insurers’ or reinsurers’ obligations in a CIRT transaction to be collateralized with
highly-rated liquid assets held in a trust account. The required amount of collateral is initially determined
according to the ratings of the insurer or reinsurer. Contractual provisions require additional collateral to be
posted in the event of adverse developments with the counterparty, such as a ratings downgrade to specified
levels.
The charts below display the concentration of our credit risk exposure to our top five CIRT counterparties, measured by
maximum liability to us, excluding the benefit of collateral we hold to secure the counterparties’ obligations.
CIRT Counterparty Concentration

Top 5 | Others | ||||||
•As of December 31, 2023, our CIRT counterparties had a maximum liability to us of $16.9 billion.
•As of December 31, 2023, $4.7 billion in liquid assets securing CIRT counterparties’ obligations were held in
trust accounts.
•Our top five CIRT counterparties had a maximum liability to us of $8.6 billion as of December 31, 2023,
compared with $7.4 billion as of December 31, 2022.
For information on our credit risk transfer transactions, see “Single-Family Business—Single-Family Mortgage Credit
Risk Management—Single-Family Credit Enhancement and Transfer of Mortgage Credit Risk—Credit Risk Transfer
Transactions” and “Multifamily Business—Multifamily Mortgage Credit Risk Management—Transfer of Multifamily
Mortgage Credit Risk.”
Multifamily Lenders with Risk Sharing
We enter into risk sharing agreements with multifamily lenders, primarily through the DUS program, pursuant to which
the lenders agree to bear all or some portion of the credit losses on the covered loans. Our maximum potential loss
recovery from lenders under risk sharing agreements on multifamily loans was $111.9 billion as of December 31, 2023,
compared with $103.9 billion as of December 31, 2022. As of December 31, 2023, 52% of our maximum potential loss
recovery on multifamily loans was from five DUS lenders compared with 53% as of December 31, 2022.
As noted above in “Multifamily Business—Multifamily Mortgage Credit Risk Management—Transfer of Multifamily
Mortgage Credit Risk,” our primary multifamily delivery channel is our DUS program, which is composed of lenders that
MD&A | Risk Management | Institutional Counterparty Credit Risk Management | ||
Fannie Mae 2023 Form 10-K | 136 |
range from large depositories to independent non-bank financial institutions. As of December 31, 2023, approximately
31% of the unpaid principal balance of loans in our multifamily guaranty book of business serviced by our DUS lenders
was from institutions with an external investment grade credit rating or a guaranty from an affiliate with an external
investment grade credit rating, compared with approximately 32% as of December 31, 2022. Given the recourse nature
of the DUS program, DUS lenders are bound by eligibility standards that dictate, among other items, minimum capital
and liquidity levels, and the posting of collateral at a highly rated custodian to secure a portion of the lenders’ future
obligations. We actively monitor the financial condition of these lenders to help ensure the level of risk remains within
our standards and to ensure required capital levels are maintained and are in alignment with actual and modeled loss
projections.
Mortgage Servicers and Sellers
The primary risk associated with mortgage servicers that service the loans in our guaranty book of business is that they
will fail to fulfill their servicing obligations. See “Single-Family Business—Single-Family Primary Business Activities—
Single-Family Mortgage Servicing” and “Multifamily Business—Multifamily Primary Business Activities—Multifamily
Mortgage Servicing” for more discussion on the services performed by our mortgage servicers.
A servicing contract breach could result in credit losses for us or could cause us to incur the cost of finding a
replacement servicer. Replacing a mortgage servicer can result in potentially significant increases in our costs, as well
as increased operational risks. If a mortgage servicer fails, it could result in a temporary disruption in servicing and loss
mitigation activities relating to the loans serviced by that mortgage servicer, particularly if there is a loss of experienced
servicing personnel. See “Risk Factors—Credit Risk” for a discussion of additional risks to our business and financial
results associated with mortgage servicers.
We mitigate these risks in several ways, including by:
•establishing minimum standards and financial requirements for our servicers;
•monitoring financial and portfolio performance as compared with peers and internal benchmarks;
•for our largest mortgage servicers, conducting periodic financial reviews to confirm compliance with servicing
guidelines and servicing performance expectations; and
•identifying a group of servicers as potential contingency sub-servicers to which we could transfer the servicing
of some of the loans in our guaranty book in the event one or more of our top mortgage servicers is not able or
permitted to continue servicing our loans on our behalf.
We may take one or more of the following actions to mitigate our credit exposure to mortgage servicers that present a
higher risk:
•require a guaranty of obligations by higher-rated entities;
•transfer exposure to third parties;
•require collateral;
•establish more stringent financial requirements;
•work with underperforming major servicers to improve operational processes; and
•suspend or terminate the selling and servicing relationship if deemed appropriate.
As of December 31, 2023, over half of our single-family guaranty book was serviced by non-depositories and we expect
this concentration will increase further. Non-depository servicers also serviced over half of our multifamily guaranty book
as of December 31, 2023.
Compared with depository financial institutions, these institutions pose additional risks to us because they generally
have lower financial strength and liquidity as compared with our mortgage servicer counterparties that are depository
institutions. Unlike for depository servicers, much of the capital of non-depository servicers is represented by the value
of mortgage servicing rights, which is subject to variability based on market conditions and therefore is an important
factor in determining capital adequacy. Non-depository servicers also are generally not subject to the same level of
regulatory oversight as our mortgage servicer counterparties that are depository institutions. We require non-depository
servicers to meet minimum liquidity requirements to maintain eligibility with Fannie Mae. We actively monitor the
financial condition and capital adequacy of non-depository servicers, including their compliance with our requirements.
MD&A | Risk Management | Institutional Counterparty Credit Risk Management | ||
Fannie Mae 2023 Form 10-K | 137 |
The charts below display the percentage of our single-family conventional guaranty book of business serviced by our
top five depository single-family mortgage servicers and top five non-depository single-family mortgage servicers.
Single-Family Mortgage Servicer Concentration
Top 5 depository servicers | Top 5 non-depository servicers | Others | |||||||||
None of our single-family mortgage servicers serviced 10% or more of our single-family conventional guaranty book of
business as of December 31, 2023 or 2022. See “Risk Factors—Credit Risk” for more information about risks relating to
non-depository servicers.
The charts below display the percentage of our multifamily guaranty book of business serviced by our top five
depository multifamily mortgage servicers and top five non-depository multifamily mortgage servicers.
Multifamily Mortgage Servicer Concentration

Top 5 depository servicers | Top 5 non-depository servicers | Others | |||||||||
As of December 31, 2023, Walker & Dunlop, Inc. and Wells Fargo Bank, N.A. (together with its affiliates) serviced 13%
and 10%, respectively, of our multifamily guaranty book of business based on unpaid principal balance, compared with
13% and 11% as of December 31, 2022. No other multifamily mortgage servicers serviced 10% or more of our
multifamily guaranty book of business as of December 31, 2023 or 2022.
MD&A | Risk Management | Institutional Counterparty Credit Risk Management | ||
Fannie Mae 2023 Form 10-K | 138 |
Counterparty Credit Exposure Relating to our Corporate Liquidity Portfolio
The primary credit exposure associated with assets held in our corporate liquidity portfolio is that issuers will not repay
principal and interest in accordance with the contractual terms. If one of these counterparties fails to meet its obligations
to us under the terms of the investments, it could result in financial losses to us and have a material adverse effect on
our earnings, liquidity, financial condition and net worth. We believe the risk of default is low because our corporate
liquidity portfolio primarily consists of cash and cash equivalents, reverse repurchase agreements with a central
counterparty clearing institution or The Federal Reserve Bank of New York and U.S. Treasury securities.
As of December 31, 2023, our corporate liquidity portfolio totaled $114.3 billion and included $47.8 billion of U.S.
Treasury securities. As of December 31, 2022, our corporate liquidity portfolio totaled $116.0 billion and included $46.9
billion of U.S. Treasury securities. We mitigate our risk by monitoring the credit risk position of our corporate liquidity
portfolio. As of December 31, 2023, we held $11.8 billion in overnight unsecured deposits with six financial institutions,
compared with $11.0 billion held with five financial institutions as of December 31, 2022. The short-term credit ratings for
each of these financial institutions by S&P, Moody’s and Fitch were at least A-1 or the Moody’s or Fitch equivalent of
A-1.
See “Liquidity and Capital Management—Liquidity Management—Corporate Liquidity Portfolio” for more information on
our corporate liquidity portfolio.
Other Counterparties
Derivative Counterparty Credit Exposure
The primary credit exposure that we have on a derivative transaction is that a counterparty will default on payments
due, which could result in us having to acquire a replacement derivative from a different counterparty at a higher cost or
we may be unable to find a suitable replacement. Our derivative counterparty credit exposure relates principally to
interest-rate derivative contracts.
Derivative instruments may be privately negotiated contracts, which are often referred to as OTC derivatives, or they
may be listed and traded on an exchange where they are accepted for clearing by a derivatives clearing organization as
our cleared derivative transactions.
Actions we take to manage our derivative counterparty credit exposure relating to our OTC derivative transactions
include:
•entering into enforceable master netting arrangements with these counterparties, which allow us to net
derivative assets and liabilities with the same counterparty; and
•requiring counterparties to post collateral, which includes cash, U.S. Treasury securities, agency debt and
agency mortgage-related securities.
We manage our credit exposure relating to our cleared derivative transactions through enforceable master netting
arrangements. These arrangements allow us to net our exposure to cleared derivatives by clearing organization and by
clearing member.
Our cleared derivative transactions are submitted to a derivatives clearing organization on our behalf through a clearing
member of the organization. A contract accepted by a derivatives clearing organization is governed by the terms of the
clearing organization’s rules and arrangements between us and the clearing member of the clearing organization. As a
result, we are exposed to the institutional credit risk of both the derivatives clearing organization and the member who is
acting on our behalf. As of December 31, 2023, approximately 81% of our derivatives transactions were cleared through
a clearing organization, compared with 82% as of December 31, 2022.
See “Note 9, Derivative Instruments” and “Note 15, Netting Arrangements” for additional information on our derivative
contracts as of December 31, 2023 and 2022.
Counterparty Credit Risk Exposure Arising from the Resecuritization of Freddie Mac-Issued Securities
We have been resecuritizing Freddie Mac-issued securities since June 2019 when we began issuing UMBS, which has
increased our credit risk exposure and operational risk exposure to Freddie Mac. Although we have an indemnification
agreement with Freddie Mac, in the event Freddie Mac were to fail (for credit or operational reasons) to make a
payment on Freddie Mac securities that we had resecuritized in a Fannie Mae-issued structured security, we would be
responsible for making the entire payment on the Freddie Mac securities included in that structured security in order to
make payments on any of our outstanding single-family Fannie Mae MBS to be paid on that payment date. Accordingly,
if Freddie Mac were to fail to meet its obligations under the terms of these securities, it could have a material adverse
effect on our earnings and financial condition. We believe the risk of default by Freddie Mac is negligible because of the
funding commitment available to Freddie Mac through its senior preferred stock purchase agreement with Treasury.
MD&A | Risk Management | Institutional Counterparty Credit Risk Management | ||
Fannie Mae 2023 Form 10-K | 139 |
As of December 31, 2023, $215.6 billion in Freddie Mac securities were backing Fannie Mae-issued structured
securities, compared with $234.0 billion as of December 31, 2022. See “Risk Factors—GSE and Conservatorship Risk”
for more information on risks associated with our issuance of UMBS.
Central Counterparty Clearing Institutions
Fannie Mae is a clearing member of two divisions of Fixed Income Clearing Corporation (“FICC”), a central counterparty
(“CCP”). One FICC division clears our trades involving securities purchased under agreements to resell, securities sold
under agreements to repurchase, and other non-mortgage related securities. The other division clears our forward
purchase and sale commitments of mortgage-related securities, including dollar roll transactions. As a result of these
trades, we are required to post initial and variation margin payments as well as settle certain positions each business
day in cash. As a clearing member of FICC, we are exposed to the risk that the FICC or one or more of the CCP’s
clearing members fails to perform its obligations as described below.
•A default by or the financial or operational failure of FICC would require us to replace transactions cleared
through FICC, thereby increasing operational costs and potentially resulting in losses.
•We may also be exposed to losses if a clearing member of FICC defaults on its obligations as each clearing
member is required to absorb a portion of those fellow-clearing member losses. As a result, we could lose the
margin that we have posted to FICC. Moreover, our exposure could exceed the amount of margin that we
previously posted to FICC, since FICC’s rules require non-defaulting clearing members to cover, on a pro rata
basis, losses caused by a clearing member’s default.
We are unable to develop an estimate of the maximum potential amount of future payments that we could be required to
make to FICC under these arrangements as our exposure is dependent on the volume of trades FICC clearing
members execute now and in the future, which varies daily. Although we are unable to develop an estimate of our
maximum exposure, we expect that losses caused by any clearing member would be partially offset by the fair value of
margin posted by the defaulting clearing member and any other available assets of the CCP for those purposes. We
believe that the risk of a material loss is remote due to the FICC's margin and settlement requirements, guarantee funds
and other resources that are available in the event of a default.
We actively monitor the risks associated with the FICC in order to effectively manage this counterparty risk and our
associated liquidity exposure.
Custodial Depository Institutions
Our mortgage servicer counterparties are required by our Servicing Guide to use custodial depository institutions to hold
remittances of borrower payments of principal and interest on our behalf. If a custodial depository institution were to fail
while holding such remittances, we would be exposed to risk for balances in excess of the deposit insurance protection
and might not be able to recover all of the principal and interest payments being held by the depository on our behalf, or
there might be a substantial delay in receiving these amounts. If this were to occur, we would be required to replace
these amounts with our own funds to make payments that are due to Fannie Mae MBS certificateholders. Accordingly,
the insolvency of one of our principal custodial depository institutions could result in significant financial losses to us. To
mitigate these risks, our Servicing Guide requires our mortgage servicer counterparties to use custodial depository
institutions that are insured, that are rated as “well capitalized” by their regulator and that meet certain minimum
financial ratings from third-party agencies.
Mortgage Originators, Investors and Dealers
We are routinely exposed to pre-settlement risk through the purchase or sale of mortgage loans and mortgage-related
securities with mortgage originators, mortgage investors and mortgage dealers. The risk is the possibility that the
counterparty will be unable or unwilling to either deliver mortgage assets or compensate us for the cost to cancel or
replace the transaction. We manage this risk by determining position limits with these counterparties, based upon our
assessment of their creditworthiness, and by monitoring and managing these exposures.
Debt Security Dealers
The credit risk associated with dealers that commit to place our debt securities is that they will fail to honor their
contracts to take delivery of the debt, which could result in delayed issuance of the debt through another dealer. We
manage these risks by establishing approval standards, monitoring our exposure positions and monitoring changes in
the credit quality of dealers.
Document Custodians
We use third-party document custodians to provide loan document certification and custody services for some of the
loans that we purchase and securitize. In many cases, our lenders or their affiliates also serve as document custodians
MD&A | Risk Management | Institutional Counterparty Credit Risk Management | ||
Fannie Mae 2023 Form 10-K | 140 |
for us. Our ownership rights to the mortgage loans that we own or that back our Fannie Mae MBS could be challenged if
a lender intentionally or negligently pledges or sells the loans that we purchased or fails to obtain a release of prior liens
on the loans that we purchased, which could result in financial losses to us. When a lender or one of its affiliates acts as
a document custodian for us, the risk that our ownership interest in the loans may be adversely affected is increased,
particularly in the event the lender were to become insolvent. We mitigate these risks through legal and contractual
arrangements with these custodians that identify our ownership interest, as well as by establishing qualifying standards
for document custodians and requiring removal of the documents to our possession or to an independent third-party
document custodian if we have concerns about the solvency or competency of the document custodian.
The MERS System
The MERS® System is an electronic registry owned by Intercontinental Exchange that is widely used by participants in
the mortgage finance industry to track servicing rights and ownership of loans in the United States. A majority of the
loans we own or guarantee are registered and tracked in the MERS System. Though we believe it is unlikely, if we are
unable to use the MERS System, or if our use of the MERS System adversely affects our ability to enforce our rights
with respect to our loans registered and tracked in the MERS System, it could create operational and legal risks for us
and increase the costs and time it takes to record loans or foreclose on loans.
Market Risk Management, including Interest-Rate Risk Management
We are subject to market risk, which includes interest-rate risk and spread risk. These risks arise primarily from our
mortgage asset investments. Interest-rate risk is the risk that movements in interest rates will adversely affect the value
of our assets or liabilities or our future earnings or capital. Spread risk is the risk from changes in an instrument’s value
that relate to factors other than changes in interest rates.
Interest-Rate Risk Management
Our exposure to interest-rate risk primarily arises from two sources: our net portfolio and our consolidated MBS trusts.
Our goal is to manage interest-rate risk from our net portfolio to be neutral to changes in interest rates and volatility on
an economic basis, subject to model constraints and prevailing market conditions. We collectively define our net
portfolio as: our retained mortgage portfolio assets; our corporate liquidity portfolio; outstanding debt of Fannie Mae
used to fund the retained mortgage portfolio assets and corporate liquidity portfolio; mortgage commitments; and risk
management derivatives.
We employ an integrated interest-rate risk management strategy that allows for informed risk taking within pre-defined
corporate risk limits. Decisions regarding our strategy in managing interest-rate risk are based upon our corporate
market risk policy and limits that are approved by our Board of Directors.
We monitor current market conditions, including the interest-rate environment, to assess the impact of these conditions
on individual positions and our interest-rate risk profile. In addition to qualitative factors, we use various quantitative risk
metrics in determining the appropriate composition of our retained mortgage portfolio, our investments in non-mortgage
securities and relative mix of debt and derivatives positions in order to remain within pre-defined risk tolerance levels
that we consider acceptable. We regularly disclose two interest-rate risk metrics that estimate our interest-rate
exposure: (1) fair value sensitivity to changes in interest-rate levels and the slope of the yield curve and (2) duration
gap.
The metrics used to measure our interest-rate exposure are generated using internal models. Our internal models,
consistent with standard practice for models used in our industry, require numerous assumptions. There are inherent
limitations in any methodology used to estimate the exposure to changes in market interest rates. The reliability of our
prepayment estimates and interest-rate risk metrics depends on the availability and quality of historical data for each of
the types of securities in our net portfolio, as discussed below. When market conditions change rapidly and dramatically,
the assumptions of our models may no longer accurately capture or reflect the changing conditions. See “Risk Factors
—Operational and Model Risk” for a discussion of the risks associated with our reliance on models to manage risk.
Sources of Interest-Rate Risk Exposure
Our mortgage assets consist mainly of single-family and multifamily mortgage loans. For single-family loans, borrowers
have the option to prepay at any time before the scheduled maturity date. This prepayment uncertainty results in a
potential mismatch between the timing of receipt of cash flows related to our assets and the timing of payment of cash
flows related to our liabilities. Changes in interest rates, as well as other factors, influence mortgage prepayment rates
and duration and also affect the value of our mortgage assets. When interest rates decrease, prepayment rates on
fixed-rate mortgages generally accelerate because borrowers usually can pay off their existing mortgages and refinance
at lower rates. Accelerated prepayment rates have the effect of shortening the duration and average life of the fixed-rate
mortgage assets we hold in our net portfolio. In a declining interest-rate environment, existing mortgage assets held in
MD&A | Risk Management | Institutional Counterparty Credit Risk Management | ||
Fannie Mae 2023 Form 10-K | 141 |
our net portfolio tend to increase in value or price because these mortgages are likely to have higher interest rates than
new mortgages, which are being originated at the then-current lower interest rates. Conversely, when interest rates
increase, prepayment rates generally slow, which extends the duration and average life of our mortgage assets and
results in a decrease in value. Interest rates also affect the value of our non-mortgage assets, which are primarily fixed-
rate securities. As interest rates decline, the value of our fixed-rate securities tend to increase with the opposite impact
when rates rise.
We are also exposed to interest-rate risk in connection with cost basis adjustments related to mortgage assets, mainly
single-family and multifamily mortgage loans, held by our consolidated MBS trusts. These cost basis adjustments often
result from upfront cash fees exchanged at the time of loan acquisition, which include buy-ups, buy-downs, and loan-
level risk-based price adjustments. The timing of when we recognize amortization income related to cost basis
adjustments may be affected by prepayments, thereby impacting our earnings. Changes in the timing of income
recognition related to cost basis adjustments impact the present value of this income. See “Consolidated Results of
Operations—Net Interest Income—Analysis of Unamortized Deferred Guaranty Fee Income” for more information on
our outstanding net cost basis adjustments related to consolidated MBS trusts.
We are also exposed to interest-rate risk in connection with the float income earned by MBS trusts on the short-term
reinvestment of loan payments received from borrowers in highly liquid investments with short maturities, such as U.S.
Treasury securities. This float income is paid to us as trust management income and recorded within “Net interest
income” in our consolidated financial statements. Changes in interest rates impact the amount of float income generated
by MBS trusts and our float reinvestment yields. Typically, interest-rate driven changes in the timing of income
recognition related to cost basis amortization are partially offset by interest-rate driven changes in the amount of float
income earned.
For additional discussion of how interest rates can affect our financial results, see “Key Market Economic Indicators—
How Interest Rates Can Affect Our Financial Results.”
Interest-Rate Risk Management Strategy
Our goal for managing the interest-rate risk of our net portfolio is to be neutral to movements in interest rates and
volatility. This involves asset selection and structuring of our liabilities to match and offset the interest-rate
characteristics of our retained mortgage portfolio and our investments in non-mortgage securities. We actively manage
the interest-rate risk of our net portfolio through a strategy incorporating the following principal elements:
•Debt Instruments. We issue a broad range of both callable and non-callable debt instruments to manage the
duration and prepayment risk of expected cash flows of the mortgage assets we own.
•Derivative Instruments. We supplement our issuance of debt with derivative instruments to further reduce
duration and prepayment risks.
•Monitoring and Active Portfolio Rebalancing. We continually monitor our risk positions and actively rebalance
our portfolio of interest rate-sensitive financial instruments to maintain a close match between the duration of
our assets and liabilities.
•Fair Value Hedge Accounting. We utilize fair value hedge accounting to align the timing of when we recognize
the interest-rate driven fair value changes in hedged mortgage loans and funding debt with derivative hedging
instruments to mitigate GAAP earnings exposure to interest-rate changes, including any short-term earnings
volatility that might result from economic hedging.
We do not currently actively manage or hedge, on an economic basis, our spread risk, or the interest-rate risk arising
from cost basis adjustments and float income associated with mortgage assets held by our consolidated MBS trusts.
Our spread risk includes the impact of changes in the spread between our mortgage assets and debt (referred to as
mortgage-to-debt spreads) after we purchase mortgage assets. For mortgage assets in our portfolio that we intend to
hold to maturity to realize the contractual cash flows, we accept period-to-period volatility in our financial performance
attributable to changes in mortgage-to-debt spreads that occur after our purchase of mortgage assets. See “Risk
Factors—Market and Industry Risk” for a discussion of the risks to our business posed by changes in interest rates and
changes in spreads. See “Earnings Exposure to Interest-Rate Risk” below for the impact of market risk on our earnings.
Debt Instruments
Historically, the primary tool we have used to fund the purchase of mortgage assets and manage the interest-rate risk
implicit in our mortgage assets is the variety of debt instruments we issue. The debt we issue is a mix that typically
consists of short- and long-term, non-callable and callable debt. The varied maturities and flexibility of these debt
combinations help us in reducing the mismatch of cash flows between assets and liabilities in order to manage the
duration risk associated with an investment in long-term fixed-rate assets. Callable debt helps us manage the
prepayment risk associated with fixed-rate mortgage assets because the duration of callable debt changes when
MD&A | Risk Management | Market Risk Management, including Interest-Rate Risk Management | ||
Fannie Mae 2023 Form 10-K | 142 |
interest rates change in a manner similar to changes in the duration of mortgage assets. See “Liquidity and Capital
Management—Liquidity Management—Debt Funding” for additional information on our debt activity.
Derivative Instruments
Derivative instruments also are an integral part of our strategy in managing interest-rate risk. See “Note 9, Derivative
Instruments” for a description of the derivatives we use for interest-rate risk management purposes and the factors we
consider in deciding whether to use derivatives.
We use interest-rate swaps, interest-rate options and futures, in combination with our issuance of debt securities, to
better match the duration of our assets with the duration of our liabilities. We are generally an end-user of derivatives;
our principal purpose in using derivatives is to manage our aggregate interest-rate risk profile within prescribed risk
parameters. We generally only use derivatives that are relatively liquid and straightforward to value. We use derivatives
for four primary purposes:
•as a substitute for notes and bonds that we issue in the debt markets;
•to achieve risk management objectives not obtainable with debt market securities;
•to quickly and efficiently rebalance our portfolio; and
•to hedge foreign currency exposure.
Decisions regarding the repositioning of our derivatives portfolio are based upon current assessments of our interest-
rate risk profile and economic conditions, including the composition of our retained mortgage portfolio, our investments
in non-mortgage securities and relative mix of our debt and derivative positions, the interest-rate environment and
expected trends.
Measurement of Interest-Rate Risk
Below we present two quantitative metrics that provide estimates of our interest-rate risk exposure: (1) fair value
sensitivity of our net portfolio to changes in interest-rate levels and slope of yield curve; and (2) duration gap. The
metrics presented are calculated using internal models that require standard assumptions regarding interest rates and
future prepayments of principal over the remaining life of our securities. These assumptions are derived based on the
characteristics of the underlying structure of the securities and historical prepayment rates experienced at specified
interest-rate levels, taking into account current market conditions, the current mortgage rates of our existing outstanding
loans, loan age and other factors. On a regular basis, management makes judgments about the appropriateness of the
risk assessments and will make adjustments as necessary to properly assess our interest-rate exposure and manage
our interest-rate risk. The methodologies used to calculate risk estimates are periodically changed on a prospective
basis to reflect improvements in the underlying estimation process.
Interest-Rate Sensitivity to Changes in Interest-Rate Level and Slope of Yield Curve
Pursuant to a disclosure commitment with FHFA, we disclose on a monthly basis the estimated adverse impact on the
fair value of our net portfolio that would result from the following hypothetical situations:
•a 50 basis point shift in interest rates; and
•a 25 basis point change in the slope of the yield curve.
In measuring the estimated impact of changes in the level of interest rates, we assume a parallel shift in all maturities of
the SOFR or U.S. LIBOR interest-rate swap curve, as applicable.
In measuring the estimated impact of changes in the slope of the yield curve, we assume a constant 7-year rate and a
shift of 16.7 basis points for the 1-year rate and shorter tenors and an opposite shift of 8.3 basis points for the 30-year
rate. Rate shocks for remaining maturity points are interpolated. Our practice is to allow interest rates to go below zero
in the downward shock models unless otherwise prevented through contractual floors. We believe the aforementioned
interest-rate shocks for our monthly disclosures represent moderate movements in interest rates over a one-month
period.
Duration Gap
Duration gap measures the price sensitivity of our assets and liabilities in our net portfolio to changes in interest rates by
quantifying the difference between the estimated durations of our assets and liabilities. Our duration gap analysis
reflects the extent to which the estimated maturity and repricing cash flows for our assets are matched, on average,
over time and across interest-rate scenarios to those of our liabilities. A positive duration gap indicates that the duration
of our assets exceeds the duration of our liabilities. We disclose duration gap on a monthly basis under the caption
“Interest Rate Risk Disclosures” in our Monthly Summary, which is available on our website and announced in a press
release.
MD&A | Risk Management | Market Risk Management, including Interest-Rate Risk Management | ||
Fannie Mae 2023 Form 10-K | 143 |
While our goal is to reduce the price sensitivity of our net portfolio to movements in interest rates, various factors can
contribute to a duration gap that is either positive or negative. For example, changes in the market environment can
increase or decrease the price sensitivity of our mortgage assets relative to the price sensitivity of our liabilities because
of prepayment uncertainty associated with our assets. In a declining interest-rate environment, prepayment rates tend to
accelerate, thereby shortening the duration and average life of the fixed-rate mortgage assets we hold in our net
portfolio. Conversely, when interest rates increase, prepayment rates generally slow, which extends the duration and
average life of our mortgage assets. Our debt and derivative instrument positions are used to manage the interest-rate
sensitivity of our retained mortgage portfolio and our investments in non-mortgage securities. As a result, the degree to
which the interest-rate sensitivity of our retained mortgage portfolio and our investments in non-mortgage securities is
offset will be dependent upon, among other factors, the mix of funding and other risk management derivative
instruments we use at any given point in time.
The market value sensitivities of our net portfolio are a function of both the duration and the convexity of our net
portfolio. Duration provides a measure of the price sensitivity of a financial instrument to changes in interest rates while
convexity reflects the degree to which the duration of the assets and liabilities in our net portfolio changes in response to
a given change in interest rates. We use convexity measures to provide us with information about how quickly and by
how much our net portfolio’s duration may change in different interest-rate environments. The market value sensitivity of
our net portfolio will depend on a number of factors, including the interest-rate environment, modeling assumptions and
the composition of assets and liabilities in our net portfolio, which vary over time.
Results of Interest-Rate Sensitivity Measures
The interest-rate risk measures discussed below exclude the impact of changes in the fair value of our guaranty assets
and liabilities resulting from changes in interest rates. We exclude our guaranty business from these sensitivity
measures based on our current assumption that the guaranty fee income generated from future business activity will
largely replace guaranty fee income lost due to mortgage prepayments.
The table below displays the pre-tax market value sensitivity of our net portfolio to changes in the level of interest rates
and the slope of the applicable yield curve as measured on the last day of each period presented. The table below also
provides the daily average, minimum, maximum and standard deviation values for duration gap and for the most
adverse market value impact on the net portfolio to changes in the level of interest rates and the slope of the applicable
yield curve for the three months ended December 31, 2023 and 2022.
Effective April 2023, we transitioned our portfolio interest-rate risk measurement process from using LIBOR to using
SOFR as the benchmark interest rate. This change did not have a significant impact on the measurement of our
interest-rate risk or our financial results. The interest-rate sensitivity metrics in the table below as of December 31, 2022
and for the three months ended December 31, 2022 were not revised.
The sensitivity measures displayed in the table below, which we disclose on a quarterly basis pursuant to a disclosure
commitment with FHFA, are an extension of our monthly sensitivity measures discussed above. There are three primary
differences between our monthly sensitivity disclosure and the quarterly sensitivity disclosure presented below:
•the quarterly disclosure is expanded to include the sensitivity results for larger rate level shocks of positive or
negative 100 basis points;
•the monthly disclosure reflects the estimated pre-tax impact on the market value of our net portfolio calculated
based on a daily average, while the quarterly disclosure reflects the estimated pre-tax impact calculated based
on the estimated financial position of our net portfolio and the market environment as of the last business day of
the quarter; and
•the monthly disclosure shows the most adverse pre-tax impact on the market value of our net portfolio from the
hypothetical interest-rate shocks, while the quarterly disclosure includes the estimated pre-tax impact of both
up and down interest-rate shocks.
MD&A | Risk Management | Market Risk Management, including Interest-Rate Risk Management | ||
Fannie Mae 2023 Form 10-K | 144 |
Interest-Rate Sensitivity of Net Portfolio to Changes in Interest-Rate Level and Slope of Yield Curve | |||||||
As of December 31,(1)(2) | |||||||
2023 | 2022 | ||||||
(Dollars in millions) | |||||||
Rate level shock: | |||||||
-100 basis points | $53 | $(10) | |||||
-50 basis points | 39 | 5 | |||||
+50 basis points | (47) | (14) | |||||
+100 basis points | (93) | (35) | |||||
Rate slope shock: | |||||||
-25 basis points (flattening) | (7) | (8) | |||||
+25 basis points (steepening) | 5 | 10 | |||||
For the Three Months Ended December 31,(1)(3) | ||||||||||||||||||||
2023 | 2022 | |||||||||||||||||||
Duration Gap | Rate Slope Shock 25 bps | Rate Level Shock 50 bps | Duration Gap | Rate Slope Shock 25 bps | Rate Level Shock 50 bps | |||||||||||||||
Market Value Sensitivity | Market Value Sensitivity | |||||||||||||||||||
(In years) | (Dollars in millions) | (In years) | (Dollars in millions) | |||||||||||||||||
Average | 0.03 | $(11) | $(27) | — | $(5) | $(16) | ||||||||||||||
Minimum | (0.01) | (22) | (47) | (0.04) | (10) | (36) | ||||||||||||||
Maximum | 0.06 | (1) | 2 | 0.04 | — | (3) | ||||||||||||||
Standard deviation | 0.02 | 4 | 12 | 0.02 | 2 | 8 | ||||||||||||||
(1)Computed based on changes in SOFR interest-rates swap curve as of and for the three months ended December 31, 2023. Computed
based on changes in U.S. LIBOR interest-rates swap curve as of and for the three months ended December 31, 2022
(2)Measured on the last business day of each period presented.
(3)Computed based on daily values during the period presented.
The market value sensitivity of our net portfolio varies across a range of interest-rate shocks depending upon the
duration and convexity profile of our net portfolio. The market value sensitivity of the net portfolio is measured by
quantifying the change in the present value of the cash flows of our financial assets and liabilities that would result from
an instantaneous shock to interest rates, assuming spreads are held constant.
We use derivatives to help manage the residual interest-rate risk exposure between the assets and liabilities in our net
portfolio. Derivatives have enabled us to keep our economic interest-rate risk exposure at consistently low levels in a
wide range of interest-rate environments. The table below displays an example of how derivatives impacted the net
market value exposure for a 50 basis point parallel interest-rate shock. For additional information on our derivative
positions, see “Note 9, Derivative Instruments.”
Derivative Impact on Interest-Rate Risk (50 Basis Points) | |||||||
As of December 31,(1) | |||||||
2023 | 2022 | ||||||
(Dollars in millions) | |||||||
Before derivatives | $(449) | $(177) | |||||
After derivatives | (47) | (14) | |||||
Effect of derivatives | 402 | 163 | |||||
(1)Measured on the last business day of each period presented.
Earnings Exposure to Interest-Rate Risk
While we manage the interest-rate risk of our net portfolio with the objective of remaining neutral to movements in
interest rates and volatility on an economic basis, our earnings can experience volatility due to interest-rate changes
and differing accounting treatments that apply to certain financial instruments on our balance sheet. Specifically, we
have exposure to earnings volatility that is driven by changes in interest rates in two primary areas: our net portfolio and
MD&A | Risk Management | Market Risk Management, including Interest-Rate Risk Management | ||
Fannie Mae 2023 Form 10-K | 145 |
our consolidated MBS trusts. The exposure in the net portfolio is primarily driven by changes in the fair value of risk
management derivatives, mortgage commitments, and certain assets, primarily securities, that are carried at fair value.
The exposure related to our consolidated MBS trusts relates to changes in our credit loss reserves and to the
amortization of cost basis adjustments resulting from changes in interest rates.
We apply fair value hedge accounting to address some of the exposure to interest rates, particularly the earnings
volatility related to changes in benchmark interest rates. Our hedge accounting program is specifically designed to
address the volatility of our financial results associated with changes in fair value related to changes in these
benchmark interest rates. As such, earnings variability driven by other factors, such as spreads or changes in cost basis
amortization recognized in net interest income, remains. In addition, our ability to effectively reduce earnings volatility is
dependent upon the volume and type of interest-rate swaps available for hedging, which is driven by our interest-rate
risk management strategy discussed above. As our range of available interest-rate swaps varies over time, our ability to
reduce earnings volatility through hedge accounting may vary as well. When the shape of the yield curve shifts
significantly from period to period, hedge accounting may be less effective. In our current program, we establish new
hedging relationships each business day to provide flexibility in our overall risk management strategy.
See “Note 1, Summary of Significant Accounting Policies” and “Note 9, Derivative Instruments” for additional information
on our fair value hedge accounting policy and related disclosures.
Liquidity and Funding Risk Management
See “Liquidity and Capital Management” for a discussion of how we manage liquidity and funding risk.
Operational Risk Management
Operational risk is the risk of loss resulting from inadequate or failed internal processes, people or systems, or
disruptions from external events. Our corporate operational risk framework aligns with our Enterprise Risk policy and
has evolved based on the changing needs of our business and FHFA regulatory guidance. The Operational Risk
Management group is responsible for overseeing and monitoring compliance with our operational risk program’s
requirements. The Operational Risk Management group reports to the Chief Risk Officer and works in conjunction with
other second line of defense teams, such as Compliance and Ethics, to oversee and aggregate the full range of
operational risks, including fraud, resiliency, business interruptions, processing errors, damage to physical assets,
workplace safety and employment practices. To quantify our operational risk exposure, we rely on the Basel
Standardized Approach, which is based on a percentage of gross income. In addition, where we deem it appropriate, we
purchase insurance policies to mitigate the impact of operational losses.
We currently use artificial intelligence and machine learning techniques in our models that support a number of business
needs. Generative artificial intelligence, or generative AI, is an evolution of artificial intelligence that is rapidly developing
and may transform the way businesses operate and make decisions, creating both opportunities for and risks to our
business. We expect to gradually increase our use of artificial intelligence to support our business needs, including
using more advanced generative AI. We are currently working on enhancing our governance and controls to support the
further development and implementation of artificial intelligence in our business processes, including implementing
guiding ethical principles on the appropriate use of artificial intelligence and enhancing our risk management framework.
We believe the use of artificial intelligence tools has significant potential to enhance employee productivity, improve our
business processes, and change the way we engage with our stakeholders.
See “Risk Factors—Operational and Model Risk” for more information regarding our operational risk, including risks
associated with artificial intelligence, and “Risk Management—Overview—Risk Management Governance” for more
information regarding our governance of operational risk management. See “Cybersecurity” for a discussion of
cybersecurity risk management.
Model Risk Management
Model risk is the risk of potential adverse consequences (such as financial loss or reputational damage) due to:
inappropriate model design; errors in model coding, implementation, inputs or assumptions; inadequate model
performance; or incorrect use or application of model outputs or reports. The use of models requires numerous
assumptions and there are inherent limitations in any methodology used to estimate macroeconomic factors such as
home prices, multifamily property values, unemployment and interest rates, and their impact on borrower behavior.
When market conditions change rapidly and dramatically, the assumptions used by models may no longer accurately
capture or reflect the changing conditions. Given the challenges of predicting future behavior, management judgment is
used throughout the modeling process, from model design decisions regarding core underlying assumptions, to
interpreting and applying final model output.
MD&A | Risk Management | Market Risk Management, including Interest-Rate Risk Management | ||
Fannie Mae 2023 Form 10-K | 146 |
We manage model risk through a model risk management framework that establishes the roles and responsibilities for
managing model risk through the model life cycle, as well as related governance requirements. Under our model risk
management framework, model owners and users have responsibility for monitoring whether models are performing
accurately and complying with the framework’s control requirements. We have an independent model risk management
team within our Enterprise Risk Management division that is responsible for establishing and maintaining the model risk
management framework, as well as providing independent review and approval of models prior to use. We also have a
management-level Model Risk Committee that oversees risk management activities related to model risk. In addition to
internally-developed models, we also use third-party models.
While we employ strategies to manage and govern the risks associated with our use of models, they have not always
been fully effective. Errors have been discovered in some of the models we use, as well as deficiencies in our current
processes for managing model risk. We are currently working on a number of remediation activities relating to our
models, including improving our processes for model governance, development, implementation and testing.
See “Risk Factors—Operational and Model Risk” for a discussion of the risks associated with the use of models,
including our use of third-party models and third-party data providers.
Critical Accounting Estimates
The preparation of financial statements in accordance with GAAP requires management to make a number of
judgments, estimates and assumptions that affect the reported amount of assets, liabilities, income and expenses in our
consolidated financial statements. Understanding our accounting policies and the extent to which we use management
judgment and estimates in applying these policies is integral to understanding our financial statements. We describe our
most significant accounting policies in “Note 1, Summary of Significant Accounting Policies.”
We evaluate our critical accounting estimates and judgments required by our policies on an ongoing basis and update
them as necessary based on changing conditions. Management has discussed any significant changes in judgments
and assumptions in applying our critical accounting estimates with the Audit Committee of our Board of Directors. See
“Risk Factors—General Risk” for a discussion of the risks associated with the need for management to make judgments
and estimates in applying our accounting policies and methods. We have identified one of our accounting estimates,
allowance for loan losses, as critical because it involves significant judgments and assumptions about highly complex
and inherently uncertain matters, and the use of reasonably different judgments and assumptions could have a material
impact on our reported results of operations or financial condition.
Allowance for Loan Losses
The allowance for loan losses is an estimate of single-family and multifamily HFI loan receivables that we expect will not
be collected related to loans held by Fannie Mae or by consolidated Fannie Mae MBS trusts. The expected credit losses
are deducted from the amortized cost basis of HFI loans to present the net amount expected to be received.
The allowance for loan losses involves substantial judgment on a number of matters including the development and
weighting of macroeconomic forecasts, the reversion period applied, the assessment of similar risk characteristics,
which determines the historic loss experience used to derive probability of loan default, the valuation of collateral, and
the determination of a loan’s remaining expected life. Our most significant judgments involved in estimating our
allowance for loan losses relate to the modeled macroeconomic data used to develop reasonable and supportable
forecasts for key economic drivers, which are subject to significant inherent uncertainty. Most notably, for single-family,
the model uses forecasted single-family home prices as well as a range of possible future interest rate environments.
For multifamily, the model uses forecasted rental income and property valuations over the remaining life of each
mortgage loan. In developing a reasonable and supportable forecast, the model simulates multiple paths of interest
rates, rental income and property values based on current market conditions.
Quantitative Component
We use a discounted cash flow method to measure expected credit losses on our single-family mortgage loans and an
undiscounted loss method to measure expected credit losses on our multifamily mortgage loans.
Our modeled loan performance is based on our historical experience of loans with similar risk characteristics adjusted to
reflect current conditions and reasonable and supportable forecasts. Our historical loss experience and our loan loss
estimates capture the possibility of a multitude of events, including remote events that could result in credit losses on
loans that are considered low risk. Our credit loss models, including the macroeconomic forecast data used as key
inputs, are subject to our model oversight and review processes as well as other established governance and controls.
MD&A | Risk Management | Model Risk Management |
Fannie Mae 2023 Form 10-K | 147 |
Qualitative Component
Our process for measuring expected credit losses is complex and involves significant management judgment, including
a reliance on historical loss information and current economic forecasts that may not be representative of credit losses
we ultimately realize. Management adjustments may be necessary to take into consideration external factors and
current macroeconomic events that have occurred but are not yet reflected in the data used to derive the model outputs.
Qualitative factors and events not previously observed by the models through historical loss experience may also be
considered, as well as the uncertainty of their impact on credit loss estimates.
Macroeconomic Variables and Sensitivities
Our benefit or provision for credit losses can vary substantially from period to period based on forecasted
macroeconomic drivers; primarily home prices and interest rates related to our single-family book of business, which for
the purposes of macroeconomic model inputs, we have determined are the most significant judgments used in our
estimation of credit losses. We develop regional forecasts for single-family home prices using a multi-path simulation
that captures home price projections over a five-year period, which is the period for which we can develop reasonable
and supportable forecasts. After the five-year period, the home price forecast reverts to a historical long-term growth
rate. Additionally, our model projects the range of possible interest rate scenarios over the life of the loan. This process
captures multiple possible outcomes of what could be more or less favorable economic environments for the borrower,
and therefore will increase or decrease the likelihood of default or prepayment depending on the environment in each
path of the simulation.
The table below provides information about our most significant key macroeconomic inputs used in determining our
single-family allowance for loan losses: forecasted home price growth rates and interest rates. Although the model
consumes a wide range of possible regional home price forecasts and interest rate scenarios that take into account
inherent uncertainty, the forecasts below represent the mean path of those simulations used in determining the
allowance for each quarter during the years ended December 31, 2023 and 2022, and how those forecasts have
changed between periods of estimate. Below we present our home price growth and interest rate estimates used in our
estimate of expected credit losses. Our forecasts include estimates for periods beyond 2025 that are not presented in
the table below.
MD&A | Critical Accounting Estimates |
Fannie Mae 2023 Form 10-K | 148 |
Select Single-Family Macroeconomic Model Inputs(1) | ||||||
Forecasted home price growth (decline) rate by period of estimate:(2) | ||||||
For the Full Year ending December 31, | ||||||
2023 | 2024 | 2025 | ||||
Fourth Quarter 2023 | 7.1% | 3.2% | 0.3% | |||
Third Quarter 2023 | 6.7 | 2.8 | (0.4) | |||
Second Quarter 2023 | 3.9 | (0.7) | (1.5) | |||
First Quarter 2023 | (1.2) | (2.2) | (1.1) | |||
For the Full Year ending December 31, | ||||||
2022 | 2023 | 2024 | ||||
Fourth Quarter 2022 | 8.4% | (4.2)% | (2.3)% | |||
Third Quarter 2022 | 9.0 | (1.5) | (1.4) | |||
Second Quarter 2022 | 16.0 | 4.4 | 0.5 | |||
First Quarter 2022 | 10.8 | 3.2 | 1.3 | |||
Forecasted 30-year interest rates by period of estimate:(3) | ||||||
Through the end of December 31, | For the Full Year ending December 31, | |||||
2023 | 2024 | 2025 | ||||
Fourth Quarter 2023 | 6.8% | 6.4% | 6.0% | |||
Third Quarter 2023 | 7.5 | 7.2 | 6.8 | |||
Second Quarter 2023 | 6.7 | 6.0 | 5.8 | |||
First Quarter 2023 | 6.2 | 5.7 | 5.5 | |||
Through the end of December 31, | For the Full Year ending December 31, | |||||
2022 | 2023 | 2024 | ||||
Fourth Quarter 2022 | 6.5% | 6.5% | 6.0% | |||
Third Quarter 2022 | 6.8 | 6.7 | 6.2 | |||
Second Quarter 2022 | 5.7 | 5.4 | 5.2 | |||
First Quarter 2022 | 4.7 | 4.8 | 4.7 | |||
(1) These forecasts are provided here solely for the purpose of providing insight into our credit loss model. Forecasts for future periods are
subject to significant uncertainty, which increases for periods that are further in the future. We provide our most recent forecasts for certain
macroeconomic and housing market conditions in “Key Market Economic Indicators.” In addition, each month our Economic & Strategic
Research group provides its forecast of economic and housing market conditions, which are available in the “About Us/Research and
Insights” section of our website, www.fanniemae.com. Information on our website is not incorporated into this report.
(2) These estimates are based on our national home price index, which is calculated differently from the S&P/Case-Shiller U.S. National Home
Price Index and therefore results in different percentages for comparable growth. We periodically update our home price growth estimates
and forecasts as new data become available. As a result, the forecast data in this table may also differ from the forecasted home price
growth rate presented in “Key Market Economic Indicators,” because that section reflects our most recent forecast as of the filing date of
this report, while this table reflects the quantitative forecast data we used in our model to estimate credit losses for the periods shown.
Management continues to monitor macroeconomic updates to our inputs in our credit loss model from the time they are approved as part
of our established governance process, to ensure the reasonableness of the inputs used to calculate estimated credit losses. The forecast
data excludes the impact of any qualitative adjustments.
(3)Forecasted 30-year interest rates represent the mean of possible future interest rate environments that are simulated by our interest rate
model and used in the estimation of credit losses. Forecasts through the end of December 31, 2023 and 2022, represent the average
forecasted rate from the quarter-end through the calendar year end of December 31st. The fourth quarter of 2023 and 2022 interest rates
represent the 30-year interest rate as of December 31, 2023 and December 31, 2022, respectively. This table reflects the forecasted
interest rate data we used in estimating credit losses for the periods shown and does not reflect changes in interest rates that occurred
after the forecast date.
MD&A | Critical Accounting Estimates |
Fannie Mae 2023 Form 10-K | 149 |
It is difficult to estimate how potential changes in any one factor or input might affect the overall credit loss estimates,
because management considers a wide variety of factors and inputs in estimating the allowance for loan losses.
Changes in the factors and inputs considered may not occur at the same rate and may not be consistent across all
geographies or loan types, and changes in factors and inputs may be directionally inconsistent, such that improvement
in one factor or input may offset deterioration in others. Changes in our assumptions and forecasts of economic
conditions could significantly affect our estimate of expected credit losses and lead to significant changes in the
estimate from one reporting period to the next.
As noted above, our allowance for loan losses is sensitive to changes in home prices and interest rate changes. To
consider the impact of a hypothetical change in home prices, assuming a positive one-percentage point change in the
home price growth rate for the first twelve months of the forecast, on a normalized basis, with all other factors held
constant, the single-family allowance for loan losses as of December 31, 2023 would decrease by approximately 3%.
Conversely, assuming a negative one-percentage point change in the home price growth rate for the first twelve months
of the forecast, on a normalized basis, the single-family allowance for loan losses would increase by approximately 4%.
To consider the impact of a hypothetical change in 30-year interest rates, assuming a 50-basis point increase in
estimated 30-year interest rates, with all other factors held constant, the single-family allowance for loan losses as of
December 31, 2023 would increase by approximately 4%. Conversely, assuming a 50-basis point decrease in 30-year
interest rates, the single-family allowance for loan losses would decrease by approximately 3%.
These sensitivity analyses are hypothetical and are provided solely for the purpose of providing insight into our credit
loss model inputs. In addition, sensitivities for home price and interest rate changes are non-linear. As a result, changes
in these estimates are not incrementally proportional. The purpose of this analysis is to provide an indication of the
impact of home price appreciation and 30-year interest rates on the estimate of the allowance for credit losses. For
example, it is not intended to imply management’s expectation of future changes in our forecasts or any other variables
that may change as a result.
We provide more detailed information on our accounting for the allowance for loan losses in “Note 1, Summary of
Significant Accounting Policies.” See “Note 5, Allowance for Loan Losses” for additional information about our current
period benefit (provision) for loan losses.
See “Key Market Economic Indicators” for additional information about how home prices can affect our credit loss
estimates, including a discussion of home price growth rates and our home price forecast. Also see “Consolidated
Results of Operations—Benefit (Provision) for Credit Losses” for information on how our home price forecast impacted
our single-family benefit (provision) for credit losses.
Impact of Future Adoption of New Accounting Guidance
We have not identified recently issued accounting changes that are expected to materially impact our future
consolidated financial statements. See “Note 1, Summary of Significant Accounting Policies” for recently implemented
accounting guidance.
Glossary of Terms Used in This Report
Terms used in this report have the following meanings, unless the context indicates otherwise.
“Agency mortgage-related securities” refers to mortgage-related securities issued by Fannie Mae, Freddie Mac and
Ginnie Mae.
“Back-end credit risk transfer transactions” refers to credit enhancements that we obtain after acquiring a loan.
“Business volume” refers to the sum in any given period of the unpaid principal balance of: (1) the mortgage loans and
mortgage-related securities we purchase for our retained mortgage portfolio; (2) the mortgage loans we securitize into
Fannie Mae MBS that are acquired by third parties; and (3) credit enhancements that we provide on our mortgage
assets. It excludes mortgage loans we securitize from our portfolio and the purchase of Fannie Mae MBS for our
retained mortgage portfolio.
“Capital reserve end date” refers to the date that is the last day of the second consecutive fiscal quarter during which we
have had and maintained capital equal to, or in excess of, all of the capital requirements and buffers under the
enterprise regulatory capital framework.
“Connecticut Avenue Securities” or “CAS” refers to a type of security that allows Fannie Mae to transfer a portion of the
credit risk from loan reference pools, consisting of certain mortgage loans in our guaranty book of business, to third-
party investors.
MD&A | Critical Accounting Estimates |
Fannie Mae 2023 Form 10-K | 150 |
“Connecticut Avenue Securities Credit-Linked Notes” or “CAS CLNs” refers to Connecticut Avenue Securities that are
structured as securities issued by trusts that do not qualify as REMICs.
“Connecticut Avenue Securities REMICs” or “CAS REMICs” refers to Connecticut Avenue Securities that are structured
as notes issued by trusts that qualify as REMICs.
“Conventional mortgage” refers to a mortgage loan that is not guaranteed or insured by the U.S. government or its
agencies, such as the VA, the FHA or the Rural Development Housing and Community Facilities Program of the
Department of Agriculture.
“Credit enhancement” refers to an agreement used to reduce credit risk by requiring collateral, letters of credit,
mortgage insurance, corporate guarantees, inclusion in a credit risk transfer transaction reference pool, or other
agreements to provide an entity with some assurance that it will be compensated to some degree in the event of a
financial loss.
“Credit Insurance Risk Transfer” or “CIRT” refers to insurance transactions whereby we obtain actual loss coverage on
pools of loans either directly from an insurance provider that retains the risk, or from an insurance provider that
simultaneously cedes all of its risk to one or more reinsurers.
“Debt Service Coverage Ratio” or “DSCR” refers to a ratio of net cash flow to the annualized debt service, which may
include both principal and interest payments, of a multifamily property.
“Deferred Guaranty Fee Income” refers to income primarily from the upfront fees that we receive at the time of loan
acquisition related to single-family loan-level price adjustments or other fees we receive from lenders, which are
amortized over the contractual life of the loan. Deferred guaranty fee income also includes the amortization of cost basis
adjustments on our mortgage loans and debt of consolidated trusts that are not associated with upfront fees.
“Desktop Underwriter” or “DU” refers to our proprietary automated underwriting system used by mortgage lenders to
evaluate the substantial majority of our single-family loan acquisitions.
“Delegated Underwriting and Servicing Program” or “DUS Program” refers to our multifamily business program whereby
DUS lenders, who must be pre-approved by us, are delegated the authority to underwrite and service loans for delivery
to us in accordance with our standards and requirements.
“Enterprise Regulatory Capital Framework” refers to the regulatory capital framework established by FHFA applicable to
us that was initially published in December 2020 and subsequently amended in 2022 and 2023, as described in
“Business—Legislation and Regulation—Capital Requirements.”
“FHFA” refers to the Federal Housing Finance Agency. FHFA is an independent agency of the federal government with
general supervisory and regulatory authority over Fannie Mae, Freddie Mac and the Federal Home Loan Banks. FHFA
is our safety and soundness regulator and our mission regulator. FHFA also has been acting as our conservator since
September 2008. For more information on FHFA’s authority as our conservator and as our regulator, see “Business—
Conservatorship and Treasury Agreements” and “Business—Legislation and Regulation.”
“Front-end credit enhancements” refers to credit enhancements that we obtain at the time we acquire a loan.
“GSE” refers to the government-sponsored enterprises Fannie Mae or Freddie Mac.
“GSE Act” refers to the Federal Housing Enterprises Financial Safety and Soundness Act of 1992, as amended.
“Guaranty book of business” refers to the sum of the unpaid principal balance of: (1) Fannie Mae MBS outstanding
(excluding the portions of any structured securities Fannie Mae issues that are backed by Freddie Mac securities);
(2) mortgage loans of Fannie Mae held in our retained mortgage portfolio; and (3) other credit enhancements that we
provide on mortgage assets. It also excludes non-Fannie Mae mortgage-related securities held in our retained mortgage
portfolio for which we do not provide a guaranty.
“HFI loans” or “held-for-investment loans” refer to mortgage loans we acquire for which we have the ability and intent to
hold for the foreseeable future or until maturity.
“HFS loans” or “held-for-sale loans” refer to mortgage loans we acquire that we intend to sell or securitize via trusts that
will not be consolidated.
“Low Income Housing Tax Credit program” or “LIHTC program” refers to a federal program that encourages private
equity investment in creating and preserving affordable units throughout the country by awarding federal tax credits to
affordable housing developers, who then exchange those tax credits with corporate investors in return for capital
contributions.
“Loans,” “mortgage loans” and “mortgages” refer to both whole loans and loan participations, secured by residential real
estate, cooperative shares or by manufactured housing units.
MD&A | Glossary of Terms Used in This Report | ||
Fannie Mae 2023 Form 10-K | 151 |
“Loss reserves” consists of our allowance for loan losses and our reserve for guaranty losses.
“Mortgage assets,” when referring to our assets, refers to both mortgage loans and mortgage-related securities we hold
in our retained mortgage portfolio. For purposes of the senior preferred stock purchase agreement, the definition of
mortgage assets is based on the unpaid principal balance of such assets and does not reflect market valuation
adjustments, allowance for loan losses, impairments, unamortized premiums and discounts and the impact of our
consolidation of variable interest entities. Our mortgage asset calculation also includes 10% of the notional value of
interest-only securities we hold. We disclose the amount of our mortgage assets for purposes of the senior preferred
stock purchase agreement on a monthly basis in the “Endnotes” to our Monthly Summaries, which are available on our
website and announced in a press release.
“Mortgage-backed securities” or “MBS” refers generally to securities that represent beneficial interests in pools of
mortgage loans or other mortgage-related securities. These securities may be issued by Fannie Mae or by others.
“Multifamily Connecticut Avenue Securities” or “MCAS” refers to Connecticut Avenue Securities that are structured as
notes issued by trusts to transfer credit risk on our multifamily guaranty book of business to third-party investors.
“Multifamily mortgage loan” refers to a mortgage loan secured by a property containing five or more residential dwelling
units.
“New business purchases” refers to single-family and multifamily whole mortgage loans purchased during the period
and single-family and multifamily mortgage loans underlying Fannie Mae MBS issued during the period pursuant to
lender swaps.
“Notional amount” refers to the hypothetical dollar amount in an interest rate swap transaction on which exchanged
payments are based. The notional amount in an interest rate swap transaction generally is not paid or received by either
party to the transaction, or generally perceived as being at risk. The notional amount is typically significantly greater
than the potential market or credit loss that could result from such transaction.
“Outstanding Fannie Mae MBS” refers to the total unpaid principal balance of any type of mortgage-backed security that
we issue, including UMBS, Supers, REMICs and other types of single-family or multifamily mortgage-backed securities
that are held by third-party investors or in our retained mortgage portfolio. For securities held by third-party investors, it
excludes the portions of any structured securities Fannie Mae issues that are backed by Freddie Mac-issued securities.
“Private-label securities” refers to mortgage-related securities issued by entities other than agency issuers Fannie Mae,
Freddie Mac or Ginnie Mae.
“Refi Plus loans” refers to loans we acquired under our Refi Plus initiative, which offered refinancing flexibility to eligible
Fannie Mae borrowers who were current on their loans and who applied prior to the initiative’s December 31, 2018
sunset date. Refi Plus had no limits on maximum LTV ratio and provided mortgage insurance flexibilities for loans with
LTV ratios greater than 80%.
“REMIC” or “Real Estate Mortgage Investment Conduit” refers to a type of mortgage-related security in which interest
and principal payments from mortgages or mortgage-related securities are structured into separately traded securities.
“REO” refers to real-estate owned by Fannie Mae because we have foreclosed on the property or obtained the property
through a deed-in-lieu of foreclosure.
“Representations and warranties” refers to a lender’s assurance that a mortgage loan sold to us complies with the
standards outlined in our Mortgage Selling and Servicing Contract, which incorporates the Selling and Servicing Guides,
including underwriting and documentation. Violation of any representation or warranty is a breach of the lender contract,
including the warranty that the loan complies with all applicable requirements of the contract, which provides us with
certain rights and remedies.
“Retained mortgage portfolio” refers to the mortgage-related assets we own (excluding the portion of assets that back
mortgage-related securities owned by third parties).
“Single-family mortgage loan” refers to a mortgage loan secured by a property containing four or fewer residential
dwelling units.
“Structured Fannie Mae MBS” refers to Fannie Mae securitizations that are resecuritizations of UMBS, MBS, or
previously-issued structured securities. Our structured securities can be commingled—that is, they can include Freddie
Mac securities as part or all of the underlying collateral for the security.
“TCCA fees” refers to the expense recognized as a result of the 10 basis point increase in guaranty fees on all single-
family mortgages delivered to us on or after April 1, 2012 pursuant to the Temporary Payroll Tax Cut Continuation Act of
2011 and as extended by the Infrastructure Investment and Jobs Act, which we pay to Treasury on a quarterly basis.
MD&A | Glossary of Terms Used in This Report | ||
Fannie Mae 2023 Form 10-K | 152 |
“TDR” or “troubled debt restructuring” refers to a modification to the contractual terms of a loan that results in granting a
concession to a borrower experiencing financial difficulties. Effective January 1, 2022, we adopted ASU 2022-02, which
eliminated TDR accounting prospectively for all restructurings occurring on or after January 1, 2022.
“Uniform Mortgage-Backed Securities” or “UMBS” refers to uniform single-family mortgage-backed securities issued by
Fannie Mae or Freddie Mac that are directly backed by fixed-rate mortgage loans and generally eligible for trading in the
to-be-announced (“TBA”) market.
“Write-off” refers to loan amounts written off as uncollectible bad debts. These loan amounts are removed from our
consolidated balance sheet and charged against our loss reserves when the balance is deemed uncollectible, which is
generally at foreclosure or other liquidation events (such as a deed-in-lieu of foreclosure or a short-sale). Also includes
write-offs related to the redesignation of loans from held for investment to held for sale.
“Yield maintenance fees” refers to multifamily prepayment premiums, which are fees that a multifamily borrower typically
pays when they prepay their loan.
Item 7A. Quantitative and Qualitative Disclosures about Market Risk
Information about market risk is set forth in “MD&A—Risk Management—Market Risk Management, including Interest-
Rate Risk Management.”
Item 8. Financial Statements and Supplementary Data
Our consolidated financial statements and notes thereto are included elsewhere in this annual report on Form 10-K as
described below in “Exhibits, Financial Statement Schedules.”
Item 9. Changes in and Disagreements with Accountants on
Accounting and Financial Disclosure
None.
Item 9A. Controls and Procedures
Overview
We are required under applicable laws and regulations to maintain controls and procedures, which include disclosure
controls and procedures as well as internal control over financial reporting, as further described below.
Evaluation of Disclosure Controls and Procedures
Disclosure Controls and Procedures
Disclosure controls and procedures refer to controls and other procedures designed to provide reasonable assurance
that information required to be disclosed in the reports we file or submit under the Exchange Act is recorded, processed,
summarized and reported within the time periods specified in the SEC’s rules and forms. Disclosure controls and
procedures include, without limitation, controls and procedures designed to provide reasonable assurance that
information required to be disclosed by us in the reports that we file or submit under the Exchange Act is accumulated
and communicated to management, including our Chief Executive Officer and Chief Financial Officer, as appropriate, to
allow timely decisions regarding our required disclosure. In designing and evaluating our disclosure controls and
procedures, management recognizes that any controls and procedures, no matter how well designed and operated, can
provide only reasonable assurance of achieving the desired control objectives, and management was required to apply
its judgment in evaluating and implementing possible controls and procedures.
Evaluation of Disclosure Controls and Procedures
As required by Rule 13a-15 under the Exchange Act, management has evaluated, with the participation of our Chief
Executive Officer and Chief Financial Officer, the effectiveness of our disclosure controls and procedures in effect as of
December 31, 2023, the end of the period covered by this report. As a result of management’s evaluation, our Chief
Executive Officer and Chief Financial Officer concluded that our disclosure controls and procedures were not effective at
a reasonable assurance level as of December 31, 2023, or as of the date of filing this report.
Our disclosure controls and procedures were not effective as of December 31, 2023 or as of the date of filing this report
because they did not adequately ensure the accumulation and communication to management of information known to
FHFA that is needed to meet our disclosure obligations under the federal securities laws. As a result, we were not able
to rely upon the disclosure controls and procedures that were in place as of December 31, 2023, or as of the date of this
MD&A | Glossary of Terms Used in This Report | ||
Fannie Mae 2023 Form 10-K | 153 |
filing, and we continue to have a material weakness in our internal control over financial reporting. This material
weakness is described in more detail below under “Management’s Report on Internal Control Over Financial Reporting
—Description of Material Weakness.” Based on discussions with FHFA and the structural nature of this material
weakness, we do not expect to remediate this material weakness while we are under conservatorship.
Management’s Report on Internal Control Over Financial Reporting
Overview
Our management is responsible for establishing and maintaining adequate internal control over financial reporting.
Internal control over financial reporting, as defined in rules promulgated under the Exchange Act, is a process designed
by, or under the supervision of, our Chief Executive Officer and Chief Financial Officer and effected by our Board of
Directors, management and other personnel to provide reasonable assurance regarding the reliability of financial
reporting and the preparation of financial statements for external purposes in accordance with GAAP. Internal control
over financial reporting includes those policies and procedures that:
•pertain to the maintenance of records that in reasonable detail accurately and fairly reflect the transactions and
dispositions of our assets;
•provide reasonable assurance that transactions are recorded as necessary to permit preparation of financial
statements in accordance with GAAP, and that our receipts and expenditures are being made only in
accordance with authorizations of our management and our Board of Directors; and
•provide reasonable assurance regarding prevention or timely detection of unauthorized acquisition, use or
disposition of our assets that could have a material effect on our financial statements.
Internal control over financial reporting cannot provide absolute assurance of achieving financial reporting objectives
because of its inherent limitations. Internal control over financial reporting is a process that involves human diligence
and compliance and is subject to lapses in judgment and breakdowns resulting from human failures. Internal control
over financial reporting also can be circumvented by collusion or improper override. Because of such limitations, there is
a risk that material misstatements may not be prevented or detected on a timely basis by internal control over financial
reporting. However, these inherent limitations are known features of the financial reporting process, and it is possible to
design into the process safeguards to reduce, though not eliminate, this risk.
Our management assessed the effectiveness of our internal control over financial reporting as of December 31, 2023. In
making its assessment, management used the criteria established in the Internal Control—Integrated Framework issued
by the Committee of Sponsoring Organizations of the Treadway Commission (“COSO”) in May 2013. Management’s
assessment of our internal control over financial reporting as of December 31, 2023 identified a material weakness,
which is described below. Because of this material weakness, management has concluded that our internal control over
financial reporting was not effective as of December 31, 2023 or as of the date of filing this report.
Our independent registered public accounting firm, Deloitte & Touche LLP, has issued an audit report on our internal
control over financial reporting, expressing an adverse opinion on the effectiveness of our internal control over financial
reporting as of December 31, 2023. This report is included below under the heading “Report of Independent Registered
Public Accounting Firm.”
Description of Material Weakness
The Public Company Accounting Oversight Board’s Auditing Standard 2201 defines a material weakness as a
deficiency, or a combination of deficiencies, in internal control over financial reporting such that there is a reasonable
possibility that a material misstatement of the company’s annual or interim financial statements will not be prevented or
detected on a timely basis.
Management has determined that we continued to have the following material weakness as of December 31, 2023, and
as of the date of filing this report:
•Disclosure Controls and Procedures. We have been under the conservatorship of FHFA since September 2008.
Under the GSE Act, FHFA is an independent agency that currently functions as both our conservator and our
regulator with respect to our safety, soundness and mission. Because of the nature of the conservatorship
under the GSE Act, which places us under the “control” of FHFA (as that term is defined by securities laws),
some of the information that we may need to meet our disclosure obligations may be solely within the
knowledge of FHFA. As our conservator, FHFA has the power to take actions without our knowledge that could
be material to our stockholders and other stakeholders, and could significantly affect our financial performance
or our continued existence as an ongoing business. Although we and FHFA attempted to design and implement
disclosure policies and procedures that would account for the conservatorship and accomplish the same
objectives as a disclosure controls and procedures policy of a typical reporting company, there are inherent
Controls and Procedures | ||
Fannie Mae 2023 Form 10-K | 154 |
structural limitations on our ability to design, implement, operate and test effective disclosure controls and
procedures. As both our regulator and our conservator under the GSE Act, FHFA is limited in its ability to design
and implement a complete set of disclosure controls and procedures relating to Fannie Mae, particularly with
respect to current reporting pursuant to Form 8-K. Similarly, as a regulated entity, we are limited in our ability to
design, implement, operate and test the controls and procedures for which FHFA is responsible.
Due to these circumstances, we have not been able to update our disclosure controls and procedures in a
manner that adequately ensures the accumulation and communication to management of information known to
FHFA that is needed to meet our disclosure obligations under the federal securities laws, including disclosures
affecting our consolidated financial statements. As a result, we did not maintain effective controls and
procedures designed to ensure complete and accurate disclosure as required by GAAP as of December 31,
2023, or as of the date of filing this report. Based on discussions with FHFA and the structural nature of this
weakness, we do not expect to remediate this material weakness while we are under conservatorship.
Mitigating Actions Related to Material Weakness
We and FHFA have engaged in the following practices intended to permit accumulation and communication to
management of information needed to meet our disclosure obligations under the federal securities laws:
•FHFA has established the Division of Conservatorship Oversight and Readiness, which is intended to facilitate
operation of the company with the oversight of the conservator.
•We have provided drafts of our SEC filings to FHFA personnel for their review and comment prior to filing. We
also have provided drafts of external press releases, statements and speeches to FHFA personnel for their
review and comment prior to release.
•FHFA personnel, including senior officials, have reviewed our SEC filings prior to filing, including this annual
report on Form 10-K for the year ended December 31, 2023 (“2023 Form 10-K”), and engaged in discussions
regarding issues associated with the information contained in those filings. Prior to filing our 2023 Form 10-K,
FHFA provided Fannie Mae management with written acknowledgment that it had reviewed the 2023 Form 10-
K, and it was not aware of any material misstatements or omissions in the 2023 Form 10-K and had no
objection to our filing the 2023 Form 10-K.
•Our senior management meets regularly with senior leadership at FHFA, including, but not limited to, the
Director.
•FHFA representatives attend meetings frequently with various groups within the company to enhance the flow
of information and to provide oversight on a variety of matters, including accounting, credit and market risk
management, external communications and legal matters.
•Senior officials within FHFA’s Office of the Chief Accountant have met frequently with our senior finance
executives regarding our accounting policies, practices and procedures.
In view of these activities, we believe that our consolidated financial statements for the year ended December 31, 2023
have been prepared in conformity with GAAP.
Changes in Internal Control Over Financial Reporting
Management has evaluated, with the participation of our Chief Executive Officer and Chief Financial Officer, whether
any changes in our internal control over financial reporting that occurred during our last fiscal quarter have materially
affected, or are reasonably likely to materially affect, our internal control over financial reporting. There were no changes
in our internal control over financial reporting from October 1, 2023 through December 31, 2023 that management
believes have materially affected, or are reasonably likely to materially affect, our internal control over financial
reporting.
In the ordinary course of business, we review our system of internal control over financial reporting and make changes
that we believe will improve these controls and increase efficiency, while continuing to ensure that we maintain effective
internal controls. Changes may include implementing new, more efficient systems, automating manual processes, and
updating existing systems.
Controls and Procedures | ||
Fannie Mae 2023 Form 10-K | 155 |
REPORT OF INDEPENDENT REGISTERED PUBLIC ACCOUNTING FIRM
To Fannie Mae:
Opinion on Internal Control over Financial Reporting
We have audited the internal control over financial reporting of Fannie Mae and consolidated entities (in
conservatorship) (the “Company”) as of December 31, 2023, based on criteria established in Internal Control –
Integrated Framework (2013) issued by the Committee of Sponsoring Organizations of the Treadway Commission
(COSO). In our opinion, because of the effect of the material weakness identified below on the achievement of the
objectives of the control criteria, the Company has not maintained effective internal control over financial reporting as of
December 31, 2023, based on the criteria established in Internal Control – Integrated Framework (2013) issued by
COSO.
We have also audited, in accordance with the standards of the Public Company Accounting Oversight Board (United
States) (PCAOB), the consolidated financial statements as of and for the year ended December 31, 2023, of the
Company and our report dated February 15, 2024, expressed an unqualified opinion on those financial statements and
included an explanatory paragraph regarding the Company’s dependence upon the continued support from various
agencies of the United States Government, including the United States Department of Treasury and the Company’s
conservator and regulator, the Federal Housing Finance Agency.
Basis for Opinion
The Company’s management is responsible for maintaining effective internal control over financial reporting and for its
assessment of the effectiveness of internal control over financial reporting, included in the accompanying
Management’s Report on Internal Control over Financial Reporting. Our responsibility is to express an opinion on the
Company’s internal control over financial reporting based on our audit. We are a public accounting firm registered with
the PCAOB and are required to be independent with respect to the Company in accordance with the U.S. federal
securities laws and the applicable rules and regulations of the Securities and Exchange Commission and the PCAOB.
We conducted our audit in accordance with the standards of the PCAOB. Those standards require that we plan and
perform the audit to obtain reasonable assurance about whether effective internal control over financial reporting was
maintained in all material respects. Our audit included obtaining an understanding of internal control over financial
reporting, assessing the risk that a material weakness exists, testing and evaluating the design and operating
effectiveness of internal control based on the assessed risk, and performing such other procedures as we considered
necessary in the circumstances. We believe that our audit provides a reasonable basis for our opinion.
Definition and Limitations of Internal Control over Financial Reporting
A company’s internal control over financial reporting is a process designed to provide reasonable assurance regarding
the reliability of financial reporting and the preparation of financial statements for external purposes in accordance with
generally accepted accounting principles. A company’s internal control over financial reporting includes those policies
and procedures that (1) pertain to the maintenance of records that, in reasonable detail, accurately and fairly reflect the
transactions and dispositions of the assets of the company; (2) provide reasonable assurance that transactions are
recorded as necessary to permit preparation of financial statements in accordance with generally accepted accounting
principles, and that receipts and expenditures of the company are being made only in accordance with authorizations of
management and directors of the company; and (3) provide reasonable assurance regarding prevention or timely
detection of unauthorized acquisition, use, or disposition of the company’s assets that could have a material effect on
the financial statements.
Because of its inherent limitations, internal control over financial reporting may not prevent or detect misstatements.
Also, projections of any evaluation of effectiveness to future periods are subject to the risk that controls may become
inadequate because of changes in conditions, or that the degree of compliance with the policies or procedures may
deteriorate.
Controls and Procedures | ||
Fannie Mae 2023 Form 10-K | 156 |
Material Weakness
A material weakness is a deficiency, or a combination of deficiencies, in internal control over financial reporting, such
that there is a reasonable possibility that a material misstatement of the company’s annual or interim financial
statements will not be prevented or detected on a timely basis. The following material weakness has been identified and
included in management’s assessment:
•Disclosure Controls and Procedures – The Company’s disclosure controls and procedures did not adequately
ensure the accumulation and communication to management of information known to the Federal Housing
Finance Agency (as conservator) that is needed to meet their disclosure obligations under the federal securities
laws as they relate to financial reporting.
This material weakness was considered in determining the nature, timing, and extent of audit tests applied in our audit
of the consolidated financial statements as of and for the year ended December 31, 2023, of the Company and this
report does not affect our report on such financial statements.
/s/ Deloitte & Touche LLP
McLean, Virginia
February 15, 2024
Controls and Procedures | ||
Fannie Mae 2023 Form 10-K | 157 |
Item 9B. Other Information
During the quarter ended December 31, 2023, no Fannie Mae director or officer (as that term is defined by the SEC in
Rule 16a-1(f) under the Exchange Act) adopted terminated
trading arrangement for transactions in Fannie Mae securities.
Item 9C. Disclosure Regarding Foreign Jurisdictions that Prevent
Inspections
Not applicable.
PART III
Item 10. Directors, Executive Officers and Corporate Governance
Directors
Our current directors are listed below. They have provided the following information about their principal occupation,
business experience and other matters.
 | Priscilla Almodovar | |
Age 56 Chief Executive Officer Director since December 2022 Board committees: • Community Responsibility and Sustainability | ||
Ms. Almodovar has been Chief Executive Officer of Fannie Mae since December 2022. In addition to that role, she has
been appointed to succeed our current President when he retires later this year. Ms. Almodovar previously served as
President and Chief Executive Officer of Enterprise Community Partners, Inc. (“Enterprise”), which invests in
communities nationwide to address affordable housing challenges and expand access to investment capital, from 2019
to 2022. Ms. Almodovar previously was a Managing Director at JPMorgan Chase, Inc. from 2010 to 2019, where she led
national real estate businesses that focused on commercial real estate and on community development. Prior to joining
JPMorgan Chase, from 2007 to 2009, Ms. Almodovar was the President and Chief Executive Officer of New York state’s
housing finance and mortgage agencies. Ms. Almodovar began her career at the global law firm, White & Case LLP,
where as an equity partner she specialized in international project finance and capital markets. Ms. Almodovar has
served on the Board of Directors of Realty Income Corporation, a real estate investment trust, since 2021, where she
also serves as Chair of the Board’s Audit Committee. In 2021, she served on the Board of Directors and Audit
Committee of VEREIT, Inc., which was acquired by Realty Income Corporation.
 | Amy E. Alving | |
Age 61 Independent director since October 2013 Board committees: • Nominating and Corporate Governance (Vice Chair) • Risk Policy and Capital (Chair) | ||
Dr. Alving served as Chief Technology Officer and Senior Vice President at Science Applications International
Corporation (“SAIC”), now known as Leidos Holdings, Inc., a scientific, engineering and technology applications
company, from 2007 to 2013. Dr. Alving’s prior positions include director of the Special Projects Office at the Defense
Advanced Research Projects Agency, White House Fellow, and tenured faculty member at the University of Minnesota.
Dr. Alving is currently a member of the Board of Directors of Howmet Aerospace Inc. (formerly Arconic Inc.), where she
serves as Chair of the Governance and Nominating Committee. Dr. Alving also serves as a member of the Department
Other Information |
Fannie Mae 2023 Form 10-K | 158 |
of the Air Force Scientific Advisory Board, a body that advises the Secretary of the Air Force and other Air Force senior
leaders on scientific and technical matters. Dr. Alving previously served on the Board of Directors of Arconic Inc. from
2016 to 2017 and rejoined its Board of Directors in 2018. From 2010 to 2015, Dr. Alving was a member of the Board of
Directors of Pall Corporation, where she served as a member of the Audit Committee and the Nominating/Governance
Committee. In addition, she was a Trustee of Princeton University from 2019 to 2023 and was a member of the Board of
Directors of DXC Technology Company from 2017 to 2023.
 | Christopher J. Brummer | |
Age 48 Independent director since February 2021 Board committees: • Community Responsibility and Sustainability (Vice Chair) • Risk Policy and Capital | ||
Mr. Brummer is the Faculty Director of Georgetown’s Institute of International Economic Law and Agnes N. Williams
Sesquicentennial Professor of Financial Technology at the Georgetown University Law Center, where he began
teaching in 2009. Prior to that time, he served as an assistant professor of law at Vanderbilt Law School from 2006 to
2009 and as an academic fellow at the Securities and Exchange Commission’s Office of International Affairs from 2008
to 2009. Prior to his position at Vanderbilt, Mr. Brummer was an attorney in private practice in New York and London
from 2004 to 2006. Mr. Brummer is the founder of DC Fintech Week, a public policy conference on finance and
technology, a co-founder of the Fintech Beat podcast and newsletter for CQ Roll Call, and the author of a number of
publications. He is currently a nonresident senior fellow for the Atlantic Council’s GeoEconomics Center, a member of
the Commodity Futures Trading Commission’s Subcommittee on Virtual Currencies, an advisory council member for the
Alliance for Innovative Regulation and an advisory group member for the Digital Dollar Project. Mr. Brummer serves as
an advisor to the investment fund Paradigm Operations LP. He is also a member of the Board of Directors of Open to
the Public Investing, Inc. and K2 Integrity. Mr. Brummer served as a member of the Biden-Harris Presidential Transition
Team from October 2020 to January 2021, a member of the Financial Innovation Standing Committee of the European
Securities and Markets Authority (“ESMA”) Consultative Working Group from 2019 to 2020, a member of Nasdaq
delisting panels from 2010 to 2016, a senior fellow for the Milken Institute’s Center for Financial Markets from 2011 to
2017, and a member of FINRA’s National Adjudicatory Council from 2013 to 2015.
 | Renée Lewis Glover | |
Age 74 Independent director since January 2016 Board committees: • Community Responsibility and Sustainability • Nominating and Corporate Governance (Chair) | ||
Ms. Glover is the Founder and Managing Member of The Catalyst Group, LLC, a national consulting firm focused on
urban revitalization, real estate development and community building, urban policy, and business transformation. Ms.
Glover is currently a member of the Board of Directors of Tricon Residential Inc., where she serves on the Audit
Committee and the Compensation, Nominating and Corporate Governance Committee. Ms. Glover was a member of
the Board of Trustees of Enterprise Community Partners, Inc., where she served on the Executive Committee and as
Chair of the Compensation and Human Resources Committee, until 2022. Ms. Glover served on the Board of Directors
of Habitat for Humanity International from 2006 to 2015, including serving as Chair of the Board of Directors from 2013
to 2015. Committees on which she served during her time as a member of the Board of Directors of Habitat for
Humanity International included the Audit Committee, Finance Committee, Operations Committee and Executive
Committee. Ms. Glover served as a member of the Board of Directors of the Federal Reserve Bank of Atlanta from 2009
to 2014, where she served on the Audit and Operational Risk Committee. She also served as a Commissioner of the
Bipartisan Policy Center Housing Commission from 2011 to 2014. The Commission was responsible for developing a
set of bipartisan recommendations concerning federal housing policy and housing finance. Ms. Glover served as
president and chief executive officer of the Atlanta Housing Authority and its affiliates from 1994 to 2013. Prior to joining
the Atlanta Housing Authority, Ms. Glover was a corporate finance attorney in Atlanta and New York. Ms. Glover served
on the Board of Trustees of Starwood Waypoint Homes in 2017, where she served on the Nominating and Corporate
Directors, Executive Officers and Corporate Governance | Directors | ||
Fannie Mae 2023 Form 10-K | 159 |
Governance Committee and the Audit Committee. Ms. Glover served on the Advisory Board of the Penn Institute for
Urban Research until 2023, and she currently serves on the Azimuth GRC Advisory Board and the Advisory Board for
the J. Ronald Terwilliger Center for Housing Policy.
 | Michael J. Heid | |
Age 66 Independent director since May 2016 Board Chair since May 2022 Board committees: • None Mr. Heid also serves as an alternate member of each Board committee for the purpose of establishing a meeting quorum if needed. | ||
Mr. Heid served as Executive Vice President (Home Lending) of Wells Fargo & Company from 1997 to his retirement in
2016. He served in a number of positions at Wells Fargo Home Mortgage, the mortgage banking division of Wells
Fargo, including as president from 2011 to 2015, as co-president from 2004 to 2011, and earlier as chief financial officer
and head of Loan Servicing. Mr. Heid was employed by Wells Fargo or its predecessors beginning in 1988. Mr. Heid
was also on the Advisory Board for Home Partners of America from 2016 to 2023 and Promontory Mortgage Path from
2018 to 2022. Mr. Heid was a member of the Board of Directors of Roosevelt Management Company LLC from 2016 to
2023, where he served as Chair of the Risk Committee and a member of the Strategy Committee.
 | Robert H. Herz | |
Age 70 Independent director since June 2011 Board committees: • Audit (Chair) • Compensation and Human Capital | ||
Mr. Herz serves as President of Robert H. Herz LLC, providing consulting services on financial reporting and other
matters. From 2002 to 2010, Mr. Herz was Chairman of the Financial Accounting Standards Board, or FASB. He was
also a part-time member of the International Accounting Standards Board, or IASB, from 2001 to 2002. He was a
partner in PricewaterhouseCoopers LLP from 1985 until his retirement in 2002. Mr. Herz is currently a member of the
Board of Directors of Morgan Stanley, where he serves as Chair of the Audit Committee and as a member of the
Governance and Sustainability Committee. Mr. Herz is also a current member of the Board of Directors of Workiva Inc.,
a provider of reporting software, where he serves as a member of the Audit Committee and Nominating and
Governance Committee. He previously served as a senior advisor to and as a member of the Advisory Board of Workiva
Inc. (formerly WebFilings LLC) from 2011 to 2014. He also serves on the Board of Directors of the International
Foundation for Valuing Impacts and on the Advisory Boards of the following entities: AccountAbility; the Continuous
Auditing and Reporting Lab at Rutgers Business School; Lukka, Inc.; and RS Metrics. Mr. Herz also serves on the G7
Impact Taskforce and was an executive in residence at the Columbia Business School.
 | Simon Johnson | |
Age 61 Independent director since February 2021 Board committees: • Audit • Risk Policy & Capital | ||
Mr. Johnson has served as a professor at the Massachusetts Institute of Technology (“MIT”) Sloan School of
Management since 1997. He is currently the Ronald A. Kurtz Professor of Entrepreneurship and head of the Global
Economics and Management Group at the MIT Sloan School of Management. Mr. Johnson is also currently a research
Directors, Executive Officers and Corporate Governance | Directors | ||
Fannie Mae 2023 Form 10-K | 160 |
associate for the National Bureau of Economic Research, a private nonpartisan organization that facilitates cutting-edge
investigation and analysis of major economic issues. Mr. Johnson was a member of the Center for a New Economy’s
Growth Commission on Puerto Rico from 2017 to 2019, a member of the Financial Research Advisory Committee of the
U.S. Department of the Treasury’s Office of Financial Research from 2014 to 2016, where he chaired the Global
Vulnerabilities Working Group, a member of the Federal Deposit Insurance Corporation’s Systemic Resolution Advisory
Committee from 2011 to 2016, a member of the Congressional Budget Office’s Panel of Economic Advisers from 2009
to 2015, a senior follow at the Peterson Institute for International Economics from 2008 to 2019, and Chief Economist at
the International Monetary Fund from 2007 to 2008. He is currently co-chair of the CFA Institute Systemic Risk Council,
a public interest group that monitors progress on the implementation of financial reforms, an advisory board member for
the Institute for New Economic Thinking, and an advisory board member for Intelligence Squared. Mr. Johnson is the
co-founder of Baselinescenario.com and the author of numerous publications.
 | Karin J. Kimbrough | |
Age 55 Independent director since March 2019 Board committees: • Community Responsibility and Sustainability (Chair) • Compensation and Human Capital (Vice Chair) | ||
Ms. Kimbrough has served as Chief Economist for LinkedIn Corporation since January 2020. Ms. Kimbrough previously
served as Assistant Treasurer for Google from 2017 to 2019. Prior to that time, Ms. Kimbrough served as a Managing
Director and Head of Macroeconomic Policy at Bank of America Merrill Lynch from 2014 to 2017. Ms. Kimbrough
worked at the Federal Reserve Bank of New York from 2005 to 2014, serving as Vice President and a director for the
Financial Stability Monitoring Function in the Markets Group from 2010 to 2014 and as a manager for Analytical
Development from 2005 to 2010. Ms. Kimbrough previously worked as an economist and strategist at Morgan Stanley
from 2000 to 2005. Ms. Kimbrough was a member of the Board of Directors of Bread Financial Holdings, Inc. from 2021
to 2023, where she served on the Compensation and Risk Committees. She currently serves as a member of the board
of directors of the Federal Reserve Bank of San Francisco and of the National Bureau of Economic Research, and she
serves on the academic advisory council of the Federal Reserve Bank of Chicago.
 | Diane C. Nordin | |
Age 65 Independent director since November 2013; Board Vice Chair since April 2019 Board committees: • Audit • Compensation and Human Capital (Chair) Ms. Nordin also serves as an alternate member of each other Board committee for the purpose of establishing a meeting quorum if needed. | ||
Ms. Nordin served as a partner of Wellington Management Company, LLP, a private asset management company, from
1995 to 2011, and originally joined Wellington in 1991. She served in many global leadership roles at Wellington, most
notably as head of Fixed Income, Vice Chair of the Compensation Committee and Audit Chair of the Wellington
Management Trust Company. Ms. Nordin spent over three decades in the investment business, having previously been
employed by Fidelity Investments and Putnam Investments. Ms. Nordin is a Chartered Financial Analyst. Following her
retirement from the asset management industry, Ms. Nordin served as an Advanced Leadership Initiative Fellow at
Harvard University from 2011 to 2012. Ms. Nordin currently serves as a member of the Board of Directors of Principal
Financial Group, where she serves as Chair of the Audit Committee and as a member of the Finance Committee. She
also serves as a member of the Board of Directors of Antares Midco, Inc., where she serves as Chair of the
Compensation Committee. Ms. Nordin also serves as a trustee of the Financial Accounting Foundation. Previously, she
served as Chair of the Board of Governors of the CFA Institute, where she also served as Chair of the Governance
Committee.
Directors, Executive Officers and Corporate Governance | Directors | ||
Fannie Mae 2023 Form 10-K | 161 |
 | Chetlur “Chet” S. Ragavan | |
Age 69 Independent director since June 2023 Board committees: • Nominating and Corporate Governance • Risk Policy and Capital (Vice Chair) | ||
Mr. Ragavan is the Founder and Principal of Risk Response LLC, which provides risk advisory and consulting services
to global financial institutions. Previously, Mr. Ragavan was Executive Vice President and Chief Risk Officer of Voya
Financial, Inc. (formerly known as ING U.S., Inc.) from 2014 until his retirement in 2019. From 2008 to 2014, he served
as Managing Director and Chief Risk Officer for Voya Investment Management. Prior to joining Voya Financial, Mr.
Ragavan was Managing Director and Co-Head of the Portfolio Analytics Group for BlackRock from 2006 to 2008. Mr.
Ragavan is a Chartered Financial Analyst. He began his career at Merrill Lynch in 1980 and held several senior
leadership roles during his 26-year career with the company, including as Managing Director and Global Head of Fixed-
Income Research of Merrill Lynch Investment Managers from 2000 to 2006 and as Managing Director and Head of Risk
Management of Merrill Lynch Asset Management from 1992 to 2000. Mr. Ragavan has served on the Board of Directors
of CNO Financial Group, Inc. since May 2021, where he is currently Chair of the Audit and Enterprise Risk Committee
and a member of the Investment Committee of the Board. He also serves on the Board of the Council for Economic
Education.
 | Manuel “Manolo” Sánchez Rodríguez | |
Age 58 Independent director since September 2018 Board committees: • Compensation and Human Capital • Nominating and Corporate Governance | ||
Mr. Sánchez was the President and Chief Executive Officer of Compass Bank, Inc. (“Compass Bank”), a U.S. subsidiary
of Banco Bilbao Vizcaya Argentaria, S.A. (“BBVA”), from 2008 to 2017. Mr. Sánchez also served as a member of
BBVA’s worldwide Executive Committee and was BBVA’s Country Manager for U.S. operations from 2010 to 2017. In
addition, Mr. Sánchez became Chairman of the Board of Directors of Compass Bank and its holding company, BBVA
Compass Bancshares, Inc., in 2010 and served in these roles until 2017. Mr. Sánchez joined BBVA in 1990 and served
in a number of other roles at BBVA prior to becoming President and Chief Executive Officer of Compass Bank in 2008.
Mr. Sánchez currently serves as a member of the Board of Directors of Stewart Information Services Corporation, where
he serves as a member of the Audit Committee and the Nominating and Corporate Governance Committee. Mr.
Sánchez also serves as a member of the Board of Directors of Affirm Holdings, Inc. where he serves as a member of
the Audit Committee and the Nominating and Corporate Governance Committee. Mr. Sánchez previously served as a
member of the Board of Directors of Elevate Credit, Inc. (from 2021 to 2023), of BanCoppel S.A. Institución de Banca
Múltiple in Mexico City (from 2019 to 2021), and of On Deck Capital, Inc. (from 2018 to 2020), where he was a member
of the Audit Committee and the Compensation Committee. Mr. Sánchez is Founder of Adelante Ventures LLC and
serves as a Board member or advisor to several fintech companies. He is an Adjunct Professor at Rice University’s
Jones Graduate School of Business, where he teaches disruption in financial services with a focus on crypto currencies
and blockchain. Mr. Sánchez also currently serves as a trustee or member of the Board of Directors of a number of
civic, cultural and educational institutions, including the KIPP Texas Public Schools and Texas Children’s Hospital.
Directors, Executive Officers and Corporate Governance | Directors | ||
Fannie Mae 2023 Form 10-K | 162 |
 | Michael A. Seelig | |
Age 61 Independent director since March 2023 Board committees: • Audit (Vice Chair) • Compensation and Human Capital | ||
Mr. Seelig served as a senior executive at PricewaterhouseCoopers LLP, where he was a partner from 1997 until his
retirement in 2022. Mr. Seelig has over 35 years of diverse experience principally serving clients in the financial services
industry, including several other government-sponsored entities. In addition to helping companies navigate risk,
regulatory, mergers and acquisitions, financial reporting, corporate governance and strategy matters, Mr. Seelig served
in a variety of leadership roles within PricewaterhouseCoopers, where he was responsible for driving various aspects of
the firm’s strategy and operations in several national, market and sector-based capacities. Mr. Seelig is a licensed
certified public accountant and a member of the American Institute of Certified Professional Accountants, or AICPA. Mr.
Seelig currently serves on the Audit Committee of the University of Florida Foundation Board, and he serves or has
served as a trustee or member of the Board of a number of other civic, educational and faith-based organizations.
Corporate Governance
Conservatorship and Board Authorities
In September 2008, the Director of FHFA appointed FHFA as our conservator in accordance with the GSE Act. As
conservator, FHFA succeeded to all rights, titles, powers and privileges of Fannie Mae, and of any stockholder, officer or
director of Fannie Mae with respect to Fannie Mae and its assets. As a result, our Board of Directors no longer had the
power or duty to manage, direct or oversee our business and affairs.
As conservator, FHFA reconstituted our Board of Directors and provided the Board with specified functions and
authorities. Our directors serve on behalf of the conservator and exercise their authority as directed by and with the
approval, where required, of the conservator. Our directors owe their fiduciary duties of care and loyalty solely to the
conservator. Thus, while we are in conservatorship, the Board has no fiduciary duties to the company or its
stockholders.
Our Board of Directors exercises specified functions and authorities provided to it pursuant to an order from FHFA, as
our conservator. The conservator also provided instructions regarding matters for which conservator decision or
notification is required. The conservator retains the authority to amend or withdraw its order and instructions at any time.
FHFA’s instructions require that we obtain the conservator’s decision before taking action on matters that require the
consent of or consultation with Treasury under the senior preferred stock purchase agreement. See “Business—
Conservatorship and Treasury Agreements—Treasury Agreements—Covenants” for matters that require the approval of
Treasury under the senior preferred stock purchase agreement.
Directors, Executive Officers and Corporate Governance | Directors | ||
Fannie Mae 2023 Form 10-K | 163 |
FHFA’s instructions also require us to obtain the conservator’s decision before taking action in the areas identified in the
table below. For some matters, FHFA’s instructions specify that our Board must review and approve the matter before
we request FHFA decision, and for other matters the Board is expected to determine the appropriate level of its
engagement. For some of the matters specified in the table below that require prior Board review and approval, the
Board is permitted to delegate authority to a relevant Board committee.
Matters requiring prior Board review and approval: | Other matters: | |
•redemptions or repurchases of our subordinated debt, except as may be necessary to comply with the senior preferred stock purchase agreement; •creation of any subsidiary or affiliate, or entering into a substantial transaction with a subsidiary or affiliate, except for routine ongoing transactions with CSS or the creation of, or a transaction with, a subsidiary or affiliate undertaken in the ordinary course of business; •changes to or removal of Board risk limits that would result in an increase in the amount of risk that we may take; •retention and termination of the external auditor; •terminations of law firms serving as consultants to the Board; •proposed amendments to our bylaws or to charters of our Board committees; •setting or increasing the compensation or benefits payable to members of the Board; and •establishing the annual operating budget. | • | •material changes in accounting policy; •proposed changes in our business operations, activities, and transactions that in the reasonable business judgment of management are more likely than not to result in a significant increase in credit, market, reputational, operational or other key risks; •matters that impact or question the conservator’s powers, our conservatorship status, the legal effect of the conservatorship, interpretations of the senior preferred stock purchase agreement or the Financial Agency Agreement with Treasury or our performance under the Financial Agency Agreement; •agreements relating to litigation, lawsuits, claims, demands, prosecutions, regulatory proceedings or tax matters where the amount in dispute exceeds a specified threshold, including related matters that aggregate to more than the threshold; •mergers, acquisitions and changes in control of key counterparties where we have a direct contractual right to cease doing business with the entity or object to the merger or acquisition; •changes to requirements, policies, frameworks, standards or products that are aligned with Freddie Mac’s, pursuant to FHFA’s direction; •credit risk transfer transactions that are a new transaction type, involve a material change in terms, or involve a new type of collateral; •transfers of mortgage servicing rights that meet minimum size thresholds and would increase the transferee’s servicing of Fannie Mae seriously delinquent loans by more than a specified threshold; and •changes in employee compensation that could significantly impact our employees, including special incentive plans, merit increase pool funding, and retention awards for executives. |
FHFA’s instructions also require us to provide timely notice to FHFA of: activities that represent a significant change in
current business practices, operations, policies or strategies not otherwise addressed in the instructions; exceptions and
waivers to aligned requirements, policies, frameworks, standards or products if not otherwise submitted to FHFA for
decision as required above; and accounting error corrections to previously-issued financial statements that are not de
minimis. FHFA will then determine whether any such items require its decision as conservator. For more information on
the conservatorship, refer to “Business—Conservatorship and Treasury Agreements.”
Composition of Board of Directors
FHFA has directed that our Board of Directors should have a minimum of nine and not more than thirteen directors.
There is a non-executive Chair of the Board and Vice Chair of the Board, and our Chief Executive Officer is the only
corporate officer serving as a director. Our Corporate Governance Guidelines, in accordance with FHFA corporate
governance regulations, require a majority of Fannie Mae’s directors to be independent. The Board currently has twelve
members, eleven of whom are independent. See “Certain Relationships and Related Transactions, and Director
Independence—Director Independence” for a description of our director independence requirements and a discussion
of the Board’s review of the independence of all current Board members.
Our conservator appointed directors in 2008. Subsequent vacancies have been and may continue to be filled by the
Board, subject to review by the conservator. FHFA’s 2008 order appointing directors provided that each director serves
on the Board until the earlier of (1) resignation or removal by the conservator or (2) the election of a successor director
at an annual meeting of stockholders. Because FHFA as our conservator has all powers of our stockholders, we have
not held stockholders’ meetings since entering into conservatorship.
Directors, Executive Officers and Corporate Governance | Corporate Governance | ||
Fannie Mae 2023 Form 10-K | 164 |
Under the Charter Act, each director is elected for a term ending on the date of our next annual stockholders’ meeting.
Fannie Mae’s bylaws provide that each director holds office for the term for which he or she was elected or appointed
and until his or her successor is chosen and qualified or until he or she dies, resigns, retires or is removed from office in
accordance with applicable law or regulation, whichever occurs first. As noted above, however, the conservator
appointed an initial group of directors to our Board following our entry into conservatorship, provided the Board with the
authority to appoint directors to subsequent vacancies subject to conservator review, and defined the term of service of
directors during conservatorship. Our Corporate Governance Guidelines were amended in 2021 to provide that, absent
death, resignation or retirement, each director first appointed in 2021 or thereafter will serve until the earliest of: (1) the
third anniversary of the effective date of such director’s appointment while we are in conservatorship; (2) the date on
which the director is removed by the conservator while we are in conservatorship; or (3) the date on which the director’s
successor is elected at an annual meeting of stockholders. Four of our current directors are serving three-year terms:
Christopher Brummer, Simon Johnson, Chet Ragavan, and Michael Seelig. Our Board may reelect a director to a new
three-year term upon the recommendation of the Nominating and Corporate Governance Committee, subject to
conservator review. In determining whether to recommend reelection, the Nominating and Corporate Governance
Committee will consider, among other factors, the willingness of the director to continue to serve on the Board and
devote the necessary time, the contributions that they have made to the Board and Committee discussions and
decision-making, their continued involvement in business and professional activities relevant to Fannie Mae, the skills
and experience that should be represented on the Board, and the desire to maintain a diverse Board. In February 2024,
FHFA approved the reelection of Mr. Brummer and Mr. Johnson to new three-year terms. As Chief Executive Officer,
Ms. Almodovar’s service on the Board ceases at the termination of her employment as Chief Executive Officer unless
otherwise requested by the Board. All of our other directors were appointed prior to 2021.
In addition, absent a waiver from FHFA, FHFA corporate governance regulations limit service on our Board to ten years
or age 72, whichever comes first. In 2021, FHFA approved a waiver of the ten-year Board term limit applicable to Mr.
Herz, allowing him to serve on the Board through June 30, 2024, as well as a waiver of the Board age limit applicable to
Ms. Glover, allowing her to serve on the Board through November 12, 2025. In 2022, FHFA approved waivers of the ten-
year Board term limit applicable to Ms. Alving, allowing her to serve on the board through October 2026, and to Ms.
Nordin, allowing her to serve on the board through November 2026.
Under the Charter Act, our Board shall at all times have as members at least one person from each of the homebuilding,
mortgage lending and real estate industries, and at least one person from an organization that has represented
consumer or community interests for not less than two years or one person who has demonstrated a career
commitment to the provision of housing for low-income households. In addition, our Corporate Governance Guidelines
provide that the Board, as a group, must be knowledgeable in business, finance, capital markets, accounting, risk
management, public policy, mortgage lending, real estate, low-income housing, homebuilding, regulation of financial
institutions, technology, environmental, social and governance (“ESG”), and any other areas as may be relevant to the
safe and sound operation of Fannie Mae. In addition to expertise in the areas noted above, our Corporate Governance
Guidelines specify that the Nominating and Corporate Governance Committee also seeks Board members who possess
the highest personal values, judgment and integrity, and who understand the regulatory and policy environment in which
Fannie Mae does business. The Nominating and Corporate Governance Committee also considers whether a
prospective Board candidate has the ability to attend meetings and fully participate in the activities of the Board.
The Nominating and Corporate Governance Committee also considers diversity when evaluating the composition of the
Board. Our Corporate Governance Guidelines specify that the Nominating and Corporate Governance Committee is
committed to considering minorities, women and individuals with disabilities in the identification and evaluation process
for prospective Board candidates, and that the Committee seeks Board members who represent diversity in ideas and
perspectives. These provisions of our Corporate Governance Guidelines implement FHFA regulations that require us to
implement and maintain policies and procedures that, among other things, encourage the consideration of diversity in
nominating or soliciting nominees for positions on our Board.
Directors, Executive Officers and Corporate Governance | Corporate Governance | ||
Fannie Mae 2023 Form 10-K | 165 |
Our directors have a variety of backgrounds and overall experience. Over half of Fannie Mae’s Board members are
women and/or racial or ethnic minorities. Our Board also has a balance of longer-serving directors with institutional
knowledge and newer directors with fresh perspectives. The charts below provide information on the demographic
background and Board tenure of our twelve Board members.
Board Diversity | |||||||||||||
Women | Black/African American | 40s | < 2 Years | ||||||||||||
Men | Asian | 50s | 2-4 Years | ||||||||||||
Hispanic/Latino | 60s | 5+ Years | |||||||||||||
White | 70s | ||||||||||||||
Two or more (also represented in each applicable category) | |||||||||||||||
Directors, Executive Officers and Corporate Governance | Corporate Governance | ||
Fannie Mae 2023 Form 10-K | 166 |
The Nominating and Corporate Governance Committee evaluates the qualifications and performance of current
directors on an annual basis, taking into consideration factors related to a Board member’s contribution to the effective
functioning of the Board. Ms. Almodovar serves as a member of our Board of Directors in connection with her role as
our Chief Executive Officer. In its assessment of our independent directors and its evaluation of potential candidates for
director, the Nominating and Corporate Governance Committee also considers each individual’s particular experience,
qualifications, attributes and skills in the areas identified in our Corporate Governance Guidelines. In concluding our
independent directors should serve as directors, the Nominating and Corporate Governance Committee took into
account their knowledge in the areas indicated in the table below, which they gained from their experience described in
“Directors.”
Director Experience, Qualifications, Attributes and Skills | |||||||||||||
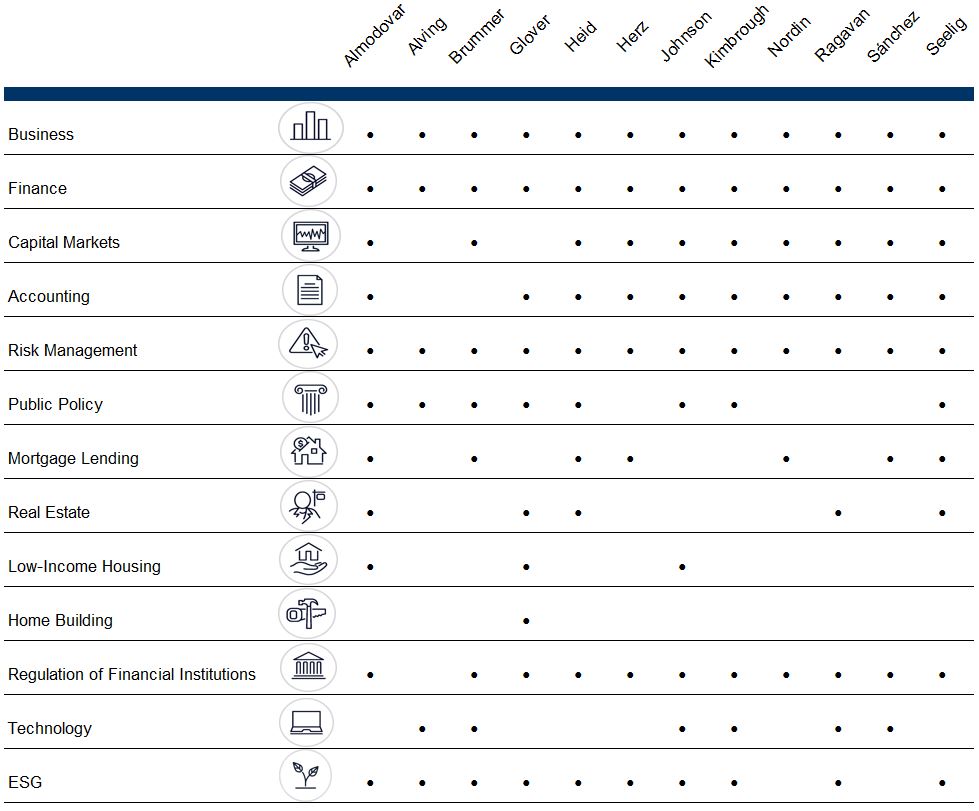
Board Leadership Structure
FHFA corporate governance regulations and our Corporate Governance Guidelines require separate Chair of the Board
and Chief Executive Officer positions and require that the Chair of the Board be an independent director. A non-
executive Chair structure enables non-management directors to raise issues and concerns for Board consideration
without immediately involving management and is consistent with the Board’s emphasis on independent oversight of
management, including independent risk oversight.
Directors, Executive Officers and Corporate Governance | Corporate Governance | ||
Fannie Mae 2023 Form 10-K | 167 |
Our Board has five standing committees: the Audit Committee, the Community Responsibility and Sustainability
Committee, the Compensation and Human Capital Committee, the Nominating and Corporate Governance Committee,
and the Risk Policy and Capital Committee. Pursuant to FHFA direction, with such exceptions as the conservator may
direct, the Board and the standing Board committees function in accordance with:
•their designated duties and authorities as set forth in the Charter Act, other applicable federal law, FHFA’s
corporate governance rules, FHFA’s prudential management and operations standards, FHFA written
supervisory guidance and direction, and, to the extent not inconsistent with the foregoing, Delaware law (insofar
as Fannie Mae has adopted its provisions for corporate governance purposes);
•Fannie Mae’s bylaws and the applicable charters of Fannie Mae’s Board committees; and
•such other duties or authorities as the conservator may provide.
Such duties or authorities may be modified by the conservator at any time.
Committee Charters and Corporate Governance
Our Corporate Governance Guidelines and charters for each of the Board’s standing committees are posted on our
website, www.fanniemae.com, in the “About Us—Corporate Governance” section. Although our equity securities are no
longer listed on the New York Stock Exchange (“NYSE”), we are required by FHFA corporate governance regulations to
follow specified NYSE corporate governance requirements relating to, among other things, the independence of our
directors and the charter, independence, composition, expertise, duties, responsibilities and other requirements of our
Board committees.
Risk Management Oversight
Our Board of Directors oversees risk management primarily through the Risk Policy and Capital Committee of the
Board. FHFA corporate governance regulations set forth risk management requirements for our Board and our Risk
Policy and Capital Committee, as described below. These regulations require that our Board approve, have in effect at
all times, and periodically review an enterprise-wide risk management program that establishes our risk appetite, aligns
the risk appetite with our strategies and objectives, and addresses our exposure to credit risk, market risk, liquidity risk,
business risk and operational risk. Our risk management program must align with our risk appetite and include risk
limitations appropriate to each line of business, appropriate policies and procedures relating to risk management
governance, risk oversight infrastructure, and processes and systems for identifying and reporting risks, including
emerging risks. Our program must also include provisions for monitoring compliance with our risk limit structure and
policies relating to risk management governance, risk oversight, and effective and timely implementation of corrective
actions. Additional provisions must specify management’s authority and independence to carry out risk management
responsibilities and the integration of risk management with management’s goals and compensation structure. FHFA
corporate governance regulations require our Risk Policy and Capital Committee to assist the Board in carrying out its
oversight of our risk management program. These regulations also require that our Risk Policy and Capital Committee
must:
•be chaired by a director not serving Fannie Mae in a management capacity;
•have at least one member with risk management experience that is commensurate with our capital structure,
risk appetite, complexity, activities, size and other appropriate risk-related factors;
•have committee members with a practical understanding of risk management principles and practices relevant
to Fannie Mae;
•fully document and maintain records of its meetings; and
•report directly to the Board and not as part of, or combined with, another committee.
FHFA corporate governance regulations set forth specific responsibilities for our Risk Policy and Capital Committee,
including that it must:
•periodically review and recommend for Board approval an appropriate enterprise-wide risk management
program that is commensurate with our capital structure, risk appetite, complexity, activities, size and other
appropriate risk-related factors;
•receive and review regular reports from our Chief Risk Officer; and
•periodically review the capabilities for, and adequacy of resources allocated to, enterprise-wide risk
management.
Our Risk Policy and Capital Committee Charter also sets forth the Risk Policy and Capital Committee’s duties and
responsibilities in overseeing risk management for all of our major categories of risk and any other emerging risks. For
Directors, Executive Officers and Corporate Governance | Corporate Governance | ||
Fannie Mae 2023 Form 10-K | 168 |
more information on the role of our Board and management in risk oversight, see “MD&A—Risk Management—Risk
Management Governance” and “Cybersecurity—Cybersecurity Governance—Board Oversight.”
Human Capital Management Oversight
The Compensation and Human Capital Committee of the Board has oversight of Fannie Mae’s human capital
management and its diversity and inclusion program and related policies and practices. As part of its oversight role, the
Committee reviews our primary compensation programs and benefits, succession planning for executives, as well as
corporate culture and employee engagement.
Codes of Conduct
We have a Code of Conduct that is applicable to all officers and employees (our “Employee Code of Conduct”) and a
Code of Conduct for the Board of Directors (our “Director Code of Conduct”). Our Employee Code of Conduct also
serves as the code of ethics for our Chief Executive Officer and senior financial officers required by the Sarbanes-Oxley
Act of 2002 and implementing regulations of the SEC. We have posted these codes on our website,
www.fanniemae.com, under “Code of Conduct” in the “About Us—Corporate Governance” section. We intend to
disclose any changes to or waivers from these codes that apply to any of our executive officers, our controller or our
directors by posting this information on our website.
Audit Committee Membership
Our Board of Directors has a standing Audit Committee consisting of Mr. Herz, who is the Chair, Mr. Seelig, who is the
Vice Chair, Mr. Johnson, and Ms. Nordin. Mr. Heid also serves as an alternate member of the Audit Committee for the
purpose of establishing a meeting quorum if needed. All of the Audit Committee members are financially literate and
independent under the requirements of independence set forth in FHFA corporate governance regulations (which
requires the standard of independence adopted by the NYSE), Fannie Mae’s Corporate Governance Guidelines, and
other SEC rules and regulations applicable to audit committees. The Board has determined that each member of the
Audit Committee has the requisite experience, as discussed in “Directors,” to qualify as an “audit committee financial
expert” under the rules and regulations of the SEC and has designated each of them as such.
Executive Sessions
Our non-management directors meet in executive session on a regularly scheduled basis. Our Board of Directors
reserves time for an executive session at every regularly scheduled in-person Board meeting. The non-executive Chair
of the Board presides over these sessions.
Communications with Directors or Audit Committee
Interested parties wishing to communicate any concerns or questions about Fannie Mae to the non-executive Chair of
the Board or to our non-management directors individually or as a group may do so by electronic mail addressed to
“board@fanniemae.com,” or by U.S. mail addressed to Board of Directors, c/o Office of the Corporate Secretary, Fannie
Mae, 1100 15th Street, NW, Washington, DC 20005. Communications may be addressed to a specific director or
directors, including Mr. Heid, the Board Chair, or to groups of directors, such as the independent or non-management
directors.
Interested parties wishing to communicate with the Audit Committee regarding accounting, internal accounting controls
or auditing matters may do so by electronic mail addressed to “auditcommittee@fanniemae.com,” or by U.S. mail
addressed to Audit Committee, c/o Office of the Corporate Secretary, Fannie Mae, 1100 15th Street, NW, Washington,
DC 20005.
The Office of the Corporate Secretary is responsible for processing all communications to a director or directors.
Communications that are deemed by the Office of the Corporate Secretary to be commercial solicitations, ordinary
course customer inquiries or complaints, incoherent or obscene are not forwarded to directors.
Director Nominations; Stockholder Proposals
Under the GSE Act, FHFA, as conservator, has all rights, titles, powers and privileges of the stockholders and Board of
Directors of Fannie Mae. As a result, Fannie Mae’s common stockholders no longer have the ability to recommend
director nominees or elect the directors of Fannie Mae or bring business before any meeting of stockholders pursuant to
the procedures in our bylaws. We currently do not plan to hold an annual meeting of stockholders in 2024.
Directors, Executive Officers and Corporate Governance | Corporate Governance | ||
Fannie Mae 2023 Form 10-K | 169 |
Report of the Audit Committee of the Board of Directors
The Audit Committee’s charter sets forth the Audit Committee’s duties and responsibilities, and provides that the Audit
Committee’s purpose is to:
•oversee (a) our accounting, reporting, and financial practices and those of our subsidiaries, including the
integrity of our financial statements and internal control over financial reporting, (b) our compliance with legal
and regulatory requirements, (c) the external auditor’s qualifications, independence, and performance, and
(d) the qualifications, independence, and performance of our internal audit function and chief audit executive;
•approve, or recommend for Board approval, as appropriate, certain of our policies relating to the Audit
Committee’s oversight of the external auditor relationship, internal audit function, and the compliance
department; and
•prepare the report required by the rules of the SEC to be included in our annual proxy statement in years in
which Fannie Mae holds an Annual Meeting of Stockholders and files a proxy statement.
In accordance with this purpose, the Audit Committee has the authority to appoint, compensate, retain, oversee,
evaluate and terminate our independent external auditor (referred to as the “independent auditor”); however, the Audit
Committee is required to consult and obtain the decision of the conservator before exercising some of these authorities.
The independent auditor reports directly to the Audit Committee. The Audit Committee is responsible for fee
negotiations with the independent auditor and pre-approves the fees for and the terms of all audit and permissible non-
audit services to be provided by the independent auditor. The Audit Committee has delegated to its Chair the authority
to pre-approve such services up to $1 million per engagement, which pre-approval must be ratified by the Audit
Committee at its next scheduled meeting. The Audit Committee has the authority to retain counsel, accountants, experts
and other advisors to assist the Audit Committee members in carrying out their duties; however, the Audit Committee’s
authority to terminate law firms serving as consultants to the Committee is subject to the conservator’s decision.
As described in “Corporate Governance—Audit Committee Membership,” the Board has determined that all members of
Fannie Mae’s Audit Committee are financially literate and all are independent under the independence requirements set
forth in FHFA corporate governance regulations (which require compliance with the independence standards adopted by
the NYSE) and that all members of the Audit Committee are “audit committee financial experts” under the rules and
regulations of the SEC.
The Audit Committee serves in an oversight capacity. Management is responsible for the financial reporting process,
including the system of internal controls, for the preparation of consolidated financial statements in accordance with
GAAP and for the report on the company’s internal control over financial reporting. The company’s independent auditor,
Deloitte & Touche LLP (“Deloitte”), is responsible for planning and conducting an independent audit of those financial
statements and expressing an opinion as to their conformity with GAAP and expressing an opinion on the effectiveness
of the company’s internal control over financial reporting. The Audit Committee’s responsibility is to oversee the financial
reporting process and to review and discuss management’s report on the company’s internal control over financial
reporting. The Audit Committee relies, without independent verification, on the information provided to it and on the
representations made by management, the internal audit function and the independent auditor, representatives of whom
generally attend each Audit Committee meeting.
For the year ended December 31, 2023, the Audit Committee, among other things:
•reviewed and discussed the company’s quarterly earnings releases, quarterly reports on Form 10-Q and this
Annual Report on Form 10-K, including the consolidated financial statements;
•together with the Board and the other Board Committees, reviewed the company’s major legal and compliance
risk exposures and the guidelines and policies that govern the process for risk assessment and risk
management;
•reviewed and discussed reports from management on the company’s policies regarding applicable legal and
regulatory requirements;
•reviewed and discussed the plan and scope of the 2023 audit work for the independent auditor;
•reviewed and discussed with management the company’s 2022 ESG Report;
•reviewed, discussed and approved the 2023 internal audit plan and budget, and reviewed and discussed
summaries of the significant reports by the internal audit function;
•reviewed the performance and compensation of the Chief Audit Executive and Chief Compliance Officer;
•reviewed the engagement, independence and quality control procedures of the independent auditor, as
described in further detail below;
Directors, Executive Officers and Corporate Governance | Report of the Audit Committee of the Board of Directors | ||
Fannie Mae 2023 Form 10-K | 170 |
•met with and/or received reports from senior representatives of the following divisions or departments of the
company: Finance, Legal, Compliance and Ethics, and Internal Audit; and
•met regularly in executive sessions with each of Deloitte, the internal audit function and company management,
including the Chief Financial Officer, the Chief Compliance Officer and the Chief Audit Executive, which
provided an additional opportunity for Deloitte and the others noted to provide candid feedback to the
Committee.
The Audit Committee also reviewed and discussed with management, the Chief Audit Executive and Deloitte:
•the audited consolidated financial statements for 2023;
•the critical accounting estimates that are set forth in this Annual Report on Form 10-K;
•management’s annual report on the company’s internal control over financial reporting; and
•Deloitte’s opinion on the consolidated financial statements, including the critical audit matters addressed during
the audit, and the effectiveness of the company’s internal control over financial reporting.
The Audit Committee has discussed with Deloitte the matters required to be discussed by the applicable requirements
of the Public Company Accounting Oversight Board (“PCAOB”) and the SEC. The Audit Committee has received from
Deloitte the written communications required by applicable requirements of the PCAOB regarding Deloitte’s
communications with the Audit Committee concerning independence, and also has discussed with Deloitte its
independence from the company.
In evaluating Deloitte’s independence, the Audit Committee considered whether services it provided to the company
beyond those rendered in connection with its audit of the company’s consolidated financial statements, reviews of the
company’s interim condensed consolidated financial statements included in its quarterly reports on Form 10-Q and its
opinion on the effectiveness of the company’s internal control over financial reporting would impair its independence.
The Committee also reviewed and pre-approved, among other things, the audit, audit-related and non-audit-related
services performed by Deloitte. The Committee received regular updates on the amount of fees and scope of audit,
audit-related and non-audit-related services provided. The Committee concluded that the provision of services by
Deloitte did not impair its independence.
Deloitte has served as the company’s independent auditor since 2005. The Audit Committee selects Deloitte’s lead audit
partner who, along with the concurring partner, rotates every five years. Pursuant to this schedule, in 2022 the Audit
Committee selected a new lead audit partner, who began in the role with the fiscal year 2023 audit. The Audit
Committee evaluates the independent auditor’s qualifications, performance and independence on at least an annual
basis. The factors the Audit Committee considered in evaluating and approving Deloitte’s appointment as the company’s
independent auditor included:
•Deloitte’s technical expertise and industry experience;
•its institutional knowledge of the company’s business, significant accounting practices and system of internal
control over financial reporting;
•audit effectiveness, including the quality of Deloitte’s audit work, its quality control procedures, the expertise
and performance of the lead audit partner, and the professionalism and demonstrated objectivity and
skepticism of Deloitte’s team;
•the frequency and quality of Deloitte’s communication with the Committee, and the level of support provided to
the Committee;
•external data on audit quality and performance and legal and regulatory matters involving Deloitte, including the
results of PCAOB inspection reports and Deloitte’s peer review reports, and actions by Deloitte to continue to
enhance the quality of its audit practice; and
•Deloitte’s independence and its policies and procedures regarding independence.
Based on the reviews, reports, meetings and discussions referred to above, and subject to the limitations on the Audit
Committee’s role and responsibilities described above and in the Audit Committee Charter, the Audit Committee
recommended to the Board of Directors that the company’s audited consolidated financial statements for 2023 be
included in this Annual Report on Form 10-K for filing with the SEC. In addition, the Audit Committee approved the
Directors, Executive Officers and Corporate Governance | Report of the Audit Committee of the Board of Directors | ||
Fannie Mae 2023 Form 10-K | 171 |
appointment of Fannie Mae’s independent auditor, Deloitte & Touche LLP, for 2024. FHFA, as the company’s
conservator, approved Deloitte’s appointment as Fannie Mae’s independent auditor for 2024.
Audit Committee:
Robert H. Herz, Chair
Michael Seelig, Vice Chair
Simon Johnson
Diane C. Nordin
Executive Officers
Under our bylaws, each executive officer holds office until their successor is chosen and qualified or until they die,
resign, retire or are removed from office, whichever occurs first.
Ms. Almodovar, our Chief Executive Officer, has served as a member of our Board of Directors since December 2022.
Information about her business experience and other matters is provided in “Directors.” As of February 15, 2024, we
have seven other executive officers:
 | David C. Benson | |
Age 64 | President Joined Fannie Mae in 2002 | |
Mr. Benson has been President since 2018, and, since becoming President, he has also served as Interim Chief
Executive Officer during part of 2022, as Interim Chief Financial Officer during part of 2021, and as the Interim head of
Fannie Mae’s Single-Family business earlier in 2021. Mr. Benson notified us that he intends to retire by mid-2024. Mr.
Benson has served Fannie Mae in a range of leadership roles, including as Executive Vice President and Chief
Financial Officer, Executive Vice President—Capital Markets, Securitization & Corporate Strategy, and as Treasurer.
Prior to joining Fannie Mae in 2002, Mr. Benson was Managing Director in the fixed income division of Merrill Lynch &
Co where, from 1988 through 2002, he served in several capacities in the areas of risk management, trading, debt
syndication and e-commerce based in New York and London.
 | H. Malloy Evans | |
Age 50 | Executive Vice President—Single-Family Joined Fannie Mae in 2004 | |
Mr. Evans has served as Executive Vice President—Single-Family since May 2021. He is responsible for Fannie Mae’s
single-family business functions, including leading the teams responsible for maintaining our single-family mortgage
acquisition and servicing standards, providing liquidity to the single-family mortgage market, and facilitating equitable
and sustainable access to homeownership across America. Mr. Evans has served in various roles at Fannie Mae, most
recently as Senior Vice President and Chief Credit Officer for Single-Family, from 2019 to 2021, where he was
responsible for first-line credit risk management from mortgage acquisition through disposition. Prior to 2019, Mr. Evans
held other leadership roles overseeing risks across the single-family mortgage life cycle, including credit, counterparty,
operational, and reputational risks, performance of Fannie Mae’s single-family lenders and servicers, and our
administration of Treasury’s Making Home Affordable program. Mr. Evans began his Fannie Mae career in 2004 as an
attorney in Fannie Mae’s legal department, serving as the principal counsel supporting our implementation of
Directors, Executive Officers and Corporate Governance | Report of the Audit Committee of the Board of Directors | ||
Fannie Mae 2023 Form 10-K | 172 |
government initiatives under the Making Home Affordable program and advising the business on our multi-class
securitization program.
 | Michele M. Evans | |
Age 60 | Executive Vice President—Multifamily Joined Fannie Mae in 1992 | |
Ms. Evans has served as Executive Vice President—Multifamily since August 2020. She is responsible for Fannie
Mae’s multifamily business functions, including leading the teams responsible for maintaining our multifamily mortgage
acquisition and servicing standards, providing liquidity to the multifamily mortgage market, and facilitating equitable and
sustainable access to quality affordable rental housing across America. Ms. Evans has served in various roles at Fannie
Mae, most recently as Senior Vice President and Chief Operating Officer for Multifamily, from 2009 to 2020, where she
was responsible for driving the digital transformation of our Multifamily business; managing loan products; innovating
with data; operational risk; and leading Multifamily’s strategy. After joining Fannie Mae in 1992 as an analyst, Ms. Evans
managed DUS and non-DUS lender relationships, including affordable transactions and credit responsibilities, and held
other leadership roles across the Multifamily business.
 | Chryssa C. Halley | |
Age 57 | Executive Vice President and Chief Financial Officer Joined Fannie Mae in 2006 | |
Ms. Halley has served as Executive Vice President and Chief Financial Officer since November 2021. In this role, she is
responsible for Fannie Mae’s financial management as well as modeling, climate-related risk management, and
corporate strategy. Previously, Ms. Halley served as Fannie Mae’s Senior Vice President and Controller, from 2017 to
2021. Since joining Fannie Mae in 2006, she has held a variety of positions, including Senior Vice President and Deputy
Controller; Vice President and Assistant Controller for Capital Markets and Operations; Vice President for Tax, Debt and
Derivatives, and Securities Accounting; and Vice President for Corporate Tax.
 | Danielle M. McCoy | |
Age 47 | Senior Vice President, General Counsel, and Corporate Secretary Joined Fannie Mae in 2006 | |
Ms. McCoy has served as Senior Vice President, General Counsel, and Corporate Secretary since January 2024. Ms.
McCoy served as Senior Vice President, Enterprise Deputy General Counsel and Deputy Corporate Secretary from
2021 to 2023, overseeing four areas within the legal department: corporate governance, fair lending, corporate data and
technology, and data privacy and cybersecurity. Before assuming this position, from 2015 to 2021, she served as
Fannie Mae’s Fair Lending Officer in her role as Vice President and Deputy General Counsel of Fair Lending and was
responsible for fair lending compliance, legal analysis, and analytics activities. Prior to that role, Ms. McCoy served as
Deputy General Counsel for Corporate Governance, providing legal advice to senior management and the Fannie Mae
Board of Directors. Ms. McCoy joined Fannie Mae in 2006.
Directors, Executive Officers and Corporate Governance | Executive Officers | ||
Fannie Mae 2023 Form 10-K | 173 |
 | Anthony Moon | |
Age 59 | Executive Vice President and Chief Risk Officer Joined Fannie Mae in 2022 | |
Mr. Moon has served as Fannie Mae’s Executive Vice President and Chief Risk Officer since December 2022. In this
role, he is responsible for our Enterprise Risk Management division, which oversees the company’s governance and
strategy for global risk management, including establishing our overarching risk governance framework as well as risk
appetite. Mr. Moon has over 30 years of experience in financial services and over 25 years of experience in risk
management. Mr. Moon previously served as Chief Risk Officer for the Wealth Management Division and the Morgan
Stanley Private Bank at Morgan Stanley, from 2015 to December 2022. In that role, he was responsible for risk
management oversight for market, credit, operational, liquidity, model, and strategic risks. He previously held risk
leadership positions at GE Capital, Bank of Tokyo-Mitsubishi, and Bankers Trust. Mr. Moon also serves as a Board
Member for the Cortland College Foundation.
 | Stergios “Terry” Theologides | |
Age 57 | Executive Vice President and Chief Administrative Officer Joined Fannie Mae in 2019 | |
Mr. Theologides has served as Executive Vice President and Chief Administrative Officer since January 2024. In this
role, he is responsible for leading our Economic & Strategic Research group and our ESG and mission, government and
industry relations, legal, and marketing and communications functions. From 2019 to 2023, Mr. Theologides served as
Fannie Mae’s Executive Vice President, General Counsel and Corporate Secretary. Prior to joining Fannie Mae, from
2017 to 2019, Mr. Theologides was in private legal practice at Theologides Law, P.C. He served as Senior Vice
President, General Counsel and Secretary of CoreLogic, Inc. from 2010 to 2017, and served as Senior Vice President
and General Counsel, Information Solutions Group, of The First American Corporation, CoreLogic’s predecessor, from
2009 to 2010. Mr. Theologides was Executive Vice President and General Counsel for Morgan Stanley’s U.S. residential
mortgage businesses from 2007 to 2009. He was Executive Vice President, General Counsel and Secretary for New
Century Financial Corporation from 1998 to 2007. Mr. Theologides was in private legal practice at O’Melveny & Myers
LLP from 1992 to 1996.
Item 11. Executive Compensation
Compensation Discussion and Analysis
Named Executives for 2023
This Compensation Discussion and Analysis focuses on our compensation decisions and arrangements for 2023
relating to the following executive officers, whom we refer to as our “named executives”:
•Priscilla AlmodovarChief Executive Officer
•Chryssa C. HalleyExecutive Vice President and Chief Financial Officer
•David C. BensonPresident
•H. Malloy EvansExecutive Vice President—Single-Family
•Anthony MoonExecutive Vice President and Chief Risk Officer
Directors, Executive Officers and Corporate Governance | Executive Officers | ||
Fannie Mae 2023 Form 10-K | 174 |
Executive Summary
Due to our conservatorship status and other legal requirements, FHFA, our conservator and regulator, has substantial
oversight and approval rights over our executive compensation arrangements and determinations. While conserving
taxpayer resources is an important objective of FHFA’s design of our executive compensation program, we and FHFA
understand that this objective must be balanced with our need to attract and retain qualified and experienced
executives. In addition to FHFA’s oversight, Congress has also enacted legislation that significantly impacts the
compensation we pay our named executives, as we describe in “Legal, Regulatory and Conservator Restrictions on
Executive Compensation.”
Compensation for our Chief Executive Officer is limited by statute while we are in conservatorship or receivership. Our
2023 compensation arrangements with our other named executives, which we refer to as the “2023 executive
compensation program,” were developed by FHFA in consultation with Treasury. Named executives other than our Chief
Executive Officer receive two principal elements of compensation: base salary, which is paid throughout the year, and
deferred salary, which is paid after a deferral period. There are two components to deferred salary: (1) a fixed portion
that is generally subject to reduction if an executive leaves the company within one year following the end of the
performance year, unless they have met specified age and years of service requirements; and (2) an at-risk portion that
is subject to reduction based on corporate and individual performance. Named executives do not receive bonuses or
any form of equity compensation.
We had a successful year in 2023 despite housing affordability challenges posed by volatile macroeconomic conditions,
rising mortgage interest rates and housing prices, and a low mortgage-origination environment. Under the leadership of
our executives, including our named executives, we provided $369 billion in liquidity to the market in 2023 and, as
discussed in “Determination of 2023 Compensation,” had many additional accomplishments. We completed the
corporate performance goals for 2023 set by FHFA as our conservator, which we refer to as the 2023 scorecard. In
addition, the Compensation and Human Capital Committee of our Board of Directors recommended, and the Board
determined, that, taking a holistic view of our 2023 performance, management should be credited with 100%
achievement of the Board of Directors’ goals.
Overview of 2023 Executive Compensation Program
FHFA has advised us that the design of our executive compensation program is intended to fulfill and balance three
primary objectives:
•Maintain Lower Pay Levels to Conserve Taxpayer Resources. Given our conservatorship status, our executive
compensation program is designed generally to provide for lower pay levels relative to large financial services
companies that are not in conservatorship.
•Attract and Retain Executive Talent. Our executive compensation program is intended to attract and retain
executive talent with the specialized skills and knowledge necessary to effectively manage a large financial
services company. Executives with these qualifications are needed for us to continue to fulfill our important role
in providing liquidity to the mortgage market and supporting the housing market, as well as to prudently
manage our $4.1 trillion guaranty book of business. We face competition for qualified executives from other
companies. The Compensation and Human Capital Committee regularly considers the level of our executives’
compensation and whether changes are needed to attract and retain executives.
•Reduce Pay if Goals Are Not Achieved. To support FHFA’s goals for our conservatorship and encourage
performance in furtherance of these goals, 30% of an executive’s total target direct compensation consists of
at-risk deferred salary subject to reduction based on corporate and individual performance.
FHFA’s objectives for our executive compensation program and the legal, regulatory and conservator restrictions on our
executive compensation described below limit our ability to make changes to the program and limit the amount and type
of compensation we may pay our executives.
Legal, Regulatory and Conservator Restrictions on Executive Compensation
We describe below legal, regulatory and conservator requirements that significantly affect our executive compensation
program and policies.
Requirements Applicable During Conservatorship
While we are in conservatorship, we are subject to additional legal, regulatory and conservator requirements relating to
our executive compensation, including the following:
•Equity in Government Compensation Act. The Equity in Government Compensation Act of 2015 limits the
compensation and benefits for our Chief Executive Officer to the same level in effect as of January 1, 2015
Executive Compensation | Compensation Discussion and Analysis | ||
Fannie Mae 2023 Form 10-K | 175 |
while we are in conservatorship or receivership. This law also provides that compensation and benefits for our
Chief Executive Officer may not be increased while we are in conservatorship or receivership. Accordingly,
annual direct compensation for our Chief Executive Officer is limited to base salary at an annual rate of
$600,000.
•The Stop Trading on Congressional Knowledge Act of 2012, known as the STOCK Act. Pursuant to the STOCK
Act and related FHFA regulations, our senior executives, including the named executives, are prohibited from
receiving bonuses during conservatorship. FHFA defines a bonus as a payment that rewards an employee for
work performed, where details of the award (such as the decision to grant it or its amounts) are determined
after the performance period using discretion or inherently subjective measures.
•FHFA authority to set executive compensation. The powers of FHFA as our conservator include the authority to
set executive compensation. As our conservator, FHFA has retained the authority to approve the terms and
amounts of our executive compensation. In its instructions to us, FHFA has directed management to obtain
FHFA’s decision before entering into new compensation arrangements or increasing amounts or benefits
payable under existing compensation arrangements of named executives or other executive officers as defined
in SEC rules.
•FHFA requirements for employee compensation. Pursuant to FHFA instructions, FHFA’s decision as
conservator is required with regard to any changes in employee compensation that could significantly impact
our employees, including but not limited to special incentive plans, merit increase pool funding, and retention
awards for executives.
•Key FHFA compensation directives. As our conservator, from time to time FHFA issues or updates directives
that relate to compensation of our executives and other employees. Currently applicable FHFA directives
provide as follows:
◦Base salaries for all executives are limited to no more than $600,000.
◦Our policies and procedures must include penalties for executive officers and certain other covered
employees who are found to have engaged in specified restricted activity, including the clawback of
compensation in appropriate circumstances to the extent permitted by law.
◦We may target between the 25th and 50th percentiles of appropriate market data for both new
executive hires and compensation increase requests for existing executives, unless FHFA has granted
an exception.
◦In November 2023, FHFA directed us to implement a new peer group and benchmarking approach for
executive compensation and apply a 20% discount to benchmarks for the roles of Chief Financial
Officer, Chief Operating Officer, and President.
•Stockholder Powers. As our conservator, FHFA has all powers of our stockholders. Accordingly, we have not
held stockholders’ meetings since entering into conservatorship, nor have we held any stockholder advisory
votes on executive compensation.
•Golden Parachute Regulation. A golden parachute payment generally refers to a compensatory payment that is
contingent on or provided in connection with termination of employment. FHFA regulation pursuant to the GSE
Act generally prohibits us from making golden parachute payments to any current or former director, officer, or
employee during any period in which we are in conservatorship, receivership or other troubled condition, unless
either a specific exemption applies or the Director of FHFA approves the payments. Specific exemptions
include qualified pension or retirement plans, nondiscriminatory employee plans or programs that meet
specified requirements, and bona fide deferred compensation plans or arrangements that meet specified
requirements.
Other Applicable Requirements
We are also subject to legal and regulatory requirements relating to our executive compensation that apply whether or
not we are in conservatorship, including the following:
•Senior Preferred Stock Purchase Agreement. Under the terms of our senior preferred stock purchase
agreement with Treasury, until the senior preferred stock is repaid or redeemed in full:
◦We may not enter into any new compensation arrangements with, or increase amounts or benefits
payable under existing compensation arrangements of, any named executives or other executive
officers as defined in SEC rules without the consent of the Director of FHFA, in consultation with the
Secretary of the Treasury.
Executive Compensation | Compensation Discussion and Analysis | ||
Fannie Mae 2023 Form 10-K | 176 |
◦We may not sell or issue any equity securities without the prior written consent of Treasury except
under limited circumstances, which effectively eliminates our ability to offer stock-based compensation.
•Charter Act. Under the Charter Act and related FHFA regulations, FHFA as our regulator must approve any
termination benefits we offer to our named executives and certain other officers identified by FHFA.
•GSE Act. Pursuant to the GSE Act and related FHFA regulations, FHFA as our regulator has specified oversight
authority over our executive compensation. The GSE Act directs FHFA to prohibit us from providing
compensation to our named executives and certain other officers identified by FHFA that is not reasonable or
comparable with compensation for employment in other similar businesses (including other publicly held
financial institutions or major financial services companies) involving similar duties and responsibilities. FHFA
may at any time review the reasonableness and comparability of an executive officer’s compensation and may
require us to withhold any payment to the officer during such review. The GSE Act also provides that, if we are
classified as significantly undercapitalized, FHFA’s prior written approval is required to pay any bonus to an
executive officer or to provide certain increases in compensation to an executive officer.
Chief Executive Officer Compensation
Direct compensation for our Chief Executive Officer consists solely of a base salary at an annual rate of $600,000 and
has been limited to this amount by statute since the enactment of the Equity in Government Compensation Act of 2015.
For purposes of this disclosure, “direct compensation” includes salary and other cash compensation, but excludes
health and welfare, retirement, relocation, secure transportation, and other similar benefits. See “Compensation Tables
and Other Information—Summary Compensation Table” for information about our Chief Executive Officer’s total 2023
compensation.
Limits on our Chief Executive Officer compensation affect our ability to attract and retain executive talent. Total direct
compensation for our Chief Executive Officer is significantly below the market median for 2022 chief executive officer
compensation at comparable businesses. Our inability to offer market-based compensation to our Chief Executive
Officer hinders our succession planning for our chief executive officer role. See “Risk Factors—GSE and
Conservatorship Risk” for a discussion of the risks associated with executive retention and succession planning.
Executive Compensation | Compensation Discussion and Analysis | ||
Fannie Mae 2023 Form 10-K | 177 |
Elements of 2023 Executive Compensation Program
Direct Compensation
The table below summarizes the principal elements, objectives and key features of our 2023 executive compensation
program for our named executives other than our Chief Executive Officer, who receives no deferred salary. All elements
of our named executives’ direct compensation are paid in cash.
Compensation Element | Form | Primary Compensation Objectives | Key Features |
Base Salary | Fixed cash payments, which are paid during the year on a biweekly basis. | Attract and retain named executives by providing a fixed level of current cash compensation. | Base salary reflects each named executive’s level of responsibility and experience, as well as individual performance over time. Base salary rate may not exceed $600,000 for any executive while we are in conservatorship. |
Deferred Salary (Not applicable to our Chief Executive Officer) | Deferred salary is earned in biweekly increments over the course of the performance year. There are two elements of deferred salary: • a fixed portion that is generally subject to reduction if an executive leaves Fannie Mae within one year following the end of the performance year, unless they have met specified age and years of service requirements; and • an at-risk portion that is subject to reduction based on assessments of corporate and individual performance following the end of the performance year. Deferred salary is paid in quarterly installments in the year after it is earned for fixed deferred salary and in the second year for at-risk deferred salary. Interest accrues on deferred salary at one-half of the one-year Treasury Bill rate in effect on the last business day immediately preceding the year in which the deferred salary is earned. | Fixed Deferred Salary | |
Retain named executives. | Earned but unpaid fixed deferred salary is generally subject to reduction if a named executive leaves Fannie Mae within one year following the end of the performance year, unless they have met the age and years of service requirements specified below. The amount of earned but unpaid fixed deferred salary received by the named executive will be reduced by 2% for each full or partial month by which the executive’s separation date precedes January 31 of the second year following the performance year (or, if later, the end of the twenty- fourth month following the month in which the named executive first earned deferred salary). The reduction provisions applicable to payments of earned but unpaid fixed deferred salary do not apply if an officer’s employment terminates other than for cause at or after age 62, or age 55 with ten years of service with Fannie Mae, or as a result of death or long-term disability. | ||
At-Risk Deferred Salary | |||
Retain named executives and encourage them to achieve corporate and individual performance objectives. | Equal to 30% of each named executive’s total target direct compensation. Half of at-risk deferred salary was subject to reduction based on corporate performance against the 2023 scorecard as determined by FHFA in its discretion. The remaining half of at-risk deferred salary was subject to reduction based on individual performance as determined by the Board of Directors, with FHFA’s review, taking into account corporate performance against the 2023 Board of Directors’ goals. There is no potential for at-risk deferred salary to be paid out at greater than 100% of target; at-risk deferred salary is subject only to reduction. If the executive’s employment terminates due to death or long-term disability prior to the Board of Directors’ and FHFA’s determinations of performance, the reduction provisions applicable to payments of earned but unpaid at-risk deferred salary do not apply. | ||
Executive Compensation | Compensation Discussion and Analysis | ||
Fannie Mae 2023 Form 10-K | 178 |
Employee Benefits
Our employee benefits serve as an important tool in attracting and retaining senior executives. We describe the
employee benefits available in 2023 to our named executives in the table below. We provide more detail on our
retirement plans in “Compensation Tables and Other Information.”
Benefit | Form | Primary Objective |
401(k) Plan (“Retirement Savings Plan”) | The Retirement Savings Plan is a tax-qualified defined contribution plan (“401(k) plan”) available to our employee population as a whole. | Attract and retain named executives by providing retirement savings in a tax-efficient manner. |
Non-qualified Deferred Compensation (“Supplemental Retirement Savings Plan”) | The Supplemental Retirement Savings Plan is an unfunded, non-tax-qualified defined contribution plan. The plan supplements our Retirement Savings Plan by providing benefits to participants whose annual eligible earnings exceed the IRS limit on eligible compensation for 401(k) plans. | Attract and retain named executives by providing additional retirement savings. |
Health, Welfare and Other Benefits | In general, the named executives are eligible for the same benefits available to our employee population as a whole, including our medical insurance plans, life insurance program and matching charitable gifts program. The named executives are also eligible to participate in our voluntary supplemental long-term disability plan, which is available to many of our employees. | Provide for the well-being of the named executives and their families. |
Sign-on Awards and Relocation Benefits
In addition to the direct compensation and employee benefits described in the tables above, from time to time we may
offer a sign-on award to a new executive to attract the executive to join Fannie Mae and to compensate the executive
for compensation forfeited upon leaving a prior employer. We also from time to time may offer relocation benefits to a
new executive to attract the executive by reimbursing them for costs associated with moving to the Washington, DC
area.
Mr. Moon, who joined Fannie Mae in December 2022, received a sign-on award of $2,100,000, payable in three
installments, primarily to compensate him for compensation he forfeited upon leaving his prior employer. Mr. Moon
received a first installment pursuant to this award, in the amount of $1,050,000, in January 2023 and a second
installment, in the amount of $525,000, in December 2023. He is scheduled to receive the final installment of $525,000
in December 2024. Under the terms of the award, each installment is subject to repayment if, within one year after its
payment, Mr. Moon resigns or his employment with Fannie Mae is terminated involuntarily due to his misconduct.
Ms. Almodovar, who joined Fannie Mae in December 2022, received relocation benefits in 2022 and 2023 in connection
with her hire. These relocation benefits are conditioned on her continued employment with Fannie Mae for a minimum of
18 months. If she had resigned or her employment had terminated involuntarily due to misconduct within twelve months
of her December 2022 start date, Ms. Almodovar would have been required to reimburse Fannie Mae 100% of the
relocation benefits paid to her. If she resigns or her employment is terminated due to misconduct from the 13th through
the 18th month from her December 2022 start date, she is required to reimburse Fannie Mae 50% of the benefits paid.
Secure Transportation Services
For her safety, we provide Ms. Almodovar with the services of a car and executive protection driver for local commuting
and related travel pursuant to the recommendation of a third-party security study.
Severance Benefits
We have not entered into agreements with any of our named executives that entitle the executive to severance benefits.
Under the 2023 executive compensation program, a named executive is entitled to receive a specified portion of their
earned but unpaid deferred salary (and related interest) if they resign, retire, or if their employment is terminated by
Fannie Mae for any reason other than for cause. See “Compensation Tables and Other Information—Potential
Payments Upon Termination or Change-in-Control” for information on compensation that we may pay to a named
executive in certain circumstances in the event the executive’s employment is terminated.
Executive Compensation | Compensation Discussion and Analysis | ||
Fannie Mae 2023 Form 10-K | 179 |
Determination of 2023 Compensation
2023 Compensation Actions
The table below displays the 2023 direct compensation targets for each of our named executives compared to the
actual amounts that will be paid to them based on the assessments and determinations made by FHFA, the
Compensation and Human Capital Committee, and the Board of Directors. This table is presented on a different basis
from, and is not intended to replace, the Summary Compensation Table required under applicable SEC rules, which is
included in “Compensation Tables and Other Information—Summary Compensation Table” and includes additional
forms of compensation not included in the table below.
Summary of 2023 Compensation Actions | ||||||||||||||||
2023 Corporate Performance-Based At-Risk Deferred Salary | 2023 Individual Performance-Based At-Risk Deferred Salary | Total | ||||||||||||||
Name and Principal Position | 2023 Base Salary | 2023 Fixed Deferred Salary | Target | Actual % of Target | Target | Actual % of Target | Target | Actual | ||||||||
Priscilla Almodovar | $600,000 | $— | $— | —% | $— | —% | $600,000 | $600,000 | ||||||||
Chief Executive Officer | ||||||||||||||||
Chryssa Halley(1) | 592,308 | 1,486,154 | 445,384 | 91 | 445,385 | 100 | 2,969,231 | 2,929,147 | ||||||||
Executive Vice President and Chief Financial Officer | ||||||||||||||||
David Benson | 600,000 | 2,480,000 | 660,000 | 91 | 660,000 | 100 | 4,400,000 | 4,340,600 | ||||||||
President | ||||||||||||||||
H. Malloy Evans(1) | 592,308 | 1,486,154 | 445,384 | 91 | 445,385 | 100 | 2,969,231 | 2,929,147 | ||||||||
Executive Vice President—Single- Family | ||||||||||||||||
Anthony Moon(2) | 500,000 | 1,460,000 | 420,000 | 91 | 420,000 | 100 | 2,800,000 | 2,762,200 | ||||||||
Executive Vice President and Chief Risk Officer | ||||||||||||||||
(1)Amounts shown reflect that Ms. Halley’s and Mr. Evans’s compensation increased during January 2023. The increases
were approved by the Board of Directors and FHFA to better align their compensation with the market. Ms. Halley’s and Mr.
Evans’s total annual direct compensation targets increased to $3,000,000, consisting of base salary of $600,000, fixed
deferred salary of $1,500,000 and at-risk deferred salary of $900,000.
(2)This table excludes the sign-on award Mr. Moon received in 2023, which is discussed in “Elements of 2023 Executive
Compensation Program—Sign-on Awards and Relocation Benefits.”
Assessment of Corporate Performance against 2023 Scorecard
Overview
In January 2023, FHFA issued the 2023 scorecard, a set of corporate performance objectives and related targets for
2023. Half of 2023 at-risk deferred salary, or 15% of overall 2023 total target direct compensation, for each named
executive other than Ms. Almodovar was subject to reduction based on FHFA’s assessment in its discretion of our
performance against the 2023 scorecard and related objectives.
The elements of the 2023 scorecard are shown below under “FHFA Assessment.” FHFA developed these objectives and
related targets with input from management. The 2023 scorecard established that our performance would be assessed
based on the following criteria:
•Our products and programs foster liquid, competitive, efficient, and resilient housing finance markets that
support affordable, sustainable, and equitable access to homeownership and rental housing;
•We conduct business in a safe and sound manner;
•We meet expectations under all FHFA requirements, including those pertaining to capital, liquidity, and credit
risk transfer;
•We continue to manage operations while in conservatorship in a manner that preserves and conserves assets
through the prudent stewardship of our resources;
Executive Compensation | Compensation Discussion and Analysis | ||
Fannie Mae 2023 Form 10-K | 180 |
•We cooperate and collaborate with FHFA to meet the conservator’s priorities and guidance throughout the
course of the year;
•We deliver work products that are high quality, thorough, creative, effective, and timely, and that consider
effects on homeowners, multifamily property owners, and renters, Fannie Mae and Freddie Mac, the industry,
and other stakeholders; and
•We ensure that diversity, equity, and inclusion remain top priorities in strategic planning, operations, and
business development.
FHFA Assessment
We provided updates to and maintained a dialogue with FHFA throughout 2023 on our performance against the 2023
scorecard, including our performance against FHFA’s expectations for diversity and inclusion. In January 2024, FHFA
reviewed and assessed our performance against the 2023 scorecard, with input from management, and determined that
the portion of 2023 at-risk deferred salary for senior executives that is based on corporate performance would be paid at
91% of target. In assessing our performance against the 2023 scorecard, the factors considered by FHFA included our
completion of all of the 2023 scorecard objectives and our performance against the qualitative assessment criteria
referenced above.
Executive Compensation | Compensation Discussion and Analysis | ||
Fannie Mae 2023 Form 10-K | 181 |
The table below sets forth the 2023 scorecard and a summary of FHFA’s assessment of our achievement against the
scorecard objectives and targets. For purposes of the 2023 scorecard, “Enterprise” refers to each of Fannie Mae and
Freddie Mac.
FHFA 2023 Scorecard | |
Objectives | Performance |
Promote Equitable Access to Affordable and Sustainable Housing (50%) Conduct business and undertake initiatives that support affordable, sustainable, and equitable access to homeownership and rental housing, and fulfill all statutory mandates. | |
Take significant actions to ensure that all borrowers and renters have equitable access to sustainable long-term affordable housing opportunities, including efforts that further energy efficiency, resiliency, and cost savings in the mortgage process. Develop and implement strategies to support and advance the following: •Sustainable homeownership and affordable rental housing ◦Explore options to expand energy efficiency and to improve resiliency product offerings and policy guidelines. ◦Explore the feasibility of expanding tenant protections in properties financed by the Enterprises. ◦Identify strategies and activities to facilitate greater affordable housing supply within the limits of charter authorities. ◦Plan for implementation of the approved credit score models, informed by stakeholder outreach. •Equitable access to housing ◦Take meaningful actions to achieve the goals and objectives of the Enterprises’ Equitable Housing Finance Plans. ◦Continue efforts to minimize single-family appraisal bias and improve valuation equity, including by supporting FHFA’s implementation of the Property and Valuation Equity (“PAVE”) action plan. •Efficiency in the mortgage market ◦Continue modernization of single-family appraisal processes and practices. ◦Leverage data, technology, and other innovations to promote efficiency and cost savings in mortgage processes. •Climate risks ◦Identify and pursue measures to enhance consumer awareness of climate risks in housing. ◦Continue research to identify at-risk borrowers, properties, and communities to inform policy and improve climate- resiliency efforts. | The objectives were assessed as completed. In its assessment, FHFA noted that Fannie Mae exceeded its targets and measures relating to multifamily tenant protections by developing several innovative and precedent setting resident-centered property management practices and identifying opportunities to develop industry-wide best practices. FHFA also noted that Fannie Mae provided exceptionally high-quality deliverables in support of its work to leverage data, technology and other innovations to promote efficiency and cost savings in single-family mortgage processes. |
Manage new multifamily purchases to remain within the multifamily cap requirements, including an expanded focus on workforce/moderate income housing. | The objectives were assessed as completed. |
Executive Compensation | Compensation Discussion and Analysis | ||
Fannie Mae 2023 Form 10-K | 182 |
FHFA 2023 Scorecard, continued | |
Objectives | Performance |
Operate the Business in a Safe and Sound Manner (50%) Operate with heightened focus on safety and soundness and with a prudent risk profile consistent with continued support for housing finance markets throughout the economic cycle, while minimizing the risk of requiring a draw against the Treasury commitment. | |
Ensure that the Enterprise is resilient to operational, market, credit, counterparty, economic, and climate risks. •Address examination and supervision findings promptly. •Maintain effective risk management systems appropriate for entities that need to minimize risk to capital as they rebuild their capital buffers. •Take appropriate action to address risk exposure and enhance Enterprise counterparty risk controls. •Strengthen risk management capabilities in identifying, assessing, controlling, monitoring, and reporting on climate risk and incorporating these capabilities into the overall Enterprise risk framework. •Maintain ability to respond to operational events without significant disruption to the primary or secondary mortgage market. •Maintain liquidity at levels required by FHFA and sufficient to sustain Enterprise operations through severe stress events. •Continue to develop the pricing framework to maintain support for core mission single-family borrowers, ensure a level playing field for small and large sellers, foster capital accumulation, and achieve viable returns on capital. | The objectives were assessed as completed. |
Transfer a meaningful amount of credit risk to private investors in a commercially reasonable and safe and sound manner, reducing risk to taxpayers. | The objectives were assessed as completed. |
Ensure CSS operates in a safe and sound manner in support of Enterprise securitization activities. | Fannie Mae’s performance was not assessed with respect to this objective, which established measures only for CSS. |
Assessment of Corporate Performance against 2023 Board of Directors’ Goals
In January 2023, the Board of Directors established the 2023 Board of Directors’ goals, which are presented in the table
below. Performance against these goals was a factor the Board of Directors used to determine individual performance
of our named executives, other than our Chief Executive Officer, for purposes of the individual performance-based
component of 2023 at-risk deferred salary.
The Compensation and Human Capital Committee reviewed our performance against the 2023 Board of Directors’
goals in December 2023 and again, with the full Board of Directors, in January 2024. In connection with the review,
management provided the Compensation and Human Capital Committee and the full Board of Directors with a report
assessing management’s performance against the goals, which was reviewed for reasonableness by our Internal Audit
group. The Compensation and Human Capital Committee considered management’s assessment of its performance
against the goals. The Committee also discussed Fannie Mae’s 2023 performance with the full Board and the Chairs of
the Audit Committee and Risk Policy and Capital Committee. The Board of Directors and the Compensation and Human
Capital Committee did not assign any relative weight to the Board of Directors’ goals and the Compensation and Human
Capital Committee used its judgment in determining the overall level of company performance.
Taking a holistic view of our 2023 performance, in January 2024 the Compensation and Human Capital Committee
recommended, and the Board of Directors determined, that management should be credited with 100% achievement of
the Board of Directors’ goals. The Compensation and Human Capital Committee commended management’s
performance in the face of housing affordability challenges posed by volatile macroeconomic conditions, rising
mortgage interest rates and housing prices, and a low mortgage-origination environment. In assessing management’s
performance, the Compensation and Human Capital Committee noted that Fannie Mae delivered solid financial results
Executive Compensation | Compensation Discussion and Analysis | ||
Fannie Mae 2023 Form 10-K | 183 |
while prioritizing operating within risk limits, consistent with its regulatory commitments. Fannie Mae also continued to
execute on its mission to facilitate equitable and sustainable access to homeownership and quality affordable rental
housing across America by excelling in regard to its Board of Directors’ goals related to climate, workforce, and diversity
and inclusion. The Compensation and Human Capital Committee provided FHFA with its assessment of corporate
performance against the 2023 Board of Directors’ goals.
The table below sets forth our 2023 Board of Directors’ goals and a summary of the Compensation and Human Capital
Committee’s assessment of our achievement against these goals.
Board of Directors’ Goals | ||
Goals | Performance | |
Goals Relating to Strategic Objectives | ||
Improve Equitable & Sustainable Access to Housing | Take action to ensure that borrowers and renters have equitable access to long-term affordable housing opportunities. | The goal was assessed as achieved. The Compensation and Human Capital Committee believes Fannie Mae met or exceeded its duty to serve targets, its multifamily housing goals, and the benchmark levels for all but two of its single-family housing goals. Those two single-family housing goals may also be met based on the level of goals-eligible originations in the primary mortgage market in 2023, which will not be available until later this year. FHFA will make the final determination on whether the company has met its 2023 housing goals and duty to serve obligations. In making its assessment, the Committee recognized the challenges posed by this year’s market conditions, commended management’s progress in alignment with the mission to facilitate equitable and sustainable access to homeownership and quality affordable rental housing across America and noted that management continues to operate within risk limits and proactively engage with FHFA. |
Take targeted actions to address climate-related risks to Fannie Mae while also guiding efforts to support sustainable housing. | The goal was assessed as achieved. While work to address climate-related risks and guide efforts to help support resilient housing remains in the early stages, in 2023 Fannie Mae took steps to begin integrating climate risk considerations into its risk management framework, partnered with industry stakeholders to build environmental resiliency, and analyzed climate risk data to limit exposure. | |
Enhance our Financial & Risk Position | ||
Manage our business, risk, and financial position to ensure safety and soundness and enable pursuit of our mission-first approach to business. | The goal was assessed as achieved. Fannie Mae adhered to Board-approved risk limits (including as remediated where limits were exceeded); managed administrative expenses within Board- approved limits; exceeded FHFA-required levels of return measures on new acquisitions; modified its single-family pricing framework; and enhanced its data, modeling and analytics infrastructure. | |
Executive Compensation | Compensation Discussion and Analysis | ||
Fannie Mae 2023 Form 10-K | 184 |
Board of Directors’ Goals, continued | ||
Goals | Performance | |
Goals Relating to Other Objectives | ||
Progress our Digital Transformation | Support delivery of our business objectives to benefit borrowers and renters and expand adoption of our modernized technology, data, and cybersecurity capabilities to increase our operational agility, stability and efficiency. | The goal was assessed as achieved. Fannie Mae made progress in cloud migrations and asset retirements. Fannie Mae also improved its product development practices; and continued to strengthen its information security capabilities. |
Strengthen our Workforce | Develop and maintain our workforce to ensure continuity of operations, support our strategy, and continue to enhance our culture. | The goal was assessed as achieved. Fannie Mae successfully navigated several significant senior leadership changes in 2023, spotlighting the effectiveness of its succession planning strategy. Fannie Mae also maintained strong employee engagement and low attrition rates. |
Promote Diversity & Inclusion | Promote diversity and the inclusion and utilization of minorities, women and individuals with disabilities in all aspects of our business | The goal was assessed as achieved. Fannie Mae met its diversity and inclusion goals and, in the midst of 2023’s evolving legal landscape, reaffirmed its commitment to fostering diversity and inclusion in its workforce and its industry. |
Deliver our Regulatory Commitments | Ensure we are meeting commitments to FHFA. | The goal was assessed as achieved. Fannie Mae met all of the objectives in the 2023 FHFA scorecard and timely submitted requested documents and remediation plans to FHFA for all FHFA-identified risk and control matters within established timeframes or mutually acceptable extensions. The Committee commended Fannie Mae for its remediation of FHFA-identified risk and control matters in 2023. |
Assessment of 2023 Individual Performance
Half of 2023 at-risk deferred salary, or 15% of overall 2023 total target direct compensation, for each named executive
other than Ms. Almodovar was subject to reduction based on individual performance in 2023, as determined by the
Board of Directors with FHFA’s approval. The Board of Directors also assessed the performance of Ms. Almodovar, who
as Chief Executive Officer does not receive at-risk deferred salary, against her goals.
The Board’s determinations regarding individual performance were based on the recommendation of the Compensation
and Human Capital Committee. For Mr. Moon, our Chief Risk Officer, the Compensation and Human Capital
Committee’s recommendation was made in consultation with the Risk Policy and Capital Committee. These committees
met in January 2024 to assess the 2023 performance of our named executives. The committees discussed the
individual performance of our named executives (other than Ms. Almodovar) with Ms. Almodovar, our Chief Executive
Officer, and the individual performance of some of our named executives with Mr. Benson, our President. Upon
recommendation from the committees, the Board of Directors determined performance and approved individual
performance-based at-risk deferred salary for 2023. The Board of Directors’ determinations and highlights of each
named executive’s performance in 2023 are discussed below. FHFA approved the performance-based at-risk deferred
salary payments for the eligible named executives in February 2024.
Executive Compensation | Compensation Discussion and Analysis | ||
Fannie Mae 2023 Form 10-K | 185 |
Priscilla Almodovar Chief Executive Officer | Ms. Almodovar provided strong leadership to Fannie Mae. Her 2023 accomplishments included: •Oversaw completion of all of the corporate performance goals in FHFA’s 2023 scorecard and achievement of a 100% rating on the Board of Directors’ goals. •Delivered solid financial results, continued to build net worth, maintained solid credit risk characteristics in Fannie Mae’s guaranty book of business, and managed within risk limits. •Completed implementation of a modified single-family pricing framework and enhanced data, modeling and analytics infrastructure. •Navigated market volatility, macroeconomic uncertainties, regional banking sector failures, lender financial pressures, and third-party cybersecurity incidents by demonstrating operational discipline, risk management, transparent communication and decisiveness, along with collaboration across divisions and with FHFA and other stakeholders. •Demonstrated budget discipline, implemented capacity-based planning, and routinized management committee-level prioritization practices to ensure we focused on our most important objectives and effectively deploying human and financial resources. | |
Chryssa Halley Executive Vice President and Chief Financial Officer | The Board determined that Ms. Halley’s individual performance-based at-risk deferred salary for 2023 would be paid at 100% of her target. Ms. Halley’s accomplishments in 2023 provided critical support to Fannie Mae’s achievement of the company’s 2023 goals. Her 2023 accomplishments included: •Changed trajectory of 2023 budget by limiting headcount increases, establishing task force to review spending on third-party services, and changed the threshold for approval of third-party spending. •Led prioritization of work across Fannie Mae, organizing a management committee subgroup to limit priorities and connect work to strategy and critical initiatives. •Oversaw significant improvements to Fannie Mae’s stress testing processes, including incorporating first-line controls testing. •Supported work on addressing FHFA requirements for remediating modeling deficiencies, including establishing project team and reporting to the Board on progress, including initial assessment of critical models. •Reorganized Finance division, including consolidating the company’s financial forecasting function as well as aligning capital monitoring and management within the Treasurer’s organization. •Oversaw the Finance division’s completion of the transition from LIBOR to SOFR. •Shortened the timeline for conducting financial forecasting. | |
Executive Compensation | Compensation Discussion and Analysis | ||
Fannie Mae 2023 Form 10-K | 186 |
David Benson President | The Board determined that Mr. Benson’s individual performance-based at-risk deferred salary for 2023 would be paid at 100% of his target. Mr. Benson’s continued strong leadership in 2023 was critical to the company’s success in achieving the 2023 scorecard and 2023 Board of Directors’ goals. His 2023 accomplishments included: •Supported completion of the corporate performance goals in FHFA’s 2023 scorecard and achievement of a 100% rating on the Board of Directors’ goals. •Delivered solid financial results, continued to build net worth, maintained solid credit risk characteristics in Fannie Mae’s guaranty book of business, and managed within risk limits. •Oversaw the design of our initial generative artificial intelligence governance process to evaluate use cases that may drive business value and appropriately mitigate risk; established an enterprise lead for our recently created generative artificial intelligence program, which we continue to build. •Continued mission-centric product and technology innovation and evolution of our initiatives supporting affordable housing. •Navigated market volatility, macroeconomic uncertainties, regional banking sector failures, lender financial pressures, and third-party cybersecurity incidents by demonstrating operational discipline, risk management, transparent communication and decisiveness, along with collaboration across divisions and with FHFA and other stakeholders. •As CSS Board member, oversaw successful operations of this joint venture, which Fannie Mae relies on for the operation of a majority of its single-family securitization, and facilitated the transition of a new Fannie Mae-designated board member upon the departure of the prior designee. | |
Malloy Evans Executive Vice President—Single- Family | The Board determined that Mr. Evans’s individual performance-based at-risk deferred salary for 2023 would be paid at 100% of his target. Mr. Evans’s accomplishments in 2023 contributed to Fannie Mae’s achievement of the company’s 2023 goals. His 2023 accomplishments included: •Managed competing business objectives relating to risks, returns, UMBS alignment and our mission during a volatile macroeconomic environment, while staying within budget. •Managed development and implementation of changes to Fannie Mae’s single-family pricing framework. •Oversaw continued innovation to support access to credit for credit-invisible and underserved borrowers and to support borrower resilience and stability. •Significantly advanced the Single-Family division’s ability to prioritize work and capacity to deliver, enabling resource and business agility and supporting capacity-based planning efforts. •Improved alignment and partnership with Chief Information Office and Finance divisions to effectively meet objectives. •Reorganized the Single-Family division to more effectively align product and digital capabilities with business activities and enhance execution on a unified set of prioritized initiatives. | |
Executive Compensation | Compensation Discussion and Analysis | ||
Fannie Mae 2023 Form 10-K | 187 |
Anthony Moon Executive Vice President and Chief Risk Officer | The Board determined that Mr. Moon’s individual performance-based at-risk deferred salary for 2023 would be paid at 100% of his target. Mr. Moon’s accomplishments in 2023 provided critical support to Fannie Mae’s achievement of the company’s 2023 goals. His 2023 accomplishments included: •Responded to FHFA concerns regarding modeling deficiencies, including conducting a gap assessment and establishing a remediation plan. •Strengthened the model risk management team by recruiting new leadership and began developing a new quality control function. •Improved risk reporting for Board and management-level risk committees. •Designed and helped implement changes to Fannie Mae’s governance structure and delegations of authority designed to more effectively use company resources to manage risks to the business. |
Other Executive Compensation Considerations
Role of Compensation Consultants
The Compensation and Human Capital Committee’s independent compensation consultant is Frederic W. Cook & Co.,
Inc. (“FW Cook”). Management’s outside compensation consultant is McLagan.
For 2023, consultants from FW Cook attended meetings and advised the Compensation and Human Capital Committee
and the Board of Directors on various executive compensation matters, including:
•supporting the Compensation and Human Capital Committee in the review of a revised peer group proposed by
FHFA for compensation benchmarking purposes;
•preparing an analysis of compensation for our Chief Executive Officer, President, and Chief Financial Officer
positions in comparison to comparable positions at companies in our peer group, based on information in proxy
statements and other reports filed by those companies with the SEC;
•reviewing McLagan’s analysis of market compensation data for select senior management positions;
•reviewing various management proposals relating to compensation structures and levels, and for new hires and
promotions;
•reviewing our risk assessment of our 2023 compensation program;
•presenting market information related to non-employee director compensation;
•assisting the Compensation and Human Capital Committee in its evaluation of our performance against the
2023 Board of Directors’ goals;
•facilitating the Compensation and Human Capital Committee’s evaluation of our Chief Executive Officer’s
performance;
•informing the Compensation and Human Capital Committee of regulatory updates and market trends in
compensation and benefits; and
•assisting with the preparation of executive compensation disclosure in our Annual Report on Form 10-K.
For 2023, consultants from McLagan attended meetings as needed and advised management and the Compensation
and Human Capital Committee on various compensation and human resources matters, including:
•providing guidance and feedback on our 2023 executive compensation program;
•supporting management in the review, recommendation, and assessment of the implications of a new peer
group for compensation benchmarking purposes;
•providing supplemental benchmark information to support Fannie Mae in meeting FHFA directions for
compensation actions;
•defining the protocol regarding benchmarking for executives;
•advising on market trends, competitive pay levels and various compensation proposals for new hires and
promotions;
•providing market compensation data for senior management positions; and
Executive Compensation | Compensation Discussion and Analysis | ||
Fannie Mae 2023 Form 10-K | 188 |
•reviewing market data and trends, and providing Compensation and Human Capital Committee members with
an opportunity to ask questions and discuss implications of trends on Fannie Mae.
Compensation Consultant Independence Assessment
Pursuant to SEC and NYSE rules, the Compensation and Human Capital Committee assessed the independence of
FW Cook and McLagan most recently in December 2023. Based on its assessments, the Compensation and Human
Capital Committee determined that FW Cook is independent from Fannie Mae management and has no conflicts of
interest.
Because McLagan was retained by and provides services to management, it is not an independent advisor. McLagan’s
work raises no material conflicts of interest, and we believe any conflict of interest raised by McLagan’s retention and
provision of services to management as well as to the Compensation and Human Capital Committee is addressed by
the Compensation and Human Capital Committee’s receipt of advice from and access to FW Cook as its independent
compensation consultant.
Peer Group and Role of Benchmark Data
Our Compensation and Human Capital Committee typically requests benchmark compensation data for our senior
executives on an annual basis to assess the compensation of the company’s senior executives relative to our peer
group or other appropriate benchmarks described below. For 2023 compensation, the Compensation and Human
Capital Committee reviewed benchmark compensation data as one of a number of factors that informed its
compensation decisions.
Finding comparable firms for purposes of benchmarking executive compensation is challenging due to our unique
business, structure and mission, and the large size of our book of business compared to other financial services
companies. We believe the only directly comparable firm to us is Freddie Mac. At FHFA’s request, we and Freddie Mac
use the same peer group of companies for benchmarking executive compensation to provide consistency in the market
data used for compensation decisions. Factors relevant to the selection of companies for our peer group included their
status as U.S. public companies, the industry in which they operate (each is a commercial bank, insurance company,
finance lessor, government-sponsored enterprise or financial technology firm) and their size (in terms of assets and
number of employees) relative to the size of Fannie Mae. Our primary peer group that was used for 2023 compensation
benchmarking consisted of the following 24 companies:
• | The Allstate Corporation | • | Mastercard Incorporated |
• | Ally Financial Inc. | • | MetLife, Inc. |
• | American International Group, Inc. | • | Northern Trust Corporation |
• | American Express Company | • | The PNC Financial Services Group, Inc. |
• | The Bank of New York Mellon Corporation | • | Prudential Financial, Inc. |
• | Capital One Financial Corporation | • | Regions Financial Corporation |
• | Citizens Financial Group, Inc. | • | State Street Corporation |
• | Discover Financial Services | • | Synchrony Financial |
• | Fifth Third Bancorp | • | Truist Financial Corporation |
• | Freddie Mac | • | U.S. Bancorp |
• | The Hartford Financial Services Group, Inc. | • | Visa Inc. |
• | KeyCorp | • | Voya Financial, Inc. |
This primary peer group was developed and approved by FHFA and the Compensation and Human Capital Committee
in 2017 and subsequently adjusted as a result of the merger of two companies in the group.
The Compensation and Human Capital Committee followed a bifurcated approach to benchmarking the compensation
of senior executive positions for 2023. Under this approach, while the peer group noted above was the primary group of
companies used for benchmarking senior management pay levels, for certain senior management roles that were more
comparable in function and/or scope to roles at firms outside this peer group, the Compensation and Human Capital
Committee considered pay levels against a broader or different group of companies.
In November 2022, members of the Compensation and Human Capital Committee reviewed and discussed
compensation benchmarking data for our executives. The benchmarking was primarily based on 2021 performance
year compensation at peer companies, although in most cases 2022 base salary information was included if available.
Executive Compensation | Compensation Discussion and Analysis | ||
Fannie Mae 2023 Form 10-K | 189 |
The named executives’ total target direct compensation in effect at the time of benchmarking was compared with
compensation for the comparable position at other companies as follows:
•the compensation of our Chief Executive Officer (Ms. Almodovar) and our Chief Financial Officer (Ms. Halley)
was benchmarked against our primary peer group identified above;
•the compensation of our President (Mr. Benson) was benchmarked against our primary peer group to the
extent those companies had a President position (14 of the 24 companies);
•the compensation of our Executive Vice President—Single-Family (Mr. Evans) was benchmarked against our
primary peer group and divisional leadership from a group of large banks (Bank of America Corporation,
Citigroup Inc., JPMorgan Chase & Co. and Wells Fargo & Company) to the extent those firms had executives in
comparable positions (eleven of the 28 companies) and seven other specialty mortgage lending organizations
that had leaders with comparable roles; and
•the compensation of our Executive Vice President and Chief Risk Officer (Mr. Moon) was benchmarked against
our primary peer group and divisional leadership from the group of large banks used for benchmarking Mr.
Evans’ compensation to the extent those firms had executives in comparable positions (22 of the 28
companies).
As described in “Legal, Regulatory and Conservator Restrictions on Executive Compensation,” in November 2023 FHFA
directed us to implement a new peer group and benchmarking approach. The new peer group and benchmarking
became effective in November 2023 and will first apply to compensation earned in 2024.
Compensation Recoupment Policies
Compensation Recoupment Policy
A portion of our executive officers’ compensation is subject to forfeiture or repayment upon the occurrence of specified
events. We provide a summary of these repayment provisions, also known as “clawback” provisions, in the table below.
Because our Chief Executive Officer does not receive deferred salary or incentive payments, the provisions in the table
below do not apply to Ms. Almodovar’s compensation. The full text of our repayment provisions is provided in
Exhibit 10.1 to this report.
Forfeiture Event | Compensation Subject to Forfeiture/Repayment | |
Materially Inaccurate Information | ||
The executive officer has been granted deferred salary or incentive payments based on materially inaccurate financial statements or any other materially inaccurate performance metric criteria. | Amounts of deferred salary and incentive payments granted in excess of the amounts the Board of Directors determines would likely have been granted using accurate metrics. | |
Termination for Cause | ||
The executive officer’s employment is terminated for cause. For a description of what constitutes termination for cause, see “Compensation Tables and Other Information—Potential Payments Upon Termination or Change-in-Control.” | All deferred salary and incentive payments that have not yet become payable. | |
Subsequent Determination of Cause | ||
The Board of Directors later determines (within a specified period of time) that the executive officer could have been terminated for cause and that the officer’s actions materially harmed the business or reputation of the company. | Deferred salary and incentive payments to the extent the Board of Directors deems appropriate. | |
Willful Misconduct | ||
The executive officer’s employment: •is terminated for cause (or the Board of Directors later determines that cause for termination existed within a specified period of time) due to willful misconduct in connection with the performance of their duties for the company; and •the Board of Directors determines this has materially harmed the business or reputation of the company. | All deferred salary and incentive payments that have not yet become payable, and, to the extent the Board of Directors deems appropriate, deferred salary and annual incentives or long-term awards paid in the two-year period prior to the officer’s employment termination date. |
Executive Compensation | Compensation Discussion and Analysis | ||
Fannie Mae 2023 Form 10-K | 190 |
In addition to these provisions, under Section 304 of the Sarbanes-Oxley Act of 2002, certain of the incentive-based
compensation for individuals serving as our chief executive officer or chief financial officer, including compensation
received for prior years, could become subject to reimbursement.
Because Fannie Mae is in conservatorship and not listed on a national securities exchange, we are not required to and
have not adopted a recoupment policy designed to comply with recently adopted SEC rules requiring specific provisions
in such policies for listed companies.
Clawback Provision under Confidentiality and Proprietary Rights Agreement
In addition to the compensation recoupment policy described above, the named executives’ at-risk deferred salary is
subject to a compensation clawback provision pursuant to a Confidentiality and Proprietary Rights Agreement (the
“Agreement”) and related Covered Employee External Employment Activities Standard (the “Standard”). All specified
covered employees, including the named executives, are required to enter into the Agreement and are subject to the
Standard. Ms. Almodovar does not receive the at-risk deferred salary that is subject to the clawback provision.
Covered employees’ obligations under the Agreement include, among other things, compliance with the Standard. The
Agreement provides that, unless otherwise required by law, covered employees’ at-risk compensation is subject to
reduction, forfeiture, recoupment, and repayment for violations of the Standard. Covered employees are required to sign
a statement acknowledging their at-risk compensation is subject to these requirements.
The Standard defines the following as restricted activity: directly or indirectly seeking, negotiating, creating, developing
or accepting employment or other commercial and business opportunities in which the covered employee has a
personal interest outside of Fannie Mae with firms that have, or seek to have, a business relationship with Fannie Mae
either during, or within the six-month period following, the covered employee’s employment at Fannie Mae. To address
the risks associated with a covered employee engaging in restricted activities, the Standard requires covered
employees to:
•disclose timely prospective employment discussions in alignment with applicable Fannie Mae policies;
•abide by specified mitigation activities to address the conflicts of interest posed by such disclosures;
•for a six-month period after the termination of their Fannie Mae employment, refrain from representing any
person (including themselves) or any commercial entity to Fannie Mae or its employees in any way with respect
to any matter on which the covered employee had direct and substantial involvement or participation while
employed by Fannie Mae;
•maintain the confidentiality of Fannie Mae confidential information to which they had access in connection with
their Fannie Mae employment after termination of their Fannie Mae employment;
•inform Fannie Mae at the time of their departure whether they have accepted an offer of employment and/or
taken steps to form a new business and provide the name of the subsequent employer/company;
•abide by the one-year non-solicitation/non-inducement of key employees to leave provisions of the Agreement;
and
•inform any subsequent employer that engages in business with Fannie Mae of these requirements of the
Standard to the extent that they remain applicable.
A covered employee’s failure to comply with the above-listed requirements of the Standard would be a violation of the
Standard.
At-risk compensation for the named executives consists of the at-risk portion of deferred salary and excludes base
salary and the fixed portion of deferred salary. The current named executives may be subject to:
•forfeiture of up to 100% of at-risk deferred salary that has not yet been paid; and
•recoupment of up to 100% of at-risk deferred salary that was paid during the period one year before or ending
one year after the violation.
In determining whether to take these actions, the decisionmaker may consider the seriousness of the violation, the level
and responsibilities of the covered employee, the intentional nature of the conduct of the covered employee, whether
the covered employee was unjustly enriched, whether seeking the recovery would prejudice the company’s interests in
any way, including in a proceeding or investigation, and any other factors they deem relevant to the determination.
The full text of the company’s Confidentiality and Proprietary Rights Agreement is provided in Exhibit 10.20 to this report
and forms of the statement that covered employees are required to sign are provided in Exhibit 10.21 and Exhibit 10.22
to this report.
Executive Compensation | Compensation Discussion and Analysis | ||
Fannie Mae 2023 Form 10-K | 191 |
Stock Ownership Policy
We ceased paying new stock-based compensation to our executives after entering into conservatorship in September
2008. In 2009, our Board of Directors eliminated our stock ownership requirements.
Hedging Policy
All Fannie Mae employees, officers and directors are prohibited from transacting in options, puts, calls or other
derivative securities relating to Fannie Mae’s securities, on an exchange or in any other organized market. All Fannie
Mae employees, officers and directors are also prohibited from engaging in hedging transactions relating to Fannie
Mae’s securities, such as prepaid variable forwards, equity swaps, collars and exchange funds, and other derivatives.
Compensation Committee Report
The Compensation and Human Capital Committee of the Board of Directors of Fannie Mae has reviewed and discussed
the Compensation Discussion and Analysis included in this Annual Report on Form 10-K with management. Based on
such review and discussions, the Compensation and Human Capital Committee has recommended to the Board of
Directors that the Compensation Discussion and Analysis be included in this Annual Report on Form 10-K.
Compensation and Human Capital Committee: |
Diane C. Nordin, Chair Karin J. Kimbrough, Vice Chair Robert H. Herz Manolo Sánchez Michael Seelig |
Compensation Risk Assessment
Our Enterprise Risk Management division conducted a risk assessment of our 2023 employee compensation policies
and practices. In conducting this risk assessment, the division reviewed the following, among other things:
•our compensation policy;
•our performance goals and performance appraisal process;
•our compensation structure (including incentives and pay mix);
•our severance arrangements and compensation clawback provisions;
•the restrictions on compensation applicable during conservatorship, including the limit on annual direct
compensation for our Chief Executive Officer; and
•the oversight of aspects of our compensation by the Compensation and Human Capital Committee, the Board
of Directors and FHFA.
The division also assessed whether mitigating factors existed that would reduce the opportunity for inappropriate risk-
taking driven by our compensation policies and practices. The risk assessment of the company’s 2023 compensation
policies and practices was shared with the Compensation and Human Capital Committee.
Based on the risk assessment, management concluded that our 2023 employee compensation policies and practices do
not create risks that are reasonably likely to have a material adverse effect on the company. A number of factors
contributed to this conclusion, including:
•the overall design of our compensation structure does not incentivize material risk taking;
•deferred salary for our executive officers is subject to clawback provisions;
•our control environment for compensation, including a defined and consistently applied annual performance
appraisal process; compensation adjustment guidelines and criteria; succession planning; and retention
planning and monitoring;
•our 2023 performance goals are neither designed nor intended to incentivize employees to engage in activities
contrary to our Employee Code of Conduct, risk appetite or any other activity that would involve taking
inappropriate risks or result in a material adverse effect on the company; and
•our Board risk limits inhibit excessive risk taking, while allowing transparency and action when the limits are
exceeded; the Board limits define the maximum amount of risk the company is willing to take in pursuit of its
Executive Compensation | Compensation Discussion and Analysis | ||
Fannie Mae 2023 Form 10-K | 192 |
objectives, and the company regularly monitors, reports and escalates limit levels and the actions that may be
taken to manage to risk limits.
Management stated in its risk assessment that the cap on our Chief Executive Officer’s compensation under the Equity
in Government Compensation Act of 2015 continues to be a risk factor for the company. See “Risk Factors—GSE and
Conservatorship Risk” for a discussion of the challenges and risks posed by limitations on our executive and employee
compensation.
Compensation Tables and Other Information
Summary Compensation Table
The following table shows summary compensation information for the named executives.
Summary Compensation Table | ||||||||||||||
Salary | ||||||||||||||
Name and Principal Position | Year | Base Salary(1) | Fixed Deferred Salary (Service-Based)(2) | Bonus(3) | Non-Equity Incentive Plan Compensation(4) | All Other Compensation(5) | Total | |||||||
Priscilla Almodovar | 2023 | $600,000 | $— | $— | $— | $94,467 | $694,467 | |||||||
Chief Executive Officer | 2022 | 46,154 | — | — | — | — | 46,154 | |||||||
Chryssa Halley | 2023 | 592,308 | 1,486,154 | — | 890,922 | 112,533 | 3,081,917 | |||||||
Executive Vice President | 2022 | 500,000 | 1,018,462 | — | 642,882 | 58,386 | 2,219,730 | |||||||
and Chief Financial Officer | 2021 | 440,000 | 335,385 | — | 310,863 | 62,707 | 1,148,955 | |||||||
David Benson | 2023 | 600,000 | 2,480,000 | — | 1,320,226 | 143,402 | 4,543,628 | |||||||
President | 2022 | 600,000 | 2,200,000 | — | 1,185,457 | 76,590 | 4,062,047 | |||||||
2021 | 600,000 | 1,920,000 | — | 1,010,305 | 87,406 | 3,617,711 | ||||||||
H. Malloy Evans | 2023 | 592,308 | 1,486,154 | — | 890,922 | 108,394 | 3,077,778 | |||||||
Executive Vice President— | 2022 | 500,000 | 1,029,231 | — | 647,442 | 64,930 | 2,241,603 | |||||||
Single-Family | ||||||||||||||
Anthony Moon | 2023 | 500,000 | 1,460,000 | 1,575,000 | 840,144 | 65,551 | 4,440,695 | |||||||
Executive Vice President | ||||||||||||||
and Chief Risk Officer | ||||||||||||||
(1)Amounts shown in this sub-column consist of base salary paid during the year on a biweekly basis.
(2)Amounts shown in this sub-column consist of the fixed, service-based portion of deferred salary. Unlike at-risk
deferred salary, which is shown in the “Non-Equity Incentive Plan Compensation” column, the fixed deferred salary
shown in this column for 2023 generally will be paid in installments in March, June, September and December of
2024. Deferred salary accrues interest at one-half of the one-year Treasury Bill rate in effect on the last business day
preceding the year in which the deferred salary is earned. For deferred salary earned in 2023, this rate is 2.365% per
year. For deferred salary earned in 2022 and 2021, this rate was 0.195% and 0.050% per year, respectively. Interest
payable on the named executives’ fixed deferred salary earned in a given year is shown in the “All Other
Compensation” column for that year. Fixed deferred salary shown for 2022 was paid to our named executives during
2023, and fixed deferred salary shown for 2021 was paid to our named executives during 2022.
(3)The amount in this column consists of payments to Mr. Moon in 2023 pursuant to the sign-on award he received
when he joined Fannie Mae. Mr. Moon’s award does not constitute a bonus under the STOCK Act as defined by
FHFA. Mr. Moon received a first installment pursuant to this award, in the amount of $1,050,000, in January 2023
and a second installment, in the amount of $525,000, in December 2023. See “Compensation Discussion and
Analysis—Elements of 2023 Executive Compensation Program—Sign-on Awards and Relocation Benefits” for more
information on the terms of Mr. Moon’s award.
Executive Compensation | Compensation Risk Assessment | ||
Fannie Mae 2023 Form 10-K | 193 |
(4)Amounts shown in this column consist of the performance-based at-risk portion of deferred salary earned during the
year and interest payable on that deferred salary. At-risk deferred salary shown for 2023 generally will be paid in
installments in March, June, September and December of 2025. Half of at-risk deferred salary shown for 2022 was
paid to our named executives during 2023, with the remaining half scheduled to be paid in 2024. At-risk deferred
salary shown for 2021 was paid to our named executives during 2022. The table below provides more detail on the
2023 at-risk deferred salary awarded to our named executives.
Performance-Based At-Risk Deferred Salary | ||||||||
Name | 2023 Corporate Performance-Based At-Risk Deferred Salary | 2023 Individual Performance-Based At-Risk Deferred Salary | Interest Payable on 2023 At-Risk Deferred Salary | Total | ||||
Priscilla Almodovar | $— | $— | $— | $— | ||||
Chryssa Halley | 405,300 | 445,385 | 40,237 | 890,922 | ||||
David Benson | 600,600 | 660,000 | 59,626 | 1,320,226 | ||||
H. Malloy Evans | 405,300 | 445,385 | 40,237 | 890,922 | ||||
Anthony Moon | 382,200 | 420,000 | 37,944 | 840,144 | ||||
(5)The table below provides more detail on the amounts reported for 2023 in the “All Other Compensation” column.
All Other Compensation | ||||||||||||
Name | Company Contributions to Retirement Savings (401(k)) Plan | Company Credits to Supplemental Retirement Savings Plan | Matching Charitable Award Program | Interest Payable on 2023 Fixed Deferred Salary | Other | Total | ||||||
Priscilla Almodovar | $26,400 | $21,600 | $— | $— | $46,467 | $94,467 | ||||||
Chryssa Halley | 26,400 | 50,985 | — | 35,148 | — | 112,533 | ||||||
David Benson | 26,400 | 57,600 | 750 | 58,652 | — | 143,402 | ||||||
H. Malloy Evans | 26,400 | 50,985 | 5,000 | 26,009 | — | 108,394 | ||||||
Anthony Moon | 26,400 | 13,600 | — | 25,551 | — | 65,551 | ||||||
See “Pension Benefits” for the vesting provisions for company contributions to the Retirement Savings Plan and
“Nonqualified Deferred Compensation” for the vesting provisions for company credits to the Supplemental
Retirement Savings Plan.
Amounts shown in the “Matching Charitable Award Program” column consist of gifts we made on behalf of our
named executives under our matching charitable gifts program, under which gifts made by our employees and
directors to Internal Revenue Code Section 501(c)(3) charities were matched, up to an aggregate total of $5,000 for
the 2023 calendar year.
The amount shown in the “Other” column consists of our incremental costs for providing relocation benefits and
secure transportation services to Ms. Almodovar in 2023. Relocation costs were provided for temporary lodging and
related expenses in Washington, DC, in connection with her hire. To enhance her safety and security, we provide the
services of a car and executive protection driver to Ms. Almodovar, pursuant to the recommendation of a third-party
security study. We also provide internet surveillance services to Ms. Almodovar, for which we incurred no incremental
costs.
Executive Compensation | Compensation Tables and Other Information | ||
Fannie Mae 2023 Form 10-K | 194 |
Plan-Based Awards
The following table shows the annual at-risk deferred salary targets for each of the named executives for 2023. The
terms of 2023 at-risk deferred salary are described in “Compensation Discussion and Analysis—Elements of 2023
Executive Compensation Program—Direct Compensation.” Deferred salary amounts shown represent only the target
performance-based at-risk portion of the named executives’ 2023 deferred salary.
Grants of Plan-Based Awards in 2023 | ||||||||
Estimated Future Payouts Under Non-Equity Incentive Plan Awards(1) | ||||||||
Name | Award Type | Threshold | Target | Maximum | ||||
Priscilla Almodovar | At-risk deferred salary—Corporate | $— | $— | $— | ||||
At-risk deferred salary—Individual | — | — | — | |||||
Total at-risk deferred salary | — | — | — | |||||
Chryssa Halley | At-risk deferred salary—Corporate | — | 445,384 | 445,384 | ||||
At-risk deferred salary—Individual | — | 445,385 | 445,385 | |||||
Total at-risk deferred salary | — | 890,769 | 890,769 | |||||
David Benson | At-risk deferred salary—Corporate | — | 660,000 | 660,000 | ||||
At-risk deferred salary—Individual | — | 660,000 | 660,000 | |||||
Total at-risk deferred salary | — | 1,320,000 | 1,320,000 | |||||
H. Malloy Evans | At-risk deferred salary—Corporate | — | 445,384 | 445,384 | ||||
At-risk deferred salary—Individual | — | 445,385 | 445,385 | |||||
Total at-risk deferred salary | — | 890,769 | 890,769 | |||||
Anthony Moon | At-risk deferred salary—Corporate | — | 420,000 | 420,000 | ||||
At-risk deferred salary—Individual | — | 420,000 | 420,000 | |||||
Total at-risk deferred salary | — | 840,000 | 840,000 | |||||
(1)Amounts shown are the target amounts of the performance-based at-risk portion of the named executives’ 2023
deferred salary. Half of 2023 at-risk deferred salary was subject to reduction based on corporate performance
against the 2023 scorecard, as determined by FHFA, and half was subject to reduction based on individual
performance in 2023, taking into account corporate performance against the 2023 Board of Directors’ goals, as
determined by the Board of Directors with FHFA’s review. No amounts are shown in the “Threshold” column because
deferred salary does not specify a minimum amount payable. The amounts shown in the “Maximum” column are the
same as the amounts shown in the “Target” column because 2023 at-risk deferred salary was only subject to
reduction; amounts higher than the target amount could not be awarded. The actual amounts of the at-risk portion of
2023 deferred salary that will be paid to the named executives for 2023 performance are included in the “Non-Equity
Incentive Plan Compensation” column of the “Summary Compensation Table.”
Pension Benefits
Retirement Savings Plan
The Retirement Savings Plan is a tax-qualified defined contribution plan for which all of our employees are generally
eligible that includes a 401(k) before-tax feature, a regular after-tax feature and a Roth after-tax feature. Under the plan,
eligible employees may allocate investment balances to a variety of investment options.
We match in cash employee contributions to the plan up to 6% of base salary and eligible incentive compensation,
subject to applicable IRS limits. This matching contribution is immediately vested. We also make a cash contribution to
the plan equal to 2% of base salary and eligible incentive compensation, subject to applicable IRS limits. Participants
are fully vested in this 2% contribution after three years of service.
Executive Compensation | Compensation Tables and Other Information | ||
Fannie Mae 2023 Form 10-K | 195 |
Nonqualified Deferred Compensation
Supplemental Retirement Savings Plan
We provide nonqualified deferred compensation to the named executives pursuant to our Supplemental Retirement
Savings Plan. Our Supplemental Retirement Savings Plan is an unfunded, non-tax-qualified defined contribution plan.
The Supplemental Retirement Savings Plan is intended to supplement our Retirement Savings Plan, or 401(k) plan, by
providing benefits to participants whose eligible earnings exceed the IRS annual limit on eligible compensation for
401(k) plans (for 2023, the annual eligible earnings limit was $330,000).
For the 2023 plan year, we credited 8% of the eligible compensation for our named executives that exceeded the
applicable IRS annual limit. Eligible compensation in any year consists of base salary plus any eligible incentive
compensation (which includes deferred salary) earned for that year, up to a combined maximum of two times base
salary. The 8% credit consists of two parts: (1) a 2% credit that vests after the participant has completed three years of
service with us; and (2) a 6% credit that is immediately vested.
While the Supplemental Retirement Savings Plan is not funded, amounts credited on behalf of a participant under the
Supplemental Retirement Savings Plan are deemed to be invested in mutual fund investments selected by the
participant that are similar to the investments offered under our Retirement Savings Plan.
Amounts deferred under the Supplemental Retirement Savings Plan are payable to participants in the January or July
following separation from service with us, subject to a six-month delay in payment for our 50 most highly compensated
officers. Participants generally may not withdraw amounts from the Supplemental Retirement Savings Plan while they
are employees.
The table below provides information on the nonqualified deferred compensation of the named executives in 2023, all of
which was provided pursuant to our Supplemental Retirement Savings Plan.
Non-Qualified Deferred Compensation for 2023 | ||||||
Name | Company Contributions in 2023(1) | Aggregate Earnings in 2023(2) | Aggregate Balance at December 31, 2023(3) | |||
Priscilla Almodovar | $21,600 | $1,350 | $22,950 | |||
Chryssa Halley | 50,985 | 104,947 | 788,817 | |||
David Benson | 57,600 | 50,777 | 967,100 | |||
H. Malloy Evans | 50,985 | 135,406 | 738,556 | |||
Anthony Moon | 13,600 | 857 | 14,457 | |||
(1)All amounts reported in this column are also reported as 2023 compensation in the “All Other Compensation” column
of the “Summary Compensation Table.”
(2)None of the earnings reported in this column are reported as 2023 compensation in the “Summary Compensation
Table” because the earnings are neither above-market nor preferential.
(3)Amounts reported in this column reflect company contributions to the Supplemental Retirement Savings Plan that
are also reported in the “All Other Compensation” column of the “Summary Compensation Table” as follows:
Balance Amounts Reported in “All Other Compensation” in the Summary Compensation Table | |||||
Name | Amounts in Aggregate Balance Column that Represent Company Contributions Reported as Compensation for 2022 in the Summary Compensation Table | Amounts in Aggregate Balance Column that Represent Company Contributions Reported as Compensation for 2021 in the Summary Compensation Table | |||
Priscilla Almodovar | $— | $— | |||
Chryssa Halley | 38,100 | 45,139 | |||
David Benson | 53,700 | 68,446 | |||
H. Malloy Evans | 39,623 | — | |||
Anthony Moon | — | — | |||
Executive Compensation | Compensation Tables and Other Information | ||
Fannie Mae 2023 Form 10-K | 196 |
Potential Payments Upon Termination or Change-in-Control
The information below describes and quantifies certain compensation and benefits that would have become payable to
each of our current named executives under our existing plans and arrangements if the named executive’s employment
had terminated on December 31, 2023 under each of the circumstances described below, taking into account the
named executive’s compensation and service levels as of that date. The discussion below does not reflect retirement or
deferred compensation plan benefits to which our named executives may be entitled, as these benefits are described
above under “Pension Benefits” and “Nonqualified Deferred Compensation.” The information below also does not
generally reflect compensation and benefits available to all salaried employees upon termination of employment with us
under similar circumstances. We are not obligated to provide any additional compensation to our named executives in
connection with a change-in-control.
Potential Payments to Named Executives
We have not entered into agreements with any of our named executives that would entitle the executive to severance
benefits. If a named executive’s employment terminated for any reason other than for cause, the named executive
would be entitled to receive a specified portion of their unpaid deferred salary that was earned in 2022 and 2023.
Below we discuss various elements of the current named executives’ compensation that would become payable in the
event a named executive dies, resigns, retires, terminates employment due to long-term disability, or the company
terminates their employment. We then quantify the amounts that would be paid to our named executives in these
circumstances, in each case assuming the triggering event occurred on December 31, 2023. Named executives’
deferred salary may also be subject to reduction, forfeiture, recoupment, or repayment in the event of a forfeiture event
under our Compensation Recoupment Policy or a violation of our Covered Employee External Employment Activities
Standard, as described in “Compensation Discussion and Analysis—Compensation Recoupment Policies.”
•Deferred salary
◦Termination other than for cause. If a named executive is separated from employment with the company for
any reason other than termination for cause, they would receive the following:
▪Fixed deferred salary. The earned but unpaid portion of their fixed deferred salary, reduced by 2% for
each full or partial month by which the named executive’s termination precedes January 31 of the
second year following the performance year (or, if later, the end of the twenty-fourth month following
the month in which the named executive first earned deferred salary), except that the reduction will
not apply if: (1) at the time of separation the named executive has reached age 62, or age 55 with ten
years of service with Fannie Mae, or (2) the named executive’s employment terminates as a result of
death or long-term disability.
▪At-risk deferred salary. The earned but unpaid portion of their at-risk deferred salary, subject to
reduction from the target level for corporate and individual performance for the applicable
performance year, except that the reduction will not apply if an officer’s employment terminates as a
result of death or long-term disability prior to the Board of Directors’ and FHFA’s determinations of
performance for at-risk deferred salary.
▪Interest on deferred salary. Interest on deferred salary payments. Deferred salary accrues interest at
one-half of the one-year Treasury Bill rate in effect on the last business day preceding the year in
which the deferred salary is earned.
▪Payment dates. Installment payments of deferred salary and related interest would be made on the
original payment schedule, except that payments will be made within 90 days in case of the named
executive’s death.
◦Termination for cause. If we terminate a named executive’s employment for cause, the named executive
would not receive any of the earned but unpaid portion of their deferred salary. The named executive’s
employment will be considered to have been terminated for cause if we determine that the executive has:
(a) materially harmed the company by, in connection with the performance of their duties for Fannie Mae,
engaging in gross misconduct or performing their duties in a grossly negligent manner; or (b) been convicted
of, or pleaded nolo contendere with respect to, a felony.
•Retiree medical benefits. We currently make certain retiree medical benefits available to our full-time employees
who meet certain age and service requirements at the time of retirement.
Executive Compensation | Compensation Tables and Other Information | ||
Fannie Mae 2023 Form 10-K | 197 |
The table below shows the amounts that would have become payable to each of our current named executives if their
employment had terminated on December 31, 2023 for the reasons specified. No amounts are shown for Ms.
Almodovar, as she did not receive deferred salary.
Potential Payments Upon Termination as of December 31, 2023 | ||||||||||||
Name | 2023 Fixed Deferred Salary(1) | 2023 At-Risk Deferred Salary(2) | Interest on 2023 Deferred Salary(3) | Remaining Unpaid 2022 At-Risk Deferred Salary(4) | Interest on Remaining Unpaid 2022 At-Risk Deferred Salary(5) | |||||||
Priscilla Almodovar | ||||||||||||
Resignation, retirement, or termination without cause | $— | $— | $— | $— | $— | |||||||
Long-term disability | — | — | — | — | — | |||||||
Death | — | — | — | — | — | |||||||
Termination for cause | — | — | — | — | — | |||||||
Chryssa Halley | ||||||||||||
Resignation, retirement, or termination without cause | 1,486,154 | 850,685 | 75,385 | 320,503 | 1,250 | |||||||
Long-term disability | 1,486,154 | 890,769 | 77,281 | 320,503 | 1,250 | |||||||
Death | 1,486,154 | 890,769 | 34,383 | 320,503 | 988 | |||||||
Termination for cause | — | — | — | — | — | |||||||
David Benson | ||||||||||||
Resignation, retirement, or termination without cause | 2,480,000 | 1,260,600 | 118,278 | 591,000 | 2,306 | |||||||
Long-term disability | 2,480,000 | 1,320,000 | 121,088 | 591,000 | 2,306 | |||||||
Death | 2,480,000 | 1,320,000 | 55,305 | 591,000 | 1,845 | |||||||
Termination for cause | — | — | — | — | — | |||||||
H. Malloy Evans | ||||||||||||
Resignation, retirement, or termination without cause | 1,099,754 | 850,685 | 66,247 | 322,777 | 1,259 | |||||||
Long-term disability | 1,486,154 | 890,769 | 77,281 | 322,777 | 1,259 | |||||||
Death | 1,486,154 | 890,769 | 34,383 | 322,777 | 995 | |||||||
Termination for cause | — | — | — | — | — | |||||||
Anthony Moon | ||||||||||||
Resignation, retirement, or termination without cause | 1,080,400 | 802,200 | 63,496 | 63,646 | 248 | |||||||
Long-term disability | 1,460,000 | 840,000 | 74,261 | 63,646 | 248 | |||||||
Death | 1,460,000 | 840,000 | 33,474 | 63,646 | 155 | |||||||
Termination for cause | — | — | — | — | — | |||||||
(1)In the case of resignation, retirement or termination without cause, Mr. Evans and Mr. Moon each would have
received 74% of their 2023 fixed deferred salary, which is the earned but unpaid portion of their 2023 fixed deferred
salary as of December 31, 2023, reduced by 2% for each full or partial month by which their separation from
employment preceded January 31, 2025. Ms. Halley and Mr. Benson each would have received 100% of their 2023
fixed deferred salary, with no reduction, because each had reached age 55 with ten years of service with Fannie
Mae.
(2)The amounts in this column in the event of resignation, retirement, or termination without cause reflect the corporate
and individual performance determinations affecting 2023 at-risk deferred salary. The amounts in this column in the
event of a termination due to death or long-term disability do not reflect any performance-based reduction, because
the hypothetical December 31, 2023 termination date occurred prior to the performance determinations for at-risk
deferred salary in early 2024.
(3)Interest payable on the payments of 2023 deferred salary, which reflects that: (a) in the event of resignation,
retirement, termination without cause, or long-term disability, installment payments of 2023 deferred salary would be
Executive Compensation | Compensation Tables and Other Information | ||
Fannie Mae 2023 Form 10-K | 198 |
paid on the original payment schedule, as described in “Compensation Discussion and Analysis—Elements of 2023
Executive Compensation Program; and (b) in the event of death, payments of deferred salary would be made within
90 days of the executive’s death. Interest on 2023 deferred salary payments accrues at an annual rate of 2.365%.
(4)At-risk deferred salary earned in 2022 is paid in quarterly installments over 2023 and 2024 for Ms. Halley, Mr.
Benson, and Mr. Evans, and in a single installment entirely in the fourth quarter of 2024 for Mr. Moon, who joined
Fannie Mae in December 2022. The amounts in this column reflect the portion of 2022 at-risk deferred salary that
was earned but remained unpaid as of December 31, 2023 and, accordingly, reflects the corporate and individual
performance determinations made in early 2023.
(5)Interest payable on the payments of 2022 deferred salary, which reflects that: (a) in the event of resignation,
retirement, termination without cause, or long-term disability, installment payments of deferred salary would be paid
on the original payment schedule; and (b) in the event of death, payments of deferred salary would be made within
90 days of the executive’s death. Interest on 2022 deferred salary payments accrues at an annual rate of 0.195%.
Chief Executive Officer to Median Employee Pay Ratio
The following table shows the compensation paid to our Chief Executive Officer for 2023, the total 2023 compensation
of our median employee (which was calculated based on the methodology described below the table), and the
estimated ratio of the Chief Executive Officer’s pay to the median employee’s pay for 2023.
2023 Chief Executive Officer to Median Employee Pay Ratio | ||||
Individual | Compensation | Ratio | ||
Chief Executive Officer | $694,467 | 3.9 to 1 | ||
Median Employee | 178,735 | |||
We took the following steps to identify our median employee and determine this employee’s compensation:
•We identified our employee population as of the last day of our final pay period in 2023, December 30, 2023.
On that date, we had approximately 8,100 full-time and part-time employees.
•In order to identify the median employee, we considered for each employee other than our Chief Executive
Officer the sum of their salary for 2023 (including any overtime pay), performance awards paid in 2023 and the
value of company contributions made in 2023 on their behalf to retirement plans. We did not annualize the
compensation of employees who were employed for less than the full year, nor did we make any full-time
equivalent adjustments to part-time employees. For employees whose sum fell at or close to the midpoint, we
considered their 2023 benefits and awards and other relevant factors and identified an employee whose
compensation best reflected Fannie Mae employees’ median 2023 compensation.
•We then determined that median employee’s total 2023 compensation using the approach required by the SEC
when calculating our named executives’ compensation, as reported in the Summary Compensation Table.
In general, we offer employees salary, the opportunity to receive awards for performance, company retirement plan
contributions and other benefits. In accordance with SEC rules, the median employee compensation amount for 2023
provided in the table above consists of salary, an award for 2023 performance and company retirement plan
contributions, but does not reflect benefits relating to group life or health plans generally available to all salaried
employees, parking or transit benefits that are generally available to all salaried employees, or personal benefits with an
aggregate value of less than $10,000.
Given the different methodologies that companies may use to determine their Chief Executive Officer pay ratios, the
estimated ratio we report above may not be comparable to that reported by other companies.
Director Compensation
Overview
FHFA’s Corporate Governance regulations provide that we may pay Board members reasonable and appropriate
compensation for the time required of them, and their necessary and reasonable expenses, in the performance of their
duties. Our non-management directors receive cash compensation pursuant to a program authorized by FHFA in 2008.
The compensation we provide to directors has not increased since this program was implemented in 2008.
Ms. Almodovar served on our Board of Directors in 2023 in connection with her service as Chief Executive Officer. We
did not provide her any additional compensation for her service on the Board of Directors.
Executive Compensation | Compensation Tables and Other Information | ||
Fannie Mae 2023 Form 10-K | 199 |
Board Compensation Levels
Board compensation levels under the program authorized by FHFA are shown in the table below. Our directors receive
no equity compensation and no meeting fees.
Board Compensation Levels | ||
Board Service | Cash Compensation | |
Annual retainer for non-executive Chair | $290,000 | |
Annual retainer for non-management directors (other than the non-executive Chair) | 160,000 | |
Committee Service | Cash Compensation | |
Annual retainer for Audit Committee Chair | $25,000 | |
Annual retainer for Risk Policy and Capital Committee Chair | 15,000 | |
Annual retainer for all other Committee Chairs | 10,000 | |
Annual retainer for Audit Committee members (other than the Audit Committee Chair) | 10,000 | |
Additional Arrangements with our Non-Management Directors
Expenses. We pay for or reimburse directors for out-of-pocket expenses incurred in connection with their service on the
Board of Directors, including travel to and from our meetings, accommodations, meals and education.
Matching Charitable Gifts Program. To further our support for charitable giving, non-employee directors are able to
participate in our corporate matching gifts program on the same terms as our employees.
Stock Ownership Guidelines for Directors. In 2009, our Board of Directors eliminated our stock ownership requirements
for directors.
2023 Non-Management Director Compensation
The total 2023 compensation for our non-management directors is shown in the table below.
2023 Non-Management Director Compensation Table | ||||||
Name | Fees Earned or Paid in Cash | All Other Compensation(1) | Total | |||
Amy Alving | $175,000 | $— | $175,000 | |||
Christopher Brummer | 160,000 | — | 160,000 | |||
Renée Glover | 173,333 | — | 173,333 | |||
Michael Heid | 290,000 | — | 290,000 | |||
Robert Herz | 185,000 | 500 | 185,500 | |||
Simon Johnson | 170,000 | 5,000 | 175,000 | |||
Karin Kimbrough | 170,000 | — | 170,000 | |||
Diane Nordin | 180,000 | 5,000 | 185,000 | |||
Chet Ragavan(2) | 80,000 | — | 80,000 | |||
Manolo Sánchez | 160,000 | — | 160,000 | |||
Michael Seelig(3) | 127,500 | 1,500 | 129,000 | |||
(1)Amounts shown in the “All Other Compensation” column consist of gifts we made on behalf of the directors under our
matching charitable gifts program, under which gifts made by our employees and directors to Internal Revenue Code
Section 501(c)(3) charities were matched, up to an aggregate total of $5,000 for the 2023 calendar year.
(2)Mr. Ragavan joined Fannie Mae’s Board of Directors in June 2023.
(3)Mr. Seelig joined Fannie Mae’s Board of Directors in March 2023.
Executive Compensation | Compensation Tables and Other Information | ||
Fannie Mae 2023 Form 10-K | 200 |
Item 12. Security Ownership of Certain Beneficial Owners and
Management and Related Stockholder Matters
Beneficial Ownership
Stock Ownership of Directors and Executive Officers
The following table shows the beneficial ownership of our stock by each of our directors, each of our named executives,
and all directors and executive officers as a group, as of February 1, 2024. As of that date, no director or named
executive, nor all directors and executive officers as a group, owned as much as 1% of our outstanding common stock
or owned any series of our preferred stock.
Beneficial Ownership of Stock by Directors and Executive Officers | ||||
Directors and Named Executives | Position | Number of Shares of Common Stock Beneficially Owned(1) | ||
Amy Alving | Director | 0 | ||
Christopher Brummer | Director | 0 | ||
Renée Glover | Director | 0 | ||
Michael Heid | Director (Board Chair) | 0 | ||
Robert Herz | Director | 0 | ||
Simon Johnson | Director | 0 | ||
Karin Kimbrough | Director | 0 | ||
Diane Nordin | Director | 0 | ||
Chet Ragavan | Director | 0 | ||
Manolo Sánchez | Director | 0 | ||
Michael Seelig | Director | 0 | ||
Priscilla Almodovar | Chief Executive Officer and Director | 0 | ||
Chryssa Halley | EVP and Chief Financial Officer | 0 | ||
David Benson | President | 0 | ||
Malloy Evans | EVP—Single-Family | 0 | ||
Anthony Moon | EVP and Chief Risk Officer | 0 | ||
All directors and executive officers as a group (19 persons)(2) | 29,146 | |||
(1)Beneficial ownership is determined in accordance with the rules of the SEC for computing the number of shares of
common stock beneficially owned by each person and the percentage owned. Each holder has sole investment and
voting power over the shares referenced in this table, except for 9,146 shares for which one executive officer shares
investment and voting power with their spouse. None of our directors, named executives or other executive officers
held any series of our preferred stock as of the date of this table.
(2) Group includes directors and current executive officers.
Security Ownership of Certain Beneficial Owners and Management and Related Stockholder Matters | Beneficial Ownership | ||
Fannie Mae 2023 Form 10-K | 201 |
Stock Ownership of Greater-Than 5% Holders
The following table shows the beneficial ownership of our common stock by the only persons or entities we know of that
hold more than 5% of our common stock as of February 1, 2024.
Beneficial Ownership of Stock by 5%+ Holders | ||||
5%+ Holders | Common Stock Beneficially Owned | Percent of Class | ||
U.S. Department of the Treasury | Variable(1) | 79.9% | ||
1500 Pennsylvania Avenue, NW, Washington, DC 20220 | ||||
Pershing Square Capital Management, L.P. PS Management GP, LLC William A. Ackman | 115,569,796(2) | 9.98% | ||
787 Eleventh Avenue, 9th Floor, New York, New York 10019 | ||||
(1)In September 2008, we issued to Treasury a warrant to purchase, for one one-thousandth of a cent ($0.00001) per
share, shares of our common stock equal to 79.9% of the total number of shares of our common stock outstanding
on a fully diluted basis at the time the warrant is exercised. The warrant may be exercised in whole or in part at any
time until September 7, 2028. As of February 15, 2024, Treasury has not exercised the warrant. The information
above assumes Treasury beneficially owns no other shares of our common stock.
(2)Information regarding these shares and the ownership interests of their holders is based solely on information
contained in a Schedule 13D filed with the SEC on November 15, 2013, as amended by an amendment to the
Schedule 13D filed on March 31, 2014. The Schedule 13D and its amendment were filed by these holders as well as
by Pershing Square GP, LLC. According to the original Schedule 13D, Pershing Square Capital Management, L.P.,
as investment adviser for a number of funds for which it purchased the shares reported in the table above, and PS
Management GP, LLC, its general partner, may be deemed to share voting and dispositive power for the shares.
Pershing Square GP, LLC, as general partner of two of the funds, may be deemed to share voting and dispositive
power for 40,114,044 of the shares reported in the table above, which are held by the two funds. As the Chief
Executive Officer of Pershing Square Capital Management, L.P. and managing member of each of PS Management
GP, LLC and Pershing Square GP, LLC, William A. Ackman may be deemed to share voting and dispositive power
for all of the shares reported in the table above. In the amendment, the parties further reported that certain of them
had entered into swap transactions resulting in their having additional economic exposure to approximately
15,434,715 notional shares of common stock under certain cash-settled total return swaps, bringing their total
aggregate economic exposure to 131,004,511 shares of common stock (approximately 11.31% of the outstanding
common stock). In the amendment to the Schedule 13D, these parties indicated that they would forgo future
reporting on Schedule 13D based on their determination that shares of the common stock are not voting securities
as such term is used in Rule 13d-1(i) under the Exchange Act. As a result, the information in the table above does
not reflect any acquisitions or dispositions by these holders of Fannie Mae common stock that occurred after March
31, 2014.
Equity Compensation Plan Information
As of December 31, 2023, we had no outstanding options, warrants or rights under any equity compensation plan.
Although we have a legacy equity compensation plan that was previously approved by stockholders, our 1985
Employee Stock Purchase Plan, we do not anticipate issuing additional shares under that plan. Moreover, we are
prohibited from issuing any stock or other equity securities as compensation without the approval of FHFA and the prior
written consent of Treasury under the senior preferred stock purchase agreement, except under limited circumstances.
Item 13. Certain Relationships and Related Transactions, and
Director Independence
Policies and Procedures Relating to Transactions with Related
Persons
Overview. We review transactions in which Fannie Mae is a participant and in which any of our directors or executive
officers or their immediate family members may have a material interest to determine whether any of those persons has
a material interest in the transaction. Our current written policies and procedures for the review, approval or ratification
Security Ownership of Certain Beneficial Owners and Management and Related Stockholder Matters | Beneficial Ownership | ||
Fannie Mae 2023 Form 10-K | 202 |
of transactions with related persons that are required to be reported under Item 404(a) of Regulation S-K are set forth in
our:
•Director Code of Conduct;
•Corporate Governance Guidelines;
•Nominating and Corporate Governance Committee Charter;
•Board of Directors’ delegation of authorities and reservation of powers;
•Employee Code of Conduct; and
•Oversight of Designated Executive Officers’ Conflicts of Interest and Business Courtesies Matters Policy.
In addition, depending on the circumstances, relationships and transactions with related persons may require
conservator decision pursuant to the instructions issued to the Board of Directors by the conservator or may require the
consent of Treasury pursuant to the senior preferred stock purchase agreement.
Director Code of Conduct. Our Director Code of Conduct prohibits our directors from engaging in any conduct or
activity that is inconsistent with our best interests, as defined by the conservator’s express directions, its policies and
applicable law. Our Director Code of Conduct requires our directors to excuse themselves from voting on any issue
before the Board that could result in a conflict, self-dealing or other circumstance where their position as directors would
be detrimental to us or result in a noncompetitive, favored or unfair advantage to either themselves or their associates.
In addition, our directors must disclose any situation that involves or appears to involve a conflict of interest to the Chair
of the Nominating and Corporate Governance Committee or another member of the Committee or, for any director who
serves as an officer of Fannie Mae, to Fannie Mae’s Chief Compliance Officer or their designee. This includes, for
example, a financial interest of a director, an immediate family member of a director or a business associate of a
director in any transaction being considered by the Board, as well as a financial interest a director has in an organization
doing business with us. Our directors also are required to comply with the company’s procedures for the review,
approval, or ratification of related person transactions. Each of our directors also must annually certify compliance with
our Director Code of Conduct.
Corporate Governance Guidelines; Board Delegation of Authorities and Reservation of Powers. Our Corporate
Governance Guidelines provide that our Board of Directors, directly or through its committees, reviews and approves
any action that in the reasonable business judgment of management at the time the action is taken is likely to cause
significant reputational risk to Fannie Mae or result in substantial negative publicity. Our Board’s delegation of authorities
and reservation of powers similarly requires Board or Board committee approval for these actions. Depending on
management’s business judgment, this requirement might include a related party transaction.
Nominating and Corporate Governance Committee Charter; Board Delegation of Authorities and Reservation of
Powers. The Nominating and Corporate Governance Committee Charter and our Board’s delegation of authorities and
reservation of powers require the Nominating and Corporate Governance Committee to approve or conduct a
reasonable prior review and oversight of transactions with any director, nominee for director or executive officer, or any
immediate family member of a director, nominee for director or executive officer, that are required to be disclosed
pursuant to Item 404 of Regulation S-K.
Employee Code of Conduct. Our Employee Code of Conduct requires that our employees seek to avoid any actual or
apparent conflicts between our business interests and the personal interests, activities and relationships of our
employees, or that could expose the company to reputational risk. Our Employee Code of Conduct requires our
employees to raise compliance or ethics concerns, including concerns relating to suspected or known violations of our
Employee Code of Conduct, with any people manager or officer of the company, a member of our Human Resources
division or our Compliance and Ethics division.
Designated Executive Officer Conflicts Policy. Our Oversight of Designated Executive Officers’ Conflicts of Interest
and Business Courtesies Matters Policy (“Designated Executive Officer Conflicts Policy”) requires that our executive
officers report to the Compliance and Ethics division any transaction with us in which the executive officer or any
immediate family member of the executive officer has a direct or indirect interest, including any transaction that is
required to be disclosed under Item 404(a) of Regulation S-K. The Designated Executive Officer Conflicts Policy
provides that the Compliance and Ethics division will notify Legal department personnel with responsibility for the
company’s periodic SEC filings as soon as possible of any such disclosure by an executive officer and work with Legal
department personnel to ensure reporting of such transaction occurs if determined necessary or appropriate. The
Designated Executive Officer Conflicts Policy also provides that, if the Compliance and Ethics division has determined
the reported transaction poses a conflict or if the reported transaction involves the CEO, the division will submit its initial
determination and any recommended mitigation activities regarding such transaction to the Nominating and Corporate
Governance Committee to approve, deny or further condition.
Certain Relationships and Related Transactions, and Director Independence | Policies and Procedures Relating to Transactions with Related Persons | ||
Fannie Mae 2023 Form 10-K | 203 |
Conservator Instructions. We are required by the conservator to obtain its decision for various matters, some of which
may involve relationships or transactions with related persons. These matters include: actions requiring the consent of
or consultation with Treasury under the senior preferred stock purchase agreement; the creation of any subsidiary or
affiliate, or entering into a substantial transaction with a subsidiary or affiliate, except for routine ongoing transactions
with CSS or the creation of, or a transaction with, a subsidiary or affiliate undertaken in the ordinary course of business;
changes in employee compensation that could significantly impact our employees; new compensation arrangements
with or increases in compensation or benefits for our executive officers; setting or increasing the compensation or
benefits payable to members of the Board; and changes in our business operations, activities, and transactions that in
the reasonable business judgment of management are more likely than not to result in a significant increase in credit,
market, reputational, operational or other key risks.
Senior Preferred Stock Purchase Agreement. The senior preferred stock purchase agreement requires us to obtain
written Treasury approval of transactions with affiliates unless, among other things, the transaction is upon terms no
less favorable to us than would be obtained in a comparable arm’s-length transaction with a non-affiliate or the
transaction is undertaken in the ordinary course or pursuant to a contractual obligation or customary employment
arrangement in existence at the time the senior preferred stock purchase agreement was entered into.
Director and Officer Disclosures. We require our directors and executive officers, not less than annually, to describe
to us any transaction with us in which a director or executive officer could potentially have an interest that would require
disclosure under Item 404 of Regulation S-K.
Transactions with Related Persons
Transactions with Treasury
Treasury beneficially owns more than 5% of the outstanding shares of our common stock by virtue of the warrant we
issued to Treasury on September 7, 2008. The warrant entitles Treasury to purchase shares of our common stock equal
to 79.9% of our outstanding common stock on a fully diluted basis on the date of exercise, for an exercise price of
$0.00001 per share, and is exercisable in whole or in part at any time on or before September 7, 2028. We describe
below our current agreements with Treasury, as well as payments we are making to Treasury pursuant to the Temporary
Payroll Tax Cut Continuation Act of 2011, the Infrastructure Investment and Jobs Act and the GSE Act.
FHFA, as conservator, approved the senior preferred stock purchase agreement, the amendments to the agreement
and the letter agreements relating to the agreement and the senior preferred stock. FHFA, as conservator, also
approved our role as program administrator for the Home Affordable Modification Program and other initiatives under
the Making Home Affordable Program.
Treasury Senior Preferred Stock Purchase Agreement and Senior Preferred Stock
We issued the warrant to Treasury pursuant to the terms of the senior preferred stock purchase agreement we entered
into with Treasury in September 2008. Under the senior preferred stock purchase agreement, we also issued to
Treasury one million shares of senior preferred stock. We issued the warrant and the senior preferred stock as an initial
commitment fee in consideration of Treasury’s commitment to provide funds to us under the terms and conditions set
forth in the senior preferred stock purchase agreement. The senior preferred stock purchase agreement was
subsequently amended in September 2008, May 2009, December 2009 and August 2012. We, through FHFA, in its
capacity as conservator, and Treasury entered into letter agreements modifying the terms of the senior preferred stock
purchase agreement and the senior preferred stock in December 2017, September 2019 and January 2021. In addition,
we, through FHFA, in its capacity as conservator, and Treasury entered into a letter agreement in September 2021 that
temporarily suspended some of the provisions added to the senior preferred stock purchase agreement pursuant to the
January 2021 letter agreement. See “Business—Conservatorship and Treasury Agreements—Treasury Agreements” for
a description of the terms, as amended, of the senior preferred stock purchase agreement, the senior preferred stock
and the warrant.
As of December 31, 2023, we had received an aggregate of $119.8 billion from Treasury under the senior preferred
stock purchase agreement, none of which was received in 2023, and the remaining amount of funding available to us
under the agreement was $113.9 billion. Through December 31, 2023, we had paid an aggregate of $181.4 billion to
Treasury in dividends on the senior preferred stock, none of which was paid in 2023.
Treasury Making Home Affordable Program
In 2009, Treasury launched the Making Home Affordable Program to help struggling homeowners avoid foreclosure and
engaged us as program administrator for loans modified under the Home Affordable Modification Program, or HAMP,
and other initiatives under the Making Home Affordable Program. HAMP was aimed at helping borrowers by modifying
Certain Relationships and Related Transactions, and Director Independence | Policies and Procedures Relating to Transactions with Related Persons | ||
Fannie Mae 2023 Form 10-K | 204 |
their mortgage loan to make their payments more affordable. Under our arrangement, Treasury compensated us for a
significant portion of the work we performed in our role as program administrator for HAMP and other initiatives under
the Making Home Affordable Program. We received an aggregate of approximately $563 million from Treasury for our
work as program administrator from 2009 through 2023, as well as an additional amount of approximately $157 million
for this period to be passed through to third-party vendors engaged by us for HAMP and other initiatives under the
Making Home Affordable Program. Our role as program administrator concluded in the third quarter of 2023, and we
received our final reimbursement from Treasury in the fourth quarter of 2023.
Obligation to Pay TCCA Fees to Treasury
In December 2011, Congress enacted the Temporary Payroll Tax Cut Continuation Act of 2011 which, among other
provisions, required that we increase our single-family guaranty fees by at least 10 basis points and pay this increase to
Treasury. To meet our obligations under the TCCA and at the direction of FHFA, we increased the guaranty fee on all
single-family mortgages delivered to us by 10 basis points in April 2012. In November 2021, the Infrastructure
Investment and Jobs Act was enacted, which extended to October 1, 2032 our obligation under the TCCA to collect 10
basis points in guaranty fees on single-family mortgages delivered to us and pay the associated revenue to Treasury. In
January 2022, FHFA advised us to continue to collect and pay these TCCA fees on and after October 1, 2032 with
respect to loans we acquired before this date until those loans are paid off or otherwise liquidated. In 2023, we
recognized $3.4 billion for our obligations to Treasury under the TCCA.
Treasury Interest in Affordable Housing Allocations
The GSE Act requires us to set aside in each fiscal year an amount equal to 4.2 basis points for each dollar of the
unpaid principal balance of our total new business purchases and to pay this amount to specified HUD and Treasury
funds. New business purchases consist of single-family and multifamily whole mortgage loans purchased during the
period and single-family and multifamily mortgage loans underlying Fannie Mae MBS issued during the period pursuant
to lender swaps. In December 2014, FHFA directed us to set aside amounts for these contributions during each fiscal
year, except for any fiscal year for which a draw from Treasury was made under the terms of the senior preferred stock
purchase agreement, or in which such allocation or transfer would cause such a draw. We paid $287 million to the funds
in 2023 based on our new business purchases in 2022. Pursuant to the GSE Act and directions from FHFA, we paid
$101 million of this amount to Treasury’s Capital Magnet Fund and $186 million of this amount to HUD’s Housing Trust
Fund.
Our new business purchases were $369.2 billion for the year ended December 31, 2023. Accordingly, we recognized an
expense of $155 million related to this obligation for the year ended December 31, 2023. Of this amount, $54 million is
payable to Treasury’s Capital Magnet Fund and $101 million is payable to HUD’s Housing Trust Fund. We expect to pay
these amounts to the funds in 2024.
Director Independence
Independence Requirements
Our Corporate Governance Guidelines, in accordance with FHFA corporate governance regulations, require a majority
of Fannie Mae’s directors to be independent as defined under the rules set forth by the NYSE, as amended from time to
time. Where the NYSE rules do not address a particular relationship, the Board, based upon the recommendation of the
Nominating and Corporate Governance Committee, determines whether a relationship is material, and whether a Board
member is independent. Our Corporate Governance Guidelines also provide that an “independent board member” must
be determined to have no material relationship with us, either directly or through an organization that has a material
relationship with us. A relationship is “material” if, in the judgment of the Board, it would interfere with the Board
member’s independent judgment. Our Corporate Governance Guidelines are posted on our website,
www.fanniemae.com, under “Corporate Governance Guidelines” in the “About Us—Corporate Governance” section.
In addition, under FHFA corporate governance regulations, Board committees are required to comply with the
independence requirements set forth under NYSE rules. The NYSE’s listing standards include additional independence
criteria for members of the Audit Committee and Compensation and Human Capital Committee.
Our Board of Directors
Our Board of Directors, with the assistance of the Nominating and Corporate Governance Committee of the Board, has
reviewed the independence of all current Board members pursuant to the requirements described in “Independence
Requirements” above. Based on its review, the Board has determined that all of our current directors are independent
under these director independence requirements other than Ms. Almodovar (who is our Chief Executive Officer).
Certain Relationships and Related Transactions, and Director Independence | Transactions with Related Persons | ||
Fannie Mae 2023 Form 10-K | 205 |
In determining the independence of our current Board members other than Ms. Almodovar, the Board of Directors
considered the following relationships, transactions or arrangements and determined they were not material to the
independence of these Board members and would not interfere with the director’s independent judgment:
•Board Memberships with Business Partners. Ms. Glover, Mr. Herz, Ms. Nordin and Mr. Sánchez are or were
directors or advisory Board members of companies that engage in business with Fannie Mae or that have an
interest in one or more entities that engage in business with Fannie Mae. The Board considered that each of these
directors was solely a director or advisory board member of such company, and none of these directors served in a
management role or had ownership interests other than as incidental to their board service. The Board also
considered other relevant information including, to the extent available, information regarding payments between
these companies and Fannie Mae during the past three years.
•Board Memberships with Companies that Invest in Our Securities. Mr. Herz and Ms. Nordin serve as directors or
advisory Board members of companies that invest or may invest in Fannie Mae fixed-income securities. It is
generally not possible for Fannie Mae to determine the extent of the holdings of these companies in Fannie Mae
fixed-income securities as payments to holders are made through the Federal Reserve, and most of these
securities are held in turn by financial intermediaries. We understand that the investments by these companies in
Fannie Mae fixed-income securities are entered into at arm’s length in the ordinary course of business, upon
market terms and conditions, and are not entered into at the direction of, or upon approval by, the director in his or
her capacity as a director or advisory Board member of these companies.
•Board Memberships with Non-Profits to Which We Have Made Payments or That May Hold Our Securities.
Mr. Herz, Ms. Kimbrough and Ms. Nordin serve as Board members of non-profit organizations that have received
payments from Fannie Mae or that may hold Fannie Mae securities. The amount of payments fell substantially
below the NYSE independence standards’ thresholds of materiality for a director who is a current employee of a
company to which Fannie Mae made, or from which Fannie Mae received, payments.
•Current Employment with Business Partners. Mr. Brummer, Mr. Johnson and Ms. Kimbrough are each employed
at entities that engage in business with Fannie Mae.
◦Mr. Brummer is currently a columnist at CQ Roll Call, a provider of congressional news, legislative tracking, and
advocacy services. He is also the co-founder of a podcast that is affiliated with CQ Roll Call. Fannie Mae pays
subscription fees providing access to CQ Roll Call. The payments made by Fannie Mae to CQ Roll Call during
the past three years fall below the NYSE independence standards’ thresholds of materiality for a director who is
a current employee of a company to which Fannie Mae made, or from which Fannie Mae received, payments.
◦Mr. Brummer is a professor at Georgetown University Law Center and founder of the DC Fintech Week
conference, which in 2023 was co-hosted by Georgetown University Law Center’s Institute of International
Economic Law and Fannie Mae, among others. The payments made by Fannie Mae in co-hosting a portion of
the event were not made to Georgetown University Law Center or to Mr. Brummer and, had they been paid to
Georgetown Law Center, they would have fallen below the NYSE independence standards’ thresholds of
materiality for a director who is a current employee of a company to which Fannie Mae made, or from which
Fannie Mae received, payments.
◦Mr. Johnson is currently a professor at MIT and engages in work for the National Bureau of Economic
Research. Fannie Mae engages in business transactions with both of these entities. The payments made by
Fannie Mae to these entities during the past three years fall below the NYSE independence standards’
thresholds of materiality for a director who is a current employee of a company to which Fannie Mae made, or
from which Fannie Mae received, payments.
◦Ms. Kimbrough is currently an employee of LinkedIn Corporation, a subsidiary of Microsoft Corporation. Fannie
Mae engages in business transactions with LinkedIn and Microsoft. The payments made by Fannie Mae to
Microsoft during the past three years fall below the NYSE independence standards’ thresholds of materiality for
a director who is a current employee of a company to which Fannie Mae made, or from which Fannie Mae
received, payments.
The Board also determined that each member of the Audit Committee, Compensation and Human Capital Committee,
and Nominating and Corporate Governance Committee met the NYSE’s independence criteria for members of such
committees.
The Board did not consider the Board’s duties to the conservator, together with the federal government’s controlling
beneficial ownership of Fannie Mae, in determining independence of the Board members.
Ms. Almodovar is not considered an independent director under NYSE independence standards because of her position
as Chief Executive Officer.
Certain Relationships and Related Transactions, and Director Independence | Director Independence | ||
Fannie Mae 2023 Form 10-K | 206 |
Item 14. Principal Accounting Fees and Services
The Audit Committee of our Board of Directors is directly responsible for the appointment, oversight and evaluation of
our independent registered public accounting firm, subject to conservator approval of matters relating to retention and
termination. Deloitte & Touche LLP (Public Company Accounting Oversight Board ID No. 34 ) was our independent
registered public accounting firm for the years ended 2023 and 2022. Deloitte & Touche LLP has advised the Audit
Committee that they are independent accountants with respect to the company, within the meaning of standards
established by the Public Company Accounting Oversight Board and federal securities laws administered by the SEC.
The following table displays the aggregate estimated or actual fees for professional services provided by Deloitte &
Touche LLP, including audit fees.
For the Year Ended December 31, | ||||
2023 | 2022 | |||
Description of fees: | ||||
Audit fees | $39,099,000 | $38,932,500 | ||
Audit-related fees(1) | 314,800 | 315,000 | ||
Tax fees(2) | 20,000 | — | ||
All other fees(3) | 394,000 | 219,000 | ||
Total fees | $39,827,800 | $39,466,500 | ||
(1)Consists of fees billed for attest-related services on debt offerings and compliance with the covenants in the senior preferred stock
purchase agreement with Treasury.
(2)Consists of tax fees related to non-audit tax research and compliance services.
(3)Consists of fees billed for non-audit engagements, including ESG Report attestation and other compliance assessments.
Pre-Approval Policy
In accordance with its charter, the Audit Committee must approve, in advance of the service, all audit and permissible
non-audit services to be provided by our independent registered public accounting firm and establish policies and
procedures for the engagement of the external auditor to provide audit and permissible non-audit services. The
independent registered public accounting firm and management are required to present reports on the nature of the
services provided by the independent registered public accounting firm for the past year and the fees for such services,
categorized into audit services, audit-related services, tax services and other services. The firm may not be retained to
perform non-audit services specified in Section 10A(g) of the Exchange Act.
The Audit Committee has delegated to its Chair the authority to pre-approve any additional audit and permissible non-
audit services up to $1 million per engagement. The Audit Committee must ratify such pre-approvals at the next
scheduled meeting of the Audit Committee. Additionally, we obtain the conservator’s approval for any services provided
by Deloitte & Touche LLP outside of the scope of the integrated audit.
In 2023, we paid no fees to the independent registered public accounting firm pursuant to the de minimis exception
established by the SEC, and all services were pre-approved.
Principal Accounting Fees and Services | ||
Fannie Mae 2023 Form 10-K | 207 |
PART IV
Item 15. Exhibits, Financial Statement Schedules
Documents filed as part of this report
Consolidated Financial Statements
An index to our consolidated financial statements has been filed as part of this report beginning on page F-1 and is
incorporated herein by reference.
Financial Statement Schedules
None.
Exhibits
The table below lists exhibits that are filed with or incorporated by reference into this report.
Item | Description | |
3.1 | ||
3.2 | ||
4.1 | ||
4.2 | ||
4.3 | ||
4.4 | ||
4.5 | ||
4.6 | ||
4.7 | ||
4.8 | ||
4.9 | ||
4.10 | ||
4.11 | ||
4.12 | ||
4.13 | ||
4.14 | ||
4.15 | ||
4.16 | ||
4.17 | ||
4.18 |
Exhibits, Financial Statement Schedules | ||
Fannie Mae 2023 Form 10-K | 208 |
4.19 | ||
4.20 | ||
4.21 | ||
4.22 | ||
4.23 | ||
4.24 | ||
4.25 | ||
4.26 | ||
4.27 | ||
4.28 | ||
10.1 | ||
10.2 | ||
10.3 | ||
10.4 | ||
10.5 | ||
10.6 | ||
10.7 | ||
10.8 | ||
10.9 | ||
10.10 | ||
10.11 | ||
10.12 |
Exhibits, Financial Statement Schedules | ||
Fannie Mae 2023 Form 10-K | 209 |
10.13 | ||
10.14 | ||
10.15 | ||
10.16 | ||
10.17 | ||
10.18 | ||
10.19 | ||
10.20 | ||
10.21 | ||
10.22 | ||
10.23 | ||
31.1 | ||
31.2 | ||
32.1 | ||
32.2 | ||
99.1 | ||
101. INS | Inline XBRL Instance Document* - the instance document does not appear in the Interactive Data File because its XBRL tags are embedded within the Inline XBRL document | |
101. SCH | Inline XBRL Taxonomy Extension Schema* | |
101. CAL | Inline XBRL Taxonomy Extension Calculation* | |
101. DEF | Inline XBRL Taxonomy Extension Definition* | |
101. LAB | Inline XBRL Taxonomy Extension Label* | |
101. PRE | Inline XBRL Taxonomy Extension Presentation* | |
104 | Cover Page Interactive Data File (embedded within the Inline XBRL document) |
__________
†This Exhibit is a management contract or compensatory plan or arrangement.
*The financial information contained in these XBRL documents is unaudited.
Item 16. Form 10-K Summary
None.
Exhibits, Financial Statement Schedules | ||
Fannie Mae 2023 Form 10-K | 210 |
SIGNATURES
Pursuant to the requirements of Section 13 or 15(d) of the Securities Exchange Act of 1934, the registrant has duly
caused this report to be signed on its behalf by the undersigned, thereunto duly authorized.
Federal National Mortgage Association | ||
/s/ Priscilla Almodovar | ||
Priscilla Almodovar Chief Executive Officer | ||
Date: February 15, 2024
KNOW ALL PERSONS BY THESE PRESENTS, that each person whose signature appears below constitutes and
appoints Priscilla Almodovar and Chryssa C. Halley, and each of them severally, his or her true and lawful attorney-in-
fact with power of substitution and resubstitution to sign in his or her name, place and stead, in any and all capacities, to
do any and all things and execute any and all instruments that such attorney may deem necessary or advisable under
the Securities Exchange Act of 1934 and any rules, regulations and requirements of the U.S. Securities and Exchange
Commission in connection with the Annual Report on Form 10-K and any and all amendments hereto, as fully for all
intents and purposes as he or she might or could do in person, and hereby ratifies and confirms all said attorneys-in-fact
and agents, each acting alone, and his or her substitute or substitutes, may lawfully do or cause to be done by virtue
hereof.
Pursuant to the requirements of the Securities Exchange Act of 1934, this report has been signed below by the following
persons on behalf of the registrant and in the capacities and on the dates indicated.
Signature | Title | Date | ||
/s/ Michael J. Heid | Chair of the Board of Directors | February 15, 2024 | ||
Michael J. Heid | ||||
/s/ Priscilla Almodovar | Chief Executive Officer and Director | February 15, 2024 | ||
Priscilla Almodovar | ||||
/s/ Chryssa C. Halley | Executive Vice President and Chief Financial Officer | February 15, 2024 | ||
Chryssa C. Halley | ||||
/s/ James L. Holmberg | Senior Vice President and Controller | February 15, 2024 | ||
James L. Holmberg | ||||
/s/ Amy E. Alving | Director | February 15, 2024 | ||
Amy E. Alving |
Signatures | ||
Fannie Mae 2023 Form 10-K | 211 |
Signature | Title | Date | ||
/s/ Christopher J. Brummer | Director | February 15, 2024 | ||
Christopher J. Brummer | ||||
/s/ Renée L. Glover | Director | February 15, 2024 | ||
Renée L. Glover | ||||
/s/ Robert H. Herz | Director | February 15, 2024 | ||
Robert H. Herz | ||||
/s/ Simon Johnson | Director | February 15, 2024 | ||
Simon Johnson | ||||
/s/ Karin J. Kimbrough | Director | February 15, 2024 | ||
Karin J. Kimbrough | ||||
/s/ Diane C. Nordin | Director | February 15, 2024 | ||
Diane C. Nordin | ||||
/s/ Chetlur S. Ragavan | Director | February 15, 2024 | ||
Chetlur S. Ragavan | ||||
/s/ Manuel Sánchez Rodríguez | Director | February 15, 2024 | ||
Manuel Sánchez Rodríguez | ||||
/s/ Michael Seelig | Director | February 15, 2024 | ||
Michael Seelig |
Signatures | ||
Fannie Mae 2023 Form 10-K | 212 |
Index to Consolidated Financial Statements | ||
Page | ||
Report of Independent Registered Public Accounting Firm . . . . . . . . . . . . . . . . . . . . . . . . . . . . . . . . . . . . . . . . . . . . | ||
Consolidated Balance Sheets . . . . . . . . . . . . . . . . . . . . . . . . . . . . . . . . . . . . . . . . . . . . . . . . . . . . . . . . . . . . . . . . . . . . . | ||
Consolidated Statements of Operations and Comprehensive Income . . . . . . . . . . . . . . . . . . . . . . . . . . . . . . . . . . | ||
Consolidated Statements of Cash Flows . . . . . . . . . . . . . . . . . . . . . . . . . . . . . . . . . . . . . . . . . . . . . . . . . . . . . . . . . . . | ||
Consolidated Statements of Changes in Equity . . . . . . . . . . . . . . . . . . . . . . . . . . . . . . . . . . . . . . . . . . . . . . . . . . . . . . | ||
Notes to Consolidated Financial Statements . . . . . . . . . . . . . . . . . . . . . . . . . . . . . . . . . . . . . . . . . . . . . . . . . . . . . . . . | ||
Note 1—Summary of Significant Accounting Policies . . . . . . . . . . . . . . . . . . . . . . . . . . . . . . . . . . . . . . . . . . . | ||
Note 2—Conservatorship, Senior Preferred Stock Purchase Agreement and Related Matters . . . . . . . . | ||
Note 3—Consolidations and Transfers of Financial Assets . . . . . . . . . . . . . . . . . . . . . . . . . . . . . . . . . . . . . . . | ||
Note 4—Mortgage Loans . . . . . . . . . . . . . . . . . . . . . . . . . . . . . . . . . . . . . . . . . . . . . . . . . . . . . . . . . . . . . . . . . . . | ||
Note 5—Allowance for Loan Losses . . . . . . . . . . . . . . . . . . . . . . . . . . . . . . . . . . . . . . . . . . . . . . . . . . . . . . . . . . | ||
Note 6—Investments in Securities . . . . . . . . . . . . . . . . . . . . . . . . . . . . . . . . . . . . . . . . . . . . . . . . . . . . . . . . . . . | ||
Note 7—Financial Guarantees . . . . . . . . . . . . . . . . . . . . . . . . . . . . . . . . . . . . . . . . . . . . . . . . . . . . . . . . . . . . . . . | ||
Note 8—Short-Term and Long-Term Debt . . . . . . . . . . . . . . . . . . . . . . . . . . . . . . . . . . . . . . . . . . . . . . . . . . . . . | ||
Note 9—Derivative Instruments . . . . . . . . . . . . . . . . . . . . . . . . . . . . . . . . . . . . . . . . . . . . . . . . . . . . . . . . . . . . . . | ||
Note 10—Income Taxes . . . . . . . . . . . . . . . . . . . . . . . . . . . . . . . . . . . . . . . . . . . . . . . . . . . . . . . . . . . . . . . . . . . . | ||
Note 11—Segment Reporting . . . . . . . . . . . . . . . . . . . . . . . . . . . . . . . . . . . . . . . . . . . . . . . . . . . . . . . . . . . . . . . | ||
Note 12—Equity . . . . . . . . . . . . . . . . . . . . . . . . . . . . . . . . . . . . . . . . . . . . . . . . . . . . . . . . . . . . . . . . . . . . . . . . . . . | ||
Note 13—Regulatory Capital Requirements . . . . . . . . . . . . . . . . . . . . . . . . . . . . . . . . . . . . . . . . . . . . . . . . . . . | ||
Note 14—Concentrations of Credit Risk . . . . . . . . . . . . . . . . . . . . . . . . . . . . . . . . . . . . . . . . . . . . . . . . . . . . . . . | ||
Note 15—Netting Arrangements . . . . . . . . . . . . . . . . . . . . . . . . . . . . . . . . . . . . . . . . . . . . . . . . . . . . . . . . . . . . . | ||
Note 16—Fair Value . . . . . . . . . . . . . . . . . . . . . . . . . . . . . . . . . . . . . . . . . . . . . . . . . . . . . . . . . . . . . . . . . . . . . . . . | ||
Note 17—Commitments and Contingencies . . . . . . . . . . . . . . . . . . . . . . . . . . . . . . . . . . . . . . . . . . . . . . . . . . . | ||
Index to Consolidated Financial Statements | ||
Fannie Mae 2023 Form 10-K | F-1 |
REPORT OF INDEPENDENT REGISTERED PUBLIC ACCOUNTING FIRM
To Fannie Mae:
Opinion on the Financial Statements
We have audited the accompanying consolidated balance sheets of Fannie Mae and consolidated entities (in
conservatorship) (the "Company") as of December 31, 2023 and 2022, the related consolidated statements of
operations and comprehensive income, cash flows, and changes in equity for each of the three years in the period
ended December 31, 2023, and the related notes (collectively referred to as the "financial statements"). In our opinion,
the financial statements present fairly, in all material respects, the financial position of the Company as of December 31,
2023 and 2022, and the results of its operations and its cash flows for each of the three years in the period ended
December 31, 2023, in conformity with accounting principles generally accepted in the United States of America.
We have also audited, in accordance with the standards of the Public Company Accounting Oversight Board (United
States) (PCAOB), the Company's internal control over financial reporting as of December 31, 2023, based on criteria
established in Internal Control — Integrated Framework (2013) issued by the Committee of Sponsoring Organizations of
the Treadway Commission and our report dated February 15, 2024, expressed an adverse opinion on the Company's
internal control over financial reporting because of a material weakness.
Emphasis of a Matter
As discussed in Note 1 to the consolidated financial statements, the Company is currently under the control of its
conservator and regulator, the Federal Housing Finance Agency (“FHFA”). Further, the Company directly and indirectly
received substantial support from various agencies of the United States Government, including the United States
Department of Treasury and FHFA. The Company is dependent upon continued support of the United States
Government, various United States Government agencies and the Company’s conservator and regulator, FHFA.
Basis for Opinion
These financial statements are the responsibility of the Company's management. Our responsibility is to express an
opinion on the Company's financial statements based on our audits. We are a public accounting firm registered with the
PCAOB and are required to be independent with respect to the Company in accordance with the U.S. federal securities
laws and the applicable rules and regulations of the Securities and Exchange Commission and the PCAOB.
We conducted our audits in accordance with the standards of the PCAOB. Those standards require that we plan and
perform the audit to obtain reasonable assurance about whether the financial statements are free of material
misstatement, whether due to error or fraud. Our audits included performing procedures to assess the risks of material
misstatement of the financial statements, whether due to error or fraud, and performing procedures that respond to
those risks. Such procedures included examining, on a test basis, evidence regarding the amounts and disclosures in
the financial statements. Our audits also included evaluating the accounting principles used and significant estimates
made by management, as well as evaluating the overall presentation of the financial statements. We believe that our
audits provide a reasonable basis for our opinion.
Critical Audit Matter
The critical audit matter communicated below is a matter arising from the current-period audit of the financial statements
that was communicated or required to be communicated to the audit committee and that (1) relates to accounts or
disclosures that are material to the financial statements and (2) involved our especially challenging, subjective, or
complex judgments. The communication of critical audit matters does not alter in any way our opinion on the financial
statements, taken as a whole, and we are not, by communicating the critical audit matter below, providing a separate
opinion on the critical audit matter or on the accounts or disclosures to which it relates.
Allowance for Loan Losses — Refer to Notes 1 and 5 to the financial statements
Critical Audit Matter Description
The Company’s allowance for loan losses is a valuation allowance that reflects an estimate of expected credit losses
related to its recorded investment in single-family and multifamily held-for-investment loans. The allowance for loan
losses requires consideration of a broad range of information about current conditions and reasonable and supportable
forecast information to develop loan loss estimates. The Company uses internal models to estimate credit losses that
incorporate historical credit loss experience, adjusted for current economic forecasts and the current credit profile of the
Company’s single-family and multifamily loan books of business. Management adjusts the modeled estimate when it
identifies relevant information that is not yet reflected in the allowance for loan losses.
For its single-family mortgage loan allowance for loan losses, the Company uses a discounted cash flow method to
measure expected credit losses. The model uses reasonable and supportable forecasts for key economic drivers for
single-family mortgage loans, including home prices and interest rates. For its multifamily mortgage loan allowance for
Report of Independent Registered Public Accounting Firm | ||
Fannie Mae 2023 Form 10-K | F-2 |
loan losses, the Company uses an undiscounted cash flow method to measure expected credit losses. The model uses
reasonable and supportable forecasts for key economic drivers for multifamily mortgage loans, including rental income
and property valuations.
We identified the allowance for loan losses for single-family and multifamily mortgage loans held-for-investment,
excluding the portion related to single-family reverse mortgage loans, as a critical audit matter because of the
complexity of the Company’s internal models and the significant assumptions used by management. This required a
high degree of auditor judgment and an increased extent of effort, including the need to involve credit specialists when
performing audit procedures to evaluate the reasonableness of management’s internal models and significant
assumptions.
How the Critical Audit Matter Was Addressed in the Audit
Our audit procedures related to the internal models, key data inputs, and management’s significant assumptions used to
estimate the allowance for loan losses described in the preceding paragraph, included the following, among others:
•We tested the effectiveness of controls, including those related to the internal models, key data inputs, and
significant management assumptions.
•With the assistance of our credit specialists, we evaluated:
◦The appropriateness of the internal models and methodologies.
◦The reasonableness of management’s significant assumptions, including the development of forecasted
home price growth (single-family), forecasted interest rates (single-family), forecasted rental income
(multifamily), and forecasted property valuations (multifamily).
◦The appropriateness of any qualitative adjustments (or lack thereof) to the modeled expected cash flow
output.
•We tested the accuracy of key data inputs, including historical loan data and economic data consumed by the
internal models used to calculate expected credit losses.
/s/ Deloitte & Touche LLP
February 15, 2024
We have served as the Company’s auditor since 2005.
Report of Independent Registered Public Accounting Firm | ||
Fannie Mae 2023 Form 10-K | F-3 |
FANNIE MAE
(In conservatorship)
Consolidated Balance Sheets
(Dollars in millions)
As of December 31, | |||||||
2023 | 2022 | ||||||
ASSETS | |||||||
Cash and cash equivalents | $ | $ | |||||
Restricted cash and cash equivalents (includes $ trusts) | |||||||
Securities purchased under agreements to resell (includes $ consolidated trusts) | |||||||
Investments in securities, at fair value | |||||||
Mortgage loans: | |||||||
Loans held for sale, at lower of cost or fair value | |||||||
Loans held for investment, at amortized cost: | |||||||
Of Fannie Mae | |||||||
Of consolidated trusts | |||||||
Total loans held for investment (includes $ | |||||||
Allowance for loan losses | ( | ( | |||||
Total loans held for investment, net of allowance | |||||||
Total mortgage loans | |||||||
Advances to lenders | |||||||
Deferred tax assets, net | |||||||
Accrued interest receivable, net (includes $ allowance of $ | |||||||
Other assets | |||||||
Total assets | $ | $ | |||||
LIABILITIES AND EQUITY | |||||||
Liabilities: | |||||||
Accrued interest payable (includes $ | $ | $ | |||||
Debt: | |||||||
Of Fannie Mae (includes $ | |||||||
Of consolidated trusts (includes $ | |||||||
Other liabilities (includes $ | |||||||
Total liabilities | |||||||
Commitments and contingencies (Note 17) | |||||||
Fannie Mae stockholders’ equity: | |||||||
Senior preferred stock (liquidation preference of $ | |||||||
Preferred stock, | |||||||
Common stock, no par value, no maximum authorization— | |||||||
Accumulated deficit | ( | ( | |||||
Accumulated other comprehensive income | |||||||
Treasury stock, at cost, | ( | ( | |||||
Total stockholders’ equity (See Note 2: Senior Preferred Stock Purchase Agreement, Senior Preferred Stock and Warrant for information on the related dividend obligation and liquidation preference) | |||||||
Total liabilities and equity | $ | $ | |||||
See Notes to Consolidated Financial Statements
Financial Statements | Consolidated Balance Sheets | ||
Fannie Mae (In conservatorship) 2023 Form 10-K | F-4 | |
FANNIE MAE
(In conservatorship)
Consolidated Statements of Operations and Comprehensive Income
(Dollars and shares in millions, except per share amounts)
For the Year Ended December 31, | |||||||||||
2023 | 2022 | 2021 | |||||||||
Interest income: | |||||||||||
Investments in securities | $ | $ | $ | ||||||||
Mortgage loans | |||||||||||
Other | |||||||||||
Total interest income | |||||||||||
Interest expense: | |||||||||||
Short-term debt | ( | ( | ( | ||||||||
Long-term debt | ( | ( | ( | ||||||||
Total interest expense | ( | ( | ( | ||||||||
Net interest income | |||||||||||
Benefit (provision) for credit losses | ( | ||||||||||
Net interest income after benefit (provision) for credit losses | |||||||||||
Investment gains (losses), net | ( | ( | |||||||||
Fair value gains, net | |||||||||||
Fee and other income | |||||||||||
Non-interest income | |||||||||||
Administrative expenses: | |||||||||||
Salaries and employee benefits | ( | ( | ( | ||||||||
Professional services | ( | ( | ( | ||||||||
Other administrative expenses | ( | ( | ( | ||||||||
Total administrative expenses | ( | ( | ( | ||||||||
TCCA fees | ( | ( | ( | ||||||||
Credit enhancement expense | ( | ( | ( | ||||||||
Change in expected credit enhancement recoveries | ( | ( | |||||||||
Other expenses, net | ( | ( | ( | ||||||||
Total expenses | ( | ( | ( | ||||||||
Income before federal income taxes | |||||||||||
Provision for federal income taxes | ( | ( | ( | ||||||||
Net income | |||||||||||
Other comprehensive loss | ( | ( | ( | ||||||||
Total comprehensive income | $ | $ | $ | ||||||||
Net income | $ | $ | $ | ||||||||
Dividends distributed or amounts attributable to senior preferred stock | ( | ( | ( | ||||||||
Net income attributable to common stockholders | $ | $ | $ | ||||||||
Earnings per share: | |||||||||||
Basic | $ | $ | $ | ||||||||
Diluted | |||||||||||
Weighted-average common shares outstanding: | |||||||||||
Basic | |||||||||||
Diluted | |||||||||||
See Notes to Consolidated Financial Statements
Financial Statements | Consolidated Statements of Operations and Comprehensive Income | ||
Fannie Mae (In conservatorship) 2023 Form 10-K | F-5 | |
FANNIE MAE
(In conservatorship)
Consolidated Statements of Cash Flows
(Dollars in millions)
For the Year Ended December 31, | ||||||
2023 | 2022 | 2021 | ||||
Cash flows provided by (used in) operating activities: | ||||||
Net income | $ | $ | $ | |||
Reconciliation of net income to net cash provided by (used in) operating activities: | ||||||
Amortization of cost basis adjustments | ( | ( | ( | |||
Net impact of hedged mortgage assets and debt | ( | ( | ||||
Provision (benefit) for credit losses | ( | ( | ||||
Valuation (gains) losses | ( | ( | ||||
Change in expected credit enhancement recoveries | ( | |||||
Deferred income tax expense (benefit) | ( | |||||
Net gains related to the disposition of acquired property and preforeclosure sales, including credit enhancements | ( | ( | ( | |||
Net change in accrued interest receivable | ( | ( | ( | |||
Net change in servicer advances | ( | ( | ||||
Net change in accrued interest payable | ( | |||||
Other, net | ( | |||||
Net change in trading securities | ( | |||||
Net cash provided by (used in) operating activities | ||||||
Cash flows provided by (used in) investing activities: | ||||||
Mortgage loans acquired held for investment: | ||||||
Purchases | ( | ( | ( | |||
Proceeds from sales | ||||||
Proceeds from repayments | ||||||
Advances to lenders | ( | ( | ( | |||
Proceeds from disposition of acquired property and preforeclosure sales | ||||||
Net change in federal funds sold and securities purchased under agreements to resell | ( | |||||
Other, net | ( | ( | ||||
Net cash provided by (used in) investing activities | ||||||
Cash flows provided by (used in) financing activities: | ||||||
Proceeds from issuance of debt of Fannie Mae | ||||||
Payments to redeem debt of Fannie Mae | ( | ( | ( | |||
Proceeds from issuance of debt of consolidated trusts | ||||||
Payments to redeem debt of consolidated trusts | ( | ( | ( | |||
Other, net | ||||||
Net cash provided by (used in) financing activities | ( | ( | ( | |||
Net increase (decrease) in cash, cash equivalents and restricted cash and cash equivalents | ( | ( | ( | |||
Cash, cash equivalents and restricted cash and cash equivalents at beginning of period | ||||||
Cash, cash equivalents and restricted cash and cash equivalents at end of period | $ | $ | $ | |||
Cash paid during the period for: | ||||||
Interest | $ | $ | $ | |||
Income taxes | ||||||
Supplemental information on non-cash activities related to mortgage loans (see Note 4) | ||||||
See Notes to Consolidated Financial Statements
Financial Statements | Consolidated Statements of Cash Flows | ||
Fannie Mae (In conservatorship) 2023 Form 10-K | F-6 | |
FANNIE MAE
(In conservatorship)
Consolidated Statements of Changes in Equity
(Dollars and shares in millions)
Fannie Mae Stockholders’ Equity | ||||||||||||||||||||
Shares Outstanding | Senior Preferred Stock | Preferred Stock | Common Stock | Accumulated Deficit | Accumulated Other Comprehensive Income | Treasury Stock | Total Equity | |||||||||||||
Senior Preferred | Preferred | Common | ||||||||||||||||||
Balance as of December 31, 2020 | $ | $ | $ | $( | $ | $( | $ | |||||||||||||
Comprehensive income: | ||||||||||||||||||||
Net income | — | — | — | — | — | — | — | — | ||||||||||||
Other comprehensive income, net of tax effect: | ||||||||||||||||||||
Changes in net unrealized losses on available- for-sale securities (net of taxes of $ | — | — | — | — | — | — | — | ( | — | ( | ||||||||||
Reclassification adjustment for gains (losses) included in net income (net of taxes of $ | — | — | — | — | — | — | — | ( | — | ( | ||||||||||
Other (net of taxes of $ | — | — | — | — | — | — | — | ( | — | ( | ||||||||||
Total comprehensive income | ||||||||||||||||||||
Balance as of December 31, 2021 | ( | ( | ||||||||||||||||||
Comprehensive income: | ||||||||||||||||||||
Net income: | — | — | — | — | — | — | — | — | ||||||||||||
Other comprehensive income, net of tax effect: | ||||||||||||||||||||
Changes in net unrealized losses on available- for-sale securities (net of taxes of $ | — | — | — | — | — | — | — | ( | — | ( | ||||||||||
Reclassification adjustment for gains (losses) included in net income (net of taxes of $ | — | — | — | — | — | — | — | — | ||||||||||||
Other (net of taxes of $ | — | — | — | — | — | — | — | — | ||||||||||||
Total comprehensive income | ||||||||||||||||||||
Balance as of December 31, 2022 | ( | ( | ||||||||||||||||||
Comprehensive income: | ||||||||||||||||||||
Net income | — | — | — | — | — | — | — | — | ||||||||||||
Other comprehensive income, net of tax effect: | ||||||||||||||||||||
Changes in net unrealized losses on available- for-sale securities (net of taxes of $ | — | — | — | — | — | — | — | ( | — | ( | ||||||||||
Reclassification adjustment for gains (losses) included in net income (net of taxes of $ | — | — | — | — | — | — | — | — | ||||||||||||
Other (net of taxes of $ | — | — | — | — | — | — | — | ( | — | ( | ||||||||||
Total comprehensive income | ||||||||||||||||||||
Balance as of December 31, 2023 | $ | $ | $ | $( | $ | $( | $ | |||||||||||||
See Notes to Consolidated Financial Statements
Financial Statements | Consolidated Statements of Changes in Equity | ||
Fannie Mae (In conservatorship) 2023 Form 10-K | F-7 | |
FANNIE MAE
(In conservatorship)
Notes to Consolidated Financial Statements
1. Summary of Significant Accounting Policies
Fannie Mae is a leading source of financing for residential mortgages in the United States. We are a government-
sponsored, stockholder-owned corporation, chartered by Congress to provide liquidity and stability to the U.S. housing
market and to promote access to mortgage credit. We primarily do this by buying residential mortgage loans that are
originated by lenders. We place these loans into trusts and issue guaranteed mortgage-backed securities (“MBS”) that
global investors buy from us. We do not originate mortgage loans or lend money directly to borrowers.
secondary mortgage market relating to loans secured by properties containing four or fewer residential dwelling units.
The Multifamily business operates in the secondary mortgage market relating primarily to loans secured by properties
generate our segment results in “Note 11, Segment Reporting.”
We have been under conservatorship with the Federal Housing Finance Agency (“FHFA”) acting as conservator since
September 2008. See “Note 2, Conservatorship, Senior Preferred Stock Purchase Agreement and Related Matters,” for
information on our conservatorship, the senior preferred stock purchase agreement, the impact of U.S. government
support on our business, and related party relationships.
The accompanying consolidated financial statements have been prepared in accordance with accounting principles
generally accepted in the United States of America (“GAAP”). To conform to our current-period presentation, we have
reclassified certain amounts reported in our prior period consolidated financial statements.
Preparing consolidated financial statements in accordance with GAAP requires management to make estimates and
assumptions that affect our reported amounts of assets and liabilities and disclosure of contingent assets and liabilities
as of the dates of our consolidated financial statements, as well as our reported amounts of revenues and expenses
during the reporting periods. Management has made significant estimates in a variety of areas including, but not limited
to, the allowance for loan losses. Actual results could be different from these estimates.
Our consolidated financial statements include our accounts as well as the accounts of the other entities in which we
have a controlling financial interest. All intercompany balances and transactions have been eliminated. The typical
condition for a controlling financial interest is ownership of a majority of the voting interests of an entity. A controlling
financial interest may also exist in an entity such as a variable interest entity (“VIE”) through arrangements that do not
involve voting interests, such as control over the servicing of the collateral held by the VIE. Fannie Mae’s controlling
interest generally arises from arrangements with VIEs.
We consolidate VIEs when we have a controlling financial interest in the VIE and are therefore considered the primary
beneficiary of the VIE. We are the primary beneficiary of a VIE when we have both the power to direct the activities of
the VIE that most significantly impact its economic performance and exposure to losses or benefits of the VIE that could
potentially be significant to the VIE. The primary beneficiary determination may change over time as our interest in the
VIE changes. Therefore, we evaluate whether we are the primary beneficiary of VIEs in which we have variable
interests at both inception and on an ongoing basis. Generally, the assets of our consolidated VIEs can be used only to
settle obligations of the VIE, and the creditors of our consolidated VIEs do not have recourse to Fannie Mae, except
when we provide a guarantee to the VIE.
The measurement of assets and liabilities of VIEs that we consolidate depends on whether we are the transferor of
assets into a VIE. When we are the transferor of assets into a VIE that we consolidate at the time of the transfer, we
continue to recognize the assets and liabilities of the VIE at the amounts that they would have been recognized if we
had not transferred the assets and no gain or loss is recognized. We are the transferor to the VIEs created during our
Notes to Consolidated Financial Statements | Summary of Significant Accounting Policies | ||
Fannie Mae (In conservatorship) 2023 Form 10-K | F-8 | |
portfolio securitizations; this execution occurs when we purchase loans from third-party sellers for cash and later deposit
these loans into an MBS trust. The securities issued through a portfolio securitization are then sold to investors for cash.
When we are not the transferor of assets into a VIE that we consolidate, we recognize the assets and liabilities of the
VIE in our consolidated financial statements at fair value and a gain or loss for the difference between (1) the fair value
of the consideration paid, fair value of noncontrolling interests and the reported amount of any previously held interests,
and (2) the net amount of the fair value of the assets and liabilities recognized upon consolidation. However, for the
VIEs established under our lender swap program, we do not recognize a gain or loss if the VIEs are consolidated at
formation as there is no difference in the respective fair value of (1) and (2) above. We record gains or losses that are
associated with the consolidation of VIEs as a component of “Investment gains (losses), net” in our consolidated
statements of operations and comprehensive income. A lender swap transaction occurs when a mortgage lender
delivers a pool of loans to us, which we immediately deposit into an MBS trust.
If we cease to be deemed the primary beneficiary of a VIE, we deconsolidate the VIE. We use fair value to measure the
initial cost basis for any retained interests that are recorded upon the deconsolidation of a VIE. Any difference between
the fair value and the previous carrying amount of our investment in the VIE is recorded in “Investment gains (losses),
net” in our consolidated statements of operations and comprehensive income.
We evaluate each transfer of financial assets to determine whether we have surrendered control and the transfer
qualifies as a sale. If a transfer does not meet the criteria for sale treatment, the transferred assets remain in our
consolidated balance sheets and we record a liability to the extent of any proceeds received in connection with the
transfer.
When a transfer that qualifies as a sale is completed, we derecognize all assets transferred and recognize all assets
received and liabilities incurred at fair value. The difference between the carrying basis of the assets transferred and the
fair value of the net proceeds from the sale is recorded as a component of “Investment gains (losses), net” in our
consolidated statements of operations and comprehensive income. We retain interests from the transfer and sale of
mortgage-related securities to unconsolidated single-class and multi-class portfolio securitization trusts. Retained
interests are primarily derived from transfers associated with our portfolio securitizations in the form of Fannie Mae
securities. We separately describe the subsequent accounting, as well as how we determine fair value, for our retained
Short-term investments that have a maturity at the date of acquisition of three months or less and are readily convertible
to known amounts of cash are generally considered cash equivalents. We also include securities purchased under
agreements to resell on an overnight basis in “cash and cash equivalents” in our consolidated balance sheets. We may
pledge as collateral certain short-term investments classified as cash equivalents.
“Restricted cash and cash equivalents” in our consolidated balance sheets primarily represents cash held in accounts
that are for the benefit of MBS certificateholders (inclusive of amounts that have been advanced by us under the terms
of our guaranty) that will be distributed to the MBS certificateholders on a future date in accordance with the terms of the
MBS trust agreements. Fannie Mae, in its role as trustee, invests funds held by consolidated trusts directly in eligible
short-term third-party investments, which may include investments in cash equivalents that are composed of overnight
repurchase agreements and U.S. Treasuries that have a maturity at the date of acquisition of three months or less. The
funds underlying these short-term investments are restricted per the MBS trust agreements. Cash may also be
We enter into repurchase agreements that involve contemporaneous trades to purchase and sell securities. As the
transferor has not relinquished control over the securities, these transactions are accounted for as secured financings
and reported as securities purchased under agreements to resell in our consolidated balance sheets except for
securities purchased under agreements to resell on an overnight basis, which are included in cash and cash equivalents
in our consolidated balance sheets. We present cash flows from securities purchased under agreements to resell as
investing activities in our consolidated statements of cash flows.
These repurchase agreements may allow us to repledge all, or a portion, of the transferred collateral, and we may
repledge such collateral periodically, although it is not typically our practice to repledge collateral that has been
Notes to Consolidated Financial Statements | Summary of Significant Accounting Policies | ||
Fannie Mae (In conservatorship) 2023 Form 10-K | F-9 | |
Securities Classified as Trading or Available-for-Sale
We classify and account for our investments in securities as either trading or available-for-sale (“AFS”). We measure
trading securities at fair value in our consolidated balance sheets with unrealized and realized gains and losses included
as a component of “Fair value gains (losses), net” in our consolidated statements of operations and comprehensive
income. We include interest on investments in securities in our consolidated statements of operations and
comprehensive income. Interest income includes the amortization of cost basis adjustments, including premiums and
discounts, recognized as a yield adjustment using the interest method over the contractual term of the security. We
measure AFS securities at fair value in our consolidated balance sheets, with unrealized gains and losses, net of
income taxes, recorded in “Accumulated other comprehensive income,” and changes in expected credit losses recorded
in “Benefit (provision) for credit losses.” We recognize realized gains and losses on AFS securities when securities are
sold. We calculate the gains and losses on AFS securities using the specific identification method and record them in
“Investment gains (losses), net” in our consolidated statements of operations and comprehensive income. As of
December 31, 2023 and 2022, we did not have any investments in securities classified as held-to-maturity.
When we own Fannie Mae MBS issued by unconsolidated trusts, the asset is recorded in “Investments in securities, at
fair value” in our consolidated balance sheets. We determine the fair value of Fannie Mae MBS based on observable
market prices because most Fannie Mae MBS are actively traded. For any subsequent purchase or sale of Fannie Mae
MBS issued by unconsolidated trusts, we continue to account for any outstanding recorded amounts associated with the
guaranty transaction on the same basis of accounting. We do not derecognize any components of the guaranty assets,
guaranty obligations, or any other outstanding recorded amounts associated with the guaranty transaction for the
Fannie Mae MBS because our contractual obligation to the MBS trust remains in force until the trust is liquidated.
An AFS debt security is impaired if the fair value of the investment is less than its amortized cost basis. In these
circumstances, we separate the excess of the amortized cost basis of the debt security over its fair value into the
amount representing the credit loss, which we recognize as an allowance for credit losses with the corresponding
amount recorded in “Benefit (provision) for credit losses” in our consolidated statements of operations and
comprehensive income, and the amount related to all other factors, which we recognize in “Other comprehensive loss,”
net of taxes, in our consolidated statements of operations and comprehensive income. Credit losses are evaluated on
an individual security basis and are limited to the excess of the amortized cost basis over the fair value of the debt
security. If we intend to sell a debt security or it is more likely than not that we will be required to sell the debt security
before recovery, any allowance for credit losses on the debt security is reversed and the amortized cost basis of the
debt security is written down to its fair value through “Investment gains (losses), net.”
Mortgage Loans
When we acquire mortgage loans that we intend to sell or securitize via trusts that will not be consolidated, we classify
the loans as held for sale (“HFS”). We report the carrying value of HFS loans at the lower of cost or fair value. Any
excess of an HFS loan’s cost over its fair value is recognized as a valuation allowance with the corresponding amount
and subsequent changes in the valuation allowance recognized as “Investment gains (losses), net” in our consolidated
statements of operations and comprehensive income. We recognize interest income on HFS loans on an accrual basis
unless we determine that the ultimate collection of contractual principal or interest payments in full is not reasonably
assured. Purchased premiums and discounts on HFS loans are deferred upon loan acquisition, included in the cost
basis of the loan, and not amortized. We determine any lower of cost or fair value adjustment on HFS loans at an
individual loan level.
In the presentation of our consolidated statements of cash flows, we present cash flows from loans classified as HFS at
acquisition as operating activities. If a loan is initially classified as HFI and it is transferred to HFS, the principal cash
flows and sales proceeds from such loans continue to be presented as investing activities in the consolidated statement
of cash flows.
Our accounting for transfers to HFS differs based upon the loan’s classification as either nonperforming or performing.
Nonperforming loans include both seriously delinquent and reperforming loans. For both single-family and multifamily
loans, reperforming loans are loans that were previously delinquent but are performing again because payments on the
loan have become current with or without the use of a loan modification plan. Single-family seriously delinquent loans
are loans that are 90 days or more past due or in the foreclosure process. Multifamily seriously delinquent loans are
loans that are 60 days or more past due. All other loans are considered performing.
Notes to Consolidated Financial Statements | Summary of Significant Accounting Policies | ||
Fannie Mae (In conservatorship) 2023 Form 10-K | F-10 | |
For nonperforming loans transferred from held for investment (“HFI”) to HFS, based upon a change in our intent, we
record the loans at the lower of cost or fair value on the date of transfer. When the fair value of the nonperforming loan
is less than its amortized cost, we record a write-off against the allowance for loan losses in an amount equal to the
excess of the amortized cost basis over the fair value of the loan. Any difference between the amount written off upon
transfer and the recorded valuation allowance related to the transferred loan is recognized in “Benefit (provision) for
credit losses” in our consolidated statements of operations and comprehensive income.
For performing loans transferred from HFI to HFS, based upon a change in our intent, the allowance for loan losses
previously recorded on the HFI mortgage loan is reversed through “Benefit (provision) for credit losses” at the time of
transfer. The loan is transferred to HFS at its amortized cost basis and a valuation allowance is established to the extent
that the amortized cost basis of the loan exceeds its fair value. The initial recognition of the valuation allowance and any
subsequent changes are recorded as a gain or loss in “Investment gains (losses), net.”
Upon reclassification from HFS to HFI, we reverse the valuation allowance on the loan, if any, and establish an
allowance for loan losses as needed.
When we acquire loans that we have the ability and the intent to hold for the foreseeable future or until maturity, we
classify the loans as HFI. When we consolidate a securitization trust, we recognize the loans underlying the trust in our
consolidated balance sheets. The trusts do not have the ability to sell loans and the use of such loans is limited
exclusively to the settlement of obligations of the trusts. Therefore, loans acquired when we have the intent to securitize
via consolidated trusts are generally classified as HFI in our consolidated balance sheets both prior to and subsequent
to their securitization.
In the presentation of our consolidated statements of cash flows, we present principal cash flows from loans classified
as HFI as investing activities and interest cash flows as operating activities.
We report the carrying value of HFI loans at the unpaid principal balance, net of unamortized premiums and discounts,
other cost basis adjustments, and allowance for loan losses. We define the amortized cost of HFI loans as unpaid
principal balance and accrued interest receivable, net, including any unamortized premiums, discounts, and other cost
basis adjustments. We present accrued interest receivable separately from the amortized cost of our HFI loans in our
consolidated balance sheets. We recognize interest income on HFI loans on an accrual basis using the effective yield
method over the contractual life of the loan, including the amortization of any deferred cost basis adjustments, such as
the premium or discount at acquisition, unless we determine that the ultimate collection of contractual principal or
interest payments in full is not reasonably assured.
We recognize interest income on an accrual basis except when we believe the collection of principal and interest is not
reasonably assured. This generally occurs when a single-family loan is three or more months past due and a multifamily
loan is two or more months past due according to its contractual terms. A loan is reported as past due if a full payment
of principal and interest is not received within one month of its due date. When a loan is placed on nonaccrual status
based on delinquency status, interest previously accrued but not collected on the loan is reversed through interest
income.
Cost basis adjustments on HFI loans are amortized into interest income over the contractual life of the loan using the
effective interest method. Cost basis adjustments on the loan are not amortized into income while a loan is on
nonaccrual status. We have elected not to measure an allowance for credit losses on accrued interest receivable
balances as we have a nonaccrual policy to ensure the timely reversal of unpaid accrued interest.
For single-family loans, we recognize any contractual interest payments received on the loan while on nonaccrual status
as interest income on a cash basis. For multifamily loans, we account for interest income on a cost recovery basis and
we apply any payment received while on nonaccrual status to reduce the amortized cost of the loan. Thus, we do not
recognize any interest income on a multifamily loan placed on nonaccrual status until the amortized cost of the loan has
been reduced to zero.
A nonaccrual loan is returned to accrual status when the full collection of principal and interest is reasonably assured.
We generally determine that the full collection of principal and interest is reasonably assured when the loan returns to
current payment status. If a loan is restructured for a borrower experiencing financial difficulty, we require a performance
period of up to 6 months before we return the loan to accrual status. Upon a loan’s return to accrual status, we resume
the recognition of interest income on an accrual basis and the amortization of cost basis adjustments, if any, into interest
income. If interest is capitalized pursuant to a restructuring, any capitalized interest that had not been previously
recognized as interest income or that had been reversed through interest income when the loan was placed on
Notes to Consolidated Financial Statements | Summary of Significant Accounting Policies | ||
Fannie Mae (In conservatorship) 2023 Form 10-K | F-11 | |
nonaccrual status is recorded as a discount to the loan and amortized into interest income over the remaining
contractual life of the loan.
For single-family loans negatively impacted by the COVID-19 pandemic that were three or more months past due as of
December 31, 2022, we continued to recognize interest income for up to six months of delinquency provided that the
loan was either current as of March 1, 2020, or originated after March 1, 2020. We continued to accrue interest income
beyond six months of delinquency provided that the full collection of principal and interest continued to be reasonably
assured. For multifamily loans that were in a COVID-19 forbearance arrangement on December 31, 2022, we continued
to recognize interest income for up to six months of delinquency and then placed the loans on nonaccrual status when
the borrower was six months past due.
For loans that were subject to the COVID-19-related nonaccrual policy, we established a valuation allowance for
expected credit losses on the accrued interest receivable balance applying the process that we have established for
both single-family and multifamily loans. The credit expense related to this valuation allowance was recorded in “Benefit
(provision) for credit losses” in our consolidated statements of operations and comprehensive income. Accrued interest
receivable was written off when the amount was deemed to be uncollectible. Loans that were in active forbearance
arrangements were not evaluated for write-off.
To the extent that loans that were subject to the COVID-19-related nonaccrual policy were restructured, the accrued
interest that was previously recognized was capitalized into the principal balance of the loan.
Allowance for Loan Losses
Our allowance for loan losses is a valuation account that is deducted from the amortized cost basis of HFI loans to
present the net amount expected to be collected on the loans. The allowance for loan losses reflects an estimate of
expected credit losses on single-family and multifamily HFI loans held by Fannie Mae and by consolidated MBS trusts.
Estimates of credit losses are based on expected cash flows derived from internal models that estimate loan
performance under simulated ranges of economic environments. Our modeled loan performance is based on our
historical experience of loans with similar risk characteristics, adjusted to reflect current conditions and reasonable and
supportable forecasts. Our historical loss experience and our credit loss estimates capture the possibility of remote
events that could result in credit losses on loans that are considered low risk. The allowance for loan losses does not
consider benefits from freestanding credit enhancements, such as our Connecticut Avenue Securities® (“CAS”) and
Credit Insurance Risk Transfer™ (“CIRT™”) programs and multifamily Delegated Underwriting and Servicing (“DUS®”)
lender risk-sharing arrangements, which are recorded in “Other assets” in our consolidated balance sheets.
Changes to our estimate of expected credit losses, including changes due to the passage of time, are recorded through
the “Benefit (provision) for credit losses” in our consolidated statements of operations and comprehensive income.
When calculating our allowance for loan losses, we consider only our amortized cost in the loans at the balance sheet
date. We record write-offs as a reduction to the allowance for loan losses when amounts are deemed uncollectible.
When losses are confirmed through the receipt of assets in satisfaction of a loan, such as the underlying collateral upon
foreclosure or cash upon completion of a short sale, we record a write-off in an amount equal to the excess of a loan’s
amortized cost over fair value of assets received. We include expected recoveries of amounts previously written off and
expected to be written off in determining our allowance for loan losses.
We present foreclosed property in “Other assets” in our consolidated balance sheets. We held $1.8 billion and $1.6
billion of acquired property, net as of December 31, 2023 and December 31, 2022, respectively.
Single-Family Loans
We estimate the amount expected to be collected on our single-family loans using a discounted cash flow approach.
Our allowance for loan losses is calculated as the difference between the amortized cost basis of the loan and the
present value of expected cash flows on the loan. Expected cash flows include payments from the borrower, net of fees
retained by a third-party for servicing, contractually attached credit enhancements and proceeds from the sale of the
underlying collateral, net of selling costs.
When foreclosure of a single-family loan is probable, the allowance for loan losses is calculated as the difference
between the amortized cost basis of the loan and the fair value of the collateral as of the reporting date, adjusted for the
estimated costs to sell the property and the amount of expected recoveries from contractually attached credit
enhancements or other proceeds we expect to receive.
Expected cash flows are developed using internal models that capture market and loan characteristic inputs. Market
inputs include information such as actual and forecasted home prices, interest rates, volatility and spreads, while loan
characteristic inputs include information such as mark-to-market loan-to-value (“LTV”) ratios, delinquency status,
geography and borrower FICO credit scores. The model assigns a probability to borrower events including contractual
Notes to Consolidated Financial Statements | Summary of Significant Accounting Policies | ||
Fannie Mae (In conservatorship) 2023 Form 10-K | F-12 | |
payment, loan payoff and default under various economic environments based on historical data, current conditions and
reasonable and supportable forecasts.
The two primary drivers of our forecasted economic environments are interest rates and home prices. Our model
projects the range of possible interest rate scenarios over the life of the loan based on actual interest rates and
observed option pricing volatility in the capital markets. For single-family home prices, we develop regional forecasts
based on Metropolitan Statistical Area data using a multi-path simulation that captures home price projections over a
five-year period, the period for which we can develop reasonable and supportable forecasts. After the five-year period,
the home price forecast reverts to a historical long-term growth rate.
Expected cash flows on the loan are discounted at the effective interest rate on the loan, adjusted for expected
prepayments. We update the discount rate of the loan each reporting period to reflect changes in expected
prepayments.
We may modify loans to borrowers experiencing financial difficulty as part of our loss mitigation activities. We consider
the effects of both actual and estimated restructurings in our estimate of expected credit losses.
Multifamily Loans
Our allowance for loan losses on multifamily loans is calculated based on estimated probabilities of default and loss
severities to derive expected loss ratios, which are then applied to the amortized cost basis of the loans. Our
probabilities of default and severity are estimated using internal models based on historical loss experience of loans
with similar risk characteristics that affect credit performance, such as debt service coverage ratio (“DSCR”), mark-to-
market LTV ratio, collateral type, age, loan size, geography, prepayment penalty term and note type. Our models
simulate a range of possible future economic scenarios, which are used to estimate probabilities of default and loss
severities. Key inputs to our models include rental income, which drives expected DSCRs for our loans, and property
values. Our reasonable and supportable forecasts for multifamily rental income and property values, which are
projected based on Metropolitan Statistical Area data, extend through the contractual maturity of the loans.
When foreclosure of a multifamily loan is probable, the allowance for loan losses is calculated as the difference between
the amortized cost basis of the loan and the fair value of the collateral as of the reporting date, adjusted for the
estimated costs to sell the property.
Restructured Loans
Effective January 1, 2022, we adopted Accounting Standards Update (“ASU”) 2022-02, Financial Instruments – Credit
Losses (Topic 326), using the prospective transition method. ASU 2022-02 eliminates the recognition and measurement
of troubled debt restructurings (“TDRs”) and enhances the disclosures for loan restructurings for borrowers experiencing
financial difficulty. Pursuant to this guidance, when a single-family loan is restructured, we continue to measure
impairment on the loan using a discounted cash flow approach that utilizes a prepayment-adjusted discount rate that is
based on the loan’s restructured terms. Using a post-restructuring interest rate does not result in the recognition of an
economic concession in the allowance for loan losses. Additionally, loan modifications to single-family and multifamily
borrowers are evaluated to determine whether they result in a new loan or a continuation of an existing loan.
Modifications made by Fannie Mae for borrowers experiencing financial difficulty are generally accounted for as a
continuation of the existing loan as the terms of the restructured loans are typically not at market rates.
Prior to our adoption of this guidance, most of our restructurings were accounted for as TDRs. Under the TDR
accounting model, we used the discount rate that was in effect prior to the restructuring to measure impairment on each
loan, which resulted in the recognition, in the allowance for loan losses, of the economic concession that we granted to
borrowers as part of the loan restructuring.
As we have elected a prospective transition for the TDR-elimination guidance effective January 1, 2022, the economic
concession on a single-family loan that was previously restructured and accounted for as a TDR will continue to be
measured in our allowance for loan losses using the discount rate that was in effect prior to the restructuring and the
economic concession may increase or decrease as we update our cash flow assumptions related to the loan’s expected
life. Further, the component of the allowance for loan losses representing economic concessions will decrease as the
borrower makes payments in accordance with the restructured terms of the loan and as the loan is sold, liquidated, or
subsequently restructured.
In general, the effect of our current accounting for loan modifications is consistent with the accounting that we applied
under section 4013 of the Coronavirus Aid, Relief, and Economic Security Act (the “CARES Act”) to modifications of
loans not previously restructured in a TDR. The CARES Act provided temporary relief from the accounting and reporting
requirements for TDRs regarding certain loan modifications related to COVID-19 beginning March 2020 through
December 31, 2021.
Notes to Consolidated Financial Statements | Summary of Significant Accounting Policies | ||
Fannie Mae (In conservatorship) 2023 Form 10-K | F-13 | |
Advances to lenders represent our payments of cash in exchange for the receipt of loans from lenders in a transfer that
is accounted for as a secured lending arrangement. These transfers primarily occur when we provide early funding to
lenders for loans that they will subsequently either sell to us or securitize into a Fannie Mae MBS that they will deliver to
us. We individually negotiate early lender funding advances with our lenders. Early lender funding advances have terms
up to 60 days and earn a short-term market rate of interest.
We report cash outflows from advances to lenders as an investing activity in our consolidated statements of cash flows.
Settlements of the advances to lenders, other than through lender repurchases of loans, are not collected in cash, but
rather in the receipt of either loans or Fannie Mae MBS. Accordingly, this activity is reflected as a non-cash transfer in
our consolidated statements of cash flows in the line item entitled “Transfers from advances to lenders to loans held for
We recognize deferred tax assets and liabilities based on the differences in the book and tax bases of assets and
liabilities. We measure deferred tax assets and liabilities using enacted tax rates that are applicable to the periods that
the differences are expected to reverse. We adjust deferred tax assets and liabilities for the effects of changes in tax
laws and rates in the period of enactment. We recognize investment and other tax credits through our effective tax rate
calculation assuming that we will be able to realize the full benefit of the credits. We invest in Low-Income Housing Tax
Credit (“LIHTC”) projects and elect the proportional amortization method for the associated tax credits. We amortize the
cost of a LIHTC investment each reporting period in proportion to the tax credits and other tax benefits received. We
recognize the resulting amortization as a component of the “Provision for federal income taxes” in our consolidated
statements of operations and comprehensive income.
We present deferred taxes net in our consolidated balance sheets. We reduce our deferred tax assets by an allowance
if, based on the weight of available positive and negative evidence, it is more likely than not (a probability of greater than
50%) that we will not realize some portion, or all, of the deferred tax asset.
We account for uncertain tax positions using a two-step approach whereby we recognize an income tax benefit if, based
on the technical merits of a tax position, it is more likely than not that the tax position would be sustained upon
examination by the taxing authority, which includes all related appeals and litigation. We then measure the recognized
tax benefit based on the largest amount of tax benefit that is greater than 50% likely to be realized upon settlement with
the taxing authority, considering all information available at the reporting date. We recognize interest expense and
penalties on unrecognized tax benefits as “Other expenses, net” in our consolidated statements of operations and
comprehensive income.
We recognize derivatives in a gain position in “Other assets” and derivatives in a loss position in “Other liabilities” in our
consolidated balance sheets at their fair value on a trade date basis. Changes in fair value and interest accruals on
derivatives not in qualifying fair value hedging relationships are recorded as “Fair value gains, net” in our consolidated
statements of operations and comprehensive income. We offset the carrying amounts of certain derivatives that are in
gain positions and loss positions as well as cash collateral receivables and payables associated with derivative
positions pursuant to the terms of enforceable master netting arrangements. We offset these amounts only when we
have the legal right to offset under the contract and we have met all the offsetting conditions. For our over-the-counter
(“OTC”) derivative positions, our master netting arrangements allow us to net derivative assets and liabilities with the
same counterparty. For our cleared derivative contracts, our master netting arrangements allow us to net our exposure
by clearing organization and by clearing member.
In the presentation of our consolidated statements of cash flows, we present cash flows from derivatives that do not
contain financing elements as operating activities.
We evaluate financial instruments that we purchase or issue and other financial and non-financial contracts for
embedded derivatives. To identify embedded derivatives that we must account for separately, we determine whether: (1)
the economic characteristics of the embedded derivative are not clearly and closely related to the economic
characteristics of the financial instrument or other contract (i.e., the host contract); (2) the financial instrument or other
contract itself is not already measured at fair value with changes in fair value included in earnings; and (3) a separate
instrument with the same terms as the embedded derivative would meet the definition of a derivative. If the embedded
derivative meets all three of these conditions, we elect to carry the hybrid contract in its entirety at fair value with
changes in fair value recorded in earnings.
Notes to Consolidated Financial Statements | Summary of Significant Accounting Policies | ||
Fannie Mae (In conservatorship) 2023 Form 10-K | F-14 | |
Fair Value Hedge Accounting
To reduce earnings volatility related to changes in benchmark interest rates, we apply fair value hedge accounting to
certain pools of single-family loans and certain issuances of our funding debt by designating such instruments as the
hedged item in hedging relationships with interest-rate swaps. In these relationships, we have designated the change in
the benchmark interest rate, the Secured Overnight Financing Rate (“SOFR”), as the risk being hedged. We have
elected to use the portfolio layer method to hedge certain pools of single-family loans. This election involves
establishing fair value hedging relationships on the portion of each loan pool that is not expected to be affected by
prepayments, defaults and other events that affect the timing and amount of cash flows. The term of each hedging
relationship is generally one business day and we establish hedging relationships each business day to align our hedge
accounting with our risk management practices.
We apply hedge accounting to qualifying hedging relationships. A qualifying hedging relationship exists when changes
in the fair value of a derivative hedging instrument are expected to be highly effective in offsetting changes in the fair
value of the hedged item attributable to the risk being hedged during the term of the hedging relationship. We assess
hedge effectiveness using statistical regression analysis. A hedging relationship is considered highly effective if the total
change in fair value of the hedging instrument and the change in the fair value of the hedged item due to changes in the
benchmark interest rate offset each other within a range of 80% to 125% and certain other statistical tests are met.
If a hedging relationship qualifies for hedge accounting, the change in the fair value of the interest-rate swap and the
change in the fair value of the hedged item for the risk being hedged are recorded through net interest income. A
corresponding basis adjustment is recorded against the hedged item, either the pool of loans or the debt, for the
changes in the fair value attributable to the risk being hedged. For hedging relationships that hedge pools of single-
family loans, basis adjustments are allocated to individual single-family loans based on the relative unpaid principal
balance of each loan at the termination of the hedging relationship. The cumulative basis adjustments on the hedged
item are amortized into earnings using the effective interest method over the contractual life of the hedged item, with
amortization beginning upon termination of the hedging relationship.
All changes in fair value of the designated portion of the derivative hedging instrument (i.e., interest-rate swap),
including interest accruals, are recorded in the same line item in the consolidated statements of operations and
comprehensive income used to record the earnings effect of the hedged item. Therefore, changes in the fair value of the
hedged loans and debt attributable to the risk being hedged are recognized in “Interest income” or “Interest expense,”
respectively, along with the changes in the fair value of the respective derivative hedging instruments.
The recognition of basis adjustments on the hedged item and the subsequent amortization are noncash activities and
are removed from net income to derive the “Net cash provided by operating activities” in our consolidated statements of
cash flows. Cash paid or received on designated derivative instruments during a hedging relationship is reported as
“Net cash provided by operating activities” in the consolidated statements of cash flows.
Commitments to Purchase and Sell Loans and Securities
We enter into commitments to purchase and sell mortgage-backed securities and to purchase single-family and
multifamily loans. Certain of these commitments to purchase or sell mortgage-backed securities and to purchase single-
family loans are accounted for as derivatives, while other commitments are not within the scope of the derivative
accounting criteria or do not meet the definition of a derivative.
Our commitments for the purchase and sale of regular way securities trades are exempt from derivative accounting and
are recorded on their trade date.
When derivative purchase commitments settle, we include the fair value on the settlement date in the cost basis of the
loan or unconsolidated security we purchase. When derivative commitments to sell securities settle, we include the fair
value of the commitment on the settlement date in the cost basis of the security we sell. Purchases and sales of
securities issued by our consolidated single-class securitization trusts and certain resecuritization trusts where the
security that has been issued by the trust is substantially the same as the underlying collateral are treated as
extinguishments or issuances of the underlying MBS debt, respectively. For commitments to purchase and sell
securities issued by these trusts, we recognize the fair value of the commitment on the settlement date as a component
of debt extinguishment gains and losses or in the cost basis of the debt issued, respectively.
We enter into various transactions where we pledge and accept collateral, the most common of which are our derivative
transactions. Required collateral levels vary depending on the credit rating and type of counterparty. We also pledge
and receive collateral under our repurchase and reverse repurchase agreements. In order to reduce potential exposure
to counterparties for securities purchased under agreements to resell, a third-party custodian typically maintains the
Notes to Consolidated Financial Statements | Summary of Significant Accounting Policies | ||
Fannie Mae (In conservatorship) 2023 Form 10-K | F-15 | |
collateral and any margin. We monitor the fair value of the collateral received from our counterparties, and we may
require additional collateral from those counterparties, as we deem appropriate.
Cash Collateral
We record cash collateral accepted from a counterparty that we have the right to use as “Cash and cash equivalents”
and cash collateral accepted from a counterparty that we do not have the right to use as “Restricted cash and cash
equivalents” in our consolidated balance sheets. We net our obligation to return cash collateral pledged to us against
the fair value of derivatives in a gain position recorded in “Other assets” in our consolidated balance sheets when the
offsetting requirements have been met as part of our counterparty netting calculation.
For derivative positions with the same counterparty under master netting arrangements where we pledge cash
collateral, we remove it from “Cash and cash equivalents” and net the right to receive it against the fair value of
derivatives in a loss position recorded in “Other liabilities” in our consolidated balance sheets as a part of our
counterparty netting calculation.
Non-Cash Collateral
We classify securities pledged to counterparties as “Investments in securities, at fair value” or “Cash and cash
equivalents” in our consolidated balance sheets. Securities that we own that are pledged to counterparties may include
securities issued by consolidated VIEs. The pledged collateral is classified as “Mortgage loans” when the trust that
issued the security has been consolidated to align with the classification of the underlying asset.
Our consolidated balance sheets contain debt of Fannie Mae as well as debt of consolidated trusts. We report debt
issued by us as “Debt of Fannie Mae” and by consolidated trusts as “Debt of consolidated trusts.” Debt issued by us
represents debt that we issue to third parties to fund our general business activities and certain credit risk-sharing
securities. The debt of consolidated trusts represents the amount of Fannie Mae MBS issued from such trusts that is
held by third-party certificateholders and prepayable without penalty at any time. We report deferred items, including
premiums, discounts and other cost basis adjustments, as adjustments to the related debt balances in our consolidated
balance sheets. Our liability to third-party holders of Fannie Mae MBS that arises as the result of a consolidation of a
securitization trust is collateralized by the underlying loans and/or mortgage-related securities.
We classify interest expense as either short-term or long-term based on the contractual maturity of the related debt. We
recognize the amortization of premiums, discounts and other cost basis adjustments through interest expense using the
effective interest method over the contractual term of the debt. Amortization of premiums, discounts and other cost basis
adjustments begins at the time of debt issuance.
We purchase and sell guaranteed MBS that have been issued through lender swap and portfolio securitization
transactions. When we purchase or sell a Fannie Mae MBS issued from a consolidated single-class securitization trust
and certain resecuritization trusts where the security that has been issued by the trust is substantially the same as the
underlying collateral, we extinguish or issue, respectively, the related debt of the consolidated trust to reflect the debt
that is owed to a third-party. For the extinguishment of debt, we record debt extinguishment gains or losses related to
debt of consolidated trusts for any difference between the purchase price of the MBS and the carrying value of the
related consolidated MBS debt reported in our consolidated balance sheets (including unamortized premiums, discounts
and other cost basis adjustments) at the time of purchase as a component of “Other expenses, net” in our consolidated
statements of operations and comprehensive income. When we issue consolidated debt, the debt is recorded at its fair
Fair Value Hedging - Portfolio Layer Method
On March 28, 2022, the Financial Accounting Standards Board (“FASB”) issued ASU 2022-01, Fair Value Hedging –
Portfolio Layer Method, which clarifies the guidance on fair value hedge accounting of interest rate risk portfolios of
financial assets. The ASU expands the scope of the last-of-layer method to allow entities to apply this method, renamed
the portfolio layer method, to non-prepayable financial assets and to designate multiple hedge relationships within a
single closed portfolio of financial assets. Additionally, the ASU clarifies that basis adjustments related to existing
portfolio layer hedge relationships should not be considered when measuring credit losses on the financial assets
included in the closed portfolio. Further, the ASU clarifies that any reversal of fair value hedge basis adjustments
associated with an actual breach should be recognized in interest income immediately. We adopted this guidance on
January 1, 2023 and the adoption did not have a material impact on our financial statements.
Notes to Consolidated Financial Statements | Summary of Significant Accounting Policies | ||
Fannie Mae (In conservatorship) 2023 Form 10-K | F-16 | |
Investments – Equity Method and Joint Ventures
On March 29, 2023, the FASB issued ASU 2023-02, Investments - Equity Method and Joint Ventures (Topic 323),
Accounting for Investment in Tax Credit Structures Using the Proportional Amortization Method. The ASU expands the
scope of the proportional amortization method that is currently restricted to investments in LIHTC structures by allowing
an entity to elect this method on a program-by-program basis to other qualifying tax equity investments. We adopted
this guidance on January 1, 2024 and the adoption did not have a material impact on our financial statements.
Segment Reporting
On November 27, 2023, the FASB issued ASU 2023-07, Segment Reporting (Topic 280), Improvements to Reportable
Segment Disclosures. The ASU enhances disclosure of an entity’s reportable segments by requiring additional
information about significant segment expenses, interim disclosures of certain segment information that previously were
only required on an annual basis and other detailed segment-related disclosures. The ASU applies to all public entities
that are required to report segment information and is effective starting in annual periods beginning after December 15,
2023. The ASU is required to be adopted retrospectively to all prior periods presented in the financial statements. We
are currently evaluating the impact of this guidance on our consolidated financial statements.
Income Taxes
On December 14, 2023, the FASB issued ASU 2023-09, Income Taxes (Topic 740): Improvements to Income Tax
Disclosures, which enhances the required disclosures primarily related to the income tax rate reconciliation and income
taxes paid. The ASU requires an entity’s income tax rate reconciliation to provide additional information for reconciling
items meeting a quantitative threshold, and to disclose certain selected categories within the income tax rate
reconciliation. The ASU also requires entities to disclose the amount of income taxes paid, disaggregated by federal,
state and foreign taxes. The ASU is effective for annual periods beginning after December 15, 2024, though early
2. Conservatorship, Senior Preferred Stock Purchase
Agreement and Related Matters
In September 2008, FHFA was appointed as our conservator pursuant to authority provided by the Federal Housing
Enterprises Financial Safety and Soundness Act of 1992, as amended (the “GSE Act”). Conservatorship is a statutory
process designed to preserve and conserve our assets and property and put the company in a sound and solvent
condition. Our conservatorship has no specified termination date.
FHFA, as conservator, succeeded to:
•all rights, titles, powers and privileges of Fannie Mae, and of any stockholder, officer or director of Fannie Mae
with respect to Fannie Mae and its assets; and
•title to the books, records and assets of any other legal custodian of Fannie Mae.
As conservator, FHFA has the authority to exercise broad powers over the company, including:
•directing us to enter into contracts or entering into contracts on our behalf; and
•transferring or selling our assets or liabilities.
FHFA has broad latitude over our business while we are in conservatorship, including authority to rehabilitate us in a
way that, while not in Fannie Mae’s best interests, is beneficial to FHFA and, by extension, the public it serves.
The GSE Act provides special protections for mortgage loans and mortgage-related assets we hold in trust. Specifically,
mortgage loans and mortgage-related assets that have been transferred to a Fannie Mae MBS trust must be held by the
conservator for the beneficial owners of such MBS and cannot be used to satisfy the company’s general creditors.
While we are operating in conservatorship, our directors:
•serve on behalf of the conservator;
•exercise their authority as directed by and with the approval (where required) of the conservator;
•owe their fiduciary duties of care and loyalty solely to the conservator, and not to either the company or the
stockholders; and
•are appointed by the conservator and not elected by stockholders.
Notes to Consolidated Financial Statements | Summary of Significant Accounting Policies | ||
Fannie Mae (In conservatorship) 2023 Form 10-K | F-17 | |
FHFA, as conservator, has issued an order authorizing our Board of Directors to exercise specified functions and
authorities, and instructions regarding matters for which conservator decision or notification is required. The conservator
retains the authority to amend or withdraw its order and instructions at any time.
The conservator has suspended stockholder meetings since conservatorship, and our common stockholders are not
empowered to vote on directors or any other matters. The conservator also eliminated dividends on our common and
preferred stock (other than dividends on the senior preferred stock issued to the U.S. Department of Treasury described
below) during the conservatorship.
Receivership
Under the GSE Act, the Director of FHFA must place us into receivership if they determine that our assets are less than
our obligations (that is, we have a net worth deficit) or if we have not been paying our debts as they become due, in
either case, for a period of 60 days. FHFA has clarified that the 60-day measurement period will commence no earlier
than the SEC filing deadline for our Form 10-K or Form 10-Q for the relevant period. In addition, the Director of FHFA
may place us into receivership at the Director’s discretion at any time for other reasons set forth in the GSE Act,
including if we are critically undercapitalized or if we are undercapitalized and have no reasonable prospect of becoming
adequately capitalized. Should we be placed into receivership, different assumptions would be required to determine the
carrying value of our assets, which would likely lead to substantially different financial results. We are not aware of any
plans of FHFA: (1) to fundamentally change our business model, or (2) to reduce the aggregate amount available to or
held by the company under our equity structure, which includes the senior preferred stock purchase agreement.
Overview
FHFA, as conservator, entered into a senior preferred stock purchase agreement with the U.S. Department of the
Treasury (“Treasury”) on our behalf in September 2008. In connection with that agreement, we issued Treasury
“senior preferred stock,” and a warrant to purchase shares equal to 79.9 % of our common stock, on a fully diluted basis,
for a nominal price of $0.00001 . We have assigned a value of $4.5 billion to Treasury’s commitment, which was
recorded as a reduction to additional paid-in-capital at the time of the issuance and was partially offset by the aggregate
fair value of the warrant of $3.5 billion. We received no cash consideration for issuing either the senior preferred stock
or the warrant. The senior preferred stock purchase agreement and the terms of the senior preferred stock have been
amended multiple times since 2008 by FHFA (acting on our behalf) and Treasury. These amendments have been
accounted for as modifications of the senior preferred stock purchase agreement. As a result, these amendments did
not trigger a change in the carrying value of the senior preferred stock.
us, including those described in the table below. For a discussion of the terms of the senior preferred stock related to
dividends, liquidation preference, and limits on redemptions and paydowns, see “Note 12, Equity.”
Treasury Funding Commitment | •On a quarterly basis, we may draw funds from Treasury to cover the amount that our total liabilities exceed our total assets for the applicable fiscal quarter (referred to as the “deficiency amount”), up to the amount of remaining funding commitment under the agreement. •As of the date of this filing: ◦$ ◦$ reduced by any future payments by Treasury under the commitment. |
Termination Provisions for Funding Commitment | •Treasury’s funding commitment has no specified end date, but will terminate upon: ◦our liquidation and the fulfillment of Treasury’s obligations under its funding commitment; ◦the payment in full of, or reasonable provision for, our liabilities (whether or not contingent, including guaranty obligations); or ◦Treasury funding the maximum amount under the agreement. •Treasury also may terminate its funding commitment and void the agreement if a court vacates, modifies, amends, conditions, enjoins, stays or otherwise affects the appointment of the conservator or curtails the conservator’s powers. |
Notes to Consolidated Financial Statements | Conservatorship, Senior Preferred Stock Purchase Agreement and Related Matters | ||
Fannie Mae (In conservatorship) 2023 Form 10-K | F-18 | |
Rights of Debt and MBS Holders | •Holders of our debt securities or our guaranteed MBS may file a claim in the United States Court of Federal Claims for relief if we default on our payment obligations on those securities and: ◦we and the conservator fail to exercise all rights under the agreement to draw on Treasury’s funding commitment, or ◦Treasury fails to perform its obligations under its funding commitment and we and/or the conservator are not diligently pursuing remedies for Treasury’s failure. •Holders may seek to require Treasury to fund us up to: ◦the amount necessary to cure the relevant payment defaults; ◦the deficiency amount; or ◦the amount of remaining funding under the agreement, whichever is the least. Any Treasury funding provided under these circumstances would increase the liquidation preference of the senior preferred stock. •The terms of the agreement generally may be amended or waived; however, no such amendment or waiver may decrease Treasury’s aggregate funding commitment or add conditions to Treasury’s funding commitment that would adversely affect in any material respect the holders of our debt or guaranteed MBS. |
Commitment Fee | •The agreement provides for the payment of an unspecified quarterly commitment fee to Treasury to compensate it for its ongoing support under the agreement. •Until the capital reserve end date, the periodic commitment fee will not be set, accrue, or be payable. The capital reserve end date is defined as the last day of the second consecutive fiscal quarter during which we have had and maintained capital equal to or exceeding the capital requirements and buffers set forth in the enterprise regulatory capital framework. •No later than the capital reserve end date, we and Treasury, in consultation with the Chair of the Federal Reserve, will agree on the amount of the periodic commitment fee. |
Covenants
taking several actions without the prior written consent of Treasury or require us to take specified actions, including the
following described in the table below:
Dividends and Share Repurchases | •We may not pay dividends or make other distributions on or repurchase our equity securities (other than the senior preferred stock). |
Issuances of Equity Securities | •We may not issue equity securities, except for common stock issued: ◦upon exercise of the warrant; ◦as required by any pre-conservatorship agreements; and ◦following the satisfaction of two conditions: (a) the exercise of the warrant in full, and (b) the resolution of all currently pending significant litigation relating to the conservatorship and the August 2012 amendment to the senior preferred stock purchase agreement. |
Notes to Consolidated Financial Statements | Conservatorship, Senior Preferred Stock Purchase Agreement and Related Matters | ||
Fannie Mae (In conservatorship) 2023 Form 10-K | F-19 | |
Termination of Conservatorship | •Neither we nor FHFA may terminate or seek to terminate the conservatorship, other than through a receivership, without the prior consent of Treasury, with one exception that allows FHFA to terminate our conservatorship without the prior consent of Treasury if the following conditions are met: ◦all currently pending significant litigation relating to the conservatorship and the August 2012 amendment to the senior preferred stock purchase agreement has been resolved; and ◦for two or more consecutive quarters, our common equity tier 1 capital (as defined in the enterprise regulatory capital framework), together with any stockholder equity that would result from a firm commitment public underwritten offering of common stock which is fully consummated concurrent with the termination of conservatorship, equals or exceeds at least 3% of our adjusted total assets (as defined in the enterprise regulatory capital framework). As of December 31, 2023, 3% of our adjusted total assets was $ and we had a common equity tier 1 capital deficit of $ |
Asset Dispositions | •We may not sell, transfer, lease or otherwise dispose of any assets, except for dispositions for fair market value in limited circumstances, including if: ◦the transaction is in the ordinary course of business and consistent with past practice; or ◦the assets have a fair market value individually or in the aggregate of less than $ |
Subordinated Debt | •We may not issue any subordinated debt securities. |
Mortgage Assets Limit | •We may not hold mortgage assets in excess of $ managing our business to a $ instructions. |
Indebtedness | •We may not have indebtedness in excess of $ |
Executive Compensation | •We may not enter into any new compensation arrangements or increase amounts or benefits payable under existing compensation arrangements with any of our executive officers (as defined by Securities and Exchange Commission (“SEC”) rules) without the consent of the Director of FHFA, in consultation with the Secretary of the Treasury. |
Equitable Access and Offers for Single-Family Mortgage Loans | •We may not vary our pricing or acquisition terms for single-family loans based on the business characteristics of the seller, including the seller’s size, charter type, or volume of business with us. •We must offer to purchase at all times, for equivalent cash consideration and on substantially the same terms, any single-family mortgage loan that: ◦is of a class of loans that we then offer to acquire for inclusion in our MBS or for other non- cash consideration; ◦is offered by a seller that has been approved to do business with us; and ◦has been originated and sold in compliance with our underwriting standards. |
Notes to Consolidated Financial Statements | Conservatorship, Senior Preferred Stock Purchase Agreement and Related Matters | ||
Fannie Mae (In conservatorship) 2023 Form 10-K | F-20 | |
Single-Family Loan Eligibility Program | •We must maintain a program reasonably designed to ensure that the single-family loans we acquire are limited to: ◦qualified mortgages; ◦government-backed loans; ◦loans exempt from the Consumer Financial Protection Bureau’s (the “CFPB’s”) ability-to- repay and qualified mortgage rule (other than loans secured by timeshares and home equity lines of credit, which, we are not allowed to buy); ◦loans secured by an investment property; ◦refinancing loans with streamlined underwriting originated in accordance with our eligibility criteria for high LTV ratio refinancings; ◦loans originated with temporary underwriting flexibilities during times of exigent circumstances, as determined in consultation with FHFA; ◦loans secured by manufactured housing; and ◦such other loans that FHFA may designate that were eligible for purchase by us as of January 2021. |
Enterprise Regulatory Capital Framework | •We are required to comply with the enterprise regulatory capital framework rule published by FHFA in the Federal Register on December 17, 2020, disregarding any subsequent amendments or modifications to the rule. •FHFA has subsequently amended the enterprise regulatory capital framework and instructed us to comply with the framework as amended. Accordingly, we are not in compliance with this covenant. See “Note 13, Regulatory Capital Requirements” for additional information. •While our compliance with the covenants in the senior preferred stock purchase agreement is not a condition of Treasury’s funding commitment under that agreement, FHFA, as our conservator and regulator, has the authority to direct compliance or impose consequences for any non-compliance with that agreement. |
Risk Management Plan | •While in conservatorship, we must provide an annual risk management plan to Treasury. |
Suspended Covenants
Certain covenants in the senior preferred stock purchase agreement (described below) were temporarily suspended in
September 2021. Treasury can terminate this suspension upon six months’ notice to us. As of the date of this filing, we
have received no such notification from Treasury. The suspended covenants include:
•A prohibition on acquiring more than $1.5 billion in single-family loans for cash consideration from any single
seller (including its affiliates) during any four-quarter period.
•A prohibition on acquiring more than $80 billion in multifamily mortgage assets in any 52-week period, with this
volume cap to be adjusted by FHFA at the end of each year.
•A requirement that at least 50 % of our multifamily acquisitions in any year be classified as mission-driven at the
time of acquisition.
•A prohibition on acquiring (during a 52-week period) a single-family mortgage loan if, following the acquisition,
more than 3 % of our single-family loans that result from a refinancing, or 6 % of our single-family loans that do
not result from a refinancing, would have two or more of the following characteristics at origination: combined
LTV ratio greater than 90 %; a debt to income ratio greater than 45 %; and FICO or equivalent credit score less
than 680.
•A requirement to limit our acquisitions of single-family mortgage loans secured by either second homes or
investment properties to not more than 7 % of the single-family mortgage loans we have acquired during the
preceding 52-week period.
Senior Preferred Stock and Common Stock Warrant
For information about the senior preferred stock and the common stock warrant, see “Note 12, Equity.”
Notes to Consolidated Financial Statements | Conservatorship, Senior Preferred Stock Purchase Agreement and Related Matters | ||
Fannie Mae (In conservatorship) 2023 Form 10-K | F-21 | |
Impact of U.S. Government Support
We continue to rely on support from Treasury to eliminate any net worth deficits we may experience in the future, which
would otherwise trigger our being placed into receivership. Based on consideration of all the relevant conditions and
events affecting our operations, including our reliance on the U.S. government, we continue to operate as a going
concern and in accordance with FHFA’s provision of authority.
We primarily fund our business through MBS issuances, retained earnings, and the issuance of a variety of short-term
and long-term debt securities in the domestic and international capital markets. Accordingly, we are subject to “roll over,”
or refinancing, risk on our outstanding debt.
We believe that our status as a government-sponsored enterprise and continued federal government support are
essential to maintaining our access to debt funding. Changes or perceived changes in federal government support of
our business, our debt securities or our status as a government-sponsored enterprise could materially and adversely
affect our liquidity, financial condition and results of operations. In addition, due to our reliance on the U.S. government’s
support, our access to debt funding or the cost of debt funding also could be materially adversely affected by a change
or perceived change in the creditworthiness of the U.S government. A downgrade in our credit ratings could reduce
demand for our debt securities and increase our borrowing costs. Future changes or disruptions in the financial markets
could significantly impact the amount, mix and cost of funds we obtain, which also could increase our liquidity and “roll
over” risk and have a material adverse impact on our liquidity, financial condition and results of operations.
Because Treasury holds a warrant to purchase shares of Fannie Mae common stock equal to 79.9 % of the total number
of shares of Fannie Mae common stock, we and Treasury are deemed related parties. As of December 31, 2023,
Treasury held an investment in our senior preferred stock with an aggregate liquidation preference of $195.2 billion.
FHFA’s control of both Fannie Mae and Freddie Mac has caused Fannie Mae, FHFA and Freddie Mac to be deemed
related parties. Additionally, Fannie Mae and Freddie Mac jointly own Common Securitization Solutions, LLC (“CSS”), a
limited liability company created to operate a common securitization platform; as a result, CSS is deemed a related
party. As a part of our joint ownership, Fannie Mae, Freddie Mac and CSS are parties to a limited liability company
agreement that sets forth the overall framework for the joint venture, including Fannie Mae’s and Freddie Mac’s rights
and responsibilities as members of CSS. Fannie Mae, Freddie Mac and CSS are also parties to a customer services
agreement that sets forth the terms under which CSS provides mortgage securitization services to us and Freddie Mac,
including the operation of the common securitization platform, as well as an administrative services agreement. CSS
operates as a separate company from us and Freddie Mac, with all funding and limited administrative support services
and other resources provided to it by us and Freddie Mac.
In the ordinary course of business, Fannie Mae may purchase and sell securities issued by Treasury and Freddie Mac
in the capital markets. Some of the structured securities we issue are backed in whole or in part by Freddie Mac
securities. Fannie Mae and Freddie Mac each have agreed to indemnify the other party for losses caused by: its failure
to meet its payment or other specified obligations under the trust agreements pursuant to which the underlying
resecuritized securities were issued; its failure to meet its obligations under the customer services agreement; its
violations of laws; or with respect to material misstatements or omissions in offering documents, ongoing disclosures
and materials relating to the underlying resecuritized securities. Additionally, we make regular income tax payments to
and receive tax refunds from the Internal Revenue Service (“IRS”), a bureau of Treasury.
Transactions with Treasury
Treasury Making Home Affordable Program
Our administrative expenses were reduced by approximately $6 million, $15 million and $17 million for the years ended
December 31, 2023, 2022 and 2021, respectively, due to reimbursements from Treasury and Freddie Mac for expenses
incurred as program administrator for Treasury’s Home Affordable Modification Program (“HAMP”) and other initiatives
under Treasury’s Making Home Affordable Program. Our role as program administrator concluded in the third quarter of
2023, and we received our final reimbursement from Treasury in the fourth quarter of 2023.
Obligation to Pay TCCA Fees to Treasury
In December 2011, Congress enacted the Temporary Payroll Tax Cut Continuation Act of 2011 (“TCCA”) which, among
other provisions, required that we increase our single-family guaranty fees by at least 10 basis points and pay this
increase to Treasury. To meet our obligations under the TCCA and at the direction of FHFA, we increased the guaranty
fee on all single-family mortgages delivered to us by 10 basis points in April 2012. The resulting fee revenue and
expense are recorded in “Interest income: Mortgage loans” and “TCCA fees,” respectively, in our consolidated
Notes to Consolidated Financial Statements | Conservatorship, Senior Preferred Stock Purchase Agreement and Related Matters | ||
Fannie Mae (In conservatorship) 2023 Form 10-K | F-22 | |
statements of operations and comprehensive income. In November 2021, the Infrastructure Investment and Jobs Act
was enacted, which extended to October 1, 2032 our obligation under the TCCA to collect 10 basis points in guaranty
fees on single-family mortgages delivered to us and pay the associated revenue to Treasury. In January 2022, FHFA
advised us to continue to collect and pay these TCCA fees on and after October 1, 2032 with respect to loans we
acquired before this date until those loans are paid off or otherwise liquidated.
We recognized $3.4 billion, $3.4 billion and $3.1 billion in TCCA fees during the years ended December 31, 2023, 2022
and 2021, respectively, of which $861 million and $854 million had not been paid as of December 31, 2023 and 2022,
respectively.
Treasury Interest in Affordable Housing Allocations
The GSE Act requires us to set aside certain funding obligations, a portion of which is attributable to Treasury’s Capital
Magnet Fund. These funding obligations are measured as the product of 4.2 basis points and the unpaid principal
balance of our total new business purchases for the respective period, with 35 % of this amount payable to Treasury’s
Capital Magnet Fund. We recognized $54 million, $101 million and $209 million in “Other expenses, net” in connection
with Treasury’s Capital Magnet Fund for the years ended December 31, 2023, 2022 and 2021, respectively. We paid
$101 million and $209 million to Treasury’s Capital Magnet Fund in 2023 and 2022, respectively. In 2024, we expect to
pay $54 million to Treasury’s Capital Magnet Fund based on our new business purchases in 2023.
Transactions with FHFA
The GSE Act authorizes FHFA to establish an annual assessment for regulated entities, including Fannie Mae, which is
payable on a semi-annual basis (April and October), for FHFA’s costs and expenses, as well as to maintain FHFA’s
working capital. We recognized FHFA assessment fees, which are recorded in “Other administrative expenses” in our
consolidated statements of operations and comprehensive income, of $159 million, $132 million and $140 million for the
years ended December 31, 2023, 2022 and 2021, respectively.
Transactions with CSS and Freddie Mac
We contributed funds to CSS, the company we jointly own with Freddie Mac, of $72 million, $65 million and $76 million
for the years ended December 31, 2023, 2022 and 2021, respectively. Net operating losses associated with our
investment in CSS are recorded in “Other expenses, net” in our consolidated statements of operations and
comprehensive income.
3. Consolidations and Transfers of Financial Assets
•securitization trusts;
•resecuritization trusts;
•housing partnerships that are established to finance the acquisition, construction, development or rehabilitation
of affordable multifamily housing; and
•certain credit risk transfer special purpose entities.
These interests may include guarantees to the VIE on behalf of the holders of the securities issued by the VIE and/or
investments in the securities issued by VIEs, such as Fannie Mae MBS created pursuant to our securitization
transactions. We consolidate the substantial majority of our single-class securitization trusts because our role as
guarantor and master servicer provides us with the power to direct activities (primarily the servicing of mortgage loans)
that impact the credit risk to which we are exposed. In contrast, we do not consolidate single-class securitization trusts
when other organizations have the power to direct these activities unless we have the unilateral ability to dissolve the
trust. We also do not consolidate our resecuritization trusts unless we have the unilateral ability to dissolve the trust. We
may include securities issued by Freddie Mac in some of our resecuritization trusts. The mortgage loans that serve as
collateral for Freddie Mac-issued securities are not held in trusts that are consolidated by Fannie Mae.
Types of VIEs
Securitization Trusts
We create single-class securitization trusts to issue single-class Fannie Mae MBS that evidence an undivided interest in
the mortgage loans held in the trust. Investors in Fannie Mae MBS receive principal and interest payments in proportion
to their percentage ownership of the Fannie Mae MBS issued. We guarantee to each single-class securitization trust
Notes to Consolidated Financial Statements | Conservatorship, Senior Preferred Stock Purchase Agreement and Related Matters | ||
Fannie Mae (In conservatorship) 2023 Form 10-K | F-23 | |
that we will supplement amounts received by the securitization trust as required to permit timely payments of principal
and interest on the related Fannie Mae MBS. This guaranty exposes us to credit losses on the loans underlying Fannie
Mae MBS.
Single-class securitization trusts are used for lender swap and portfolio securitization transactions. We consolidate
single-class securitization trusts that are created under these programs when our role as master servicer provides us
with the power to direct activities, such as the servicing of the mortgage loans, that impact the credit risk to which we
are exposed. In contrast, we do not consolidate single-class securitization trusts when other organizations have the
power to direct these activities (for example, when the mortgage loan collateral is subject to a Federal Housing
Administration guaranty and related Servicing Guide).
Resecuritization Trusts
Fannie Mae single-class resecuritization trusts, which include Fannie Megas® and Supers®, are created by depositing
MBS into a new securitization trust for the purpose of aggregating multiple mortgage-related securities (generally
Fannie Mae MBS, Freddie Mac MBS or combinations of both) into one combined security. Fannie Mae multi-class
resecuritization trusts are trusts we create to issue multi-class Fannie Mae structured securities, including real-estate
mortgage investment conduits (“REMIC”) and stripped mortgage-backed securities (“SMBS”), in which the cash flows of
the underlying mortgage assets are divided, creating several classes of securities, each of which represents a beneficial
ownership interest in a separate portion of the cash flows.
We guaranty to each Fannie Mae resecuritization trust that we will supplement amounts received by the trust as
required to permit timely principal and interest payments on the related Fannie Mae security. As the underlying collateral
may have been previously guaranteed by Fannie Mae, we are only exposed to incremental credit risk when we guaranty
the timely payment of principal and interest on underlying securities that were issued by Freddie Mac and were not
previously guaranteed by us. We may also be exposed to prepayment risk via our ownership of securities issued by
these trusts. Additionally, we earn a fee for assisting the lenders and dealers with the design and issuance of these
securities.
We do not have any incremental rights or powers related to resecuritization trusts that would enable us to direct any
activities of the underlying trust. As a result, we have concluded that we are not the primary beneficiary of, and therefore
do not consolidate, our resecuritization trusts unless we have the unilateral right to dissolve the trust. We have this right
when we hold 100% of the beneficial interests issued by the resecuritization trust.
Limited Partnerships
We invest in various limited partnerships that sponsor affordable housing projects utilizing the LIHTC pursuant to
Section 42 of the Internal Revenue Code. The purpose of these investments is to increase the supply of affordable
housing in the United States and to serve communities in need. In addition, our investments in LIHTC partnerships
generate both tax credits and net operating losses that may reduce our federal income tax liability. Our LIHTC
investments primarily represent limited partnership interests in entities that have been organized by a fund manager
who acts as the general partner. These LIHTC partnerships seek out equity investments in LIHTC operating
partnerships that have been established to identify, develop and operate multifamily housing that is leased to qualifying
residential tenants. Fannie Mae does not consolidate these entities because our limited partnership interest does not
provide us with a controlling financial interest.
Special Purpose Vehicles Associated with Our Credit Risk Transfer Programs
We transfer mortgage credit risk to investors through both Connecticut Avenue Securities (“CAS”) special purpose
vehicles (“SPVs”) and Multifamily Connecticut Avenue Securities (“MCAS”) SPVs. CAS and MCAS SPVs are separate
legal entities that issue notes that are fully collateralized by cash deposited into a collateral account held by the
respective CAS or MCAS SPV and is invested in short-term highly rated investments. To the extent that collateral held
by the CAS or MCAS SPV and the earnings thereon are insufficient relative to the payments due to holders of the CAS
or MCAS notes, we may be required to make payments to the CAS or MCAS SPVs. The CAS and MCAS SPV qualify
as VIEs. We do not have the power to direct significant activities of the CAS or MCAS SPVs while the CAS and MCAS
SPVs are outstanding, and, therefore, we do not consolidate CAS or MCAS SPVs.
Notes to Consolidated Financial Statements | Consolidations and Transfers of Financial Assets | ||
Fannie Mae (In conservatorship) 2023 Form 10-K | F-24 | |
carrying amount and classification of our assets and liabilities that relate to our involvement with unconsolidated
securitization and resecuritization trusts.
As of December 31, | |||||||
2023 | 2022 | ||||||
(Dollars in millions) | |||||||
Assets and liabilities recorded in our consolidated balance sheets related to unconsolidated mortgage-backed trusts: | |||||||
Investments in securities, at fair value | $ | $ | |||||
Other assets | |||||||
Other liabilities | ( | ( | |||||
Net carrying amount | $ | $ | |||||
Our maximum exposure to loss generally represents the greater of our carrying amount related to our involvement with
unconsolidated securitization and resecuritization trusts or the unpaid principal balance of the assets covered by our
guaranty. Our involvement in unconsolidated resecuritization trusts may give rise to additional exposure to loss
depending on the type of resecuritization trust. Fannie Mae resecuritization trusts that are backed entirely by Fannie
Mae MBS are not consolidated and do not give rise to any additional exposure to loss as we already consolidate the
underlying collateral. In contrast, Fannie Mae resecuritization trusts that are backed in whole or in part by Freddie Mac
securities may increase our exposure to loss to the extent that we are providing a guaranty for the timely payment and
interest on the underlying Freddie Mac securities that we have not previously guaranteed. Our maximum exposure to
loss for these unconsolidated trusts is measured by the amount of Freddie Mac securities that are held in these
resecuritization trusts.
Our maximum exposure to loss related to unconsolidated securitization and resecuritization trusts, which includes but is
not limited to our exposure to these Freddie Mac securities, was approximately $223 billion and $240 billion as of
December 31, 2023 and 2022, respectively. The total assets of our unconsolidated securitization and resecuritization
trusts were approximately $273 billion and $240 billion as of December 31, 2023 and 2022, respectively.
The maximum exposure to loss for our unconsolidated limited partnerships and similar legal entities, which consist of
LIHTC, community investments and other entities, was $530 million and the related net carrying value was $528 million
as of December 31, 2023. As of December 31, 2022, the maximum exposure to loss was $427 million and the related
net carrying value was $424 million. The total assets of these limited partnership investments were $5.8 billion and $4.3
billion as of December 31, 2023 and 2022, respectively.
The maximum exposure to loss related to our involvement with unconsolidated SPVs that transfer credit risk represents
the unpaid principal balance and accrued interest payable of obligations issued by the CAS and MCAS SPVs. The
maximum exposure to loss related to these unconsolidated SPVs was $21.4 billion and $16.9 billion as of December 31,
2023 and 2022, respectively. The total assets related to these unconsolidated SPVs were $21.4 billion and $17.0 billion
as of December 31, 2023 and 2022, respectively.
The unpaid principal balance of our multifamily loan portfolio was $461.2 billion as of December 31, 2023. As our
lending relationship does not provide us with a controlling financial interest in the borrower entity, we do not consolidate
these borrowers regardless of their status as either a VIE or a voting interest entity. We have excluded these entities
from our VIE disclosures. However, the disclosures we have provided in “Note 4, Mortgage Loans,” “Note 5, Allowance
for Loan Losses” and “Note 7, Financial Guarantees” with respect to this population are consistent with the FASB’s
stated objectives for the disclosures related to unconsolidated VIEs.
As noted below, we consolidate the substantial majority of our single-class securitization trusts. The assets and liabilities
of consolidated trusts created via portfolio securitization transactions are reported in our consolidated balance sheets.
We recognize assets obtained and liabilities incurred in qualifying sales of portfolio securitizations at fair value. We had
2022 or 2021.
We issue single-class Fannie Mae MBS through portfolio securitization transactions by transferring pools of mortgage
loans or mortgage-related securities to one or more trusts or special purpose entities. For the years ended December
31, 2023, 2022 and 2021, the unpaid principal balance of portfolio securitizations was $131.6 billion, $270.5 billion and
$682.9 billion, respectively. The substantial majority of these portfolio securitization transactions generally do not qualify
Notes to Consolidated Financial Statements | Consolidations and Transfers of Financial Assets | ||
Fannie Mae (In conservatorship) 2023 Form 10-K | F-25 | |
for sale treatment. Portfolio securitization trusts that do qualify for sale treatment primarily consist of loans that are
guaranteed or insured, in whole or in part, by the U.S. government as such transactions are not consolidated by Fannie
Mae.
We retain interests from the transfer and sale of mortgage-related securities to unconsolidated single-class portfolio
securitization trusts and unconsolidated single class and multi-class portfolio resecuritization trusts. As of December 31,
2023, the unpaid principal balance of retained interests was $821 million and its related fair value was $1.3 billion. The
unpaid principal balance of retained interests was $910 million and its related fair value was $1.4 billion as of December
31, 2022. For the years ended December 31, 2023, 2022 and 2021, the principal, interest and other fees received on
retained interests was $282 million, $397 million and $558 million, respectively.
4. Mortgage Loans
mortgage loans, which are secured by five or more residential dwelling units. We classify these loans as either HFI or
HFS. Unless otherwise noted, within “Note 4, Mortgage Loans,” we report the amortized cost of HFI loans for which we
have not elected the fair value option at the unpaid principal balance, net of unamortized premiums and discounts,
hedge-related basis adjustments, other cost basis adjustments, and accrued interest receivable. Within our consolidated
balance sheets, we present accrued interest receivable, net separately from the amortized cost of our loans held for
investment. We report the carrying value of HFS loans at the lower of cost or fair value and record valuation changes in
“Investment gains (losses), net” in our consolidated statements of operations and comprehensive income.
Within our single-family mortgage loan disclosures below, we display loans by class of financing receivable type.
Financing receivable classes used for disclosure consist of: “20- and 30-year or more, amortizing fixed-rate,” “15-year or
less, amortizing fixed-rate,” “Adjustable-rate,” and “Other.” The “Other” class primarily consists of reverse mortgage
loans, interest-only loans, negative-amortizing loans and second liens.
As of December 31, | ||||
2023 | 2022 | |||
(Dollars in millions) | ||||
Single-family | $ | $ | ||
Multifamily | ||||
Total unpaid principal balance of mortgage loans | ||||
Cost basis and fair value adjustments, net | ||||
Allowance for loan losses for HFI loans | ( | ( | ||
Total mortgage loans(1) | $ | $ | ||
(1)Excludes $10.4 billion and $9.5 billion of accrued interest receivable, net of allowance as of December 31, 2023 and 2022.
Notes to Consolidated Financial Statements | Consolidations and Transfers of Financial Assets | ||
Fannie Mae (In conservatorship) 2023 Form 10-K | F-26 | |
The following table displays information about our purchase of HFI loans, redesignation of loans and the sales of
mortgage loans during the period.
For the Year Ended December 31, | ||||||
2023 | 2022 | 2021 | ||||
(Dollars in millions) | ||||||
Purchase of HFI loans: | ||||||
Single-family unpaid principal balance | $ | $ | $ | |||
Multifamily unpaid principal balance | ||||||
Single family loans redesignated from HFI to HFS: | ||||||
Amortized cost | $ | $ | $ | |||
Lower of cost or fair value adjustment at time of redesignation(1) | ( | ( | ( | |||
Allowance reversed at time of redesignation | ||||||
Single family loans redesignated from HFS to HFI: | ||||||
Amortized cost | $ | $ | $ | |||
Single-family loans sold: | ||||||
Unpaid principal balance | $ | $ | $ | |||
Realized gains, net | ||||||
(1)Consists of the write-off against the allowance at the time of redesignation.
The amortized cost of single-family mortgage loans for which formal foreclosure proceedings were in process was $4.6
billion as of December 31, 2023 and 2022. As a result of our various loss mitigation and foreclosure prevention efforts,
we expect that a portion of the loans in the process of formal foreclosure proceedings will not ultimately foreclose.
Notes to Consolidated Financial Statements | Mortgage Loans | ||
Fannie Mae (In conservatorship) 2023 Form 10-K | F-27 | |
segment and class of financing receivable, excluding loans for which we have elected the fair value option.
As of December 31, 2023 | ||||||||||||||||
30 - 59 Days Delinquent | 60 - 89 Days Delinquent | Seriously Delinquent(1) | Total Delinquent | Current | Total | Loans 90 Days or More Delinquent and Accruing Interest | Nonaccrual Loans with No Allowance | |||||||||
(Dollars in millions) | ||||||||||||||||
Single-family: | ||||||||||||||||
20- and 30-year or more, amortizing fixed-rate | $ | $ | $ | $ | $ | $ | $ | $ | ||||||||
15-year or less, amortizing fixed-rate | ||||||||||||||||
Adjustable-rate | ||||||||||||||||
Other(2) | ||||||||||||||||
Total single-family | ||||||||||||||||
Multifamily(3) | N/A | |||||||||||||||
Total | $ | $ | $ | $ | $ | $ | $ | $ | ||||||||
As of December 31, 2022 | ||||||||||||||||
30 - 59 Days Delinquent | 60 - 89 Days Delinquent | Seriously Delinquent(1) | Total Delinquent | Current | Total | Loans 90 Days or More Delinquent and Accruing Interest | Nonaccrual Loans with No Allowance | |||||||||
(Dollars in millions) | ||||||||||||||||
Single-family: | ||||||||||||||||
20- and 30-year or more, amortizing fixed-rate | $ | $ | $ | $ | $ | $ | $ | $ | ||||||||
15-year or less, amortizing fixed-rate | ||||||||||||||||
Adjustable-rate | ||||||||||||||||
Other(2) | ||||||||||||||||
Total single-family | ||||||||||||||||
Multifamily(3) | N/A | |||||||||||||||
Total | $ | $ | $ | $ | $ | $ | $ | $ | ||||||||
(1)Single-family seriously delinquent loans are loans that are 90
delinquent loans are loans that are 60
(2)Reverse mortgage loans included in “Other” are not aged due to their nature and are included in the current column.
(3)Multifamily loans 60 89
for single-family loans. As LTV ratios increase, the borrower’s equity in the home decreases, which may negatively
Notes to Consolidated Financial Statements | Mortgage Loans | ||
Fannie Mae (In conservatorship) 2023 Form 10-K | F-28 | |
affect the borrower’s ability to refinance or to sell the property for an amount at or above the outstanding balance of the
loan.
cost. Effective January 1, 2023, we adopted amendments to ASU 2022-02 that require us to disclose current-period
gross write-offs by year of origination for financing receivables. As a result, for the periods beginning January 1, 2023,
the tables below include current year write-offs of our single-family HFI mortgage loans by class of financing receivable
and year of origination, excluding loans for which we have elected the fair value option.
Credit Quality Indicators as of December 31, 2023 and Write-offs for the year ended December 31, 2023, by Year of Origination(1) | ||||||||||||||
2023 | 2022 | 2021 | 2020 | 2019 | Prior | Total | ||||||||
(Dollars in millions) | ||||||||||||||
Estimated mark-to-market LTV ratio:(2) | ||||||||||||||
20- and 30-year or more, amortizing fixed-rate: | ||||||||||||||
Less than or equal to 80% | $ | $ | $ | $ | $ | $ | $ | |||||||
Greater than 80% and less than or equal to 90% | ||||||||||||||
Greater than 90% and less than or equal to 100% | ||||||||||||||
Greater than 100% | ||||||||||||||
Total 20- and 30-year or more, amortizing fixed-rate | ||||||||||||||
Current-year 20- and 30-year or more, amortizing fixed-rate write-offs | $ | $ | $ | $ | $ | $ | $ | |||||||
15-year or less, amortizing fixed-rate: | ||||||||||||||
Less than or equal to 80% | ||||||||||||||
Greater than 80% and less than or equal to 90% | ||||||||||||||
Greater than 90% and less than or equal to 100% | ||||||||||||||
Greater than 100% | ||||||||||||||
Total 15-year or less, amortizing fixed-rate | ||||||||||||||
Current-year 15-year or less, amortizing fixed-rate write-offs | ||||||||||||||
Adjustable-rate: | ||||||||||||||
Less than or equal to 80% | ||||||||||||||
Greater than 80% and less than or equal to 90% | ||||||||||||||
Greater than 90% and less than or equal to 100% | ||||||||||||||
Greater than 100% | ||||||||||||||
Total adjustable-rate | ||||||||||||||
Current-year adjustable-rate write-offs | ||||||||||||||
Other: | ||||||||||||||
Less than or equal to 80% | ||||||||||||||
Greater than 80% and less than or equal to 90% | ||||||||||||||
Greater than 90% and less than or equal to 100% | ||||||||||||||
Greater than 100% | ||||||||||||||
Total other | ||||||||||||||
Current-year other write-offs | ||||||||||||||
Total for all classes by LTV ratio:(2) | ||||||||||||||
Less than or equal to 80% | $ | $ | $ | $ | $ | $ | $ | |||||||
Greater than 80% and less than or equal to 90% | ||||||||||||||
Greater than 90% and less than or equal to 100% | ||||||||||||||
Greater than 100% | ||||||||||||||
Total | $ | $ | $ | $ | $ | $ | $ | |||||||
Total current-year write-offs | $ | $ | $ | $ | $ | $ | $ | |||||||
Notes to Consolidated Financial Statements | Mortgage Loans | ||
Fannie Mae (In conservatorship) 2023 Form 10-K | F-29 | |
Credit Quality Indicators of December 31, 2022, by Year of Origination(1) | ||||||||||||||
2022 | 2021 | 2020 | 2019 | 2018 | Prior | Total | ||||||||
(Dollars in millions) | ||||||||||||||
Estimated mark-to-market LTV ratio:(2) | ||||||||||||||
20- and 30-year or more, amortizing fixed-rate: | ||||||||||||||
Less than or equal to 80% | $ | $ | $ | $ | $ | $ | $ | |||||||
Greater than 80% and less than or equal to 90% | ||||||||||||||
Greater than 90% and less than or equal to 100% | ||||||||||||||
Greater than 100% | ||||||||||||||
Total 20- and 30-year or more, amortizing fixed-rate | ||||||||||||||
15-year or less, amortizing fixed-rate: | ||||||||||||||
Less than or equal to 80% | ||||||||||||||
Greater than 80% and less than or equal to 90% | ||||||||||||||
Greater than 90% and less than or equal to 100% | ||||||||||||||
Greater than 100% | ||||||||||||||
Total 15-year or less, amortizing fixed-rate | ||||||||||||||
Adjustable-rate: | ||||||||||||||
Less than or equal to 80% | ||||||||||||||
Greater than 80% and less than or equal to 90% | ||||||||||||||
Greater than 90% and less than or equal to 100% | ||||||||||||||
Greater than 100% | ||||||||||||||
Total adjustable-rate | ||||||||||||||
Other: | ||||||||||||||
Less than or equal to 80% | ||||||||||||||
Greater than 80% and less than or equal to 90% | ||||||||||||||
Greater than 90% and less than or equal to 100% | ||||||||||||||
Greater than 100% | ||||||||||||||
Total other | ||||||||||||||
Total | $ | $ | $ | $ | $ | $ | $ | |||||||
Total for all classes by LTV ratio:(2) | ||||||||||||||
Less than or equal to 80% | $ | $ | $ | $ | $ | $ | $ | |||||||
Greater than 80% and less than or equal to 90% | ||||||||||||||
Greater than 90% and less than or equal to 100% | ||||||||||||||
Greater than 100% | ||||||||||||||
Total | $ | $ | $ | $ | $ | $ | $ | |||||||
(1)Excludes $5.5 billion and $9.5 billion as of December 31, 2023 and 2022, respectively, of mortgage loans guaranteed or insured, in whole
or in part, by the U.S. government or one of its agencies, which represents primarily reverse mortgages for which we do not calculate an
estimated mark-to-market LTV ratio. For the year ended December 31, 2023, it also excludes $7 million in write-offs, of mortgage loans
guaranteed or insured, in whole or in part, by the U.S. government or one of its agencies. Year of loan origination may not be the same as
the period in which we subsequently acquired the loan.
(2)The aggregate estimated mark-to-market LTV ratio is based on the unpaid principal balance of the loan divided by the estimated current
value of the property as of the end of each reported period, which we calculate using an internal valuation model that estimates periodic
changes in home value.
Notes to Consolidated Financial Statements | Mortgage Loans | ||
Fannie Mae (In conservatorship) 2023 Form 10-K | F-30 | |
rating, excluding loans for which we have elected the fair value option. Property rental income and property valuations
are key inputs to our internally assigned credit risk ratings. For the periods beginning January 1, 2023, the tables below
include current year write-offs of our multifamily HFI mortgage loans by year of origination, excluding loans for which we
have elected the fair value option.
Credit Quality Indicators as of December 31, 2023 and Write-offs for the year ended December 31, 2023, by Year of Origination(1) | ||||||||||||||
2023 | 2022 | 2021 | 2020 | 2019 | Prior | Total | ||||||||
(Dollars in millions) | ||||||||||||||
Internally assigned credit risk rating: | ||||||||||||||
Pass(2) | $ | $ | $ | $ | $ | $ | $ | |||||||
Special mention(3) | ||||||||||||||
Substandard(4) | ||||||||||||||
Doubtful(5) | ||||||||||||||
Total | $ | $ | $ | $ | $ | $ | $ | |||||||
Current-year write-offs | $ | $ | $ | $ | $ | $ | $ | |||||||
Credit Quality Indicators as of December 31, 2022, by Year of Origination(1) | ||||||||||||||
2022 | 2021 | 2020 | 2019 | 2018 | Prior | Total | ||||||||
(Dollars in millions) | ||||||||||||||
Internally assigned credit risk rating: | ||||||||||||||
Pass(2) | $ | $ | $ | $ | $ | $ | $ | |||||||
Special mention(3) | ||||||||||||||
Substandard(4) | ||||||||||||||
Doubtful(5) | ||||||||||||||
Total | $ | $ | $ | $ | $ | $ | $ | |||||||
(1)In the current period, we updated our presentation of credit quality indicators. Previously, “Pass” and “Special mention” were disclosed as
“Non-classified,” and “Substandard” and “Doubtful” were disclosed as “Classified.” Prior periods have been updated to conform to the
current period presentation. Year of loan origination may not be the same as the period in which we subsequently acquired the loan.
(2)A loan categorized as “Pass” is current or adequately protected by the current financial strength and debt service capability of the
borrower.
(3)“Special mention” refers to loans that are otherwise performing but have potential weaknesses that, if left uncorrected, may result in
deterioration in the borrower’s ability to repay in full.
(4)Loans classified as “Substandard” have a well-defined weakness that jeopardizes the timely full repayment. We had loans in our seniors
housing portfolio with an amortized cost of $6.9 billion and $9.2 billion as of December 31, 2023 and 2022, respectively, classified as
substandard.
(5)“Doubtful” refers to a loan with a weakness that makes collection or liquidation in full highly questionable and improbable based on existing
Difficulty
As part of our loss mitigation activities, we may agree to modify the contractual terms of a loan to a borrower
experiencing financial difficulty. In addition to loan modifications, we also provide other loss mitigation options to assist
borrowers who experience financial difficulties.
Below we provide disclosures relating to loan restructurings where borrowers were experiencing financial difficulty,
including restructurings that resulted in an insignificant payment delay. The disclosures exclude loans classified as held
for sale and those for which we have elected the fair value option. See “Note 1, Summary of Significant Accounting
Policies” for additional information on our accounting policies for single-family and multifamily loans that have been
restructured.
Notes to Consolidated Financial Statements | Mortgage Loans | ||
Fannie Mae (In conservatorship) 2023 Form 10-K | F-31 | |
Single-Family Loan Restructurings
We offer several types of restructurings to single-family borrowers that may result in a payment delay, interest rate
reduction, term extension, or combination thereof. We do not typically offer principal forgiveness.
We offer the following types of restructurings to single-family borrowers that only result in a payment delay:
•a forbearance plan is a short-term loss mitigation option which grants a period of time (typically in 6-month
increments and generally do not exceed a total of 12 months) during which the borrower’s monthly payment
obligations are reduced or suspended. A forbearance plan does not impact our reporting of when a loan is
considered past due, which remains based on the contractual terms of the loan. Borrowers may exit a
forbearance plan by repaying all past due amounts to fully reinstate the loan, paying off the loan in full, or
entering into another loss mitigation option, such as a repayment plan, a payment deferral, or a loan
modification.
•a repayment plan is a short-term loss mitigation option that allows borrowers a specific period of time to return
the loan to current status by paying the regular monthly payment plus additional agreed-upon delinquent
amounts (generally for a period up to 12 months and the monthly repayment plan amount must not exceed
150% of the contractual mortgage payment). A repayment plan does not impact our reporting of when a loan is
considered past due, which remains based on the contractual terms of the loan. At the end of the repayment
plan, the borrower resumes making the regular monthly payment; and
•a payment deferral is a loss mitigation option which defers the repayment of the delinquent principal and
interest payments and other eligible default-related amounts that were advanced on behalf of the borrower by
converting them into a non-interest-bearing balance due at the earlier of the payoff date, the maturity date, or
sale or transfer of the property. The remaining mortgage terms, interest rate, payment schedule, and maturity
date remain unchanged, and no trial period is required. The number of months of payments deferred varies
based on the types of hardships the borrower is facing.
We also offer single-family borrowers loan modifications, which contractually change the terms of the loan. Our loan
modification programs generally require completion of a trial period of three to four months where the borrower makes
reduced monthly payments prior to receiving the modification. During the trial period, the mortgage loan is not
contractually modified and continues to be reported as past due according to its contractual terms. The reduced
payments that are made by the borrower during the trial period will result in a payment delay with respect to the original
contractual terms of the loan. After successful completion of the trial period, and the borrower’s execution of a
modification agreement, the mortgage loan is contractually modified.
Our loan modifications include the following concessions:
•capitalization of past due amounts, a form of payment delay, which capitalizes interest and other eligible default
related amounts that were advanced on behalf of the borrower that are past due into the unpaid principal
balance; and
•a term extension, which typically extends the contractual maturity date of the loan to 40 years from the effective
date of the modification.
In addition to these concessions, loan modifications may also include an interest rate reduction, which reduces the
contractual interest rate of the loan, or a principal forbearance, which is another form of payment delay that includes
forbearing repayment of a portion of the principal balance as a non-interest bearing amount that is due at the earlier of
the payoff date, the maturity date, or sale or transfer of the property.
Multifamily Loan Restructurings
For multifamily borrowers, loan restructurings include short-term forbearance plans and loan modification programs,
which primarily result in term extensions of up to one year with no change to the loan’s interest rate. In certain cases,
we may make more significant modifications of terms for borrowers experiencing financial difficulty, such as reducing the
interest rate, converting to interest-only payments, extending the maturity for longer than one year, providing principal
forbearance, or some combination of these terms. In some instances when a loan is restructured, we may require
additional collateral, which may take the form of a guaranty from another entity, to further mitigate the risk of
nonperformance.
Notes to Consolidated Financial Statements | Mortgage Loans | ||
Fannie Mae (In conservatorship) 2023 Form 10-K | F-32 | |
Restructurings for Borrowers Experiencing Financial Difficulty
segment and class of financing receivable.
For the Year Ended December 31, 2023 | ||||||||||||||
Payment Delay (Only) | ||||||||||||||
Forbearance Plan | Payment Deferral | Trial Modification and Repayment Plans | Payment Delay and Term Extension(1) | Payment Delay, Term Extension, Interest Rate Reduction, and Other(1) | Total | Percentage of Total by Financing Class(2) | ||||||||
(Dollars in millions) | ||||||||||||||
Single-family: | ||||||||||||||
20- and 30-year or more, amortizing fixed-rate | $ | $ | $ | $ | $ | $ | ||||||||
15-year or less, amortizing fixed- rate | * | |||||||||||||
Adjustable-rate | ||||||||||||||
Other | ||||||||||||||
Total single-family | ||||||||||||||
Multifamily | * | |||||||||||||
Total(3) | $ | $ | $ | $ | $ | $ | ||||||||
For the Year Ended December 31, 2022 | ||||||||||||||
Payment Delay (Only) | ||||||||||||||
Forbearance Plan | Payment Deferral | Trial Modification and Repayment Plans | Payment Delay and Term Extension(1) | Payment Delay, Term Extension and Interest Rate Reduction(1) | Total | Percentage of Total by Financing Class(2) | ||||||||
(Dollars in millions) | ||||||||||||||
Single-family: | ||||||||||||||
20- and 30-year or more, amortizing fixed-rate | $ | $ | $ | $ | $ | $ | ||||||||
15-year or less, amortizing fixed-rate | * | |||||||||||||
Adjustable-rate | ||||||||||||||
Other | ||||||||||||||
Total single-family | ||||||||||||||
Multifamily | * | |||||||||||||
Total(3) | $ | $ | $ | $ | $ | $ | ||||||||
*Represents less than 0.5
(1)Represents loans that received a contractual modification.
(2)Based on the amortized cost basis as of period end, divided by the period end amortized cost basis of the corresponding class of financing
receivable.
(3)Excludes $1.8 billion and $4.0 billion for the year ended December 31, 2023 and December 31, 2022, respectively, for loans that received
a loss mitigation activity during the period that paid off, repurchased or sold prior to period end. Also excludes loans that liquidated either
through foreclosure, deed-in-lieu of foreclosure, or a short sale. Loans may move from one category to another, as a result of the
restructuring(s) they received during the period.
Notes to Consolidated Financial Statements | Mortgage Loans | ||
Fannie Mae (In conservatorship) 2023 Form 10-K | F-33 | |
Our estimate of future credit losses uses a lifetime methodology, derived from modeled loan performance based on the
extensive historical experience of loans with similar risk characteristics, adjusted to reflect current conditions and
reasonable and supportable forecasts. The historical loss experience used in our single-family and multifamily credit
loss models includes the impact of the loss mitigation options provided to borrowers experiencing financial difficulty, and
also includes the impact of projected loss severities as a result of a loan default.
HFI loans presented by class of financing receivable. We discuss the qualitative impacts of forbearance plans,
repayment plans, and trial modifications earlier in this footnote. As a result, those loss mitigation options are excluded
from the table below.
For the Year Ended December 31, | ||||||||||||
2023 | 2022 | |||||||||||
Weighted- Average Interest Rate Reduction | Weighted- Average Term Extension (in Months) | Average Amount Capitalized as a Result of a Payment Delay(1) | Weighted- Average Interest Rate Reduction | Weighted- Average Term Extension (in Months) | Average Amount Capitalized as a Result of a Payment Delay(1) | |||||||
Loan by class of financing receivable:(2) | ||||||||||||
20- and 30-year or more, amortizing fixed-rate | $ | $ | ||||||||||
15-year or less, amortizing fixed-rate | ||||||||||||
Adjustable-rate | ||||||||||||
Other | ||||||||||||
(1)Represents the average amount of delinquency-related amounts that were capitalized as part of the loan balance. Amounts are in whole
dollars.
completed modification or payment deferral in the twelve months prior to the payment default. The substantial majority
of loans that received a completed modification or a payment deferral during the fourth quarter of 2023 did not default
during the period. For purposes of this disclosure, we define loans that had a payment default as single-family loans
with completed modifications that are two or more months delinquent during the period; or multifamily loans with
completed modifications that are one or more months delinquent during the period. For loans that receive a forbearance
plan, repayment plan or trial modification, these loss mitigation options generally remain in default until the loan is no
longer delinquent as a result of the payment of all past-due amounts or as a result of a loan modification or payment
deferral. Therefore, forbearance plans, repayment plans and trial modifications are not included in default tables below.
For the Year Ended December 31, 2023 | |||||||||
Payment Delay as a Result of a Payment Deferral (Only) | Payment Delay and Term Extension | Payment Delay, Term Extension, Interest Rate Reduction, and Other | Total | ||||||
(Dollars in millions) | |||||||||
Single-family: | |||||||||
20- and 30-year or more, amortizing fixed-rate | $ | $ | $ | $ | |||||
15-year or less, amortizing fixed-rate | |||||||||
Adjustable-rate | |||||||||
Other | |||||||||
Total single-family | |||||||||
Multifamily | |||||||||
Total loans that subsequently defaulted(1) | $ | $ | $ | $ | |||||
(1)Represents amortized cost as of period end. Excludes loans that liquidated either through foreclosure, deed-in-lieu of foreclosure, or a
short sale.
Notes to Consolidated Financial Statements | Mortgage Loans | ||
Fannie Mae (In conservatorship) 2023 Form 10-K | F-34 | |
on or after January 1, 2022, the date we adopted ASU 2022-02, through December 31, 2022 and that defaulted in the
period presented. The substantial majority of loans that received a completed modification or a payment deferral during
the fourth quarter of 2022 did not default during the period.
For the Year Ended December 31, 2022 | |||||||||
Payment Delay as a Result of a Payment Deferral (Only) | Payment Delay and Term Extension | Payment Delay, Term Extension and Interest Rate Reduction | Total | ||||||
(Dollars in millions) | |||||||||
Single-family: | |||||||||
20- and 30-year or more, amortizing fixed-rate | $ | $ | $ | $ | |||||
15-year or less, amortizing fixed-rate | |||||||||
Adjustable-rate | |||||||||
Other | |||||||||
Total single-family | |||||||||
Multifamily | |||||||||
Total loans that subsequently defaulted(1) | $ | $ | $ | $ | |||||
(1)Represents amortized cost as of period end. Excludes loans that liquidated either through foreclosure, deed-in-lieu of foreclosure, or a
short sale.
prior to December 31, 2023 and December 31, 2022, respectively, presented by portfolio segment and class of
financing receivable.
As of December 31, 2023(1) | ||||||||||||
30-59 Days Delinquent | 60-89 Days Delinquent(2) | Seriously Delinquent | Total Delinquent | Current | Total | |||||||
(Dollars in millions) | ||||||||||||
Single-family: | ||||||||||||
20- and 30-year or more, amortizing fixed-rate | $ | $ | $ | $ | $ | $ | ||||||
15-year or less, amortizing fixed-rate | ||||||||||||
Adjustable-rate | ||||||||||||
Other | ||||||||||||
Total single-family loans modified | ||||||||||||
Multifamily | N/A | |||||||||||
Total loans restructured(3) | $ | $ | $ | $ | $ | $ | ||||||
Notes to Consolidated Financial Statements | Mortgage Loans | ||
Fannie Mae (In conservatorship) 2023 Form 10-K | F-35 | |
As of December 31, 2022(1) | ||||||||||||
30-59 Days Delinquent | 60-89 Days Delinquent(2) | Seriously Delinquent | Total Delinquent | Current | Total | |||||||
(Dollars in millions) | ||||||||||||
Single-family: | ||||||||||||
20- and 30-year or more, amortizing fixed-rate | $ | $ | $ | $ | $ | $ | ||||||
15-year or less, amortizing fixed-rate | ||||||||||||
Adjustable-rate | ||||||||||||
Other | ||||||||||||
Total single-family loans modified | ||||||||||||
Multifamily | N/A | |||||||||||
Total loans restructured(3) | $ | $ | $ | $ | $ | $ | ||||||
(1)As of December, 31 2023, the substantial majority of loans that received a completed modification or a payment deferral during the fourth
quarter of 2023 were not delinquent as of December 31, 2023. As of December 31, 2022, the substantial majority of loans that received a
completed modification or a payment deferral during the fourth quarter of 2022 were not delinquent as of December 31, 2022.
(2)Multifamily loans 60-89 days delinquent are included in the seriously delinquent column.
(3)Represents the amortized cost basis as of period end.
Troubled Debt Restructuring Disclosures Prior to Our Adoption of ASU 2022-02
granting a concession to a borrower experiencing financial difficulties as a TDR. In addition to formal loan modifications,
we accounted for informal restructurings as a TDR if we deferred more than three missed payments to a borrower
experiencing financial difficulty. We also classified bankruptcy relief provided to certain borrowers as TDRs. However,
our TDR accounting described herein was suspended for most of our loss mitigation activities through our election to
account for certain eligible loss mitigation activities occurring between March 2020 and January 1, 2022 under the
COVID-19 relief granted pursuant to the CARES Act and the Consolidated Appropriations Act of 2021. Effective January
1, 2022, we adopted ASU 2022-02, which eliminated TDR accounting prospectively for all restructurings occurring on or
after January 1, 2022. Loans that were restructured in a TDR prior to the adoption of ASU 2022-02 will continue to be
accounted for under the historical TDR accounting until the loan is paid off, liquidated or subsequently modified.
The substantial majority of the loan modifications accounted for as TDRs resulted from a payment delay, term
extension, interest rate reduction or a combination thereof. The average term extension of a single-family modified loan
was 145 months for the year ended December 31, 2021. The average interest rate reduction was 0.57 percentage
points for the year ended December 31, 2021.
For the Year Ended December 31, 2021 | ||||
Number of Loans | Amortized Cost | |||
(Dollars in millions) | ||||
Single-family: | ||||
20- and 30-year or more, amortizing fixed rate | $ | |||
15-year or less, amortizing fixed rate | ||||
Adjustable-rate | ||||
Other | ||||
Total single-family | ||||
Multifamily | ||||
Total TDRs | $ | |||
For loans that defaulted in the period presented and that were classified as a TDR in the twelve months prior to the
default, the following table displays the number of loans and the amortized cost of these loans at the time of payment
Notes to Consolidated Financial Statements | Mortgage Loans | ||
Fannie Mae (In conservatorship) 2023 Form 10-K | F-36 | |
default. For purposes of this disclosure, we define loans that had a payment default as: single-family and multifamily
loans with completed modifications that liquidated during the period, either through foreclosure, deed-in-lieu of
foreclosure, or a short sale; single-family loans with completed modifications that are two or more months delinquent
during the period; or multifamily loans with completed modifications that are one or more months delinquent during the
period.
For the Year Ended December 31, 2021 | ||||
Number of Loans | Amortized Cost | |||
(Dollars in millions) | ||||
Single-family: | ||||
20- and 30-year or more, amortizing fixed rate | $ | |||
15-year or less, amortizing fixed rate | ||||
Adjustable-rate | ||||
Other | ||||
Total single-family | ||||
Multifamily | ||||
Total TDRs that subsequently defaulted | $ | |||
nonaccrual loans. See “Note 1, Summary of Significant Accounting Policies” for more information about our policy for
nonaccrual loans including information about our COVID-19-related nonaccrual policy.
For the Year Ended December 31, | ||||||
2023 | 2022 | 2021 | ||||
(Dollars in millions) | ||||||
Accrued interest receivable written off through the reversal of interest income: | ||||||
Single-family | $ | $ | $ | |||
Multifamily | ||||||
The table below includes the amortized cost of and interest income recognized on our HFI single-family and multifamily
loans on nonaccrual status by class, excluding loans for which we have elected the fair value option.
As of December 31, | For the Year Ended December 31, | |||||||||||||
2023 | 2022 | 2021 | 2020 | 2023 | 2022 | 2021 | ||||||||
Amortized Cost(1) | Total Interest Income Recognized(2) | |||||||||||||
(Dollars in millions) | ||||||||||||||
Single-family: | ||||||||||||||
20- and 30-year or more, amortizing fixed-rate | $ | $ | $ | $ | $ | $ | $ | |||||||
15-year or less, amortizing fixed- rate | ||||||||||||||
Adjustable-rate | ||||||||||||||
Other | ||||||||||||||
Total single-family | ||||||||||||||
Multifamily | ||||||||||||||
Total nonaccrual loans | $ | $ | $ | $ | $ | $ | $ | |||||||
(1)Amortized cost is presented net of any write-offs, which are recognized when a loan balance is deemed uncollectible.
Notes to Consolidated Financial Statements | Mortgage Loans | ||
Fannie Mae (In conservatorship) 2023 Form 10-K | F-37 | |
(2)Interest income recognized includes amortization of any deferred cost basis adjustments while the loan is performing and that is not
reversed when the loan is placed on nonaccrual status. For loans negatively impacted by the COVID-19 pandemic, also includes amounts
accrued but not collected prior to the loan being placed on nonaccrual status. For single-family, interest income recognized includes
payments received on nonaccrual loans held as of period end.
For the Year Ended December 31, | ||||||
2023 | 2022 | 2021 | ||||
(Dollars in millions) | ||||||
Non-cash activities related to mortgage loans: | ||||||
Mortgage loans acquired by assuming debt | $ | $ | $ | |||
Net transfers from mortgage loans of Fannie Mae to mortgage loans of consolidated trusts | ||||||
Mortgage loans received by consolidated trusts to satisfy advances to lenders | ||||||
Transfers from mortgage loans to acquired property | ||||||
Subsequent to the issuance of our 2022 consolidated financial statements, we identified an error in the disclosure of
non-cash activities of mortgage loans acquired by assuming debt, presented as supplemental information to the
consolidated statement of cash flows for the year ended December 31, 2022. We concluded that $61,678 million of non-
cash activities was excluded from the previously reported amount of $185,205 million in the disclosure. Therefore, we
restated the disclosure to $246,883 million for the year ended December 31, 2022. We concluded this correction was
immaterial to our consolidated financial statements for the year ended December 31, 2022.
5. Allowance for Loan Losses
trusts, excluding loans for which we have elected the fair value option. When calculating our allowance for loan losses,
we consider the unpaid principal balance, net of unamortized premiums and discounts, and other cost basis
adjustments of HFI loans at the balance sheet date. We record write-offs as a reduction to our allowance for loan losses
at the point of foreclosure, completion of a short sale, upon the redesignation of nonperforming and reperforming loans
from HFI to HFS or when a loan is determined to be uncollectible.
Notes to Consolidated Financial Statements | Mortgage Loans | ||
Fannie Mae (In conservatorship) 2023 Form 10-K | F-38 | |
loan losses. The benefit or provision for loan losses excludes provision for accrued interest receivable losses, guaranty
loss reserves and credit losses on AFS debt securities. Cumulatively, these amounts are recognized as “Benefit
(provision) for credit losses” in our consolidated statements of operations and comprehensive income.
For the Year Ended December 31, | ||||||
2023 | 2022 | 2021 | ||||
(Dollars in millions) | ||||||
Single-family allowance for loan losses: | ||||||
Beginning balance | $( | $( | $( | |||
Benefit (provision) for loan losses | ( | |||||
Write-offs | ||||||
Recoveries | ( | ( | ( | |||
Other | ( | ( | ||||
Ending balance | $( | $( | $( | |||
Multifamily allowance for loan losses: | ||||||
Beginning balance | $( | $( | $( | |||
Benefit (provision) for loan losses | ( | ( | ||||
Write-offs | ||||||
Recoveries | ( | ( | ( | |||
Ending balance | $( | $( | $( | |||
Total allowance for loan losses: | ||||||
Beginning balance | $( | $( | $( | |||
Benefit (provision) for loan losses | ( | |||||
Write-offs | ||||||
Recoveries | ( | ( | ( | |||
Other | ( | ( | ||||
Ending balance | $( | $( | $( | |||
as changes in actual and forecasted home prices or property valuations, fluctuations in actual and forecasted interest
rates, borrower payment behavior, events such as natural disasters or pandemics, the type, volume and effectiveness of
our loss mitigation activities, including forbearances and loan modifications, the volume of foreclosures completed, and
the volume and pricing of loans redesignated from HFI to HFS. Our benefit or provision can also be impacted by
Our single-family benefit for loan losses for 2023 was primarily driven by a benefit from actual and forecasted home
price growth, partially offset by a provision from changes in loan activity and a provision relating to the redesignation of
loans from HFI to HFS, as described below:
•Benefit from actual and forecasted home price growth. During 2023, we observed stronger than expected
actual and forecasted home price appreciation. Higher home prices decrease the likelihood that loans will
default and reduce the amount of losses on loans that do default, which impacts our estimate of losses and
ultimately reduces our loss reserves and provision for loan losses.
•Provision from changes in loan activity, which includes provision on newly acquired loans. This was primarily
driven by the credit risk profile of our 2023 single-family acquisitions, which had a higher proportion of purchase
loans compared with our 2022 single-family acquisitions. Purchase loans generally have higher origination LTV
ratios than refinance loans. This factor drove a higher estimated risk of default and loss severity in the
allowance and therefore a higher credit loss provision for those loans at the time of acquisition.
•Provision from redesignation of loans from HFI to HFS. In 2023 we redesignated certain nonperforming and
reperforming single-family loans from HFI to HFS, as we no longer intended to hold them for the foreseeable
future or to maturity. Upon redesignation, these loans had an amortized cost of $3.3 billion with a related
allowance of $42 million. Since interest rates on the loans were below current market interest rates, their
Notes to Consolidated Financial Statements | Allowance for Loan Losses | ||
Fannie Mae (In conservatorship) 2023 Form 10-K | F-39 | |
carrying value exceeded their fair value at the time of redesignation, which resulted in a write-off against the
allowance of $658 million, with a net impact of $616 million in additional provision for loan losses.
The primary factors that contributed to our single-family provision for loan losses for 2022 were:
•Net provision from actual and forecasted home prices. Provision from home price changes was primarily driven
by our home price forecast, which estimated home price declines in 2023 and 2024. Lower forecasted home
prices increase the likelihood that loans will default and increase the amount of credit loss on loans that do
default, which increased our estimate of loss reserves and provision for loan losses.
•Provision from changes in loan activity, which includes provision on newly acquired loans. The portion of our
single-family acquisitions consisting of purchase loans increased in 2022 compared with 2021. In addition, in
2022, our loan loss provision also increased as our more negative home price forecast increased our estimate
of losses on newly acquired loans.
•Provision from higher actual and projected interest rates. As mortgage rates increased, we expected a
decrease in future prepayments on single-family loans, including modified loans accounted for as TDRs. Lower
expected prepayments extended the expected lives of these loans resulting in an increase in expected losses.
For TDR loans, longer expected lives also increase the expected impairment relating to economic concessions
provided on them, resulting in a provision for loan losses.
The increase in single-family write-offs in 2022 compared with 2021 was primarily driven by higher lower-of-cost-or-
market adjustments at the time of loan redesignation due to price declines on our HFS loans as interest rates rose
during the year. In addition, we had higher write-offs on single-family loans that went into foreclosure in 2022.
The primary factors that contributed to our multifamily provision for loan losses in 2023 were:
•Provision from changes in loan activity. This was primarily driven by new acquisitions resulting in book growth,
as well as increased delinquencies and declining DSCRs on the multifamily guaranty book, particularly in
instances where the DSCR declined to at or below a 1.0x coverage ratio.
•Provision from actual and projected economic data. Multifamily property values decreased throughout 2023,
which resulted in higher estimated LTV ratios on the loans in our multifamily guaranty book of business,
resulting in a provision for loan losses.
Our seniors housing loans were not a driver of our multifamily provision for loan losses in 2023, as our estimate of
losses related to these loans has decreased slightly since year-end 2022 as a result of loss mitigation activities
performed on this portfolio in 2023 and some recovery in property financials. However, our allowance for seniors
housing loans remained elevated as of December 31, 2023. These properties continue to be stressed from the effects of
the COVID-19 pandemic and ongoing economic trends and have not recovered to pre-pandemic levels.
Multifamily write-offs for 2023 were primarily due to the write-off of a specific seniors housing portfolio in 2023. The
seniors housing loans in our guaranty book of business are still recovering from being disproportionately affected by the
COVID-19 pandemic and ongoing economic trends, as well as other factors.
The primary factors that contributed to our multifamily provision for loan losses in 2022 were:
•Provision relating to our multifamily seniors housing portfolio. As of December 31, 2022, our estimate of credit
losses reflected an increased probability of default and greater expected severity of loss on our seniors housing
portfolio. As of December 31, 2022, nearly all of the seniors housing loans in our guaranty book of business
were current on their payments. However, our seniors housing portfolio was disproportionately impacted by
market conditions, which resulted in higher expected losses on this portfolio.
Seniors housing was negatively impacted by elevated vacancy rates and higher operating costs, which were
exacerbated by inflation pressures. This reduced the net operating income on many seniors housing properties,
which in turn led to lower estimated property values. These factors, combined with increased costs associated
with adjustable-rate mortgages due to a sharp rise in short-term interest rates during the latter half of 2022, put
additional stress on our seniors housing portfolio and increased our estimate of credit losses on these loans. As
of December 31, 2022, our seniors housing portfolio had an unpaid principal balance of $16.6 billion, of which
•Provision for higher actual and projected interest rates. Rising interest rates may reduce the ability of
multifamily borrowers to refinance their loans, which often have balloon balances at maturity, increasing our
provision for loan losses. Additionally, rising interest rates increase the chance that multifamily borrowers with
adjustable-rate mortgages may default due to higher payments if the property net operating income is not
increasing at a similar pace.
Notes to Consolidated Financial Statements | Allowance for Loan Losses | ||
Fannie Mae (In conservatorship) 2023 Form 10-K | F-40 | |
6. Investments in Securities
trading securities.
As of December 31, | ||||
2023 | 2022 | |||
(Dollars in millions) | ||||
Mortgage-related securities (includes $ consolidated trusts) | $ | $ | ||
Non-mortgage-related securities (includes $ collateral)(1) | ||||
Total trading securities | $ | $ | ||
(1)Primarily includes U.S. Treasury securities.
For the Year Ended December 31, | |||||||||||
2023 | 2022 | 2021 | |||||||||
(Dollars in millions) | |||||||||||
Net trading gains (losses) | $ | $( | $( | ||||||||
Net trading gains (losses) recognized in the period related to securities still held at period end | ( | ( | |||||||||
We record AFS securities at fair value with unrealized gains and losses, recorded net of tax, as a component of “Other
comprehensive loss” and we recognize realized gains and losses from the sale of AFS securities in “Investment gains
(losses), net” in our consolidated statements of operations and comprehensive income. We define the amortized cost
basis of our AFS securities as unpaid principal balance, net of unamortized premiums and discounts, and other cost
basis adjustments. We record an allowance for credit losses for AFS securities that reflects the impairment for credit
losses, which are limited to the amount that fair value is less than the amortized cost. Impairment due to non-credit
losses are recorded as unrealized losses within “Other comprehensive loss.”
accumulated other comprehensive income (loss) (“AOCI”), and fair value by major security type for AFS securities.
As of December 31, 2023 | ||||||||||||||||||||
Total Amortized Cost | Allowance for Credit Losses | Gross Unrealized Gains in AOCI | Gross Unrealized Losses in AOCI | Total Fair Value | ||||||||||||||||
(Dollars in millions) | ||||||||||||||||||||
Agency securities | $ | $ | $ | $( | $ | |||||||||||||||
Other mortgage-related securities | ( | |||||||||||||||||||
Total | $ | $( | $ | $( | $ | |||||||||||||||
As of December 31, 2022 | ||||||||||||||||||||
Total Amortized Cost | Allowance for Credit Losses | Gross Unrealized Gains in AOCI | Gross Unrealized Losses in AOCI | Total Fair Value | ||||||||||||||||
(Dollars in millions) | ||||||||||||||||||||
Agency securities | $ | $ | $ | $( | $ | |||||||||||||||
Other mortgage-related securities | ( | ( | ||||||||||||||||||
Total | $ | $( | $ | $( | $ | |||||||||||||||
Notes to Consolidated Financial Statements | Investments in Securities | ||
Fannie Mae (In conservatorship) 2023 Form 10-K | F-41 | |
these securities are guaranteed by the issuing agency. We believe that the guaranty provided by the issuing agency, the
support provided to the agencies by the U.S. government, the importance of the agencies to the liquidity and stability in
the secondary mortgage market, and the long history of zero credit losses on agency mortgage-related securities are all
indicators that there are currently no credit losses on these securities, even if the security is in an unrealized loss
position. In addition, we generally hold these securities that are in an unrealized loss position to recovery. As a result,
unless we intend to sell the security, we do not recognize an allowance for credit losses on agency mortgage-related
securities.
type for AFS securities in an unrealized loss position, excluding allowance for credit losses.
As of December 31, | |||||||||||||||||||||||
2023 | 2022 | ||||||||||||||||||||||
Less Than 12 Consecutive Months | 12 Consecutive Months or Longer | Less Than 12 Consecutive Months | 12 Consecutive Months or Longer | ||||||||||||||||||||
Gross Unrealized Losses in AOCI | Fair Value | Gross Unrealized Losses in AOCI | Fair Value | Gross Unrealized Losses in AOCI | Fair Value | Gross Unrealized Losses in AOCI | Fair Value | ||||||||||||||||
(Dollars in millions) | |||||||||||||||||||||||
Agency securities | $( | $ | $( | $ | $( | $ | $( | $ | |||||||||||||||
Other mortgage-related securities | ( | ||||||||||||||||||||||
Total | $( | $ | $( | $ | $( | $ | $( | $ | |||||||||||||||
December 31, 2021, we had $582 million in proceeds from sales of AFS securities that resulted in $59 million in gross
realized gains.
We held no securities classified as held-to-maturity as of December 31, 2023 or 2022.
7. Financial Guarantees
trusts and other guaranty arrangements. These off-balance sheet guarantees expose us to credit losses primarily
maximum remaining contractual term of our guarantees is 29 years; however, the actual term of each guaranty may be
significantly less than the contractual term based on the prepayment characteristics of the related mortgage loans. We
measure our guaranty reserve for estimated credit losses for off-balance sheet exposures over the contractual period
for which they are exposed to the credit risk, unless that obligation is unconditionally cancellable by the issuer.
As the guarantor of structured securities backed in whole or in part by Freddie Mac-issued securities, we extend our
guaranty to the underlying Freddie Mac securities in our resecuritization trusts. However, Freddie Mac continues to
guarantee the payment of principal and interest on the underlying Freddie Mac securities that we have resecuritized.
When we began issuing UMBS, we entered into an indemnification agreement under which Freddie Mac agreed to
indemnify us for losses caused by its failure to meet its payment or other specified obligations under the trust
agreements pursuant to which the underlying resecuritized securities were issued. As a result, and due to the funding
commitment available to Freddie Mac through its senior preferred stock purchase agreement with Treasury, we have
concluded that the associated credit risk is negligible. Accordingly, we exclude from the following table Freddie Mac
securities backing unconsolidated Fannie Mae-issued structured securities of $215.6 billion and $234.0 billion as of
December 31, 2023 and 2022, respectively.
Notes to Consolidated Financial Statements | Investments in Securities | ||
Fannie Mae (In conservatorship) 2023 Form 10-K | F-42 | |
consolidated balance sheets and the potential maximum recovery from third parties through available credit
enhancements and recourse related to our financial guarantees.
As of December 31, | ||||||||||||||||||
2023 | 2022 | |||||||||||||||||
Maximum Exposure | Guaranty Obligation | Maximum Recovery(1) | Maximum Exposure | Guaranty Obligation | Maximum Recovery(1) | |||||||||||||
(Dollars in millions) | ||||||||||||||||||
Unconsolidated Fannie Mae MBS | $ | $ | $ | $ | $ | $ | ||||||||||||
Other guaranty arrangements(2) | ||||||||||||||||||
Total | $ | $ | $ | $ | $ | $ | ||||||||||||
(1)Recoverability of such credit enhancements and recourse is subject to, among other factors, the ability of our mortgage insurers and the
U.S. government, as a financial guarantor, to meet their obligations to us. For information on our mortgage insurers, see “Note 14,
Concentrations of Credit Risk.”
(2)Primarily consists of credit enhancements and long-term standby commitments.
8. Short-Term and Long-Term Debt
less) and weighted-average interest rates of this debt.
As of December 31, | ||||||||
2023 | 2022 | |||||||
Outstanding | Weighted- Average Interest Rate(1) | Outstanding | Weighted- Average Interest Rate(1) | |||||
(Dollars in millions) | ||||||||
Short-term debt of Fannie Mae | $ | $ | ||||||
(1)Includes the effects of discounts, premiums and other cost basis adjustments.
Notes to Consolidated Financial Statements | Financial Guarantees | ||
Fannie Mae (In conservatorship) 2023 Form 10-K | F-43 | |
Long-term debt represents debt with an original contractual maturity of greater than one year. The following table
displays our outstanding long-term debt.
As of December 31, | ||||||||||||
2023 | 2022 | |||||||||||
Maturities | Outstanding(1) | Weighted- Average Interest Rate(2) | Maturities | Outstanding(1) | Weighted- Average Interest Rate(2) | |||||||
(Dollars in millions) | ||||||||||||
Senior fixed: | ||||||||||||
Benchmark notes and bonds | 2024 - 2030 | $ | 2023 - 2030 | $ | ||||||||
Medium-term notes(3) | 2024 - 2031 | 2023 - 2031 | ||||||||||
Other(4) | 2024 - 2038 | 2023 - 2038 | ||||||||||
Total senior fixed | ||||||||||||
Senior floating: | ||||||||||||
Connecticut Avenue Securities(5) | 2024 - 2031 | 2023 - 2031 | ||||||||||
Other(6) | 2037 | 2037 | ||||||||||
Total senior floating | ||||||||||||
Total long-term debt of Fannie Mae(7) | ||||||||||||
Debt of consolidated trusts | 2024 - 2062 | 2023 - 2062 | ||||||||||
Total long-term debt | $ | $ | ||||||||||
(1)Outstanding debt balance consists of the unpaid principal balance, premiums and discounts, fair value adjustments, hedge-related basis
adjustments, and other cost basis adjustments.
(2)Excludes the effects of fair value adjustments and hedge-related basis adjustments.
(3)Includes long-term debt with an original contractual maturity of greater than 1 year and up to 10 years, excluding zero-coupon debt.
(4)Includes other long-term debt with an original contractual maturity of greater than 10 years and foreign exchange bonds.
(5)Consists of CAS debt issued prior to November 2018, a portion of which is reported at fair value.
(6)Consists of structured debt instruments that are reported at fair value.
(7)Includes unamortized discounts and premiums, fair value adjustments, hedge-related cost basis adjustments, and other cost basis
adjustments in a net discount position of $4.0 billion and $5.1 billion as of December 31, 2023 and 2022, respectively.
greater than one year that are issued through dealer banks. We also offer Benchmark Notes® that provide increased
efficiency, liquidity and tradability to the market through regularly-scheduled issuance dates that are used if needed
during the year. Additionally, we have historically issued notes and bonds denominated in a foreign currency but have
not issued any foreign currency debt in the periods presented. We effectively convert all outstanding foreign currency-
denominated transactions into U.S. dollars through the use of foreign currency swaps for the purpose of funding our
mortgage assets. Our long-term debt also includes CAS securities issued prior to November 2018, which are credit risk-
sharing securities that transfer a portion of the credit risk on specified pools of single-family mortgage loans to the
investors in these securities.
Our other long-term debt includes callable and non-callable securities, which include all long-term non-Benchmark
securities, such as zero-coupon bonds, fixed rate and other long-term securities, and are generally negotiated
underwritings with one or more dealers or dealer banks.
Characteristics of Debt
As of December 31, 2023 and 2022, the face amount of our debt securities of Fannie Mae was $128.1 billion and
$139.3 billion, respectively. As of December 31, 2023, we had zero-coupon debt with a face amount of $11.6 billion,
which had an effective interest rate of 5.06 %. As of December 31, 2022, we had zero-coupon debt with a face amount
of $10.0 billion, which had an effective interest rate of 3.91 %.
We issue callable debt instruments to manage the duration and prepayment risk of expected cash flows of the mortgage
assets we own. Our outstanding debt as of December 31, 2023 and 2022 included $43.8 billion and $43.3 billion,
respectively, of callable debt that could be redeemed, in whole or in part, at our option on or after a specified date.
Notes to Consolidated Financial Statements | Short-Term and Long-Term Debt | ||
Fannie Mae (In conservatorship) 2023 Form 10-K | F-44 | |
the years 2024 through 2028 and thereafter. The first column assumes that we pay off this debt at maturity or on the call
date if the call has been announced, while the second column assumes that we redeem our callable debt at the next
available call date.
Long-Term Debt by Year of Maturity | Assuming Callable Debt Redeemed at Next Available Call Date | |||||||
(Dollars in millions) | ||||||||
2024 | $ | $ | ||||||
2025 | ||||||||
2026 | ||||||||
2027 | ||||||||
2028 | ||||||||
Thereafter | ||||||||
Total long-term debt of Fannie Mae(1) | ||||||||
Debt of consolidated trusts(2) | ||||||||
Total long-term debt | $ | $ | ||||||
(1)Includes unamortized discounts and premiums, fair value adjustments, hedge-related cost basis adjustments, and other cost basis
adjustments.
(2)Contractual maturity of debt of consolidated trusts is not a reliable indicator of expected maturity because borrowers of the underlying
9. Derivative Instruments
privately-negotiated, bilateral contracts, or they may be listed and traded on an exchange. We refer to our derivative
transactions made pursuant to bilateral contracts as our over-the-counter (“OTC”) derivative transactions and our
derivative transactions accepted for clearing by a derivatives clearing organization as our cleared derivative
transactions. We typically do not settle the notional amount of our risk management derivatives; rather, notional
amounts provide the basis for calculating actual payments or settlement amounts. The derivative contracts we use for
interest-rate risk management purposes fall into these broad categories:
•Interest-rate swap contracts. An interest-rate swap is a transaction between two parties in which each party
agrees to exchange payments tied to different interest rates or indices for a specified period of time, generally
based on a notional amount of principal. The types of interest-rate swaps we use include pay-fixed swaps,
receive-fixed swaps and basis swaps.
•Interest-rate option contracts. These contracts primarily include pay-fixed swaptions, receive-fixed swaptions,
cancellable swaps and interest-rate caps. A swaption is an option contract that allows us or a counterparty to
enter into a pay-fixed or receive-fixed swap at some point in the future.
•Foreign currency swaps. These swaps convert debt that we issue in foreign denominated currencies into U.S.
dollars. We enter into foreign currency swaps only to the extent that we hold foreign currency debt.
•Futures. These are standardized exchange-traded contracts that either obligate a buyer to buy an asset at a
predetermined date and price or a seller to sell an asset at a predetermined date and price. The types of
futures contracts we enter into include SOFR and U.S. Treasury.
We account for certain forms of credit risk transfer transactions as derivatives. In our credit risk transfer transactions, a
portion of the credit risk associated with losses on a reference pool of mortgage loans is transferred to a third party. We
enter into derivative transactions that are associated with some of our credit risk transfer transactions, whereby we
manage investment risk to guarantee that certain unconsolidated VIEs have sufficient cash flows to pay their contractual
obligations.
We enter into forward purchase and sale commitments that lock in the future delivery of mortgage loans and mortgage-
related securities at a fixed price or yield. Certain commitments to purchase mortgage loans and purchase or sell
mortgage-related securities meet the criteria of a derivative. We typically settle the notional amount of our mortgage
commitments that are accounted for as derivatives.
trade-date basis. Fair value amounts, which are (1) netted to the extent a legal right of offset exists and is enforceable
by law at the counterparty level and (2) inclusive of the right or obligation associated with the cash collateral posted or
Notes to Consolidated Financial Statements | Short-Term and Long-Term Debt | ||
Fannie Mae (In conservatorship) 2023 Form 10-K | F-45 | |
Value” for additional information on derivatives recorded at fair value. We present cash flows from derivatives as
operating activities in our consolidated statements of cash flows.
Fair Value Hedge Accounting
instruments in hedges of the change in fair value attributable to the designated benchmark interest rate for certain
closed pools of fixed-rate, single-family mortgage loans or our funding debt. For hedged items in qualifying fair value
hedging relationships, changes in fair value attributable to the designated risk are recognized as a basis adjustment to
the hedged item. We also report changes in the fair value of the derivative hedging instrument in the same consolidated
statements of operations and comprehensive income line item used to recognize the earnings effect of the hedged
in benchmark interest rates.
Notes to Consolidated Financial Statements | Derivative Instruments | ||
Fannie Mae (In conservatorship) 2023 Form 10-K | F-46 | |
Notional and Fair Value Position of our Derivatives
instruments.
As of December 31, | |||||||||||||||
2023 | 2022 | ||||||||||||||
Notional Amount | Estimated Fair Value | Notional Amount | Estimated Fair Value | ||||||||||||
Asset Derivatives | Liability Derivatives | Asset Derivatives | Liability Derivatives | ||||||||||||
(Dollars in millions) | |||||||||||||||
Risk management derivatives designated as hedging instruments: | |||||||||||||||
Swaps:(1) | |||||||||||||||
Pay-fixed | $ | $ | $ | $ | $ | $ | |||||||||
Receive-fixed | |||||||||||||||
Total risk management derivatives designated as hedging instruments | |||||||||||||||
Risk management derivatives not designated as hedging instruments: | |||||||||||||||
Swaps:(1) | |||||||||||||||
Pay-fixed | |||||||||||||||
Receive-fixed | ( | ( | |||||||||||||
Basis | |||||||||||||||
Foreign currency | ( | ( | |||||||||||||
Swaptions:(1) | |||||||||||||||
Pay-fixed | ( | ( | |||||||||||||
Receive-fixed | ( | ( | |||||||||||||
Futures(1) | |||||||||||||||
Total risk management derivatives not designated as hedging instruments | ( | ( | |||||||||||||
Netting adjustment(2) | — | ( | — | ( | |||||||||||
Total risk management derivatives portfolio | ( | ( | |||||||||||||
Mortgage commitment derivatives: | |||||||||||||||
Mortgage commitments to purchase whole loans | ( | ||||||||||||||
Forward contracts to purchase mortgage- related securities | ( | ( | |||||||||||||
Forward contracts to sell mortgage-related securities | ( | ( | |||||||||||||
Total mortgage commitment derivatives | ( | ( | |||||||||||||
Credit enhancement derivatives | ( | ( | |||||||||||||
Derivatives at fair value | $ | $ | $( | $ | $ | $( | |||||||||
(1)Centrally cleared derivatives have no ascribable fair value because the positions are settled daily.
(2)The netting adjustment represents the effect of the legal right to offset under legally enforceable master netting arrangements to settle with
the same counterparty on a net basis, including cash collateral posted and received. Cash collateral posted was $2.9 billion and $4.5
Notes to Consolidated Financial Statements | Derivative Instruments | ||
Fannie Mae (In conservatorship) 2023 Form 10-K | F-47 | |
following table displays, by type of derivative instrument, the fair value gains and losses, net on our derivatives.
For the Year Ended December 31, | ||||||
2023 | 2022 | 2021 | ||||
(Dollars in millions) | ||||||
Risk management derivatives: | ||||||
Swaps: | ||||||
Pay-fixed | $( | $ | $ | |||
Receive-fixed | ( | ( | ||||
Basis | ( | ( | ||||
Foreign currency | ( | ( | ||||
Swaptions: | ||||||
Pay-fixed | ( | |||||
Receive-fixed | ( | ( | ( | |||
Futures | ( | |||||
Net contractual interest income (expense) on interest-rate swaps | ( | ( | ||||
Total risk management derivatives fair value gains, net | ||||||
Mortgage commitment derivatives fair value gains, net | ||||||
Credit enhancement derivatives fair value gains (losses), net | ( | ( | ||||
$ | $ | $ | ||||
comprehensive income, including gains and losses recognized on fair value hedging relationships.
For the Year Ended December 31, | ||||||||
2023 | 2022 | |||||||
Interest Income: Mortgage Loans | Interest Expense: Long- Term Debt | Interest Income: Mortgage Loans | Interest Expense: Long- Term Debt | |||||
(Dollars in millions) | ||||||||
Total amounts presented in our consolidated statements of operations and comprehensive income | $ | $( | $ | $( | ||||
Gains (losses) from fair value hedging relationships: | ||||||||
Mortgage loans HFI and related interest-rate contracts: | ||||||||
Hedged items | $ | $— | $( | $— | ||||
Discontinued hedge-related basis adjustment amortization | — | — | ||||||
Derivatives designated as hedging instruments | ( | — | — | |||||
Interest accruals on derivative hedging instruments | — | — | ||||||
Debt of Fannie Mae and related interest-rate contracts: | ||||||||
Hedged items | — | ( | — | |||||
Discontinued hedge-related basis adjustment amortization | — | ( | — | ( | ||||
Derivatives designated as hedging instruments | — | — | ( | |||||
Interest accruals on derivative hedging instruments | — | ( | — | ( | ||||
Gains (losses) recognized in net interest income on fair value hedging relationships | $ | $( | $ | $( | ||||
Notes to Consolidated Financial Statements | Derivative Instruments | ||
Fannie Mae (In conservatorship) 2023 Form 10-K | F-48 | |
Hedged Items in Fair Value Hedging Relationships
recorded in our consolidated balance sheets, including the hedged item’s cumulative basis adjustments and the closed
portfolio balances under the portfolio layer method. The hedged item carrying amounts and total basis adjustments
include both open and discontinued hedges. The amortized cost and designated UPB consists only of open hedges as
of December 31, 2023.
As of December 31, 2023 | ||||||||||
Carrying Amount Assets (Liabilities) | Cumulative Amount of Fair Value Hedging Basis Adjustments Included in the Carrying Amount | Closed Portfolio of Mortgage Loans Under Portfolio Layer Method | ||||||||
Total Basis Adjustments(1)(2) | Remaining Adjustments - Discontinued Hedge | Total Amortized Cost | Designated UPB | |||||||
(Dollars in millions) | ||||||||||
Mortgage loans HFI | $ | $( | $( | $ | $ | |||||
Debt of Fannie Mae | ( | N/A | N/A | |||||||
As of December 31, 2022 | ||||||||||
Carrying Amount Assets (Liabilities) | Cumulative Amount of Fair Value Hedging Basis Adjustments Included in the Carrying Amount | Closed Portfolio of Mortgage Loans Under Portfolio Layer Method | ||||||||
Total Basis Adjustments(1)(2) | Remaining Adjustments - Discontinued Hedge | Total Amortized Cost | Designated UPB | |||||||
(Dollars in millions) | ||||||||||
Mortgage loans HFI | $ | $( | $( | $ | $ | |||||
Debt of Fannie Mae | ( | N/A | N/A | |||||||
(1)No basis adjustment associated with open hedges, as all hedges are designated at the close of business, with a one-day term.
(2)Based on the unamortized balance of the hedge-related cost basis.
Our derivative counterparty credit exposure relates principally to interest-rate derivative contracts. We are exposed to
the risk that a counterparty in a derivative transaction will default on payments due to us, which may require us to seek
a replacement derivative from a different counterparty. This replacement may be at a higher cost, or we may be unable
to find a suitable replacement. We manage our derivative counterparty credit exposure relating to our risk management
derivative transactions mainly through enforceable master netting arrangements, which allow us to net derivative assets
and liabilities with the same counterparty or clearing organization and clearing member. For our OTC derivative
transactions, we require counterparties to post collateral, which may include cash, U.S. Treasury securities, agency debt
and agency mortgage-related securities. See “Note 15, Netting Arrangements” for information on our rights to offset
assets and liabilities as of December 31, 2023 and 2022.
For certain OTC derivatives, the amount of collateral we pledge to counterparties related to our derivative instruments is
determined after considering our credit ratings. Currently, our long-term senior debt is rated AA+ or above by the three
major rating agencies. If our long-term senior debt credit ratings were downgraded to established thresholds in our OTC
derivative contracts, which range from A3/A- to Baa2/BBB or below, we would be required to provide additional
collateral to certain counterparties. The aggregate fair value of our OTC derivative instruments with credit-risk-related
contingent features that were in a net liability position was $1.8 billion and $2.8 billion, for which we posted collateral of
$1.6 billion and $2.6 billion as of December 31, 2023 and 2022, respectively. If our credit ratings were downgraded to
Baa2/BBB or below, the maximum additional collateral we would have been required to post to our counterparties as of
December 31, 2023 and 2022 would have been $798 million and $1.1 billion, respectively.
Notes to Consolidated Financial Statements | Derivative Instruments | ||
Fannie Mae (In conservatorship) 2023 Form 10-K | F-49 | |
10. Income Taxes
We are subject to federal income tax, but we are exempt from state and local income taxes. The following table displays
the components of our provision for federal income taxes.
For the Year Ended December 31, | ||||||
2023 | 2022 | 2021 | ||||
(Dollars in millions) | ||||||
Current income tax benefit (provision) | $( | $( | $( | |||
Deferred income tax benefit (provision)(1) | ( | ( | ||||
Provision for federal income taxes | $( | $( | $( | |||
(1)Amount excludes the current income tax effect of items recognized directly in “Total stockholders' equity.”
For the Year Ended December 31, | ||||||||||||
2023 | 2022 | 2021 | ||||||||||
Statutory corporate tax rate | % | % | % | |||||||||
Research tax credits | ( | ( | ||||||||||
Equity investments in affordable housing projects | ( | ( | ( | |||||||||
Valuation allowance | ||||||||||||
Other | ( | |||||||||||
Effective tax rate | % | % | % | |||||||||
Our effective tax rate is the provision for federal income taxes expressed as a percentage of income or loss before
federal income taxes. Our effective tax rates for the years 2023, 2022, and 2021 were impacted by the benefits of our
investments in housing projects eligible for low-income housing tax credits. Our effective tax rate for 2022 was also
impacted by the benefit of the research tax credits claimed in 2022 and amended prior year returns, and the valuation
allowance against the deferred tax asset relating to capital loss carryforwards.
of negative and positive evidence, including our historical profitability and projections of future taxable income. Our
framework for assessing the recoverability of deferred tax assets requires us to weigh all available evidence, to the
extent it exists, including:
•the sustainability of recent profitability required to realize the deferred tax assets;
•the cumulative net income or losses in our consolidated statements of operations and comprehensive income
in recent years;
•unsettled circumstances that, if unfavorably resolved, would adversely affect future operations and profit levels
on a continuing basis in future years;
•the funding available to us under the senior preferred stock purchase agreement;
•the carryforward period for capital losses; and
•tax planning strategies.
Based on all positive and negative evidence available as of December 31, 2023, we concluded that it is more likely than
not that our deferred tax assets will be realized, except the deferred tax asset relating to capital loss carryforwards. For
the deferred tax asset relating to capital loss carryforwards, we concluded that the negative evidence outweighed the
positive evidence, and it is more likely than not that these capital loss carryforwards will not be utilized during the
allowable five-year carryforward period, which will expire in 2027 and 2028 if unused. Therefore, a valuation allowance
has been recorded against our capital loss carryforward deferred tax asset, which is included in “Other, net” in the table
below.
Notes to Consolidated Financial Statements | Income Taxes | ||
Fannie Mae (In conservatorship) 2023 Form 10-K | F-50 | |
As of December 31, | |||||||
2023 | 2022 | ||||||
(Dollars in millions) | |||||||
Deferred tax assets: | |||||||
Mortgage and mortgage-related assets | $ | $ | |||||
Allowance for loan losses and basis in acquired property, net | |||||||
Derivative instruments | |||||||
Partnership and other equity investments | |||||||
Interest-only securities | |||||||
Other, net | |||||||
Total deferred tax assets | |||||||
Deferred tax liabilities: | |||||||
Debt instruments | |||||||
Valuation allowance | ( | ( | |||||
Deferred tax assets, net | $ | $ | |||||
For the Year Ended December 31, | |||||||||||
2023 | 2022 | 2021 | |||||||||
(Dollars in millions) | |||||||||||
Unrecognized tax benefits as of January 1 | $ | $ | $ | ||||||||
Gross increases - tax positions in current year | |||||||||||
Unrecognized tax benefits as of December 31 | $ | $ | $ | ||||||||
If these positions were to resolve favorably, our effective tax would be reduced in future periods by $69 million. It is
reasonably possible that changes in our gross balance of unrecognized tax benefits may occur within the next twelve
months. Our tax years 2020 through 2022 remain open to examination by the IRS.
11. Segment Reporting
Family and Multifamily. Results of our two business segments are intended to reflect each segment as if it were a stand-
alone business. The sum of the results for our two business segments equals our consolidated results of operations.
The section below provides a discussion of our business segments.
Single-Family Business Segment
•Works with lenders to acquire and securitize single-family mortgage loans delivered to us by lenders into
Fannie Mae MBS.
•Issues structured Fannie Mae MBS backed by single-family mortgage assets and provides other services to
single-family lenders.
•Prices and manages the credit risk on loans in our single-family guaranty book of business, which includes
establishing underwriting and servicing standards. Also enters into transactions that transfer a portion of the
credit risk on some of the loans in our single-family guaranty book of business to third parties.
•Works to reduce costs of defaulted single-family loans, including through forbearance plans, home retention
solutions, foreclosure alternatives, management of foreclosures and our REO inventory, selling nonperforming
loans and pursuing contractual remedies from lenders, servicers and providers of credit enhancements.
Notes to Consolidated Financial Statements | Income Taxes | ||
Fannie Mae (In conservatorship) 2023 Form 10-K | F-51 | |
Multifamily Business Segment
•Works with lenders to acquire and securitize multifamily mortgage loans delivered to us by lenders into Fannie
Mae MBS.
•Issues structured multifamily Fannie Mae MBS through our Fannie Mae Guaranteed Multifamily Structures
(“Fannie Mae GeMSTM”) program and provides other services to our multifamily lenders.
•Prices and manages the credit risk on loans in our multifamily guaranty book of business, which includes
establishing underwriting and servicing standards. Lenders retain a portion of the credit risk in most multifamily
transactions.
•Enters into additional transactions that transfer a portion of the credit risk on some of the loans in our
multifamily guaranty book of business to third parties.
•Works to reduce costs of defaulted multifamily loans, including through loss mitigation strategies such as
forbearance and modification, management of foreclosures and our REO inventory, and pursuing contractual
remedies from lenders, servicers, borrowers, sponsors, and providers of credit enhancements.
Segment Allocations and Results
The majority of our assets, revenues and expenses are directly associated with each respective business segment and
are included in determining its asset balance and operating results. Those assets, revenues and expenses that are not
directly attributable to a particular business segment are allocated based on the size of each segment’s guaranty book
of business. The substantial majority of the gains and losses associated with our risk management derivatives, including
the impact of hedge accounting, are allocated to our Single-Family business segment.
As of December 31, | ||||
2023 | 2022 | |||
(Dollars in millions) | ||||
Single-Family | $ | $ | ||
Multifamily | ||||
Total assets | $ | $ | ||
We operate our business solely in the United States and its territories, and accordingly, we generate no revenue from
and have no long-lived assets, other than financial instruments, in geographic locations other than the United States
and its territories.
For the Year Ended December 31, 2023 | ||||||||
Single-Family | Multifamily | Total | ||||||
(Dollars in millions) | ||||||||
Net interest income(1) | $ | $ | $ | |||||
Fee and other income(2) | ||||||||
Net revenues | ||||||||
Investment losses, net(3) | ( | ( | ( | |||||
Fair value gains, net(4) | ||||||||
Administrative expenses | ( | ( | ( | |||||
Benefit (provision) for credit losses(5) | ( | |||||||
TCCA fees(6) | ( | ( | ||||||
Credit enhancement expense(7) | ( | ( | ( | |||||
Change in expected credit enhancement recoveries(8) | ( | ( | ||||||
Other expenses, net | ( | ( | ( | |||||
Income before federal income taxes | ||||||||
Provision for federal income taxes | ( | ( | ( | |||||
Net income | $ | $ | $ | |||||
Notes to Consolidated Financial Statements | Segment Reporting | ||
Fannie Mae (In conservatorship) 2023 Form 10-K | F-52 | |
For the Year Ended December 31, 2022 | ||||||||
Single-Family | Multifamily | Total | ||||||
(Dollars in millions) | ||||||||
Net interest income(1) | $ | $ | $ | |||||
Fee and other income(2) | ||||||||
Net revenues | ||||||||
Investment losses, net(3) | ( | ( | ( | |||||
Fair value gains (losses), net(4) | ( | |||||||
Administrative expenses | ( | ( | ( | |||||
Provision for credit losses(5) | ( | ( | ( | |||||
TCCA fees(6) | ( | ( | ||||||
Credit enhancement expense(7) | ( | ( | ( | |||||
Change in expected credit enhancement recoveries(8) | ||||||||
Other expenses, net | ( | ( | ( | |||||
Income before federal income taxes | ||||||||
Provision for federal income taxes | ( | ( | ( | |||||
Net income | $ | $ | $ | |||||
For the Year Ended December 31, 2021 | ||||||||
Single-Family | Multifamily | Total | ||||||
(Dollars in millions) | ||||||||
Net interest income(1) | $ | $ | $ | |||||
Fee and other income(2) | ||||||||
Net revenues | ||||||||
Investment gains (losses), net(3) | ( | |||||||
Fair value gains (losses), net(4) | ( | |||||||
Administrative expenses | ( | ( | ( | |||||
Benefit for credit losses(5) | ||||||||
TCCA fees(6) | ( | ( | ||||||
Credit enhancement expense(7) | ( | ( | ( | |||||
Change in expected credit enhancement recoveries(8) | ( | ( | ( | |||||
Other expenses, net | ( | ( | ( | |||||
Income before federal income taxes | ||||||||
Provision for federal income taxes | ( | ( | ( | |||||
Net income | $ | $ | $ | |||||
(1)Net interest income primarily consists of guaranty fees received as compensation for assuming the credit risk on loans underlying Fannie
Mae MBS held by third parties for the respective business segment, and the difference between the interest income earned on the
respective business segment’s assets in our retained mortgage portfolio and our corporate liquidity portfolio and the interest expense
associated with the debt funding those assets. Revenues from single-family guaranty fees include revenues generated by the 10 basis
point increase in guaranty fees pursuant to the TCCA, the incremental revenue from which is paid to Treasury and not retained by us. Also
includes yield maintenance revenue we recognized on the prepayment of multifamily loans.
(2)Single-family fee and other income primarily consists of compensation for engaging in structured transactions and providing other lender
services. Multifamily fee and other income consists of fees associated with certain Multifamily business activities, such as credit
enhancements for tax-exempt multifamily housing revenue bonds.
(3)Single-family investment gains and losses primarily consist of gains and losses on the sale of mortgage assets. Multifamily investment
gains and losses primarily consist of gains and losses on resecuritization activity.
(4)Single-family fair value gains and losses primarily consist of fair value gains and losses on risk management and mortgage commitment
derivatives, trading securities, fair value option debt, and other financial instruments associated with our single-family guaranty book of
business. Multifamily fair value gains and losses primarily consist of fair value gains and losses on MBS commitment derivatives, trading
securities and other financial instruments associated with our multifamily guaranty book of business.
Notes to Consolidated Financial Statements | Segment Reporting | ||
Fannie Mae (In conservatorship) 2023 Form 10-K | F-53 | |
(5)Benefit (provision) for credit losses is based on loans underlying the segment’s guaranty book of business.
(6)Consists of the portion of our single-family guaranty fees that is paid to Treasury pursuant to the TCCA.
(7)Single-family credit enhancement expense consists of costs associated with our freestanding credit enhancements, which include primarily
costs associated with our CIRTTM, CAS and enterprise-paid mortgage insurance (“EPMI”) programs. Multifamily credit enhancement
expense primarily consists of costs associated with our Multifamily CIRTTM (“MCIRTTM”) and Multifamily CAS (“MCASTM“) programs as well
as amortization expense for certain lender risk-sharing programs. Excludes CAS transactions accounted for as debt instruments and credit
risk transfer programs accounted for as derivative instruments.
(8)Consists of change in benefits recognized from our freestanding credit enhancements, primarily from our CAS and CIRT programs, as well
as certain lender risk-sharing arrangements, including our multifamily DUS® program.
12. Equity
Senior Preferred Stock
Liquidation Preference
There were one million
2023 and 2022. Shares of the senior preferred stock have no par value and have a stated value and initial liquidation
preference equal to $1,000 per share, for an aggregate initial liquidation preference of $1 billion. The senior preferred
stock is non-participating and non-voting.
Under the terms that currently govern the senior preferred stock, the aggregate liquidation preference will be increased
by the following:
•any amounts Treasury pays to us pursuant to its funding commitment under the agreement (as of the date of
this filing, the cumulative amount Treasury has paid to us under its funding commitment is $119.8 billion);
•any quarterly commitment fees that are payable but not paid by us (no such fees have become payable, nor will
such fees be set until the capital reserve end date, as defined in “Note 2, Conservatorship, Senior Preferred
Stock Purchase Agreement and Related Matters”);
•any senior preferred stock dividends that are payable but not paid to Treasury, regardless of whether or not
they are declared; and
•for each fiscal quarter through and including the capital reserve end date, an amount equal to the increase in
our net worth, if any, during the immediately prior fiscal quarter.
The aggregate liquidation preference of the senior preferred stock was $195.2 billion as of December 31, 2023 and will
further increase to $199.2 billion as of March 31, 2024, due to the $4.0 billion increase in our net worth during the fourth
quarter of 2023.
The senior preferred stock ranks ahead of our common stock and our preferred stock, as to both dividends and rights
upon liquidation. As a result, if we are liquidated, the holder of the senior preferred stock is entitled to its then-current
liquidation preference before any distributions are made to the holders of our common stock or other preferred stock.
Dividend Provisions
Treasury, as the holder of the senior preferred stock, is entitled to receive, when, as and if declared, out of legally
available funds, cumulative quarterly cash dividends. The dividends we have paid to Treasury on the senior preferred
stock during conservatorship have been declared by, and paid at the direction of, our conservator. Dividend payments
we make to Treasury do not restore or increase the amount of Treasury’s funding commitment under the agreement.
We are currently not required to pay or accumulate new dividends to Treasury until our net worth exceeds the amount of
adjusted total capital necessary for us to meet the capital requirements and buffers set forth in the enterprise regulatory
capital framework. Our net worth is the amount, if any, by which our total assets (excluding Treasury’s funding
commitment and any unfunded amounts related to the commitment) exceed our total liabilities (excluding any obligation
with respect to equity securities). After the capital reserve end date, the quarterly dividends due to Treasury under the
senior preferred stock will be the lesser of (i) any quarterly increase in our net worth, and (ii) a 10 % annual rate on the
then-current liquidation preference of the senior preferred stock (or 12 % if we fail to pay dividends to Treasury).
We had no dividends declared or paid on the senior preferred stock for the years ended December 31, 2023, 2022 or
2021.
Notes to Consolidated Financial Statements | Segment Reporting | ||
Fannie Mae (In conservatorship) 2023 Form 10-K | F-54 | |
Limitations on Redemption and Paydown of Liquidation Preference; Requirement to Pay Net Proceeds of Capital
Stock Issuances to Reduce Liquidation Preference
We are not permitted to redeem or retire the senior preferred stock prior to the termination of Treasury’s funding
commitment under the agreement. Moreover, we are not permitted to reduce or pay down the liquidation preference of
the senior preferred stock out of regular corporate funds except to the extent of (1) accumulated and unpaid dividends
previously added to the liquidation preference; and (2) quarterly commitment fees previously added to the liquidation
preference. While the senior preferred stock remains outstanding, we are required to use the net cash proceeds of
issuances of equity securities to pay down the liquidation preference of the senior preferred stock; however, we are
permitted to retain up to $70 billion in aggregate gross cash proceeds from issuances of common stock. The liquidation
preference of the senior preferred stock may not be paid down below $1,000 per share prior to the termination of
Treasury’s funding commitment. After termination, we may fully pay down the liquidation preference of the senior
preferred stock.
Common Stock Warrant
On September 7, 2008, we, through FHFA in its capacity as conservator, issued to Treasury a warrant to purchase, at a
nominal price of $0.00001 , shares of our common stock equal to 79.9 % of the total number of shares of our common
stock outstanding on a fully diluted basis on the date the warrant is exercised. The warrant may be exercised in whole
or in part at any time on or before September 7, 2028.
If the market price of one share of common stock is greater than the exercise price, in lieu of exercising the warrant by
payment of the exercise price, Treasury may elect to receive shares equal to the value of the warrant (or portion thereof
being canceled) pursuant to the formula specified in the warrant. Upon exercise of the warrant, Treasury may assign the
right to receive the shares of common stock issuable upon exercise to any other person. If the warrant is exercised, the
stated value of the common stock issued will be reclassified as “Common stock” in our consolidated balance sheets. As
of February 15, 2024, Treasury has not exercised the warrant.
We recorded the warrant at fair value in our stockholders’ equity as a component of additional paid-in-capital. The fair
value of the warrant was calculated using the Black-Scholes Option Pricing Model. Since the warrant has an exercise
price of $0.00001 per share, the model is insensitive to the risk-free rate and volatility assumptions used in the
calculation and the share value of the warrant is equal to the price of the underlying common stock. We estimated that
the fair value of the warrant at issuance was $3.5 billion based on the price of our common stock on September 8, 2008,
which was after the dilutive effect of the warrant had been reflected in the market price. Subsequent changes in the fair
value of the warrant are not recognized in our financial statements.
Notes to Consolidated Financial Statements | Equity | ||
Fannie Mae (In conservatorship) 2023 Form 10-K | F-55 | |
Preferred Stock
Authorized, Issued and Outstanding as of December 31, | Annual Dividend Rate as of December 31, 2023 | |||||||||||||||||
2023 | 2022 | Stated Value per Share | ||||||||||||||||
Title | Issue Date | Shares | Amount | Shares | Amount | Redeemable on or After | ||||||||||||
(Dollars and shares in millions, except per share amounts) | ||||||||||||||||||
Series D | September 30, 1998 | $ | $ | $ | September 30, 1999 | |||||||||||||
Series E | April 15, 1999 | April 15, 2004 | ||||||||||||||||
Series F | March 20, 2000 | (1) | March 31, 2002 | (2) | ||||||||||||||
Series G | August 8, 2000 | (3) | September 30, 2002 | (2) | ||||||||||||||
Series H | April 6, 2001 | April 6, 2006 | ||||||||||||||||
Series I | October 28, 2002 | October 28, 2007 | ||||||||||||||||
Series L | April 29, 2003 | April 29, 2008 | ||||||||||||||||
Series M | June 10, 2003 | June 10, 2008 | ||||||||||||||||
Series N | September 25, 2003 | September 25, 2008 | ||||||||||||||||
Series O | December 30, 2004 | (4) | December 31, 2007 | |||||||||||||||
Convertible Series 2004-I(5) | December 30, 2004 | — | — | January 5, 2008 | ||||||||||||||
Series P | September 28, 2007 | (6) | September 30, 2012 | |||||||||||||||
Series Q | October 4, 2007 | September 30, 2010 | ||||||||||||||||
Series R(7) | November 21, 2007 | November 21, 2012 | ||||||||||||||||
Series S | December 11, 2007 | (8) | December 31, 2010 | (9) | ||||||||||||||
Series T(10) | May 19, 2008 | May 20, 2013 | ||||||||||||||||
Total | $ | $ | ||||||||||||||||
(1)Rate effective March 31, 2022. Variable dividend rate resets every two years at a per annum rate equal to the two-year Constant Maturity
U.S. Treasury Rate (“CMT”) minus 0.16 % with a cap of 11 % per year.
(2)Represents initial call date. Redeemable every two years thereafter.
(3)Rate effective September 30, 2022. Variable dividend rate resets every two years at a per annum rate equal to the two-year CMT rate
minus 0.18 % with a cap of 11 % per year.
(4)Rate effective December 31, 2023. Variable dividend rate resets quarterly thereafter at a per annum rate equal to the greater of 7 % or 10-
year CMT rate plus 2.375 %.
(5)Issued and outstanding shares were 24,922
(6)Rate effective December 31, 2023. In accordance with the Federal Reserve Board’s Regulation ZZ implementing the Adjustable Interest
Rate (LIBOR) Act (“Regulation ZZ”), for quarterly periods beginning after June 30, 2023, the quarterly dividend resets at a per annum rate
equal to the greater of 4.50 % or the sum of 3-month CME Term SOFR plus 0.26161 % plus 0.75 %.
(7)On November 21, 2007, we issued 20 million shares of preferred stock in the amount of $500 million. Subsequent to the initial issuance,
we issued an additional 1.2 million shares in the amount of $30 million on December 14, 2007 under the same terms as the initial
issuance.
(8)Rate effective December 31, 2023. In accordance with Regulation ZZ, for quarterly periods beginning after June 30, 2023, the quarterly
dividend resets at a per annum rate equal to the greater of 7.75 % or the sum of 3-month CME Term SOFR plus 0.26161 % plus 4.23 %.
(9)Represents initial call date. Redeemable every five years thereafter.
(10)On May 19, 2008, we issued 80 million shares of preferred stock in the amount of $2 billion. Subsequent to the initial issuance, we issued
an additional 8 million shares in the amount of $200 million on May 22, 2008 and 1 million shares in the amount of $25 million on June 4,
2008 under the same terms as the initial issuance.
The preferred stock ranks junior to the senior preferred stock as to both dividends and distributions upon dissolution,
liquidation or winding down of the company. Each series of our preferred stock has no par value, is non-participating, is
non-voting and has a liquidation preference equal to the stated value per share.
Holders of preferred stock are entitled to receive non-cumulative, quarterly dividends when, and if, declared by our
Board of Directors, but have no right to require redemption of any shares of preferred stock. Payment of dividends on
preferred stock is not mandatory but has priority over payment of dividends on common stock, which are also declared
Notes to Consolidated Financial Statements | Equity | ||
Fannie Mae (In conservatorship) 2023 Form 10-K | F-56 | |
by the Board of Directors. If dividends on the preferred stock are not paid or set aside for payment for a given dividend
period, dividends may not be paid on our common stock for that period. The senior preferred stock purchase agreement
prohibits the payment of dividends on preferred stock without the prior written consent of Treasury, and the conservator
has separately confirmed the elimination of such dividends. In addition, FHFA’s regulations relating to conservatorship
and receivership operations prohibit us from paying any dividends while in conservatorship unless authorized by the
Director of FHFA. As such, we had no dividends declared or paid on the preferred stock for the years ended December
31, 2023, 2022 or 2021.
After a specified period, we have the option to redeem preferred stock at its redemption price plus the dividend (whether
or not declared) for the then-current period accrued to, but excluding, the date of redemption. The redemption price is
equal to the stated value for all issues of preferred stock except Series O, which has a redemption price of $50 to
$52.50 depending on the year of redemption and Convertible Series 2004-1, which has a redemption price of $105,000
per share.
None of our preferred stock is convertible into or exchangeable for any of our other stock or obligations, with the
exception of the Convertible Series 2004-1 which are convertible at any time, at the option of the holders, into shares of
Fannie Mae common stock at a conversion price of $94.31 per share of common stock (equivalent to a conversion rate
of 1,060.3329 shares of common stock for each share of Series 2004-1 Preferred Stock). The conversion price is
adjustable, as necessary, to maintain the stated conversion rate into common stock. Events which may trigger an
adjustment to the conversion price include certain changes in our common stock dividend rate, subdivisions of our
outstanding common stock into a greater number of shares, combinations of our outstanding common stock into a
smaller number of shares and issuances of any shares by reclassification of our common stock. No such events have
occurred.
Our preferred stock is traded in the over-the-counter market.
Common Stock
The common stock ranks junior to the senior preferred stock and the preferred stock as to both dividends and
distributions upon dissolution, liquidation or winding down of the company. Shares of common stock outstanding, net of
shares held as treasury stock, totaled 1.2
During conservatorship, the rights and powers of stockholders are suspended. Accordingly, our common stockholders
have no ability to elect directors or to vote on other matters during the conservatorship unless FHFA elects to delegate
this authority to them. In addition, we issued a warrant to Treasury that provides Treasury with the right to purchase for a
nominal price shares of our common stock equal to 79.9 % of the total number of shares of common stock outstanding
on a fully diluted basis on the date of exercise, which would substantially dilute the ownership in Fannie Mae of our
common stockholders at the time of exercise. Refer to the “Senior Preferred Stock” and “Common Stock Warrant”
sections of this note for more information.
The senior preferred stock purchase agreement prohibits the payment of dividends on common stock without the prior
written consent of Treasury and the conservator has separately confirmed the elimination of such dividends. In addition,
FHFA’s regulations relating to conservatorship and receivership operations prohibit us from paying any dividends while
in conservatorship unless authorized by the Director of FHFA. As such, we had no dividends declared or paid on the
common stock for the years ended December 31, 2023, 2022 or 2021.
Earnings per share (“EPS”) is presented for basic and diluted EPS. However, as a result of our conservatorship status
and the terms of the senior preferred stock, no amounts would be available to distribute as dividends to common or
preferred stockholders (other than to Treasury as the holder of the senior preferred stock).
We compute basic EPS by dividing net income attributable to common stockholders by the weighted-average number of
shares of common stock outstanding during the period. Net income attributable to common stockholders excludes
amounts attributable to the senior preferred stock because such amounts increase the liquidation preference of the
senior preferred stock and therefore are required to be excluded from basic EPS. See further information on the senior
preferred stock above in “Senior Preferred Stock.”
The calculation of diluted EPS includes all the components of basic earnings per share, plus the dilutive effect of
common stock equivalents such as convertible securities and stock options. Weighted-average common shares
outstanding is increased to include the number of additional common shares that would have been outstanding if the
dilutive potential common shares had been issued. Our diluted EPS weighted-average common shares outstanding
includes 26
Notes to Consolidated Financial Statements | Equity | ||
Fannie Mae (In conservatorship) 2023 Form 10-K | F-57 | |
During periods in which a net loss attributable to common stockholders has been incurred, potential common equivalent
shares outstanding are not included in the calculation because it would have an anti-dilutive effect.
We include the shares of common stock that would be issuable upon full exercise of the common stock warrant in the
weighted average shares of outstanding for the computation of both basic and diluted earnings per share because the
warrant’s exercise prices per share is considered non-substantive (compared to the market price of our common stock)
and therefore was determined to have characteristics of non-voting common stock. For the years ended December 31,
2023, 2022 and 2021, the common stock warrant added 4.7
outstanding.
13. Regulatory Capital Requirements
The enterprise regulatory capital framework rule that is applicable to us was initially published by FHFA in December
2020 and subsequently amended in 2022 and 2023. Although the enterprise regulatory capital framework went into
effect in February 2021, we are not required to hold capital according to the framework’s requirements until the date of
termination of our conservatorship, or such later date as may be ordered by FHFA.
The enterprise regulatory capital framework includes the following requirements under the standardized approach
related to the amount and form of capital we must hold:
•Supplemental leverage and risk-based minimum capital requirements based largely on definitions of capital
used in U.S. banking regulators’ regulatory capital framework. Under the leverage capital requirement, we must
maintain tier 1 capital equal to at least 2.5% of adjusted total assets. Under the risk-based capital requirements,
we must maintain common equity tier 1 capital, tier 1 capital, and adjusted total capital equal to at least 4.5%,
6.0%, and 8.0%, respectively, of risk-weighted assets;
•A requirement that we hold prescribed capital buffers that can be drawn down in periods of financial stress. In
general, once we are required to be in compliance with the capital buffers, if our capital levels fall below the
prescribed buffer amounts, we must restrict capital distributions, such as stock repurchases and dividends, as
well as discretionary bonus payments to executives, until the buffer amounts are restored. The prescribed
capital buffers represent the amount of capital we are required to hold above the minimum leverage and risk-
based capital requirements. Compliance with the capital buffers will be required upon our exit from
conservatorship.
◦The prescribed leverage buffer amount (“PLBA”) represents the amount of tier 1 capital we are
required to hold above the minimum tier 1 leverage capital requirement;
◦The risk-based capital buffers consist of three separate components: a stability capital buffer, a stress
capital buffer, and a countercyclical capital buffer. Taken together, these risk-based buffers comprise
the prescribed capital conservation buffer amount (“PCCBA”). The PCCBA must be comprised entirely
of common equity tier 1 capital; and
•Specific minimum risk-weights, or “floors,” on single-family and multifamily risk-weighted exposures, as well as
retained portions of credit risk transfer transactions.
The table below sets forth information about our capital requirements under the standardized approach of the enterprise
regulatory capital framework. Available capital for purposes of the enterprise regulatory capital framework excludes the
stated value of the senior preferred stock ($120.8
Because of these exclusions, we had a deficit in available capital as of December 31, 2023 and 2022, even though we
had positive net worth under GAAP of $77.7 billion and $60.3 billion as of December 31, 2023 and 2022, respectively.
We had a shortfall of $243 billion and $258 billion of our available capital (deficit) to the adjusted total capital
requirement (including buffers) of $188 billion and $184 billion under the standardized approach of the enterprise
regulatory capital framework as shown in the table below as of December 31, 2023 and December 31, 2022,
respectively.
Risk-weighted assets increased from $1,316 billion as of December 31, 2022 to $1,357 billion as of December 31, 2023,
primarily due to an increase in the countercyclical adjustment we are required to apply in the calculation of credit risk
weights for our single-family mortgage exposures under the enterprise regulatory capital framework and declining
property values in our multifamily book of business. The countercyclical adjustment is intended to stabilize our capital
requirements through home price cycles by adjusting mark-to-market LTV ratios for single-family mortgage loans when
national home prices are meaningfully above or below the long-term trend. These increases were partially offset by our
on-going credit risk transfer issuances, which reduce risk-weighted assets.
Notes to Consolidated Financial Statements | Equity | ||
Fannie Mae (In conservatorship) 2023 Form 10-K | F-58 | |
As of December 31, 2023 and December 31, 2022, our risk-based adjusted total capital requirement (including buffers)
represented the amount of capital needed to be fully capitalized under the standardized approach to the enterprise
regulatory capital framework.
Capital Metrics under the Enterprise Regulatory Capital Framework as of December 31, 2023(1) | ||||||||||||
(Dollars in billions) | ||||||||||||
Adjusted total assets | $ | |||||||||||
Risk-weighted assets | ||||||||||||
Amounts | Ratios | |||||||||||
Available Capital (Deficit)(2) | Minimum Capital Requirement | Total Capital Requirement (including Buffers)(3) | Available Capital (Deficit) Ratio(4) | Minimum Capital Ratio Requirement | Total Capital Requirement Ratio (including Buffers) | |||||||
Risk-based capital: | ||||||||||||
Total capital (statutory)(5) | $( | $ | $ | ( | ||||||||
Common equity tier 1 capital | ( | ( | ||||||||||
Tier 1 capital | ( | ( | ||||||||||
Adjusted total capital | ( | ( | ||||||||||
Leverage capital: | ||||||||||||
Core capital (statutory)(6) | ( | ( | ||||||||||
Tier 1 capital | ( | ( | ||||||||||
Capital Metrics under the Enterprise Regulatory Capital Framework as of December 31, 2022(1) | ||||||||||||
(Dollars in billions) | ||||||||||||
Adjusted total assets | $ | |||||||||||
Risk-weighted assets | ||||||||||||
Amounts | Ratios | |||||||||||
Available Capital (Deficit)(2) | Minimum Capital Requirement | Total Capital Requirement (including Buffers)(3) | Available Capital (Deficit) Ratio(4) | Minimum Capital Ratio Requirement | Total Capital Requirement Ratio (including Buffers) | |||||||
Risk-based capital: | ||||||||||||
Total capital (statutory)(5) | $( | $ | $ | ( | ||||||||
Common equity tier 1 capital | ( | ( | ||||||||||
Tier 1 capital | ( | ( | ||||||||||
Adjusted total capital | ( | ( | ||||||||||
Leverage capital: | ||||||||||||
Core capital (statutory)(6) | ( | ( | ||||||||||
Tier 1 capital | ( | ( | ||||||||||
(1)Ratios are calculated as a percentage of risk-weighted assets for risk-based capital metrics and as a percentage of adjusted total assets
for leverage capital metrics.
(2)Available capital (deficit) for all line items excludes the stated value of the senior preferred stock ($120.8
for all line items except total capital and core capital also deducts a portion of deferred tax assets. Deferred tax assets arising from
temporary differences between GAAP and tax requirements are deducted from capital to the extent they exceed 10% of common equity.
As of December 31, 2023 and 2022, this resulted in the full deduction of deferred tax assets ($11.7 billion and $12.9 billion, respectively),
from our available capital (deficit). Available capital (deficit) for common equity tier 1 capital also excludes the value of the perpetual,
noncumulative preferred stock ($19.1
Notes to Consolidated Financial Statements | Regulatory Capital Requirements | ||
Fannie Mae (In conservatorship) 2023 Form 10-K | F-59 | |
(3)The prescribed capital buffers represent the amount of capital we are required to hold above the minimum risk-based and leverage capital
requirements. The applicable buffer for risk-based common equity tier 1 capital, tier 1 capital, and adjusted total capital is the PCCBA,
which is composed of a stress capital buffer, a stability capital buffer, and a countercyclical capital buffer. The PCCBA must be comprised
entirely of common equity tier 1 capital. The applicable buffer for leverage tier 1 capital is the PLBA. The stress capital buffer and
countercyclical capital buffer are each calculated by multiplying prescribed factors by adjusted total assets as of the last day of the
previous calendar quarter. The stability capital buffer is based on our share of mortgage debt outstanding. The prescribed leverage buffer
for 2023 and 2022 was set at 50% of the 2023 and 2022 stability capital buffer, respectively. Going forward the stability capital buffer and
the prescribed leverage buffer will be updated with an effective date that depends on whether the stability capital buffer increases or
decreases relative to the previously calculated value.
(4)Ratios are negative because we had a deficit in available capital for each tier of capital.
(5)The sum of (a) core capital (see definition in footnote 6 below); and (b) a general allowance for foreclosure losses, which (i) shall include
an allowance for portfolio mortgage losses, an allowance for non-reimbursable foreclosure costs on government claims, and an allowance
for liabilities reflected on the balance sheet for estimated foreclosure losses on mortgage-backed securities; and (ii) shall not include any
reserves made or held against specific assets; and (c) any other amounts from sources of funds available to absorb losses that the
Director of FHFA by regulation determines are appropriate to include in determining total capital.
(6)The sum of (a) the stated value of our outstanding common stock (common stock less treasury stock); (b) the stated value of our
outstanding perpetual, noncumulative preferred stock; (c) our paid-in capital; and (d) our retained earnings (accumulated deficit). Core
capital does not include: (a) accumulated other comprehensive income or (b) senior preferred stock.
While it is not applicable until the date of termination of our conservatorship, our maximum payout ratio represents the
percentage of eligible retained income that we are permitted to pay out in the form of distributions or discretionary bonus
payments under the enterprise regulatory capital framework. The maximum payout ratio for a given quarter is the lowest
of the payout ratios determined by our capital conservation buffer and our leverage buffer. As a result of our capital
shortfall, our maximum payout ratio under the enterprise regulatory capital framework as of December 31, 2023 and
December 31, 2022 was 0
Restrictions on Capital Distributions and Dividends
Statutory Restrictions. Under the GSE Act, FHFA has authority to prohibit capital distributions, including payment of
dividends, if we fail to meet our capital requirements. If FHFA classifies us as significantly undercapitalized, the approval
of the Director of FHFA is required for any dividend payment. Under the Charter Act and the GSE Act, we are not
permitted to make a capital distribution if, after making the distribution, we would be undercapitalized. The Director of
FHFA, however, may permit us to repurchase shares if the repurchase is made in connection with the issuance of
additional shares or obligations in at least an equivalent amount and will reduce our financial obligations or otherwise
improve our financial condition.
Restrictions Relating to Conservatorship and Under Senior Preferred Stock Purchase Agreement. Consistent with the
prohibition on the payment of dividends in the senior preferred stock purchase agreement, the conservator eliminated
dividends on our common and preferred stock (other than the senior preferred stock issued to the U.S. Department of
Treasury described below) during the conservatorship. For additional information on the dividend provisions for our
equity instruments and the restrictions on our ability to pay dividends, see “Note 12, Equity.”
While not currently applicable, our payment of dividends and capital distributions will be subject to the following
restrictions under the enterprise regulatory capital framework effective on the date of termination of our conservatorship:
Restrictions Under Enterprise Regulatory Capital Framework. During a calendar quarter, we will not be permitted to pay
dividends or make any other capital distributions (or create an obligation to make such distributions) that, in the
aggregate, exceed the amount equal to our eligible retained income for the quarter multiplied by our maximum payout
ratio. The maximum payout ratio for a given quarter is the lowest of the payout ratios determined by our capital
conservation buffer and our leverage buffer. We will not be subject to this limitation on distributions if we have a capital
conservation buffer that is greater than our prescribed capital conservation buffer amount and a leverage buffer that is
greater than our prescribed leverage buffer amount. Notwithstanding the above-described limitations, FHFA may permit
us to make a distribution upon our request, if FHFA determines that the distribution would not be contrary to the
purposes of this section of the enterprise regulatory capital framework or to our safety and soundness. We will not be
permitted to make any distributions during a quarter if our eligible retained income is negative and either (a) our capital
conservation buffer is less than our stress capital buffer or (b) our leverage buffer is less than our prescribed leverage
buffer amount.
Notes to Consolidated Financial Statements | Regulatory Capital Requirements | ||
Fannie Mae (In conservatorship) 2023 Form 10-K | F-60 | |
14. Concentrations of Credit Risk
Concentrations of credit risk arise when a number of lenders and counterparties engage in similar activities or have
similar economic characteristics that make them susceptible to similar changes in industry conditions, which could affect
their ability to meet their contractual obligations. Based on our assessment of business conditions that could impact our
financial results, we have determined that concentrations of credit risk exist among:
•single-family and multifamily borrowers (including geographic concentrations and loans with certain higher-risk
characteristics);
•mortgage insurers;
•mortgage lenders that sell loans to us and mortgage lenders and other counterparties that service our loans;
•multifamily lenders with risk sharing; and
•derivative counterparties.
Concentrations for each of these groups are discussed below.
Single-Family Loan Borrowers
Regional economic conditions may affect a borrower’s ability to repay a mortgage loan and the property value
underlying the loan. Geographic concentrations increase the exposure of our guaranty book of business to changes in
credit risk. Our single-family allowance is primarily affected by home prices and interest rates.
To manage credit risk and comply with our charter requirements, we typically require primary mortgage insurance or
other credit enhancements if the current LTV ratio (i.e., the ratio of the unpaid principal balance of a loan to the current
value of the property that serves as collateral) of a single-family conventional mortgage loan is greater than 80% when
the loan is delivered to us.
Multifamily Loan Borrowers
Numerous factors affect a multifamily borrower’s ability to repay the loan and the value of the property underlying the
loan. Multifamily loans are generally non-recourse to the borrower. The most significant factors affecting credit risk are
rental income, property valuations, and general economic conditions. The average unpaid principal balance for
multifamily loans is significantly larger than for single-family borrowers and, therefore, individual defaults for multifamily
borrowers can result in more significant losses. We continually monitor the performance and risk characteristics of our
multifamily loans, underlying properties and borrowers on an ongoing basis.
As part of our multifamily risk management activities, we perform detailed loan reviews that evaluate property
performance, borrower and geographic concentrations, lender qualifications, counterparty risk and contract compliance.
We generally require mortgage servicers to obtain and submit periodic property operating information and condition
reviews, allowing us to monitor the performance of individual loans. We use this information to evaluate the credit
quality of our portfolio, identify potential problem loans and initiate appropriate loss mitigation activities.
Geographic Concentration
book of business, measured by the unpaid principal balance of the loans.
Geographic Concentration(1) | |||||||||||||||
Percentage of Single- Family Conventional Guaranty Book of Business | Percentage of Multifamily Guaranty Book of Business | ||||||||||||||
As of December 31, | As of December 31, | ||||||||||||||
2023 | 2022 | 2023 | 2022 | ||||||||||||
Midwest | % | % | % | % | |||||||||||
Northeast | |||||||||||||||
Southeast | |||||||||||||||
Southwest | |||||||||||||||
West | |||||||||||||||
Total | % | % | % | % | |||||||||||
(1)Midwest consists of IL, IN, IA, MI, MN, NE, ND, OH, SD and WI. Northeast consists of CT, DE, ME, MA, NH, NJ, NY, PA, PR, RI, VT and
VI. Southeast consists of AL, DC, FL, GA, KY, MD, MS, NC, SC, TN, VA and WV. Southwest consists of AZ, AR, CO, KS, LA, MO, NM, OK,
TX and UT. West consists of AK, CA, GU, HI, ID, MT, NV, OR, WA and WY.
Notes to Consolidated Financial Statements | Concentrations of Credit Risk | ||
Fannie Mae (In conservatorship) 2023 Form 10-K | F-61 | |
book of business.
For single-family and multifamily loans, we use this information, in conjunction with housing market and other economic
data, to structure our pricing and our eligibility and underwriting criteria to reflect the current risk of loans with higher-risk
characteristics, and in some cases we decide to significantly reduce our participation in riskier loan product categories.
Management also uses this data together with other credit risk measures to identify key trends that guide the
development of our loss mitigation strategies.
We report the delinquency status of our single-family and multifamily guaranty book of business below.
Single-Family Credit Risk Characteristics
For single-family loans, management monitors the serious delinquency rate, which is the percentage of single-family
loans, based on number of loans, that are 90 days or more past due or in the foreclosure process, and loans that have
higher risk characteristics, such as high mark-to-market LTV ratios.
single-family conventional guaranty book of business.
As of December 31, | |||||||||||
2023 | 2022 | ||||||||||
30 Days Delinquent | 60 Days Delinquent | Seriously Delinquent(1) | 30 Days Delinquent | 60 Days Delinquent | Seriously Delinquent(1) | ||||||
Percentage of single-family conventional guaranty book of business based on UPB | |||||||||||
Percentage of single-family conventional loans based on loan count | |||||||||||
As of December 31, | |||||||
2023 | 2022 | ||||||
Percentage of Single-Family Conventional Guaranty Book of Business Based on UPB | Seriously Delinquent Rate(1) | Percentage of Single-Family Conventional Guaranty Book of Business Based on UPB | Seriously Delinquent Rate(1) | ||||
Estimated mark-to-market LTV ratio: | |||||||
80.01% to 90% | |||||||
90.01% to 100% | |||||||
Greater than 100% | * | * | |||||
Geographical distribution: | |||||||
California | |||||||
Florida | |||||||
Illinois | |||||||
New York | |||||||
Texas | |||||||
All other states | |||||||
Vintages: | |||||||
2008 and prior | |||||||
2009-2023 | |||||||
*Represents less than 0.5
(1)Based on loan count, consists of single-family conventional loans that were 90
December 31, 2023 and 2022.
Notes to Consolidated Financial Statements | Concentrations of Credit Risk | ||
Fannie Mae (In conservatorship) 2023 Form 10-K | F-62 | |
For multifamily loans, management monitors the serious delinquency rate, which is the percentage of multifamily loans,
based on unpaid principal balance, that are 60 days or more past due, and loans with other higher risk characteristics to
determine the overall credit quality of our multifamily book of business. Higher risk characteristics include, but are not
limited to, current DSCR below 1.0 and original LTV ratios greater than 80%. We stratify multifamily loans into different
internal risk categories based on the credit risk inherent in each individual loan.
multifamily guaranty book of business.
As of December 31, | |||||||
2023(1) | 2022(1) | ||||||
30 Days Delinquent | Seriously Delinquent(2) | 30 Days Delinquent | Seriously Delinquent(2) | ||||
Percentage of multifamily guaranty book of business | |||||||
As of December 31, | |||||||
2023 | 2022 | ||||||
Percentage of Multifamily Guaranty Book of Business(1) | Serious Delinquency Rate(2)(3) | Percentage of Multifamily Guaranty Book of Business(1) | Serious Delinquency Rate(2)(3) | ||||
Original LTV ratio: | |||||||
Greater than 80% | |||||||
Less than or equal to 80% | |||||||
Current DSCR below 1.0(4) | |||||||
(1)Calculated based on the aggregate unpaid principal balance of multifamily loans for each category divided by the aggregate unpaid
principal balance of loans in our multifamily guaranty book of business.
(2)Consists of multifamily loans that were 60 days or more past due as of the dates indicated.
(3)Calculated based on the unpaid principal balance of multifamily loans that were seriously delinquent divided by the aggregate unpaid
principal balance of multifamily loans for each category included in our multifamily guaranty book of business.
(4)Our estimates of current DSCRs are based on the latest available income information covering a 12 month period, from quarterly and
annual statements for these properties including the related debt service.
Mortgage Insurers. Mortgage insurance “risk in force” refers to our maximum potential loss recovery under the
applicable mortgage insurance policies in force and is generally based on the loan-level insurance coverage percentage
and, if applicable, any aggregate pool loss limit, as specified in the policy.
risk-in-force mortgage insurance coverage as a percentage of the single-family conventional guaranty book of business.
As of December 31, | ||||||||
2023 | 2022 | |||||||
Risk in Force | Percentage of Single-Family Conventional Guaranty Book of Business | Risk in Force | Percentage of Single-Family Conventional Guaranty Book of Business | |||||
(Dollars in millions) | ||||||||
Mortgage insurance risk in force: | ||||||||
Primary mortgage insurance | $ | $ | ||||||
Pool mortgage insurance | ||||||||
Total mortgage insurance risk in force | $ | $ | ||||||
Mortgage insurance only covers losses that are realized after the borrower defaults and title to the property is
subsequently transferred, such as after a foreclosure, short-sale, or a deed-in-lieu of foreclosure. Also, mortgage
insurance does not protect us from all losses on covered loans. For example, mortgage insurance does not cover
Notes to Consolidated Financial Statements | Concentrations of Credit Risk | ||
Fannie Mae (In conservatorship) 2023 Form 10-K | F-63 | |
property damage that is not covered by the hazard insurance we require, and such damage may result in a reduction to,
or a denial of, mortgage insurance benefits. Specifically, a property damaged by a flood that was outside a Federal
Emergency Management Agency (“FEMA”)-identified Special Flood Hazard Area, coastal barrier resources system, or
otherwise protected area, where we require coverage, or a property damaged by an earthquake are the most likely
scenarios where property damage may result in a default not covered by hazard insurance.
insurance coverage on mortgage loans in our single-family conventional guaranty book of business.
Percentage of Risk-in-Force Coverage by Mortgage Insurer | ||||
As of December 31, | ||||
2023 | 2022 | |||
Counterparty:(1) | ||||
Mortgage Guaranty Insurance Corp. | ||||
Radian Guaranty, Inc. | ||||
Arch Capital Group Ltd. | ||||
Enact Mortgage Insurance Corp. | ||||
Essent Guaranty, Inc. | ||||
National Mortgage Insurance Corp. | ||||
Others | ||||
Total | ||||
(1)Insurance coverage amounts provided for each counterparty may include coverage provided by affiliates and subsidiaries of the
counterparty.
We have counterparty credit risk relating to the potential insolvency of, or non-performance by, monoline mortgage
insurers that insure single-family loans we purchase or guarantee. There is risk that these counterparties may fail to
fulfill their obligations to pay our claims under insurance policies. On at least a quarterly basis, we assess our mortgage
insurer counterparties’ respective abilities to fulfill their obligations to us. Our assessment includes financial reviews and
analyses of the insurers’ portfolios and capital adequacy. If we determine that it is probable that we will not collect all of
our claims from one or more of our mortgage insurer counterparties, it could increase our loss reserves, which could
adversely affect our results of operations, liquidity, financial condition and net worth.
When we estimate the credit losses that are inherent in our mortgage loans and under the terms of our guaranty
obligations, we also consider the recoveries that we expect to receive from primary mortgage insurance, as mortgage
insurance recoveries reduce the severity of the loss associated with defaulted loans if the borrower defaults and title to
the property is subsequently transferred. Mortgage insurance does not cover credit losses that result from a reduction in
mortgage interest paid by the borrower in connection with a loan modification, forbearance of principal, or forbearance
of scheduled loan payments. We evaluate the financial condition of our mortgage insurer counterparties and adjust the
contractually due recovery amounts to ensure that expected credit losses as of the balance sheet date are included in
our loss reserve estimate. As a result, if our assessment of one or more of our mortgage insurer counterparties’ ability to
fulfill their respective obligations to us worsens, it could increase our loss reserves. As of December 31, 2023 and 2022,
our estimated benefit from mortgage insurance, which is based on estimated credit losses as of period end, reduced our
loss reserves by $1.2 billion and $2.2 billion, respectively.
loan, eliminating any previously-recorded loss reserves, and record REO and a mortgage insurance receivable for the
claim proceeds deemed probable of recovery, as appropriate. However, if a mortgage insurer rescinds, cancels or
receivables of $471 million recorded in “Other assets” in our consolidated balance sheets as of December 31, 2023 and
$515 million as of December 31, 2022 related to amounts claimed on insured, defaulted loans excluding government-
insured loans. We assessed these outstanding receivables for collectability, and established a valuation allowance of
$417 million as of December 31, 2023 and $462 million as of December 31, 2022, which reduced our claim receivable
to the amount considered probable of collection.
Mortgage Servicers and Sellers. Mortgage servicers collect mortgage and escrow payments from borrowers, pay taxes
and insurance costs from escrow accounts, monitor and report delinquencies, and perform other required activities,
including loss mitigation, on our behalf. Our mortgage servicers and sellers may also be obligated to repurchase loans
or foreclosed properties, reimburse us for losses or provide other remedies under certain circumstances, such as if it is
determined that the mortgage loan did not meet our underwriting or eligibility requirements, if certain loan
representations and warranties are violated or if mortgage insurers rescind coverage. Our representation and warranty
Notes to Consolidated Financial Statements | Concentrations of Credit Risk | ||
Fannie Mae (In conservatorship) 2023 Form 10-K | F-64 | |
framework does not require repurchase for loans that have breaches of certain selling representations and warranties if
they have met specified criteria for relief.
Our business with mortgage servicers is concentrated. The table below displays the percentage of our single-family
conventional guaranty book of business serviced by our top five depository single-family mortgage servicers and top five
non-depository single-family mortgage servicers (i.e., servicers that are not insured depository institutions) based on
unpaid principal balance. There were no servicers that serviced 10% or more of our single-family guaranty book of
business as of December 31, 2023 or 2022.
Percentage of Single-Family Conventional Guaranty Book of Business | ||||
As of December 31, | ||||
2023 | 2022 | |||
Top five depository servicers | ||||
Top five non-depository servicers | ||||
Total | ||||
depository multifamily mortgage servicers and top five non-depository multifamily mortgage servicers. As of December
31, 2023, two servicers serviced 10% or more of our multifamily guaranty book of business, Walker & Dunlop, Inc. and
Wells Fargo Bank, N.A. (together with its affiliates). As of December 31, 2023, Walker & Dunlop, Inc. and Wells Fargo
Bank, N.A. (together with its affiliates) serviced 13 % and 10 %, respectively, of our multifamily guaranty book of business
based on unpaid principal balance, compared with 13 % and 11 % as of December 31, 2022.
Percentage of Multifamily Guaranty Book of Business | ||||
As of December 31, | ||||
2023 | 2022 | |||
Top five depository servicers | ||||
Top five non-depository servicers | ||||
Total | ||||
Multifamily Lenders with Risk Sharing. We enter into risk sharing agreements with lenders pursuant to which the lenders
agree to bear all or some portion of the credit losses on the covered loans. Our maximum potential loss recovery from
lenders under these risk sharing agreements on both DUS and non-DUS multifamily loans was $111.9 billion as of
December 31, 2023, compared with $103.9 billion as of December 31, 2022. As of December 31, 2023, 52 % of our
maximum potential loss recovery on multifamily loans was from five DUS lenders, as compared with 53 % as of
December 31, 2022.
Derivatives Counterparties. For information on credit risk associated with our derivative transactions and repurchase
agreements see “Note 9, Derivative Instruments” and “Note 15, Netting Arrangements.”
Notes to Consolidated Financial Statements | Concentrations of Credit Risk | ||
Fannie Mae (In conservatorship) 2023 Form 10-K | F-65 | |
15. Netting Arrangements
We use master netting arrangements, which allow us to offset certain financial instruments and collateral with the same
counterparty, to minimize counterparty credit exposure. The tables below display information related to derivatives and
securities purchased under agreements to resell, which are subject to an enforceable master netting arrangement or
similar agreement that are either offset or not offset in our consolidated balance sheets.
As of December 31, 2023 | |||||||||||||
Gross Amount Offset(1) | Net Amount Presented in our Consolidated Balance Sheets | Amounts Not Offset in our Consolidated Balance Sheets | |||||||||||
Gross Amount | Financial Instruments(2) | Collateral(3) | Net Amount | ||||||||||
(Dollars in millions) | |||||||||||||
Assets: | |||||||||||||
OTC risk management derivatives | $ | $( | $ | $ | $ | $ | |||||||
Cleared risk management derivatives | |||||||||||||
Mortgage commitment derivatives | ( | ( | |||||||||||
Total derivative assets | ( | (4) | ( | ( | |||||||||
Securities purchased under agreements to resell(5) | ( | ||||||||||||
Total assets | $ | $( | $ | $( | $( | $ | |||||||
Liabilities: | |||||||||||||
OTC risk management derivatives | $( | $ | $( | $ | $ | $( | |||||||
Cleared risk management derivatives | ( | ( | |||||||||||
Mortgage commitment derivatives | ( | ( | ( | ||||||||||
Total liabilities | $( | $ | $( | (4) | $ | $ | $( |
As of December 31, 2022 | |||||||||||||
Gross Amount Offset(1) | Net Amount Presented in our Consolidated Balance Sheets | Amounts Not Offset in our Consolidated Balance Sheets | |||||||||||
Gross Amount | Financial Instruments(2) | Collateral(3) | Net Amount | ||||||||||
(Dollars in millions) | |||||||||||||
Assets: | |||||||||||||
OTC risk management derivatives | $ | $( | $ | $ | $ | $ | |||||||
Cleared risk management derivatives | |||||||||||||
Mortgage commitment derivatives | ( | ( | |||||||||||
Total derivative assets | ( | (4) | ( | ( | |||||||||
Securities purchased under agreements to resell(5) | ( | ||||||||||||
Total assets | $ | $( | $ | $( | $( | $ | |||||||
Liabilities: | |||||||||||||
OTC risk management derivatives | $( | $ | $( | $ | $ | $( | |||||||
Cleared risk management derivatives | |||||||||||||
Mortgage commitment derivatives | ( | ( | ( | ||||||||||
Total liabilities | $( | $ | $( | (4) | $ | $ | $( | ||||||
(1)Represents the effect of the right to offset under legally enforceable master netting arrangements to settle with the same counterparty on a
net basis, including cash collateral posted and received and accrued interest.
(2)Mortgage commitment derivative amounts reflect where we have recognized both an asset and a liability with the same counterparty under
an enforceable master netting arrangement but we have not elected to offset the related amounts in our consolidated balance sheets.
Notes to Consolidated Financial Statements | Netting Arrangements | ||
Fannie Mae (In conservatorship) 2023 Form 10-K | F-66 | |
(3)Represents collateral received that has not been recognized and not offset in our consolidated balance sheets as well as collateral posted
which has been recognized but not offset in our consolidated balance sheets. Does not include collateral held or posted in excess of our
exposure. The fair value of non-cash collateral we pledged which the counterparty was permitted to sell or repledge was $2.2 billion and
$2.1 billion as of December 31, 2023 and 2022, respectively. The fair value of non-cash collateral received was $65.5 billion and $69.5
billion, of which $55.4 billion and $28.7 billion could be sold or repledged as of December 31, 2023 and 2022, respectively. None
underlying collateral was sold or repledged as of December 31, 2023 and 2022.
(4)Excludes derivative assets recognized in our consolidated balance sheets of $45 million and $3 million as of December 31, 2023 and
2022, and derivative liabilities recognized in our consolidated balance sheets of $13 million and $66 million as of December 31, 2023 and
2022, respectively, that were not subject to enforceable master netting arrangements.
(5)Includes $21.8 billion and $45.2 billion of securities purchased under agreements to resell classified as “Cash and cash equivalents” in our
consolidated balance sheets as of December 31, 2023 and 2022, respectively. Includes $12.9 billion and $9.7 billion in securities
purchased under agreements to resell classified as “Restricted cash and cash equivalents” in our consolidated balance sheets as of
December 31, 2023 and 2022, respectively.
amortized cost in our consolidated balance sheets.
We determine our rights to offset the assets and liabilities presented above with the same counterparty, including
collateral posted or received, based on the contractual arrangements entered into with our individual counterparties and
description, under various agreements, of the nature of those rights and their effect or potential effect on our financial
position.
The terms of the majority of our contracts for OTC risk management derivatives are governed under master agreements
of the International Swaps and Derivatives Association Inc. (“ISDA”). These agreements provide that all transactions
entered into under the agreement with the counterparty constitute a single contractual relationship. An event of default
by the counterparty allows the early termination of all outstanding transactions under the same ISDA agreement and we
may offset all outstanding amounts related to the terminated transactions including collateral posted or received.
The terms of our contracts for cleared derivatives are governed under the rules of the clearing organization and the
agreement between us and the clearing member of that clearing organization. In the event of a clearing organization
default, all open positions at the clearing organization are closed and a net position (on a clearing member by clearing
member basis) is calculated. Unless otherwise transferred, in the event of a clearing member default, all open positions
cleared through that clearing member are closed and a net position is calculated.
The terms of our contracts for mortgage commitment derivatives are primarily governed by the Fannie Mae Single-
Family Selling Guide (“Selling Guide”), for Fannie Mae-approved lenders, or Master Securities Forward Transaction
Agreements (“MSFTA”), for counterparties that are not Fannie Mae-approved lenders. In the event of default by the
counterparty, both the Selling Guide and the MSFTA allow us to terminate all outstanding transactions under the
applicable agreement and offset all outstanding amounts related to the terminated transactions including collateral
posted or received. Under the Selling Guide, upon a lender event of default, we generally may offset any amounts owed
to a lender against any amounts a lender may owe us under any other existing agreement, regardless of whether or not
such other agreements are in default or payments are immediately due.
The terms of our contracts for securities purchased under agreements to resell are governed by Master Repurchase
Agreements, which are based on the guidelines prescribed by the Securities Industry and Financial Markets
Association. Master Repurchase Agreements provide that all transactions under the agreement constitute a single
contractual relationship. An event of default by the counterparty allows the early termination of all outstanding
transactions under the same agreement and we may offset all outstanding amounts related to the terminated
transactions including collateral posted or received.
In addition to these contractual relationships, we are also a clearing member of two divisions of Fixed Income Clearing
Corporation (“FICC”), a central counterparty (“CCP”). One FICC division clears our trades involving securities
purchased under agreements to resell, securities sold under agreements to repurchase, and other non-mortgage
related securities. The other division clears our forward purchase and sale commitments of mortgage-related securities,
including dollar roll transactions. As a result of these trades, we are required to post initial and variation margin
payments as well as settle certain positions each business day in cash. As a clearing member of FICC, we are exposed
to the risk that the FICC or one or more of the CCP’s clearing members fails to perform its obligations as described
below.
•A default by or the financial or operational failure of FICC would require us to replace transactions cleared
through FICC, thereby increasing operational costs and potentially resulting in losses.
•We may also be exposed to losses if a clearing member of FICC defaults on its obligations as each clearing
member is required to absorb a portion of those fellow-clearing member losses. As a result, we could lose the
margin that we have posted to FICC. Moreover, our exposure could exceed the amount of margin that we
Notes to Consolidated Financial Statements | Netting Arrangements | ||
Fannie Mae (In conservatorship) 2023 Form 10-K | F-67 | |
previously posted to FICC, since FICC’s rules require non-defaulting clearing members to cover, on a pro rata
basis, losses caused by a clearing member’s default.
We are unable to develop an estimate of the maximum potential amount of future payments that we could be required to
make to FICC under these arrangements as our exposure is dependent on the volume of trades FICC clearing
members execute now and in the future, which varies daily. Although we are unable to develop an estimate of our
maximum exposure, we expect that losses caused by any clearing member would be partially offset by the fair value of
margin posted by the defaulting clearing member and any other available assets of the CCP for those purposes. We
believe that the risk of a material loss is remote due to FICC’s margin and settlement requirements, guarantee funds
and other resources that are available in the event of a default.
We actively monitor the risks associated with FICC in order to effectively manage this counterparty risk and our
16. Fair Value
certain assets and liabilities on a recurring or nonrecurring basis.
Fair value measurement guidance defines fair value, establishes a framework for measuring fair value and sets forth
disclosures around fair value measurements. This guidance applies whenever other accounting guidance requires or
permits assets or liabilities to be measured at fair value. The guidance establishes a three-level fair value hierarchy that
prioritizes the inputs into the valuation techniques used to measure fair value. The fair value hierarchy gives the highest
priority, Level 1, to measurements based on unadjusted quoted prices in active markets for identical assets or liabilities.
The next highest priority, Level 2, is given to measurements of assets and liabilities based on limited observable inputs
or observable inputs for similar assets and liabilities. The lowest priority, Level 3, is given to measurements based on
unobservable inputs.
Recurring Changes in Fair Value
recurring basis subsequent to initial recognition, including instruments for which we have elected the fair value option.
Fair Value Measurements as of December 31, 2023 | |||||||||||||||||||
Quoted Prices in Active Markets for Identical Assets (Level 1) | Significant Other Observable Inputs (Level 2) | Significant Unobservable Inputs (Level 3) | Netting Adjustment(1) | Estimated Fair Value | |||||||||||||||
Recurring fair value measurements: | (Dollars in millions) | ||||||||||||||||||
Assets: | |||||||||||||||||||
Trading securities: | |||||||||||||||||||
Mortgage-related | $ | $ | $ | $— | $ | ||||||||||||||
Non-mortgage-related(2) | — | ||||||||||||||||||
Total trading securities | — | ||||||||||||||||||
Available-for-sale securities: | |||||||||||||||||||
Agency(3) | — | ||||||||||||||||||
Other mortgage-related | — | ||||||||||||||||||
Total available-for-sale securities | — | ||||||||||||||||||
Mortgage loans | — | ||||||||||||||||||
( | |||||||||||||||||||
Total assets at fair value | $ | $ | $ | $( | $ | ||||||||||||||
Liabilities: | |||||||||||||||||||
Long-term debt: | |||||||||||||||||||
Of Fannie Mae | $ | $ | $ | $— | $ | ||||||||||||||
Of consolidated trusts | — | ||||||||||||||||||
Total long-term debt | — | ||||||||||||||||||
( | |||||||||||||||||||
Total liabilities at fair value | $ | $ | $ | $( | $ | ||||||||||||||
Notes to Consolidated Financial Statements | Netting Arrangements | ||
Fannie Mae (In conservatorship) 2023 Form 10-K | F-68 | |
Fair Value Measurements as of December 31, 2022 | |||||||||||||||||||
Quoted Prices in Active Markets for Identical Assets (Level 1) | Significant Other Observable Inputs (Level 2) | Significant Unobservable Inputs (Level 3) | Netting Adjustment(1) | Estimated Fair Value | |||||||||||||||
Recurring fair value measurements: | (Dollars in millions) | ||||||||||||||||||
Assets: | |||||||||||||||||||
Trading securities: | |||||||||||||||||||
Mortgage-related | $ | $ | $ | $— | $ | ||||||||||||||
Non-mortgage-related(2) | — | ||||||||||||||||||
Total trading securities | — | ||||||||||||||||||
Available-for-sale securities: | |||||||||||||||||||
Agency(3) | — | ||||||||||||||||||
Other mortgage-related | — | ||||||||||||||||||
Total available-for-sale securities | — | ||||||||||||||||||
Mortgage loans | — | ||||||||||||||||||
( | |||||||||||||||||||
Total assets at fair value | $ | $ | $ | $( | $ | ||||||||||||||
Liabilities: | |||||||||||||||||||
Long-term debt: | |||||||||||||||||||
Of Fannie Mae | $ | $ | $ | $— | $ | ||||||||||||||
Of consolidated trusts | — | ||||||||||||||||||
Total long-term debt | — | ||||||||||||||||||
( | |||||||||||||||||||
Total liabilities at fair value | $ | $ | $ | $( | $ | ||||||||||||||
(1)Derivative contracts are reported on a gross basis by level. The netting adjustment represents the effect of the legal right to offset under
legally enforceable master netting arrangements to settle with the same counterparty on a net basis, including cash collateral posted and
received.
(2)Primarily includes U.S. Treasury securities.
(3)Agency securities consist of securities issued by Fannie Mae, Freddie Mac, and Ginnie Mae.
Notes to Consolidated Financial Statements | Fair Value | ||
Fannie Mae (In conservatorship) 2023 Form 10-K | F-69 | |
significant unobservable inputs (Level 3). The tables also display gains and losses due to changes in fair value,
including both realized and unrealized gains and losses, recognized in our consolidated statements of operations and
comprehensive income for Level 3 assets and liabilities.
Fair Value Measurements Using Significant Unobservable Inputs (Level 3) | ||||||||||||||||||||||||||
For the Year Ended December 31, 2023 | ||||||||||||||||||||||||||
Total Gains (Losses) (Realized/Unrealized) | Net Unrealized Gains (Losses) Included in Net Income Related to Assets and Liabilities Still Held as of December 31, 2023(4)(5) | Net Unrealized Gains (Losses) Included in OCI Related to Assets and Liabilities Still Held as of December 31, 2023(1) | ||||||||||||||||||||||||
Balance, December 31, 2022 | Included in Net Income | Included in Total OCI (Loss)(1) | Purchases(2) | Sales(2) | Issues(3) | Settlements(3) | Transfers out of Level 3 | Transfers into Level 3 | Balance, December 31, 2023 | |||||||||||||||||
(Dollars in millions) | ||||||||||||||||||||||||||
Trading securities: | ||||||||||||||||||||||||||
Mortgage-related | $ | $( | (5)(6) | $ | $ | $ | $ | $( | $( | $ | $ | $( | $— | |||||||||||||
Available-for-sale securities: | ||||||||||||||||||||||||||
Agency | $ | $ | $( | $ | $ | $ | $( | $( | $ | $ | $— | $( | ||||||||||||||
Other mortgage- related | ( | ( | — | |||||||||||||||||||||||
Total available-for- sale securities | $ | $ | (6)(7) | $( | $ | $ | $ | $( | $( | $ | $ | $— | $( | |||||||||||||
Mortgage loans | $ | $ | (5)(6) | $ | $ | $( | $ | $( | $( | $ | $ | $ | $— | |||||||||||||
Net derivatives | ( | (5) | — | |||||||||||||||||||||||
Long-term debt: | ||||||||||||||||||||||||||
Of Fannie Mae | $( | $( | (5) | $ | $ | $ | $ | $ | $ | $ | $( | $( | $— | |||||||||||||
Of consolidated trusts | ( | (5)(6) | ( | ( | — | |||||||||||||||||||||
$( | $( | $ | $ | $ | $ | $ | $ | $( | $( | $( | $— | |||||||||||||||
Fair Value Measurements Using Significant Unobservable Inputs (Level 3) | ||||||||||||||||||||||||||
For the Year Ended December 31, 2022 | ||||||||||||||||||||||||||
Total Gains (Losses) (Realized/Unrealized) | Net Unrealized Gains (Losses) Included in Net Income Related to Assets and Liabilities Still Held as of December 31, 2022(4)(5) | Net Unrealized Gains (Losses) Included in OCI Related to Assets and Liabilities Still Held as of December 31, 2022(1) | ||||||||||||||||||||||||
Balance, December 31, 2021 | Included in Net Income | Included in Total OCI (Loss)(1) | Purchases(2) | Sales(2) | Issues(3) | Settlements(3) | Transfers out of Level 3 | Transfers into Level 3 | Balance, December 31, 2022 | |||||||||||||||||
(Dollars in millions) | ||||||||||||||||||||||||||
Trading securities: | ||||||||||||||||||||||||||
Mortgage-related | $ | $( | (5)(6) | $ | $ | $ | $ | $( | $( | $ | $ | $( | $— | |||||||||||||
Available-for-sale securities: | ||||||||||||||||||||||||||
Agency | $ | $ | $( | $ | $ | $ | $( | $ | $ | $ | $— | $( | ||||||||||||||
Other mortgage- related | ( | ( | ( | ( | — | ( | ||||||||||||||||||||
Total available-for- sale securities | $ | $( | (6)(7) | $( | $ | $ | $ | $( | $( | $ | $ | $— | $( | |||||||||||||
Mortgage loans | $ | $( | (5)(6) | $ | $ | $( | $ | $( | $( | $ | $ | $( | $— | |||||||||||||
Net derivatives | ( | (5) | ( | ( | — | |||||||||||||||||||||
Long-term debt: | ||||||||||||||||||||||||||
Of Fannie Mae | $( | $ | (5) | $ | $ | $ | $ | $ | $ | $ | $( | $ | $— | |||||||||||||
Of consolidated trusts | ( | (5)(6) | ( | ( | ( | — | ||||||||||||||||||||
$( | $ | $ | $ | $ | $( | $ | $ | $( | $( | $ | $— | |||||||||||||||
Notes to Consolidated Financial Statements | Fair Value | ||
Fannie Mae (In conservatorship) 2023 Form 10-K | F-70 | |
Fair Value Measurements Using Significant Unobservable Inputs (Level 3) | ||||||||||||||||||||||||||
For the Year Ended December 31, 2021 | ||||||||||||||||||||||||||
Total Gains (Losses) (Realized/Unrealized) | Net Unrealized Gains (Losses) Included in Net Income Related to Assets and Liabilities Still Held as of December 31, 2021(4)(5) | Net Unrealized Gains (Losses) Included in OCI Related to Assets and Liabilities Still Held as of December 31, 2021(1) | ||||||||||||||||||||||||
Balance, December 31, 2020 | Included in Net Income | Included in Total OCI (Loss)(1) | Purchases(2) | Sales(2) | Issues(3) | Settlements(3) | Transfers out of Level 3 | Transfers into Level 3 | Balance, December 31, 2021 | |||||||||||||||||
(Dollars in millions) | ||||||||||||||||||||||||||
Trading securities: | ||||||||||||||||||||||||||
Mortgage-related | $ | $( | (5)(6) | $ | $ | $ | $ | $ | $( | $ | $ | $ | $— | |||||||||||||
Available-for-sale securities: | ||||||||||||||||||||||||||
Agency | $ | $ | $( | $ | $ | $ | $( | $( | $ | $ | $— | $ | ||||||||||||||
Other mortgage- related | ( | ( | — | ( | ||||||||||||||||||||||
Total available-for- sale securities | $ | $ | (6)(7) | $( | $ | $ | $ | $( | $( | $ | $ | $— | $ | |||||||||||||
Mortgage loans | $ | $ | (5)(6) | $ | $ | $( | $ | $( | $( | $ | $ | $ | $— | |||||||||||||
Net derivatives | ( | (5) | ( | — | ||||||||||||||||||||||
Long-term debt: | ||||||||||||||||||||||||||
Of Fannie Mae | $( | $ | (5) | $ | $ | $ | $ | $ | $ | $ | $( | $ | $— | |||||||||||||
Of consolidated trusts | ( | ( | (5)(6) | ( | ( | ( | — | |||||||||||||||||||
$( | $ | $ | $ | $ | $ | $ | $ | $( | $( | $ | $— | |||||||||||||||
(1)Gains (losses) are included in “Other comprehensive loss” in our consolidated statements of operations and comprehensive income.
(2)Purchases and sales include activity related to the consolidation and deconsolidation of assets of securitization trusts.
(3)Issues and settlements include activity related to the consolidation and deconsolidation of liabilities of securitization trusts.
(4)Amount represents temporary changes in fair value. Amortization, accretion and the impairment of credit losses are not considered
unrealized and are not included in this amount.
(5)Gains (losses) are included in “Fair value gains, net” in our consolidated statements of operations and comprehensive income.
(6)Gains (losses) included in “Net interest income” in our consolidated statements of operations and comprehensive income includes
amortization of cost basis adjustments.
Notes to Consolidated Financial Statements | Fair Value | ||
Fannie Mae (In conservatorship) 2023 Form 10-K | F-71 | |
inputs for our Level 3 assets and liabilities measured at fair value on a recurring basis, excluding instruments for which
we have elected the fair value option. Changes in these unobservable inputs can result in significantly higher or lower
fair value measurements of these assets and liabilities as of the reporting date.
Fair Value Measurements as of December 31, 2023 | ||||||||||||
Fair Value | Significant Valuation Techniques | Significant Unobservable Inputs(1) | Range(1) | Weighted - Average(1)(2) | ||||||||
(Dollars in millions) | ||||||||||||
Recurring fair value measurements: | ||||||||||||
Trading securities: | ||||||||||||
Mortgage-related(3) | $ | Various | ||||||||||
Available-for-sale securities: | ||||||||||||
Agency(3) | Consensus | |||||||||||
Other mortgage-related | Discounted Cash Flow | Spreads (bps) | - | |||||||||
Single Vendor | ||||||||||||
Various | ||||||||||||
Total other mortgage-related | ||||||||||||
Total available-for-sale securities | $ | |||||||||||
Net derivatives | $ | Dealer Mark | ||||||||||
Discounted Cash Flow | ||||||||||||
Total net derivatives | $ | |||||||||||
Fair Value Measurements as of December 31, 2022 | ||||||||||||
Fair Value | Significant Valuation Techniques | Significant Unobservable Inputs(1) | Range(1) | Weighted - Average(1)(2) | ||||||||
(Dollars in millions) | ||||||||||||
Recurring fair value measurements: | ||||||||||||
Trading securities: | ||||||||||||
Mortgage-related(3) | $ | Various | ||||||||||
Available-for-sale securities: | ||||||||||||
Agency(3) | Consensus | |||||||||||
Other mortgage-related | Discounted Cash Flow | Spreads (bps) | - | |||||||||
Single Vendor | ||||||||||||
Various | ||||||||||||
Total other mortgage-related | ||||||||||||
Total available-for-sale securities | $ | |||||||||||
Net derivatives | $ | Dealer Mark | ||||||||||
( | Discounted Cash Flow | |||||||||||
Total net derivatives | $( | |||||||||||
(1)Valuation techniques for which no unobservable inputs are disclosed generally reflect the use of third-party pricing services or dealers, and
the range of unobservable inputs applied by these sources is not readily available or cannot be reasonably estimated. Where we have
disclosed unobservable inputs for consensus and single vendor techniques, those inputs are based on our validations performed at the
security level using discounted cash flows.
(2)Unobservable inputs were weighted by the relative fair value of the instruments.
(3)Includes Fannie Mae and Freddie Mac securities.
is, the instruments are not measured at fair value on an ongoing basis but are subject to fair value adjustments in
that were measured at fair value on a nonrecurring basis as of December 31, 2023 or 2022. We held $42 million and
$30 million in Level 2 assets as of December 31, 2023 and 2022, respectively, composed of mortgage loans held for
sale that were impaired. We had no
basis as of December 31, 2023 or 2022.
Notes to Consolidated Financial Statements | Fair Value | ||
Fannie Mae (In conservatorship) 2023 Form 10-K | F-72 | |
Fair Value Measurements as of December 31, | ||||||
Valuation Techniques | 2023 | 2022 | ||||
(Dollars in millions) | ||||||
Nonrecurring fair value measurements: | ||||||
Mortgage loans:(1) | ||||||
Mortgage loans held for sale, at lower of cost or fair value | Consensus | $ | $ | |||
Single Vendor | ||||||
Total mortgage loans held for sale, at lower of cost or fair value | ||||||
Single-family mortgage loans held for investment, at amortized cost | Internal Model | |||||
Multifamily mortgage loans held for investment, at amortized cost | Appraisal | |||||
Broker Price Opinion | ||||||
Internal Model | ||||||
Total multifamily mortgage loans held for investment, at amortized cost | ||||||
Acquired property, net: | ||||||
Single-family | Accepted Offer | |||||
Appraisal | ||||||
Internal Model | ||||||
Walk Forward | ||||||
Various | ||||||
Total single-family | ||||||
Multifamily | Various | |||||
Total nonrecurring assets at fair value | $ | $ | ||||
(1)When we measure impairment, including recoveries, based on the fair value of the loan or the underlying collateral and impairment is
recorded on any component of the mortgage loan, including accrued interest receivable and amounts due from the borrower for advances
of taxes and insurance, we present the entire fair value measurement amount with the corresponding mortgage loan.
Notes to Consolidated Financial Statements | Fair Value | ||
Fannie Mae (In conservatorship) 2023 Form 10-K | F-73 | |
We use valuation techniques that maximize the use of observable inputs and minimize the use of unobservable inputs.
our basis for classifying these measurements as Level 1, Level 2 or Level 3 of the valuation hierarchy in more specific
situations.
Instruments | Valuation Techniques | Classification |
U.S Treasury Securities and Futures | We classify securities whose values are based on quoted market prices in active markets for identical assets as Level 1 of the valuation hierarchy. These are comprised of US Treasury securities and futures which are classified as trading securities. | Level 1 |
Other Trading Securities and Available-for-Sale Securities | We classify securities in active markets as Level 2 of the valuation hierarchy if quoted market prices in active markets for identical assets are not available. For all valuation techniques used for securities where there is limited activity or less transparency around these inputs to the valuation, these securities are classified as Level 3 of the valuation hierarchy. Single Vendor: Uses one vendor price to estimate fair value. We generally validate these observations of fair value through the use of a discounted cash flow technique whose unobservable inputs (for example, spreads) are disclosed in the table above. Consensus: Uses an average of two or more vendor prices for similar securities. We generally validate these observations of fair value through the use of a discounted cash flow technique whose unobservable inputs (for example, spreads) are disclosed in the table above. | Level 2 and 3 |
Discounted Cash Flow: In the absence of prices provided by third-party pricing services supported by observable market data, we estimate the fair value of a portion of our securities using a discounted cash flow technique that uses inputs such as default rates, prepayment speeds, loss severity and spreads based on market assumptions where available. Other: Default pricing to par or par equivalent. For private-label securities, an increase in unobservable prepayment speeds in isolation would generally result in an increase in fair value, and an increase in unobservable spreads, severity rates or default rates in isolation would generally result in a decrease in fair value. For mortgage revenue bonds classified as Level 3 of the valuation hierarchy, an increase in unobservable spreads would result in a decrease in fair value. Although we have disclosed unobservable inputs for the fair value of our recurring Level 3 securities above, interrelationships exist among these inputs such that a change in one unobservable input typically results in a change to one or more of the other inputs. | ||
Mortgage Loans Held for Investment | Build-up: We derive the fair value of performing mortgage loans using a build-up valuation technique starting with the base value for our Fannie Mae MBS with similar characteristics and then add or subtract the fair value of the associated guaranty asset, guaranty obligation (“GO”) and master servicing arrangement. We set the GO equal to the estimated fair value we would receive if we were to issue our guaranty to an unrelated party in a stand-alone arm’s length transaction at the measurement date. The fair value of the GO is estimated based on our current guaranty pricing for loans underwritten after 2008 and our internal valuation models considering management’s best estimate of key loan characteristics for loans underwritten before 2008. Our performing loans are generally classified as Level 2 of the valuation hierarchy to the extent that significant inputs are observable. To the extent that unobservable inputs are significant, the loans are classified as Level 3 of the valuation hierarchy. | Level 2 and 3 |
Consensus: Calculated through the extrapolation of indicative sample bids obtained from multiple active market participants plus the estimated value of any applicable mortgage insurance, the estimated fair value using the Consensus method represents an estimate of the prices we would receive if we were to sell these single-family nonperforming and certain reperforming loans in the whole loan market. The fair value of any mortgage insurance on a nonperforming or reperforming loan is estimated using product-specific pricing grids that have been derived from loan-level bids on whole loan transactions. These loans are generally classified as Level 3 of the valuation hierarchy because significant inputs are unobservable. To the extent that significant inputs are observable, the loans are classified as Level 2 of the valuation hierarchy. We estimate the fair value for a portion of our senior-subordinated trust structures using the prices at the security level as a proxy for estimating loan fair value. These loans are classified as Level 3 of the valuation hierarchy because significant inputs are unobservable. | ||
Single Vendor: We estimate the fair value of our reverse mortgages using the single vendor valuation technique. Internal Model: The internal model used to value collateral contains four sub-component models: 1) Location Model, 2) Neighborhood Model, 3) Automated Valuation Model (“AVM”) Imputation Model and 4) Final Valuation Model. These models consider characteristics of the property, neighborhood, local housing markets, underlying loan and home price growth to derive a final estimated value. These loans are classified as Level 3 of the valuation hierarchy because significant inputs are unobservable. |
Notes to Consolidated Financial Statements | Fair Value | ||
Fannie Mae (In conservatorship) 2023 Form 10-K | F-74 | |
Instruments | Valuation Techniques | Classification |
Mortgage Loans Held for Investment | Appraisal: We use appraisals to estimate the fair value for a portion of our multifamily loans based on either estimated replacement cost, the present value of future cash flows, or sales of similar properties. Significant unobservable inputs include estimated replacement or construction costs, property net operating income, capitalization rates, and adjustments made to sales of comparable properties based on characteristics such as financing, conditions of sale, and physical characteristics of the property. Broker Price Opinion: We use broker price opinions to estimate the fair value for a portion of our multifamily loans. This technique uses both current property value and the property value adjusted for stabilization and market conditions. The unobservable inputs used in this technique are property net operating income and market capitalization rates to estimate property value. Asset Manager Estimate: This technique uses the net operating income and tax assessments of the specific property as well as Metropolitan Statistical Area-specific market capitalization rates and average per unit sales values to estimate property fair value. | Level 2 and 3 |
An increase in prepayment speeds in isolation would generally result in an increase in the fair value of our mortgage loans classified as Level 3 of the valuation hierarchy, and an increase in severity rates, default rates or spreads in isolation would generally result in a decrease in fair value. Although we have disclosed unobservable inputs for the fair value of the mortgage loans classified as Level 3 above, interrelationships exist among these inputs such that a change in one unobservable input typically results in a change to one or more of the other inputs. | ||
Mortgage Loans Held for Sale | Loans are reported at the lower of cost or fair value in our consolidated balance sheets. The valuation methodology and inputs used in estimating the fair value of HFS loans are the same as our HFI loans and are described above in “Mortgage Loans Held for Investment.” To the extent that significant inputs are unobservable, the loans are classified within level 3 of the valuation hierarchy. | Level 2 and 3 |
Acquired Property, Net and Other Assets | Single-family acquired property valuation techniques Accepted Offer: An Offer to Purchase Real Estate that has been submitted by a potential purchaser of an acquired property and accepted by Fannie Mae in a pending sale. Appraisal: An appraisal is an estimate based on recent historical data of the value of a specific property by a certified or licensed appraiser. Adjustments are made for differences between comparable properties for unobservable inputs such as square footage, location, and condition of the property. Broker Price Opinion: This technique provides an estimate of what the property is worth based upon a real estate broker’s use of specific market research and a sales comparison approach that is similar to the appraisal process. This information, all of which is unobservable, is used along with recent and pending sales and current listings of similar properties to arrive at an estimate of value. | Level 3 |
Property Inspection Report with Value: This technique provides an estimate of what the property is worth based upon a third party model that is adjusted for condition of the property and/or any other factors impacting the marketability. Appraisal and Broker Price Opinion, and Property Inspection Report with Value Walk Forward (“Walk Forward”): We use these techniques to adjust appraisal, broker price opinion, and property inspection valuations for changing market conditions by applying a walk forward factor based on local price movements since the time the third-party value was obtained. Internal Model: We use an internal model to estimate fair value for distressed properties. The valuation methodology and inputs used are described under “Mortgage Loans Held for Investment.” | ||
Multifamily acquired property valuation techniques Appraisal: We use this method to estimate property values for distressed properties. The valuation methodology and inputs used are described under “Mortgage Loans Held for Investment.” Broker Price Opinion: We use this method to estimate property values for distressed properties. The valuation methodology and inputs used are described under “Mortgage Loans Held for Investment.” Asset Manager Estimate: We use this method to estimate property values for distressed properties. The valuation methodology and inputs used are described under “Mortgage Loans Held for Investment.” |
Notes to Consolidated Financial Statements | Fair Value | ||
Fannie Mae (In conservatorship) 2023 Form 10-K | F-75 | |
Instruments | Valuation Techniques | Classification |
Asset and Liability Derivative Instruments (collectively “Derivatives”) | The valuation process for the majority of our risk management derivatives uses observable market data provided by third-party sources, resulting in Level 2 classification of the valuation hierarchy. Single Vendor: We use one vendor price to estimate fair value. We generally validate these observations of fair value through the use of a discounted cash flow technique. Clearing House: We use the clearing house-provided value for interest-rate derivatives which are transacted through a clearing house. Internal Model: We use internal models to value interest-rate derivatives which are valued by referencing yield curves derived from observable interest rates and spreads to project and discount cash flows to present value. Discounted Cash Flow: We use discounted cash flow to estimate fair value for credit enhancement derivatives related to CRT. Dealer Mark: Certain highly complex structured swaps primarily use a single dealer mark due to lack of transparency in the market and may be modeled using observable interest rates and volatility levels as well as significant unobservable assumptions, resulting in Level 3 classification of the valuation hierarchy. Mortgage commitment derivatives that use observable market data, quotes and actual transaction price levels adjusted for market movement are typically classified as Level 2 of the valuation hierarchy. To the extent mortgage commitment derivatives include adjustments for market movement that cannot be corroborated by observable market data, we classify them as Level 3 of the valuation hierarchy. | Level 2 and 3 |
Debt of Fannie Mae and Consolidated Trusts | We classify debt instruments that have quoted market prices in active markets for similar liabilities when traded as assets as Level 2 of the valuation hierarchy. For all valuation techniques used for debt instruments where there is limited activity or less transparency around these inputs to the valuation, these debt instruments are classified as Level 3 of the valuation hierarchy. Consensus: Uses an average of two or more vendor prices or dealer marks that represents estimated fair value for similar liabilities when traded as assets. Single Vendor: Uses a single vendor price that represents estimated fair value for these liabilities when traded as assets. Discounted Cash Flow: Uses spreads based on market assumptions where available. Other: Default pricing to par or par equivalent. The valuation methodology and inputs used in estimating the fair value of MBS assets are described under “Trading Securities and Available-for-Sale Securities.” | Level 2 and 3 |
Notes to Consolidated Financial Statements | Fair Value | ||
Fannie Mae (In conservatorship) 2023 Form 10-K | F-76 | |
financial instruments we disclose includes commitments to purchase multifamily and single-family mortgage loans that
we do not record in our consolidated balance sheets. The fair values of these commitments are included as “Mortgage
therefore, the fair value of our financial assets and liabilities does not represent the underlying fair value of our total
consolidated assets and liabilities.
As of December 31, 2023 | ||||||||||||
Carrying Value | Quoted Prices in Active Markets for Identical Assets (Level 1) | Significant Other Observable Inputs (Level 2) | Significant Unobservable Inputs (Level 3) | Netting Adjustment | Estimated Fair Value | |||||||
(Dollars in millions) | ||||||||||||
Financial assets: | ||||||||||||
Cash and cash equivalents, including restricted cash and cash equivalents | $ | $ | $ | $ | $— | $ | ||||||
Securities purchased under agreements to resell | — | |||||||||||
Trading securities | — | |||||||||||
Available-for-sale securities | — | |||||||||||
Mortgage loans held for sale | — | |||||||||||
Mortgage loans held for investment, net of allowance for loan losses | — | |||||||||||
Advances to lenders | — | |||||||||||
Derivative assets at fair value | ( | |||||||||||
Guaranty assets and buy-ups | — | |||||||||||
Total financial assets | $ | $ | $ | $ | $( | $ | ||||||
Financial liabilities: | ||||||||||||
Short-term debt: | ||||||||||||
Of Fannie Mae | $ | $ | $ | $ | $— | $ | ||||||
Long-term debt: | ||||||||||||
Of Fannie Mae | — | |||||||||||
Of consolidated trusts | — | |||||||||||
Derivative liabilities at fair value | ( | |||||||||||
Guaranty obligations | — | |||||||||||
Total financial liabilities | $ | $ | $ | $ | $( | $ | ||||||
Notes to Consolidated Financial Statements | Fair Value | ||
Fannie Mae (In conservatorship) 2023 Form 10-K | F-77 | |
As of December 31, 2022 | ||||||||||||
Carrying Value | Quoted Prices in Active Markets for Identical Assets (Level 1) | Significant Other Observable Inputs (Level 2) | Significant Unobservable Inputs (Level 3) | Netting Adjustment | Estimated Fair Value | |||||||
(Dollars in millions) | ||||||||||||
Financial assets: | ||||||||||||
Cash and cash equivalents, including restricted cash and cash equivalents | $ | $ | $ | $ | $— | $ | ||||||
Securities purchased under agreements to resell | — | |||||||||||
Trading securities | — | |||||||||||
Available-for-sale securities | — | |||||||||||
Mortgage loans held for sale | — | |||||||||||
Mortgage loans held for investment, net of allowance for loan losses | — | |||||||||||
Advances to lenders | — | |||||||||||
Derivative assets at fair value | ( | |||||||||||
Guaranty assets and buy-ups | — | |||||||||||
Total financial assets | $ | $ | $ | $ | $( | $ | ||||||
Financial liabilities: | ||||||||||||
Short-term debt: | ||||||||||||
Of Fannie Mae | $ | $ | $ | $ | $— | $ | ||||||
Long-term debt: | ||||||||||||
Of Fannie Mae | — | |||||||||||
Of consolidated trusts | — | |||||||||||
Derivative liabilities at fair value | ( | |||||||||||
Guaranty obligations | — | |||||||||||
Total financial liabilities | $ | $ | $ | $ | $( | $ | ||||||
Notes to Consolidated Financial Statements | Fair Value | ||
Fannie Mae (In conservatorship) 2023 Form 10-K | F-78 | |
as well as our basis for classifying these measurements as Level 1, Level 2 or Level 3 of the valuation hierarchy in
certain specific situations.
Instruments | Description | Classification |
Financial Instruments for which Fair Value Approximates Carrying Value | We hold certain financial instruments that are not carried at fair value but for which the carrying value approximates fair value due to the short-term nature and negligible credit risk inherent in them. These financial instruments include cash and cash equivalents, the majority of advances to lenders, and securities sold/purchased under agreements to repurchase/resell. | Level 1 and 2 |
Securities Sold/ Purchased Under Agreements to Repurchase/Resell | The carrying value for the majority of these specific instruments approximates the fair value due to the short-term nature and the negligible inherent credit risk, as they involve the exchange of collateral that is easily traded. Were we to calculate the fair value of these instruments, we would use observable inputs. | Level 2 |
Mortgage Loans Held for Sale | Loans are reported at the lower of cost or fair value in our consolidated balance sheets. The valuation methodology and inputs used in estimating the fair value of HFS loans are the same as for our HFI loans and are described under “Fair Value Measurement—Mortgage Loans Held for Investment” in the valuation techniques for assets and liabilities held at fair value table. To the extent that significant inputs are unobservable, the loans are classified within Level 3 of the valuation hierarchy. | Level 2 and 3 |
Mortgage Loans Held for Investment | For a description of loan valuation techniques, refer to “Fair Value Measurement—Mortgage Loans Held for Investment” in the valuation techniques for assets and liabilities held at fair value table. We measure the fair value of certain loans that are delivered under the Home Affordable Refinance Program® (“HARP®”) using a modified build-up approach while the loan is performing. Under this modified approach, we set the credit component of the consolidated loans (that is, the guaranty obligation) equal to the compensation we would currently receive for a loan delivered to us under the program because the total compensation for these loans is equal to their current exit price in the government-sponsored enterprise securitization market. If, subsequent to delivery, the refinanced loan becomes past due or is modified, the fair value of the guaranty obligation is then measured consistent with other loans that have similar characteristics. | Level 2 and 3 |
Advances to Lenders | The carrying value for the majority of our advances to lenders approximates the fair value due to the short-term nature and the negligible inherent credit risk. If we were to calculate the fair value of these instruments, we would use discounted cash flow models that use observable inputs such as spreads based on market assumptions, resulting in Level 2 classification. Advances to lenders also include loans that do not qualify for Fannie Mae MBS securitization and are valued using a discounted cash flow technique that uses estimated credit spreads of similar collateral and prepayment speeds that consider recent prepayment activity. We classify these valuations as Level 3 given that significant inputs are not observable or are determined by extrapolation of observable inputs. | Level 2 and 3 |
Guaranty Assets and Buy-ups | Guaranty assets related to our portfolio securitizations are recorded in our consolidated balance sheets at fair value on a recurring basis and are classified as Level 3. Guaranty assets in lender swap transactions are recorded in our consolidated balance sheets at the lower of cost or fair value. These assets, which are measured at fair value on a nonrecurring basis, are also classified as Level 3. We estimate the fair value of guaranty assets by using proprietary models to project cash flows based on management’s best estimate of key assumptions such as prepayment speeds and forward yield curves. Because guaranty assets are similar to an interest-only income stream, the projected cash flows are discounted at rates that consider the current spreads on interest-only swaps that reference Fannie Mae MBS and also liquidity considerations of the guaranty assets. The fair value of guaranty assets includes the fair value of any associated buy-ups. | Level 3 |
Guaranty Obligations | The fair value of all guaranty obligations, measured subsequent to their initial recognition, is our estimate of a hypothetical transaction price we would receive if we were to issue our guaranty to an unrelated party in a standalone arm’s-length transaction at the measurement date. The valuation methodology and inputs used in estimating the fair value of the guaranty obligations are described under “Fair Value Measurement—Mortgage loans held for investment—build-up” in the valuation techniques for assets and liabilities held at fair value. | Level 3 |
We generally elect the fair value option on a financial instrument when the accounting guidance would otherwise require
us to separately account for a derivative that is embedded in an instrument at fair value. Under the fair value option, we
carry this type of instrument, in its entirety, at fair value instead of separately accounting for the derivative.
Interest income for the mortgage loans is recorded in “Interest income: Mortgage loans” and interest expense for the
debt instruments is recorded in “Interest expense: Long-term debt” in our consolidated statements of operations and
Notes to Consolidated Financial Statements | Fair Value | ||
Fannie Mae (In conservatorship) 2023 Form 10-K | F-79 | |
made fair value elections.
As of December 31, | ||||||||||||
2023 | 2022 | |||||||||||
Loans(1) | Long-Term Debt of Fannie Mae | Long-Term Debt of Consolidated Trusts | Loans(1) | Long-Term Debt of Fannie Mae | Long-Term Debt of Consolidated Trusts | |||||||
(Dollars in millions) | ||||||||||||
Fair value | $ | $ | $ | $ | $ | $ | ||||||
Unpaid principal balance | ||||||||||||
(1)Includes nonaccrual loans with a fair value of $32 million and $40 million as of December 31, 2023 and 2022, respectively. Includes loans
that are 90 days or more past due with a fair value of $31 million and $48 million as of December 31, 2023 and 2022, respectively.
Changes in Fair Value under the Fair Value Option Election
We recorded gains of $108 million, losses of $503 million and gains of $28 million for the years ended December 31,
2023, 2022 and 2021, respectively, from changes in the fair value of loans recorded at fair value in “Fair value gains,
net” in our consolidated statements of operations and comprehensive income.
We recorded losses of $308 million, gains of $2.3 billion, and gains of $631 million for the years ended December 31,
2023, 2022 and 2021, respectively, from changes in the fair value of long-term debt recorded at fair value in “Fair value
gains, net” in our consolidated statements of operations and comprehensive income.
17. Commitments and Contingencies
We are party to various types of legal actions and proceedings, including actions brought on behalf of various classes of
claimants. We also are subject to regulatory examinations, inquiries and investigations, and other information gathering
requests. In some of the matters, indeterminate amounts are sought. Modern pleading practice in the U.S. permits
considerable variation in the assertion of monetary damages or other relief. Jurisdictions may permit claimants not to
specify the monetary damages sought or may permit claimants to state only that the amount sought is sufficient to
invoke the jurisdiction of the trial court. This variability in pleadings, together with our and our counsel’s actual
experience in litigating or settling claims, leads us to conclude that the monetary relief that may be sought by plaintiffs
bears little relevance to the merits or disposition value of claims.
Legal actions and proceedings of all types are subject to many uncertain factors that generally cannot be predicted with
assurance. Accordingly, the outcome of any given matter and the amount or range of potential loss at particular points in
time is frequently difficult to ascertain. Uncertainties can include how fact finders will evaluate documentary evidence
and the credibility and effectiveness of witness testimony, and how the court will apply the law. Disposition valuations
are also subject to the uncertainty of how opposing parties and their counsel may view the evidence and applicable law.
evaluating and revising our contingencies, accruals and disclosures. We establish an accrual only for matters when the
estimate the possible losses or ranges of losses, particularly for proceedings that are in their early stages of
development, where plaintiffs seek indeterminate or unspecified damages, where there may be novel or unsettled legal
questions relevant to the proceedings, or where settlement negotiations have not occurred or progressed. Given the
uncertainties involved in any action or proceeding, regardless of whether we have established an accrual, the ultimate
resolution of certain of these matters may be material to our operating results for a particular period, depending on,
among other factors, the size of the loss or liability imposed and the level of our net income or loss for that period.
In addition to the matters specifically described below, we are involved in a number of legal and regulatory proceedings
that arise in the ordinary course of business that we do not expect will have a material impact on our business or
financial condition.
Notes to Consolidated Financial Statements | Fair Value | ||
Fannie Mae (In conservatorship) 2023 Form 10-K | F-80 | |
Senior Preferred Stock Purchase Agreements Litigation
A consolidated class action (“In re Fannie Mae/Freddie Mac Senior Preferred Stock Purchase Agreement Class Action
Litigations”) and a non-class action lawsuit, Fairholme Funds v. FHFA, filed by Fannie Mae and Freddie Mac
stockholders against us, FHFA as our conservator, and Freddie Mac are pending in the U.S. District Court for the District
of Columbia. The lawsuits challenge the August 2012 amendment to each company’s senior preferred stock purchase
agreement with Treasury.
Plaintiffs in these lawsuits allege that the net worth sweep dividend provisions of the senior preferred stock that were
implemented pursuant to the August 2012 amendments nullified certain of the stockholders’ rights and caused them
harm. Plaintiffs in the class action represent a class of Fannie Mae preferred stockholders and classes of Freddie Mac
common and preferred stockholders. On September 23, 2022, the court issued a summary judgment ruling that
permitted the plaintiffs in these lawsuits to present to a jury their claims for breach of the implied covenant of good faith
and fair dealing. The cases were consolidated for trial and a trial commenced on October 17, 2022, but resulted in a
mistrial after the jury could not reach a verdict. A second trial commenced on July 24, 2023. On August 14, 2023, the
jury returned a verdict for the plaintiffs and awarded damages of $299.4 million to Fannie Mae preferred stockholders.
On October 24, 2023, the court awarded these stockholders prejudgment interest on the damage award, to be
determined as simple interest, accruing from August 17, 2012 until the date on which judgment is entered at a fixed rate
of 5 % over the Federal Reserve discount rate as of August 17, 2012. We have determined the prejudgment interest
through December 31, 2023 is $196 million. The parties will have an opportunity to file an appeal once the court enters
a final judgment. We evaluated the jury verdict and the court’s award of prejudgment interest and have established an
accrual for each, reflected as expense in “Other expenses, net” for the year ended December 31, 2023.
Unconditional Purchase and Lease Commitments
both on- and off-balance sheet commitments. A portion of these have been recorded as derivatives in our consolidated
We lease certain premises and equipment under agreements that expire at various dates through August 31, 2037.
Some of these leases provide for payment by the lessee of property taxes, insurance premiums, cost of maintenance
and other costs. Rent expenses for operating leases were $106 million, $101 million and $108 million for the years
ended December 31, 2023, 2022 and 2021, respectively.
mortgage purchases, operating leases and other agreements.
As of December 31, 2023 | ||||||
Loans and Mortgage- Related Securities(1) | Operating Leases(2) | Other(3) | ||||
(Dollars in millions) | ||||||
2024 | $ | $ | $ | |||
2025 | ||||||
2026 | ||||||
2027 | ||||||
2028 | ||||||
Thereafter | ||||||
Total | $ | $ | $ | |||
(1)Primarily includes mortgage commitment derivatives.
(2)Includes amounts related to office buildings and equipment leases.
(3)Includes purchase commitments for certain telecommunications services, computer software and services, and other agreements and
commitments.
Notes to Consolidated Financial Statements | Commitments and Contingencies | ||
Fannie Mae (In conservatorship) 2023 Form 10-K | F-81 | |