UNITED STATES
SECURITIES AND EXCHANGE COMMISSION
Washington, D.C. 20549
FORM
(Mark one)
| | ANNUAL REPORT PURSUANT TO SECTION 13 OR 15(d) OF THE SECURITIES EXCHANGE ACT OF 1934 |
|
| For the fiscal year ended |
| | TRANSITION REPORT PURSUANT TO SECTION 13 OR 15(d) OF THE SECURITIES EXCHANGE ACT OF 1934 |
|
| Commission File Number: |
FS BANCORP, INC.
(Exact name of registrant as specified in its charter)
| | | |
| | | |
| (State or other jurisdiction of incorporation or organization) | | (I.R.S. Employer Identification Number) |
| | | |
| | | |
| (Address of principal executive offices) | | (Zip Code) |
| | | |
| Registrant’s telephone number, including area code: | | ( |
Securities registered pursuant to Section 12(b) of the Act:
| Title of each class | Trading Symbol(s) | Name of each exchange on which registered |
| | | The |
Securities Registered Pursuant to Section 12(g) of the Act: None
Indicate by check mark if the Registrant is a well-known seasoned issuer, as defined in Rule 405 of the Securities Act. Yes ☐
Indicate by check mark if the Registrant is not required to file reports pursuant to Section 13 or Section 15(d) of the Act. Yes ☐
Indicate by check mark whether the Registrant (1) has filed all reports required to be filed by Section 13 or 15(d) of the Securities Exchange Act of 1934 during the preceding 12 months (or for such shorter period that the Registrant was required to file such reports), and (2) has been subject to such filing requirements for the past 90 days.
Indicate by check mark whether the registrant has submitted electronically, every Interactive Data File required to be submitted pursuant to Rule 405 of Regulation S-T (§232.405 of this chapter) during the preceding 12 months (or for such shorter period that the registrant was required to submit such files).
Indicate by check mark whether the registrant is a large accelerated filer, an accelerated filer, a non-accelerated filer, a smaller reporting company, or an emerging growth company. See definitions of “large accelerated filer,” “accelerated filer”, “smaller reporting company” and “emerging growth company” in Rule 12b-2 of the Exchange Act.
| Large accelerated filer ☐ | |
| Non-accelerated filer ☐ | Smaller reporting company |
| Emerging growth company | |
If an emerging growth company, indicate by check mark if the registrant has elected not to use the extended transition period for complying with any new or revised financial accounting standards provided pursuant to Section 13 (a) of the Exchange Act. ☐
Indicate by check mark whether the registrant has filed a report on and attestation to its management’s assessment of the effectiveness of its internal control over financial reporting under Section 404(b) of the Sarbanes-Oxley Act (15 U.S.C. 7262(b)) by the registered public accounting firm that prepared or issued its audit report.
If securities are registered pursuant to Section 12(b) of the Act, indicate by check mark whether the financial statements of the registrant included in the filing reflect the correction of an error to previously issued financial statements.
Indicate by check mark whether any of those error corrections are restatements that required a recovery analysis of incentive-based compensation received by any of the registrant’s executive officers during the relevant recovery period pursuant to §240.10D-1(b).
Indicate by check mark whether the Registrant is a shell company (as defined in Exchange Act Rule 12b-2). Yes
As of March 14, 2024, there were
DOCUMENTS INCORPORATED BY REFERENCE
| 1. | Portions of the definitive Proxy Statement for the 2024 Annual Meeting of Shareholders (“Proxy Statement”) are incorporated by reference into Part III. |
Table of Contents
| |
Page |
|||
| |
|
|||
| 3 | ||||
| |
|
3 | ||
| |
|
4 | ||
| |
|
5 | ||
| |
|
11 | ||
| |
|
13 | ||
| |
|
14 | ||
| |
|
17 | ||
| |
|
18 | ||
| |
|
18 | ||
| |
|
18 | ||
| |
|
22 | ||
| Human Capital | 24 | |||
| |
|
25 | ||
| |
|
33 | ||
| 33 | ||||
| 45 | ||||
| Item 1C. | Cybersecurity | 45 | ||
| 48 | ||||
| 48 | ||||
| 48 | ||||
| |
|
|||
| 48 | ||||
| 51 | ||||
| Management’s Discussion and Analysis of Financial Condition and Results of Operations |
51 | |||
| |
|
51 | ||
| |
|
53 | ||
| |
|
56 | ||
| |
|
Comparison of Financial Condition at December 31, 2023 and December 31, 2022 |
57 | |
| |
|
59 | ||
| |
|
60 | ||
| |
|
Comparison of Results of Operations for the Years Ended December 31, 2023 and December 31, 2022 |
60 | |
| |
|
64 | ||
| |
|
67 | ||
| 67 | ||||
| 68 | ||||
| Changes in and Disagreements With Accountants on Accounting and Financial Disclosure |
128 | |||
| 129 | ||||
| 130 | ||||
| Disclosure Regarding Foreign Jurisdiction that Prevent Inspections |
130 | |||
When we refer to “FS Bancorp” in this report, we are referring to FS Bancorp, Inc. When we refer to “Bank” or “1st Security Bank” in this report, we are referring to 1st Security Bank of Washington, the wholly owned subsidiary of FS Bancorp. As used in this report, the terms “we,” “our,” “us,” and “Company” refer to FS Bancorp, Inc. and its consolidated subsidiary, 1st Security Bank of Washington, unless the context indicates otherwise.
Forward-Looking Statements
This Form 10–K contains forward-looking statements, which can be identified by the use of words such as “believes,” “expects,” “anticipates,” “estimates,” or similar expressions. Forward-looking statements include, but are not limited to:
| ● |
statements of our goals, intentions, and expectations; |
| ● |
statements regarding our business plans, prospects, growth, and operating strategies; |
| ● |
statements regarding the quality of our loan and investment portfolios; and |
| ● |
estimates of our risks and future costs and benefits. |
These forward-looking statements are subject to significant risks and uncertainties. Actual results may differ materially from those contemplated by the forward-looking statements due to, among others, the following factors:
| ● |
expected revenues, cost savings, synergies and other benefits from our branch purchase, might not be realized within the expected time frames or at all and costs or difficulties relating to integration matters, including but not limited to customer and employee retention, might be greater than expected; |
| ● |
potential adverse impacts to economic conditions in the Company’s local market areas, other markets where the Company has lending relationships, or other aspects of the Company’s business operations or financial markets, including, without limitation, as a result of employment levels; labor shortages, the effects of inflation, a potential recession or slowed economic growth; |
| ● |
changes in the interest rate environment, including the recent past increases in the Board of Governors of the Federal Reserve System (“Federal Reserve”) benchmark rate and duration at which such increased interest rate levels are maintained, which could adversely affect our revenues and expenses, the values of our assets and obligations, and the availability and cost of capital and liquidity; |
| ● |
the impact of continuing high inflation and the current and future monetary policies of the Federal Reserve in response thereto; |
| ● |
the effects of any government shutdown; |
| ● |
the credit risks of lending activities, including changes in the level and trend of loan delinquencies, write offs, changes in our allowance for credit losses (“ACL”) on loans, and provision for credit losses on loans that may be impacted by deterioration in the housing and commercial real estate markets; |
| ● |
secondary market conditions and our ability to originate loans for sale and sell loans in the secondary market; |
| ● |
fluctuations in the demand for loans, the number of unsold homes, land and other properties, and fluctuations in real estate values in our market area; |
| ● |
staffing fluctuations in response to product demand or the implementation of corporate strategies that affect our workforce and potential associated charges; |
| ● |
the use of estimates in determining fair value of certain of our assets, which estimates may prove to be incorrect and result in significant declines in valuation; |
| ● |
changes in the interest rate environment that reduce our interest margins or reduce the fair value of financial instruments; |
| ● |
increased competitive pressures among financial services companies; |
| ● |
our ability to execute our plans to grow our residential construction lending, our home lending operations, our warehouse lending, and the geographic expansion of our indirect home improvement lending; |
| ● |
our ability to attract and retain deposits; |
| ● |
our ability to successfully integrate any assets, liabilities, customers, systems, and management personnel we may in the future acquire into our operations and our ability to realize related revenue synergies and cost savings within expected time frames and any goodwill charges related thereto; |
| ● |
our ability to control operating costs and expenses; |
| ● |
our ability to retain key members of our senior management team; |
| ● |
changes in consumer spending, borrowing, and savings habits; |
| ● |
our ability to successfully manage our growth; |
| ● |
the impact of bank failures or adverse developments at other banks and related negative press about the banking industry in general on investor and depositor sentiment; |
| ● |
legislative or regulatory changes that adversely affect our business, including changes in banking, securities and tax law, and in regulatory policies and principles, or the interpretation of regulatory capital or other rules; |
| ● |
our ability to pay dividends on our common stock; |
| ● |
the quality and composition of our securities portfolio and the impact of any adverse changes in the securities markets; |
| ● |
changes in accounting policies and practices, as may be adopted by the bank regulatory agencies, the Public Company Accounting Oversight Board, or the Financial Accounting Standards Board (“FASB”); |
| ● |
costs and effects of litigation, including settlements and judgments; |
| ● |
disruptions, security breaches, or other adverse events, failures, or interruptions in, or attacks on, our information technology systems or on the third-party vendors who perform several of our critical processing functions; |
| ● |
inability of key third-party vendors to perform their obligations to us; |
| ● |
the economic impact of climate change, severe weather events, natural disasters, pandemics, epidemics and other public health crises, acts of war or terrorism, and other external events on our business; |
| ● |
other economic, competitive, governmental, regulatory, and technical factors affecting our operations, pricing, products and services, and |
| ● |
other risks described elsewhere in this Annual Report on Form 10–K for the year ended December 31, 2023 (the “Form 10–K”), and our other reports filed with or furnished to the Securities and Exchange Commission (the “SEC”). |
Any of the forward-looking statements made in this Form 10–K and in other public statements may turn out to be wrong because of inaccurate assumptions we might make, because of the factors illustrated above or because of other factors that we cannot foresee. Forward-looking statements are based upon management’s beliefs and assumptions at the time they are made. The Company undertakes no obligation to update or revise any forward-looking statement included in this report or to update the reasons why actual results could differ from those contained in such statements, whether as a result of new information, future events or otherwise. In light of these risks, uncertainties and assumptions, the forward-looking statements discussed in this report might not occur and you should not put undue reliance on any forward-looking statements.
Available Information
The Company provides a link on its investor information page at www.fsbwa.com to filings with the SEC for purposes of providing copies of its annual report on Form 10–K, quarterly reports on Form 10–Q, current reports on Form 8–K and amendments to these reports, as soon as reasonably practicable after we have electronically filed such material with, or furnished such material to the SEC. Other than an investor’s own internet access charges, these filings are free of charge and available through the SEC’s website at www.sec.gov. The information contained on the Company’s website is not included as part of, or incorporated by reference into, this Annual Report on Form 10–K.
Item 1. Business
General
FS Bancorp, a Washington corporation, was organized in September 2011 for the purpose of becoming the holding company of 1st Security Bank upon the Bank’s conversion from a mutual to a stock savings bank (“Conversion”). The Conversion was completed on July 9, 2012. At December 31, 2023, the Company had consolidated total assets of $2.97 billion, total loans receivable, net of $2.40 billion, total deposits of $2.52 billion, and total stockholders’ equity of $264.5 million. The Company has not engaged in significant activity other than holding the stock of and providing capital to the Bank. Accordingly, the information set forth in this Form 10–K, including the consolidated financial statements and related data, relates primarily to the Bank.
1st Security Bank is a relationship-driven community bank. The Bank delivers banking and financial services to local families, local and regional businesses and industry niches mostly within distinct Puget Sound area communities. The Bank emphasizes long-term relationships with families and businesses within the communities served, working with them to meet their financial needs. The Bank is also actively involved in community activities and events within these market areas, which further strengthens these relationships. The Bank has been serving the Puget Sound area since 1907. Originally chartered as a credit union, and known as Washington’s Credit Union, the Bank served various select employment groups. On April 1, 2004, the Bank converted from a credit union to a Washington state-chartered mutual savings bank. Upon completion of the Conversion in July 2012, 1st Security Bank became a Washington state-chartered stock savings bank and the wholly-owned subsidiary of the Company.
At December 31, 2023, the Company maintained its headquarters, which produces loans and accepts deposits, in Mountlake Terrace, Washington, and an administrative office in Aberdeen, Washington. The Bank also operates 27 full-service bank branches, of which 22 are located in Washington state and five in Oregon state, and 11 loan production offices in suburban communities in the greater Puget Sound area. Additionally, a home loan production office is located in the Tri-Cities, area of Washington and another one in Vancouver, Washington. Among the 22 full-service branches in Washington, three are in Snohomish County, two in King County, two in Clallam County, two in Jefferson County, two in Pierce County, five in Grays Harbor County, two in Thurston County, two in Kitsap County, and two in Klickitat County. Furthermore, five full-service branches are located in Oregon: two in Lincoln County, two in Tillamook County, and one in Malheur County. Our 13 loan production offices include seven stand-alone offices: two in Pierce County, one in King County, one in Kitsap County, and one in Snohomish County in the Puget Sound region, as well as one in Benton County in Eastern Washington, and our newest office in Clark County, in Southwest Washington.
The Company is a diversified lender that specializes in originating various types of loans, including commercial real estate, one-to-four-family, and home equity loans, as well as consumer loans, such as indirect home improvement (“fixture secured loans”), and marine loans, along with commercial business loans. Historically, consumer loans, particularly fixture secured loans, have constituted the largest portion of the Company’s loan portfolio and have been the mainstay of its lending strategy. Since 2011, there has been a shift towards placing more emphasis on real estate lending products, such as one-to-four-family, and commercial real estate loans, including speculative residential construction loans, as well as commercial business loans. Simultaneously, the Company has continued to grow its consumer loan portfolio. In 2012, the Company reintroduced in-house originations of residential mortgage loans, primarily for sale into the secondary market, through a mortgage banking program. The Company’s lending strategies aim to leverage its historical strength in indirect consumer lending, capitalize on new lending opportunities, arising from recent market consolidation, and focus on relationship lending. Retail deposits will remain a crucial funding source for the Company. For more detailed information about 1st Security Bank's business and operations, please refer to “Item 7. Management’s Discussion and Analysis of Financial Condition and Results of Operations” in this Form 10–K.
The Company has periodically pursued strategic acquisitions, either through whole bank acquisitions or branch purchases to increase its customer base and/or to create additional distribution infrastructure. On November 5, 2022, the Bank entered into a Purchase and Assumption Agreement for the acquisition of seven retail bank branches from Columbia State Bank, which was completed on February 24, 2023 (the “Branch Acquisition”). The seven acquired branch locations are situated in Goldendale and White Salmon, Washington, and Manzanita, Newport, Ontario, Tillamook, and Waldport, Oregon. In connection with the Branch Acquisition, the Bank acquired $425.5 million in deposits and $66.1 million in loans. See “Note 2 – Business Combination” of the Notes to Consolidated Financial Statements included in “Item 8. Financial Statements and Supplementary Data” of this Form 10–K.
In 2018, the Company completed its acquisition of Anchor Bancorp, acquiring $357.9 million in deposits and $361.6 million in loans. This acquisition expanded our Puget Sound-focused retail presence by adding nine full-service bank branches in Aberdeen, Centralia (closed as of December 31, 2022), Elma, Lacey, Montesano, Ocean Shores, Olympia, Puyallup, and Westport, Washington. Furthermore, in 2016, the Company completed the purchase of four retail bank branches on the Olympic Peninsula from Bank of America resulting in the acquisition of $186.4 million in deposits and $419,000 in loans.
1st Security Bank is examined and regulated by the Washington State Department of Financial Institutions (“DFI”), its primary regulator, and by the Federal Deposit Insurance Corporation (“FDIC”). 1st Security Bank is required to have certain reserves set by the Federal Reserve and is a member of the Federal Home Loan Bank of Des Moines (“FHLB” or “FHLB of Des Moines”), which is one of the 11 regional banks in the Federal Home Loan Bank System.
The principal executive offices of the Company are located at 6920 220th Street SW, Mountlake Terrace, Washington 98043 and the main telephone number is (425) 771-5299.
As of December 31, 2023, the Company conducted operations, including loan and/or deposit services from its headquarters, 13 loan production offices (seven of which stand-alone), 27 full-service bank branches in the Puget Sound region of Washington, and various locations in Oregon.
The primary market area for business operations is the Seattle-Tacoma-Bellevue, Washington Metropolitan Statistical Area (the “Seattle MSA”). Kitsap, Clallam, Jefferson, Thurston, and Grays Harbor counties, though not in the Seattle MSA, are also part of the Company’s market area. This overall region is typically known as the Puget Sound region.
The Puget Sound region is the largest business center in both the State of Washington and the Pacific Northwest, with a well-developed urban area in the western portion along Puget Sound and a mix of developed residential and commercial neighborhoods and undeveloped rural areas in the north, central, and eastern portions.
The Puget Sound region's economy is characterized by key sectors such as aerospace, military bases, clean technology, biotechnology, education, information technology, logistics, international trade, and tourism. Major industry leaders like The Boeing Corporation, Microsoft, and Amazon.com contribute to the region's economic prominence. The workforce is well-educated and strong in technology, and the region's location and deep-water port facilitate significant international trade. Tourism is also a major industry due to the scenic beauty, temperate climate, and easy accessibility.
King County, which includes the city of Seattle, hosts the largest employment base and economic activity, with major employers like Microsoft, University of Washington, Amazon.com, King County Government, Starbucks, and Costco. Pierce County, the second most populous county features diversified industries, including military-related government employment (Joint Base Lewis-McChord), health care (the MultiCare Health System and the Franciscan Health System), shipping (Port of Tacoma) and aerospace (Boeing). Snohomish County's economy is based on aerospace (Boeing), health care (Providence Regional Medical Center), military (the Everett Naval Station), biotechnology, electronics/computers, and wood products.
Kitsap County's economy is significantly influenced by the United States Navy, being the largest employer in the county with installations at Puget Sound Naval Shipyard, Naval Undersea Warfare Center Keyport and Naval Base Kitsap (which comprises former Naval Submarine Base Bangor, and Naval Station Bremerton). The largest private employers in the county are the St. Michael Medical Center/Franciscan Medical Group and Port Madison Enterprises. Clallam County relies on agriculture, forestry, fishing, outdoor recreation and tourism, with Olympic Medical Center as the largest employer. Jefferson County's largest private employer is Port Townsend Paper Mill and Thurston County, home to Olympia (Washington State’s capital), is driven by state government related employment.
As of December 31, 2023, the unemployment rate in Washington was an estimated 4.2%, slightly exceeding the national average of 3.7%, according to data from the U.S. Bureau of Labor Statistics. Within specific counties, King County reported an estimated unemployment rate of 3.5%, marking an increase from 2.8% in the preceding year. Snohomish County experienced a rise in its unemployment rate to 3.6% at the close of 2023, up from 3.2% at the end of 2022. Kitsap County noted a 4.7% unemployment rate at December 31, 2023, compared to 4.3% at December 31, 2022. Pierce County recorded a 5.5% unemployment rate as of December 31, 2023, compared to 5.3% at December 31, 2022. Grays Harbor County and Thurston County reported estimated unemployment rates of 7.4% and 4.7%, respectively at the end of 2023, with slight changes from 7.6% and 4.7%, at the close of 2022.
Beyond the Puget Sound area, the Tri-Cities market encompassing Benton and Franklin counties, exhibited a 5.4% unemployment rate in Benton County at year-end 2023, down from 5.6% at year-end 2022. Franklin County saw a decrease in its unemployment rate to 7.1% at December 31, 2023, from 7.7% at December 31, 2022. In Clallam and Jefferson counties, the estimated unemployment rates rose to 6.3% and 5.8%, respectively, at the end of 2023, compared to 6.1% and 5.4% at the end of 2022. Clark County experienced an increase in its unemployment rate to 4.8% at the end of 2023, up from 4.6% at the end of 2022. Klickitat County reported a 6.1% unemployment rate at December 31, 2023, compared to an estimated 4.4% at the end of 2022.
For a discussion regarding the competition in the Company’s primary market area, see “Competition.”
General. Historically, the Company’s primary emphasis was the origination of consumer loans (primarily indirect home improvement loans), one-to-four-family residential first mortgages, and second mortgage/home equity loan products. As a result of the Company’s initial public offering in 2012, while maintaining the active indirect consumer lending program, the Company shifted its lending focus to include non-mortgage commercial business loans, as well as commercial real estate which includes construction and development loans. The Company reintroduced in-house originations of residential mortgage loans in 2012, primarily for sale in the secondary market. While maintaining the Company’s historical strength in consumer lending, the Company has added management and personnel in the commercial and home lending areas to take advantage of the relatively favorable long-term business and economic environments prevailing in the markets. In addition, the Company expanded its loan products by offering residential mortgage and commercial construction warehouse lending consistent with its business plan to further diversify revenues.
The following table sets forth the amount of total loans with fixed or adjustable interest rates maturing subsequent to December 31, 2024. Loan balances do not include undisbursed loan proceeds, unearned discounts, unearned income, and the ACL on loans.
| (Dollars in thousands) |
||||||||||||
| Real estate loans: |
Fixed |
Adjustable |
Total |
|||||||||
| Commercial |
$ | 217,764 | $ | 127,455 | $ | 345,219 | ||||||
| Construction |
30,656 | 82,714 | 113,370 | |||||||||
| Home equity |
13,429 | 53,798 | 67,227 | |||||||||
| One-to-four-family |
270,603 | 282,044 | 552,647 | |||||||||
| Multi-family |
91,058 | 126,954 | 218,012 | |||||||||
| Consumer |
649,715 | 1,129 | 650,844 | |||||||||
| Commercial Business |
66,688 | 74,322 | 141,010 | |||||||||
| Total |
$ | 1,339,913 | $ | 748,416 | $ | 2,088,329 | ||||||
Loan Maturity. The following table sets forth certain information at December 31, 2023, regarding the dollar amount for the loans maturing in the portfolio based on their contractual terms to maturity but does not include scheduled payments or potential prepayments. Loan balances do not include undisbursed loan proceeds, unearned discounts, unearned income, and the ACL on loans.
| Real Estate |
||||||||||||||||||||||||||||||||
| (Dollars in thousands) |
Commercial |
Construction and Development |
Home Equity |
One-to-Four-Family (2) |
Multi-family |
Consumer |
Commercial Business |
Total |
||||||||||||||||||||||||
| Amount |
Amount |
Amount |
Amount |
Amount |
Amount |
Amount |
Amount |
|||||||||||||||||||||||||
| Due in one year or less (1) |
$ | 23,172 | $ | 191,171 | $ | 1,951 | $ | 16,215 | $ | 6,409 | $ | 1,669 | $ | 115,072 | $ | 355,659 | ||||||||||||||||
| Due after one year through five years |
147,021 | 20,275 | 183 | 25,403 | 18,048 | 21,333 | 73,660 | 305,923 | ||||||||||||||||||||||||
| Due after five years through 15 years |
197,230 | 58,111 | 3,521 | 96,201 | 197,731 | 544,685 | 59,022 | 1,156,501 | ||||||||||||||||||||||||
| Due after 15 years |
968 | 34,984 | 63,523 | 431,043 | 2,233 | 84,826 | 8,328 | 625,905 | ||||||||||||||||||||||||
| Total |
$ | 368,391 | $ | 304,541 | $ | 69,178 | $ | 568,862 | $ | 224,421 | $ | 652,513 | $ | 256,082 | $ | 2,443,988 | ||||||||||||||||
| (1) |
Includes demand loans, loans having no stated maturity and overdraft loans. |
| (2) |
Excludes loans held for sale. |
Lending Authority. Credit administration has the authority to approve multiple loans to one borrower up to $20.0 million in aggregate. Loans in excess of $20.0 million to $35.0 million require additional approval from management’s senior loan committee. All loans that are approved over $10.0 million are reported to the asset quality committee (“AQC”) at each AQC meeting. Loans in excess of $35.0 million require AQC approval. Credit administration may delegate lending authority to other individuals at levels consistent with their responsibilities.
The Board of Directors has implemented an in-house lending limit policy of $35.0 million. Lending relationships exceeding the internal limit require Board approval. The Washington State legal lending limit is 20% of Bank total capital, or $67.9 million at December 31, 2023. The Company's largest lending relationship at December 31, 2023 totaled $36.4 million, representing the total committed sum. This relationship comprised three multi-family real estate loans, all secured by the associated properties. The second largest lending relationship at December 31, 2023, totaling $36.0 million, consisted of a $17.0 million loan to a related limited liability company secured by a construction multi-family real estate property, seven secured residential loans to three additional related limited liability companies for $16.5 million, of which $12.6 million was drawn at December 31, 2023, and a $2.5 million commercial construction warehouse lending line of credit to another related limited liability company. The third largest lending relationship consisted of three loans: two commercial lines of credit secured by residential real estate with a total potential commitment of $22.8 million, of which $21.0 million was drawn at December 31, 2023, and one permanent one-to-four-family loan having combined commitments of $7.2 million. At December 31, 2023, all the borrowers listed above were in compliance with the original repayment terms of their respective loans.
At December 31, 2023, the Company had $57.5 million in approved commercial construction warehouse lending lines to four companies, with $17.1 million outstanding at that date (including the $2.5 million discussed above). These commitments individually range from $2.5 million to $25.0 million. In addition, at December 31, 2023, the Company had $22.0 million approved in mortgage warehouse lending lines to three companies, with $574,000 outstanding at that date. These commitments individually ranged from $3.0 million to $10.0 million. At December 31, 2023, all of these warehouse lines were in compliance with the original repayment terms of their respective lending lines.
Commercial Real Estate Lending. The Company offers a variety of commercial real estate loans. Most of these loans are secured by income-producing properties. At December 31, 2023, commercial real estate loans (including $223.8 million of multi-family residential loans) totaled $590.1 million, or 24.3%, of the gross loan portfolio.
The Company’s loans secured by commercial real estate are originated with a fixed or variable interest rate for up to a 15-year maturity and a 30-year amortization. The variable rate loans are indexed to the prime rate of interest or five, seven, or ten-year FHLB rate, with rates equal to the prevailing index rate up to 4.00% above the prevailing rate. Loan-to-value ratios on the Company’s commercial real estate loans typically do not exceed 80% of the appraised value of the property securing the loan. In addition, personal guarantees are typically obtained from a principal of the borrower on substantially all credits.
Loans secured by commercial real estate are generally underwritten based on the net operating income of the property and the financial strength of the borrower. The net operating income, which is the income derived from the operation of the property less all operating expenses, must be sufficient to cover the payments related to the outstanding debt plus an additional coverage requirement. The Company generally requires an assignment of rents or leases in order to be assured that the cash flow from the project will be sufficient to repay the debt. Appraisals on properties securing commercial real estate loans are performed by independent state certified or licensed fee appraisers. The Company does not generally maintain insurance or tax escrows for loans secured by commercial real estate. In order to monitor the adequacy of cash flows on income-producing properties, the borrower is generally required to provide financial information on a periodic basis.
Loans secured by commercial real estate properties generally involve a greater degree of credit risk than one-to-four-family residential mortgage loans. These loans typically involve large balances to single borrowers or groups of related borrowers. Because payments on loans secured by commercial and multi-family real estate properties are often dependent on the successful operation or management of the properties, repayment of these loans may be subject to adverse conditions in the real estate market or the economy. If the cash flow from the project is reduced, or if leases are not obtained or renewed, the borrower’s ability to repay the loan may be impaired. Commercial and multi-family loans also expose a lender to greater credit risk than loans secured by one-to-four-family because the collateral securing these loans typically cannot be sold as easily as one-to-four-family. In addition, most of our commercial and multi-family loans are not fully amortizing and include balloon payments upon maturity. Balloon payments may require the borrower to either sell or refinance the underlying property in order to make the payment, which may increase the risk of default or non-payment. The largest single commercial or multi-family real estate loan at December 31, 2023 was a performing $17.0 million loan secured by a 105-unit apartment building (which includes two retail spaces totaling 12,200 square feet) located in Seattle, Washington.
The Company intends to continue to emphasize commercial real estate lending and has hired experienced commercial loan officers to support the Company’s commercial real estate lending objectives. As the commercial real estate loan portfolio expands, the Company intends to bring in additional experienced personnel in the areas of loan analysis and commercial deposit relationship management.
Construction and Development Lending. In 2011, the Company expanded its team dedicated to residential construction lending, concentrating on vertical, in-city one-to-four-family development within our market area. This specialized team has cumulative experience of over 80 years, demonstrating expertise in acquisition, development and construction (“ADC”) lending in the Puget Sound market area. This strategic move was undertaken to capitalize on what is perceived as robust demand for construction and ADC loans among seasoned, successful and relationship-oriented builders in our market area. This initiative was pursued after many other banks withdrew from this segment because of previous overexposure. At December 31, 2023, outstanding construction and development loans totaled $303.1 million, or 12.5% of the gross loan portfolio, comprised of 291 loans, compared to $342.6 million and 327 loans at December 31, 2022.
A breakdown of construction and development loans at the dates indicated were as follows:
| (Dollars in thousands) |
||||||||||||||||
| December 31, 2023 |
December 31, 2022 |
|||||||||||||||
| Construction Types: |
Amount |
Percent |
Amount |
Percent |
||||||||||||
| Commercial construction - office |
$ | 4,699 | 1.6 | % | $ | 2,009 | 0.6 | % | ||||||||
| Commercial construction - self storage |
17,445 | 5.8 | 20,000 | 5.8 | ||||||||||||
| Commercial construction - car wash |
7,742 | 2.6 | 3,417 | 1.0 | ||||||||||||
| Multi-family |
56,065 | 18.5 | 75,254 | 22.0 | ||||||||||||
| Custom construction - single family residential & single family manufactured residential |
47,230 | 15.6 | 32,465 | 9.5 | ||||||||||||
| Custom construction - land, lot and acquisition and development |
6,377 | 2.1 | 5,438 | 1.6 | ||||||||||||
| Speculative residential construction - vertical |
131,336 | 43.3 | 164,368 | 48.0 | ||||||||||||
| Speculative residential construction - land, lot and acquisition and development |
32,160 | 10.6 | 39,640 | 11.6 | ||||||||||||
| Total |
$ | 303,054 | 100.0 | % | $ | 342,591 | 100.0 | % | ||||||||
The Company’s residential construction lending program includes loans for the purpose of constructing both speculative and pre-sold one-to-four-family residences, the acquisition of in-city lots with and without existing improvements for later development of one-to-four-family residences, the acquisition of land to be developed, and loans for the acquisition and development of land for future development of single-family residences. The Company generally limits these types of loans to known builders and developers in the market area. Construction loans generally provide for the payment of interest-only during the construction phase, which is typically 12 - 18 months. At the end of the construction phase, the construction loan is generally paid off through the sale of the newly constructed home and a permanent loan from another lender, although commitments to convert to a permanent loan may be made by us. Construction loans are generally made with a maximum loan amount of the lower of 95% of cost or 75% of appraised value at completion. During the term of construction, the accumulated interest on the loan is typically added to the principal balance of the loan through an interest reserve set at six to 10 months of interest based on a fully disbursed note at the starting interest rate for the loan.
Commitments to fund construction loans generally are made subject to an appraisal of the property by an independent licensed appraiser. The Company also reviews and has a licensed third-party inspect each property before disbursement of funds during the term of the construction loan. Loan proceeds are disbursed after inspection by a third-party inspector based on the percentage of completion method.
The Company may also make land acquisition and development loans to builders or residential lot developers on a limited basis. These loans involve a higher degree of credit risk, similar to commercial construction loans. At December 31, 2023, included in the $303.1 million of construction and development loans, were seven residential land acquisition and development loans for finished lots totaling $9.4 million, with total commitments of $14.8 million. These land loans also involve additional risks because the loan amount is based on the projected value of the lots after development. Loans are made for up to 75% of the estimated value with a term of up to two years. These loans are required to be paid on an accelerated basis as the lots are sold, so that the Company is repaid before all the lots are sold.
Construction financing is generally considered to involve a higher degree of credit risk than longer-term financing on improved, owner-occupied real estate. Construction and development lending contains the inherent difficulty in estimating both a property’s value at completion of the project and the estimated cost (including interest) of the project. Changes in the demand, such as for new housing and higher than anticipated building costs may cause actual results to vary significantly from those estimated. If the estimate of construction cost proves to be inaccurate, we may be required to advance funds beyond the amount originally committed to permit completion of the project.
This type of lending also typically involves higher loan principal amounts and is often concentrated with a small number of builders. In addition, during the term of most of our construction loans, an interest reserve is created at origination and is added to the principal of the loan through the construction phase. If the estimate of value upon completion proves to be inaccurate, we may be confronted at, or prior to, the maturity of the loan with a project, the value of which is insufficient to assure full repayment. Because construction loans require active monitoring of the building process, including cost comparisons and on-site inspections, these loans are more difficult and costly to monitor.
Increases in market rates of interest may have a more pronounced effect on construction loans by rapidly increasing the end-purchasers’ borrowing costs, thereby reducing the overall demand for the project. Properties under construction are often difficult to sell and typically must be completed in order to be successfully sold which also complicates the process of working out problem construction loans. This may require us to advance additional funds and/or contract with another builder to complete construction. Furthermore, speculative construction loans to a builder are often associated with homes that are not pre-sold, and thus pose a greater potential risk than construction loans to individuals on their personal residences as there is the added risk associated with identifying an end-purchaser for the finished project. Loans on land under development or held for future construction pose additional risk because of the lack of income being produced by the property and the potential illiquid nature of the collateral. These risks can be significantly impacted by supply and demand. As a result, this type of lending often involves the disbursement of substantial funds with repayment dependent on the success of the ultimate project and the ability of the borrower to sell or lease the property, rather than the ability of the borrower or guarantor themselves to repay principal and interest.
The Company seeks to address the forgoing risks associated with construction development lending by developing and adhering to underwriting policies, disbursement procedures, and monitoring practices. Specifically, the Company (i) seeks to diversify the number of loans and projects in the market area, (ii) evaluate and document the creditworthiness of the borrower and the viability of the proposed project, (iii) limit loan-to-value ratios to specified levels, (iv) control disbursements on construction loans on the basis of on-site inspections by a licensed third-party, (v) monitor economic conditions and the housing inventory in each market, and (iv) typically obtains personal guarantees from a principal of the borrower on substantially all credits. No assurances, however, can be given that these practices will be successful in mitigating the risks of construction development lending.
Home Equity Lending. The Company has been active in second lien mortgage and home equity lending, with the focus of this lending being conducted in the Company’s primary market area. The home equity lines of credit generally have adjustable rates tied to the prime rate of interest with a draw term of 10 years plus and a term to maturity of 15 years. Monthly payments are based on 1.0% of the outstanding balance with a maximum combined loan-to-value ratio of up to 90%, including any underlying first mortgage. Fixed second lien mortgage home equity loans are typically amortizing loans with terms of up to 30 years. Total second lien mortgage/home equity loans totaled $69.5 million, or 2.9% of the gross loan portfolio, at December 31, 2023, $54.0 million of which were adjustable-rate home equity lines of credit. Unfunded commitments on home equity lines of credit at December 31, 2023, was $93.8 million.
Residential. The Company originates loans secured by first mortgages on one-to-four-family residences primarily in the market area. The Company originates one-to-four-family residential mortgage loans through referrals from real estate agents, financial planners, builders, and from existing customers. Retail banking customers are also important referral sources of the Company’s loan originations. The Company originated $543.6 million of one-to-four-family mortgages (including $15.9 million of loans brokered to other institutions) and sold $408.0 million to investors in 2023. Of the loans sold to investors, $241.5 million were sold to the Federal National Mortgage Association (“Fannie Mae”), the Government National Mortgage Association (“Ginnie Mae”), the FHLB, and the Federal Home Loan Mortgage Corporation (“Freddie Mac”) with servicing rights retained to further build the relationship with the customer. At December 31, 2023, one-to-four-family residential mortgage loans totaled $567.7 million, or 23.3%, of the gross loan portfolio, excluding loans held for sale of $25.7 million. In addition, the Company originates residential loans through its commercial lending channel, secured by single family rental homes in Washington, with an outstanding balance of $133.4 million at December 31, 2023.
The Company generally underwrites the one-to-four-family loans based on the applicant’s ability to repay. This includes employment and credit history and the appraised value of the subject property. The Company will lend up to 100% of the lesser of the appraised value or purchase price for one-to-four-family first mortgage loans. For first mortgage loans with a loan-to-value ratio in excess of 80%, the Company generally requires either private mortgage insurance or government sponsored insurance in order to mitigate the higher risk level associated with higher loan-to-value loans. Fixed-rate loans secured by one-to-four-family residences have contractual maturities of up to 30 years and are generally fully amortizing, with payments due monthly. Adjustable-rate mortgage loans generally pose different credit risks than fixed-rate loans, primarily because as interest rates rise the borrower’s payments rise, increasing the potential for default. Properties securing the one-to-four-family loans are appraised by independent fee appraisers who are selected in accordance with industry and regulatory standards. The Company requires borrowers to obtain title and hazard insurance, and flood insurance, if necessary. Loans are generally underwritten to the secondary market guidelines with overlays as determined by the internal underwriting department.
Consumer Lending. Consumer lending represents a significant and important historical activity for the Company, primarily reflecting the indirect lending through home improvement contractors and dealers. At December 31, 2023, consumer loans totaled $646.8 million, or 26.6% of the gross loan portfolio.
The Company’s indirect home improvement loans, also referred to as fixture secured loans, represent the largest portion of the consumer loan portfolio and have traditionally been the mainstay of the Company’s consumer lending strategy. These loans totaled $569.9 million, or 23.4% of gross loans, and 88.1% of total consumer loans, at December 31, 2023. Indirect home improvement loans are originated through a network of 114 home improvement contractors and dealers located in Washington, Oregon, California, Idaho, Colorado, Arizona, Minnesota, Nevada, Texas, Utah, Massachusetts, Montana, and recently, New Hampshire. Five dealers are responsible for 65.9% of the loan volume. These fixture secured loans consist of loans for a wide variety of products, such as replacement windows, siding, roofs, HVAC systems, spas, and other home fixture installations, including solar related home improvement projects.
In connection with fixture secured loans, the Company receives loan applications from the dealers, and originates the loans based on pre-defined lending criteria. These loans are processed through the loan origination software, with approximately 40.0% of the loan applications receiving an automated decision based on the information provided. All loan applications are evaluated by the Company’s credit analysts who use the automated data to expedite the loan approval process. The Company follows the internal underwriting guidelines in evaluating loans obtained through the indirect dealer program, including using a Fair Isaac and Company, Incorporated (“FICO”) credit score to approve loans. A FICO score is a principal measure of credit quality and is one of the significant criteria we rely upon in our underwriting in addition to the borrower’s debt to income.
The Company’s fixture secured loans generally range in amounts from $2,500 to $100,000, and generally carry terms of 12 to 20 years with fixed rates of amortizing payments and interest. In some instances, the participating dealer may pay a fee to buy down the borrower’s interest rate to a rate below the Company’s published rate. Fixture secured loans are secured by the personal property installed in, on or at the borrower’s real property, and may be perfected with a financing statement under the Uniform Commercial Code (“UCC”) filed in the county of the borrower’s residence. The Company generally files a UCC financing statement to perfect the security interest in the personal property in situations where the borrower’s credit score is below 720 or the home improvement loan is for an amount in excess of $5,000. Perfection gives the Company a claim to the collateral that is superior to someone that obtains a lien through the judicial process subsequent to the perfection of a security interest. The failure to perfect a security interest does not render the security interest unenforceable against the borrower. However, failure to perfect a security interest risks avoidance of the security interest in bankruptcy or subordination to the claims of third parties.
The Company also offers consumer marine loans secured by boats. At December 31, 2023, the marine loan portfolio totaled $73.3 million, or 3.0% of total loans. Marine loans are originated with borrowers on both a direct and indirect basis, and generally carry terms of up to 20 years with fixed rates of interest. The Company generally requires a 10% down payment, and the loan amount may be up to the lesser of 120% of factory invoice or 90% of the purchase price.
The Company originates other consumer loans which totaled $3.5 million at December 31, 2023. These loans primarily include personal lines of credit, credit cards, automobile, direct home improvement, loans on deposit, and recreational loans.
In evaluating any consumer loan application, a borrower’s FICO score is utilized as an important indicator of credit risk. The FICO score represents the creditworthiness of a borrower based on the borrower’s credit history, as reported by an independent third party. A higher FICO score typically indicates a greater degree of creditworthiness. Over the last several years the Company has emphasized originations of loans to consumers with higher credit scores. This has resulted in a lower level of loan charge-offs in recent periods. At December 31, 2023, 84.9% of the consumer loan portfolio was originated with borrowers having a FICO score over 720 at the time of origination, and 14.3% was originated with borrowers having a FICO score of and between 660 and 720 at the time of origination. Generally, a FICO score of 660 or higher indicates the borrower has an acceptable credit reputation. A consumer credit score at the time of loan origination of less than 660 is associated as “subprime” by federal banking regulators and these loans comprised just 1.0% of our consumer loan portfolio at December 31, 2023. Consideration for loans with FICO scores below 660 require additional management oversight and approval.
Consumer loans generally have shorter average lives with faster prepayment, which reduces the Company’s exposure to changes in interest rates. In addition, management believes that offering consumer loan products helps to expand and create stronger ties to existing customer base by increasing the number of customer relationships and providing cross-marketing opportunities.
Consumer and other loans generally entail greater risk than do one-to-four-family residential mortgage loans, particularly in the case of consumer loans that are secured by rapidly depreciable assets, such as boats, automobiles and other recreational vehicles. In these cases, any repossessed collateral for a defaulted loan may not provide an adequate source of repayment of the outstanding loan balance. As a result, consumer loan collections are dependent on the borrower’s continuing financial stability and, thus, are more likely to be adversely affected by job loss, divorce, illness, or personal bankruptcy. In the case of fixture secured loans, it is very difficult to repossess the personal property securing these loans as they are typically attached to the borrower’s personal residence. Accordingly, if a borrower defaults on a fixture secured loan the only practical recourse is to wait until the borrower wants to sell or refinance the home, at which time if there is a perfected security interest the Company generally will be able to collect a portion of the loan previously charged off.
Commercial Business Lending. The Company originates commercial business loans and lines of credit to local small- and mid-sized businesses in the Puget Sound market area that are secured by accounts receivable, inventory, or personal/business property, plant and equipment. Commercial business loans may be fixed-rate but are usually adjustable-rate loans indexed to the prime rate of interest, plus a margin. Some of these commercial business loans, such as those made pursuant to the warehouse lending program, are structured as lines of credit with terms of 12 months and interest-only payments required during the term, while other loans may reprice on an annual basis and amortize over a two-to-five-year period. Due to the current interest rate environment, these loans and lines of credit are generally originated with a floor, which is set between 3.75% and 8.00%. Loan fees are generally charged at origination depending on the credit quality and account relationships of the borrower. Advance rates on these types of lines are generally limited to 80% of accounts receivable and 50% of inventory. The Company also generally requires the borrower to establish a deposit relationship as part of the loan approval process. At December 31, 2023, the commercial business loan portfolio totaled $255.9 million, or 10.5%, of the gross loan portfolio including warehouse lending loans.
The Company also has commercial construction warehouse lending lines secured by notes on construction loans and typically guaranteed by principals with experience in construction lending. In April 2013, we commenced an expansion of our mortgage warehouse lending program to include construction re-lending warehouse lines. These lines are secured by notes provided to construction lenders and are typically guaranteed by a principal of the borrower with experience in construction lending. Terms for the underlying notes can be up to 18 months and the Company will lend a percentage (typically 70 - 80%) of the underlying note which may have a loan-to-value ratio up to 75%. Combined, the loan-to-value ratio on the underlying note would be up to 60% with additional credit support provided by the guarantor. At December 31, 2023, the Company had $57.5 million in approved commercial construction warehouse lending lines to four companies. The individual commitments range from $2.5 million to $25.0 million. At December 31, 2023, there was $17.1 million outstanding, compared to $60.0 million approved in commercial warehouse lending lines to four companies with $31.2 million outstanding at December 31, 2022.
Consistent with management’s objectives to expand commercial business lending, in 2009, the Company commenced a mortgage warehouse lending program through which the Company funds third-party residential mortgage bankers. Under this program the Company provides short-term funding to the mortgage banking companies for the purpose of originating residential mortgage loans for sale into the secondary market. The Company’s warehouse lending lines are secured by the underlying notes associated with one-to-four-family mortgage loans made to borrowers by the mortgage banking company and generally require guarantees from the principal shareholder(s) of the mortgage banking company. These loans are repaid when the note is sold by the mortgage bank into the secondary market, with the proceeds from the sale used to pay down the outstanding loan before being dispersed to the mortgage bank. As of December 31, 2023, the Company had approved residential mortgage warehouse lending lines totaling $22.0 million for four companies with commitments ranging from $3.0 million to $10.0 million. At that date, there was $573,000 outstanding under the residential warehouse lines. In comparison, at December 31, 2022, the Company had approved residential warehouse lending lines totaling $36.0 million, with no amounts outstanding. During the year ended December 31, 2023, the Company processed approximately 115 loans and funded approximately $58.7 million in total under its mortgage warehouse lending program.
At December 31, 2023, most of the commercial business loans were secured. The Company’s commercial business lending policy includes credit file documentation and analysis of the borrower’s background, capacity to repay the loan, the adequacy of the borrower’s capital and collateral, as well as an evaluation of other conditions affecting the borrower. Analysis of the borrower’s past, present, and future cash flows is also an important aspect of credit analysis. The Company typically requires personal guarantees on these commercial business loans, acknowledging that they are generally associated with higher credit risk compared to residential mortgage loans. The largest commercial business lending relationships at December 31, 2023, consisted of a construction warehouse line of credit with a commitment of $25.0 million and an outstanding balance of $7.7 million. This loan is secured by underlying notes associated with one-to-four-family mortgage loans made to borrower. The next largest commercial business lending relationship totaled $16.2 million to a transportation company, of which $14.2 million was outstanding at December 31, 2023. This relationship consisted of three lines of credit and one business term loan, all secured by assets of the borrower. The final noteworthy relationship is a commercial line of credit to a financing company with a commitment of $16.0 million, of which $12.6 million had been disbursed as of December 31, 2023.
Unlike residential mortgage loans, commercial business loans, particularly unsecured loans, are made on the basis of the borrower’s ability to make repayment from the cash flow of the borrower’s business and, therefore, are of higher risk. The Company makes commercial business loans secured by business assets, such as accounts receivable, inventory, equipment, real estate and cash as collateral with loan-to-value ratios in most cases up to 80%, based on the type of collateral. This collateral depreciates over time, may be difficult to appraise and may fluctuate in value based on the specific type of business and equipment used. As a result, the availability of funds for the repayment of commercial business loans may be substantially dependent on the success of the business itself (which, in turn, is often dependent in part upon general economic conditions).
Loan Originations, Servicing, Purchases and Sales
The Company originates both fixed-rate and adjustable-rate loans. The ability to originate loans, however, is dependent upon customer demand for loans in the market areas. From time to time to supplement our loan originations and based on our asset/liability objectives we will also purchase bulk loans or pools of loans from other financial institutions.
Over the past few years, the Company has continued to originate consumer loans, and increased emphasis on commercial real estate loans, including construction and development lending, as well as commercial business loans. Demand is affected by competition and the interest rate environment. In periods of economic uncertainty, the ability of financial institutions, including the Bank, to originate large dollar volumes of commercial business and real estate loans may be substantially reduced or restricted, with a resultant decrease in interest income. In addition to interest earned on loans and loan origination fees, the Company receives fees for loan commitments, late payments, and other miscellaneous services. The fees vary from time to time, generally depending on the supply of funds and other competitive conditions in the market.
The Company will sell long-term, conforming fixed-rate residential real estate loans in the secondary market to mitigate credit and interest rate risk. Gains and losses from the sale of these loans are recognized based on the difference between the sales proceeds and carrying value of the loans at the time of the sale. A majority of residential real estate loans sold by the Company are sold with servicing retained at a specified servicing fee. Certain residential real estate loans, originating as Federal Housing Administration (“FHA”), U.S. Department of Veterans Affairs (“VA”), or United States Department of Agriculture (“USDA”) Rural Housing loans are sold by the Company as servicing released loans to other companies.
For the year ended December 31, 2023, the Company earned gross mortgage servicing fees of $7.2 million. As of December 31, 2023, the Company was servicing $2.83 billion of one-to-four-family loans for Fannie Mae, Freddie Mac, Ginnie Mae, the FHLB, and another financial institution. These mortgage servicing rights (“MSRs”) represented a $17.2 million asset on the Company's books, amortized proportionally over the period of the net servicing income. Periodic evaluations for impairment of these MSRs are conducted based on fair value, considering the rates and potential prepayments of the sold loans being serviced. The fair value of our MSRs at December 31, 2023 was $38.2 million based on third-party valuation reports. For additional information, see "Note 1 - Basis of Presentation and Summary of Significant Account Policies - Subsequent Events", “Note 5 – Mortgage Servicing Rights” and “Note 16 – Fair Value Measurements” of the Notes to Consolidated Financial Statements included in “Item 8. Financial Statements and Supplementary Data” of this Form 10–K.
The following table presents the notional balance activity during the year ended December 31, 2023, related to loans serviced for others:
| (In thousands) |
||||
| Beginning balance at January 1, 2023 |
||||
| One-to-four-family |
$ | 2,783,458 | ||
| Consumer |
95 | |||
| Subtotal |
2,783,553 | |||
| Additions |
||||
| One-to-four-family |
241,529 | |||
| Repayments |
||||
| One-to-four-family |
(192,971 | ) | ||
| Consumer |
(44 | ) | ||
| Subtotal |
(193,015 | ) | ||
| Ending balance at December 31, 2023 |
||||
| One-to-four-family |
2,832,016 | |||
| Consumer |
51 | |||
| Total |
$ | 2,832,067 | ||
The following table shows total loans originated, purchased, sold and repaid during the years indicated:
| Year Ended December 31, |
||||||||
| (Dollars in thousands) |
2023 |
2022 |
||||||
| Originations by type: |
||||||||
| Fixed-rate: |
||||||||
| Commercial real estate |
$ | 21,453 | $ | 77,561 | ||||
| Construction and development |
59,807 | 81,820 | ||||||
| Home equity |
8,787 | 22,849 | ||||||
| One-to-four-family (1) |
21,941 | 71,015 | ||||||
| Loans held for sale (one-to-four-family) |
365,214 | 566,117 | ||||||
| Multi-family |
4,124 | 19,919 | ||||||
| Consumer |
221,120 | 350,028 | ||||||
| Commercial business (2) |
17,904 | 28,980 | ||||||
| Total fixed-rate |
720,350 | 1,218,289 | ||||||
| Adjustable-rate: |
||||||||
| Commercial real estate |
39,136 | 23,906 | ||||||
| Construction and development |
231,632 | 330,108 | ||||||
| Home equity |
30,085 | 29,830 | ||||||
| One-to-four-family (1) |
89,529 | 113,933 | ||||||
| Loans held for sale (one-to-four-family) |
11,900 | 14,154 | ||||||
| Multi-family |
4,423 | 24,030 | ||||||
| Consumer |
2,437 | 2,295 | ||||||
| Commercial business (2) |
98,538 | 93,514 | ||||||
| Warehouse lines, net |
(13,545 | ) | (2,120 | ) | ||||
| Total adjustable-rate |
494,135 | 629,650 | ||||||
| Total loans originated |
1,214,485 | 1,847,939 | ||||||
| Purchases by type (6) |
||||||||
| Fixed-rate: |
||||||||
| Commercial real estate |
20,704 | — | ||||||
| Home equity |
858 | — | ||||||
| One-to-four-family (1) (4) |
6,486 | 665 | ||||||
| Multi-family |
1,187 | — | ||||||
| Consumer |
1,095 | — | ||||||
| Construction and development |
186 | — | ||||||
| Commercial business (2) |
18,303 | 2,400 | ||||||
| Adjustable-rate: |
||||||||
| Commercial real estate |
6,830 | — | ||||||
| Home equity |
8,311 | — | ||||||
| One-to-four-family (1) |
1,761 | — | ||||||
| Multi-family |
399 | — | ||||||
| Consumer |
200 | — | ||||||
| Commercial business (3) |
2,591 | 2,345 | ||||||
| Total loans purchased |
68,911 | 5,410 | ||||||
| Sales and repayments: |
||||||||
| One-to-four-family (1) |
— | (12,862 | ) | |||||
| Loans held for sale (one-to-four-family) |
(408,031 | ) | (715,645 | ) | ||||
| Consumer (5) |
— | (25,576 | ) | |||||
| Commercial business (2) |
— | — | ||||||
| Total loans sold |
(408,031 | ) | (754,083 | ) | ||||
| Total principal repayments |
(652,683 | ) | (737,348 | ) | ||||
| Total reductions |
(1,060,714 | ) | (1,491,431 | ) | ||||
| Net increase |
$ | 222,682 | $ | 361,918 | ||||
| (1) |
One-to-four-family portfolio loans. |
| (2) |
Excludes warehouse lines. |
| (3) |
Includes USDA/ SBA guaranteed loans purchased at a premium. |
| (4) |
Loan repurchased due to investor underwriting standards, previously sold. |
| (5) | Marine loans sold in the year ended December 31, 2022. |
| (6) |
Includes $66.1 million in loans acquired in business combinations for the year ended December 31, 2023. |
Sales of whole and participations in real estate loans can be beneficial to the Company since these sales systematically generate income at the time of sale, produce future servicing income on loans where servicing is retained, provide funds for additional lending and other investments, and increase liquidity.
From time to time we also sell whole consumer loans, specifically long-term consumer loans, which can be beneficial to us since these sales generate income at the time of sale, can potentially create future servicing income where servicing is retained, and provide a mitigation of interest rate risk associated with holding longer maturity consumer loans.
When a borrower fails to make a required payment on a residential real estate loan, the Company attempts to cure the delinquency by contacting the borrower. In the case of loans secured by residential real estate, a late notice typically is sent 16 days after the due date, and the borrower is contacted by phone within 16 to 25 days after the due date. When the loan is 30 days past due, an action plan is formulated for the credit under the direction of the service and operations manager. Generally, a delinquency letter is mailed to the borrower. All delinquent accounts are reviewed by a loan control representative who attempts to cure the delinquency by contacting the borrower once the loan is 30 days past due. If the account becomes 60 days delinquent and an acceptable repayment plan has not been agreed upon, a Loan Control representative will generally refer the account to legal counsel with instructions to prepare a notice of intent to foreclose. The notice of intent to foreclose allows the borrower up to 30 days to bring the account current. Between 90 - 120 days past due, a value is obtained for the loan collateral. At that time, a mortgage analysis is completed to determine the loan-to-value ratio and any collateral deficiency. If foreclosed, the Company customarily takes title to the property and sells it directly through a real estate broker.
Delinquent consumer loans are handled in a similar manner. Appropriate action is taken in the form of phone calls and notices to collect any loan payment that is delinquent more than 16 days. Once the loan is 90 days past due, it is classified as nonaccrual. Generally, credits are charged off if past due 120 days, unless the collections department provides support for a customer repayment plan. Bank procedures for repossession and sale of consumer collateral are subject to various requirements under the applicable consumer protection laws as well as other applicable laws and the determination by us that it would be beneficial from a cost basis.
Delinquent commercial business loans and loans secured by commercial real estate are handled by the loan officer in charge of the loan or someone of the Company's credit administration, who is responsible for contacting the borrower. They work with outside counsel and, in the case of real estate loans, a third-party consultant to resolve problem loans. In addition, management meets as needed and reviews past due and classified loans, as well as other loans that management feels may present possible collection problems, which are reported to the AQC and the board on a monthly basis. If an acceptable workout of a delinquent commercial loan cannot be agreed upon, the Company customarily will initiate foreclosure or repossession proceedings on any collateral securing the loan.
Other Real Estate Owned. Real estate acquired by the Company as a result of foreclosure or by deed-in-lieu of foreclosure is classified as real estate owned until it is sold. The Company also classifies any former retail branches that no longer provide banking services as other real estate owned. When the property is acquired it is recorded at the lower of its cost, which is the unpaid principal balance of the related loan plus foreclosure costs, or the fair market value of the property less selling costs. The Company had no other real estate owned properties as of December 31, 2023.
Restructured Loans. ASU 2022-02 eliminates the accounting and reporting for troubled debt restructurings (“TDRs”) by creditors and introduces new required disclosures for loan modifications made to borrowers experiencing financial difficulty. The new required disclosures include information about modifications granted to borrowers experiencing financial difficulty. These new disclosures encompass details about modifications granted to such borrowers, including principal forgiveness, interest rate reductions, other-than-insignificant payment delays, term extensions, or a combination of these modifications. The ASU also requires disclosures about the financial effects of these modifications and the performance of modified loans in the 12 months following the modification. The update eliminates the requirement to use a discounted cash flow approach to measure the ACL on TDRs and instead allows for the use of a current expected credit loss, or CECL approach for all loans. Under the CECL approach, the impact of loan modifications and the subsequent performance of modified loans, including defaults, is incorporated into the historical loss data used to calculate expected lifetime credit losses.
For additional information, see “Note 4 – Loans Receivable and Allowance for Credit Losses on Loans.” in the Notes to Consolidated Financial Statements included in “Item 8. Financial Statements and Supplementary Data” of this Form 10–K.
Classified Assets. Federal regulations provide for the classification of lower quality loans and other assets (such as other real estate owned and repossessed property), debt and equity securities, as substandard, doubtful or loss. An asset is considered substandard if it is inadequately protected by the current net worth and pay capacity of the borrower or of any collateral pledged. Substandard assets include those characterized by the distinct possibility that the Company will sustain some loss if the deficiencies are not corrected. Assets classified as doubtful have all the weaknesses inherent in those classified substandard with the added characteristic that the weaknesses present make collection or liquidation in full highly questionable and improbable, on the basis of currently existing facts, conditions, and values. Assets classified as loss are those considered uncollectible and of such little value that their continuance as assets without the establishment of a specific loss reserve is not warranted.
When the Company classifies problem assets as either substandard or doubtful, a specific allowance may be established in an amount deemed prudent to address specific impairments. General allowances represent loss allowances which have been established to recognize the inherent risk associated with lending activities, but which, unlike specific allowances, have not been allocated to particular problem assets. When an insured institution classifies problem assets as a loss, it is required to charge off those assets in the period in which they are deemed uncollectible. The Company’s determination as to the classification of assets and the amount of valuation allowances is subject to review by the FDIC and the DFI, which can order the establishment of additional loss allowances. Assets which do not currently expose the Company to sufficient risk to warrant classification in one of the aforementioned categories but possess weaknesses are required to be designated as special mention.
In connection with the filing of periodic reports with the FDIC and in accordance with the Company’s classification of assets policy, the Company regularly reviews the problem assets in the portfolio to determine whether any assets require classification in accordance with applicable regulations. On the basis of the review of the Company’s assets, at December 31, 2023, the Company had classified $24.9 million of assets as substandard or doubtful. The $24.9 million of classified assets represented 9.4% of equity and 0.8% of total assets at December 31, 2023. The Company had $2.6 million of assets classified as special mention at December 31, 2023, not included in classified assets reported above.
Allowance for Credit Losses on Loans
The Company's method for assessing the appropriateness of the ACL includes specific allowances for individually analyzed loans, formula allowance factors for pools of loans, and qualitative considerations which include, among other things, current and forecast economic and environmental factors (e.g., interest rates, growth, economic conditions).
Management estimates the ACL balance using relevant information, from internal and external sources, relating to past events, current conditions, and reasonable and supportable forecasts. The ACL is measured on a collective (pool) basis when similar risk characteristics exist. Historical credit loss experience provides the basis for the estimation of expected credit losses, which captures loan balances as of a point in time to form a cohort, then tracks the respective losses generated by that cohort of loans over the remaining life. In situations where the Company's actual loss history was not statistically relevant, the loss history of peers were utilized to create a minimum loss rate.
In its CECL forecasting framework, the Company incorporates forward-looking information using macroeconomic scenarios applied over the forecasted life of the assets. These macroeconomic scenarios incorporate variables that have historically been key drivers of increases and decreases in credit losses.
The likelihood of the Company incurring a loss is higher for loans that have been risk-rated as less than satisfactory compared to those graded as satisfactory. Therefore, accurately assessing the risk grading of loans in the portfolio is crucial in determining the calculation and adequacy of the ACL. Drawing on historical loss data, the Company employs reserve rates specific to each unique pool, considering loss and risk grade migration. Consequently, a greater loss estimation factor is applied to less than satisfactory loans within any given pool, as opposed to those last graded as satisfactory. The resulting allowance for each pool is the aggregate of the calculated reserves derived through this methodology.
Certain loans are excluded from collectively evaluated pools and are individually assessed based on management's criteria for specific evaluation. The segregation of these loans is determined through an analysis of identified credits meeting specific criteria. Initially, these loans undergo an individual review to ascertain whether they possess a unique risk profile warranting individual evaluation. Loans where management deems it probable that the borrower will be unable to fulfill all obligations under the original contractual terms are removed from collectively evaluated pools. Subsequently, these loans undergo a specific review and evaluation by management for potential losses, considering sources of repayment, including collateral where applicable. A specified ACL is established as necessary. Any loan placed on nonaccrual, by definition, must undergo individual evaluation; however, not all individually evaluated loans need to be placed on nonaccrual.
Due to the dynamic nature of current economic conditions and the inherent difficulty in predicting future events, management recognizes that the determination of the appropriateness of the ACL could undergo significant changes. Estimating the anticipated amount of credit losses on loans is challenging, given the potential variability in economic conditions and forecasts. The complexity arises from the multitude of factors and inputs considered in estimating the allowance, making it difficult to gauge the impact of changes in any one economic factor. Furthermore, these changes may not occur at the same rate and may not be consistent across all product types. Additionally, changes in factors and inputs may move independently, meaning that improvements in one area may offset deteriorations in others. Despite these challenges, management believes that the ACL was adequate as of December 31, 2023, given the comprehensive consideration of various factors and inputs. However, it remains aware of the potential for changes in economic conditions and the impact they may have on the ACL in the future.
The ACL on loans is adjusted based on various factors. It is increased through the provision for credit losses, which is expensed against current period earnings, and decreased by the reversal of credit losses and the actual amount of loan charge-offs, net of recoveries. For the year ended December 31, 2023, the provision for credit losses on loans was $5.8 million, compared to $6.6 million for the year ended December 31, 2022. This decrease in the provision for credit losses on loans compared to the previous year reflects less loan growth in 2023. As of December 31, 2023, the ACL on loans was $31.5 million, or 1.30% of gross loans receivable, compared to $28.0 million, or 1.26% of gross loans receivable at December 31, 2022.
Management continually reviews the adequacy of the ACL on loans and will adjust the provision for credit losses on loans as needed. This ongoing assessment takes into consideration factors such as loan growth, prevailing economic conditions, charge-offs and portfolio composition. It is crucial for management to stay vigilant, as a decline in both national and local economic conditions could result in a material increase in the ACL on loans, which has the potential to adversely affect the Company's financial condition and results of operations.
The following table shows certain credit ratios at or for the periods indicated and each component of the ratio’s calculations:
| (Dollars in thousands) |
At or for the Year Ended December 31, |
|||||||||||
| 2023 |
2022 |
2021 |
||||||||||
| ACL on loans as a percentage of total loans outstanding at year end: |
1.30 | % | 1.26 | % | 1.46 | % | ||||||
| ACL on loans |
$ | 31,534 | $ | 27,992 | $ | 25,635 | ||||||
| Total loans outstanding |
$ | 2,433,015 | $ | 2,218,852 | $ | 1,754,175 | ||||||
| Nonaccrual loans as a percentage of total loans outstanding at year end |
0.45 | % | 0.39 | % | 0.33 | % | ||||||
| Total nonaccrual loans |
$ | 10,952 | $ | 8,652 | $ | 5,829 | ||||||
| Total loans outstanding |
$ | 2,433,015 | $ | 2,218,852 | $ | 1,754,175 | ||||||
| ACL on loans as a percentage of nonaccrual loans at year end |
287.93 | % | 323.53 | % | 439.78 | % | ||||||
| ACL on loans |
$ | 31,534 | $ | 27,992 | $ | 25,635 | ||||||
| Total nonaccrual loans |
$ | 10,952 | $ | 8,652 | $ | 5,829 | ||||||
| Net charge-offs during year to average loans outstanding: |
||||||||||||
| Commercial real estate: |
— | % | — | % | — | % | ||||||
| Net charge-offs |
$ | — | $ | — | $ | — | ||||||
| Average loans outstanding |
$ | 352,562 | $ | 295,416 | $ | 226,452 | ||||||
| Construction and Development: |
— | % | — | % | — | % | ||||||
| Net charge-offs |
$ | — | $ | — | $ | — | ||||||
| Average loans outstanding |
$ | 319,322 | $ | 305,840 | $ | 243,989 | ||||||
| Home Equity: |
0.02 | % | — | % | — | % | ||||||
| Net charge-offs |
$ | 10 | $ | — | $ | — | ||||||
| Average loans outstanding |
$ | 62,317 | $ | 48,771 | $ | 41,029 | ||||||
| One-to-four-family: |
— | % | — | % | — | % | ||||||
| Net charge-offs |
$ | — | $ | — | $ | — | ||||||
| Average loans outstanding |
$ | 520,732 | $ | 401,534 | $ | 330,709 | ||||||
| Multi-family |
— | % | — | % | — | % | ||||||
| Net charge-offs |
$ | — | $ | — | $ | — | ||||||
| Average loans outstanding |
$ | 231,734 | $ | 205,209 | $ | 145,381 | ||||||
| Indirect Home Improvement: |
0.36 | % | 0.18 | % | 0.24 | % | ||||||
| Net charge-offs |
$ | 2,001 | $ | 738 | $ | 751 | ||||||
| Average loans outstanding |
$ | 554,423 | $ | 408,973 | $ | 310,681 | ||||||
| Marine: |
0.17 | % | 0.22 | % | 0.09 | % | ||||||
| Net charge-offs |
$ | 121 | $ | 170 | $ | 76 | ||||||
| Average loans outstanding |
$ | 70,152 | $ | 77,675 | $ | 84,566 | ||||||
| Other Consumer: |
— | % | 17.61 | % | 5.51 | % | ||||||
| Net charge-offs |
$ | 95 | $ | 499 | $ | 172 | ||||||
| Average loans outstanding |
$ | 3,486 | $ | 2,834 | $ | 3,123 | ||||||
| Commercial and Industrial: |
0.00 | % | — | % | 0.02 | % | ||||||
| Net charge-offs |
$ | 1 | $ | — | $ | 38 | ||||||
| Average loans outstanding |
$ | 225,789 | $ | 205,054 | $ | 232,519 | ||||||
| Warehouse Lending |
— | % | — | % | — | % | ||||||
| Net charge-offs |
$ | — | $ | — | $ | — | ||||||
| Average loans outstanding |
$ | 25,493 | $ | 33,090 | $ | 43,452 | ||||||
| Total loans: |
0.09 | % | 0.07 | % | 0.06 | % | ||||||
| Total net charge-offs |
$ | 2,228 | $ | 1,407 | $ | 1,037 | ||||||
| Total average loans outstanding |
$ | 2,366,010 | $ | 1,984,396 | $ | 1,661,901 | ||||||
The following table shows the allocation of the ACL on loans for each loan category and the percent of each loan category to total loans, gross at the period indicated:
| (Dollars in thousands) |
December 31, 2023 |
|||||||
| Allocation of the |
Percent of Loans in |
|||||||
| ACL on Loans |
Each Category to Total |
|||||||
| Amount |
Loans Receivable, Gross |
|||||||
| REAL ESTATE LOANS |
||||||||
| Commercial |
$ | 3,177 | 15.1 | % | ||||
| Construction and development |
3,265 | 12.5 | ||||||
| Home equity |
809 | 2.9 | ||||||
| One-to-four-family (excludes HFS) |
5,308 | 23.3 | ||||||
| Multi-family |
1,548 | 9.2 | ||||||
| Total real estate loans |
14,107 | 63.0 | ||||||
| CONSUMER LOANS |
||||||||
| Indirect home improvement |
12,247 | 23.4 | ||||||
| Marine |
1,053 | 3.0 | ||||||
| Other consumer |
57 | 0.1 | ||||||
| Total consumer loans |
13,357 | 26.5 | ||||||
| COMMERCIAL BUSINESS LOANS |
||||||||
| Commercial and industrial |
3,987 | 9.8 | ||||||
| Warehouse lending |
83 | 0.7 | ||||||
| Total commercial business loans |
4,070 | 10.5 | ||||||
| Total |
$ | 31,534 | 100.0 | % | ||||
While management believes that the estimates and assumptions used in its determination of the adequacy of the ACL on loans are reasonable, it is important to acknowledge the inherent uncertainties. There is no guarantee that these estimates and assumptions will not be proven incorrect in the future. Additionally, there is the possibility that the actual amount of future provisions may exceed past provisions, and any potential increased provisions could adversely impact the Company’s financial condition and results of operations. Furthermore, the determination of the amount of the Company's ACL on loans is subject to review by bank regulators as part of the routine examination process. The regulators may adjust the ACL based on their judgment and the information available to them at the time of their examination. This regulatory scrutiny adds an additional layer of evaluation and potential adjustment to the Company's credit loss provisions. For additional information on the ACL on loans, see “Item 7. Management’s Discussion and Analysis of Financial Condition and Results of Operations – Comparison of Results of Operations for the Years Ended December 31, 2023 and 2022 – Provision for Credit Losses”, “Notes 1 – Basis of Presentation and Summary of Significant Accounting Policies” and “Note 4 – Loans Receivable and Allowance for Credit Losses on Loans” of the Notes to Consolidated Financial Statements included in “Item 8. Financial Statements and Supplementary Data” of this Form 10–K.
General. Under Washington law, savings banks are permitted to invest in various types of liquid assets, including U.S. Treasury obligations, securities of various federal agencies, certain certificates of deposit of insured banks and savings institutions, banker’s acceptances, repurchase agreements, federal funds (“Fed Funds”), commercial paper, investment grade corporate debt securities, and obligations of states and their political subdivisions.
The Chief Financial Officer has the responsibility for the management of the Company’s investment portfolio, subject to consultation with the Chief Executive Officer, and the direction and guidance of the Board of Directors. Various factors are considered when making investment decisions, including the marketability, maturity and tax consequences of the proposed investment. The maturity structure of investments will be affected by various market conditions, including the current and anticipated slope of the yield curve, the level of interest rates, the trend of new deposit inflows, and the anticipated demand for funds via deposit withdrawals and loan originations and purchases.
The general objectives of the Company’s investment portfolio will be to provide liquidity when loan demand is high, to assist in maintaining earnings when loan demand is low and to maximize earnings while satisfactorily managing risk, including credit risk, reinvestment risk, liquidity risk, and interest rate risk. See “Item 7. Management’s Discussion and Analysis of Financial Condition and Results of Operations – Asset and Liability Management and Market Risk” of this Form 10–K.
The composition and contractual maturities of the investment portfolio at December 31, 2023, excluding FHLB stock, are indicated in the following table. Weighted-average yield for each maturity range includes coupon interest, discount accretion and premium amortization and has been calculated using the amortized cost of each security in that range. The yields on tax exempt municipal bonds have not been computed on a tax equivalent basis.
| December 31, 2023 |
||||||||||||||||||||||||||||||||||||||||||||
| 1 year or less |
Over 1 year to 5 years |
Over 5 to 10 years |
Over 10 years |
Total Securities |
||||||||||||||||||||||||||||||||||||||||
| Weighted |
Weighted |
Weighted |
Weighted |
Weighted |
||||||||||||||||||||||||||||||||||||||||
| Amortized |
Average |
Amortized |
Average |
Amortized |
Average |
Amortized |
Average |
Amortized |
Average |
Fair |
||||||||||||||||||||||||||||||||||
| (Dollars in thousands) |
Cost |
Yield |
Cost |
Yield |
Cost |
Yield |
Cost |
Yield |
Cost |
Yield |
Value |
|||||||||||||||||||||||||||||||||
| Securities available-for-sale |
||||||||||||||||||||||||||||||||||||||||||||
| U.S. agency securities |
$ | 922 | 2.91 | % | $ | 3,947 | 1.23 | % | $ | 11,972 | 2.53 | % | $ | 4,310 | 2.32 | % | $ | 21,151 | 2.26 | % | $ | 18,018 | ||||||||||||||||||||||
| Corporate securities |
1,000 | 5.66 | 6,000 | 7.00 | 4,000 | 5.26 | 2,000 | 2.05 | 13,000 | 5.60 | 12,872 | |||||||||||||||||||||||||||||||||
| Municipal bonds |
1,013 | 3.06 | 757 | 3.10 | 7,603 | 2.23 | 129,430 | 1.93 | 138,803 | 1.96 | 119,447 | |||||||||||||||||||||||||||||||||
| Mortgage-backed securities: |
||||||||||||||||||||||||||||||||||||||||||||
| Federal National Mortgage Association |
— | — | 11,076 | 2.85 | 42,546 | 2.82 | 22,747 | 2.54 | 76,369 | 2.74 | 66,275 | |||||||||||||||||||||||||||||||||
| Federal Home Loan Mortgage Corporation |
— | — | — | — | 23,116 | 5.54 | 9,195 | 3.73 | 32,311 | 5.02 | 31,376 | |||||||||||||||||||||||||||||||||
| Government National Mortgage Association |
— | — | 728 | 2.93 | 3,447 | 2.33 | — | — | 4,175 | 2.43 | 3,597 | |||||||||||||||||||||||||||||||||
| U.S. Small Business Administration securities |
198 | 2.63 | 1,860 | 3.10 | 21,420 | 5.59 | 19,408 | 5.28 | 42,886 | 5.33 | 41,348 | |||||||||||||||||||||||||||||||||
| Total securities available-for-sale |
3,133 | 3.82 | 24,368 | 3.64 | 114,104 | 3.89 | 187,090 | 2.45 | 328,695 | 3.05 | 292,933 | |||||||||||||||||||||||||||||||||
| Securities held-to-maturity |
||||||||||||||||||||||||||||||||||||||||||||
| Corporate securities |
— | — | — | — | 8,500 | 5.05 | — | — | 8,500 | 5.05 | 7,666 | |||||||||||||||||||||||||||||||||
| Total securities |
$ | 3,133 | 3.82 | % | $ | 24,368 | 3.64 | % | $ | 122,604 | 3.97 | % | $ | 187,090 | 2.45 | % | $ | 337,195 | 3.10 | % | $ | 300,599 | ||||||||||||||||||||||
As a member of the FHLB of Des Moines, the Company had $2.1 million in stock at December 31, 2023. For the year ended December 31, 2023, the Company received $245,000 in dividends.
Deposit Activities and Other Sources of Funds
General. Deposits, borrowings, and loan repayments are the major sources of funds for lending and other investment purposes. Scheduled loan repayments are a relatively stable source of funds, while deposit inflows and outflows and loan prepayments are influenced significantly by general interest rates and market conditions. Borrowings from the FHLB of Des Moines are used to supplement the availability of funds from other sources and also as a source of term funds to assist in the management of interest rate risk.
The Company’s deposit composition reflects a mixture with certificates of deposit (including brokered) accounting for 43.5% of the total deposits at December 31, 2023, and interest and noninterest-bearing checking, savings and money market accounts comprising the balance of total deposits. The Company relies on marketing activities, convenience, customer service and the availability of a broad range of deposit products and services to attract and retain customer deposits. The Company had $431.5 million of brokered deposits, or 17.1% of total deposits, at December 31, 2023. As a wholesale funding alternative, brokered deposits have competitive rates that are comparable to FHLB borrowings and local certificates of deposit.
Deposits. Deposits are attracted from within the market area through the offering of a broad selection of deposit instruments, including checking accounts, money market deposit accounts, savings accounts, and certificates of deposit with a variety of rates. Deposit account terms vary according to the minimum balance required, the time periods the funds must remain on deposit, and the interest rate, among other factors. In determining the terms of the Company’s deposit accounts, the Company considers the development of long-term profitable customer relationships, current market interest rates, current maturity structure and deposit mix, customer preferences, and the profitability of acquiring customer deposits compared to alternative sources.
The following table sets forth total deposit activities for the years indicated:
| Year Ended December 31, |
||||||||||||
| (Dollars in thousands) |
2023 |
2022 |
2021 |
|||||||||
| Beginning balance |
$ | 2,127,741 | $ | 1,915,744 | $ | 1,674,071 | ||||||
| Net deposits before interest credited |
357,831 | 202,577 | 234,744 | |||||||||
| Interest credited |
36,751 | 9,420 | 6,929 | |||||||||
| Ending balance |
$ | 2,522,323 | $ | 2,127,741 | $ | 1,915,744 | ||||||
| Net increase in deposits (1) |
$ | 394,582 | $ | 211,997 | $ | 241,673 | ||||||
| Percent increase |
18.54 | % | 11.07 | % | 14.44 | % | ||||||
| (1) | Net increase in deposits for the year ended December 31, 2023 includes $377.7 million of deposits attributable to branches acquired in the Branch Acquisition |
The following table sets forth the dollar amount of deposits in the various types of deposit programs the Company offered at the dates indicated:
| December 31, |
||||||||||||||||
| 2023 |
2022 |
|||||||||||||||
| (Dollars in thousands) |
Amount |
Percent of Total |
Amount |
Percent of Total |
||||||||||||
| Transactions and Savings Deposits |
||||||||||||||||
| Noninterest-bearing checking (1) |
$ | 654,048 | 25.93 | % |
$ | 537,938 | 25.28 | % |
||||||||
| Interest-bearing checking |
244,028 | 9.67 | 135,127 | 6.35 | ||||||||||||
| Savings |
151,630 | 6.01 | 134,358 | 6.32 | ||||||||||||
| Money market (2) |
359,063 | 14.24 | 574,290 | 26.99 | ||||||||||||
| Escrow accounts related to mortgages serviced (3) |
16,783 | 0.67 | 16,236 | 0.76 | ||||||||||||
| Total transaction and savings deposits |
1,425,552 | 56.52 | 1,397,949 | 65.70 | ||||||||||||
| Certificates |
||||||||||||||||
| 0.00 - 1.99% |
369,237 | 14.64 | 202,945 | 9.54 | ||||||||||||
| 2.00 - 3.99% |
168,776 | 6.69 | 403,216 | 18.95 | ||||||||||||
| 4.00 - 5.99% |
558,758 | 22.15 | 123,631 | 5.81 | ||||||||||||
| Total certificates (4) |
1,096,771 | 43.48 | 729,792 | 34.30 | ||||||||||||
| Total deposits |
$ | 2,522,323 | 100.00 | % |
$ | 2,127,741 | 100.00 | % |
||||||||
________________________________
| (1) |
Includes $70.2 million and $2.3 million of brokered deposits at December 31, 2023 and 2022, respectively. |
| (2) |
Includes $1,000 and $59.7 million of brokered deposits at December 31, 2023 and 2022, respectively. |
| (3) | Noninterest-bearing accounts. |
| (4) |
Includes $361.3 million and $332.0 million of brokered certificates of deposit at December 31, 2023 and 2022, respectively. |
The following table sets forth the rate and maturity information of time deposit certificates at December 31, 2023:
| Rate |
||||||||||||||||||||
| (Dollars in thousands) |
0.00 - | 2.00 - | 4.00 - | Percent | ||||||||||||||||
| Certificate accounts maturing in quarter ending: |
1.99 | % | 3.99 | % | 5.99 | % | Total | of Total | ||||||||||||
| March 31, 2024 |
$ | 240,026 | $ | 24,183 | $ | 49,222 | $ | 313,431 | 28.58 | % | ||||||||||
| June 30, 2024 |
38,372 | 16,332 | 93,692 | 148,396 | 13.53 | |||||||||||||||
| September 30, 2024 |
15,743 | 34,254 | 157,484 | 207,481 | 18.92 | |||||||||||||||
| December 31, 2024 |
3,430 | 6,028 | 184,584 | 194,042 | 17.69 | |||||||||||||||
| March 31, 2025 |
6,043 | 44,741 | 42,060 | 92,844 | 8.47 | |||||||||||||||
| June 30, 2025 |
20,347 | 2,209 | 10,445 | 33,001 | 3.01 | |||||||||||||||
| September 30, 2025 |
1,957 | 338 | 10,990 | 13,285 | 1.21 | |||||||||||||||
| December 31, 2025 |
27,575 | 122 | — | 27,697 | 2.53 | |||||||||||||||
| March 31, 2026 |
5,539 | 389 | — | 5,928 | 0.54 | |||||||||||||||
| June 30, 2026 |
7,851 | 338 | 4,983 | 13,172 | 1.20 | |||||||||||||||
| September 30, 2026 |
63 | 397 | — | 460 | 0.04 | |||||||||||||||
| December 31, 2026 |
484 | 19,186 | 5,058 | 24,728 | 2.25 | |||||||||||||||
| Thereafter |
1,807 | 20,259 | 240 | 22,306 | 2.03 | |||||||||||||||
| Total |
$ | 369,237 | $ | 168,776 | $ | 558,758 | $ | 1,096,771 | 100.00 | |||||||||||
| Percent of total |
33.67 | % | 15.39 | % | 50.94 | % | 100.00 | % | ||||||||||||
As of December 31, 2023 and 2022, approximately $606.5 million and $560.0 million, respectively, of our deposit portfolio was uninsured. The uninsured amounts are estimates based on the methodologies and assumptions used for the Bank’s regulatory reporting requirements. The following table sets forth the portion of our time deposits that are in excess of the FDIC insurance limit, by remaining time until maturity, as of December 31, 2023:
| (Dollars in thousands) |
||||
| 3 months or less |
$ | 7,886 | ||
| Over 3 through 6 months |
6,566 | |||
| Over 6 through 12 months |
37,381 | |||
| Over 12 months |
27,707 | |||
| Total |
$ | 79,540 |
For additional information regarding our deposits, see “Note 9 – Deposits” of the Notes to Consolidated Financial Statements contained in "Part II. Item 8. Financial Statements and Supplementary Data" of this report on Form 10–K.
The Federal Reserve requires the Bank to maintain reserves on transaction accounts or non-personal time deposits. These reserves may be in the form of cash or noninterest-bearing deposits with the Federal Reserve Bank of San Francisco (“FRB”). Negotiable order of withdrawal (“NOW”) accounts and other types of accounts that permit payments or transfers to third parties fall within the definition of transaction accounts and are subject to the reserve requirements, as are any non-personal time deposits at a savings bank. Effective March 26, 2020, the Federal Reserve lowered the reserve requirement to zero percent. There was no required reserve balance at December 31, 2023.
Debt. Although customer deposits are the primary source of funds for lending and investment activities, the Company uses various borrowings such as advances and warehouse lines of credit from the FHLB of Des Moines, and to a lesser extent Fed Funds purchased to supplement the supply of lendable funds, to meet short-term deposit withdrawal requirements and also to provide longer term funding to better match the duration of selected loan and investment maturities.
As one of the Company’s capital management strategies, the Company has used advances from the FHLB of Des Moines to fund loan originations in order to increase net interest income. Depending upon the retail banking activity, the Company will consider and may undertake additional leverage strategies within applicable regulatory requirements or restrictions. These borrowings would be expected to primarily consist of FHLB of Des Moines advances.
As a member of the FHLB of Des Moines, the Company is required to own capital stock in the FHLB of Des Moines and authorized to apply for advances on the security of that stock and certain mortgage loans and other assets (principally securities which are obligations of, or guaranteed by, the U.S. Government) provided certain creditworthiness standards have been met. Advances are individually made under various terms pursuant to several different credit programs, each with its own interest rate and range of maturities. Depending on the program, limitations on the amount of advances are based on the financial condition of the member institution and the adequacy of collateral pledged to secure the credit. The Bank maintains a committed credit facility with the FHLB of Des Moines allowing for immediately available advances up to an aggregate of $686.2 million at December 31, 2023. Outstanding advances from the FHLB of Des Moines totaled $3.9 million at December 31, 2023. Additionally, securities available-for-sale, carried at fair value, with a fair value of $77.0 million at December 31, 2023, were pledged to the FRB, primarily to provide contingent liquidity through the Bank Term Funding Program (“BTFP”) of the Federal Reserve, with a current limit of $90.5 million and unused borrowing capacity of $620,000 at that date.
As of December 31, 2023, the Company also had $351.6 million of additional short-term borrowing capacity with the FRB and an aggregate of $101.0 million in unsecured Fed Funds lines of credit with other correspondent financial institutions, of which none was outstanding on either facility at December 31, 2023.
In February 2021, FS Bancorp completed the private placement of $50.0 million of its 3.75% fixed-to-floating rate subordinated notes due 2031 (the “Notes”) at an offering price equal to 100% of the aggregate principal amount of the Notes, of which $50.0 million have been exchanged for subordinated notes registered under the Securities Act of 1933. Net proceeds, after placement agent fees and offering expenses, was approximately $49.3 million. The Notes were issued under an Indenture, dated February 10, 2021 (the “Indenture”), by and between the Company and U.S. Bank National Association, as trustee. From and including the original issue date to, but excluding, February 15, 2026 or the date of earlier redemption, FS Bancorp pays interest on the Notes semi-annually in arrears on February 15 and August 15 of each year at a fixed annual interest rate equal to 3.75%. From and including February 15, 2026 to but excluding the maturity date or the date of earlier redemption, the floating interest rate per annum will be equal to a benchmark rate, which is expected to be Three-Month Term Secured Overnight Funding Rate or SOFR, plus a spread of 337 basis points, payable quarterly in arrears on February 15, May 15, August 15 and November 15 of each year, commencing on May 15, 2026. Notwithstanding the foregoing, in the event that the benchmark rate is less than zero, the benchmark rate shall be deemed to be zero. The Notes will mature on February 15, 2031.
On or after February 15, 2026, FS Bancorp may redeem the Notes, in whole or in part, at an amount equal to 100% of the outstanding principal amount being redeemed plus accrued interest. The Notes are not redeemable by FS Bancorp prior to February 15, 2026 except in the event that (i) the Notes no longer qualify as Tier 2 capital, (ii) the interest on the Notes is determined by law to be not deductible for Federal Income Tax reporting or (iii) FS Bancorp is considered an investment company pursuant to the Investment Company Act of 1940. The Notes are not subject to redemption by the noteholder.
The Notes are unsecured obligations and are subordinated in right of payment to all existing and future indebtedness, deposits and other liabilities of the Company's current and future subsidiaries, including the Banks’ deposits as well as the Company's subsidiaries' liabilities to general creditors and liabilities arising during the ordinary course of business. The Notes may be included in Tier 2 capital for the Company under current regulatory guidelines and interpretations.
For additional information related to debt, see “Note 11 – Debt” of the Notes to Consolidated Financial Statements included in “Item 8. Financial Statements and Supplementary Data” of this Form 10–K.
Subsidiary and Other Activities
The Company has one active subsidiary, which is the Bank, and the Bank has one inactive subsidiary. The Bank had no capital investment in its inactive subsidiary at December 31, 2023.
Competition
The Company faces strong competition in originating real estate loans, primarily from other savings institutions, commercial banks, credit unions, life insurance companies, mortgage bankers, and emerging players in financial technology (“FinTech”). In the consumer lending area, including indirect lending, competition arises from other savings institutions, commercial banks, credit unions, finance, and FinTech companies. Local commercial banks, pose the primary competition in the commercial business segment. The Company differentiates itself by prioritizing high-quality, personalized service, aiming to foster a high level of customer satisfaction.
Competition for deposits is also very competitive, with the Company relying on its branch network. Competition for those deposits is principally from other savings institutions, commercial banks and credit unions located in the same community, as well as mutual funds, FinTech companies, and other alternative investments. The Bank competes for these deposits by striving to offer superior service and a variety of deposit accounts at competitive rates. Based on the most recent branch deposit data provided by the FDIC, at June 30, 2023, 1st Security Bank’s share of aggregate deposits in its market area spanning the 12 counties with Company branches, was less than one percent.
The Company’s market areas have a high concentration of financial institutions, including branches of large money centers and regional banks resulting from the banking industry's consolidation in Washington and other western states. National lenders like Wells Fargo, Bank of America, Chase, and others in the Company’s market area offer services beyond the Bank's scope, such as trust services. Institutions providing comprehensive services may attract customers seeking “one-stop shopping,” potentially diverting them from the Bank.
Information about our Executive Officers
Set forth below is certain information regarding the executive officers of the Company and the Bank. There are no family relationships among or between the executive officers.
| Name |
Age (1) |
Position with FS Bancorp |
Position with 1st Security Bank |
|||
| Joseph C. Adams |
64 |
Director and Chief Executive Officer |
Director and Chief Executive Officer |
|||
| Matthew D. Mullet |
45 |
Chief Financial Officer, Treasurer and Secretary |
Executive Vice President, Chief Financial Officer |
|||
| Benjamin G. Crowl |
39 |
Executive Vice President, Chief Lending Officer |
||||
| Erin M. Burr |
46 |
Executive Vice President, Chief Risk Officer and CRA Officer |
||||
| Vickie A. Jarman |
46 |
Executive Vice President, Chief Human Resources Officer/WOW! Officer |
||||
| Shana C. Allen | 54 | Executive Vice President, Chief Information Officer | ||||
| Donn C. Costa |
62 |
Executive Vice President, Home Lending Production |
||||
| Kelli B. Nielsen |
52 |
Executive Vice President, Retail Banking and Marketing |
___________________________
(1) At December 31, 2023.
Joseph C. Adams, age 64, is a director and has been the Chief Executive Officer of 1st Security Bank since July 2004. He has also served in those capacities for FS Bancorp since its formation in September 2011. He joined 1st Security Bank in April 2003 as its Chief Financial Officer. Mr. Adams served as Supervisory Committee Chairperson from 1993 to 1999 when the Bank was Washington’s Credit Union. Mr. Adams is a lawyer, having worked for Deloitte as a tax consultant, K&L Gates as a lawyer and then at Univar USA as a lawyer and Director of Regulatory Affairs. As the Director of Regulatory Affairs for Univar USA, the largest chemical distribution company in the United States, Mr. Adams used his environmental law expertise to ensure Univar stayed in compliance with all relevant local, state and federal environmental laws, rules and regulations. He is a member of the Washington State Bar Association, and was a Board member of the Community Bankers of Washington. Mr. Adams graduated with distinction from the University of Hawaii with a Bachelor of Business Administration in Finance. He also graduated cum laude with a Juris Doctor from the University of Puget Sound School of Law. In addition, Mr. Adams graduated with honors from the Pacific Coast Banking School in 2007, a master’s level program held at the University of Washington. Mr. Adams’ legal and accounting backgrounds, as well as his duties as Chief Executive Officer of 1st Security Bank, bring a special knowledge of the financial, economic and regulatory challenges faced by the Bank, which makes him well-suited to educating the Board on these matters.
Matthew D. Mullet, age 45, joined 1st Security Bank in July 2011 and was appointed Chief Financial Officer in September 2011. As a cum laude graduate of University of Washington, he began his banking career in June 2000 as a financial examiner with the Washington State, Department of Financial Institutions, Division of Banks. In 2004, Matthew accepted a position at Golf Savings Bank in Seattle. He served in a variety of capacities at Golf and was appointed Chief Financial Officer in 2007. After the Golf Savings Bank merger with Sterling Savings Bank, he held the position of Senior Vice President of the Home Loan Division at Sterling until resigning in 2011 to join 1st Security Bank. Matthew is inspired by the Bank’s commitment to its customers and to the communities it serves. Matthew serves on the Government Relations Committee with Washington Bankers Association and volunteers with The IF Project, teaching Financial Literacy at the Washington Corrections Center for Women. He is passionate about financial literacy and youth education.
Benjamin G. Crowl, age 39, joined the Bank in 2018 as Senior Vice President, Commercial Lending Relationship Manager. He was promoted to Executive Vice President and Chief Lending Officer on July 1, 2023. His responsibilities include oversight of the loan production for the commercial, consumer, and commercial real estate lending groups of the Bank. A five-year veteran at 1st Security Bank, he served as Senior Vice President, Director of Consumer Lending and held the position of Senior Vice President, Commercial Lending Team Lead. Benjamin holds a Bachelor of Science in Business Administration degree from Northern Arizona University with a specialty in Marketing. He is also an honor graduate of the Pacific Coast Banking School; a master's level program held at the University of Washington and has an Executive Leadership Certificate from the University of Washington's Michael G. Foster School of Business. With a deep dedication to local nonprofits and the community, Benjamin has served on several nonprofit boards throughout his career. He finds satisfaction in being able to use the skills he has developed in banking to help others.
Erin M. Burr, age 46, holds a Bachelor of Business Administration degree from Western Washington University. She began her career in 1999 as a financial examiner for the Washington State, Department of Financial Institutions, Division of Banks. In 2006, Erin joined Builders Capital Mortgage in Seattle as their senior underwriter. She joined 1st Security Bank in January 2009 and became the Community Reinvestment Act (CRA) Officer in January 2010. She took on the Enterprise Risk Manager role in May 2012 and was promoted to Executive Vice President and Chief Risk Officer in April 2018. As the Bank’s CRA Officer, Erin enjoys building relationships with nonprofit groups that support the communities the Bank serves. She coordinates the Bank’s community outreach volunteer programs. Erin is a member of the Housing Consortium of Everett and Snohomish County and is dedicated to addressing affordable housing issues. She volunteers with The IF Project, teaching Financial Literacy to women who are in the Washington Corrections Center and she works with YWCA BankWork$ and the Teach Children to Save Program. She has volunteered in various roles with Domestic Violence Services of Snohomish County. As the Chief Risk Officer, Erin uses her regulatory background to help promote and build risk awareness throughout the Bank.
Vickie A. Jarman, age 46, holds a Bachelor of Arts in Communications from Seattle Pacific University. She joined 1st Security Bank in 2002, after working with the Ballard Boys and Girls Club. Vickie was promoted to Executive Vice President and Chief Human Resources Officer/WOW! Officer in 2018. Prior to becoming the Director of WOW and Chief Human Resources Officer, Vickie worked with our Consumer Lending team. Vickie oversees the onboarding and orientation of new hires, sharing the Bank’s Vision, Mission, Core Values, and unique company culture. She also ensures that the Bank’s Core Values continue to reflect the personal principles that support all the employees as the organization evolves. She has always been passionate and dedicated to volunteering and giving back to our communities and nonprofits. She volunteers with The IF Project, teaching Financial Literacy at the Washington Corrections Center for Women, YWCA BankWork$, and for the Teach Children to Save Program.
Shana C. Allen, age 54, joined the Bank in 2010 as Vice President of Technology & Operations and was promoted to Senior Vice President the following year. In 2015 she was promoted to SVP, Chief Information Officer and then promoted to Executive Vice President and Chief Information Officer in January 2023. Her responsibilities include oversight of the technology, security and project management teams at the Bank. Shana attended the University of Washington and holds certifications in IT Service Management under the Information Technology Infrastructure Library and is a Certified Information Systems Security Professional (CISSP). As a frequent contributor to industry publications in the areas of cybersecurity, information security and data encryption and a speaker on these topics in several industry forums, Shana has a proven track record of leadership in the Information Technology field. In addition, she currently sits on the Client Advisory Board for Computer Services, Inc. as well as on the IT & Cybersecurity Program Advisory Committee for Peninsula College, and the American Bankers Association Core Platforms Committee. An enthusiastic volunteer and passionate community supporter, Shana has served organizations such as Domestic Violence Services of Snohomish County and the White Center Food Bank.
Donn C. Costa, age 62, is a cum laude graduate from Washington State University with a Bachelor of Business Administration degree. He began his career in mortgage lending over three decades ago and joined the Bank as the EVP of Home Lending in 2012, overseeing home lending sales and operations. Donn previously held the position of Executive Vice President at Sterling Savings Bank after its merger with Golf Savings Bank in 2009. Prior to the merger, Donn was President of Golf Savings Bank and a member of the Board of Directors, serving on the Asset and Liability, Personnel and Lending Committees and held the position of Executive Vice President of Mortgage Lending. Donn’s achievements include serving as President of the Washington Mortgage Lenders and the Seattle Mortgage Bankers, as well as on the Advisory Boards of Fannie Mae and Freddie Mac. His goal for the team at 1st Security Bank is to provide “best in class” customer service and loan programs that help people achieve the dream of homeownership.
Kelli B. Nielsen, age 52, has worked in the financial services industry for three decades and brought a wealth of retail banking and leadership experience to her role when she joined 1st Security Bank in 2016. Previously, she was Vice President, Sales and Service Manager of Retail Banking at Cascade Bank before she moved to Sound Community Bank as the Senior Vice President of Retail Banking and Marketing. In 2016, Kelli graduated from the American Bankers Association (ABA), Stonier Graduate School of Banking, and holds a Certificate of Leadership from the University of Pennsylvania, The Wharton School. She serves on the ABA Stonier Advisory Board and is a representative on the Diversity, Equity, and Inclusion (DEI) Committee. She is also a founder for Women of Stonier, an advisory group. Passionate about building relationships and helping others, Kelli serves on the Washington Bankers Association (WBA) Retail Banking Committee, the Government Relations Committee and is on the WBA Pros Board. Kelli is also a published children’s book author and certified life coach. She has a deep commitment to causes that improve the lives of children. She volunteers with Long Way Home, a nonprofit in Guatemala focused on building schools from sustainable material, is a former board member of the Victim Support Services and the corporate advisory board for the Greater Seattle Business Association (GSBA) the largest LGBTQ+ Chamber in North America. She also volunteers with The IF Project, teaching Financial Literacy and serving as a mentor to female residents of the Washington Corrections Center for Women.
The Company has developed a Vision Statement that guides our current and future strategies. Our Vision Statement articulates our aspiration: To build a truly great place to work and bank. This statement is both aspirational and dynamic signifying our commitment to evolving responsibly to uphold these values for our employees. The deliberate order of priorities reflects our belief that constructing an exceptional workplace will inherently lead to the creation of an outstanding banking environment.
Employee Compensation and Benefits
Management remains focused on ensuring employees are provided a livable wage in addition to a commitment to a balanced work/life schedule. Besides a competitive salary, the following benefits are available to all full-time employees:
| ● |
Employee health benefits that have not increased in employee contribution cost since 2014; |
| ● |
Life, AD&D, short-term disability and long-term disability; |
| ● |
401k match of up to the first 5% of contribution for up to 4% of total salary; |
| ● |
An Employee Stock Purchase Plan (“ESPP”) that matched 6,799 shares in 2023 to employees that have met a minimum threshold of months worked; |
| ● |
Vacation and sick leave benefits; |
| ● |
Family leave benefits including paid time off for a new child/adopted child; |
| ● |
Education reimbursement of up to $5,000 per year for any accredited program; |
| ● |
Paid volunteer hours (16 hours each year); |
| ● |
Opportunities to participate in development programs through the Washington Bankers Association; |
| ● |
Regular Company provided lunches and treats; and |
| ● |
A pet friendly workplace at the administrative offices. |
Management works with employees to provide these benefits whenever possible including a flexible schedule for employees to be able to enjoy full-time benefits with a reduced hour schedule when appropriate.
Diversity and Inclusion
Diversity is a fundamental core value for our organization, reflecting our commitment to celebrating differences and promoting equality. Both the Board and management actively embrace diverse perspectives, backgrounds, and experiences, including considerations of gender, age, race, and ethnicity. Our inclusive community welcomes everyone. Among our independent directors, 50% are female (three out of six), and 50% of the executives that report to our Chief Executive Officer are female (four out of eight). As of December 31, 2023, our workforce composition was 69% female and 31% male. Women held 62% of the Company's management roles including executives. The average tenure for management positions was seven and a half years. Our diverse workforce includes individuals of various ethnicities: 1% Alaska Native or American Indian, 9% Asian, 2% Black, 7% Hispanic/Latino, 1% Native Hawaiian or Other Pacific Islander, 76% White. Additionally, 4% identified with Two or More Races.
The following table outlines gender diversity:
| Level |
Female % |
Male % |
||||||
| Individual Contributor |
73 | % | 27 | % | ||||
| Manager |
60 | % | 40 | % | ||||
| Independent Director |
50 | % | 50 | % | ||||
| Executive |
50 | % | 50 | % | ||||
Talent Acquisition
Since 2011, the Company has experienced consistent growth and regularly seeks to fill positions within the markets we serve. Our interview process involves both manager and team members to ensure a comprehensive evaluation of potential candidates. The Human Resources team serves as a dedicated advocate for employees, with a primary focus on fostering a culture of “Wow.” The leader of our human resources team holds the role of EVP of WOW and is dedicated to recruiting individuals who can build lasting careers within our thriving culture. In 2023, we hired 145 new employees for additional positions and replacements, bringing our total employee count to 574 as of December 31, 2023.
Volunteerism
Our organization has a long history of giving back and actively participating in volunteer initiatives within the communities we serve. In 2023, our volunteer hours significantly increased, totaling approximately 6,000 hours, compared to 5,100 hours in 2022. This increase in community outreach can be attributed to the positive impact of the Branch Acquisition, as well as increased demand from additional nonprofit organizations seeking volunteer support.
Human Capital Metrics
As of December 31, 2023, the Company had 574 employees, 99.9% are full time employees and 0.1% are part time including our college internship program. None of our employees are represented by a collective bargaining agreement. Geographically, 89% of our employees reside in Washington State, 8% in Oregon, 1% in Arizona, and 2% in Idaho. The turnover rate for employees as measured by terminated/replaced individuals was 18% in 2023, showing a slight decrease from 19% in 2022.
The following is a brief description of certain laws and regulations applicable to FS Bancorp and 1st Security Bank. Descriptions of laws and regulations here and elsewhere in this Form 10–K do not purport to be complete and are qualified in their entirety by reference to the actual laws and regulations. Legislation is introduced from time to time in the United States Congress or in the Washington State Legislature that may affect the operations of FS Bancorp and 1st Security Bank. In addition, the regulations governing the Company and the Bank may be amended from time to time by the FDIC, DFI, Federal Reserve and the Consumer Financial Protection Bureau (“CFPB”). Any such legislation or regulatory changes in the future could adversely affect our operations and financial condition. We cannot predict whether any such changes may occur.
Regulation of 1st Security Bank
General. 1st Security Bank, as a state-chartered savings bank, is subject to applicable provisions of Washington law and to regulations and examinations of the DFI. As an insured institution, it also is subject to examination and regulation by the FDIC, which insures the deposits of 1st Security Bank to the maximum amount permitted by law. During these state or federal regulatory examinations, the examiners may require 1st Security Bank to provide for higher general or specific loan loss reserves, which can impact capital and earnings. This regulation of 1st Security Bank is intended for the protection of depositors and the Deposit Insurance Fund (“DIF”) of the FDIC and not for the purpose of protecting shareholders of 1st Security Bank or FS Bancorp. 1st Security Bank is required to maintain minimum levels of regulatory capital and is subject to some limitations on the payment of dividends to FS Bancorp. See below “Capital Requirements” and “Regulation and Supervision of FS Bancorp - Restrictions on Dividends and Stock Repurchases.”
Federal and State Enforcement Authority and Actions. As part of its supervisory authority over Washington-chartered savings banks, the DFI may initiate enforcement proceedings to obtain a consent order to cease-and-desist against an institution believed to have engaged in unsafe and unsound practices or to have violated a law, regulation, or other regulatory limit, including a written agreement. The FDIC also has the authority to initiate enforcement actions against insured institutions under its jurisdiction for similar reasons and may terminate the deposit insurance if it determines that an institution has engaged in unsafe or unsound practices or is in an unsafe or unsound condition. Both these agencies may also utilize less formal supervisory tools to address their concerns about the condition, operations or compliance status of a savings bank.
Regulation by the Washington State Department of Financial Institutions. State law and regulations govern 1st Security Bank’s ability to take deposits and pay interest, to make loans on or invest in residential and other real estate, to make consumer loans, to invest in securities, to offer various banking services to its customers, and to establish branch offices. As a state savings bank, 1st Security Bank must pay semi-annual assessments, examination costs and certain other charges to the DFI.
Washington law generally provides the same powers for Washington savings banks as federally and other-state chartered savings institutions and banks with branches in Washington, subject to the approval of the DFI. Washington law allows Washington savings banks to charge the maximum interest rates on loans and other extensions of credit to Washington residents which are allowable for a national bank in another state if higher than Washington limits. In addition, the DFI may approve applications by Washington savings banks to engage in an otherwise unauthorized activity, if the DFI determines that the activity is closely related to banking, and 1st Security Bank is otherwise qualified under the statute. This additional authority, however, is subject to review and approval by the FDIC if the activity is not permissible for national banks.
Insurance of Accounts and Regulation by the FDIC. Through the DIF, the FDIC insures deposit accounts in 1st Security Bank up to $250,000 per separately insured deposit ownership right or category. As insurer, the FDIC imposes deposit insurance premiums and is authorized to conduct examinations of and to require reporting by FDIC-insured institutions.
The FDIC assesses deposit insurance premiums quarterly on each FDIC-insured institution applied to its deposit base, which is its average consolidated total assets minus its Tier 1 capital. No institution may pay a dividend if it is in default on its federal deposit insurance assessment. At December 31, 2023, total base assessment rates ranged from 2.5 to 32 basis points subject to certain adjustments.
Extraordinary growth in insured deposits during the first and second quarters of 2020 caused the DIF reserve ratio to decline below the statutory minimum of 1.35 percent as of June 30, 2020. In September 2020, the FDIC Board of Directors adopted a Restoration Plan to restore the reserve ratio to at least 1.35 percent within eight years, absent extraordinary circumstances, as required by the Federal Deposit Insurance Act. The Restoration Plan maintained the assessment rate schedules in place at the time and required the FDIC to update its analysis and projections for the deposit insurance fund balance and reserve ratio at least semiannually. In the semiannual update for the Restoration Plan in June 2022, the FDIC projected that the reserve ratio was at risk of not reaching the statutory minimum of 1.35 percent by September 30, 2028, the statutory deadline to restore the reserve ratio. Based on this update, the FDIC Board approved an Amended Restoration Plan, and concurrently proposed an increase in initial base deposit insurance assessment rate schedules uniformly by 2 basis points, applicable to all insured depository institutions. In October 2022, the FDIC Board finalized the increase with an effective date of January 1, 2023, applicable to the first quarterly assessment period of 2023. The revised assessment rate schedules which now range from 2.5 percent to 32 percent, subject to certain adjustments, are intended to increase the likelihood that the reserve ratio of the DIF reaches the statutory minimum level of 1.35 percent by September 30, 2028.
The FDIC has authority to increase insurance assessments, and any significant increases may have an adverse effect on the operating expenses and results of operations of the Company. Management cannot predict what assessment rates will be in the future. In a banking industry emergency, the FDIC may also impose a special assessment. The Bank’s deposit insurance premiums for the year ended December 31, 2023, were $2.4 million.
The FDIC conducts examinations of and requires reporting by state non-member banks, such as 1st Security Bank. The FDIC also may prohibit any insured institution from engaging in any activity determined by regulation or order to pose a serious risk to the DIF. No institution may pay a dividend if it is in default on its federal deposit insurance assessment. Management is not aware of any existing circumstances which would result in termination of the Bank's deposit insurance.
Capital Requirements. 1st Security Bank is subject to capital regulations adopted by the FDIC, which establish a required ratio for common equity Tier 1 (“CET1”) capital, minimum leverage and Tier 1 capital ratios, risk-weightings of certain assets for purposes of the risk-based capital ratios, an additional capital conservation buffer over the minimum capital ratios and define what qualifies as capital for purposes of meeting the capital requirements. These regulations implement the regulatory capital reforms required by the Dodd Frank Act and the “Basel III” requirements.
Under the capital regulations, the minimum capital ratios are: (1) a CET1 capital ratio of 4.50% of risk-weighted assets; (2) a Tier 1 capital ratio of 6.00% of risk-weighted assets; (3) a total risk-based capital ratio of 8.00% of risk-weighted assets; and (4) a leverage ratio (the ratio of Tier 1 capital to average total adjusted assets) of 4.00%. CET1 generally consists of common stock; retained earnings; accumulated other comprehensive income (“AOCI”); and certain minority interests; all subject to applicable regulatory adjustments and deductions. Tier 1 capital generally consists of CET1 and noncumulative perpetual preferred stock. In addition, Tier 1 capital includes AOCI, which includes all unrealized gains and losses on available for sale debt and equity securities, unless an institution elects to opt out of such inclusion, if eligible to do so. We have elected to permanently opt-out of the inclusion of AOCI in our capital calculations. Tier 2 capital generally consists of other preferred stock and subordinated debt meeting certain conditions plus an amount of the ACL on loans up to 1.25% of assets. Total capital is the sum of Tier 1 and Tier 2 capital.
In addition to the minimum capital requirements, a capital conservation buffer must be maintained by 1st Security Bank which consists of additional CET1 capital greater than 2.5% of risk-weighted assets above the required minimum levels in order to avoid limitations on paying dividends, repurchasing shares, and paying discretionary bonuses.
To be considered well capitalized, a depository institution must have a Tier 1 risk-based capital ratio of at least 8.00%, a total risk-based capital ratio of at least 10.00%, a CET1 capital ratio of at least 6.50% and a leverage ratio of at least 5.00% and not be subject to an individualized order, directive or agreement under which its primary federal banking regulator requires it to maintain a specific capital level.
At December 31, 2023, 1st Security Bank was categorized as well capitalized under the prompt corrective action regulations of the FDIC. Management monitors the capital levels of the Bank to provide for current and future business opportunities and to meet regulatory guidelines for well capitalized institutions. The Bank’s actual capital ratios at December 31, 2023 are presented in the following table:
| To be Well |
||||||||||||||||
| Capitalized |
||||||||||||||||
| For Capital |
For Capital |
Under Prompt |
||||||||||||||
| Adequacy |
Adequacy with |
Corrective |
||||||||||||||
| Actual |
Purposes |
Capital Buffer |
Action Provisions |
|||||||||||||
| Ratio |
Ratio |
Ratio |
Ratio |
|||||||||||||
| At December 31, 2023 |
||||||||||||||||
| Total risk-based capital (to risk-weighted assets) |
13.37 | % | 8.00 | % | 10.50 | % | 10.00 | % | ||||||||
| Tier 1 risk-based capital (to risk-weighted assets) |
12.12 | % | 6.00 | % | 8.50 | % | 8.00 | % | ||||||||
| Tier 1 leverage capital (to average assets) |
10.39 | % | 4.00 | % | N/A | 5.00 | % | |||||||||
| CET1 capital (to risk-weighted assets) |
12.12 | % | 4.50 | % | 7.00 | % | 6.50 | % | ||||||||
At December 31, 2023, the Bank was categorized as well capitalized under the prompt corrective action regulations of the FDIC. For a complete description of the Bank’s required and actual capital levels on December 31, 2023, see “Note 15 – Regulatory Capital” of the Notes to Consolidated Financial Statements included in “Item 8. Financial Statements and Supplementary Data,” of this Form 10–K.
The FDIC also has authority to establish individual minimum capital requirements in appropriate cases upon a determination that an institution’s capital level is or may become inadequate in light of particular risks or circumstances. Management of 1st Security Bank believes that, under the current regulations, 1st Security Bank will continue to meet its minimum capital requirements in the foreseeable future.
FS Bancorp is a bank holding company registered with the Federal Reserve. Bank holding companies are subject to capital adequacy requirements of the Federal Reserve under the Bank Holding Company Act of 1956, as amended, and the regulations of the Federal Reserve. Bank holding companies with less than $3.0 billion in assets are generally not subject to compliance with the Federal Reserve’s capital regulations, which are generally the same as the capital regulations applicable to the Bank. The Federal Reserve has a policy that a bank holding company is required to serve as a source of financial and managerial strength to the holding company’s subsidiary bank and expects the holding company’s subsidiary bank to be well capitalized under the prompt corrective action regulations. If FS Bancorp was subject to regulatory guidelines for bank holding companies with $3.0 billion or more in assets at December 31, 2023, FS Bancorp would have exceeded all regulatory capital requirements.
Prompt Corrective Action. The FDIC Improvement Act established a system of prompt corrective action to resolve the problems of under-capitalized institutions. Federal statutes establish a supervisory framework for FDIC-insured institutions based on five capital categories: well capitalized, adequately capitalized, undercapitalized, significantly undercapitalized and critically undercapitalized. An institution’s category generally depends upon where its capital levels are in relation to relevant capital measures, which include risk-based capital measures, a leverage ratio capital measure, and certain other factors. An institution that is not well capitalized is subject to certain restrictions on brokered deposits, including restrictions on the rates it can offer on its deposits generally. Any institution which is neither well capitalized nor adequately capitalized is considered undercapitalized. The previously referenced final rule establishing an elective “community bank leverage ratio” regulatory capital framework provides that a qualifying institution whose capital exceeds the community bank leverage ratio and opts to use that framework will be considered “well capitalized” for purposes of prompt corrective action.
Undercapitalized institutions are subject to certain prompt corrective action requirements, regulatory controls and restrictions which become more extensive as an institution becomes more severely undercapitalized. Failure by 1st Security Bank to comply with applicable capital requirements would, if unremedied, result in progressively more severe restrictions on its activities and lead to enforcement actions, including, but not limited to, the issuance of a capital directive to ensure the maintenance of required capital levels and, ultimately, the appointment of the FDIC as receiver or conservator. Banking regulators will take prompt corrective action with respect to depository institutions that do not meet minimum capital requirements. Additionally, approval of any regulatory application filed for their review may be dependent on compliance with capital requirements.
At December 31, 2023, 1st Security Bank was categorized as well capitalized under the prompt corrective action regulations of the FDIC. For additional information, see “Note 15 – Regulatory Capital” of the Notes to Consolidated Financial Statements included in “Item 8. Financial Statements and Supplementary Data,” of this Form 10–K.
Standards for Safety and Soundness. Each federal banking agency, including the FDIC, has adopted guidelines establishing general standards relating to internal controls, information and internal audit systems; loan documentation; credit underwriting; interest rate risk exposure; asset growth; asset quality; earnings; and compensation, fees and benefits. In general, the guidelines require, among other things, appropriate systems and practices to identify and manage the risks and exposures specified in the guidelines. The guidelines prohibit excessive compensation as an unsafe and unsound practice and describe compensation as excessive when the amounts paid are unreasonable or disproportionate to the services performed by an executive officer, employee, director, or principal shareholder. If the FDIC determines that an institution fails to meet any of these guidelines, it may require an institution to submit to the FDIC an acceptable plan to achieve compliance. Management of the Bank is not aware of any conditions relating to these safety and soundness standards which would require submission of a plan of compliance.
Federal Home Loan Bank System. The FHLB of Des Moines is one of 11 regional Federal Home Loan Banks that administer the home financing credit function of savings institutions. The Federal Home Loan Banks are subject to the oversight of the Federal Housing Finance Agency and each Federal Home Loan Bank serves as a reserve or central bank for its members within its assigned region. The Federal Home Loan Banks are funded primarily from proceeds derived from the sale of consolidated obligations of the Federal Home Loan Bank System and make loans or advances to members in accordance with policies and procedures established by the Board of Directors of the Federal Home Loan Bank, which are subject to the oversight of the Federal Housing Finance Agency. All advances are required to be fully secured by sufficient collateral as determined by the Federal Home Loan Bank. As a member, the Bank is required to purchase and maintain stock in the FHLB of Des Moines based on the Bank’s asset size and level of borrowings from the FHLB of Des Moines. See “Business - Deposit Activities and Other Sources of Funds - Debt.” At December 31, 2023, 1st Security Bank had $2.1 million in FHLB of Des Moines stock, which was in compliance with this requirement. The FHLB pays dividends quarterly, and 1st Security Bank received $245,000 in dividends during the year ended December 31, 2023.
The Federal Home Loan Banks continue to contribute to low- and moderately-priced housing programs through direct loans or interest subsidies on advances targeted for community investment and low- and moderate-income housing projects. These contributions have adversely affected the level of Federal Home Loan Bank dividends paid and could continue to do so in the future. These contributions could also have an adverse effect on the value of Federal Home Loan Bank stock in the future. A reduction in value of 1st Security Bank FHLB stock may result in a decrease in net income.
Commercial Real Estate Lending Concentrations. The federal banking agencies have issued guidance on sound risk management practices for concentrations in commercial real estate lending. The particular focus is on exposure to commercial real estate loans that are dependent on the cash flow from the real estate held as collateral and that are likely to be sensitive to conditions in the commercial real estate market (as opposed to real estate collateral held as a secondary source of repayment or as an abundance of caution). The purpose of the guidance is not to limit a bank’s commercial real estate lending but to guide banks in developing risk management practices and capital levels commensurate with the level and nature of real estate concentrations. The guidance directs the FDIC and other federal bank regulatory agencies to focus their supervisory resources on institutions that may have significant commercial real estate loan concentration risk. A bank that has experienced rapid growth in commercial real estate lending, has notable exposure to a specific type of commercial real estate loan, or is approaching or exceeding the following supervisory criteria may be identified for further supervisory analysis with respect to real estate concentration risk:
| ● |
Total reported loans for construction, land development and other land represent 100% or more of the Bank’s total regulatory capital; or |
| ● |
Total commercial real estate loans (as defined in the guidance) represent 300% or more of the Bank’s total regulatory capital and the outstanding balance of the Bank’s commercial real estate loan portfolio has increased 50% or more during the prior 36 months. |
The guidance provides that the strength of an institution’s lending and risk management practices with respect to such concentrations will be taken into account in supervisory guidance on evaluation of capital adequacy. At December 31, 2023, 1st Security Bank's aggregate recorded loan balances for construction, land development and land loans were 89.4% of regulatory capital. In addition, at December 31, 2023, 1st Security Bank loans on all commercial real estate, including construction, owner and non-owner occupied commercial real estate, and multi-family lending, as defined by the FDIC, were 273.1% of regulatory capital.
Activities and Investments of Insured State-Chartered Financial Institutions. Federal law generally limits the activities and equity investments of FDIC insured, state-chartered banks to those that are permissible for national banks. An insured state bank is not prohibited from, among other things, (1) acquiring or retaining a majority interest in a subsidiary, (2) investing as a limited partner in a partnership the sole purpose of which is direct or indirect investment in the acquisition, rehabilitation or new construction of a qualified housing project, provided that such limited partnership investments may not exceed 2% of the bank’s total assets, (3) acquiring up to 10% of the voting stock of a company that solely provides or reinsures directors’ and officers’ liability insurance coverage or bankers’ blanket bond group insurance coverage for insured depository institutions, and (4) acquiring or retaining the voting shares of a depository institution if certain requirements are met.
Dividends. Dividends from 1st Security Bank constitute a major source of funds for dividends in future periods that may be paid by FS Bancorp to shareholders. The amount of dividends payable by 1st Security Bank to FS Bancorp depends upon the Bank’s earnings and capital position, and is limited by federal and state laws, regulations and policies. According to Washington law, 1st Security Bank may not declare or pay a cash dividend on its capital stock if it would cause its net worth to be reduced below (1) the amount required for liquidation accounts or (2) the net worth requirements, if any, imposed by the Director of the DFI. Dividends on 1st Security Bank’s capital stock may not be paid in an aggregate amount greater than the aggregate retained earnings of 1st Security Bank, without the approval of the Director of the DFI. The Bank paid $8.9 million in dividends to the holding company in 2023.
The amount of dividends actually paid during any one period will be strongly affected by 1st Security Bank’s policy of maintaining a strong capital position. Federal law further limits and can prohibit dividends when an institution does not meet the capital conservation buffer requirement and provides that no insured depository institution may pay a cash dividend if it would cause the institution to be “undercapitalized,” as defined in the prompt corrective action regulations. Moreover, the federal bank regulatory agencies also have the general authority to limit the dividends paid by insured banks if such payments are deemed to constitute an unsafe and unsound practice.
Affiliate Transactions. FS Bancorp and 1st Security Bank are separate and distinct legal entities. FS Bancorp (and any non-bank subsidiary of FS Bancorp) is an affiliate of 1st Security Bank. Federal laws strictly limit the ability of banks to engage in certain transactions with their affiliates. Transactions deemed to be “covered transactions” under Section 23A of the Federal Reserve Act and between a bank and an affiliate are limited to 10% of the bank subsidiary’s capital and surplus and, with respect to all affiliates, to an aggregate of 20% of the bank’s capital and surplus. Further, covered transactions that are loans and extensions of credit generally are required to be secured by eligible collateral in specified amounts. Federal law also requires that covered transactions and certain other transactions listed in Section 23B of the Federal Reserve Act between a bank and its affiliates be on terms as favorable to the bank as transactions with non-affiliates.
Community Reinvestment Act. 1st Security Bank is also subject to the provisions of the Community Reinvestment Act of 1977 (“CRA”), which requires the appropriate federal bank regulatory agency to assess a bank’s performance under the CRA in meeting the credit needs of the community serviced by the Bank, including low- and moderate-income neighborhoods. The regulatory agency’s assessment of a bank’s record is made available to the public. Further, a bank’s CRA performance rating must be considered in connection with a bank’s application to, among other things, establish a new branch office that will accept deposits, relocate an existing office or merge or consolidate with, or acquire the assets or assume the liabilities of, a federally regulated financial institution, and in connection with certain applications by a bank holding company, such as bank acquisitions. An unsatisfactory rating may be the basis for denial of certain applications. 1st Security Bank received a “satisfactory” rating during its most recent CRA examination.
On October 24, 2023, the federal banking agencies issued a final rule designed to strengthen and modernize regulations implementing the CRA. The changes are designed to encourage banks to expand access to credit, investment and banking service in low- and moderate-income communities, adapt to changes in the banking industry including mobile and internet banking, provide greater clarity and consistency in the application of the CRA regulations and tailor CRA evaluations and data collection to bank size and type. The Bank cannot predict the impact the changes to the CRA will have on its operations at this time.
In February 2024, several trade groups filed a complaint in the U.S. District Court for the Northern District of Texas challenging the Federal Reserve Board, the Federal Deposit Insurance Corporation, and the Office of the Comptroller of the Currency’s final rule modernizing how they assess lenders’ compliance under the CRA. In their complaint, the trade groups asked the court to vacate the final rule and provide a preliminary injunction that would pause implementation of the final rule while the court decides the case. It is not known at this time what the final outcome of this litigation will be and how it will impact our CRA requirements
Privacy Standards and Cybersecurity. The Gramm-Leach-Bliley Financial Services Modernization Act of 1999 modernized the financial services industry by establishing a comprehensive framework to permit affiliations among commercial banks, insurance companies, securities firms, and other financial service providers. Federal banking agencies, including the FDIC, have adopted guidelines for establishing information security standards and cybersecurity programs for implementing safeguards under the supervision of the board of directors. These guidelines, along with related regulatory materials, increasingly focus on risk management and processes related to information technology and the use of third parties in the provision of financial services. These regulations require 1st Security Bank to disclose its privacy policy, including informing consumers of its information sharing practices and informing consumers of their rights to opt out of certain practices. In addition, other federal and state cybersecurity and data privacy laws and regulations may expose 1st Security Bank to risk and result in certain risk management costs.
In addition, on November 18, 2021, the federal banking agencies announced the adoption of a final rule providing for new notification requirements for banking organizations and their service providers for significant cybersecurity incidents. Specifically, the new rule requires a banking organization to notify its primary federal regulator as soon as possible, and no later than 36 hours after the banking organization determines that a “computer-security incident” rising to the level of a “notification incident” has occurred. Notification is required for incidents that have materially affected or are reasonably likely to materially affect the viability of a banking organization’s operations, its ability to deliver banking products and services, or the stability of the financial sector. Service providers are required under the rule to notify affected banking organization customers as soon as possible when the provider determines that it has experienced a computer-security incident that has materially affected or is reasonably likely to materially affect the banking organization’s customers for four or more hours. Compliance with the new rule was required by May 1, 2022. Noncompliance with federal or similar state privacy and cybersecurity laws and regulations could lead to substantial regulatory imposed fines and penalties, damages from private causes of action and/or reputational harm.
In July 2023, the SEC adopted rules requiring registrants to disclose material cybersecurity incidents they experience and to disclose on an annual basis material information regarding their cybersecurity risk management, strategy, and governance. The new rules require registrants to disclose on Form 8–K any cybersecurity incident they determine to be material and to describe the material aspects of the incident's nature, scope, and timing, as well as its material impact or reasonably likely material impact on the registrant. For information regarding the Company's cybersecurity risk management, strategy, and governance, see “Item 1C. Cybersecurity” in Part I of this Form 10–K.
Environmental Issues Associated with Real Estate Lending. The Comprehensive Environmental Response, Compensation and Liability Act (“CERCLA”) is a federal statute that generally imposes strict liability on, all prior and present “owners and operators” of sites containing hazardous waste. However, Congress asked to protect secured creditors by providing that the term “owner and operator” excludes a person whose ownership is limited to protecting its security interest in the site. Since the enactment of the CERCLA, this “secured creditor exemption” has been the subject of judicial interpretations which have left open the possibility that lenders could be liable for cleanup costs on contaminated property that they hold as collateral for a loan. To the extent that legal uncertainty exists in this area, all creditors, including 1st Security Bank, that have made loans secured by properties with potentially hazardous waste contamination (such as petroleum contamination) could be subject to liability for cleanup costs, which costs often substantially exceed the value of the collateral property.
Federal Reserve System. The Federal Reserve requires all depository institutions to maintain reserves at specified levels against their transaction accounts, primarily checking accounts. At December 31, 2023, the Bank was in compliance with the reserve requirements in place at the time.
Other Consumer Protection Laws and Regulations. The Dodd-Frank Act established the CFPB and empowered it to exercise broad regulatory, supervisory and enforcement authority with respect to both new and existing consumer financial protection laws. 1st Security Bank is subject to consumer protection regulations issued by the CFPB, but as a financial institution with assets of less than $10 billion, 1st Security Bank is generally subject to supervision and enforcement by the FDIC and the DFI with respect to compliance with federal and state consumer financial protection laws and regulations.
1st Security Bank is subject to a broad array of federal and state consumer protection laws and regulations that govern almost every aspect of its business relationships with consumers. While the list set forth below is not exhaustive, these include the Truth in Lending Act, the Truth in Savings Act, the Electronic Fund Transfer Act, the Expedited Funds Availability Act, the Equal Credit Opportunity Act, the Fair Housing Act, the Real Estate Settlement Procedures Act, the Home Mortgage Disclosure Act, the Fair Credit Reporting Act, the Fair Debt Collection Practices Act, the Right to Financial Privacy Act, the Home Ownership and Equity Protection Act, the Consumer Leasing Act, the Fair Credit Billing Act, the Homeowners Protection Act, the Check Clearing for the 21st Century Act, laws governing flood insurance, laws governing consumer protections in connection with the sale of insurance, federal and state laws prohibiting unfair and deceptive business practices, and various regulations that implement the foregoing. These laws and regulations mandate certain disclosure requirements and regulate the manner in which financial institutions must deal with customers when taking deposits, making loans, collecting loans, and providing other services. In addition, The USA PATRIOT Act, requires banks to, among other things, establish broadened anti-money laundering compliance programs, and due diligence policies and controls to ensure the detection and reporting of money laundering. Such required compliance programs are intended to supplement existing compliance requirements that also apply to financial institutions under the Bank Secrecy Act and the Office of Foreign Assets Control regulations. Failure to comply with these laws and regulations can subject 1st Security Bank to various penalties, including but not limited to, enforcement actions, injunctions, fines, civil liability, criminal penalties, punitive damages, and the loss of certain contractual rights.
Regulation and Supervision of FS Bancorp
General. FS Bancorp is a bank holding company registered with the Federal Reserve and is the sole shareholder of 1st Security Bank. Bank holding companies are subject to comprehensive regulation by the Federal Reserve under the Bank Holding Company Act of 1956, as amended (“BHCA”), and the regulations promulgated there under. This regulation and oversight is generally intended to ensure that FS Bancorp limits its activities to those allowed by law and that it operates in a safe and sound manner without endangering the financial health of 1st Security Bank. As a bank holding company, FS Bancorp is required to file quarterly and annual reports with the Federal Reserve and any additional information required by the Federal Reserve and is subject to regular examinations by the Federal Reserve. The Federal Reserve also has extensive enforcement authority over bank holding companies, including the ability to assess civil money penalties, to issue cease and desist or removal orders, and to require that a holding company divest subsidiaries (including its bank subsidiaries). In general, enforcement actions may be initiated for violations of law and regulations and unsafe or unsound practices.
The Bank Holding Company Act. Under the BHCA, FS Bancorp is supervised by the Federal Reserve. The Federal Reserve has a policy that a bank holding company is required to serve as a source of financial and managerial strength to its subsidiary banks and may not conduct its operations in an unsafe or unsound manner. In addition, the Dodd-Frank Act provides that a bank holding company should serve as a source of strength to its subsidiary banks by having the ability to provide financial assistance to its subsidiary banks during periods of financial stress to the bank. A bank holding company’s failure to meet its obligation to serve as a source of strength to its subsidiary banks will generally be considered by the Federal Reserve to be an unsafe and unsound banking practice or a violation of the Federal Reserve’s regulations or both. FS Bancorp and any subsidiaries that it may control are considered “affiliates” of 1st Security Bank within the meaning of the Federal Reserve Act, and transactions between 1st Security Bank and its affiliates are subject to numerous restrictions. With some exceptions, FS Bancorp and its subsidiaries are prohibited from tying the provision of various services, such as extensions of credit, to other services offered by FS Bancorp or its subsidiaries.
Acquisitions. The BHCA prohibits a bank holding company, with certain exceptions, from acquiring ownership or control of more than 5% of the voting shares of any company that is not a bank or bank holding company and from engaging in activities other than those of banking, managing or controlling banks, or providing services for its subsidiaries. Under the BHCA, the Federal Reserve may approve the ownership of shares by a bank holding company in any company, the activities of which the Federal Reserve has determined to be so closely related to the business of banking or managing or controlling banks as to be a proper incident thereto. These activities include: operating a savings institution, mortgage company, finance company, credit card company or factoring company; performing certain data processing operations; providing certain investment and financial advice; underwriting and acting as an insurance agent for certain types of credit-related insurance; leasing property on a full-payout, non-operating basis; selling money orders, travelers’ checks, and U.S. Savings Bonds; real estate and personal property appraising; providing tax planning and preparation services; and, subject to certain limitations, providing securities brokerage services for customers. The Federal Reserve must approve the acquisition (or acquisition of control) of a bank or other FDIC-insured depository institution by a bank holding company, and the appropriate federal banking regulator must approve a bank’s acquisition (or acquisition of control) of another bank or other FDIC-insured institution.
Under the Change in Bank Control Act, no person may acquire control of a bank holding company such as the FS Bancorp unless the Federal Reserve has prior written notice and has not issued a notice disapproving the proposed acquisition. In evaluating such notices, the Federal Reserve takes into consideration such factors as the financial resources, competence, experience and integrity of the acquirer, the future prospects the bank holding company involved and its subsidiary bank and the competitive effects of the acquisition. In January 2020, the Federal Reserve substantially revised its control regulations. Under the revised rule, control is conclusively presumed to exist if an individual or company acquires 25% or more of any class of voting securities of the bank holding company. Where an investor holds less than 25%, the Federal Reserve provides the following four-tiered approach to determining control: (1) less than 5%; (2) 5% -9.99%; (3) 10% - 14.99%; and (4) 15% - 24.99%. In addition to the four tiers, the Federal Reserve takes into account substantive activities, including director service, business relationships, business terms, officer/employee interlocks, contractual powers, and proxy contests for directors. The Federal Reserve Board may require the company to enter into passivity and, if other companies are making similar investments, anti-association commitments. Acquisition of more than 10% of any class of a bank holding company’s voting stock constitutes a rebuttable presumption of control under the regulations under certain circumstances including where, as will be the case with the FS Bancorp, the issuer has registered securities under Section 12 of the Securities Exchange Act of 1934.
Regulatory Capital Requirements. As discussed above, pursuant to the “Small Bank Holding Company” exception, effective August 30, 2018, bank holding companies with less than $3 billion in consolidated assets were generally no longer subject to the Federal Reserve’s capital regulations, which are generally the same as the capital regulations applicable to 1st Security Bank. At the time of this change, FS Bancorp was considered “well capitalized” (as defined for a bank holding company), and was not subject to an individualized order, directive or agreement under which the Federal Reserve requires it to maintain a specific capital level. For additional information, see “Note 15 – Regulatory Capital” of the Notes to the Consolidated Financial Statements contained in “Item 8. Financial Statements and Supplementary Data” of this Form 10–K.
Restrictions on Dividends and Stock Repurchases. FS Bancorp’s ability to declare and pay dividends is subject to the Federal Reserve limits and Washington law and may depend on its ability to receive dividends from 1st Security Bank. Federal Reserve policy limits the payment of a cash dividend by a bank holding company if the holding company’s net income for the past year is not sufficient to cover both the cash dividend and a rate of earnings retention that is consistent with capital needs, asset quality and overall financial condition. A bank holding company that does not meet any applicable capital standard would not be able to pay any cash dividends under this policy. A bank holding company not subject to consolidated capital requirements is expected not to pay dividends unless its debt-to-equity ratio is less than 1:1, and it meets certain additional criteria. The Federal Reserve also has indicated that it would be inappropriate for a company experiencing serious financial problems to borrow funds to pay dividends. Except for a company that meets the applicable standard to be considered a well-capitalized and well-managed bank holding company and is not subject to any unresolved supervisory issues, a bank holding company is required to give the Federal Reserve prior written notice of any purchase or redemption of its outstanding equity securities if the gross consideration for the purchase or redemption, when combined with the net consideration paid for all such purchases or redemptions during the preceding 12 months, is equal to 10% or more of the company’s consolidated net worth. The Federal Reserve may disapprove such a purchase or redemption if it determines that the proposal would constitute an unsafe or unsound practice or would violate any law, regulation or regulatory order, condition, or written agreement. Under Washington corporate law, FS Bancorp generally may not pay dividends if after that payment it would not be able to pay its liabilities as they become due in the usual course of business, or its total assets would be less than the sum of its total liabilities.
Federal Securities Law. The stock of FS Bancorp is registered with the SEC under the Securities Exchange Act of 1934, as amended. As a result, FS Bancorp is subject to the information, proxy solicitation, insider trading restrictions, and other requirements under the Securities Exchange Act of 1934. FS Bancorp stock held by persons who are affiliates of FS Bancorp may not be resold without registration unless sold in accordance with certain resale restrictions. Affiliates are generally considered to be officers, directors, and principal shareholders. If FS Bancorp meets specified current public information requirements, each affiliate of FS Bancorp will be able to sell in the public market, without registration, a limited number of shares in any three-month period.
Federal Taxation
General. FS Bancorp and 1st Security Bank are subject to federal income taxation in the same general manner as other corporations, with some exceptions discussed below. The following discussion of federal taxation is intended only to summarize certain pertinent federal income tax matters and is not a comprehensive description of the tax rules applicable to FS Bancorp. 1st Security Bank is no longer subject to U.S. federal income tax examinations by tax authorities for years ended before 2020, and income tax returns have not been audited for the period of 2015 to 2023.
FS Bancorp files a consolidated federal income tax return with 1st Security Bank. Accordingly, any cash distributions made by FS Bancorp to its shareholders would be considered to be taxable dividends and not as a non‑taxable return of capital to shareholders for federal and state tax purposes. For additional information, see “Note 12 – Income Taxes” of the Notes to Consolidated Financial Statements included in “Item 8. Financial Statements and Supplementary Data” of this Form 10–K.
Method of Accounting. For federal income tax purposes, FS Bancorp currently reports its income and expenses on the accrual method of accounting and uses a fiscal year ending on December 31 for filing its federal income tax return.
Net Operating Loss Carryovers. The Company may carryforward net operating losses indefinitely. At December 31, 2023, the Company had no net operating losses.
Corporate Dividends‑Received Deduction. FS Bancorp may eliminate from its income dividends received from 1st Security Bank as a wholly-owned subsidiary of FS Bancorp if it elects to file a consolidated return with 1st Security Bank. The corporate dividends-received deduction is 100%, or 80%, in the case of dividends received from corporations with which a corporate recipient does not file a consolidated tax return, depending on the level of stock ownership of the payor of the dividend. Corporations which own less than 20% of the stock of a corporation distributing a dividend may deduct 70% of dividends received or accrued on their behalf.
Washington Taxation
The Company and the Bank are subject to a business and occupation tax which is imposed under Washington law at the rate of 1.75% of gross receipts. Interest received on loans secured by mortgages or deeds of trust on residential properties, residential mortgage-backed securities, and certain U.S. Government and agency securities are not subject to this tax.
An investment in our common stock is subject to risks inherent in our business. Before making an investment decision, you should carefully consider the risks and uncertainties described below together with all the other information included in this report and our other documents filed with and furnished to the SEC. In addition to the risks and uncertainties described below, other risks and uncertainties not currently known to us or that we currently deem to be immaterial also may materially and adversely affect our business, financial condition, capital levels, cash flows, liquidity, results of operations, and prospects. The market price of our common stock could decline significantly due to any of these identified or other risks, and you could lose some or all your investment. The risks discussed below also include forward-looking statements, and our actual results may differ substantially from those discussed in these forward-looking statements. This report is qualified in its entirety by these risk factors.
Risks Related to Macroeconomic Conditions
Our business may be adversely affected by downturns in the national economy and in the economies in our market areas.
Our primary market areas are in the Puget Sound region of Washington and Kitsap, Clallam, Jefferson, Grays Harbor, Thurston, and Benton counties. Additionally, following the acquisition of seven branches on February 24, 2023, our footprint has expanded to include Klickitat County (2) in Washington, and the counties of Lincoln (2) Malheur (1) and Tillamook (2) in Oregon. A return of recessionary conditions or adverse economic conditions in our market areas could reduce our rate of growth, affect our customers’ ability to repay loans and adversely impact our business, financial condition, and results of operations. General economic conditions, including inflation, unemployment and money supply fluctuations, also may adversely affect our profitability. In addition, weakness in the global economy and prevalent global supply chain issues have adversely affected numerous businesses within our market areas, particularly those reliant on international trade. Changes in agreements or relationships between the United States and other countries may further impact these businesses and, by extension, our operations.
A downturn in economic conditions, be it due to inflation, a recession, war, geopolitical conflicts, adverse weather, or other factors, could have a material adverse effect on the business, financial condition, and results of operations, including but not limited to:
| ● |
Reduced demand for our products and services, potentially leading to a decline in our overall loans or assets. |
| ● |
Elevated instances of loan delinquencies, problematic assets, and foreclosures. |
| ● |
An increase in our ACL on loans. |
| ● |
Depreciation in collateral values linked to our loans, thereby diminishing borrowing capacities and asset values tied to existing loans. |
| ● |
Reduced net worth and liquidity of loan guarantors, possibly impairing their ability to meet commitments to us. |
| ● |
Reduction in our low-cost or noninterest-bearing deposits. |
Our loan portfolio predominantly comprises assets secured by real estate or fixtures affixed to real property. Any deterioration in the real estate markets associated with the collateral securing mortgage loans could significantly impact borrowers' repayment capabilities and the value of collateral. Real estate values are affected by various factors, including economic conditions, governmental rules or policies, and natural disasters such as earthquakes. If we are required to liquidate a significant amount of collateral during a period of reduced real estate values, our financial condition and profitability could be adversely affected.
External economic factors, such as changes in monetary policy and inflation and deflation, may have an adverse effect on our business, financial condition and results of operations.
Our financial condition and results of operations are affected by credit policies of monetary authorities, particularly the Board of Governors of the Federal Reserve System, or the Federal Reserve. Actions by monetary and fiscal authorities, including the Federal Reserve, could lead to inflation, deflation, or other economic phenomena that could adversely affect our financial performance. Inflation has risen sharply since the end of 2021 and throughout 2022 at levels not seen for over 40 years. Inflationary pressures, while easing recently, remained elevated throughout the first half of 2023. Small to medium-sized businesses may be impacted more during periods of high inflation as they are not able to leverage economics of scale to mitigate cost pressures compared to larger businesses. Consequently, the ability of our business clients to repay their loans may deteriorate quickly, which would adversely impact our results of operations and financial condition. Furthermore, a prolonged period of inflation could cause wages and other costs to the Company to increase, which could adversely affect our results of operations and financial condition. Virtually all of our assets and liabilities are monetary in nature. As a result, interest rates tend to have a more significant impact on our performance than general levels of inflation or deflation. Interest rates do not necessarily move in the same direction or by the same magnitude as the prices of goods and services.
Risks Related to our Lending Activities
Our loan portfolio possesses increased risk due to a large percentage of consumer loans.
Our consumer loans accounted for $646.8 million, or 26.6% of our total gross loan portfolio as of December 31, 2023, of which $569.9 million (88.1% of total consumer loans) consisted of indirect home improvement loans (some of which were not secured by a lien on the real property), $73.3 million (11.3% of total consumer loans) consisted of marine loans secured by boats, and $3.5 million (0.6% of total consumer loans) consisted of other consumer loans, which includes personal lines of credit, credit cards, automobile, direct home improvement, loans on deposit, and recreational loans. Generally, we consider these types of loans to involve a higher degree of risk compared to first mortgage loans on owner-occupied, one-to-four-family residential properties. As a result of our large portfolio of consumer loans, it may become necessary to increase the level of provision for credit losses on loans, which would reduce profits. Consumer loans generally entail greater risk than do one-to-four-family residential mortgage loans, particularly in the case of loans that are secured by rapidly depreciable assets, such as automobiles and boats. In these cases, any repossessed collateral for a defaulted loan may not provide an adequate source of repayment of the outstanding loan balance.
Most of our consumer loans are originated indirectly by or through third parties, which presents greater risk than our direct lending products which involves direct contact between us and the borrower. Unlike a direct loan where the borrower makes an application directly to us, in these loans the dealer, who has a direct financial interest in the loan transaction, assists the borrower in preparing the loan application. Although we disburse the loan proceeds directly to the dealer upon receipt of a “completion certificate” signed by the borrower, because we do not have direct contact with the borrower, these loans may be more susceptible to a material misstatement on the loan application or having the loan proceeds being misused by the borrower or the dealer. In addition, if the work is not properly performed, the borrower may cease payment on the loan until the problem is rectified.
Although we file a UCC-2 financing statement to perfect the security interest in the personal property collateral for most fixture loans, there are no guarantees on our ability to collect on that security interest or that the repossessed collateral for a defaulted fixture loan will provide an adequate source of repayment for the outstanding loan given the limited stand-alone value of the collateral. See “Item 1. Business – Lending Activities – Consumer Lending” and “– Asset Quality.”
Our business could suffer if we are unsuccessful in making, continuing, and growing relationships with home improvement contractors and dealers.
Our indirect home improvement lending, which is the largest component of our consumer loan portfolio, is reliant on our relationships with home improvement contractors and dealers. In particular, our indirect home improvement loan operations depend in large part upon our ability to establish and maintain relationships with reputable contractors and dealers who originate loans at the point of sale. Our indirect home improvement contractor/dealer network is currently comprised of 114 active contractors and dealers with businesses located throughout Washington, Oregon, California, Idaho, Colorado, Arizona, Minnesota, Nevada, Texas, Utah, Massachusetts, Montana, and recently, New Hampshire. Indirect home improvement loans totaled $569.9 million, or 23.4% of our total gross loan portfolio, at December 31, 2023, reflecting approximately 30,500 loans with an average balance of approximately $19,000.
We have relationships with home improvement contractors/dealers; however, the relationships generally are not exclusive, some of them are newly established and they may be terminated at any time. An economic downturn or recession and contraction of credit to both contractors/dealers and their customers, could result in an increase in business closures and our existing contractor/dealer base could experience decreased sales and loan volume, which may have an adverse effect on our business, results of operations and financial condition. In addition, if a competitor were to offer better service or more attractive loan products to our contractor/dealer partners, it is possible that our partners would terminate their relationships with us or recommend customers to our competitors. If we are unable to continue to grow our existing relationships and develop new relationships, our results of operations and financial condition could be adversely affected. In addition, we rely on five dealers for 65.9% of our loan volume so the loss of one of these dealers can have a significant effect on our loan origination volume.
A significant portion of our business involves commercial real estate lending which is subject to various risks that could adversely impact our results of operations and financial condition.
At December 31, 2023, our loan portfolio included $590.1 million of commercial real estate loans, including $190.6 million secured by non-owner occupied commercial real estate properties, and $223.8 million of multi-family real estate loans, or 9.2% of our total gross loan portfolio. Subject to market demand, we have been increasing since 2011, the origination of commercial and multi-family real estate loans. The credit risk related to these types of loans is considered to be greater than the risk related to one-to-four-family residential loans because the repayment of commercial and multi-family real estate loans typically is dependent on the successful operation and income stream of the property securing the loan and the value of the real estate securing the loan as collateral, which can be significantly affected by economic conditions.
Our focus on these types of loans will increase the risk profile relative to traditional one-to-four-family lenders as we continue to implement our business strategy. Although commercial and multi-family real estate loans are intended to enhance the average yield of the earning assets, they do involve a different, and possibly higher, level of risk of delinquency or collection than generally associated with one-to-four-family loans for a number of reasons. Among other factors, these loans involve larger balances to a single borrower or groups of related borrowers. Since commercial real estate and multi-family real estate loans generally have large balances, if we make any errors in judgment in the collectability of these loans, we may need to significantly increase the provision for credit losses since any resulting charge‑offs will be larger on a per loan basis. Consequently, this could materially adversely affect our future earnings.
Collateral evaluation for these types of loans also requires a more detailed analysis at the time of loan underwriting and on an ongoing basis. In addition, most of our commercial and multi-family loans are not fully amortizing and include balloon payments upon maturity. Balloon payments may require the borrower to either sell or refinance the underlying property in order to make the payment, which may increase the risk of default or non-payment. Finally, if foreclosure occurs on a commercial real estate loan, the holding period for the collateral, if any, typically is longer than for a one-to-four-family residence because the secondary market for most types of commercial and multi-family real estate is not readily liquid, so we have less opportunity to mitigate credit risk by selling part or all of our interest in these assets. See “Item 1. Business – Lending Activities – Commercial Real Estate Lending” of this Form 10–K.
Repayment of our commercial business loans is often dependent on the cash flows of the borrower, which may be unpredictable, and the collateral securing these loans may fluctuate in value.
At December 31, 2023, our commercial business loan portfolio included commercial and industrial loans of $238.3 million, or 9.8%, and warehouse lending of $17.6 million, or 0.7%, of our total gross loan portfolio. Commercial business lending involves risks that are different from those associated with residential and commercial real estate lending. Real estate lending is generally considered to be collateral-based lending with loan amounts based on predetermined loan to collateral values and liquidation of the underlying real estate collateral being viewed as the primary source of repayment in the event of borrower default. Our commercial and industrial business loans are primarily made based on the cash flow of the borrower and secondarily on the underlying collateral provided by the borrower. The borrowers’ cash flow may be unpredictable and collateral securing these loans may fluctuate in value. This collateral may consist of equipment, inventory, accounts receivable, or other business assets. In the case of loans secured by accounts receivable, the availability of funds for the repayment of these loans may be substantially dependent on the ability of the borrower to collect amounts due from its customers. Other collateral securing these loans may depreciate over time, may be difficult to appraise, may be illiquid, and may fluctuate in value based on the specific type of business and equipment. As a result, the availability of funds for the repayment of commercial and industrial business loans may be substantially dependent on the success of the business itself, which, in turn, is often dependent in part upon general economic conditions and secondarily on the underlying collateral provided by the borrower. For additional information related to the risks of warehouse lending, see “Our residential mortgage warehouse lending and construction warehouse lending programs are subject to various risks that could adversely impact our results of operations and financial condition.”
Our residential construction lending is subject to various risks that could adversely impact our results of operations and financial condition.
Our lending activities include extending real estate construction loans to individuals and builders, primarily for residential property development. As of December 31, 2023, our construction and development loan portfolio totaled $303.1 million, constituting 12.5% of our total gross loan portfolio, excluding $154.6 million in unfunded construction loan commitments. Of this portfolio, $210.7 million was allocated to residential real estate projects. Additionally, we had four commercial note-secured lines of credit totaling $57.5 million in commitments, directed towards residential construction re-lenders with an outstanding balance of $17.0 million at December 31, 2023. The risks associated with the collateral underlying our commercial construction warehouse lines are similar to those associated with our residential construction and development loans.
Construction financing inherently involves a higher degree of credit risk compared to longer-term financing on improved, owner-occupied real estate. Factors contributing to elevated risk levels in construction lending include advanced disbursement of funds based on estimated project costs to achieve future value at completion, uncertainties in estimating construction costs and the market value of completed projects, and the influence of governmental regulations on real property which may impact project valuations. Changes in demand for new housing and higher than anticipated building costs may cause actual results to vary significantly from those estimated. This type of lending also typically involves higher loan principal amounts and may be concentrated with a small number of builders. A downturn in housing, or the real estate market, could increase delinquencies, defaults and foreclosures, and significantly impair the value of our collateral and our ability to sell the collateral upon foreclosure. Some of the builders we deal with have more than one loan outstanding with us. Consequently, an adverse development with respect to one loan or one credit relationship can expose us to a significantly greater risk of loss. In addition, during the term of most of our construction loans, no payment from the borrower is required since the accumulated interest is added to the principal of the loan through an interest reserve. As a result, these loans often involve the disbursement of funds with repayment substantially dependent on the success of the ultimate project and the ability of the borrower to sell or lease the property or obtain permanent take-out financing, rather than the ability of the borrower or guarantor to repay principal and interest. If our appraisal of the value of a completed project proves to be overstated, we may have inadequate security for the repayment of the loan upon completion of construction of the project and may incur a loss. Also, construction loans require active monitoring of the building process, including cost comparisons and on-site inspections, making these loans more difficult and costly to monitor.
Increases in market rates of interest can substantially increase borrowing costs for end-purchasers, potentially reducing the ability of homeowners to finance completed homes or overall demand for projects. Properties under construction are often difficult to sell and typically must be completed in order to be successfully sold which also complicates the process of working out problem construction loans. This may require us to advance additional funds and/or contract with another builder to complete construction and assume the market risk of selling the project at a future market price, which may or may not enable us to fully recover unpaid loan funds and associated construction and liquidation costs.
Furthermore, a portion of our outstanding construction and development loans comprises $131.3 million in speculative one-to-four-family construction loans and $38.5 million in land acquisition and development loans as of December 31, 2023. Speculative construction loans involve financing projects without a committed buyer in place, relying on market demand upon project completion for sale. Consequently, the success of these loans heavily depends on prevailing market conditions at the project's completion. Fluctuations in market demand for such properties can significantly impact their salability and subsequent loan repayment. As these projects advance without a predetermined purchaser, completion and subsequent sale are imperative for loan repayment. The absence of a confirmed buyer during the construction phase introduces uncertainty and potential challenges in ensuring a successful project. Land acquisition loans are often associated with properties lacking income-generating capabilities. Without income streams from the property, repayment primarily depends on successful development, sale, or lease of the land. Unlike developed properties, undeveloped land can be illiquid, meaning it may not readily convert to cash. The lack of income and potential challenges in liquidating the collateral could impact repayment capabilities in the event of default. Given the inherent uncertainties associated with speculative construction and land loans, rigorous monitoring practices are essential. Active oversight, continuous evaluation of market conditions, and careful management of these loan types are crucial to mitigate associated risks and minimize potential adverse impacts on our loan portfolio and financial standing.
At December 31, 2023, $4.7 million in real estate construction and development loans were nonperforming. A substantial increase in nonperforming loans in this segment could significantly affect our financial condition and results of operations.
Our residential mortgage warehouse lending program is subject to various risks that could adversely impact our results of operations and financial condition.
The Company has a residential mortgage warehouse lending program that focuses on three Pacific Northwest mortgage banking companies. Short-term funding is provided to the mortgage banking companies for the purpose of originating residential mortgage loans for sale into the secondary market. Our warehouse lending lines are secured by the underlying notes associated with mortgage loans made to borrowers by the mortgage banking company and we generally require guarantees from the principal shareholder(s) of the mortgage banking company. Because these loans are repaid when the note is sold by the mortgage bank into the secondary market, with the proceeds from the sale used to pay down our outstanding loan before being dispersed to the mortgage bank, interest rate fluctuation is also a key risk factor affecting repayment. At December 31, 2023, we had approved residential warehouse lending lines to three companies in varying amounts from $3.0 million to $10.0 million, for an aggregate amount of $22.0 million. At December 31, 2023, there was $573,000 outstanding under these residential warehouse lines, compared to no amounts outstanding at December 31, 2022.
There are numerous risks associated with residential mortgage warehouse lending, which include, without limitation, (i) credit risks relating to the mortgage bankers that borrow from us, (ii) the risk of intentional misrepresentation or fraud by any of these mortgage bankers, (iii) changes in the market value of mortgage loans originated by the mortgage banker, the sale of which is the expected source of repayment of the borrowings under the warehouse line of credit, due to changes in interest rates during the time in warehouse, (iv) unsalable or impaired mortgage loans originated, which could lead to decreased collateral value and the failure of a purchaser of the mortgage loan to purchase the loan from the mortgage banker, and (v) the volatility of mortgage loan originations.
The underlying collateral risks associated with our residential mortgage warehouse lines are similar to the risks related to our one-to-four-family residential mortgage loans. Additionally, the impact of interest rates on our residential mortgage warehouse lending business is similar to the impact on our mortgage banking operations as discussed below under “Revenue from mortgage banking operations is sensitive to changes in economic conditions, decreased economic activity, a slowdown in the housing market, higher interest rates or new legislation and may adversely impact our financial condition and results of operations.”
If our ACL on loans is not sufficient to cover actual loan losses, our earnings could be reduced.
Deterioration in economic conditions, new information regarding existing loans, identification of additional problem loans or relationships, and other factors, both within and outside of our control, may increase our loan charge-offs and/or otherwise require an increase in our provision for credit losses on loans. In addition, bank regulatory agencies periodically review our ACL on loans. Based on their assessment, they may require additional provisions for credit losses or loan charge-offs. Any increase in the provision for credit losses on loans affects net income and could materially impact our financial condition, results of operations, and capital.
Our business may be adversely affected by credit risk associated with residential property.
At December 31, 2023, $567.7 million, excluding loans held for sale of $25.7 million, or 23.3% of our total loan portfolio was secured by first liens on one-to-four-family residential loans. Additionally, home equity lines of credit and second lien mortgages totaled $69.5 million, or 2.9% of our total loan portfolio at that date. These loans are sensitive to regional and local economic fluctuations, significantly impacting borrowers’ ability to meet payment obligations, making loss levels difficult to predict. A downturn in housing markets, particularly in Washington (and to a lesser extent in Oregon), where a concentration of our loans exist could reduce the value of the collateral securing these loans and increase our risk of loss upon a default by the borrower. Economic decline or reduced real estate sales volume and prices, coupled with higher unemployment rates, may increase loan delinquencies and asset quality concerns, affecting demand for our products and services. In addition, residential loans with higher combined loan-to-value ratios are more vulnerable to property value fluctuations, potentially leading to increased default rates and higher losses, compared to loans with lower loan-to-value ratios. Further, the majority of our home equity lines of credit are second mortgage loans. In the event of default on these second mortgage-secured lines of credit, recovering loan proceeds is challenging unless we cover the first mortgage loan repayment and such repayment and the costs associated with a foreclosure are justified by the value of the property. These factors may lead to higher elevated rates of delinquencies, defaults, and related losses, which would adversely affect our net income.
Nonperforming assets take significant time to resolve and adversely affect our results of operations and financial condition and could result in losses in the future.
At December 31, 2023, our nonperforming assets (which consisted of nonaccrual loans, other real estate owned (“OREO”), and other repossessed assets) were $11.0 million or 0.4% of total assets. Nonperforming assets adversely affect our earnings in various ways. We do not record interest income on nonaccrual loans or foreclosed assets, thereby adversely affecting our income and increasing our loan administration costs. Upon foreclosure or similar proceedings, we record the repossessed asset at the estimated fair value, less costs to sell, which may result in a write down or loss. If we experience increases in nonperforming loans and nonperforming assets, our losses and troubled assets could increase significantly, which could have a material adverse effect on our financial condition and results of operations, as our loan administration costs could increase, each of which could have an adverse effect on our net income and related ratios, such as return on assets and equity. A significant increase in the level of nonperforming assets from current levels would also increase our risk profile and may impact the capital levels our regulators believe are appropriate in light of the increased risk profile.
While we reduce problem assets through collection efforts, asset sales, workouts and restructurings, decreases in the value of the underlying collateral, or in these borrowers’ performance or financial condition, whether or not due to economic and market conditions beyond our control, could adversely affect our business, results of operations, and financial condition. In addition, the resolution of nonperforming assets requires significant commitments of time from management and our directors, which can be detrimental to the performance of their other responsibilities.
Risk Related to Changes in Market Interest Rates
Changes in interest rates may reduce our net interest income and may result in higher defaults in a rising rate environment.
Our earnings and cash flows are largely dependent upon our net interest income. Interest rates are highly sensitive to many factors that are beyond our control, including general economic conditions and policies of various governmental and regulatory agencies and, in particular, the Federal Reserve. Since March 2022, in response to inflation, the Federal Open Market Committee (“FOMC”) of the Federal Reserve has increased the target range for the federal funds rate by 525 basis points, including 100 basis points during 2023, to a range of 5.25% to 5.50% as of December 31, 2023. The FOMC has paused increases to the target federal funds rate but has not ruled out future increases. If the FOMC further increases the targeted federal funds rates, overall interest rates will likely rise, which will negatively impact our net interest income and may negatively impact both the housing market by reducing refinancing activity and new home purchases and the U.S. economy.
We principally manage interest rate risk by managing our volume and mix of our earning assets and funding liabilities. If we are unable to manage interest rate risk effectively, our business, financial condition, and results of operations could be materially affected.
Changes in interest rates could also have a negative impact on our results of operations by reducing the ability of borrowers to repay their current loan obligations or by reducing our margins and profitability. Our net interest margin is the difference between the yield we earn on our interest-earning assets and the interest rate we pay for deposits and our other sources of funding. Changes in interest rates-up or down-could adversely affect our net interest margin and, as a result, our net interest income. Although the yield we earn on our interest-earning assets and our funding costs tend to move in the same direction in response to changes in interest rates, one can rise or fall faster than the other, causing our net interest margin to expand or contract. Our interest-bearing liabilities tend to be shorter in duration than our interest-earning assets, so they may adjust faster in response to changes in interest rates. As a result, when interest rates rise, our funding costs may rise faster than the yield we earn on our interest-earning assets, causing our net interest margin to contract until the yields on interest-earning assets catch up. Changes in the slope of the “yield curve”, or the spread between short-term and long-term interest rates could also reduce our net interest margin. Normally, the yield curve is upward sloping, meaning short-term rates are lower than long-term rates. Because our interest-bearing liabilities tend to be shorter in duration than our interest-earning assets, when the yield curve flattens or even inverts, we could experience pressure on our net interest margin as our cost of funds increases relative to the yield we can earn on our interest-earning assets. Also, interest rate decreases can lead to increased prepayments of loans and mortgage-backed securities as borrowers refinance their loans to reduce borrowing costs. Under these circumstances, we are subject to reinvestment risk as we may have to redeploy such repayment proceeds into lower yielding investments, which would likely hurt our income.
A sustained increase in market interest rates could adversely affect our earnings. As is the case with many financial institutions, we attempt to increase core deposits, those deposits bearing no or a relatively low rate of interest with no stated maturity date, which has been challenging over the last couple of years. At December 31, 2023, we had $863.4 million in certificates of deposit that mature within one year and $1.43 billion in noninterest bearing, NOW checking, savings and money market accounts. We would incur a higher cost of funds to retain these deposits in a rising interest rate environment. If the interest rates paid on deposits and other borrowings increase at a faster rate than the interest rates received on loans and other investments, our net interest income, and therefore earnings, could be adversely affected. In addition, a substantial amount of our residential mortgage loans and home equity lines of credit have adjustable interest rates. As a result, these loans may experience a higher rate of default in a rising interest rate environment.
Our net income can also be reduced by the impact that changes in interest rates can have on the fair value of our capitalized MSRs. At December 31, 2023, we serviced $2.83 billion of loans sold to third parties, and the servicing rights associated with such loans had an amortized cost of $17.2 million and an estimated fair value, at that date, of $38.2 million. Because the estimated life and estimated income to be derived from servicing the underlying loans generally increase with rising interest rates and decrease with falling interest rates, the value of MSRs generally increases as interest rates rise and decreases as interest rates fall. For example, a decrease in mortgage interest rates typically increases the prepayment speeds of MSRs and therefore decreases the fair value of the MSRs. Future decreases in mortgage interest rates could decrease the fair value of our MSRs below their recorded amount, which would decrease our earnings. For additional information, see "Note 1 - Basis of Presentation and Summary of Significant Account Policies - Subsequent Events", “Note 5 – Mortgage Servicing Rights” and “Note 16 – Fair Value Measurements” of the Notes to Consolidated Financial Statements included in “Item 8. Financial Statements and Supplementary Data” of this Form 10–K.
Changes in interest rates also affect the value of our interest-earning assets and in particular, our investment securities portfolio. Generally, the fair value of fixed-rate securities fluctuates inversely with changes in interest rates. Unrealized gains and losses on securities available for sale are reported as a separate component of equity, net of tax. Decreases in the fair value of securities available for sale resulting from increases in interest rates could have an adverse effect on stockholders’ equity.
Changes in interest rates also affect the current market value of our interest-earning securities portfolio. Generally, the value of securities moves inversely with changes in interest rates. At December 31, 2023, the fair value of our investment securities available for sale totaled $292.9 million. Unrealized net losses on these available for sale securities totaled approximately $35.8 million at December 31, 2023 and are reported as a separate component of stockholders’ equity. Decreases in the fair value of securities available for sale in future periods would have an adverse effect on stockholders’ equity.
Although management believes it has implemented effective asset and liability management strategies to reduce the potential effects of changes in interest rates on our results of operations, any substantial, unexpected, or prolonged change in market interest rates could have a material adverse effect on our financial condition and results of operations. Also, our interest rate risk modeling techniques and assumptions likely may not fully predict or capture the impact of actual interest rate changes on our balance sheet or projected operating results. See “Item 7. Management’s Discussion and Analysis of Financial Condition and Results of Operations – Asset and Liability Management and Market Risk” of this Form 10–K.
Revenue from mortgage banking operations is sensitive to changes in economic conditions, decreased economic activity, a slowdown in the housing market, higher interest rates or new legislation and may adversely impact our financial condition and results of operations.
Our mortgage banking operations provide a significant portion of our noninterest income. We generate mortgage banking revenues primarily from gains on the sale of one-to-four-family mortgage loans. The one-to-four-family mortgage loans are sold pursuant to programs currently offered by Fannie Mae, Freddie Mac, Ginnie Mae, FHA, VA, USDA Rural Housing, the FHLB, and non-Government Sponsored Enterprise (“GSE”) investors. These entities account for a substantial portion of the secondary market in residential one-to-four-family mortgage loans. Any future changes in the one-to-four-family programs, our eligibility to participate in these programs, the criteria for loans to be accepted or laws that significantly affect the activity of such entities, could, in turn, materially adversely affect our results of operations. Mortgage banking is generally considered a volatile source of income because it depends largely on the level of loan volume which, in turn, depends largely on prevailing market interest rates. In a rising or higher interest rate environment, our originations of mortgage loans may decrease, resulting in fewer loans that are available to be sold to investors. This would result in a decrease in mortgage banking revenues and a corresponding decrease in noninterest income. In addition, our results of operations are affected by the amount of noninterest expense associated with mortgage banking activities, such as salaries and employee benefits, occupancy, equipment and data processing expense, and other operating costs. During periods of reduced loan demand, our results of operations may be adversely affected to the extent that we are unable to reduce expenses commensurate with the decline in loan originations. In addition, although we sell loans into the secondary market without recourse, we are required to give customary representations and warranties about the loans to the buyers. If we breach those representations and warranties, the buyers may require us to repurchase the loans and we may incur a loss on the repurchase. The Company has recorded a holdback reserve of $2.1 million to cover loss exposure related to these guarantees for one-to-four-family loans sold into the secondary market at December 31, 2023.
Our securities portfolio may be negatively impacted by fluctuations in market value and interest rates.
Our securities portfolio may be impacted by fluctuations in market value, potentially reducing accumulated other comprehensive income and/or earnings. Fluctuations in market value may be caused by changes in market interest rates, rating agency actions in respect to the securities, defaults by the issuer or with respect to the underlying securities, lower market prices for securities and limited investor demand. Our available-for-sale debt securities in an unrealized loss position are evaluated to determine whether the decline in fair value has resulted from credit losses or other factors. If a credit loss exists, an allowance for credit losses is recorded for the credit loss, resulting in a charge against earnings. Changes in interest rates can also have an adverse effect on our financial condition, as our available-for-sale securities are reported at their estimated fair value, and therefore are impacted by fluctuations in interest rates. Generally, the fair value of fixed-rate securities fluctuates inversely with changes in interest rates. Unrealized gains and losses on securities available-for-sale are reported as a separate component of AOCI, net of tax. Decreases in the fair value of securities available-for-sale resulting from increases in interest rates could have an adverse effect on shareholders’ equity. There can be no assurance that the declines in market value will not result in credit losses, which would lead to additional provision for credit losses that could have a material adverse effect on our net income and capital levels.
If our hedging against interest rate exposure is ineffective, it could result in volatility in our operating results, including potential losses, which could have a material adverse effect on our results of operations and cash flows.
We employ hedging techniques to mitigate the adverse impacts of rising interest rates on our loans held for sale and interest rate locks provided to customers. Our hedging strategies adapt to varying interest rate levels and market dynamics, utilizing tools such as forward contracts, put and call options on securities, and other mortgage-backed derivatives. However, hedging strategies are not perfect and may not fully shield us from potential losses. The effectiveness of interest rate hedging could be compromised due to several factors, including but not limited to the following:
| ● |
Hedging strategies might not entirely align with the specific interest rate risks they aim to mitigate. |
| ● |
The duration of the hedge may not match the underlying liability’s duration, impacting its effectiveness. |
| ● |
Risks arise from potential defaults or credit downgrades of counterparties involved in hedging transactions, impacting our ability to execute or assign our side of the hedge. |
| ● |
Changes in fair value adjustments mandated by accounting standards can affect the value of derivatives used for hedging, leading to mark-to-market losses. |
| ● |
Mark-to-market losses could reduce our stockholders’ equity. |
We may enter into derivative financial instruments such as interest rate swaps in order to mitigate our interest rate risks. These instruments expose us to several risks:
| ● |
Potential loss due to variations in the spread between the interest rate contract and the hedged item. |
| ● |
Risks related to the counterparty’s inability to fulfill obligations. |
| ● |
Exposure to fluctuations and uncertainties in underlying asset prices due to interest rates and market volatility. |
| ● |
Liquidity risk associated with the ease of buying or selling these instruments. |
Losses on interest rate hedging derivatives could adversely affect our business, financial condition and prospects, leading to decreased net income.
We designate interest rate swaps as effective cash flow hedges under Accounting Standards Codification ("ASC") 815, "Derivatives and Hedging." Regular evaluations measure hedge effectiveness and any ineffectiveness may result from factors such as debt early retirement or counterparty creditworthiness. Ineffective hedges could materially impact our operations and cash flows, causing volatility in our financial results. Additionally, changes in accounting standards related to these derivatives, particularly ASC 815, could significantly increase earnings volatility.
Risks Related to Accounting Matters
We may experience future goodwill impairment, which could reduce our earnings.
In accordance with GAAP, we record assets acquired and liabilities assumed in a business combination at their fair value with the excess of the purchase consideration over the net assets acquired resulting in the recognition of goodwill. As a result, acquisitions typically result in recording goodwill. We perform a goodwill evaluation at least annually to test for goodwill impairment. Our test of goodwill for potential impairment is based on a qualitative assessment by management that takes into consideration macroeconomic conditions, industry and market conditions, cost or margin factors, financial performance and share price. Our evaluation of the fair value of goodwill involves a substantial amount of judgment. If our judgment was incorrect, or if events or circumstances change, and an impairment of goodwill was deemed to exist, we would be required to record a non-cash charge to earnings in our financial statements during the period in which such impairment is determined to exist. Any such charge could have a material adverse effect on our results of operations; however, it would have no impact on our liquidity, operations or regulatory capital.
Long-lived assets, such as purchased intangibles subject to amortization, are reviewed for impairment whenever events or changes in circumstances indicate that the carrying amount of an asset may not be recoverable. Recoverability of assets to be held and used is measured by a comparison of the carrying amount of an asset to estimated future cash flows expected to be generated by an asset. If the carrying amount of an asset exceeds its estimated future cash flows, an impairment charge is recognized by the amount by which the carrying amount of the asset exceeds the fair value of the asset. The Company had $3.6 million of goodwill at December 31, 2023.
The Company’s reported financial results depend on management’s selection of accounting methods and certain assumptions and estimates, which, if incorrect, could cause unexpected losses in the future.
The Company’s accounting policies and methods are fundamental to how the Company records and reports its financial condition and results of operations. The Company’s management must exercise judgment in selecting and applying many of these accounting policies and methods, so they comply with generally accepted accounting principles and reflect management’s judgment regarding the most appropriate manner to report the Company’s financial condition and results of operations. In some cases, management must select the accounting policy or method to apply from two or more alternatives, any of which might be reasonable under the circumstances, yet might result in the Company’s reporting materially different results than would have been reported under a different alternative.
Certain accounting policies are critical to presenting the Company’s financial condition and results of operations. They require management to make difficult, subjective or complex judgments about matters that are uncertain. Materially different amounts could be reported under different conditions or using different assumptions or estimates. These critical accounting policies include, but are not limited to, the ACL on loans, MSRs, derivative and hedging activity, fair value, income taxes, securities and unfunded commitments and acquisition accounting, including valuing assets and liabilities of an acquired company, including intangible assets such goodwill. Because of the uncertainty of estimates involved in these matters, the Company may be required to do one or more of the following: significantly increase the ALC and/or sustain credit losses that are significantly higher than the reserve provided or recognize significant losses on the impairment of goodwill.
For more information, refer to “Critical Accounting Estimates” included in Item 7. Management’s Discussion and Analysis of Financial Condition and Results of Operations of this Form 10–K.
Risk Related to Regulatory and Compliance Matters
We may become subject to supervisory actions and enhanced regulation that could have a material adverse effect on our business, reputation, operating flexibility and, financial condition.
Under federal and state laws and regulations pertaining to the safety and soundness of insured depository institutions, state banking regulators, the DFI, the Federal Reserve and separately the FDIC as the insurer of bank deposits, each has the authority to compel or restrict certain actions on our part if any of them determine that we have insufficient capital or are otherwise operating in a manner that may be deemed to be inconsistent with safe and sound banking practices. In addition to examinations for safety and soundness, we and our subsidiaries also are subject to examination by state and federal banking regulators, including the CFPB, for compliance with various laws and regulations, as well as consumer compliance initiatives. As a result of this regulatory oversight and examination process, our regulators may require us to enter into informal or formal supervisory agreements, including board resolutions, memoranda of understanding, written agreements, and consent or cease and desist orders, pursuant to which we could be required to take identified corrective actions to address cited concerns, or to refrain from taking certain actions.
If we become subject to and are unable to comply with the terms of any future regulatory actions or directives, supervisory agreements, or orders, then we could become subject to additional, heightened supervisory actions and orders, possibly including consent orders, prompt corrective action restrictions, and/or other regulatory actions, including prohibitions. If our regulators were to take such additional supervisory actions, then we could, among other things, become subject to significant restrictions on our ability to develop any new business, as well as restrictions on our existing business, The terms of any such supervisory action could have a material negative effect on our business, reputation and operating flexibility.
Climate change and related legislative and regulatory initiatives may materially affect the Company’s business and results of operations.
The effects of climate change continue to create an alarming level of concern for the state of the environment. As a result, the global business community has increased its political and social awareness surrounding the issue, and the United States has entered into international agreements in an attempt to reduce global temperatures, such as reentering the Paris Agreement. Further, the U.S. Congress, state legislatures and federal and state regulatory agencies continue to propose initiatives to supplement the global effort to combat climate change. Similar and even more expansive initiatives are expected under the current administration, including potentially increasing supervisory expectations with respect to banks’ risk management practices, accounting for the effects of climate change in stress testing scenarios and systemic risk assessments, revising expectations for credit portfolio concentrations based on climate-related factors and encouraging investment by banks in climate-related initiatives and lending to communities disproportionately impacted by the effects of climate change. The lack of empirical data surrounding the credit and other financial risks posed by climate change render it difficult, or even impossible, to predict how specifically climate change may impact our financial condition and results of operations; however, the physical effects of climate change may also directly impact us. Specifically, unpredictable and more frequent weather disasters may adversely impact the real property, and/or the value of the real property, securing the loans in our portfolios. Additionally, if insurance obtained by our borrowers is insufficient to cover any losses sustained to the collateral, or if insurance coverage is otherwise unavailable to our borrowers, the collateral securing our loans may be negatively impacted by climate change, natural disasters and related events, which could impact our financial condition and results of operations. Further, the effects of climate change may negatively impact regional and local economic activity, which could lead to an adverse effect on our customers and impact the communities in which we operate. Overall, climate change, its effects and the resulting, unknown impact could have a material adverse effect on our financial condition and results of operations.
Non-compliance with the USA PATRIOT Act, Bank Secrecy Act, or other laws and regulations could result in fines or sanctions.
The USA PATRIOT and Bank Secrecy Acts and related regulations require financial institutions to develop programs to prevent financial institutions from being used for money laundering and terrorist activities. Failure to comply with these regulations could result in fines or sanctions. While we have developed policies and procedures designed to assist in compliance with these laws and regulations, no assurance can be given that these policies and procedures will be effective in preventing violations of these laws and regulations. If our policies and procedures are deemed deficient, we would be subject to liability, including fines and regulatory actions, which may include restrictions on our ability to pay dividends and the denial of regulatory approvals to proceed with certain aspects of our business plan. Failure to maintain and implement adequate programs to combat money laundering and terrorist financing could also have serious reputational consequences for us. Any of these results could have a material adverse effect on our business, financial condition, results of operations, and growth prospects.
Risks Related to Cybersecurity, Third Parties and Technology
We rely on other companies to provide key components of our business infrastructure.
We rely on numerous external vendors to provide us with products and services necessary to maintain our day-to-day operations. Accordingly, our operations are exposed to risk that these vendors will not perform in accordance with the contracted arrangements under service level agreements. The failure of an external vendor to perform in accordance with the contracted arrangements under service level agreements because of changes in the vendor's organizational structure, financial condition, support for existing products and services or strategic focus or for any other reason, could be disruptive to our operations, which in turn could have a material negative impact on our financial condition and results of operations. We also could be adversely affected to the extent such an agreement is not renewed by the third-party vendor or is renewed on terms less favorable to us. Additionally, the bank regulatory agencies expect financial institutions to be responsible for all aspects of our vendors’ performance, including aspects which they delegate to third parties. Disruptions or failures in the physical infrastructure or operating systems that support our business and customers, or cyber-attacks or security breaches of the networks, systems or devices that our customers use to access our products and services could result in client attrition, regulatory fines, penalties or intervention, reputational damage, reimbursement or other compensation costs, and/or additional compliance costs, any of which could materially adversely affect our results of operations or financial condition.
We are subject to certain risks in connection with our use of technology.
Our security measures may not be sufficient to mitigate the risk of a cyber-attack. Communications and information systems are essential to the conduct of our business, as we use such systems to manage our customer relationships, our general ledger, and virtually all other aspects of our business. Our operations rely on the secure processing, storage, and transmission of confidential and other information in our computer systems and networks. Although we take protective measures and endeavor to modify them as circumstances warrant, the security of our computer systems, software, and networks may be vulnerable to breaches, fraudulent or unauthorized access, denial or degradation of service, attacks, misuse, computer viruses, malware, or other malicious code and cyber-attacks that could have a security impact. If one or more of these events occur, this could jeopardize our or our customers’ confidential and other information processed and stored in, and transmitted through, our computer systems and networks, or otherwise cause interruptions or malfunctions in our operations or the operations of our customers or counterparties. We may be required to expend significant additional resources to modify our protective measures or to investigate and remediate vulnerabilities or other exposures, and we may be subject to litigation and financial losses that are either not insured against or not fully covered through any insurance maintained by us. We could also suffer significant reputational damage.
Security breaches in our internet banking activities could further expose us to possible liability and damage our reputation. Increases in criminal activity levels and sophistication, advances in computer capabilities, vulnerabilities in third-party technologies (including browsers and operating systems), or other developments could result in a compromise or breach of the technology, processes and controls that we use to prevent fraudulent transactions, and to protect data about us, our customers, and underlying transactions. Any compromise of our security could deter customers from using our internet banking services that involve the transmission of confidential information. Although we have developed and continue to invest in systems and processes that are designed to detect and prevent security breaches and cyber-attacks and periodically test our security, these precautions may not protect our systems from compromises or breaches of our security measures, and could result in losses to us or our customers, our loss of business and/or customers, damage to our reputation, the incurrence of additional expenses, disruption to our business, our inability to grow our online services, or other businesses, additional regulatory scrutiny or penalties, or our exposure to civil litigation and possible financial liability, any of which could have a material adverse effect on our business, financial condition and results of operations.
Our security measures may not protect us from system failures or interruptions. While we have established policies and procedures to prevent or limit the impact of systems failures and interruptions, there can be no assurance that such events will not occur or that they will be adequately addressed if they do. In addition, we outsource certain aspects of our data processing and other operational functions to certain third-party providers. While we select third-party vendors carefully, we do not control their actions. If our third-party providers encounter difficulties including those resulting from breakdowns or other disruptions in communication services provided by a vendor, failure of a vendor to handle current or higher transaction volumes, cyber-attacks and security breaches or if we otherwise have difficulty in communicating with them, our ability to adequately process and account for transactions could be affected, and our ability to deliver products and services to our customers and otherwise conduct business operations could be adversely impacted. Replacing these third-party vendors could also entail significant delay and expense. Threats to information security also exist in the processing of customer information through various other vendors and their personnel.
We cannot assure you that such breaches, failures or interruptions will not occur or, if they do occur, that they will be adequately addressed by us or the third parties on which we rely. We may not be insured against all types of losses as a result of third-party failures and insurance coverage may be inadequate to cover all losses resulting from breaches, system failures, or other disruptions. If any of our third-party service providers experience financial, operational, or technological difficulties, or if there is any other disruption in our relationships with them, we may be required to identify alternative sources of such services, and we cannot assure you that we could negotiate terms that are as favorable to us, or could obtain services with similar functionality as found in our existing systems without the need to expend substantial resources, if at all. Further, the occurrence of any systems failure or interruption could damage our reputation and result in a loss of customers and business, could subject us to additional regulatory scrutiny, or could expose us to legal liability. Any of these occurrences could have a material adverse effect on our financial condition and results of operations.
We are subject to certain risks in connection with our data management or aggregation.
We are reliant on our ability to manage data and our ability to aggregate data in an accurate and timely manner to ensure effective risk reporting and management. Our ability to manage data and aggregate data may be limited by the effectiveness of our policies, programs, processes, and practices that govern how data is acquired, validated, stored, protected, and processed. While we continuously update our policies, programs, processes, and practices, many of our data management and aggregation processes are manual and subject to human error or system failure. Failure to manage data effectively and to aggregate data in an accurate and timely manner may limit our ability to manage current and emerging risks, as well as to manage changing business needs.
Risks Related to Our Business and Industry Generally
Ineffective liquidity management could adversely affect our financial results and condition.
Effective liquidity management is essential for the operation of our business. We require sufficient liquidity to meet customer loan requests, customer deposit maturities/withdrawals, payments on our debt obligations as they come due, and other cash commitments under both normal operating conditions and other unpredictable circumstances causing industry or general financial market stress. Our access to funding sources in amounts adequate to finance our activities on terms that are acceptable to us could be impaired by factors that affect us specifically, or the financial services industry or economy generally. Factors that could detrimentally impact our access to liquidity sources include a downturn in the geographic markets in which our loans and operations are concentrated or difficult credit markets. Our access to deposits may also be affected by the liquidity needs of our depositors. In particular, a majority of our liabilities are checking accounts and other liquid deposits, which are payable on demand or upon several days’ notice, while by comparison, a substantial majority of our assets are loans, which cannot be called or sold in the same time frame. Although we have historically been able to replace maturing deposits and advances as necessary, we might not be able to replace such funds in the future, especially if a large number of our depositors seek to withdraw their accounts, regardless of the reason. A failure to maintain adequate liquidity could materially and adversely affect our business, results of operations, or financial condition. See “Item 7. Management’s Discussion and Analysis of Financial Condition and Results of Operations – Liquidity” of this Form 10–K.
Our growth or future losses may require us to raise additional capital in the future, but that capital may not be available when it is needed or the cost of that capital may be exceedingly high.
We are required by federal regulatory authorities to maintain adequate levels of capital to support our operations. At some point, we may need to raise additional capital or issue additional debt to support our growth or replenish future losses. Our ability to raise additional capital or issue additional debt depends on conditions in the capital markets, economic conditions, and a number of other factors, including investor perceptions regarding the banking industry, market conditions, and governmental activities, and on our financial condition and performance. Such borrowings or additional capital, if sought, may not be available to us or, if available, may not be on favorable terms.
Accordingly, we cannot make assurances that we will be able to raise additional capital or issue additional debt if needed on terms that are acceptable to us, or at all. If we cannot raise additional capital or issue additional debt when needed, our ability to further expand our operations could be materially impaired and our financial condition and liquidity could be materially and adversely affected.
In addition, any additional capital we obtain may dilute the interests of existing holders of our common stock. Further, if we are unable to raise additional capital when required by our bank regulators, we may be subject to adverse regulatory action.
The Company’s ability to pay dividends and make subordinated debt payments is subject to the ability of the Bank to make capital distributions to the Company.
The Company is a separate legal entity from its subsidiary and does not have significant operations of its own. The long-term ability of the Company to pay dividends to its stockholders and debt payments is based primarily upon the ability of the Bank to make capital distributions to the Company, and also on the availability of cash at the holding company level. The availability of dividends from the Bank is limited by the Bank’s earnings and capital, as well as various statutes and regulations. In the event, the Bank is unable to pay dividends to the Company, the Company may not be able to pay dividends on its common stock or make payments on its outstanding debt. Consequently, the inability to receive dividends from the Bank could adversely affect the Company’s financial condition, results of operations, and future prospects. At December 31, 2023, FS Bancorp had $9.1 million in unrestricted cash to support dividend and debt payments.
The markets in which the Company operates are subject to the risk of flooding, mudslides, and other natural disasters.
The Company’s offices are located in Washington and as of February 24, 2023, Oregon. Also, most of the real and personal properties securing the Company’s loans are located in either Washington or Oregon which areas are prone to flooding, mudslides, brush fires, earthquakes, and other natural disasters. In addition to possibly sustaining damage to its own properties, if there is a major flood, mudslide, brush fire, earthquake or other natural disaster, the Company faces the risk that many of the Company’s borrowers may experience uninsured property losses, or sustained job interruption and/or loss which may materially impair their ability to meet the terms of their loan obligations. Therefore, a major flood, mudslide, brush fire, earthquake or other natural disaster could have a material adverse effect on the Company’s business, financial condition, results of operations, and cash flows.
Increasing scrutiny and evolving expectations from customers, regulators, investors, and other stakeholders with respect to our environmental, social and governance practices may impose additional costs on us or expose us to new or additional risks.
Companies are facing increasing scrutiny from customers, regulators, investors, and other stakeholders related to their environmental, social and governance (“ESG”) practices and disclosure. Investor advocacy groups, investment funds and influential investors are also increasingly focused on these practices, especially as they relate to the environment, health and safety, diversity, labor conditions and human rights. Increased ESG related compliance costs could result in increases to our overall operational costs. Failure to adapt to or comply with regulatory requirements or investor or stakeholder expectations and standards could negatively impact our reputation, ability to do business with certain partners, and our stock price. New government regulations could also result in new or more stringent forms of ESG oversight and expanding mandatory and voluntary reporting, diligence, and disclosure.
Item 1B. Unresolved Staff Comments
None.
Risk Management Strategy
As a financial institution, cybersecurity presents significant risks. Accordingly, the protection of customer and business information is taken very seriously. Cybersecurity risk management is a component of the Company’s formal Information Security Program. The Information Security Program is incorporated into the Company’s Enterprise Risk Management Program, ensuring a holistic approach to risk prevention, detection, mitigation, and remediation of cybersecurity threats.
The Information Security Program is based on regulation and guidance established by agencies, including but not limited to, the Federal Financial Institutions Counsel (“FFIEC”) and the Federal Deposit Insurance Corporation (“FDIC”). The Information Security Program begins with risk assessment. At least annually, the Company’s Information Security team completes an information security risk assessment in accordance with regulatory guidance. While cyber threats are included in the overall information security risk assessment, a targeted cybersecurity risk assessment is also completed, utilizing the FFIEC Cybersecurity Assessment Tool (“FFIEC CAT”). The FFIEC CAT specifically assesses the maturity and effectiveness of the Bank’s cybersecurity programs. In addition to the FFIEC CAT, the Bank partners with internal and external auditors to conduct various assessments throughout the year to identify, manage, and mitigate cybersecurity risks. The assessments conducted include but are not limited to: vulnerability assessments, penetration testing, social engineering, and onsite security assessments. Risk assessments consider size and complexity, are formally documented, and adapt to changes in the technology and organizational environment. Management and the Board of Directors use risk assessment data to make informed risk management decisions based on a full understanding of the risks. Management and the Board also consider the results of these assessments when overseeing operations. A strong, high-level risk assessment process provides the foundation for more detailed assessments within the functional risk management areas, as well as improves policy and internal control decisions across the organization.
Information Security Risk Assessment
Information security controls result from an effective risk assessment process. The Company identifies, measures, controls, and monitors threats to avoid risks that threaten the safety and soundness of the organization. In accordance with the Gramm-Leach-Bliley Act (GLBA) and FDIC regulation 12 CFR Part 364 Appendix B III B, the objectives of the information security risk assessment include:
| ● |
Identifying reasonably foreseeable internal and external threats that could result in unauthorized disclosure, misuse, alteration, or destruction of customer information or customer information systems. |
| ● |
Assessing the likelihood and potential damage of these threats, taking into consideration the sensitivity of customer information. |
| ● |
Assessing the sufficiency of policies, procedures, customer information systems, and other arrangements in place to control risks. |
Cybersecurity Risk Assessment
Cybersecurity is an integral subset of information security and refers to anything intended to protect enterprises and individuals from intentional attacks, breaches, incidents, and consequences. The foundation of this protection begins with identifying the risk of these threats and assessing the controls in place to mitigate such risks. The Company has included cyber threats in its information security risk assessment in accordance with regulatory guidance and conducts a targeted cyber risk assessment using the FFIEC CAT. Utilizing the FFIEC CAT, the Company’s inherent risk profile is documented along with its maturity level and effectiveness in managing cyber risk.
Both the Information Security Risk Assessment and the FFIEC CAT results are presented to, and approved by, the Audit Committee of the Board of Directors at least annually.
Risk Management Plan
Once risk assessments are complete, a risk management plan is prepared to ensure controls are developed or enhanced to mitigate risks to acceptable levels. The Risk Management Plan is presented to, and approved by, the Audit Committee of the Board of Directors annually and progress on remediation activities is shared quarterly.
Information Security Program
| ● |
Vendor Management. The Company maintains a formally documented Vendor Management Program that includes an information security review of all new and existing third-party vendor relationships. The Vendor Management team ensures initial and ongoing due diligence is performed on all
third-
party relationships according to policy. Quarterly Vendor Management program updates are provided and the Policy is reviewed and approved annually by the Audit Committee of the Board of Directors.
|
| ● |
Implementation of a multi-faceted threat intelligence gathering process. The Information Security and Information Technology teams subscribe to several threat intelligence news feeds and regularly attend cybersecurity threat intelligence webinars, trainings, and peer groups. Information on threat gathering is included in a quarterly report to the Board of Directors. |
| ● |
Implementation of a multi-layered defense strategy to fortify information protection. Technical, physical, and administrative control redundancies are deployed to ensure multiple layers of protection are in place against cyber threats. Control design and operating effectiveness is tested regularly by independent audit firms and reported to senior management and the Audit Committee of the Board of Directors. |
| ● |
Comprehensive security awareness training and testing for all bank employees. Various communication strategies to communicate new and existing cybersecurity threats are used. Employees receive regular virtual and in-person security awareness training through simulated tests, online training courses, company communications, and in-person training and testing events. Training and testing efforts are included in the quarterly update to the Board of Directors. |
| ● |
Incident Response. A comprehensive Incident Response Plan has been developed and tested. The Plan contains information for employees to ensure they can recognize, investigate, communicate, prevent, and document an incident that threatens the confidentiality, integrity, or availability of information or systems. All incidents are reported to, and the Plan is reviewed and approved by, the Audit Committee of the Board of Directors. |
| ● |
Independent Audit and Testing. The Company’s Audit Department schedules and oversees a regular review of program design and effectiveness by independent third-party audit firms that specialize in technology and cybersecurity. Results are reported directly to senior management and the Audit Committee of the Board of Directors. |
| ● |
Remediation Tracking. Remediation and tracking sheets are developed for all audit and assessment results. Progress is monitored by the Audit Department and reported to the Audit Committee of the Board of Directors regularly. |
Governance
The Company’s Board of Directors provides active oversight of cybersecurity threats in accordance with the Board-approved Information Security Policy and Program. Direct oversight of the Program is delegated to the Audit Committee of the Board of Directors. The Audit Committee has an established risk appetite statement that defines the Company’s risk acceptance tolerance. The Audit Committee reviews and approves the Risk Appetite statement annually. The Audit Committee also plays a critical role in overseeing the Bank’s efforts to develop, implement, and maintain an effective Information Security Program. With direction and oversight by the Audit Committee, the Bank’s Chief Risk Officer (“CRO”) oversees the enterprise-wide risk management program, and the Chief Information Officer (“CIO”) is the Board-appointed Information Security Officer, responsible for the Information Security Program, including cybersecurity. The CRO and CIO report cybersecurity related matters directly to the Audit Committee.
The Information Security team, engaged in enterprise-wide cybersecurity strategy, policy, standards, architecture, and processes, ensures a complete approach to safeguarding the confidentiality, integrity, and availability of sensitive information. The Information Security team consists of experienced information security professionals and is led by the CIO. The CIO has more than 25 years of information technology and banking leadership experience and holds a Certified Information Systems Security Professional (“CISSP”) designation. Reporting to the CIO is the Information Security Manager who has more than 10 years of cybersecurity experience in the Financial Institution industry and possesses a master’s degree in information systems management with an emphasis in cybersecurity. Complementing the independent Information Security team, is the Information Technology (IT) team. The IT System Administration & Engineering Manager has over seven years financial institution technology experience and a master’s degree in information systems management with a cybersecurity management specialization and the Systems Support Manager has over 20 years of financial institution technology experience, ensuring technology operations occur with a security-focused mindset. In addition to experienced information security and information technology teams, the Company engages with industry experts for managed security services. This collaborative effort includes threat intelligence gathering, firewall management, intrusion detection system monitoring, intrusion prevention services, and security information and event management monitoring, ensuring round-the-clock protection.
The Vendor Management team ensures compliance with the organization’s Vendor Management Policy, including initial and ongoing due diligence of all third-party providers.
Risk assessments and risk management plans are developed, communicated, and tracked. Annually, the CIO presents the Information Security Risk Assessment to the IT Steering Committee and to the Audit Committee of the Board of Directors for review and approval. Quarterly, the CIO provides an Information Security Risk Management Plan status report to the Audit Committee and an Information/Cybersecurity Status report to the full Board of Directors. Reports encompass internal information and cybersecurity assessments, business continuity plans, disaster recovery measures, incident response planning and testing, patch management and vendor management program statuses, as well as internal self-audit results. The information security risk assessment and updates on projects aimed at fortifying information security systems and emerging cybersecurity threat insights are communicated to the Audit Committee, maintaining transparency, and ensuring informed decision-making. Annual review and approval of information security-related policies by the Audit Committee underscore our commitment to governance and regulatory compliance.
Audits and testing of program effectiveness are coordinated by the Company’s Senior Vice President of Audit who oversees the Audit Department and reports to the Audit Committee of the Board of Directors, independent of the technology and cybersecurity functions. The Audit Department utilizes independent third-party audit firms with technology and cybersecurity expertise. Results of all audits and independent assessments are delivered directly to senior management and the Audit Committee of the Board of Directors by the SVP of Audit.
The Information Security team serves as the Bank’s dedicated cybersecurity incident response team. Cybersecurity incident response is a sub-section of the Bank’s Incident Response Plan. The Information Security team handles the technical aspects of the Bank’s response to a cybersecurity incident. Escalation instructions are included in the Plan for engaging resources outside the Information Security team. The Board is notified immediately of cybersecurity incidents, as per the incident response instructions.
Cybersecurity Incidents
As of the reporting period, the Company has not experienced any material cybersecurity events or incidents. Although third-party service providers have encountered cybersecurity events or incidents, these occurrences have not resulted in a material impact on our systems, computing environments, or data.
At December 31, 2023, the Company maintained a headquarters office in Mountlake Terrace, Washington, an administrative office in Aberdeen, Washington, 27 full-service bank branches, and 13 loan production offices, with an aggregate net book value of $30.6 million. The Company owns its headquarters office, its administrative office and 20 of its 27 branch offices. The remaining branch offices and the seven stand-alone loan production offices are leased facilities. The lease terms for our branch and loan production offices are not individually material. The Company’s leases have remaining lease terms of three months to 6.5 years, some of which include options to extend the leases for up to five years. In the opinion of management, all properties are adequately covered by insurance, are in a good state of repair and are suitable for the Company’s needs. For additional information see “Note 6 – Premises and Equipment” of the Notes to Consolidated Financial Statements included in “Item 8. Financial Statements and Supplementary Data” of this Form 10–K.
The Company maintains depositor and borrower customer files on an on-line basis, utilizing a telecommunications network, portions of which are leased. The book value of all data processing and computer equipment utilized by the Company at December 31, 2023 was $1.6 million. Management has a business continuity plan in place with respect to the data processing system, as well as the Company’s operations as a whole.
Because of the nature of our activities, the Company is subject to various pending and threatened legal actions, which arise in the ordinary course of business. From time to time, subordination liens may create litigation which requires us to defend our lien rights. In the opinion of management, liabilities arising from these claims, if any, will not have a material effect on our financial position.
Item 4. Mine Safety Disclosures
Not applicable.
Item 5. Market for Registrant’s Common Equity, Related Stockholder Matters and Issuer Purchases of Equity Securities
The Company’s common stock is traded on The NASDAQ Stock Market LLC’s Global Market, under the symbol “FSBW.” At December 31, 2023, there were approximately 198 shareholders of record based upon securities position listings furnished to us by our transfer agent. This total does not reflect the number of persons or entities who hold stock in nominee or “street name” accounts with brokers.
1st Security Bank is a wholly-owned subsidiary of FS Bancorp. Under federal regulations, the dollar amount of dividends 1st Security Bank may pay to FS Bancorp depends upon its capital position and recent net income. Generally, if 1st Security Bank satisfies its regulatory capital requirements, it may make dividend payments up to the limits prescribed by state law and FDIC regulations. See “Item 1. Business – How We Are Regulated – Regulation of 1st Security Bank – Dividends” and “Regulation and Supervision of FS Bancorp – Restrictions on Dividends and Stock Repurchases.”
Our cash dividend policy is reviewed by management and the Board of Directors. Any dividends declared and paid in the future would depend upon a number of factors including capital requirements, the Company’s financial condition and results of operations, tax considerations, statutory and regulatory limitations, and general economic conditions. No assurances can be given that any dividends will be paid or that, if paid, will not be reduced or eliminated in future periods. Our future payment of dividends may depend, in part, upon receipt of dividends from the Bank, which are restricted by federal regulations. Management’s projections show an expectation that cash dividends will continue for the foreseeable future.
Issuer Purchases of Equity Securities. The following table summarizes common stock repurchases during the quarter ended December 31, 2023:
| Maximum |
||||||||||||||||
| Total Number |
Dollar Value of |
|||||||||||||||
| of Shares |
Shares that |
|||||||||||||||
| Average |
Repurchased as |
May Yet Be |
||||||||||||||
| Total Number |
Price |
Part of Publicly |
Repurchased |
|||||||||||||
| of Shares |
Paid per |
Announced |
Under the |
|||||||||||||
| Period |
Purchased |
Share |
Plan or Program |
Plan or Program |
||||||||||||
| October 1, 2023 - October 31, 2023 |
3,172 | $ | 28.99 | 3,172 | $ | 4,569,836 | ||||||||||
| November 1, 2023 - November 30, 2023 |
29,162 | 30.52 | 29,162 | 3,679,708 | ||||||||||||
| December 1, 2023 - December 31, 2023 |
— | — | — | — | ||||||||||||
| Total for the quarter |
32,334 | $ | 30.37 | 32,334 | $ | 3,679,708 | ||||||||||
On August 15, 2023, the Company publicly announced that its Board of Directors approved a stock repurchase program, authorizing the repurchase up to $5.0 million of Company common stock, representing approximately 2.5% of its outstanding shares as of that date. The repurchase may be executed, from time to time, in the open market, through privately negotiated transactions, or by withholding shares upon the exercise of equity awards, over a 12-month period until July 31, 2024. The actual timing, price, and number of shares repurchased under the program will depend on a number of factors, including constraints specified pursuant to any trading plan that may be adopted in accordance with Rule 10b5-1 of the Securities Exchange Act of 1934, as amended, price, general business and market conditions, and alternative investment opportunities. The share repurchase program does not obligate the Company to acquire any specific number of shares in any period, and may be expanded, extended, modified or discontinued at any time.
Equity Compensation Plan Information. The equity compensation plan information presented under subparagraph (d) in Part III, Item 12 of this report is incorporated herein by reference.
Performance Graph. The following graph compares the cumulative total shareholder return on the Company’s common stock with the cumulative total return on the NASDAQ S&P 500 Index (U.S. Stock) and S&P U.S. SmallCap Banks Index. Total return assumes the reinvestment of all dividends and that the value of common stock and bank index was $100 on December 31, 2018.
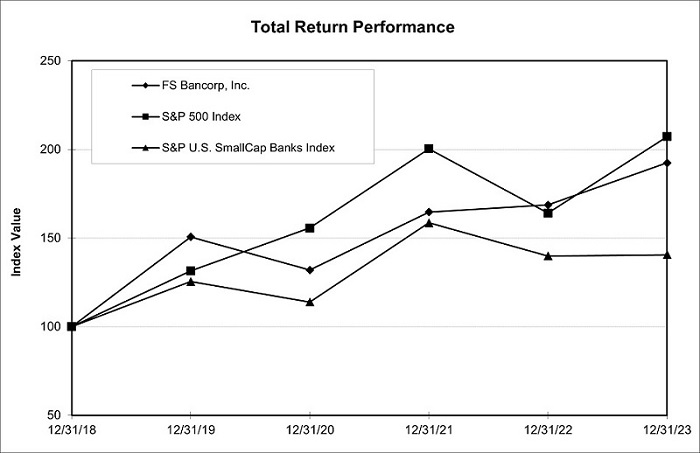
| Index |
12/31/18 |
12/31/19 |
12/31/20 |
12/31/21 |
12/31/22 |
12/31/23 |
||||||||||||||||||
| FS Bancorp, Inc. |
$ | 100.00 | $ | 150.66 | $ | 131.95 | $ | 164.65 | $ | 168.64 | $ | 192.43 | ||||||||||||
| S&P 500 Index |
100.00 | 131.49 | 155.68 | 200.37 | 164.08 | 207.21 | ||||||||||||||||||
| S&P U.S. SmallCap Banks Index |
100.00 | 125.46 | 113.94 | 158.62 | 139.85 | 140.55 | ||||||||||||||||||
Item 7. Management’s Discussion and Analysis of Financial Condition and Results of Operations
This discussion and analysis reviews our consolidated financial statements and other relevant statistical data and is intended to enhance your understanding of our financial condition and results of operations. The information in this section has been derived from the Consolidated Financial Statements and footnotes thereto that appear in Item 8. of this Form 10–K. The information contained in this section should be read in conjunction with these Consolidated Financial Statements and footnotes and the business and financial information provided in this Form 10–K.
FS Bancorp and its subsidiary bank, 1st Security Bank, have been serving the Puget Sound area since 1907. Originally chartered as a credit union, known as Washington’s Credit Union, the credit union served various select employment groups. On April 1, 2004, the credit union converted to a Washington state-chartered mutual savings bank. On July 9, 2012, the Bank converted from mutual to stock ownership and became the wholly owned subsidiary of FS Bancorp.
The Company is relationship-driven, delivering banking and financial services to local families, local and regional businesses and industry niches in suburban communities in the greater Puget Sound area, the Kennewick-Pasco-Richland metropolitan area of Washington, also known as the Tri-Cities, Goldendale, Vancouver, and White Salmon, Washington and Manzanita, Newport, Ontario, Tillamook, and Waldport, Oregon.
On February 24, 2023, the Company completed its purchase of seven retail bank branches from Columbia State Bank (the “Branch Acquisition”) and acquired approximately $425.5 million in deposits and $66.1 million in loans. The seven acquired branches are in the communities of Goldendale and White Salmon, Washington, and Manzanita, Newport, Ontario, Tillamook, and Waldport, Oregon. The Branch Acquisition expanded our Puget Sound-focused retail footprint into southeast Washington and the state of Oregon as well as providing an opportunity to extend our unique brand of community banking into those communities.
The Company also maintains its long-standing indirect consumer lending platform which operates primarily throughout the Western United States. The Company emphasizes long-term relationships with families and businesses within the communities served, working with them to meet their financial needs. The Company is also actively involved in community activities and events within these market areas, which further strengthens our relationships within those markets.
The Company's strategic focus involves diversifying revenues, expanding lending channels, and enhancing the banking franchise. Management is committed to establishing varied revenue streams considering credit, interest rate, and concentration risks. The business plan includes:
| ● |
Growing and diversifying our loan portfolio; |
| ● |
Maintaining strong asset quality; |
| ● |
Emphasizing lower cost core deposits to reduce the costs of funding our loan growth; |
| ● |
Capturing customers’ complete relationships through a broad array of products and services, leveraging community involvement, and selectively emphasizing offerings aligned with customers' banking needs; and |
| ● |
Expanding into new markets. |
As a diversified lender, the Company specializes in originating one-to-four-family loans, commercial real estate mortgages, second mortgages, consumer loans, marine lending, and commercial business loans. At December 31, 2023, the Company's loan portfolio included real estate loans, consumer loans, and commercial business loans representing 63.0%, 26.6%, and 10.5% of the total loan portfolio, respectively.
Fixture secured loans to finance window, gutter, siding replacement, solar panels, spas, and other improvement renovations are a large segment of the consumer loan portfolio. These fixture-secured consumer loans are dependent on the Company's contractor/dealer network of 114 active dealers located throughout Washington, Oregon, California, Idaho, Colorado, Nevada, Arizona, Minnesota, Texas, Utah, Massachusetts, Montana, and recently, New Hampshire. Five of these contractor/dealers were responsible for 65.9% of the dollar volume of funded loans for the year ended December 31, 2023. To address concentration risks, management has consolidated any dealers owned by the same corporate entity under that entity as of December 31, 2023, rather than treating them as separate dealers. The Company funded $205.3 million, or approximately 9,000 loans in the fixture-secured consumer loan category during the year ended December 31, 2023.
The following table details fixture secured loan originations by state for the periods indicated:
| (Dollars in thousands) |
For the Year Ended |
For the Year Ended |
||||||||||||||
| December 31, 2023 |
December 31, 2022 |
|||||||||||||||
| State |
Amount |
Percent |
Amount |
Percent |
||||||||||||
| Washington |
$ | 72,166 | 35.1 | % |
$ | 102,981 | 32.7 | % |
||||||||
| Oregon |
48,831 | 23.8 | 73,110 | 23.2 | ||||||||||||
| California |
34,219 | 16.7 | 59,175 | 18.8 | ||||||||||||
| Idaho |
13,787 | 6.7 | 22,744 | 7.2 | ||||||||||||
| Colorado |
7,442 | 3.6 | 14,584 | 4.6 | ||||||||||||
| Arizona |
5,846 | 2.8 | 5,029 | 1.6 | ||||||||||||
| Nevada |
4,697 | 2.3 | 4,869 | 1.5 | ||||||||||||
| Minnesota |
8,312 | 4.0 | 28,503 | 9.1 | ||||||||||||
| Texas |
1,685 | 0.8 | 572 | 0.2 | ||||||||||||
| Utah |
5,062 | 2.5 | 2,674 | 0.9 | ||||||||||||
| Massachusetts |
778 | 0.4 | 137 | — | ||||||||||||
| Montana |
2,200 | 1.1 | 577 | 0.2 | ||||||||||||
| New Hampshire |
322 | 0.2 | — | — | ||||||||||||
| Total fixture secured loans |
$ | 205,347 | 100.0 | % |
$ | 314,955 | 100.0 | % |
||||||||
The Company originates one-to-four-family residential mortgage loans through referrals from real estate agents, financial planners, builders, and from existing customers. Retail banking customers are also an important source of the Company’s loan originations. The Company originated $527.7 million of one-to-four-family loans (which included loans held for sale, loans held for investment and second lien mortgages classified as home equity loans) in addition to $15.9 million of loans brokered to other institutions through the home lending segment during the year ended December 31, 2023, of which $408.0 million were sold to investors. Of the loans sold to investors, $241.5 million were sold to the FNMA, FHLMC, FHLB, and/or GNMA with servicing rights retained for the purpose of further developing these customer relationships. At December 31, 2023, one-to-four-family residential mortgage loans held for investment totaled $567.7 million, or 23.3% of the total gross loan portfolio, while loans held for sale totaled $25.7 million and home equity loans totaled $69.5 million at that date.
For the year ended December 31, 2023, one-to-four-family loan originations and refinancing activity decreased as a result of increased market interest rates. Residential construction and development lending, while not as common as other loan origination options like one-to-four-family loans, continues to be an important element in our total loan portfolio, and we continue to take a disciplined approach by concentrating our efforts on loans to builders and developers in our market areas known to us. These short-term loans typically have a maturity period of six to 18 months, with disbursements not fully realized at origination, leading to a short-term reduction in net loans receivable.
The Company is significantly affected by prevailing economic conditions, as well as government policies and regulations concerning, among other things, monetary and fiscal affairs. Deposit flows are influenced by a number of factors, including interest rates paid on time deposits, other investments, account maturities, and the overall level of personal income and savings. Lending activities are influenced by the demand for funds, the number and quality of lenders, and regional economic cycles. Sources of funds for lending activities include primarily deposits, including brokered deposits, borrowings, payments on loans, and income provided from operations.
The Company’s earnings are primarily dependent upon net interest income, the difference between interest income and interest expense. Interest income is a function of the balances of loans and investments outstanding during a given period and the yield earned on these loans and investments. Interest expense is a function of the amount of deposits and borrowings outstanding during the same period and the interest rates paid on these deposits and borrowings.
The Company’s earnings are also affected by fee income from mortgage banking activities, the provision for (recovery of) credit losses, service charges and fees, gains from sales of assets, operating expenses and income taxes. Most notable of these factors, the Company recorded a provision for credit losses of $4.8 million for the year ended December 31, 2023, compared to $6.2 million for the same period one year ago. The decreased provision in the current year was primarily due to a decrease in net loan growth, particularly in consumer loans and an increase in recoveries of reserves for unfunded commitments.
We prepare our consolidated financial statements in accordance with GAAP. In doing so, we have to make estimates and assumptions. Our critical accounting estimates are those estimates that involve a significant level of uncertainty at the time the estimate was made, and changes in the estimate that are reasonably likely to occur from period to period, or use of different estimates that we reasonably could have used in the current period, would have a material impact on our financial condition or results of operations. Accordingly, actual results could differ materially from our estimates. We base our estimates on past experience and other assumptions that we believe are reasonable under the circumstances, and we evaluate these estimates on an ongoing basis. We have reviewed our critical accounting estimates with the audit committee of our Board of Directors. See Note 1 of the Notes to Consolidated Financial Statements included in Item 8 of this Annual Report on Form 10–K for a summary of significant accounting policies and the effect on our financial statements.
Allowance for Credit Losses on Held-to-Maturity Securities. Management measures expected credit losses on held-to-maturity securities by individual security. Accrued interest receivable on held-to-maturity debt securities is excluded from the estimate of credit losses. The estimate of expected credit losses considers credit ratings and historical credit loss information that is adjusted for current conditions and reasonable and supportable forecasts.
The held-to-maturity portfolio consists entirely of corporate securities. Securities are generally rated investment grade or higher. Securities are analyzed individually to establish a reserve.
Allowance for Credit Losses on Available-for-Sale Securities. For available-for-sale securities in an unrealized loss position, management first assesses whether it intends to sell, or is more likely than not to be required to sell, the security before recovery of its amortized cost basis. If either of the criteria regarding intent or requirement to sell is met, the security’s amortized cost basis is written down to fair value through income. For debt securities available-for-sale that do not meet the aforementioned criteria, the Company evaluates whether the decline in fair value has resulted from credit losses or other factors. In making this assessment, management considers the extent to which fair value is less than amortized cost, any changes to the rating of the security by a rating agency, and adverse conditions specifically related to the security, among other factors. If this assessment indicates that a credit loss exists, the present value of cash flows expected to be collected from the security are compared to the amortized cost basis of the security. If the present value of cash flows expected to be collected is less than the amortized cost basis, a credit loss exists and an ACL is recorded, limited by the amount that the fair value is less than the amortized cost basis.
Changes in the ACL are recorded as a provision for (reversal of) credit losses. Losses are charged against the ACL when management believes the uncollectability of an available-for-sale security is confirmed or when either of the criteria regarding intent or requirement to sell is met. Accrued interest receivable on available-for-sale debt securities is not included in the estimate of credit losses.
Allowance for Credit Losses on Loans. The ACL on loans is a valuation account that is deducted from the loans’ amortized cost basis to present the net amount expected to be collected on the loans. Loans are charged off against the ACL when management believes the uncollectability of a loan balance is confirmed and recoveries are credited to the ACL when received. In the case of recoveries, amounts may not exceed the aggregate of amounts previously charged off.
Management utilizes relevant available information, from internal and external sources, relating to past events, current conditions, historical loss experience, and reasonable and supportable forecasts. The lookback period in the analysis includes historical data from 2009 to present. Adjustments to historical loss information are made when management determines historical data is not likely reflective of the current portfolio such as limited data sets or lack of default or loss history. Management may selectively apply external market data to subjectively adjust the Company’s own loss history including index or peer data. Accrued interest receivable is excluded from the estimate of credit losses on loans.
The ACL on loans is measured on a collective cohort basis when similar risk characteristics exist. Generally, collectively assessed loans are grouped by call report code and then risk-grade grouping. Risk grade is grouped within each call report code by pass, watch, special mention, substandard, and doubtful. Other loan types are separated into their own cohorts due to specific risk characteristics for that pool of loans.
The Company has elected a non-discounted cash flow methodology with probability of default (“PD”) and loss given default (“LGD”) for all call report code cohorts (“cohorts”), except for the indirect and marine portfolios which are evaluated under a vintage methodology. The vintage methodology measures the expected loss calculation for future periods based on historical performance by the origination period of loans with similar life cycles and risk characteristics. Guaranteed portions of loans are measured with zero risk due to cash collateral and full guaranty.
The PD calculation looks at the historical loan portfolio at points in time (each month during the lookback period) to determine the probability that loans in a certain cohort will default over the next 12-month period. A default is defined as a loan that has moved to past due 90 days and greater, nonaccrual status, or experienced a charge-off during the period. In cohorts where the Company’s historical data is insufficient due to a minimal amount of default activity or zero defaults, management uses index PDs comprised of rates derived from the PD experience of other community banks in place of the Company’s historical PDs. Additionally, management reviews all other cohorts to determine if index PDs should be used outside of these criteria.
The LGD calculation looks at actual losses (net charge-offs) experienced over the entire lookback period for each cohort of loans. The aggregate loss amount is divided by the exposure at default to determine an LGD rate. All loan defaults (non-accrual, charge-off, or greater than 90 days past due) occurring during the lookback period are included in the denominator, whether a loss occurred or not and exposure at default is determined by the loan balance immediately preceding the default event (i.e., nonaccrual or charge-off). Due to limited charge-off history, management uses index LGDs comprised of rates derived from the LGD experience of other community banks in place of the Company’s historical LGDs.
The Company utilizes reasonable and supportable forecasts of future economic conditions when estimating the ACL on loans. The calculation includes a 12-month PD forecast based on the Company’s regression model comparing peer nonperforming loan ratios to the national unemployment rate. After the forecast period, PD rates revert on a straight-line basis back to long-term historical average rates over a 12-month period. Due to limited default history, management uses index PDs comprised of rates derived from the PD experience of other community banks in place of the Company’s historical PDs.
The Company recognizes that all significant factors that affect the collectability of the loan portfolio must be considered to determine the estimated credit losses as of the evaluation date. Furthermore, the methodology, in and of itself and even when selectively adjusted by comparison to market and peer data, does not provide a sufficient basis to determine the estimated credit losses. The Company adjusts the modeled historical losses by qualitative and environmental adjustments to incorporate all significant risks to form a sufficient basis to estimate the credit losses.
Loans classified as nonaccrual, are reviewed quarterly for potential individual assessment. Any loan classified as a nonaccrual that is not determined to need individual assessment is evaluated collectively within its respective cohort.
Where the primary and/or expected source of repayment of a specific loan is believed to be the future liquidation of available collateral, impairment will generally be measured based upon expected future collateral proceeds, net of disposition expenses including sales commissions as well as other costs potentially necessary to sell the asset(s) (i.e., past due taxes, liens, etc.). Estimates of future collateral proceeds will be based upon available appraisals, reference to recent valuations of comparable properties, use of consultants or other professionals with relevant market and/or property-specific knowledge, and any other sources of information believed appropriate by management under the specific circumstances. When appraisals are ordered to support the impairment analysis of an impaired loan, the appraisal is reviewed by the Company’s internal appraisal reviewer.
Where the primary and/or expected source of repayment of a specific loan is believed to be the receipt of principal and interest payments from the borrower and/or the refinancing of the loan by another creditor, impairment will generally be measured based upon the present value of expected proceeds discounted at the contractual interest rate. Expected refinancing proceeds may be estimated from review of term sheets received by the borrower from other creditors and/or from the Company’s knowledge of terms generally available from other banks.
Expected credit losses are estimated over the contractual term of the loans, adjusted for expected prepayments when appropriate. The contractual term excludes expected extensions, renewals and modifications. Prepayment assumptions will be determined by analysis of historical behavior by loan cohort.
Allowance for Credit Losses on Unfunded Commitments. The Company estimates expected credit losses over the contractual period in which the Company is exposed to credit risk via a contractual obligation to extend credit unless that obligation is unconditionally cancellable by the Company. The ACL on unfunded commitments is adjusted through a provision for (recovery of) credit losses. The estimate includes consideration of the likelihood that funding will occur and an estimate of expected credit losses on commitments expected to be funded over its estimated life. The estimate utilizes the same factors and assumptions as the ACL on loans and is applied at the same collective cohort level.
Business Combinations and Goodwill. Pursuant to applicable accounting guidance, the Company recognizes assets acquired, including identified intangible assets, and liabilities assumed in acquisitions at their fair values as of the acquisition date. Transaction costs related to the acquisition are expensed in the period incurred. The determination of fair values involves estimates based on internal or third-party valuations, including appraisals, discounted cash flow analysis, and other techniques incorporating factors such as attrition, inflation, asset growth rates, discount rates, credit risk, and multiples of earnings. The determination of fair value may require us to make point-in-time estimates about discount rates, future expected cash flows, market conditions, and other future events that can be volatile in nature and challenging to assess. While we use the best estimates and assumptions to accurately value assets acquired and liabilities assumed at the acquisition date, the estimates are inherently uncertain and subject to refinement.
In whole bank or bank branch acquisitions, the primary identifiable intangible asset recorded is the value of core deposit intangibles, representing the estimated value of long-term deposit relationships acquired. The determination involves assumptions and estimates, typically determined through discounted cash flow analysis, considering customer attrition/runoff, alternative funding costs, deposit servicing costs, and discount rates. Amortization of core deposit intangibles occurs over estimated useful lives reviewed periodically for reasonableness. These estimated useful lives, typically ranging from seven to 10 years with an accelerated rate of amortization, are periodically reviewed for reasonableness. Identifiable intangible assets, including core deposit intangibles, are assessed for impairment when events or changes suggest the carrying value may not be recoverable. The Company's policy dictates recognition of an impairment loss equal to the difference between the asset’s carrying amount and fair value if the expected undiscounted future cash flows are less than the carrying amount. Estimating future cash flows involves multiple estimates and assumptions, as previously mentioned.
The ACL on purchase credit deteriorated (“PCD”) assets is recognized within business combination accounting with no initial impact to net income. Subsequent changes in estimates of expected credit losses on PCD loans are recognized through a provision for (reversal of) credit losses in subsequent periods as they arise. The ACL on non-PCD assets is recognized as provision expense in the same reporting period as the business combination. Estimated loan losses for acquired loans are determined using methodologies and applying estimates and assumptions that were described previously in the section above entitled, “Allowance for Credit Losses on Loans.”
Non-PCD loans acquired are generally estimated at fair value using a discounted cash flow approach with differences from contractual unpaid principal balances referred to as “discounts.” These discounts are accreted to interest income over the loans' estimated remaining lives.
Similar adjustments are made for premiums or discounts on acquired debt impacting interest expense over their remaining lives. Actual accretion or amortization may differ materially from our estimates impacting our operating results.
Goodwill arising from business combinations represents the excess of the purchase price over the sum of the estimated fair values of the tangible and identifiable intangible assets acquired less the estimated fair value of the liabilities assumed. Goodwill has an indefinite useful life and is evaluated for impairment annually or more frequently if events and circumstances indicate that the asset might be impaired. An impairment loss is recognized to the extent that the carrying amount exceeds the asset’s fair value. Accounting for goodwill also involves a higher degree of judgment than most other significant accounting policies. ASC 350–10 establishes standards for an impairment assessment of goodwill.
The initial recognition of goodwill and other intangible assets, along with subsequent analyses, necessitates subjective judgments from management. These judgements involve estimating how acquired assets will perform in the future using valuation methods including discounted cash flow analysis. Additionally, the challenge arises as estimated cash flows may extend beyond 10 years, making them difficult to determine over an extended timeframe. Significant events and factors influencing these estimates include competitive forces, customer behaviors, attrition, changes in revenue growth trends, cost structures, technology, alterations in discount rates, and specific industry and market conditions. To validate assumptions in its estimates, the Company reviews the historical performance of underlying or similar assets, ensuring the reasonableness of cash flow estimates.
The Company’s annual assessment of potential goodwill impairment was completed during the fourth quarter of 2023. Based on the results of this assessment, no goodwill impairment was recognized. Because of current economic conditions the Company continues to monitor goodwill and other intangible assets for impairment indicators throughout the year.
On an on-going basis, the Company evaluates its estimates. The Company bases its estimates on historical experience and on various other assumptions that are believed to be reasonable under the circumstances, the results of which form the basis for making judgments about the carrying values of assets and liabilities that are not readily apparent from other sources. Actual results may differ from these estimates under different assumptions or conditions. The Company’s policies related to these estimates can be found in “Note 1 – Basis of Presentation and Summary of Significant Accounting Policies” of the Notes to the Consolidated Financial Statements included in “Item 8. Financial Statements and Supplementary Data” of this Form 10–K. The Company’s accounting policies are discussed in detail in “Note 1 – Basis of Presentation and Summary” of the Notes to Consolidated Financial Statements included in “Item 8. Financial Statements and Supplementary Data” of this Form 10–K.
Our Business and Operating Strategy and Goals
The Company’s primary objective is to operate 1st Security Bank as a well-capitalized, profitable, independent, community-oriented financial institution, serving customers in its primary market area defined generally as the greater Puget Sound market area. The Company’s strategy is to provide innovative products and superior customer service to small businesses, industry and geographic niches, and individuals located in its primary market area. Services are currently provided to communities through the main office, 27 full-service bank branches and seven stand-alone loan production offices, which are supported with 24/7 access to on-line banking and participation in a worldwide ATM network.
The Company focuses on diversifying revenues, expanding lending channels, and growing the banking franchise. Management remains focused on building diversified revenue streams based upon credit, interest rate, and concentration risks. The Board of Directors seeks to accomplish the Company’s objectives through the adoption of a strategy designed to improve profitability and maintain a strong capital position and high asset quality. This strategy primarily involves:
Growing and diversifying the loan portfolio and revenue streams. The Company is a diversified lender that seeks to grow and maintain the current level of diversification in its portfolio. At December 31, 2023, the Company's loan portfolio included real estate loans, consumer loans, and commercial business loans representing 63.0%, 26.5%, and 10.5% of the total loan portfolio, respectively.
Maintaining strong asset quality. The Company believes that strong asset quality is a key to long-term financial success. The percentage of nonperforming loans to total gross loans were 0.45% and 0.39% at December 31, 2023 and 2022, respectively. The percentage of nonperforming assets to total assets were 0.37% and 0.35% at December 31, 2023 and 2022, respectively. Management actively addresses delinquent loans and nonperforming assets by pursuing aggressive collection efforts for consumer debts, marketing saleable foreclosed or repossessed properties, working on classified assets' resolutions and implementing loan charge-offs. In recent years, the Company focused on originating consumer loans for borrowers with higher credit scores, generally, over 720 while maintaining flexibility with its policy. While the Company plans to emphasize specific lending products, including commercial and multi-family real estate loans, construction and development loans (including speculative residential construction loans), and commercial business loans, it remains committed to expanding the size of its one-to-four-family residential mortgage loans and consumer loan portfolios. Throughout these initiatives, the Company maintains a conservative approach to lending and manages credit exposures by leveraging the expertise of experienced bankers.
Emphasizing lower cost core deposits to reduce the costs of funding loan growth. The Company provides a range of financial products, including personal and business checking accounts, NOW accounts, and savings and money market accounts. These accounts serve as lower-cost funding sources compared to certificates of deposit and are less sensitive to interest rate fluctuations. The Company employs several strategies to build a core deposit base. First, it actively encourages commercial loan customers to establish and maintain deposit relationships typically through business checking accounts. Second, periodic interest rate promotions are offered on savings and checking accounts to stimulate deposit growth. Third, the Company hires experienced personnel with established community relationships in the areas it serves to further enhance its deposit-building efforts.
Capturing customers’ full relationship. The Company offers a wide range of products and services that provide diversification of revenue sources and solidify the relationship with the Bank’s customers. The Company focuses on core retail and business deposits, including savings and checking accounts, that lead to long-term customer retention. As part of the commercial lending process, cross-selling the entire business banking relationship, including deposit relationships and business banking products, such as online cash management, treasury management, wires, direct deposit, payment processing and remote deposit capture. The Company’s mortgage banking program also provides opportunities to cross-sell products to new customers.
Expanding the Company’s markets. In addition to deepening relationships with existing customers, the Company intends to broaden its customer base by leveraging the Company’s well-established community involvement. This strategy involves selectively emphasizing products and services tailored to meet the specific banking needs of new customers. Additionally, the Company plans to extend its presence into other market areas through targeted expansion of its home lending network.
Comparison of Financial Condition at December 31, 2023 and December 31, 2022
Assets. Total assets increased $339.8 million, to $2.97 billion at December 31, 2023, from $2.63 billion at December 31, 2022. The increase was primarily due to increases in loans receivable, net of $210.6 million, securities available-for-sale of $63.7 million, total cash and cash equivalents of $24.3 million, certificates of deposit at other financial institutions of $19.5 million, and core deposit intangible of $14.0 million. The Company also transferred $8.1 million of residential MSRs to held for sale during the fourth quarter of 2023. The increase in total assets was primarily funded by deposit growth during the year ended December 31, 2023.
Loans receivable, net, increased $210.6 million, to $2.40 billion at December 31, 2023, from $2.19 billion at December 31, 2022. Total real estate loans increased $109.1 million, with increases in one-to-four-family portfolio loans of $98.3 million, commercial real estate loans of $32.3 million, home equity loans of $14.1 million, and multi-family loans of $4.0 million, offset by a decrease in construction and development loans of $39.5 million. Undisbursed construction and development loan commitments decreased $47.1 million, or 23.3%, to $154.6 million at December 31, 2023, as compared to $201.7 million at December 31, 2022. Consumer loans increased $77.2 million, primarily due to increases of $74.0 million in indirect home improvement loans and $2.7 million in marine loans. Additionally, commercial business loans increased $27.9 million due to an increase in commercial and industrial loans of $41.5 million, partially offset by a decrease in warehouse lending of $13.6 million due to higher residential mortgage interest rates and reduced refinance activity.
Loans held for sale, consisting of one-to-four-family loans, increased by $5.6 million, or 27.7%, to $25.7 million at December 31, 2023, compared to $20.1 million at December 31, 2022. The Company continues to invest in its home lending operations and strategically adds production staff in the markets we serve.
One-to-four-family loan originations for the year ended December 31, 2023, included $377.1 million of loans originated for sale, $150.5 million of portfolio loans including first and second liens, and $15.9 million of loans brokered to other institutions.
Originations of one-to-four-family loans to purchase and to refinance a home for the periods indicated were as follows:
| (Dollars in thousands) |
For the Year Ended December 31, |
|||||||||||||||||||||||
| 2023 |
2022 |
|||||||||||||||||||||||
| Amount |
Percent |
Amount |
Percent |
$ Change |
% Change |
|||||||||||||||||||
| Purchase |
$ | 497,669 | 91.6 | % | $ | 664,361 | 80.2 | % | $ | (166,692 | ) | (25.1 | )% | |||||||||||
| Refinance |
45,925 | 8.4 | 164,380 | 19.8 | (118,455 | ) | (72.1 | ) | ||||||||||||||||
| Total |
$ | 543,594 | 100.0 | % | $ | 828,741 | 100.0 | % | $ | (285,147 | ) | (34.4 | )% | |||||||||||
During the year ended December 31, 2023, the Company sold $408.0 million of one-to-four-family loans, compared to $715.6 million one year ago. The decrease in loan purchase and refinance activity, as well as sales activity, compared to the prior year reflects the impact of higher interest rates. The cash margin on loans sold, net of deferred fees and capitalized expenses, increased to 1.59% for the year ended December 31, 2023, compared to 1.39% for the year ended December 31, 2022. Margin reported is based on actual loans sold into the secondary market and the related value of capitalized servicing, partially offset by recognized deferred loans fees and capitalized expenses. The gross cash margins on loans sold, were 3.07% and 2.78% for the years ended December 31, 2023 and 2022, respectively. Gross cash margins on loans sold is defined as the margin on loans sold without the impact of deferred loan costs.
The ACL on loans was $31.5 million, or 1.30% of gross loans receivable, excluding loans held for sale at December 31, 2023, compared to $28.0 million, or 1.26% of gross loans receivable, excluding loans held for sale, at December 31, 2022. The increase was primarily due to organic loan growth, increases in nonperforming loans, and the addition of loans acquired in the Branch Acquisition. The ACL - unfunded loan commitments decreased $1.0 million to $1.5 million at December 31, 2023, from $2.5 million at December 31, 2022, primarily due to a decrease in unfunded construction loan commitments.
At December 31, 2023, loans classified as substandard or worse increased to $24.9 million, consisting of $24.5 million classified as substandard and $399,000 as doubtful, compared to $20.2 million at December 31, 2022, all of which loans were classified as substandard. This increase in substandard loans was primarily due to increases of $4.7 million in construction and development loans and $787,000 in indirect home improvement loans, partially offset by a decrease of $1.5 million in commercial and industrial loans.
Nonperforming loans, consisting solely of nonaccrual loans, increased $2.3 million to $11.0 million at December 31, 2023, from $8.7 million at December 31, 2022. This increase was primarily due to a $4.7 million increase in nonaccrual construction and development loans, a $1.1 million increase in nonaccrual commercial real estate loans, and a $787,000 increase in nonaccrual indirect home improvement loans, partially offset by a $3.7 million decrease in nonaccrual commercial business loans and an $842,000 decrease in nonaccrual one-to-four family loans. These increases and decreases were largely due to the payment performance on a few loans. At December 31, 2023, nonperforming loans consisted of $4.7 million in construction and development loans, $2.7 million in commercial business loans, $1.9 million in indirect home improvement loans, $1.1 million in commercial real estate loans, $342,000 in marine loans, $173,000 of home equity loans, $96,000 in one-to-four-family loans, and $8,000 in other consumer loans. The ratio of nonperforming loans to total gross loans was 0.45% at December 31, 2023, compared to 0.39% at December 31, 2022. There were no OREO properties at December 31, 2023, and one OREO property totaling $570,000 at December 31, 2022. See “Item 1. Business – Lending Activities – Asset Quality” of this Form 10–K for additional information regarding the Company’s nonperforming loans.
Liabilities. Total liabilities increased $307.0 million to $2.71 billion at December 31, 2022, from $2.40 billion at December 31, 2022, primarily due to $394.6 million in deposits, partially offset by a $92.8 million decrease in borrowings.
Total deposits increased $394.6 million to $2.52 billion at December 31, 2023, from $2.13 billion at December 31, 2022, primarily as a result of the Branch Acquisition in which we acquired approximately $425.5 million in deposits. CDs increased $367.0 million to $1.10 billion at December 31, 2023, from $729.8 million at December 31, 2022. Transactional accounts (noninterest-bearing checking, interest-bearing checking, and escrow accounts) increased $225.6 million to $914.9 million at December 31, 2023, from $689.3 million at December 31, 2022, due to increases of $116.1 million in noninterest-bearing checking, $108.9 million in interest-bearing checking and $547,000 in escrow accounts (also noninterest bearing) related to mortgages serviced. Money market and savings accounts decreased $198.0 million, to $510.7 million at December 31, 2023, from $708.6 million at December 31, 2022 as depositors shifted to higher yielding CDs and other investment alternatives.
Deposits are summarized as follows at the years indicated:
| (Dollars in thousands) |
December 31, |
|||||||
| 2023 |
2022 |
|||||||
| Noninterest-bearing checking |
$ | 654,048 | $ | 537,938 | ||||
| Interest-bearing checking (1) |
244,028 | 135,127 | ||||||
| Savings |
151,630 | 134,358 | ||||||
| Money market (2) |
359,063 | 574,290 | ||||||
| Certificates of deposit less than $100,000 (3) |
587,858 | 440,785 | ||||||
| Certificates of deposit of $100,000 through $250,000 |
429,373 | 195,447 | ||||||
| Certificates of deposit of $250,000 and over (4) |
79,540 | 93,560 | ||||||
| Escrow accounts related to mortgages serviced |
16,783 | 16,236 | ||||||
| Total |
$ | 2,522,323 | $ | 2,127,741 | ||||
_______________________________
| (1) |
Includes $70.2 million and $2.3 million of brokered deposits at December 31, 2023 and December 31, 2022, respectively. |
| (2) |
Includes $1,000 and $59.7 million of brokered deposits at December 31, 2023 and December 31, 2022, respectively. |
| (3) |
Includes $361.3 million and $332.0 million of brokered CDs at December 31, 2023 and December 31, 2022, respectively. |
| (4) |
CDs that meet or exceed the FDIC insurance limit. |
The Bank had uninsured deposits of approximately $606.5 million or 24.0% of total deposits, at December 31, 2023, compared to approximately $560.0 million or 26.3% of total deposits at December 31, 2022. The uninsured amounts are estimates based on the methodologies and assumptions used for the Bank’s regulatory reporting requirements.
At December 31, 2023, borrowings totaled $93.7 million and were comprised of the FRB borrowings from the BTFP of $89.9 million and FHLB fixed-rate advances of $3.9 million. Borrowings decreased $92.8 million to $93.7 million at December 31, 2023, from $186.5 million of FHLB advances at December 31, 2022. The decrease was partially attributable to a shift in funding mix from overnight borrowings to wholesale brokered CDs, as well as liquidity from the Branch Acquisition utilized to pay down borrowings and brokered deposits.
Stockholders’ Equity. Total stockholders’ equity increased $32.8 million to $264.5 million at December 31, 2023, from $231.7 million at December 31, 2022. The increase in stockholders’ equity was primarily due to net income of $36.1 million earned during 2023, partially offset by cash dividends paid during the year of $7.8 million. In addition, stockholders' equity was positively impacted by unrealized gains on fair value and cash flow hedges of $3.0 million, net of tax, and unrealized net gains in securities available-for-sale of $5.3 million, net of tax, reflecting changes in market interest rates during the period, resulting in a $2.3 million increase in accumulated other income.
Book value per common share was $34.36 at December 31, 2023, compared to $30.42 at December 31, 2022. The calculation of book value per share at December 31, 2023, was based on 7,698,401 common shares, derived by subtracting the 102,144 unvested restricted stock shares from the 7,800,545 reported common shares outstanding as of that date. Similarly, the book value per share at December 31, 2022, was calculated based on 7,617,655 common shares, obtained by subtracting the 118,530 unvested restricted stock shares from the 7,736,185 reported common shares outstanding as of that date.
Average Balances, Interest and Average Yields/Cost
The following table sets forth for the periods indicated, information regarding average balances of assets and liabilities, as well as the total dollar amounts of interest income from average interest-earning assets and interest expense on average interest-bearing liabilities, resultant yields, interest rate spread, net interest margin (otherwise known as net yield on interest-earning assets), and the ratio of average interest-earning assets to average interest-bearing liabilities. Also presented is the weighted average yield on interest-earning assets, rates paid on interest-bearing liabilities and the resultant spread at December 31, 2023. Income and all average balances are monthly average balances. Nonaccrual loans have been included in the table as loans carrying a zero yield. The yields on tax-exempt municipal bonds have not been computed on a tax equivalent basis.
| Year Ended December 31, |
|||||||||||||||||||||||||||||||||||||
| 2023 |
2022 |
2021 |
|||||||||||||||||||||||||||||||||||
| Average |
Interest |
Average |
Interest |
Average |
Interest |
||||||||||||||||||||||||||||||||
| Balance |
Earned |
Yield/ |
Balance |
Earned |
Yield/ |
Balance |
Earned |
Yield/ |
|||||||||||||||||||||||||||||
| (Dollars in thousands) |
Outstanding |
Paid |
Rate |
Outstanding |
Paid |
Rate |
Outstanding |
Paid |
Rate |
||||||||||||||||||||||||||||
| Interest-earning assets: |
|||||||||||||||||||||||||||||||||||||
| Loans receivable, net and loans held for sale (1) (2) |
$ | 2,384,577 | $ | 154,945 | 6.50 | % |
$ | 2,014,017 | $ | 111,648 | 5.54 | % |
$ | 1,762,832 | $ | 90,737 | 5.15 | % |
|||||||||||||||||||
| Taxable mortgage-backed securities |
93,661 | 1,596 | 1.70 | 86,626 | 1,842 | 2.13 | 75,493 | 1,690 | 2.24 | ||||||||||||||||||||||||||||
| Taxable AFS investment securities |
65,704 | 4,578 | 6.97 | 60,729 | 1,431 | 2.36 | 56,063 | 1,152 | 2.05 | ||||||||||||||||||||||||||||
| Tax-exempt AFS investment securities |
128,787 | 2,503 | 1.94 | 130,744 | 2,488 | 1.90 | 97,471 | 1,733 | 1.78 | ||||||||||||||||||||||||||||
| Taxable HTM Investment securities |
8,500 | 430 | 5.06 | 8,084 | 409 | 5.06 | 7,500 | 380 | 5.07 | ||||||||||||||||||||||||||||
| FHLB stock |
4,740 | 245 | 5.17 | 7,231 | 401 | 5.55 | 5,494 | 256 | 4.66 | ||||||||||||||||||||||||||||
| Interest-bearing deposits at other financial institutions |
67,063 | 2,895 | 4.32 | 32,689 | 475 | 1.45 | 93,435 | 426 | 0.46 | ||||||||||||||||||||||||||||
| Total interest-earning assets |
2,753,032 | 167,192 | 6.07 | 2,340,120 | 118,694 | 5.07 | 2,098,288 | 96,374 | 4.59 | ||||||||||||||||||||||||||||
| Interest-bearing liabilities: |
|||||||||||||||||||||||||||||||||||||
| Savings and money market |
612,430 | 5,511 | 0.90 | 781,763 | 3,775 | 0.48 | 661,199 | 1,604 | 0.24 | ||||||||||||||||||||||||||||
| Interest-bearing checking |
189,107 | 2,586 | 1.37 | 176,204 | 495 | 0.28 | 203,230 | 282 | 0.14 | ||||||||||||||||||||||||||||
| Certificates of deposit |
930,805 | 28,654 | 3.08 | 459,594 | 5,150 | 1.12 | 464,921 | 5,043 | 1.08 | ||||||||||||||||||||||||||||
| Borrowings |
110,328 | 5,196 | 4.71 | 102,571 | 3,052 | 2.98 | 63,128 | 1,074 | 1.70 | ||||||||||||||||||||||||||||
| Subordinated note |
49,492 | 1,942 | 3.92 | 49,425 | 1,942 | 3.93 | 44,160 | 1,722 | 3.90 | ||||||||||||||||||||||||||||
| Total interest-bearing liabilities |
1,892,162 | 43,889 | 2.32 | % |
1,569,557 | 14,414 | 0.92 | % |
1,436,638 | 9,725 | 0.68 | % |
|||||||||||||||||||||||||
| Net interest income |
$ | 123,303 | $ | 104,280 | $ | 86,649 | |||||||||||||||||||||||||||||||
| Net interest rate spread |
3.75 | % |
4.15 | % |
3.91 | % |
|||||||||||||||||||||||||||||||
| Net earning assets |
$ | 860,870 | $ | 770,563 | $ | 661,650 | |||||||||||||||||||||||||||||||
| Net interest margin |
4.48 | % | 4.46 | % | 4.13 | % | |||||||||||||||||||||||||||||||
| Average interest-earning assets to average interest-bearing liabilities |
145.50 | % | 149.09 | % | 146.06 | % | |||||||||||||||||||||||||||||||
____________________________
| (1) |
The average loans receivable, net balances include nonaccrual loans, which carry a zero yield. |
| (2) |
Includes net deferred fee recognition of $6.0 million, $8.3 million and $9.4 million for the years ended December 31, 2023, 2022, 2021, respectively. |
The following table presents the dollar amount of changes in interest income and interest expense for major components of interest-earning assets and interest-bearing liabilities for the periods indicated. It distinguishes between the changes related to outstanding balances and that due to the changes in interest rates. For each category of interest-earning assets and interest-bearing liabilities, information is provided on changes attributable to (i) changes in volume (i.e., changes in volume multiplied by old rate) and (ii) changes in rate (i.e., changes in rate multiplied by old volume). For purposes of this table, changes attributable to both rate and volume, which cannot be segregated, have been allocated proportionately to the change due to volume and the change due to rate.
| Year Ended December 31, 2023 vs. 2022 |
Year Ended December 31, 2022 vs. 2021 |
|||||||||||||||||||||||
| Increase (Decrease) Due to |
Total Increase |
Increase (Decrease) Due to |
Total Increase |
|||||||||||||||||||||
| (Dollars in thousands) |
Volume |
Rate |
(Decrease) |
Volume |
Rate |
(Decrease) |
||||||||||||||||||
| Interest-earning assets: |
||||||||||||||||||||||||
| Loans receivable, net and loans held for sale(1) |
$ | 20,542 | $ | 22,755 | $ | 43,297 | $ | 12,929 | $ | 7,982 | $ | 20,911 | ||||||||||||
| Taxable mortgage-backed securities |
150 | (396 | ) | (246 | ) | 249 | (97 | ) | 152 | |||||||||||||||
| Taxable AFS Investment securities |
117 | 3,030 | 3,147 | 96 | 183 | 279 | ||||||||||||||||||
| Tax-exempt AFS investment securities |
(38 | ) | 53 | 15 | 592 | 163 | 755 | |||||||||||||||||
| Taxable HTM Investment securities |
21 | — | 21 | 30 | (1 | ) | 29 | |||||||||||||||||
| FHLB stock |
(138 | ) | (18 | ) | (156 | ) | 81 | 64 | 145 | |||||||||||||||
| Interest-bearing deposits at other financial institutions |
500 | 1,920 | 2,420 | (277 | ) | 326 | 49 | |||||||||||||||||
| Total interest-earning assets |
$ | 21,154 | $ | 27,344 | $ | 48,498 | $ | 13,700 | $ | 8,620 | $ | 22,320 | ||||||||||||
| Interest-bearing liabilities: |
||||||||||||||||||||||||
| Savings and money market |
$ | (818 | ) | $ | 2,554 | $ | 1,736 | $ | 292 | $ | 1,879 | $ | 2,171 | |||||||||||
| Interest-bearing checking |
36 | 2,055 | 2,091 | (38 | ) | 251 | 213 | |||||||||||||||||
| Certificates of deposit |
5,280 | 18,224 | 23,504 | (58 | ) | 165 | 107 | |||||||||||||||||
| Borrowings |
231 | 1,913 | 2,144 | 671 | 1,307 | 1,978 | ||||||||||||||||||
| Subordinated note |
2 | (2 | ) | — | 205 | 15 | 220 | |||||||||||||||||
| Total interest-bearing liabilities |
$ | 4,731 | $ | 24,744 | $ | 29,475 | $ | 1,072 | $ | 3,617 | $ | 4,689 | ||||||||||||
| Net change in net interest income |
$ | 19,023 | $ | 17,631 | ||||||||||||||||||||
__________________________
| (1) |
The average loans receivable, net balances include nonaccrual loans. |
Comparison of Results of Operations for the Years Ended December 31, 2023 and 2022
General. Net income was $36.1 million for the year ended December 31, 2023, and $29.6 million for the year ended December 31, 2022. The $6.4 million, or 21.6%, increase in net income was primarily due to a $19.0 million, or 18.2% increase in net interest income, a $2.4 million, or 13.2%, increase in noninterest income, and a $1.4 million, or 23.2%, decrease in the provision for credit losses, partially offset by a $14.6 million, or 18.4%, increase in noninterest expense and a $1.9 million, or 25.6%, increase in the provision for income taxes.
Net Interest Income. Net interest income increased $19.0 million to $123.3 million for the year ended December 31, 2023, from $104.3 million for the year ended December 31, 2022. This increase was primarily attributed to an increase in interest income earned on loans, resulting from both an increase in the average balance of loans and an improved yield on loans. Additionally, there were minor contributions to the increase in interest income from taxable available-for-sale (“AFS”) investment securities and interest-bearing deposits at other financial institutions. These increases were partially offset by a $29.5 million increase in interest expense during the same period, primarily as a result of higher interest rates, higher utilization of borrowings and a shift in deposit mix from transactional accounts to higher cost CDs.
The net interest margin (“NIM”) increased two basis points to 4.48% for the year ended December 31, 2023, from 4.46% for the prior year. The increase in NIM reflects new loan originations at higher market interest rates, variable rate interest-earning assets repricing higher following increases in market interest rates. The benefit of the higher rates and increase in interest-earning assets was partially offset by rising deposit and borrowing costs. Increases in average balances of higher costing CDs and borrowings placed additional pressure on the NIM.
Interest Income. Interest income for the year ended December 31, 2023, increased $48.5 million, to $167.2 million, from $118.7 million for the year ended December 31, 2022. The increase during the year was primarily attributable to a $412.9 million increase in the average balance of total interest-earning assets, primarily loans, and a 100-basis point increase in the average yield on total interest-earning assets. Interest income on loans receivable, including fees, increased $43.3 million, 38.8%, for the year ended December 31, 2023, compared to the prior year due to an increase in the average balance of loans outstanding during the period and to new loans being originated at higher rates, and variable-rate loans repricing higher following increases in market interest rates. In addition, interest income on taxable AFS investment securities and interest-bearing deposits at other financial institutions increased $3.1 million and $2.4 million, respectively, during the year ended December 31, 2023, compared to the prior year, primarily due to increases in market interest rates.
The following table compares average earning asset balances, associated yields, and resulting changes in interest income for the years ended December 31, 2023 and 2022:
| (Dollars in thousands) |
Year Ended December 31, |
|||||||||||||||||||
| 2023 |
2022 |
|||||||||||||||||||
| Average |
Average |
$ Change |
||||||||||||||||||
| Balance |
Yield/ |
Balance |
Yield/ |
in Interest |
||||||||||||||||
| Outstanding |
Rate |
Outstanding |
Rate |
Income |
||||||||||||||||
| Loans receivable, net and loans held for sale (1) |
$ | 2,384,577 | 6.50 | % |
$ | 2,014,017 | 5.54 | % |
$ | 43,297 | ||||||||||
| Taxable mortgage-backed securities |
93,661 | 1.70 | 86,626 | 2.13 | (246 | ) | ||||||||||||||
| Taxable AFS investment securities |
65,704 | 6.97 | 60,729 | 2.36 | 3,147 | |||||||||||||||
| Tax-exempt AFS investment securities |
128,787 | 1.94 | 130,744 | 1.90 | 15 | |||||||||||||||
| Taxable HTM investment securities |
8,500 | 5.06 | 8,084 | 5.06 | 21 | |||||||||||||||
| FHLB stock |
4,740 | 5.17 | 7,231 | 5.55 | (156 | ) | ||||||||||||||
| Interest-bearing deposits at other financial institutions |
67,063 | 4.32 | 32,689 | 1.45 | 2,420 | |||||||||||||||
| Total interest-earning assets |
$ | 2,753,032 | 6.07 | % |
$ | 2,340,120 | 5.07 | % |
$ | 48,498 | ||||||||||
___________________________
| (1) |
The average loans receivable, net balances include nonaccrual loans. |
Interest Expense. Interest expense increased $29.5 million, to $43.9 million for the year ended December 31, 2023, from $14.4 million for the prior year, primarily due to an increase in interest expense on deposits of $27.3 million, primarily higher costing CDs, and on borrowings of $2.1 million. The average cost of funds for total interest-bearing liabilities increased 140 basis points to 2.32% for the year ended December 31, 2023, from 0.92% for the year ended December 31, 2022. The increase in interest expense was predominantly due to the increase in market rate for deposits and borrowings, and a shift in deposits to higher costing CDs. The average cost of total interest-bearing deposits increased 146 basis points to 2.12% for the year ended December 31, 2023, compared to 0.66% for the year ended December 31, 2022. The average cost of funds, including noninterest-bearing checking, increased 105 basis points to 1.72% for the year ended December 31, 2023, from 0.67% for the year ended December 31, 2022. The average balance of noninterest-bearing deposits, which include noninterest-bearing checking and escrow accounts, totaled $672.2 million and $580.0 million for the years ended December 31, 2023 and 2022, respectively.
The following table details average balances of interest-bearing liabilities, associated rates and resulting change in interest expense for the years ended December 31, 2023 and 2022:
| (Dollars in thousands) |
Year Ended December 31, |
|||||||||||||||||||
| 2023 |
2022 |
|||||||||||||||||||
| Average |
Average |
$ Change |
||||||||||||||||||
| Balance |
Yield/ |
Balance |
Yield/ |
in Interest |
||||||||||||||||
| Outstanding |
Rate |
Outstanding |
Rate |
Expense |
||||||||||||||||
| Savings and money market |
$ | 612,430 | 0.90 | % |
$ | 781,763 | 0.48 | % |
$ | 1,736 | ||||||||||
| Interest-bearing checking |
189,107 | 1.37 | 176,204 | 0.28 | 2,091 | |||||||||||||||
| Certificates of deposit |
930,805 | 3.08 | 459,594 | 1.12 | 23,504 | |||||||||||||||
| Borrowings |
110,328 | 4.71 | 102,571 | 2.98 | 2,144 | |||||||||||||||
| Subordinated note |
49,492 | 3.92 | 49,425 | 3.93 | — | |||||||||||||||
| Total interest-bearing liabilities |
$ | 1,892,162 | 2.32 | % |
$ | 1,569,557 | 0.92 | % |
$ | 29,475 | ||||||||||
Provision for Credit Losses. For the year ended December 31, 2023, the provision for credit losses was $4.8 million consisting of a $5.8 million provision for credit losses on loans partially offset by a $1.0 million reversal of the ACL on unfunded loan commitments, compared to a $6.2 million provision for credit losses, consisting of a $6.6 million provision for credit losses on loans partially offset by a $365,000 reversal of the ACL on unfunded loan commitments for the year ended December 31, 2022. The provision for credit losses on loans reflects the increase in total loans receivable, increased net charge-offs, and increased reserves on individually evaluated nonaccrual loans. The reversals of the allowance for credit losses on unfunded loan commitments for the years indicated above were a result of decreases in total unfunded commitments during those periods.
During the year ended December 31, 2023, net charge-offs totaled $2.2 million, compared to $1.4 million during the year ended December 31, 2022. The increase was primarily due to increases in net charge-offs of $1.3 million in indirect home improvement loans, partially offset by a decrease in net charge-offs of $395,000 in deposit accounts and overdrafts. A further decline in national and local economic conditions, as a result of the effects of inflation, a potential recession or slowed economic growth, among other factors, could result in a material increase in the ACL on loans and may adversely affect the Company’s financial condition and result of operations.
The following table details activity and information related to the ACL on loans for the years ended December 31, 2023 and 2022:
| At or For the Year Ended December 31, |
||||||||
| (Dollars in thousands) |
2023 |
2022 |
||||||
| Provision for credit losses on loans |
$ | 5,770 | $ | 6,623 | ||||
| Net charge-offs |
$ | 2,228 | $ | 1,407 | ||||
| ACL on loans |
$ | 31,534 | $ | 27,992 | ||||
| ACL on loans as a percentage of total gross loans receivable at year end |
1.30 | % |
1.26 | % |
||||
| Nonperforming loans |
$ | 10,952 | $ | 8,652 | ||||
| ACL on loans as a percentage of nonperforming loans at year end |
288.11 | % |
303.50 | % |
||||
| Nonperforming loans as a percentage of gross loans receivable at year end |
0.45 | % |
0.39 | |||||
| Total gross loans |
$ | 2,433,015 | $ | 2,218,852 | ||||
Management considers the ACL on loans at December 31, 2023, to be adequate to cover forecasted losses in the loan portfolio based on the assessment of the above-mentioned factors affecting the loan portfolio. While management believes that the estimates and assumptions used in its determination of the adequacy of the ACL on loans are reasonable, it is important to acknowledge the inherent uncertainties. There is no assurance that these estimates and assumptions will not be proven incorrect in the future. Additionally, there is the possibility that the actual amount of future provisions may exceed past provisions, and any potential increased provisions could adversely impact the Company's financial condition and results of operations. Furthermore, the determination of the amount of the Company's ACL on loans is subject to review by bank regulators as part of the routine examination process. The regulators may adjust the ACL based on their judgment and the information available to them at the time of their examination. This regulatory scrutiny adds an additional layer of evaluation and potential adjustment to the Company's credit loss provisions.
Noninterest Income. Noninterest income increased $2.4 million to $20.5 million for the year ended December 31, 2023, from $18.1 million for the year ended December 31, 2022. The following table provides a detailed analysis of the changes in the components of noninterest income:
| Year Ended December 31, |
Increase/(Decrease) |
|||||||||||||||
| (Dollars in thousands) |
2023 |
2022 |
Amount |
Percent |
||||||||||||
| Service charges and fee income |
$ | 11,138 | $ | 8,525 | $ | 2,613 | 30.7 | % | ||||||||
| Gain on sale of loans |
6,711 | 7,917 | (1,206 | ) | (15.2 | ) | ||||||||||
| Earnings on cash surrender value of BOLI |
920 | 876 | 44 | 5.0 | ||||||||||||
| Other noninterest income |
1,721 | 790 | 931 | 117.8 | ||||||||||||
| Total noninterest income |
$ | 20,490 | $ | 18,108 | $ | 2,382 | 13.2 | % | ||||||||
The year over year increase include a $2.6 million increase in service charges and fee income as a result of less amortization of MSRs reflecting increased market interest rates and increased servicing fees from non-portfolio serviced loans and a $931,000 increase in other noninterest income, partially offset by a $1.2 million, or 15.2%, decrease in gain on sale of loans, primarily due to a reduction in origination and sales volume of loans held for sale and a reduction in gross margins of sold loans. Gross margins on home loan sales increased to 3.07% for the year ended December 31, 2023, from 2.78% for the year ended December 31, 2022.
Noninterest Expense. Noninterest expense increased $14.6 million to $93.7 million for the year ended December 31, 2023, from $79.2 million for the year ended December 31, 2022. The following table provides an analysis of the changes in the components of noninterest expense:
| Year Ended December 31, |
Increase/(Decrease) |
|||||||||||||||
| (Dollars in thousands) |
2023 |
2022 |
Amount |
Percent |
||||||||||||
| Salaries and benefits |
$ | 53,622 | $ | 47,632 | $ | 5,990 | 12.6 | |||||||||
| Operations |
13,070 | 10,743 | 2,327 | 21.7 | ||||||||||||
| Occupancy |
6,378 | 5,165 | 1,213 | 23.5 | ||||||||||||
| Data processing |
6,852 | 6,062 | 790 | 13.0 | ||||||||||||
| Gain on sale of OREO |
(148 | ) | — | (148 | ) | NM | ||||||||||
| Loan costs |
2,574 | 2,718 | (144 | ) | (5.3 | ) | ||||||||||
| Professional and board fees |
2,584 | 3,154 | (570 | ) | (18.1 | ) | ||||||||||
| FDIC insurance |
2,392 | 1,224 | 1,168 | 95.4 | ||||||||||||
| Marketing and advertising |
1,349 | 897 | 452 | 50.4 | ||||||||||||
| Acquisition costs |
1,562 | 898 | 664 | 73.9 | ||||||||||||
| Amortization of core deposit intangible |
3,464 | 691 | 2,773 | 401.3 | ||||||||||||
| Impairment (recovery) of MSRs |
48 | (1 | ) | 49 | (4,900.0 | ) | ||||||||||
| Total noninterest expense |
$ | 93,747 | $ | 79,183 | $ | 14,564 | 18.4 | |||||||||
The increase in noninterest expense was primarily a result of a $6.0 million increase in salaries and benefits largely due to an increase in the number of FTEs as a result of the Branch Acquisition. Other increases included a $2.8 million in amortization of core deposit intangible, $2.3 million in operations, $1.2 million in occupancy, $1.2 million in FDIC insurance, $790,000 in data processing, and $664,000 in acquisition costs, partially offset by a decrease of $570,000 in professional and board fees.
The efficiency ratio, which is noninterest expense as a percentage of net interest income and noninterest income, improved slightly to 62.47% for the year ended December 31, 2023, compared to 64.70% for the year ended December 31, 2022, primarily due to the growth in revenues outpacing the increase in noninterest expenses.
Provision for Income Taxes. For the year ended December 31, 2023, the Company recorded a provision for income taxes of $9.2 million on pre-tax income of $45.3 million, as compared to a provision of income taxes of $7.3 million on pre-tax income of $37.0 million for the year ended December 31, 2022. There was a net deferred tax asset of $6.7 million at both December 31, 2023 and 2022. The effective corporate income tax rates for the years ended December 31, 2023 and 2022 were 20.4% and 19.8%, respectively. The increase in effective tax rate was partially attributable to an increase in disallowed interest expense on tax exempt assets due to an increase in the cost of funds. Disallowed interest expense was $1.9 million and $587,000 for the years ended December 31, 2023 and 2022, respectively. For additional information regarding income taxes, see “Note 12 – Income Taxes” of the Notes to Consolidated Financial Statements included in “Item 8. Financial Statements and Supplementary Data” of this Form 10–K.
Comparison of Results of Operations for the Years Ended December 31, 2022 and 2021
See Management’s Discussion and Analysis of Financial Condition and Results of Operations in our Annual Report on Form 10–K for the year ended December 31, 2022 filed with the SEC.
Asset and Liability Management and Market Risk
Risk When Interest Rates Change. The rates of interest the Company earns on assets and pays on liabilities generally is established contractually for a period of time. Market rates change over time. Like other financial institutions, the Company’s results of operations are impacted by changes in interest rates and the interest rate sensitivity of the Company’s assets and liabilities. The risk associated with changes in interest rates and the Company’s ability to adapt to these changes is known as interest rate risk and is the most significant market risk.
The Company assumes interest rate risk (the risk that general interest rate levels will change) as a result of its normal operations. Consequently, the fair value of the Company’s consolidated financial instruments will change when interest rate levels change, and that change may either be favorable or unfavorable to the Company. Management attempts to match maturities of assets and liabilities to the extent believed necessary to minimize interest rate risk. However, borrowers with fixed interest rate obligations are less likely to prepay in a rising interest rate environment and more likely to prepay in a falling interest rate environment. Conversely, depositors who are receiving fixed interest rates are more likely to withdraw funds before maturity in a rising interest rate environment and less likely to do so in a falling interest rate environment. Management monitors interest rates and maturities of assets and liabilities and attempts to minimize interest rate risk by adjusting terms of new loans, and deposits, and by investing in securities with terms that mitigate the Company’s overall interest rate risk.
How The Company Measures Risk of Interest Rate Changes. As part of an attempt to manage exposure to changes in interest rates and comply with applicable regulations, the Company monitors interest rate risk. In doing so, the Company analyzes and manages assets and liabilities based on their interest rates and payment streams, timing of maturities, repricing opportunities, and sensitivity to actual or potential changes in market interest rates.
The Company is subject to interest rate risk to the extent that its interest-bearing liabilities, primarily deposits, subordinated notes, and FHLB advances, reprice more rapidly or at different rates than the interest-earning assets. In order to minimize the potential for adverse effects of material prolonged increases or decreases in interest rates on the Company’s results of operations, the Company has adopted an Asset and Liability Management Policy. The Board of Directors sets the Asset and Liability Management Policy for the Bank, which is implemented by the Asset/Liability Committee (“ALCO”), an internal management committee. The board-level oversight of the ALCO is performed by the Audit Committee of the Board of Directors.
The purpose of the ALCO is to communicate, coordinate, and control asset/liability management consistent with the business plan and board-approved policies. The committee establishes and monitors the volume and mix of assets and funding sources, taking into account relative costs and spreads, interest rate sensitivity and liquidity needs. The objectives are to manage assets and funding sources to produce results that are consistent with liquidity, capital adequacy, growth, risk, and profitability goals.
The ALCO generally meets monthly to, among other things, protect capital through earnings stability over the interest rate cycle; maintain the Bank’s well capitalized status; and provide a reasonable return on investment. The committee recommends appropriate strategy changes based on this review. Additionally, the ALCO is responsible for reviewing and reporting the effects of the policy implementations and strategies to the Board of Directors at least quarterly. The Chief Financial Officer oversees this process on a daily basis.
A key element of the Bank’s asset/liability management plan is to protect net earnings by managing the maturity or repricing mismatch between interest-earning assets and rate-sensitive liabilities. The Company seeks to accomplish this by extending funding maturities through wholesale funding sources, including the use of FHLB advances and brokered certificates of deposit, and through asset management, including the use of adjustable-rate loans and selling certain fixed-rate loans in the secondary market. Management is also focused on matching deposit duration with the duration of earning assets as appropriate.
As part of the efforts to monitor and manage interest rate risk, a number of indicators are used to monitor overall risk. Among the measurements are:
Market Risk. Market risk is the potential change in the value of investment securities if interest rates change. This change in value impacts the value of the Company and the liquidity of the securities. Market risk is controlled by setting a maximum average maturity/average life of the securities portfolio to 10 years.
Economic Risk. Economic risk is the risk that the underlying value of a bank will change when rates change. This can be caused by a change in value of the existing assets and liabilities (this is called Economic Value of Equity or EVE), or a change in the earnings stream (this is caused by interest rate risk). The Company takes economic risk primarily when fixed rate loans are made, or purchase fixed-rate investments, or issue long term certificates of deposit or take fixed-rate FHLB advances. It is the risk that interest rates will change and these fixed-rate assets and liabilities will change in value. This change in value usually is not recognized in the earnings, or equity (other than marking to market securities available-for-sale or fair value adjustments on loans held for sale). The change is recognized only when the assets and liabilities are liquidated. Although the change in market value is usually not recognized in earnings or in capital, the impact is real to the long-term value of the Company. Therefore, the Company will control the level of economic risk by limiting the amount of long-term, fixed-rate assets it will have and by setting a limit on concentrations and maturities of securities.
Interest Rate Risk. The table presented below, as of December 31, 2023, is an analysis prepared for the Company by a third-party consultant. The analysis employs various market and actual experience-based assumptions and depicts a static shock. to net interest income through instantaneous and sustained shifts in the yield curve, with adjustments in 100 basis point increments, both up and down by 300 basis points. The results present a projected income statement with minimal exposure to immediate changes in interest rates. These outcomes rely on historical prepayment speeds within the consumer lending portfolio, coupled with the above average yields associated with the consumer portfolio if prepayments do not occur. The table illustrates the estimated change in net interest income over the next 12 months, starting from December 31, 2023.
| Change in Interest |
Net Interest Income |
|||||||||||
| Rates in Basis Points |
Amount |
Change |
Change |
|||||||||
| (Dollars in thousands) |
||||||||||||
| +300bp |
$ | 116,799 | $ | (4,006 | ) | (3.32 | )% |
|||||
| +200bp |
118,376 | (2,429 | ) | (2.01 | ) | |||||||
| +100bp |
119,629 | (1,176 | ) | (0.97 | ) | |||||||
| 0bp |
120,805 | — | — | |||||||||
| -100bp |
120,489 | (316 | ) | (0.26 | ) | |||||||
| -200bp |
119,999 | (806 | ) | (0.67 | ) | |||||||
| -300bp |
118,928 | (1,877 | ) | (1.55 | ) | |||||||
In managing the assets/liability mix the Company typically places an equal emphasis on maximizing net interest margin and matching the interest rate sensitivity of the assets and liabilities. From time to time, however, depending on the relationship between long- and short-term interest rates, market conditions and consumer preference, the Company may place somewhat greater emphasis on maximizing net interest margin than on strict dollar for dollar categories matching the interest rate sensitivity of the assets and liabilities. Management also believes that the increased net income which may result from a prepayment assumption mismatch in the actual maturity or repricing of the asset and liability portfolios can, during periods of changing interest rates, provide sufficient returns to justify the increased exposure to sudden and unexpected increases in interest rates which may result from such a mismatch. Management believes that 1st Security Bank’s level of interest rate risk is acceptable under this approach.
In evaluating the Company’s exposure to interest rate movements, certain shortcomings inherent in the method of analysis presented in the foregoing table must be considered. For example, although certain assets and liabilities may have similar maturities or repricing periods, they may react in different degrees to changes in market interest rates. Also, the interest rates on certain types of assets and liabilities may fluctuate in advance of changes in market interest rates, while interest rates on other types may lag behind changes in interest rates. Additionally, certain assets, such as adjustable-rate mortgages, have features which restrict changes in interest rates on a short-term basis and over the life of the asset. Further, in the event of a significant change in interest rates, prepayment and early withdrawal levels would likely deviate significantly from those assumed above. Finally, the ability of many borrowers to service their debt may decrease in the event of an interest rate increase. The Company considers all of these factors in monitoring its exposure to interest rate risk.
Liquidity and Capital Resources
Management maintains a liquidity position that it believes will adequately provide funding for loan demand and deposit runoff that may occur in the normal course of business. The Company relies on a number of different sources in order to meet potential liquidity demands. The primary sources are increases in deposit accounts, FHLB advances, purchases of federal funds, sale of securities available-for-sale, cash flows from loan payments, sales of one-to-four-family loans held for sale, and maturing securities. While the maturities and the scheduled amortization of loans are a predictable source of funds, deposit flows and mortgage prepayments are greatly influenced by general interest rates, economic conditions and competition.
The Bank must maintain an adequate level of liquidity to ensure the availability of sufficient funds to fund its operations. The Bank generally maintains sufficient cash and short-term investments to meet short-term liquidity needs. At December 31, 2023, the Bank’s total borrowing capacity was $686.2 million with the FHLB of Des Moines, with unused borrowing capacity of $681.9 million. The FHLB borrowing limit is based on certain categories of loans, primarily real estate loans, that qualify as collateral for FHLB advances. At December 31, 2023, the Bank held approximately $1.07 billion in loans that qualify as collateral for FHLB advances.
In addition to the availability of liquidity from the FHLB of Des Moines, the Bank maintained a short-term borrowing line of credit with the FRB, with a current limit of $351.6 million, and a combined credit limit of $101.0 million in written federal funds lines of credit through correspondent banking relationships at December 31, 2023. The FRB borrowing limit is based on certain categories of loans, primarily consumer loans, that qualify as collateral for FRB line of credit. At December 31, 2023, the Bank held approximately $631.1 million in loans that qualify as collateral for the FRB line of credit. Additionally, securities with a carrying value of $77.0 million at December 31, 2023, were pledged primarily to provide contingent liquidity through the BTFP at the FRB, with a current limit of $90.5 million and unused borrowing capacity of $620,000. Subject to market conditions, we expect to utilize these borrowing facilities from time to time in the future to fund loan originations and deposit withdrawals, to satisfy other financial commitments, repay maturing debt and to take advantage of investment opportunities to the extent feasible.
The Bank’s Asset and Liability Management Policy permits management to utilize brokered deposits up to 20% of total deposits or $506.3 million at December 31, 2023. Total brokered deposits at December 31, 2023 were $431.5 million. Management utilizes brokered deposits to mitigate interest rate risk and to enhance liquidity when appropriate.
Liquidity management is both a daily and long-term function of the Company’s management. Excess liquidity is generally invested in short-term investments, such as overnight deposits and federal funds. On a longer-term basis, a strategy is maintained of investing in various lending products and investment securities, including U.S. Government obligations and U.S. agency securities. The Company uses sources of funds primarily to meet ongoing commitments, pay maturing deposits and fund withdrawals, and to fund loan commitments. At December 31, 2023, the outstanding loan commitments totaled $535.0 million, which included $154.6 million of undisbursed construction and development loan commitments. For information regarding our commitments and off-balance sheet arrangements, see “Note 13 – Commitments and Contingencies” of the Notes to Consolidated Financial Statements included in “Item 8. Financial Statements and Supplementary Data” of this Form 10–K. Securities purchased during the years ended December 31, 2023 and 2022 totaled $76.0 million and $24.0 million, respectively, and securities repayments, maturities and sales in those periods were $17.3 million and $21.2 million, respectively.
The Bank’s liquidity is also affected by the volume of loans sold and loan principal payments. During the years ended December 31, 2023 and 2022, the Bank sold $405.0 million and $740.4 million in loans, respectively. During the years ended December 31, 2023 and 2022, the Bank received $652.7 million and $737.3 million in principal repayments on loans, respectively.
The Bank’s liquidity has been positively impacted by increases in deposit levels. During the years ended December 31, 2023 and 2022, deposits increased by $394.6 million and $212.0 million, respectively. Our liquid assets in the form of cash and cash equivalents, CDs at other financial institutions and investment securities increased to $391.2 million at December 31, 2023 from $283.9 million at December 31, 2022. CDs scheduled to mature in one year or less at December 31, 2023, totaled $863.4 million. It is management’s policy to offer deposit rates that are competitive with other local financial institutions. Based on this management strategy, the Bank believes that a majority of maturing relationship deposits will remain with the Bank.
We incur capital expenditures on an ongoing basis to expand and improve our product offerings, enhance and modernize our technology infrastructure, and to introduce new technology-based products to compete effectively in our markets. We evaluate capital expenditure projects based on a variety of factors, including expected strategic impacts (such as forecasted impact on revenue growth, productivity, expenses, service levels and customer retention) and our expected return on investment. The amount of capital investment is influenced by, among other things, current and projected demand for our services and products, cash flow generated by operating activities, cash required for other purposes and regulatory considerations. Based on current capital allocation objectives, there are no projects scheduled for capital investments in premises and equipment during the year ending December 31, 2024 that would materially impact liquidity. We also have purchase obligations, with remaining terms generally less than three years and contracts with various vendors to provide services, including information processing. These contracts typically extend for periods ranging from one to five years, and our financial obligations are contingent upon satisfactory performance by the vendor.
For the year ending December 31, 2024, we project that fixed commitments will include $1.9 million of operating lease payments and $93.7 million of scheduled payments and maturities of FHLB advances and FRB borrowing. For information regarding our operating leases and borrowings, see “Note 7 – Leases” and “Note 11 – Debt”, respectively, of the Notes to Consolidated Financial Statements included in “Item 8. Financial Statements and Supplementary Data” of this Form 10–K.
The Bank's management believes that the Company's liquid assets combined with its available lines of credit provide adequate liquidity to meet current financial obligations for at least the next 12 months.
As a separate legal entity from the Bank, FS Bancorp must provide for its own liquidity. Sources of capital and liquidity for FS Bancorp include distributions from the Bank and the issuance of debt or equity securities. Dividends and other capital distributions from the Bank are subject to regulatory notice. At December 31, 2023, FS Bancorp, Inc. had $9.1 million in unrestricted cash to meet liquidity needs.
The Company currently expects to continue the current practice of paying quarterly cash dividends on common stock subject to the Board of Directors' discretion to modify or terminate this practice at any time and for any reason without prior notice. Our current quarterly common stock dividend rate is $0.26 per share, which we believe is a dividend rate per share which enables us to balance our multiple objectives of managing and investing in the Bank and returning a substantial portion of our cash to our shareholders. Assuming continued cash dividend payment during 2024 at this rate of $0.26 per share, our average total dividend paid each quarter would be approximately $2.0 million based on the number of our current outstanding shares as of December 31, 2023.
The Bank is subject to minimum capital requirements imposed by the FDIC. Based on its capital levels at December 31, 2023, the Bank exceeded these requirements as of that date. Consistent with our goals to operate a sound and profitable organization, our policy is for the Bank to maintain a well capitalized status under the capital categories of the FDIC. Based on capital levels at December 31, 2023, the Bank was considered to be well capitalized. At December 31, 2023, the Bank exceeded all regulatory capital requirements with Tier 1 leverage-based capital, Tier 1 risk-based capital, total risk-based capital, and common equity Tier 1 capital ratios of 10.4%, 12.1%, 13.4%, and 12.1%, respectively.
As a bank holding company registered with the Federal Reserve, the Company is subject to the capital adequacy requirements of the Federal Reserve. Bank holding companies with less than $3.0 billion in assets are generally not subject to compliance with the Federal Reserve’s capital regulations, which are generally the same as the capital regulations applicable to the Bank. The Federal Reserve has a policy that a bank holding company is required to serve as a source of financial and managerial strength to the holding company’s subsidiary bank and the Federal Reserve expects the holding company’s subsidiary bank to be well capitalized under the prompt corrective action regulations. If FS Bancorp were subject to regulatory capital guidelines for bank holding companies with $3.0 billion or more in assets at December 31, 2023, FS Bancorp would have exceeded all regulatory capital requirements. For informational purposes, the regulatory capital ratios calculated for FS Bancorp at December 31, 2023 were 9.0% for Tier 1 leverage-based capital, 10.5% for Tier 1 risk-based capital, 13.7% for total risk-based capital, and 10.5% for CET 1 capital ratio. For additional information regarding regulatory capital compliance, see the discussion included in “Note 15 – Regulatory Capital” of the Notes to Consolidated Financial Statements included in “Item 8. Financial Statements and Supplementary Data” of this Form 10–K.
Recent Accounting Pronouncements
For a discussion of recent accounting standards, please see “Note 1– Basis of Presentation and Summary of Significant Accounting Policies” of the Notes to Consolidated Financial Statements included in “Item 8. Financial Statements and Supplementary Data” of this Form 10–K.
Item 7A. Quantitative and Qualitative Disclosures about Market Risk
Market risk is the risk of loss from adverse changes in market prices and rates. The Company’s market risk arises principally from interest rate risk inherent in lending, investing, deposit and borrowings activities. Management actively monitors and manages its interest rate risk exposure. In addition to other risks that are managed in the normal course of business, such as credit quality and liquidity, management considers interest rate risk to be a significant market risk that could potentially have a material effect on the Company’s financial condition and result of operations. The information contained in “Item 7. Management’s Discussion and Analysis of Financial Condition and Results of Operations – Asset and Liability Management” of this Form 10–K is incorporated herein by reference.
Item 8. Financial Statements and Supplementary Data
FS BANCORP, INC. AND SUBSIDIARY
INDEX TO FINANCIAL STATEMENTS
Index to Consolidated Financial Statements
Report of Independent Registered Public Accounting Firm
To the Shareholders and the Board of Directors of
FS Bancorp, Inc.
Opinions on the Financial Statements and Internal Control over Financial Reporting
We have audited the accompanying consolidated balance sheets of FS Bancorp, Inc. and subsidiary (the “Company”) as of December 31, 2023 and 2022, the related consolidated statements of income, comprehensive income, changes in stockholders’ equity, and cash flows for each of the three years in the period ended December 31, 2023, and the related notes (collectively referred to as the “consolidated financial statements”). We also have audited the Company’s internal control over financial reporting as of December 31, 2023, based on criteria established in Internal Control - Integrated Framework (2013) issued by the Committee of Sponsoring Organizations of the Treadway Commission (“COSO”).
In our opinion, the consolidated financial statements referred to above present fairly, in all material respects, the consolidated financial position of the Company as of December 31, 2023 and 2022, and the consolidated results of its operations and its cash flows for each of the three years in the period ended December 31, 2023, in conformity with accounting principles generally accepted in the United States of America. Also, in our opinion, the Company maintained, in all material respects, effective internal control over financial reporting as of December 31, 2023, based on criteria established in Internal Control - Integrated Framework (2013) issued by COSO.
Change in Accounting Principle
The Company changed its method of accounting for credit losses effective January 1, 2022, due to the adoption of Accounting Standards Codification Topic 326, Financial Instruments—Credit Losses (Topic 326). The Company adopted the new credit loss standard using the modified retrospective approach such that prior period amounts are not adjusted and continue to be reported in accordance with previously applicable generally accepted accounting principles. The new credit loss standard is also communicated as a critical audit matter below.
Basis for Opinions
The Company’s management is responsible for these consolidated financial statements, for maintaining effective internal control over financial reporting, and for its assessment of the effectiveness of internal control over financial reporting, included in the accompanying Management's Report on Internal Control over Financial Reporting. Our responsibility is to express an opinion on the Company’s consolidated financial statements and an opinion on the Company’s internal control over financial reporting based on our audits. We are a public accounting firm registered with the Public Company Accounting Oversight Board (United States) (“PCAOB”) and are required to be independent with respect to the Company in accordance with the U.S. federal securities laws and the applicable rules and regulations of the Securities and Exchange Commission and the PCAOB.
We conducted our audits in accordance with the standards of the PCAOB. Those standards require that we plan and perform the audits to obtain reasonable assurance about whether the consolidated financial statements are free of material misstatement, whether due to error or fraud, and whether effective internal control over financial reporting was maintained in all material respects.
Our audits of the consolidated financial statements included performing procedures to assess the risks of material misstatement of the consolidated financial statements, whether due to error or fraud, and performing procedures to respond to those risks. Such procedures included examining, on a test basis, evidence regarding the amounts and disclosures in the consolidated financial statements. Our audits also included evaluating the accounting principles used and significant estimates made by management, as well as evaluating the overall presentation of the consolidated financial statements. Our audit of internal control over financial reporting included obtaining an understanding of internal control over financial reporting, assessing the risk that a material weakness exists, and testing and evaluating the design and operating effectiveness of internal control based on the assessed risk. Our audits also included performing such other procedures as we considered necessary in the circumstances. We believe that our audits provide a reasonable basis for our opinions.
Definition and Limitations of Internal Control Over Financial Reporting
A company’s internal control over financial reporting is a process designed to provide reasonable assurance regarding the reliability of financial reporting and the preparation of financial statements for external purposes in accordance with generally accepted accounting principles. A company’s internal control over financial reporting includes those policies and procedures that (1) pertain to the maintenance of records that, in reasonable detail, accurately and fairly reflect the transactions and dispositions of the assets of the company; (2) provide reasonable assurance that transactions are recorded as necessary to permit preparation of financial statements in accordance with generally accepted accounting principles, and that receipts and expenditures of the company are being made only in accordance with authorizations of management and directors of the company; and (3) provide reasonable assurance regarding prevention or timely detection of unauthorized acquisition, use, or disposition of the company’s assets that could have a material effect on the financial statements.
Because of its inherent limitations, internal control over financial reporting may not prevent or detect misstatements. Also, projections of any evaluation of effectiveness to future periods are subject to the risk that controls may become inadequate because of changes in conditions, or that the degree of compliance with the policies or procedures may deteriorate.
Critical Audit Matters
The critical audit matters communicated below are matters arising from the current period audit of the consolidated financial statements that were communicated or required to be communicated to the audit committee and that (1) relate to accounts or disclosures that are material to the consolidated financial statements and (2) involved our especially challenging, subjective, or complex judgments. The communication of critical audit matters does not alter in any way our opinion on the consolidated financial statements, taken as a whole, and we are not, by communicating the critical audit matters below, providing a separate opinion on the critical audit matters or on the accounts or disclosures to which it relates.
Allowance for Credit Losses on Loans
As described in Notes 1 and 4 to the consolidated financial statements, the Company’s allowance for credit losses on loans totaled $31.5 million as of December 31, 2023. The allowance for credit losses on loans is a valuation account that is deducted from the loans’ amortized cost basis to present the net amount expected to be collected on the loans. The measurement of the net amount expected to be collected on loans is based on relevant available information, from internal and external sources, relating to past events, current conditions, historical loss experience, and reasonable and supportable forecasts.
We identified management’s risk-grade grouping of loans, the qualitative and environmental adjustments, each of which are used in the calculation of the allowance for credit losses on loans, as a critical audit matter. The Company groups loans by call report code and then by risk-grade grouping. Risk-grade groupings are internally developed based on relevant credit quality indicators for each loan group, and estimated losses for each loan group are based upon risk-grade groupings. The determination of risk-grade groupings involves significant management judgment. The qualitative and environmental adjustments are used to estimate factors that are not captured in the modeled expected losses. In turn, auditing management’s complex judgments regarding the determination of risk grades, and qualitative and environmental adjustments applied to the allowance for credit losses on loans involved a high degree of auditor judgment due to the nature and extent of the audit evidence and effort required to audit the matter.
The primary procedures we performed to address this critical audit matter included:
| ● | Testing the design, implementation, and operating effectiveness of controls related to management’s calculation of the allowance for credit losses on loans, including controls over the accuracy of risk-grade groupings and application of qualitative and environmental adjustments. |
| ● | Testing the completeness and accuracy of the data used in the calculation, application of the loan risk-grade groupings, and application of qualitative and environmental adjustments, all of which are determined by management and used in the calculation. |
| ● | Testing a risk-based, targeted selection of loans to gain substantive evidence that the Company is appropriately risk-grading these loans in accordance with its policies, and that the risk grades for the loans are reasonable based on current information available. |
| ● | Obtaining management’s analysis and supporting documentation related to the qualitative and environmental adjustments, and testing whether the adjustments used in the calculation of the allowance for credit losses on loans are supported by the analysis provided by management. |
| ● | Analytically reviewed historical asset quality trends and the overall characteristics of the loan portfolio for directional consistency. |
Business Combination
As discussed in Notes 1 and 2 to the consolidated financial statements, on February 24, 2023, the Company’s wholly owned subsidiary, 1st Security Bank, completed the purchase of seven branches (“Branch Acquisition”) from Columbia State Bank. In accordance with the Purchase and Assumption Agreement, dated as of November 7, 2022, between Columbia State Bank and 1st Security Bank, the Bank acquired $425.5 million of deposits, a portfolio of performing loans, six owned bank branches, one lease associated with the bank branches, and certain other assets of the branches. In consideration of the purchased assets and assumed liabilities, 1st Security Bank paid the unpaid principal balance and accrued interest of $66.6 million for the loans acquired; the fair value, or approximately $6.3 million, for the bank facilities and certain other assets associated with the acquired branches; and a deposit premium of 4.15% for core deposits and 2.5% for public funds on substantially all of the deposits assumed, which equated to approximately $16.4 million. The transaction was settled with Columbia State Bank paying cash of $334.7 million to 1st Security Bank for the difference between the total assets purchased and the total liabilities assumed. The business combination was accounted for using the acquisition method of accounting in which assets, liabilities, and consideration exchanged were recorded at their respective fair values on February 24, 2023, the date of the acquisition.
We identified the valuation of acquired loans as a critical audit matter because of the judgments necessary by management to determine the fair value of the loan portfolio acquired and the related high degree of auditor judgment and extensive effort involved in testing management’s significant estimates and assumptions, including using individuals with specialized skill and knowledge.
The primary procedures we performed to address this critical audit matter included:
| ● | Testing the design, implementation, and operating effectiveness of internal controls related to the completeness and accuracy of acquired loan data and fair value estimates of acquired loans, including significant assumptions and methods utilized in the calculation. |
| ● | Testing the completeness and accuracy of loan data used in the determination of non-purchase credit deteriorated loans at the acquisition data and evaluating the reasonableness of the criteria used by management in their identification. |
| ● | Testing the completeness and accuracy of acquired loan data used in the fair value estimate calculation. |
| ● | Utilizing internal firm specialists with specialized skill and knowledge to evaluate the reasonableness of significant assumptions and methods used by management, by preparing an independent fair value calculation, as well as an assessment of the overall reasonableness of the fair value estimates of all acquired loans. |
We identified the valuation of the core deposit intangible as a critical audit matter because of the judgments necessary by management to determine the fair value of the core deposit intangible, and the related high degree of auditor judgment and extensive effort involved in testing management’s significant estimates and assumptions, including using individuals with specialized skill and knowledge.
The primary procedures we performed to address this critical audit matter included:
| ● | Testing the design, implementation, and operating effectiveness of internal controls related to the completeness and accuracy of acquired deposit data and the fair value estimate of the core deposit intangible, including significant assumptions and methods utilized in the calculation. |
| ● | Testing the completeness and accuracy of acquired deposit data used in the fair value estimate calculation. |
| ● | Utilizing internal firm specialists with specialized skill and knowledge to evaluate the reasonableness of significant assumptions and methods used by management, by preparing an independent fair value calculation, as well as an assessment of the overall reasonableness of the fair value estimates of core deposit intangible. |
/s/
March 15, 2024
We have served as the Company’s auditor since 2006.
FS BANCORP, INC. AND SUBSIDIARY
CONSOLIDATED BALANCE SHEETS
DECEMBER 31, 2023 AND 2022
(Dollars in thousands, except share data)
| December 31, | December 31, | |||||||
| ASSETS | 2023 | 2022 | ||||||
| Cash and due from banks | $ | $ | ||||||
| Interest-bearing deposits at other financial institutions | ||||||||
| Total cash and cash equivalents | ||||||||
| Certificates of deposit at other financial institutions | ||||||||
| Securities available-for-sale, at fair value | ||||||||
| Securities held-to-maturity, net of allowance for credit losses of $ and $, respectively (fair value of $ and $, respectively) | ||||||||
| Loans held for sale, at fair value | ||||||||
| Loans receivable, net (includes $ and $, at fair value, respectively) | ||||||||
| Accrued interest receivable | ||||||||
| Premises and equipment, net | ||||||||
| Operating lease right-of-use (“ROU”) assets | ||||||||
| Federal Home Loan Bank (“FHLB”) stock, at cost | ||||||||
| Other real estate owned (“OREO”) | ||||||||
| Deferred tax asset, net | ||||||||
| Bank owned life insurance (“BOLI”), net | ||||||||
| Mortgage servicing rights (“MSRs”), held at the lower of cost or fair value | ||||||||
| MSRs held for sale, held at the lower of cost or fair value | ||||||||
| Goodwill | ||||||||
| Core deposit intangible, net | ||||||||
| Other assets | ||||||||
| TOTAL ASSETS | $ | $ | ||||||
| LIABILITIES | ||||||||
| Deposits: | ||||||||
| Noninterest-bearing accounts | $ | $ | ||||||
| Interest-bearing accounts | ||||||||
| Total deposits | ||||||||
| Borrowings | ||||||||
| Subordinated notes: | ||||||||
| Principal amount | ||||||||
| Unamortized debt issuance costs | ( | ) | ( | ) | ||||
| Total subordinated notes less unamortized debt issuance costs | ||||||||
| Operating lease liabilities | ||||||||
| Other liabilities | ||||||||
| Total liabilities | ||||||||
| COMMITMENTS AND CONTINGENCIES (NOTE 13) | ||||||||
| STOCKHOLDERS’ EQUITY | ||||||||
| Preferred stock, $ par value; shares authorized; issued or outstanding | ||||||||
| Common stock, $ par value; shares authorized; and shares issued and outstanding at December 31, 2023 and December 31, 2022, respectively | ||||||||
| Additional paid-in capital | ||||||||
| Retained earnings | ||||||||
| Accumulated other comprehensive loss, net of tax | ( | ) | ( | ) | ||||
| Total stockholders’ equity | ||||||||
| TOTAL LIABILITIES AND STOCKHOLDERS’ EQUITY | $ | $ | ||||||
See accompanying notes to these consolidated financial statements.
FS BANCORP, INC. AND SUBSIDIARY
CONSOLIDATED STATEMENTS OF INCOME
FOR THE YEARS ENDED December 31, 2023, 2022, and 2021
(Dollars in thousands, except earnings per share data)
| Year Ended |
||||||||||||
| December 31, |
||||||||||||
| 2023 |
2022 |
2021 |
||||||||||
| INTEREST INCOME |
||||||||||||
| Loans receivable, including fees |
$ | $ | $ | |||||||||
| Interest and dividends on investment securities, cash and cash equivalents, and certificates of deposit at other financial institutions |
||||||||||||
| Total interest and dividend income |
||||||||||||
| INTEREST EXPENSE |
||||||||||||
| Deposits |
||||||||||||
| Borrowings |
||||||||||||
| Subordinated notes |
||||||||||||
| Total interest expense |
||||||||||||
| NET INTEREST INCOME |
||||||||||||
| PROVISION FOR CREDIT LOSSES |
||||||||||||
| NET INTEREST INCOME AFTER PROVISION FOR CREDIT LOSSES |
||||||||||||
| NONINTEREST INCOME |
||||||||||||
| Service charges and fee income |
||||||||||||
| Gain on sale of loans |
||||||||||||
| Earnings on cash surrender value of BOLI |
||||||||||||
| Other noninterest income |
||||||||||||
| Total noninterest income |
||||||||||||
| NONINTEREST EXPENSE |
||||||||||||
| Salaries and benefits |
||||||||||||
| Operations |
||||||||||||
| Occupancy |
||||||||||||
| Data processing |
||||||||||||
| (Gain) loss on sale of OREO |
( |
) | ||||||||||
| Loan costs |
||||||||||||
| Professional and board fees |
||||||||||||
| Federal Deposit Insurance Corporation (“FDIC”) insurance |
||||||||||||
| Marketing and advertising |
||||||||||||
| Acquisition costs |
||||||||||||
| Amortization of core deposit intangible |
||||||||||||
| Impairment (recovery) of MSRs |
( |
) | ( |
) | ||||||||
| Total noninterest expense |
||||||||||||
| INCOME BEFORE PROVISION FOR INCOME TAXES |
||||||||||||
| PROVISION FOR INCOME TAXES |
||||||||||||
| NET INCOME |
$ | $ | $ | |||||||||
| Basic earnings per share |
$ | $ | $ | |||||||||
| Diluted earnings per share |
$ | $ | $ | |||||||||
Share and per share data has been adjusted for all periods to reflect a two-for-one stock split effective July 14, 2021.
See accompanying notes to these consolidated financial statements.
FS BANCORP, INC. AND SUBSIDIARY
CONSOLIDATED STATEMENTS OF COMPREHENSIVE INCOME
FOR THE YEARS ENDED December 31, 2023, 2022, and 2021
(Dollars in thousands)
| Year Ended |
||||||||||||
| December 31, |
||||||||||||
| 2023 |
2022 |
2021 |
||||||||||
| Net income |
$ | $ | $ | |||||||||
| Other comprehensive income (loss): |
||||||||||||
| Securities available-for-sale: |
||||||||||||
| Unrealized gain (loss) during period |
( |
) | ( |
) | ||||||||
| Income tax (provision) benefit related to unrealized holding gain (loss) |
( |
) | ||||||||||
| Derivative financial instruments: |
||||||||||||
| Unrealized derivative gain during period |
||||||||||||
| Income tax provision related to unrealized derivative gain |
( |
) | ( |
) | ( |
) | ||||||
| Reclassification adjustment for realized (gain) loss, net included in net income |
( |
) | ( |
) | ||||||||
| Income tax provision (benefit) related to reclassification, net |
( |
) | ||||||||||
| Other comprehensive income (loss), net of tax |
( |
) | ( |
) | ||||||||
| COMPREHENSIVE INCOME |
$ | $ | $ | |||||||||
See accompanying notes to these consolidated financial statements.
FS BANCORP, INC. AND SUBSIDIARY
CONSOLIDATED STATEMENTS OF CHANGES IN STOCKHOLDERS’ EQUITY
FOR THE YEARS ENDED December 31, 2023, 2022, and 2021
(Dollars in thousands, except share amounts)
| Accumulated | ||||||||||||||||||||||||||||
| Other | ||||||||||||||||||||||||||||
| Additional | Comprehensive | Unearned | Total | |||||||||||||||||||||||||
| Common Stock | Paid-in | Retained | Income (Loss), | ESOP | Stockholders’ | |||||||||||||||||||||||
| Shares | Amount | Capital | Earnings | Net of Tax | Shares | Equity | ||||||||||||||||||||||
| BALANCE, January 1, 2021 | $ | $ | $ | $ | $ | ( | ) | $ | ||||||||||||||||||||
| Net income | — | $ | $ | |||||||||||||||||||||||||
| Dividends paid ($ per share) | — | $ | ( | ) | $ | ( | ) | |||||||||||||||||||||
| Share-based compensation | — | $ | $ | |||||||||||||||||||||||||
| Restricted stock awards | 41,350 | $ | $ | |||||||||||||||||||||||||
| Common stock repurchased - repurchase plan | ( | ) | $ | ( | ) | ( | ) | $ | ( | ) | ||||||||||||||||||
| Common stock repurchased for employee/director taxes paid on restricted stock awards | ( | ) | $ | ( | ) | $ | ( | ) | ||||||||||||||||||||
| Stock options exercised, net | $ | ( | ) | $ | ( | ) | ||||||||||||||||||||||
| Other comprehensive loss, net of tax | — | $ | ( | ) | $ | ( | ) | |||||||||||||||||||||
| ESOP shares allocated | — | $ | $ | |||||||||||||||||||||||||
| BALANCE, December 31, 2021 | $ | $ | $ | $ | $ | $ | ||||||||||||||||||||||
| BALANCE, January 1, 2022 | $ | $ | $ | $ | $ | $ | ||||||||||||||||||||||
| Net income | — | $ | $ | |||||||||||||||||||||||||
| Dividends paid ($ per share) | — | $ | ( | ) | $ | ( | ) | |||||||||||||||||||||
| Share-based compensation | — | $ | $ | |||||||||||||||||||||||||
| Issuance of common stock- employee stock purchase plan | $ | $ | ||||||||||||||||||||||||||
| Restricted stock awards | 35,050 | $ | $ | |||||||||||||||||||||||||
| Cumulative effect of new accounting standard (Topic 326) - impact in year of adoption | — | $ | $ | |||||||||||||||||||||||||
| Common stock repurchased - repurchase plan | ( | ) | $ | ( | ) | ( | ) | $ | ( | ) | ||||||||||||||||||
| Common stock repurchased for employee/director taxes paid on restricted stock awards | ( | ) | $ | ( | ) | $ | ( | ) | ||||||||||||||||||||
| Stock options exercised, net | $ | $ | ||||||||||||||||||||||||||
| Other comprehensive loss, net of tax | — | $ | ( | ) | $ | ( | ) | |||||||||||||||||||||
| BALANCE, December 31, 2022 | $ | $ | $ | $ | ( | ) | $ | $ | ||||||||||||||||||||
Share and per share data has been adjusted for all periods to reflect a two-for-one stock split effective July 14, 2021.
FS BANCORP, INC. AND SUBSIDIARY
CONSOLIDATED STATEMENTS OF CHANGES IN STOCKHOLDERS’ EQUITY
FOR THE YEARS ENDED December 31, 2023, 2022, and 2021 (Continued)
(Dollars in thousands, except share amounts)
| Accumulated | ||||||||||||||||||||||||
| Other | ||||||||||||||||||||||||
| Additional | Comprehensive | Total | ||||||||||||||||||||||
| Common Stock | Paid-in | Retained | Loss, | Stockholders’ | ||||||||||||||||||||
| Shares | Amount | Capital | Earnings | Net of Tax | Equity | |||||||||||||||||||
| BALANCE, January 1, 2023 | $ | $ | $ | $ | ( | ) | $ | |||||||||||||||||
| Net income | — | $ | $ | |||||||||||||||||||||
| Dividends paid ($ per share) | — | $ | ( | ) | $ | ( | ) | |||||||||||||||||
| Share-based compensation | — | $ | $ | |||||||||||||||||||||
| Issuance of common stock- employee stock purchase plan | $ | $ | ||||||||||||||||||||||
| Restricted stock awards | $ | $ | ||||||||||||||||||||||
| Restricted stock awards forfeited | (9,524 | ) | $ | $ | ||||||||||||||||||||
| Common stock repurchased - repurchase plan | ( | ) | $ | ( | ) | $ | ( | ) | ||||||||||||||||
| Common stock repurchased for employee/director taxes paid on restricted stock awards | ( | ) | $ | ( | ) | $ | ( | ) | ||||||||||||||||
| Stock options exercised, net | $ | ( | ) | $ | ( | ) | ||||||||||||||||||
| Other comprehensive income, net of tax | — | $ | $ | |||||||||||||||||||||
| BALANCE, December 31, 2023 | $ | $ | $ | $ | ( | ) | $ | |||||||||||||||||
Share and per share data has been adjusted for all periods to reflect a two-for-one stock split effective July 14, 2021.
See accompanying notes to these consolidated financial statements.
FS BANCORP, INC. AND SUBSIDIARY
CONSOLIDATED STATEMENTS OF CASH FLOWS
FOR THE YEARS ENDED December 31, 2023, 2022, and 2021
(Dollars in thousands)
| Year Ended December 31, |
||||||||||||
| CASH FLOWS FROM OPERATING ACTIVITIES |
2023 |
2022 |
2021 |
|||||||||
| Net income |
$ | $ | $ | |||||||||
| Adjustments to reconcile net income to net cash from operating activities |
||||||||||||
| Provision for credit losses |
||||||||||||
| Depreciation, amortization and accretion |
||||||||||||
| Compensation expense related to stock options and restricted stock awards |
||||||||||||
| ESOP compensation expense for allocated shares |
||||||||||||
| (Benefit) provision for deferred income taxes |
( |
) | ( |
) | ||||||||
| Earnings on cash surrender value of BOLI |
( |
) | ( |
) | ( |
) | ||||||
| Gain on sale of loans held for sale |
( |
) | ( |
) | ( |
) | ||||||
| Gain on sale of portfolio loans |
( |
) | ( |
) | ||||||||
| Origination of loans held for sale |
( |
) | ( |
) | ( |
) | ||||||
| Proceeds from sale of loans held for sale |
||||||||||||
| Impairment (recovery) of MSRs |
( |
) | ( |
) | ||||||||
| (Gain) loss on sale of OREO |
( |
) | ||||||||||
| Changes in operating assets and liabilities |
||||||||||||
| Accrued interest receivable |
( |
) | ( |
) | ( |
) | ||||||
| Other assets |
( |
) | ( |
) | ||||||||
| Other liabilities |
( |
) | ||||||||||
| Net cash from operating activities |
||||||||||||
| CASH FLOWS FROM (USED BY) INVESTING ACTIVITIES |
||||||||||||
| Activity in securities available-for-sale: |
||||||||||||
| Maturities, prepayments, and calls |
||||||||||||
| Purchases |
( |
) | ( |
) | ( |
) | ||||||
| Activity in securities held-to-maturity: |
||||||||||||
| Purchases |
( |
) | ||||||||||
| Maturities of certificates of deposit at other financial institutions |
||||||||||||
| Purchase of certificates of deposit at other financial institutions |
( |
) | ||||||||||
| Portfolio loan originations and principal collections, net |
( |
) | ( |
) | ( |
) | ||||||
| Net cash from acquisitions |
||||||||||||
| Proceeds from sale of portfolio loans |
||||||||||||
| Purchase of portfolio loans |
( |
) | ( |
) | ( |
) | ||||||
| Proceeds from sale of OREO, net |
||||||||||||
| Purchase of premises and equipment |
( |
) | ( |
) | ( |
) | ||||||
| Proceeds from bank owned life insurance death benefits |
||||||||||||
| Change in FHLB stock, net |
( |
) | ||||||||||
| Net cash from (used by) investing activities |
( |
) | ( |
) | ||||||||
| CASH FLOWS (USED BY) FROM FINANCING ACTIVITIES |
||||||||||||
| Net (decrease) increase in deposits |
( |
) | ||||||||||
| Proceeds from borrowings |
||||||||||||
| Repayments of borrowings |
( |
) | ( |
) | ( |
) | ||||||
| Dividends paid on common stock |
( |
) | ( |
) | ( |
) | ||||||
| Net proceeds from issuance of subordinated notes |
||||||||||||
| Repayment of subordinated notes |
( |
) | ||||||||||
| Stock options exercised, net |
( |
) | ( |
) | ||||||||
| Common stock repurchased for employee/director taxes paid on restricted stock awards |
( |
) | ( |
) | ( |
) | ||||||
| Issuance of common stock - employee stock purchase plan |
||||||||||||
| Common stock repurchased |
( |
) | ( |
) | ( |
) | ||||||
| Net cash (used by) from financing activities |
( |
) | ||||||||||
| NET INCREASE (DECREASE) IN CASH AND CASH EQUIVALENTS |
( |
) | ||||||||||
| CASH AND CASH EQUIVALENTS, beginning of year |
||||||||||||
| CASH AND CASH EQUIVALENTS, end of year |
$ | $ | $ | |||||||||
| SUPPLEMENTARY DISCLOSURES OF CASH FLOW INFORMATION |
||||||||||||
| Cash paid during the year for: |
||||||||||||
| Interest on deposits and borrowings |
$ | $ | $ | |||||||||
| Income taxes |
||||||||||||
| SUPPLEMENTARY DISCLOSURES OF NONCASH OPERATING, INVESTING AND FINANCING ACTIVITIES |
||||||||||||
| Change in unrealized gain (loss) on available-for-sale investment securities |
$ | $ | ( |
) | $ | ( |
) | |||||
| Change in unrealized (loss) gain on fair value and cash flow hedges |
( |
) | ||||||||||
| Retention in gross MSRs from loan sales |
||||||||||||
| OREO received in settlement of loans |
||||||||||||
| Transfer of closed retail branch to OREO |
||||||||||||
| ROU assets in exchange for lease liabilities |
||||||||||||
| Acquisitions: |
||||||||||||
| Assets acquired |
||||||||||||
| Liabilities assumed |
||||||||||||
See accompanying notes to these consolidated financial statements.
NOTE 1 – BASIS OF PRESENTATION AND SUMMARY OF SIGNIFICANT ACCOUNTING POLICIES
Nature of Operations – FS Bancorp, Inc. (the “Company”) was incorporated in September 2011 as the holding company for 1st Security Bank of Washington (the “Bank” or “1st Security Bank”) in connection with the Bank’s conversion from the mutual to stock form of ownership which was completed on July 9, 2012. The Bank is a community-based savings bank with
Financial Statement Presentation – The consolidated financial statements have been prepared in accordance with accounting principles generally accepted in the United States (“U.S. GAAP”) and with prevailing practices within the banking and securities industries. In preparing such financial statements, management is required to make certain estimates and judgments that affect the reported amounts of assets and liabilities and disclosure of contingent assets and liabilities as of the date of the balance sheet and the reported amounts of revenues and expenses for the reporting period. Actual results could differ significantly from those estimates. Material estimates that are particularly susceptible to significant change relate to the determination of the allowance for credit losses, fair value adjustments from assets and liabilities acquired in a business combination, fair value of financial instruments, the valuation of MSRs, deferred income taxes, and if needed, a deferred tax asset valuation allowance.
Amounts presented in the consolidated financial statements and footnote tables are rounded and presented to the nearest thousands of dollars except per share amounts. If the amounts are above $1.0 million, they are rounded one decimal point, and if they are above $1.0 billion, they are rounded two decimal points.
Principles of Consolidation – The consolidated financial statements include the accounts of FS Bancorp and its wholly owned subsidiary, 1st Security Bank. All material intercompany accounts have been eliminated in consolidation.
Segment Reporting – The Company operates in business segments through the Bank: commercial and consumer banking and home lending. The Company’s business segments are determined based on the products and services provided, as well as the nature of the related business activities, and they reflect the way financial information is regularly reviewed for the purpose of allocating resources and evaluating performance of the Company’s businesses. The results for these business segments are based on management’s accounting process, which assigns income statement items and assets to each responsible operating segment. This process is dynamic and is based on management’s view of the Company’s operations. See “Note 21 – Business Segments.”
Subsequent Events – The Company has evaluated events and transactions subsequent to December 31, 2023, for potential recognition or disclosure. On January 31, 2024, the Company completed the sale of MSRs relating to certain single family mortgage loans serviced for the Federal National Mortgage Association (“Fannie Mae”) and the Federal Home Loan Mortgage Corporation (“Freddie Mac,” and together with Fannie Mae, the “Agencies”) with an aggregate unpaid principal balance of approximately $
Error Corrections - The Company has evaluated error corrections in earnings per share as follows:
Earnings Per Share
Prior presentations of earnings per share were revised due to the improper inclusion of certain unvested shares of the Company’s commons stock in the denominator of basic and diluted earnings per share. As a result of the inclusion, earnings per share was understated for the year ended December 31, 2021. Basic earnings per share for December 31, 2021 was updated to $
Cash and Cash Equivalents – Cash and cash equivalents include cash and due from banks, and interest-bearing balances due from other banks and the FRB and have an original maturity of 90 days or less at the time of purchase. At times, cash balances may exceed FDIC insured limits. At December 31, 2023 and 2022, the Company had $
Securities – Securities are classified as held-to-maturity when the Company has the ability and positive intent to hold them to maturity. Securities classified as held-to-maturity are carried at cost, adjusted for amortization of premiums to the earliest callable date and accretion of discounts to the maturity date and, if appropriate, any credit impairment losses. Securities available-for-sale consist of debt securities that the Company has the intent and ability to hold for an indefinite period, but not necessarily to maturity. Such securities may be sold to implement the Company’s asset/liability management strategies and in response to changes in interest rates and similar factors. Securities available-for-sale are reported at fair value. Realized gains and losses on securities available-for-sale, determined using the specific identification method, are included in results of operations. Amortization of premiums and accretion of discounts are recognized as adjustments to yield over the contractual lives of the related securities with the exception of premiums for non-contingently callable debt securities which are amortized to the earliest call date, rather than the contractual maturity date. Dividends and interest income are recognized when earned.
Management no longer evaluates securities for other-than-temporary impairment, as ASC Subtopic 326-30, Financial Instruments - Credit Losses - Available for Sale Debt Securities, changes the accounting for recognizing impairment on available for sale and held to maturity debt securities. Each quarter management evaluates impairment where there has been a decline in fair value below the amortized cost basis of a security to determine whether there is a credit loss associated with the decline in fair value. Management considers the nature of the collateral, potential future changes in collateral values, default rates, delinquency rates, third-party guarantees, credit ratings, interest rate changes since purchase, volatility of the security’s fair value and historical loss information for financial assets secured with similar collateral among other factors. Credit losses are calculated individually, rather than collectively, using a discounted cash flow method, whereby management compares the present value of expected cash flows with the amortized cost basis of the security. The credit loss component recognized through the Provision for Credit Losses on the Consolidated Statements of Income. (See Note 3 – Investments).
Federal Home Loan Bank Stock – The Bank’s investment in FHLB stock is carried at cost, which approximates fair value. As a member of the FHLB system, the Bank is required to maintain an investment in capital stock of the FHLB. The Bank’s required minimum level of investment in FHLB stock is based on specific percentages of its outstanding mortgages, total assets, or FHLB advances. At December 31, 2023 and 2022, the Bank’s investment in FHLB stock was $
Management evaluates FHLB stock for impairment annually. Management’s determination of whether these investments are impaired is based on its assessment of the ultimate recoverability of cost rather than by recognizing temporary declines in value. The determination of whether a decline affects the ultimate recoverability of cost is influenced by criteria such as (1) the significance of any decline in net assets of the FHLB as compared with the capital stock amount for the FHLB and the length of time this situation has persisted; (2) commitments by the FHLB to make payments required by law or regulation and the level of such payments in relation to the operating performance of the FHLB; (3) the impact of legislative and regulatory changes on institutions and, accordingly, the customer base of the FHLB; and (4) the liquidity position of the FHLB. Based on its evaluation, management determined that there was
Loans Held for Sale – The Bank records all mortgage loans held for sale at fair value. Fair value is determined by outstanding commitments from investors or current investor yield requirements calculated on the aggregate loan basis. Gains and losses on fair value changes of loans held for sale are recorded in the gain on sale of loans component of noninterest income. Origination fees and costs are recognized in earnings at the time of origination. Mortgage loans held for sale are sold with the mortgage service rights either released or retained by the Bank. Gains or losses on sales of mortgage loans are recognized based on the difference between the selling price and the carrying value of the related mortgage loans sold. All sales are made with limited recourse against the Company.
Other Real Estate Owned – OREO is recorded initially at the lower of cost or fair value less selling costs, with any initial charge made to the allowance for credit losses ("ACL") on loans. Costs relating to development and improvement of the properties or assets are capitalized while costs relating to holding the properties or assets are expensed. Valuations are periodically performed by management, and a charge to earnings is recorded if the recorded value of a property exceeds its estimated net realizable value.
Derivatives – Commitments to fund mortgage loans (interest rate locks) to be sold into the secondary market and forward commitments for the future delivery of these mortgage loans are accounted for as free-standing derivatives. The fair value of the interest rate lock is recorded at the time the commitment to fund the mortgage loan is executed and is adjusted for the expected exercise of the commitments to fund the loans. The Company enters into forward commitments for the future delivery of mortgage loans when interest rate locks are entered. Fair values of these mortgage derivatives are estimated based on changes in mortgage interest rates from the date the interest on the loan is locked. Changes in the fair values of these derivatives are reported in “Gain on sale of loans” on the Consolidated Statements of Income.
The accounting for changes in the fair value of derivatives depends on the intended use of the derivative and resulting designation. The Company’s hedging policies permit the use of various derivative financial instruments to manage interest rate risk or to hedge specified assets and liabilities. To qualify for hedge accounting, derivatives must be highly effective at reducing the risk associated with the exposure being hedged and must be designated as a hedge at the inception of the derivative contract. If derivative instruments are designated as fair value hedges, and such hedges are highly effective, both the change in the fair value of the hedge and the hedged item are included in current earnings. If derivative instruments are designated as cash flow hedges, fair value adjustments related to the effective portion are recorded in other comprehensive income and are reclassified to earnings when the hedged transaction is reflected in earnings. Ineffective portions of cash flow hedges are reflected in earnings as they occur. Actual cash receipts and/or payments and related accruals on derivatives related to hedges are recorded as adjustments to the interest income or interest expense associated with the hedged item. During the life of the hedge, the Company formally assesses whether derivatives designated as hedging instruments continue to be highly effective in offsetting changes in the fair value or cash flows of hedged items. If it is determined that a hedge has ceased to be highly effective, the Company will discontinue hedge accounting prospectively. At such time, previous adjustments to the carrying value of the hedged item are reversed into current earnings and the derivative instrument is reclassified to a trading position recorded at fair value. For derivatives not designated as hedges, changes in fair value are recognized in earnings, in noninterest income.
Loans Receivable – Loans receivable, are stated at the amount of unpaid principal reduced by the ACL on loans and net deferred fees or costs and premiums or discounts. Interest on loans is calculated using the simple interest method based on the daily balance of the principal amount outstanding and is credited to income as earned. Loan fees, net of direct origination costs, are deferred and amortized over the life of the loan using the effective yield method. If the loan is repaid prior to maturity, the remaining unamortized net deferred loan origination fee is recognized in income at the time of repayment.
Income Recognition on Nonaccrual Loans and Securities – Interest on loans is accrued daily based on the principal amount outstanding. Generally, the accrual of interest on loans is discontinued when, in management’s opinion, the borrower may be unable to meet payments as they become due or when they are past due 90 days as to either principal or interest (based on contractual terms), unless they are well secured and in the process of collection. All interest accrued but not collected for loans that are placed on nonaccrual status or charged off are reversed against interest income. Subsequent collections on a cash basis are applied proportionately to past due principal and interest, unless collectability of principal is in doubt, in which case all payments are applied to principal. Loans are returned to accrual status when the loan is performing according to its contractual terms for at least six months and the collectability of principal and interest is no longer doubtful. While less common, similar interest reversal and nonaccrual treatment is applied to investment securities if their ultimate collectability becomes questionable.
Allowance for Credit Losses on Held-to-Maturity Securities – Management measures expected credit losses on held-to-maturity securities by individual security. Accrued interest receivable on held-to-maturity debt securities is excluded from the estimate of credit losses. The estimate of expected credit losses considers credit ratings and historical credit loss information that is adjusted for current conditions and reasonable and supportable forecasts.
The held-to-maturity portfolio consists entirely of corporate securities. Securities are generally rated investment grade. Securities are analyzed individually to establish a reserve.
Allowance for Credit Losses on Available-for-Sale Securities – For available-for-sale securities in an unrealized loss position, management first assesses whether it intends to sell, or is more likely than not to be required to sell, the security before recovery of its amortized cost basis. If either of the criteria regarding intent or requirement to sell is met, the security’s amortized cost basis is written down to fair value through income. For debt securities available-for-sale that do not meet the aforementioned criteria, the Company evaluates whether the decline in fair value has resulted from credit losses or other factors. In making this assessment, management considers the extent to which fair value is less than amortized cost, any changes to the rating of the security by a rating agency, and adverse conditions specifically related to the security, among other factors. If this assessment indicates that a credit loss exists, the present value of cash flows expected to be collected from the security are compared to the amortized cost basis of the security. If the present value of cash flows expected to be collected is less than the amortized cost basis, a credit loss exists and an ACL is recorded for the credit loss, limited by the amount that the fair value is less than the amortized cost basis.
Changes in the ACL are recorded as a provision for (recovery of) credit loss expense. Losses are charged against the ACL when management believes the uncollectability of an available-for-sale security is confirmed or when either of the criteria regarding intent or requirement to sell is met. Accrued interest receivable on available-for-sale debt securities is not included in the estimate of credit losses.
Allowance for Credit Losses on Loans – The ACL on loans is a valuation account that is deducted from the loans’ amortized cost basis to present the net amount expected to be collected on the loans. Loans are charged off against the allowance when management believes the uncollectability of a loan balance is confirmed and recoveries are credited to the allowance when received. In the case of recoveries, amounts may not exceed the aggregate of amounts previously charged off.
Management utilizes relevant available information, from internal and external sources, relating to past events, current conditions, historical loss experience, and reasonable and supportable forecasts. The lookback period in the analysis includes historical data from 2009 to present. Adjustments to historical loss information are made when management determines historical data is not likely reflective of the current portfolio such as limited data sets or lack of default or loss history. Management may selectively apply external market data to subjectively adjust the Company’s own loss history including index or peer data. Accrued interest receivable is excluded from the estimate of credit losses on loans.
Collective Assessment – The ACL on loans is measured on a collective cohort basis when similar risk characteristics exist. Generally, collectively assessed loans are grouped by call report code and then risk-grade grouping. Risk grade is grouped within each call report code by pass, watch, special mention, substandard, and doubtful. Other loan types are separated into their own cohorts due to specific risk characteristics for that pool of loan.
The Company has elected a non-discounted cash flow methodology with probability of default (“PD”) and loss given default (“LGD”) for all call report code cohorts (“cohorts”), with the exception of the indirect and marine portfolios which are evaluated under a vintage methodology. The vintage methodology measures the expected loss calculation for future periods based on historical performance by the origination period of loans with similar life cycles and risk characteristics. Guaranteed portions of loans are measured with zero risk due to cash collateral and full guaranty.
The PD calculation looks at the historical loan portfolio at particular points in time (each month during the lookback period) to determine the probability that loans in a certain cohort will default over the next 12-month period. A default is defined as a loan that has moved to past due 90 days and greater, nonaccrual status, or experienced a charge-off during the period. In cohorts where the Company’s historical data is insufficient due to a minimal amount of default activity or zero defaults, management uses index PDs comprised of rates derived from the PD experience of other community banks in place of the Company’s historical PDs. Additionally, management reviews all other cohorts to determine if index PDs should be used outside of these criteria.
The LGD calculation looks at actual losses (net charge-offs) experienced over the entire lookback period for each cohort of loans. The aggregate loss amount is divided by the exposure at default to determine an LGD rate. All defaults (non-accrual, charge-off, or greater than 90 days past due) occurring during the lookback period are included in the denominator, whether a loss occurred or not and exposure at default is determined by the loan balance immediately preceding the default event (i.e., nonaccrual or charge-off). Due to very limited charge-off history, management uses index LGDs comprised of rates derived from the LGD experience of other community banks in place of the Company’s historical LGDs.
The Company utilizes reasonable and supportable forecasts of future economic conditions when estimating the ACL on loans. The calculation includes a 12-month PD forecast based on the Company’s regression model comparing peer nonperforming loan ratios to the national unemployment rate. After the forecast period, PD rates revert on a straight-line basis back to long-term historical average rates over a 12-month period. Due to very limited default history, management uses index PDs comprised of rates derived from the PD experience of other community banks in place of the Company’s historical PDs.
The Company recognizes that all significant factors that affect the collectability of the loan portfolio must be considered to determine the estimated credit losses as of the evaluation date. Furthermore, the methodology, in and of itself and even when selectively adjusted by comparison to market and peer data, does not provide a sufficient basis to determine the estimated credit losses. The Company adjusts the modeled historical losses by qualitative and environmental adjustments to incorporate all significant risks to form a sufficient basis to estimate the credit losses.
Individual Assessment – Loans classified as nonaccrual are reviewed quarterly for potential individual assessment. Any loan classified as a nonaccrual that is not determined to need individual assessment is evaluated collectively within its respective cohort.
Where the primary and/or expected source of repayment of a specific loan is believed to be the future liquidation of available collateral, impairment will generally be measured based upon expected future collateral proceeds, net of disposition expenses including sales commissions as well as other costs potentially necessary to sell the asset(s) (i.e., past due taxes, liens, etc.). Estimates of future collateral proceeds will be based upon available appraisals, reference to recent valuations of comparable properties, use of consultants or other professionals with relevant market and/or property-specific knowledge, and any other sources of information believed appropriate by management under the specific circumstances. When appraisals are ordered to support the impairment analysis of an impaired loan, the appraisal is reviewed by the Company’s internal appraisal reviewer.
Where the primary and/or expected source of repayment of a specific loan is believed to be the receipt of principal and interest payments from the borrower and/or the refinancing of the loan by another creditor, impairment will generally be measured based upon the present value of expected proceeds discounted at the contractual interest rate. Expected refinancing proceeds may be estimated from review of term sheets actually received by the borrower from other creditors and/or from the Company’s knowledge of terms generally available from other banks.
Determining the Contractual Term – Expected credit losses are estimated over the contractual term of the loans, adjusted for expected prepayments when appropriate. The contractual term excludes expected extensions, renewals and modifications. Prepayment assumptions will be determined by analysis of historical behavior by loan cohort.
Allowance for Credit Losses on Unfunded Commitments – The Company estimates expected credit losses over the contractual period in which the Company is exposed to credit risk via a contractual obligation to extend credit. The ACL on unfunded commitments is adjusted through a provision for (recovery of) credit losses. The estimate includes consideration of the likelihood that funding will occur and an estimate of expected credit losses on commitments expected to be funded over its estimated life. The estimate utilizes the same factors and assumptions as the ACL on loans and is applied at the same collective cohort level.
Premises and Equipment, Net – Land is carried at cost. Premises and equipment are stated at cost less accumulated depreciation and amortization. Depreciation is computed using the straight-line method over the estimated useful lives of the assets. The estimated useful lives used to compute depreciation include building and building improvements up to
Management reviews buildings, improvements and equipment for impairment on an annual basis or whenever events or changes in the circumstances indicate that the undiscounted cash flows for the property are less than its carrying value. If identified, an impairment loss is recognized through a charge to earnings based on the fair value of the property.
Right of Use (“ROU”) Lease Asset & Lease Liability – The Company leases retail space, office space, storage space, and equipment under operating leases. Most leases require the Company to pay real estate taxes, maintenance, insurance and other similar costs in addition to the base rent. Certain leases also contain lease incentives, such as tenant improvement allowances and rent abatement. Variable lease payments are recognized as lease expense as they are incurred. The Company records an operating lease ROU asset and an operating lease liability for operating leases with a lease term greater than 12 months. The ROU asset and lease liability are recorded in “Other assets” and “Other liabilities”, respectively, on the Consolidated Balance Sheets.
ROU assets represent our right to use an underlying asset for the lease term and lease liabilities represent our obligation to make lease payments arising from the lease. ROU assets and lease liabilities are recognized at commencement date based on the present value of lease payments over the lease term. As most of the Company’s leases do not provide an implicit rate, the Company generally uses its incremental borrowing rate based on the estimated rate of interest for collateralized borrowing over a similar term of the lease payments at commencement date. Many of the Company’s leases contain various provisions for increases in rental rates, based either on changes in the published Consumer Price Index or a predetermined escalation schedule, which are factored into our determination of lease payments when appropriate. Substantially all of the leases provide the Company with the option to extend the lease term one or more times following expiration of the initial term. The ROU asset and lease liability terms may include options to extend or terminate the lease when it is reasonably certain that the Company will exercise that option. Lease expense for lease payments is recognized on a straight-line basis over the lease term.
Transfers of Financial Assets – Transfers of an entire financial asset, a group of entire financial assets, or participating interest in an entire financial asset are accounted for as sales when control over the assets has been surrendered. Control over transferred assets is deemed to be surrendered when (1) the assets have been isolated from the Company, (2) the transferee obtains the right (free of conditions that constrain it from taking advantage of that right) to pledge or exchange the transferred assets, and (3) the Company does not maintain effective control over the transferred assets through an agreement to repurchase them before their maturity.
Mortgage Servicing Rights – Servicing assets are recognized as separate assets when rights are acquired through purchase or through sale of financial assets. Generally, purchased MSRs are capitalized at the cost to acquire the rights. For sales of mortgage loans, a portion of the cost of originating the loan is allocated to the MSRs based on relative fair value. Fair value is based on market prices for comparable MSR contracts, when available, or alternatively, is based on a valuation model that calculates the present value of estimated future net servicing income. The valuation model incorporates assumptions that market participants would use in estimating future net servicing income, such as the cost to service, the discount rate, the custodial earnings rate, an inflation rate, ancillary income, prepayment speeds, and default rates and losses.
Servicing assets are evaluated quarterly for impairment based upon the fair value of the rights as compared to amortized cost. Impairment is determined by stratifying rights into tranches based on predominant characteristics, such as interest rate, loan type, and investor type. Impairment is recognized through a valuation allowance for an individual tranche, to the extent that fair value is less than the capitalized amount for the tranche. If the Company later determines that all or a portion of the impairment no longer exists for a particular tranche, a reduction of the allowance may be recorded as a recovery and an increase to income. Capitalized MSRs are stated separately on the Consolidated Balance Sheets and are amortized into noninterest income in proportion to, and over the period of, the estimated future net servicing income of the underlying financial assets.
Income Taxes – The Company files a consolidated federal income tax return. Income taxes are reflected in the Company’s consolidated financial statements to show the tax effects of the operations and transactions reported in the consolidated financial statements and consist of taxes currently payable plus deferred taxes. ASC 740, “Accounting for Income Taxes,” requires the asset and liability approach for financial accounting and reporting for deferred income taxes. Deferred tax assets and liabilities result from temporary differences between the financial statement carrying amounts and the tax bases of assets and liabilities. They are reflected at currently enacted income tax rates applicable to the period in which the deferred tax assets or liabilities are expected to be realized or settled and are determined using the assets and liability method of accounting. The deferred income tax provision represents the difference between net deferred tax asset/liability at the beginning and end of the reported period. In formulating the deferred tax asset, the Company is required to estimate income and taxes in the jurisdiction in which the Company operates. This process involves estimating the actual current tax exposure for the reported period together with assessing temporary differences resulting from differing treatment of items, such as depreciation and the provision for credit losses, for tax and financial reporting purposes.
The Company follows the authoritative guidance issued related to accounting for uncertainty in income taxes. The guidance prescribes a recognition threshold and measurement attribute for the financial statement recognition and measurement of a tax position taken or expected to be taken in a tax return. It is the Company’s policy to record any penalties or interest arising from federal or state taxes as a component of income tax expense.
Employee Stock Ownership Plan (“ESOP”) – Compensation expense recognized for the Company's ESOP equals the fair value of shares that have been allocated or committed to be released for allocation to participants. Any difference between the fair value of the shares at the time and the ESOP’s original acquisition cost is charged or credited to stockholders’ equity (additional paid-in-capital). The cost of ESOP shares that have not yet been allocated or committed to be released is deducted from stockholders’ equity.
Earnings Per Share (“EPS”) – Basic and diluted EPS are computed using the two-class method, which is an earnings allocation method for computing earnings per share that treats a participating security as having rights to earnings that would otherwise have been available to common shareholders. Basic earnings per share are computed by dividing income available to common shareholders by the weighted average number of common shares outstanding for the period. Unvested share-based awards containing non-forfeitable rights to dividends or dividend equivalents (whether paid or unpaid) are participating securities and are included in the computation of earnings per share pursuant to the two-class method. Diluted earnings per share reflect the potential dilution that could occur if securities or other contracts to issue common stock were exercised or converted into common stock or resulted in the issuance of common stock that then shared in the earnings of the entity.
Comprehensive Income (Loss) – Comprehensive income (loss) is comprised of net income and other comprehensive income (loss). Other comprehensive income (loss) includes unrealized holding gains and losses on securities available-for-sale, net of tax and unrealized holding gains (losses) on derivatives designated as hedges, net of tax recorded directly to equity.
Financial Instruments – In the ordinary course of business, the Company has entered into agreements for off-balance-sheet financial instruments consisting of commitments to extend credit and stand-by letters of credit. Such financial instruments are recorded in the financial statements when they are funded or related fees are incurred or received.
Restricted Assets – Regulations of the Board of Governors of the Federal Reserve System (“Federal Reserve”) require that the Bank maintain reserves in the form of cash on hand and deposit balances with the FRB, based on a percentage of deposits. At December 31, 2023 and December 31, 2022, the Bank had no reserve requirement.
Marketing and Advertising Costs – The Company records marketing and advertising costs as expenses as they are incurred. Total marketing and advertising expense was $
Stock-Based Compensation – Compensation cost is recognized for stock options and restricted stock awards, based on the fair value of these awards at the grant date. A Black-Scholes model is utilized to estimate the fair value of stock options, while the market price of the Company’s common stock at the grant date is used for restricted stock awards. Compensation cost is recognized over the required service period, generally defined as the vesting period. For awards with graded vesting, compensation cost is recognized on a straight-line basis over the requisite service period for the entire award.
Goodwill – Goodwill is recorded upon completion of a business combination as the difference between the purchase price and the fair value of net identifiable assets acquired. The Company completes its annual review of goodwill during the fourth quarter of each fiscal year. An assessment of qualitative factors is completed to determine if it is more likely than not that the fair value of a reporting unit is less than its carrying amount. If the qualitative analysis concludes that further analysis is required, then a quantitative impairment test would be completed. The quantitative goodwill impairment test is used to identify the existence of impairment and the amount of impairment loss and compares the reporting unit’s estimated fair value, including goodwill, to its carrying amount. If the fair value exceeds the carrying amount, then goodwill is not considered impaired. If the carrying amount exceeds its fair value, an impairment loss would be recognized equal to the amount of excess, limited to the amount of total goodwill allocated to that reporting unit. There was
Bank Owned Life Insurance – The Bank has purchased life insurance policies on certain key executives. Company owned life insurance is recorded at the amount that can be realized under the insurance contract at the balance sheet date, which is the cash surrender value adjusted for other charges or other amounts due that are probable at settlement.
As a result of current tax law and the nature of these policies, the Bank records any increase in cash value of these policies as nontaxable noninterest income. If the Bank decided to surrender any of the policies prior to the death of the insured, such surrender may result in tax expense related to the life-to-date cumulative increase in cash value of the policy. If the Bank retains such policies until the death of the insured, the Bank would receive nontaxable proceeds from the insurance company equal to the death benefit of the policies.
Business Combinations – The Company accounts for business combinations using the acquisition method of accounting. The accounts of an acquired entity are included as of the date of acquisition, and any excess of purchase price over the fair value of the net assets acquired is capitalized as goodwill. In the event that the fair value of net assets acquired exceeds the purchase price, including fair value of liabilities assumed, a bargain purchase gain is recorded on that acquisition. Under this method, all identifiable assets acquired, including purchased loans, and liabilities assumed are recorded at fair value.
The primary identifiable intangible asset we typically record in connection with a whole bank or bank branch acquisition is the value of the core deposit intangibles which represents the estimated value of the long-term deposit relationships acquired in the transaction. Determining the amount of identifiable intangible assets and their average lives involves multiple assumptions and estimates and is typically determined by performing a discounted cash flow analysis, which involves a combination of any or all the following assumptions: customer attrition/runoff, alternative funding costs, deposit servicing costs, and discount rates. The core deposit intangibles are amortized over the estimated useful lives of the deposit accounts based on a method that we believe reasonably approximates the anticipated benefit stream from this intangible. The estimated useful lives are periodically reviewed for reasonableness and have generally been estimated to have a life ranging from to years, with an accelerated rate of amortization. We review identifiable intangible assets for impairment whenever events or changes in circumstances indicate that the carrying value may not be recoverable. Our policy is that an impairment loss is recognized, equal to the difference between the asset's carrying amount and its fair value, if the sum of the expected undiscounted future cash flows is less than the carrying amount of the asset. Estimating future cash flows involves the use of multiple estimates and assumptions, such as those listed above.
Acquired Loans – Loans acquired in business combinations are recorded at their fair value at the acquisition date. Establishing the fair value of acquired loans involves a significant amount of judgement, including determining the credit discount based upon historical data adjusted for current economic conditions and other factors. Acquired loans are evaluated upon acquisition and classified as either purchased credit-deteriorated or purchased non-credit-deteriorated. Purchased credit-deteriorated (“PCD”) loans have experienced more than insignificant credit deterioration since origination. For PCD loans, an allowance for credit losses is determined at the acquisition date using the same methodology as other loans held for investment. The initial allowance for credit losses determined on a collective basis is allocated to individual loans. The loan’s fair value is grossed up for the allowance for credit losses and becomes its initial amortized cost basis. The difference between the initial amortized cost basis and the par value of the loan is a noncredit discount or premium, which is amortized into interest income over the life of the loan. Subsequent changes to the allowance for credit losses are recorded through a provision for credit losses.
For purchased non-credit-deteriorated loans, the difference between the fair value and unpaid principal balance of the loan at the acquisition date is amortized or accreted to interest income over the life of the loan. While credit discounts are included in the determination of the fair value for non-credit-deteriorated loans, since these discounts are expected to be accreted over the life of the loans, they cannot be used to offset the allowance for credit losses that must be recorded at the acquisition date. As a result, an allowance for credit losses is determined at the acquisition date using the same methodology as other loans held for investment and is recognized as a provision for credit losses in the Consolidated Statement of Income. Any subsequent deterioration (improvement) in credit quality is recognized by recording a provision for (reversal of) credit losses.
Application of New Accounting Guidance in 2023
On January 1, 2023, the Company adopted Accounting Standards Update (“ASU”) No. 2022–02, Financial Instruments – Credit Losses (Topic 326): Troubled Debt Restructurings and Vintage Disclosures. This ASU eliminated the accounting guidance for troubled debt restructurings (“TDRs”) for creditors, required new disclosures for creditors for certain loan refinancings and restructurings when a borrower is experiencing financial difficulty, and required public business entities to include current-period gross write-offs in the vintage disclosure tables. The amendments in this ASU were effective for fiscal years beginning after December 15, 2022, including interim periods within those fiscal years. The adoption of ASU 2022–02 did not have a material impact on the Company’s consolidated financial statements.
RECENT ACCOUNTING PRONOUNCEMENTS
In March 2020, the Financial Accounting Standards Board (“FASB”) issued ASU No. 2020–04, “Reference Rate Reform” (“Topic 848”). This ASU provides optional guidance for a limited period to ease the potential burden in accounting for (or recognizing the effects of) reference rate reform on financial reporting. The amendments in this ASU apply to modifications to agreements (e.g., loans, debt securities, derivatives, borrowings) that replace a reference rate affected by reference rate reform (including rates referenced in fallback provisions) and contemporaneous modifications of other contract terms related to the replacement of the reference rate (including contract modifications to add or change fallback provisions). The following optional expedients for applying the requirements of certain Topics or Industry Subtopics in the Codification are permitted for contracts that are modified because of reference rate reform and that meet certain scope guidance: 1) Modifications of contracts within the scope of Topics 310, Receivables, and 470, Debt, should be accounted for by prospectively adjusting the effective interest rate; 2) Modifications of contracts within the scope of Topics 840, Leases, and 842, Leases, should be accounted for as a continuation of the existing contracts with no reassessments of the lease classification and the discount rate (for example, the incremental borrowing rate) or remeasurements of lease payments that otherwise would be required under those Topics for modifications not accounted for as separate contracts; and 3) Modifications of contracts do not require an entity to reassess its original conclusion about whether that contract contains an embedded derivative that is clearly and closely related to the economic characteristics and risks of the host contract under Subtopic 815-15, Derivatives and Hedging - Embedded Derivatives. In January 2021, ASU 2021–01 updated amendments in the new ASU to clarify that certain optional expedients and exceptions in Topic 848 for contract modifications and hedge accounting apply to derivative instruments that use an interest rate for margining, discounting, or contract price alignment that is modified as a result of reference rate reform. Amendments in this ASU and the expedients and exceptions in Topic 848 capture the incremental consequences of the scope clarification and tailor the existing guidance to derivative instruments affected by the discounting transition. An entity may elect to apply the amendments in this ASU on a full retrospective basis as of any date from the effective dates. The amendments in this ASU have differing effective dates, beginning with an interim period including and subsequent to March 12, 2020 through December 31, 2022, deferred now until December 31, 2024. The Company does not expect the adoption of ASU 2020–04 to have a material impact on its consolidated financial statements and related disclosures.
In June 2022, the FASB issued ASU 2022-03, Fair Value Measurement (Topic 820): Fair Value Measurement of Equity Securities Subject to Contractual Sale Restrictions. ASU 2022-03 clarifies that a contractual restriction on the sale of an equity security should not be considered in measuring fair value, nor should the contractual restriction be recognized and measured separately. Further, this ASU requires disclosure of the fair value of equity securities subject to contractual sale restrictions reflected in the balance sheet, the nature and remaining duration of the restrictions(s), and the circumstances that could cause a lapse in the restriction(s). ASU 2022-03 is effective for the Company for fiscal years beginning after December 15, 2023, including interim periods within those fiscal years, with early adoption permitted. The Company does not believe this ASU will have a material impact on its consolidated financial statements and related disclosures.
In March 2023, the FASB issued ASU 2023-02, Investments - Equity Method and Joint Ventures (Topic 323): Accounting for Investments in Tax Credit Structures Using the Proportional Amortization Method, a consensus of the Emerging Issues Task Force. ASU 2023-02 allows an entity the option to apply the proportional amortization method of accounting to other equity investments that are made for the primary purpose of receiving tax credits or other income tax benefits if certain conditions are met. Prior to this ASU, the application of the proportional amortization method of accounting was limited to investments in low-income housing tax credit structures. The proportional amortization method of accounting results in the amortization of applicable investments, as well as the related income tax credits or other income tax benefits received, being presented on a single line in the statements of income, income tax expense. Under this ASU, an entity has the option to apply the proportional amortization method of accounting to applicable investments on a tax-credit-program-by-tax-credit program basis. In addition, the amendments in this ASU require that all tax equity investments accounted for using the proportional amortization method use the delayed equity contribution guidance in paragraph 323-740-25-3, requiring a liability to be recognized for delayed equity contributions that are unconditional and legally binding or for equity contributions that are contingent upon a future event when that contingent event becomes probable. Under this ASU, low-income housing tax credit investments for which the proportional amortization method is not applied can no longer be accounted for using the delayed equity contribution guidance. Further, this ASU specifies that impairment of low-income housing tax credit investments not accounted for using the equity method must apply the impairment guidance in Subtopic 323-10: Investments - Equity Method and Joint Ventures - Overall. This ASU also clarifies that for low-income housing tax credit investments not accounted for under the proportional amortization method or the equity method, an entity shall account for them under Topic 321: Investments - Equity Securities. The amendments in the ASU also require additional disclosures in interim and annual periods concerning investments for which the proportional amortization method is applied, including (i) the nature of tax equity investments, and (ii) the effect of tax equity investments and related income tax credits and other income tax benefits on the financial position and results of operations. ASU 2023-02 is effective for the Company for fiscal years beginning after December 15, 2023, including interim periods within those fiscal years, with early adoption permitted. The Company is evaluating the effect that ASU 2023-02 will have on its consolidated financial statements and related disclosures.
In November 2023, the FASB issued guidance within ASU 2023-07, Segment Reporting (Topic 280): Improvements to Reportable Segment Disclosures. This ASU requires that a public entity that has a single reportable segment provide all the disclosures required by the amendments in this ASU and all existing disclosures in Topic 280.
The amendments in this ASU are intended to improve segment disclosure requirements, primarily through enhanced disclosures about significant segment expenses. The key amendments included in this ASU:
| ● | Require disclosure on an annual and interim basis, significant segment expenses that are regularly provided to the chief operating decision maker (“CODM”) and are included within each reported measure of segment profit and loss. |
| ● | Require disclosure on an annual and interim basis, an amount for other segment items (defined in the ASU) and a description of its composition. |
| ● | Clarify that if the CODM uses more than one measure of the segment's profit or loss in assessing performance, one or more of those additional measures may be reported. |
| ● | Require disclosure of the title and position of the CODM and an explanation of how the CODM uses the reported measure(s) of segment profit or loss in assessing performance. |
This ASU is effective for fiscal years beginning after December 15, 2023, and interim periods within fiscal years beginning after December 15, 2024. The amendments should be applied retrospectively to all prior periods presented in the financial statements. The Company is currently evaluating the effect that ASU 2023-07 will have on the Company’s consolidated financial statements and related disclosures.
In December 2023, the FASB issued guidance within ASU 2023-09, Income Taxes (Topic 740): Improvements to Income Tax Disclosures. The amendments in the ASU are intended to provide more transparency about income tax information through improvements to income tax disclosures primarily related to the rate reconciliation and income taxes paid information. The ASU requires disclosure in the rate reconciliation of specific categories as well as provide additional information for reconciling items that meet a quantitative threshold.
Those amendments require disclosure of the following information about income taxes paid on an annual basis:
| ● | Income taxes paid (net of refunds received), disaggregated by federal and state taxes and by individual jurisdictions in which income taxes paid (net of refunds received) is equal to or greater than five percent of total income taxes paid (net refunds received). |
| ● | Income tax expense (or benefit) from continuing operations disaggregated by federal and state jurisdictions. |
The ASU is effective for annual periods beginning after December 15, 2024. Early adoption is permitted for annual financial statements that have not yet been issued or made available for issuance. The amendments should be applied on a prospective basis. The Company is evaluating the effect that ASU 2023-09 will have on its consolidated financial statements and related disclosures.
NOTE 2 – BUSINESS COMBINATION
On February 24, 2023, the Company’s wholly-owned subsidiary, 1st Security Bank, completed the purchase of branches (“Branch Acquisition”) from Columbia State Bank to expand its franchise in Washington and Oregon. The Branch Acquisition included retail bank branches located in the communities of Goldendale and White Salmon, Washington and Manzanita, Newport, Ontario, Tillamook, and Waldport, Oregon. In accordance with the Purchase and Assumption Agreement, dated as of November 7, 2022, between Columbia State Bank and 1st Security Bank, the Bank acquired $
The Branch Acquisition was accounted for under the acquisition method of accounting and accordingly, the assets and liabilities were recorded at fair values on February 24, 2023, the date of acquisition. Determining the fair value of assets and liabilities is a complicated process involving significant judgement regarding methods and assumptions used to calculate estimated fair values. Fair values are preliminary and subject to refinement for up to one year after the closing date of the acquisition as information relative to closing date fair values become available. Due to the timing of the data conversion and the integration of operations of the branches onto the Company’s existing operations, historical reporting of the acquired branches is impracticable, and therefore, disclosure of the amounts of revenue and expenses attributable to the acquired branches since the acquisition date are not available.
The following table summarizes the estimated fair values of assets acquired and liabilities assumed at the date of acquisition:
| Acquired Book |
Fair Value |
Amount |
|||||||||||
| February 24, 2023 |
Value |
Adjustments |
Recorded |
||||||||||
| Assets |
|||||||||||||
| Cash and cash equivalents |
$ | $ | $ | ||||||||||
| Loans receivable |
( |
) | (1) | ||||||||||
| Premises and equipment |
|||||||||||||
| Accrued interest receivable |
|||||||||||||
| Core deposit intangible ("CDI") |
(2) | ||||||||||||
| Goodwill |
(3) | ||||||||||||
| Other assets |
|||||||||||||
| Total assets acquired |
$ | $ | $ | ||||||||||
| Liabilities |
|||||||||||||
| Deposits: |
|||||||||||||
| Noninterest-bearing accounts |
$ | $ | $ | ||||||||||
| Interest-bearing accounts |
( |
) | (4) | ||||||||||
| Total deposits |
( |
) | |||||||||||
| Accrued interest payable |
|||||||||||||
| Other liabilities |
|||||||||||||
| Total liabilities assumed |
$ | $ | ( |
) | $ | ||||||||
______________________
| (1) |
The fair value discount for acquired loans was determined by separate adjustments to reflect a credit risk and marketability component and a yield component reflecting the differential between portfolio and market yields. The discount on acquired loans will be accreted back into interest income using the effective yield method. of the loans acquired are purchased financial assets with credit deterioration. The fair value of the loans is $ |
| (2) |
The fair value adjustment represents the value of the core deposit base assumed in the Branch Acquisition based on a study performed by an independent consulting firm. This amount was recorded by the Company as an identifiable intangible asset and will be amortized as an expense on an accelerated basis over the average life of the core deposit base, which is estimated to be |
| (3) |
The fair value adjustment represents the value of the goodwill calculated from the purchase based on the purchase price, less the fair value of assets acquired net of liabilities assumed. The goodwill of $ |
| (4) |
The fair value of time deposits was calculated using a discounted cash flow analysis that calculated the present value of the projected cash flows from the portfolio versus the present value of a similar portfolio with a similar maturity profile at current market rates. This adjustment represents a difference in interest rates from the time deposits acquired and the estimated wholesale funding rates used in the application of fair value accounting. The discounted amount will be amortized into expense as an increase in interest expense over the maturity profile of the acquired time deposits. |
The disclosures regarding pro-forma data and the results of operations after the acquisition date are omitted as this information is not practical to obtain. The branches’ financial information is not reported on a stand-alone basis.
NOTE 3 – INVESTMENTS
The following tables present the amortized costs, unrealized gains, unrealized losses, and estimated fair values of securities available-for-sale and held-to-maturity, and ACL on securities held-to-maturity, at the dates indicated:
| December 31, 2023 | ||||||||||||||||||||
| Estimated | ||||||||||||||||||||
| Amortized | Unrealized | Unrealized | Fair | |||||||||||||||||
| SECURITIES AVAILABLE-FOR-SALE | Cost | Gains | Losses | Values | ACL | |||||||||||||||
| U.S. agency securities | $ | $ | $ | ( | ) | $ | $ | |||||||||||||
| Corporate securities | ( | ) | ||||||||||||||||||
| Municipal bonds | ( | ) | ||||||||||||||||||
| Mortgage-backed securities | ( | ) | ||||||||||||||||||
| U.S. Small Business Administration securities | ( | ) | ||||||||||||||||||
| Total securities available-for-sale | ( | ) | ||||||||||||||||||
| SECURITIES HELD-TO-MATURITY | ||||||||||||||||||||
| Corporate securities | ( | ) | ||||||||||||||||||
| Total securities held-to-maturity | ( | ) | ||||||||||||||||||
| Total securities | $ | $ | $ | ( | ) | $ | $ | |||||||||||||
| December 31, 2022 | ||||||||||||||||||||
| Estimated | ||||||||||||||||||||
| Amortized | Unrealized | Unrealized | Fair | |||||||||||||||||
| SECURITIES AVAILABLE-FOR-SALE | Cost | Gains | Losses | Values | ACL | |||||||||||||||
| U.S. agency securities | $ | $ | $ | ( | ) | $ | $ | |||||||||||||
| Corporate securities | ( | ) | ||||||||||||||||||
| Municipal bonds | ( | ) | ||||||||||||||||||
| Mortgage-backed securities | ( | ) | ||||||||||||||||||
| U.S. Small Business Administration securities | ( | ) | ||||||||||||||||||
| Total securities available-for-sale | ( | ) | ||||||||||||||||||
| SECURITIES HELD-TO-MATURITY | ||||||||||||||||||||
| Corporate securities | ( | ) | ||||||||||||||||||
| Total securities held-to-maturity | ( | ) | ||||||||||||||||||
| Total securities | $ | $ | $ | ( | ) | $ | $ | |||||||||||||
The following table presents the activity in the ACL on securities held-to-maturity by major security type for the years indicated:
| SECURITIES HELD-TO-MATURITY | For the Year Ended | |||||||
| Corporate Securities | December 31, 2023 | December 31, 2022 | ||||||
| Beginning ACL balance | $ | $ | ||||||
| Impact of adopting ASU 2016-13 | ||||||||
| Provision for (recapture of) credit losses | ( | ) | ||||||
| Securities charged-off | ||||||||
| Recoveries | ||||||||
| Total ending ACL balance | $ | $ | ||||||
Management measures expected credit losses on held-to-maturity debt securities on an individual basis. The estimate of expected credit losses considers historical credit loss information that is adjusted for current conditions and reasonable and supportable forecasts. Accrued interest receivable on held-to-maturity debt securities totaled $
The Bank monitors the credit quality of debt securities held-to-maturity quarterly using credit rating, material event notices, and changes in market value. The following table summarizes the amortized cost of debt securities held-to-maturity at the dates indicated, aggregated by credit quality indicator:
| December 31, | ||||||||
| Corporate securities | 2023 | 2022 | ||||||
| BBB/BBB- | $ | $ | ||||||
| BB+ | ||||||||
| Total | $ | $ | ||||||
At December 31, 2023, there were
The following table presents, as of December 31, 2023, investment securities which were pledged to secure borrowings, public deposits or other obligations as permitted or required by law:
| December 31, 2023 | ||||||||||||
| Purpose or beneficiary | Carrying Value | Amortized Cost | Fair Value | |||||||||
| State and local government public deposits | $ | $ | $ | |||||||||
| FRB - Bank Term Funding Program facility ("BTFP") | ||||||||||||
| Total pledged securities | $ | $ | $ | |||||||||
Investment securities that were in an unrealized loss position at the dates indicated are presented in the following tables, based on the length of time individual securities have been in an unrealized loss position.
| December 31, 2023 | ||||||||||||||||||||||||
| Less than 12 Months | 12 Months or Longer | Total | ||||||||||||||||||||||
| Fair | Unrealized | Fair | Unrealized | Fair | Unrealized | |||||||||||||||||||
| SECURITIES AVAILABLE-FOR-SALE | Value | Losses | Value | Losses | Value | Losses | ||||||||||||||||||
| U.S. agency securities | $ | $ | $ | $ | ( | ) | $ | $ | ( | ) | ||||||||||||||
| Corporate securities | ( | ) | ( | ) | ( | ) | ||||||||||||||||||
| Municipal bonds | ( | ) | ( | ) | ( | ) | ||||||||||||||||||
| Mortgage-backed securities | ( | ) | ( | ) | ( | ) | ||||||||||||||||||
| U.S. Small Business Administration securities | ( | ) | ( | ) | ( | ) | ||||||||||||||||||
| Total securities available-for-sale | $ | $ | ( | ) | $ | $ | ( | ) | $ | $ | ( | ) | ||||||||||||
| SECURITIES HELD-TO-MATURITY | ||||||||||||||||||||||||
| Corporate securities | ( | ) | ( | ) | ||||||||||||||||||||
| Total securities held-to-maturity | ( | ) | ( | ) | ||||||||||||||||||||
| Total | $ | $ | ( | ) | $ | $ | ( | ) | $ | $ | ( | ) | ||||||||||||
| December 31, 2022 | ||||||||||||||||||||||||
| Less than 12 Months | 12 Months or Longer | Total | ||||||||||||||||||||||
| Fair | Unrealized | Fair | Unrealized | Fair | Unrealized | |||||||||||||||||||
| SECURITIES AVAILABLE-FOR-SALE | Value | Losses | Value | Losses | Value | Losses | ||||||||||||||||||
| U.S. agency securities | $ | $ | ( | ) | $ | $ | ( | ) | $ | $ | ( | ) | ||||||||||||
| Corporate securities | ( | ) | ( | ) | ( | ) | ||||||||||||||||||
| Municipal bonds | ( | ) | ( | ) | ( | ) | ||||||||||||||||||
| Mortgage-backed securities | ( | ) | ( | ) | ( | ) | ||||||||||||||||||
| U.S. Small Business Administration securities | ( | ) | ( | ) | ( | ) | ||||||||||||||||||
| Total securities available-for-sale | $ | $ | ( | ) | $ | $ | ( | ) | $ | $ | ( | ) | ||||||||||||
| SECURITIES HELD-TO-MATURITY | ||||||||||||||||||||||||
| Corporate securities | ( | ) | ( | ) | ||||||||||||||||||||
| Total securities held-to-maturity | ( | ) | ( | ) | ||||||||||||||||||||
| Total | $ | $ | ( | ) | $ | $ | ( | ) | $ | $ | ( | ) | ||||||||||||
There were
There were
All of the available-for-sale mortgage-backed securities and U.S. Small Business Administration securities in an unrealized loss position are issued or guaranteed by government-sponsored enterprises, and the available-for-sale corporate securities are all investment grade and monitored for rating or outlook changes. Based on the Company’s evaluation of these securities,
The contractual maturities of securities available-for-sale and held-to-maturity at the dates indicated are listed below. Expected maturities of mortgage-backed securities may differ from contractual maturities because borrowers may have the right to call or prepay the obligations; therefore, these securities are classified separately with no specific maturity date.
| December 31, | ||||||||||||||||
| 2023 | 2022 | |||||||||||||||
| SECURITIES AVAILABLE-FOR-SALE | Amortized | Fair | Amortized | Fair | ||||||||||||
| U.S. agency securities | Cost | Value | Cost | Value | ||||||||||||
| Due within one year | $ | $ | $ | $ | ||||||||||||
| Due after one year through five years | ||||||||||||||||
| Due after five years through ten years | ||||||||||||||||
| Due after ten years | ||||||||||||||||
| Subtotal | ||||||||||||||||
| Corporate securities | ||||||||||||||||
| Due within one year | ||||||||||||||||
| Due after one year through five years | ||||||||||||||||
| Due after five years through ten years | ||||||||||||||||
| Due after ten years | ||||||||||||||||
| Subtotal | ||||||||||||||||
| Municipal bonds | ||||||||||||||||
| Due within one year | ||||||||||||||||
| Due after one year through five years | ||||||||||||||||
| Due after five years through ten years | ||||||||||||||||
| Due after ten years | ||||||||||||||||
| Subtotal | ||||||||||||||||
| Mortgage-backed securities | ||||||||||||||||
| Federal National Mortgage Association (“FNMA”) | ||||||||||||||||
| Federal Home Loan Mortgage Corporation (“FHLMC”) | ||||||||||||||||
| Government National Mortgage Association (“GNMA”) | ||||||||||||||||
| Subtotal | ||||||||||||||||
| U.S. Small Business Administration securities | ||||||||||||||||
| Due within one year | ||||||||||||||||
| Due after one year through five years | ||||||||||||||||
| Due after five years through ten years | ||||||||||||||||
| Due after ten years | ||||||||||||||||
| Subtotal | ||||||||||||||||
| Total securities available-for-sale | ||||||||||||||||
| SECURITIES HELD-TO-MATURITY | ||||||||||||||||
| Corporate securities | ||||||||||||||||
| Due after five years through ten years | ||||||||||||||||
| Total securities held-to-maturity | ||||||||||||||||
| Total securities | $ | $ | $ | $ | ||||||||||||
There were
NOTE 4 – LOANS RECEIVABLE AND ALLOWANCE FOR CREDIT LOSSES ON LOANS
The composition of the loan portfolio was as follows at the dates indicated:
| December 31, | ||||||||
| REAL ESTATE LOANS | 2023 | 2022 | ||||||
| Commercial | $ | $ | ||||||
| Construction and development | ||||||||
| Home equity | ||||||||
| One-to-four-family (excludes loans held for sale) | ||||||||
| Multi-family | ||||||||
| Total real estate loans | ||||||||
| CONSUMER LOANS | ||||||||
| Indirect home improvement | ||||||||
| Marine | ||||||||
| Other consumer | ||||||||
| Total consumer loans | ||||||||
| COMMERCIAL BUSINESS LOANS | ||||||||
| Commercial and industrial | ||||||||
| Warehouse lending | ||||||||
| Total commercial business loans | ||||||||
| Total loans receivable, gross | ||||||||
| ACL on loans | ( | ) | ( | ) | ||||
| Total loans receivable, net | $ | $ | ||||||
Loan amounts are net of unearned loan fees in excess of unamortized costs and premiums of $
Most of the Company’s commercial and multi-family real estate, construction, residential, and commercial business lending activities are with customers located in Western Washington, the Oregon Coast, and near our loan production offices in Vancouver, Washington and the Tri-Cities, Washington. The Company originates real estate, consumer and commercial business loans and has concentrations in these areas, however, indirect home improvement loans, including solar-related home improvement loans, are originated through a network of home improvement contractors and dealers located throughout Washington, Oregon, California, Idaho, Colorado, Arizona, Minnesota, Nevada, Texas, Utah, Massachusetts, Montana, and recently New Hampshire. Management reviewed dealer concentrations and determined as of December 31, 2023, any dealer owned by the same corporate entity will be included under that corporate entity and not as a separate dealer. Loans are generally secured by collateral and rights to collateral vary and are legally documented to the extent practicable. Local economic conditions may affect borrowers’ ability to meet the stated repayment terms.
At December 31, 2023, the Bank held approximately $
The Company has defined its loan portfolio into three segments that reflect the structure of the lending function, the Company’s strategic plan and the way management monitors performance and credit quality. The three loan portfolio segments are: (a) Real Estate Loans, (b) Consumer Loans and (c) Commercial Business Loans. Each of these segments is disaggregated into classes based on the risk characteristics of the borrower and/or the collateral type securing the loan. The following is a summary of each of the Company’s loan portfolio segments and classes:
Real Estate Loans
Commercial Lending. Loans originated by the Company primarily secured by income producing properties, including retail centers, warehouses, and office buildings located in our market areas.
Construction and Development Lending. Loans originated by the Company for the construction of, and secured by, commercial real estate, one-to-four-family, and multi-family residences and tracts of land for development that are not pre-sold. A portion of the one-to-four-family construction portfolio is custom construction loans to the intended occupant of the residence.
Home Equity Lending. Loans originated by the Company secured by second mortgages on one-to-four-family residences, including home equity lines of credit in our market areas.
One-to-Four-Family Real Estate Lending. One-to-four-family residential loans include owner-occupied properties (including second homes), and non-owner-occupied properties with four or less units. These loans originated by the Company or periodically purchased from banks are secured by first mortgages on one-to-four-family residences in our market areas that the Company intends to hold (excludes loans held for sale).
Multi-family Lending. Apartment term lending (five or more units) to current banking customers and community reinvestment loans for low to moderate income individuals in the Company’s footprint.
Consumer Loans
Indirect Home Improvement. Fixture secured loans for home improvement are originated by the Company through its network of home improvement contractors and dealers and are secured by the personal property installed in, on, or at the borrower’s real property, and may be perfected with a UCC‑2 financing statement filed in the county of the borrower’s residence. These indirect home improvement loans include replacement windows, siding, roofing, spas, and other home fixture installations, including solar related home improvement projects.
Marine. Loans originated by the Company, secured by boats, to borrowers primarily located in the states where the Company originates consumer loans.
Other Consumer. Loans originated by the Company to consumers in our retail branch footprint, including automobiles, recreational vehicles, direct home improvement loans, loans on deposits, and other consumer loans, primarily consisting of personal lines of credit and credit cards.
Commercial Business Loans
Commercial and Industrial (“C&I”) Lending. C&I loans originated by the Company to local small- and mid-sized businesses in our Puget Sound market area are secured primarily by accounts receivable, inventory, or personal property, plant and equipment. Some of the C&I loans purchased by the Company are outside of the greater Puget Sound market area. C&I loans are made on the basis of the borrower’s ability to make repayment from the cash flow of the borrower’s business.
Warehouse Lending. Loans originated to non-depository financial institutions and secured by notes originated by the non-depository financial institution. The Company has two distinct warehouse lending divisions: commercial warehouse re-lending secured by notes on construction loans and mortgage warehouse re-lending secured by notes on one-to-four-family loans. The Company’s commercial construction warehouse lines are secured by notes on construction loans and typically guaranteed by principals with experience in construction lending. Mortgage warehouse lending loans are funded through third-party residential mortgage bankers. Under this program, the Company provides short-term funding to the mortgage banking companies for the purpose of originating residential mortgage loans for sale into the secondary market.
Allowance for Credit Losses
The main drivers of the provision for credit losses on loans recorded in 2023 were increases in outstanding loans, net charge-offs, and specific reserves on individually evaluated loans.
The following tables detail activity in the ACL on loans and the allowance for loan losses by loan categories, at or for the years indicated:
| At or For the Year Ended December 31, 2023 | ||||||||||||||||||||
| Real | Commercial | |||||||||||||||||||
| ACL ON LOANS | Estate | Consumer | Business | Unallocated | Total | |||||||||||||||
| Beginning balance | $ | $ | $ | $ | $ | |||||||||||||||
| Provision for credit losses on loans | ||||||||||||||||||||
| Charge-offs | ( | ) | ( | ) | ( | ) | ( | ) | ||||||||||||
| Recoveries | ||||||||||||||||||||
| Net charge-offs | ( | ) | ( | ) | ( | ) | ( | ) | ||||||||||||
| Total ending ACL balance | $ | $ | $ | $ | $ | |||||||||||||||
| At or For the Year Ended December 31, 2022 | ||||||||||||||||||||
| Real | Commercial | |||||||||||||||||||
| ACL ON LOANS | Estate | Consumer | Business | Unallocated | Total | |||||||||||||||
| Beginning balance, prior to adoption of ASC 326 | $ | $ | $ | $ | $ | |||||||||||||||
| Impact of adopting ASC 326 | ( | ) | ( | ) | ( | ) | ( | ) | ||||||||||||
| Provision for credit losses on loans | ||||||||||||||||||||
| Charge-offs | ( | ) | ( | ) | ||||||||||||||||
| Recoveries | ||||||||||||||||||||
| Net charge-offs | ( | ) | ( | ) | ||||||||||||||||
| Total ending ACL balance | $ | $ | $ | $ | $ | |||||||||||||||
The allowance for loan losses is reported using the incurred loss method at or for the year ended December 31, 2021:
| At or For the Year Ended December 31, 2021 | ||||||||||||||||||||
| Commercial | ||||||||||||||||||||
| ALLOWANCE FOR LOAN LOSSES | Real Estate | Consumer | Business | Unallocated | Total | |||||||||||||||
| Beginning balance | $ | $ | $ | $ | $ | |||||||||||||||
| Provision for (recapture of) loan losses | ( | ) | ( | ) | ||||||||||||||||
| Charge-offs | ( | ) | ( | ) | ( | ) | ||||||||||||||
| Recoveries | ||||||||||||||||||||
| Net charge-offs | ( | ) | ( | ) | ( | ) | ||||||||||||||
| Total ending allowance for loan losses balance | $ | $ | $ | $ | $ | |||||||||||||||
| Period end amount allocated to: | ||||||||||||||||||||
| Loans individually evaluated for impairment | $ | $ | $ | $ | $ | |||||||||||||||
| Loans collectively evaluated for impairment | ||||||||||||||||||||
| Ending balance | $ | $ | $ | $ | $ | |||||||||||||||
| LOANS RECEIVABLE | ||||||||||||||||||||
| Loans individually evaluated for impairment | $ | $ | $ | $ | $ | |||||||||||||||
| Loans collectively evaluated for impairment | ||||||||||||||||||||
| Ending balance | $ | $ | $ | $ | $ | |||||||||||||||
Nonaccrual and Past Due Loans. Loans are considered past due if the required principal and interest payments have not been received as of the date such payments were due. Loans are automatically placed on nonaccrual once the loan is 90 days past due or sooner if, in management’s opinion, the borrower may be unable to meet payment obligations as they become due, or as required by regulatory authorities.
Loan Modifications to Borrowers Experiencing Financial Difficulty
The Company may modify the contractual terms of a loan to a borrower experiencing financial difficulty as a part of ongoing loss mitigation strategies. These modifications may result in an interest rate reduction, term extension, payment deferral, or a combination thereof. The Company typically does not offer principal forgiveness.
The following tables present the amortized basis of loans that were modified to borrowers experiencing financial difficulty during the period by loan class and modification type.
| Payment Deferral | ||||||||||
| Amortized Cost | % of Total Loan | |||||||||
| December 31, 2023 | Basis | Type | Financial Effect | |||||||
| Commercial real estate | $ | % |
| |||||||
| Combination - Term Extension and Interest Rate Reduction | ||||||||||
| Amortized Cost | % of Total Loan | |||||||||
| December 31, 2023 | Basis | Type | Financial Effect | |||||||
| C&I | $ |
| ||||||||
There were no loans that were modified on or after January 1, 2023, the date the Company adopted ASU 2022–02, through December 31, 2023 that subsequently defaulted during the period presented.
Troubled Debt Restructurings (“TDRs”)
At December 31, 2022, the Company had TDRs, both of which were commercial business loans, on nonaccrual totaling $
Nonaccrual and Past Due Loans
The following tables provide information pertaining to the aging analysis of contractually past due loans and nonaccrual loans at the dates indicated:
| December 31, 2023 | ||||||||||||||||||||||||||||
| 30-59 | 60-89 | |||||||||||||||||||||||||||
| Days | Days | 90 Days | Total | Total | ||||||||||||||||||||||||
| Past | Past | or More | Past | Loans | Non- | |||||||||||||||||||||||
| REAL ESTATE LOANS | Due | Due | Past Due | Due | Current | Receivable | Accrual (1) | |||||||||||||||||||||
| Commercial | $ | $ | $ | $ | $ | $ | $ | |||||||||||||||||||||
| Construction and development | ||||||||||||||||||||||||||||
| Home equity | ||||||||||||||||||||||||||||
| One-to-four-family | ||||||||||||||||||||||||||||
| Multi-family | ||||||||||||||||||||||||||||
| Total real estate loans | ||||||||||||||||||||||||||||
| CONSUMER LOANS | ||||||||||||||||||||||||||||
| Indirect home improvement | ||||||||||||||||||||||||||||
| Marine | ||||||||||||||||||||||||||||
| Other consumer | ||||||||||||||||||||||||||||
| Total consumer loans | ||||||||||||||||||||||||||||
| COMMERCIAL BUSINESS LOANS | ||||||||||||||||||||||||||||
| C&I | ||||||||||||||||||||||||||||
| Warehouse lending | ||||||||||||||||||||||||||||
| Total commercial business loans | ||||||||||||||||||||||||||||
| Total loans | $ | $ | $ | $ | $ | $ | $ | |||||||||||||||||||||
| December 31, 2022 | ||||||||||||||||||||||||||||
| 30-59 | 60-89 | |||||||||||||||||||||||||||
| Days | Days | 90 Days | Total | Total | ||||||||||||||||||||||||
| Past | Past | or More | Past | Loans | Non- | |||||||||||||||||||||||
| REAL ESTATE LOANS | Due | Due | Past Due | Due | Current | Receivable | Accrual (1) | |||||||||||||||||||||
| Commercial | $ | $ | $ | $ | $ | $ | $ | |||||||||||||||||||||
| Construction and development | ||||||||||||||||||||||||||||
| Home equity | ||||||||||||||||||||||||||||
| One-to-four-family | ||||||||||||||||||||||||||||
| Multi-family | ||||||||||||||||||||||||||||
| Total real estate loans | ||||||||||||||||||||||||||||
| CONSUMER LOANS | ||||||||||||||||||||||||||||
| Indirect home improvement | ||||||||||||||||||||||||||||
| Marine | ||||||||||||||||||||||||||||
| Other consumer | ||||||||||||||||||||||||||||
| Total consumer loans | ||||||||||||||||||||||||||||
| COMMERCIAL BUSINESS LOANS | ||||||||||||||||||||||||||||
| C&I | ||||||||||||||||||||||||||||
| Warehouse lending | ||||||||||||||||||||||||||||
| Total commercial business loans | ||||||||||||||||||||||||||||
| Total loans | $ | $ | $ | $ | $ | $ | $ | |||||||||||||||||||||
______________________________
| (1) | Includes past due loans as applicable. |
There were
Credit Quality Indicators
As part of the Company’s on-going monitoring of credit quality of the loan portfolio, management tracks certain credit quality indicators including trends related to (i) the risk grading of loans, (ii) the level of classified loans, (iii) net charge-offs, (iv) nonperforming loans and (v) the general economic conditions in the Company’s markets.
The Company utilizes a risk grading matrix to assign a risk grade to its real estate and commercial business loans. Loans are graded on a scale of 1 to 10, with loans in risk grades 1 to 6 reported as “Pass” and loans in risk grades 7 to 10 reported as classified loans in the Company’s ACL analysis.
A description of the 10 risk grades is as follows:
| ● | Grades 1 and 2 - These grades include loans to very high-quality borrowers with excellent or desirable business credit. |
| ● | Grade 3 - This grade includes loans to borrowers of good business credit with moderate risk. |
| ● | Grades 4 and 5 - These grades include “Pass” grade loans to borrowers of average credit quality and risk. |
| ● | Grade 6 - This grade includes loans on management’s “Watch” list and is intended to be utilized on a temporary basis for “Pass” grade borrowers where frequent and thorough monitoring is required due to credit weaknesses and where significant risk-modifying action is anticipated in the near term. |
| ● | Grade 7 - This grade is for “Other Assets Especially Mentioned (OAEM)” in accordance with regulatory guidelines and includes borrowers where performance is poor or significantly less than expected. |
| ● | Grade 8 - This grade includes “Substandard” loans in accordance with regulatory guidelines which represent an unacceptable business credit where a loss is possible if loan weakness is not corrected. |
| ● | Grade 9 - This grade includes “Doubtful” loans in accordance with regulatory guidelines where a loss is highly probable. |
| ● | Grade 10 - This grade includes “Loss” loans in accordance with regulatory guidelines for which total loss is expected and when identified are charged off. |
Homogeneous loans are risk rated based upon the Federal Financial Institutions Examination Council’s Uniform Retail Credit Classification and Account Management Policy. Loans classified under this policy at the Company are consumer loans which include indirect home improvement, solar, marine, other consumer, and one-to-four-family first and second liens. Under the Uniform Retail Credit Classification Policy, loans that are current or less than 90 days past due are graded “Pass” and risk graded “4” or “5” internally. Loans that are past due more than 90 days are classified “Substandard” risk graded “8” internally until the loan has demonstrated consistent performance, typically six months of contractual payments. Closed-end loans that are 120 days past due and open-end loans that are 180 days past due are charged off based on the value of the collateral less cost to sell. Management may choose to conservatively risk rate credits even if paying in accordance with the loan’s repayment terms.
Commercial real estate, construction and development, multi-family and commercial business loans are evaluated individually for their risk classification and may be classified as “Substandard” even if current on their loan payment obligations. We regularly review our credits for accuracy of risk grades whenever we receive new information. Borrowers are generally required to submit financial information at regular intervals. Typically, commercial borrowers with lines of credit are required to submit financial information with reporting intervals ranging from monthly to annually depending on credit size, risk, and complexity. In addition, nonowner-occupied commercial real estate borrowers with loans exceeding a certain dollar threshold are usually required to submit rent rolls or property income statements annually. We monitor construction loans monthly. We also review loans graded “Watch” or worse, regardless of loan type, no less than quarterly.
The following tables summarize risk rated loan balances by category as of December 31, 2023 and 2022. Term loans that are renewed or extended for periods longer than 90 days are presented as new originations in the year of the most recent renewal or extension.
| December 31, 2023 | ||||||||||||||||||||||||||||||||||||
| Revolving Loans | ||||||||||||||||||||||||||||||||||||
| REAL ESTATE LOANS | Term Loans by Year of Origination | Converted | ||||||||||||||||||||||||||||||||||
| Commercial | 2023 | 2022 | 2021 | 2020 | 2019 | Prior | Revolving Loans | to Term | Total Loans | |||||||||||||||||||||||||||
| Pass | $ | $ | $ | $ | $ | $ | $ | $ | $ | |||||||||||||||||||||||||||
| Watch | ||||||||||||||||||||||||||||||||||||
| Special mention | ||||||||||||||||||||||||||||||||||||
| Substandard | ||||||||||||||||||||||||||||||||||||
| Total commercial | ||||||||||||||||||||||||||||||||||||
| Construction and development | ||||||||||||||||||||||||||||||||||||
| Pass | ||||||||||||||||||||||||||||||||||||
| Substandard | ||||||||||||||||||||||||||||||||||||
| Total construction and development | ||||||||||||||||||||||||||||||||||||
| Home equity | ||||||||||||||||||||||||||||||||||||
| Pass | ||||||||||||||||||||||||||||||||||||
| Substandard | ||||||||||||||||||||||||||||||||||||
| Total home equity | ||||||||||||||||||||||||||||||||||||
| Home equity gross charge-offs | ||||||||||||||||||||||||||||||||||||
| One-to-four-family | ||||||||||||||||||||||||||||||||||||
| Pass | ||||||||||||||||||||||||||||||||||||
| Substandard | ||||||||||||||||||||||||||||||||||||
| Total one-to-four-family | ||||||||||||||||||||||||||||||||||||
| Multi-family | ||||||||||||||||||||||||||||||||||||
| Pass | ||||||||||||||||||||||||||||||||||||
| Total multi-family | ||||||||||||||||||||||||||||||||||||
| Total real estate loans | $ | $ | $ | $ | $ | $ | $ | $ | $ | |||||||||||||||||||||||||||
| December 31, 2023 | ||||||||||||||||||||||||||||||||||||
| Revolving Loans | ||||||||||||||||||||||||||||||||||||
| CONSUMER LOANS | Term Loans by Year of Origination | Converted | ||||||||||||||||||||||||||||||||||
| Indirect home improvement | 2023 | 2022 | 2021 | 2020 | 2019 | Prior | Revolving Loans | to Term | Total Loans | |||||||||||||||||||||||||||
| Pass | $ | $ | $ | $ | $ | $ | $ | $ | $ | |||||||||||||||||||||||||||
| Substandard | ||||||||||||||||||||||||||||||||||||
| Total indirect home improvement | ||||||||||||||||||||||||||||||||||||
| Indirect home improvement gross charge-offs | ||||||||||||||||||||||||||||||||||||
| Marine | ||||||||||||||||||||||||||||||||||||
| Pass | ||||||||||||||||||||||||||||||||||||
| Substandard | ||||||||||||||||||||||||||||||||||||
| Total marine | ||||||||||||||||||||||||||||||||||||
| Marine gross charge-offs | ||||||||||||||||||||||||||||||||||||
| Other consumer | ||||||||||||||||||||||||||||||||||||
| Pass | ||||||||||||||||||||||||||||||||||||
| Substandard | ||||||||||||||||||||||||||||||||||||
| Total other consumer | ||||||||||||||||||||||||||||||||||||
| Other consumer gross charge-offs | ||||||||||||||||||||||||||||||||||||
| Total consumer loans | $ | $ | $ | $ | $ | $ | $ | $ | $ | |||||||||||||||||||||||||||
| December 31, 2023 | ||||||||||||||||||||||||||||||||||||
| COMMERCIAL | Revolving Loans | |||||||||||||||||||||||||||||||||||
| BUSINESS LOANS | Term Loans by Year of Origination | Converted | ||||||||||||||||||||||||||||||||||
| C&I | 2023 | 2022 | 2021 | 2020 | 2019 | Prior | Revolving Loans | to Term | Total Loans | |||||||||||||||||||||||||||
| Pass | $ | $ | $ | $ | $ | $ | $ | $ | $ | |||||||||||||||||||||||||||
| Watch | ||||||||||||||||||||||||||||||||||||
| Special mention | ||||||||||||||||||||||||||||||||||||
| Substandard | ||||||||||||||||||||||||||||||||||||
| Doubtful | ||||||||||||||||||||||||||||||||||||
| Total C&I | ||||||||||||||||||||||||||||||||||||
| C&I gross charge-offs | ||||||||||||||||||||||||||||||||||||
| Warehouse lending | ||||||||||||||||||||||||||||||||||||
| Pass | ||||||||||||||||||||||||||||||||||||
| Watch | ||||||||||||||||||||||||||||||||||||
| Total warehouse lending | ||||||||||||||||||||||||||||||||||||
| Total commercial business loans | $ | $ | $ | $ | $ | $ | $ | $ | $ | |||||||||||||||||||||||||||
| TOTAL LOANS RECEIVABLE, GROSS | ||||||||||||||||||||||||||||||||||||
| Pass | $ | $ | $ | $ | $ | $ | $ | $ | $ | |||||||||||||||||||||||||||
| Watch | ||||||||||||||||||||||||||||||||||||
| Special mention | ||||||||||||||||||||||||||||||||||||
| Substandard | ||||||||||||||||||||||||||||||||||||
| Doubtful | ||||||||||||||||||||||||||||||||||||
| Total loans receivable, gross | $ | $ | $ | $ | $ | $ | $ | $ | $ | |||||||||||||||||||||||||||
| Total gross charge-offs | $ | $ | $ | $ | $ | $ | $ | $ | $ | |||||||||||||||||||||||||||
| December 31, 2022 | ||||||||||||||||||||||||||||||||||||
| Revolving Loans | ||||||||||||||||||||||||||||||||||||
| REAL ESTATE LOANS | Term Loans by Year of Origination | Converted | ||||||||||||||||||||||||||||||||||
| Commercial | 2022 | 2021 | 2020 | 2019 | 2018 | Prior | Revolving Loans | to Term | Total Loans | |||||||||||||||||||||||||||
| Pass | $ | $ | $ | $ | $ | $ | $ | $ | $ | |||||||||||||||||||||||||||
| Watch | ||||||||||||||||||||||||||||||||||||
| Special mention | ||||||||||||||||||||||||||||||||||||
| Substandard | ||||||||||||||||||||||||||||||||||||
| Total commercial | ||||||||||||||||||||||||||||||||||||
| Construction and development | ||||||||||||||||||||||||||||||||||||
| Pass | ||||||||||||||||||||||||||||||||||||
| Total construction and development | ||||||||||||||||||||||||||||||||||||
| Home equity | ||||||||||||||||||||||||||||||||||||
| Pass | ||||||||||||||||||||||||||||||||||||
| Watch | ||||||||||||||||||||||||||||||||||||
| Special mention | ||||||||||||||||||||||||||||||||||||
| Substandard | ||||||||||||||||||||||||||||||||||||
| Total home equity | ||||||||||||||||||||||||||||||||||||
| One-to-four-family | ||||||||||||||||||||||||||||||||||||
| Pass | ||||||||||||||||||||||||||||||||||||
| Watch | ||||||||||||||||||||||||||||||||||||
| Special mention | ||||||||||||||||||||||||||||||||||||
| Substandard | ||||||||||||||||||||||||||||||||||||
| Total one-to-four-family | ||||||||||||||||||||||||||||||||||||
| Multi-family | ||||||||||||||||||||||||||||||||||||
| Pass | ||||||||||||||||||||||||||||||||||||
| Total multi-family | ||||||||||||||||||||||||||||||||||||
| Total real estate loans | $ | $ | $ | $ | $ | $ | $ | $ | $ | |||||||||||||||||||||||||||
| December 31, 2022 | ||||||||||||||||||||||||||||||||||||
| Revolving Loans | ||||||||||||||||||||||||||||||||||||
| CONSUMER LOANS | Term Loans by Year of Origination | Converted | ||||||||||||||||||||||||||||||||||
| Indirect home improvement | 2022 | 2021 | 2020 | 2019 | 2018 | Prior | Revolving Loans | to Term | Total Loans | |||||||||||||||||||||||||||
| Pass | $ | $ | $ | $ | $ | $ | $ | $ | $ | |||||||||||||||||||||||||||
| Watch | ||||||||||||||||||||||||||||||||||||
| Special Mention | ||||||||||||||||||||||||||||||||||||
| Substandard | ||||||||||||||||||||||||||||||||||||
| Total indirect home improvement | ||||||||||||||||||||||||||||||||||||
| Marine | ||||||||||||||||||||||||||||||||||||
| Pass | ||||||||||||||||||||||||||||||||||||
| Watch | ||||||||||||||||||||||||||||||||||||
| Special Mention | ||||||||||||||||||||||||||||||||||||
| Substandard | ||||||||||||||||||||||||||||||||||||
| Total marine | ||||||||||||||||||||||||||||||||||||
| Other consumer | ||||||||||||||||||||||||||||||||||||
| Pass | ||||||||||||||||||||||||||||||||||||
| Substandard | ||||||||||||||||||||||||||||||||||||
| Total other consumer | ||||||||||||||||||||||||||||||||||||
| Total consumer loans | $ | $ | $ | $ | $ | $ | $ | $ | $ | |||||||||||||||||||||||||||
| December 31, 2022 | ||||||||||||||||||||||||||||||||||||
| COMMERCIAL | Revolving Loans | |||||||||||||||||||||||||||||||||||
| BUSINESS LOANS | Term Loans by Year of Origination | Converted | ||||||||||||||||||||||||||||||||||
| C&I | 2022 | 2021 | 2020 | 2019 | 2018 | Prior | Revolving Loans | to Term | Total Loans | |||||||||||||||||||||||||||
| Pass | $ | $ | $ | $ | $ | $ | $ | $ | $ | |||||||||||||||||||||||||||
| Watch | ||||||||||||||||||||||||||||||||||||
| Special mention | ||||||||||||||||||||||||||||||||||||
| Substandard | ||||||||||||||||||||||||||||||||||||
| Total C&I | ||||||||||||||||||||||||||||||||||||
| Warehouse lending | ||||||||||||||||||||||||||||||||||||
| Pass | ||||||||||||||||||||||||||||||||||||
| Watch | ||||||||||||||||||||||||||||||||||||
| Total warehouse lending | ||||||||||||||||||||||||||||||||||||
| Total commercial business loans | $ | $ | $ | $ | $ | $ | $ | $ | $ | |||||||||||||||||||||||||||
| TOTAL LOANS RECEIVABLE, GROSS | ||||||||||||||||||||||||||||||||||||
| Pass | $ | $ | $ | $ | $ | $ | $ | $ | $ | |||||||||||||||||||||||||||
| Watch | ||||||||||||||||||||||||||||||||||||
| Special mention | ||||||||||||||||||||||||||||||||||||
| Substandard | ||||||||||||||||||||||||||||||||||||
| Total loans receivable, gross | $ | $ | $ | $ | $ | $ | $ | $ | $ | |||||||||||||||||||||||||||
The following table presents the amortized cost basis of loans on nonaccrual status at the dates indicated:
| December 31, 2023 | December 31, 2022 | |||||||||||||||||||||||
| Nonaccrual with | Nonaccrual with | Total | Nonaccrual with | Nonaccrual with | Total | |||||||||||||||||||
| REAL ESTATE LOANS | No ACL | ACL | Nonaccrual | No ACL | ACL | Nonaccrual | ||||||||||||||||||
| Commercial | $ | $ | $ | $ | $ | $ | ||||||||||||||||||
| Construction and development | ||||||||||||||||||||||||
| Home equity | ||||||||||||||||||||||||
| One-to-four-family | ||||||||||||||||||||||||
| CONSUMER LOANS | ||||||||||||||||||||||||
| Indirect home improvement | ||||||||||||||||||||||||
| Marine | ||||||||||||||||||||||||
| Other consumer | ||||||||||||||||||||||||
| COMMERCIAL BUSINESS LOANS | ||||||||||||||||||||||||
| C&I | ||||||||||||||||||||||||
| Total | $ | $ | $ | $ | $ | $ | ||||||||||||||||||
The Company recognized interest income on a cash basis for nonaccrual loans of $
The following table presents the amortized cost basis of collateral dependent loans by class of loans as of dates indicated:
| December 31, 2023 | December 31, 2022 | |||||||||||||||||||||||||||
| Other | Other | |||||||||||||||||||||||||||
| Commercial | Residential | Non-Real | Residential | Non-Real | ||||||||||||||||||||||||
| REAL ESTATE LOANS | Real Estate | Real Estate | Estate | Total | Real Estate | Estate | Total | |||||||||||||||||||||
| Commercial | $ | $ | $ | $ | $ | $ | $ | |||||||||||||||||||||
| Construction and development | ||||||||||||||||||||||||||||
| Home equity | $ | $ | ||||||||||||||||||||||||||
| One-to-four-family | ||||||||||||||||||||||||||||
| CONSUMER LOANS | ||||||||||||||||||||||||||||
| Indirect home improvement | ||||||||||||||||||||||||||||
| Marine | ||||||||||||||||||||||||||||
| COMMERCIAL BUSINESS LOANS | ||||||||||||||||||||||||||||
| C&I | ||||||||||||||||||||||||||||
| Total | $ | $ | $ | $ | $ | $ | $ | |||||||||||||||||||||
Related Party Loans
Certain directors and executive officers or their related affiliates are customers of and have had banking transactions with the Company. Total loans to directors, executive officers, and their affiliates are subject to regulatory limitations.
Outstanding loan balances of related party loans were as follows and were within regulatory limitations:
| At December 31, | ||||||||
| 2023 | 2022 | |||||||
| Beginning balance | $ | $ | ||||||
| Additions | ||||||||
| Repayments | ( | ) | ( | ) | ||||
| Ending balance | $ | $ | ||||||
The aggregate maximum loan balance of extended credit to related parties was $
NOTE 5 – MORTGAGE SERVICING RIGHTS
Loans serviced for others are not included on the Consolidated Balance Sheets. The unpaid principal balances of permanent loans serviced for others were $
The following table summarizes the activity for MSRs at or for the years indicated:
| At or For the Year Ended | ||||||||||||
| December 31, | ||||||||||||
| 2023 | 2022 | 2021 | ||||||||||
| Beginning balance, at the lower of cost or fair value | $ | $ | $ | |||||||||
| Additions | ||||||||||||
| MSRs amortized | ( | ) | ( | ) | ( | ) | ||||||
| Recovery (impairment) of MSRs | ( | ) | ||||||||||
| Ending balance, at the lower of cost or fair value | $ | $ | $ | |||||||||
| MSRs held for sale, held at the lower of cost or fair value included in the ending balance above | $ | $ | $ | |||||||||
The fair value of the mortgage servicing rights’ assets was $
The following provides valuation assumptions used in determining the fair value of MSRs at the dates indicated:
| At December 31, | ||||||||
| Key assumptions: | 2023 | 2022 | ||||||
| Weighted average discount rate | % | % | ||||||
| Conditional prepayment rate (“CPR”) | % | % | ||||||
| Weighted average life in years | ||||||||
Key economic assumptions of the current fair value for single family MSRs are presented in the table below. Also presented is the sensitivity to market rate changes for the par rate coupon for a conventional one-to-four-family FNMA, FHLMC, GNMA, or FHLB serviced home loan. The table below references a
| December 31, | ||||||||||||
| 2023 | 2022 | |||||||||||
| Aggregate portfolio principal balance | $ | $ | ||||||||||
| Weighted average rate of loans in servicing portfolio | % | % | ||||||||||
| At December 31, 2023 | Base | 0.5% Adverse Rate Change | 1.0% Adverse Rate Change | |||||||||
| Conditional prepayment rate | % | % | % | |||||||||
| Fair value MSRs | $ | $ | $ | |||||||||
| Percentage of MSRs | % | % | % | |||||||||
| Discount rate | % | % | % | |||||||||
| Fair value MSRs | $ | $ | $ | |||||||||
| Percentage of MSRs | % | % | % | |||||||||
| At December 31, 2022 | Base | 0.5% Adverse Rate Change | 1.0% Adverse Rate Change | |||||||||
| Conditional prepayment rate | % | % | % | |||||||||
| Fair value MSRs | $ | $ | $ | |||||||||
| Percentage of MSRs | % | % | % | |||||||||
| Discount rate | % | % | % | |||||||||
| Fair value MSRs | $ | $ | $ | |||||||||
| Percentage of MSRs | % | % | % | |||||||||
These sensitivities are hypothetical and should be used with caution as the tables above demonstrate the Company’s methodology for estimating the fair value of MSRs which is highly sensitive to changes in key assumptions. For example, actual prepayment experience may differ and any difference may have a material effect on the fair value of MSRs. Changes in fair value resulting from changes in assumptions generally cannot be extrapolated because the relationship of the change in the assumption to the change in fair value may not be linear. Also, in these tables, the effects of a variation in a particular assumption on the fair value of MSRs is calculated without changing any other assumption; in reality, changes in one factor may be associated with changes in another (for example, decreases in market interest rates may provide an incentive to refinance; however, this may also indicate a slowing economy and an increase in the unemployment rate, which reduces the number of borrowers who qualify for refinancing), which may magnify or counteract the sensitivities. Thus, any measurement of the fair value of MSRs is limited by the conditions existing and assumptions made at a particular point in time. Those assumptions may not be appropriate if they are applied to a different point in time.
The Company recorded $
NOTE 6 – PREMISES AND EQUIPMENT
Premises and equipment at the dates indicated were as follows:
| December 31, |
||||||||
| 2023 |
2022 |
|||||||
| Land |
$ | $ | ||||||
| Buildings |
||||||||
| Furniture, fixtures, and equipment |
||||||||
| Leasehold improvements |
||||||||
| Building improvements |
||||||||
| Projects in process |
||||||||
| Subtotal |
||||||||
| Less accumulated depreciation and amortization |
( |
) | ( |
) | ||||
| Total |
$ | $ | ||||||
Depreciation and amortization expense for these assets totaled $
NOTE 7 – LEASES
The Company has operating leases for retail bank and home lending branches, loan production offices, and certain equipment. The Company’s leases have remaining lease terms of months to six years and months, some of which include options to extend the leases for up to years.
The components of lease cost (included in occupancy expense on the Consolidated Statements of Income) for the years indicated are as follows:
| For Year Ended December 31, |
||||||||||||
| Lease cost: |
2023 |
2022 |
2021 |
|||||||||
| Operating lease cost |
$ | $ | $ | |||||||||
| Short-term lease cost |
||||||||||||
| Total lease cost |
$ | $ | $ | |||||||||
The following table provides supplemental information related to operating leases at or for the years indicated:
| Cash paid for amounts included in the |
At or For the Year Ended December 31, |
|||||||
| measurement of lease liabilities: |
2023 |
2022 |
||||||
| Operating cash flows from operating leases |
$ | $ | ||||||
| Weighted average remaining lease term - operating leases (in years) |
||||||||
| Weighted average discount rate - operating leases |
% |
% |
||||||
The Company’s leases typically do not contain a discount rate implicit in the lease contract. As an alternative, the discount rate used in determining the lease liability for each individual lease was the FHLB of Des Moines’ fixed advance rate.
Maturities of operating lease liabilities at December 31, 2023 for future periods are as follows:
| 2024 |
$ | |||
| 2025 |
||||
| 2026 |
||||
| 2027 |
||||
| 2028 |
||||
| Thereafter |
||||
| Total lease payments |
||||
| Less imputed interest |
( |
) | ||
| Total |
$ |
NOTE 8 – OTHER REAL ESTATE OWNED (“OREO”)
The following table presents the activity related to OREO at and for the years indicated:
| At or For the Year Ended |
||||||||||||
| December 31, |
||||||||||||
| 2023 |
2022 |
2021 |
||||||||||
| Beginning balance |
$ | $ | $ | |||||||||
| Loans transferred to OREO |
||||||||||||
| Closed retail branch transferred to OREO |
||||||||||||
| Gross proceeds from sale of OREO |
( |
) | ( |
) | ( |
) | ||||||
| Gain (loss) on sale of OREO |
( |
) | ||||||||||
| Ending balance |
$ | $ | $ | |||||||||
There were OREO properties at December 31, 2023, OREO property (a closed branch in Centralia, Washington) at December 31, 2022 and at December 31, 2021. OREO holding costs were $
There were $
NOTE 9 – DEPOSITS
Deposits are summarized as follows at the dates indicated:
| December 31, |
||||||||
| 2023 |
2022 |
|||||||
| Noninterest-bearing checking |
$ | $ | ||||||
| Interest-bearing checking (1) |
||||||||
| Savings |
||||||||
| Money market (2) |
||||||||
| Certificates of deposit less than $100,000 (3) |
||||||||
| Certificates of deposit of $100,000 through $250,000 |
||||||||
| Certificates of deposit of $250,000 and over |
||||||||
| Escrow accounts related to mortgages serviced (4) |
||||||||
| Total |
$ | $ | ||||||
_____________________________
| (1) |
Includes $ |
| (2) |
Includes $ |
| (3) |
Includes $ |
| (4) |
Noninterest-bearing accounts. |
Scheduled maturities of time deposits at December 31, 2023 for future years ending are as follows:
| December 31, 2023 |
||||
| Maturing in 2024 |
$ | |||
| Maturing in 2025 |
||||
| Maturing in 2026 |
||||
| Maturing in 2027 |
||||
| Maturing in 2028 and thereafter |
||||
| Total |
$ | |||
Interest expense by deposit category for the years indicated is as follows:
| Year Ended |
||||||||||||
| December 31, |
||||||||||||
| 2023 |
2022 |
2021 |
||||||||||
| Interest-bearing checking |
$ | $ | $ | |||||||||
| Savings and money market |
||||||||||||
| Certificates of deposit |
||||||||||||
| Total |
$ | $ | $ | |||||||||
The Company had related party deposits of approximately $
NOTE 10 – EMPLOYEE BENEFITS
401(k) Plan
The Company has a salary deferral 401(k) Plan covering substantially all of its employees. Employees are eligible to participate in the 401(k) plan at the date of hire if they are 18 years of age. Eligible employees may contribute through payroll deductions and are
NOTE 11 – DEBT
Borrowings
The Bank is a member of the FHLB of Des Moines, which entitles it to certain benefits including a variety of borrowing options consisting of a secured credit line that allows both fixed and variable rate advances. The FHLB borrowings at December 31, 2023 and 2022, consisted of a warehouse securities credit line (“securities line”), which allows advances with interest rates fixed at the time of borrowing and a warehouse federal funds (“Fed Funds”) advance, which allows daily advances at variable interest rates. Credit capacity is primarily determined by the value of assets collateralized at the FHLB, funds on deposit at the FHLB, and stock owned by the Bank.
Credit is limited to
The Bank maintains a short-term borrowing line with the FRB with total credit based on eligible collateral. The Bank can borrow under the Term Auction Facility and Term Deposit Facility at rates published by the San Francisco FRB. As of December 31, 2023 and 2022, the Bank had approximately $
Borrowings on these lines at the dates indicated were as follows:
| December 31, | ||||||||
| 2023 | 2022 | |||||||
| Federal Home Loan Bank - (interest rates ranging from % to % and % to % at December 31, 2023 and 2022, respectively) | $ | $ | ||||||
| FRB BTFP advance - (interest rate of % at December 31, 2023) | ||||||||
| Total | $ | $ | ||||||
Scheduled maturities of borrowings were as follows:
| Interest | ||||||||
| Years Ending December 31, | Balances | Rates | ||||||
| 2024 | $ | % | ||||||
Subordinated Notes
On February 10, 2021, FS Bancorp completed the private placement of $
The Notes are unsecured obligations and are subordinated in right of payment to all existing and future indebtedness, deposits and other liabilities of the Company's current and future subsidiaries, including the Bank’s deposits as well as the Company's subsidiaries' liabilities to general creditors and liabilities arising during the ordinary course of business. The Notes may be included in Tier 2 capital for the Company under current regulatory guidelines and interpretations.
The maximum balance at any month end and the average balances and weighted average interest rates on debt during the years indicated were as follows:
| For the Year Ending December 31, | ||||||||||||
| 2023 | 2022 | 2021 | ||||||||||
| Maximum balance: | ||||||||||||
| FHLB advances and Fed Funds | $ | $ | $ | |||||||||
| FRB Fed Funds | ||||||||||||
| Fed Funds lines of credit with other financial institutions | ||||||||||||
| Subordinated notes | ||||||||||||
| FRB Paycheck Protection Program Liquidity Facility ("PPPLF") | ||||||||||||
| FRB BTFP advance | ||||||||||||
| Average balance: | ||||||||||||
| FHLB advances and Fed Funds | ||||||||||||
| FRB Fed Funds | ||||||||||||
| Fed Funds lines of credit with other financial institutions | ||||||||||||
| Subordinated notes | ||||||||||||
| FRB PPPLF | ||||||||||||
| FRB BTFP advance | ||||||||||||
| Weighted average interest rates | ||||||||||||
| FHLB advances and Fed Funds | % | % | % | |||||||||
| FRB Fed Funds | % | % | % | |||||||||
| Fed Funds lines of credit with other financial institutions | % | % | % | |||||||||
| Subordinated notes | % | % | % | |||||||||
| FRB PPPLF | % | % | % | |||||||||
| FRB BTFP advance | % | % | % | |||||||||
NOTE 12 – INCOME TAXES
The components of income tax expense for the years indicated were as follows:
| For the Year Ending December 31, | ||||||||||||
| Provision for income taxes | 2023 | 2022 | 2021 | |||||||||
| Current | $ | $ | $ | |||||||||
| Deferred | ( | ) | ( | ) | ||||||||
| Total provision for income taxes | $ | $ | $ | |||||||||
A reconciliation of the effective income tax rate with the federal statutory tax rates at the dates indicated was as follows:
| December 31, | ||||||||||||||||||||||||
| 2023 | 2022 | 2021 | ||||||||||||||||||||||
| Amount | Rate | Amount | Rate | Amount | Rate | |||||||||||||||||||
| Income tax provision at statutory rate | $ | % | $ | % | $ | % | ||||||||||||||||||
| Tax exempt income | ( | ) | ( | ) | ( | ) | ( | ) | ( | ) | ( | ) | ||||||||||||
| Nondeductible items resulting in increase in tax | ||||||||||||||||||||||||
| Increase in tax resulting from other items | ||||||||||||||||||||||||
| Equity compensation | ( | ) | ( | ) | ( | ) | ( | ) | ( | ) | ( | ) | ||||||||||||
| Executive compensation | ||||||||||||||||||||||||
| ESOP | ||||||||||||||||||||||||
| Total | $ | % | $ | % | $ | % | ||||||||||||||||||
Total deferred tax assets and liabilities at the dates indicated were as follows:
| Deferred Tax Assets | December 31, | |||||||
| 2023 | 2022 | |||||||
| ACL on loans | $ | $ | ||||||
| Non-accrued loan interest | ||||||||
| Restricted stock awards | ||||||||
| Non-qualified stock options | ||||||||
| Lease liability | ||||||||
| Securities available-for-sale | ||||||||
| ACL on unfunded commitments | ||||||||
| Other | ||||||||
| Purchase accounting adjustments | ||||||||
| Total deferred tax assets | ||||||||
| Deferred Tax Liabilities | ||||||||
| Loan origination costs | ( | ) | ( | ) | ||||
| MSRs | ( | ) | ( | ) | ||||
| Stock dividend - FHLB stock | ( | ) | ( | ) | ||||
| Property, plant, and equipment | ( | ) | ( | ) | ||||
| Purchase accounting adjustments | ( | ) | ||||||
| Lease right-of-use assets | ( | ) | ( | ) | ||||
| Interest rate swaps designated as cash flow hedge | ( | ) | ( | ) | ||||
| Total deferred tax liabilities | ( | ) | ( | ) | ||||
| Net deferred tax assets | $ | $ | ||||||
The Company files a U.S. Federal income tax return and Oregon and Idaho state returns, which are subject to examination by tax authorities for years 2021 and later. At December 31, 2023 and 2022, the Company had
NOTE 13 – COMMITMENTS AND CONTINGENCIES
Commitments – The Company is party to financial instruments with off-balance sheet risk in the normal course of business to meet the financing needs of its customers. These financial instruments include commitments to extend credit. These instruments involve, to varying degrees, elements of credit risk in excess of the amount recognized on the Consolidated Balance Sheets.
The Company’s exposure to credit loss in the event of nonperformance by the other party to the financial instrument for commitments to extend credit is represented by the contractual amount of those instruments. The Company uses the same credit policies in making commitments and conditional obligations as it does for on-balance sheet instruments.
The following table provides a summary of the Company’s commitments at the dates indicated:
| COMMITMENTS TO EXTEND CREDIT | December 31, | |||||||
| REAL ESTATE LOANS | 2023 | 2022 | ||||||
| Commercial | $ | $ | ||||||
| Construction and development | ||||||||
| One-to-four-family (includes locks for saleable loans) | ||||||||
| Home equity | ||||||||
| Multi-family | ||||||||
| Total real estate loans | ||||||||
| CONSUMER LOANS | ||||||||
| COMMERCIAL BUSINESS LOANS | ||||||||
| C&I | ||||||||
| Warehouse lending | ||||||||
| Total commercial business loans | ||||||||
| Total commitments to extend credit | $ | $ | ||||||
Commitments to extend credit are agreements to lend to a customer provided there is no violation of any condition established in the contract. Since many of the commitments are expected to expire without being drawn upon, the amount of the total commitments does not necessarily represent future cash requirements. The Company evaluates each customer’s creditworthiness on a case-by-case basis. The amount of collateral obtained, if deemed necessary by the Company upon extension of credit, is based on management’s credit evaluation of the party. Collateral held varies, but may include accounts receivable, inventory, property and equipment, residential real estate, and income-producing commercial properties.
Unfunded commitments under commercial lines of credit, revolving credit lines and overdraft protection agreements are commitments for possible future extensions of credit to existing customers. These lines of credit usually do not contain a specified maturity date and ultimately may not be drawn upon to the total extent to which the Company is committed. The Company’s ACL – unfunded loan commitments at December 31, 2023 and December 31, 2022 was $
The Company also sells one-to-four-family loans to the FHLB of Des Moines that require a limited level of recourse if the loans default and exceed a certain loss exposure. Specific to that recourse, the FHLB of Des Moines established a first loss account (“FLA”) related to the loans and required a credit enhancement (“CE”) obligation by the Bank to be utilized after the FLA is used. Based on loans sold through December 31, 2023, the total loans sold to the FHLB were $
Contingent liabilities for loans held for sale – In the ordinary course of business, loans are sold with limited recourse against the Company and may have to subsequently be repurchased due to defects that occurred during the origination of the loan. The defects are categorized as documentation errors, underwriting errors, early payoff, early payment defaults, breach of representation or warranty, servicing errors, and/or fraud. When a loan sold to an investor without recourse fails to perform according to its contractual terms, the investor will typically review the loan file to determine whether defects in the origination process occurred. If a defect is identified, the Company may be required to either repurchase the loan or indemnify the investor for losses sustained. If there are no such defects, the Company has no commitment to repurchase the loan. The Company has recorded a holdback reserve of $
The Company has entered into a severance agreement with its Chief Executive Officer (“CEO”). The severance agreement, subject to certain requirements, generally includes a lump sum payment to the CEO equal to 24 months of base compensation in the event their employment is involuntarily terminated, other than for cause or the executive terminates his employment with good reason, as defined in the severance agreement.
The Company has entered into change of control agreements with its Chief Financial Officer, Chief Lending Officer, Chief Risk Officer, Chief Human Resources Officer, Senior Vice President Compliance Officer, Executive Vice President of Retail Banking and Marketing, and the Executive Vice President of Home Lending. The change of control agreements, subject to certain requirements, generally remain in effect until canceled by either party upon at least 24 months prior written notice. Under the change of control agreements, the executive generally will be entitled to a change of control payment from the Company if the executive is involuntarily terminated within six months preceding or 12 months after a change in control (as defined in the change of control agreements). In such an event, the executives would each be entitled to receive a cash payment in an amount equal to 12 months of their then current salary, subject to certain requirements in the change of control agreements.
As a result of the nature of our activities, the Company is subject to various pending and threatened legal actions, which arise in the ordinary course of business. From time to time, subordination liens may create litigation which requires us to defend our lien rights. In the opinion of management, liabilities arising from these claims, if any, will not have a material effect on our financial position. The Company had no material pending legal actions at December 31, 2023.
NOTE 14 – SIGNIFICANT CONCENTRATION OF CREDIT RISK
Most of the Company’s commercial and multi-family real estate, construction, residential, and commercial business lending activities are with customers located in Western Washington, and various location in Oregon state, near the one loan production office located in the Tri-Cities, Washington, and our newest loan production office in Vancouver, Washington. The Company originates real estate, consumer, and commercial business loans and has concentrations in these areas, however, indirect home improvement loans, including solar-related home improvement loans are originated through a network of home improvement contractors and dealers located throughout Washington, Oregon, California, Idaho, Colorado, Arizona, Minnesota, Nevada, Texas, Utah, Massachusetts, Montana, and recently New Hampshire. Loans are generally secured by collateral and rights to collateral vary and are legally documented to the extent practicable. Local economic conditions may affect borrowers’ ability to meet the stated repayment terms. The concentration on commercial real estate remains below the 300% of Risk Based Capital regulatory threshold and the subset of construction concentration, excluding owner-occupied loans is within Board approved limits. The construction, land development, and other land concentration represents less than 100% of the Bank’s total regulatory capital at
NOTE 15 – REGULATORY CAPITAL
The Bank is subject to various regulatory capital requirements administered by the Federal Reserve and the FDIC. Failure to meet minimum capital requirements can initiate certain mandatory and possibly additional discretionary actions by regulators that, if undertaken, could have a direct material effect on the Company’s consolidated financial statements. Under capital adequacy guidelines of the regulatory framework for prompt corrective action, the Bank must meet specific capital adequacy guidelines that involve quantitative measures of the Bank’s assets, liabilities, and certain off-balance sheet items as calculated under regulatory accounting practices. The Bank’s capital classification is also subject to qualitative judgments by the regulators about components, risk weightings, and other factors.
Under capital adequacy guidelines of the regulatory framework for prompt corrective action, quantitative measures established by regulation to ensure capital adequacy require the Bank to maintain minimum amounts and ratios (set forth in the table below) of Tier 1 capital (as defined in the regulations) to total average assets (as defined), and minimum ratios of Tier 1 total capital (as defined) and common equity Tier 1 (“CET 1”) capital to risk-weighted assets (as defined).
The Bank must maintain minimum total risk-based, Tier 1 risk-based, Tier 1 leverage, and CET 1 capital ratios as set forth in the table below to be categorized as well capitalized. At December 31, 2023, the Bank was categorized as well capitalized under applicable regulatory requirements. There are no conditions or events since that notification that management believes have changed the Bank’s category. Management believes, at December 31, 2023, that the Bank met all capital adequacy requirements.
The following table compares the Bank’s actual capital amounts and ratios at December 31, 2023 to their minimum regulatory capital requirements and well capitalized regulatory capital at that date:
| To be Well Capitalized |
||||||||||||||||||||||||||||||||
| Under Prompt |
||||||||||||||||||||||||||||||||
| For Capital |
For Capital Adequacy |
Corrective |
||||||||||||||||||||||||||||||
| Actual |
Adequacy Purposes |
with Capital Buffer |
Action Provisions |
|||||||||||||||||||||||||||||
| Bank Only |
Amount |
Ratio |
Amount |
Ratio |
Amount |
Ratio |
Amount |
Ratio |
||||||||||||||||||||||||
| At December 31, 2023 |
||||||||||||||||||||||||||||||||
| Total risk-based capital (to risk-weighted assets) |
$ | % | $ | % | $ | % | $ | % | ||||||||||||||||||||||||
| Tier 1 risk-based capital (to risk-weighted assets) |
$ | % | $ | % | $ | % | $ | % | ||||||||||||||||||||||||
| Tier 1 leverage capital (to average assets) |
$ | % | $ | % | $ | N/A | N/A | $ | % | |||||||||||||||||||||||
| CET 1 capital (to risk-weighted assets) |
$ | % | $ | % | $ | % | $ | % | ||||||||||||||||||||||||
In addition to the minimum CET 1, Tier 1, total capital, and leverage ratios, the Bank is required to maintain a capital conservation buffer consisting of additional CET 1 capital greater than
The Company is a bank holding company registered with the Federal Reserve. Bank holding companies are subject to capital adequacy requirements of the Federal Reserve under the Bank Holding Company Act of 1956, as amended, and the regulations of the Federal Reserve. Bank holding companies with less than $3.0 billion in assets are generally not subject to compliance with the Federal Reserve’s capital regulations, which are generally the same as the capital regulations applicable to the Bank. The Federal Reserve has a policy that a bank holding company is required to serve as a source of financial and managerial strength to the holding company’s subsidiary bank and expects the holding company’s subsidiary bank to be well capitalized under the prompt corrective action regulations. If the Company were subject to regulatory guidelines for bank holding companies with $3.0 billion or more in assets at December 31, 2023, it would have exceeded all regulatory capital requirements. For informational purposes, the regulatory capital ratios calculated for the Company at December 31, 2023, were
NOTE 16 – FAIR VALUE MEASUREMENTS
The Company determines fair value based on the requirements established in ASC Topic 820, Fair Value Measurements, which provides a framework for measuring fair value in accordance with U.S. GAAP and requires an entity to maximize the use of observable inputs and minimize the use of unobservable inputs when measuring fair value. ASC Topic 820 defines fair value as the exit price, or the price that would be received for an asset or paid to transfer a liability, in the principal or most advantageous market for the asset or liability in an orderly transaction between market participants on the measurement date under current market conditions. ASU 2016 – 01, Financial Instruments – Overall (Subtopic 825 – 10), Recognition and Measurement of Financial Assets and Financial Liabilities, requires us to use the exit price notion when measuring the fair value of instruments for disclosure purposes.
The following definitions describe the levels of inputs that may be used to measure fair value:
Level 1 – Inputs to the valuation methodology are quoted prices (unadjusted) for identical assets or liabilities in active markets.
Level 2 – Inputs to the valuation methodology include quoted prices for similar assets and liabilities in active markets, and inputs that are observable for the asset or liability, either directly or indirectly, for substantially the full term of the financial instrument.
Level 3 – Inputs to the valuation methodology are unobservable and significant to the fair value measurement.
The following methods were used to estimate the fair value of certain assets and liabilities on a recurring and nonrecurring basis.
Securities – The fair value of securities available-for-sale are recorded on a recurring basis. The fair value of investments and mortgage-backed securities are provided by a third-party pricing service. These valuations are based on market data using pricing models that vary by asset class and incorporate available current trade, bid and other market information, and for structured securities, cash flow, and loan performance data. The pricing processes utilize benchmark curves, benchmarking of similar securities, sector groupings, and matrix pricing. Option adjusted spread models are also used to assess the impact of changes in interest rates and to develop prepayment scenarios (Level 2). Transfers between the fair value hierarchy are determined through the third-party service provider which, from time to time will transfer between levels based on market conditions per the related security. All models and processes used consider market convention.
Mortgage Loans Held for Sale – The fair value of loans held for sale reflects the value of commitments with investors and/or the relative price as delivered into a To-Be-Announced (“TBA”) mortgage-backed security (Level 2).
Loans Receivable – Certain residential mortgage loans were initially originated for sale and measured at fair value; after origination, the loans were transferred to loans held for investment. As of December 31, 2023 and 2022, there were $
Derivative Instruments – Fair values for derivative assets and liabilities are measured on a recurring basis. The primary use of a derivative instrument is related to the mortgage banking activities of the Company. The fair value of the interest rate lock commitments and forward sales commitments are estimated using quoted or published market prices for similar instruments, adjusted for factors such as pull-through rate assumptions based on historical information, where appropriate. TBA mortgage-backed securities are fair valued on similar contracts in active markets (Level 2) while locks and forwards with customers and investors are fair valued using similar contracts in the market and changes in the market interest rates (Level 2 and 3). Derivative instruments not related to mortgage banking activities include interest rate swap agreements. The fair values of interest rate swap agreements are based on valuation models using observable market data as of the measurement date (Level 2). The Company’s derivatives are traded in an over-the-counter market where quoted market prices are not always available. Therefore, the fair values of derivatives are determined using quantitative models that utilize multiple market inputs. The inputs will vary based on the type of derivative, but could include interest rates, prices and indices to generate continuous yield or pricing curves, prepayment rates, and volatility factors to value the position. The majority of market inputs are actively quoted and can be validated through external sources, including market transactions and third-party pricing services. The fair values of all interest rate swaps are determined from third-party pricing services without adjustment.
Other Real Estate Owned – Fair value adjustments to OREO are recorded at the lower of carrying amount of the loan or fair value of the collateral less selling costs. Any write-downs based on the asset’s fair value at the date of acquisition are charged to the ACL on loans. After foreclosure, management periodically performs valuations such that the real estate is carried at the lower of its new cost basis or fair value, net of estimated costs to sell (Level 3).
Collateral Dependent Loans – Expected credit losses on collateral dependent loans are measured based on the fair value of the collateral as of the reporting date, less estimated selling costs, as applicable. If the fair value of the collateral is less than the amortized cost basis of the loan, the Company will recognize an allowance as the difference between the fair value of the collateral, less costs to sell (if applicable) at the reporting date and the amortized cost basis of the loan. If the fair value of the collateral exceeds the amortized cost basis of the loan, any expected recovery added to the amortized cost basis will be limited to the amount previously charged-off by the subsequent changes in the expected credit losses on collateral dependent loans are included within the provision for credit losses in the same manner in which the expected credit loss initially was recognized or as a reduction in the provision that would otherwise be reported (Level 3).
Mortgage Servicing Rights – The fair value of MSRs is estimated using net present value of expected cash flows using a third-party model that incorporates assumptions used in the industry to value such rights, adjusted for factors such as weighted average prepayments speeds based on historical information where appropriate (Level 3).
The following tables present securities available-for-sale, mortgage loans held for sale, loans receivable, at fair value, and derivative assets and liabilities measured at fair value on a recurring basis at the dates indicated:
| Financial Assets |
At December 31, 2023 |
|||||||||||||||
| Securities available-for-sale: |
Level 1 |
Level 2 |
Level 3 |
Total |
||||||||||||
| U.S. agency securities |
$ | $ | $ | $ | ||||||||||||
| Corporate securities |
||||||||||||||||
| Municipal bonds |
||||||||||||||||
| Mortgage-backed securities |
||||||||||||||||
| U.S. Small Business Administration securities |
||||||||||||||||
| Mortgage loans held for sale, at fair value |
||||||||||||||||
| Loans receivable, at fair value |
||||||||||||||||
| Derivatives: |
||||||||||||||||
| Interest rate lock commitments with customers |
||||||||||||||||
| Interest rate swaps - cash flow and fair value hedges |
||||||||||||||||
| Interest rate swaps - dealer offsets to customer swap positions |
||||||||||||||||
| Total assets measured at fair value |
$ | $ | $ | $ | ||||||||||||
| Financial Liabilities |
||||||||||||||||
| Derivatives: |
||||||||||||||||
| Mandatory and best effort forward commitments with investors |
$ | $ | $ | ( |
) | $ | ( |
) | ||||||||
| Forward TBA mortgage-backed securities |
( |
) | ( |
) | ||||||||||||
| Interest rate swaps - cash flow and fair value hedges |
( |
) | ( |
) | ||||||||||||
| Interest rate swaps - customer swap positions |
( |
) | ( |
) | ||||||||||||
| Total liabilities measured at fair value |
$ | $ | ( |
) | $ | ( |
) | $ | ( |
) | ||||||
| Financial Assets |
At December 31, 2022 |
|||||||||||||||
| Securities available-for-sale: |
Level 1 |
Level 2 |
Level 3 |
Total |
||||||||||||
| U.S. agency securities |
$ | $ | $ | $ | ||||||||||||
| Corporate securities |
||||||||||||||||
| Municipal bonds |
||||||||||||||||
| Mortgage-backed securities |
||||||||||||||||
| U.S. Small Business Administration securities |
||||||||||||||||
| Mortgage loans held for sale, at fair value |
||||||||||||||||
| Loans receivable, at fair value |
||||||||||||||||
| Derivatives: |
||||||||||||||||
| Forward TBA mortgage-backed securities |
||||||||||||||||
| Interest rate lock commitments with customers |
||||||||||||||||
| Interest rate swaps - cash flow and fair value hedges |
||||||||||||||||
| Total assets measured at fair value |
$ | $ | $ | $ | ||||||||||||
| Financial Liabilities |
||||||||||||||||
| Derivatives: |
||||||||||||||||
| Mandatory and best effort forward commitments with investors |
$ | $ | $ | ( |
) | $ | ( |
) | ||||||||
| Total liabilities measured at fair value |
$ | $ | $ | ( |
) | $ | ( |
) | ||||||||
The following table presents financial assets measured at fair value on a nonrecurring basis and the level within the fair value hierarchy at the dated indicated. There were
| December 31, 2023 |
||||||||||||||||
| Level 1 |
Level 2 |
Level 3 |
Total |
|||||||||||||
| MSRs |
$ | $ | $ | $ | ||||||||||||
Quantitative Information about Level 3 Fair Value Measurements – Shown in the table below is the fair value of financial instruments measured under a Level 3 unobservable input on a recurring and nonrecurring basis at the dates indicated:
| Level 3 |
Significant |
Weighted Average |
||||||||||||
| Fair Value |
Valuation |
Unobservable |
December 31, |
December 31, |
||||||||||
| Instruments |
Techniques |
Inputs |
Range |
2023 |
2022 |
|||||||||
| RECURRING |
||||||||||||||
| Interest rate lock commitments with customers |
Quoted market prices |
Pull-through expectations |
% |
% |
||||||||||
| Individual forward sale commitments with investors |
Quoted market prices |
Pull-through expectations |
% |
% |
||||||||||
| NONRECURRING |
||||||||||||||
| MSRs |
Industry sources |
Pre-payment speeds |
% |
% |
||||||||||
The pull-through rate is based on historical loan closing rates for similar interest rate lock commitments. An increase or decrease in the pull-through rate would have a corresponding positive or negative fair value adjustment.
The following table provides a reconciliation of assets and liabilities measured at fair value using significant unobservable inputs (Level 3) on a recurring basis during the years indicated:
| Purchases |
Net change in |
Net change in |
||||||||||||||||||||||
| Beginning |
and |
Sales and |
Ending |
fair value for |
fair value for |
|||||||||||||||||||
| 2023 |
Balance |
Issuances |
Settlements |
Balance |
gains/(losses) (1) |
gains/(losses) (2) |
||||||||||||||||||
| Interest rate lock commitments with customers |
$ | $ | $ | ( |
) | $ | $ | $ | ||||||||||||||||
| Individual forward sale commitments with investors |
( |
) | ( |
) | ( |
) | ( |
) | ||||||||||||||||
| 2022 |
||||||||||||||||||||||||
| Interest rate lock commitments with customers |
$ | $ | $ | ( |
) | $ | $ | ( |
) | $ | ||||||||||||||
| Individual forward sale commitments with investors |
( |
) | ( |
) | ( |
) | ||||||||||||||||||
| 2021 |
||||||||||||||||||||||||
| Interest rate lock commitments with customers |
$ | $ | $ | ( |
) | $ | $ | ( |
) | $ | ||||||||||||||
| Individual forward sale commitments with investors |
( |
) | ( |
) | ||||||||||||||||||||
| Securities available-for-sale, at fair value |
( |
) | ||||||||||||||||||||||
_____________________________
(1) Relating to items held at end of period included in income.
(2) Relating to items held at end of period included in other comprehensive income.
(Losses) gains on interest rate lock commitments and on forward sale commitments with investors carried at fair value are recorded in “Gain on sale of loans” on the Consolidated Statements of Income.
Fair values for financial instruments are management's estimates of the values at which the instruments could be exchanged in a transaction between willing parties. The Company uses the exit price notion when measuring the fair value of financial instruments.
The following table provides estimated fair values of the Company’s financial instruments at the dates indicated, whether recognized at fair value or not on the Consolidated Balance Sheets:
| December 31, |
December 31, |
|||||||||||||||
| 2023 |
2022 |
|||||||||||||||
| Financial Assets |
Carrying |
Fair |
Carrying |
Fair |
||||||||||||
| Level 1 inputs: |
Amount |
Value |
Amount |
Value |
||||||||||||
| Cash and cash equivalents |
$ | $ | $ | $ | ||||||||||||
| Certificates of deposit at other financial institutions |
||||||||||||||||
| Level 2 inputs: |
||||||||||||||||
| Securities available-for-sale, at fair value |
||||||||||||||||
| Securities held-to-maturity |
||||||||||||||||
| Loans held for sale, at fair value |
||||||||||||||||
| FHLB stock, at cost |
||||||||||||||||
| Forward TBA mortgage-backed securities |
||||||||||||||||
| Loans receivable, at fair value |
||||||||||||||||
| Interest rate swaps - cash flow and fair value hedges |
||||||||||||||||
| Accrued interest receivable |
||||||||||||||||
| Interest rate swaps - dealer offsets to customer swap positions |
||||||||||||||||
| Level 3 inputs: |
||||||||||||||||
| Loans receivable, gross |
||||||||||||||||
| MSRs, held at lower of cost or fair value |
||||||||||||||||
| MSRs held for sale, held at lower of cost or fair value |
||||||||||||||||
| Fair value interest rate locks with customers |
||||||||||||||||
| Financial Liabilities |
||||||||||||||||
| Level 2 inputs: |
||||||||||||||||
| Deposits |
||||||||||||||||
| Borrowings |
||||||||||||||||
| Subordinated notes, excluding unamortized debt issuance costs |
||||||||||||||||
| Accrued interest payable |
||||||||||||||||
| Interest rate swaps - cash flow and fair value hedges |
||||||||||||||||
| Forward TBA mortgage-backed securities |
||||||||||||||||
| Interest rate swaps - customer swap positions |
||||||||||||||||
| Level 3 inputs: |
||||||||||||||||
| Mandatory and best effort forward commitments with investors |
||||||||||||||||
NOTE 17 – EARNINGS PER SHARE
The Company computes earnings per share using the two-class method, which is an earnings allocation method for computing earnings per share that treats a participating security as having rights to earnings that would otherwise have been available to common shareholders. Basic earnings per share are computed by dividing income available to common shareholders by the weighted average number of common shares outstanding for the period. Unvested share-based awards containing non-forfeitable rights to dividends or dividend equivalents (whether paid or unpaid) are participating securities and are included in the computation of earnings per share pursuant to the two-class method. Diluted earnings per share reflect the potential dilution that could occur if securities or other contracts to issue common stock were exercised or converted into common stock or resulted in the issuance of common stock that then shared in the earnings of the entity. For earnings per share calculations for 2021, the ESOP shares committed to be released were included as outstanding shares for both basic and diluted earnings per share. All ESOP shares were allocated as of December 31, 2021.
The following table presents a reconciliation of the components used to compute basic and diluted earnings per share at or for the years indicated:
| At or For the Year Ended December 31, |
||||||||||||
| Numerator (Dollars in thousands, except per share amounts): |
2023 |
2022 |
2021 |
|||||||||
| Net income |
$ | $ | $ | |||||||||
| Dividends and undistributed earnings allocated to participating securities |
( |
) | ( |
) | ( |
) | ||||||
| Net income available to common shareholders |
$ | $ | $ | |||||||||
| Denominator (shown as actual): |
||||||||||||
| Basic weighted average common shares outstanding |
||||||||||||
| Dilutive shares |
||||||||||||
| Diluted weighted average common shares outstanding |
||||||||||||
| Basic earnings per share |
$ | $ | $ | |||||||||
| Diluted earnings per share |
$ | $ | $ | |||||||||
| Potentially dilutive weighted average share options that were not included in the computation of diluted earnings per share because to do so would be anti-dilutive. |
||||||||||||
NOTE 18 – DERIVATIVES
The Company is exposed to certain risk arising from both its business operations and economic conditions. The Company principally manages its exposures to a wide variety of business and operational risks through management of its core business activities. The Company manages economic risks, including interest rate, liquidity, and credit risk primarily by managing the amount, sources, and duration of its assets and liabilities and the use of derivative financial instruments. Specifically, the Company enters into derivative financial instruments to manage exposures that arise from business activities that result in the receipt or payment of future known and uncertain cash amounts, the value of which are determined by interest rates.
The Company’s predominant derivative and hedging activities involve interest rate swaps related to certain borrowings, brokered deposits, investment securities, forward sales contracts, and commitments to extend credit associated with mortgage banking activities. Generally, these instruments help the Company manage exposure to market risk. Market risk represents the possibility that economic value or net interest income will be adversely affected by fluctuations in external factors such as market-driven interest rates and prices or other economic factors.
Mortgage Banking Derivatives Not Designated as Hedges
The Company regularly enters into commitments to originate and sell loans held for sale. The Company has exposure to movements in interest rates associated with written interest rate lock commitments with potential borrowers to originate one-to four-family loans that are intended to be sold and for closed one-to-four-family mortgage loans held for sale for which fair value accounting has been elected, that are awaiting sale and delivery into the secondary market. The Company economically hedges the risk of changing interest rates associated with these mortgage loan commitments by entering into forward sales contracts to sell one-to-four-family mortgage loans or into contracts to sell forward To-Be-Announced (“TBA”) mortgage-backed securities. These commitments and contracts are considered derivatives but have not been designated as hedging instruments for reporting purposes under U.S. GAAP. Rather, they are accounted for as free-standing derivatives, or economic hedges, with changes in the fair value of the derivatives reported in noninterest income or noninterest expense. The Bank recognizes all derivative instruments as either “Other assets” or “Other liabilities” on the Consolidated Balance Sheets and measures those instruments at fair value.
Customer Swaps Not Designated as Hedges
The Company also enters into derivative contracts, which consist of interest rate swaps, to facilitate the needs of clients desiring to manage interest rate risk. These swaps are not designated as accounting hedges under ASC 815, Derivatives and Hedging. To economically hedge the interest rate risk associated with offering this product, the Company simultaneously enters into derivative contracts with third parties to offset the customer contracts such that the Company minimizes its net risk exposure resulting from such transactions. The derivative contracts are structured such that the notional amounts reduce over time to generally match the expected amortization of the underlying loans. These derivatives are not speculative and arise from a service provided to clients.
Cash Flow Hedges
The Company has entered into interest rate swaps to reduce the exposure to variability in interest-related cash outflows attributable to changes in forecasted SOFR based brokered deposits. These derivative instruments are designated as cash flow hedges. The hedged item is the SOFR portion of the series of future adjustable-rate borrowings and deposits over the term of the interest rate swap. Accordingly, changes to the amount of interest payment cash flows for the hedged transactions attributable to a change in credit risk are excluded from management’s assessment of hedge effectiveness. The Bank tests for hedging effectiveness on a quarterly basis. The accumulated other comprehensive income is subsequently reclassified into earnings in the period that the hedged forecasted transaction affects earnings. The Bank has not recorded any hedge ineffectiveness since inception.
The Bank expects that approximately $
Fair Value Hedges
The Company is exposed to changes in the fair value of certain of its pools of prepayable fixed-rate assets due to changes in benchmark interest rates. The Company uses interest rate swaps to manage its exposure to changes in fair value on these instruments attributable to changes in the designated benchmark interest rate, the SOFR. Interest rate swaps designated as fair value hedges involve the receipt of variable-rate amounts from a counterparty in exchange for the Company making fixed-rate payments over the life of the agreements without the exchange of the underlying notional amount. For derivatives designated and that qualify as fair value hedges, the gain or loss on the derivative as well as the offsetting loss or gain on the hedged item attributable to the hedged risk are recognized in interest income.
The following amounts were recorded on the balance sheet related to cumulative-basis adjustment for fair value hedges for the dates indicated:
| Cumulative Amount of Fair Value |
||||||||
| Line item on the Consolidated Balance Sheets |
Hedging Adjustment Included in |
|||||||
| in which the hedged item is included: |
Carrying Amount of the |
the Carrying Amount of the |
||||||
| December 31, 2023 |
Hedged Assets |
Hedged Assets |
||||||
| Investment securities (1) |
$ | $ | ||||||
| Total |
$ | $ | ||||||
| December 31, 2022 |
||||||||
| Investment securities (1) |
$ | $ | ||||||
| Total |
$ | $ | ||||||
____________________________________
| 1) |
These amounts include the amortized cost basis of closed portfolios used in designated hedging relationships in which the hedged item is the last layer expected to be remaining at the end of the hedging relationship. At December 31, 2023, the amortized cost basis of the closed portfolios used in these hedging relationships was $ |
The following tables summarize the Company’s derivative instruments at the dates indicated. The Company has master netting agreements with derivative dealers with which it does business, but reflects gross assets and liabilities as “Other assets” and “Other liabilities”, respectively, on the Consolidated Balance Sheets, as follows:
| December 31, 2023 |
||||||||||||
| Fair Value |
||||||||||||
| Cash flow hedges: |
Notional |
Asset |
Liability |
|||||||||
| Interest rate swaps - brokered deposits |
$ | $ | $ | |||||||||
| Fair value hedges: |
||||||||||||
| Interest rate swaps - securities |
$ | $ | $ | |||||||||
| Non-hedging derivatives: |
||||||||||||
| Fallout adjusted interest rate lock commitments with customers |
||||||||||||
| Mandatory and best effort forward commitments with investors |
||||||||||||
| Forward TBA mortgage-backed securities |
||||||||||||
| Interest rate swaps - customer swap positions |
||||||||||||
| Interest rate swaps - dealer offsets to customer swap positions |
||||||||||||
| December 31, 2022 |
||||||||||||
| Fair Value |
||||||||||||
| Cash flow hedges: |
Notional |
Asset |
Liability |
|||||||||
| Interest rate swaps - brokered deposits |
$ | $ | $ | |||||||||
| Fair value hedges: |
||||||||||||
| Interest rate swaps - securities |
$ | $ | $ | |||||||||
| Non-hedging derivatives: |
||||||||||||
| Fallout adjusted interest rate lock commitments with customers |
||||||||||||
| Mandatory and best effort forward commitments with investors |
||||||||||||
| Forward TBA mortgage-backed securities |
||||||||||||
The following table summarizes the effect of fair value and cash flow hedge accounting on the Consolidated Statements of Income for the years indicated:
| Year Ended December 31, |
||||||||||||||||||||||||
| 2023 |
2022 |
2021 |
||||||||||||||||||||||
| Interest |
Interest |
Interest |
Interest |
Interest |
Interest |
|||||||||||||||||||
| Expense |
Income |
Expense |
Income |
Expense |
Income |
|||||||||||||||||||
| Deposits |
Securities |
Deposits |
Securities |
Deposits |
Securities |
|||||||||||||||||||
| Total amounts presented on the Consolidated Statements of Income |
$ | $ | $ | $ | $ | $ | ||||||||||||||||||
| Net gains (losses) on fair value hedging relationships: |
||||||||||||||||||||||||
| Interest rate swaps - securities |
||||||||||||||||||||||||
| Recognized on hedged items |
( |
) | ||||||||||||||||||||||
| Recognized on derivatives designated as hedging instruments |
( |
) | ||||||||||||||||||||||
| Net interest income (expense) recognized on cash flows of derivatives designated as hedging instruments |
||||||||||||||||||||||||
| Net income (expense) recognized on fair value hedges |
$ | $ | $ | $ | ( |
) | $ | $ | ||||||||||||||||
| Net gain (loss) on cash flow hedging relationships: |
||||||||||||||||||||||||
| Interest rate swaps - brokered deposits and borrowings |
||||||||||||||||||||||||
| Realized gains (losses) (pre-tax) reclassified from AOCI into net income |
$ | $ | $ | $ | $ | ( |
) | $ | ||||||||||||||||
| Net income (expense) recognized on cash flow hedges |
$ | $ | $ | $ | $ | ( |
) | $ | ||||||||||||||||
Changes in the fair value of the non-hedging derivatives recognized in “Noninterest income” on the Consolidated Statements of Income and included in gain on sale of loans resulted in net gains of $
The following table presents a summary of amounts outstanding in derivative financial instruments, including those entered into in connection with the same counterparty under master netting agreements, as of the years indicated. While these agreements are typically over-collateralized, GAAP requires disclosures in this table to limit the amount of such collateral to the amount of the related asset or liability for each counterparty.
| Gross Amounts |
Net Amounts of |
Gross Amounts Not Offset |
||||||||||||||||||||||
| Gross Amounts |
Offset on the |
Assets on the |
on the Consolidated Balance Sheets |
|||||||||||||||||||||
| Offsetting of derivative assets |
of Recognized |
Consolidated |
Consolidated |
Financial |
Cash Collateral |
|||||||||||||||||||
| At December 31, 2023 |
Assets |
Balance Sheets |
Balance Sheets |
Instruments |
Received |
Net Amount |
||||||||||||||||||
| Interest rate swaps |
$ | $ | $ | $ | $ | — | $ | |||||||||||||||||
| At December 31, 2022 |
||||||||||||||||||||||||
| Interest rate swaps |
$ | $ | $ | $ | $ | — | $ | |||||||||||||||||
| Gross Amounts |
Net Amounts of |
Gross Amounts Not Offset |
||||||||||||||||||||||
| Gross Amounts |
Offset on the |
Liabilities on the |
on the Consolidated Balance Sheets |
|||||||||||||||||||||
| Offsetting of derivative liabilities |
of Recognized |
Consolidated |
Consolidated |
Financial |
Cash Collateral |
|||||||||||||||||||
| At December 31, 2023 |
Liabilities |
Balance Sheets |
Balance Sheets |
Instruments |
Posted |
Net Amount |
||||||||||||||||||
| Interest rate swaps |
$ | ( |
) | $ | ( |
) | $ | ( |
) | $ | — | $ | $ | ( |
) | |||||||||
| At December 31, 2022 |
||||||||||||||||||||||||
| Interest rate swaps |
$ | — | $ | — | $ | — | $ | — | $ | — | $ | — | ||||||||||||
Credit Risk-related Contingent Features
The Company has derivative contracts with its derivative counterparties that contain provisions to post collateral to the counterparties when these contracts are in a net liability position. At December 31, 2023, the Company had collateral posted of $
NOTE 19 – ACCUMULATED OTHER COMPREHENSIVE INCOME (LOSS)
The following were changes in accumulated other comprehensive income (loss) by component, net of tax, for the years indicated:
| Unrealized (Losses) |
||||||||||||
| Gains and |
and Gains |
|||||||||||
| (Losses) on |
on Available |
|||||||||||
| Derivative |
for Sale |
|||||||||||
| Year Ended December 31, 2023 |
Instruments |
Securities |
Total |
|||||||||
| Beginning balance |
$ | $ | ( |
) | $ | ( |
) | |||||
| Other comprehensive income before reclassification, net of tax |
||||||||||||
| Amounts reclassified from accumulated other comprehensive loss, net of tax |
( |
) | ( |
) | ||||||||
| Net current period other comprehensive (loss) income |
( |
) | ||||||||||
| Ending balance |
$ | $ | ( |
) | $ | ( |
) | |||||
| Unrealized |
||||||||||||
| Gains and |
Losses |
|||||||||||
| (Losses) on |
on Available |
|||||||||||
| Derivative |
for Sale |
|||||||||||
| Year Ended December 31, 2022 |
Instruments |
Securities |
Total |
|||||||||
| Beginning balance |
$ | $ | ( |
) | $ | |||||||
| Other comprehensive income (loss) before reclassification, net of tax |
( |
) | ( |
) | ||||||||
| Amounts reclassified from accumulated other comprehensive loss, net of tax |
( |
) | ( |
) | ||||||||
| Net current period other comprehensive income (loss) |
( |
) | ( |
) | ||||||||
| Ending balance |
$ | $ | ( |
) | $ | ( |
) | |||||
| Unrealized Gains |
||||||||||||
| (Losses) and |
and (Losses) |
|||||||||||
| Gains on |
on Available |
|||||||||||
| Derivative |
for Sale |
|||||||||||
| Year Ended December 31, 2021 |
Instruments |
Securities |
Total |
|||||||||
| Beginning balance |
$ | ( |
) | $ | $ | |||||||
| Other comprehensive (loss) income before reclassification, net of tax |
( |
) | ( |
) | ||||||||
| Amounts reclassified from accumulated other comprehensive income, net of tax |
||||||||||||
| Net current period other comprehensive income (loss) |
( |
) | ( |
) | ||||||||
| Ending balance |
$ | $ | ( |
) | $ | |||||||
NOTE 20 – STOCK-BASED COMPENSATION
Stock Options and Restricted Stock
On May 17, 2018, the shareholders of the Company approved the 2018 Equity Incentive Plan (the “2018 Plan”) that authorized
For the years ended December 31, 2023, 2022, and 2021, total share-based compensation expense was $
Stock Options
The 2018 Plan consists of stock option awards that may be granted as incentive stock options or nonqualified stock options. Stock option awards generally vest over a -year period for independent directors or over a -year period for employees and officers with
The fair value of options granted was determined using the following weighted-average assumptions as of the grant date for the years indicated:
| For the Year Ended December 31, |
||||||||||||
| 2023 |
2022 |
2021 |
||||||||||
| Dividend yield |
% |
% |
% |
|||||||||
| Expected volatility |
% |
% |
% |
|||||||||
| Risk-free interest rate |
% |
% |
% |
|||||||||
| Expected term in years |
||||||||||||
| Weighted-average grant date fair value per option granted |
$ | $ | $ | |||||||||
The following table presents a summary of the Company’s stock option awards during the years indicated (shown as actual). Share and per share data has been adjusted for all periods to reflect a
| Weighted-Average | ||||||||||||||||
| Weighted- | Remaining | |||||||||||||||
| Average | Contractual Term In | Aggregate | ||||||||||||||
| Shares | Exercise Price | Years | Intrinsic Value | |||||||||||||
| Outstanding at January 1, 2021 | $ | $ | ||||||||||||||
| Granted | $ | — | ||||||||||||||
| Less exercised | $ | — | $ | |||||||||||||
| Forfeited or expired | — | |||||||||||||||
| Outstanding at December 31, 2021 | $ | $ | ||||||||||||||
| Outstanding at January 1, 2022 | $ | $ | ||||||||||||||
| Granted | $ | — | ||||||||||||||
| Less exercised | $ | — | $ | |||||||||||||
| Forfeited or expired | — | |||||||||||||||
| Outstanding at December 31, 2022 | $ | $ | ||||||||||||||
| Outstanding at January 1, 2023 | $ | $ | ||||||||||||||
| Granted | $ | — | ||||||||||||||
| Less exercised | $ | — | $ | |||||||||||||
| Forfeited or expired | $ | — | ||||||||||||||
| Outstanding at December 31, 2023 | $ | $ | ||||||||||||||
| Expected to vest, assuming a % annual forfeiture rate at December 31, 2023 (1) | $ | $ | ||||||||||||||
| Exercisable at December 31, 2023 | $ | $ | ||||||||||||||
___________________________
| (1) |
Forfeiture rate has been calculated and estimated to assume a forfeiture of |
At December 31, 2023, there was $
Restricted Stock Awards
The RSAs fair value is equal to the value of the market price of the Company’s common stock on the grant date and compensation expense is recognized over the vesting period of the awards based on the fair value of the restricted stock. Shares granted under the 2018 Plan generally vest over a -year period for independent directors, a -year period for employees and officers, beginning on the grant date. Any nonvested RSAs will be forfeited and be made available for future grants under the 2018 Plan in the event of the award recipient’s termination of service with the Company or the Bank.
The following table presents a summary of the Company’s nonvested awards during the years indicated (shown as actual). Share and per share data has been adjusted for all periods to reflect a
| Weighted-Average |
||||||||
| Grant-Date Fair Value |
||||||||
| Nonvested Shares |
Shares |
Per Share |
||||||
| Nonvested at January 1, 2021 |
$ | |||||||
| Granted |
||||||||
| Less vested |
||||||||
| Forfeited or expired |
||||||||
| Nonvested at December 31, 2021 |
$ | |||||||
| Nonvested at January 1, 2022 |
$ | |||||||
| Granted |
||||||||
| Less vested |
||||||||
| Forfeited or expired |
||||||||
| Nonvested at December 31, 2022 |
$ | |||||||
| Nonvested at January 1, 2023 |
$ | |||||||
| Granted |
||||||||
| Less vested |
||||||||
| Forfeited or expired |
||||||||
| Nonvested at December 31, 2023 |
$ | |||||||
At December 31, 2023, there was $
NOTE 21 – BUSINESS SEGMENTS
The Company’s business segments are determined based on the products and services provided, as well as the nature of the related business activities, and they reflect the way financial information is currently evaluated by management. This process is dynamic and is based on management’s current view of the Company’s operations and is not necessarily comparable with similar information for other financial institutions. The Company defines its business segments by product type and customer segment which it has organized into lines of business: commercial and consumer banking and home lending.
The Company uses various management accounting methodologies to assign certain income statement items to the responsible operating segment, including:
| ● |
a funds transfer pricing (“FTP”) system, which allocates interest income credits and funding charges between the segments, assigning to each segment a funding credit for its liabilities, such as deposits, and a charge to fund its assets; |
| ● |
a cost per loan serviced allocation based on the number of loans being serviced on the balance sheet and the number of loans serviced for third parties; |
| ● |
an allocation based upon the approximate square footage utilized by the home lending segment in Company owned locations; |
| ● |
an allocation of charges for services rendered to the segments by centralized functions, such as corporate overhead, which are generally based on the number of full-time employees (“FTEs”) in each segment; and |
| ● |
an allocation of the Company’s consolidated income taxes which are based on the effective tax rate applied to the segment’s pretax income or loss. |
A description of the Company’s business segments and the products and services that they provide is as follows:
Commercial and Consumer Banking Segment
The commercial and consumer banking segment provides diversified financial products and services to our commercial and consumer customers through Bank branches, online banking platforms, mobile banking apps, and telephone banking. These products and services include deposit products; residential, consumer, business and commercial real estate lending portfolios and cash management services. The Company originates consumer loans, commercial and multi-family real estate loans, construction loans for residential and multi-family construction, and commercial business loans. At December 31, 2023, the Company’s retail deposit branch network consisted of
Home Lending Segment
The home lending segment originates one-to-four-family residential mortgage loans primarily for sale in the secondary markets as well as loans held for investment. A majority of these mortgage loans are sold to or securitized by FNMA, FHLMC, GNMA or the FHLB of Des Moines, while the Company generally retains the right to service these loans. Loans originated under the guidelines of the Federal Housing Administration or (“FHA”), US Department of Veterans Affairs or VA, and United States Department of Agriculture or USDA are generally sold servicing released or servicing retained to a correspondent bank or mortgage company. The Company has the option to sell loans on a servicing-released or servicing-retained basis to securitizers and correspondent lenders. A small percentage of its loans are brokered to other lenders. On occasion, the Company may sell a portion of its MSR portfolio and may sell small pools of loans initially originated to be held in the loan portfolio. The Company manages the loan funding and the interest rate risk associated with the secondary market loan sales and the retained one-to-four-family MSRs within this business segment. One-to-four-family loans originated for investment and held in this segment are allocated to the home lending segment with a corresponding provision expense and FTP for cost of funds.
Segment Financial Results
The tables below summarize the financial results for each segment based on the factors mentioned above within each segment at or for the years indicated:
| At or For the Year Ended December 31, 2023 |
||||||||||||
| Commercial |
||||||||||||
| and Consumer |
||||||||||||
| Condensed income statement: |
Banking |
Home Lending |
Total |
|||||||||
| Net interest income (1) |
$ | $ | $ | |||||||||
| Provision for credit losses |
( |
) | ( |
) | ( |
) | ||||||
| Noninterest income (2) |
||||||||||||
| Noninterest expense (3) |
( |
) | ( |
) | ( |
) | ||||||
| Income before provision for income taxes |
||||||||||||
| Provision for income taxes |
( |
) | ( |
) | ( |
) | ||||||
| Net income |
$ | $ | $ | |||||||||
| Total average assets for period ended |
$ | $ | $ | |||||||||
| FTEs |
||||||||||||
| At or For the For the Year Ended December 31, 2022 |
||||||||||||
| Commercial |
||||||||||||
| and Consumer |
||||||||||||
| Condensed income statement: |
Banking |
Home Lending |
Total |
|||||||||
| Net interest income (1) |
$ | $ | $ | |||||||||
| Provision for credit losses |
( |
) | ( |
) | ( |
) | ||||||
| Noninterest income (2) |
||||||||||||
| Noninterest expense (3) |
( |
) | ( |
) | ( |
) | ||||||
| Income (loss) before (provision) benefit for income taxes |
( |
) | ||||||||||
| (Provision) benefit for income taxes |
( |
) | ( |
) | ||||||||
| Net income (loss) |
$ | $ | ( |
) | $ | |||||||
| Total average assets for period ended |
$ | $ | $ | |||||||||
| FTEs |
||||||||||||
| At or For the Year Ended December 31, 2021 |
||||||||||||
| Commercial |
||||||||||||
| and Consumer |
||||||||||||
| Condensed income statement: |
Banking |
Home Lending |
Total |
|||||||||
| Net interest income (1) |
$ | $ | $ | |||||||||
| (Provision for) recovery of loan losses |
( |
) | ( |
) | ||||||||
| Noninterest income (2) |
||||||||||||
| Noninterest expense(3) |
( |
) | ( |
) | ( |
) | ||||||
| Income before provision for income taxes |
||||||||||||
| Provision for income taxes |
( |
) | ( |
) | ( |
) | ||||||
| Net income |
$ | $ | $ | |||||||||
| Total average assets for period ended |
$ | $ | $ | |||||||||
| FTEs |
||||||||||||
__________________________
| (1) |
Net interest income is the difference between interest earned on assets and the cost of liabilities to fund those assets. Interest earned includes actual interest earned on segment assets and, if the segment has excess liabilities, interest credits for providing funding to the other segment. The cost of liabilities includes interest expense on segment liabilities and, if the segment does not have enough liabilities to fund its assets, a funding charge based on the cost of assigned liabilities to fund segment assets. All material revenues in each segment are from external customers. |
| (2) |
Noninterest income includes activity from certain residential mortgage loans that were initially originated for sale and measured at fair value, and subsequently transferred to loans held for investment. Gains and losses from changes in fair value for these loans are reported in earnings as a component of noninterest income. For the years ended December 31, 2023, 2022, and 2021, the Company recorded net increases in fair value of $ |
| (3) |
Noninterest expense includes allocated overhead expense from general corporate activities. Allocation is determined based on a combination of segment assets and FTEs. For the years ended December 31, 2023, 2022, and 2021, the Home Lending segment included allocated overhead expenses of $ |
NOTE 22 – REVENUE FROM CONTRACTS WITH CUSTOMERS
Revenue Recognition
In accordance with Topic 606, revenues are recognized when control of promised goods or services is transferred to customers in an amount that reflects the consideration the Company expects to be entitled to in exchange for those goods or services. To determine revenue recognition for arrangements that an entity determines are within the scope of Topic 606, the Company performs the following five steps: (i) identify the contract(s) with a customer; (ii) identify the performance obligations in the contract; (iii) determine the transaction price; (iv) allocate the transaction price to the performance obligations in the contract; and (v) recognize revenue when (or as) the Company satisfies a performance obligation. The Company only applies the five-step model to contracts when it is probable that the entity will collect the consideration it is entitled to in exchange for the goods or services it transfers to the customer. At contract inception, once the contract is determined to be within the scope of Topic 606, the Company assesses the goods or services that are promised within each contract and identifies those that contain performance obligations, and assesses whether each promised good or service is distinct. The Company then recognizes as revenue the amount of the transaction price that is allocated to the respective performance obligation when (or as) the performance obligation is satisfied.
All the Company’s revenue from contracts with customers in-scope of ASC 606 is recognized in noninterest income and included in our commercial and consumer banking segment. The following table presents noninterest income, segregated by revenue streams in-scope and out-of-scope and/or immaterial to Topic 606, for the years indicated:
| For the Year Ended December 31, |
||||||||||||
| Noninterest income |
2023 |
2022 |
2021 |
|||||||||
| In-scope of Topic 606: |
||||||||||||
| Debit card interchange fees |
$ | $ | $ | |||||||||
| Deposit service and account maintenance fees |
||||||||||||
| Noninterest income (in-scope of Topic 606) |
||||||||||||
| Noninterest income (out-of-scope of Topic 606) |
||||||||||||
| Total noninterest income |
$ | $ | $ | |||||||||
Deposit Service and Account Maintenance Fees
The Bank earns fees from its deposit customers for account maintenance, transaction-based services and overdraft charges. Account maintenance fees consist primarily of account fees and analyzed account fees charged on deposit accounts monthly. The performance obligation is satisfied and the fees are recognized monthly as the service period is completed. Transaction-based fees on deposits accounts are charged to deposit customers for specific services provided to the customer, such as wire fees, as well as charges against the account, such as fees for non-sufficient funds and overdrafts. The performance obligation is completed as the transaction occurs and the fees are recognized at the time each specific service is provided to the customer.
Debit Card Interchange Income
Debit and ATM interchange income represent fees earned when a debit card issued by the Bank is used. The Bank earns interchange fees from debit cardholder transactions through the Visa payment network. Interchange fees from cardholder transactions represent a percentage of the underlying transaction value and are recognized daily, concurrently with the transaction processing services provided to the cardholder. The performance obligation is satisfied and the fees are earned when the cost of the transaction is charged to the cardholders’ debit card.
NOTE 23 – GOODWILL AND OTHER INTANGIBLE ASSETS
Goodwill and certain other intangibles generally arise from business combinations accounted for under the acquisition method of accounting. Goodwill totaled $
Core deposit intangible (“CDI”) is evaluated for impairment whenever events or changes in circumstances indicate that its carrying amount may not be recoverable, with any changes in estimated useful life accounted for prospectively over the revised remaining life. As of December 31, 2023, management believes that there have been
The following table summarizes the changes in the Company’s other intangible assets comprised solely of CDI for the years indicated:
| Other Intangible Assets |
||||||||||||
| Accumulated |
||||||||||||
| Gross CDI |
Amortization |
Net CDI |
||||||||||
| Balance, December 31, 2020 |
$ | $ | ( |
) | $ | |||||||
| Amortization |
— | ( |
) | ( |
) | |||||||
| Balance, December 31, 2021 |
( |
) | ||||||||||
| Amortization |
— | ( |
) | ( |
) | |||||||
| Balance, December 31, 2022 |
( |
) | ||||||||||
| Additions as a result of the Branch Purchase |
— | |||||||||||
| Amortization |
— | ( |
) | ( |
) | |||||||
| Balance, December 31, 2023 |
$ | $ | ( |
) | $ | |||||||
The CDI represents the fair value of the intangible core deposit base acquired in business combinations. The CDI will be amortized on a straight-line basis over
Amortization expense for CDI is expected to be as follows for the years ended December 31:
| 2024 |
$ | |||
| 2025 |
||||
| 2026 |
||||
| 2027 |
||||
| 2028 |
||||
| Thereafter |
||||
| Total |
$ |
NOTE 24 – PARENT COMPANY ONLY FINANCIAL INFORMATION
The Condensed Balance Sheets, Statements of Income, and Statements of Cash Flows for the Company (Parent Only) are presented below:
| Condensed Balance Sheets |
December 31, |
|||||||
| Assets |
2023 |
2022 |
||||||
| Cash and due from banks |
$ | $ | ||||||
| Investment in subsidiary |
||||||||
| Other assets |
||||||||
| Total assets |
$ | $ | ||||||
| Liabilities and Stockholders' Equity |
||||||||
| Subordinated notes, net |
||||||||
| Other liabilities |
||||||||
| Total liabilities |
||||||||
| Stockholders' equity |
||||||||
| Total liabilities and stockholders' equity |
$ | $ | ||||||
| Condensed Statements of Income |
Year Ended December 31, |
|||||||||||
| 2023 |
2022 |
2021 |
||||||||||
| Interest expense on subordinated note |
$ | ( |
) | $ | ( |
) | $ | ( |
) | |||
| Dividends received from subsidiary |
||||||||||||
| Other expenses |
( |
) | ( |
) | ( |
) | ||||||
| Income before income tax benefit and equity in undistributed net income of subsidiary |
||||||||||||
| Income tax benefit |
||||||||||||
| Equity in undistributed earnings of subsidiary |
||||||||||||
| Net income |
$ | $ | $ | |||||||||
| Condensed Statements of Cash Flows |
Year Ended December 31, |
|||||||||||
| 2023 |
2022 |
2021 |
||||||||||
| Cash flows from operating activities: |
||||||||||||
| Net income |
$ | $ | $ | |||||||||
| Equity in undistributed net income of subsidiary |
( |
) | ( |
) | ( |
) | ||||||
| Amortization |
||||||||||||
| ESOP compensation expense for allocated shares |
||||||||||||
| Share-based compensation expense related to stock options and restricted stock |
||||||||||||
| Changes in operating assets and liabilities |
||||||||||||
| Other assets |
( |
) | ( |
) | ||||||||
| Other liabilities |
||||||||||||
| Net cash from operating activities |
||||||||||||
| Cash flows used by investing activities: |
||||||||||||
| Net proceeds from ESOP |
||||||||||||
| Investment in subsidiary |
( |
) | ||||||||||
| Net cash used by investing activities |
( |
) | ||||||||||
| Cash flows (used by) from financing activities: |
||||||||||||
| Net proceeds from issuance of subordinated notes |
||||||||||||
| Repayment of subordinated notes |
( |
) | ||||||||||
| Stock options exercised, net |
( |
) | ( |
) | ||||||||
| Common stock repurchased for employee/director taxes paid on restricted stock awards |
( |
) | ( |
) | ( |
) | ||||||
| Issuance of common stock - employee stock purchase plan |
||||||||||||
| Common stock repurchased |
( |
) | ( |
) | ( |
) | ||||||
| Dividends paid on common stock |
( |
) | ( |
) | ( |
) | ||||||
| Net cash (used by) from financing activities |
( |
) | ( |
) | ||||||||
| Net increase (decrease) in cash and cash equivalents |
( |
) | ||||||||||
| Cash and cash equivalents, beginning of year |
||||||||||||
| Cash and cash equivalents, end of year |
$ | $ | $ | |||||||||
Item 9. Changes in and Disagreements with Accountants on Accounting and Financial Disclosure
None.
Item 9A. Controls and Procedures
(i) Evaluation of Disclosure Controls and Procedures.
An evaluation of the disclosure controls and procedures as defined in Rule 13a-15(e) of the Securities Exchange Act of 1934, as amended (the “Exchange Act”) was carried out as of December 31, 2023 under the supervision and with the participation of the Company’s Chief Executive Officer (“CEO”), Chief Financial Officer (“CFO”), and several other members of the Company’s senior management. In designing and evaluating the Company’s disclosure controls and procedures, management recognized that disclosure controls and procedures, no matter how well conceived and operated, can provide only reasonable, not absolute, assurance that the objectives of the disclosure controls and procedures are met. Additionally, in designing disclosure controls and procedures, management necessarily was required to apply its judgment in evaluating the cost-benefit relationship of possible disclosure controls and procedures. The design of any disclosure controls and procedures also is based in part upon certain assumptions about the likelihood of future events, and there can be no assurance that any design will succeed in achieving its stated goals under all potential future conditions.
The Company’s CEO (principal executive officer) and CFO (principal financial officer) concluded that based on their evaluation at December 31, 2023, the Company’s disclosure controls and procedures were effective in ensuring that information we are required to disclose in the reports we file or submit under the Exchange Act is (1) recorded, processed, summarized, and reported within the time periods specified in the SEC’s rules and forms, and (2) accumulated and communicated to FS Bancorp management, including its CEO and CFO, as appropriate to allow timely decisions regarding required disclosure, specified in the SEC’s rules and forms.
a) Management’s Report on internal control over financial reporting.
FS Bancorp’s management is responsible for establishing and maintaining adequate internal control over financial reporting, as defined in Rule 13a‑15(f) of the Exchange Act. FS Bancorp’s internal control system is designed to provide reasonable assurance to our management and the Board of Directors regarding the preparation and fair presentation of published financial statements for external purposes in accordance with generally accepted accounting principles.
This process includes policies and procedures that: (i) pertain to the maintenance of records that, in reasonable detail, accurately and fairly reflect the transactions of FS Bancorp; (ii) provide reasonable assurance that transactions are recorded as necessary to permit preparation of financial statements in accordance with generally accepted accounting principles, and that receipts and expenditures of FS Bancorp are being made only in accordance with authorizations of management and directors of FS Bancorp; and (iii) provide reasonable assurance regarding prevention or timely detection of unauthorized acquisition, use, or disposition of FS Bancorp’s assets that could have a material effect on the financial statements. A control procedure, no matter how well conceived and operated, can provide only reasonable, not absolute, assurance that the objectives of the control system are met. Also, because of the inherent limitations in all control procedures, no evaluation of controls can provide absolute assurance that all control issues and instances of fraud, if any, within the Company have been detected. Additionally, in designing disclosure controls and procedures, FS Bancorp’s management was required to apply its judgment in evaluating the cost-benefit relationship of possible disclosure controls and procedures. The design of any disclosure controls and procedures is also based in part upon certain assumptions about the likelihood of future events, and there can be no assurance that any design will succeed in achieving its stated goals under all potential future conditions. As a result of these inherent limitations, internal control over financial reporting may not prevent or detect misstatements. Furthermore, projections of any evaluation of effectiveness to future periods are subject to risk that controls may become inadequate because of changes in conditions or that the degree of compliance with the policies or procedures may deteriorate.
FS Bancorp’s management assessed the effectiveness of FS Bancorp’s internal control over financial reporting as of December 31, 2023. In making this assessment, management used the criteria set forth by the Committee of Sponsoring Organizations of the Treadway Commission in Internal Control-Integrated Framework (2013 Framework). Based on management’s assessment, it was concluded that, as of December 31, 2023, FS Bancorp’s internal control over financial reporting was effective based on those criteria.
b) Attestation report of the registered public accounting firm.
Moss Adams LLP, an independent registered public accounting firm, has audited FS Bancorp’s consolidated financial statements and the effectiveness of its internal control over financial reporting as of December 31, 2023, which is included in “Item 8. Financial Statements and Supplementary Data” of this Annual Report on Form 10–K.
c) Changes in internal control over financial reporting.
There were no significant changes in FS Bancorp’s internal control over financial reporting during FS Bancorp’s most recent fiscal quarter that have materially affected or are reasonably likely to materially affect, FS Bancorp’s internal control over financial reporting.
a) Nothing to report.
b) During the quarter ended December 31, 2023, director or officer (as defined in Rule 16a-1(f) under the Exchange Act) of the Corporation adopted or terminated a “Rule 10b5-1 trading arrangement” or “non-Rule 10b5-1 trading arrangement” as each term is defined in Item 408(a) of Regulation S–K.
.
Item 9C. Disclosure Regarding Foreign Jurisdictions that Prevent Inspections
Not applicable.
Item 10. Directors, Executive Officers and Corporate Governance
Directors and Executive Officers
The information required by this item regarding the Company’s Board of Directors is incorporated herein by reference from the section captioned “Proposal I - Election of Directors” in the Company’s Proxy Statement, a copy of which will be filed with the SEC no later than 120 days after the Company’s fiscal year end.
The executive officers of the Company and the Bank are elected annually and hold office until their respective successors have been elected and qualified or until death, resignation or removal by the Board of Directors. For information regarding the Company’s executive officers, see “Item 1. Business – Information About Our Executive Officers” included in this Form 10–K.
Delinquent Section 16(a) Reports
Any information concerning compliance with the reporting requirements of Section 16(a) of the Securities Exchange Act of 1934 by our directors, officers and ten percent stockholders required by this item is incorporated herein by reference from the Company's Proxy Statement, a copy of which will be filed with the Securities and Exchange Commission not later than 120 days after the Company's fiscal year end.
Code of Ethics for Senior Financial Officers
The Board of Directors has adopted a Code of Ethics for the Company’s officers (including its senior financial officers), directors and employees. The Code of Ethics is applicable to the Company’s principal executive officer and senior financial officers. The Company’s Code of Ethics is posted on its website at www.fsbwa.com under the Investor Relations tab.
Nominating Procedures
There have been no material changes to the procedures by which stockholders may recommend nominees to our Board of Directors since last disclosed to stockholders.
Audit Committee and Audit Committee Financial Expert
The Company has a separately-designated standing Audit Committee established in accordance with Section 3(a)(58)(A) of the Exchange Act. The Audit Committee of the Company is composed of Directors Leech (Chairperson), Mansfield and Cofer-Wildsmith. Each member of the Audit Committee is independent as independence is defined for audit committee members in the listing standards of The Nasdaq Stock Market, LLC. The Board of Directors has determined that Mr. Leech and Mr. Mansfield meet the definition of “audit committee financial expert,” as defined by the SEC.
Item 11. Executive Compensation
The information required by this item is incorporated herein by reference from the sections captioned “Executive Compensation” and “Directors’ Compensation” in the Proxy Statement, a copy of which will be filed with the SEC no later than 120 days after the Company’s fiscal year end.
Item 12. Security Ownership of Certain Beneficial Owners and Management and Related Stockholder Matters
(a) Security Ownership of Certain Beneficial Owners.
The information required by this item is incorporated herein by reference from the section captioned “Security Ownership of Certain Beneficial Owners and Management” in the Company’s Proxy Statement, a copy of which will be filed with the SEC no later than 120 days after the Company’s fiscal year end.
(b) Security Ownership of Management.
The information required by this item is incorporated herein by reference from the sections captioned “Security Ownership of Certain Beneficial Owners and Management” and “Proposal I – Election of Directors” in the Company’s Proxy Statement, a copy of which will be filed with the SEC no later than 120 days after the Company’s fiscal year end.
(c) Changes in Control.
The Company is not aware of any arrangements, including any pledge by any person of securities of the Company, the operation of which may at a subsequent date result in a change in control of the Company.
d) Equity Compensation Plans Information. The following table summarizes share and exercise price information about FS Bancorp’s equity compensation plans as of December 31, 2023:
| Number of securities |
||||||||||||
| remaining available for |
||||||||||||
| future issuance under |
||||||||||||
| Number of securities to |
Weighted-average |
equity compensation |
||||||||||
| be issued upon exercise |
exercise price of |
plans (excluding |
||||||||||
| of outstanding options, |
outstanding options, |
securities reflected in |
||||||||||
| Plan category |
warrants, and rights |
warrants, and rights |
column (a)) |
|||||||||
| (a) |
(b) |
(c) |
||||||||||
| Equity compensation plans (stock options) approved by security holders: |
||||||||||||
| 2013 Equity Incentive Plan |
30,638 | $ | 13.85 | N/A | ||||||||
| 2018 Equity Incentive Plan |
631,641 | $ | 28.98 | 330,154 | ||||||||
| Equity compensation plans not approved by security holders |
N/A | N/A | N/A | |||||||||
| Total |
662,279 | $ | 28.12 | 330,154 | (1) |
|||||||
_____________________________
(1) Includes 76,622 shares available for future grants of restricted stock.
Item 13. Certain Relationships and Related Transactions, and Director Independence
The information required by this item is incorporated herein by reference from the section captioned “Transactions with Management” in the Company’s Proxy Statement, a copy of which will be filed with the SEC no later than 120 days after the Company’s fiscal year end.
Item 14. Principal Accountant Fees and Services
The information required by this item is incorporated herein by reference from the section captioned “Proposal 3 – Ratification of Appointment of Independent Auditor” in the Company’s Proxy Statement, a copy of which will be filed with the SEC no later than 120 days after the Company’s fiscal year end.
Item 15. Exhibits and Financial Statement Schedules
| (a) |
1. Financial Statements |
||
| For a list of the financial statements filed as part of this report see “Part II - Item 8. Financial Statements and Supplementary Data.” |
|||
| 2. Financial Statement Schedules |
|||
| Schedules to the Consolidated Financial Statements have been omitted as the required information is inapplicable. |
|||
| (b) |
Exhibits |
||
| Exhibits are available from the Company by written request |
|||
| 3.1 |
|||
| 3.2 |
|||
| 4.1 |
|||
| 4.2 |
|||
| 4.3 |
|||
| 4.4 |
|||
| 10.1 |
Severance Agreement between 1st Security Bank of Washington and Joseph C. Adams (1) |
||
| 10.2 |
|||
| 10.3 |
FS Bancorp, Inc. 2013 Equity Incentive Plan (the “2013 Plan”) (5) |
||
| 10.4 |
Form of Incentive Stock Option Agreement under the 2013 Plan (5) |
||
| 10.5 |
Form of Non-Qualified Stock Option Agreement under the 2013 Plan (5) |
||
| 10.6 |
|||
| 10.9 |
|||
| 10.10 |
|||
| 10.11 |
Form of Incentive Stock Option Award Agreement under the 2018 Equity Incentive Plan (8) |
||
| 10.12 |
Form of Non-Qualified Stock Option Award Agreement under the 2018 Equity Incentive Plan (8) |
||
| 10.13 |
Form of Restricted Stock Award Agreement under the 2018 Equity Incentive Plan (8) |
||
| 10.14 |
|||
| 10.15 |
Form of Enrollment/Change Form under the FS Bancorp, Inc. Nonqualified 2022 Stock Purchase Plan (9) |
||
| 10.16 | Form of Change of Control Agreement with Shana Allen and Benjamin Crowl (10) | ||
| 14 |
|||
| 21 |
|||
| 23 |
|||
| 31.1 |
Certification of Chief Executive Officer Pursuant to Section 302 of the Sarbanes-Oxley Act of 2002 |
||
| 31.2 |
Certification of Chief Financial Officer Pursuant to Section 302 of the Sarbanes-Oxley Act of 2002 |
||
| 32.1 |
Certification of Chief Executive Officer Pursuant to Section 906 of the Sarbanes-Oxley Act of 2002 |
||
| 32.2 |
Certification of Chief Financial Officer Pursuant to Section 906 of the Sarbanes-Oxley Act of 2002 |
||
| 97 | Policy relating to Recovery of Erroneously Awarded Compensation | ||
| 101 |
The following materials from the Company’s Annual Report on Form 10‑K for the fiscal year ended December 31, 2023, formatted in Inline Extensible Business Reporting Language (iXBRL): (1) Consolidated Balance Sheets; (2) Consolidated Statements of Income; (3) Consolidated Statements of Comprehensive Income; (4) Consolidated Statements of Stockholders’ Equity; (5) Consolidated Statements of Cash Flows; and (6) Notes to Consolidated Financial Statements. |
||
| 104 |
Cover Page Interactive Data file (formatted as Inline XBRL and contained in Exhibit 101) |
||
| (1) |
Filed as an exhibit to the Registrant’s Registration Statement on Form S-1 (333-177125) filed on October 3, 2011, and incorporated by reference. |
| (2) |
Filed as an exhibit to the Registrant’s Current Report on Form 8‑K filed on July 10, 2013 (File No. 001‑355589). |
| (3) |
Filed as an exhibit to the Registrant’s Current Report on Form 8-K filed on February 11, 2021 (File No. 001-35589). |
| (4) | Filed as an exhibit to the Registrant's Current Report on 424B5 (Prospectus) (333-215810) filed on September 11, 2017. |
| (5) |
Filed as an exhibit to the Registrant’s Registration Statement on Form S‑8 (333‑192990) filed on December 20, 2013 and incorporated by reference. |
| (6) |
Filed as an exhibit to the Registrant’s Current Report on Form 8-K filed on February 1, 2016 (File No. 001-35589) |
| (7) |
Registrant elects to satisfy Regulation S-K §229.406(c) by posting its Code of Ethics on its website at www.fsbwa.com in the section titled Investor Relations: Corporate Governance. |
| (8) |
Filed as an exhibit to the Registrant’s Registration Statement on Form S-8 (333-22513) filed on May 23,2018. |
| (9) |
Filed as an exhibit to the Registrant’s Registration Statement on Form S-8 (333-265729) filed on June 21,2022. |
| (10) | Filed as an exhibit to the Registrant's Current Report on Form 8-K filed on February 2, 2024 (File No. 001-35589). |
None.
Pursuant to the requirements of Section 13 or 15(d) of the Securities Exchange Act of 1934, the registrant has duly caused this report to be signed on its behalf by the undersigned, thereunto duly authorized.
| Date: March 15, 2024 |
FS Bancorp, Inc. |
| /s/Joseph C. Adams |
|
| Joseph C. Adams |
|
| Chief Executive Officer |
Pursuant to the requirements of the Securities Exchange Act of 1934, this report has been signed below by the following persons on behalf of the registrant and in the capacities and on the dates indicated.
| SIGNATURES |
TITLE |
DATE |
||
| /s/Joseph C. Adams |
Director and Chief Executive Officer |
March 15, 2024 | ||
| Joseph C. Adams |
(Principal Executive Officer) |
|
||
| /s/Matthew D. Mullet |
Chief Financial Officer, Treasurer and Secretary |
March 15, 2024 | ||
| Matthew D. Mullet |
(Principal Financial and Accounting Officer) |
|
||
| /s/Ted A. Leech |
Chairman of the Board |
March 15, 2024 | ||
| Ted A. Leech |
|
|||
| /s/Margaret R. Piesik |
Director |
March 15, 2024 | ||
| Margaret R. Piesik |
|
|||
| /s/Joseph P. Zavaglia |
Director |
March 15, 2024 | ||
| Joseph P. Zavaglia |
|
|||
| /s/Michael J. Mansfield |
Director |
March 15, 2024 | ||
| Michael J. Mansfield |
|
|||
| /s/Marina Cofer-Wildsmith |
Director |
March 15, 2024 | ||
| Marina Cofer-Wildsmith |
|
|||
| /s/Pamela M. Andrews |
Director |
March 15, 2024 |
||
| Pamela M. Andrews |