UNITED STATES
SECURITIES AND EXCHANGE COMMISSION
Washington, D.C. 20549
FORM 10-K
(Mark One)
| ANNUAL REPORT PURSUANT TO SECTION 13 OR 15(d) OF THE SECURITIES EXCHANGE ACT OF 1934 | |||||
For the year ended December 31 , 2023
or
| TRANSITION REPORT PURSUANT TO SECTION 13 OR 15(d) OF THE SECURITIES EXCHANGE ACT OF 1934 | |||||
For the transition period from to
Commission file number: 001-34511
______________________________________
(Exact name of registrant as specified in its charter)
______________________________________
| (State or other jurisdiction of incorporation or organization) | (I.R.S. Employer Identification No.) | ||||
(Address of principal executive offices, including zip code)
(408 ) 235-7700
(Registrant’s telephone number, including area code)
Securities registered pursuant to Section 12(b) of the Act:
| Title of each class | Trading Symbol | Name of each exchange on which registered | ||||||||||||
Securities registered pursuant to Section 12(g) of the Act: None
Indicate by check mark if the registrant is a well-known seasoned issuer, as defined in Rule 405 of the Securities Act. Yes ☒ No ☐
Indicate by check mark if the registrant is not required to file reports pursuant to Section 13 or Section 15(d) of the Act. Yes ☐ No ☒
Indicate by check mark whether the registrant (1) has filed all reports required to be filed by Section 13 or 15(d) of the Securities Exchange Act of 1934 (“Exchange Act”) during the preceding 12 months (or for such shorter period that the registrant was required to file such reports), and (2) has been subject to such filing requirements for the past 90 days. Yes ☒ No ☐
Indicate by check mark whether the registrant has submitted electronically every Interactive Data File required to be submitted pursuant to Rule 405 of Regulation S-T (§232.405 of this chapter) during the preceding 12 months (or for such shorter period that the registrant was required to submit such files). Yes ☒ No ☐
Indicate by check mark whether the registrant is a large accelerated filer, an accelerated filer, a non-accelerated filer, a smaller reporting company, or an emerging growth company. See the definitions of “large accelerated filer,” “accelerated filer,” “smaller reporting company,” and “emerging growth company” in Rule 12b-2 of the Exchange Act.
| ☒ | Accelerated filer | ☐ | |||||||||||||||
| Non-accelerated filer | ☐ | Smaller reporting company | |||||||||||||||
| Emerging growth company | |||||||||||||||||
If an emerging growth company, indicate by check mark if the registrant has elected not to use the extended transition period for complying with any new or revised financial accounting standards provided pursuant to Section 13(a) of the Exchange Act. ☐
Indicate by check mark whether the registrant has filed a report on and attestation to its management’s assessment of the effectiveness of its internal control over financial reporting under Section 404(b) of the Sarbanes-Oxley Act (15 U.S.C. 7262(b)) by the registered public accounting firm that prepared or issued its audit report. ☒
If securities are registered pursuant to Section 12(b) of the Exchange Act, indicate by check mark whether the financial statements of the registrant included in the filing reflect the correction of an error to previously issued financial statements. ☐
Indicate by check mark whether any of those error corrections are restatements that required a recovery analysis of incentive-based compensation received by any of the registrant’s executive officers during the relevant recovery period pursuant to §240.10D-1(b). ☐
Indicate by check mark whether the registrant is a shell company (as defined in Rule 12b-2 of the Exchange Act). Yes ☐ No ☒
The aggregate market value of voting stock held by non-affiliates of the registrant, as of June 30, 2023, the last business day of the registrant’s most recently completed second quarter, was $38,472,948,871 (based on the closing price for shares of the registrant’s common stock as reported by The Nasdaq Global Select Market on that date). Shares of common stock held by each executive officer, director, and holder of 5% or more of the registrant’s outstanding common stock have been excluded in that such persons may be deemed to be affiliates. This determination of affiliate status is not necessarily a conclusive determination for other purposes.
As of February 22, 2024, there were 763,030,948 shares of the registrant’s common stock outstanding.
DOCUMENTS INCORPORATED BY REFERENCE
FORTINET, INC.
ANNUAL REPORT ON FORM 10-K
For the Year Ended December 31, 2023
Table of Contents
| Page | ||||||||
| Part I | ||||||||
| Item 1. | ||||||||
| Item 1A. | ||||||||
| Item 1B. | ||||||||
Item 1C. | ||||||||
| Item 2. | ||||||||
| Item 3. | ||||||||
| Item 4. | ||||||||
| Part II | ||||||||
| Item 5. | ||||||||
| Item 6. | ||||||||
| Item 7. | ||||||||
| Item 7A. | ||||||||
| Item 8. | ||||||||
| Item 9. | ||||||||
| Item 9A. | ||||||||
| Item 9B. | ||||||||
| Item 9C. | ||||||||
| Part III | ||||||||
| Item 10. | ||||||||
| Item 11. | ||||||||
| Item 12. | ||||||||
| Item 13. | ||||||||
| Item 14. | ||||||||
| Part IV | ||||||||
| Item 15. | ||||||||
| Item 16. | ||||||||
Summary of Risk Factors
Our business is subject to numerous risks and uncertainties, including those described in Part I, Item 1A, “Risk Factors” in this Annual Report on Form 10-K. You should carefully consider these risks and uncertainties when investing in our common stock. Some of the principal risks and uncertainties include:
•Our operating results are likely to vary significantly and be unpredictable.
•Adverse economic conditions, such as a possible economic downturn or recession, and possible impacts of inflation or stagflation, increasing or decreasing interest rates, instability in the global banking system or reduced information technology spending, including firewall spending, may adversely impact our business.
•We have been, and may in the future be, susceptible to supply chain constraints, supply shortages and disruptions, long or less predictable lead times for components and finished goods and supply changes because some of the key components in our products come from limited sources of supply.
•As a result of supply chain disruptions in previous periods, we increased our purchase order commitments in previous periods and, as a result, may be required to accept or pay for components and finished goods regardless of our level of sales in a particular period, which may negatively impact our operating results and financial condition.
•Our billings, revenue, and free cash flow growth may slow further or may not continue, and our operating margins may decline.
•Our real estate investments, including construction, acquisitions, sales, or strategy changes, and ongoing maintenance and management of office buildings, warehouses, data centers and points of presence, as well as data center expansions or enhancements, could involve significant risks to our business.
•Our backlog has fluctuated over past quarters and any decrease in growth or negative growth of in-quarter billings and revenue may not be reflected by our aggregate billings and revenue. As we have fulfilled, shipped and billed during a quarter to satisfy backlog, this has increased our aggregate billings and revenue during any particular quarter, and as the supply chain challenges normalize, the growth comparisons versus prior quarters where backlog contributed more to billings have become more challenging.
•Any weakness in sales strategy, productivity and execution could negatively impact our results of operations.
•We are dependent on the continued services and performance of our senior management, as well as our ability to hire, retain and motivate qualified personnel.
•We rely on third-party channel partners for substantially all of our billings, revenue and a small number of distributors represents a large percentage of our revenue and accounts receivable.
•Reliance on a concentration of shipments at the end of the quarter could cause our billings and revenue to fall below expected levels.
•We rely significantly on revenue from FortiGuard security subscription and FortiCare technical support services, and revenue from these services may decline or fluctuate.
•We have incurred indebtedness and may incur other debt in the future, which may adversely affect our financial condition and future financial results.
•We generate a majority of billings, revenue and cash flow from sales outside of the United States.
•We may not be successful in executing our strategy to increase our sales to large- and medium-sized end-customers.
•A portion of our revenue is generated by sales to government organizations and other customers, which are subject to a number of regulatory requirements, challenges and risks.
•We face intense competition in our market and we may not maintain or improve our competitive position.
1
•We order components from third-party manufacturers based on our forecasts of future demand and targeted inventory levels, which exposes us to the risk of both product shortages, may result in lost sales and higher expenses, including excess inventory charges and costs related to future purchase commitments, and may require us to sell our products at discounts or offer various other incentives.
•We depend on third parties to provide various components for our products and build our products and are susceptible to manufacturing delays, capacity constraints and cost increases.
•We are susceptible to defects or vulnerabilities in our products or services, as well as reputational harm from the failure or misuse of our products or services, and any actual or perceived defects or vulnerabilities in our products or services or the failure of our products or services to detect or prevent a security incident, or the failure to help secure our customers or cause our products or services to allow unauthorized access to our customers network, could harm our operational results and reputation more significantly as compared to certain other companies given we are a security company.
•Our inability to successfully acquire and integrate other businesses, products or technologies, or to successfully invest in and form successful strategic alliances with other businesses, could seriously harm our competitive position and could negatively affect our financial condition and results of operations. In addition, any additional future impairment of the value of our investment in Linksys Holdings, Inc. (“Linksys”) could negatively affect our financial condition and results of operations.
•Investors’ and regulators’ expectations of our performance relating to environmental, social and governance factors may impose additional costs and expose us to new risks.
•We are exposed to fluctuations in currency exchange rates, which could negatively affect our financial condition and results of operations.
•Our proprietary rights may be difficult to enforce and we may be subject to claims by others that we infringe their proprietary technology.
•The trading price of our common stock may be volatile, which volatility may be exacerbated by share repurchases under our Share Repurchase Program (the “Repurchase Program”).
•Anti-takeover provisions contained in our certificate of incorporation and bylaws, as well as provisions of Delaware law, could impair a takeover attempt.
•Global economic uncertainty and weakening product demand caused by political instability, changes in trade agreements, wars and foreign conflicts, such as the war in Ukraine and the Israel-Hamas war or tensions between China and Taiwan, could adversely affect our business and financial performance.
2
Part I
ITEM 1. Business
Overview
Fortinet is a leader in cybersecurity and the convergence of networking and security. Our mission is to secure people, devices and data everywhere. Our integrated platform, the Fortinet Security Fabric, spans secure networking, unified Secure Access Service Edge (“SASE”) and AI-driven security operations to deliver cybersecurity where our customers need it. As of December 31, 2023, over a half million customers trusted our solutions, including enterprises such as in the financial services, retail and operational technology market verticals, communication and security service providers, government organizations and small and medium-sized businesses. As a global company headquartered in Sunnyvale, California with a large international customer base, the majority of our research and development is in the United States and Canada with a global footprint of support and centers of excellence around the world. As of December 31, 2023, we held 957 U.S. patents and 1,299 global patents and we are recognized in over 80 enterprise analyst reports demonstrating both our vision and execution across networking and security products.
•Secure Networking—Our Secure Networking solutions focus on the convergence of networking and security via our network firewall and our switches, access points and other secure connectivity solutions. FortiOS is our networking and security operating system that is consistent across our firewalls and secure connectivity solutions and supports over 30 functions that can be delivered via a physical, virtual, cloud or Software as a Service (“SaaS”) solution. When delivered via our network firewall appliances, functionality is accelerated through our proprietary Application-Specific Integrated Circuits (“ASIC”) technology. These proprietary ASICs, combined with off-the-shelf central processing units (“CPUs”) and ASICs, allow our systems to scale, run multiple applications at higher performance, lower power consumption and perform more processor-intensive operations, such as inspecting encrypted traffic, including streaming video. The Network Firewall solution consists of FortiGate data centers, hyperscale and distributed firewalls, as well as encrypted applications (secure sockets layer (“SSL”) inspection, Virtual Private Network and IPsec connectivity). Our ability to converge networking and security also enables the ethernet to become an extension of a company’s security infrastructure through FortiSwitch and FortiLink. Our wireless local area network (“LAN”) solution leverages secure networking to provide secure wireless access for the enterprise LAN edge. FortiExtender secures 5G/LTE and remote ethernet extenders to connect and secure any branch environment. The Secure Connectivity solution includes FortiSwitch Secure Ethernet Switches, FortiAP Wireless Local Area Network Access Points and FortiExtender 5G Connectivity Gateways, among other products.
•Unified Secure Access Service Edge (SASE)—As applications move to the cloud and work from anywhere becomes established, cloud delivery is needed to enable secure access to applications on any cloud. The Fortinet Unified SASE solution is a single-vendor SASE solution that includes Firewall, SD-WAN, Secure Web Gateway, Cloud Access Services Broker, Data Loss Prevention, Zero Trust Network Access and cloud security, including Web Application Firewalls, Virtualized Firewalls and Cloud-Native Firewalls, among other products. These functions are delivered through our FortiOS operating systems, which can deploy the full SASE stack through the cloud or on our ASIC-driven appliances. All functions can be managed through a unified management console.
•Security Operations (SecOps)—Fortinet’s Security Operations solutions comply with the National Institute of Standards and Technology (“NIST”) cybersecurity framework of identify, protect, detect, respond and recover, and are delivered as a platform that automates detection and response to accelerate discovery and remediation. The SecOps solution includes FortiAI generative AI assistant, FortiSIEM Security Information and Event Management, FortiSOAR Security Orchestration, Automation and Response, FortiEDR Endpoint Detection and Response, FortiXDR Extended Detection and Response, FortiMDR Managed Detection and Response Service, FortiNDR Network Detection and Response, FortiRecon Digital Risk Protection, FortiDeceptor Deception technology, FortiGuard SoCaaS, FortiSandbox Sandboxing Services and FortiGuard Incident Response Services, among other products.
FortiGuard Labs is our cybersecurity threat intelligence and research organization comprised of experienced threat hunters, researchers, analysts, engineers and data scientists who develop and utilize machine learning and AI technologies to provide timely protection updates and actionable threat intelligence for the benefit of our customers. FortiGuard Security Services are a suite of AI-powered security capabilities that are natively integrated as part of the Fortinet Security Fabric to deliver coordinated detection and enforcement across the entire attack surface. The portfolio consists of FortiGuard application security services, content security services, device security services, NOC/SOC security services and web security services.
FortiCare Technical Support Service is a per-device support service, which provides customers access to experts to ensure efficient and effective operations and maintenance of their Fortinet capabilities. Global technical support is offered 24x7 with flexible add-ons, including enhanced Service Level Agreements (“SLAs”) and premium hardware replacement through in-
3
country depots. Organizations have the flexibility to procure different levels of service for different devices based on their availability needs. We offer three per-device support options tailored to the needs of our enterprise customers: FortiCare Premium, FortiCare Elite and FortiCare Essential. The FortiCare Elite service aims to provide 15-minute response times for key product families.
We also offer training services to our end-customers and channel partners through our training team and authorized training partners. We have also implemented a training certification program, Network Security Expert (“NSE”), to help ensure an understanding of our products and services. Since 2020, Fortinet has also offered a number of free online training courses to help address prevalent industry-wide cybersecurity skills gaps and shortages.
During the year ended December 31, 2023, we generated total revenue of $5.30 billion and net income of $1.15 billion. See Part II, Item 8 of this Annual Report on Form 10-K for more information on our consolidated balance sheets as of December 31, 2023 and 2022 and our consolidated statements of income, comprehensive income, equity (deficit), and cash flows for each of the three years ended December 31, 2023, 2022 and 2021.
We were incorporated in Delaware in November 2000. Our principal executive office is located at 909 Kifer Road, Sunnyvale, California 94086 and our telephone number at that location is (408) 235-7700.
Industry Background: The Trends Driving the Need for a Platform Approach
Modern networks are increasingly complex, spanning many edges as well as a mix of cloud and on-premises deployments. Fortinet was founded with the mission of providing a converged networking and security approach that empowers organizations to adopt new technologies without worrying about how it would impact their ability to manage and secure their environments. The escalating threat landscape has resulted in a significant increase in the demand for secure networking solutions. In fact, we believe the demand for secure networking will overtake the pure networking market by 2030. At the same time, businesses contend with an escalating threat landscape, a cybersecurity skills shortage, and siloed security tools that do not work well together. They need to consolidate point products to gain better visibility and faster threat response times.
A platform approach–what we call the Fortinet Security Fabric–has emerged to address these challenges and support enterprises in reducing complexity and improving risk mitigation. The concept of an integrated cybersecurity platform that converges networking and security and consolidates point products is what guides how we design our products and advise our customers and partners.
Customers
Our end-customers are located in over 100 countries and include small, medium and large enterprises and government organizations across a wide range of industries, including financial services, government, manufacturing, retail, technology, education, healthcare and telecommunications. An end-customer deployment may involve as few as one or as many as dozens of different types of integrated products and services from across our broad portfolio that spans secure networking, unified SASE, and security operations. Customers may also access our products via the cloud through certain cloud providers such as Amazon Web Services, Microsoft Azure and Google Cloud. Often, our customers also purchase our FortiGuard security subscription services and FortiCare technical support services. Refer to Note 16 Segment Information in Part II, Item 8 of this Annual Report on Form 10-K for distributor customers that accounted for 10% or more of our revenue or net accounts receivable.
Sales and Marketing
We primarily sell our products and services through a two-tier distribution model. We sell to distributors that sell to resellers and to service providers and managed security service providers (“MSSPs”), who, in turn, sell products and/or services to end-customers. In certain cases, we sell directly to large service providers and major systems integrators. We work with many technology distributors, including Arrow Electronics, Inc., Exclusive, Ingram Micro and TD Synnex (formerly Tech Data Corporation and Synnex Corporation, separately). In addition, we provide our cloud-based subscription offerings through Fortinet-owned data centers, as well as data centers operated under co-location arrangements globally, and via public cloud providers.
We support our channel partners with a dedicated team of experienced channel account managers, sales professionals and sales engineers who provide business planning, joint marketing strategy, pre-sales and operational sales support. Additionally, our sales teams help drive and support large enterprise and service provider sales through a direct touch model. Our sales professionals and engineers typically work closely with our channel partners and directly engage with large end-customers to address their unique security and deployment requirements. To support our broadly dispersed global channel and end-customer base, we have sales professionals in over 100 countries around the world.
4
Our marketing strategy is focused on building our brand, driving thought leadership with emphasis on the criticality of cybersecurity platform adoption and the convergence of security and networking as well as driving end-customer demand for our security solutions. We use a combination of internal marketing professionals and a network of regional and global channel partners. Our internal marketing organization is responsible for messaging, branding, demand generation, product marketing, channel marketing, partner incentives and promotions, event marketing, digital marketing, communications, analyst relations, public relations, and sales enablement. We focus our resources on campaigns, programs, and activities that can be leveraged by partners worldwide to extend our marketing reach, such as sales tools and collateral, product awards and technical certifications, media engagement, training, regional seminars and conferences, webinars, and various other demand-generation activities.
Manufacturing and Suppliers
We outsource the manufacturing of our security appliance products to a variety of contract manufacturers and original design manufacturers. Our current manufacturing partners include ADLINK Technology, Inc. (“ADLINK”), IBASE Technology, Inc. (“IBASE”), Micro-Star International Co. (“Micro-Star”), Senao Networks, Inc. (“Senao”), Wistron Corporation (“Wistron”), and a number of other manufacturers. Approximately 95% of our hardware is manufactured in Taiwan. We submit purchase orders to our contract manufacturers that describe the type and quantities of our products to be manufactured, the delivery date and other delivery terms. Once our products are manufactured, they are sent to either our warehouse in California or to our logistics partner in Taoyuan City, Taiwan, where accessory packaging and quality-control testing are performed. We believe that outsourcing our manufacturing and a substantial portion of our logistics enables us to focus resources on our core competencies. Our proprietary ASICs, which are key to the performance of our appliances, are built by contract manufacturers including Toshiba America Electronic Components, Inc. (“Toshiba America”) and Renesas Electronics America, Inc. (“Renesas”). These contract manufacturers use foundries in Taiwan and Japan operated by either Taiwan Semiconductor Manufacturing Company Limited (“TSMC”) or by the contract manufacturer itself.
The components included in our products are sourced from various suppliers by us or, more frequently, by our contract manufacturers. Some of the components important to our business, including certain CPUs from Intel Corporation (“Intel”) and Advanced Micro Devices, Inc. (“AMD”), network and wireless chips from Broadcom Inc. (“Broadcom”), Marvell Technology Group Ltd. (“Marvell”), Qualcomm Incorporated (“Qualcomm”) and Intel and memory devices from Intel, Micron Technology (“Micron”), ADATA Technology Co., Ltd. (“ADATA”), Toshiba Corporation (“Toshiba”), Samsung Electronics Co., Ltd. (“Samsung”), and Western Digital Technologies, Inc. (“Western Digital”), are available from limited or sole sources of supply.
We have no long-term contracts related to the manufacturing of our ASICs or other components that guarantee any capacity or pricing terms.
Research and Development
We focus our research and development efforts on developing new hardware and software products and services, and adding new features to existing products, services and operating systems. Our development strategy is to identify features, products and systems for both software and hardware that are, or are expected to be, important to our end-customers. Our success in designing, developing, manufacturing and selling new or enhanced products will depend on a variety of factors, including identification of market demand for new products or new features, components selection, timely implementation of product design and development, product performance, quality, ease of use, costs of development, bill of materials, effective manufacturing and assembly processes and sales and marketing.
Intellectual Property
We rely primarily on patent, trademark, copyright and trade secrets laws, confidentiality procedures and contractual provisions to protect our technology. We periodically have discussions with third parties regarding licensing Fortinet’s intellectual property (“IP”) and have sometimes taken legal action against competitors to protect our IP, and as a result third parties have paid us fees in return for licenses or covenants-not-to-sue related to Fortinet IP. As of December 31, 2023, we had 1,299 U.S. and foreign-issued patents and 252 pending U.S. and foreign patent applications. We also license software from third parties for inclusion in our products, including open source software and other software.
Despite our efforts to protect our rights in our technology, unauthorized parties may attempt to copy aspects of our products or obtain and use information and technology that we regard as proprietary. We generally enter into confidentiality agreements with our employees, consultants, vendors and customers, and generally limit access to and distribution of our proprietary information. However, we cannot provide assurance that the steps we take will prevent misappropriation of our technology. In addition, the laws of some foreign countries do not protect our proprietary rights to as great an extent as the laws
5
of the United States, and many foreign countries do not enforce these laws as diligently as government agencies and private parties in the United States.
Our industry is characterized by the existence of a large number of patents and frequent claims and related litigation regarding patent and other IP rights. Third parties have asserted, are currently asserting and may in the future assert patent, copyright, trademark or other IP rights against us, our channel partners or our end-customers. Successful claims of infringement by a third-party could prevent us from distributing certain products or performing certain services or require us to pay substantial damages (including treble damages if we are found to have willfully infringed patents or copyrights), royalties or other fees. Even if third parties offer a license to their technology, the terms of any offered license may not be acceptable and the failure to obtain a license or the costs associated with any license could cause our business, operating results or financial condition to be materially and adversely affected. In certain instances, we indemnify our end-customers, distributors and resellers against claims that our products infringe the IP of third parties.
Government Regulation
We are subject to regulation by various federal, state, regional, local and foreign governmental agencies, including agencies responsible for monitoring and enforcing employment and labor laws, workplace safety, security, product safety, product labeling, environmental laws, consumer protection laws, anti-bribery laws, data privacy laws, import and export controls, federal securities laws and tax laws and regulations. Many of the laws and regulations that are or may be applicable to our business are changing or being tested in courts and could be interpreted in ways that could adversely impact our business. In addition, the application and interpretation of these laws and regulations often are uncertain, particularly in the industry in which we operate. We believe we take reasonable steps designed to ensure we are in compliance with current laws and regulations and do not expect continued compliance to have a material impact on our capital expenditures, earnings, or competitive position. We continue to monitor existing and pending laws and regulations and while the impact of regulatory changes cannot be predicted with certainty, we do not currently expect compliance to have a material adverse effect.
Seasonality
For information regarding seasonality in our sales, see the section entitled “Management’s Discussion and Analysis of Financial Condition and Results of Operations—Seasonality, Cyclicality and Quarterly Revenue Trends” in Part II, Item 7 of this Annual Report on Form 10-K.
Competition
The markets for our products are extremely competitive and are characterized by rapid technological change. The principal competitive factors in our markets include:
•product security performance, throughput, features, effectiveness, interoperability and reliability;
•addition and integration of new networking and security features and technological expertise;
•compliance with industry standards and security and other certifications;
•price of products and services and total cost of ownership;
•brand recognition;
•customer service and support across varied and complex customer segments and use cases;
•sales and distribution capabilities;
•size and financial stability;
•breadth of product line;
•form factor of the solution; and
•other competitive differentiators.
Among others, our competitors include Aruba Networks, Inc. (“Aruba”), Check Point Software Technologies Ltd. (“Check Point”), Cisco Systems, Inc. (“Cisco”), CrowdStrike Holdings, Inc. (“CrowdStrike”), F5 Networks, Inc. (“F5 Networks”), Huawei Technologies Co., Ltd. (“Huawei”), Juniper Networks, Inc. (“Juniper”), Palo Alto Networks, Inc. (“Palo Alto Networks”), SonicWALL, Inc. (“SonicWALL”), Sophos Group Plc (“Sophos”), VMware, Inc. (“VMware”) and Zscaler, Inc. (“Zscaler”).
We believe we compete favorably based on our products’ security performance, throughput, reliability, breadth and ability to work together, our ability to add and integrate new networking and security features and our technological expertise. Several competitors are significantly larger, have greater financial, technical, marketing, distribution, customer support and other resources, are more established than we are, and have significantly better brand recognition. Some of these larger competitors have substantially broader product offerings and leverage their relationships based on other products or incorporate
6
functionality into existing products in a manner that discourages users from purchasing our products. Based in part on these competitive pressures, we may lower prices or attempt to add incremental features and functionalities to our products.
Conditions in our markets could change rapidly and significantly as a result of technological advancements, market consolidation, supply chain constraints, price list or discount changes or inflation. The development and market acceptance of alternative technologies could decrease the demand for our products or render them obsolete. Our competitors may introduce products that are less costly, provide superior performance, are better marketed, or achieve greater market acceptance than our products. Additionally, our larger competitors often have broader product lines and are better positioned to withstand a significant reduction in capital spending by end-customers, and will therefore not be as susceptible to downturns in a particular market. The above competitive pressures are likely to continue to impact our business. We may not be able to compete successfully in the future, and competition may harm our business.
Human Capital Management
As of December 31, 2023, our total headcount was 13,568 employees, approximately 30% of whom were employed in the United States and approximately 70% of whom were employed outside of the United States.
Our employees are the foundation of our innovation and cybersecurity leadership for the benefit of our customers. We understand there is a shortage of highly skilled employees for security companies like ours, and we believe that our success and competitive advantage depends largely on our ability to continue to attract and retain highly skilled employees with diverse backgrounds and experiences. We believe we offer fair, competitive compensation and benefits, and we encourage a culture of fairness and meritocracy. Our compensation programs for our employees include base pay, incentive compensation, opportunities for equity ownership where local statutes allow and employee benefits that promote well-being across different aspects of our employees’ lives, which may include health and welfare insurance, retirement benefits and paid time off.
As a global company, much of our success is rooted in the diversity of our teams and our commitment to diversity, equity and inclusion (“DEI”). Such commitment starts at the top, with a highly skilled and diverse board of directors. As of December 31, 2023, women represented 25% of the members of our board of directors, and approximately 50% of our board of directors was from underrepresented communities. We value diversity at all levels and continue to focus on enhancing our DEI initiatives across our workforce.
We are also committed to community engagement and social responsibility with regards to our employees and beyond, and our board of directors has active oversight of such initiatives. Examples of our initiatives focused on our employees include our company matching program for employee charitable contributions and the free security training programs we offer to help with career development for our employees, in addition to the general public.
Our culture is defined by our commitment to ethics and integrity. We reinforce our ethical “tone at the top” through clear policies including our Code of Business Conduct and Ethics, regular compliance training for our employees, quarterly meetings of our cross-functional Ethics Committee, clear messaging from our executives, enforcement of company policies and oversight by our board of directors. In addition, our Chief Executive Officer regularly communicates the importance of Fortinet’s core values of openness, teamwork and innovation.
None of our U.S. employees are represented by a labor union. Our employees in certain European and Latin American countries, however, have the right to be represented by external labor organizations if they maintain up-to-date union membership. We have not experienced any work stoppages, and we consider our relations with our employees to be good.
Environmental, Social and Governance
We are committed to responsible environmental, social and governance (“ESG”) practices and having a positive impact on the sustainability of our society and planet. Fortinet is a member of the Dow Jones Sustainability Indices — World and North America, for the second consecutive year. Our approach to ESG is based on a strong corporate governance structure, starting with the Social Responsibility Committee of our board of directors, which provides oversight of our Corporate Social Responsibility (“CSR”) strategy, initiatives and execution related to ESG matters. Our senior leadership sponsors the integration of CSR priorities throughout our business operations. In addition, our CSR team, along with our internal cross-functional employee CSR Committee, engage with internal and external stakeholders to lead CSR execution, communications and disclosure.
Environmental. We recognize that environmental considerations such as climate change, resource scarcity and the energy crisis are top priorities for the future of our planet. We are committed to helping address climate change impacts and minimizing the environmental footprint of our solutions, operations and our broader value chain. We are engaged on a
7
decarbonization path to reach net zero for our Scope 1 and Scope 2 emissions by 2030, and formally signed on to the Science-Based Target Initiative commitment in September 2022. In 2023, we obtained the ISO14001 certification for our largest company-owned warehouse in Union City, California, and have continued to be a leader on energy efficiency with the launch of our SP5 ASIC and our FortiGate-90G model. We submitted our survey on environment to CDP, which is a not-for-profit charity organization that runs the global disclosure system for companies to manage their environmental impacts. We also disclosed for the first time our Scope 3 emissions, across all 12 relevant categories, as part of our annual reporting on sustainability.
Social. We are committed to building an inclusive, equitable and diverse workforce within our organization and across the security industry to help empower individuals to reach their full potential. We continue to focus on skilling, upskilling and reskilling individuals and are on track to reach our goal of training one million people in cybersecurity by 2026 with over 430,000 individuals trained as of the end of 2023. As part of our Education Outreach Program, which focuses on creating a more diverse cybersecurity talent pool, we launched the Veterans Program Advisory Council to help build on the Veterans Program's success in providing more cybersecurity training pathways for military veterans across the United States, the United Kingdom, Canada, Australia and New Zealand. We offered our Security Awareness Curriculum at no cost to primary and secondary schools across the same countries. We continued to expand partnerships with educational institutions and now have over 650 Authorized Academic Partners in 99 countries or territories across the world. Internally, we continue to foster a culture of diversity and inclusion through our DEI Council, which meets quarterly, Employee Resource Groups and various campaigns and activities that engage our broader workforce.
Governance. Our approach to responsible business is based on strong corporate governance practices that aim to ensure accountability while meeting our responsibilities across our value chain, starting with our employees. Our board of directors regularly reviews our governance practices. Our Codes of Conduct apply to employees, partners and suppliers, and we have compliance trainings and controls in place. In 2023, we established a risk management committee and steering committee to further enhance our anti-corruption program and we employ a thorough screening process for partners and suppliers, including continuous monitoring in high-risk zones, and resolution process for risk mitigation.
Available Information
Our web site is located at https://www.fortinet.com, and our investor relations web site is located at https://investor.fortinet.com. The information posted on our website is not incorporated by reference into this Annual Report on Form 10-K. Our Annual Report on Form 10-K, Quarterly Reports on Form 10-Q, Current Reports on Form 8-K and amendments to reports filed or furnished pursuant to Sections 13(a) and 15(d) of the Securities Act of 1933, as amended (the “Securities Act”), are available free of charge on our investor relations web site as soon as reasonably practicable after we electronically file such material with, or furnish it to, the Securities and Exchange Commission (the “SEC”). You may also access all of our public filings through the SEC’s website at https://www.sec.gov.
We webcast our earnings calls and certain events we participate in or host with members of the investment community on our investor relations website. Additionally, we provide notifications of news or announcements regarding our financial performance, including SEC filings, investor events and press and earnings releases, as part of our investor relations website. The contents of these websites are not intended to be incorporated by reference into this report or in any other report or document we file.
ITEM 1A. Risk Factors
Investing in our common stock involves a high degree of risk. Investors should carefully consider the following risks and all other information contained in this Annual Report on Form 10-K, including our consolidated financial statements and the related notes, before investing in our common stock. The risks and uncertainties described below are not the only ones we face. Additional risks and uncertainties that we are unaware of, or that we currently believe are not material, also may become important factors that affect us. If any of the following risks materialize, our business, financial condition and results of operations could be materially harmed. In that case, the trading price of our common stock could decline substantially, and investors may lose some or all of their investment. We have summarized risks immediately below and encourage investors to carefully read the entirety of this Risk Factors section.
Risks Related to Our Business and Financial Position
Our operating results are likely to vary significantly and be unpredictable.
Our operating results have historically varied from period to period, and we expect that they will continue to do so as a result of a number of factors, many of which are outside of our control or may be difficult to predict, including:
8
•economic conditions, including macroeconomic and regional economic challenges resulting, for example, from a recession or other economic downturn, increased inflation or possible stagflation in certain geographies, rising interest rates, the war in Ukraine, the Israel-Hamas war, tensions between China and Taiwan, or other factors;
•sales strategy, productivity and execution, and our ability to attract and retain new end-customers or sell additional products and services to our existing end-customers, including customer demand for platform solutions like ours versus point solutions;
•our ability to successfully anticipate market changes related to cloud-based solutions and to sell, support and meet service level agreements related to cloud-based solutions;
•component shortages, including chips and other components, and product inventory shortages, including those caused by factors outside of our control, such as epidemics and pandemics, supply chain disruptions, inflation and other cost increases, international trade disputes or tariffs, natural disasters, health emergencies, power outages, civil unrest, labor disruption, international conflicts, terrorism, wars, such as the war in Ukraine and the Israel-Hamas war, and critical infrastructure attacks;
•inventory management, including future inventory purchase order commitments;
•the level of demand for our products and services, which may render forecasts inaccurate, increase backlog or future inventory purchase order commitments and lead to price decreases;
•based on supply chain shortages, including component and other shortages, our backlog has fluctuated over past quarters and any decrease in growth or negative growth of in-quarter billings and revenue may not be reflected by our aggregate billings and revenue. As we have fulfilled, shipped and billed during a quarter to satisfy backlog, this has increased our aggregate billings and revenue during any particular quarter, and as the supply chain challenges normalize, the growth comparisons versus prior quarters where backlog contributed more to billings have become more challenging and may become increasingly challenging;
•supplier cost increases and any lack of market acceptance of our price increases designed to help offset any supplier cost increases;
•the effects of our reduction of operations in Russia;
•the timing of channel partner and end-customer orders and our reliance on a concentration of shipments at the end of each quarter;
•the impact to our business, the global economy, disruption of global supply chains and creation of significant volatility and disruption of the financial markets due to factors such as increased inflation or possible stagflation in certain geographies, increasing or decreasing interest rates, the war in Ukraine and the Israel-Hamas war and other factors;
•any actual or perceived vulnerabilities in our products or services, and any actual or perceived breach of our network or our customers’ networks;
•the timing of shipments, which may depend on factors such as inventory levels, logistics, manufacturing or shipping delays, our ability to ship products on schedule and our ability to accurately forecast inventory requirements and our suppliers’ ability to deliver components and finished goods;
•increased expenses, unforeseen liabilities or write-downs and any negative impact on results of operations from any acquisition or equity investment consummated, as well as accounting risks, integration risks related to product plans and products and risks of negative impact by such acquisitions and equity investments on our financial results;
•investors’ expectations of our performance relating to environmental, social and governance (“ESG”) and commitment to carbon neutrality;
•certain customer agreements which contain service-level agreements, under which we guarantee specified availability of our platform and solutions;
•data security requirements that may be inconsistently enforced in certain jurisdictions;
9
•impairments as a result of certain events or changes in circumstances;
•the mix of products sold and the mix of revenue between products and services, as well as the degree to which products and services are bundled and sold together for a package price;
•the purchasing practices and budgeting cycles of our channel partners and end-customers, including the effect of the end of product lifecycles or refresh cycles;
•any decreases in demand by channel partners or end-customers, including any such decreases caused by factors outside of our control such as natural disasters and health emergencies, including earthquakes, droughts, fires, power outages, typhoons, floods, pandemics or epidemics and manmade events such as civil unrest, labor disruption, international trade disputes, international conflicts, terrorism, wars, such as the war in Ukraine and the Israel-Hamas war, and critical infrastructure attacks;
•the effectiveness of our sales organization, generally or in a particular geographic region, including the time it takes to hire sales personnel, the timing of hiring and our ability to hire and retain effective sales personnel, as well as our efforts to align our sales capacity and market demand;
•sales productivity and sales execution risk related to effectively selling to all segments of the market, including enterprise and small- and medium-sized businesses, government organizations and service providers, and to selling our broad security product and services portfolio, including, among other execution risks, risks associated with the complexity and distraction in selling to all segments, increased competition and unpredictability of timing to close larger enterprise and large organization deals, and the risk that our sales representatives do not effectively sell products and services;
•execution risk associated with our efforts to capture the opportunities related to our identified growth drivers, such as risk associated with our ability to capitalize on the convergence of networking and security, vendor consolidation of various cyber security solutions, SD-WAN, infrastructure security, security operations, SASE and other cloud security solutions, endpoint protection, and IoT and OT security opportunities;
•the seasonal buying patterns of our end-customers;
•the timing and level of our investments in sales and marketing, and the impact of such investments on our operating expenses, operating margin and the productivity, capacity, tenure and effectiveness of execution of our sales and marketing teams;
•the timing of revenue recognition for our sales, including any impacts resulting from extension of payment terms to distributors and fluctuations in backlog levels, which could result in more variability and less predictability in our quarter-to-quarter revenue and operating results;
•the level of perceived threats to network security, which may fluctuate from period to period;
•changes in the requirements, market needs or buying practices and patterns of our distributors, resellers or end-customers;
•changes in the growth rates of the network security market in particular and other security and networking markets, such as SD-WAN, OT, switches, access points, security operations, SASE and other cloud solutions for which we and our competitors sell products and services;
•the timing and success of new product and service introductions or enhancements by us or our competitors, or any other change in the competitive landscape of our industry, including consolidation among our competitors, partners or end-customers;
•the deferral of orders from distributors, resellers or end-customers in anticipation of new products or product enhancements announced by us or our competitors, price decreases or changes in our registration policies, or the acceleration of orders in response to our announced or expected price list increases;
•increases or decreases in our billings, revenue and expenses caused by fluctuations in foreign currency exchange rates or a strengthening of the U.S. dollar, as a significant portion of our expenses is incurred and paid in currencies other than the U.S. dollar, and the impact such fluctuations may have on the actual prices that our partners and customers are willing to pay for our products and services;
10
•compliance with existing laws and regulations;
•our ability to obtain and maintain permits, clearances and certifications that are applicable to our ability to conduct business with the U.S. federal government, other foreign and local governments and other industries and sectors;
•litigation, litigation fees and costs, settlements, judgments and other equitable and legal relief granted related to litigation;
•the impact of cloud-based security solutions on our billings, revenue, operating margins and free cash flow;
•decisions by potential end-customers to purchase network security solutions from newer technology providers, from larger, more established security vendors or from their primary network equipment vendors;
•price competition and increased competitiveness in our market, including the competitive pressure caused by product refresh cycles;
•our ability to both increase revenue and manage and control operating expenses in order to maintain or improve our operating margins;
•changes in customer renewal rates or attach rates for our services;
•changes in the timing of our billings, collection for our contracts or the contractual term of service sold;
•changes in our estimated annual effective tax rates and the tax treatment of research and development expenses and the related impact of cash from operations;
•changes in circumstances and challenges in business conditions, including decreased demand, which may negatively impact our channel partners’ ability to sell the current inventory they hold and negatively impact their future purchases of products from us;
•increased demand for cloud-based services and the uncertainty associated with transitioning to providing such services;
•potential shift or migration from physical appliances that deliver on-premises network security to cloud and SaaS-based security services;
•our channel partners having insufficient financial resources to withstand changes and challenges in business conditions;
•disruptions in our channel or termination of our relationship with important channel partners, including as a result of consolidation among distributors and resellers of security solutions;
•insolvency, credit or other difficulties confronting our key suppliers and channel partners, which could affect their ability to purchase or pay for products and services and which could disrupt our supply or distribution chain;
•policy changes and uncertainty with respect to immigration laws, trade policy and tariffs, including increased tariffs applicable to countries where we manufacture our products, foreign imports and tax laws related to international commerce;
•political, economic and social instability, including geo-political instability and uncertainty, such as that caused by the war in Ukraine, the Israel-Hamas war, tensions between China and Taiwan, and any disruption or negative impact on our ability to sell to, ship product to and support customers in certain regions based on trade restrictions, embargoes and export control law restrictions;
•general economic conditions, both in domestic and foreign markets;
•future accounting pronouncements or changes in our accounting policies as well as the significant costs that may be incurred to adopt and comply with these new pronouncements;
11
•possible impairments or acceleration of depreciation of our existing real estate due to our current real estate investments and future acquisition and development plans; and
•legislative or regulatory changes, such as with respect to privacy, information and cybersecurity, exports, the environment, regional component bans, and requirements for local manufacture.
Any one of the factors above or the cumulative effect of some of the factors referred to above may result in significant fluctuations in our quarterly financial and other operating results. This variability and unpredictability could result in failing to meet our internal operating plan or the expectations of securities analysts or investors for any period. If we fail to meet or exceed such expectations for these or any other reasons, the market price of our shares could fall substantially and we could face costly lawsuits, including securities class action suits. In addition, a significant percentage of our operating expenses are fixed in nature over the near term. Accordingly, in the event of revenue shortfalls, we are generally unable to mitigate the negative impact on margins in the short term.
Adverse economic conditions, such as a possible recession and possible impacts of inflation or stagflation, increasing or decreasing interest rates, reduced information technology spending, including firewall and other security spending, or any economic downturn or recession, may adversely impact our business.
Our business depends on the overall demand for information technology and on the economic health of our current and prospective customers. In addition, the purchase of our products is often discretionary and may involve a significant commitment of capital and other resources. Weak global and regional economic conditions and spending environments, based on a downturn in the economy, a possible recession and the effects of ongoing or increased inflation or possible stagflation in certain geographies, increasing or decreasing interest rates, geopolitical instability and uncertainty, a reduction in information technology spending regardless of macroeconomic conditions, the effects of epidemics and pandemics and the impact of the war in Ukraine and the Israel-Hamas war each could have a material adverse impacts on our financial condition and results of operations and our business, including resulting in longer sales cycles, lower prices for our products and services, increased component costs, higher default rates among our channel partners, reduced unit sales, lower prices and slower or declining growth. These can negatively impact our business by putting downward pressure on growth if we are unable to achieve the increases in product prices necessary to appropriately offset the additional costs in a manner sufficient to maintain margins. Any of these impacts may materially and adversely affect our business, financial condition, results of operations and liquidity.
The existence of inflation in certain economies has resulted in, and may continue to result in, increasing or decreasing interest rates and capital costs, increased component or shipping costs, increased costs of labor, weakening exchange rates and other similar effects. Although we take measures to mitigate risks such as those associated with inflation, the mitigating measures may not be effective or their impact may not offset the increased cost of inflation in a timely manner. Inflation, an economic downturn, a recession and any other economic challenges may also adversely impact spending patterns by our distributors, resellers and end-customers.
Our billings, revenue and free cash flow growth may slow or may not continue, and our operating margins may decline.
We may experience slowing growth or a decrease in billings, revenue, operating margin and free cash flow for a number of reasons, including a slowdown in demand for our products or services, a shift in demand from products to services, decrease in services revenue growth, increased competition, execution challenges including sales execution challenges and lack of optimal sales productivity, worldwide or regional economic challenges based on inflation or possible stagflation, a regional recession or a recession in the global economy, rising interest rates, the war in Ukraine and the Israel-Hamas war, a decrease in the growth of our overall market or softness in demand in certain geographies or industry verticals, such as the service provider industry, changes in our strategic opportunities, execution risks, lower sales productivity and our failure for any reason to continue to capitalize on sales and growth opportunities due to other risks identified in the risk factors described in this periodic report. Our expenses as a percentage of total revenue may be higher than expected if our revenue is lower than expected. If our investments in sales and marketing and other functional areas do not result in expected billings and revenue growth, we may experience margin declines. In addition, we may not be able to sustain our historical profitability levels in future periods if we fail to increase billings, revenue or deferred revenue, and do not appropriately manage our cost structure, free cash flow, or encounter unanticipated liabilities. As a result, any failure by us to maintain profitability and margins and continue our billings, revenue and free cash flow growth could cause the price of our common stock to materially decline.
Our real estate investments, including construction or acquisition of new data centers, data center expansions or office buildings, could involve significant risks to our business.
In order to sustain our growth in certain of our existing and new markets, we may expand existing data centers, lease new facilities or acquire suitable land, with or without structures, to build new data centers or office buildings. These projects
12
expose us to risks which could have an adverse effect on our results of operations and financial condition. The current global supply chain and inflation issues have exacerbated many of these construction risks and created additional risks for our business. Some of the risks associated with construction projects include:
•construction delays;
•lack of availability and delays for data center equipment, including items such as generators and switchgear;
•unexpected budget changes;
•increased prices for and delays in obtaining building supplies, raw materials and data center equipment;
•labor availability, labor disputes and work stoppages with contractors, subcontractors and other third parties;
•unanticipated environmental issues and geological problems;
•delays related to permitting and approvals to open from public agencies and utility companies;
•unexpected lack of power access;
•failure or inability for any reason to meet customer requirements;
•investor expectations regarding ESG;
•delays in site readiness leading to our failure to meet commitments made to customers; and
•unanticipated customer requirements that would necessitate alternative data center design, making our sites less desirable or leading to increased costs in order to make necessary modifications or retrofits.
All construction-related projects require us to carefully select and rely on the experience of one or more designers, general contractors and associated subcontractors during the design and construction process. Should a designer, general contractor, significant subcontractor or key supplier experience financial problems or other problems during the design or construction process, we could experience significant delays, increased costs to complete the project and/or other negative impacts to our expected returns.
We have broad insurance programs covering our properties and operating activities with limits of liability, deductibles and self-insured retentions that we believe are comparable to similarly situated companies. We believe the policy specifications and insured limits of these policies are adequate and appropriate. There are, however, certain types of extraordinary losses which may not be adequately covered under our insurance program. In addition, we could sustain losses due to insurance deductibles, self-insured retention, uninsured claims or casualties or losses in excess of applicable coverage. If an uninsured loss or a loss in excess of insured limits occurs, we could lose all or a portion of the capital we have invested in a property, as well as the anticipated future revenue from the property. In such an event, we might nevertheless remain obligated for any mortgage debt or other financial obligations related to the property. Material losses in excess of insurance proceeds may occur in the future. Such events could materially and adversely affect our financial condition and results of operations.
Additionally, under various federal, state and local environmental laws, ordinances and regulations, a current or previous owner or operator of real property may be liable for the costs of removal or remediation of hazardous or toxic substances on, under or in that property. Those laws often impose liability even if the owner or operator did not cause or know of the presence of hazardous or toxic substances and even if the storage of those substances was in violation of a customer’s lease. In addition, the presence of hazardous or toxic substances, or the failure of the owner to address their presence on the property, may adversely affect the owner’s ability to borrow using that real property as collateral. Any environmental issues related to our real estate activities could materially and adversely affect our financial condition and results of operations.
We are dependent on the continued services and performance of our senior management, the loss of any of whom could adversely affect our business, operating results and financial condition.
Our future performance depends on the continued services and continuing contributions of our senior management to execute on our business plan and to identify and pursue new opportunities and product innovations. The loss of services of members of senior management, particularly Ken Xie, our Co-Founder, Chief Executive Officer and Chairman, or Michael Xie, our Co-Founder, President and Chief Technology Officer, or of any of our senior sales leaders or functional area leaders, could significantly delay or prevent the achievement of our development and strategic objectives. The loss of the services or the
13
distraction of our senior management for any reason could adversely affect our business, financial condition and results of operations.
We rely on third-party channel partners for substantially all of our revenue. If our partners fail to perform, our ability to sell our products and services will be limited, and if we fail to optimize our channel partner model going forward, our operating results may be harmed. Additionally, a small number of distributors represents a large percentage of our revenue and accounts receivable, and one distributor accounted for 33% of our total net accounts receivable as of December 31, 2023.
A significant portion of our sales is generated through a limited number of distributors, and substantially all of our revenue is from sales by our channel partners, including distributors and resellers. We depend on our channel partners to generate a significant portion of our sales opportunities and to manage our sales process. To the extent our channel partners are unsuccessful in selling our products, or if we are unable to enter into arrangements with and retain a sufficient number of high-quality channel partners in each of the regions in which we sell products, we are unable to keep them motivated to sell our products, or our channel partners shift focus to other vendors and/or our competitors, our ability to sell our products and operating results may be harmed. The termination of our relationship with any significant channel partner may adversely impact our sales and operating results. If we change our partner strategy, such as if we start engaging in more sales directly with customers, and if we terminate partners or partners terminate or reduce selling on our behalf based on changes in our strategy or for any other reason, this could harm our results.
In addition, a small number of channel partners represents a large percentage of our revenue and gross accounts receivable. We are exposed to the credit and liquidity risk of some of our channel partners and to credit exposure in weakened markets, which could result in material losses. Our dependence on a limited number of key channel partners means that our billings, revenue and operating results may be harmed by the inability of these key channel partners to successfully sell our products and services, or if any of these key channel partners is unable or unwilling to pay us, terminates its relationship with us or goes out of business. Although we have programs in place that are designed to monitor and mitigate credit and liquidity risks, we cannot guarantee these programs will be effective in reducing our credit risks. If we are unable to adequately control these risks, our business, operating results, and financial condition could be harmed. If channel partners fail to pay us under the terms of our agreements or we are otherwise unable to collect on our accounts receivable from these channel partners, we may be adversely affected both from the inability to collect amounts due and the cost of enforcing the terms of our contracts, including litigation. Our channel partners may seek bankruptcy protection or other similar relief and fail to pay amounts due to us, or pay those amounts more slowly, either of which could adversely affect our operating results, financial position, and cash flow. We may be further impacted by consolidation of our existing channel partners. In such instances, we may experience changes to our overall business and operational relationships due to dealing with a larger combined entity, and our ability to maintain such relationships on favorable contractual terms may be more limited. We may also become increasingly dependent on a more limited number of channel partners, as consolidation increases the relative proportion of our business for which each channel partner is responsible, which may magnify the risks described in the preceding paragraphs.
Six distributor customers accounted for 70% and 69% of our total net accounts receivable in the aggregate as of December 31, 2023 and 2022, respectively. See Note 16. Segment Information in Part II, Item 8 of this Annual Report on Form 10-K for distributor customers that accounted for 10% or more of our revenue or net accounts receivable. Our largest distributors may experience financial difficulties, face liquidity risk or other financial challenges, which may harm our ability to collect on our accounts receivable.
We provide channel partners with specific programs to assist them with selling our products and incentivize them to sell our products, but there can be no assurance that these programs will be effective. In addition, our channel partners may be unsuccessful in marketing, selling and supporting our products and services and may purchase more inventory than they can sell. Our channel partners generally do not have minimum purchase requirements. Some of our channel partners may have insufficient financial resources to withstand changes and challenges in business conditions. Moreover, many of our channel partners are privately held, including some of our largest partners, and we may not have sufficient information to assess their financial condition. If our channel partners’ financial condition or operations weaken, their ability to sell our products and services could be negatively impacted. Our channel partners may also market, sell and support products and services that are competitive with ours, and may devote more resources to the marketing, sales and support of such products, or may decide to cease selling our products and services altogether in favor of a competitor’s products and services. They may also have incentives to promote our competitors’ products to the detriment of our own, or they may cease selling our products altogether. We cannot ensure that we will retain these channel partners or that we will be able to secure additional or replacement partners or that existing channel partners will continue to perform. The loss of one or more of our significant channel partners or the failure to obtain and ship a number of large orders each quarter through them could harm our operating results.
Any new sales channel partner will require extensive training and may take several months or more to achieve productivity. Our channel partner sales structure could subject us to lawsuits, potential liability and reputational harm if, for
14
example, any of our channel partners misrepresent the functionality of our products or services to end-customers, our service provider customers suffer a cyber event impacting end-users, or our channel partners violate laws or our corporate policies. We depend on our global channel partners to comply with applicable legal and regulatory requirements. To the extent that they fail to do so, that could have a material adverse effect on our business, operating results and financial condition. If we fail to optimize our channel partner model or fail to manage existing sales channels, our business will be seriously harmed.
Reliance on a concentration of shipments at the end of the quarter could cause our billings and revenue to fall below expected levels.
As a result of customer buying patterns and the efforts of our sales force and channel partners to meet or exceed quarterly quotas, we have historically received a substantial portion of each quarter’s sales orders and generated a substantial portion of each quarter’s billings and revenue during the last two weeks of the quarter. We typically arrange for a logistics partner to pick up the last shipment of our products a few hours prior to the end of the quarter, and a delay in the arrival of the logistics partner or other factors such as a power outage could prevent us from shipping and billing for a material amount of products for which we have orders. Further, it is possible that the dollar value of these products intended to be shipped late on the last day of the quarter may be material. Additionally, our service billings are dependent on the completion of certain automated processes by our internal business management systems, some of which cannot be performed until after the related products have been shipped. If we do not have enough time after shipping our products for our systems to perform these processes prior to the end of the quarter, we have system issues that prevent processing in time to realize service billings in a quarter, or there are delays in deals closing or deals are lost, we will not be able to bill and realize billings for those services until possibly the following quarter at the earliest, which may materially negatively impact our billings for a particular quarter. We implemented a cloud-based quoting tool to help provide our sales team with the ability to have faster quote generation, reduce quote errors and increase sales productivity. Our ability to integrate the data from this tool into our order processing may cause order processing delays that could have an effect on our financial results. Our billings and revenue for any quarter could fall below our expectations or those of securities analysts and investors, resulting in a decline in our stock price, if expected orders at the end of any quarter are delayed or deals are lost for any reason or our ability to fulfill orders at the end of any quarter is hindered for any reason, including, among others:
•the failure of anticipated purchase orders to materialize;
•our logistics partners’ failure or inability to ship products prior to quarter-end to fulfill purchase orders received near the end of the quarter;
•disruption in manufacturing or shipping based on power outages, system failures, labor disputes or constraints, excessive demand, natural disasters or widespread public health problems including pandemics and epidemics;
•our failure to accurately forecast our inventory requirements and to appropriately manage inventory to meet demand;
•our inability to release new products on schedule;
•any failure of our systems related to order review and processing; and
•any delays in shipments due to trade compliance requirements, labor disputes or logistics changes at shipping ports, airline strikes, severe weather or otherwise.
We rely significantly on revenue from FortiGuard and other security subscription and FortiCare technical support services, and revenue from these services may decline or fluctuate. Because we recognize revenue from these services over the term of the relevant service period, downturns or upturns in sales of FortiGuard and other security subscription and FortiCare technical support services are not immediately reflected in full in our operating results.
Our FortiGuard and other security subscription and FortiCare technical support services revenue has historically accounted for a significant percentage of our total revenue. Revenue from the sale of new, or from the renewal of existing, FortiGuard and other security subscription and FortiCare technical support service contracts may decline and fluctuate as a result of a number of factors, including fluctuations in purchases of secure networking, unified SASE and security operations, changes in the sales mix between products and services, end-customers’ level of satisfaction with our products and services, the prices of our products and services, the prices of products and services offered by our competitors, reductions in our customers’ spending levels and the timing of revenue recognition with respect to these arrangements. If our sales of new, or renewals of existing, FortiGuard and other security subscription and FortiCare technical support service contracts decline, our revenue and revenue growth may decline and our business could suffer. In addition, in the event significant customers require payment
15
terms for FortiGuard and other security subscription and FortiCare technical support services in arrears or for shorter periods of time than annually, such as monthly or quarterly, this may negatively impact our billings and revenue. Furthermore, we recognize FortiGuard and other security subscription and FortiCare technical support services revenue ratably over the term of the service period, which is typically from one to five years. As a result, much of the FortiGuard and other security subscription and FortiCare technical support services revenue we report each quarter is the recognition of deferred revenue from FortiGuard and other security subscription and FortiCare technical support services contracts entered into during previous quarters or years. Consequently, a decline in new or renewed FortiGuard and other security subscription and FortiCare technical support services contracts in any one quarter will not be fully reflected in revenue in that quarter but will negatively affect our revenue in future quarters. Accordingly, the effect of significant downturns in sales of new, or renewals of existing, FortiGuard and other security subscriptions and FortiCare technical support services is not reflected in full in our statements of income until future periods. Our FortiGuard and other security subscription and FortiCare technical support services revenue also makes it difficult for us to rapidly increase our revenue through additional service sales in any period, as revenue from new and renewal support services contracts must be recognized over the applicable service term.
If we are unable to hire, retain and motivate qualified personnel, our business will suffer.
Our future success depends, in part, on our ability to continue to attract and retain highly skilled personnel. The loss of the services of any of our key personnel, the inability to attract or retain qualified personnel, any failure to have in place and execute an effective succession plan for key executives or delays in hiring required personnel, particularly in engineering, sales and marketing, may seriously harm our business, financial condition and results of operations. From time to time, we experience turnover in our management-level personnel. For example, in December 2023, our Chief Revenue Officer announced his upcoming retirement after 19 years at Fortinet. None of our key employees has an employment agreement for a specific term, and any of our employees may terminate their employment at any time. Our ability to continue to attract and retain highly skilled personnel will be critical to our future success.
Competition for highly skilled personnel is frequently intense, especially for qualified sales, support and engineering employees in network security and especially in the locations where we have a substantial presence and need for highly skilled personnel, such as the San Francisco Bay Area and the Vancouver, Canada area. We may not be successful in attracting, assimilating or retaining qualified personnel to fulfill our current or future needs. In addition, to the extent we hire personnel from competitors, we may be subject to allegations that they have been improperly solicited or divulged proprietary or other confidential information. Changes in immigration laws, including changes to the rules regarding H1-B visas, may also harm our ability to attract personnel from other countries. Our inability to hire properly qualified and effective sales, support and engineering employees could harm our growth and our ability to effectively support growth.
We have incurred indebtedness and may incur other debt in the future, which may adversely affect our financial condition and future financial results.
As of December 31, 2023, we had an aggregate of $992.3 million of indebtedness outstanding under our Senior Notes. Under the agreements governing our indebtedness, we are permitted to incur additional debt. This debt, and any debt that we may incur in the future, may adversely affect our financial condition and future financial results by, among other things:
•increasing our vulnerability to downturns in our business, to competitive pressures and to adverse economic and industry conditions;
•requiring the dedication of a portion of our expected cash from operations to service our indebtedness, thereby reducing the amount of expected cash flow available for other purposes, including capital expenditures, share repurchases and acquisitions; and
•limiting our flexibility in planning for, or reacting to, changes in our businesses and our industries;
If we are unable to generate sufficient cash flow from operations in the future to service our debt, we may be required, among other things, to seek additional financing in the debt or equity markets, refinance or restructure all or a portion of our indebtedness, sell selected assets or reduce or delay planned capital, operating or investment expenditures. Such measures may not be sufficient to enable us to service our debt.
Additionally, the agreements governing our indebtedness impose restrictions on us and require us to comply with certain covenants. If we breach any of these covenants and do not obtain a waiver from the noteholders, then, subject to applicable cure periods, any or all of our outstanding indebtedness may be declared immediately due and payable. There can be no assurance that any refinancing or additional financing would be available on terms that are favorable or acceptable to us, if at all.
16
Under the terms of our outstanding Senior Notes, we may be required to repurchase the notes for cash prior to their maturity in connection with the occurrence of certain changes of control that are accompanied by certain downgrades in the credit ratings of the notes. The repayment obligations under the notes may have the effect of discouraging, delaying or preventing a takeover of our company. If we were required to pay the notes prior to their scheduled maturity, it could have a negative impact on our cash position and liquidity and impair our ability to invest financial resources in other strategic initiatives.
In addition, changes by any rating agency to our credit rating may negatively impact the value and liquidity of both our debt and equity securities, as well as affect our ability to obtain additional financing in the future and may negatively impact the terms of any such financing.
Risks Related to Our Sales and End-Customers
We generate a majority of revenue from sales to distributors, resellers and end-customers outside of the United States, and we are therefore subject to a number of risks associated with international sales and operations.
We market and sell our products throughout the world and have established sales offices in many parts of the world. Our international sales have represented a majority of our total revenue in recent periods. Therefore, we are subject to risks associated with having worldwide operations. We are also subject to a number of risks typically associated with international sales and operations, including:
•disruption in the supply chain or in manufacturing or shipping, or decreases in demand by channel partners or end-customers, including any such disruption or decreases caused by factors outside of our control such as natural disasters and health emergencies, including earthquakes, droughts, fires, power outages, typhoons, floods, pandemics or epidemics and manmade events such as civil unrest, labor disruption, international trade disputes, international conflicts, terrorism, wars or other foreign conflicts, such as the war in Ukraine and the Israel-Hamas war or tensions between China and Taiwan, and critical infrastructure attacks;
•fluctuations in foreign currency exchange rates or a strengthening of the U.S. dollar, as a significant portion of our expenses is incurred and paid in currencies other than the U.S. dollar, and the impact such fluctuations may have on the actual prices that our partners and customers are willing to pay for our products and services;
•economic or political instability in foreign markets, such as any economic or political instability caused by economic downturns and wars or other foreign conflicts, such as the war in Ukraine and the Israel-Hamas war, tensions between China and Taiwan and any expansions thereof;
•instability in the global banking system;
•greater difficulty in enforcing contracts and accounts receivable collection, including longer collection periods;
•longer sales processes for larger deals;
•changes in regulatory requirements;
•difficulties and costs of staffing and managing foreign operations;
•the uncertainty of protection for Intellectual Property (“IP”) rights in some countries;
•costs of compliance with foreign policies, laws and regulations and the risks and costs of non-compliance with such policies, laws and regulations;
•protectionist policies and penalties, and local laws, requirements, policies and perceptions that may adversely impact a U.S.-headquartered business’s sales in certain countries outside of the United States;
•costs of complying with, and the risks, reputational damage and other costs of non-compliance with, U.S. or other foreign laws and regulations for foreign operations, including the U.S. Foreign Corrupt Practices Act, the United Kingdom Bribery Act 2010, the General Data Protection Regulation (the “GDPR”), import and
17
export control laws, trade laws and regulations, tariffs and retaliatory measures, trade barriers and economic sanctions;
•other regulatory or contractual limitations on our ability to sell our products in certain foreign markets, and the risks and costs of non-compliance;
•heightened risks of unfair or corrupt business practices in certain geographies and of improper or fraudulent sales or sales-related arrangements, such as sales “side agreements” to allow return rights, that could disrupt the sales team through terminations of employment or otherwise, and may adversely impact financial results as compared to those already reported or forecasted and result in restatements of financial statements and irregularities in financial statements;
•our ability to effectively implement and maintain adequate internal controls to properly manage our international sales and operations;
•political unrest, changes and uncertainty associated with terrorism, hostilities, war or natural disasters;
•management communication and integration problems resulting from cultural differences and geographic dispersion; and
•changes in tax, tariff, employment and other laws.
Product and service sales and employee and contractor matters may be subject to foreign governmental regulations, which vary substantially from country to country. Further, we may be unable to keep up to date with changes in government requirements as they change over time. Failure to comply with these regulations could result in adverse effects to our business. In many foreign countries, it is common for others to engage in business practices that are prohibited by our internal policies and procedures or U.S. regulations applicable to us. Although we implemented policies and procedures designed to ensure compliance with these laws and policies, there can be no assurance that all of our employees, contractors, channel partners and agents will comply with these laws and policies. Violations of laws or key control policies by our employees, contractors, channel partners or agents could result in litigation, regulatory action, costs of investigation, delays in revenue recognition, delays in financial reporting, financial reporting misstatements, fines, penalties or the prohibition of the importation or exportation of our products and services, any of which could have a material adverse effect on our business and results of operations.
We may undertake corporate operating restructurings or transfers of assets that involve our group of foreign country subsidiaries through which we do business abroad, in order to maximize the operational and tax efficiency of our group structure. If ineffectual, such restructurings or transfers could increase our income tax liabilities, and in turn, increase our global effective tax rate. Moreover, our existing corporate structure and intercompany arrangements have been implemented in a manner we believe reasonably ensures that we are in compliance with current prevailing tax laws. However, the tax authorities of the jurisdictions in which we operate may challenge our methodologies for valuing developed technology or intercompany arrangements, which could impact our worldwide effective tax rate and harm our financial position and operating results.
If we are not successful in continuing to execute our strategy to increase our sales to large and medium-sized end-customers, our results of operations may suffer.
An important part of our growth strategy is to increase sales of our products to large- and medium-sized businesses, service providers and government organizations. While we have increased sales in recent periods to large- and medium-sized businesses, our sales volume varies by quarter and there is a risk as to our level of success selling to these target customers. Such sales involve unique sales skillsets, processes and structures, are often more complex and feature a longer contract term and may be at higher discount levels. We also have experienced uneven traction selling to certain government organizations and service providers and MSSPs, and there can be no assurance that we will be successful selling to these customers. Sales to these organizations involve risks that may not be present, or that are present to a lesser extent, with sales to smaller entities. These risks include:
•increased competition from competitors that traditionally target large and medium-sized businesses, service providers and government organizations and that may already have purchase commitments from those end-customers;
•increased purchasing power and leverage held by large end-customers in negotiating contractual arrangements;
18
•unanticipated changes in the capital resources or purchasing behavior of large end-customers, including changes in the volume and frequency of their purchases and changes in the mix of products and services, willingness to change to cloud delivery model and related payment terms;
•more stringent support requirements in our support service contracts, including stricter support response times, more complex requirements and increased penalties for any failure to meet support requirements;
•longer sales cycles and the associated risk that deals are delayed and that substantial time and resources may be spent on a potential end-customer that elects not to purchase our products and services;
•increased requirements from these customers that we have certain third-party security or other certifications, which we may not have, the lack of which may adversely affect our ability to successfully sell to such customers;
•uncertainty as to timing to close large deals and any delays in closing those deals; and
•longer ramp-up periods for enterprise sales personnel as compared to other sales personnel.
Large and medium-sized businesses, service providers and MSSPs and government organizations often undertake a significant evaluation process that results in a lengthy sales cycle, in some cases longer than 12 months. Although we have a channel sales model, our sales representatives typically engage in direct interaction with end-customers, along with our distributors and resellers, in connection with sales to large- and medium-sized end-customers. We may spend substantial time, effort and money in our sales efforts without being successful in producing any sales. In addition, purchases by large- and medium-sized businesses, service providers and government organizations are frequently subject to budget constraints, multiple approvals and unplanned administrative, processing and other delays; in light of current economic conditions and regulations in place by various government authorities, some of these sales cycles are being further extended. Furthermore, service providers and MSSPs represent our largest industry vertical and consolidation or continued changes in buying behavior by larger customers within this industry could negatively impact our business. Large- and medium-sized businesses, service providers and MSSPs and government organizations typically have longer implementation cycles, require greater product functionality and scalability, expect a broader range of services, including design, implementation and post go-live services, demand that vendors take on a larger share of risks, require acceptance provisions that can lead to a delay in revenue recognition and expect greater payment flexibility from vendors. In addition, large- and medium-sized businesses, service providers and government organizations may require that our products and services be sold differently from how we offer our products and services, which could negatively impact our operating results. Our large business and service provider customers may also become more deliberate in their purchases as they plan their next-generation network security architecture, leading them to take more time in making purchasing decisions or to purchase based only on their immediate needs. All these factors can add further risk to business conducted with these customers. In addition, if sales expected from a large- and medium-sized end-customer for a particular quarter are not realized in that quarter or at all, our business, operating results and financial condition could be materially and adversely affected.
If we do not increase the effectiveness of our sales organization, we may have difficulty adding new end-customers or increasing sales to our existing end-customers and our business may be adversely affected.
Although we have a channel sales model, sales in our industry are complex and members of our sales organization often engage in direct interaction with our prospective end-customers, particularly for larger deals involving larger end-customers. Therefore, we continue to be substantially dependent on our sales organization to obtain new end-customers and sell additional products and services to our existing end-customers. There is significant competition for sales personnel with the skills and technical knowledge that we require, including experienced enterprise sales employees and others. Our ability to grow our revenue depends, in large part, on our success in recruiting, training and retaining sufficient numbers of sales personnel to support our growth and on the effectiveness of our sales strategy, sales execution, and sales personnel selling successfully in different contexts, each of which has its own different complexities, approaches and competitive landscapes, such as managing and growing the channel business for sales to small businesses and more actively selling to the end-customer for sales to larger organizations. New hires require substantial training and may take significant time before they achieve full productivity. Our recent hires and planned hires may not become productive as quickly as we expect, and we may be unable to hire or retain sufficient numbers of qualified individuals in the markets where we do business or plan to do business. Furthermore, hiring sales personnel in new countries requires additional setup and upfront costs that we may not recover if the sales personnel fail to achieve full productivity. If our sales employees do not become fully productive on the timelines that we have projected, our revenue may not increase at anticipated levels and our ability to achieve long-term projections may be negatively impacted. If we are unable to hire and train sufficient numbers of effective sales personnel, the sales personnel are not successful in obtaining new end-customers or increasing sales to our existing customer base or sales personnel do not
19
effectively sell our unified SASE and security operations technology solutions, our business, operating results and prospects may be adversely affected. If we do not hire properly qualified and effective sales employees and organize our sales team effectively to capture the opportunities in the various customer segments we are targeting, our growth and ability to effectively support growth may be harmed.
In addition, in light of macroeconomic trends and in the event of sales execution challenges for any reason, we may face excess sales capacity, low sales productivity generally, and a decline in productivity in our sales organization. If we are not able to align our sales capacity and market demand, or if the productivity of our sales organization decreases, our operating results and financial condition could be harmed.
Unless we continue to develop better market awareness of our company and our products, and to improve lead generation and sales enablement, our revenue may not continue to grow.
Increased market awareness of our capabilities and products and increased lead generation are essential to our continued growth and our success in all of our markets, particularly the market for sales to large businesses, service providers and government organizations. While we have increased our investments in sales and marketing, it is not clear that these investments will continue to result in increased revenue. If our investments in additional sales personnel or our marketing programs are not successful in continuing to create market awareness of our company and products or increasing lead generation, in growing billings for our broad product suite or if we experience turnover and disruption in our sales and marketing teams, we may not be able to achieve sustained growth, and our business, financial condition and results of operations may be adversely affected.
Some of our sales are to government organizations, which subjects us to a number of regulatory requirements, challenges and risks.
Sales to U.S. and foreign federal, state and local government organizations are subject to a number of risks. Because of public sector budgetary cycles and laws or regulations governing public procurements, such sales often require significant upfront time and expense without any assurance of winning a sale.
Government demand, sales and payment for our products and services may be negatively impacted by numerous factors and requirements unique to selling to government agencies, such as:
•policies, laws and regulations have in the past, and may in the future, require us to obtain and maintain certain security and other certifications in order to sell our products and services into certain government organizations, and such certifications may be costly and time-consuming to obtain and maintain;
•funding authorizations and requirements unique to government agencies, with funding or purchasing reductions or delays adversely affecting public sector demand for our products; and
•geopolitical matters, including tariff and trade disputes, government shutdowns, impact of the war in Ukraine and the Israel-Hamas war, tensions between China and Taiwan and trade protectionism and other political dynamics that may adversely affect our ability to sell in certain locations or obtain the requisite permits and clearances required for certain purchases by government organizations of our products and services.
In addition, if we do not have certain certifications, this may restrict our ability to sell to certain government customers until we have obtained certain certifications and we may not obtain the certifications in a timely manner or at all. For example, certain of our competitors may have decided to become certified under the U.S. Federal Risk and Authorization Management Program (“FedRAMP”), and until the time that we also certify under FedRAMP, we risk losing sales for government deals to certified competitors for deals where FedRAMP certification is a requirement.
The rules and regulations applicable to sales to government organizations may also negatively impact sales to other organizations. For example, government organizations may have contractual or other legal rights to terminate contracts with our distributors and resellers for convenience or due to a default, and any such termination may adversely impact our future results of operations. If the distributor receives a significant portion of its revenue from sales to government organizations, the financial health of the distributor could be substantially harmed, which could negatively affect our future sales to such distributor. Governments routinely investigate, review and audit government vendors’ administrative and other processes, and any unfavorable investigation, audit, other review or unfavorable determination related to any government clearance or certification could result in the government’s refusing to continue buying our products and services, a limitation and reduction of government purchases of our products and services, a reduction of revenue or fines, or civil or criminal liability if the investigation, audit or other review uncovers improper, illegal or otherwise concerning activities. Any such penalties could adversely impact our results of operations in a material way. Further, any refusal to grant certain certifications or clearances by one government agency, or any decision by one government agency that our products do not meet certain standards, may
20
reduce business opportunities and cause reputational harm and cause concern with other government agencies, governments and businesses and cause them to not buy our products and services and/or lead to a decrease in demand for our products generally.
Finally, some governments, including the U.S. federal government, may require certain products to be manufactured in, and services to be provided from, certain identified countries which may be high-cost locations. We may not manufacture all products or provide all services in locations that meet such requirements and consequently our products and services may not be eligible for certain government purchases.
Risks Related to Our Industry, Customers, Products and Services
We face intense competition in our market and we may not maintain or improve our competitive position.
The market for network security products is intensely competitive and dynamic, and we expect competition to continue to intensify. We face many competitors across the different cybersecurity markets. Our competitors include companies such as Aruba, Check Point, Cisco, CrowdStrike, F5 Networks, Huawei, Juniper, Palo Alto Networks, SonicWALL, Sophos, VMware and Zscaler.
Some of our existing and potential competitors enjoy competitive advantages such as:
•greater name recognition and/or longer operating histories;
•larger sales and marketing budgets and resources;
•broader distribution and established relationships with distribution partners and end-customers;
•access to larger customer bases;
•greater customer support resources;
•greater resources to make acquisitions;
•stronger U.S. government relationships;
•lower labor and development costs; and
•substantially greater financial, technical and other resources.
In addition, certain of our larger competitors have broader product offerings, and leverage their relationships based on other products or incorporate functionality into existing products in a manner that discourages customers from purchasing our products. These larger competitors often have broader product lines and market focus, and are in a better position to withstand any significant reduction in capital spending by end-customers in these markets. Therefore, these competitors will not be as susceptible to downturns in a particular market. Also, many of our smaller competitors that specialize in providing protection from a single type of security threat are often able to deliver these specialized security products to the market more quickly than we can.
Conditions in our markets could change rapidly and significantly as a result of technological advancements or continuing market consolidation. Our competitors and potential competitors may also be able to develop products or services, and leverage new business models, that are equal or superior to ours, achieve greater market acceptance of their products and services, disrupt our markets, and increase sales by utilizing different distribution channels than we do. For example, certain of our competitors are focusing on delivering security services from the cloud which include cloud-based security providers, such as CrowdStrike and Zscaler. In addition, current or potential competitors may be acquired by third parties with greater available resources, and new competitors may arise pursuant to acquisitions of network security companies or divisions. As a result of such acquisitions, competition in our market may continue to increase and our current or potential competitors might be able to adapt more quickly to new technologies and customer needs, devote greater resources to the promotion or sale of their products and services, initiate or withstand substantial price competition, take advantage of acquisition or other opportunities more readily, or develop and expand their product and service offerings more quickly than we do. In addition, our competitors may bundle products and services competitive with ours with other products and services. Customers may accept these bundled products and services rather than separately purchasing our products and services. As our customers refresh the security products bought in prior years, they may seek to consolidate vendors, which may result in current customers choosing to purchase products from our competitors on an ongoing basis. Due to budget constraints or economic downturns, organizations may be more willing to incrementally add solutions to their existing network security infrastructure from competitors than to
21
replace it with our solutions. These competitive pressures in our market or our failure to compete effectively may result in price reductions, fewer customer orders, reduced revenue and gross margins and loss of market share.
Managing inventory of our products and product components is complex. We order components from third-party manufacturers based on our forecasts of future demand and targeted inventory levels, which exposes us to the risk of both product shortages, which may result in lost sales and higher expenses, and excess inventory, which may require us to sell our products at discounts and lead to write-offs.
Managing our inventory is complex, especially in times of supply chain disruption. Our channel partners may increase orders during periods of product shortages, cancel orders or not place orders commensurate with our expectations if their inventory is too high, return products or take advantage of price protection (if any is available to the particular partner) or delay orders in anticipation of new products, and accurately forecasting inventory requirements and demand can be challenging. Our channel partners also may adjust their orders in response to the supply of our products and the products of our competitors that are available to them and in response to seasonal fluctuations in end-customer demand. If we cannot manufacture and ship our products due to, for example, global chip shortages, excessive demand on contract manufacturers capacity, natural disasters and health emergencies such as earthquakes, fires, power outages, typhoons, floods, cyber events, pandemics and epidemics or manmade events such as civil unrest, labor disruption, international trade disputes, international conflicts, terrorism, wars or other foreign conflicts, such as the war in Ukraine and the Israel-Hamas war or tensions between China and Taiwan, and critical infrastructure attacks, our business and financial results could be materially and adversely impacted. The conflicts in the Middle East highlights potential risks associated with geopolitical instability in the region, including disruption to shipping routes, longer lead times for components and products, increased insurance costs for vessels passing through conflict zones, potential increased costs for shipping and products, and potential delays and interruptions in the supply chain. We may face challenges in sourcing materials, fulfilling orders, and managing logistics efficiently, which could ultimately affect our operations, financial performance and overall business continuity.
In response to component shortages in previous periods, we increased our purchase order commitments. Our suppliers may require us to accept or pay for components and finished goods regardless of our level of sales in a particular period, which may negatively impact our operating results and financial condition. For additional information and a further discussion of impacts and risks related to our purchase commitments with our suppliers, refer to Note 12. Commitments and Contingencies in Part II, Item 8 of this Annual Report on Form 10-K.
Inventory management remains an area of focus as we balance the need to maintain inventory levels that are sufficient to ensure competitive lead times against the risk of inventory obsolescence because of rapidly changing technology, product transitions, customer requirements or excess inventory levels. If we ultimately determine that we have excess inventory, we may have to reduce our prices and write-down inventory, which in turn could result in lower gross margins. Alternatively, insufficient inventory levels may lead to shortages that result in delayed billings and revenue or loss of sales opportunities altogether as potential end-customers turn to competitors’ products that are readily available. For example, we have in the past experienced inventory shortages and excesses due to the variance in demand for certain products from forecasted amounts. Our inventory management systems and related supply chain visibility tools may be inadequate to enable us to effectively manage inventory. If we are unable to effectively manage our inventory and that of our channel partners, our results of operations could be adversely affected.
If our new products, services and enhancements do not achieve sufficient market acceptance, our results of operations and competitive position will suffer.
We spend substantial amounts of time and money to develop internally and acquire new products and services and enhance versions of our existing products and services in order to incorporate additional features, improved functionality or other enhancements in order to meet our customers’ rapidly evolving demands for network security in our highly competitive industry. When we develop a new product or service, or an enhanced version of an existing product or service, we typically incur expenses and expend resources upfront to market, promote and sell the new offering. Therefore, when we develop and introduce new or enhanced products or services, they must achieve high levels of market acceptance in order to justify the amount of our investment in developing and bringing them to market.
Our new products, services or enhancements could fail to attain sufficient market acceptance for many reasons, including:
•delays in releasing our new products, services or enhancements to the market;
•failure to accurately predict market demand in terms of product and service functionality and to supply products and services that meet this demand in a timely fashion;
22
•failure to have the appropriate research and development expertise and focus to make our top strategic products and services successful;
•failure of our sales force and partners to focus on selling new products and services;
•inability to interoperate effectively with the networks or applications of our prospective end-customers;
•inability to protect against new types of attacks or techniques used by hackers;
•actual or perceived defects, vulnerabilities, errors or failures;
•negative publicity about their performance or effectiveness;
•introduction or anticipated introduction of competing products and services by our competitors;
•poor business conditions for our end-customers, causing them to delay IT purchases;
•changes to the regulatory requirements around security; and
•reluctance of customers to purchase products or services incorporating open source software.
If our new products, services or enhancements do not achieve adequate acceptance in the market, our competitive position will be impaired, our revenue will be diminished and the effect on our operating results may be particularly acute because of the significant research, development, marketing, sales and other expenses we incurred in connection with the new product, service or enhancement.
The network security market is rapidly evolving and the complex technology incorporated in our products makes them difficult to develop. If we do not accurately predict, prepare for and respond promptly to technological and market developments, changing end-customer needs, and expanding regulatory requirements and standards, our competitive position and prospects may be harmed.
The network security market is expected to continue to evolve rapidly. Moreover, many of our end-customers operate in markets characterized by rapidly changing technologies and business plans, which require them to add numerous network access points and adapt increasingly complex networks, incorporating a variety of hardware, software applications, operating systems and networking protocols. In addition, computer hackers and others who try to attack networks employ increasingly sophisticated techniques to gain access to and attack systems and networks. The technology in our products is especially complex because of the requirements to effectively identify and respond to new and increasingly sophisticated methods of attack, while minimizing the impact on network performance. Additionally, some of our new products and enhancements may require us to develop new hardware architectures and ASICs that involve complex, expensive and time-consuming research and development processes. For example, we enter into development agreements with third parties. If our development projects are not successfully completed, or are not completed in a timely fashion, our product development could be delayed and our business generally could suffer. Costs for development can be substantial and our profitability may be harmed if we are unable to recover these costs. Although the market expects rapid introduction of new products or product enhancements to respond to new threats, the development of these products is difficult and the timetable for commercial release and availability is uncertain and there can be long time periods between releases and availability of new products. We have in the past and may in the future experience unanticipated delays in the availability of new products and services and fail to meet previously announced timetables for such availability. If we do not quickly respond to the rapidly changing and rigorous needs of our end-customers by developing, releasing and making available on a timely basis new products and services or enhancements that can respond adequately to new security threats, our competitive position and business prospects may be harmed.
Moreover, business models based on a subscription cloud-based software service have become increasingly in demand by our end-customers and adopted by other providers, including our competitors. While we have introduced additional cloud-based solutions and will continue to do so, most of our platform is currently deployed on premise, and therefore, as customers demand that solutions be provided through a subscription cloud-based business model, we are making additional investments in our infrastructure and personnel to be able to more fully provide our platform through a subscription cloud-based model in order to maintain the competitiveness of our platform. Such investments involve expanding our data centers, servers and networks, and increasing our technical operations and engineering teams and this results in added cost and risks associated with managing new business models, such as obligations to deliver certain functionality and features and to meet certain service level agreements related to cloud-based solutions. There is also a risk that we are slower to offer these solutions than competitors. The risks are compounded by the uncertainty concerning the future success of any of our particular subscription
23
cloud-based business models and the future demand for our subscription cloud-based models by customers. Additionally, if we are unable to meet the demand to provide our services effectively through a subscription cloud-based model, we may lose customers to competitors.
Demand for our products may be limited by market perception that individual products from one vendor that provide multiple layers of security protection in one product are inferior to point products from multiple vendors.
Sales of many of our products depend on increased demand for incorporating broad security functionality into one appliance. If the market for these products fails to grow as we anticipate, our business will be seriously harmed. Target customers may view “all-in-one” network security solutions as inferior to security solutions from multiple vendors because of, among other things, their perception that such products of ours provide security functions from only a single vendor and do not allow users to choose “best-of-breed” defenses from among the wide range of dedicated security applications available. Target customers might also perceive that, by combining multiple security functions into a single platform, our solutions create a “single point of failure” in their networks, which means that an error, vulnerability or failure of our product may place the entire network at risk. In addition, the market perception that “all-in-one” solutions may be suitable only for small and medium-sized businesses because such solution lacks the performance capabilities and functionality of other solutions may harm our sales to large businesses, service provider and government organization end-customers. If the foregoing concerns and perceptions become prevalent, even if there is no factual basis for these concerns and perceptions, or if other issues arise with our market in general, demand for multi-security functionality products could be severely limited, which would limit our growth and harm our business, financial condition and results of operations. Further, a successful and publicized targeted attack against us, exposing a “single point of failure”, could significantly increase these concerns and perceptions and may harm our business and results of operations.
If functionality similar to that offered by our products is incorporated into existing network infrastructure products, organizations may decide against adding our appliances to their network, which would have an adverse effect on our business.
Large, well-established providers of networking equipment, such as Cisco, offer, and may continue to introduce, network security features that compete with our products, either in standalone security products or as additional features in their network infrastructure products. The inclusion of, or the announcement of an intent to include, functionality perceived to be similar to that offered by our security solutions in networking products that are already generally accepted as necessary components of network architecture may have an adverse effect on our ability to market and sell our products. Furthermore, even if the functionality offered by network infrastructure providers is more limited than our products, a significant number of customers may elect to accept such limited functionality in lieu of adding appliances from an additional vendor such as us. Many organizations have invested substantial personnel and financial resources to design and operate their networks and have established deep relationships with other providers of networking products, which may make them reluctant to add new components to their networks, particularly from other vendors such as us. In addition, an organization’s existing vendors or new vendors with a broad product offering may be able to offer concessions that we are not able to match because we currently offer only network security products and have fewer resources than many of our competitors. If organizations are reluctant to add additional network infrastructure from new vendors or otherwise decide to work with their existing vendors, our business, financial condition and results of operations will be adversely affected.
Because we depend on several third-party manufacturers to build our products, we are susceptible to manufacturing delays that could prevent us from shipping customer orders on time, if at all, and may result in the loss of sales and customers, and third-party manufacturing cost increases could result in lower gross margins and free cash flow.
We outsource the manufacturing of our security appliance products to contract manufacturing partners and original design manufacturing partners, including manufacturers with facilities located in Taiwan and other countries outside the United States such as ADLINK, IBASE, Micro-Star, Senao and Wistron. Our reliance on our third-party manufacturers reduces our control over the manufacturing process, exposing us to risks, including reduced control over quality assurance, costs, supply and timing and possible tariffs. Any manufacturing disruption related to our third-party manufacturers or their component suppliers for any reason, including global chip shortages, natural disasters and health emergencies such as earthquakes, fires, power outages, typhoons, floods, health pandemics and epidemics and manmade events such as civil unrest, labor disruption, cyber events, international trade disputes, international conflicts, terrorism, wars, such as the war in Ukraine and the Israel-Hamas war, and critical infrastructure attacks, could impair our ability to fulfill orders. If we are unable to manage our relationships with these third-party manufacturers effectively, or if these third-party manufacturers experience delays, increased manufacturing lead-times, disruptions, capacity constraints or quality control problems in their manufacturing operations, or fail to meet our future requirements for timely delivery, our ability to ship products to our customers could be impaired and our business would be seriously harmed. Further, certain components for our products come from Taiwan and approximately 95%
24
of our hardware is manufactured in Taiwan. Any increase in tensions between China and Taiwan, including threats of military actions or escalation of military activities, could adversely affect our manufacturing operations in Taiwan.
These manufacturers fulfill our supply requirements on the basis of individual purchase orders. We have no long-term contracts or arrangements with our third-party manufacturers that guarantee capacity, the continuation of particular payment terms or the extension of credit limits. Accordingly, they are not obligated to continue to fulfill our supply requirements, and the prices we are charged for manufacturing services could be increased on short notice. If we are required to change third-party manufacturers, our ability to meet our scheduled product deliveries to our customers would be adversely affected, which could cause the loss of sales and existing or potential customers, delayed revenue or an increase in our costs, which could adversely affect our gross margins. Our individual product lines are generally manufactured by only one manufacturing partner. Any production or shipping interruptions for any reason, such as a natural disaster, epidemics, pandemics, capacity shortages, quality problems or strike or other labor disruption at one of our manufacturing partners or locations or at shipping ports or locations, would severely affect sales of our product lines manufactured by that manufacturing partner. Furthermore, manufacturing cost increases for any reason could result in lower gross margins.
Our proprietary ASIC, which are key to the performance of our appliances, are built by contract manufacturers including Renesas and Toshiba America. These contract manufacturers use foundries operated by TSMC or Renesas on a purchase-order basis, and these foundries do not guarantee their capacity and could delay orders or increase their pricing. Accordingly, the foundries are not obligated to continue to fulfill our supply requirements, and due to the long lead time that a new foundry would require, we could suffer inventory shortages of our ASIC as well as increased costs. In addition to our proprietary ASIC, we also purchase off-the-shelf ASICs or integrated circuits from vendors for which we have experienced, and may continue to experience, long lead times. Our suppliers may also prioritize orders by other companies that order higher volumes or more profitable products. If any of these manufacturers materially delays its supply of ASICs or specific product models to us, or requires us to find an alternate supplier and we are not able to do so on a timely and reasonable basis, or if these foundries materially increase their prices for fabrication of our ASICs, our business would be harmed.
In addition, our reliance on third-party manufacturers and foundries limits our control over environmental regulatory requirements such as the hazardous substance content of our products and therefore our ability to ensure compliance with the Restriction of Hazardous Substances Directive (the “EU RoHS”) adopted in the European Union (the “EU”) and other similar laws. It also exposes us to the risk that certain minerals and metals, known as “conflict minerals”, that are contained in our products have originated in the Democratic Republic of the Congo or an adjoining country. As a result of the passage of the Dodd-Frank Wall Street Reform and Consumer Protection Act of 2010 (“Dodd-Frank”), the Securities and Exchange Commission (the “SEC”) adopted disclosure requirements for public companies whose products contain conflict minerals that are necessary to the functionality or production of such products. Under these rules, we are required to obtain sourcing data from suppliers, perform supply chain due diligence, and file annually with the SEC a specialized disclosure report on Form SD covering the prior calendar year. We have incurred and expect to incur additional costs to comply with the rules, including costs related to efforts to determine the origin, source and chain of custody of the conflict minerals used in our products and the adoption of conflict minerals-related governance policies, processes and controls. Moreover, the implementation of these compliance measures could adversely affect the sourcing, availability and pricing of materials used in the manufacture of our products to the extent that there may be only a limited number of suppliers that are able to meet our sourcing requirements, which would make it more difficult to obtain such materials in sufficient quantities or at competitive prices. We may also encounter customers who require that all of the components of our products be certified as conflict-free. If we are not able to meet customer requirements, such customers may choose to not purchase our products, which could impact our sales and the value of portions of our inventory.
Because some of the key components in our products come from limited sources of supply, we are susceptible to supply shortages, long or uncertain lead times for components, and supply changes, each of which could disrupt or delay our scheduled product deliveries to our customers, result in inventory shortage, cause loss of sales and customers or increase component costs resulting in lower gross margins and free cash flow.
We and our contract manufacturers currently purchase several key parts and components used in the manufacture of our products from limited sources of supply. We are therefore subject to the risk of shortages and long or uncertain lead times in the supply of these components and the risk that component suppliers may discontinue or modify components used in our products. We have in the past experienced shortages and long or uncertain lead times for certain components. Our limited source components for particular appliances and suppliers of those components include specific types of CPUs from Intel and AMD, network and wireless chips from Broadcom, Marvell, Qualcomm and Intel, and memory devices from Intel, Micron, ADATA, Toshiba, Samsung and Western Digital. We also may face shortages in the supply of the capacitors and resistors that are used in the manufacturing of our products, which may persist for an indefinite period of time. The introduction by component suppliers of new versions of their products, particularly if not anticipated by us or our contract manufacturers, could
25
require us to expend significant resources to incorporate these new components into our products. In addition, if these suppliers were to discontinue production of a necessary part or component, we would be required to expend significant resources and time in locating and integrating replacement parts or components from another vendor. Qualifying additional suppliers for limited source parts or components can be time-consuming and expensive.
Although we have increased our purchase order commitments to support long-term customer demand, if we are unable to obtain sufficient quantities of any of these components on commercially reasonable terms or in a timely manner, or if we are unable to obtain alternative sources for these components, shipments of our products could be delayed or halted entirely or we may be required to redesign our products. Any of these events could result in a cancellation of orders, lost sales, reduced gross margins or damage to our end customer relationships, which would adversely impact our business, financial condition, results of operations and prospects. Additionally, if actual demand does not directly match with our demand forecasts, due to our purchase order commitments, we could be required to accept or pay for components and finished goods. This may result in us discounting our products or excess or obsolete inventory, which we would be required to write down to its estimated realizable value, which in turn could result in lower gross margins. Our reliance on a limited number of suppliers involves several additional risks, including:
•a potential inability to obtain an adequate supply of required parts or components when required;
•financial or other difficulties faced by our suppliers;
•infringement or misappropriation of our IP;
•price increases;
•failure of a component to meet environmental or other regulatory requirements;
•failure to meet delivery obligations in a timely fashion;
•failure in component quality; and
•inability to ship products on a timely basis.
The occurrence of any of these events would be disruptive to us and could seriously harm our business. Any interruption or delay in the supply of any of these parts or components, or the inability to obtain these parts or components from alternate sources at acceptable prices and within a reasonable amount of time, would harm our ability to meet our scheduled product deliveries to our distributors, resellers and end-customers. This could harm our relationships with our channel partners and end-customers and could cause delays in shipment of our products and adversely affect our results of operations. In addition, increased component costs could result in lower gross margins.
We offer retroactive price protection to certain of our major distributors in North America, and if we fail to balance their inventory with end-customer demand for our products, our allowance for price protection may be inadequate, which could adversely affect our results of operations.
We provide certain of our major distributors in North America with price protection rights for inventories of our products held by them. If we reduce the list price of our products, as we have recently done, certain distributors in North America receive refunds or credits from us that reduce the price of such products held in their inventory based upon the new list price. Future credits for price protection will depend on the percentage of our price reductions for the products in inventory and our ability to manage the levels of certain of our major distributors’ inventories in North America. If future price protection adjustments are higher than expected, our future results of operations could be materially and adversely affected.
The sales prices of our products and services may decrease, which may reduce our gross profits and operating margin and may adversely impact our financial results and the trading price of our common stock.
The sales prices for our products and services may decline for a variety of reasons or our product mix may change, resulting in lower growth and margins based on a number of factors, including competitive pricing pressures, discounts or promotional programs we offer, a change in our mix of products and services and anticipation of the introduction of new products and services. We have recently conducted such price decreases. Competition continues to increase in the market segments in which we participate, and we expect competition to further increase in the future, thereby leading to increased pricing pressures. Larger competitors with more diverse product offerings may reduce the price of products and services that compete with ours in order to promote the sale of other products or services or may bundle them with other products or
26
services. Additionally, although we price our products and services worldwide in U.S. dollars, currency fluctuations in certain countries and regions have in the past, and may in the future, negatively impact actual prices that partners and customers are willing to pay in those countries and regions. Furthermore, we anticipate that the sales prices and gross profits for our products or services will decrease over product life cycles. We cannot ensure that we will be successful in developing and introducing new offerings with enhanced functionality on a timely basis, or that our product and service offerings, if introduced, will enable us to maintain our prices, gross profits and operating margin at levels that will allow us to maintain profitability.
Actual, possible or perceived defects, errors or vulnerabilities in our products or services, the failure of our products or services to detect or prevent a security incident, or the misuse of our products could harm our operational results and reputation.
Our products and services are complex, and they have contained and may contain defects, errors or vulnerabilities that are not detected until after their commercial release and deployment by our customers. Defects, errors or vulnerabilities may impede or block network traffic, cause our products or services to be vulnerable to electronic break-ins, cause them to fail to help secure our customers or cause our products or services to allow unauthorized access to our customers’ networks. Following a review in accordance with our publicly available Product Security Incident Response Team policy, our Product Security Incident Response Team publicly posts on our FortiGuard Labs website known product vulnerabilities, including critical vulnerabilities, and methods for customers to mitigate the risk of vulnerabilities. There can be no assurance, however, that such posts will be sufficiently timely, accurate or complete or that those customers will take steps to mitigate the risk of vulnerabilities, and certain customers may be negatively impacted. Additionally, any perception that our products have vulnerabilities, whether or not accurate, and any actual vulnerabilities may harm our operational results and reputation, more significantly as compared to certain other companies in other industries because we are a security company. Our products are also susceptible to errors, defects, logic flaws, vulnerabilities and inserted vulnerabilities that may arise in, or be included in our products in, different stages of our supply chain, manufacturing and shipment processes, and a threat actor’s exploitation of these weaknesses may be difficult to anticipate, prevent, and detect. If we are unable to maintain an effective supply chain security risk management and products security program, then the security and integrity of our products and the updates to those products that our customers receive could be exploited by third parties or insiders. Different customers deploy and use our products in different ways, and certain deployments and usages may subject our products to adverse conditions that may negatively impact the effectiveness and useful lifetime of our products. Our networks and products, including cloud-based technology, could be targeted by attacks specifically designed to disrupt our business and harm our operational results and reputation. We cannot ensure that our products will prevent all adverse security events. Because the techniques used by malicious adversaries to access or sabotage networks change frequently and generally are not recognized until launched against a target, we may be unable to anticipate these techniques. In addition, defects or errors in our FortiGuard and other security subscription or FortiCare updates or our Fortinet appliances and operating systems could result in a failure of our FortiGuard and other security subscription services to effectively or correctly update end-customers’ Fortinet appliances and cloud-based products and thereby leave customers vulnerable to attacks. Furthermore, our solutions may also fail to detect or prevent viruses, worms, ransomware attacks or similar threats due to a number of reasons such as the evolving nature of such threats and the continual emergence of new threats that we may fail to anticipate or add to our FortiGuard databases in time to protect our end-customers’ networks. Our data centers and networks and those of our hosting vendors and cloud service providers may also experience technical failures and downtime, and may fail to distribute appropriate updates, or fail to meet the increased requirements of our customer base. Any such technical failure, downtime or failures in general may temporarily or permanently expose our end-customers’ networks, leaving their networks unprotected against the latest security threats.
An actual, possible or perceived security incident or infection of the network of one of our end-customers, regardless of whether the incident is attributable to the failure of our products or services to prevent or detect the security incident, or any actual or perceived security risk in our supply chain, could adversely affect the market’s perception of our security products and services, cause customers and customer prospects not to buy from us and, in some instances, subject us to potential liability that is not contractually limited. We may not be able to correct any security flaws or vulnerabilities promptly, or at all. Our products may also be misused or misconfigured by end-customers or third parties who obtain access to our products. For example, our products could be used to censor private access to certain information on the internet. Such use of our products for censorship could result in negative press coverage and negatively affect our reputation, even if we take reasonable measures to prevent any improper shipment of our products or if our products are provided by an unauthorized third party. Any actual, possible or perceived defects, errors or vulnerabilities in our products, or misuse of our products, could result in:
•the expenditure of significant financial and product development resources in efforts to analyze, correct, eliminate or work around errors or defects or to address and eliminate vulnerabilities;
•the loss of existing or potential end-customers or channel partners;
•delayed or lost revenue;
27
•delay or failure to attain market acceptance;
•negative publicity and harm to our reputation; and
•disclosure requirements, litigation, regulatory inquiries or investigations that may be costly and harm our reputation and, in some instances, subject us to potential liability that is not contractually limited.
Our uniform resource locator (“URL”) database for our web filtering service may fail to keep pace with the rapid growth of URLs and may not categorize websites in accordance with our end-customers’ expectations.
The success of our web filtering service depends on the breadth and accuracy of our URL database. Although our URL database currently catalogs millions of unique URLs, it contains only a portion of the URLs for all of the websites that are available on the internet. In addition, the total number of URLs and software applications is growing rapidly, and we expect this rapid growth to continue in the future. Accordingly, we must identify and categorize content for our security risk categories at an extremely rapid rate. Our database and technologies may not be able to keep pace with the growth in the number of websites, especially the growing amount of content utilizing foreign languages and the increasing sophistication of malicious code and the delivery mechanisms associated with spyware, phishing and other hazards associated with the internet. Further, the ongoing evolution of the internet and computing environments will require us to continually improve the functionality, features and reliability of our web filtering function. Any failure of our databases to keep pace with the rapid growth and technological change of the internet could impair the market acceptance of our products, which in turn could harm our business, financial condition and results of operations.
In addition, our web filtering service may not be successful in accurately categorizing internet and application content to meet our end-customers’ expectations. We rely upon a combination of automated filtering technology and human review to categorize websites and software applications in our proprietary databases. Our end-customers may not agree with our determinations that particular URLs should be included or not included in specific categories of our databases. In addition, it is possible that our filtering processes may place material that is objectionable or that presents a security risk in categories that are generally unrestricted by our customers’ internet and computer access policies, which could result in such material not being blocked from the network. Conversely, we may miscategorize websites such that access is denied to websites containing information that is important or valuable to our customers. Any miscategorization could result in customer dissatisfaction and harm our reputation. Any failure to effectively categorize and filter websites according to our end-customers’ and channel partners’ expectations could impair the growth of our business.
False detection of vulnerabilities, viruses or security incidents or false identification of spam or spyware could adversely affect our business.
Our FortiGuard and other security subscription services may falsely detect, report and act on viruses or other threats that do not actually exist. This risk is heightened by the inclusion of a “heuristics” feature in our products, which attempts to identify viruses and other threats not based on any known signatures but based on characteristics or anomalies that may indicate that a particular item is a threat. When our end-customers enable the heuristics feature in our products, the risk of falsely identifying viruses and other threats significantly increases. These false positives, while typical in the industry, may impair the perceived reliability of our products and may therefore adversely impact market acceptance of our products. Also, our FortiGuard and other security subscription services may falsely identify emails or programs as unwanted spam or potentially unwanted programs, or alternatively fail to properly identify unwanted emails or programs, particularly as spam emails or spyware are often designed to circumvent anti-spam or spyware products. Parties whose emails or programs are blocked by our products may seek redress against us for labeling them as spammers or spyware, or for interfering with their business. In addition, false identification of emails or programs as unwanted spam or potentially unwanted programs may reduce the adoption of our products. If our system restricts important files or applications based on falsely identifying them as malware or some other item that should be restricted, this could adversely affect end-customers’ systems and cause material system failures. In addition, our threat researchers periodically identify vulnerabilities in various third-party products, and, if these identifications are perceived to be incorrect or are in fact incorrect, this could harm our business. Any such false identification or perceived false identification of important files, applications or vulnerabilities could result in negative publicity, loss of end-customers and sales, increased costs to remedy any problem and costly litigation.
28
Our ability to sell our products is dependent on our quality control processes and the quality of our technical support services, and our failure to offer high-quality technical support services could have a material adverse effect on our sales and results of operations.
Once our products are deployed within our end-customers’ networks, our end-customers depend on our technical support services, as well as the support of our channel partners and other third parties, to resolve any issues relating to our products. If we, our channel partners or other third parties do not effectively assist our customers in planning, deploying and operational proficiency for our products, succeed in helping our customers quickly resolve post-deployment issues and provide effective ongoing support, our ability to sell additional products and services to existing customers could be adversely affected and our reputation with potential customers could be damaged. Many large end-customers, and service provider or government organization end-customers, require higher levels of support than smaller end-customers because of their more complex deployments and more demanding environments and business models. If we, our channel partners or other third parties fail to meet the requirements of our larger end-customers, it may be more difficult to execute on our strategy to increase our penetration with large businesses, service providers and government organizations. Our failure to maintain high-quality support services could have a material adverse effect on our business, financial condition and results of operations and may subject us to litigation, reputational damage, loss of customers and additional costs.
Our business is subject to the risks of warranty claims, product returns, product liability and product defects.
Our products are very complex and, despite testing prior to their release, have contained and may contain undetected defects or errors, especially when first introduced or when new versions are released. Product errors have affected the performance and effectiveness of our products and could delay the development or release of new products or new versions of products, adversely affect our reputation and our end-customers’ willingness to buy products from us, result in litigation and disputes with customers and adversely affect market acceptance or perception of our products. Any such errors or delays in releasing new products or new versions of products or allegations of unsatisfactory performance could cause us to lose revenue or market share, increase our service costs, cause us to incur substantial costs in redesigning the products, cause us to lose significant end-customers, subject us to litigation, litigation costs and liability for damages and divert our resources from other tasks, any one of which could materially and adversely affect our business, results of operations and financial condition. Our products must successfully interoperate with products from other vendors. As a result, when problems occur in a network, it may be difficult to identify the sources of these problems. The occurrence of hardware and software errors, whether or not caused by our products, could delay or reduce market acceptance of our products and have an adverse effect on our business and financial performance, and any necessary revisions may cause us to incur significant expenses. The occurrence of any such problems could harm our business, financial condition and results of operations.
Although we generally have limitation of liability provisions in our standard terms and conditions of sale, they may not fully or effectively protect us from claims if exceptions apply or if the provisions are deemed unenforceable, and in some circumstances, we may be required to indemnify a customer in full, without limitation, for certain liabilities, including liabilities that are not contractually limited. The sale and support of our products also entail the risk of product liability claims. We maintain insurance to protect against certain claims associated with the use of our products, but our insurance coverage may not adequately cover any claim asserted against us, if at all, and in some instances may subject us to potential liability that is not contractually limited. In addition, even claims that ultimately are unsuccessful could result in our expenditure of funds in litigation and divert management’s time and other resources.
If the availability of our cloud-based subscription services does not meet our service-level commitments to our customers, our current and future revenue may be negatively impacted.
We typically commit to our customers that our cloud-based subscription services will maintain a minimum service-level of availability. If we are unable to meet these commitments, this could negatively impact our business. We rely on public cloud providers, such as Amazon Web Services, Microsoft Azure and Google Cloud, co-location providers, such as Equinix, and our own data centers and points of presence (“PoPs”), and any availability interruption in any of these cloud solutions could result in us not meeting our service-level commitments to our customers. In some cases, we may not have a contractual right with our public cloud or co-location providers that compensates us for any losses due to availability interruptions in our cloud-based subscription services. Further, any failure to meet our service-level commitments could damage our reputation and adoption of our cloud-based subscription services, and we could face loss of revenue from reduced future subscriptions and reduced sales and face additional costs associated with any failure to meet service-level agreements. Any service-level failures could adversely affect our business, financial condition and results of operations.
29
Risks Related to our Systems and Technology
If our internal enterprise IT networks, on which we conduct internal business and interface externally, our operational networks, through which we connect to customers, vendors and partners systems and provide services, or our research and development networks, our back-end labs and cloud stacks hosted in our data centers, colocation vendors or public cloud providers, through which we research, develop and host products and services, are compromised, public perception of our products and services may be harmed, our customers may be breached and harmed, we may become subject to liability, and our business, operating results and stock price may be adversely impacted.
Our success depends on the market’s confidence in our ability to provide effective network security protection. Despite our efforts and processes to prevent breaches of our internal networks, systems and websites, we are still vulnerable to computer viruses, break-ins, phishing attacks, ransomware attacks, attempts to overload our servers with denial-of-service, vulnerabilities in vendor hardware and software that we leverage, advanced persistent threats from sophisticated actors and other cyber-attacks and similar disruptions from unauthorized access to our internal networks, systems or websites. Our security measures may also be breached due to employee error, malfeasance or otherwise, which breaches may be more difficult to detect than outsider threats, and the existing programs and trainings we have in place to prevent such insider threats may not be effective or sufficient. Third parties may also attempt to fraudulently induce our employees to transfer funds or disclose information in order to gain access to our networks and confidential information. Third parties may also send our customers or others malware or malicious emails that falsely indicate that we are the source, potentially causing lost confidence in us and reputational harm. We cannot guarantee that the measures we have taken to protect our networks, systems and websites will provide adequate security. Moreover, because we provide network security products, we may be a more attractive target for attacks by computer hackers and any security breaches and other security incidents involving us may result in more harm to our reputation and brand than companies that do not sell network security solutions. Hackers and malicious parties may be able to develop and deploy viruses, worms, ransomware and other malicious software programs that attack our products and customers, that impersonate our update servers in an effort to access customer networks and negatively impact customers, or otherwise exploit any security vulnerabilities of our products, or attempt to fraudulently induce our employees, customers or others to disclose passwords or other sensitive information or unwittingly provide access to our internal networks, systems or data. Moreover, the threat landscape continues to evolve as a result of new technologies, including artificial intelligence (“AI”), and malicious parties may use AI to help attack our solutions, systems, and our customers.
For example, from time to time, we have discovered that unauthorized parties have targeted us using sophisticated techniques, including by stealing technical data and attempting to steal private encryption keys, in an effort to both impersonate our products and threat intelligence update services and possibly attempt other attack methodologies. Using these techniques, these unauthorized parties have tried, and may in the future try, to gain access to certain of our and our customers’ systems. We have also, for example, discovered that unauthorized parties have targeted vulnerabilities in our product software and infrastructure in an effort to gain entry into our customers’ networks. In addition, in general threat actors use dark web forums to sell organizations’ stolen credentials. If threat actors sell valid credentials used by our customers to access our services, it is possible that unauthorized third parties may use such stolen credentials to try to gain access to our services. These and other hacking efforts against us and our customers may be ongoing and may happen in the future.
Although we take numerous measures and implement multiple layers of security to protect our networks, we cannot guarantee that our security products, processes and services will secure against all threats. Further, we cannot be sure that third parties have not been, or will not in the future be, successful in improperly accessing our systems and our customers’ systems, which could negatively impact us and our customers. An actual breach could significantly harm us and our customers, and an actual or perceived breach, or any other actual or perceived data security incident, threat or vulnerability, that involves our supply chains, networks, systems or websites and/or our customers’ supply chains, networks, systems or websites could adversely affect the market perception of our products and services and investor confidence in our company. Any breach of our networks, systems or websites could impair our ability to operate our business, including our ability to provide FortiGuard and other security subscription and FortiCare technical support services to our end-customers, lead to interruptions or system slowdowns, cause loss of critical data or lead to the unauthorized disclosure or use of confidential, proprietary or sensitive information. We could also be subject to liability and litigation and reputational harm and our channel partners and end-customers may be harmed, lose confidence in us and decrease or cease using our products and services. Any breach of our internal networks, systems or websites could have an adverse effect on our business, operating results and stock price.
In addition, there has been a general increase in phishing attempts and spam emails as well as social engineering attempts from hackers, and many of our employees continue to work remotely which may pose additional data security risks in the event remote work environments are not as secure as office environments. Any security incident could negatively impact our reputation and results of operations.
30
If we do not appropriately manage any future growth, including through the expansion of our real estate facilities, or are unable to improve our systems, processes and controls, our operating results will be negatively affected.
We rely heavily on information technology to help manage critical functions such as order configuration, pricing and quoting, revenue recognition, financial forecasts, inventory and supply chain management and trade compliance reviews. In addition, we have been slow to adopt and implement certain automated functions, which could have a negative impact on our business. For example, our order processing relies on both manual data entry of customer purchase orders received through email and electronic data interchange (EDI). Due to the use of manual processes and the fact that we may receive a large amount of our orders in the last few weeks of any given quarter, an interruption in our email service or other systems could result in delayed order fulfillment and decreased billings and revenue for that quarter.
To manage any future growth effectively, we must continue to improve and expand our information technology and financial, operating, security and administrative systems and controls, and our business continuity and disaster recovery plans and processes. We must also continue to manage headcount, capital and processes in an efficient manner. We may not be able to successfully implement requisite improvements to these systems, controls and processes, such as system capacity, access, security and change management controls, in a timely or efficient manner. Our failure to improve our systems and processes, or their failure to operate in the intended manner, whether as a result of the significant growth of our business or otherwise, may result in our inability to manage the growth of our business and to accurately forecast our revenue, expenses and earnings, or to prevent certain losses. Moreover, the failure of our systems and processes could undermine our ability to provide accurate, timely and reliable reports on our financial and operating results and could impact the effectiveness of our internal control over financial reporting.
In addition, our systems, processes and controls may not prevent or detect all errors, omissions, malfeasance or fraud, such as corruption and improper “side agreements” that may impact revenue recognition or result in financial liability. Our productivity and the quality of our products and services may also be adversely affected if we do not integrate and train our new employees quickly and effectively. Any future growth would add complexity to our organization and require effective coordination throughout our organization. Failure to ensure appropriate systems, processes and controls and to manage any future growth effectively could result in increased costs and harm our reputation and results of operations.
We have expanded our office real estate holdings to meet our projected growing need for office space. These plans will require significant capital expenditure over the next several years and involve certain risks, including impairment charges and acceleration of depreciation, changes in future business strategy that may decrease the need for expansion (such as a decrease in headcount or increase in work from home) and risks related to construction. Future changes in growth or fluctuations in cash flow may also negatively impact our ability to pay for these projects or free cash flow. Additionally, inaccuracies in our projected capital expenditures could negatively impact our business, operating results and financial condition.
We may experience difficulties maintaining and expanding our internal business management systems.
The maintenance of our internal business management systems, such as our Enterprise Resource Planning (“ERP”) and Customer Relationship Management (“CRM”) systems, has required, and will continue to require, the investment of significant financial and human resources. In addition, we may choose to upgrade or expand the functionality of our internal systems, leading to additional costs. Deficiencies in our design or maintenance of our internal systems may adversely affect our ability to sell products and services, forecast orders, process orders, ship products, provide services and customer support, send invoices and track payments, fulfill contractual obligations, accurately maintain books and records, provide accurate, timely and reliable reports on our financial and operating results or otherwise operate our business. Additionally, if any of our internal systems does not operate as intended, the effectiveness of our internal control over financial reporting could be adversely affected or our ability to assess it adequately could be delayed. Further, we may expand the scope of our ERP and CRM systems. Our operating results may be adversely affected if these upgrades or expansions are delayed or if the systems do not function as intended or are not sufficient to meet our operating requirements.
We may not be successful in our artificial intelligence initiatives, which could adversely affect our business, reputation, or financial results.
AI presents new risks and challenges that may affect our business. We have made, and expect to continue to make investments to integrate AI and machine learning technology into our solutions. AI presents risks, challenges, and potentially unintended consequences that could impact our ability to effectively use of AI successfully in our business. Given the nature of AI technology, we face an evolving regulatory landscape and significant competition from other companies. Our AI efforts may not be successful and our competitors may incorporate AI into their products more quickly or more successfully than us, which
31
could impair our ability to compete effectively and adversely affect our financial results. Data practices by us or others that result in controversy could also impair the acceptance of AI solutions. This in turn could undermine confidence in the decisions, predictions, analysis, and effectiveness of our AI-related initiatives. The rapid evolution of AI, including potential government regulation of AI, may require significant additional resources related to AI in our solutions. Our AI-related initiatives may result in new or enhanced governmental or regulatory scrutiny, including regarding the use of AI in our solutions and the marketing of products using AI, litigation, customer reporting or documentation requirements, ethical or social concerns, or other complications. For example, AI technologies, including generative AI, may create content that appears correct but is factually inaccurate or flawed, or contains copyrighted or other protected material, and if our customers or others use this flawed content to their detriment, we may be exposed to brand or reputational harm, competitive harm, or legal liability. Any of the foregoing could adversely affect our business, reputation, or financial results.
Risks Related to our Intellectual Property
Our proprietary rights may be difficult to enforce and we may be subject to claims by others that we infringe their propriety technology.
We rely primarily on patent, trademark, copyright and trade secrets laws and confidentiality procedures and contractual provisions to protect our technology. Valid patents may not issue from our pending applications, and the claims eventually allowed on any patents may not be sufficiently broad to protect our technology or products. Any issued patents may be challenged, invalidated or circumvented, and any rights granted under these patents may not actually provide adequate defensive protection or competitive advantages to us. Patent applications in the United States are typically not published until at least 18 months after filing, or, in some cases, not at all, and publications of discoveries in industry-related literature lag behind actual discoveries. We cannot be certain that we were the first to make the inventions claimed in our pending patent applications or that we were the first to file for patent protection. Additionally, the process of obtaining patent protection is expensive and time-consuming, and we may not be able to prosecute all necessary or desirable patent applications at a reasonable cost or in a timely manner. In addition, recent changes to the patent laws in the United States may bring into question the validity of certain software patents and may make it more difficult and costly to prosecute patent applications. As a result, we may not be able to obtain adequate patent protection or effectively enforce our issued patents.
Despite our efforts to protect our proprietary rights, unauthorized parties may attempt to copy aspects of our products or obtain and use information that we regard as proprietary. We generally enter into confidentiality or license agreements with our employees, consultants, vendors and customers, and generally limit access to and distribution of our proprietary information. However, we cannot guarantee that the steps taken by us will prevent misappropriation of our technology. Policing unauthorized use of our technology or products is difficult. In addition, the laws of some foreign countries do not protect our proprietary rights to as great an extent as the laws of the United States, and many foreign countries do not enforce these laws as diligently as government agencies and private parties in the United States. From time to time, legal action by us may be necessary to enforce our patents and other IP rights, to protect our trade secrets, to determine the validity and scope of the proprietary rights of others or to defend against claims of infringement or invalidity. Such litigation could result in substantial costs and diversion of resources and could negatively affect our business, operating results and financial condition. If we are unable to protect our proprietary rights (including aspects of our software and products protected other than by patent rights), we may find ourselves at a competitive disadvantage to others who need not incur the additional expense, time and effort required to create the innovative products that have enabled us to be successful to date.
Our products contain third-party open-source software components, and failure to comply with the terms of the underlying open-source software licenses could restrict our ability to sell our products.
Our products contain software modules licensed to us by third-party authors under “open source” licenses, including but not limited to, the GNU Public License, the GNU Lesser Public License, the BSD License, the Apache License, the MIT X License and the Mozilla Public License. From time to time, there have been claims against companies that distribute or use open-source software in their products and services, asserting that open-source software infringes the claimants’ IP rights. We could be subject to suits by parties claiming infringement of IP rights in what we believe to be licensed open-source software. Use and distribution of open-source software may entail greater risks than use of third-party commercial software, as, for example, open-source licensors generally do not provide warranties or other contractual protections regarding infringement claims or the quality of the code. Some open-source licenses contain requirements that we make available source code for modifications or derivative works we create based upon the type of open-source software we use. If we combine our proprietary software with open-source software in a certain manner, we could, under certain open-source licenses, be required to release the source code of our proprietary software to the public. This would allow our competitors to create similar products with lower development effort and time and ultimately could result in a loss of product sales for us.
32
Although we monitor our use of open source software to avoid subjecting our products to conditions we do not intend, the terms of many open source licenses have not been interpreted by U.S. courts, and there is a risk that these licenses could be construed in a way that, for example, could impose unanticipated conditions or restrictions on our ability to commercialize our products. In this event, we could be required to seek licenses from third parties to continue offering our products, to make our proprietary code generally available in source code form, to re-engineer our products or to discontinue the sale of our products if re-engineering could not be accomplished on a timely basis, any of which requirements could adversely affect our business, operating results and financial condition.
Claims by others that we infringe their proprietary technology or other litigation matters could harm our business.
Patent and other IP disputes are common in the network security industry. Third parties are currently asserting, have asserted and may in the future assert claims of infringement of IP rights against us. Third parties have also asserted such claims against our end-customers or channel partners whom we may indemnify against claims that our products infringe the IP rights of third parties. As the number of products and competitors in our market increases and overlaps occur, infringement claims may increase. Any claim of infringement by a third party, even those without merit, could cause us to incur substantial costs defending against the claim and could distract our management from our business. In addition, litigation may involve patent holding companies, non-practicing entities or other adverse patent owners who have no relevant product revenue and against whom our own patents may therefore provide little or no deterrence or protection.
Although third parties may offer a license to their technology, the terms of any offered license may not be acceptable, and the failure to obtain a license or the costs associated with any license could cause our business, financial condition and results of operations to be materially and adversely affected. In addition, some licenses may be non-exclusive and, therefore, our competitors may have access to the same technology licensed to us.
Alternatively, we may be required to develop non-infringing technology, which could require significant time, effort and expense, and may ultimately not be successful. Furthermore, a successful claimant could secure a judgment or we may agree to a settlement that prevents us from distributing certain products or performing certain services or that requires us to pay substantial damages (including treble damages if we are found to have willfully infringed such claimant’s patents or copyrights), royalties or other fees. Any of these events could seriously harm our business, financial condition and results of operations.
From time to time, we are subject to lawsuits claiming patent infringement. We are also subject to other litigation in addition to patent infringement claims, such as employment-related litigation and disputes, as well as general commercial litigation, such as the Alorica litigation, and could become subject to other forms of litigation and disputes, including stockholder litigation. If we are unsuccessful in defending any such claims, our operating results and financial condition and results may be materially and adversely affected. For example, we may be required to pay substantial damages and could be prevented from selling certain of our products. Litigation, with or without merit, could negatively impact our business, reputation and sales in a material fashion.
We have several ongoing patent lawsuits, certain companies have sent us demand letters proposing that we license certain of their patents, and organizations have sent letters demanding that we provide indemnification for patent claims. Given this and the proliferation of lawsuits in our industry and other similar industries by both non-practicing entities and operating entities, and recent non-practicing entity and operating entity patent litigation against other companies in the security space, we expect that we will be sued for patent infringement in the future, regardless of the merits of any such lawsuits. The cost to defend such lawsuits and any settlement payment or adverse result in such lawsuits could have a material adverse effect on our results of operations and financial condition.
We rely on the availability of third-party licenses.
Many of our products include software or other IP licensed from third parties. It may be necessary in the future to renew licenses relating to various aspects of these products or to seek new licenses for existing or new products. Licensors may claim we owe them additional license fees for past and future use of their software and other IP or that we cannot utilize such software or IP in our products going forward. There can be no assurance that the necessary licenses would be available on acceptable terms, if at all. The inability to obtain certain licenses or other rights or to obtain such licenses or rights on favorable terms or for reasonable pricing, or the need to engage in litigation regarding these matters, could result in delays in product releases until equivalent technology can be identified, licensed or developed, if at all, and integrated into our products and may result in significant license fees and have a material adverse effect on our business, operating results, and financial condition. Moreover, the inclusion in our products of software or other IP licensed from third parties on a non-exclusive basis could limit our ability to differentiate our products from those of our competitors.
33
We also rely on technologies licensed from third parties in order to operate functions of our business. If any of these third parties allege that we have not properly paid for such licenses or that we have improperly used the technologies under such licenses, we may need to pay additional fees or obtain new licenses, and such licenses may not be available on terms acceptable to us or at all or may be costly. In any such case, or if we were required to redesign our internal operations to function with new technologies, our business, results of operations and financial condition could be harmed.
Other Risks Related to Our Business and Financial Position
Our inability to successfully acquire and integrate other businesses, products or technologies, or to successfully invest in and form successful strategic alliances with other businesses, could seriously harm our competitive position and could negatively affect our financial condition and results of operations.
In order to remain competitive, we may seek to acquire additional businesses, products, technologies or IP, such as patents, and to make equity investments in businesses coupled with strategic alliances. For any possible future acquisitions or investments, we may not be successful in negotiating the terms of the acquisition or investment or financing the acquisition or investment. For both our prior and future acquisitions, we may not be successful in effectively integrating the acquired business, product, technology, IP or sales force into our existing business and operations, and the acquisitions may negatively impact our financial results. We may have difficulty incorporating acquired technologies, IP or products with our existing product lines, integrating reporting systems and procedures, and maintaining uniform standards, controls, procedures and policies. For example, we may experience difficulties integrating an acquired company’s ERP or CRM systems, sales support and other processes and systems, with our current systems and processes. The results of certain businesses that we invest in, such as Linksys, are, or may in the future, be reflected in our operating results, and we depend on these companies to provide us financial information in a timely manner in order to meet our financial reporting requirements. We may experience difficulty in timely obtaining financial information from the companies in which we have invested in order to meet our financial reporting requirements. Our due diligence for acquisitions and investments may fail to identify all of the problems, liabilities or other shortcomings or challenges of an acquired business, product or technology, including issues with IP, product quality or product architecture, regulatory compliance practices, environmental and sustainability compliance practices, revenue recognition or other accounting practices or employee or customer issues. We also may not accurately forecast the financial impact of an acquisition or an investment and alliance. In addition, any acquisitions and significant investments we are able to complete may be dilutive to revenue growth and earnings and may not result in any synergies or other benefits we had expected to achieve, which could negatively impact our operating results and result in impairment charges that could be substantial. We may have to pay cash, incur debt or issue equity securities to pay for any acquisition, each of which could affect our financial condition or the value of our capital stock and could result in dilution to our stockholders. Acquisitions or investments during a quarter may result in increased operating expenses and adversely affect our cash flows or our results of operations for that period and future periods compared to the results that we have previously forecasted or achieved. Further, completing a potential acquisition or investment and alliance and integrating acquired businesses, products, technologies or IP are challenging to do successfully and could significantly divert management time and resources.
Linksys sells predominantly into the consumer Wi-Fi market, and its sales have declined since our investment. Because we are accounting for our Linksys investment using the equity method of accounting, we are required to assess the investment for other-than-temporary impairment (“OTTI”) when events or circumstances suggest that the carrying amount of the investment may be impaired. We have analyzed whether there should be an OTTI of the value of our investment in Linksys and during the three months ended December 31, 2022 we recorded an OTTI charge of $22.2 million. In evaluating OTTI, we considered factors such as Linksys’ financial results and operating history, our ability and intent to hold the investment until its fair value recovers, the implied revenue valuation multiples compared to guideline public companies, Linksys’ ability to achieve milestones and any notable operational and strategic changes. We intend to continue to analyze our investment in Linksys to determine whether any further impairment is appropriate. If any further decline in fair value is determined to be other-than-temporary, we will adjust the carrying value of the investment to its fair value and record the impairment expense in our consolidated statements of income. The cost basis of the investment is not adjusted for subsequent recoveries in fair value. We may experience additional volatility to our statements of operations due to the underlying operating results of Linksys or impairments of our Linksys investment. This volatility could be material to our results in any given quarter and may cause our stock price to decline.
Failure to comply with laws and regulations applicable to our business could subject us to fines and penalties and could also cause us to lose end-customers or negatively impact our ability to contract.
Our business is subject to regulation by various federal, state, regional, local and foreign governmental agencies, including agencies responsible for monitoring and enforcing employment and labor laws, workplace safety, product safety, product labeling, environmental laws, consumer protection laws, anti-bribery laws, data privacy laws, import and export controls, federal securities laws and tax laws and regulations. In certain jurisdictions, these regulatory requirements may be
34
more stringent than in the United States. Non-compliance with applicable regulations or requirements could subject us to investigations, sanctions, enforcement actions, disgorgement of profits, fines, damages and civil and criminal penalties or injunctions. If any governmental sanctions are imposed, or if we do not prevail in any possible civil or criminal litigation, our business, operating results and financial condition could be adversely affected. In addition, responding to any action will likely result in a significant diversion of management’s attention and resources and an increase in professional fees. Enforcement actions and sanctions could harm our business, operating results and financial condition.
For example, the GDPR imposes stringent data handling requirements on companies that operate in the EU or receive or process personal data about individuals in the EU in certain contexts. Non-compliance with the GDPR could result in data protection audits and significant penalties, heavy fines imposed on us and bans on other businesses’ use of our services. Compliance with, and the other burdens imposed by, the GDPR and local regulatory authorities may limit our ability to operate or expand our business in the EU and could adversely impact our operating results. In July 2020, the European Court of Justice issued a judgment declaring invalid the EU-U.S. Privacy Shield Framework (the “Privacy Shield”) as a mechanism for the transfer of GDPR-regulated personal data to recipients in the United States and calling into question the validity of certain popular alternative mechanisms for addressing GDPR restrictions on transfers to the United States and other areas where we operate. The Privacy Shield has now been replaced with the EU-U.S. Data Privacy Framework following certain changes to U.S. law intended to address the concerns underlying that court decision with respect to transfers of personal data to the United States. However, there remains a possibility that our business could be negatively impacted by restrictions on transfers of GDPR-regulated personal data (including transfers made by our customers) to other areas we operate. In addition, it is possible that the updates to U.S. law may ultimately be deemed insufficient in a court case similar to the one that invalidated Privacy Shield. The mere possibility of this outcome, and our reliance on global data transfers within our corporate family and between us and our service providers, may create challenges for us to compete with companies that may be able to offer services in which personal data never exits the EU, thereby avoiding risks of noncompliance with GDPR data transfer restrictions.
Additionally, we may be subject to other legal regimes throughout the world governing data handling, protection and privacy. For example, in June 2018, California passed the California Consumer Privacy Act (the “CCPA”), which provides new data privacy rights for consumers and new operational requirements for companies and became effective on January 1, 2020. The CCPA was expanded pursuant to the California Privacy Rights Act, which was passed in 2020 and became effective in 2023. Other states have since passed similar laws, adding to the complexity of compliance with overlapping and sometimes conflicting requirements. The costs of compliance with and the penalties for violations of the GDPR, the CCPA and other laws, along with other burdens imposed by these regulations, may limit the use and adoption of our products and services and could have an adverse impact on our business. For example, our sales cycles may lengthen and face an increased risk of failure as customers take more time to vet our services for compliance with these legal requirements and to negotiate data-related contract terms with us, causing delays or loss of revenue.
Selling our solutions to the U.S. government, whether directly or through channel partners, also subjects us to certain regulatory and contractual requirements, government permit and clearance requirements and other risks. Failure to comply with these requirements or to obtain and maintain government permits and clearances required to do certain business, by either us or our channel partners, could subject us to investigations, fines, suspension, limitations on business or debarment from doing business with the U.S. government or one of its divisions, as well as other penalties, damages and reputational harms, which could have an adverse effect on our business, operating results, financial condition and prospects. Any violations of regulatory and contractual requirements could result in us being suspended or debarred from future government contracting. Any of these outcomes could have an adverse effect on our revenue, operating results, financial condition and prospects.
The landscape of laws, regulations, and industry standards related to cybersecurity is evolving globally. We may be subject to increased compliance burdens by regulators and customers with respect to our products and services, as well as additional costs to oversee and monitor security risks. Many jurisdictions have enacted laws mandating companies to inform individuals, stockholders, regulatory authorities, and others of security incidents. For example, the SEC recently adopted cybersecurity risk management and disclosure rules, which require the disclosure of information pertaining to cybersecurity incidents and cybersecurity risk management, strategy, and governance. In addition, certain of our customer agreements may require us to promptly report security incidents involving their data on our systems or those of subcontractors processing such data on our behalf. This mandatory disclosure can be costly, harm our reputation, erode customer trust, reduce demand, and require significant resources to mitigate issues stemming from actual or perceived security incidents
These laws, regulations and other requirements impose added costs on our business, and failure to comply with these or other applicable regulations and requirements, including non-compliance in the past, could lead to claims for damages from our channel partners, penalties, termination of contracts, loss of exclusive rights in our IP and temporary suspension, permanent debarment from government contracting, or other limitations on doing business. Any such damages, penalties, disruptions or limitations in our ability to do business could have an adverse effect on our business and operating results.
35
We are subject to governmental export and import controls that could subject us to liability or restrictions on sales, and that could impair our ability to compete in international markets.
Because we incorporate encryption technology into our products, certain of our products are subject to U.S. export controls and may be exported outside the United States only with the required export license or through an export license exception, or may be prohibited altogether from export to certain countries. If we were to fail to comply with U.S. export laws, U.S. Customs regulations and import regulations, U.S. economic sanctions and other countries’ import and export laws, we could be subject to substantial civil and criminal penalties, including fines for the company and incarceration for responsible employees and managers, and the possible loss of export or import privileges. In addition, if our channel partners fail to obtain appropriate import, export or re-export licenses or permits (e.g., for stocking orders placed by our partners), we may also be adversely affected through reputational harm and penalties and we may not be able to provide support related to appliances shipped pursuant to such orders. Obtaining the necessary export license for a particular sale may be time-consuming and may result in the delay or loss of sales opportunities.
Furthermore, U.S. export control laws and economic sanctions prohibit the shipment of certain products to U.S. embargoed or sanctioned countries, governments and persons, such as the sanctions and trade restrictions that have been implemented against Russia and Belarus. Even though we take precautions to prevent our product from being shipped to U.S. sanctions targets, our products could be shipped to those targets by our channel partners, despite such precautions. Any such shipment could have negative consequences including government investigations and penalties and reputational harm. In addition, various countries regulate the import of certain encryption technology, including import permitting and licensing requirements, and have enacted laws that could limit our ability to distribute our products or could limit our customers’ ability to implement our products in those countries. Changes in our products or changes in export and import regulations may create delays in the introduction of our products in international markets, prevent our customers with international operations from deploying our products globally or, in some cases, prevent the export or import of our products to certain countries, governments or persons altogether. Any change in export or import regulations, economic sanctions or related legislation, shift in the enforcement or scope of existing regulations, or change in the countries, governments, persons or technologies targeted by such regulations, could result in decreased use of our products by, or in our decreased ability to export or sell our products to, existing or potential customers with international operations. Any decreased use of our products or limitation on our ability to export or sell our products would likely adversely affect our business, financial condition and results of operations.
Efforts to withdraw from or materially modify international trade agreements, to change tax provisions related to global manufacturing and sales or to impose new tariffs, economic sanctions or related legislation, any of which could adversely affect our financial condition and results of operations.
Our business benefits directly and indirectly from free trade agreements, and we also rely on various corporate tax provisions related to international commerce, as we develop, market and sell our products and services globally. Efforts to withdraw from or materially modify international trade agreements, or to change corporate tax policy related to international commerce, could adversely affect our financial condition and results of operations as could the continuing uncertainty regarding whether such actions will be taken.
Moreover, efforts to implement changes related to export or import regulations (including the imposition of new border taxes or tariffs on foreign imports), trade barriers, economic sanctions and other related policies could harm our results of operations. For example, in recent years, the United States has imposed additional import tariffs on certain goods from different countries and on most goods imported from China. As a result, China and other countries imposed retaliatory tariffs on goods exported from the United States and both the United States and foreign countries have threatened to alter or leave current trade agreements. While we do not currently expect these tariffs to have a significant effect on our raw material and product import costs, if the United States expands increased tariffs, or retaliatory trade measures are taken by other countries in response to the tariffs, the cost of our products could increase, our operations could be disrupted or we could be required to raise our prices, which may result in the loss of customers and harm to our reputation and operating performance.
Any modification in these areas, any shift in the enforcement or scope of existing regulations or any change in the countries, governments, persons or technologies targeted by such regulations, could result in decreased use of our products by, or in our decreased ability to export or sell our products to, existing or potential end-customers with international operations and could result in increased costs. Any decreased use of our products or limitation on our ability to export or sell our products would likely adversely affect our business, financial condition and results of operations.
36
If we fail to comply with environmental requirements, our business, financial condition, operating results and reputation could be adversely affected.
We are subject to various environmental laws and regulations, including laws governing the hazardous material content of our products, laws relating to our real property and future expansion plans and laws concerning the recycling of Electrical and Electronic Equipment (“EEE”). The laws and regulations to which we are subject include the EU RoHS Directive, EU Regulation 1907/2006 – Registration, Evaluation, Authorization and Restriction of Chemicals (the “REACH” Regulation) and the EU Waste Electrical and Electronic Equipment Directive (the “WEEE Directive”), as well as the implementing legislation of the EU member states. Similar laws and regulations have been passed or are pending in China, South Korea, Taiwan, Japan, Norway, Saudi Arabia and the UAE and may be enacted in other regions, including in the United States, and we are, or may in the future be, subject to these laws and regulations. These legal and regulatory regimes, including the laws, rules and regulations thereunder, evolve frequently and may be modified, interpreted and applied in an inconsistent manner from one jurisdiction to another, and may conflict with one another. Moreover, the timing and effect of these laws and regulations on our business may be uncertain. To the extent we have not complied with such laws, rules and regulations, we could be subject to significant fines, revocation of licenses, limitations on our products and services, reputational harm and other regulatory consequences, each of which may be significant and could adversely affect our business, operating results and financial condition. These laws and regulations may also impact our suppliers, which could have, among other things, an adverse impact on the costs of components in our products.
The EU RoHS Directive and the similar laws of other jurisdictions ban or restrict the presence of certain hazardous substances such as lead, mercury, cadmium, hexavalent chromium and certain fire-retardant plastic additives in electrical equipment, including our products. We have incurred costs to comply with these laws, including research and development costs and costs associated with assuring the supply of compliant components. We expect to continue to incur costs related to environmental laws and regulations in the future. With respect to the EU RoHS, we and our competitors rely on exemptions for lead and other substances in network infrastructure equipment. It is possible one or more of these use exemptions will be revoked in the future. Additionally, although some of the EU RoHS exemptions have been extended, it is possible that some of these exemptions may expire in the future without being extended. If this exemption is revoked or expires without extension, if there are other changes to these laws (or their interpretation) or if new similar laws are passed in other jurisdictions, we may be required to re-engineer our products to use components compatible with these regulations. This re-engineering and component substitution could result in additional costs to us and/or disrupt our operations or logistics.
As part of the Circular Economy Action Plan, the European Commission amended the EU Waste Framework Directive (“WFD”) to include a number of measures related to waste prevention and recycling, whereby we are responsible for submitting product data to a Substances of Concern In articles as such or in complex objects (Products) (“SCIP”) database containing information on Substances of Very High Concern (“SVHC”) in articles and in complex objects. The SCIP database is established under the WFD and managed by the European Chemicals Agency (“ECHA”). We have incurred costs in order to comply with this new requirement. Similar laws and regulations have been passed or are pending in the European Economic Area and the UK.
The EU’s WEEE Directive, which requires electronic goods producers to be responsible for the collection, recycling and treatment of such products. Although currently our EU international channel partners are responsible for the requirements of this directive as the importer of record in most of the European countries in which we sell our products, changes in interpretation of the regulations may cause us to incur costs or have additional regulatory requirements in the future to meet in order to comply with this directive, or with any similar laws adopted in other jurisdictions including the United States.
Our failure to comply with these and future environmental rules and regulations could result in decreased demand for our products and services resulting in reduced sales of our products, increased demand for competitive products and services that result in lower emissions than our products, increased costs, substantial product inventory write-offs, reputational damage, penalties and other sanctions, any of which could harm our business and financial condition. To date, our expenditures for environmental compliance have not had a material impact on our operating results or cash flows, and, although we cannot predict the future impact of such laws or regulations, they will likely result in additional costs. New laws may result in increased penalties associated with violations or require us to change the content of our products or how they are manufactured, which could have a material adverse effect on our business, operating results and financial condition.
Investors’ expectations of our performance relating to environmental, social and governance factors may impose additional costs and expose us to new risks.
There is an increasing focus from certain investors, employees, customers and other stakeholders concerning corporate responsibility, specifically related to ESG matters. Some investors may use these non-financial performance factors to guide their investment strategies and, in some cases, may choose not to invest in us if they believe our policies and actions relating to corporate responsibility are inadequate. The growing investor demand for measurement of non-financial performance is addressed by third-party providers of sustainability assessment and ratings on companies. The criteria by which our corporate
37
responsibility practices are assessed may change due to the constant evolution of the sustainability landscape, which could result in greater expectations of us and cause us to undertake costly initiatives to satisfy such new criteria. For example, in 2023, California passed three separate climate bills governing disclosure of greenhouse gas emissions data, climate-related financials risks and details around emissions-related claims and carbon offsets. If we elect not to or are unable to satisfy such new criteria, investors may conclude that our policies and/or actions with respect to corporate social responsibility are inadequate and we may be subject to fines from regulatory authorities. We may face reputational damage in the event that we do not meet the ESG standards set by various constituencies.
Furthermore, in the event that we communicate certain initiatives and goals regarding ESG matters, such as our commitment to target Net-Zero on Scope 1 and Scope 2 emissions resulting from our owned facilities worldwide by 2030 or our commitment to the Paris Agreement via the Science Based Targets Initiative, we could fail, or be perceived to fail, in our achievement of such initiatives or goals, or we could be criticized for the scope, target and timelines of such initiatives or goals. If we fail to satisfy the expectations of investors, customers, employees, and other stakeholders or our initiatives are not executed as planned, our reputation and business, operating results and financial condition could be adversely impacted. In addition, the SEC has also proposed a draft rule that requires climate disclosures in financial filings. To the extent the SEC proposal becomes effective for our company, we will be required to establish additional internal controls, engage additional consultants and incur additional costs related to evaluating, managing and reporting on our environmental impact and climate-related risks and opportunities. If we fail to implement sufficient oversight or accurately capture and disclose on environmental matters, our reputation, business, operating results and financial condition may be materially adversely affected.
Risks Related to Finance, Accounting and Tax Matters
If our estimates or judgments relating to our critical accounting policies are based on assumptions that change or prove to be incorrect, our operating results could fall below expectations of securities analysts and investors, resulting in a decline in our stock price.
The preparation of financial statements in conformity with generally accepted accounting principles requires management to make estimates and assumptions that affect the amounts reported in the consolidated financial statements and accompanying notes. We base our estimates on historical experience and on various other assumptions that we believe to be reasonable under the circumstances, as provided in “Management’s Discussion and Analysis of Financial Condition and Results of Operations—Critical Accounting Policies and Estimates” in this Annual Report on Form 10-K, the results of which form the basis for making judgments about the carrying values of assets and liabilities that are not readily apparent from other sources. Our operating results may be adversely affected if our assumptions change or if actual circumstances differ from those in our assumptions, which could cause our operating results to fall below the expectations of securities analysts and investors, resulting in a decline in our stock price. Significant assumptions and estimates used in preparing our consolidated financial statements include those related to revenue recognition, deferred contract costs and commission expense, accounting for business combinations, contingent liabilities and accounting for income taxes.
We are exposed to fluctuations in currency exchange rates, which could negatively affect our financial condition and results of operations.
A significant portion of our operating expenses are incurred outside the United States. These expenses are denominated in foreign currencies and are subject to fluctuations due to changes in foreign currency exchange rates, particularly changes in the Euro, Japanese yen, Canadian dollar and British pound. A weakening of the U.S. dollar compared to foreign currencies would negatively affect our expenses and operating results, which are expressed in U.S. dollars. Additionally, fluctuations in the exchange rate of the Canadian dollar may negatively impact our development plans in Burnaby, Canada. While we are not currently engaged in material hedging activities, we have been hedging currency exposures relating to certain balance sheet accounts through the use of forward exchange contracts. If we stop hedging against any of these risks or if our attempts to hedge against these currency exposures are not successful, our financial condition and results of operations could be adversely affected. Our sales contracts are primarily denominated in U.S. dollars and therefore, while substantially all of our revenue is not subject to foreign currency risk, it does not serve as a hedge to our foreign currency-denominated operating expenses. In addition, a strengthening of the U.S. dollar may increase the real cost of our products to our customers outside of the United States, which may also adversely affect our financial condition and results of operations.
38
We could be subject to changes in our tax rates, the adoption of new U.S. or international tax legislation, exposure to additional tax liabilities or impacts from the timing of tax payments.
We are subject to taxes in the United States and numerous foreign jurisdictions, where a number of our subsidiaries are organized. Our provision for income taxes is subject to volatility and could be adversely affected by several factors, many of which are outside of our control. These include:
•the mix of earnings in countries with differing statutory tax rates or withholding taxes;
•changes in the valuation of our deferred tax assets and liabilities;
•transfer pricing adjustments;
•increases to corporate tax rates;
•an increase in non-deductible expenses for tax purposes, including certain stock-based compensation expense;
•changes in availability of tax credits and/or tax deductions;
•the timing of tax payments;
•tax costs related to intercompany realignments;
•tax assessments resulting from income tax audits or any related tax interest or penalties that could significantly affect our provision for income taxes for the period in which the settlement takes place; and
•changes in accounting principles, court decisions, tax rulings, and interpretations of or changes to tax laws, and regulations by international, federal or local governmental authorities.
We have open tax years that could be subject to the examination by the Internal Revenue Service (the “IRS”) and other tax authorities. We currently have ongoing tax audits in the United Kingdom, Canada, Germany and several other foreign jurisdictions. The focus of all of these audits is the allocation of profits among our legal entities. We regularly assess the likelihood of adverse outcomes resulting from such examinations to determine the adequacy of our provision for income taxes. Although we believe that our estimates are reasonable, the ultimate tax outcome may differ from the amounts recorded in our consolidated financial statements and may materially affect our financial results.
We may undertake corporate operating restructurings or transfers of assets that involve our group of foreign country subsidiaries through which we do business abroad, in order to maximize the operational and tax efficiency of our group structure. If ineffectual, such restructurings or transfers could increase our income tax liabilities, and in turn, increase our global effective tax rate. Moreover, our existing corporate structure and intercompany arrangements have been implemented in a manner we believe reasonably ensures that we are in compliance with current prevailing tax laws. However, the tax authorities of the jurisdictions in which we operate may challenge our methodologies for valuing developed technology or intercompany arrangements, which could impact our worldwide effective tax rate and harm our financial position and operating results.
Significant judgment is required in determining any valuation allowance recorded against deferred tax assets. In assessing the need for a valuation allowance, we consider all available evidence, including past operating results, estimates of future taxable income and the feasibility of tax planning strategies. In the event that we change our determination as to the amount of deferred tax assets that can be realized, we will adjust our valuation allowance with a corresponding impact to the provision for income taxes in the period in which such determination is made.
Forecasting our estimated annual effective tax rate is complex and subject to uncertainty, and there may be material differences between our forecasted and actual tax rates.
Forecasts of our income tax position and effective tax rate are complex, subject to uncertainty and periodic updates because our income tax position for each year combines the effects of a mix of profits earned and losses incurred by us in various tax jurisdictions with a broad range of income tax rates, as well as changes in the valuation of deferred tax assets and liabilities, the impact of various accounting rules and changes to these rules and tax laws, the results of examinations by various tax authorities, and the impact of any acquisition, business combination or other reorganization or financing transaction. To forecast our global tax rate, we estimate our pre-tax profits and losses by jurisdiction and forecast our tax expense by
39
jurisdiction. If the mix of profits and losses, our ability to use tax credits or our effective tax rate in a given jurisdiction differs from our estimate, our actual tax rate could be materially different than forecasted, which could have a material impact on our results of business, financial condition and results of operations. Additionally, our actual tax rate may be subject to further uncertainty due to potential changes in U.S. and foreign tax rules.
As a multinational corporation, we conduct our business in many countries and are subject to taxation in many jurisdictions. The taxation of our business is subject to the application of multiple and sometimes conflicting tax laws and regulations, as well as multinational tax conventions. Our effective tax rate is highly dependent upon the geographic distribution of our worldwide earnings or losses, the tax regulations in each geographic region, the availability of tax credits and carryforwards and the effectiveness of our tax planning strategies. The application of tax laws and regulations is subject to legal and factual interpretation, judgment and uncertainty. Tax laws themselves are subject to change as a result of changes in fiscal policy, changes in legislation and the evolution of regulations and court rulings. Consequently, tax authorities may impose tax assessments or judgments against us that could materially impact our tax liability and/or our effective income tax rate.
The Organisation for Economic Co-operation and Development (the “OECD”), an international association comprised of 38 countries, including the United States, has issued and continues to issue guidelines and proposals that change various aspects of the existing framework under which our tax obligations are determined in many of the countries in which we do business. Due to our extensive international business activities, any changes in the taxation of such activities could increase our tax obligations in many countries and may increase our worldwide effective tax rate.
Risks Related to Ownership of Our Common Stock
As a public company, we are subject to compliance initiatives that will require substantial time from our management and result in significantly increased costs that may adversely affect our operating results and financial condition.
The Sarbanes-Oxley Act of 2002 (“Sarbanes-Oxley”), Dodd-Frank and other rules implemented by the SEC and The Nasdaq Stock Market impose various requirements on public companies, including requiring changes in corporate governance practices. These requirements, as well as proposed corporate governance laws and regulations under consideration, may further increase our compliance costs. If compliance with these various legal and regulatory requirements diverts our management’s attention from other business concerns, it could have a material adverse effect on our business, financial condition and results of operations. Sarbanes-Oxley requires, among other things, that we assess the effectiveness of our internal control over financial reporting annually, and of our disclosure controls and procedures quarterly. Although our most recent assessment, testing and evaluation resulted in our conclusion that, as of December 31, 2023, our internal controls over financial reporting were effective, we cannot predict the outcome of our testing in 2024 or future periods and there can be no assurance that, in the future, our internal controls over financial reporting will be effective or deemed effective. We may incur additional expenses and commitment of management’s time in connection with further evaluations, both of which could materially increase our operating expenses and accordingly reduce our operating results.
If equity research or industry analysts stop publishing research or reports about our business, issue unfavorable commentary, downgrade our shares of common stock or publish inaccurate information, our stock price and trading volume could decline.
The trading market for our common stock is influenced in part by the research and reports that equity research and industry analysts publish about us or our business. If one or more of these analysts ceases coverage of our company or fails to publish reports on us regularly, we could lose visibility in the financial markets, which in turn could cause our stock price or trading volume to decline. Furthermore, if one or more of these analysts downgrades our stock or issues unfavorable commentary about our business, the price of our stock could decline. We have in the past experienced downgrades and may in the future experience downgrades. In addition, these analysts may publish their own financial projections, which may vary widely and may not accurately predict the results we actually achieve, which in turn could cause our share price to decline if our actual results do not match their projections. If one of these analysts were to publish inaccurate negative information about us or our business, our stock price could decline. Moreover, if securities analysts publish inaccurate positive information, stockholders could buy our stock and the stock price may later decline.
The trading price of our common stock may be volatile, which may be exacerbated by share repurchases under our Share Repurchase Program.
The market price of our common stock may be subject to wide fluctuations in response to, among other things, the risk factors described in this periodic report, news about us and our financial results, news about our competitors and their results, and other factors such as rumors or fluctuations in the valuation of companies perceived by investors to be comparable to us. For example, during 2023, the closing price of our common stock ranged from $47.45 to $80.28 per share.
40
Furthermore, stock markets have experienced price and volume fluctuations that have affected and continue to affect the market prices of equity securities of many companies. These fluctuations often have been unrelated or disproportionate to the operating performance of those companies. These broad market and industry fluctuations, as well as general economic, political and market conditions, such as recessions, interest rate changes or international currency fluctuations, may negatively affect the market price of our common stock.
In the past, many companies that have experienced volatility in the market price of their stock have been subject to securities class action litigation. We may be the target of this type of litigation in the future. Securities litigation against us could result in substantial costs and divert our management’s attention from other business concerns, which could seriously harm our business.
Share repurchases under the Repurchase Program could increase the volatility of the trading price of our common stock, could diminish our cash reserves, could occur at non-optimal prices and may not result in the most effective use of our capital.
In February 2023, our board of directors approved an extension of the Repurchase Program to February 29, 2024. In April 2023 and July 2023, our board of directors approved $1.0 billion and $500.0 million increases in the authorized stock repurchase amount under the Repurchase Program, respectively. As of December 31, 2023, $529.1 million remained available for future share repurchases under the Repurchase Program. In January 2024, our board of directors approved a $500.0 million increase in the authorized stock repurchase amount under the Repurchase Program, bringing the aggregate amount authorized to be repurchased to $7.25 billion of our outstanding common stock. As of February 23, 2024, approximately $1.03 billion remained available for future share repurchases. In February 2024, our board of directors approved an extension of the Repurchase Program to February 28, 2025. Share repurchases under the Repurchase Program could affect the price of our common stock, increase stock price volatility and diminish our cash reserves. In addition, an announcement of the reduction, suspension or termination of the Repurchase Program could result in a decrease in the trading price of our common stock. Moreover, our stock price could decline, resulting in repurchases made at non-optimal prices. Our failure to repurchase our stock at optimal prices may be perceived by investors as an inefficient use of our cash and cash equivalents, which could result in litigation that may have an adverse effect on our business, operating results and financial condition. In addition, while our board of directors carefully considers various alternative uses of our cash and cash equivalents in determining whether to authorize stock repurchases, there can be no assurance that the decision by our board of directors to repurchase stock would result in the most effective uses of our cash and cash equivalents, and there may be alternative uses of our cash and cash equivalents that would be more effective, such as investing in growing our business organically or through acquisitions.
Anti-takeover provisions contained in our certificate of incorporation and bylaws, as well as provisions of Delaware law, could impair a takeover attempt.
Our certificate of incorporation, bylaws and Delaware law contain provisions that could have the effect of rendering more difficult, delaying or preventing an acquisition deemed undesirable by our board of directors. Our corporate governance documents include provisions:
•authorizing “blank check” preferred stock, which could be issued by the board without stockholder approval and may contain voting, liquidation, dividend and other rights superior to our common stock;
•limiting the liability of, and providing indemnification to, our directors and officers;
•requiring advance notice of stockholder proposals for business to be conducted at meetings of our stockholders and for nominations of candidates for election to our board of directors;
•providing that certain litigation matters may only be brought against us in state or federal courts in the State of Delaware;
•controlling the procedures for the conduct and scheduling of board and stockholder meetings; and
•providing the board of directors with the express power to postpone previously scheduled annual meetings and to cancel previously scheduled special meetings.
These provisions, alone or together, could delay or prevent hostile takeovers and changes in control or changes in our management.
41
In addition, our amended and restated bylaws provide that unless we consent in writing to the selection of an alternative forum, to the fullest extent permitted by law, the federal district courts of the United States shall be the exclusive forum for the resolution of any complaint asserting a cause of action arising under the Securities Act. Any person or entity purchasing or otherwise acquiring any interest in any of our securities shall be deemed to have notice of and consented to this provision. This provision, as well as provisions providing that certain litigation matters may only be brought against us in state or federal courts in the State of Delaware, may limit a stockholder’s ability to bring a claim in a judicial forum that it finds favorable for disputes with us or any of our directors, officers or other employees, which may discourage lawsuits against us and our directors, officers and other employees.
As a Delaware corporation, we are also subject to provisions of Delaware law, including Section 203 of the Delaware General Corporation Law, which prevents stockholders holding more than 15% of our outstanding common stock from engaging in certain business combinations without approval of the holders of a substantial majority of all of our outstanding common stock.
Any provision of our certificate of incorporation, bylaws or Delaware law that has the effect of delaying or deterring a change in control could limit the opportunity for our stockholders to receive a premium for their shares of our common stock, and could also affect the price that some investors are willing to pay for our common stock.
However, these anti-takeover provisions will not have the effect of preventing activist stockholders from seeking to increase short-term stockholder value through actions such as nominating board candidates and requesting that we pursue strategic combinations or other transactions. These actions could disrupt our operations, be costly and time-consuming and divert the attention of our management and employees. In addition, perceived uncertainties as to our future direction as a result of activist stockholder actions could result in the loss of potential business opportunities, as well as other negative business consequences. Actions of an activist stockholder may also cause fluctuations in our stock price based on speculative market perceptions or other factors that do not necessarily reflect our business. Further, we may incur significant expenses in retaining professionals to advise and assist us on activist stockholder matters, including legal, financial, communications advisors and solicitation experts, which may negatively impact our future financial results.
General Risks
Global economic uncertainty, an economic downturn, the possibility of a recession, inflation, rising interest rates, weakening product demand caused by political instability, changes in trade agreements and conflicts such as the war in Ukraine and the Israel-Hamas war, could adversely affect our business and financial performance.
Economic uncertainty in various global markets caused by political instability and conflict, such as the war in Ukraine and the Israel-Hamas war, and economic challenges caused by the economic downturn, any resulting recession, inflation or rise in interest rates has resulted, and may continue to result, in weakened demand for our products and services and difficulty in forecasting our financial results and managing inventory levels. Political developments impacting government spending and international trade, including potential government shutdowns and trade disputes and tariffs may negatively impact markets and cause weaker macroeconomic conditions. The effects of these events may continue due to potential U.S. government shutdowns and the transition in administrations, and the United States’ ongoing trade disputes with Russia, China and other countries. The continuing effect of any or all of these events could adversely impact demand for our products, harm our operations and weaken our financial results.
In addition, the U.S. capital markets have experienced and continue to experience extreme volatility and disruption. Inflation rates in the United States significantly increased in 2022 resulting in federal action to increase interest rates, adversely affecting capital markets activity. Further deterioration of the macroeconomic environment and regulatory action may adversely affect our business, operating results and financial condition. Moreover, there has been recent turmoil in the global banking system. For example, in March 2023, Silicon Valley Bank (“SVB”) was put into receivership by the Federal Deposit Insurance Corporation and subsequently sold. Other banks at risk of failure have been subsequently sold, including First Republic Bank in May 2023, and there is concern that more banks could be at risk of the same fate. Although we only had an immaterial amount of our cash directly at SVB, there is no guarantee that the federal government would guarantee all depositors as they did with SVB depositors in the event of further bank closures. Continued instability in the global banking system may negatively impact us or our customers, including our customers’ ability to pay for our platform, and adversely impact our business and financial condition. Moreover, events such as the closure of SVB, in addition to global macroeconomic conditions discussed above, may cause further turbulence and uncertainty in the capital markets and economy.
42
Our business is subject to the risks of earthquakes, drought, fire, power outages, typhoon, floods, virus outbreaks and other broad health-related challenges, cyber events and other catastrophic events, and to interruption by manmade problems such as civil unrest, war, labor disruption, critical infrastructure attack and terrorism.
A significant natural disaster, such as an earthquake, drought, fire, power outage, flood, viral outbreak or other catastrophic event, could have a material adverse impact on our business, operating results and financial condition. Our corporate headquarters are located in the San Francisco Bay Area, a region known for seismic activity, and our research and development and data center in Burnaby, Canada, from which we deliver to customers our FortiGuard and other security subscription updates, is subject to the risk of flooding and is also in a region known for seismic activity. Any earthquake in the Bay Area or Burnaby, or flooding in Burnaby, could materially negatively impact our ability to provide products and services, such as FortiCare support and FortiGuard subscription services and could otherwise materially negatively impact our business. In addition, natural disasters could affect our manufacturing vendors, suppliers or logistics providers’ ability to perform services, such as obtaining product components and manufacturing products, or performing or assisting with shipments, on a timely basis, as well as our customers’ ability to order from us and our employees’ ability to perform their duties. For example, a typhoon in Taiwan could materially negatively impact our ability to manufacture and ship products and could result in delays and reductions in billings and revenue, or the effects of epidemics and pandemics may negatively impact our ability to manufacture and ship products, possibly in a material way, and could result in delays and reductions in billings and revenue, also possibly in a material way. The impact of climate change could affect economies in ways that negatively impact us and our results of operations. In the event our or our service providers’ information technology systems or manufacturing or logistics abilities are hindered by any of the events discussed above, shipments could be delayed, resulting in our missing financial targets, such as revenue and shipment targets, for a particular quarter. In addition, regional instability, international disputes, wars, such as the war in Ukraine and the Israel-Hamas war and any expansion thereof, and other acts of aggression, civil and political unrest, labor disruptions, rebellions, acts of terrorism and other geo-political unrest could cause disruptions in our business or the business of our manufacturers, suppliers, logistics providers, partners or end-customers, or of the economy as a whole. Given our typical concentration of sales at the end of each quarter, any disruption in the business of our manufacturers, logistics providers, partners or end-customers that impacts sales at the end of our quarter could have a significant adverse impact on our quarterly results. To the extent that any of the above results in security risks to our customers, delays or cancellations of customer orders, the delay of the manufacture, deployment or shipment of our products or interruption or downtime of our services, our business, financial condition and results of operations would be adversely affected.
Changes in financial accounting standards may cause adverse unexpected fluctuations and affect our reported results of operations.
A change in accounting standards or practices, and varying interpretations of existing or new accounting pronouncements, as well as significant costs incurred or that may be incurred to adopt and to comply with these new pronouncements, could have a significant effect on our reported financial results or the way we conduct our business. If we do not ensure that our systems and processes are aligned with the new standards, we could encounter difficulties generating quarterly and annual financial statements in a timely manner, which could have an adverse effect on our business, our ability to meet our reporting obligations and compliance with internal control requirements.
Management will continue to make judgments and assumptions based on our interpretation of new standards. If our circumstances change or if actual circumstances differ from our assumptions, our operating results may be adversely affected and could fall below our publicly announced guidance or the expectations of securities analysts and investors, resulting in a decline in the market price of our common stock. Further, marketable equity investments are required to be measured at fair value (with subsequent changes in fair value recognized in net income), which may increase the volatility of our earnings.
ITEM 1B. Unresolved Staff Comments
Not applicable.
ITEM 1C. Cybersecurity
Our board of directors recognizes the critical importance of maintaining the trust and confidence of our customers, end users, business partners, stockholders and employees. Our board of directors is actively involved in oversight of our risk management program, and information and product security represent an important component of our overall approach to enterprise risk management (“ERM”). Our risks from cybersecurity threats are considered in conjunction with other risks in our ERM program. In addition, we leverage a cybersecurity-specific risk assessment process and strategy based on the NIST Cybersecurity Framework to manage risks to organizational operations and assets, individuals and other organizations associated with the operation and use of systems. Risk assessments are periodically conducted to identify threats and vulnerabilities, and then used to determine the likelihood and impact for each risk using a qualitative risk assessment methodology. In general, we seek to address cybersecurity risks through a broad, cross-functional approach that is focused on
43
preserving the confidentiality, security and availability of the information that we collect and store by identifying, preventing and mitigating cybersecurity threats and effectively responding to cybersecurity incidents when they occur.
Governance
The Audit Committee of our board of directors (the “Audit Committee”) is responsible for reviewing with management our cybersecurity and other information technology risks, controls and processes, including the processes used to prevent or mitigate cybersecurity risks and respond to cybersecurity events. Our executives with responsibility over cybersecurity provide quarterly reports to the Audit Committee as well as to the Chief Executive Officer and other members of our senior management as appropriate. These reports include updates on our cyber risks and threats, the status of projects to strengthen our information security systems, assessments of the information security program and the emerging threat landscape. Our program is regularly evaluated by internal and external experts with the results of those reviews reported to senior management and the Audit Committee. We also actively engage with key vendors, and intelligence and law enforcement communities as part of our continuing efforts to evaluate and enhance the effectiveness of our information security policies and procedures. The Audit Committee also receives prompt and timely information regarding any cybersecurity threat or incident that meets established reporting thresholds, as well as ongoing updates regarding any such threat or incident until it has been mitigated, resolved or otherwise addressed.
We believe our systems and processes with respect to the management of risks associated with cybersecurity threats are adequate. We have experienced, and may in the future experience, adverse impacts to our operations as a result of cybersecurity incidents. However, to date, cybersecurity threats, including as a result of any previous cybersecurity incidents, have not materially affected our business strategy, operating results, and/or financial condition. If we were to experience a material cybersecurity incident in the future, such incident may have a material effect, including on our business strategy, operating results or financial condition. For more information regarding cybersecurity risks that we face and potential impacts on our business related thereto, see our risk factors, including our risk factor titled “If our internal enterprise IT networks, on which we conduct internal business and interface externally, our operational networks, through which we connect to customers, vendors and partners systems and provide services, or our research and development networks, our back-end labs and cloud stacks hosted in our data centers, colocation vendors or public cloud providers, through which we research, develop and host products and services, are compromised, public perception of our products and services may be harmed, our customers may be breached and harmed, we may become subject to liability, and our business, operating results and stock price may be adversely impacted.”
Risk Management and Strategy
As one of the critical elements of our overall ERM approach, our cybersecurity program is focused on the following key areas:
Governance: As discussed in more detail above under the heading, “Governance,” our board of directors’ oversight of cybersecurity risk management is supported by the Audit Committee, which regularly interacts with executives with responsibility for cybersecurity, our Chief Executive Officer, Chief Technology Officer and President, Chief Financial Officer, Chief Operating Officer/General Counsel and other members of management. Management is promptly updated regarding any significant security events and the Audit Committee regularly reviews updates from our information security and product security leaders about cyber threat response preparedness, security controls and procedures, security program maturity milestones, risk and approaches to risk mitigation and the current and emerging threat landscape. In addition, all members of our board of directors receive management’s cybersecurity updates to the Audit Committee as part of their regular attendance at meetings of our board of directors.
Collaborative Approach: We have implemented a broad, cross-functional approach to identifying, preventing and mitigating cybersecurity threats and incidents, while also implementing controls and procedures that provide for the prompt escalation of certain cybersecurity incidents so that decisions regarding the public disclosure and reporting of such incidents can be made by management in a timely manner. In addition, we manage a cross-functional program across our engineering, manufacturing and technical services teams, together with our suppliers and channel partners, designed to ensure the proper security of our products from design through manufacture and shipment.
Information Security: We implement organizational, administrative and technical measures based on commercially reasonable procedures using: (i) industry standard information security measures prescribed for use by NIST; (ii) security measures aligned with the ISO/IEC 27000 series of standards, (iii) Sarbanes-Oxley and SSAE 18/ISAE 3402; (iv) privacy regulations such as the GDPR and the CCPA; (v) business continuity management measures aligned with the ISO/IEC 22301 standard; and (vi) other generally recognized industry standards, in each case, designed to safeguard the confidentiality, integrity, and availability of our infrastructure and data and the resiliency of our operations.
44
Technical Safeguards: We deploy technical safeguards that are designed to protect our information systems from cybersecurity threats, including firewalls, intrusion prevention and detection systems, anti-malware functionality and access controls, which are evaluated and improved through vulnerability assessments and cybersecurity threat intelligence.
Incident Response and Recovery Planning: We have established and maintains broad incident response and recovery plans that help enable its effective and orderly management of, and response to, any identified security incidents, including escalation and internal and external-notification steps, allowing the incident response team to respond in a timely manner and enlist appropriate personnel and third-party experts. We maintain a process to promptly assess and assign severity levels to any identified security incidents in order to prioritize their importance and promptly direct resources to those issues of potentially greater impact. The notification plan establishes steps to alert external stakeholders as appropriate, including law enforcement, regulatory bodies, investors, customers and other business partners.
Third-Party Risk Management: We maintain a broad, risk-based approach to identifying and overseeing cybersecurity risks presented by third parties, including vendors, service providers and other external users of our systems, as well as the systems of third parties that could adversely impact our business in the event of a cybersecurity incident affecting those third-party systems. In addition, our Trusted Supplier Program is designed to ensure manufacturing partners undergo a selection and qualification process that adheres to NIST 800-161.
Education and Awareness: We provide regular, mandatory training for personnel and contractors regarding cybersecurity threats as a means to equip Fortinet personnel with effective tools to address cybersecurity threats and to communicate Fortinet’s evolving information security policies, standards, processes and practices.
Risk and Readiness Assessments: We engage in the periodic assessment and testing of our policies, standards, processes and practices that are designed to identify vulnerabilities and weaknesses, address cybersecurity threats and test its readiness to respond to cyber security incidents. These efforts include a wide range of activities, including threat modeling, a variety of vulnerability and configuration scans, penetration testing, audits, tabletop exercises and other exercises focused on evaluating the effectiveness of our cybersecurity measures and planning. We regularly engage third parties to perform assessments on our cybersecurity measures, including information security maturity assessments, audits and independent reviews of our information security control environment and operating effectiveness and penetration tests. The results of such assessments, audits and reviews are reported to the Audit Committee and our board of directors and to our management, and we adjust its cybersecurity policies, standards, processes and practices as necessary based on the information provided by these assessments, audits and reviews.
Insurance: We maintain information security risk insurance coverage.
ITEM 2. Properties
Our corporate headquarters is located in Sunnyvale, California and comprises approximately 395,000 square feet of building space on 21 acres of land. Refer to Note 17, Subsequent Events, in Part II, Item 8 of this Annual Report on Form 10-K for the January 2024 purchase of an additional 480,000 square feet in Santa Clara, CA which is located in close proximity to corporate headquarters.
Along with our corporate headquarters, as of December 31, 2023, we operated the following facilities:
Location | Owned Square Footage | Description of Use | ||||||||||||
Burnaby and Ottawa, Canada | 560,000 | Datacenter operations, support functions and research and development | ||||||||||||
Union City, California | 350,000 | Manufacturing assembly and operations | ||||||||||||
Plano & Frisco, Texas | 130,000 | Office space and datacenter operations | ||||||||||||
Torija, Spain | 120,000 | Future development of datacenter operations | ||||||||||||
Chicago, Illinois | 100,000 | Office space and retail | ||||||||||||
Sunrise, Florida | 100,000 | Office space | ||||||||||||
Valbonne, France | 70,000 | Sales and support functions | ||||||||||||
We also own additional building space in Sunnyvale and Union City, California, and Sydney, Australia, for future development of approximately 450,000 square feet in the aggregate.
We maintain additional leased offices throughout the world, predominantly used as sales and support offices, and leased data center spaces throughout the world operated under co-location arrangements. We believe that our existing properties
45
are sufficient and suitable to meet our current needs. We intend to expand our facilities, develop unoccupied space, or add new facilities to support our future growth and enter new product markets, and we believe that suitable additional or alternative space will be available or can be developed as needed to accommodate ongoing operations and any such growth. However, we expect to incur additional operating expenses and capital expenditures in connection with such new or expanded facilities.
For information regarding the geographical location of our property and equipment, refer to Note 16 to our consolidated financial statements in Part II, Item 8 of this Annual Report on Form 10-K.
ITEM 3. Legal Proceedings
We are subject to various claims, complaints and legal actions that arise from time to time in the ordinary course of business. We accrue for contingencies when we believe that a loss is probable and that we can reasonably estimate the amount of any such loss. There can be no assurance that existing or future legal proceedings arising in the ordinary course of business or otherwise will not have a material adverse effect on our business, consolidated financial position, results of operations or cash flows. Refer to Note 12. Commitments and Contingencies in Part II, Item 8 of this Annual Report on Form 10-K for additional information.
ITEM 4. Mine Safety Disclosure
Not applicable.
Part II
All share and per share amounts presented in this Part II have been retroactively adjusted to reflect the five-for-one forward stock split of our common stock effective June 22, 2022.
ITEM 5. Market for Registrant’s Common Equity, Related Stockholder Matters and Issuer Purchases of Equity Securities
Common Stock
Our common stock is traded on The Nasdaq Global Select Market under the symbol “FTNT.”
Holders of Record
As of February 22, 2024, there were 45 holders of record of our common stock. A substantially greater number of holders of our common stock are “street name” or beneficial holders, whose shares are held by banks, brokers and other financial institutions.
Dividends
We have never declared or paid cash dividends on our capital stock. We do not anticipate paying any cash dividends in the foreseeable future. Any future determination to declare cash dividends will be made at the discretion of our board of directors and will depend on our financial condition, operating results, capital requirements, general business conditions and other factors that our board of directors may deem relevant.
Securities Authorized for Issuance Under Equity Compensation Plans
Information responsive to this item is incorporated herein by reference to our definitive proxy statement with respect to our 2024 Annual Meeting of Stockholders to be filed with the Securities and Exchange Commission (the “SEC”) within 120 days after the end of the fiscal year covered by this Annual Report on Form 10-K.
Stock Performance Graph
This performance graph shall not be deemed “filed” for purposes of Section 18 of the Securities and Exchange Act of 1934 (the “Exchange Act”), or incorporated by reference into any filing of Fortinet under the Securities Act of 1933, as amended (the “Securities Act”), or the Exchange Act, except as shall be expressly set forth by specific reference in such filing.
46
The following graph compares the cumulative five-year total return for our common stock, the Standard & Poor’s 500 Stock Index (the “S&P 500 Index”) and the NASDAQ Computer Index. Such returns are based on historical results and are not intended to suggest future performance. Data for the S&P 500 Index and the NASDAQ Computer Index assume reinvestment of dividends.
COMPARISON OF CUMULATIVE TOTAL RETURN*
Among Fortinet, Inc., the S&P 500 Index and
the NASDAQ Computer Index
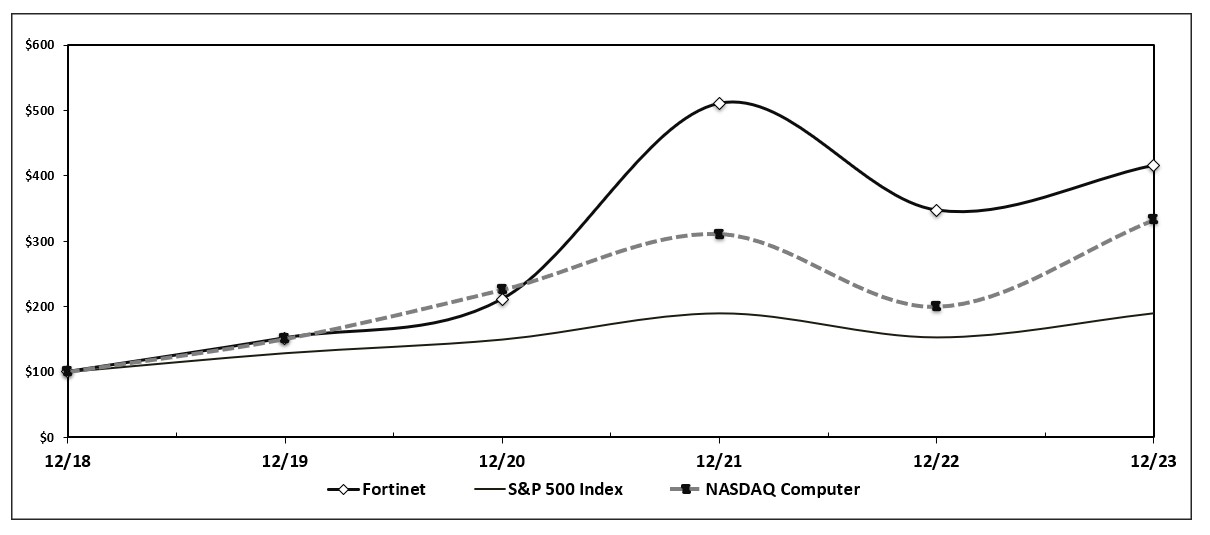
December 2018 * | December 2019 | December 2020 | December 2021 | December 2022 | December 2023 | |||||||||||||||||||||||||||||||||
| Fortinet, Inc. | $ | 100 | $ | 152 | $ | 211 | $ | 510 | $ | 347 | $ | 416 | ||||||||||||||||||||||||||
| S&P 500 Index | $ | 100 | $ | 129 | $ | 150 | $ | 190 | $ | 153 | $ | 190 | ||||||||||||||||||||||||||
| NASDAQ Computer | $ | 100 | $ | 150 | $ | 225 | $ | 311 | $ | 200 | $ | 332 | ||||||||||||||||||||||||||
* Assumes that $100 was invested on December 31, 2018 in stock or index, including reinvestment of dividends. Stockholder returns over the indicated period should not be considered indicative of future stockholder returns. | ||||||||||||||||||||||||||||||||||||||
Sales of Unregistered Securities
None.
Purchases of Equity Securities by the Issuer and Affiliated Purchasers
Share Repurchase Program
In January 2016, our board of directors approved our Share Repurchase Program (the “Repurchase Program”), which authorized the repurchase of up to $200.0 million of our outstanding common stock through December 31, 2017. From 2016 through 2022, our board of directors approved increases to our Repurchase Program by various amounts and extended the term to February 28, 2023. In February 2023, our board of directors approved an extension of the Repurchase Program to February 29, 2024. In April 2023 and July 2023, our board of directors approved $1.0 billion and $500.0 million increases in the authorized stock repurchase amount under the Repurchase Program, respectively, bringing the aggregate amount authorized to be repurchased to $6.75 billion. Under the Repurchase Program, share repurchases may be made by us from time to time in privately negotiated transactions or in open market transactions. The Repurchase Program does not require us to purchase a minimum number of shares, and may be suspended, modified or discontinued at any time without prior notice. Since its inception, we have repurchased 238.6 million shares of our common stock under the Repurchase Program for an aggregate purchase price of $6.22 billion.
47
The following table provides information with respect to the shares of common stock we repurchased under the Repurchase Program during the three months ended December 31, 2023 (in millions, except average price paid per share amounts):
| Period | Total Number of Shares Purchased | Average Price Paid per Share | Total Number of Shares Purchased as Part of Publicly Announced Plan or Program | Approximate Dollar Value of Shares that May Yet Be Purchased Under the Plans or Programs | ||||||||||||||||||||||
October 1 - October 31, 2023 | 7.7 | $ | 57.43 | 7.7 | $ | 980.0 | ||||||||||||||||||||
November 1 - November 30, 2023 | 9.1 | $ | 49.75 | 9.1 | $ | 529.1 | ||||||||||||||||||||
December 1 - December 31, 2023 | — | $ | — | — | $ | 529.1 | ||||||||||||||||||||
| Total | 16.8 | $ | 53.29 | 16.8 | ||||||||||||||||||||||
In January 2024, our board of directors approved a $500.0 million increase in the authorized stock repurchase amount under the Repurchase Program, bringing the aggregate amount authorized to be repurchased to $7.25 billion of our outstanding common stock. As of February 23, 2024, approximately $1.03 billion remained available for future share repurchases. In February 2024, our board of directors approved an extension of the Repurchase Program to February 28, 2025.
ITEM 6. [Reserved]
48
ITEM 7. Management’s Discussion and Analysis of Financial Condition and Results of Operations
In addition to historical information, this Annual Report on Form 10-K contains forward-looking statements within the meaning of Section 27A of the Securities Act and Section 21E of the Exchange Act. These statements include, among other things, statements concerning our expectations regarding:
•continued growth and market share gains;
•variability in sales in certain product and service categories from year to year and between quarters;
•expected impact of sales from certain products and services;
•increasing or decreasing inflation or stagflation, and changing interest rates in many geographies and changes in currency exchange rates and currency regulations;
•competition in our markets;
•macroeconomic, geopolitical factors and other disruption on our manufacturing or sales, including public health issues, wars and natural disasters;
•real estate investments, management of future growth including expansions and enhancements of current properties;
•government regulation, tariffs and other policies;
•drivers of long-term growth and operating leverage, such as pricing of our products and services, sales productivity, pipeline and capacity, functionality, value and technology improvements in our service offerings;
•growing our solution sales through channel partners to businesses, service providers and government organizations, our ability to execute these sales and the complexity of providing solutions to all segments (including the increased competition and unpredictability of timing associated with sales to larger enterprises), the impact of sales to these organizations on our long-term growth, expansion and operating results, and the effectiveness of our sales organization;
•our ability to successfully anticipate market changes related to cloud-based solutions and to sell, support and meet service level agreements related to cloud-based solutions;
•growth expectations for the secure networking market;
•supply chain constraints, component availability and other factors affecting our manufacturing capacity, delivery, cost and inventory management;
•forecasts of future demand and targeted inventory levels, including changing market drivers and demands;
•the effect of backlog from prior quarters, including its effect on growth of in-quarter billings and revenue;
•instability in the global banking system;
•our ability to hire properly qualified and effective sales, support and engineering employees;
•risks and expectations related to acquisitions and equity interests in private and public companies, including integration issues related to go-to-market plans, product plans, employees of such companies, controls and processes and the acquired technology, and risks of negative impact by such acquisitions and equity investments on our financial results;
•trends in revenue, cost of revenue and gross margin, including expectations regarding product revenue and service revenue growth;
49
•trends in our operating expenses, including sales and marketing expense, research and development expense, general and administrative expense, and expectations regarding these expenses;
•expected impact of plans and strategy for the acceleration of our points of presence (“PoP”) deployment;
•expectations that our operating expenses will increase year over year in absolute dollars during 2024;
•expectations that proceeds from the exercise of stock options in future years will be adversely impacted by the increased mix of restricted stock units and performance stock units versus stock options granted or a decline in our stock price;
•expectations regarding uncertain tax benefits and our effective domestic and global tax rates, the impact of interpretations of or changes to tax law, and the timing of tax payments;
•expectations regarding spending related to real estate acquisitions and development, including data center, office building and warehouse investments, as well as other capital expenditures and to the impact on free cash flow and expenses;
•estimates of a range of 2024 spending on capital expenditures;
•expected outcomes and liabilities in litigation;
•our intentions regarding share repurchases and the sufficiency of our existing cash, cash equivalents and investments to meet our cash needs, including our debt servicing requirements, for at least the next 12 months;
•other statements regarding our future operations, financial condition and prospects and business strategies; and
•adoption and impact of new accounting standards.
These forward-looking statements are subject to certain risks and uncertainties that could cause our actual results to differ materially from those reflected in the forward-looking statements. Factors that could cause or contribute to such differences include, but are not limited to, those discussed in this Annual Report on Form 10-K and, in particular, the risks discussed under the heading “Risk Factors” in Part I, Item 1A of this Annual Report on Form 10-K and those discussed in other documents we file with the SEC. We undertake no obligation, and specifically disclaim any obligation, to revise or publicly release the results of any revision to these and any other forward-looking statements. Given these risks and uncertainties, readers are cautioned not to place undue reliance on such forward-looking statements.
Business Overview
Fortinet is a leader in cybersecurity and the convergence of networking and security. Our mission is to secure people, devices and data everywhere. Our integrated platform, the Fortinet Security Fabric, spans secure networking, unified SASE and AI-driven security operations to deliver cybersecurity where our customers need it. As of December 31, 2023, over a half million customers trusted our solutions, including enterprises such as in the financial services, retail and operational technology market verticals, communication and security service providers, government organizations and small and medium-sized businesses. As a global company headquartered in Sunnyvale, California with a large international customer base, the majority of our research and development is in the United States and Canada with a global footprint of support and centers of excellence around the world. As of December 31, 2023, we held 957 U.S. patents and 1,299 global patents and we are recognized in over 80 enterprise analyst reports demonstrating both our vision and execution across networking and security products.
•Secure Networking—Our Secure Networking solutions focus on the convergence of networking and security via our network firewall and our switches, access points and other secure connectivity solutions. FortiOS is our networking and security operating system that is consistent across our firewalls and secure connectivity solutions and supports over 30 functions that can be delivered via a physical, virtual, cloud or SaaS solution. When delivered via our network firewall appliances, functionality is accelerated through our proprietary ASIC technology. These proprietary ASICs, combined with off-the-shelf CPUs and ASICs, allow our systems to scale, run multiple applications at higher performance, lower power consumption and perform more processor-intensive operations, such as inspecting encrypted traffic, including streaming video. The Network Firewall solution consists of FortiGate data centers, hyperscale and distributed firewalls, as well as encrypted applications (SSL inspection, Virtual Private Network and
50
IPsec connectivity). Our ability to converge networking and security also enables the ethernet to become an extension of a company’s security infrastructure through FortiSwitch and FortiLink. Our wireless LAN solution leverages secure networking to provide secure wireless access for the enterprise LAN edge. FortiExtender secures 5G/LTE and remote ethernet extenders to connect and secure any branch environment. The Secure Connectivity solution includes FortiSwitch Secure Ethernet Switches, FortiAP Wireless Local Area Network Access Points and FortiExtender 5G Connectivity Gateways, among other products.
•Unified Secure Access Service Edge (SASE)—As applications move to the cloud and work from anywhere becomes established, cloud delivery is needed to enable secure access to applications on any cloud. The Fortinet Unified SASE solution is a single-vendor SASE solution that includes Firewall, SD-WAN, Secure Web Gateway, Cloud Access Services Broker, Data Loss Prevention, Zero Trust Network Access and cloud security, including Web Application Firewalls, Virtualized Firewalls and Cloud-Native Firewalls, among other products. These functions are delivered through our FortiOS operating systems, which can deploy the full SASE stack through the cloud or on our ASIC-driven appliances. All functions can be managed through a unified management console.
•Security Operations (SecOps)—Fortinet’s Security Operations solutions comply with the NIST cybersecurity framework of identify, protect, detect, respond and recover, and are delivered as a platform that automates detection and response to accelerate discovery and remediation. The SecOps solution includes FortiAI generative AI assistant, FortiSIEM Security Information and Event Management, FortiSOAR Security Orchestration, Automation and Response, FortiEDR Endpoint Detection and Response, FortiXDR Extended Detection and Response, FortiMDR Managed Detection and Response Service, FortiNDR Network Detection and Response, FortiRecon Digital Risk Protection, FortiDeceptor Deception technology, FortiGuard SoCaaS, FortiSandbox Sandboxing Services and FortiGuard Incident Response Services, among other products.
FortiGuard Labs is our cybersecurity threat intelligence and research organization comprised of experienced threat hunters, researchers, analysts, engineers and data scientists who develop and utilize machine learning and AI technologies to provide timely protection updates and actionable threat intelligence for the benefit of our customers. FortiGuard Security Services are a suite of AI-powered security capabilities that are natively integrated as part of the Fortinet Security Fabric to deliver coordinated detection and enforcement across the entire attack surface. The portfolio consists of FortiGuard application security services, content security services, device security services, NOC/SOC security services and web security services.
FortiCare Technical Support Service is a per-device support service, which provides customers access to experts to ensure efficient and effective operations and maintenance of their Fortinet capabilities. Global technical support is offered 24x7 with flexible add-ons, including enhanced SLAs and premium hardware replacement through in-country depots. Organizations have the flexibility to procure different levels of service for different devices based on their availability needs. We offer three per-device support options tailored to the needs of our enterprise customers: FortiCare Premium, FortiCare Elite and FortiCare Essential. The FortiCare Elite service aims to provide 15-minute response times for key product families.
We also offer training services to our end-customers and channel partners through our training team and authorized training partners. We have also implemented a training certification program, NSE, to help ensure an understanding of our products and services. Since 2020, Fortinet has also offered a number of free online training courses to help address prevalent industry-wide cybersecurity skills gaps and shortages.
Financial Highlights
•Total revenue was $5.30 billion in 2023, an increase of 20% compared to $4.42 billion in 2022.
•Product revenue was $1.93 billion in 2023, an increase of 8% compared to $1.78 billion in 2022.
•Service revenue was $3.38 billion in 2023, an increase of 28% compared to $2.64 billion in 2022.
•Total gross profit was $4.07 billion in 2023, an increase of 22% compared to $3.33 billion in 2022.
•Operating income was $1.24 billion in 2023, an increase of 28% compared to $969.6 million in 2022.
•Cash, cash equivalents, investments and marketable equity securities were $2.44 billion as of December 31, 2023, an increase of $183.9 million, or 8%, from December 31, 2022.
•Long-term debt, net of unamortized discount and debt issuance costs, was $992.3 million and $990.4 million as of December 31, 2023 and 2022, respectively.
51
•In 2023, we repurchased 27.2 million shares of common stock under the Repurchase Program for an aggregate purchase price of $1.50 billion, which excludes a $10.9 million accrual related to the 1% excise tax imposed by the Inflation Reduction Act of 2022. In 2022, we repurchased 36.0 million shares of common stock for a total purchase price of $1.99 billion.
•Deferred revenue was $5.74 billion as of December 31, 2023, an increase of $1.09 billion, or 24%, from December 31, 2022. Short-term deferred revenue was $2.85 billion as of December 31, 2023, an increase of $499.4 million, or 21%, from December 31, 2022.
•Cash flows from operating activities were $1.94 billion in 2023, an increase of $204.9 million, or 12%, compared to 2022.
Our revenue growth was driven primarily by service revenue. On a geographic basis, revenue continues to be diversified globally, which remains a key strength of our business.
In 2023, the Americas region, the Europe, Middle East and Africa (“EMEA”) region and the Asia Pacific (“APAC”) region contributed 41%, 39% and 20% of our total revenue, respectively, and increased 22%, 23% and 12% compared to 2022, respectively.
Product revenue growth was impacted by an elevated cyber threat landscape, the convergence of security and networking, the impact of certain historical pricing actions, improving supply chain dynamics and changes in the backlog balance. Product revenue growth rates decreased from 42% in 2022 to 8% in 2023 partially due to overall softening macroeconomic conditions. We expect that product revenue growth rates will continue to be impacted by overall macroeconomic conditions in 2024.
Service revenue growth has accelerated over the past three years from 24% in 2021, to 26% in 2022, to 28% in 2023. Service revenue growth of 28% in 2023 was primarily driven by the strength of our security subscription revenue, which grew 33%. The increase was primarily due to the recognition of revenue from our growing deferred revenue balance related to FortiGuard and other security subscriptions delivered to on-premise and cloud-based environments. Security subscriptions outpaced technical support growth due to strength in secure networking subscriptions, SecOps and SASE. We expect our service revenue to continue to grow in 2024, with growth opportunities coming from our SecOps and SASE offerings. While service revenue is expected to grow, we anticipate that the growth rates will be impacted by overall macroeconomic conditions in 2024.
Our billings were diversified on a geographic basis. In 2023, seven countries represented approximately 50% of our billings and the remaining 50% in the aggregate were from over 100 countries that individually contributed less than 3% of our billings.
Operating expenses as a percentage of revenue decreased approximately 0.2 percentage points in 2023 compared to 2022. Headcount increased 8% to 13,568 employees as of December 31, 2023, up from 12,595 as of December 31, 2022.
Impact of Macroeconomic Developments
Our overall performance depends in part on worldwide economic and geopolitical conditions, such as the war in Ukraine and the Israel-Hamas war or tensions between China and Taiwan, and their impact on customer behavior. Worsening economic conditions, including inflation, higher interest rates, slower growth, any recession, fluctuations in foreign exchange rates, instability in the global banking industry and other changes in economic conditions, may result in decreased sales productivity and growth and adversely affect our results of operations and financial performance. We have seen certain impacts on our business, results of operations, financial condition, cash flows, liquidity and capital and financial resources such as longer sales cycles, delayed purchases and increased commitments with certain suppliers and increased inventory and inventory purchase commitment reserves.
Our days sales outstanding remained flat at 89 days for the years ended December 31, 2023 and 2022, primarily due to the sales linearity and certain geographies where extended payment terms are more prevalent. The accounts receivable allowance for credit losses was $8.2 million as of December 31, 2023, an increase of $4.6 million compared to $3.6 million as of December 31, 2022, primarily due to an increase in past due invoices over 60 and 90 days.
Worsening economic conditions may have a material negative impact on our results in future periods and may negatively impact our billings, revenue and costs, and may decrease growth and profitability. The extent of the impact of economic conditions on our operational and financial performance will depend on ongoing developments, including those
52
discussed above and others identified in Part I, Item 1A “Risk Factors” in this Form 10-K. Given the dynamic nature of these circumstances, the full impact of worsening economic conditions on our business and operations, results of operations, financial condition, cash flows, liquidity and capital and financial resources cannot be reasonably estimated at this time.
Business Model
We typically sell our security solutions to distributors that sell to networking security focused resellers and to certain service providers and managed security service providers (“MSSPs”), who, in turn, sell to end-customers or use our products and services to provide hosted solutions to other enterprises. At times, we also sell directly to certain large enterprise customers, large service providers and major systems integrators. In addition, we sell our software licenses and services via different cloud service provider platforms, both directly and through our channel partners. Our end-customers are located in over 100 countries and include small, medium and large enterprises and government organizations across a wide range of industries, including financial services, government, healthcare, manufacturing, retail, technology and telecommunications. An end-customer deployment may involve as few as one or as many as thousands of secure networking, unified SASE and security operations technology products, depending on the end-customer’s size and security requirements.
Our customers purchase our hardware products, software licenses and cloud-delivered solutions, as well as our FortiGuard and other security subscription and FortiCare technical support services. We generally invoice network security at the time of our sale for the total price of the products and services. Standard payment terms are generally no more than 60 days, though we may offer extended payment terms to certain distributors or related to certain transactions.
We also offer our products hosted in our own data centers, PoPs and through co-locations and major cloud service providers, including Amazon Web Services, Microsoft Azure and Google Cloud. We have also recognized revenue from customers who deploy our products in a bring-your-own-license (“BYOL”) arrangements at cloud service providers or at private clouds. In a BYOL arrangement, a customer purchases a software license through our channel partners and deploys the software in a cloud provider’s environment, in third-party clouds or in their private cloud.
Key Metrics
We monitor several key metrics, including the key financial metrics set forth below, in order to help us evaluate growth trends, establish budgets, measure the effectiveness of our sales and marketing efforts, and assess operational efficiencies. The following table summarizes revenue, deferred revenue, billings (non-GAAP), net cash provided by operating activities, and free cash flow (non-GAAP). We discuss revenue below under “—Components of Operating Results,” and we discuss net cash provided by operating activities below under “—Liquidity and Capital Resources.” Deferred revenue, billings (non-GAAP), and free cash flow (non-GAAP) are discussed immediately below the following table.
| Year Ended or As of December 31, | |||||||||||||||||
| 2023 | 2022 | 2021 | |||||||||||||||
| (in millions) | |||||||||||||||||
| Revenue | $ | 5,304.8 | $ | 4,417.4 | $ | 3,342.2 | |||||||||||
| Deferred revenue | $ | 5,735.0 | $ | 4,640.3 | $ | 3,452.9 | |||||||||||
| Billings (non-GAAP) | $ | 6,399.5 | $ | 5,594.0 | $ | 4,181.4 | |||||||||||
| Net cash provided by operating activities | $ | 1,935.5 | $ | 1,730.6 | $ | 1,499.7 | |||||||||||
| Free cash flow (non-GAAP) | $ | 1,731.4 | $ | 1,449.4 | $ | 1,203.8 | |||||||||||
Deferred revenue. Our deferred revenue consists of amounts that have been invoiced but that have not yet been recognized as revenue. The majority of our deferred revenue balance consists of the unrecognized portion of service revenue from FortiGuard and other security subscriptions and FortiCare technical support service contracts, which is recognized as revenue ratably over the service term. We monitor our deferred revenue balance, short term and total deferred revenue growth and the mix of short-term and long-term deferred revenue because deferred revenue represents a significant portion of free cash flow and of revenue to be recognized in future periods. Deferred revenue was $5.74 billion as of December 31, 2023, an increase of $1.09 billion, or 24%, from December 31, 2022. Short term deferred revenue was $2.85 billion as of December 31, 2023, an increase of $499.4 million, or 21%, from December 31, 2022.
Billings (non-GAAP). We define billings as revenue recognized in accordance with generally accepted accounting principles in the United States (“GAAP”) plus the change in deferred revenue from the beginning to the end of the period, less any deferred revenue balances acquired from business combination(s) and adjustment due to adoption of new accounting standard during the period. We consider billings to be a useful metric for management and investors because billings drive current and future revenue, which is an important indicator of the health and viability of our business. There are several
53
limitations related to the use of billings instead of GAAP revenue. First, billings include amounts that have not yet been recognized as revenue and are impacted by the term of FortiGuard security subscription and FortiCare and other support agreements. Second, we may calculate billings in a manner that is different from peer companies that report similar financial measures. Management accounts for these limitations by providing specific information regarding GAAP revenue and evaluating billings together with GAAP revenue. Total billings were $6.40 billion in 2023, an increase of 14% compared to $5.59 billion in 2022.
During 2023, our billings and product revenue fell below our expectations due to a slowdown in secure networking growth, along with challenges in sales execution and marketing programs. In addition, we believe secure networking growth in the near term may be below historical growth rates. In response to the slowdown in the secure networking market, we plan to shift our marketing and sales teams’ focus towards the faster growing SecOps and Unified SASE markets over the next several quarters, while maintaining our continued focus on leading innovation in secure networking and the convergence of security and networking.
We anticipate limited near-term growth in the secure networking market and shifting sales and marketing focus may result in certain risks, including go-to-market challenges, increased sales turnover and other execution challenges.
Our backlog has fluctuated over past quarters and any decrease in growth or negative growth of in-quarter billings and revenue may not be reflected by our aggregate billings and revenue. As we have fulfilled, shipped and billed during a quarter to satisfy backlog, this has increased our aggregate billings and revenue during any particular quarter, and as the supply chain challenges normalize, the growth comparisons versus prior quarters where backlog contributed more to billings have become more challenging.
A reconciliation of revenue, the most directly comparable financial measure calculated and presented in accordance with GAAP, to billings is provided below:
| Year Ended December 31, | |||||||||||||||||
| 2023 | 2022 | 2021 | |||||||||||||||
| (in millions) | |||||||||||||||||
| Billings: | |||||||||||||||||
| Revenue | $ | 5,304.8 | $ | 4,417.4 | $ | 3,342.2 | |||||||||||
| Add: Change in deferred revenue | 1,094.7 | 1,187.4 | 847.6 | ||||||||||||||
| Less: Deferred revenue balance acquired in business combinations | — | (10.8) | (4.1) | ||||||||||||||
| Less: Adjustment due to adoption of ASU 2021-08 | — | — | (4.3) | ||||||||||||||
| Total billings (non-GAAP) | $ | 6,399.5 | $ | 5,594.0 | $ | 4,181.4 | |||||||||||
Free cash flow (non-GAAP). We define free cash flow as net cash provided by operating activities minus purchases of property and equipment and excluding any significant non-recurring items. We believe free cash flow to be a liquidity measure that provides useful information to management and investors about the amount of cash generated by the business that, after capital expenditures, can be used for strategic opportunities, including repurchasing outstanding common stock, investing in our business, making strategic acquisitions, and strengthening the balance sheet. A limitation of using free cash flow rather than the GAAP measures of cash provided by or used in operating activities, investing activities, and financing activities is that free cash flow does not represent the total increase or decrease in the cash and cash equivalents balance for the period because it excludes cash flows from investing activities other than capital expenditures and cash flows from financing activities. Management accounts for this limitation by providing information about our capital expenditures and other investing and financing activities on the consolidated statements of cash flows and under “—Liquidity and Capital Resources” and by presenting cash flows from investing and financing activities in our reconciliation of free cash flow. In addition, it is important to note that other companies, including companies in our industry, may not use free cash flow, may calculate free cash flow in a different manner than we do or may use other financial measures to evaluate their performance, all of which could reduce the usefulness of free cash flow as a comparative measure. A reconciliation of net cash provided by operating activities, the most directly comparable financial measure calculated and presented in accordance with GAAP, to free cash flow is provided below:
54
| Year Ended December 31, | |||||||||||||||||
| 2023 | 2022 | 2021 | |||||||||||||||
| (in millions) | |||||||||||||||||
| Free Cash Flow: | |||||||||||||||||
| Net cash provided by operating activities | $ | 1,935.5 | $ | 1,730.6 | $ | 1,499.7 | |||||||||||
| Less: Purchases of property and equipment | (204.1) | (281.2) | (295.9) | ||||||||||||||
| Free cash flow (non-GAAP) | $ | 1,731.4 | $ | 1,449.4 | $ | 1,203.8 | |||||||||||
| Net cash provided by (used in) investing activities | $ | (649.3) | $ | 763.9 | $ | (1,325.1) | |||||||||||
| Net cash provided by (used in) financing activities | $ | (1,570.4) | $ | (2,130.3) | $ | 82.8 | |||||||||||
Components of Operating Results
Revenue. We generate the majority of our revenue from sales of our hardware and software products and amortization of amounts included in deferred revenue related to previous sales of FortiGuard security subscription and FortiCare technical support services. We also recognize revenue from cloud security solutions, professional services, and training.
Our total revenue is comprised of:
•Product revenue. Product revenue is primarily generated from sales of our physical and virtual machine appliances. The majority of our product revenue continues to be generated by our secure networking product lines. Product revenue also includes revenue from sales of unified SASE and SecOps technologies. As a percentage of total revenue, our product revenue has varied from quarter to quarter.
•Service revenue. Service revenue is generated primarily from FortiGuard security subscription services and FortiCare technical support services. We recognize revenue from FortiGuard security subscription and FortiCare technical support services ratably over the service term. Our typical contractual support and subscription term is one to five years. We also generate our revenue from other services, for which we recognize revenue as the services are provided, and cloud-based services, for which we recognize revenue as the services are delivered or on a monthly usage basis. As a percentage of total revenue, we continue to expect service revenue to be higher than product revenue. Our service revenue growth rate depends significantly on the growth of our customer base, the expansion of our service bundle offerings, the mix of our product revenue, pricing actions, the expansion and introduction of new service offerings, the attach rate of service contracts to new product sales, and the renewal of service contracts by our existing customers.
Our total cost of revenue is comprised of:
•Cost of product revenue. The majority of the cost of product revenue consists of third-party contract manufacturers’ costs and the costs of materials used in production. Our cost of product revenue also includes supplies, shipping costs, personnel costs associated with logistics and quality control, facility-related costs, excess and obsolete inventory costs, warranty costs and amortization of intangible assets. Personnel costs include compensation benefits and stock-based compensation.
•Cost of service revenue. Cost of service revenue is primarily comprised of personnel costs, third-party repair and contract fulfillment, data center costs, colocation expenses and cloud provider fees, supplies, facility-related costs and amortization of intangible assets.
Gross margin. Gross profit as a percentage of revenue, or gross margin, has been and will continue to be affected by a variety of factors, including the average sales price of our products, product costs, the mix of products sold and the mix of revenue between hardware products, software licenses and services and any excess inventory or other charges. Service revenue and software licenses have higher gross margins compared to hardware products. Overall gross margin in 2024 will be impacted by service and product revenue mix.
Operating expenses. Our operating expenses consist of research and development, sales and marketing and general and administrative expenses. Personnel costs are the most significant component of operating expenses and consist primarily of salaries, benefits, bonuses, sales commissions and stock-based compensation. We expect personnel costs to continue to increase in absolute dollars as we expand our workforce.
•Research and development. Research and development expense consists primarily of personnel costs. Additional research and development expenses include ASIC and system prototypes and certification-related
55
expenses, depreciation of property and equipment and facility-related expenses. The majority of our research and development is focused on software and hardware development. We record research and development expenses as incurred. As of December 31, 2023, approximately 80%, 8%, 4%, 3% and 3% of our research and development teams were located in North America, India, Japan, Taiwan and Israel, respectively. As of December 31, 2023, approximately two-thirds of our engineers worked on software development while the remainder worked on hardware development.
•Sales and marketing. Sales and marketing expense is the largest component of our operating expenses and primarily consists of personnel costs. Additional sales and marketing expenses include product marketing, public relations, field marketing and events and channel marketing programs (e.g., partner cooperative marketing arrangements), as well as travel, depreciation of property and equipment and facility-related expenses. We intend to hire additional personnel focused on sales and marketing and expand our sales and marketing efforts worldwide in order to capture market share.
•General and administrative. General and administrative expense consists of personnel costs, as well as professional fees, depreciation of property and equipment and software and facility-related expenses. General and administrative personnel include our executive, finance, human resources, information technology and legal organizations. Our professional fees principally consist of outside legal, auditing, tax, information technology and other consulting costs.
Interest income. Interest income consists primarily of interest earned on our cash equivalents and investments. Historically, our interest-bearing investments include corporate debt securities, certificates of deposit and term deposits, commercial paper, money market funds, U.S. government and agency securities and municipal bonds.
Interest expense. Interest expense consists of interest expense due to the senior notes and other miscellaneous interest expense.
Other expense—net. Other expense—net consists primarily of foreign exchange gains and losses related to foreign currency remeasurement, gains or losses due to the changes in fair value of our marketable equity securities, realized gains and losses of available-for-sale investments, net rental income from real estate, as well as the gain on the sale or the impairment of investments in privately held companies without readily determinable fair values, which are not accounted for under the equity method.
Provision for income taxes. We are subject to income taxes in the United States, as well as other tax jurisdictions or countries in which we conduct business. Earnings from our non-U.S. activities are subject to income taxes in local countries and may be subject to U.S. income taxes. Our effective tax rate differs from the U.S. statutory rate primarily due to foreign income subject to different tax rates than in the U.S., federal research and development tax credit, state income taxes, withholding taxes, excess tax benefits related to stock-based compensation expense and the tax impacts of the foreign-derived intangible income (“FDII”) deduction.
Loss from equity method investments. Loss from equity method investments consists of our proportionate share of the investees’ net loss, the amortization of any basis differences, as well as any other-than-temporary impairment (“OTTI”) when events or circumstances suggest that the carrying amount of the investment may be impaired.
Critical Accounting Policies and Estimates
Our discussion and analysis of our financial condition and results of operations are based upon our financial statements, which have been prepared in accordance with GAAP. These principles require us to make estimates and judgments that affect the reported amounts of assets, liabilities, revenue, cost of revenue and expenses, and related disclosures. We base our estimates on historical experience and on various other assumptions that we believe to be reasonable under the circumstances. To the extent that there are material differences between these estimates and our actual results, our future financial statements will be affected.
We believe that, of the significant accounting policies described in Note 1 to our consolidated financial statements included in Part II, Item 8 of this Annual Report on Form 10-K, the following accounting policies involve a greater degree of judgment and complexity. Accordingly, we believe these are the most critical to fully understand and evaluate our financial condition and results of operations.
56
Revenue Recognition
Revenues are recognized when control of goods or services is transferred to our customers, in an amount that reflects the consideration we expect to be entitled to in exchange for those goods or services.
We determine revenue recognition through the following steps:
•identification of a contract or contracts with a customer;
•identification of the performance obligations in a contract, including evaluation of performance obligations as to being distinct goods or services in a contract;
•determination of a transaction price;
•allocation of a transaction price to the performance obligations in a contract; and
•recognition of revenue when, or as, we satisfy a performance obligation.
Our sales contracts typically contain multiple deliverables, such as hardware, software license, security subscription, technical support services and other services, which are generally capable of being distinct and accounted for as separate performance obligations. Our hardware and software licenses have significant standalone functionalities and capabilities. Accordingly, the hardware and software licenses are distinct from the security subscription and technical support services, as a customer can benefit from the product without the services and the services are separately identifiable within a contract. We allocate a transaction price to each performance obligation based on relative standalone selling price. We establish standalone selling price using the prices charged for a deliverable when sold separately. If not observable through past transactions, we determine standalone selling price by considering multiple historical factors including, but not limited to, cost of products, gross margin objectives, pricing practices, geographies and the term of a service contract.
Deferred Contract Costs and Commission Expense
We defer contract costs that are recoverable and incremental to obtaining customer sales contracts. Contract costs, which primarily consist of sales commissions, are amortized on a systematic basis that is consistent with the transfer to the customer of the goods or services to which the asset relates. Costs for initial contracts that are not commensurate with commissions on renewal contracts are amortized on a straight-line basis over the period of benefit of five years. Estimates, assumptions, and judgments in accounting for deferred contract costs include, but are not limited to, identification of contract costs, anticipated billings and the expected period of benefit.
Business Combinations
We include the results of operations of the businesses that we acquire as of the respective dates of acquisition. We allocate the fair value of the purchase price of our business acquisitions to the tangible and intangible assets acquired and liabilities assumed based on their estimated fair values. The excess of the purchase price over the fair values of these identifiable assets and liabilities is recorded as goodwill. We often continue to gather additional information throughout the measurement period, and if we make changes to the amounts recorded, such changes are recorded in the period in which they are identified.
Contingent Liabilities
From time to time, we are involved in disputes, litigation and other legal actions. However, there are many uncertainties associated with any litigation, and these actions or other third-party claims against us may cause us to incur substantial settlement charges, which are inherently difficult to estimate and could adversely affect our results of operations. We periodically review significant claims and litigation matters for the probability of an adverse outcome. We accrue for a loss contingency if a loss is probable and the amount of the loss can be reasonably estimated. These accruals are generally based on a range of possible outcomes that require significant judgement. Estimates can change as individual claims develop. The actual liability in any such matters may be materially different from our estimates, which could result in the need to adjust our liability and record additional expenses.
Accounting for Income Taxes
We record income taxes using the asset and liability method, which requires the recognition of deferred tax assets and liabilities for the expected future tax consequences of events that have been recognized in our financial statements or tax returns. In addition, deferred tax assets are recorded for the future benefit of utilizing net operating losses and research and development credit carryforwards. Deferred tax assets and liabilities are measured using the currently enacted tax rates that
57
apply to taxable income in effect for the years in which those tax assets and liabilities are expected to be realized or settled. Valuation allowances are provided when necessary to reduce deferred tax assets to the amount expected to be realized.
As part of the process of preparing our consolidated financial statements, we are required to estimate our taxes in each of the jurisdictions in which we operate. We estimate actual current tax exposure together with assessing temporary differences resulting from differing treatment of items, such as accruals and allowances not currently deductible for tax purposes. These differences result in deferred tax assets, which are included in our consolidated balance sheets. In general, deferred tax assets represent future tax benefits to be received when certain expenses previously recognized in our consolidated statements of income become deductible expenses under applicable income tax laws, or loss or credit carryforwards are utilized.
In assessing the realizability of deferred tax assets, management considers whether it is more likely than not that some portion or all of the deferred tax assets will be realized. The ultimate realization of deferred tax assets is dependent upon the generation of future taxable income during the periods in which those temporary differences become deductible. We continue to assess the need for a valuation allowance on the deferred tax assets by evaluating both positive and negative evidence that may exist. Any adjustment to the valuation allowance on deferred tax assets would be recorded in the consolidated statements of income for the period that the adjustment is determined to be required.
We recognize tax benefits from an uncertain tax position only if it is more likely than not, based on the technical merits of the position that the tax position will be sustained on examination by the tax authorities. The tax benefits recognized in the financial statements from such positions are then measured based on the largest benefit that has a greater than 50% likelihood of being realized upon ultimate settlement.
We have elected to account for the tax effect of the Global Intangible Low-Taxed Income (“GILTI”) as a current period expense.
58
Results of Operations
The following tables set forth our results of operations for the periods presented and as a percentage of our total revenue for those periods. The period-to-period comparison of financial results is not necessarily indicative of financial results to be achieved in future periods.
| Year Ended December 31, | |||||||||||||||||
| 2023 | 2022 | 2021 | |||||||||||||||
| (in millions) | |||||||||||||||||
| Consolidated Statements of Income Data: | |||||||||||||||||
| Revenue: | |||||||||||||||||
| Product | $ | 1,927.3 | $ | 1,780.5 | $ | 1,255.0 | |||||||||||
| Service | 3,377.5 | 2,636.9 | 2,087.2 | ||||||||||||||
| Total revenue | 5,304.8 | 4,417.4 | 3,342.2 | ||||||||||||||
| Cost of revenue: | |||||||||||||||||
| Product | 763.6 | 691.3 | 487.7 | ||||||||||||||
| Service | 473.6 | 393.6 | 295.3 | ||||||||||||||
| Total cost of revenue | 1,237.2 | 1,084.9 | 783.0 | ||||||||||||||
| Gross profit: | |||||||||||||||||
| Product | 1,163.7 | 1,089.2 | 767.3 | ||||||||||||||
| Service | 2,903.9 | 2,243.3 | 1,791.9 | ||||||||||||||
| Total gross profit | 4,067.6 | 3,332.5 | 2,559.2 | ||||||||||||||
| Operating expenses: | |||||||||||||||||
| Research and development | 613.8 | 512.4 | 424.2 | ||||||||||||||
| Sales and marketing | 2,006.0 | 1,686.1 | 1,345.7 | ||||||||||||||
| General and administrative | 211.3 | 169.0 | 143.5 | ||||||||||||||
| Gain on intellectual property matter | (4.6) | (4.6) | (4.6) | ||||||||||||||
| Total operating expenses | 2,826.5 | 2,362.9 | 1,908.8 | ||||||||||||||
| Operating income | 1,241.1 | 969.6 | 650.4 | ||||||||||||||
| Interest income | 119.7 | 17.4 | 4.5 | ||||||||||||||
| Interest expense | (21.0) | (18.0) | (14.9) | ||||||||||||||
| Other expense—net | (6.1) | (13.5) | (11.6) | ||||||||||||||
Income before income taxes and loss from equity method investments | 1,333.7 | 955.5 | 628.4 | ||||||||||||||
| Provision for income taxes | 143.8 | 30.8 | 14.1 | ||||||||||||||
Loss from equity method investments | (42.1) | (68.1) | (7.6) | ||||||||||||||
| Net income including non-controlling interests | 1,147.8 | 856.6 | 606.7 | ||||||||||||||
| Less: net loss attributable to non-controlling interests, net of tax | — | (0.7) | (0.1) | ||||||||||||||
| Net income attributable to Fortinet, Inc. | $ | 1,147.8 | $ | 857.3 | $ | 606.8 | |||||||||||
59
| Year Ended December 31, | |||||||||||||||||
| 2023 | 2022 | 2021 | |||||||||||||||
| (as percentage of revenue) | |||||||||||||||||
| Revenue: | |||||||||||||||||
| Product | 36 | % | 40 | % | 38 | % | |||||||||||
| Service | 64 | 60 | 62 | ||||||||||||||
| Total revenue | 100 | 100 | 100 | ||||||||||||||
| Cost of revenue: | |||||||||||||||||
| Product | 14 | 16 | 15 | ||||||||||||||
| Service | 9 | 9 | 9 | ||||||||||||||
| Total cost of revenue | 23 | 25 | 23 | ||||||||||||||
| Gross margin: | |||||||||||||||||
| Product | 60 | 61 | 61 | ||||||||||||||
| Service | 86 | 85 | 86 | ||||||||||||||
| Total gross margin | 77 | 75 | 77 | ||||||||||||||
| Operating expenses: | |||||||||||||||||
| Research and development | 12 | 12 | 13 | ||||||||||||||
| Sales and marketing | 38 | 38 | 40 | ||||||||||||||
| General and administrative | 4 | 4 | 4 | ||||||||||||||
| Gain on intellectual property matter | — | — | — | ||||||||||||||
| Total operating expenses | 53 | 53 | 57 | ||||||||||||||
| Operating margin | 23 | 22 | 19 | ||||||||||||||
| Interest income | 2 | — | — | ||||||||||||||
| Interest expense | — | — | — | ||||||||||||||
| Other expense—net | — | — | — | ||||||||||||||
Income before income taxes and loss from equity method investments | 25 | 22 | 19 | ||||||||||||||
| Provision for income taxes | 3 | 1 | — | ||||||||||||||
Loss from equity method investments | (1) | (2) | — | ||||||||||||||
| Net income including non-controlling interests | 22 | 19 | 18 | ||||||||||||||
| Less: net loss attributable to non-controlling interests, net of tax | — | — | — | ||||||||||||||
| Net income attributable to Fortinet, Inc. | 22 | % | 19 | % | 18 | % | |||||||||||
| Percentages have been rounded for presentation purposes and may differ from unrounded results. | |||||||||||||||||
Discussion regarding our financial condition and results of operations for 2022 as compared to 2021 can be found in Item 7 of our Annual Report on Form 10-K for the fiscal year ended December 31, 2022, filed with the SEC on February 24, 2023.
60
2023 and 2022
Revenue
| Year Ended December 31, | |||||||||||||||||||||||||||||||||||
| 2023 | 2022 | ||||||||||||||||||||||||||||||||||
| Amount | % of Revenue | Amount | % of Revenue | Change | % Change | ||||||||||||||||||||||||||||||
| (in millions, except percentages) | |||||||||||||||||||||||||||||||||||
| Revenue: | |||||||||||||||||||||||||||||||||||
| Product | $ | 1,927.3 | 36 | % | $ | 1,780.5 | 40 | % | $ | 146.8 | 8 | % | |||||||||||||||||||||||
| Service | 3,377.5 | 64 | 2,636.9 | 60 | 740.6 | 28 | |||||||||||||||||||||||||||||
| Total revenue | $ | 5,304.8 | 100 | % | $ | 4,417.4 | 100 | % | $ | 887.4 | 20 | % | |||||||||||||||||||||||
| Revenue by geography: | |||||||||||||||||||||||||||||||||||
| Americas | $ | 2,175.2 | 41 | % | $ | 1,785.0 | 41 | % | $ | 390.2 | 22 | % | |||||||||||||||||||||||
| EMEA | 2,072.9 | 39 | 1,691.8 | 38 | 381.1 | 23 | |||||||||||||||||||||||||||||
| APAC | 1,056.7 | 20 | 940.6 | 21 | 116.1 | 12 | |||||||||||||||||||||||||||||
| Total revenue | $ | 5,304.8 | 100 | % | $ | 4,417.4 | 100 | % | $ | 887.4 | 20 | % | |||||||||||||||||||||||
Total revenue increased $887.4 million, or 20%, in 2023 compared to 2022. We continued to experience large organic revenue growth (i.e., revenue growth excluding attribution from recent acquisitions) with diversification of revenue geographically, and across both customer and industry segments. Revenue from all regions grew, with the Americas contributing the largest portion of the increase on an absolute dollar basis and EMEA, contributing the largest portion of the increase on a percentage basis.
Product revenue increased $146.8 million, or 8%, in 2023 compared to 2022. Product revenue growth was impacted by an elevated cyber threat landscape, the convergence of security and networking, the impact of certain historical pricing actions, improving supply chain dynamics, and changes in the backlog balance. Product revenue growth rates decreased from 42% in 2022 to 8% in 2023 partially due to overall softening macroeconomic conditions.
Service revenue increased $740.6 million, or 28%, in 2023 compared to 2022. Service revenue growth has accelerated over the past three years from 24% in 2021, to 26% in 2022 to 28% in 2023. Compared to 2022, FortiGuard security subscription revenue and other security subscription revenue increased $471.1 million, or 33% and FortiCare, other technical support and other revenues increased $269.5 million, or 22%, in 2023. The increases in service revenue were primarily due to the recognition of revenue from our growing deferred revenue balance related to FortiGuard and other security subscriptions delivered to on-premise and cloud-based environments. Security subscriptions outpaced technical support growth due to strength in secure networking subscriptions, SecOps and SASE.
Of the service revenue recognized in 2023, 67% was included in the deferred revenue balance as of December 31, 2022. Of the service revenue recognized in 2022, 66% was included in the deferred revenue balance as of December 31, 2021.
Of the service revenue recognized in each quarter of 2023, from 88% to 89% was included in deferred revenue as of the beginning of the respective quarter.
61
Cost of revenue and gross margin
Year Ended December 31, | |||||||||||||||||||||||
| 2023 | 2022 | Change | % Change | ||||||||||||||||||||
| (in millions, except percentages) | |||||||||||||||||||||||
| Cost of revenue: | |||||||||||||||||||||||
| Product | $ | 763.6 | $ | 691.3 | $ | 72.3 | 11 | % | |||||||||||||||
| Service | 473.6 | 393.6 | 80.0 | 20 | |||||||||||||||||||
| Total cost of revenue | $ | 1,237.2 | $ | 1,084.9 | $ | 152.3 | 14 | % | |||||||||||||||
| Gross margin (%): | |||||||||||||||||||||||
| Product | 60.4 | % | 61.2 | % | |||||||||||||||||||
| Service | 86.0 | % | 85.1 | % | |||||||||||||||||||
| Total gross margin | 76.7 | % | 75.4 | % | |||||||||||||||||||
Percentages have been rounded for presentation purposes and may differ from unrounded results. | |||||||||||||||||||||||
Total gross margin increased 1.3 percentage points in 2023 compared to 2022, primarily driven by a shift in the revenue mix and increased service gross margin, partially offset by decreased product gross margin. Revenue mix shifted by 4.0 percentage points from product revenue to service revenue, as a percentage of total revenue.
Product gross margin decreased 0.8 percentage points in 2023 compared to 2022, primarily due to inventory related reserves expense, partially offset by lower expedite fees and freight costs and a shift in revenue mix from hardware to software. Cost of product revenue was comprised primarily of third-party contract manufacturers’ costs, costs of materials used in production and inventory reserves.
Service gross margin increased 0.9 percentage points in 2023 compared to 2022, primarily driven by pricing actions in earlier periods and benefited from the mix shift towards higher margin security subscription services. Cost of service revenue was comprised primarily of personnel costs, third-party repair and contract fulfillment, data center costs, colocation expenses and cloud hosting, supplies and facility-related costs.
Operating expenses
| Year Ended December 31, | Change | % Change | |||||||||||||||||||||||||||||||||
| 2023 | 2022 | ||||||||||||||||||||||||||||||||||
| Amount | % of Revenue | Amount | % of Revenue | ||||||||||||||||||||||||||||||||
| (in millions, except percentages) | |||||||||||||||||||||||||||||||||||
| Operating expenses: | |||||||||||||||||||||||||||||||||||
| Research and development | $ | 613.8 | 12 | % | $ | 512.4 | 12 | % | $ | 101.4 | 20 | % | |||||||||||||||||||||||
| Sales and marketing | 2,006.0 | 38 | 1,686.1 | 38 | 319.9 | 19 | |||||||||||||||||||||||||||||
| General and administrative | 211.3 | 4 | 169.0 | 4 | 42.3 | 25 | |||||||||||||||||||||||||||||
| Gain on intellectual property matter | (4.6) | — | (4.6) | — | — | — | |||||||||||||||||||||||||||||
| Total operating expenses | $ | 2,826.5 | 53 | % | $ | 2,362.9 | 53 | % | $ | 463.6 | 20 | % | |||||||||||||||||||||||
Percentages have been rounded for presentation purposes and may differ from unrounded results. | |||||||||||||||||||||||||||||||||||
Research and development
Research and development expense increased $101.4 million, or 20%, in 2023 compared to 2022, primarily due to an increase of $74.3 million in personnel-related costs as a result of increased headcount and compensation rates to support the development of new products and continued enhancements to our existing products. In addition, non-personnel-related product development costs increased $13.8 million and depreciation expense and other occupancy-related expense increased $11.4 million. We currently intend to continue to invest in our research and development organization, and expect research and development expense to increase in absolute dollars in 2024.
62
Sales and marketing
Sales and marketing expense increased $319.9 million, or 19%, in 2023 compared to 2022, primarily due to an increase of $244.3 million in personnel-related costs. We increased our sales and pipeline generation capacity. The increase in headcount is expected to help drive global market revenue increases. In addition, marketing-related expenses increased $23.5 million, travel expense increased $20.7 million and depreciation expense and other occupancy-related expense increased $18.4 million. We currently intend to continue to make investments in sales and marketing resources, which are critical to support our future growth, and expect sales and marketing expense to increase in absolute dollars in 2024.
General and administrative
General and administrative expense increased $42.3 million, or 25%, in 2023 compared to 2022, primarily due to an increase of $19.2 million in professional services fees, an increase of $14.6 million in personnel-related costs and an increase of $3.4 million in provision for expected credit losses. We currently expect general and administrative expense to increase in absolute dollars in 2024.
Operating income and margin
We generated operating income of $1.24 billion in 2023, an increase of $271.5 million, or 28%, compared to $969.6 million in 2022. Operating income as a percentage of revenue increased to 23.4% in 2023 compared to 21.9% in 2022. The increase in our operating margin primarily benefits from a 1.3 percentage points increase in gross margin and 0.4 percentage points decrease in sales and marketing expense as a percentage of revenue, partially offset by 0.2 percentage points increase in general and administrative expense as percentage of revenue.
Interest income, interest expense and other expense—net
| Year Ended December 31, | |||||||||||||||||||||||
| 2023 | 2022 | Change | % Change | ||||||||||||||||||||
| (in millions, except percentages) | |||||||||||||||||||||||
| Interest income | $ | 119.7 | $ | 17.4 | $ | 102.3 | 588 | % | |||||||||||||||
| Interest expense | (21.0) | (18.0) | (3.0) | 17 | % | ||||||||||||||||||
| Other expense—net | (6.1) | (13.5) | 7.4 | (55) | % | ||||||||||||||||||
Interest income increased $102.3 million in 2023 as compared to 2022, primarily as a result of higher interest rates and investment balances. Interest income varies depending on our average investment balances during the period, types and mix of investments, and market interest rates. Interest expense increased $3.0 million in 2023 as compared to 2022. Other expense—net decreased $7.4 million in 2023 as compared to 2022 due to an $8.7 million lower loss on marketable equity securities and a $1.0 million increase of net rental income from real estate, partially offset by a $2.4 million increase of foreign exchange losses.
Provision for income taxes
| Year Ended December 31, | Change | % Change | |||||||||||||||||||||
| 2023 | 2022 | ||||||||||||||||||||||
| (in millions, except percentages) | |||||||||||||||||||||||
| Provision for income taxes | $ | 143.8 | $ | 30.8 | $ | 113.0 | 367 | % | |||||||||||||||
| Effective tax rate (%) | 11 | % | 3 | % | |||||||||||||||||||
Our provision for income taxes for 2023 reflects an effective tax rate of 11%, compared to an effective tax rate of 3% for 2022. The provision for income taxes for 2023 was comprised primarily of a $302.4 million tax expense related to U.S. federal and state income taxes, other foreign income taxes, foreign withholding taxes and unrecognized tax benefits. The provision was partially offset by excess tax benefits of $55.1 million from stock-based compensation expense, a tax benefit of $89.5 million from the FDII deduction, and a tax benefit of $14.0 million from federal research and development tax credits.
Our provision for income taxes for 2022 reflects an effective tax rate of 3%, compared to an effective tax rate of 2% for 2021. The provision for income taxes for 2022 was comprised primarily of a $233.4 million tax expense related to U.S. federal and state income taxes, other foreign income taxes, foreign withholding taxes and unrecognized tax benefits. The provision was partially offset by excess tax benefits of $75.8 million from stock-based compensation expense, a tax benefit of $115.2 million from the FDII deduction, and a tax benefit of $11.6 million from federal research and development tax credits.
63
Loss from Equity Method Investments
| Year Ended December 31, | Change | % Change | |||||||||||||||||||||
| 2023 | 2022 | ||||||||||||||||||||||
| (in millions, except percentages) | |||||||||||||||||||||||
Loss from equity method investments | $ | (42.1) | $ | (68.1) | $ | 26.0 | (38) | % | |||||||||||||||
Loss from equity method investments decreased $26.0 million in 2023 as compared to 2022, as our proportionate share of Linksys’ financial results including our share of the amortization of the basis differences improved over the same period last year. Our loss related to Linksys in fiscal 2022 totaled $68.1 million, comprised our proportionate share of Linksys’ financial results as well as the amortization of the basis differences of $45.9 million, which included a $17.5 million charge in connection with a valuation allowance established on deferred tax assets at Linksys, and the OTTI charge of $22.2 million recorded during the three months ended December 31,2022.
Seasonality, Cyclicality and Quarterly Revenue Trends
Our quarterly results reflect a pattern of increased customer buying at year-end, which has positively impacted billings and product revenue activity in the fourth quarter. In the first quarter, we generally experience lower sequential customer product buying, followed by an increase in buying in the second and third quarters. Although these seasonal factors may be common in the technology sector, historical patterns should not be considered a reliable indicator of our future sales activity or performance. On a quarterly basis, we have usually generated the majority of our product revenue in the final month of each quarter and a significant amount in the last two weeks of each quarter. We believe this is due to customer buying patterns typical in this industry.
Our quarterly revenue over the past two years has increased sequentially each quarter within the year.
Total gross margin has fluctuated on a quarterly basis primarily due to the relative product and service mix. Product gross margin varies based on the types of products sold, their cost profile and their average selling prices. Service gross margin is impacted by revenue growth and our personnel-related costs, third-party repair and contract fulfillment, data center, colocation fees, cloud hosting, supplies, facility-related costs and foreign currency fluctuations.
Liquidity and Capital Resources
| As of December 31, | |||||||||||||||||
| 2023 | 2022 | 2021 | |||||||||||||||
| (in millions) | |||||||||||||||||
| Cash and cash equivalents | $ | 1,397.9 | $ | 1,682.9 | $ | 1,319.1 | |||||||||||
| Short-term and long-term investments | 1,021.5 | 548.1 | 1,634.8 | ||||||||||||||
| Marketable equity securities | 21.0 | 25.5 | 38.6 | ||||||||||||||
| Total cash, cash equivalents, investments and marketable equity securities | $ | 2,440.4 | $ | 2,256.5 | $ | 2,992.5 | |||||||||||
| Working capital | $ | 709.3 | $ | 732.0 | $ | 1,282.5 | |||||||||||
| Year Ended December 31, | |||||||||||||||||
| 2023 | 2022 | 2021 | |||||||||||||||
| (in millions) | |||||||||||||||||
| Net cash provided by operating activities | $ | 1,935.5 | $ | 1,730.6 | $ | 1,499.7 | |||||||||||
| Net cash provided by (used in) investing activities | (649.3) | 763.9 | (1,325.1) | ||||||||||||||
| Net cash provided by (used in) financing activities | (1,570.4) | (2,130.3) | 82.8 | ||||||||||||||
| Effect of exchange rate changes on cash and cash equivalents | (0.8) | (0.4) | (0.1) | ||||||||||||||
| Net increase (decrease) in cash and cash equivalents | $ | (285.0) | $ | 363.8 | $ | 257.3 | |||||||||||
Liquidity and capital resources are primarily impacted by our operating activities, proceeds from issuance of our investment grade debt, as well as cash used on stock repurchases, real estate purchases and other capital expenditures, investments in various companies and business acquisitions.
64
In recent years, we have received significant capital resources from our billings to customers, issuance of investment grade debt and, to some extent, from the exercise of stock options by our employees. Additional increases in billings may depend on a number of factors, including demand for and availability of our products and services, competition, pricing actions, market or industry changes, macroeconomic events such as rising inflation and interest rates, economic strength, supply chain capacity and disruptions, international conflicts, including the war in Ukraine and the Israel-Hamas war, and our ability to execute. We expect proceeds from the exercise of stock options in future years to be impacted by the increased mix of restricted stock units and performance stock units versus stock options granted to our employees and to vary based on our share price. We expect our cash tax payments to increase as a result of a provision in the Tax Cuts and Jobs Act of 2017 requiring taxpayers to capitalize and amortize research and development expenses for tax purposes, other tax law changes and our expected growth.
In February 2023, our board of directors approved an extension of the Repurchase Program to February 29, 2024. In April 2023 and July 2023, our board of directors approved $1.0 billion and $500.0 million increases in the authorized stock repurchase amount under the Repurchase Program, respectively, bringing the aggregate amount authorized to be repurchased to $6.75 billion. In 2023, we repurchased 27.2 million shares of common stock under the Repurchase Program for an aggregate purchase price of $1.50 billion. As of December 31, 2023, $529.1 million remained available for future share repurchases under the Repurchase Program. In January 2024, our board of directors approved a $500.0 million increase in the authorized stock repurchase amount under the Repurchase Program, bringing the aggregate amount authorized to be repurchased to $7.25 billion of our outstanding common stock. In February 2024, our board of directors approved an extension of the Repurchase Program to February 28, 2025. As of February 23, 2024, approximately $1.03 billion remained available for future share repurchases.
In March 2021, we issued $1.0 billion aggregate principal amount of senior notes, consisting of $500.0 million aggregate principal amount of 1.0% notes due March 15, 2026 and $500.0 million aggregate principal amount of 2.2% notes due March 15, 2031, in an underwritten registered public offering. We do not currently intend to retire these senior notes early. Refer to Note 11. Debt in Part II, Item 8 of this Annual Report on Form 10-K for information on the senior notes.
We expect to continue to increase our data centers, PoPs, office and warehouse capacity to support growth and the expansion of existing services or introduction of new services. As we purchase new properties, we will work to incorporate these properties into the environmental goals we have established. We estimate 2024 capital expenditures to be between $370.0 million and $420.0 million.
Our principal commitments consist of obligations under our senior notes, inventory purchase and other contractual commitments. As of December 31, 2023, the long-term debt, net of unamortized discount and debt issuance costs, was $992.3 million. $500.0 million in aggregate principal amount of senior notes is due on March 15, 2026 and $500.0 million in aggregate principal amount of senior notes is due on March 15, 2031. In addition, we enter into non-cancellable agreements with contract manufacturers to procure inventory based on our requirements in order to reduce manufacturing lead times, plan for adequate component supply or incentivize suppliers to deliver. In certain instances, these agreements allow us the option to reschedule and adjust our requirements based on our business needs prior to firm orders being placed. In 2023, we have seen supply chain constraints gradually improve as we continued to work with contract manufacturers and component suppliers to decrease and optimize our non-cancellable inventory purchase commitments. Inventory purchase commitments as of December 31, 2023, were $637.3 million, a decrease of $697.7 million compared to $1.34 billion as of December 31, 2022. We estimate payments of $381.5 million due on or before December 31, 2024 related to these commitments. We also have open purchase orders and contractual obligations in the ordinary course of business for which we have not received goods or services. As of December 31, 2023, we had $66.9 million in other contractual commitments having a remaining term in excess of one year that are non-cancelable.
As of December 31, 2023, our cash, cash equivalents and short-term and long-term investments of $2.44 billion were invested primarily in deposit accounts, commercial paper, corporate debt securities, U.S. government and agency securities, certificates of deposit and term deposits, money market funds, municipal bonds. It is our investment policy to invest excess cash in a manner that preserves capital, provides liquidity and generates return without significantly increasing risk. We do not enter into investments for trading or speculative purposes.
The amount of cash, cash equivalents and investments held by our international subsidiaries was $199.9 million and $218.1 million as of December 31, 2023 and 2022, respectively.
We believe that our existing cash and cash equivalents and cash flow from operations will be sufficient for at least the next 12 months to meet our requirements and plans for cash, including meeting our working capital requirements and capital expenditure requirements. In the long term, our ability to support our requirements and plans for cash, including our working capital and capital expenditure requirements will depend on many factors, including our growth rate; the timing and amount of our share repurchases; the expansion of sales and marketing activities, pricing actions, the introduction of new and enhanced products and services offerings; the continuing market acceptance of our products; the timing and extent of spending to support development efforts; our investments in purchasing, developing or leasing real estate; cash tax payments and macroeconomic impacts such as rising inflation and interest rates; the war in Ukraine and the Israel-Hamas war; and instability in the global
65
banking system. Historically, we have required capital principally to fund our working capital needs, share repurchases, capital expenditures and acquisition activities. In the event that additional financing is required from outside sources, we may not be able to raise it on terms acceptable to us or at all.
During 2023, 2022 and 2021, we did not have any relationships with unconsolidated organizations or financial partnerships, such as structured finance or special purpose entities that would have been established for the purpose of facilitating off-balance sheet arrangements or other contractually narrow or limited purposes.
Operating Activities
Cash generated by operating activities is our primary source of liquidity. It is primarily comprised of net income, as adjusted for non-cash items and changes in operating assets and liabilities. Non-cash adjustments consist primarily of amortization of deferred contract costs, stock-based compensation and depreciation and amortization. Changes in operating assets and liabilities consist primarily of changes in deferred revenue, deferred contract costs, deferred tax assets, inventory and accounts receivable—net.
Our operating activities during 2023 provided cash flows of $1.94 billion as a result of the continued growth of our business, improved profitability and our ability to successfully manage our working capital. Changes in operating assets and liabilities primarily resulted from an increase in sales of our security subscription services and technical support services to new and existing customers, as reflected by an increase of $1.10 billion in our deferred revenue during 2023. In addition, changes in operating assets and liabilities were driven by an increase of $353.5 million in deferred contract costs, an increase of $301.9 million in deferred tax assets, an increase of $253.5 million in inventory and an increase of $146.4 million in accounts receivable—net.
Investing Activities
The changes in cash flows from investing activities primarily relate to timing of purchases, maturities and sales of investments, purchases of property and equipment, investments in various companies and business acquisitions. Historically, in making a lease-versus-ownership decision related to warehouse, office or data center space, we have considered various factors including financial metrics, expected long-term growth rates, time to market and changes in asset values. In certain cases, we have elected to own a facility if we believe that purchasing or developing buildings rather than leasing is more closely aligned with our long-term strategy. We expect to make similar decisions in the future. We may also make cash payments in connection with future business combinations.
During 2023, cash used in investing activities was $649.3 million, primarily driven by $437.0 million spent for purchases of investments, net of maturities and sales of investments, $204.1 million used for the purchases of property and equipment, and $8.5 million investment in a privately held company.
Financing Activities
The changes in cash flows from financing activities primarily relate to repurchase and retirement of common stock, and taxes paid related to net share settlement of equity awards, net of proceeds from the issuance of common stock under our Amended and Restated 2009 Equity Incentive Plan (the “2009 EIP”).
During 2023, cash used in financing activities was $1.57 billion, primarily driven by $1.50 billion used to repurchase shares of our common stock and $68.7 million used to pay tax withholding, net of proceeds from the issuance of common stock.
Recent Accounting Pronouncements
Refer to Note 1 of the notes to our consolidated financial statements in Part II, Item 8 of this Annual Report on Form 10-K for a full description of recently adopted accounting pronouncements.
ITEM 7A. Quantitative and Qualitative Disclosures about Market Risk
Investment and Interest Rate Fluctuation Risk
We are exposed to interest rate risks related to our investment portfolio and outstanding debt.
The primary objectives of our investment activities are to preserve principal, provide liquidity and maximize income without significantly increasing risk. Some of the securities we invest in are subject to market risk. This means that a change in prevailing interest rates may cause the principal amount of the investment to fluctuate. To minimize this risk, we maintain our
66
portfolio of cash, cash equivalents, investments and marketable equity securities in a variety of securities, including commercial paper, corporate debt securities, U.S. government and agency securities, certificates of deposit and term deposits, money market funds, municipal bonds and marketable equity securities. The risk associated with fluctuating interest rates is limited to our investment portfolio. A 10% decrease in interest rates would have resulted in a decrease of $12.0 million in our interest income in 2023, and would have resulted in an insignificant decrease in our interest income in 2022 and 2021
On March 5, 2021, we issued $1.0 billion aggregate principal amount of senior notes, consisting of $500.0 million aggregate principal amount of 1.0% notes due March 15, 2026 and $500.0 million aggregate principal amount of 2.2% notes due March 15, 2031. We carry the senior notes at face value less unamortized discount on our consolidated balance sheets. As the senior notes bear interest at a fixed rate, we have no financial statement risk associated with changes in interest rates. Refer to Note 11. Debt in Part II, Item 8 of this Annual Report on Form 10-K.
Foreign Currency Exchange Risk
Our sales contracts are primarily denominated in U.S. dollars and therefore substantially all of our revenue is not subject to foreign currency translation risk. However, a substantial portion of our operating expenses incurred outside the United States are denominated in foreign currencies and are subject to fluctuations due to changes in foreign currency exchange rates, particularly changes in the Euro (“EUR”), the Canadian dollar (“CAD”), the British pound (“GBP”) and the Japanese yen (“JPY”). To help protect against significant fluctuations in value and the volatility of future cash flows caused by changes in currency exchange rates, we engage in foreign currency risk management activities to minimize the impact of balance sheet items denominated in CAD. We do not use these contracts for speculative or trading purposes. All of the derivative instruments are with high quality financial institutions and we monitor the credit worthiness of these parties. These contracts typically have a maturity of one month and settle on the last day of each month. We record changes in the fair value of forward exchange contracts related to balance sheet accounts in other expense—net in the consolidated statements of income. We recognized an expense of $7.0 million in 2023 due to foreign currency transaction losses.
Our use of forward exchange contracts is intended to reduce, but not eliminate, the impact of currency exchange rate movements. Our forward exchange contracts are relatively short-term in nature and are focused on the CAD. Long-term material changes in the value of the U.S. dollar against other foreign currencies, such as the EUR, GBP and JPY could adversely impact our operating expenses in the future. We assessed the risk of loss in fair values from the impact of hypothetical changes in foreign currency exchange rates. For foreign currency exchange rate risk, a 10% increase or decrease of foreign currency exchange rates against the U.S. dollar with all other variables held constant would have resulted in a $14.2 million change in the value of our foreign currency cash balances as of December 31, 2023.
Inflation Risk
Our monetary assets, consisting primarily of cash, cash equivalents and short-term investments, are not affected significantly by inflation because they are predominantly short-term. We believe the impact of inflation on replacement costs of equipment, furniture and leasehold improvements will not materially affect our operations. The rate of inflation, however, affects our cost of revenue and expenses, such as those for employee compensation, which may not be readily recoverable in the price of products and services offered by us.
67
ITEM 8. Financial Statements and Supplementary Data
INDEX TO CONSOLIDATED FINANCIAL STATEMENTS
| Page | |||||
Report of Independent Registered Public Accounting Firm (PCAOB ID No. | |||||
68
REPORT OF INDEPENDENT REGISTERED PUBLIC ACCOUNTING FIRM
To the stockholders and the Board of Directors of Fortinet, Inc.
Opinion on the Financial Statements
We have audited the accompanying consolidated balance sheets of Fortinet, Inc. and subsidiaries (the “Company”) as of December 31, 2023 and 2022, the related consolidated statements of income, comprehensive income, equity (deficit), and cash flows, for each of the three years in the period ended December 31, 2023, and the related notes (collectively referred to as the “financial statements”). In our opinion, the financial statements present fairly, in all material respects, the financial position of the Company as of December 31, 2023 and 2022, and the results of its operations and its cash flows for each of the three years in the period ended December 31, 2023, in conformity with accounting principles generally accepted in the United States of America.
We have also audited, in accordance with the standards of the Public Company Accounting Oversight Board (United States) (PCAOB), the Company’s internal control over financial reporting as of December 31, 2023, based on criteria established in Internal Control – Integrated Framework (2013) issued by the Committee of Sponsoring Organizations of the Treadway Commission and our report dated February 23, 2024, expressed an unqualified opinion on the Company’s internal control over financial reporting.
Basis for Opinion
These financial statements are the responsibility of the Company’s management. Our responsibility is to express an opinion on the Company’s financial statements based on our audits. We are a public accounting firm registered with the PCAOB and are required to be independent with respect to the Company in accordance with the U.S. federal securities laws and the applicable rules and regulations of the Securities and Exchange Commission and the PCAOB.
We conducted our audits in accordance with the standards of the PCAOB. Those standards require that we plan and perform the audit to obtain reasonable assurance about whether the financial statements are free of material misstatement, whether due to error or fraud. Our audits included performing procedures to assess the risks of material misstatement of the financial statements, whether due to error or fraud, and performing procedures that respond to those risks. Such procedures included examining, on a test basis, evidence regarding the amounts and disclosures in the financial statements. Our audits also included evaluating the accounting principles used and significant estimates made by management, as well as evaluating the overall presentation of the financial statements. We believe that our audits provide a reasonable basis for our opinion.
Critical Audit Matter
The critical audit matter communicated below is a matter arising from the current-period audit of the financial statements that was communicated or required to be communicated to the audit committee and that (1) relates to accounts or disclosures that are material to the financial statements and (2) involved our especially challenging, subjective, or complex judgments. The communication of critical audit matters does not alter in any way our opinion on the financial statements, taken as a whole, and we are not, by communicating the critical audit matter below, providing a separate opinion on the critical audit matter or on the accounts or disclosures to which it relates.
Litigation – Refer to Notes 1 and 12 to the financial statements
Critical Audit Matter Description
The Company is involved in disputes, litigation, and other legal actions in the normal course of business. Claims from third parties may result in a requirement to pay substantial damages. The Company accrues for a loss contingency if a loss is probable, and the amount of the loss can be reasonably estimated. These accruals are generally based on a range of possible outcomes that require significant management judgement.
Given the inherent uncertainty of the outcome of current matters, auditing litigation contingencies required a high degree of auditor judgment and an increased extent of effort when performing audit procedures.
How the Critical Audit Matter Was Addressed in the Audit
Our audit procedures related to litigation contingencies included the following, among others:
•We tested the effectiveness of controls over management’s litigation contingency accrual analysis and assessment of matters
69
with potential impact.
•We obtained and evaluated legal letters from internal and external legal counsel, and we discussed the pending litigation matters with internal legal counsel.
•We made inquiries with management to obtain an understanding of litigation matters that the Company is currently undergoing.
•We read available court documents for litigation matters to search for contradictory information.
•We read Board of Directors meeting minutes to search for contradictory information.
•We evaluated the assumptions used by the Company to estimate the litigation contingency, including corroborating the assumptions with internal legal counsel.
/s/ DELOITTE & TOUCHE LLP
February 23, 2024
We have served as the Company’s auditor since 2002.
70
FORTINET, INC.
CONSOLIDATED BALANCE SHEETS
(in millions, except per share amounts)
| December 31, 2023 | December 31, 2022 | ||||||||||
| ASSETS | |||||||||||
| CURRENT ASSETS: | |||||||||||
| Cash and cash equivalents | $ | $ | |||||||||
| Short-term investments | |||||||||||
| Marketable equity securities | |||||||||||
Accounts receivable—Net of allowance for credit losses of $ | |||||||||||
| Inventory | |||||||||||
| Prepaid expenses and other current assets | |||||||||||
| Total current assets | |||||||||||
| LONG-TERM INVESTMENTS | |||||||||||
| PROPERTY AND EQUIPMENT—NET | |||||||||||
| DEFERRED CONTRACT COSTS | |||||||||||
| DEFERRED TAX ASSETS | |||||||||||
| GOODWILL | |||||||||||
| OTHER INTANGIBLE ASSETS—NET | |||||||||||
| OTHER ASSETS | |||||||||||
| TOTAL ASSETS | $ | $ | |||||||||
LIABILITIES AND STOCKHOLDERS’ DEFICIT | |||||||||||
| CURRENT LIABILITIES: | |||||||||||
| Accounts payable | $ | $ | |||||||||
| Accrued liabilities | |||||||||||
| Accrued payroll and compensation | |||||||||||
| Deferred revenue | |||||||||||
| Total current liabilities | |||||||||||
| DEFERRED REVENUE | |||||||||||
| LONG-TERM DEBT | |||||||||||
| OTHER LIABILITIES | |||||||||||
| Total liabilities | |||||||||||
COMMITMENTS AND CONTINGENCIES (Note 12) | |||||||||||
STOCKHOLDERS’ DEFICIT: | |||||||||||
Common stock, $ | |||||||||||
| Additional paid-in capital | |||||||||||
| Accumulated other comprehensive loss | ( | ( | |||||||||
| Accumulated deficit | ( | ( | |||||||||
Total stockholders’ deficit | ( | ( | |||||||||
TOTAL LIABILITIES AND STOCKHOLDERS’ DEFICIT | $ | $ | |||||||||
71
FORTINET, INC.
CONSOLIDATED STATEMENTS OF INCOME
(in millions, except per share amounts)
| Year Ended December 31, | |||||||||||||||||
| 2023 | 2022 | 2021 | |||||||||||||||
| REVENUE: | |||||||||||||||||
| Product | $ | $ | $ | ||||||||||||||
| Service | |||||||||||||||||
| Total revenue | |||||||||||||||||
| COST OF REVENUE: | |||||||||||||||||
| Product | |||||||||||||||||
| Service | |||||||||||||||||
| Total cost of revenue | |||||||||||||||||
| GROSS PROFIT: | |||||||||||||||||
| Product | |||||||||||||||||
| Service | |||||||||||||||||
| Total gross profit | |||||||||||||||||
| OPERATING EXPENSES: | |||||||||||||||||
| Research and development | |||||||||||||||||
| Sales and marketing | |||||||||||||||||
| General and administrative | |||||||||||||||||
| Gain on intellectual property matter | ( | ( | ( | ||||||||||||||
| Total operating expenses | |||||||||||||||||
| OPERATING INCOME | |||||||||||||||||
| INTEREST INCOME | |||||||||||||||||
| INTEREST EXPENSE | ( | ( | ( | ||||||||||||||
| OTHER EXPENSE—NET | ( | ( | ( | ||||||||||||||
INCOME BEFORE INCOME TAXES AND LOSS FROM EQUITY METHOD INVESTMENTS | |||||||||||||||||
| PROVISION FOR INCOME TAXES | |||||||||||||||||
LOSS FROM EQUITY METHOD INVESTMENTS | ( | ( | ( | ||||||||||||||
| NET INCOME INCLUDING NON-CONTROLLING INTERESTS | |||||||||||||||||
LESS: NET LOSS ATTRIBUTABLE TO NON-CONTROLLING INTERESTS, NET OF TAX | ( | ( | |||||||||||||||
| NET INCOME ATTRIBUTABLE TO FORTINET, INC. | $ | $ | $ | ||||||||||||||
Net income per share attributable to Fortinet, Inc. (Note 9): | |||||||||||||||||
| Basic | $ | $ | $ | ||||||||||||||
| Diluted | $ | $ | $ | ||||||||||||||
| Weighted-average shares used to compute net income per share attributable to Fortinet, Inc.: | |||||||||||||||||
| Basic | |||||||||||||||||
| Diluted | |||||||||||||||||
See notes to consolidated financial statements.
72
FORTINET, INC.
CONSOLIDATED STATEMENTS OF COMPREHENSIVE INCOME
(in millions)
| Year Ended December 31, | |||||||||||||||||
| 2023 | 2022 | 2021 | |||||||||||||||
| Net income including non-controlling interests | $ | $ | $ | ||||||||||||||
Other comprehensive income (loss): | |||||||||||||||||
| Change in foreign currency translation | ( | ( | ( | ||||||||||||||
| Change in unrealized gains (losses) on investments | ( | ( | |||||||||||||||
Less: tax provision (benefit) related to items of other comprehensive income (loss) | ( | ( | |||||||||||||||
Other comprehensive income (loss) | ( | ( | |||||||||||||||
| Comprehensive income including non-controlling interests | |||||||||||||||||
| Less: comprehensive income (loss) attributable to non-controlling interests | ( | ||||||||||||||||
| Comprehensive income attributable to Fortinet, Inc. | $ | $ | $ | ||||||||||||||
See notes to consolidated financial statements.
73
FORTINET, INC.
CONSOLIDATED STATEMENTS OF EQUITY (DEFICIT)
(in millions)
| Common Stock | Additional Paid-In Capital | Accumulated Other Comprehensive Income (Loss) | Accumulated Deficit | Non-Controlling Interests | Total Equity (Deficit) | ||||||||||||||||||||||||||||||||||||
| Shares | Amount | ||||||||||||||||||||||||||||||||||||||||
BALANCE—December 31, 2020 | $ | $ | $ | $ | ( | $ | $ | ||||||||||||||||||||||||||||||||||
| Issuance of common stock in connection with equity incentive plans - net of tax withholding | — | ( | — | — | — | ( | |||||||||||||||||||||||||||||||||||
Repurchase and retirement of common stock | ( | — | ( | — | ( | — | ( | ||||||||||||||||||||||||||||||||||
| Stock-based compensation expense | — | — | — | — | — | ||||||||||||||||||||||||||||||||||||
| Recognition of non-controlling interests upon business combination | — | — | — | — | — | ||||||||||||||||||||||||||||||||||||
| Net unrealized loss on investments - net of tax | — | — | — | ( | — | — | ( | ||||||||||||||||||||||||||||||||||
| Foreign currency translation adjustment | — | — | — | ( | — | ( | ( | ||||||||||||||||||||||||||||||||||
| Net income | — | — | — | — | ( | ||||||||||||||||||||||||||||||||||||
BALANCE—December 31, 2021 | ( | ( | |||||||||||||||||||||||||||||||||||||||
| Issuance of common stock in connection with equity incentive plans - net of tax withholding | — | ( | — | — | — | ( | |||||||||||||||||||||||||||||||||||
Repurchase and retirement of common stock | ( | — | ( | — | ( | — | ( | ||||||||||||||||||||||||||||||||||
| Stock-based compensation expense | — | — | — | — | — | ||||||||||||||||||||||||||||||||||||
| Acquisition of the non-controlling interests | — | — | — | — | ( | ( | |||||||||||||||||||||||||||||||||||
| Net unrealized loss on investments - net of tax | — | — | — | ( | — | — | ( | ||||||||||||||||||||||||||||||||||
| Foreign currency translation adjustment | — | — | — | ( | — | ( | |||||||||||||||||||||||||||||||||||
| Net income | — | — | — | — | ( | ||||||||||||||||||||||||||||||||||||
BALANCE—December 31, 2022 | ( | ( | ( | ||||||||||||||||||||||||||||||||||||||
| Issuance of common stock in connection with equity incentive plans - net of tax withholding | — | ( | — | — | — | ( | |||||||||||||||||||||||||||||||||||
Repurchase and retirement of common stock | ( | — | ( | — | ( | — | ( | ||||||||||||||||||||||||||||||||||
Excise tax on net stock repurchases | — | — | ( | — | — | — | ( | ||||||||||||||||||||||||||||||||||
| Stock-based compensation expense | — | — | — | — | — | ||||||||||||||||||||||||||||||||||||
Net unrealized gain on investments - net of tax | — | — | — | — | — | ||||||||||||||||||||||||||||||||||||
| Foreign currency translation adjustment | — | — | — | ( | — | ( | |||||||||||||||||||||||||||||||||||
| Net income | — | — | — | — | |||||||||||||||||||||||||||||||||||||
BALANCE—December 31, 2023 | $ | $ | $ | ( | $ | ( | $ | $ | ( | ||||||||||||||||||||||||||||||||
See notes to consolidated financial statements.
74
FORTINET, INC.
CONSOLIDATED STATEMENTS OF CASH FLOWS
(in millions)
| Year Ended December 31, | |||||||||||||||||
| 2023 | 2022 | 2021 | |||||||||||||||
| CASH FLOWS FROM OPERATING ACTIVITIES: | |||||||||||||||||
| Net income including non-controlling interests | $ | $ | $ | ||||||||||||||
| Adjustments to reconcile net income to net cash provided by operating activities: | |||||||||||||||||
| Stock-based compensation | |||||||||||||||||
| Amortization of deferred contract costs | |||||||||||||||||
| Depreciation and amortization | |||||||||||||||||
| Amortization of investment premiums (discounts) | ( | ||||||||||||||||
Loss from equity method investments | |||||||||||||||||
| Other | |||||||||||||||||
| Changes in operating assets and liabilities, net of impact of business combinations: | |||||||||||||||||
| Accounts receivable—net | ( | ( | ( | ||||||||||||||
| Inventory | ( | ( | ( | ||||||||||||||
| Prepaid expenses and other current assets | ( | ( | ( | ||||||||||||||
| Deferred contract costs | ( | ( | ( | ||||||||||||||
| Deferred tax assets | ( | ( | ( | ||||||||||||||
| Other assets | ( | ( | |||||||||||||||
| Accounts payable | ( | ( | |||||||||||||||
| Accrued liabilities | |||||||||||||||||
| Accrued payroll and compensation | |||||||||||||||||
| Other liabilities | ( | ( | |||||||||||||||
| Deferred revenue | |||||||||||||||||
| Net cash provided by operating activities | |||||||||||||||||
| CASH FLOWS FROM INVESTING ACTIVITIES: | |||||||||||||||||
| Purchases of investments | ( | ( | ( | ||||||||||||||
| Sales of investments | |||||||||||||||||
| Maturities of investments | |||||||||||||||||
| Purchases of property and equipment | ( | ( | ( | ||||||||||||||
Purchases of Investments in privately held companies | ( | ( | |||||||||||||||
| Payments made in connection with business combinations, net of cash acquired | ( | ( | |||||||||||||||
| Purchases of marketable equity securities | ( | ||||||||||||||||
| Other | |||||||||||||||||
| Net cash provided by (used in) investing activities | ( | ( | |||||||||||||||
| CASH FLOWS FROM FINANCING ACTIVITIES: | |||||||||||||||||
| Proceeds from long-term borrowings, net of discount and underwriting fees | |||||||||||||||||
| Payments for debt issuance costs | ( | ||||||||||||||||
| Payments of debt assumed in connection with business combination | ( | ||||||||||||||||
Repurchase and retirement of common stock | ( | ( | ( | ||||||||||||||
| Proceeds from issuance of common stock | |||||||||||||||||
| Taxes paid related to net share settlement of equity awards | ( | ( | ( | ||||||||||||||
| Other | ( | ( | ( | ||||||||||||||
| Net cash provided by (used in) financing activities | ( | ( | |||||||||||||||
| EFFECT OF EXCHANGE RATE CHANGES ON CASH AND CASH EQUIVALENTS | ( | ( | ( | ||||||||||||||
NET INCREASE (DECREASE) IN CASH AND CASH EQUIVALENTS | ( | ||||||||||||||||
| CASH AND CASH EQUIVALENTS—Beginning of year | |||||||||||||||||
| CASH AND CASH EQUIVALENTS—End of year | $ | $ | $ | ||||||||||||||
| SUPPLEMENTAL DISCLOSURES OF CASH FLOW INFORMATION: | |||||||||||||||||
| Cash paid for income taxes—net | $ | $ | $ | ||||||||||||||
| Operating lease liabilities arising from obtaining right-of-use assets | $ | $ | $ | ||||||||||||||
| NON-CASH INVESTING AND FINANCING ACTIVITIES: | |||||||||||||||||
| Transfers of evaluation units from inventory to property and equipment | $ | $ | $ | ||||||||||||||
| Liability for purchase of property and equipment | $ | $ | $ | ||||||||||||||
| Excise tax payable on net stock repurchases | $ | $ | $ | ||||||||||||||
Liability incurred in connection with business combinations | $ | $ | $ | ||||||||||||||
See notes to consolidated financial statements.
75
1. THE COMPANY AND SUMMARY OF SIGNIFICANT ACCOUNTING POLICIES
Business—Fortinet, Inc. (“Fortinet”) was incorporated in Delaware in 2000 and is a global leader in broad, integrated and automated cybersecurity solutions. Fortinet provides high performance cybersecurity solutions to a wide variety of businesses, such as large enterprises, communication service providers, government organizations and small to medium-sized enterprises. Fortinet’s cybersecurity solutions are designed to provide broad visibility and segmentation of the digital attack surface, through our integrated cybersecurity platform (the “Fortinet Security Fabric”) with automated protection, detection and response.
The amounts previously reported as Income tax liabilities are included in Other liabilities. Prior periods have been reclassified to conform with current period presentation.
Basis of Presentation and Preparation—The consolidated financial statements of Fortinet and its subsidiaries (collectively, “we,” “us”, or “our”) have been prepared in accordance with generally accepted accounting principles in the United States (“GAAP”). We consolidate all legal entities in which we have an absolute controlling financial interest. All intercompany transactions and balances have been eliminated in consolidation.
Use of Estimates—The preparation of consolidated financial statements in accordance with GAAP requires management to make estimates and assumptions that affect the amounts reported in the consolidated financial statements and accompanying notes. Such management estimates include, but are not limited to, the determination of contingent liabilities, the determination of our ability to exercise control or significant influence over our investees, the evaluation of the equity method investments for OTTI, the standalone selling price for our products and services, the period of benefit for deferred contract costs for commissions, stock-based compensation, inventory valuation and liability for non-cancellable inventory purchase commitments with contract manufacturers and component suppliers, the fair value of tangible and intangible assets acquired and liabilities assumed in business combinations, the measurement of liabilities for uncertain tax positions and deferred tax assets and liabilities, the assessment of recoverability of our goodwill and other long-lived assets, measurement of non-marketable equity securities and the determination of sales returns reserves. We base our estimates on historical experience and also on assumptions that we believe are reasonable. Actual results could differ materially from those estimates.
Concentration Risk—Financial instruments that subject us to concentrations of credit risk consist primarily of cash, cash equivalents, short-term and long-term investments, marketable equity securities and accounts receivable. Our cash balances are maintained as deposits with various large financial institutions in the United States and around the world. Balances in the United States typically exceed the amount of insurance provided on such deposits. We maintain our cash equivalents and investments in money market funds, corporate debt securities, U.S. government and agency securities, commercial paper, certificates of deposit and term deposits and municipal bonds with major financial institutions that our management believes are financially sound.
Our accounts receivable are derived from our customers in various geographic locations. We perform ongoing credit evaluations of our customers. We generally do not require collateral on accounts receivable, and we maintain reserves for estimated credit losses. See Note 16. Segment Information for distributor customers that accounted for 10% or more of our revenue or net accounts receivable.
We rely on a small number of manufacturing partners, with over 95 % of manufacturing in Taiwan and U.S., to manufacture our products, and some of the chips and other components of our products used by the contract manufacturers are available from limited or sole sources of supply. Our proprietary Application-Specific Integrated Circuits are built by contract manufacturers located in Japan and Taiwan; other integrated circuits are provided by other chip manufacturers.
Financial Instruments and Fair Value—We define fair value as the price that would be received from selling an asset, or paid to transfer a liability, in an orderly transaction between market participants at the measurement date. When determining the fair value measurements for assets and liabilities which are required to be recorded at fair value, we consider the principal or most advantageous market in which to transact and the market-based risk. We apply fair value accounting for all financial assets and liabilities and non-financial assets and liabilities that are recognized or disclosed at fair value in the financial statements on a recurring basis. Due to their short-term nature, the carrying amounts reported in the consolidated financial statements approximate the fair value for cash and cash equivalents, accounts receivable, accounts payable, accrued liabilities, and accrued payroll and compensation.
76
Comprehensive Income—Comprehensive income includes certain changes in equity from non-owner sources that are excluded from net income, specifically, cumulative foreign currency translation adjustments, unrealized gains and losses on available-for-sale investments and the related tax impacts.
Cash and Cash Equivalents—We consider all highly liquid investments, purchased with original maturities of three months or less, to be cash equivalents. Cash and cash equivalents consist of balances with banks and highly liquid investments in commercial paper, corporate debt, U.S. government and agency securities, term deposits and money market funds.
Available-for-Sale Investments—We hold investment grade securities consisting of corporate debt securities, U.S. government and agency securities, commercial paper, certificates of deposit and term deposits and municipal bonds that our management believes are financially sound. We classify our investments as available-for-sale (“AFS”) at the time of purchase, since it is our intent that these investments are available for current operations. Investments with original maturities greater than three months with a remaining maturity of less than one year from the consolidated balance sheet date are classified as short-term investments. Investments with remaining maturities greater than one year from the consolidated balance sheet date are classified as long-term investments.
Our AFS investments in debt securities are carried at estimated fair value with any unrealized gains and losses, net of taxes, included in accumulated other comprehensive income (loss) in the consolidated statements of equity (deficit). AFS debt securities with an amortized cost basis in excess of estimated fair value are assessed to determine what amount of that difference, if any, is caused by expected credit losses. An investment is impaired if the fair value of the investment is less than its cost. If the fair value of an investment is less than its amortized cost basis at the balance sheet date and if we do not intend to sell the investment, we consider available evidence to assess whether it is more likely than not that we will be required to sell the investment before the recovery of its amortized cost basis. We consult with our investment managers and consider available quantitative and qualitative evidence in evaluating, among other factors, general market conditions, the duration and extent to which the fair value is less than cost, and our ability to hold the investment. Once an impairment is determined to be attributable to credit-related factors, allowance for credit losses (i.e., the credit loss component) on AFS debt securities is recognized as credit loss expense, a charge in other expense—net, on our consolidated statements of income, and any remaining unrealized losses (i.e., the non-credit loss component), net of taxes, are included in accumulated other comprehensive income (loss) on our consolidated statements of equity (deficit).
We consider whether unrealized losses have resulted from a credit loss or other factors. The unrealized losses on our AFS debt securities as of December 31, 2023, 2022 and 2021 were caused by fluctuations in market value and interest rates as a result of the market conditions. We concluded that an allowance for credit losses was unnecessary as of December 31, 2023, 2022 and 2021 because (i) the decline in market value was attributable to changes in market conditions and not credit quality, and (ii) we concluded that neither do we intend to sell nor is it more likely than not that we will be required to sell these investments prior to recovery of their amortized cost basis. As a result, we had no credit losses recorded for the years ended December 31, 2023, 2022 and 2021.
We determine realized gains or losses on sale of AFS debt securities using the specific identification method to determine the cost basis of investments sold and record such gains or losses as other expense—net on the consolidated statements of income. We have elected to not record an allowance for credit losses for accrued interest for AFS investments in debt securities and will reverse the accrued interest against interest income in the period in which we determine the accrued interest to be uncollectible.
Marketable Equity Securities—Our marketable equity investments with readily determinable fair values are accounted for at fair value through net income. Realized gains and losses as well as changes in fair value of these securities are recognized and reported in other expense—net, and are determined using the specific identification method.
77
Investments in privately held companies—Our investments in privately held companies consist of investments in common stock or in-substance common stock. Our equity method investments provide us with the ability to exercise significant influence over the investees, but not an absolute controlling financial interest. These investments are accounted for under the equity method of accounting and were initially recorded at cost. Subsequently, we recognize our proportionate share of the entity’s net loss, the amortization of any basis differences, as well as any OTTI as gain or loss from these equity method investments in the consolidated statements of income and as an adjustment to the investment balance. We record our proportionate share of the results of these equity method investments on a three-month lag basis. We evaluate if there are material transactions or events that occur during the intervening period that materially affect the financial position or results of operations. As of December 31, 2023, we had two equity method investments, including our investment in Linksys. As of December 31, 2022, our investment in Linksys was our only equity method investment. As of December 31, 2023 and 2022, our equity method investments were recorded in other assets. Our remaining investments in privately held companies are recorded at cost and as of December 31, 2023 and 2022 were not material.
We evaluate our equity method investments at the end of each reporting period to determine whether events or changes in business circumstances indicate that the carrying value of the investments may not be recoverable. Evidence of a loss in value might include, but would not necessarily be limited to, absence of an ability to recover the carrying amount of the investments or inability of the investee to sustain an earnings capacity that would justify the carrying amount of the investments. This evaluation consists of several qualitative and quantitative factors including recent financial results, projected financial results and operating trends of the investees and other publicly available information that may affect the value of our investments.
Accounts receivable—Trade accounts receivable are recorded at the invoiced amount. Our accounts receivable balance is reduced by an allowance for expected credit losses. We measure expected credit losses of accounts receivable on a collective (pooled) basis, aggregating accounts receivable that are either current or no more than 60 days past due, and aggregating accounts receivable that are more than 60 days past due. We apply a credit-loss percentage to each of the pools that is based on our historical credit losses. We review whether each of our significant accounts receivable that is more than 60 days past due continues to exhibit similar risk characteristics with the other accounts receivable in the pool. If we determine that it does not, we evaluate it for expected credit losses on an individual basis.
Inventory—Inventory is recorded at the lower of cost or net realizable value. Cost is computed using the first-in, first-out method. Inventory costs comprise primarily of the cost of materials and other component parts as well as capitalized overhead. In assessing the ultimate recoverability of inventory, we make estimates regarding future customer demand, the timing of new product introductions, economic trends and market conditions. A write-down of inventory and a corresponding charge to cost of product revenue is recorded when inventory is determined to be in excess of anticipated demand or considered obsolete. At the point of the write-down loss recognition, a new, lower cost basis for that inventory is established, and subsequent changes in facts and circumstances do not result in the restoration or increase in that newly established cost basis. In addition, we record a liability for non-cancelable inventory purchase commitments with contract manufacturers and suppliers for quantities in excess of our future estimated demand forecasts. The expense related to such accrued liability for inventory purchase commitments is recorded in cost of product revenue on the consolidated statements of income.
78
Property and Equipment—Property and equipment are stated at cost less accumulated depreciation. We do not depreciate the allocated cost of land. Depreciation is computed using the straight-line method over the estimated useful lives of the assets:
| Estimated Useful Lives | |||||
| Building and building improvements | |||||
| Computer equipment and software | |||||
| Evaluation units | |||||
| Furniture and fixtures | |||||
| Leasehold improvements | Shorter of useful life or lease term | ||||
Business Combinations—We include the results of operations of the businesses that we acquire as of the respective dates of acquisition. We allocate the fair value of the purchase price of our business acquisitions to the tangible and intangible assets acquired and liabilities assumed, based on their estimated fair values. The excess of the purchase price over the fair values of these identifiable assets and liabilities is recorded as goodwill. Our estimates and assumptions are subject to change based on information existing at acquisition date but unknown to us, which may become known during the remainder of the measurement period, not to exceed 12 months from the acquisition date, and if we make changes to the amounts recorded, such amounts are recorded in the period in which they are identified.
Goodwill—Goodwill represents the excess of purchase consideration over the estimated fair value of net assets of businesses acquired in a business combination. Goodwill acquired in a business combination is not amortized, but instead tested for impairment at least annually during the fourth quarter, or sooner when circumstances indicate an impairment may exist. We perform a qualitative assessment in the fourth quarter of each year, or more frequently if indicators of potential impairment exist, to determine if any events or circumstances exist, such as an adverse change in business climate or a decline in the overall industry that would indicate that it would more likely than not reduce the fair value of a reporting unit below its carrying amount, including goodwill. If such evaluation indicates that it is more likely than not that the fair value of a reporting unit is less that its carrying amount, then the quantitative impairment test will be performed. Under the quantitative impairment test, if the carrying amount of a reporting unit exceeds its fair value, any excess is recognized as an impairment loss in goodwill, limited to the total amount of goodwill allocated to that reporting unit.
We performed our annual goodwill impairment assessment and did not identify any impairment indicators as a result of the review. As of December 31, 2023 and 2022, we had one reporting unit.
Other Intangible Assets—Intangible assets with finite lives are carried at cost, less accumulated amortization. Amortization is computed using the straight-line or accelerated method over the estimated economic lives of the assets, which range from to ten years .
Income Taxes—We record income taxes using the asset and liability method, which requires the recognition of deferred tax assets and liabilities for the expected future tax consequences of events that have been recognized in our financial statements or tax returns. In addition, deferred tax assets are recorded for the future benefit of utilizing net operating losses and research and development credit carryforwards. Deferred tax assets and liabilities are measured using the currently enacted tax rates that apply to taxable income in effect for the years in which those tax assets and liabilities are expected to be realized or settled. Valuation allowances are provided when necessary to reduce deferred tax assets to the amount expected to be realized.
As part of the process of preparing our consolidated financial statements, we are required to estimate our taxes in each of the jurisdictions in which we operate. We estimate actual current tax exposure together with assessing temporary differences resulting from differing treatment of items, such as accruals and allowances not currently deductible for tax purposes. These
79
differences result in deferred tax assets, which are included in our consolidated balance sheets. In general, deferred tax assets represent future tax benefits to be received when certain expenses previously recognized in our consolidated statements of income become deductible expenses under applicable income tax laws, or loss or credit carryforwards are utilized.
In assessing the realizability of deferred tax assets, management considers whether it is more likely than not that some portion or all of the deferred tax assets will be realized. The ultimate realization of deferred tax assets is dependent upon the generation of future taxable income during the periods in which those temporary differences become deductible. We continue to assess the need for a valuation allowance on the deferred tax assets by evaluating both positive and negative evidence that may exist. Any adjustment to the valuation allowance on deferred tax assets would be recorded in the consolidated statements of income for the period that the adjustment is determined to be required.
We recognize tax benefits from an uncertain tax position only if it is more likely than not, based on the technical merits of the position, that the tax position will be sustained on examination by the tax authorities. The tax benefits recognized in the financial statements from such positions are then measured based on the largest benefit that has a greater than 50% likelihood of being realized upon ultimate settlement.
Stock-Based Compensation—The fair value of restricted stock units (“RSUs”) is based on the closing market price of our common stock on the date of grant. We have elected to use the Black-Scholes-Merton (“Black-Scholes”) pricing model to determine the fair value of our employee stock options and the Monte Carlo simulation pricing model to determine the fair value of our performance stock units (“PSUs”). Stock-based compensation expense of our RSUs and options is amortized on a straight-line basis over the service period and stock-based compensation expense of our PSUs is amortized using a graded vesting method over the vesting period. We account for forfeitures of all stock-based payment awards when they occur.
Leases—We determine if an arrangement is a lease at inception. We evaluate the classification of leases at commencement and, as necessary, at modification. The right-of-use (“ROU”) assets and the short- and long-term lease liabilities from our operating leases are included in other assets, accrued liabilities and other liabilities in our consolidated balance sheets, respectively. The corresponding assets and, the short- and long-term lease liabilities from our finance leases are included in property and equipment, accrued liabilities and other liabilities in our consolidated balance sheets, respectively.
The ROU assets represent our right to use an underlying asset for the lease term. Lease liabilities represent our obligation to make lease payments under the lease. Operating lease ROU assets and liabilities are recognized at the lease commencement date based on the present value of lease payments over the lease term. The implicit rate within our operating leases is generally not determinable and therefore we use our incremental borrowing rate at the lease commencement date to determine the present value of lease payments. The determination of our incremental borrowing rate requires judgment. We determine our incremental borrowing rate for each lease using indicative bank borrowing rates, adjusted for various factors including level of collateralization, term and currency to align with the terms of a lease. The operating lease ROU asset also includes any lease prepayments and initial direct costs, net of lease incentives. Certain leases include options to extend or terminate the lease. An option to extend the lease is considered in connection with determining the ROU asset and lease liability when it is reasonably certain we will exercise that option. An option to terminate is considered unless it is reasonably certain we will not exercise the option.
We do not recognize lease liabilities or ROU assets for short-term leases (leases that, at the commencement date, have a lease term of 12 months or less and do not include an option to purchase the underlying asset that we are reasonably certain to exercise). We do not allocate the contract consideration for operating lease contracts with lease and non-lease components, and account for the lease and non-lease components as a single lease component.
Payments under our lease arrangements are primarily fixed; however, certain lease agreements contain variable payments, which are expensed as incurred and not included in the operating lease ROU assets and liabilities. Variable lease payments primarily include common area maintenance charges, real estate taxes, certain parking expense, utilities based on actual usage, and insurance costs. Lease expense for lease payments for our operating leases is recognized on a straight-line basis over the term of the lease. We begin recognizing rent expense on the date that a lessor makes an underlying asset that is subject to the lease available for our use. For our finance leases, we recognize amortization expense from the amortization of the corresponding assets and interest expense on the related lease liabilities.
80
Advertising Expense—Advertising costs are expensed when incurred and are included in operating expenses in the accompanying consolidated statements of income. Our advertising expenses were not material for any periods presented.
Research and Development Costs—Research and development costs are expensed as incurred.
Software Development Costs—The costs to develop software that is marketed have not been capitalized as we believe our current software development process is essentially completed concurrently with the establishment of technological feasibility. Such costs are expensed as incurred and included in research and development in our consolidated statements of income.
The costs to develop software for internal use are capitalized based on qualifying criteria. These costs consist of internal compensation related costs and external direct costs incurred during the application development stage. Such costs are amortized over the software’s estimated useful life. Internal use software development costs capitalized were not material for any periods presented.
Deferred Revenue—Deferred revenue consists of amounts that have been invoiced but that have not yet been recognized as revenue. Deferred revenue that will be recognized during the succeeding 12-month period is recorded as current deferred revenue and the remaining portion is recorded as non-current deferred revenue. The majority of deferred revenue is comprised of security subscription and technical support services which are invoiced upfront and delivered over 12 months or longer.
Revenue Recognition—Our revenue consists of product and service revenue. Revenues are recognized when control of these goods or services is transferred to our customers, in an amount that reflects the consideration we expect to be entitled to in exchange for those goods or services. We determine revenue recognition through the following steps:
•identification of a contract or contracts with a customer;
•identification of the performance obligations in a contract, including evaluation of performance obligations and evaluating the distinct goods or services in a contract;
•determination of a transaction price;
•allocation of a transaction price to the performance obligations in a contract; and
•recognition of revenue when, or as, we satisfy a performance obligation.
We derive a majority of product sales from Secure Networking hardware and associated security services which include a broad set of built-in security and networking features and functionalities, including firewall, next-generation firewall, secure web gateway, secure sockets layer (“SSL”) inspection, software-defined wide-area network, intrusion prevention, SSL data leak prevention, virtual private network, switch and wireless controller and wide area network edge.
We recognize product revenue upon shipment when control of the promised goods is transferred to the customer. Our term software licenses represent multiple performance obligations, which include software licenses and software support services where the term licenses are recognized upfront upon transfer of control, with the associated software support services recognized ratably over the service term as services and software updates are provided.
Service revenue relates to sales of our FortiGuard security subscription, FortiCare technical support services and other services. Our typical subscription and support term is to five years . We generally recognize revenue from these services ratably over the service term because of continuous transfer of control to the customer. We also generate a portion of our revenue from other services consisting of professional services, training and software-as-a-service (“SaaS”) which is either hosted by us or provided through cloud-providers. We recognize revenue from professional and training services as the services
81
are provided. We recognize revenue from SaaS as the subscription service is delivered over the term, which is typically one year, or on a monthly usage basis. To date, SaaS revenue has not represented a significant percentage of our total revenue.
Our sales contracts typically contain multiple deliverables, such as hardware, software license, security subscription, technical support services and other services, which are generally capable of being distinct and accounted for as separate performance obligations. Our hardware and software licenses have significant standalone functionalities and capabilities. Accordingly, the hardware and software licenses are distinct from the security subscription and technical support services, as a customer can benefit from the product without the services and the services are separately identifiable within a contract. We allocate a transaction price to each performance obligation based on relative standalone selling price. We establish standalone selling price using the prices charged for a deliverable when sold separately. If not observable through past transactions, we determine standalone selling price by considering multiple historical factors including, but not limited to, cost of products, gross margin objectives, pricing practices, geographies and the term of a service contract. Revenue is reported net of sales tax.
In certain circumstances, our contracts include provisions for sales rebates and other customer incentive programs. Additionally, in limited circumstances, we may permit end-customers, distributors and resellers to return our products, subject to varying limitations, for a refund within a reasonably short period from the date of purchase. These amounts are accounted for as variable consideration that can decrease the transaction price. We estimate variable consideration using the expected-value method based on the most likely amounts to which we expect our customers to be entitled. We include estimated amounts in the transaction price to the extent that it is probable that a significant reversal of cumulative revenue recognized will not occur when the uncertainty associated with the variable consideration is resolved. Our estimate for refund liabilities, which include sales returns reserve and customer rebates, was $92.7 million and $92.0 million as of December 31, 2023 and 2022, respectively, and is included in current liabilities in our consolidated balance sheet.
We generally invoice at the time of our sale for the total price of the hardware, software licenses, security subscription and technical support and other services. Standard payment terms are generally no more than 60 days, though we continue to offer extended payment terms to certain distributors. Amounts billed and due from our customers are classified as receivables on the balance sheet and do not bear interest.
Contingent Liabilities—From time to time, we are involved in disputes, litigation, and other legal actions. There are many uncertainties associated with any disputes, litigation and other legal actions, and these actions or other third-party claims against us may cause us to incur costly litigation fees, costs and substantial settlement charges, and possibly subject us to damages and other penalties, which are inherently difficult to estimate and could adversely affect our results of operations. In addition, the resolution of any IP litigation may require us to make royalty payments, which could adversely affect our gross margins in future periods. We periodically review significant claims and litigation matters for the probability of an adverse outcome. Estimates can change as individual claims develop. The actual liability in any such matters may be materially different from our estimates, which could result in the need to adjust our liability and record additional expenses, which may be material.
Recent Accounting Standards Not Yet Effective
Segment Reporting
In November 2023, the Financial Accounting Standards Board (the “FASB”) issued Accounting Standards Update (“ASU”) 2023-07, Segment Reporting (Topic 280): Improvements to Reportable Segment Disclosures, which is intended to
82
improve reportable segment disclosure requirements, primarily through enhanced disclosures about significant expenses. ASU 2023-07 was effective for us beginning on January 1, 2024 and will be applied on a retrospective basis to all periods presented. We are currently evaluating the ASU to determine its impact on our disclosures.
Income Taxes
In December 2023, the FASB issued ASU 2023-09, Income Taxes (Topic 740): Improvements to Income Tax Disclosures, which includes amendments that further enhance income tax disclosures, primarily through standardization and disaggregation of rate reconciliation categories and income taxes paid by jurisdiction. The amendments are effective for our annual periods beginning January 1, 2025, with early adoption permitted, and should be applied prospectively. We are currently evaluating the ASU to determine its impact on our disclosures.
2. REVENUE RECOGNITION
Disaggregation of Revenue
The following table presents our revenue disaggregated by major product and service lines (in millions):
| Year Ended December 31, | |||||||||||||||||
| 2023 | 2022 | 2021 | |||||||||||||||
| Product | $ | $ | $ | ||||||||||||||
| Service: | |||||||||||||||||
| Security subscription | |||||||||||||||||
| Technical support and other | |||||||||||||||||
| Total service revenue | |||||||||||||||||
| Total revenue | $ | $ | $ | ||||||||||||||
Deferred Revenue
During 2023 and 2022, we recognized $2.27 billion and $1.73 billion in revenue that was included in the deferred revenue balance as of December 31, 2022 and 2021, respectively.
Transaction Price Allocated to the Remaining Performance Obligations
As of December 31, 2023, the aggregate amount of the transaction price allocated to remaining performance obligations was $5.75 billion, which was substantially comprised of deferred security subscription and technical support services revenue as well as unbilled contract revenue from non-cancellable contracts that will be recognized in future periods. We expect to recognize approximately $2.86 billion as revenue over the next 12 months and the remainder thereafter.
83
3. FINANCIAL INSTRUMENTS AND FAIR VALUE
Available-for-Sale Investments
The following tables summarize our available-for-sale investments (in millions):
| December 31, 2023 | |||||||||||||||||||||||
| Amortized Cost | Unrealized Gains | Unrealized Losses | Fair Value | ||||||||||||||||||||
| U.S. government and agency securities | $ | $ | $ | ( | $ | ||||||||||||||||||
| Commercial paper | ( | ||||||||||||||||||||||
| Certificates of deposit and term deposits | |||||||||||||||||||||||
| Corporate debt securities | ( | ||||||||||||||||||||||
Total available-for-sale investments | $ | $ | $ | ( | $ | ||||||||||||||||||
| December 31, 2022 | |||||||||||||||||||||||
| Amortized Cost | Unrealized Gains | Unrealized Losses | Fair Value | ||||||||||||||||||||
| U.S. government and agency securities | $ | $ | $ | ( | $ | ||||||||||||||||||
| Commercial paper | ( | ||||||||||||||||||||||
| Certificates of deposit and term deposits | |||||||||||||||||||||||
| Corporate debt securities | ( | ||||||||||||||||||||||
| Municipal Bonds | ( | ||||||||||||||||||||||
Total available-for-sale investments | $ | $ | $ | ( | $ | ||||||||||||||||||
The following tables show the gross unrealized losses and the related fair values of our available-for-sale investments that have been in a continuous unrealized loss position (in millions):
| December 31, 2023 | |||||||||||||||||||||||||||||||||||
| Less Than 12 Months | 12 Months or Greater | Total | |||||||||||||||||||||||||||||||||
| Fair Value | Unrealized Losses | Fair Value | Unrealized Losses | Fair Value | Unrealized Losses | ||||||||||||||||||||||||||||||
| U.S. government and agency securities | $ | $ | $ | $ | ( | $ | $ | ( | |||||||||||||||||||||||||||
| Commercial paper | ( | ( | |||||||||||||||||||||||||||||||||
| Corporate debt securities | ( | ( | |||||||||||||||||||||||||||||||||
Total available-for-sale investments | $ | $ | ( | $ | $ | ( | $ | $ | ( | ||||||||||||||||||||||||||
| December 31, 2022 | |||||||||||||||||||||||||||||||||||
| Less Than 12 Months | 12 Months or Greater | Total | |||||||||||||||||||||||||||||||||
| Fair Value | Unrealized Losses | Fair Value | Unrealized Losses | Fair Value | Unrealized Losses | ||||||||||||||||||||||||||||||
| U.S. government and agency securities | $ | $ | ( | $ | $ | ( | $ | $ | ( | ||||||||||||||||||||||||||
| Commercial paper | ( | ( | |||||||||||||||||||||||||||||||||
| Corporate debt securities | ( | ( | ( | ||||||||||||||||||||||||||||||||
| Municipal Bonds | ( | ( | |||||||||||||||||||||||||||||||||
Total available-for-sale investments | $ | $ | ( | $ | $ | ( | $ | $ | ( | ||||||||||||||||||||||||||
84
The contractual maturities of our investments were (in millions):
| December 31, 2023 | December 31, 2022 | ||||||||||
| Due within one year | $ | $ | |||||||||
| Due within one to three years | |||||||||||
| Total | $ | $ | |||||||||
Available-for-sale investments are reported at fair value, with unrealized gains and losses and the related tax impact included as a separate component of equity (deficit) and in comprehensive income. We do not intend to sell any of the securities in an unrealized loss position and it is not more likely than not that we would be required to sell these securities before recovery of their amortized cost basis, which may be at maturity.
Realized gains and losses on available-for-sale investments were insignificant in the periods presented.
Marketable Equity Securities
Our marketable equity securities were $21.0 million and $25.5 million as of December 31, 2023 and December 31, 2022, respectively. The changes in fair value of our marketable equity securities are recorded in other expense—net on the consolidated statements of income. We recognized $4.4 million and $13.1 million of losses in 2023 and 2022, respectively.
Fair Value of Financial Instruments
Fair Value Accounting—We apply the following fair value hierarchy for disclosure of the inputs used to measure fair value. This hierarchy prioritizes the inputs into three broad levels:
Level 1—Inputs are unadjusted quoted prices in active markets for identical assets or liabilities.
Level 2—Inputs are quoted prices for similar assets and liabilities in active markets or inputs that are observable for the assets or liabilities, either directly or indirectly through market corroboration, for substantially the full term of the financial instruments.
Level 3—Unobservable inputs based on our own assumptions used to measure assets and liabilities at fair value. The inputs require significant management judgment or estimation.
We measure the fair value of money market funds, certain U.S. government and agency securities and marketable equity securities using quoted prices in active markets for identical assets. The fair value of all other financial instruments was based on quoted prices for similar assets in active markets, or model-driven valuations using significant inputs derived from or corroborated by observable market data.
We classify investments within Level 1 if quoted prices are available in active markets for identical securities.
We classify items within Level 2 if the investments are valued using model-driven valuations using observable inputs such as quoted market prices, benchmark yields, reported trades, broker/dealer quotes or alternative pricing sources with reasonable levels of price transparency. Investments are held by custodians who obtain investment prices from a third-party pricing provider that incorporates standard inputs in various asset price models.
85
Assets Measured at Fair Value on a Recurring Basis
The following tables present the fair value of our financial assets measured at fair value on a recurring basis (in millions):
| December 31, 2023 | December 31, 2022 | ||||||||||||||||||||||||||||||||||||||||||||||
| Aggregate Fair Value | Quoted Prices in Active Markets For Identical Assets | Significant Other Observable Remaining Inputs | Significant Other Unobservable Remaining Inputs | Aggregate Fair Value | Quoted Prices in Active Markets For Identical Assets | Significant Other Observable Remaining Inputs | Significant Other Unobservable Remaining Inputs | ||||||||||||||||||||||||||||||||||||||||
| (Level 1) | (Level 2) | (Level 3) | (Level 1) | (Level 2) | (Level 3) | ||||||||||||||||||||||||||||||||||||||||||
| Assets: | |||||||||||||||||||||||||||||||||||||||||||||||
| U.S. government and agency securities | $ | $ | $ | $ | $ | $ | $ | $ | |||||||||||||||||||||||||||||||||||||||
| Commercial paper | |||||||||||||||||||||||||||||||||||||||||||||||
| Certificates of deposit and term deposits | |||||||||||||||||||||||||||||||||||||||||||||||
| Corporate debt securities | |||||||||||||||||||||||||||||||||||||||||||||||
| Money market funds | |||||||||||||||||||||||||||||||||||||||||||||||
| Municipal bonds | |||||||||||||||||||||||||||||||||||||||||||||||
| Marketable equity securities | |||||||||||||||||||||||||||||||||||||||||||||||
| Total | $ | $ | $ | $ | $ | $ | $ | $ | |||||||||||||||||||||||||||||||||||||||
| Reported as: | |||||||||||||||||||||||||||||||||||||||||||||||
| Cash equivalents | $ | $ | |||||||||||||||||||||||||||||||||||||||||||||
| Marketable equity securities | |||||||||||||||||||||||||||||||||||||||||||||||
| Short-term investments | |||||||||||||||||||||||||||||||||||||||||||||||
| Long-term investments | |||||||||||||||||||||||||||||||||||||||||||||||
| Total | $ | $ | |||||||||||||||||||||||||||||||||||||||||||||
There were no transfers between Level 1 and Level 2 of the fair value hierarchy during the years ended December 31, 2023 and December 31, 2022.
4. INVENTORY
Inventory consisted of (in millions):
| December 31, 2023 | December 31, 2022 | ||||||||||
| Raw materials | $ | $ | |||||||||
Work in process | |||||||||||
| Finished goods | |||||||||||
| Inventory | $ | $ | |||||||||
The excess and obsolete inventory reserve was $89.2 million and $52.5 million as of December 31, 2023 and 2022, respectively. Inventory write-downs related to excess and obsolete inventory were $35.8 million for the year ended December 31, 2023, and not
86
5. PROPERTY AND EQUIPMENT—Net
Property and equipment—net consisted of (in millions):
| December 31, 2023 | December 31, 2022 | ||||||||||
| Land | $ | $ | |||||||||
| Buildings and improvements | |||||||||||
| Computer equipment and software | |||||||||||
| Leasehold improvements | |||||||||||
| Evaluation units | |||||||||||
| Furniture and fixtures | |||||||||||
| Construction-in-progress | |||||||||||
| Total property and equipment | |||||||||||
| Less: accumulated depreciation | ( | ( | |||||||||
| Property and equipment—net | $ | $ | |||||||||
During 2023, we purchased certain real estate in the United States, Spain, and Australia totaling $109.3 million. The purchases were accounted for under the asset acquisition method. The costs of the assets allocated to land, buildings and improvements and construction-in-progress were $41.7 million, $46.0 million and $21.6 million, respectively, based on their relative fair values.
Depreciation expense was $94.5 million, $81.0 million and $65.9 million in 2023, 2022 and 2021, respectively.
6. INVESTMENTS IN PRIVATELY HELD COMPANIES
Linksys Holdings, Inc.
During 2021, we invested $160.0 million in cash for shares of the Series A Preferred Stock of Linksys for a 50.8 % ownership interest in this privately held company. As of December 31, 2023 and 2022, our ownership interest remained the same. Linksys provides router connectivity solutions to the consumer and small business markets.
We have concluded that our investment in Linksys is an in-substance common stock investment and that we do not hold an absolute controlling financial interest in Linksys, but that we have the ability to exercise significant influence over the operating and financial policies of Linksys. Determining that we have significant influence but not control over the operating and financial policies of Linksys required significant judgement of many factors, including but not limited to the ownership interest in Linksys, board representation, participation in policy-making processes and participation rights in certain significant financial and operating decisions of Linksys in the ordinary course of business. Therefore, we determined to account for this investment using the equity method of accounting. We record our share of Linksys’ financial results on a three-month lag basis, with the exception of material transactions or events that occur during the intervening period that materially affect the financial position or results of operations. We determined that there was a basis difference between the cost of our investment in Linksys and the amount of underlying equity in net assets of Linksys.
Our share of loss of Linksys’ financial results, as well as our share of the amortization of the basis differences, totaled $42.1 million in 2023. Our loss related to Linksys in 2022 totaled $68.1 million, which comprised of our proportionate share of Linksys’ financial results as well as the amortization of the basis differences of $45.9 million, which included a $17.5 million charge in connection with a valuation allowance established on deferred tax assets at Linksys, and the other-than-temporary impairment (“OTTI”) charge of $22.2 million recorded during the three months ended December 31, 2022. Our share of loss of Linksys’ financial results as well as our share of the amortization of the basis differences in total was $7.6 million in 2021. The loss related to Linksys is recorded in loss from equity method investments on the consolidated statements of income.
Due to the presence of impairment indicators, such as a series of operating losses, current expected performance relative to expected performance when we initially invested, performance relative to peers, changes in net working capital and cash available for business operations, and the results of a discounted cash flows analysis, we evaluated our equity method investment for an OTTI during 2023 and 2022. We considered various factors in determining whether an OTTI has occurred, including Linksys financial results and operating history, our ability and intent to hold the investment until its fair value recovers, the implied revenue valuation multiples compared to guideline public companies, Linksys’ ability to achieve
87
milestones and any notable operational and strategic changes. In connection with our evaluation as of December 31, 2022, we noted that certain factors were present that indicated that the equity method investment’s decline in value was OTTI, primarily driven by Linksys’ continuous losses, decrease in revenue and operating results, then current forecasted results for the foreseeable future as compared to the expected performance at the time of the investments, and the results of a discounted cash flows analysis. To determine the fair value of our investment in Linksys, we utilized a market approach referencing revenue multiples from publicly traded peer companies and concluded that the estimated fair value of the investment was lower than its carrying value. During the three months ended December 31, 2022, we recorded a non-cash impairment charge of $22.2 million on our equity method investment in Linksys. In connection with our evaluation as of December 31, 2023, we determined that an additional OTTI has not occurred. However, we may be required to recognize an impairment loss in future reporting periods if and when our evaluation of the aforementioned factors indicates that the investment in Linksys is determined to be other than temporarily impaired. Such determination will be based on the prevailing facts and circumstances at that time.
The carrying amount of our Linksys investment was $42.2 million and $84.3 million as of December 31, 2023 and 2022, respectively, and the investment was included in other assets on our consolidated balance sheets.
Other investment
On August 1, 2023, we invested $8.5 million in cash for a 19.5 % ownership interest in the outstanding common stock of a privately held company that provides rugged ethernet switches, 4G/5G industrial routers and media converters for critical infrastructure customers. We accounted for this investment as an equity method investment since we have the ability to exercise significant influence, but not control, over the operating and financial policies of the privately held company. Determining that we have significant influence but not control over the operating and financial policies of the privately held company required significant judgement of many factors, including but not limited to the ownership interest, board representation, participation in policy-making processes and participation rights in certain significant financial and operating decisions in the ordinary course of business. Therefore, we determined to account for this investment using the equity method of accounting.
We recorded our proportionate share of the privately held company’s financial results on a three-month lag basis and presented it in loss from equity method investments on the consolidated statements of income. Our share of income of the privately held company’s financial results, as well as our share of the amortization of the basis differences, were immaterial during 2023. The carrying amount of the investment was $8.5 million as of December 31, 2023, and the investment was included in other assets on our consolidated balance sheets.
7. BUSINESS COMBINATIONS
2022 Acquisitions
Network Detection and Response Business
On December 22, 2022, we closed an acquisition of certain assets and liabilities of a business specializing in network detection and response for $18.0 million in cash. This acquisition was accounted for as a business combination using the acquisition method of accounting. Of the purchase price, $5.8 million was allocated to goodwill, $10.5 million was allocated to developed technology intangible asset, $10.0 million was allocated to customer relationships intangible asset and $8.3 million was allocated to other net liabilities assumed, which predominantly include deferred revenue. Goodwill recorded in connection with this acquisition is primarily attributable to the assembled workforce acquired and the anticipated operational synergies. All acquired goodwill is expected to be deductible for tax purposes. Acquisition-related costs related to this acquisition were not material and were recorded as general and administrative expense.
Alaxala Networks Corporation
On October 3, 2022, we acquired the remaining 25 % of equity interests in Alaxala for $13.5 million in cash, and Alaxala became a wholly owned subsidiary.
2021 Acquisition
Alaxala Networks Corporation
On August 31, 2021, we closed an acquisition of 75 % of equity interests as controlling interests in Alaxala Networks Corporation (“Alaxala”), a privately held network hardware equipment company in Japan, for $64.2 million in cash. We
88
acquired the equity interests in Alaxala to broaden our offering of secure switches integrated with our secure networking solutions.
Under the acquisition method of accounting in accordance with ASC 805, the total purchase price was allocated to Alaxala’s identifiable tangible and intangible assets acquired and liabilities assumed based on their estimated fair values using management’s best estimates and assumptions to assign fair value as of the acquisition date. The following table provides the assets acquired and liabilities assumed as of the date of acquisition:
(in millions) | Estimated Fair Value | ||||
| ASSETS | |||||
| Cash | $ | ||||
| Accounts receivable—net | |||||
| Inventory | |||||
| Prepaid expenses and other current assets | |||||
| Property and equipment | |||||
| Goodwill | |||||
| Other intangible assets | |||||
| Other long-term assets | |||||
| TOTAL ASSETS | $ | ||||
| LIABILITIES | |||||
| Accounts payable | $ | ||||
| Current portion of long-term debt | |||||
| Accrued and other current liabilities | |||||
| Other long-term liabilities | |||||
| TOTAL LIABILITIES | $ | ||||
| NON-CONTROLLING INTERESTS | $ | ||||
| Net purchase consideration | $ | ||||
The excess of the purchase consideration and the fair value of non-controlling interests over the fair value of net tangible and identified intangible assets acquired was recorded as goodwill, which is not deductible for tax purposes. Goodwill is primarily attributable to the assembled workforce of Alaxala and the anticipated operational synergies.
The fair value of the non-controlling interests of $17.8 million was estimated based on the non-controlling interests’ respective share of the fair value of Alaxala.
Identified intangible assets acquired and their estimated useful lives as of August 31, 2021, were (in millions, except years):
| Fair Value | Estimated Useful Life (in years) | ||||||||||
| Developed technology | $ | ||||||||||
| Customer relationships | |||||||||||
| Trade name | |||||||||||
| Backlog | |||||||||||
| Total identified intangible assets: | $ | ||||||||||
Developed technology relates to Alaxala’s network equipment. We valued the developed technology using the relief-from-royalty method under the income approach. This method reflects the present value of the projected cost savings that are expected to be realized by avoiding the royalty that otherwise would be granted in exchange for the use of the asset. The
89
economic useful life was determined based on the technology cycle related to each developed technology, as well as the cash flows over the forecast period.
Customer relationships represent the fair value of future projected revenue that will be derived from sales to existing customers of Alaxala. Customer contracts and related relationships were valued using the multi-period excess earnings method. This method reflects the present value of the projected cash flows that are expected to be generated by the customer contracts and relationships less charges representing the contribution of other assets to those cash flows. The economic useful life was determined based on historical customer turnover rates.
Trade name relates to the “Alaxala” trade name. The fair value was determined by applying the relief-from-royalty method under the income approach. This method is based on the application of a royalty rate to forecasted revenue under the trade name. The economic useful life was determined based on the expected life of the trade name and the cash flows anticipated over the forecast period.
Customer backlog relates to the unfulfilled customer contract orders. Backlog was valued using the multi-period excess earnings method. This method reflects the present value of the projected cash flows that are expected to be generated by the execution of the unfulfilled customer contract orders less charges representing the contribution of other assets to those cash flows. The economic useful life was determined based on the anticipated contract orders’ execution timeframe.
In connection with our acquisition of Alaxala, we assumed certain current debt liabilities of $20.2 million as of August 31, 2021. We concluded that the fair value of this debt approximated its book value as of the acquisition date. We repaid this debt in full in September and October 2021. During the post-acquisition period from September 1, 2021 through the repayment dates, interest expense related to Alaxala debt was not material.
The following unaudited pro forma financial information presents the combined results of operations of Fortinet, Inc. and Alaxala, as if Alaxala had been acquired as of the beginning of business on January 1, 2020. The unaudited pro forma financial information is presented for informational purposes only and is not necessarily indicative of our consolidated results of operations of the combined business that would have been achieved if the acquisition had taken place at the beginning of business on January 1, 2020, or of the results of our future operations of the combined business. The following unaudited pro forma financial information for all periods presented includes purchase accounting adjustments for amortization of acquired intangible assets, depreciation of acquired property and equipment, the purchase accounting effect on inventory acquired and related tax effects (in millions):
| Year Ended December 31, | |||||||||||
| 2021 | 2020 | ||||||||||
Pro forma revenue | $ | $ | |||||||||
Pro forma net income attributable to Fortinet, Inc. | $ | $ | |||||||||
Additional acquisition-related information
The operating results of the acquired companies are included in our consolidated statements of income from the respective dates of acquisition. Acquisition-related costs related to each acquisition were not material. Pro forma information has not been presented, except for Alaxala as disclosed above, as the impact of these acquisitions, individually and in the aggregate, in each year were not material to our consolidated financial statements.
8. GOODWILL AND OTHER INTANGIBLE ASSETS—Net
Goodwill
The following table presents the changes in the carrying amount of goodwill (in millions):
| Amount | |||||
Balance—December 31, 2022 | $ | ||||
| Foreign currency translation adjustments | ( | ||||
Balance—December 31, 2023 | $ | ||||
There were no
90
Other Intangible Assets—Net
The following tables present other intangible assets—net (in millions, except years):
| December 31, 2023 | |||||||||||||||||||||||
| Weighted-Average Useful Life (in Years) | Gross | Accumulated Amortization | Net | ||||||||||||||||||||
| Other intangible assets—net: | |||||||||||||||||||||||
| Finite-lived intangible assets: | |||||||||||||||||||||||
| Developed technologies | $ | $ | $ | ||||||||||||||||||||
| Customer relationships | |||||||||||||||||||||||
| Trade name | |||||||||||||||||||||||
| Backlog | |||||||||||||||||||||||
| Total other intangible assets—net | $ | $ | $ | ||||||||||||||||||||
| December 31, 2022 | |||||||||||||||||||||||
| Weighted-Average Useful Life (in Years) | Gross | Accumulated Amortization | Net | ||||||||||||||||||||
| Other intangible assets—net: | |||||||||||||||||||||||
| Finite-lived intangible assets: | |||||||||||||||||||||||
| Developed technologies | $ | $ | $ | ||||||||||||||||||||
| Customer relationships | |||||||||||||||||||||||
| Trade name | |||||||||||||||||||||||
| Backlog | |||||||||||||||||||||||
| Total other intangible assets—net | $ | $ | $ | ||||||||||||||||||||
Amortization expense of finite-lived intangible assets was $18.9 million, $23.3 million and $18.5 million in 2023, 2022, and 2021, respectively.
The following table summarizes estimated future amortization expense of finite-lived intangible assets (in millions):
| Year Ending December 31, | Amount | ||||
| 2024 | $ | ||||
| 2025 | |||||
| 2026 | |||||
| 2027 | |||||
2028 | |||||
| Thereafter | |||||
| Total | $ | ||||
9. NET INCOME PER SHARE
Basic net income per share is computed by dividing net income attributable to Fortinet, Inc., by the weighted-average number of shares of common stock outstanding during the period. Diluted net income per share is computed by dividing net income attributable to Fortinet, Inc. by the weighted-average number of shares of common stock outstanding during the period, plus the dilutive effects of restricted stock units RSUs, stock options and PSUs. Dilutive shares of common stock are determined by applying the treasury stock method.
91
A reconciliation of the numerator and denominator used in the calculation of basic and diluted net income per share attributable to Fortinet, Inc. is (in millions, except per share amounts):
| Year Ended December 31, | |||||||||||||||||
| 2023 | 2022 | 2021 | |||||||||||||||
| Numerator: | |||||||||||||||||
| Net income including non-controlling interests | $ | $ | $ | ||||||||||||||
| Net loss attributable to non-controlling interests | ( | ( | |||||||||||||||
| Net income attributable to Fortinet, Inc. | $ | $ | $ | ||||||||||||||
| Denominator: | |||||||||||||||||
| Basic shares: | |||||||||||||||||
| Weighted-average common stock outstanding-basic | |||||||||||||||||
| Diluted shares: | |||||||||||||||||
| Weighted-average common stock outstanding-basic | |||||||||||||||||
| Effect of potentially dilutive securities: | |||||||||||||||||
| RSUs | |||||||||||||||||
| Stock options | |||||||||||||||||
PSUs | |||||||||||||||||
| Weighted-average shares used to compute diluted net income per share attributable to Fortinet, Inc. | |||||||||||||||||
| Net income per share attributable to Fortinet, Inc.: | |||||||||||||||||
| Basic | $ | $ | $ | ||||||||||||||
| Diluted | $ | $ | $ | ||||||||||||||
The following weighted-average shares of common stock were excluded from the computation of diluted net income per share attributable to Fortinet, Inc. for the periods presented, as their effect would have been antidilutive (in millions):
| Year Ended December 31, | |||||||||||||||||
| 2023 | 2022 | 2021 | |||||||||||||||
| RSUs | |||||||||||||||||
| Stock options | |||||||||||||||||
PSUs | |||||||||||||||||
| Total | |||||||||||||||||
10. LEASES
We have operating leases for offices, research and development facilities and data centers. Our leases have remaining terms that range from less than one year to approximately six years , some of which include one or more options to renew, with renewal terms of up to seven years . Unless and until we are reasonably certain we will exercise these renewal options, we do not include renewal options in our lease terms for calculating our lease liability, as the renewal options allow us to maintain operational flexibility. Our finance leases were not material to our consolidated financial statements.
92
The components of lease expense were (in millions):
| Year Ended December 31, | |||||||||||||||||
| 2023 | 2022 | 2021 | |||||||||||||||
| Operating lease expense | $ | $ | $ | ||||||||||||||
Variable lease expense (1) | |||||||||||||||||
| Short-term lease expense | |||||||||||||||||
| Total lease expense | $ | $ | $ | ||||||||||||||
(1) Variable lease expense for the years ended December 31, 2023, 2022 and 2021 predominantly included common area maintenance charges, real estate taxes, certain parking expense, utilities based on actual usage and insurance costs. | |||||||||||||||||
Supplemental balance sheet information related to our operating leases was (in millions, except lease term and discount rate):
| Classification | December 31, 2023 | December 31, 2022 | |||||||||||||||
| Operating lease ROU assets – non-current | $ | $ | |||||||||||||||
| Operating lease liabilities – current | $ | $ | |||||||||||||||
| Operating lease liabilities – non-current | |||||||||||||||||
| Total operating lease liabilities | $ | $ | |||||||||||||||
| Weighted average remaining lease term in years – operating leases | |||||||||||||||||
| Weighted average discount rate – operating leases | % | % | |||||||||||||||
Supplemental cash flow information related to leases was (in millions):
| Year Ended December 31, | |||||||||||||||||
| 2023 | 2022 | 2021 | |||||||||||||||
| Cash paid for amounts included in the measurement of lease liabilities | |||||||||||||||||
| Operating cash flows used for operating leases | $ | $ | $ | ||||||||||||||
Maturities of operating lease liabilities as of December 31, 2023 were (in millions):
| Year Ending December 31, | Amount | ||||
2024 | $ | ||||
2025 | |||||
2026 | |||||
2027 | |||||
2028 | |||||
| Thereafter | |||||
| Total lease payments | $ | ||||
| Less imputed interest | ( | ||||
| Total | $ | ||||
As of December 31, 2023, our operating leases that had been signed but had not yet commenced were not material.
93
11. DEBT
2026 and 2031 Senior Notes
On March 5, 2021, we issued $1.0 billion aggregate principal amount of senior notes (collectively, the “Senior Notes”), consisting of $500.0 million aggregate principal amount of 1.0 % notes due March 15, 2026 (the “2026 Senior Notes”) and $500.0 million aggregate principal amount of 2.2 % notes due March 15, 2031 (the “2031 Senior Notes”), in an underwritten registered public offering. The Senior Notes are senior unsecured obligations and rank equally with each other in right of payment and with our other outstanding obligations. We may redeem the Senior Notes at any time in whole or in part for cash, at specified redemption prices that include accrued and unpaid interest, if any, and a make-whole premium. However, no make-whole premium will be paid for redemptions of the 2026 Senior Notes on or after February 15, 2026, or the 2031 Senior Notes on or after December 15, 2030. Interest on the Senior Notes is payable on March 15 and September 15 of each year, beginning on September 15, 2021. As of December 31, 2023, the Senior Notes were recorded as long-term debt, net of discount and issuance costs, which are amortized to interest expense over the respective contractual terms of these notes using the effective interest method.
The total outstanding debt is summarized below (in millions, except percentages):
| Maturity | Coupon Rate | Effective Interest Rate | December 31, 2023 | ||||||||||||||||||||
| Debt | |||||||||||||||||||||||
| 2026 Senior Notes | March 2026 | % | % | $ | |||||||||||||||||||
| 2031 Senior Notes | March 2031 | % | % | ||||||||||||||||||||
| Total debt | |||||||||||||||||||||||
| Less: Unamortized discount and debt issuance costs | |||||||||||||||||||||||
| Total long-term debt | $ | ||||||||||||||||||||||
As of December 31, 2023 and 2022, we accrued interest payable of $4.7 17.9 million, $17.9 million and $14.7 million of total interest expense in relation to these Senior Notes and repaid $16.0 million, $16.0 million and $8.4 million of interest in cash, respectively. No
The total estimated fair value of the outstanding Senior Notes was approximately $882.6 million, including accrued and unpaid interest, as of December 31, 2023. The fair value was determined based on observable market prices of identical instruments in less active markets. The estimated fair values are based on Level 2 inputs.
12. COMMITMENTS AND CONTINGENCIES
The following table summarizes our inventory purchase commitments as of December 31, 2023 (in millions):
| Total | 2024 | Thereafter | |||||||||||||||
| Inventory purchase commitments | $ | $ | $ | ||||||||||||||
Inventory Purchase Commitments—Our independent contract manufacturers and certain component suppliers procure components and build our products based on our forecasts, the availability of various components and their capacity. These forecasts are based on estimates of future demand for our products, which are in turn based on historical trends and an analysis from our sales and marketing organizations, adjusted for lead times, changes in supplier delivery commitments and other supply chain matters and market conditions. In order to manage manufacturing lead times, plan for adequate component supply and incentivize suppliers to deliver, we may issue purchase orders to some of our independent contract manufacturers which are non-cancelable. As of December 31, 2023, we had $637.3 million of open purchase orders with our independent contract manufacturers that consist of non-cancelable commitments. In certain instances, these agreements allow us the option to reschedule and adjust our requirements based on our business needs prior to firm orders being placed. We record a liability for non-cancelable inventory purchase commitments for quantities in excess of our future estimated demand forecasts, consistent with the valuation of our excess and obsolete inventory. As of December 31, 2023, the liability for these inventory purchase commitments was $84.7 million and was included in accrued liabilities. The expense related to such accrued liability
94
for inventory purchase commitments was $85.9 million for the year ended December 31, 2023, and not
Other Contractual Commitments and Open Purchase Orders—In addition to commitments with contract manufacturers and certain component suppliers, we have open purchase orders and contractual obligations in the ordinary course of business for which we have not received goods or services. A significant portion of our reported purchase commitments consist of firm and non-cancelable commitments. In certain instances, contractual commitments allow us the option to cancel, reschedule, and adjust our requirements based on our business needs prior to firm orders being placed. As of December 31, 2023, we had $66.9 million in other contractual commitments having a remaining term in excess of one year that are non-cancelable.
Litigation—We are involved in disputes, litigation, and other legal actions. For lawsuits where we are the defendant, we are in the process of defending these litigation matters, and while there can be no assurances and the outcome of certain of these matters is currently not determinable and not predictable, we currently are unaware of any existing claims or proceedings that we believe are likely to have a material adverse effect on our financial position. There are many uncertainties associated with any litigation and these actions or other third-party claims against us may cause us to incur costly litigation fees, costs and substantial settlement charges, and possibly subject us to damages and other penalties. In addition, the resolution of any intellectual property (“IP”) litigation may require us to make royalty payments, which could adversely affect our gross margins in future periods. If any of those events were to occur, our business, financial condition, results of operations, and cash flows could be adversely affected. Litigation is unpredictable and the actual liability in any such matters may be materially different from our current estimates, which could result in the need to adjust any accrued liability and record additional expenses. We accrue for contingencies when we believe that a loss is probable and that we can reasonably estimate the amount of any such loss. These accruals are generally based on a range of possible outcomes that require significant management judgement. If no amount within a range is a better estimate than any other, we accrue the minimum amount. Litigation loss contingency accruals associated with outstanding cases were not material as of December 31, 2023 and 2022.
On March 21, 2019, we were sued by Alorica Inc. (“Alorica”) in Santa Clara County Superior Court in California. Alorica has alleged breach of warranty and misrepresentation claims, which we deny. Fact discovery closed during the quarter ended June 30, 2023. Trial is set for May 2024. Although we believe that the ultimate outcome of this matter will not materially impact our financial position, results of operations or cash flows, legal proceedings are subject to inherent uncertainties, and an unfavorable ruling could occur, which may result in a material adverse impact on our business, financial position, results of operations and cash flows. No loss accrual had been recorded as of December 31, 2023 related to this litigation.
Indemnification and Other Matters—Under the indemnification provisions of our standard sales contracts, we agree to defend our customers against third-party claims asserting various allegations such as product defects and infringement of certain IP rights, which may include patents, copyrights, trademarks or trade secrets, and to pay judgments entered on such claims. In some contracts, our exposure under these indemnification provisions is limited by the terms of the contracts to certain defined limits, such as the total amount paid by our customer under the agreement. However, certain agreements include covenants, penalties and indemnification provisions including and beyond indemnification for third-party claims of IP infringement that could potentially expose us to losses in excess of the amount received under the agreement, and in some instances to potential liability that is not contractually limited. Although from time to time there are indemnification claims asserted against us and currently there are pending indemnification claims, to date there have been no material awards under such indemnification provisions.
Similar to other security companies and companies in other industries, we have experienced and may experience in the future, cybersecurity threats, malicious activity directed against our information technology infrastructure or unauthorized attempts to gain access to our and our customers’ sensitive information and systems. We currently are unaware of any existing claims or proceedings related to these types of matters, including any that we believe are likely to have a material adverse effect on our financial position.
13. EQUITY PLANS AND SHARE REPURCHASE PROGRAM
Stock-Based Compensation Plans
We have one primary stock incentive plan, the 2009 EIP, under which we have granted RSUs, stock options and PSUs.
Our board of directors approved the 2009 EIP in 2009 and amended the plan in 2019. The maximum aggregate number of shares that may be issued under the 2009 EIP is 239,367,655 shares; provided, however, that only 67,500,000 shares may be
95
issued or transferred pursuant to new awards granted on or following the effective date of the 2009 EIP. We may grant awards to employees, directors and other service providers. In the case of an incentive stock option granted to an employee who, at the time of the grant, owns stock representing more than 10 % of the voting power of all classes of stock, the exercise price shall be no less than 110 % of the fair market value per share on the date of grant and expire no more than five years from the date of grant, and options granted to any other employee, the per share exercise price shall be no less than 100 % of the closing stock price on the date of grant. In the case of a non-statutory stock option and options granted to other service providers, the per share exercise price shall be no less than 100 % of the fair market value per share on the date of grant. Options granted to individuals owning less than 10 % of the total combined voting power of all classes of stock generally have a contractual term of no more than ten years and options generally vest over four years .
As of December 31, 2023, there were a total of 53.6 million shares of common stock available for grant under the 2009 EIP.
Restricted Stock Units
The following table summarizes the activity and related information for RSUs for the periods presented below (in millions, except per share amounts):
| Restricted Stock Units Outstanding | |||||||||||
| Number of Shares | Weighted-Average Grant Date Fair Value per Share | ||||||||||
Balance—December 31, 2020 | $ | ||||||||||
| Granted | |||||||||||
| Forfeited | ( | ||||||||||
| Vested | ( | ||||||||||
Balance—December 31, 2021 | |||||||||||
| Granted | |||||||||||
| Forfeited | ( | ||||||||||
| Vested | ( | ||||||||||
Balance—December 31, 2022 | |||||||||||
| Granted | |||||||||||
| Forfeited | ( | ||||||||||
| Vested | ( | ||||||||||
Balance—December 31, 2023 | $ | ||||||||||
Stock compensation expense is recognized on a straight-line basis over the vesting period of each RSU. As of December 31, 2023, total compensation expense related to unvested RSUs granted to employees and non-employees under the 2009 EIP, but not yet recognized, was $413.8 million, with a weighted-average remaining vesting period of 2.6 years.
RSUs settle into shares of common stock upon vesting. Upon the vesting of the RSUs, we net-settle the RSUs and withhold a portion of the shares to satisfy employee withholding tax requirements. The payment of the withheld taxes to the tax authorities is reflected as a financing activity within the consolidated statements of cash flows.
The following summarizes the number and value of the shares withheld for employee taxes (in millions):
| Year Ended December 31, | |||||||||||||||||
| 2023 | 2022 | 2021 | |||||||||||||||
| Shares withheld for taxes | |||||||||||||||||
| Amount withheld for taxes | $ | $ | $ | ||||||||||||||
96
Employee Stock Options
In determining the fair value of our employee stock options, we use the Black-Scholes model, which employs the following assumptions.
Expected Term—The expected term represents the period that our stock-based awards are expected to be outstanding. We believe that we have sufficient historical experience for determining the expected term of the stock option award, and therefore, we calculated our expected term based on historical experience instead of using the simplified method.
Expected Volatility—The expected volatility of our common stock is based on our weighted-average implied and historical volatility.
Fair Value of Common Stock—The fair value of our common stock is the closing sales price of the common stock effective on the date of grant.
Risk-Free Interest Rate—We base the risk-free interest rate on the implied yield available on U.S. Treasury zero-coupon issues with an equivalent remaining term.
Expected Dividend—The expected dividend weighted-average assumption is zero .
The following table summarizes the weighted-average assumptions relating to our employee stock options:
| Year Ended December 31, | |||||||||||||||||
| 2023 | 2022 | 2021 | |||||||||||||||
| Expected term in years | |||||||||||||||||
| Volatility | % | % | % | ||||||||||||||
| Risk-free interest rate | % | % | % | ||||||||||||||
| Dividend rate | % | % | % | ||||||||||||||
97
The following table summarizes the stock option activity and related information for the periods presented below (in millions, except exercise prices and contractual life):
| Options Outstanding | |||||||||||||||||||||||
| Number of Shares | Weighted- Average Exercise Price | Weighted- Average Remaining Contractual Life (Years) | Aggregate Intrinsic Value | ||||||||||||||||||||
Balance—December 31, 2020 | $ | ||||||||||||||||||||||
| Granted | |||||||||||||||||||||||
| Forfeited | ( | ||||||||||||||||||||||
| Exercised | ( | ||||||||||||||||||||||
Balance—December 31, 2021 | |||||||||||||||||||||||
| Granted | |||||||||||||||||||||||
| Forfeited | ( | ||||||||||||||||||||||
| Exercised | ( | ||||||||||||||||||||||
Balance—December 31, 2022 | |||||||||||||||||||||||
| Granted | |||||||||||||||||||||||
| Forfeited | ( | ||||||||||||||||||||||
| Exercised | ( | ||||||||||||||||||||||
Balance—December 31, 2023 | $ | ||||||||||||||||||||||
Options vested and expected to vest—December 31, 2023 | $ | $ | |||||||||||||||||||||
Options exercisable—December 31, 2023 | $ | $ | |||||||||||||||||||||
The aggregate intrinsic value represents the difference between the exercise price of stock options and the quoted market price of our common stock at the date of balance sheet for all in-the-money stock options. Stock compensation expense is recognized on a straight-line basis over the vesting period of each stock option. As of December 31, 2023, total compensation expense related to unvested stock options granted to employees but not yet recognized was $54.6 million, with a weighted-average remaining vesting period of 2.5 years.
Additional information related to our stock options is summarized below (in millions, except per share amounts):
| Year Ended December 31, | |||||||||||||||||
| 2023 | 2022 | 2021 | |||||||||||||||
| Weighted-average fair value per share granted | $ | $ | $ | ||||||||||||||
| Intrinsic value of options exercised | $ | $ | $ | ||||||||||||||
| Fair value of options vested | $ | $ | $ | ||||||||||||||
98
The following table summarizes information about outstanding and exercisable stock options as of December 31, 2023, (in millions, except exercise prices and contractual life):
| Options Outstanding | Options Exercisable | |||||||||||||||||||||||||||||||
| Range of Exercise Prices | Number Outstanding | Weighted- Average Remaining Contractual Life (Years) | Weighted- Average Exercise Price | Number Exercisable | Weighted- Average Exercise Price | |||||||||||||||||||||||||||
$ | $ | $ | ||||||||||||||||||||||||||||||
$ | ||||||||||||||||||||||||||||||||
$ | ||||||||||||||||||||||||||||||||
$ | ||||||||||||||||||||||||||||||||
Market/Performance-Based PSUs
In 2023, we granted market/performance-based PSUs under the 2009 EIP to certain of our executives. Based on the achievement of the market/performance-based vesting conditions during the performance period, the final settlement of the PSUs will range between 0 % and 200 % of the target shares underlying the PSUs based on the percentile ranking of our total stockholder return over -, -, - and four-year periods among companies included in the S&P 500 Index. 20 %, 20 %, 20 % and 40 % of the PSUs vest over -, -, - and four-year service periods, respectively.
We granted approximately 0.3 million shares of PSU awards with a grant date fair value of $90.96 per share to certain of our executives during the first quarter of 2023. The grant date fair value of these awards was determined using a Monte Carlo simulation pricing model. The following table summarizes the weighted-average assumptions relating to our PSUs for the three months ended March 31, 2023:
| Three Months Ended | |||||
| March 31, 2023 | |||||
| Expected term in years | |||||
| Volatility | % | ||||
| Risk-free interest rate | % | ||||
| Dividend rate | % | ||||
As of December 31, 2023, total compensation expense related to unvested PSUs that were granted to certain of our executives, but not yet recognized, was $16.1 million. This expense is expected to be amortized on a graded vesting method over a weighted-average vesting period of 2.4 years.
Shares Reserved for Future Issuances
The following table presents the common stock reserved for future issuance (in millions):
| December 31, 2023 | |||||
| Reserved for future equity award grants | |||||
Outstanding stock options, RSUs and PSUs | |||||
| Total common stock reserved for future issuances | |||||
99
Stock-Based Compensation Expense
Stock-based compensation expense, including stock-based compensation expense related to awards classified as liabilities, is included in costs and expenses (in millions):
| Year Ended December 31, | |||||||||||||||||
| 2023 | 2022 | 2021 | |||||||||||||||
| Cost of product revenue | $ | $ | $ | ||||||||||||||
| Cost of service revenue | |||||||||||||||||
| Research and development | |||||||||||||||||
| Sales and marketing | |||||||||||||||||
| General and administrative | |||||||||||||||||
| Total stock-based compensation expense | $ | $ | $ | ||||||||||||||
The following table summarizes stock-based compensation expense, including stock-based compensation expense related to awards classified as liabilities, by award type (in millions):
| Year Ended December 31, | |||||||||||||||||
| 2023 | 2022 | 2021 | |||||||||||||||
| RSUs | $ | $ | $ | ||||||||||||||
| Stock options | |||||||||||||||||
PSUs | $ | $ | $ | ||||||||||||||
| Total stock-based compensation expense | $ | $ | $ | ||||||||||||||
Total income tax benefit associated with stock-based compensation that is recognized in the consolidated statements of income is (in millions):
| Year Ended December 31, | |||||||||||||||||
| 2023 | 2022 | 2021 | |||||||||||||||
| Income tax benefit associated with stock-based compensation | $ | $ | $ | ||||||||||||||
Share Repurchase Program
In January 2016, our board of directors approved the Repurchase Program, which authorized the repurchase of up to $200.0 million of our outstanding common stock through December 31, 2017. From 2016 through 2022, our board of directors approved increases to our Repurchase Program by various amounts and extended the term to February 28, 2023, bringing the aggregated amount authorized to $5.25 billion. In February 2023, our board of directors approved an extension of the Repurchase Program to February 29, 2024. In April 2023 and July 2023, our board of directors approved $1.0 billion and $500.0 million increases in the authorized stock repurchase amount under the Repurchase Program, bringing the aggregate amount authorized to be repurchased to $6.75 billion. Under the Repurchase Program, share repurchases may be made by us from time to time in privately negotiated transactions or in open market transactions. The Repurchase Program does not require us to purchase a minimum number of shares, and may be suspended, modified or discontinued at any time without prior notice. In 2023, we repurchased 27.2 million shares of common stock under the Repurchase Program in open market transactions for an aggregate purchase price of $1.50 billion, which excludes a $10.9 million accrual related to the 1% excise tax imposed by the Inflation Reduction Act of 2022. As of December 31, 2023, $529.1 million remained available for future share repurchases under the Repurchase Program. Refer to Note 17, Subsequent Events, for information regarding the approved $500.0 million increase in the authorized stock repurchase amount under the Repurchase Program in January 2024 and the extension of the Repurchase Program to February 28, 2025 in February 2024.
100
14. INCOME TAXES
Income before income taxes and loss from equity method investments consisted of (in millions):
| Year Ended December 31, | |||||||||||||||||
| 2023 | 2022 | 2021 | |||||||||||||||
| Domestic | $ | $ | $ | ||||||||||||||
| Foreign | |||||||||||||||||
Total income before income taxes and loss from equity method investments | $ | $ | $ | ||||||||||||||
The provision for (benefit from) income taxes consisted of (in millions):
| Year Ended December 31, | |||||||||||||||||
| 2023 | 2022 | 2021 | |||||||||||||||
| Current: | |||||||||||||||||
| Federal | $ | $ | $ | ||||||||||||||
| State | |||||||||||||||||
| Foreign | |||||||||||||||||
| Total current | $ | $ | $ | ||||||||||||||
| Deferred: | |||||||||||||||||
| Federal | $ | ( | $ | ( | $ | ( | |||||||||||
| State | ( | ( | ( | ||||||||||||||
| Foreign | ( | ( | ( | ||||||||||||||
| Total deferred | ( | ( | ( | ||||||||||||||
| Provision for income taxes | $ | $ | $ | ||||||||||||||
The foreign tax provision included the tax impacts from U.S. GAAP to local tax return book to tax differences that create a permanent addback including but not limited to stock compensation, meals and entertainment, and settlement of prior year tax audits with foreign jurisdiction adjustments.
101
The provision for income taxes differs from the amount computed by applying the statutory federal income tax rate (in millions):
| Year Ended December 31, | |||||||||||||||||
| 2023 | 2022 | 2021 | |||||||||||||||
| Tax at federal statutory tax rate | $ | $ | $ | ||||||||||||||
| Foreign income taxed at different rates | |||||||||||||||||
| Foreign withholding taxes | |||||||||||||||||
| Stock-based compensation expense | ( | ( | ( | ||||||||||||||
| Foreign tax credit | ( | ( | ( | ||||||||||||||
| State taxes—net of federal benefit | ( | ( | |||||||||||||||
| Research and development credit | ( | ( | ( | ||||||||||||||
| Valuation allowance | ( | ||||||||||||||||
| Impact of the 2017 Tax Cuts and Jobs Act: | |||||||||||||||||
| One-time transition tax | |||||||||||||||||
Tax effect of a law change | ( | ||||||||||||||||
Foreign-Derived Intangible Income ("FDII") | ( | ( | ( | ||||||||||||||
Adjustment to prior year’s FDII | |||||||||||||||||
| Other | ( | ( | |||||||||||||||
| Total provision for income taxes | $ | $ | $ | ||||||||||||||
Effective January 1, 2022, research and development expenses are required to be capitalized and amortized for U.S. tax purposes, which delays the deductibility of these expenses, and increases our current provision.
During 2023, we changed our position regarding the allocation and apportionment of expenses for income tax purposes. This change in approach affected the amount of our FDII benefit and our ability to utilize certain foreign tax credits. As a result, our FDII benefits recorded in prior years decreased by $92.8 million, partially offset by an increased benefit for the utilization of foreign tax credits of $63.1 million. These foreign tax credit carryforwards were previously expected to have expired unutilized resulting in the recording of a full valuation allowance thereon. Accordingly, the benefit recognized as a result of their utilization is included in the benefit from the release of a valuation allowance of $67.7 million.
On January 4, 2022, the U.S. Treasury published another tranche of final regulations regarding the foreign tax credit. These final regulations impose new requirements that a foreign tax must meet in order to be creditable against U.S. income taxes, and generally apply to tax years beginning on or after December 28, 2021. On July 26, 2022, the U.S. Treasury released corrections to the final regulations. On July 21, 2023, the IRS released a notice that suspended the application of significant portions of the final regulations regarding the foreign tax credit for tax years 2022 and 2023. The notice released in July 2023 favorably impacted our ability to claim foreign tax credits in the United States for certain taxes imposed by certain foreign jurisdictions. On December 11, 2023, the IRS released a notice that extended the suspension of significant portions of the final regulations beyond December 31, 2023, until further guidance is issued.
On August 16, 2022, the United States enacted the Inflation Reduction Act of 2022 that provides for certain changes to the U.S. corporate income tax system, including a 15% minimum tax based on financial statement income for companies with three-year average annual adjusted financial statement income exceeding $1 billion, and a 1% excise tax on net repurchases of stock after December 31, 2022, if any. The applicable tax law changes have had no impact to our tax provision for the year ended December 31, 2023. We will continue to evaluate the impact of these tax law changes on future periods.
In December 2021, the Organisation for Economic Co-operation and Development (the “OECD”) enacted model rules for a new global minimum tax framework (“BEPS Pillar Two”), and various governments around the world have enacted, or are in the process of enacting, legislation on this. We are in the process of assessing the tax impact of Pillar Two legislation becoming applicable to us beginning January 1, 2024, and believe these rules will not have a material impact on our provision for income taxes.
102
The tax effects of temporary differences that give rise to significant portions of the deferred tax assets as of the years ended are presented below (in millions):
| December 31, 2023 | December 31, 2022 | ||||||||||
| Deferred tax assets: | |||||||||||
| General business credit carryforward | $ | $ | |||||||||
| Deferred revenue | |||||||||||
| Reserves and accruals | |||||||||||
| Net operating loss carryforward | |||||||||||
| Stock-based compensation expense | |||||||||||
| Depreciation and amortization | |||||||||||
| Capitalized research expenditures | |||||||||||
| Operating lease liabilities | |||||||||||
| Total deferred tax assets | |||||||||||
| Less: Valuation allowance | ( | ( | |||||||||
| Deferred tax assets, net of valuation allowance | |||||||||||
| Deferred tax liabilities: | |||||||||||
| Deferred contract costs | ( | ( | |||||||||
| Operating lease ROU assets | ( | ( | |||||||||
| Acquired intangibles | ( | ( | |||||||||
| Total deferred tax liabilities | ( | ( | |||||||||
| Net deferred tax assets | $ | $ | |||||||||
In assessing the realizability of deferred tax assets, we considered whether it is more likely than not that some portion or all of our deferred tax assets will be realized. This realization is dependent upon the generation of future taxable income during the periods in which those temporary differences become deductible. We concluded that it is more likely than not that we will be able to realize the benefits of our deferred tax assets in the future except for our California research and development credits carryforward, certain impairment losses in business investments and certain tax attributes from business acquisitions. As of December 31, 2023, we had a valuation allowance of $33.2 million against those items.
As of December 31, 2023, our federal and California net operating loss carryforwards for income tax purposes were $67.0 million and $20.8 million, respectively. All the net operating loss carryforwards were from acquisitions which were limited by Section 382 of the Internal Revenue Code. If not utilized, the federal net operating loss carryforwards will begin to expire in 2024, and California net operating loss carryforwards will begin to expire in 2034.
As of December 31, 2023, we had state tax credit carryforwards of $45.3 million. The state credits can be carried forward indefinitely.
103
The aggregate changes in the balance of unrecognized tax benefits are (in millions):
| Year Ended December 31, | |||||||||||||||||
| 2023 | 2022 | 2021 | |||||||||||||||
| Unrecognized tax benefits, beginning of year | $ | $ | $ | ||||||||||||||
| Gross increases for tax positions related to the current year | |||||||||||||||||
| Gross decreases for tax positions related to the current year | |||||||||||||||||
| Gross increases for tax positions related to the prior year | |||||||||||||||||
| Gross decreases for tax positions related to prior year | ( | ( | ( | ||||||||||||||
| Gross decreases for tax positions related to prior year audit settlements | |||||||||||||||||
| Gross decreases for tax positions related to expiration of statute of limitations | ( | ( | ( | ||||||||||||||
| Unrecognized tax benefits, end of year | $ | $ | $ | ||||||||||||||
As of December 31, 2023, we had $65.8 million of unrecognized tax benefits, of which, if recognized, $55.5 million would favorably affect our effective tax rate. Our gross unrecognized tax benefits decreased approximately $1.6 million during the year ended December 31, 2023. The net decrease was primarily due to the reversal of gross unrecognized tax benefits in connection with the lapse of statutes of limitations. Our policy is to include accrued interest and penalties related to uncertain tax benefits in income tax expense. As of December 31, 2023, 2022 and 2021, accrued interest and penalties were $6.4 million, $9.3 million and $13.3 million, respectively.
It is reasonably possible that our gross unrecognized tax benefits will decrease up to $3.9 million in the next 12 months, primarily due to the lapse of the statute of limitations. These adjustments, if recognized, would favorably impact our effective tax rate, and would be recognized as additional tax benefits.
We file income tax returns in the U.S. federal jurisdiction and in various U.S. state and foreign jurisdictions. Generally, we are no longer subject to examination by U.S. federal income tax authorities for tax years prior to 2015. We are no longer subject to U.S. state and foreign income tax examinations by tax authorities for tax years prior to 2010. We currently have ongoing tax audits in the United Kingdom, Canada, Germany and several other foreign jurisdictions. The focus of these audits is the inter-company profit allocation.
104
15. DEFINED CONTRIBUTION PLANS
Our tax-deferred savings plan under our 401(k) Plan permits participating U.S. employees to contribute a portion of their pre-tax or after-tax earnings. In Canada, we have a Group Registered Retirement Savings Plan Program (the “RRSP”), which permits participants to make pre-tax contributions. Our board of directors approved 50 % matching contributions on employee contributions up to 4 % of each employee’s eligible earnings. Our matching contributions to our 401(k) Plan and the RRSP for 2023, 2022 and 2021 were $17.1 million, $12.6 million and $10.0 million, respectively.
16. SEGMENT INFORMATION
Operating segments are defined as components of an enterprise about which separate financial information is available that is evaluated regularly by the chief operating decision maker in deciding how to allocate resources and in assessing performance. Our chief operating decision maker is our chief executive officer. Our chief executive officer reviews financial information presented on a consolidated basis, accompanied by information about revenue by geographic region for purposes of allocating resources and evaluating financial performance. We have one business activity, and there are no segment managers who are held accountable for operations, operating results and plans for levels or components below the consolidated unit level. Accordingly, we have determined that we have one operating segment, and therefore, one reportable segment.
Revenue by geographic region is based on the billing address of our customers. The following tables set forth revenue and property and equipment—net by geographic region (in millions):
| Year Ended December 31, | |||||||||||||||||
| Revenue | 2023 | 2022 | 2021 | ||||||||||||||
| Americas: | |||||||||||||||||
| United States | $ | $ | $ | ||||||||||||||
| Other Americas | |||||||||||||||||
| Total Americas | |||||||||||||||||
| Europe, Middle East and Africa (“EMEA”) | |||||||||||||||||
| Asia Pacific (“APAC”) | |||||||||||||||||
| Total revenue | $ | $ | $ | ||||||||||||||
Property and Equipment—net | December 31, 2023 | December 31, 2022 | |||||||||
| Americas: | |||||||||||
| United States | $ | $ | |||||||||
| Canada | |||||||||||
| Latin America | |||||||||||
| Total Americas | |||||||||||
| EMEA | |||||||||||
| APAC | |||||||||||
| Total property and equipment—net | $ | $ | |||||||||
The following distributors accounted for 10% or more of our revenue:
| Year Ended December 31, | |||||||||||||||||
| 2023 | 2022 | 2021 | |||||||||||||||
| Distributor A | % | % | % | ||||||||||||||
| Distributor B | % | % | % | ||||||||||||||
| Distributor C | % | % | * | ||||||||||||||
* Represents less than 10%
105
The following distributors accounted for 10% or more of net accounts receivable:
| 2023 | 2022 | ||||||||||
| Distributor A | % | % | |||||||||
| Distributor B | % | % | |||||||||
| Distributor C | % | % | |||||||||
17. SUBSEQUENT EVENTS
Real Property Purchases
In January 2024, we purchased real property in Santa Clara, CA, and Union City, CA, totaling approximately 480,000 square feet and 54,300 square feet, respectively, for $192.0 million and $14.8 million in cash, respectively.
Share Repurchase Program
106
ITEM 9. Changes in and Disagreements with Accountants on Accounting and Financial Disclosure
None.
ITEM 9A. Controls and Procedures
Evaluation of Disclosure Controls and Procedures
Our management, with the participation of our chief executive officer and chief financial officer, evaluated the effectiveness of our disclosure controls and procedures (as defined in Rule 13a-15(e) or 15d-15(e) under the Securities Exchange Act of 1934 (the “Exchange Act”)) as of the end of the period covered by this Annual Report on Form 10-K. In designing and evaluating the disclosure controls and procedures, management recognized that any controls and procedures, no matter how well designed and operated, can provide only reasonable assurance of achieving the desired control objectives. In addition, the design of disclosure controls and procedures must reflect the fact that there are resource constraints and that management is required to apply its judgment in evaluating the benefits of possible controls and procedures relative to their costs.
Based on that evaluation, our chief executive officer and chief financial officer concluded that our disclosure controls and procedures were effective as of December 31, 2023 to provide reasonable assurance that information we are required to disclose in reports that we file or submit under the Exchange Act is recorded, processed, summarized and reported within the time periods specified in SEC rules and forms, and that such information is accumulated and communicated to our management, including our Chief Executive Officer and Chief Financial Officer, as appropriate, to allow timely decisions regarding required disclosure.
Management’s Report on Internal Control over Financial Reporting
Our management is responsible for establishing and maintaining adequate internal control over financial reporting, as defined in Rule 13a-15(f) and 15d-15(f) under the Exchange Act. Management conducted an evaluation of the effectiveness of our internal control over financial reporting based on the framework in Internal Control—Integrated Framework (2013) set forth by the Committee of Sponsoring Organizations of the Treadway Commission.
Based on this evaluation, management concluded that our internal control over financial reporting was effective as of December 31, 2023. Management reviewed the results of its assessment with our Audit Committee. The effectiveness of our internal control over financial reporting as of December 31, 2023 has been audited by Deloitte & Touche LLP, an independent registered public accounting firm, as stated in its report, which appears in this Item under the heading “Report of Independent Registered Public Accounting Firm.”
Changes in Internal Control over Financial Reporting
There were no changes in our internal controls over financial reporting (as defined in Rules 13a-15(f) or 15d-15(f) under the Exchange Act) during 2023 that have materially affected, or are reasonably likely to materially affect, our internal controls over financial reporting.
107
REPORT OF INDEPENDENT REGISTERED PUBLIC ACCOUNTING FIRM
To the stockholders and the Board of Directors of Fortinet, Inc.
Opinion on Internal Control over Financial Reporting
We have audited the internal control over financial reporting of Fortinet, Inc. and subsidiaries (the “Company”) as of December 31, 2023, based on criteria established in Internal Control – Integrated Framework (2013) issued by the Committee of Sponsoring Organizations of the Treadway Commission (COSO). In our opinion, the Company maintained, in all material respects, effective internal control over financial reporting as of December 31, 2023, based on criteria established in Internal Control – Integrated Framework (2013) issued by COSO.
We have also audited, in accordance with the standards of the Public Company Accounting Oversight Board (United States) (PCAOB), the consolidated financial statements as of and for the year ended December 31, 2023, of the Company and our report dated February 23, 2024 expressed an unqualified opinion on those financial statements.
Basis for Opinion
The Company’s management is responsible for maintaining effective internal control over financial reporting and for its assessment of the effectiveness of internal control over financial reporting, included in the accompanying Management’s Report on Internal Control over Financial Reporting. Our responsibility is to express an opinion on the Company’s internal control over financial reporting based on our audit. We are a public accounting firm registered with the PCAOB and are required to be independent with respect to the Company in accordance with the U.S. federal securities laws and the applicable rules and regulations of the Securities and Exchange Commission and the PCAOB.
We conducted our audit in accordance with the standards of the PCAOB. Those standards require that we plan and perform the audit to obtain reasonable assurance about whether effective internal control over financial reporting was maintained in all material respects. Our audit included obtaining an understanding of internal control over financial reporting, assessing the risk that a material weakness exists, testing and evaluating the design and operating effectiveness of internal control based on the assessed risk, and performing such other procedures as we considered necessary in the circumstances. We believe that our audit provides a reasonable basis for our opinion.
Definition and Limitations of Internal Control over Financial Reporting
A company’s internal control over financial reporting is a process designed to provide reasonable assurance regarding the reliability of financial reporting and the preparation of financial statements for external purposes in accordance with generally accepted accounting principles. A company’s internal control over financial reporting includes those policies and procedures that (1) pertain to the maintenance of records that, in reasonable detail, accurately and fairly reflect the transactions and dispositions of the assets of the company; (2) provide reasonable assurance that transactions are recorded as necessary to permit preparation of financial statements in accordance with generally accepted accounting principles, and that receipts and expenditures of the company are being made only in accordance with authorizations of management and directors of the company; and (3) provide reasonable assurance regarding prevention or timely detection of unauthorized acquisition, use, or disposition of the company’s assets that could have a material effect on the financial statements.
Because of its inherent limitations, internal control over financial reporting may not prevent or detect misstatements. Also, projections of any evaluation of effectiveness to future periods are subject to the risk that controls may become inadequate because of changes in conditions, or that the degree of compliance with the policies or procedures may deteriorate.
/s/ DELOITTE & TOUCHE LLP
San Jose, California
February 23, 2024
108
ITEM 9B. Other Information
Rule 10b5-1 Trading Plans
On November 13, 2023 , Patrice Perche , our Chief Revenue Officer and Executive Vice President of Support , entered into a pre-arranged written stock sale plan in accordance with Rule 10b5-1 (the “Perche Plan”) under the Exchange Act for the sale of shares of our common stock. The Perche Plan was entered into during an open trading window in accordance with our insider trading policy and is intended to satisfy the affirmative defense of Rule 10b5-1(c) under the Exchange Act. The Perche Plan provides for the potential sale by Patrice Perche of up to (a) 141,981 shares of our common stock, including upon the vesting and settlement of RSUs and PSUs for shares of our common stock, and (b) the net shares (which are not yet determinable) after shares are withheld to satisfy tax obligations upon such vesting and settlement, in each case, at the market price, all between March 4, 2024 and June 1, 2025.
On December 6, 2023 , Judith Sim , one of director s, entered into a pre-arranged written stock sale plan in accordance with Rule 10b5-1 (the “Sim Plan”) under the Exchange Act for the sale of shares of our common stock. The Sim Plan was entered into during an open trading window in accordance with our insider trading policy and is intended to satisfy the affirmative defense of Rule 10b5-1(c) under the Exchange Act. The Sim Plan provides for the potential sale by Judith Sim of up to 20,637 shares of our common stock between March 6, 2024 and March 8, 2025.
Each of the Perche Plan and the Sim Plan (together, the “10b5-1 Plans”) includes a representation from Patrice Perche and Judith Sim (as applicable) to the broker administering the plan that none of them were in possession of any material nonpublic information regarding us or the securities subject to the 10b5-1 Plans at the time the 10b5-1 Plans were entered into. A similar representation was made to us in connection with the adoption of the 10b5-1 Plans under our insider trading policy. Those representations for each 10b5-1 Plan were made as of the respective date of adoption of the applicable 10b5-1 Plan, and speak only as of that date. In making those representations, there is no assurance with respect to any material nonpublic information of which Patrice Perche and Judith Sim were unaware, or with respect to any material nonpublic information acquired by Patrice Perche and Judith Sim or us after the date of each such representation.
Once executed, transactions under the Sim Plan will be disclosed publicly through Form 4 and/or Form 144 filings with the SEC in accordance with applicable securities laws, rules and regulations. Except as may be required by law, we do not undertake any obligation to update or report any modification, termination, or other activity under current or future Rule 10b5-1 plans that may be adopted by Patrice Perche or Judith Sim or our other officers or directors, or their affiliated entities.
ITEM 9C. Disclosure Regarding Foreign Jurisdictions that Prevents Inspections
Not applicable.
Part III
ITEM 10. Directors, Executive Officers and Corporate Governance
Information responsive to this item is incorporated herein by reference to our definitive proxy statement with respect to our 2024 Annual Meeting of Stockholders to be filed with the SEC within 120 days after the end of the fiscal year covered by this Annual Report on Form 10-K.
As part of our system of corporate governance, our board of directors has adopted a code of business conduct and ethics. The code applies to all of our employees, officers (including our principal executive officer, principal financial officer, principal accounting officer or controller, or persons performing similar functions), agents and representatives, including our independent directors and consultants, who are not our employees, with regard to their Fortinet-related activities. Our code of business conduct and ethics is available on our website at www.fortinet.com under “Corporate—Investor Relations—Corporate Governance.” We will post on this section of our website any amendment to our code of business conduct and ethics, as well as any waivers of our code of business conduct and ethics, which are required to be disclosed by the rules of the SEC or the Nasdaq Stock Market.
ITEM 11. Executive Compensation
Information responsive to this item is incorporated herein by reference to our definitive proxy statement with respect to our 2024 Annual Meeting of Stockholders to be filed with the SEC within 120 days after the end of the fiscal year covered by this Annual Report on Form 10-K.
ITEM 12. Security Ownership of Certain Beneficial Owners and Management and Related Stockholder Matters
109
Information responsive to this item is incorporated herein by reference to our definitive proxy statement with respect to our 2024 Annual Meeting of Stockholders to be filed with the SEC within 120 days after the end of the fiscal year covered by this Annual Report on Form 10-K.
ITEM 13. Certain Relationships and Related Transactions, and Director Independence
Information responsive to this item is incorporated herein by reference to our definitive proxy statement with respect to our 2024 Annual Meeting of Stockholders to be filed with the SEC within 120 days after the end of the fiscal year covered by this Annual Report on Form 10-K.
ITEM 14. Principal Accounting Fees and Services
Information responsive to this item is incorporated herein by reference to our definitive proxy statement with respect to our 2024 Annual Meeting of Stockholders to be filed with the SEC within 120 days after the end of the fiscal year covered by this Annual Report on Form 10-K.
110
Part IV
ITEM 15. Exhibits and Financial Statement Schedules
(a) The following documents are filed as part of this Annual Report on Form 10-K:
1.Financial Statements: The information concerning Fortinet’s financial statements and the Report of Independent Registered Public Accounting Firm required by this Item 15(a)(1) is incorporated by reference herein to the section of this Annual Report on Form 10-K in Part II, Item 8, titled “Financial Statements and Supplementary Data.”
2.Financial Statement Schedule: Financial statement schedules have been omitted because they are not applicable or are not required or the information required to be set forth therein is included in the consolidated financial statements or notes thereto.
3. Exhibits: See Item 15(b) below. We have filed, or incorporated into this Annual Report on Form 10-K by reference, the exhibits listed on the accompanying Exhibit Index immediately preceding the signature page of this Annual Report on Form 10-K.
(b) Exhibits:
The exhibits listed on the Exhibit Index immediately preceding the signature page of this Annual Report on Form 10-K is incorporated herein by reference as the list of exhibits required by this Item 15(b).
(c) Financial Statement Schedules: See Item 15(a) above.
111
EXHIBIT INDEX
| Exhibit Number | Description | Form Incorporated by reference herein | Date Filed | Exhibit Number | ||||||||||||||||||||||
Restated Certificate of Incorporation | Quarterly Report on Form 10-Q (File No. 001-34511) | August 7, 2023 | 3.3 | |||||||||||||||||||||||
| Amended and Restated Bylaws | Current Report on Form 8-K (File No. 001-34511) | June 23, 2023 | 3.3 | |||||||||||||||||||||||
| Specimen common stock certificate of the Company | Registration Statement on Form S-l, as amended (File No. 333-161190) | November 2, 2009 | 4.1 | |||||||||||||||||||||||
4.2* | Description of Securities Registered Pursuant to Section 12 of the Exchange Act | |||||||||||||||||||||||||
10.1† | Forms of Indemnification Agreement between the Company and its directors and officers | Registration Statement on Form S-l (File No. 333-161190) | August 10, 2009 | 10.1 | ||||||||||||||||||||||
10.2† | Amended and Restated 2009 Equity Incentive Plan | Quarterly Report on Form 10-Q (File No. 001-34511) | August 1, 2019 | 10.1 | ||||||||||||||||||||||
10.3† | Forms of stock option agreement under Amended and Restated 2009 Equity Incentive Plan | Annual Report on Form 10-K (File No. 001-34511) | February 28, 2012 | 10.5 | ||||||||||||||||||||||
10.4† | Form of performance stock unit award agreement under Amended and Restated 2009 Equity Incentive Plan | Quarterly Report on Form 10-Q (File No. 001-34511) | August 6, 2013 | 99.1 | ||||||||||||||||||||||
10.5† | Forms of restricted stock unit award and performance stock unit award agreement under Amended and Restated 2009 Equity Incentive Plan (Additional Forms) | Annual Report on Form 10-K (File No. 001-34511) | March 2, 2015 | 10.7 | ||||||||||||||||||||||
10.6† | Form of restricted stock unit award agreement under Amended and Restated 2009 Equity Incentive Plan (Additional Form) | Annual Report on Form 10-K (File No. 001-34511) | February 26, 2020 | 10.6 | ||||||||||||||||||||||
10.7† | Form of stock option award agreement under Amended and Restated 2009 Equity Incentive Plan (Additional Form) | Annual Report on Form 10-K (File No. 001-34511) | February 26, 2020 | 10.7 | ||||||||||||||||||||||
10.8† | Fortinet, Inc. Amended Bonus Plan | Annual Report on Form 10-K (File No. 001-34511) | February 19, 2021 | 10.8 | ||||||||||||||||||||||
10.9† | Fortinet, Inc. Cash and Equity Incentive Plan | Quarterly Report on Form 10-Q (File No. 001-34511) | November 5, 2013 | 10.1 | ||||||||||||||||||||||
| Form of Change of Control Agreement between the Company and its directors | Quarterly Report on Form 10-Q (File No. 001-34511) | August 4, 2015 | 10.1 | |||||||||||||||||||||||
| Amended and Restated Change of Control Severance Agreement, effective as of August 7, 2019, between the Company and Ken Xie | Quarterly Report on Form 10-Q (File No. 001-34511) | August 1, 2019 | 10.2 | |||||||||||||||||||||||
| Amended and Restated Change of Control Severance Agreement, effective as of August 7, 2019, between the Company and Michael Xie | Quarterly Report on Form 10-Q (File No. 001-34511) | August 1, 2019 | 10.3 | |||||||||||||||||||||||
| Amended and Restated Change of Control Severance Agreement, effective as of August 7, 2019, between the Company and John Whittle | Quarterly Report on Form 10-Q (File No. 001-34511) | August 1, 2019 | 10.4 | |||||||||||||||||||||||
| Offer Letter, dated as of October 23, 2006, by and between the Company and John Whittle | Registration Statement on Form S-l, as amended (File No. 333-161190) | August 10, 2009 | 10.10 | |||||||||||||||||||||||
| Offer Letter, dated as of April 3, 2014, by and between the Company and Keith Jensen | Annual Report on Form 10-K (File No. 001-34511) | February 26, 2018 | 10.22 | |||||||||||||||||||||||
| Amended and Restated Change of Control Severance Agreement, effective as of August 7, 2019, between the Company and Keith Jensen | Quarterly Report on Form 10-Q (File No. 001-34511) | August 1, 2019 | 10.5 | |||||||||||||||||||||||
Employment Agreement, dated as of January 24, 2018, between Fortinet UK Limited and Patrice Perche | Annual Report on Form 10-K (File No. 001-34511) | February 24, 2023 | 10.17 | |||||||||||||||||||||||
Change of Control Severance Agreement, effective as of February 21, 2023, between the Company and Patrice Perche | Annual Report on Form 10-K (File No. 001-34511) | February 24, 2023 | 10.18 | |||||||||||||||||||||||
Form of performance stock unit award agreement under Amended and Restated 2009 Equity Incentive Plan | Quarterly Report on Form 10-Q (File No. 001-34511) | May 8, 2023 | 10.1 | |||||||||||||||||||||||
112
Form of restricted stock unit award agreement under Amended and Restated 2009 Equity Incentive Plan (Additional Form) | Quarterly Report on Form 10-Q (File No. 001-34511) | May 8, 2023 | 10.2 | |||||||||||||||||||||||
21.1* | List of subsidiaries | |||||||||||||||||||||||||
23.1* | Consent of Independent Registered Public Accounting Firm | |||||||||||||||||||||||||
24.1* | Power of Attorney (incorporated by reference to the signature page of this Annual Report on Form 10-K) | |||||||||||||||||||||||||
31.1* | Certification of Chief Executive Officer pursuant to Exchange Act Rules 13a-14(a) and 15d-14(a), as adopted pursuant to Section 302 of the Sarbanes-Oxley Act of 2002 | |||||||||||||||||||||||||
31.2* | Certification of Chief Financial Officer pursuant to Exchange Act Rules 13a-14(a) and 15d-14(a), as adopted pursuant to Section 302 of the Sarbanes-Oxley Act of 2002 | |||||||||||||||||||||||||
32.1** | Certifications of Chief Executive Officer and Chief Financial Officer pursuant to 18 U.S.C. Section 1350, as adopted pursuant to Section 906 of the Sarbanes-Oxley Act of 2002 | |||||||||||||||||||||||||
97.1* | Compensation Recovery Policy | |||||||||||||||||||||||||
101.INS* | Inline XBRL Instance Document - the instance document does not appear in the interactive data file because its XBRL tags are embedded within the inline XBRL document. | |||||||||||||||||||||||||
101.SCH* | Inline XBRL Taxonomy Extension Schema Document | |||||||||||||||||||||||||
101.CAL* | Inline XBRL Taxonomy Extension Calculation Linkbase Document | |||||||||||||||||||||||||
101.DEF* | Inline XBRL Taxonomy Extension Definition Linkbase Document | |||||||||||||||||||||||||
101.LAB* | Inline XBRL Taxonomy Extension Label Linkbase Document | |||||||||||||||||||||||||
101.PRE* | Inline XBRL Taxonomy Extension Presentation Linkbase Document | |||||||||||||||||||||||||
104* | Cover Page Interactive Data File - the cover page from the Company’s Annual Report on Form 10-K for the year ended December 31, 2023 is formatted in inline XBRL. | |||||||||||||||||||||||||
________________________________
† Indicates management compensatory plan, contract or arrangement.
* Filed herewith.
** Furnished herewith. This certification is deemed not filed for purposes of Section 18 of the Exchange Act, or otherwise subject to the liability of that section, nor shall it be deemed incorporated by reference into any filing under the Securities Act or the Exchange Act.
113
ITEM 16. Form 10-K summary
None.
114
SIGNATURES
Pursuant to the requirements of Section 13 or 15(d) of the Securities Exchange Act of 1934, the registrant has duly caused this report to be signed on its behalf by the undersigned, thereunto duly authorized.
Date: February 23, 2024 | ||||||||
| FORTINET, INC. | ||||||||
| By: | /s/ Ken Xie | |||||||
| Ken Xie, Chief Executive Officer and Chairman | ||||||||
(Duly Authorized Officer and Principal Executive Officer) | ||||||||
Date: February 23, 2024 | ||||||||
| FORTINET, INC. | ||||||||
| By: | /s/ Keith Jensen | |||||||
| Keith Jensen, Chief Financial Officer | ||||||||
(Duly Authorized Officer and Principal Financial Officer and Principal Accounting Officer) | ||||||||
115
POWER OF ATTORNEY
KNOW ALL PERSONS BY THESE PRESENTS, that each person whose signature appears below constitutes and appoints Ken Xie and Keith Jensen, jointly and severally, his or her attorney-in-fact, with the power of substitution, for him or her in any and all capacities, to sign any amendments to this Annual Report on Form 10-K and to file the same, with exhibits thereto and other documents in connection therewith, with the Securities and Exchange Commission, hereby ratifying and confirming all that each of said attorneys-in-fact, or his substitute or substitutes, may do or cause to be done by virtue hereof.
Pursuant to the requirements of the Securities Exchange Act of 1934, this report has been signed below by the following persons on behalf of the registrant and in the capacities and on the dates indicated.
| Signature | Title | Date | ||||||||||||
| /s/ Ken Xie | Chief Executive Officer and Chairman | February 23, 2024 | ||||||||||||
| Ken Xie | (Principal Executive Officer) | |||||||||||||
| /s/ Keith Jensen | Chief Financial Officer | February 23, 2024 | ||||||||||||
| Keith Jensen | (Principal Financial Officer and Principal Accounting Officer) | |||||||||||||
| /s/ Michael Xie | President, Chief Technology Officer and Director | February 23, 2024 | ||||||||||||
| Michael Xie | ||||||||||||||
/s/ Kenneth A. Goldman | Director | February 23, 2024 | ||||||||||||
Kenneth A. Goldman | ||||||||||||||
| /s/ Ming Hsieh | Director | February 23, 2024 | ||||||||||||
| Ming Hsieh | ||||||||||||||
| /s/ Jean Hu | Director | February 23, 2024 | ||||||||||||
| Jean Hu | ||||||||||||||
| /s/ William H. Neukom | Director | February 23, 2024 | ||||||||||||
| William H. Neukom | ||||||||||||||
| /s/ Judith Sim | Director | February 23, 2024 | ||||||||||||
| Judith Sim | ||||||||||||||
| /s/ Admiral James Stavridis | Director | February 23, 2024 | ||||||||||||
| Admiral James Stavridis | ||||||||||||||
116