UNITED STATES
SECURITIES AND EXCHANGE COMMISSION
Washington, D.C. 20549
FORM 10-K
(Mark One)
| ANNUAL REPORT PURSUANT TO SECTION 13 OR 15(d) OF THE SECURITIES EXCHANGE ACT OF 1934 | |||||
For the fiscal year ended: December 31 , 2023
OR
| TRANSITION REPORT PURSUANT TO SECTION 13 OR 15(d) OF THE SECURITIES EXCHANGE ACT OF 1934 | |||||
For the transition period from to .
Commission file number 1-9444
(Exact name of registrant as specified in its charter)
| (State or other jurisdiction of incorporation or organization) | (I.R.S. Employer Identification No.) | |||||||
(Address of principal executive offices) (Zip Code)
(419 ) 626-0830
(Registrant’s telephone number, including area code)
Securities registered pursuant to Section 12(b) of the Act:
| Title of each class | Trading Symbol(s) | Name of each exchange on which registered | ||||||
Limited Partner Interests) | ||||||||
Securities registered pursuant to Section 12(g) of the Act: None
Indicate by check mark if the registrant is a well-known seasoned issuer, as defined in Rule 405 of the Securities Act.
☑ Yes ☐ No
Indicate by check mark if the registrant is not required to file reports pursuant to Section 13 or Section 15(d) of the Act.
☐ Yes ☑ No
Indicate by check mark whether the registrant (1) has filed all reports required to be filed by Section 13 or 15(d) of the Securities Exchange Act of 1934 during the preceding 12 months (or for such shorter period that the registrant was required to file such reports), and (2) has been subject to such filing requirements for the past 90 days. ☑ Yes ☐ No
Indicate by check mark whether the registrant has submitted electronically every Interactive Data File required to be submitted pursuant to Rule 405 of Regulation S-T (§232.405 of this chapter) during the preceding 12 months (or for such shorter period that the registrant was required to submit such files). ☑ Yes ☐ No
Indicate by check mark whether the registrant is a large accelerated filer, an accelerated filer, a non-accelerated filer, a smaller reporting company, or an emerging growth company. See the definitions of "large accelerated filer," "accelerated filer," "smaller reporting company," and "emerging growth company" in Rule 12b-2 of the Exchange Act.
| ☑ | Accelerated filer | ☐ | ||||||||||||||||||
| Non-accelerated filer | ☐ | Smaller reporting company | ||||||||||||||||||
| Emerging growth company | ||||||||||||||||||||
If an emerging growth company, indicate by check mark if the registrant has elected not to use the extended transition period for complying with any new or revised financial accounting standards provided pursuant to Section 13(a) of the Exchange Act. ☐
Indicate by check mark whether the registrant has filed a report on and attestation to its management's assessment of the effectiveness of its internal control over financial reporting under Section 404(b) of the Sarbanes-Oxley Act (15 U.S.C. 7262(b)) by the registered public accounting firm that prepared or issued its audit report. ☑
If securities are registered pursuant to Section 12(b) of the Act, indicate by check mark whether the financial statements of the registrant included in the filing reflect the correction of an error to previously issued financial statements. ☐
Indicate by check mark whether any of those error corrections are restatements that required a recovery analysis of incentive-based compensation received by any of the registrant's executive officers during the relevant recovery period pursuant to §240.10D-1(b). ☐
Indicate by check mark whether the registrant is a shell company (as defined in Rule 12b-2 of the Exchange Act). ☐ Yes ☑ No
The aggregate market value of Depositary Units held by non-affiliates of the Registrant based on the closing price of such units on June 23, 2023 of $39.99 per unit was approximately $2,016,277,365 .
Number of Depositary Units representing limited partner interests outstanding as of February 9, 2024: 51,029,491 units
DOCUMENTS INCORPORATED BY REFERENCE
Part III of this Form 10-K incorporates by reference certain information from the Registrant's definitive proxy statement pursuant to Regulation 14A or an amendment to this report under cover of Form 10-K/A to be filed within 120 days of the end of its fiscal year ended December 31 , 2023
************
Page 1 of 61 pages
CEDAR FAIR, L.P.
2023 FORM 10-K CONTENTS
| PAGE | ||||||||||||||
PART I
Unless the context otherwise indicates, all references to "we," "us," "our," or the "Partnership" in this Annual Report on Form 10-K for the year ended December 31, 2023 (this "Form 10-K") refer to Cedar Fair, L.P. together with its affiliated companies.
ITEM 1. BUSINESS.
We are one of the largest regional amusement park operators in the world with 13 properties in our portfolio consisting of amusement parks, water parks and complementary resort facilities. We are a publicly traded Delaware limited partnership formed in 1987 and managed by Cedar Fair Management, Inc., an Ohio corporation (the "General Partner"), whose shares are held by an Ohio trust. Our parks are family-oriented, with recreational facilities for people of all ages, and provide clean and attractive environments with exciting rides and immersive entertainment. We generate revenue from sales of admission to our amusement parks and water parks, from purchases of food, merchandise and games both inside and outside our parks, and from the sale of accommodations and other extra-charge products.
Our parks operate seasonally except for Knott's Berry Farm, which is typically open daily on a year-round basis. Our seasonal parks are generally open daily from Memorial Day until Labor Day. Outside of daily operations, our seasonal parks are open during select weekends, including at most properties in the fourth quarter for Halloween and winter events. As a result, a substantial portion of our revenues from these seasonal parks are generated from Memorial Day through Labor Day with the major portion concentrated during the peak vacation months of July and August.
The demographic groups that are most important to our business are families and young people ages 12 through 24. Families are believed to be attracted by a combination of rides, live entertainment and the clean, wholesome atmosphere. Young people are believed to be attracted by the action-packed rides. We conduct active advertising campaigns in our major market areas geared toward these two groups.
Merger Agreement with Six Flags
On November 2, 2023, we announced that we entered into a definitive merger agreement to combine with Six Flags Entertainment Corporation (“Six Flags”) (NYSE: SIX). Subject to the terms and conditions set forth in the merger agreement, each issued and outstanding unit of limited partnership interest in Cedar Fair will be converted into the right to receive one (1) share of common stock of the new combined entity (subject to certain exceptions and as the same may be adjusted). Following the close of the transaction, the holders of units of Cedar Fair limited partnership interest will own approximately 51.2% of the outstanding shares of the combined company and the holders of Six Flags common stock will own approximately 48.8% of the outstanding shares of the combined company. The merger is expected to close in the first half of 2024, following receipt of Six Flags' stockholder approval, regulatory approvals, and satisfaction of other customary closing conditions.
DESCRIPTION OF OUR PARKS
Cedar Point
Cedar Fair's flagship park, Cedar Point, was first developed as a recreational area in 1870. Located on a peninsula in Sandusky, Ohio bordered by Lake Erie between Cleveland and Toledo, Cedar Point serves a six-state region which includes nearly all of Ohio and Michigan, western Pennsylvania and New York, northern West Virginia and Indiana, as well as southwestern Ontario, Canada. Attractive to both families and thrill-seekers, the park features 18 roller coasters, including many record-breakers, and three children's areas. Located adjacent to the park is Cedar Point Shores Water Park, a separately gated water park featuring more than 15 water rides and attractions. Cedar Point also features four hotels, three marinas, an upscale campground, and the nearby Cedar Point Sports Center which features both indoor and outdoor sports facilities. Cedar Point's four hotels include:
Hotel Breakers - the park's largest hotel and only hotel located on the Cedar Point peninsula, featuring various dining and lounge facilities, a mile-long beach, lake swimming, a conference/meeting center, an indoor pool and multiple outdoor pools;
Castaway Bay Indoor Waterpark Resort - a year-round hotel located adjacent to the entrance to the park featuring tropical, Caribbean themed hotel rooms centered around an indoor water park, as well as a marina and dining facilities;
Cedar Point's Express Hotel - a limited-service seasonal hotel located adjacent to the entrance to the park; and
Sawmill Creek Resort - a year-round resort lodge located near Cedar Point in Huron, Ohio, featuring a golf course, marina, half-mile beach, dining and shopping facilities, and a conference/meeting center.
3
Knott's Berry Farm
Knott's Berry Farm, located near Los Angeles in Buena Park, California, first opened in 1920 and was acquired by the Partnership in 1997. The park is one of several year-round theme parks in Southern California and serves a market area centered in Orange County with a large national and international tourism population. The park is renowned for its seasonal events, including a spring culinary festival, Boysenberry Festival; a special holiday event, Knott's Merry Farm; and a Halloween event, Knott's Scary Farm, which has been held for 50 years and is annually rated one of the best Halloween events in the industry by Amusement Today's international survey. Adjacent to Knott's Berry Farm is Knott's Soak City, a separately gated seasonal water park that features multiple water rides and attractions. Knott's Berry Farm also features the Knott's Hotel, a full-service hotel located adjacent to Knott's Berry Farm featuring a restaurant, meeting/banquet facilities, an outdoor pool and a fitness center.
Canada's Wonderland
Canada's Wonderland, a combination amusement and water park located near Toronto in Vaughan, Ontario, first opened in 1981 and was acquired by the Partnership in 2006. It contains numerous attractions, including 18 roller coasters, and is one of the most attended amusement parks in North America. Canada's Wonderland is in a culturally diverse metropolitan market with large populations of different ethnicities and national origins. Each year the park showcases an extensive entertainment and special event line-up which includes cultural festivals.
Kings Island
Kings Island, a combination amusement and water park located near Cincinnati, Ohio, first opened in 1972 and was acquired by the Partnership in 2006. Kings Island is also one of the most attended amusement parks in North America. The park features a children's area that has been consistently named one of the "Best Kids' Area in the World" by Amusement Today. The park's market area includes Cincinnati, Dayton and Columbus, Ohio; Louisville and Lexington, Kentucky; and Indianapolis, Indiana.
Carowinds
Carowinds, a combination amusement and water park located in Charlotte, North Carolina, first opened in 1973 and was acquired by the Partnership in 2006. Carowinds' major markets include Charlotte, Greensboro, and Raleigh, North Carolina; as well as Greenville and Columbia, South Carolina. The park also features Camp Wilderness Resort, an upscale campground, and a SpringHill Suites by Marriott hotel located adjacent to the park entrance. The SpringHill Suites is a Marriott franchise operated by Cedar Fair. The hotel is open year-round and features suites, an outdoor pool, fitness center and bar.
Kings Dominion
Kings Dominion, a combination amusement and water park located near Richmond, Virginia, first opened in 1975 and was acquired by the Partnership in 2006. The park's market area includes Richmond and Norfolk, Virginia; Raleigh, North Carolina; Baltimore, Maryland and Washington, D.C. Additionally, the park offers Kings Dominion Camp Wilderness Campground, an upscale campground.
California's Great America
California's Great America, a combination amusement and water park located in Santa Clara, California, first opened in 1976 and was acquired by the Partnership in 2006. The park draws its visitors primarily from San Jose, San Francisco, Sacramento, Modesto and Monterey, among other cities in northern California. On June 27, 2022, we sold the land at California's Great America. Concurrently with the sale, we entered into a lease contract that allows us to operate the park during a six-year term, and we have an option to extend the term for an additional five years. The lease is subject to early termination by the buyer with at least two years' prior notice.
Dorney Park
Dorney Park, a combination amusement and water park located in Allentown, Pennsylvania, was first developed as a summer resort area in 1884 and was acquired by the Partnership in 1992. Dorney Park's major markets include Philadelphia, Lancaster, Harrisburg, York, Scranton, Wilkes-Barre, Hazleton and the Lehigh Valley, Pennsylvania; New York City; and New Jersey.
Worlds of Fun
Worlds of Fun, which opened in 1973 and was acquired by the Partnership in 1995, is a combination amusement and water park located in Kansas City, Missouri. Worlds of Fun serves a market area centered in Kansas City, as well as most of Missouri and portions of Kansas and Nebraska. Worlds of Fun also features Worlds of Fun Village, an upscale campground.
Valleyfair
Valleyfair, which opened in 1976 and was acquired by the Partnership's predecessor in 1978, is a combination amusement and water park located near Minneapolis-St. Paul in Shakopee, Minnesota. Valleyfair's market area is centered in Minneapolis-St. Paul, but the park also draws visitors from other areas in Minnesota and surrounding states.
4
Michigan's Adventure
Michigan's Adventure, which opened in 1956 as Deer Park and was acquired by the Partnership in 2001, is a combination amusement and water park located in Muskegon, Michigan. Michigan's Adventure serves a market area principally from central and western Michigan and eastern Indiana.
Schlitterbahn Waterpark & Resort New Braunfels
Schlitterbahn Waterpark & Resort New Braunfels began as a resort in 1966, was introduced as a water park in 1979 and was acquired by the Partnership in 2019. The park is consistently rated the best water park in the industry by Amusement Today's international survey and is one of the most attended water parks in North America. The park, located in New Braunfels, Texas, features many river rides, water slides and attractions along the Comal River. The Resort at Schlitterbahn New Braunfels includes hotel rooms, suites, cabins, luxury suites and vacation homes. Schlitterbahn Waterpark & Resort New Braunfels’ major markets include San Antonio, Austin and Houston, Texas.
Schlitterbahn Waterpark Galveston
Schlitterbahn Waterpark Galveston opened in 2006 and was acquired by the Partnership in 2019. The park is one of the most attended water parks in North America. The park, located in Galveston, Texas, features many water attractions including an award-winning water coaster and a one-mile long river system. Schlitterbahn Waterpark Galveston serves a market area centered in Houston, Texas, as well as the tourism population in Galveston Island, Texas, a barrier island on the Texas Gulf Coast.
CAPITAL EXPENDITURES
We believe that annual park attendance is influenced by annual investments in our properties, including new attractions and infrastructure, among other factors. Capital expenditures are planned on a seasonal basis with most expenditures made prior to the beginning of the peak operating season. Capital expenditures made in a calendar year may differ materially from amounts identified with a particular operating season because of timing considerations such as weather conditions, site preparation requirements and availability of ride components, which may result in accelerated or delayed expenditures around calendar year-end.
COMPETITION
We compete for discretionary spending with all aspects of the recreation industry within our primary market areas, including other destination and regional amusement parks. We also compete with other forms of entertainment and recreational activities, including movies, sports events, restaurants and vacation travel.
The principal competitive factors in the amusement park industry include the uniqueness and perceived quality of the rides and attractions in a particular park, proximity to metropolitan areas, the atmosphere and cleanliness of the park, and the quality and variety of the food and immersive entertainment available. We believe that our parks feature a variety of high-quality rides and attractions, restaurants, gift shops and family atmosphere to make them highly competitive with other parks and forms of entertainment.
GOVERNMENT REGULATION
Our operations are subject to regulatory requirements, such as those relating to employment practices, environmental requirements, and other regulatory matters. We are subject to extensive federal and state employment laws and regulations, including wage and hour laws and other pay practices and employee record-keeping requirements. We may be required to incur costs to comply with these requirements, and the costs of compliance, investigation, remediation, litigation, and resolution of regulatory matters could be substantial.
We also are subject to federal, state and local environmental laws and regulations such as those relating to water resources; discharges to air, water and land; the handling and disposal of solid and hazardous waste; and the cleanup of properties affected by regulated materials. Under these laws and regulations, we may be required to investigate and clean up hazardous or toxic substances or chemical releases from current or formerly owned or operated facilities or to mitigate potential environmental risks. Environmental laws typically impose cleanup responsibility and liability without regard to whether the relevant entity knew of or caused the presence of the contaminants. The costs of investigation, remediation or removal of regulated materials may be substantial, and the presence of those substances, or the failure to remediate a property properly, may impair our ability to use, transfer or obtain financing with respect to our property.
Currently, we believe we are in substantial compliance with applicable requirements under these laws and regulations. However, such requirements have generally become stricter over time, and there can be no assurance that new requirements, changes in enforcement policies or newly discovered conditions relating to our properties or operations will not require significant expenditures in the future.
5
All rides are inspected daily by both our maintenance and ride operations personnel before being placed into operation for our guests. The parks are also periodically inspected by our insurance carrier and, at all parks except Valleyfair, Worlds of Fun, Schlitterbahn Waterpark New Braunfels, Schlitterbahn Waterpark Galveston and Carowinds' South Carolina rides, by state or county ride-safety inspectors. Valleyfair, Worlds of Fun, Schlitterbahn Waterpark New Braunfels, Schlitterbahn Waterpark Galveston and Carowinds each contract with a third party to inspect our rides pursuant to Minnesota, Missouri, Texas and South Carolina law, respectively, and submit the third-party report to the respective state agency. Additionally, all parks have added ride maintenance and operation inspections completed by third party qualified inspectors to make sure our standards are being maintained.
HUMAN CAPITAL
As of December 31, 2023, we employed approximately 3,350 full-time employees. Throughout 2023, we also employed approximately 49,700 seasonal and part-time employees, many of whom are high school and college students. We house some of our seasonal employees in dormitories owned by us at Cedar Point, Kings Island, Carowinds, Kings Dominion and Valleyfair, or rented by us at Dorney Park, Worlds of Fun, Schlitterbahn Waterpark New Braunfels and Schlitterbahn Waterpark Galveston. As of December 31, 2023, approximately 225 of our employees were represented by labor unions. We believe we maintain good relations with our employees.
Our associate guidelines and policies are founded on our cornerstones of safety, service and cleanliness and our core values of integrity, courtesy and inclusiveness. Our highest priority continues to be the safety and well-being of our guests and employees. We are committed to equal opportunity employment and prohibit harassment or discrimination of any kind. We have adopted an open door policy to encourage an honest employer-associate relationship, which includes a confidential hotline available to all employees. As part of our commitment to our core values, we published our second Environmental, Social and Governance ("ESG") Strategy Report in 2023. Our enterprise-wide ESG framework includes the prioritization of five key strategic pillars: Safety, Associate Happiness, Community, Environment, and Operations and Governance. As part of the Safety pillar, we have established and are working to formalize the Cedar Fair Safety Model, which enhances our longstanding commitment to workplace safety. The Cedar Fair Safety Model emphasizes associate accountability for safety, conducting safety risk assessments, implementing best practices, training, credentialing our safety associates, and assessing mitigation tactics. We have advanced our safety initiatives by focusing on better data systems, improving existing safety training, and launching the Safety Grants Initiative, which is a supplemental source of funding to encourage innovation in safety. As part of the Associate Happiness pillar, we have established the Associate Happiness Model, which frames our efforts to provide a positive associate experience using the components of authenticity, diversity, equity and inclusion. The Associate Happiness Model includes a Diversity, Equity and Inclusion ("DEI") Strategic Plan which prioritizes being an equal opportunity employer, building an inclusive work environment, developing our associates, and accelerating DEI into succession planning. We have advanced our Associate Happiness initiatives by launching a series of new awards and recognitions, launching DEI training programs, implementing an awareness month program, revising our policies and recruiting efforts to be aligned with our DEI priorities, and streamlining training courses.
We maintain training programs for new employees, including safety training specific to job responsibilities. We participate in the J-1 Visa program providing cultural and educational exchange opportunities for our associates. We also have partnered with Bowling Green State University to create the Cedar Fair Resort and Attraction Management program, a bachelor's degree program, which is housed in downtown Sandusky, Ohio in a facility jointly owned by the Partnership and a third party developer. The bachelor's degree program prepares students for management careers at Cedar Fair parks or similar establishments. We encourage a promote-from-within policy.
Our executive compensation program is designed to incentivize our key employees to drive superior results, to give key employees a vested interest in our growth and performance, and to enhance our ability to attract and retain exceptional managerial talent. Our executive compensation program rewards both successful individual performance and the consolidated operating results of the Partnership by directly tying compensation to our performance.
AVAILABLE INFORMATION
Copies of our annual report on Form 10-K, quarterly reports on Form 10-Q, and current reports on Form 8-K and all amendments to those reports as filed or furnished with the SEC are available without charge upon written request to our Investor Relations Office or through our website (www.ir.cedarfair.com).
We use our website www.ir.cedarfair.com as a channel of distribution of information. The information we post through this channel may be deemed material. Accordingly, investors should monitor this channel, in addition to following our news releases, SEC filings, and public conference calls and webcasts. The contents of our website, including without limitation the ESG Strategy Report referenced above, shall not be deemed to be incorporated herein by reference.
The SEC maintains an Internet site at http://www.sec.gov that contains our reports, proxy statements and other information.
6
SUPPLEMENTAL ITEM. Information about our Executive Officers
| Name | Age | Position(s) | ||||||||||||
| Richard A. Zimmerman | 63 | Richard Zimmerman has been President and Chief Executive Officer since January 2018 and a member of the Board of Directors since April 2019. Prior to becoming CEO, he served as President and Chief Operating Officer from October 2016 through December 2017 and served as Chief Operating Officer from 2011 through 2016. Prior to that, he was appointed as Executive Vice President in 2010 and as Regional Vice President in 2007. He has been with Cedar Fair since 2006, when Kings Dominion was acquired. Richard served as Vice President and General Manager of Kings Dominion from 1998 through 2006. | ||||||||||||
| Brian C. Witherow | 57 | Brian Witherow has served as Executive Vice President and Chief Financial Officer since 2012. Prior to that, he served as Vice President and Corporate Controller beginning in 2005. Brian has been with Cedar Fair in various other positions since 1995. | ||||||||||||
| Tim V. Fisher | 63 | Tim Fisher joined Cedar Fair as Chief Operating Officer in December 2017. Prior to joining Cedar Fair, he served as Chief Executive Officer of Village Roadshow Theme Parks International, an Australian-based theme park operator, since March 2017. Prior to this appointment with Village Roadshow Theme Parks International, Tim served as Chief Executive Officer of Village Roadshow Theme Parks since 2009. | ||||||||||||
| Brian M. Nurse | 52 | Brian Nurse joined Cedar Fair as Executive Vice President, Chief Legal Officer and Secretary in November 2021. Prior to joining Cedar Fair, he served as Senior Vice President, General Counsel and Secretary for World Wrestling Entertainment, Inc. ("WWE"), an integrated media and entertainment company, from September 2018 to November 2020. Prior to joining WWE, Brian served as Vice President, Associate General Counsel and Secretary at Nestle Waters North America, Inc., a former division of Nestle S.A. which is a multinational food and drink corporation, from 2012 to 2018. Prior to that, he was Senior Legal Counsel for North American beverage/soft drink brands at PepsiCo, Inc., a multinational food, snack and beverage corporation, from 2003 to 2012. | ||||||||||||
| David R. Hoffman | 55 | Dave Hoffman has served as Senior Vice President and Chief Accounting Officer since 2012. Prior to that, he served as Vice President of Finance and Corporate Tax since 2010. He served as Vice President of Corporate Tax from 2006 through 2010. Prior to joining Cedar Fair, Dave served as a business advisor with Ernst & Young from 2002 through 2006. | ||||||||||||
| Monica R. Sauls | 44 | Monica Sauls joined Cedar Fair as Senior Vice President and Chief Human Resources Officer in March 2023. Prior to joining Cedar Fair, she served as Senior Vice President and Chief People Officer of Bojangles, a regional chain of fast-food restaurants, from 2020 through March 2023. Prior to that, Monica served as Senior Human Resources Strategic Business Solutions Leader for Duke Energy, an electric power and natural gas holding company, from 2018 to 2020. From 2014 to 2018, she served as Senior Executive and Leadership Development Director for Boeing, a global aerospace company and manufacturer. From 2009 to 2014, she served as Human Resources and Talent Management Manager for Walgreens, a national pharmacy store chain. | ||||||||||||
| Charles E. Myers | 60 | Charles Myers joined Cedar Fair as Senior Vice President, Creative Development in June 2019. Prior to joining Cedar Fair, he held a variety of Senior Leadership roles including Show Design, Production Management and Producing at Walt Disney Imagineering, the research and development arm of the Walt Disney Company, from 2013 to June 2019. Prior to this, he served as Senior Vice President, Licensing, Project Development & Business Development of Paramount Pictures from 2002 to 2013. | ||||||||||||
7
ITEM 1A. RISK FACTORS.
Risks Related to the Amusement Park Industry
Instability in economic conditions could impact our business, including our results of operations and financial condition.
Uncertain or deteriorating economic conditions, including during inflationary and recessionary periods, may adversely impact attendance figures and guest spending patterns at our parks as uncertain economic conditions affect our guests' levels of discretionary spending. Both attendance and in-park spending at our parks are key drivers of our revenues and profitability, and reductions in either can directly and negatively affect revenues and profitability. A decrease in discretionary spending due to a decline in consumer confidence in the economy, an economic slowdown or deterioration in the economy could adversely affect the frequency with which our guests choose to attend our parks and the amount that our guests spend on our products when they visit.
Periods of inflation or economic downturn could also impact our ability to obtain supplies and services and increase our operating costs. We continue to see some inflationary effects and supply chain disruptions on our business, which may continue or worsen. In addition, the existence of unfavorable general economic conditions may also hinder the ability of those with which we do business, including vendors, concessionaires and customers, to satisfy their obligations to us. The materialization of these risks could lead to a decrease in our revenues, operating income and cash flows.
Public health concerns or a future pandemic could adversely impact our business, as well as intensify certain risks we face.
Consumer behavior and preferences changed in response to the effects of the COVID-19 pandemic and may remain changed both in the short term and long term, including impacts on discretionary consumer spending due to economic uncertainty and changing risk tolerances of our employees and guests regarding health matters. Future significant volatility or reductions in demand for, or interest in, our parks could materially adversely impact attendance, in-park per capita spending and revenue. In addition, we could experience damage to our brand and reputation due to actual or perceived health risks associated with our parks or the amusement park industry which could have a similar material adverse effect on attendance, in-park per capita spending and revenue. We may also experience operational risks, including limitations on our ability to recruit and train employees in sufficient numbers to fully staff our parks as a result of changing risk tolerances.
Because our amusement and water parks and complementary resort facilities are the primary sources of net income and operating cash flows, any future mandated or voluntary closures or other operating restrictions related to a future pandemic could adversely impact our business and financial results. Our parks are geographically located throughout the United States and in Canada. The duration and severity of a pandemic and the related restrictions at any one location could result in a potentially disproportionate amount of risk if concentrated amongst our largest properties.
The high fixed cost structure of amusement park operations can result in significantly lower margins, profitability and cash flows if attendance levels do not meet expectations.
A significant portion of our expenses are relatively fixed because the costs for full-time employees, maintenance, utilities, advertising and insurance do not vary significantly with attendance. These fixed costs may increase and may not be able to be reduced at a rate proportional with ongoing attendance levels. If cost-cutting efforts are insufficient or are impractical, we could experience a material decline in margins, profitability and cash flows. Such effects can be especially pronounced during periods of economic contraction or slow economic growth.
Bad or extreme weather conditions can adversely impact attendance at our parks, which in turn would reduce our revenues.
Because most of the attractions at our parks are outdoors, attendance at our parks can be adversely affected by continuous bad or extreme weather and by forecasts of bad or mixed weather conditions, which would negatively affect our revenues. We believe that our ownership of many parks in different geographic locations reduces, but does not completely eliminate, the effect that adverse weather can have on our consolidated results. This risk could be magnified by the effects of climate change, including more extreme temperatures, excessive precipitation or wind, wildfires and hurricanes.
Our insurance coverage may not be adequate to cover all possible losses that we could suffer, and our insurance costs may increase.
Although we carry liability insurance to cover possible incidents, our coverage may not be adequate to cover liabilities, we may not be able to obtain coverage at commercially reasonable rates, and we may not be able to obtain adequate coverage should a catastrophic incident occur at our parks or at other parks. Companies engaged in the amusement park business may be sued for substantial damages in the event of an actual or alleged incident. An incident occurring at our parks or at competing parks could reduce attendance, increase insurance premiums, and negatively impact our operating results.
8
Unanticipated construction delays in completing capital improvement projects in our parks and resort facilities, significant ride downtime, or other unplanned park closures could adversely affect our revenues.
A meaningful marketing factor for an amusement park is the uniqueness and perceived quality of its rides and attractions in a particular market area. Accordingly, the regular addition of new rides and attractions is important, and a key element of our revenue growth is strategic capital spending on new rides and attractions. Any construction delays could adversely affect our attendance and our ability to realize revenue growth. Further, when rides, attractions, or an entire park, have unplanned downtime and/or closures, our revenue could be adversely affected.
There is a risk of accidents or other incidents occurring at amusement and water parks, which may reduce attendance and negatively impact our revenues.
The safety of our guests and employees is one of our top priorities. Our amusement and water parks feature thrill rides. There are inherent risks involved with these attractions, and an accident or a serious injury at any of our parks could result in negative publicity and could reduce attendance and result in decreased revenues. In addition, accidents or injuries at facilities operated by our competitors, including amusement parks, could influence the general attitudes of patrons and adversely affect attendance at our parks. Other types of incidents such as food borne illnesses and disruptive, negative guest behavior which have either been alleged or proved to be attributable to our parks or our competitors could adversely affect attendance and revenues.
Extended disruptions to our technology platforms may adversely impact our sales and revenues.
A large portion of our sales are processed online and utilize third party technology platforms. Our increased dependence on these technology platforms may adversely impact our sales, and therefore our revenues, if key systems are disrupted for an extended period of time.
Risks Related to the Proposed Merger with Six Flags
The proposed merger with Six Flags and integration of both companies may be more difficult, costly or time-consuming than expected, and we may fail to realize the anticipated benefits of the merger.
The success of the proposed merger with Six Flags will depend in part on our ability to realize anticipated revenue and cost synergies and on our ability to successfully integrate the businesses. If we are not able to successfully achieve these objectives, the anticipated benefits of the merger may not be realized fully, or at all, or may take longer to realize than expected. In addition, our ability to achieve the goals for the proposed merger may be affected by future prospects, execution of business strategies, and our ability to manage the various factors discussed within this report, including within the forward-looking statements. The actual benefits of the proposed merger also could be less than anticipated if, for example, completion of the merger and/or integration of the businesses are more difficult, costly or time-consuming than we expect.
The market price of the combined company's common stock following the closing of the merger may be affected by factors different from those that historically have affected or currently affect our units.
Upon completion of the merger, the combined company's financial position may differ from each of Six Flags' and Cedar Fair's financial positions before the completion of the merger, and the results of operations of the combined company may be affected by factors that are different from those currently affecting the results of operations of each of Six Flags and Cedar Fair. Accordingly, the market price and performance of the combined company's common stock is likely to be different from the performance of our units prior to the closing of the merger.
We have incurred and expect to continue to incur substantial costs, fees, expenses, and charges related to the merger and integration, and may incur additional costs we do not currently anticipate.
We have incurred and expect to continue to incur additional costs, fees, expenses, and charges related to the merger and integration. We may incur additional costs that we do not currently anticipate. These costs include and may include legal, financial advisory, accounting, consulting and other advisory fees, retention, severance and employee benefit-related costs, public company filing fees and other regulatory fees, as well as closing, integration and other related costs. Some of the costs are payable regardless of whether or not the merger is completed.
We may be unable to retain personnel successfully while the merger is pending or after the merger is completed.
The success of the merger will depend in part on our ability to retain key employees while the merger is pending or after the merger is consummated. If we are unable to retain key employees, including management, who are critical to the successful completion, integration and future operation of the combined company, we could face disruption in our operations, loss of key information, expertise or know-how, or unanticipated recruiting costs, which may impact our ability to achieve our goals related to the transaction.
The announcement or completion of the proposed merger may disrupt and/or harm our current plans and operations or those of Six Flags, may divert management’s time and attention and may affect existing business relationships, any of which may impact financial performance, operating results and/or our ability to achieve the benefits of the merger.
The announcement or completion of the proposed merger may disrupt and/or harm our current plans and operations and/or those of Six Flags. Management’s time and attention also may be diverted on transaction-related issues. There also may be adverse reactions to or changes in business relationships as a result of the announcement or completion of the merger. Any of
9
these factors could affect our and/or Six Flags’ financial performance or operating results, and/or could impact our ability to achieve the benefits of the merger.
Regulatory approvals may not be received, may take longer than expected, or may impose conditions that are not presently anticipated or that affect the anticipated benefits of the merger.
Before the merger may be completed, various approvals, consents and non-objections must be obtained from regulatory authorities in the United States and Mexico. These approvals could be delayed or not obtained at all, which could disrupt operations, or could delay or adversely affect completion of the merger. In Mexico, on January 25, 2024, the Mexican Federal Competition Commission concluded its review of the transactions and determined to allow the transactions to proceed as proposed, subject to customary statutory requirements. On January 22, 2024, Six Flags and Cedar Fair each received a request for additional information and documentary materials (a "Second Request") from the U.S. Department of Justice ("DOJ") in connection with the DOJ's review of the merger. The effect of a Second Request is to extend the waiting period imposed by the Hart-Scott-Rodino Act ("HSR Act"), until 30 days after each of Six Flags and Cedar Fair has substantially complied with the Second Request issued to it, unless that period is extended voluntarily by the parties or terminated earlier by the DOJ. The Second Request, and any further inquiries or actions from the DOJ, could have the effect of substantially delaying, imposing restrictions on, or impeding or precluding the completion of the proposed merger. In deciding whether to grant antitrust clearance, the DOJ will consider the effect of the merger on competition and take such action under the antitrust laws as it deems necessary or desirable in the public interest. The DOJ may take steps to prevent the merger, or the approvals that are granted may impose terms and conditions, including requiring the parties to seek divestitures of substantial assets, limitations, obligations or costs, or place restrictions on the conduct of the combined company's business or require changes to the terms of the transactions contemplated by the merger agreement, which could affect the anticipated benefits of the merger.
The merger agreement may be terminated in accordance with its terms, and the merger may not be completed, which could negatively impact our business, financial results, and/or unit price.
The merger agreement is subject to a number of conditions which must be satisfied or waived in order to complete the merger, including approval of Six Flags' stockholders. If the merger is not completed or is delayed for any reason, there may be adverse consequences and we may experience negative reactions from investors, the financial markets, our customers, our vendors and/or our employees.
The merger agreement subjects Six Flags and Cedar Fair to restrictions on their respective business activities prior to the closing of the merger.
The merger agreement subjects Six Flags and Cedar Fair to restrictions on their respective business activities prior to the closing of the merger. The merger agreement obligates each of Six Flags and Cedar Fair to generally conduct its businesses in the ordinary course until the closing and to use its reasonable best efforts to (i) preserve intact their current business organizations, (ii) preserve their assets and properties in good repair and condition and (iii) keep available the services of their current officers and other key employees and preserve their relationships with those having business dealings with Six Flags and Cedar Fair. These restrictions could prevent Six Flags and Cedar Fair from pursuing certain business opportunities that arise prior to the closing and are outside the ordinary course of business.
The merger agreement limits Cedar Fair’s ability to pursue alternative transaction proposals, which may discourage other companies from making a favorable alternative transaction proposal.
The merger agreement contains certain provisions that restrict Cedar Fair’s ability to solicit, initiate or knowingly encourage (including by way of furnishing information), or take any other action designed to facilitate, any inquiries regarding, or the making of, any proposal the consummation of which would constitute an “Alternative Transaction”, which includes, among other things: any transaction or series of transactions which result in the acquisition of more than 20% of the outstanding equity or voting power of Cedar Fair; any merger, consolidation, share exchange or similar transaction resulting in the acquisition or, or acquisition of control over, assets or business representing 20% or more of the consolidated revenues, net income or assets of Cedar Fair; or any transaction resulting in the disposition of assets representing 20% or more of the consolidated revenues, net income or assets of Cedar Fair (each such transaction or series of transactions, an “Alternative Transaction”). Additionally, Cedar Fair is subject to restrictions on its ability to participate in any discussions or negotiations, or cooperate with any third parties with respect to any inquiries regarding, or the making of, any proposal the consummation of which would constitute an Alternative Transaction. These provisions could discourage a potential third-party acquirer or other strategic transaction partner that might have an interest in acquiring all or a significant portion of Cedar Fair from considering or pursuing an Alternative Transaction.
Litigation relating to the proposed merger may be filed against Six Flags, us and/or each entity's board of directors that could prevent or delay the closing and/or result in the payment of damages.
In connection with the proposed merger, it is possible that the stockholders of Six Flags and/or our unitholders may file lawsuits against Six Flags, us and/or each entity's board of directors. Among other remedies, these stockholders and/or unitholders could seek damages and/or to enjoin the merger. Any such potential lawsuits could prevent or delay the closing and/or result in substantial costs to us. The outcome of any such actions would be uncertain and may create uncertainty relating to the merger and may be costly and distracting to management. Further, the defense or settlement of any lawsuit or claim that remains unresolved at the time of the merger may adversely affect our business, financial condition, results of operations and cash flows or those of the combined entity.
10
Our unitholders as of immediately prior to the merger will have reduced ownership in the combined company.
Following the closing of the proposed merger, Six Flags’ existing stockholders are expected to own approximately 48.8% of the issued and outstanding shares of the combined company and our existing unitholders are expected to own approximately 51.2% of the issued and outstanding shares of the combined company, in each case on a fully diluted basis. As a result, existing Cedar Fair unitholders will have less influence on the policies of the combined company than they currently have on the policies of Cedar Fair.
Declaration, payment and amounts of dividends, if any, distributed to stockholders of the combined company will be uncertain.
Although we have paid cash distributions on our units in the past, the combined company board may determine not to declare dividends in the future or may reduce the amount of dividends paid in the future. Any payment of future dividends will be at the discretion of the combined company board and will depend on the combined company's results of operations, financial condition, cash requirements, future prospects and other considerations that the combined company board deems relevant.
Even if the merger otherwise qualifies for tax-free treatment, a unitholder will recognize taxable gain upon the exchange of units if and to the extent that the aggregate amount of our liabilities attributable for tax purposes to the units exchanged by the unitholder exceeds the unitholder’s aggregate tax basis in the units exchanged.
It is intended that, for U.S. federal income tax purposes, the merger qualify as a transaction described in Section 351 of the Code pursuant to which generally no gain or loss is recognized. However, even if the merger qualifies as a transaction described in Section 351 of the Code, under Section 357(c) of the Code, if a corporation assumes or is treated for U.S. federal income tax purposes as having assumed liabilities of the transferor or accepts property subject to liabilities in an exchange described in Section 351 of the Code, the transferor generally must recognize taxable gain in the amount by which the liabilities exceed the transferor’s basis in the property contributed to the corporation. Under Section 752 of the Code, the liabilities of the Partnership are allocated to its unitholders and as a result of the merger, the liabilities allocated to the unitholders will be treated as having been assumed by the successor combined company and will be subject to Section 357(c) of the Code. Accordingly, a unitholder will recognize taxable gain upon the exchange of units in the merger if and to the extent that (i) the aggregate amount of the Partnership liabilities attributable to the units exchanged by the unitholder exceeds (ii) the unitholder's aggregate tax basis in the units exchanged by such unitholder.
Our non-U.S. unitholders will be subject to withholding in the exchange of partnership units for the successor merged company stock and the applicable withholding agent may satisfy such withholding by retaining shares of the successor merged company stock or cash or other property of our non-U.S. unitholder.
Our non-U.S. unitholders are taxed by the U.S. on income effectively connected with the conduct of a U.S. trade or business, unless exempted or further limited by an income tax treaty. Each non-U.S. holder is considered to be engaged in business in the U.S. because of their ownership of our units. Furthermore, it is probable that such non-U.S. holders are deemed to conduct such activities through permanent establishments in the U.S. within the meaning of applicable tax treaties. Treasury Regulations under Section 1446(f) of the Code provide that the broker effecting the transfer of a unitholder’s interest in a publicly traded partnership engaged in a U.S. trade or business, such as the Partnership, is required to withhold 10% of the amount realized, even if the exchange otherwise qualified for nonrecognition treatment for U.S. federal income tax purposes. Our non-U.S. holders should expect to have the applicable withholding agent withhold 10% of the gross proceeds received by the non-U.S. unitholder, and the applicable withholding agent may satisfy such withholding by withholding shares of the successor merged company or cash or other property of the non-U.S. unitholder.
The Amendments, as defined in Note 6 of the Consolidated Financial Statements, becoming operative and payment of the Consent Payment, as defined in Note 6 to the Consolidated Financial Statements, in connection with the Consent Solicitation, as defined in Note 6 to the Consolidated Financial Statements, with respect to our bonds may result in our unitholders being allocated cancellation of debt income (CODI) for U.S. federal income tax purposes.
In connection with the Consent Solicitation with respect to our bonds, the Amendments may become operative and certain holders of our bonds may receive the Consent Payment as described in Note 6.
We intend to take the position that the Amendments becoming operative for any series of our bonds would not result in a significant modification or the Partnership recognizing CODI for U.S. federal income tax purposes. However, such position is not free from doubt.
Payment of the Consent Payment in connection with the Consent Solicitation may result in a “significant modification” of one or more series of our bonds as determined for U.S. federal income tax purposes, and therefore, a deemed exchange of old bonds for new bonds. If one or more series of our bonds were to undergo such a significant modification, the Partnership may recognize CODI, which would be allocated and taxable to our unitholders. We are not able to calculate whether the payment of the Consent Payment will result in a significant modification or the amount of CODI, if any, that would be allocated and taxable to our unitholders until the Consent Payment is paid, which is expected to occur, if at all, upon or immediately prior to consummation of the merger.
11
Risks Related to Our Strategy
Our growth strategy may not achieve the anticipated results.
Our future success will depend on our ability to grow our business. We grow our business through acquisitions and capital investments to improve our parks through new rides and attractions, as well as in-park product offerings and product offerings outside of our parks. Our growth and innovation strategies require significant commitments of management resources and our investments may not grow our revenues at the rate we expect or at all. As a result, we may not be able to recover the costs incurred in developing new projects and initiatives, or to realize their intended or projected benefits, which could have a material adverse effect on our business, financial condition or results of operations.
We compete for discretionary spending and discretionary free time with many other entertainment alternatives and are subject to factors that generally affect the recreation and leisure industry, including general economic conditions.
Our parks compete for discretionary spending and discretionary free time with other amusement, water and theme parks and with other types of recreational activities and forms of entertainment, including movies, sporting events, restaurants and vacation travel. Our business is also subject to factors that generally affect the recreation and leisure industries and are not within our control. Such factors include, but are not limited to, general economic conditions, including relative fuel prices, and changes in consumer tastes and spending habits. There may be a material adverse effect on our business, financial condition or results of operations if we are unable to effectively compete with other entertainment alternatives.
The operating season at most of our parks is of limited duration, which can magnify the impact of adverse conditions or events occurring within that operating season.
Twelve of our properties are seasonal and are generally open daily from Memorial Day through Labor Day. Outside of daily operations, our seasonal properties are typically open during select weekends, including at most properties in the fourth quarter for Halloween and winter events. As a result, a substantial portion of our revenues from these seasonal parks are generated from Memorial Day through Labor Day with the major portion concentrated during the peak vacation months of July and August. Consequently, when adverse conditions or events occur during the operating season, particularly during the peak vacation months of July and August or the important fall season, there is only a limited period of time during which the impact of those conditions or events can be mitigated. Accordingly, the timing of such conditions or events may have a disproportionate adverse effect upon our revenues.
Risks Related to Human Capital
Increased costs of labor and employee health and welfare benefits may impact our results of operations.
Labor is a primary component in the cost of operating our business. Increased labor costs, due to competition, inflationary pressures, increased federal, state or local minimum wage requirements, and increased employee benefit costs, including health care costs, could adversely impact our operating expenses. Since the COVID-19 pandemic, we experienced a meaningful increase in the seasonal labor rate in order to recruit employees in a challenging labor market. Continued increases to both market wage rates and the statutory minimum wage rates could also materially impact our future seasonal labor rates. It is possible that these changes could significantly increase our labor costs, which would adversely affect our operating results and cash flows.
Our business depends on our ability to meet our workforce needs.
Our success depends on our ability to attract, motivate and retain qualified employees to keep pace with our needs. If we are unable to do so, our results of operations and cash flows may be adversely affected. We employ a significant workforce each season. We recruit year-round to fill thousands of staffing positions to ensure the appropriate workforce is in place at the right time. We may be unable to recruit and hire adequate personnel as the business requires or we may experience material increases in the cost of securing our workforce in the future.
If we lose key personnel, our business may be adversely affected.
Our success depends in part upon a number of key employees, including our senior management team, whose members have been involved in the leisure and hospitality industries for an average of more than 20 years. The loss of services of our key employees or our inability to replace our key employees could cause disruption in important operational, financial and strategic functions and have a material adverse effect on our business.
Risks Related to Our Capital Structure
The amount of our indebtedness could adversely affect our ability to raise additional capital to fund our operations, limit our ability to react to changes in the economy or our industry and prevent us from fulfilling our obligations under our debt agreements.
We had $2.3 billion of outstanding indebtedness as of December 31, 2023 (before reduction of debt issuance costs).
The amount of our indebtedness could have important consequences. For example, it could:
12
•limit our ability to borrow money for our working capital, capital expenditures, debt service requirements, strategic initiatives or other purposes;
•limit our flexibility in planning or reacting to changes in business and future business operations; and
•make it more difficult for us to satisfy our obligations with respect to our indebtedness, and any failure to comply with the obligations of any of our debt instruments, including restrictive covenants and borrowing conditions, could result in an event of default under the agreements governing other indebtedness.
In addition, we may not be able to generate sufficient cash flow from operations, or be able to draw under our revolving credit facility or otherwise, in an amount sufficient to fund our liquidity needs, including the payment of principal and interest on our debt obligations. If our cash flows and capital resources are insufficient to service our indebtedness, we may be forced to reduce or delay capital expenditures, suspend partnership distributions, sell assets, seek additional capital or restructure or refinance our indebtedness. These alternative measures may not be successful and may not permit us to meet our scheduled debt service obligations. Our ability to restructure or refinance our debt in the future will depend on the condition of the capital and credit markets and our financial condition at such time. Any refinancing of our debt could be at higher interest rates and may require us to comply with more onerous covenants, which could further restrict our business operations. In addition, the terms of our existing or future debt agreements, including our credit agreement and the indentures governing our notes, may restrict us from adopting some of these alternatives. In the absence of sufficient operating results and resources, we could face substantial liquidity problems and might be required to dispose of material assets or operations to meet our debt service and other obligations. We may not be able to consummate those dispositions for fair market value or at all. Furthermore, any proceeds that we could realize from any such dispositions may not be adequate to meet our debt service obligations then due.
Despite the amount of our indebtedness, we may be able to incur additional indebtedness, which could further exacerbate the risks associated with the amount of our indebtedness.
Our debt agreements contain restrictions that could limit our flexibility in investing in our business, including the ability to pay partnership distributions.
Our credit agreement and the indentures governing our notes contain, and any future indebtedness of ours will likely contain, a number of covenants that could impose significant financial restrictions on us, including restrictions on our and our subsidiaries' ability to, among other things:
•pay distributions on or make distributions in respect of our partnership units or make other Restricted Payments, including unit repurchases;
•incur additional debt or issue certain preferred equity;
•make certain investments;
•sell certain assets;
•create restrictions on distributions from restricted subsidiaries;
•create liens on certain assets to secure debt;
•consolidate, merge, amalgamate, sell or otherwise dispose of all or substantially all our assets;
•enter into certain transactions with our affiliates; and
•designate our subsidiaries as unrestricted subsidiaries.
Our credit agreement includes a Senior Secured Leverage Ratio of 3.75x Total First Lien Senior Secured Debt-to-Consolidated EBITDA. This financial covenant is only required to be tested at the end of any fiscal quarter in which revolving credit facility borrowings are outstanding.
Our credit agreement and fixed rate note agreements include Restricted Payment provisions, which could limit our ability to pay partnership distributions. Pursuant to the terms of the indenture governing the 2027 senior notes, which includes the most restrictive of these Restricted Payments provisions, if our pro forma Total-Indebtedness-to-Consolidated-Cash-Flow Ratio is greater than 5.25x, we can still make Restricted Payments of $100 million annually so long as no default or event of default has occurred and is continuing. If our pro forma Total-Indebtedness-to-Consolidated-Cash-Flow Ratio is less than or equal to 5.25x, we can make Restricted Payments up to our Restricted Payment pool.
Variable rate indebtedness could subject us to the risk of higher interest rates, which could cause our future debt service obligations to increase.
Our credit agreement is and our future borrowings may be at variable rates of interest and expose us to interest rate risk. If interest rates continue to increase, our annual debt service obligations on any variable-rate indebtedness would increase even though the amount borrowed remained the same, and our net income would decrease.
Risks Related to Legal, Regulatory and Compliance Matters
Cyber-security risks and the failure to maintain the integrity of internal or customer data could result in damages to our reputation and/or subject us to costs, fines or lawsuits.
In the normal course of business, we, or third parties on our behalf, collect and retain large volumes of internal and customer data, including credit card numbers and other personally identifiable information, which is used for marketing and promotional
13
purposes, and our various information technology systems enter, process, summarize and report such data. We also maintain personally identifiable information about our employees. The integrity and protection of such data is critical to our business, and our guests and employees have a high expectation that we will adequately protect their personal information. The regulatory environment, as well as the requirements imposed on us by the credit card industry, governing information, security and privacy laws is increasingly demanding and continues to evolve. Maintaining compliance with applicable security and privacy regulations may increase our operating costs and/or adversely impact our ability to market our parks, products and services to our guests. Furthermore, if a person could circumvent our security measures, he or she could destroy or steal valuable information or disrupt our operations. Any security breach could expose us to risks of data loss, which could harm our reputation and result in remedial and other costs, fines or lawsuits. Although we carry liability insurance to cover this risk, our coverage may not be adequate to cover liabilities, and we may not be able to obtain adequate coverage should a catastrophic incident occur.
Our operations, our workforce and our ownership of property subject us to various laws and regulatory compliance, which may create uncertainty regarding future expenditures and liabilities.
We may be required to incur costs to comply with regulatory requirements, such as those relating to employment practices, environmental requirements, and other regulatory matters, and the costs of compliance, investigation, remediation, litigation, and resolution of regulatory matters could be substantial. We may also be required to incur additional costs and commit management resources to comply with proposed regulatory requirements that may become effective in the near future, including ESG initiatives, which continue to be a focus for investors and other stakeholders. Any ESG initiatives entered into by us may not realize their intended or projected benefits.
We are subject to extensive federal and state employment laws and regulations, including wage and hour laws and other pay practices and employee record-keeping requirements. We periodically have had to, and may have to, defend against lawsuits asserting non-compliance. Such lawsuits can be costly, time consuming and distract management, and adverse rulings in these types of claims could negatively affect our business, financial condition or results.
We also are subject to federal, state and local environmental laws and regulations such as those relating to water resources; discharges to air, water and land; the handling and disposal of solid and hazardous waste; and the cleanup of properties affected by regulated materials. Under these laws and regulations, we may be required to investigate and clean up hazardous or toxic substances or chemical releases from current or formerly owned or operated facilities or to mitigate potential environmental risks. Environmental laws typically impose cleanup responsibility and liability without regard to whether the relevant entity knew of or caused the presence of the contaminants. The costs of investigation, remediation or removal of regulated materials may be substantial, and the presence of those substances, or the failure to remediate a property properly, may impair our ability to use, transfer or obtain financing regarding our property.
Our tax treatment is dependent on our status as a partnership for federal income tax purposes. If the tax laws were to treat us as a corporation or we become subject to a material amount of entity-level taxation, it may substantially reduce our available cash.
We are a limited partnership under Delaware law and are treated as a partnership for federal income tax purposes. A change in current tax law may cause us to be taxed as a corporation for federal income tax purposes or otherwise subject us to taxation as an entity. If we were treated as a corporation for federal income tax purposes, we would pay federal income tax on our entire taxable income at the corporate tax rate, rather than only on the taxable income from our corporate subsidiaries, and may be subject to additional state taxes at varying rates. Further, unitholder distributions would generally be taxed again as corporate distributions or dividends and no income, gains, losses, or deductions would flow through to unitholders. Because additional entity level taxes would be imposed upon us as a corporation, our available cash could be substantially reduced. Although we are not currently aware of any legislative proposal that would adversely impact our treatment as a partnership, we are unable to predict whether any changes or other proposals will ultimately be enacted.
Our status as a partnership for federal income tax purposes subjects us and our unitholders to additional tax reporting that may be costly and may increase complexity.
Because we are treated as a partnership for federal income tax purposes, we are required to annually report to our unitholders certain partnership items. The nature of these items and the evolving legislation surrounding these reporting requirements may increase our unitholders' compliance cost and the cost of owning our units.
General Risk Factors
Other factors, including local events, natural disasters, pandemics and terrorist activities, or threats of these events, could adversely impact park attendance and our revenues.
Lower attendance may result from various local events, natural disasters, pandemics or terrorist activities, or threats of these events, all of which are outside of our control.
ITEM 1B. UNRESOLVED STAFF COMMENTS.
None.
14
ITEM 1C. CYBERSECURITY.
As described under Item 1A in this Form 10-K, we are subject to risks from cybersecurity threats, including risks relating to maintaining customer and employee data. Cybersecurity is a key focus at multiple levels of our organization, and we have developed policies and procedures to assess, identify and manage risks from cybersecurity threats.
–Board of Directors – Enterprise risk management (“ERM”) process: As part of the ERM process, executive management and the Board of Directors regularly review an assessment related to cybersecurity and data protection risks to identify material risk areas, assess our processes to mitigate those risks, and identify process and procedure improvements to alleviate identified risks, including allocating appropriate resources. Cybersecurity and data protection focus areas of ERM include phishing, malware, data breaches, outdated software, staffing levels for key information technology positions, and risks associated with our use of third parties.
–Audit Committee of the Board of Directors: The Audit Committee is responsible for discussing the Company’s major information technology risk exposures, including cybersecurity, and the steps management has taken to monitor and control such exposures. The Audit Committee dedicates attention to and provides oversight of certain cybersecurity risks. The Chief Information Officer and Corporate Vice President, IT Infrastructure Operations and Security, meet with the Audit Committee regularly to assess management’s progress on implementing process and procedure improvements related to cybersecurity. The Audit Committee also provides guidance on long-term and short-term cybersecurity strategies.
–Executive Management – Technology Governance Committee: The Technology Governance Committee consists of certain members of executive management, including the Chief Accounting Officer, Chief Information Officer, Chief Commercial Officer, Chief Strategy Officer, and Corporate Vice President, IT Infrastructure Operations and Security. This committee evaluates projects involving information technology, including reviewing best practices and change management needs and communicating a company-wide approach. Therefore, the information technology department is aware of system and application implementations prior to execution to facilitate proper application and infrastructure security both during implementation and after implementation. Internal audit is notified of system and application implementations as part of this process as well. The internal audit department works with the information technology department to review information technology projects to ensure key projects are appropriately planned, designed, developed, tested, deployed and maintained, including verifying proper security both during and after implementation.
–Information Technology Department: The information technology department consists of employees with extensive cybersecurity experience, including the Chief Information Officer and Corporate Vice President, IT Infrastructure Operations and Security, as well as a team of compliance and security associates. Cybersecurity experience within the information technology department includes prior work experience and bachelor's degrees or higher in technology related fields. In addition to internal resources, we engage a cyber insurance carrier with comprehensive data privacy and security risk management services; a managed security service provider with comprehensive security solutions, including continuous network monitoring, reporting and assistance with investigation; and an information security consulting company that consists of cybersecurity experts and information security practitioners to provide additional cybersecurity support. We also maintain a system of information technology controls and procedures, including controls and procedures related to authentication and access, recovery plans and secured backups of data, the design of applications and selection of packaged software, and testing of significant changes in applications and infrastructure technology. We also provide training to our employees about cybersecurity, perform penetration testing at least annually, perform security incident preparedness activities at least annually, and perform an annual Payment Card Industry (“PCI”) attestation. Third party providers involving information technology are identified as part of our contract review process. System and Organizational Controls (“SOC”) reports are reviewed annually for third party providers. The information technology department continuously monitors for cybersecurity threats in order to detect if a cybersecurity incident has occurred. The department uses endpoint detection and response (“EDR”) and security information and event management (“SIEM”) with the assistance of our managed security service provider and internal analysts to detect and identify threats. Lastly, we follow the National Institute of Standards and Technology ("NIST") Framework, which enables us to compare ourselves against the industry and manage dynamic cybersecurity risks.
If a cybersecurity incident were to occur, including a cybersecurity incident associated with one of our third-party providers, we have developed an incident response plan to align responsibilities throughout the organization to facilitate an efficient and effective response, as well as an appropriate investigation of each incident. The incident response plan is led by executive management, the Chief Information Officer, the Corporate Vice President, IT Infrastructure Operations and Security, and our information technology department and includes a further delegation of incident responsibility to key internal stakeholders, including the legal, investor relations, human resources, and internal audit departments. Upon identification of an incident, each incident is assigned an incident materiality rating based on both quantitative and qualitative considerations. Qualitative considerations include the presence of ransomware, operational degradation or interruption, operational loss, and sensitive or confidential data loss. Based on the severity of each incident, the incident response is escalated. Cybersecurity incidents, regardless of materiality, are investigated by the information technology department led by Corporate Vice President, IT Infrastructure Operations and Security and are communicated to the Chief Executive Officer, Chief Financial Officer, Chief Legal
15
Officer, Chief Information Officer, the Chairman of the Board of Directors and the Chair of the Audit Committee. The entire Board of Directors is notified of material or high risk incidents.
Risks from cybersecurity threats could materially affect our business strategy, results of operations or financial condition as described under Item 1A in this Form 10-K. There are no known risks from cybersecurity incidents that have materially affected or are reasonably likely to materially affect the registrant as of the date of this filing.
ITEM 2. PROPERTIES.
| Park | Location | Approximate Total Acreage | Approximate Developed Acreage | Approximate Undeveloped Acreage | |||||||||||||
| Cedar Point Cedar Point Shores | (1) | Sandusky, Ohio | 860 | 725 | 135 | ||||||||||||
| Knott's Berry Farm Knott's Soak City | Buena Park, California | 175 | 175 | — | |||||||||||||
| Canada's Wonderland | Vaughan, Ontario, Canada | 295 | 295 | — | |||||||||||||
| Kings Island | Mason, Ohio | 650 | 330 | 320 | |||||||||||||
| Carowinds | Charlotte, North Carolina and Fort Mill, South Carolina | 400 | 300 | 100 | |||||||||||||
| Kings Dominion | Doswell, Virginia | 740 | 280 | 460 | |||||||||||||
| California's Great America | (2) | Santa Clara, California | 175 | 175 | — | ||||||||||||
| Dorney Park | Allentown, Pennsylvania | 210 | 180 | 30 | |||||||||||||
| Worlds of Fun | Kansas City, Missouri | 350 | 255 | 95 | |||||||||||||
| Valleyfair | Shakopee, Minnesota | 190 | 110 | 80 | |||||||||||||
| Michigan's Adventure | Muskegon, Michigan | 260 | 120 | 140 | |||||||||||||
| Schlitterbahn Waterpark & Resort New Braunfels | New Braunfels, Texas | 90 | 75 | 15 | |||||||||||||
| Schlitterbahn Waterpark Galveston | (3) | Galveston, Texas | 40 | 35 | 5 | ||||||||||||
(1) Cedar Point and Cedar Point Shores are located on approximately 365 acres, virtually all of which have been developed, on the Cedar Point peninsula in Sandusky, Ohio. We also own acreage on the mainland near Cedar Point with approximately 135 acres undeveloped. Cedar Point's Express Hotel, Castaway Bay Indoor Waterpark Resort and an adjoining restaurant, Castaway Bay Marina, seasonal-employee housing complexes, Cedar Point Sports Center and Sawmill Creek Resort are located on this property.
We control, through ownership or an easement, a six-mile public highway and own approximately 40 acres of vacant land adjacent to this highway, which is a secondary access route to Cedar Point and serves about 250 private residences. We maintain this roadway pursuant to deed provisions. We also own the Cedar Point Causeway, a four-lane roadway across Sandusky Bay, which is the principal access road to Cedar Point.
(2) We sold the land at California's Great America on June 27, 2022. Concurrently with the sale of the land, we entered into a lease contract that allows us to operate the park during a six-year term, and we have an option to extend the term for an additional five years. The lease is subject to early termination by the buyer with at least two years' prior notice; see Note 11.
(3) We lease the land at Schlitterbahn Waterpark Galveston through a long-term lease agreement. The lease is renewable in 2024 with options to renew at our discretion through 2049 and a right of first refusal clause to purchase the land.
All of our property is owned in fee simple and is encumbered by our credit agreement and the 2025 senior notes, with the exception of the land at California's Great America, the land at Schlitterbahn Waterpark Galveston, the land at the location of the Cedar Fair Resort and Attraction Management program, and portions of the six-mile public highway that serves as secondary access route to Cedar Point. We consider our properties to be well maintained, in good condition and adequate for our present uses and business requirements.
ITEM 3. LEGAL PROCEEDINGS.
None.
16
ITEM 4. MINE SAFETY DISCLOSURES.
Not applicable.
PART II
ITEM 5. MARKET FOR REGISTRANT'S DEPOSITARY UNITS, RELATED UNITHOLDER MATTERS AND ISSUER
PURCHASES OF DEPOSITARY UNITS.
Cedar Fair, L.P. Depositary Units representing limited partner interests are listed for trading on The New York Stock Exchange under the symbol "FUN". As of February 9, 2024, there were approximately 4,400 registered holders of Cedar Fair, L.P. Depositary Units, representing limited partner interests. Item 12 in this Form 10-K includes information regarding our equity incentive plan, which is incorporated herein by reference.
Our credit agreement and fixed rate note agreements include Restricted Payment provisions, which could limit our ability to pay partnership distributions. Pursuant to the terms of the indenture governing the 2027 senior notes, which includes the most restrictive of these Restricted Payments provisions, if our pro forma Total-Indebtedness-to-Consolidated-Cash-Flow Ratio is greater than 5.25x, we can still make Restricted Payments of $100 million annually so long as no default or event of default has occurred and is continuing. If our pro forma Total-Indebtedness-to-Consolidated-Cash-Flow Ratio is less than or equal to 5.25x, we can make Restricted Payments up to our Restricted Payment pool. Our pro forma Total-Indebtedness-to-Consolidated-Cash-Flow Ratio was less than 5.25x as of December 31, 2023.
Unitholder Return Performance Graph
The graph below shows a comparison of the five-year cumulative total return (assuming all distributions/dividends reinvested) for Cedar Fair, L.P. limited partnership units, the S&P 500 Index, the S&P 400 Index, and the S&P - Movies and Entertainment Index, assuming investment of $100 on December 31, 2018.
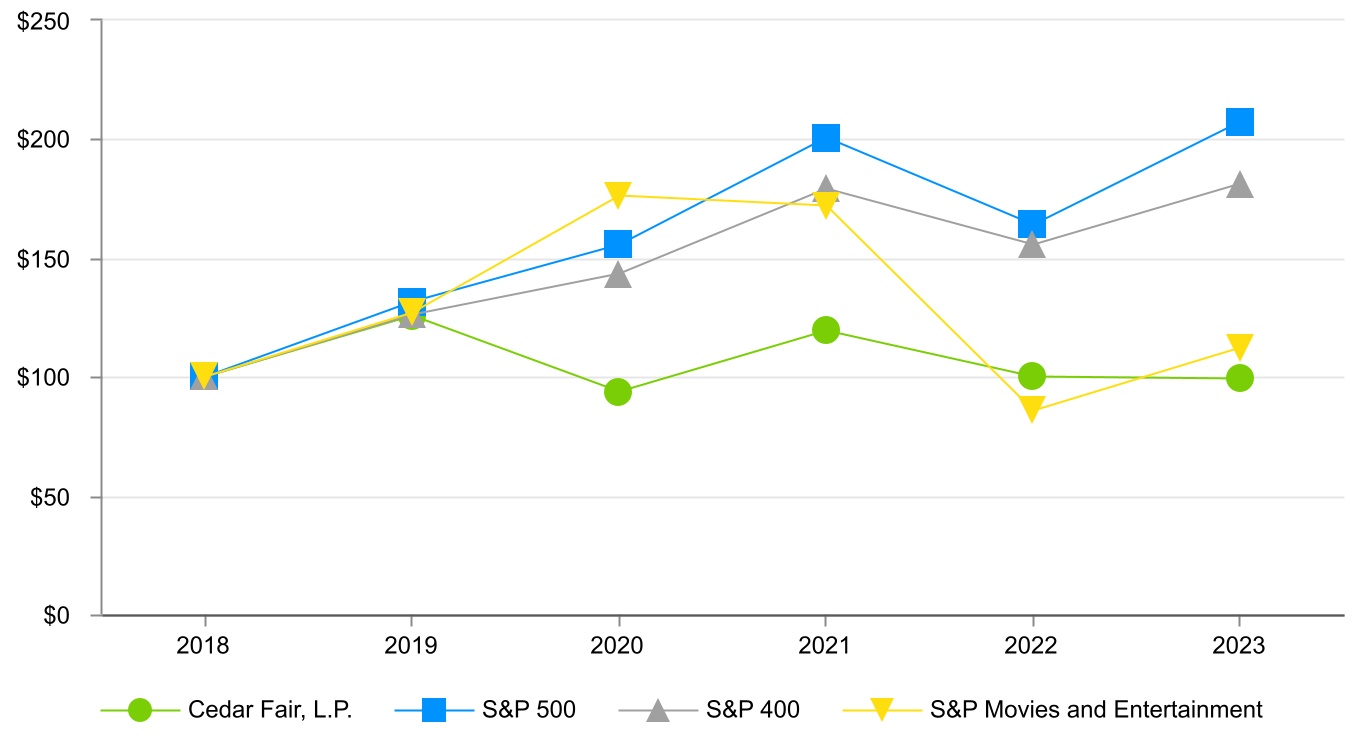
| Base Period | Return | |||||||||||||||||||||||||||||||||||||||||||
| 2018 | 2019 | 2020 | 2021 | 2022 | 2023 | |||||||||||||||||||||||||||||||||||||||
| Cedar Fair, L.P. | $ | 100.00 | $ | 125.45 | $ | 93.82 | $ | 119.39 | $ | 100.01 | $ | 99.15 | ||||||||||||||||||||||||||||||||
| S&P 500 | 100.00 | 131.49 | 155.68 | 200.38 | 164.09 | 207.23 | ||||||||||||||||||||||||||||||||||||||
| S&P 400 | 100.00 | 126.20 | 143.44 | 178.95 | 155.58 | 181.16 | ||||||||||||||||||||||||||||||||||||||
| S&P Movies and Entertainment | 100.00 | 126.72 | 176.24 | 171.91 | 85.56 | 112.14 | ||||||||||||||||||||||||||||||||||||||
17
Issuer Purchases of Equity Securities
The following table summarizes repurchases of Cedar Fair, L.P. Depositary Units representing limited partner interests by the Partnership during the three months ended December 31, 2023:
| (a) | (b) | (c) | (d) | |||||||||||||||||||||||
Period | Total Number of Units Purchased | Average Price Paid per Unit | Total Number of Units Purchased as Part of Publicly Announced Plans or Programs (1) | Maximum Number (or Approximate Dollar Value) of Units that May Yet Be Purchased Under the Plans or Programs (1) | ||||||||||||||||||||||
| September 25 - October 31 | — | $ | — | — | $ | 237,962,641 | ||||||||||||||||||||
| November 1 - November 30 | — | $ | — | — | $ | 237,962,641 | ||||||||||||||||||||
| December 1 - December 31 | — | $ | — | — | $ | 237,962,641 | ||||||||||||||||||||
| Total | — | $ | — | — | $ | 237,962,641 | ||||||||||||||||||||
(1)On May 4, 2023, we announced that our Board of Directors authorized the Partnership to repurchase units for an additional aggregate amount of not more than $250 million. There were no units repurchased under the May 2023 repurchase program during the three months ended December 31, 2023. See Note 8 for additional information.
ITEM 6. RESERVED.
ITEM 7. MANAGEMENT'S DISCUSSION AND ANALYSIS OF FINANCIAL CONDITION AND RESULTS OF OPERATIONS.
Business Overview
We generate our revenues from sales of (1) admission to our amusement parks and water parks, (2) food, merchandise and games both inside and outside our parks, and (3) accommodations, extra-charge products, and other revenue sources. Our principal costs and expenses, which include salaries and wages, operating supplies, maintenance and advertising, are relatively fixed for a typical operating season and do not vary significantly with attendance.
Each of our properties is overseen by a general manager and operates autonomously. Management reviews operating results, evaluates performance and makes operating decisions, including allocating resources, on a property-by-property basis. Discrete financial information and operating results are prepared at the individual park level for use by the CEO, who is the Chief Operating Decision Maker (CODM), as well as by the Chief Financial Officer, the Chief Operating Officer, Senior Vice Presidents and the general managers. We operate within a single reportable segment of amusement/water parks with accompanying resort facilities.
Merger Agreement with Six Flags
On November 2, 2023, we announced that we entered into a definitive merger agreement to combine with Six Flags. Subject to the terms and conditions set forth in the merger agreement, each issued and outstanding unit of limited partnership interest in Cedar Fair will be converted into the right to receive one (1) share of common stock of the new combined entity (subject to certain exceptions and as the same may be adjusted). Following the close of the transaction, the holders of units of Cedar Fair limited partnership interest will own approximately 51.2% of the outstanding shares of the combined company and the holders of Six Flags common stock will own approximately 48.8% of the outstanding shares of the combined company. The merger is expected to close in the first half of 2024, following receipt of Six Flags' stockholder approval, regulatory approvals, and satisfaction of other customary closing conditions.
18
Select Financial Data
The following table presents certain financial data expressed as a percent of total net revenues and selective statistical information for the periods indicated.
| Years Ended December 31, | ||||||||||||||||||||||||||||||||||||||
| 2023 | 2022 | 2021 | ||||||||||||||||||||||||||||||||||||
| (In thousands, except per capita spending, operating days and percentages) | ||||||||||||||||||||||||||||||||||||||
| Net revenues: | ||||||||||||||||||||||||||||||||||||||
| Admissions | $ | 894,728 | 49.7 | % | $ | 925,903 | 50.9 | % | $ | 674,799 | 50.4 | % | ||||||||||||||||||||||||||
| Food, merchandise and games | 613,969 | 34.1 | % | 602,603 | 33.2 | % | 432,513 | 32.3 | % | |||||||||||||||||||||||||||||
| Accommodations, extra-charge products and other | 289,971 | 16.1 | % | 288,877 | 15.9 | % | 230,907 | 17.3 | % | |||||||||||||||||||||||||||||
| Net revenues | 1,798,668 | 100.0 | % | 1,817,383 | 100.0 | % | 1,338,219 | 100.0 | % | |||||||||||||||||||||||||||||
| Operating costs and expenses | 1,316,442 | 73.2 | % | 1,289,142 | 70.9 | % | 1,030,466 | 77.0 | % | |||||||||||||||||||||||||||||
| Depreciation and amortization | 157,995 | 8.8 | % | 153,274 | 8.4 | % | 148,803 | 11.1 | % | |||||||||||||||||||||||||||||
| Loss on impairment / retirement of fixed assets, net | 18,067 | 1.0 | % | 10,275 | 0.6 | % | 10,486 | 0.8 | % | |||||||||||||||||||||||||||||
| Gain on sale of land | — | — | (155,250) | (8.5) | % | — | — | |||||||||||||||||||||||||||||||
| Loss on other assets | — | — | — | — | 129 | — | % | |||||||||||||||||||||||||||||||
| Operating income | 306,164 | 17.0 | % | 519,942 | 28.6 | % | 148,335 | 11.1 | % | |||||||||||||||||||||||||||||
| Interest and other expense, net | 139,087 | 7.7 | % | 148,332 | 8.2 | % | 183,732 | 13.7 | % | |||||||||||||||||||||||||||||
| Net effect of swaps | — | — | (25,641) | (1.4) | % | (19,000) | (1.4) | % | ||||||||||||||||||||||||||||||
| Loss on early debt extinguishment | — | — | 1,810 | 0.1 | % | 5,909 | 0.4 | % | ||||||||||||||||||||||||||||||
| (Gain) loss on foreign currency | (5,525) | (0.3) | % | 23,784 | 1.3 | % | 6,177 | 0.5 | % | |||||||||||||||||||||||||||||
| Provision for taxes | 48,043 | 2.7 | % | 63,989 | 3.5 | % | 20,035 | 1.5 | % | |||||||||||||||||||||||||||||
| Net income (loss) | $ | 124,559 | 6.9 | % | $ | 307,668 | 16.9 | % | $ | (48,518) | (3.6) | % | ||||||||||||||||||||||||||
| Other data: | ||||||||||||||||||||||||||||||||||||||
| Attendance | 26,665 | 26,912 | 19,498 | |||||||||||||||||||||||||||||||||||
| In-park per capita spending | $ | 61.05 | $ | 61.65 | $ | 62.03 | ||||||||||||||||||||||||||||||||
| Operating days | 2,365 | 2,302 | 1,765 | |||||||||||||||||||||||||||||||||||
Critical Accounting Policies
Management's Discussion and Analysis of Financial Condition and Results of Operations is based upon our consolidated financial statements, which were prepared in accordance with accounting principles generally accepted in the United States of America. These principles require us to make judgments, estimates and assumptions during the normal course of business that affect the amounts reported in the Consolidated Financial Statements and related notes. The following discussion addresses our critical accounting policies, which are those that are most important to the portrayal of our financial condition and operating results or involve a higher degree of judgment and complexity (see Note 2 for a complete discussion of our significant accounting policies). Application of the critical accounting policies described below involves the exercise of judgment and the use of assumptions as to future uncertainties, and as a result, actual results could differ from these estimates and assumptions.
Impairment of Long-Lived Assets
Long-lived assets, including property and equipment, are reviewed for impairment upon the occurrence of events or changes in circumstances that would indicate that the carrying value of the assets may not be recoverable. In order to determine if an asset has been impaired, assets are grouped and tested at the lowest level for which identifiable, independent cash flows are available. A significant amount of judgment is involved in determining if an indicator of impairment has occurred. Such indicators may include, among others: a significant decrease in the market price of a long-lived asset; a significant adverse change in the extent or manner in which a long-lived asset is being used or in its physical condition; a significant adverse change in legal factors or in the business climate; an accumulation of costs significantly in excess of the amount originally expected for the acquisition or construction of a long-lived asset; past, current or future operating or cash flow losses that demonstrate continuing losses associated with the use of a long-lived asset; and a current expectation that a long-lived asset will be sold or disposed significantly before the end of its previously estimated useful life. An impairment loss may be recognized when estimated undiscounted future cash flows expected to result from the use of the asset, including disposition, are less than the carrying value of the asset. The measurement of the impairment loss to be recognized is based on the difference between the fair value and the carrying amounts of the assets. Fair value is generally determined using a combination of a cost and market approach. Significant factors considered in the cost approach include replacement cost, reproduction cost, depreciation, physical deterioration, functional obsolescence and economic obsolescence of the assets. The market approach estimates fair value by utilizing market data for similar assets.
19
The determination of whether an indicator of impairment has occurred and the estimation of undiscounted cash flows requires management to make significant estimates and consider an anticipated course of action as of the balance sheet date. Subsequent changes arising from changes in anticipated actions could impact the determination of whether impairment exists, the estimation of undiscounted cash flows and whether the effects could materially impact the consolidated financial statements.
Goodwill and Other Intangible Assets
Goodwill and other indefinite-lived intangible assets, including trade-names, are reviewed for impairment annually, or more frequently if indicators of impairment exist. A significant amount of judgment is involved in determining if an indicator of impairment has occurred. Such indicators may include, among others: a significant decline in expected future cash flows; a sustained, significant decline in equity price and market capitalization; a significant adverse change in legal factors or in the business climate; unanticipated competition; the testing for recoverability of a significant asset group within a reporting unit; and slower growth rates. The fair value of a reporting unit is established using a combination of an income (discounted cash flow) approach and market approach. The income approach uses a reporting unit's projection of estimated operating results and discounted cash flows using a weighted-average cost of capital that reflects current market conditions. Estimated operating results are established using management's best estimates of economic and market conditions over the projected period including growth rates in revenues and costs, estimates of future expected changes in operating margins and cash expenditures. Other significant estimates and assumptions include terminal value growth rates, future estimates of capital expenditures and changes in future working capital requirements. A market approach estimates fair value by applying cash flow multiples to the reporting unit's operating performance. The multiples are derived from comparable publicly traded companies with similar operating and investment characteristics of the reporting units.
It is possible that our assumptions about future performance, as well as the economic outlook and related conclusions regarding valuation, could change adversely, which may result in additional impairment that would have a material effect on our financial position and results of operations in future periods.
Self-Insurance Reserves
Self-insurance reserves are recorded for the estimated amounts of guest and employee claims and related expenses incurred each period. Reserves are established for both identified claims and incurred but not reported ("IBNR") claims and are recorded when claim amounts become probable and estimable. Reserves for identified claims are based upon our historical claim experience and third-party estimates of settlement costs. Reserves for IBNR claims are based upon our claims data history. Self-insurance reserves are periodically reviewed for changes in facts and circumstances and adjustments are made as necessary. The ultimate cost for identified claims can be difficult to predict due to the unique facts and circumstances associated with each claim.
Revenue Recognition
As disclosed within the consolidated statements of operations and comprehensive income (loss), revenues are generated from sales of (1) admission to our amusement parks and water parks, (2) food, merchandise and games both inside and outside the parks, and (3) accommodations, extra-charge products, and other revenue sources. Most revenues are recognized on a daily basis based on actual guest spend at our properties. Revenues from multi-use products, including season-long products for admission, dining, beverage and other products, are recognized over the estimated number of uses expected for each type of product. The estimated number of uses is reviewed and may be updated periodically during the operating season prior to the ticket or product expiration, which generally occurs no later than the close of the operating season associated with that product. The number of uses is estimated based on historical usage adjusted for current period trends. In order to calculate revenue recognized on season-long products, management makes significant estimates regarding the estimated number of uses expected for season-long products, including during interim periods. Actual usage could materially differ from these estimates which could potentially result in an inappropriate amount of revenue recognized in a given period.
Income Taxes
Our legal entity structure includes both partnerships and corporate subsidiaries. We are subject to publicly traded partnership tax ("PTP tax") on certain partnership level gross income (net revenues less cost of food, merchandise, and games revenues), state and local income taxes on partnership income, U.S. federal state and local income taxes on income from our corporate subsidiaries and foreign income taxes on our foreign subsidiary. As such, the total provision for taxes includes amounts for the PTP gross income tax and federal, state, local and foreign income taxes. Under applicable accounting rules, the total provision for income taxes includes the amount of taxes payable for the current year and the impact of deferred tax assets and liabilities, which represents future tax consequences of events that are recognized in different periods in the financial statements than for tax purposes.
Our corporate subsidiaries account for income taxes under the asset and liability method. Accordingly, deferred tax assets and liabilities are recognized for the future book and tax consequences attributable to temporary differences between the financial statement carrying amounts of existing assets and liabilities and their respective tax bases. Deferred tax assets and liabilities are determined using enacted tax rates expected to apply in the year in which those temporary differences are expected to be recovered or settled. The effect on deferred tax assets and liabilities of a change in tax law is recognized in income at the time of enactment of such change in tax law. Any interest or penalties due for payment of income taxes are included in the provision for income taxes.
20
We record a valuation allowance if, based on the weight of available evidence, it is more likely than not that some portion, or all, of a deferred tax asset will not be realized. The need for this allowance is based on several factors including the ten-year carryforward period allowed for excess foreign tax credits, experience to date of foreign tax credit limitations, carryforward periods of state net operating losses, and management's long-term estimates of domestic and foreign source income.
There is inherent uncertainty in the estimates used to project the amount of foreign tax credit and state net operating loss carryforwards that are more likely than not to be realized. It is possible that our future income projections, as well as the economic outlook and related conclusions regarding valuation allowances could change, which may result in additional valuation allowance being recorded or may result in additional valuation allowance reductions, and which may have a material negative or positive effect on our reported financial position and results of operations in future periods.
Results of Operations
The following operational measures are key performance metrics in our managerial and operational reporting. They are used as major factors in significant operational decisions as they are primary drivers of our financial and operational performance, measuring demand, pricing and consumer behavior. In-park revenues, in-park per capita spending and out-of-park revenues are non-GAAP measures.
Attendance is defined as the number of guest visits to our amusement parks and separately gated outdoor water parks.
In-park per capita spending is calculated as revenues generated within our amusement parks and separately gated outdoor water parks along with related parking revenues (in-park revenues), divided by total attendance.
Out-of-park revenues are defined as revenues from resorts, out-of-park food and retail locations, online transaction fees charged to customers, sponsorships and all other out-of-park operations.
Net revenues consist of in-park revenues and out-of-park revenues less amounts remitted to outside parties under concessionaire arrangements; see Note 3 for a reconciliation of in-park revenues and out-of-park revenues to net revenues.
In the Results of Operations section, we discuss and compare our 2023 and 2022 results. For a discussion regarding our 2021 results, including comparisons of our 2022 results to our 2021 and 2019 results, see "Management's Discussion and Analysis of Financial Condition and Results of Operations" within the Company's Annual Report on Form 10-K for the year ended December 31, 2022, filed with the SEC on February 17, 2023.
2023 vs. 2022
The year ended December 31, 2023 included 2,365 operating days compared with 2,302 operating days for the year ended December 31, 2022. The 63 operating day increase was primarily attributable to additional operating days in January and February at Carowinds, Kings Dominion and California's Great America, and additional operating days during early season weekdays at some of our mid-sized properties during the second quarter of 2023. These additional days were offset by 17 operating day closures due to inclement weather. Of these 17 closed operating days, ten occurred during the first quarter of 2023 at our parks in California, Knott's Berry Farm and California's Great America. Both parks experienced unusually inclement weather during that quarter.
21
The following table presents key financial information and operating measures for the years ended December 31, 2023 and December 31, 2022:
| Increase (Decrease) | ||||||||||||||||||||||||||
| December 31, 2023 | December 31, 2022 | $ | % | |||||||||||||||||||||||
| (Amounts in thousands, except for per capita and operating days) | ||||||||||||||||||||||||||
| Net revenues | $ | 1,798,668 | $ | 1,817,383 | $ | (18,715) | (1.0) | % | ||||||||||||||||||
| Operating costs and expenses | 1,316,442 | 1,289,142 | 27,300 | 2.1 | % | |||||||||||||||||||||
| Depreciation and amortization | 157,995 | 153,274 | 4,721 | 3.1 | % | |||||||||||||||||||||
| Loss on impairment/retirement of fixed assets, net | 18,067 | 10,275 | 7,792 | N/M | ||||||||||||||||||||||
| Gain on sale of land | — | (155,250) | 155,250 | N/M | ||||||||||||||||||||||
| Operating income | $ | 306,164 | $ | 519,942 | $ | (213,778) | (41.1) | % | ||||||||||||||||||
| Other Data: | ||||||||||||||||||||||||||
| Attendance | 26,665 | 26,912 | (247) | (0.9) | % | |||||||||||||||||||||
| In-park per capita spending | $ | 61.05 | $ | 61.65 | $ | (0.60) | (1.0) | % | ||||||||||||||||||
| Out-of-park revenues | $ | 223,263 | $ | 213,337 | $ | 9,926 | 4.7 | % | ||||||||||||||||||
| Operating days | 2,365 | 2,302 | 63 | 2.7 | % | |||||||||||||||||||||
Net income margin (1) | 6.9 | % | 16.9 | % | (10.0) | % | ||||||||||||||||||||
N/M Not meaningful due to the nature of the expense line-item.
(1) Net income margin is calculated as net income divided by net revenues.
For the year ended December 31, 2023, net revenues decreased $18.7 million, or 1.0%, compared with 2022. The decrease in net revenues reflected the impact of a 0.2 million-visit, or 0.9%, decrease in attendance and the impact of a 1.0% decrease in in-park per capita spending to $61.05 partially offset by a 4.7%, or $9.9 million increase in out-of-park revenues. The decrease in attendance was driven by reduced season pass attendance as a result of fewer season pass units outstanding. There were fewer season pass units outstanding due to less sales, particularly at our parks in California, as well as due to the impact of the prior period extension of 2020 and 2021 season-long products at Knott's Berry Farm through May 2022 and Canada's Wonderland through Labour Day 2022. Attendance was also negatively impacted by inclement weather, particularly during the first quarter of 2023. These negative impacts were somewhat offset by the continuing recovery of group sales attendance, the impact of additional operating days during the current year, and higher 2024 season pass sales in 2023 compared to 2023 season pass sales in 2022. The decrease in in-park per capita spending was attributable to a decline in admissions spending driven by a reassessment of our pricing strategy at several parks and the recovery of lower priced attendance channels. The decrease in admission spending was somewhat offset by higher levels of guest spending on food and beverage. The increase in food and beverage spending was driven by increases in both the number of transactions per guest and average transaction value. The increase in out-of-park revenues was largely attributable to the reopening of Castaway Bay Resort and Sawmill Creek Resort at Cedar Point following temporary closures for renovations in the prior year. The decrease in net revenues included a $5.1 million unfavorable impact of foreign currency exchange rates at our Canadian park.
Operating costs and expenses for the year ended December 31, 2023 increased $27.3 million, or 2.1%, compared with 2022. The $27.3 million increase in operating costs and expenses was the result of a $35.9 million increase in selling, general, and administrative ("SG&A") expenses partially offset by a $4.4 million decrease in cost of food, merchandise and games revenues ("COGS") and a $4.2 million decrease in operating expenses. The increase in SG&A expenses was primarily driven by $22.3 million of costs related to the proposed merger with Six Flags. Excluding costs related to the proposed merger, the increase in SG&A expenses was primarily attributable to higher planned advertising costs. The decrease in operating expenses was primarily due to cost savings initiatives resulting in a reduction in seasonal labor hours and less in-park entertainment costs. The decreases were somewhat offset by incremental land lease costs associated with the sale-leaseback of the land at California's Great America for a full-year, early season maintenance wage costs, and increased insurance claims and related costs. COGS as a percentage of food, merchandise and games revenue decreased approximately 1%. The increase in operating costs and expenses included a $3.0 million favorable impact of foreign currency exchange rates at our Canadian park.
Depreciation and amortization expense for the year ended December 31, 2023 increased $4.7 million compared with 2022 due to the reduction of the estimated useful lives of the long-lived assets at California's Great America following the sale-leaseback of the land at California's Great America. The loss on impairment / retirement of fixed assets for 2023 was $18.1 million compared to $10.3 million for 2022. The loss on impairment / retirement of fixed assets for both periods included retirements of assets in the normal course of business, including a specific terminated project at Knott's Berry Farm in the current year.
After a $155.3 million gain on the sale of the land at California's Great America during the third quarter of 2022 and the items above, operating income for 2023 totaled $306.2 million compared to $519.9 million for 2022.
22
Interest expense for 2023 decreased $10.2 million compared with 2022 as a result of the repayment of our senior secured term loan facility and related termination of our interest rate swap agreements during the third quarter of 2022. The reduction in interest expense was partially offset by interest on additional borrowings on our revolving credit facility in the current year. Prior to the termination of our interest rate swaps, the net effect of our swaps resulted in a $25.6 million benefit to earnings for 2022 representing the change in fair market value of our swap portfolio. We realized a $5.3 million cash receipt, net of fees, upon termination of our interest rate swap agreements during the third quarter of 2022. In addition, we recognized a loss on early debt extinguishment of $1.8 million in 2022 upon full repayment of our senior secured term debt facility. During 2023, we recognized a $5.5 million net benefit to earnings for foreign currency gains and losses compared with a $23.8 million net charge to earnings for 2022. Both amounts primarily represented the remeasurement of U.S.-dollar denominated notes to our Canadian entity's functional currency.
For 2023, a provision for taxes of $48.0 million was recorded to account for PTP taxes and federal, state, local and foreign income taxes compared with $64.0 million recorded for 2022. The decrease in provision for taxes was primarily attributable to lower pretax income from our taxable subsidiaries in 2023. The prior year included a provision for taxes recorded for the sale of the land at California's Great America.
After the items above, net income for 2023 totaled $124.6 million, or $2.42 per diluted limited partner unit, compared with a $307.7 million, or $5.45 per diluted unit, for 2022. Net income margin decreased 10.0% primarily due to the $155.3 million gain on the sale of the land at California's Great America during the third quarter of 2022.
Adjusted EBITDA
Adjusted EBITDA represents earnings before interest, taxes, depreciation, amortization, other non-cash items, and adjustments as defined in our current and prior credit agreements. Adjusted EBITDA is not a measurement of operating performance computed in accordance with generally accepted accounting principles ("GAAP") and should not be considered as a substitute for operating income, net income or cash flows from operating activities computed in accordance with GAAP. Management believes Adjusted EBITDA is a meaningful measure of park-level operating profitability, and we use it for measuring returns on capital investments, evaluating potential acquisitions, determining awards under incentive compensation plans, and calculating compliance with certain loan covenants. Adjusted EBITDA is widely used by analysts, investors and comparable companies in our industry to evaluate our operating performance on a consistent basis, as well as more easily compare our results with those of other companies in our industry. This measure is provided as a supplemental measure of our operating results and may not be comparable to similarly titled measures of other companies.
The table below sets forth a reconciliation of Adjusted EBITDA to net income for the periods indicated.
| Years Ended December 31, | ||||||||||||||
| (In thousands) | 2023 | 2022 | ||||||||||||
| Net income | $ | 124,559 | $ | 307,668 | ||||||||||
| Interest expense | 141,770 | 151,940 | ||||||||||||
| Interest income | (2,818) | (3,621) | ||||||||||||
| Provision for taxes | 48,043 | 63,989 | ||||||||||||
| Depreciation and amortization | 157,995 | 153,274 | ||||||||||||
| EBITDA | 469,549 | 673,250 | ||||||||||||
| Loss on early debt extinguishment | — | 1,810 | ||||||||||||
| Net effect of swaps | — | (25,641) | ||||||||||||
| Non-cash foreign currency (gain) loss | (5,594) | 23,856 | ||||||||||||
| Non-cash equity compensation expense | 22,611 | 20,589 | ||||||||||||
| Loss on impairment/retirement of fixed assets, net | 18,067 | 10,275 | ||||||||||||
| Gain on sale of land | — | (155,250) | ||||||||||||
Costs related to proposed merger (1) | 22,287 | — | ||||||||||||
Other (2) | 752 | 3,064 | ||||||||||||
| Adjusted EBITDA | $ | 527,672 | $ | 551,953 | ||||||||||
Adjusted EBITDA margin (3) | 29.3 | % | 30.4 | % | ||||||||||
(1) Consists of third-party investment banking, consulting and legal costs related to the proposed merger with Six Flags. See Note 2 for additional information. These costs are added back to net income to calculate Adjusted EBITDA as defined in our current and prior credit agreements and were recorded within "Selling, general and administrative" in the consolidated statement of operations and comprehensive income.
23
(2) Consists of certain costs as defined in our current and prior credit agreements. These items are added back to net income to calculate Adjusted EBITDA and have included certain legal expenses, severance and related benefits and contract termination costs. This balance also includes unrealized gains and losses on short-term investments.
(3) Adjusted EBITDA margin (Adjusted EBITDA divided by net revenues) is not a measurement computed in accordance with GAAP and may not be comparable to similarly titled measures of other companies. We provide Adjusted EBITDA margin because we believe the measure provides a meaningful metric of operating profitability.
For 2023, Adjusted EBITDA decreased $24.3 million and Adjusted EBITDA margin decreased 1.1% compared with 2022. The decreases in Adjusted EBITDA and Adjusted EBITDA margin were due to a decrease in net revenues driven by a decline in attendance during the first six months of 2023, and to a lesser extent, higher advertising, land lease and insurance claim costs.
Liquidity and Capital Resources
Our principal sources of liquidity include cash from operating activities, funding from our long-term debt obligations and existing cash on hand. Due to the seasonality of our business, we typically fund pre-opening operations with revolving credit borrowings. Revolving credit borrowings are reduced with our positive cash flow during the seasonal operating period. Our primary uses of liquidity include operating expenses, capital expenditures, interest payments, partnership distributions, income tax obligations, and recently, limited partnership unit repurchases. As of December 31, 2023, we had cash on hand of $65.5 million and availability under our revolving credit facility of $280.1 million. Based on this level of liquidity, we concluded that we will have sufficient liquidity to satisfy our obligations at least through the first quarter of 2025.
We expect to invest between $210 million and $220 million in capital expenditures for the 2024 operating season, which will include the debut of a world-class roller coaster at Cedar Point, a dive coaster at Dorney Park, an expansion of Kings Island's award winning children's area, new water park attractions at Canada's Wonderland, the world's first water coaster for kids at Schlitterbahn New Braunfels and other rides and attractions, as well as upgraded and expanded food and beverage facilities.
We paid a partnership distribution of $0.30 per limited partner unit on December 20, 2023. On February 15, 2024, we announced that our Board declared an additional partnership distribution of $0.30 per limited partner unit, which will be payable on March 20, 2024 to unitholders of record on March 6, 2024.
On August 3, 2022, we announced the Board of Directors approved a unit repurchase plan authorizing the Partnership to repurchase units for an aggregate purchase price of not more than $250 million. As of April 12, 2023, we repurchased all remaining availability under the August 2022 repurchase program resulting in a total of 6.0 million units repurchased at an average price of $41.93 per limited partner unit. On May 4, 2023, we announced that our Board of Directors authorized the Partnership to repurchase more units for an additional aggregate amount of not more than $250 million. We repurchased 0.3 million units under the May 2023 repurchase program at an average price of $38.27 per limited partner unit during 2023. See Note 8 for additional information.
We anticipate cash interest payments between $140 million and $150 million during 2024. We anticipate cash payments for income taxes to range from $50 million to $60 million in 2024.
As of December 31, 2023, deferred revenue totaled $191.6 million, including non-current deferred revenue. This represented an increase of $19.0 million compared with total deferred revenue as of December 31, 2022. The increase in total deferred revenue was largely attributable to higher season-long product sales for the subsequent season.
Operating Activities
Net cash from operating activities in 2023 totaled $325.7 million, a decrease of $82.0 million compared with 2022 and an increase of $124.4 million compared with 2021. The decrease from 2022 was largely driven by tax refunds received in 2022 related to 2020 net operating losses carried back to prior years, as well as costs related to the proposed merger in 2023. The increase from 2021 was attributable to lower earnings in 2021 as a result of disrupted operations due to the COVID-19 pandemic.
Cash interest payments totaled $135.7 million in 2023 compared with $137.7 million in 2022 and $174.3 million in 2021. The decrease in cash interest payments from 2022 was attributable to the repayment of our senior secured term loan facility and related termination of our interest rate swap agreements during the third quarter of 2022 somewhat offset by additional revolver borrowings in 2023. The decrease in cash interest payments from 2021 was attributable to the redemption of the 2024 senior notes in December 2021, as well as the repayment of our senior secured term loan facility and related termination of our interest rate swap agreements during the third quarter of 2022. Net cash payments for income taxes totaled $45.0 million in 2023 compared with net cash refunds of $47.2 million in 2022 and net cash payments of $10.1 million in 2021. The variance in cash payments (refunds) for income taxes from 2022 was attributable to $90.7 million in tax refunds received in 2022 for the net operating loss in tax year 2020 being carried back to prior years. The net cash payments in 2021 were lower due to the impact of disrupted operations in 2021.
24
Investing Activities
Net cash for investing activities in 2023 totaled $220.4 million, a decrease of $347.1 million compared with net cash from investing activities in 2022 and an increase of $162.6 million compared with net cash for investing activities in 2021. The decrease from 2022 was attributable to the proceeds from the sale of the land at California's Great America in 2022 somewhat offset by higher capital spending in 2023 driven by the timing of spending on capital expenditure projects. The increase from 2021 was attributable to a planned reduction in capital spending in 2021 to retain liquidity as a result of the impact of the COVID-19 pandemic.
Financing Activities
Net cash for financing activities in 2023 totaled $143.0 million, a decrease of $346.6 million compared with 2022 and a decrease of $323.4 million compared with 2021. The variances from 2022 and 2021 were primarily attributable to the timing of debt payments. We reduced our outstanding debt by redeeming the 2024 senior notes in 2021 and by repaying our senior secured term loan facility in 2022. In 2022, we also repurchased additional limited partnership units. These decreases were somewhat offset by higher partnership distributions in 2023.
Contractual Obligations
As of December 31, 2023, our primary contractual obligations consisted of outstanding long-term debt agreements. We also have various commitments under our lease agreements; see Note 11. Before reduction for debt issuance costs, our long-term debt agreements consisted of the following:
•$1.0 billion of 5.500% senior secured notes, maturing in May 2025, issued at par. The 2025 senior notes and the related guarantees are secured by first-priority liens on the issuers' and the guarantors' assets that secure all the obligations under our credit facilities. The 2025 senior notes may be redeemed, in whole or in part, at various prices depending on the date redeemed. The 2025 senior notes pay interest semi-annually in May and November.
•$500 million of 5.375% senior unsecured notes, maturing in April 2027, issued at par. The 2027 senior notes may be redeemed, in whole or in part, at various prices depending on the date redeemed. The 2027 senior notes pay interest semi-annually in April and October.
•$300 million of 6.500% senior unsecured notes, maturing in October 2028, issued at par. The 2028 senior notes may be redeemed, in whole or in part, at various prices depending on the date redeemed. The 2028 senior notes pay interest semi-annually in April and October.
•$500 million of 5.250% senior unsecured notes, maturing in July 2029, issued at par. The 2029 senior notes may be redeemed, in whole or in part, at any time prior to July 15, 2024 at a price equal to 100% of the principal amount of the notes redeemed plus a "make-whole" premium together with accrued and unpaid interest and additional interest, if any, to the redemption date. Thereafter, the 2029 senior notes may be redeemed, in whole or in part, at various prices depending on the date redeemed. The 2029 senior notes pay interest semi-annually in January and July.
•No borrowings under the $300 million senior secured revolving credit facility under our current credit agreement with a Canadian sub-limit of $15 million. The revolving credit facility bears interest at Secured Overnight Financing Rate ("SOFR") plus 350 bps with a SOFR adjustment of 10 bps per annum and a floor of zero, and requires the payment of a 62.5 bps commitment fee per annum on the unused portion of the credit facilities. The senior secured revolving credit facility matures on February 10, 2028, provided that the maturity date will be (x) January 30, 2025 if at least $200 million of the 2025 senior notes remain outstanding as of that date, or (y) January 14, 2027 if at least $200 million of the 2027 senior notes remain outstanding as of that date. The credit agreement provides for the issuance of documentary and standby letters of credit. After letters of credit, which totaled $19.9 million as of December 31, 2023 and December 31, 2022, we had availability under our revolving credit facility of $280.1 million as of December 31, 2023 and December 31, 2022. Our letters of credit are primarily in place to backstop insurance arrangements.
The 2017 Credit Agreement, as amended, includes a Senior Secured Leverage Ratio of 3.75x Total First Lien Senior Secured Debt-to-Consolidated EBITDA. This financial covenant is only required to be tested at the end of any fiscal quarter in which revolving credit facility borrowings are outstanding. We were in compliance with the applicable financial covenants under our credit agreement during 2023.
Our credit agreement and fixed rate note agreements include Restricted Payment provisions, which could limit our ability to pay partnership distributions. Pursuant to the terms of the indenture governing the 2027 senior notes, which includes the most restrictive of these Restricted Payments provisions, if our pro forma Total-Indebtedness-to-Consolidated-Cash-Flow Ratio is greater than 5.25x, we can still make Restricted Payments of $100 million annually so long as no default or event of default has occurred and is continuing. If our pro forma Total-Indebtedness-to-Consolidated-Cash-Flow Ratio is less than or equal to 5.25x, we can make Restricted Payments up to our Restricted Payment pool. Our pro forma Total-Indebtedness-to-Consolidated-Cash-Flow Ratio was less than 5.25x as of December 31, 2023.
25
On November 9, 2023, we entered into supplemental indentures related to the 2025 senior notes, 2027 senior notes, 2028 senior notes and 2029 senior notes (the "Amendments") following receipt of requisite consents from the holders of the notes (the "Consent Solicitation"). The Amendments enable us to select November 2, 2023, the date the merger agreement with Six Flags was entered into, as the testing date for purposes of calculating, with respect to the proposed merger and related transactions, any and all ratio tests under those notes, each of which was satisfied when tested on November 2, 2023. The Amendments require a payment upon or immediately prior to the consummation of the merger (the "Consent Payment").
Financial and Non-Financial Disclosure About Issuers and Guarantors of our Registered Senior Notes
As discussed within the Long-Term Debt footnote at Note 6, we had four tranches of fixed rate senior notes outstanding at December 31, 2023: the 2025, 2027, 2028 and 2029 senior notes. The 2027, 2028 and 2029 senior notes were registered under the Securities Act of 1933. The 2025 senior notes were sold in a private placement in reliance on exemptions from registration under the Securities Act of 1933. Cedar Fair, L.P., Canada's Wonderland Company ("Cedar Canada"), Magnum Management Corporation ("Magnum"), and Millennium Operations LLC (“Millennium”) are the co-issuers of the 2027, 2028 and 2029 senior notes. Our senior notes have been irrevocably and unconditionally guaranteed, on a joint and several basis, by each wholly owned subsidiary of Cedar Fair (other than the co-issuers) that guarantees our credit facilities under our credit agreement. A full listing of the issuers and guarantors of our registered senior notes can be found within Exhibit 22, and additional information with respect to our registered senior notes and the related guarantees follows.
The 2027, 2028 and 2029 senior notes each rank equally in right of payment with all of each issuer’s existing and future senior unsecured debt, including the other registered senior notes. However, the 2027, 2028 and 2029 senior notes rank effectively junior to any secured debt under the 2017 Credit Agreement, as amended, and the 2025 senior notes to the extent of the value of the assets securing such debt.
In the event that the co-issuers (except for Cedar Fair, L.P.) or any subsidiary guarantor is released from its obligations under our senior secured credit facilities (or the 2017 Credit Agreement, as amended), such entity will also be released from its obligations under the registered senior notes. In addition, the co-issuers (except for Cedar Fair, L.P.) or any subsidiary guarantor can be released from its obligations under the 2027, 2028 and 2029 senior notes under the following circumstances, assuming the associated transactions are in compliance with the applicable provisions of the indentures governing the 2027, 2028 and 2029 senior notes: i) any direct or indirect sale, conveyance or other disposition of the capital stock of such entity following which the entity ceases to be a direct or indirect subsidiary of Cedar Fair or a sale or disposition of all or substantially all of the assets of such entity; ii) if such entity is dissolved or liquidated; iii) if we designate such entity as an Unrestricted Subsidiary; iv) upon transfer of such entity in a qualifying transaction if following such transfer the entity ceases to be a direct or indirect Restricted Subsidiary of Cedar Fair or is a Restricted Subsidiary that is not a guarantor under any credit facility; or v) in the case of the subsidiary guarantors, upon a discharge of the indenture or upon any legal defeasance or covenant defeasance of the indenture.
The obligations of each guarantor are limited to the extent necessary to prevent such guarantee from constituting a fraudulent conveyance or fraudulent transfer under applicable law. This provision may not, however, protect a guarantee from being voided under fraudulent transfer law, or may reduce the applicable guarantor’s obligation to an amount that effectively makes its guarantee worthless. If a guarantee were rendered voidable, it could be subordinated by a court to all other indebtedness of the guarantor, and depending on the amount of such indebtedness, could reduce the guarantee to zero. Each guarantor that makes a payment or distribution under a guarantee is entitled to a pro rata contribution from each other guarantor based on the respective net assets of the guarantors.
The following tables provide summarized financial information for each of our co-issuers and guarantors of the 2027, 2028 and 2029 senior notes (the "Obligor Group"). We presented each entity that is a co-issuer of the registered senior notes separately. The subsidiaries that guarantee the registered senior notes are presented on a combined basis with intercompany balances and transactions between entities in such guarantor subsidiary group eliminated. Intercompany balances and transactions between the co-issuers and guarantor subsidiaries have not been eliminated. Certain subsidiaries of Cedar Fair did not guarantee our credit facilities or senior notes as the assets and results of operations of these subsidiaries were immaterial (the "non-guarantor" subsidiaries). The summarized financial information excludes results of the non-guarantor subsidiaries and does not reflect investments of the Obligor Group in the non-guarantor subsidiaries. The Obligor Group's amounts due from, amounts due to, and transactions with the non-guarantor subsidiaries have not been eliminated and included intercompany receivables from non-guarantors of $14.3 million as of December 31, 2023 and December 31, 2022.
26
| Summarized Financial Information (In thousands) | Cedar Fair L.P. (Parent) | Magnum (Co-Issuer Subsidiary) | Cedar Canada (Co-Issuer Subsidiary) | Millennium (Co-Issuer Subsidiary) | Guarantor Subsidiaries | |||||||||||||||||||||||||||
Balance as of December 31, 2023 | ||||||||||||||||||||||||||||||||
| Current Assets | $ | 445 | $ | 13,876 | $ | 46,641 | $ | 346,820 | $ | 1,618,550 | ||||||||||||||||||||||
| Non-Current Assets | (269,050) | 1,916,183 | 627,130 | 2,387,798 | 1,955,628 | |||||||||||||||||||||||||||
| Current Liabilities | 160,560 | 1,525,756 | 188,975 | 223,098 | 107,007 | |||||||||||||||||||||||||||
| Non-Current Liabilities | 148,854 | 2,019 | 16,985 | 2,141,096 | 141,402 | |||||||||||||||||||||||||||
Balance as of December 31, 2022 | ||||||||||||||||||||||||||||||||
| Current Assets | $ | 507 | $ | 32,194 | $ | 82,860 | $ | 409,869 | $ | 1,400,403 | ||||||||||||||||||||||
| Non-Current Assets | (202,160) | 1,583,510 | 563,637 | 2,214,189 | 1,870,827 | |||||||||||||||||||||||||||
| Current Liabilities | 237,793 | 1,247,618 | 261,744 | 213,669 | 103,436 | |||||||||||||||||||||||||||
| Non-Current Liabilities | 147,937 | 1,238 | 14,142 | 2,135,550 | 159,493 | |||||||||||||||||||||||||||
Year Ended December 31, 2023 | ||||||||||||||||||||||||||||||||
| Net revenues | $ | 87,790 | $ | 478,478 | $ | 173,321 | $ | 1,935,516 | $ | 447,639 | ||||||||||||||||||||||
| Operating income (loss) | 84,005 | (153,697) | 67,459 | 126,165 | 182,687 | |||||||||||||||||||||||||||
| Net income | 125,284 | 72,213 | 98,108 | — | 263,071 | |||||||||||||||||||||||||||
Year Ended December 31, 2022 | ||||||||||||||||||||||||||||||||
| Net revenues | $ | 210,192 | $ | 522,915 | $ | 179,180 | $ | 2,174,828 | $ | 320,682 | ||||||||||||||||||||||
| Operating income (loss) | 207,251 | (116,440) | 80,880 | 124,469 | 224,675 | |||||||||||||||||||||||||||
| Net income | 308,808 | 141,776 | 65,665 | — | 216,578 | |||||||||||||||||||||||||||
Quantitative and Qualitative Disclosures about Market Risk
We are exposed to market risks from fluctuations in interest rates and currency exchange rates on our operations in Canada, and from time to time, on imported rides and equipment. The objective of our financial risk management is to reduce the potential negative impact of interest rate and foreign currency exchange rate fluctuations to acceptable levels. We do not acquire market risk sensitive instruments for trading purposes.
We typically manage interest rate risk using a combination of fixed-rate long-term debt, interest rate swaps that fix variable-rate long-term debt, and variable-rate borrowings under a revolving credit facility. Translation exposures with regard to our Canadian operations are not hedged.
We repaid all of our outstanding variable-rate long-term debt during the third quarter of 2022 and subsequently terminated our interest rate swap agreements. Therefore, as of December 31, 2023, all of our outstanding long-term debt represented fixed-rate debt except for revolving credit borrowings. Assuming the daily average balance over the past twelve months on revolving credit borrowings of approximately $73.1 million, a hypothetical 100 bps increase in 30-day SOFR on our variable-rate debt would lead to an increase of approximately $0.7 million in cash interest costs over the next twelve months.
A uniform 10% strengthening of the U.S. dollar relative to the Canadian dollar would result in a $6.7 million decrease in annual operating income for the year ended December 31, 2023.
27
Forward Looking Statements
Some of the statements contained in this report (including the "Management's Discussion and Analysis of Financial Condition and Results of Operations" section) that are not historical in nature are forward-looking statements within the meaning of the federal securities laws, including Section 27A of the Securities Act of 1933 and Section 21E of the Securities Exchange Act of 1934, including statements as to our expectations, beliefs, goals and strategies regarding the future. These forward-looking statements may involve current plans, estimates, expectations and ambitions that are subject to risks, uncertainties and assumptions that are difficult to predict, may be beyond our control and could cause actual results to differ materially from those described in such statements. Although we believe that the expectations reflected in such forward-looking statements are reasonable, we can give no assurance that such expectations will prove to be correct, that our growth strategies will achieve the targeted results, that the proposed transaction with Six Flags will close or that the Company will realize the anticipated benefits thereof. Important risk factors that may cause such a difference and could adversely affect attendance at our parks, our future financial performance, our growth strategies and/or the proposed transaction, and could cause actual results to differ materially from our expectations or otherwise to fluctuate or decrease, include, but are not limited to: general economic conditions, the impacts of public health concerns; adverse weather conditions; competition for consumer leisure time and spending; unanticipated construction delays; changes in our capital investment plans and projects; the expected timing and likelihood of completion of the proposed transaction, including the timing, receipt and terms and conditions of any required governmental and regulatory approvals of the proposed transaction and Six Flags stockholder approval; anticipated tax treatment, unforeseen liabilities, future capital expenditures, revenues, expenses, earnings, synergies, economic performance, indebtedness, financial condition, losses, future prospects, business and management strategies for the management, expansion and growth of the combined company’s operations and other conditions to the completion of the proposed transaction, including the possibility that any of the anticipated benefits of the proposed transaction will not be realized or will not be realized within the expected time period; the occurrence of any event, change or other circumstances that could give rise to the termination of the merger agreement; the outcome of any legal proceedings that may be instituted against Cedar Fair, Six Flags or their respective directors and others following announcement of the merger agreement and proposed transaction; the inability to consummate the transaction due to the failure to satisfy other conditions to complete the transaction; risks that the proposed transaction disrupts and/or harms current plans and operations of Cedar Fair or Six Flags, including that management’s time and attention will be diverted on transaction-related issues; the amount of the costs, fees, expenses and charges related to the transaction, including the possibility that the transaction may be more expensive to complete than anticipated; the ability of Cedar Fair and Six Flags to successfully integrate their businesses and to achieve anticipated synergies and value creation; potential adverse reactions or changes to business relationships resulting from the announcement or completion of the proposed transaction; legislative, regulatory and economic developments and changes in laws, regulations, and policies affecting Cedar Fair and Six Flags; potential business uncertainty, including the outcome of commercial negotiations and changes to existing business relationships during the pendency of the proposed transaction that could affect Cedar Fair’s and/or Six Flags’ financial performance and operating results; acts of terrorism or outbreak of war, hostilities, civil unrest, and other political or security disturbances; the impacts of pandemics or other public health crises, including the effects of government responses on people and economies; risks related to the potential impact of general economic, political and market factors on the companies or the proposed transaction; other factors, including those listed under Item 1A in this Form 10-K; and those risks that are described in the registration statement on Form S-4 and the accompanying proxy statement/prospectus. We do not undertake any obligation to publicly update or revise any forward-looking statements to reflect future events, information or circumstances that arise after the filing date of this document.
ITEM 7A. QUANTITATIVE AND QUALITATIVE DISCLOSURES ABOUT MARKET RISK.
The information appearing under the subheading "Quantitative and Qualitative Disclosures about Market Risk" under the heading "Management's Discussion and Analysis of Financial Condition and Results of Operations" of this Report is incorporated herein by reference.
28
ITEM 8. FINANCIAL STATEMENTS AND SUPPLEMENTARY DATA.
CEDAR FAIR, L.P.
FINANCIAL STATEMENTS INDEX
29
REPORT OF INDEPENDENT REGISTERED PUBLIC ACCOUNTING FIRM
To the Unitholders and the Board of Directors of
Cedar Fair, L.P.
Opinions on the Financial Statements and Internal Control over Financial Reporting
We have audited the accompanying consolidated balance sheets of Cedar Fair, L.P., and subsidiaries (the "Partnership") as of December 31, 2023 and 2022, the related consolidated statements of operations and comprehensive income (loss), partners' deficit, and cash flows for each of the three years in the period ended December 31, 2023, and the related notes (collectively referred to as the “financial statements”). We also have audited the Partnership's internal control over financial reporting as of December 31, 2023, based on criteria established in Internal Control - Integrated Framework (2013) issued by the Committee of Sponsoring Organizations of the Treadway Commission (COSO).
In our opinion, the financial statements referred to above present fairly, in all material respects, the financial position of the Partnership as of December 31, 2023 and 2022, and the results of its operations and its cash flows for each of the three years in the period ended December 31, 2023, in conformity with accounting principles generally accepted in the United States of America. Also, in our opinion, the Partnership maintained, in all material respects, effective internal control over financial reporting as of December 31, 2023, based on criteria established in Internal Control - Integrated Framework (2013) issued by COSO.
Basis for Opinions
The Partnership's management is responsible for these financial statements, for maintaining effective internal control over financial reporting, and for its assessment of the effectiveness of internal control over financial reporting, included in the accompanying Management's Report on Internal Control over Financial Reporting. Our responsibility is to express an opinion on these financial statements and an opinion on the Partnership's internal control over financial reporting based on our audits. We are a public accounting firm registered with the Public Company Accounting Oversight Board (United States) (PCAOB) and are required to be independent with respect to the Partnership in accordance with the U.S. federal securities laws and the applicable rules and regulations of the Securities and Exchange Commission and the PCAOB.
We conducted our audits in accordance with the standards of the PCAOB. Those standards require that we plan and perform the audits to obtain reasonable assurance about whether the financial statements are free of material misstatement, whether due to error or fraud, and whether effective internal control over financial reporting was maintained in all material respects.
Our audits of the financial statements included performing procedures to assess the risks of material misstatement of the financial statements, whether due to error or fraud, and performing procedures to respond to those risks. Such procedures included examining, on a test basis, evidence regarding the amounts and disclosures in the financial statements. Our audits also included evaluating the accounting principles used and significant estimates made by management, as well as evaluating the overall presentation of the financial statements. Our audit of internal control over financial reporting included obtaining an understanding of internal control over financial reporting, assessing the risk that a material weakness exists, and testing and evaluating the design and operating effectiveness of internal control based on the assessed risk. Our audits also included performing such other procedures as we considered necessary in the circumstances. We believe that our audits provide a reasonable basis for our opinions.
Definition and Limitations of Internal Control over Financial Reporting
A company’s internal control over financial reporting is a process designed to provide reasonable assurance regarding the reliability of financial reporting and the preparation of financial statements for external purposes in accordance with generally accepted accounting principles. A company’s internal control over financial reporting includes those policies and procedures that (1) pertain to the maintenance of records that, in reasonable detail, accurately and fairly reflect the transactions and dispositions of the assets of the company; (2) provide reasonable assurance that transactions are recorded as necessary to permit preparation of financial statements in accordance with generally accepted accounting principles, and that receipts and expenditures of the company are being made only in accordance with authorizations of management and directors of the company; and (3) provide reasonable assurance regarding prevention or timely detection of unauthorized acquisition, use, or disposition of the company’s assets that could have a material effect on the financial statements.
Because of its inherent limitations, internal control over financial reporting may not prevent or detect misstatements. Also, projections of any evaluation of effectiveness to future periods are subject to the risk that controls may become inadequate because of changes in conditions, or that the degree of compliance with the policies or procedures may deteriorate.
Critical Audit Matters
The critical audit matters communicated below are matters arising from the current-period audit of the financial statements that were communicated or required to be communicated to the audit committee and that (1) relate to accounts or disclosures that are material to the financial statements and (2) involved our especially challenging, subjective, or complex judgments. The communication of the critical audit matters does not alter in any way our opinion on the financial statements, taken as a whole, and we are not, by communicating the critical audit matters below, providing separate opinions on the critical audit matters or on the accounts or disclosures to which they relate.
30
Deferred Revenues - Revenue Recognition of Multi-Use Season Long Products for Admission - Refer to Notes 2 and 3 in the consolidated financial statements
Critical Audit Matter Description
The Partnership defers revenue for its multi-use products, including season-long products for admissions, dining, beverages, and other products and recognizes revenues over the estimated number of uses expected for each type of product. The Partnership estimates a redemption rate for each multi-use season long product for admission using historical and forecasted uses at each park. Revenue is then recognized on a pro-rated basis based on the estimated allocated selling price of the multi-use season long products for admission and the estimated uses of that product. During the third quarter of 2023, management began selling multi-use season long products for admission for the 2024 operating season. These products include providing the customer park access for the remainder of the 2023 operating season, while also providing the customer with admission for the 2024 operating season.
We identified the amount of deferred revenue associated with the multi-use season long products for admission for selected parks as a critical audit matter because of significant judgments made by management in estimating the amount of revenue that should be recognized in each fiscal year, which in turn led to a high degree of auditor judgment and increased extent of effort.
How the Critical Audit Matter Was Addressed in the Audit
Our audit procedures related to the amount of deferred revenue associated with the multi-use season long products for admission for selected parks that should be recognized in each fiscal year included the following, among others:
•We tested the effectiveness of controls over deferred revenue and revenue recognition related to multi-use season long products for admission for selected parks.
•We performed transaction testing for deferred revenue associated with the multi-use season long products for admission for selected parks by agreeing the amounts recorded as deferred revenue to source documents and determined that products sold related to items that are deferred in nature.
•We tested the completeness of deferred revenue associated with the multi-use season long products for admission for selected parks by making selections from a reciprocal population such as the cash and credit card receipt listings from selected days and determined whether the cash received was appropriately recorded as deferred revenue in the general ledger.
•We developed an independent expectation of the total deferred revenue balances for selected parks and compared such expectation to the recorded amount for reasonableness.
•We developed independent expectations of 2023 admissions revenue related to 2024 multi-use season long products for admission for selected parks and compared such expectations to the recorded revenue amount.
Goodwill - Schlitterbahn Reporting Unit - Refer to Notes 2 and 5 to the consolidated financial statements
Critical Audit Matter Description
The Partnership's evaluation of goodwill for impairment involves the comparison of the fair value of each reporting unit to its carrying value. The Partnership determines the fair value of its reporting units using a combination of an income (discounted cash flow) approach and the market approach. The determination of the fair value using the income approach requires management to make significant assumptions related to terminal value growth rates and weighted-average cost of capital. The determination of the fair value using the market approach requires management to make significant assumptions related to the selection of comparable publicly traded companies and cash flow multiples to determine the fair value. The goodwill balance was $265 million as of December 31, 2023, of which $93 million was allocated to the Schlitterbahn Waterpark & Resort New Braunfels and the Schlitterbahn Waterpark Galveston Reporting Unit ("Schlitterbahn").
We identified certain valuation assumptions in support of goodwill for Schlitterbahn as a critical audit matter because of the significant judgment made by management in determining those valuation assumptions when determining the fair value of Schlitterbahn. This required a high degree of auditor judgment and an increased extent of effort, including the need to include our fair value specialists, when performing audit procedures to evaluate the reasonableness of management's estimates and assumptions related to the terminal value growth rate, weighted-average cost of capital, comparable publicly traded companies, and cash flow multiples.
How the Critical Audit Matter Was Addressed in the Audit
Our audit procedures for the Schlitterbahn reporting unit related to selection of the terminal value growth rate, weighted-average cost of capital, comparable publicly traded companies and cash flow multiples. Those procedures included the following, among others:
•We tested the effectiveness of controls over management's goodwill impairment evaluation related to the determination of the fair value of Schlitterbahn, such as controls related to management's selection of the terminal value growth rate, weighted-average cost of capital, comparable publicly traded companies, and cash flow multiples.
•With the assistance of our fair value specialists, we evaluated the terminal value growth rate and weighted-average cost of capital, including testing the underlying source information and the mathematical accuracy of the calculations, and developing ranges of independent estimates and comparing those to the terminal value growth rate and weighted-average cost of capital selected by management.
31
•With the assistance of our fair value specialists, we evaluated the selected comparable publicly traded companies and cash flow multiples, including testing the underlying source information and mathematical accuracy of the calculations, and comparing the multiples selected by management to its comparable publicly traded companies.
/s/ DELOITTE & TOUCHE LLP
February 16, 2024
We have served as the Partnership’s auditor since 2004.
32
CEDAR FAIR, L.P.
CONSOLIDATED BALANCE SHEETS
(In thousands)
| December 31, 2023 | December 31, 2022 | |||||||||||||
| ASSETS | ||||||||||||||
| Current Assets: | ||||||||||||||
| Cash and cash equivalents | $ | $ | ||||||||||||
| Receivables | ||||||||||||||
| Inventories | ||||||||||||||
| Prepaid insurance | ||||||||||||||
| Other current assets | ||||||||||||||
| Property and Equipment: | ||||||||||||||
| Land | ||||||||||||||
| Land improvements | ||||||||||||||
| Buildings | ||||||||||||||
| Rides and equipment | ||||||||||||||
| Construction in progress | ||||||||||||||
| Less accumulated depreciation | ( | ( | ||||||||||||
| Goodwill | ||||||||||||||
| Other Intangibles, net | ||||||||||||||
| Right-of-Use Asset | ||||||||||||||
| Other Assets | ||||||||||||||
| $ | $ | |||||||||||||
| LIABILITIES AND PARTNERS’ EQUITY | ||||||||||||||
| Current Liabilities: | ||||||||||||||
| Accounts payable | $ | $ | ||||||||||||
| Deferred revenue | ||||||||||||||
| Accrued interest | ||||||||||||||
| Accrued taxes | ||||||||||||||
| Accrued salaries, wages and benefits | ||||||||||||||
| Self-insurance reserves | ||||||||||||||
| Other accrued liabilities | ||||||||||||||
| Deferred Tax Liability | ||||||||||||||
| Lease Liability | ||||||||||||||
| Other Liabilities | ||||||||||||||
| Long-Term Debt: | ||||||||||||||
| Notes | ||||||||||||||
| Partners’ Deficit: | ||||||||||||||
| Special L.P. interests | ||||||||||||||
| General partner | ( | ( | ||||||||||||
Limited partners, | ( | ( | ||||||||||||
| Accumulated other comprehensive income | ||||||||||||||
| ( | ( | |||||||||||||
| $ | $ | |||||||||||||
The accompanying Notes to Consolidated Financial Statements are an integral part of these statements.
33
CEDAR FAIR, L.P.
CONSOLIDATED STATEMENTS OF OPERATIONS AND COMPREHENSIVE INCOME (LOSS)
(In thousands, except per unit amounts)
| Years Ended December 31, | ||||||||||||||||||||
| 2023 | 2022 | 2021 | ||||||||||||||||||
| Net revenues: | ||||||||||||||||||||
| Admissions | $ | $ | $ | |||||||||||||||||
| Food, merchandise and games | ||||||||||||||||||||
| Accommodations, extra-charge products and other | ||||||||||||||||||||
| Costs and expenses: | ||||||||||||||||||||
| Cost of food, merchandise and games revenues | ||||||||||||||||||||
| Operating expenses | ||||||||||||||||||||
| Selling, general and administrative | ||||||||||||||||||||
| Depreciation and amortization | ||||||||||||||||||||
| Loss on impairment / retirement of fixed assets, net | ||||||||||||||||||||
| Gain on sale of land | ( | |||||||||||||||||||
| Loss on other assets | ||||||||||||||||||||
| Operating income | ||||||||||||||||||||
| Interest expense | ||||||||||||||||||||
| Net effect of swaps | ( | ( | ||||||||||||||||||
| Loss on early debt extinguishment | ||||||||||||||||||||
| (Gain) loss on foreign currency | ( | |||||||||||||||||||
| Other income | ( | ( | ( | |||||||||||||||||
| Income (loss) before taxes | ( | |||||||||||||||||||
| Provision for taxes | ||||||||||||||||||||
| Net income (loss) | ( | |||||||||||||||||||
| Net income (loss) allocated to general partner | ||||||||||||||||||||
| Net income (loss) allocated to limited partners | $ | $ | $ | ( | ||||||||||||||||
| Net income (loss) | $ | $ | $ | ( | ||||||||||||||||
| Other comprehensive (loss) income (net of tax): | ||||||||||||||||||||
| Foreign currency translation | ( | |||||||||||||||||||
| Other comprehensive (loss) income (net of tax) | ( | |||||||||||||||||||
| Total comprehensive income (loss) | $ | $ | $ | ( | ||||||||||||||||
| Basic income (loss) per limited partner unit: | ||||||||||||||||||||
| Weighted average limited partner units outstanding | ||||||||||||||||||||
| Net income (loss) per limited partner unit | $ | $ | $ | ( | ||||||||||||||||
| Diluted income (loss) per limited partner unit: | ||||||||||||||||||||
| Weighted average limited partner units outstanding | ||||||||||||||||||||
| Net income (loss) per limited partner unit | $ | $ | $ | ( | ||||||||||||||||
The accompanying Notes to Consolidated Financial Statements are an integral part of these statements.
34
CEDAR FAIR, L.P.
CONSOLIDATED STATEMENTS OF PARTNERS’ DEFICIT
(In thousands, except per unit amounts)
| Limited Partnership Units Outstanding | Limited Partners’ Deficit | General Partner’s Deficit | Special L.P. Interests | Accumulated Other Comprehensive Income (Loss) | Total Partners’ Deficit | ||||||||||||||||||||||||||||||
| Balance as of December 31, 2020 | $ | ( | $ | ( | $ | $ | $ | ( | |||||||||||||||||||||||||||
| Net loss | — | ( | — | — | — | ( | |||||||||||||||||||||||||||||
| Limited partnership units related to equity-based compensation | — | — | — | ||||||||||||||||||||||||||||||||
| Tax effect of units involved in treasury unit transactions | — | ( | — | — | — | ( | |||||||||||||||||||||||||||||
Foreign currency translation adjustment, net of tax $( | — | — | — | — | |||||||||||||||||||||||||||||||
| Balance as of December 31, 2021 | $ | ( | $ | ( | $ | $ | $ | ( | |||||||||||||||||||||||||||
| Net income | — | — | — | ||||||||||||||||||||||||||||||||
| Repurchase of limited partnership units | ( | ( | — | — | — | ( | |||||||||||||||||||||||||||||
Partnership distribution declared ($ | — | ( | — | — | — | ( | |||||||||||||||||||||||||||||
| Limited partnership units related to equity-based compensation | — | — | — | ||||||||||||||||||||||||||||||||
| Tax effect of units involved in treasury unit transactions | — | ( | — | — | — | ( | |||||||||||||||||||||||||||||
Foreign currency translation adjustment, net of tax $ | — | — | — | — | |||||||||||||||||||||||||||||||
| Balance as of December 31, 2022 | $ | ( | $ | ( | $ | $ | $ | ( | |||||||||||||||||||||||||||
| Net income | — | — | — | ||||||||||||||||||||||||||||||||
| Repurchase of limited partnership units | ( | ( | ( | — | — | ( | |||||||||||||||||||||||||||||
Partnership distribution declared ($ | — | ( | — | — | — | ( | |||||||||||||||||||||||||||||
| Limited partnership units related to equity-based compensation | — | — | — | ||||||||||||||||||||||||||||||||
| Tax effect of units involved in treasury unit transactions | — | — | — | — | |||||||||||||||||||||||||||||||
Foreign currency translation adjustment, net of tax $( | — | — | — | — | ( | ( | |||||||||||||||||||||||||||||
| Balance as of December 31, 2023 | $ | ( | $ | ( | $ | $ | $ | ( | |||||||||||||||||||||||||||
The accompanying Notes to Consolidated Financial Statements are an integral part of these statements.
35
CEDAR FAIR, L.P.
CONSOLIDATED STATEMENTS OF CASH FLOWS
(In thousands)
| Years Ended December 31, | ||||||||||||||||||||
| 2023 | 2022 | 2021 | ||||||||||||||||||
| CASH FLOWS FROM OPERATING ACTIVITIES | ||||||||||||||||||||
| Net income (loss) | $ | $ | $ | ( | ||||||||||||||||
| Adjustments to reconcile net income (loss) to net cash from operating activities: | ||||||||||||||||||||
| Depreciation and amortization | ||||||||||||||||||||
| Loss on early debt extinguishment | ||||||||||||||||||||
| Non-cash foreign currency (gain) loss on USD notes | ( | |||||||||||||||||||
| Non-cash equity-based compensation expense | ||||||||||||||||||||
| Non-cash deferred income tax (benefit) expense | ( | |||||||||||||||||||
| Net effect of swaps | ( | ( | ||||||||||||||||||
| Gain on sale of land before cash closing costs | ( | |||||||||||||||||||
| Other non-cash expenses | ||||||||||||||||||||
| Change in operating assets and liabilities: | ||||||||||||||||||||
| (Increase) decrease in receivables | ( | ( | ( | |||||||||||||||||
| (Increase) decrease in inventories | ( | |||||||||||||||||||
| (Increase) decrease in tax receivable/payable | ( | |||||||||||||||||||
| (Increase) decrease in other assets | ||||||||||||||||||||
| Increase (decrease) in accounts payable | ( | ( | ||||||||||||||||||
| Increase (decrease) in deferred revenue | ( | |||||||||||||||||||
| Increase (decrease) in accrued interest | ( | |||||||||||||||||||
| Increase (decrease) in accrued salaries, wages and benefits | ( | ( | ||||||||||||||||||
| Increase (decrease) in other liabilities | ||||||||||||||||||||
| Net cash from operating activities | ||||||||||||||||||||
| CASH FLOWS (FOR) FROM INVESTING ACTIVITIES | ||||||||||||||||||||
| Capital expenditures | ( | ( | ( | |||||||||||||||||
| Proceeds from sale of land | ||||||||||||||||||||
| Proceeds from sale of other assets | ||||||||||||||||||||
| Net cash (for) from investing activities | ( | ( | ||||||||||||||||||
| CASH FLOWS FOR FINANCING ACTIVITIES | ||||||||||||||||||||
| Term debt payments | ( | |||||||||||||||||||
| Note payments, including amounts paid for early termination | ( | |||||||||||||||||||
| Repurchase of limited partnership units | ( | ( | ||||||||||||||||||
| Distributions paid to partners | ( | ( | ||||||||||||||||||
| Payment of debt issuance costs | ( | ( | ||||||||||||||||||
| Payments related to tax withholding for equity compensation | ( | ( | ( | |||||||||||||||||
| Other | ( | ( | ||||||||||||||||||
| Net cash for financing activities | ( | ( | ( | |||||||||||||||||
| EFFECT OF EXCHANGE RATE CHANGES ON CASH AND CASH EQUIVALENTS | ( | |||||||||||||||||||
| Net (decrease) increase for the year | ( | ( | ||||||||||||||||||
| Balance, beginning of year | ||||||||||||||||||||
| Balance, end of year | $ | $ | $ | |||||||||||||||||
| SUPPLEMENTAL INFORMATION | ||||||||||||||||||||
| Cash payments for interest | $ | $ | $ | |||||||||||||||||
| Interest capitalized | ||||||||||||||||||||
| Cash payments for income taxes, net of refunds | ( | |||||||||||||||||||
| Capital expenditures in accounts payable | ||||||||||||||||||||
The accompanying Notes to Consolidated Financial Statements are an integral part of these statements.
36
CEDAR FAIR, L.P.
INDEX FOR NOTES TO CONSOLIDATED FINANCIAL STATEMENTS
37
CEDAR FAIR, L.P.
NOTES TO CONSOLIDATED FINANCIAL STATEMENTS
(1) Partnership Organization:
Cedar Fair, L.P. (together with its affiliated companies, the "Partnership") is a Delaware limited partnership that commenced operations in 1983 when it acquired Cedar Point, Inc., and became a publicly traded partnership in 1987. The Partnership's general partner is Cedar Fair Management, Inc., an Ohio corporation (the “General Partner”), whose shares are held by an Ohio trust. The General Partner owns a 0.001 % interest in the Partnership's income, losses and cash distributions, except in defined circumstances, and has full responsibility for management of the Partnership. As of December 31, 2023, there were 51,013,467 outstanding limited partnership units listed on The New York Stock Exchange, net of 6,048,516 units held in treasury. As of December 31, 2022, there were 52,562,832 outstanding limited partnership units listed, net of 4,499,151 units held in treasury.
The General Partner may, with the approval of a specified percentage of the limited partners, make additional capital contributions to the Partnership, but is only obligated to do so if the liabilities of the Partnership cannot otherwise be paid or there exists a negative balance in its capital account at the time of its withdrawal from the Partnership. The General Partner, in accordance with the terms of the Partnership Agreement, is required to make regular cash distributions on a quarterly basis of all the Partnership's available cash, as defined in the Partnership Agreement. The General Partner paid $1.20 per limited partner unit in distributions, or approximately $61.1 million in aggregate, in 2023.
(2) Description of the Business and Significant Accounting Policies:
Merger Agreement with Six Flags
On November 2, 2023, we announced that we entered into a definitive merger agreement to combine with Six Flags Entertainment Corporation (“Six Flags”) (NYSE: SIX). Subject to the terms and conditions set forth in the merger agreement, each issued and outstanding unit of limited partnership interest in Cedar Fair will be converted into the right to receive one (1) share of common stock of the new combined entity (subject to certain exceptions and as the same may be adjusted). Following the close of the transaction, the holders of units of Cedar Fair limited partnership interest will own approximately 51.2 % of the outstanding shares of the combined company and the holders of Six Flags common stock will own approximately 48.8 % of the outstanding shares of the combined company. The merger is expected to close in the first half of 2024, following receipt of Six Flags' stockholder approval, regulatory approvals, and satisfaction of other customary closing conditions. During 2023, we incurred proposed merger costs totaling $22.3 million, which was primarily comprised of third-party investment banking, consulting and legal costs. These costs were recorded within "Selling, general and administrative" in the consolidated statement of operations and comprehensive income.
Significant Accounting Policies
We use the following policies in the preparation of the accompanying consolidated financial statements.
Principles of Consolidation
Foreign Currency
| Years Ended December 31, | ||||||||||||||||||||
| (In thousands) | 2023 | 2022 | 2021 | |||||||||||||||||
| (Gain) loss on foreign currency related to re-measurement of U.S. dollar denominated notes held in Canada | $ | ( | $ | $ | ||||||||||||||||
| Gain on other transactions | ||||||||||||||||||||
| (Gain) loss on foreign currency | $ | ( | $ | $ | ||||||||||||||||
Segment Reporting
Our properties operate autonomously, and management reviews operating results, evaluates performance and makes operating decisions, including the allocation of resources, on a property-by-property basis. In addition to reviewing and evaluating performance of the business at the property level, the structure of our management incentive compensation systems is centered on the operating results of each property as an integrated operating unit. Therefore, each property represents a separate operating segment of our business with the exception of the Schlitterbahn parks, which are aggregated into one segment.
38
Although we manage our properties with a high degree of autonomy, each property offers and markets a similar collection of products and services to similar customers. In addition, our properties have similar economic characteristics, in that they show similar long-term growth trends in key industry metrics such as attendance, in-park per capita spending, net revenue, operating margin and operating profit. Therefore, we operate within a single reportable segment of amusement/water parks with accompanying resort facilities.
Estimates
The preparation of financial statements in conformity with GAAP requires management to make estimates and assumptions that affect the reported amounts of assets and liabilities, the disclosure of contingent assets and liabilities at the date of the financial statements, and the reported amounts of revenues and expenses during each period. Actual results could differ from those estimates.
Fair Value
Fair value is the price that would be received to sell an asset or paid to transfer a liability in an orderly transaction between market participants, or an exit price. Inputs to valuation techniques used to measure fair value may be observable or unobservable, and valuation techniques used to measure fair value should maximize the use of relevant observable inputs and minimize the use of unobservable inputs. Accordingly, a hierarchical disclosure framework ranks the quality and reliability of information used to determine fair values. The three broad levels of inputs defined by the fair value hierarchy are as follows:
•Level 1 – inputs to the valuation methodology are quoted prices (unadjusted) for identical assets or liabilities in active markets.
•Level 2 – inputs to the valuation methodology include quoted prices for similar assets and liabilities in active markets, and inputs that are observable for the asset or liability, either directly or indirectly, for substantially the full term of the financial instrument.
•Level 3 – inputs to the valuation methodology are unobservable and significant to the fair value measurement.
A financial instrument's categorization within the valuation hierarchy is based upon the lowest level of input that is significant to the fair value measurement. Assets and liabilities recognized or disclosed at fair value on a recurring basis include derivatives, debt and short-term investments.
Cash and Cash Equivalents
Inventories
Property and Equipment
The estimated useful lives of the assets are as follows:
| Land improvements | Approximately | ||||||||||
| Buildings | - | ||||||||||
| Rides | - | ||||||||||
| Equipment | - | ||||||||||
39
Impairment of Long-Lived Assets
Accounting for Business Combinations
Business combinations are accounted for under the acquisition method of accounting. The amounts assigned to the identifiable assets acquired and liabilities assumed in connection with acquisitions are based on estimated fair values as of the date of the acquisition, with the remainder, if any, recorded as goodwill. The fair values are determined by management, taking into consideration information supplied by the management of the acquired entities, valuations supplied by independent appraisal experts and other relevant information. The valuations are generally based upon future cash flow projections for the acquired assets, discounted to present value. The determination of fair values requires significant judgment by management.
Goodwill
Goodwill is reviewed annually for impairment, or whenever events or changes in circumstances indicate that the carrying value may not be recoverable. Goodwill is allocated to reporting units and goodwill impairment tests are performed at the reporting unit level. We perform our annual goodwill impairment test as of the first day of the fourth quarter.
We may elect to first perform a qualitative assessment to determine whether it is more likely than not that a reporting unit is impaired. If we do not perform a qualitative assessment, or if we determine that it is not more likely than not that the fair value of the reporting unit exceeds its carrying amount, we calculate the fair value of the reporting unit. The fair value of a reporting unit is established using a combination of an income (discounted cash flow) approach and market approach. The income approach uses a reporting unit's projection of estimated operating results and discounted cash flows using a weighted-average cost of capital that reflects current market conditions. Estimated operating results are established using management's best estimates of economic and market conditions over the projected period including growth rates in revenues and costs, estimates of future expected changes in operating margins and cash expenditures. Other significant estimates and assumptions include terminal value growth rates, future estimates of capital expenditures and changes in future working capital requirements. A market approach estimates fair value by applying cash flow multiples to the reporting unit's operating performance. The multiples are derived from comparable publicly traded companies with similar operating and investment characteristics of the reporting units. If an impairment is identified, an impairment charge is recognized for the amount by which a reporting unit's carrying amount exceeds its fair value, not to exceed the carrying amount of goodwill.
Other Intangible Assets
Our finite-lived intangible assets consist primarily of licenses, franchise agreements and the California's Great America trade name. These intangible assets are amortized on a straight-line basis over the life of the agreement, ranging from to twenty years .
40
Self-Insurance Reserves
Derivative Financial Instruments
Leases
We have commitments under various operating leases. Right-of-use assets and lease liabilities are recognized at the present value of the future lease payments at the lease commencement date. The discount rate used to determine the present value of the future lease payments is generally our incremental borrowing rate as the rate implicit in most of our leases is not readily determinable. As a practical expedient, a relief provided in the accounting standard to simplify compliance, we do not recognize right-of-use assets and lease liabilities for leases with an original term of one year or less. The current portion of our lease liability is recorded within "" in the consolidated balance sheets.
Revenue Recognition and related receivables and contract liabilities
As disclosed within the consolidated statements of operations and comprehensive income (loss), revenues are generated from sales of (1) admission to our amusement parks and water parks, (2) food, merchandise and games both inside and outside the parks, and (3) accommodations, extra-charge products, and other revenue sources. Admission revenues include amounts paid to gain admission into our parks, including parking fees. Revenues related to extra-charge products, including premium benefit offerings such as front-of-line products, and online transaction fees charged to customers are included in "Accommodations, extra-charge products and other". Due to our highly seasonal operations, a substantial portion of our revenues are generated from Memorial Day through Labor Day. Most revenues are recognized on a daily basis based on actual guest spend at our properties. Revenues from multi-use products, including season-long products for admission, dining, beverage and other products, are recognized over the estimated number of uses expected for each type of product. The estimated number of uses is reviewed and may be updated periodically during the operating season prior to the ticket or product expiration, which generally occurs no later than the close of the operating season associated with that product. The number of uses is estimated based on historical usage adjusted for current period trends. For any bundled products that include multiple performance obligations, revenue is allocated using the retail price of each distinct performance obligation and any inherent discounts are allocated based on the gross margin and expected redemption of each performance obligation. We do not typically provide for refunds or returns.
In some instances, we arrange with outside parties ("concessionaires") to provide goods to guests, typically food and merchandise, and we act as an agent, resulting in net revenues recorded within the consolidated statements of operations and comprehensive income (loss). Concessionaire arrangement revenues are recognized over the operating season and are variable. Fixed sponsorship revenues and marina revenues, which are classified as "Accommodations, extra-charge products and other," are recognized over the park operating season which represents the period in which the performance obligations are satisfied. We also recognize variable sponsorship revenues which are based on achievement of specified operating metrics. We estimate variable revenues and perform a constraint analysis using both historical information and current trends to determine the amount of revenue that is not probable of a significant reversal.
Most deferred revenue is classified as current within the balance sheet. However, a portion of deferred revenue is typically classified as non-current during the third quarter related to season-long products sold in the current season for use in the subsequent season. Season-long products are typically sold beginning in August of the year preceding the operating season. Season-long products may subsequently be recognized 12 to 16 months after purchase depending on the date of sale. We estimate the number of uses expected outside of the next twelve months for each type of product and classify the related deferred revenue as non-current in the consolidated balance sheets.
Except for the non-current deferred revenue described above, our contracts with customers typically have an original duration of one year or less. For these short-term contracts, we use the practical expedient applicable to such contracts and have not disclosed the transaction price for the remaining performance obligations as of the end of each reporting period or when we expect to recognize this revenue. Further, we elected to recognize incremental costs of obtaining a contract as an expense when incurred as the amortization period of the asset would be less than one year. Lastly, we elected not to adjust consideration for the effects of significant financing components of our installment purchase plans because the terms of these plans do not exceed one year.
41
Advertising Costs
Equity-Based Compensation
We measure compensation cost for all equity-based awards at fair value on the date of grant. We recognize the compensation cost over the service period. We recognize forfeitures as they occur.
Income Taxes
Our legal entity structure includes both partnerships and corporate subsidiaries. We are subject to publicly traded partnership tax ("PTP tax") on certain partnership level gross income (net revenues less cost of food, merchandise, and games revenues), state and local income taxes on partnership income, U.S. federal state and local income taxes on income from our corporate subsidiaries and foreign income taxes on our foreign subsidiary. As such, the total provision for taxes includes amounts for the PTP gross income tax and federal, state, local and foreign income taxes. Under applicable accounting rules, the total provision for income taxes includes the amount of taxes payable for the current year and the impact of deferred tax assets and liabilities, which represents future tax consequences of events that are recognized in different periods in the financial statements than for tax purposes.
Neither financial reporting income, nor the cash distributions to unitholders, can be used as a substitute for the detailed tax calculations that we must perform annually for our partners. Net income from the Partnership is not treated as passive income for federal income tax purposes. As a result, partners subject to the passive activity loss rules are not permitted to offset income from the Partnership with passive losses from other sources.
Government Assistance
On March 27, 2020, the Coronavirus Aid, Relief, and Economic Security Act (the "CARES Act") was signed into law. As a result of the CARES Act, we deferred $8.2 million of the employer's share of Social Security taxes, which was payable in 50 0.5 million in tax benefits from the Employee Retention Credit program during the year ended December 31, 2021. The tax benefits from the Employee Retention Credit program were recorded as a reduction to wage expense within the consolidated statements of operations and comprehensive loss as the benefits were offered to defray labor costs during the COVID-19 pandemic.
We also received $5.1 million from the Canada Emergency Wage Subsidy ("CEWS") during the year ended December 31, 2021. The CEWS provided cash payments to Canadian employers that experienced a decline in revenues related to the COVID-19 pandemic. We recorded the CEWS payments as a reduction to wage expense within the consolidated statements of operations and comprehensive loss as the payments were offered to defray labor costs during the COVID-19 pandemic.
Contingencies
We are a party to a number of lawsuits arising in the normal course of business. In the opinion of management, none of these matters, beyond what has been disclosed within this Form 10-K, are expected to have a material effect in the aggregate on the consolidated financial statements.
Earnings Per Unit
42
| Years Ended December 31, | ||||||||||||||||||||
| (In thousands, except per unit amounts) | 2023 | 2022 | 2021 | |||||||||||||||||
| Basic weighted average units outstanding | ||||||||||||||||||||
| Effect of dilutive units: | ||||||||||||||||||||
| Diluted weighted average units outstanding | ||||||||||||||||||||
| Net income (loss) per unit - basic | $ | $ | $ | ( | ||||||||||||||||
| Net income (loss) per unit - diluted | $ | $ | $ | ( | ||||||||||||||||
There were approximately 0.4 million potentially dilutive units excluded from the computation of diluted loss per limited partner unit for the year ended December 31, 2021 as their effect would have been anti-dilutive due to the net loss in the period.
Performance units are included in the calculation of diluted earnings per limited partner unit to the extent that the performance conditions would have been met at the end of the reporting period if the end of the reporting period were the end of the performance period. The performance units included in the calculation of diluted earnings per limited partner unit as of December 31, 2023 included a portion of the 2021-2025 performance-based units awarded in 2021. The 2022-2024 and 2023-2025 performance-based units awarded in 2022 and 2023, respectively, and the transaction-based units awarded in connection with the proposed merger in 2023 were excluded from the calculation of diluted earnings per limited partner unit as the related performance conditions had not been met as of December 31, 2023. See Note 8 for additional information. The performance units included in the calculation of diluted earnings per limited partner unit as of December 31, 2022 were limited to performance-based other units awarded in 2020 to incentivize executive performance in light of the effects of the COVID-19 pandemic, and which were payable in the first quarter of 2022. All outstanding performance units as of December 31, 2022 were excluded from the calculation of diluted earnings per limited partner unit as the performance conditions had not been met as of December 31, 2022.
New Accounting Pronouncements
In November 2023, the Financial Accounting Standards Board ("FASB") issued Accounting Standards Update No. 2023-07, Segment Reporting (Topic 280): Improvements to Reportable Segment Disclosures ("ASU 2023-07"). ASU 2023-07 requires the disclosure of incremental segment information on an annual and interim basis, including the disclosure of significant segment expense categories. ASU 2023-07 is effective for fiscal years beginning after December 15, 2023 and interim periods beginning after December 15, 2024. Early adoption is permitted. The amendments should be applied retrospectively to all prior periods presented in the financial statements. We are in the process of evaluating the effect this standard will have on the consolidated financial statement disclosures.
In December 2023, the FASB issued Accounting Standards Update No. 2023-09, Income Taxes (Topic 740): Improvements to Income Tax Disclosures ("ASU 2023-09"). ASU 2023-09 requires additional income tax disclosures, including amendments to the rate reconciliation and income taxes paid disclosure. ASU 2023-09 is effective for fiscal years beginning after December 15, 2024. Early adoption is permitted. The amendments should be applied on a prospective basis, but retrospective application is permitted. We are in the process of evaluating the effect this standard will have on the consolidated financial statement disclosures.
(3) Revenue Recognition:
As disclosed within the consolidated statements of operations and comprehensive income (loss), revenues are generated from sales of (1) admission to our amusement parks and water parks, (2) food, merchandise and games both inside and outside the parks, and (3) accommodations, extra-charge products, and other revenue sources. Admission revenues include amounts paid to gain admission into our parks, including parking fees. Revenues related to extra-charge products, including premium benefit offerings such as front-of-line products, and online transaction fees charged to customers are included in "Accommodations, extra-charge products and other".
The following table presents net revenues disaggregated by revenues generated within the parks and revenues generated from out-of-park operations less amounts remitted to outside parties under concessionaire arrangements for the periods presented. The amounts are not comparable due to the effects of the COVID-19 pandemic in 2021.
43
| Years Ended December 31, | ||||||||||||||||||||
| (In thousands) | 2023 | 2022 | 2021 | |||||||||||||||||
| In-park revenues | $ | $ | $ | |||||||||||||||||
| Out-of-park revenues | ||||||||||||||||||||
| Concessionaire remittance | ( | ( | ( | |||||||||||||||||
| Net revenues | $ | $ | $ | |||||||||||||||||
Many products, including season-long products, are sold to customers in advance, resulting in a contract liability ("deferred revenue"). Deferred revenue is typically at its highest immediately prior to the peak summer season, and at its lowest after the peak summer and important fall seasons, as well as at the beginning of the calendar year following the close of our parks' operating seasons. Season-long products represent most of the deferred revenue balance in any given period.
Due to the effects of the COVID-19 pandemic, we extended the validity of our 2020 season-long products through the 2021 operating season in order to ensure our season pass holders received a full season of access to our parks. The extended validity of the 2020 season-long products resulted in a significant amount of revenue deferred from 2020 into 2021. All 2020 and 2021 season-long product revenue had been recognized as of December 31, 2021 except for season-long product extensions into 2022 at two parks. Knott's Berry Farm offered a further day-for-day extension into calendar year 2022 for 2020 and 2021 season-long products for every day the park was closed in 2021. The extension for the 2020 and 2021 season-long products at Knott's Berry Farm concluded and all related revenue was recognized by the end of the second quarter of 2022. Canada's Wonderland also extended its 2020 and 2021 season-long products into calendar year 2022, specifically through Labour Day, or September 5, 2022. All Canada's Wonderland 2020 and 2021 season-long product revenue was recognized by the end of the third quarter of 2022. In order to calculate revenue recognized on these extended season-long products, management made significant estimates regarding the estimated number of uses expected for these season-long products for admission, dining, beverage and other products, including during interim periods.
Of the $162.7 million of current deferred revenue recorded as of January 1, 2023, all of the deferred revenue was recognized by December 31, 2023, except for an immaterial amount of deferred revenue for prepaid products such as gift cards and prepaid games cards. As of December 31, 2023, we had recorded $7.9 million of non-current deferred revenue which largely represented prepaid lease payments for a portion of the California's Great America parking lot. The prepaid lease payments are being recognized through 2027 following the sale of the land under California's Great America; see Note 4. Prior to the sale, the prepaid lease payments were being recognized through 2039.
Payment is due immediately on the transaction date for most products. Our receivable balance includes outstanding amounts on installment purchase plans which are offered for season-long products, and includes sales to retailers, group sales and catering activities which are billed. Installment purchase plans vary in length from three monthly installments to 12 monthly installments. Payment terms for billings are typically net 30 days. Receivables in a typical operating year are highest in the peak summer months and lowest in the winter months. We are not exposed to a significant concentration of customer credit risk. As of December 31, 2023 and December 31, 2022, we recorded a $6.3 million and $5.8 million allowance for doubtful accounts, respectively, representing estimated defaults on installment purchase plans. The default estimate is calculated using historical default rates adjusted for current period trends. The allowance for doubtful accounts is recorded as a reduction of deferred revenue to the extent revenue has not been recognized on the corresponding season-long products.
(4) Long-Lived Assets:
Long-lived assets are reviewed for impairment upon the occurrence of events or changes in circumstances that would indicate that the carrying value of the assets may not be recoverable. In order to determine if an asset has been impaired, assets are grouped and tested at the lowest level for which identifiable, independent cash flows are available. A significant amount of judgment is involved in determining if an indicator of impairment has occurred. Such indicators may include, among others: a significant decrease in the market price of a long-lived asset; a significant adverse change in the extent or manner in which a long-lived asset is being used or in its physical condition; a significant adverse change in legal factors or in the business climate; an accumulation of costs significantly in excess of the amount originally expected for the acquisition or construction of a long-lived asset; past, current or future operating or cash flow losses that demonstrate continuing losses associated with the use of a long-lived asset; and a current expectation that a long-lived asset will be sold or disposed significantly before the end of its previously estimated useful life. Any adverse change in these factors could have a significant impact on the recoverability of these assets and could have a material impact on the consolidated financial statements. We concluded no indicators of impairment existed during 2023. We based our conclusions on our financial performance projections, as well as an updated analysis of macroeconomic and industry-specific conditions.
On June 27, 2022, the Partnership sold the land at California's Great America for a cash purchase price of $310 million, subject to customary prorations, which resulted in a $155.3 million gain recorded, net of transaction costs, within "Gain on sale of land" in the consolidated statement of operations and comprehensive income (loss) during the third quarter of 2022. Concurrently with the sale, we entered into a lease contract that allows us to operate the park during a six-year term; see Note 11. As a result, we changed the estimated useful lives of the remaining property and equipment at California's Great America to an approximate 5.5 -year period, or through December 31, 2027. We expect this to result in an approximate $8 million increase in annual depreciation
44
expense over the 5.5 -year period. We may dispose of the remaining property and equipment at California's Great America significantly before the end of their previously estimated useful lives if the assets are not sold to a third party or transferred for an alternate use. As a result, we tested the long-lived assets at California's Great America for impairment during the second quarter of 2022, which resulted in no impairment. The fair value of the long-lived assets was determined using a replacement cost approach. There were no other indicators of impairment during 2022.
(5) Goodwill and Other Intangible Assets:
Goodwill and other indefinite-lived intangible assets, including trade names, are reviewed for impairment annually, or more frequently if indicators of impairment exist. We concluded no indicators of impairment existed during 2023. We based our conclusions on our financial performance projections, as well as an updated analysis of macroeconomic and industry-specific conditions. We performed our annual impairment test as of the first days of the fourth quarter in 2023 and 2022, respectively, and concluded there was no
During the second quarter of 2022, we concluded the useful life of the trade name, California's Great America, was no longer indefinite due to the then-anticipated sale of the land and the eventual disposal of the remaining assets; see Note 4. As a result, we tested the California's Great America trade name totaling $0.7 million for impairment during the second quarter of 2022 resulting in no impairment. The fair value of the trade name was calculated using a relief-from-royalty model. We are amortizing the trade name over an approximate period, or through December 31, 2027. There were no other indicators of impairment during 2022.
Changes in the carrying value of goodwill for the years ended December 31, 2023 and December 31, 2022 were:
| (In thousands) | Goodwill | |||||||
| Balance as of December 31, 2021 | $ | |||||||
| Foreign currency exchange translation | ( | |||||||
| Balance as of December 31, 2022 | $ | |||||||
| Foreign currency exchange translation | ||||||||
| Balance as of December 31, 2023 | $ | |||||||
As of December 31, 2023 and December 31, 2022, other intangible assets consisted of the following:
| (In thousands) | Weighted Average Amortization Period | Gross Carrying Amount | Accumulated Amortization | Net Carrying Value | ||||||||||||||||||||||
| December 31, 2023 | ||||||||||||||||||||||||||
| Other intangible assets: | ||||||||||||||||||||||||||
| Trade names (1) | $ | $ | ( | $ | ||||||||||||||||||||||
| License / franchise agreements | ( | |||||||||||||||||||||||||
| Total other intangible assets | $ | $ | ( | $ | ||||||||||||||||||||||
| December 31, 2022 | ||||||||||||||||||||||||||
| Other intangible assets: | ||||||||||||||||||||||||||
| Trade names (1) | $ | $ | ( | $ | ||||||||||||||||||||||
| License / franchise agreements | ( | |||||||||||||||||||||||||
| Total other intangible assets | $ | $ | ( | $ | ||||||||||||||||||||||
(1) Trade name amortization represents amortization of the California's Great America trade name. Our other trade names are indefinite-lived.
Amortization expense of finite-lived other intangible assets for 2023, 2022 and 2021 was immaterial and is expected to be immaterial going forward.
45
(6) Long-Term Debt:
Long-term debt as of December 31, 2023 and December 31, 2022 consisted of the following:
| (In thousands) | December 31, 2023 | December 31, 2022 | ||||||||||||
2025 U.S. fixed rate senior secured notes at | $ | $ | ||||||||||||
2027 U.S. fixed rate senior unsecured notes at | ||||||||||||||
2028 U.S. fixed rate senior unsecured notes at | ||||||||||||||
2029 U.S. fixed rate senior unsecured notes at | ||||||||||||||
| Less current portion | ||||||||||||||
| Less debt issuance costs and original issue discount | ( | ( | ||||||||||||
| $ | $ | |||||||||||||
Term Debt and Revolving Credit Facilities
In April 2017, we amended and restated our credit agreement (the "2017 Credit Agreement") which includes our senior secured revolving credit facility and which included a senior secured term loan facility. During 2022, we made the remaining $264.3 million of principal payments on the senior secured term loan facility, fully repaying the term loan facility. As a result, we recognized a $1.8 million loss on early debt extinguishment during the third quarter of 2022, inclusive of the write-off of debt issuance costs and original issue discount. Prior to repayment, the term loan facility was scheduled to mature on April 15, 2024 and bore interest at London InterBank Offered Rate ("LIBOR") plus 175 basis points ("bps").
As of December 31, 2023, our total senior secured revolving credit facility capacity under the 2017 Credit Agreement, as amended, was $300 million with a Canadian sub-limit of $15 million. The senior secured revolving credit facility bears interest at Secured Overnight Financing Rate ("SOFR") plus 350 bps with a SOFR adjustment of 10 bps per annum and a floor of zero , requires the payment of a 62.5 bps commitment fee per annum on the unused portion of the revolving credit facility, in each case without any step-downs, and is collateralized by substantially all of the assets of the Partnership. The senior secured revolving credit facility matures on February 10, 2028, provided that the maturity date will be (x) January 30, 2025 if at least $200 million of the 2025 senior notes remain outstanding as of that date, or (y) January 14, 2027 if at least $200 million of the 2027 senior notes remain outstanding as of that date. Prior to an amendment entered into on February 10, 2023, borrowings under the senior secured revolving credit facility bore interest at LIBOR plus 350 bps or Canadian Dollar Offered Rate ("CDOR") plus 250 bps and matured in December 2023. As of December 31, 2023 and December 31, 2022, no 19.9 million, we had $280.1
In April 2022, $75 million of the senior secured revolving credit facility capacity under the 2017 Credit Agreement matured, and the outstanding borrowings were repaid. While such $75 million of senior secured revolving credit facility capacity was available, borrowings under this portion of the revolver capacity bore interest at LIBOR plus 300 bps or CDOR plus 200 bps, and the unused portion of this revolving credit facility capacity required the payment of a 37.5 bps commitment fee per annum.
Notes
In April 2020, as a result of the anticipated effects of the COVID-19 pandemic, we issued $1.0 billion of 5.500 % senior secured notes due 2025 ("2025 senior notes") in a private placement. The 2025 senior notes and the related guarantees are secured by first-priority liens on the issuers' and the guarantors' assets that secure all the obligations under our credit facilities. The net proceeds from the offering of the 2025 senior notes were used to repay $463.3 million of our then-outstanding senior secured term loan facility. The remaining amount was for general corporate and working capital purposes, including fees and expenses related to the transaction. The 2025 senior notes pay interest semi-annually in May and November, with the principal due in full on May 1, 2025. The 2025 senior notes may be redeemed, in whole or in part, at various prices depending on the date redeemed.
In April 2017, we issued $500 million of 5.375 % senior unsecured notes due 2027 ("2027 senior notes"). The 2027 senior notes pay interest semi-annually in April and October, with the principal due in full on April 15, 2027. The 2027 senior notes may be redeemed, in whole or in part, at various prices depending on the date redeemed.
In June 2019, we issued $500 million of 5.250 % senior unsecured notes due 2029 ("2029 senior notes"). The 2029 senior notes pay interest semi-annually in January and July, with the principal due in full on July 15, 2029. The 2029 senior notes may be redeemed, in whole or in part, at any time prior to July 15, 2024 at a price equal to 100 % of the principal amount of the notes redeemed plus a "make-whole" premium together with accrued and unpaid interest and additional interest, if any, to the redemption date. Thereafter, the 2029 senior notes may be redeemed, in whole or in part, at various prices depending on the date redeemed.
46
In October 2020, in response to the continuing effects of the COVID-19 pandemic, we issued $300 million of 6.500 % senior unsecured notes due 2028 ("2028 senior notes"). The net proceeds from the offering of the 2028 senior notes were for general corporate and working capital purposes, including fees and expenses related to the transaction. The 2028 senior notes pay interest semi-annually in April and October with the principal due in full on October 1, 2028. The 2028 senior notes may be redeemed, in whole or in part, at various prices depending on the date redeemed.
In June 2014, we issued $450 million of 5.375 % senior unsecured notes due 2024 ("2024 senior notes"). On December 17, 2021, we redeemed all of the 2024 senior notes at a redemption price equal to 100.896 % of the principal amount plus accrued and unpaid interest. As a result, we recognized a $5.9 million loss on early debt extinguishment during the fourth quarter of 2021, inclusive of debt premium payments of $4.1 million and the write-off of debt issuance costs of $1.8 million.
As market conditions warrant, we may from time to time repurchase our outstanding debt securities in privately negotiated or open market transactions, by tender offer, exchange offer or otherwise.
Covenants
The 2017 Credit Agreement, as amended, includes a Senior Secured Leverage Ratio of 3.75 x Total First Lien Senior Secured Debt-to-Consolidated EBITDA. This financial covenant is only required to be tested at the end of any fiscal quarter in which revolving credit facility borrowings are outstanding. We were in compliance with the applicable financial covenants under our credit agreement during 2023.
Our credit agreement and fixed rate note agreements include Restricted Payment provisions, which could limit our ability to pay partnership distributions. Pursuant to the terms of the indenture governing the 2027 senior notes, which includes the most restrictive of these Restricted Payments provisions, if our pro forma Total-Indebtedness-to-Consolidated-Cash-Flow Ratio is greater than 5.25 x, we can still make Restricted Payments of $100 million annually so long as no default or event of default has occurred and is continuing. If our pro forma Total-Indebtedness-to-Consolidated-Cash-Flow Ratio is less than or equal to 5.25 x, we can make Restricted Payments up to our Restricted Payment pool. Our pro forma Total-Indebtedness-to-Consolidated-Cash-Flow Ratio was less than 5.25 x as of December 31, 2023.
(7) Derivative Financial Instruments:
Derivative financial instruments have been used within our overall risk management program to manage certain interest rate and foreign currency risks. When we use a derivative instrument to hedge exposure to variable interest rate changes, we are exposed to counterparty credit risk, in particular the failure of the counterparty to perform under the terms of the derivative contract. To mitigate this risk, hedging instruments are placed with a counterparty that we believe poses minimal credit risk. We do not use derivative financial instruments for trading purposes.
We terminated our interest rate swap agreements during the third quarter of 2022 following the full repayment of our senior secured term loan facility, resulting in a $5.3 million cash receipt, net of fees. The interest rate swap agreements were not designated as hedging instruments. Instruments that do not qualify for hedge accounting are adjusted to fair value each reporting period through "Net effect of swaps" within the consolidated statements of operations and comprehensive income (loss).
(8) Partners' Equity and Equity-Based Compensation:
Special L.P. Interests
In accordance with the Partnership Agreement, certain partners were allocated $5.3 million of 1987 and 1988 taxable income (without any related cash distributions) for which they received Special L.P. Interests. The Special L.P. Interests do not participate in cash distributions and have no voting rights. However, the holders of Special L.P. Interests will receive in the aggregate $5.3 million upon liquidation of the Partnership.
Equity-Based Incentive Plan
The 2016 Omnibus Incentive Plan was approved by our unitholders in June 2016 and allows the awarding of 2.8 million units, plus units subject to outstanding awards under the prior plan that cease to be subject to such awards, as determined by the People, Culture & Compensation Committee (the "Compensation Committee") of the Board of Directors as an element of compensation to senior management, key employees and directors. The 2016 Omnibus Incentive Plan superseded the 2008 Omnibus Incentive Plan which was approved by our unitholders in May 2008 and allowed the awarding of up to 2.5 million unit options and other forms of equity. Outstanding awards under the 2008 Omnibus Incentive Plan continue to be in effect and are governed by the terms of that plan. The 2016 Omnibus Incentive Plan provides an opportunity for officers, directors, and eligible persons to acquire an interest in the growth and performance of our units and provides employees annual and long-term
47
incentive awards as determined by the Board of Directors. Under the 2016 Omnibus Incentive Plan, the Compensation Committee may grant unit options, unit appreciation rights, restricted units, performance awards, other unit awards, cash incentive awards and unrestricted unit awards. The awards granted by the Compensation Committee fall into two categories: 1) Awards Payable in Cash or Equity and 2) Awards Payable in Equity. The impact of these awards is more fully described below.
Equity-based compensation expense recognized in the consolidated statements of operations and comprehensive income (loss) within "Selling, General and Administrative Expense" for the applicable periods was as follows:
| Years Ended December 31, | ||||||||||||||||||||
| (In thousands) | 2023 | 2022 | 2021 (1) | |||||||||||||||||
| Awards Payable in Cash or Equity | ||||||||||||||||||||
| Deferred units | $ | $ | ( | $ | ||||||||||||||||
| Awards Payable in Equity | ||||||||||||||||||||
| Performance units | ||||||||||||||||||||
| Restricted units | ||||||||||||||||||||
| Total equity-based compensation expense | $ | $ | $ | |||||||||||||||||
(1) Due to the effects of the COVID-19 pandemic on 2020 results, the 2018-2020 three-year performance plan was below the payout threshold. Given that two full years of the program were completed, the 2018-2020 performance unit awards were modified to allow for a payout taking into account 2018-2019 results, management's performance relative to 2020 COVID-19 strategic goals and 2020 pre-COVID-19 forecast, resulting in $3.9 million of additional expense recognized during the year ended December 31, 2021.
Awards Payable in Cash or Equity
Deferred Units
| (In thousands, except per unit amounts) | Number of Units | Weighted Average Grant Date Fair Value Per Unit | ||||||||||||
| Outstanding deferred units at December 31, 2022 | $ | |||||||||||||
Granted (1) | $ | |||||||||||||
| Settled | ( | $ | ||||||||||||
| Outstanding deferred units at December 31, 2023 | $ | |||||||||||||
(1) Includes 1 forfeitable distribution-equivalent units
Deferred unit awards vest over a one-year period and the settlement of these units is deferred until the individual's service to the Partnership ends. The deferred units begin to accumulate distribution-equivalents upon vesting and are paid when the restriction ends. The effect of outstanding deferred unit awards has been included in the diluted earnings per unit calculation for the year ended December 31, 2023, as a portion of the awards are expected to be settled in limited partnership units. As of December 31, 2023, the market value of the deferred units was $2.4 million, was classified as current and was recorded within "Other accrued liabilities" within the consolidated balance sheet. As of December 31, 2023, there was no unamortized expense related to unvested deferred unit awards as all units were fully vested.
Awards Payable in Equity
Performance Units
| (In thousands, except per unit amounts) | Number of Units | Weighted Average Grant Date Fair Value Per Unit | ||||||||||||
| Unvested performance units at December 31, 2022 | $ | |||||||||||||
Granted (1) | $ | |||||||||||||
| Forfeited | ( | $ | ||||||||||||
| Vested | $ | |||||||||||||
| Unvested performance units at December 31, 2023 | $ | |||||||||||||
(1) Includes 27 forfeitable distribution-equivalent units
Of the unvested performance units outstanding as of December 31, 2023, 0.6 million units represented annual awards for the 2022-2024 and 2023-2025 three-year performance periods. The number of performance units issuable under these performance unit awards are contingently based upon certain performance targets over each three-year vesting period. The annual
48
performance awards and the related forfeitable distribution-equivalent units are paid out in the first quarter following the performance period in limited partnership units.
The remaining outstanding performance units as of December 31, 2023 represented the 2021-2025 performance-based units awarded in 2021. These units were awarded instead of the traditional annual performance unit awards with three-year performance periods due to continued uncertainty related to the COVID-19 pandemic. The number of performance units issuable under the 2021-2025 performance-based unit awards are contingently based upon three separate financial performance targets which can vest over a to five-year period. The performance targets become incrementally higher over the five-year period. The 2021-2025 performance-based unit awards and related forfeitable distribution-equivalent units will be paid out in limited partnership units upon the achievement of each target. For the Adjusted EBITDA targets, the awards will be payable in the first quarter following the year the target was earned. For the other two financial performance targets, the awards will be payable in the first quarter following the year the target was earned unless the target is earned in year three. If the other two financial performance targets are earned in year three, the awards will be payable in the first quarter following the fourth year. The first opportunity for units to be paid out under the 2021-2025 performance-based unit awards is the first quarter of 2024.
The effect of outstanding performance unit awards have been included in the diluted earnings per unit calculation for the year ended December 31, 2023 to the extent that the performance conditions would have been met at the end of the reporting period if the end of the reporting period were the end of the performance period.
As of December 31, 2023, unamortized compensation expense related to unvested performance unit awards was $16.1 million, which is expected to be amortized over a weighted average period of 1.4 years. The fair value of the performance units is based on the unit price the day before the date of grant. We assess the probability of the performance targets being met and may reverse prior period expense or recognize additional expense accordingly.
On December 4, 2023, the Board of Directors approved transaction-based awards totaling 0.2 million units in recognition of certain executive officers' efforts in connection with the entry into the definitive merger agreement with Six Flags. The units will only be earned under these performance-based phantom unit awards if the merger closes. The awards vest 50 % 12 months after December 4, 2023, and 50 % 18 months after December 4, 2023. We will begin recognizing expense related to these awards upon closing of the merger.
Restricted Units
| (In thousands, except per unit amounts) | Number of Units | Weighted Average Grant Date Fair Value Per Unit | ||||||||||||
| Unvested restricted units at December 31, 2022 | $ | |||||||||||||
| Granted | $ | |||||||||||||
| Forfeited | ( | $ | ||||||||||||
| Vested | ( | $ | ||||||||||||
| Unvested restricted units at December 31, 2023 | $ | |||||||||||||
As of December 31, 2023, 0.3 million of our outstanding restricted units vest evenly over an approximate three-year period, 0.1 million units outstanding vest following an approximate three-year cliff vesting period, and approximately 21,500 units outstanding vest under alternate vesting schedules, all of which approximate three years . Restrictions on our restricted unit awards lapse upon vesting. During the vesting period for restricted unit awards, the units accumulate forfeitable distribution-equivalents, which when the units are fully vested, are payable in cash. As of December 31, 2023, the amount of forfeitable distribution equivalents accrued totaled $0.6 million; $0.2 million of which was classified as current and recorded within "Other accrued liabilities" within the consolidated balance sheet and $0.4 million of which was classified as non-current and recorded within "Other Liabilities".
The effect of outstanding restricted unit awards has been included in the diluted earnings per unit calculation for the year ended December 31, 2023.
As of December 31, 2023, unamortized compensation expense, determined as the market value of the units on the day before the date of grant, related to unvested restricted unit awards was $10.4 million, which is expected to be amortized over a weighted average period of 1.6 years.
49
Unit Options
| (In thousands, except per unit amounts) | Unit Options | Weighted Average Exercise Price | Weighted Average Remaining Contractual Life | Aggregate Intrinsic Value | ||||||||||||||||||||||
| Options outstanding at December 31, 2022 | $ | |||||||||||||||||||||||||
| Exercised | ( | $ | ||||||||||||||||||||||||
| Options outstanding at December 31, 2023 | $ | |||||||||||||||||||||||||
| Options exercisable, end of year | $ | $ | ||||||||||||||||||||||||
Unit options are issued with an exercise price no less than the market closing price of the Partnership's units on the day before the date of grant. The unit options in the table above vested over three years and had a maximum term of ten years . As of December 31, 2023, there were no fixed-price unit options outstanding under the 2008 Omnibus Incentive Plan. No options have been granted under the 2016 Omnibus Incentive Plan.
The total intrinsic value of unit options exercised during the years ended December 31, 2023, 2022 and 2021 was $0.7 million, $0.7 million, and $2.0 million, respectively.
Unit Repurchase Plan
On August 3, 2022, we announced our Board of Directors approved a unit repurchase program authorizing the Partnership to repurchase units for an aggregate amount of not more than $250 million. There were 1.4 million limited partnership units repurchased under the August 2022 repurchase program during the year ended December 31, 2023 at an average price of $44.00 per limited partner unit for an aggregate amount of $62.5 million. There were 4.5 million limited partnership units repurchased under the August 2022 repurchase program during the year ended December 31, 2022 at an average price of $41.28 per limited partner unit for an aggregate amount of $187.4 million. There was no remaining availability under the August 2022 repurchase program following April 2023.
On May 4, 2023, we announced our Board of Directors authorized the Partnership to repurchase additional units for an aggregate amount of not more than $250 million. There were 0.3 million units repurchased under the May 2023 repurchase program during the year ended December 31, 2023 at an average price of $38.27 per limited partner unit for an aggregate amount of $12.0 million. Accordingly, there was a total of 1.7 million units repurchased under the August 2022 and May 2023 repurchase programs during the year ended December 31, 2023 at an average price of $42.97 per limited partner unit for an aggregate amount of $74.5 million. There was $238.0 million of remaining availability under the May 2023 repurchase program as of December 31, 2023.
There were no unit repurchases in 2021.
Subject to applicable rules and regulations, we can repurchase units from time-to-time in the open market or by negotiated transactions. The amount and timing of repurchases are based on a variety of factors, including liquidity, capital needs of the business, market conditions, regulatory requirements, and other business considerations. No limit was placed on the duration of either repurchase program. The Partnership is not obligated to repurchase any minimum dollar amount or specific number of units, and can modify, suspend, or discontinue the program at any time.
(9) Retirement Plans:
We have a trusteed, contributory retirement plan for most of our full-time employees. This plan permits employees to contribute specified percentages of their salary, matched up to a limit. Matching contributions, net of forfeitures, approximated $6.9 million, $5.7 million and $4.7 million for the years ended December 31, 2023, 2022 and 2021, respectively. We had trusteed, noncontributory retirement plans for most of our full-time employees prior to 2023. Contributions were discretionary and amounts accrued were approximately $4.8 million and $1.8 million for the years ended 2022 and 2021, respectively. We did not have a material trusteed, noncontributory retirement plan in 2023.
In addition, as of December 31, 2023, approximately 165 employees are covered by union-sponsored, multi-employer pension plans for which approximately $2.1 million, $2.1 million and $1.9 million were contributed for the years ended December 31, 2023, 2022 and 2021, respectively. A union representing approximately 15 employees decertified in 2023. The related withdrawal liability totaled $0.7 million.
50
(10) Income and Partnership Taxes:
Federal and state tax legislation in 1997 provided a permanent income tax exemption to existing publicly traded partnerships (PTP), such as Cedar Fair, L.P., with a PTP tax levied on partnership gross income (net revenues less cost of food, merchandise and games revenues) beginning in 1998. In addition, income taxes are recognized for the amount of income taxes payable by Cedar Fair, L.P. and its corporate subsidiaries for the current year and for the impact of deferred tax assets and liabilities that represent future tax consequences of events that have been recognized differently in the financial statements than for tax purposes. As such, the "Provision for taxes" includes amounts for both the PTP tax and for federal, state, local and foreign income taxes.
The 2023 tax provision totaled $48.0 million, which consisted of a $14.2 million provision for the PTP tax and a $33.8 million provision for income taxes. This compared with a 2022 tax provision of $64.0 million, which consisted of a $14.4 million provision for the PTP tax and a $49.6 million provision for income taxes, and a 2021 tax provision of $20.0 million, which consisted of a $10.3 million provision for the PTP tax and a $9.7 million provision for income taxes. The calculation of the tax provision involves significant estimates and assumptions. Actual results could differ from those estimates.
Significant components of income (loss) before taxes for the years ended December 31, 2023, 2022 and 2021 were as follows:
| (In thousands) | 2023 | 2022 | 2021 | |||||||||||||||||
| Domestic | $ | $ | $ | ( | ||||||||||||||||
| Foreign | ( | |||||||||||||||||||
| Total income (loss) before taxes | $ | $ | $ | ( | ||||||||||||||||
The provision for income taxes was comprised of the following for the years ended December 31, 2023, 2022 and 2021:
| (In thousands) | 2023 | 2022 | 2021 | |||||||||||||||||
| Current federal | $ | $ | $ | ( | ||||||||||||||||
| Current state and local | ||||||||||||||||||||
| Current foreign | ||||||||||||||||||||
| Total current | ( | |||||||||||||||||||
| Deferred federal, state and local | ( | |||||||||||||||||||
| Deferred foreign | ( | |||||||||||||||||||
| Total deferred | ( | |||||||||||||||||||
| Total provision for income taxes | $ | $ | $ | |||||||||||||||||
The provision for income taxes for the corporate subsidiaries differed from the amount computed by applying the U.S. federal statutory income tax rate of 21% to income (loss) before taxes. The sources and tax effects of the differences were as follows:
| (In thousands) | 2023 | 2022 | 2021 | |||||||||||||||||
| Income tax provision based on the U.S. federal statutory tax rate | $ | $ | $ | ( | ||||||||||||||||
| Partnership (income) loss not subject to corporate income tax | ( | ( | ||||||||||||||||||
| State and local taxes, net | ||||||||||||||||||||
| Valuation allowance | ||||||||||||||||||||
| Expired foreign tax credits | ||||||||||||||||||||
| Tax credits | ( | ( | ( | |||||||||||||||||
| Change in U.S. tax law | ( | ( | ||||||||||||||||||
| Foreign currency translation (gains) losses | ( | |||||||||||||||||||
| Nondeductible expenses and other | ( | |||||||||||||||||||
| Total provision for income taxes | $ | $ | $ | |||||||||||||||||
Deferred income taxes reflect the net tax effects of temporary differences between the carrying amounts of assets and liabilities for financial reporting purposes and the amounts used for income tax purposes.
51
Significant components of deferred tax assets and liabilities as of December 31, 2023 and December 31, 2022 were as follows:
| (In thousands) | 2023 | 2022 | ||||||||||||
| Deferred tax assets: | ||||||||||||||
| Compensation | $ | $ | ||||||||||||
| Accrued expenses | ||||||||||||||
| Foreign tax credits | ||||||||||||||
| Tax attribute carryforwards | ||||||||||||||
| Foreign currency translation | ||||||||||||||
| Deferred revenue | ||||||||||||||
| Lease liability | ||||||||||||||
| Deferred tax assets | ||||||||||||||
| Valuation allowance | ( | ( | ||||||||||||
| Net deferred tax assets | ||||||||||||||
| Deferred tax liabilities: | ||||||||||||||
| Property | ( | ( | ||||||||||||
| Intangibles | ( | ( | ||||||||||||
| Right-of-use asset | ( | ( | ||||||||||||
| Deferred tax liabilities | ( | ( | ||||||||||||
| Net deferred tax liability | $ | ( | $ | ( | ||||||||||
We record a valuation allowance if, based on the weight of available evidence, it is more likely than not that some portion, or all, of a deferred tax asset will not be realized. The need for this allowance is based on several factors including the carryforward periods for net operating losses and tax credits, prior experience of tax credit limitations, and management's long-term estimates of domestic and foreign source income.
As of December 31, 2023, we recorded a $32.1 million valuation allowance consisting of $18.0 million related to foreign tax credits, $10.3 million of state net operating loss carryforwards, $2.4 million related to Canadian capital loss carryforwards and $1.4 million related to other state deferred tax assets. The following table presents the changes to the valuation allowance for the periods presented.
| (In thousands) | 2023 | 2022 | 2021 | |||||||||||||||||
| Beginning Valuation Allowance | $ | ( | $ | ( | $ | ( | ||||||||||||||
| Change in Foreign Tax Credit Carryforward Allowance | ( | ( | ( | |||||||||||||||||
| Change in State Net Operating Loss Carryforward Allowance | ( | ( | ||||||||||||||||||
| Change in Canadian Capital Loss Carryforward Allowance | ( | ( | ||||||||||||||||||
| Change in Other State Deferred Tax Asset Allowance | ||||||||||||||||||||
| Ending Valuation Allowance | $ | ( | $ | ( | $ | ( | ||||||||||||||
The CARES Act resulted in various changes to the U.S. tax law, including, among other things, allowing net operating losses arising in tax years 2018 through 2020 to be carried back to the preceding five taxable years and removing the limitation that such losses only offset 80% of taxable income. As a result of these changes, we received U.S. tax refunds attributable to the net operating loss in tax year 2020 being carried back to prior years. We received refunds of $77.1 million during the second quarter of 2022 and an additional $2.5 million during the fourth quarter of 2022. We also received $11.1 million in tax refunds attributable to the net operating loss of our Canadian corporate subsidiary being carried back to prior years in Canada during the first quarter of 2022.
We have recorded a deferred tax liability of $1.9 million and $1.2 million as of December 31, 2023 and December 31, 2022, respectively, to account for foreign currency translation adjustments in other comprehensive income.
Our unrecognized tax benefits, including accrued interest and penalties, were not material in any year presented. We recognize accrued interest and penalties related to unrecognized tax benefits as income tax expense.
The Inflation Reduction Act was signed into law on August 16, 2022 and created a new 15% corporate alternative minimum tax ("CMAT") based on adjusted financial statement income. The effective date of the provision was January 1, 2023. We will not be subject to the CMAT as our reported earnings for each of the past three years did not exceed $1 billion.
The Canadian government has issued draft Pillar Two legislation (Global Minimum Tax Act), which it intends to enact in 2024, that includes the Income Inclusion Rule and Qualified Domestic Minimum Top-Up Tax. The Canadian legislation is expected to be effective for our fiscal year beginning January 1, 2024. We have performed an assessment of the potential exposure to Pillar Two income taxes. This assessment is based on the most recent information available regarding the financial performance of the
52
constituent entities in the Partnership. Based on the assessment performed, the Pillar Two effective tax rates in all jurisdictions in which we operate are above the 15% minimum tax rate. We continue to evaluate the legislation and do not expect an exposure to Pillar Two taxes for 2024.
We are subject to taxation in the U.S., Canada and various state and local jurisdictions. Our tax returns are subject to examination by state and federal tax authorities. With few exceptions, we are no longer subject to examination by the major taxing authorities for tax years before 2019.
(11) Lease Commitments:
Our most significant lease commitment is for the land at California's Great America, which we sold on June 27, 2022. Concurrently with the sale of the land, we entered into a lease contract that allows us to operate the park during a six-year term, and we have an option to extend the term for an additional five years . The lease is subject to early termination by the buyer with at least two years ' prior notice. Upon termination of the lease, we will close existing park operations and remove the rides and attractions from the land. The annual base rent under the lease liability initially was $12.2 million and will increase by 2.5 % per year. Upon commencement of the lease, we recognized a right-of-use asset and lease liability equal to the annual base rent for the initial six-year term and estimated lease payments totaling $12.8 million to dismantle and remove rides and attractions upon termination of the lease. The discount rate used to determine the present value of the future lease payments was our incremental borrowing rate. We sublease a portion of the California's Great America parking lot to the Santa Clara Stadium Authority during Levi's Stadium events. The lease payments were prepaid, and the corresponding income is being recognized over the lease term, or through 2027. The annual lease income recognized is immaterial.
Other significant lease commitments include corporate office space in Charlotte, North Carolina and the land on which Schlitterbahn Waterpark Galveston is located. The corporate office space is generally leased through 2029. The Schlitterbahn Waterpark Galveston land lease has an initial term through 2024 with renewal options at our discretion through 2049, which we have concluded we are reasonably certain to exercise. We have also entered into various operating leases for office equipment, vehicles, storage and revenue-generating assets.
Total lease cost and related supplemental information for the years ended December 31, 2023, 2022 and 2021 were as follows:
| Years Ended December 31, | ||||||||||||||||||||
| (In thousands, except for lease term and discount rate) | 2023 | 2022 | 2021 | |||||||||||||||||
| Operating lease expense | $ | $ | $ | |||||||||||||||||
| Variable lease expense | ||||||||||||||||||||
| Short-term lease expense | ||||||||||||||||||||
| Sublease income | ( | ( | ||||||||||||||||||
| Total lease cost | $ | $ | $ | |||||||||||||||||
| Weighted-average remaining lease term | ||||||||||||||||||||
| Weighted-average discount rate | % | % | % | |||||||||||||||||
| Operating cash flows for operating leases | $ | $ | $ | |||||||||||||||||
| Leased assets obtained in exchange for new operating lease liabilities (non-cash activity) | $ | $ | $ | |||||||||||||||||
53
Future undiscounted cash flows under our operating leases and a reconciliation to the operating lease liabilities recognized as of December 31, 2023 are included below:
| (In thousands) | December 31, 2023 | |||||||
| Undiscounted cash flows | ||||||||
| 2024 | $ | |||||||
| 2025 | ||||||||
| 2026 | ||||||||
| 2027 | ||||||||
| 2028 | ||||||||
| Thereafter | ||||||||
| Total | $ | |||||||
| Present value of cash flows | ||||||||
| Current lease liability | $ | |||||||
| Lease Liability | ||||||||
| Total | $ | |||||||
| Difference between undiscounted cash flows and discounted cash flows | $ | |||||||
(12) Fair Value Measurements:
The table below presents the balances of assets and liabilities measured at fair value as of December 31, 2023 and December 31, 2022 on a recurring basis, as well as the fair values of other financial instruments, including their locations within the consolidated balance sheets:
| (In thousands) | December 31, 2023 | December 31, 2022 | |||||||||||||||||||||||||||
| Balance Sheet Location | Fair Value Hierarchy Level | Carrying Value | Fair Value | Carrying Value | Fair Value | ||||||||||||||||||||||||
| Financial assets (liabilities) measured on a recurring basis: | |||||||||||||||||||||||||||||
| Short-term investments | Level 1 | $ | $ | $ | $ | ||||||||||||||||||||||||
| Other financial assets (liabilities): | |||||||||||||||||||||||||||||
| 2025 senior notes | Long-Term Debt (1) | Level 2 | $ | ( | $ | ( | $ | ( | $ | ( | |||||||||||||||||||
| 2027 senior notes | Long-Term Debt (1) | Level 1 | $ | ( | $ | ( | $ | ( | $ | ( | |||||||||||||||||||
| 2028 senior notes | Long-Term Debt (1) | Level 1 | $ | ( | $ | ( | $ | ( | $ | ( | |||||||||||||||||||
| 2029 senior notes | Long-Term Debt (1) | Level 1 | $ | ( | $ | ( | $ | ( | $ | ( | |||||||||||||||||||
(1)Carrying values of long-term debt balances are before reductions for debt issuance costs and original issue discount of $24.5 million and $31.8 million as of December 31, 2023 and December 31, 2022, respectively.
The carrying value of cash and cash equivalents, accounts receivable, accounts payable, and accrued liabilities approximates fair value because of the short maturity of these instruments. There were no assets or liabilities measured at fair value on a non-recurring basis as of December 31, 2023 or December 31, 2022. The "Loss on impairment / retirement of fixed assets" within the consolidated statements of operations and comprehensive income (loss) included the write-off of the net book value of certain property and equipment based on Level 3 inputs.
54
ITEM 9. CHANGES IN AND DISAGREEMENTS WITH ACCOUNTANTS ON ACCOUNTING
AND FINANCIAL DISCLOSURE.
None.
ITEM 9A. CONTROLS AND PROCEDURES.
Disclosure Controls and Procedures
We maintain a system of controls and procedures designed to ensure that information required to be disclosed by us in our reports under the Securities Exchange Act of 1934, as amended, is recorded, processed, summarized and reported within the time periods specified by the Commission and that such information is accumulated and communicated to management, including the Chief Executive Officer and the Chief Financial Officer, as appropriate, to allow timely decisions regarding required disclosure. As of December 31, 2023, management, with the participation of our Chief Executive Officer and Chief Financial Officer, has evaluated the effectiveness of our disclosure controls and procedures. Based upon that evaluation, the Chief Executive Officer and Chief Financial Officer concluded that our disclosure controls and procedures were effective as of December 31, 2023.
Management's Report on Internal Control over Financial Reporting
Management is responsible for establishing and maintaining adequate internal control over financial reporting, as defined in Rules 13a-15(f) and 15d-15(f) under the Exchange Act. Our internal control over financial reporting is a process designed to provide reasonable assurance regarding the reliability of financial reporting and the preparation of financial statements for external purposes in accordance with generally accepted accounting principles. Management, with the participation of our Chief Executive Officer and Chief Financial Officer, assessed the effectiveness of our internal control over financial reporting as of December 31, 2023. In making this assessment, it used the criteria described in "Internal Control - Integrated Framework" (2013) issued by the Committee of Sponsoring Organizations (COSO) of the Treadway Commission. As a result of its assessment, management concluded that, as of December 31, 2023, our internal control over financial reporting was effective. Deloitte & Touche LLP, the independent registered public accounting firm that audited the financial statements included in this Form 10-K, has issued an attestation report on our internal control over financial reporting.
Changes in Internal Control over Financial Reporting
There were no changes in our internal control over financial reporting that occurred during the fourth quarter of 2023 that have materially affected, or are reasonably likely to materially affect, our internal control over financial reporting.
ITEM 9B. OTHER INFORMATION.
During the three months ended December 31, 2023, no director or officer adopted terminated
ITEM 9C. DISCLOSURE REGARDING FOREIGN JURISDICTIONS THAT PREVENT INSPECTIONS.
Not applicable.
55
PART III
ITEM 10. DIRECTORS, EXECUTIVE OFFICERS AND CORPORATE GOVERNANCE.
Cedar Fair Management, Inc., an Ohio corporation owned by an Ohio trust, is the General Partner of the Partnership and has full responsibility for the management of the Partnership; see Note 1.
A. Identification of Directors:
The information required by this item is incorporated by reference to the material in our definitive proxy statement pursuant to Regulation 14A or an amendment to this Form 10-K under cover of Form 10-K/A to be filed within 120 days of the end of the fiscal year ended December 31, 2023 under the captions "Board of Directors", "Board Committees", and, if required, "Delinquent Section 16(a) Reports".
B. Identification of Executive Officers:
Information regarding executive officers of the Partnership is included in this Annual Report on Form 10-K under the caption "Supplemental Item. Information about our Executive Officers" in Item 1 of Part I and is incorporated herein by reference.
C. Code of Ethics and Certifications:
In accordance with Section 406 of the Sarbanes-Oxley Act of 2002 and Item 406 of Regulation S-K, we have adopted a Code of Conduct and Ethics (the "Code"), which applies to all directors, officers and employees, including the Chief Executive Officer, Chief Financial Officer and Chief Accounting Officer. A copy of the Code is available free of charge on our Investor Relations website (www.ir.cedarfair.com).
We submitted an unqualified Section 303A.12(a) Chief Executive Officer certification to the New York Stock Exchange on June 20, 2023, stating that we were in compliance with the NYSE's Corporate Governance Listing Standards. The Chief Executive Officer and Chief Financial Officer certifications under Section 302 of the Sarbanes-Oxley Act are included as exhibits to this Form 10-K.
ITEM 11. EXECUTIVE COMPENSATION.
The information required by this item is incorporated by reference to the material in our definitive proxy statement pursuant to Regulation 14A or an amendment to this Form 10-K under cover of Form 10-K/A to be filed within 120 days of the end of the fiscal year ended December 31, 2023 under the captions "Executive Compensation", "Compensation Committee Interlocks and Insider Participation", and "People, Culture & Compensation Committee Report".
ITEM 12. SECURITY OWNERSHIP OF CERTAIN BENEFICIAL OWNERS AND MANAGEMENT AND RELATED UNITHOLDER MATTERS.
The information required by this item is incorporated by reference to the material in our definitive proxy statement pursuant to Regulation 14A or an amendment to this Form 10-K under cover of Form 10-K/A to be filed within 120 days of the end of the fiscal year ended December 31, 2023 under the caption "Security Ownership of Certain Beneficial Owners and Management".
EQUITY COMPENSATION PLAN INFORMATION
The following table sets forth information concerning units authorized or available for issuance under our equity compensation plan (see Note 8) as of December 31, 2023:
| Plan Category | Number of units to be issued upon exercise of outstanding options, warrants and rights (a) (1) | Weighted-average exercise price of outstanding options, warrants and rights (b) | Number of units remaining available for future issuance under equity compensation plans (excluding units reflected in column (a)) (c) | |||||||||||||||||
| Equity compensation plans approved by unitholders | 1,599,491 | — | 636,090 | |||||||||||||||||
| Equity compensation plans not approved by unitholders | — | — | — | |||||||||||||||||
| Total | 1,599,491 | — | 636,090 | |||||||||||||||||
(1)The units in column (a) include performance awards and deferred unit awards at the maximum number of units issuable.
56
ITEM 13. CERTAIN RELATIONSHIPS AND RELATED TRANSACTIONS, AND DIRECTOR INDEPENDENCE.
The information required by this item is incorporated by reference to the material in our definitive proxy statement pursuant to Regulation 14A or an amendment to this Form 10-K under cover of Form 10-K/A to be filed within 120 days of the end of the fiscal year ended December 31, 2023 under the captions "Certain Relationships and Related Transactions", "Board Independence", and "Board Committees".
ITEM 14. PRINCIPAL ACCOUNTANT FEES AND SERVICES.
The information required by this item is incorporated by reference to the material in our definitive proxy statement pursuant to Regulation 14A or an amendment to this Form 10-K under cover of Form 10-K/A to be filed within 120 days of the end of the fiscal year ended December 31, 2023 under the caption "Independent Registered Public Accounting Firm Services and Fees".
PART IV
ITEM 15. EXHIBITS AND FINANCIAL STATEMENT SCHEDULES.
A. 1. Financial Statements
The following consolidated financial statements of the Registrant, the notes thereto and the related Report of Independent Registered Public Accounting Firm are filed under Item 8 of this Report:
| Page | ||||||||
| (i) | Report of Independent Registered Public Accounting Firm | |||||||
| (ii) | Consolidated Balance Sheets - December 31, 2023 and 2022 | |||||||
| (iii) | Consolidated Statements of Operations and Comprehensive Income (Loss) - Years ended December 31, 2023, 2022, and 2021 | |||||||
| (iv) | Consolidated Statements of Cash Flows - Years ended December 31, 2023, 2022, and 2021 | |||||||
| (v) | Consolidated Statements of Partners' Deficit - Years ended December 31, 2023, 2022, and 2021 | |||||||
| (vi) | Notes to Consolidated Financial Statements - December 31, 2023, 2022, and 2021 | |||||||
A. 2. Financial Statement Schedules
All schedules are omitted as the information is not required or is otherwise furnished.
A. 3. Exhibits
The exhibits listed below are incorporated herein by reference to prior SEC filings by the Registrant or are included as exhibits in this Form 10-K.
| Exhibit Number | Description | ||||
57
| Exhibit Number | Description | ||||
58
| Exhibit Number | Description | ||||
59
| Exhibit Number | Description | ||||
| 101 | The following materials from the Partnership's Annual Report on Form 10-K for the year ended December 31, 2023 formatted in Inline XBRL: (i) the Consolidated Statements of Operations and Comprehensive Income (Loss), (ii) the Consolidated Balance Sheets, (iii) the Consolidated Statements of Cash Flows, (iv) the Consolidated Statements of Partners' Deficit, and (v) related notes, tagged as blocks of text and including detailed tags. | ||||
| 104 | The cover page from the Partnership's Annual Report on Form 10-K for the year ended December 31, 2023, formatted in Inline XBRL (included as Exhibit 101). | ||||
(+) Management contract or compensatory plan or arrangement.
ITEM 16. FORM 10-K SUMMARY.
None.
60
SIGNATURES
Pursuant to the requirements of Section 13 or 15(d) of the Securities Exchange Act of 1934, the registrant has duly caused this report to be signed on its behalf by the undersigned, thereunto duly authorized.
CEDAR FAIR, L.P.
(Registrant)
DATED: February 16, 2024
By: Cedar Fair Management, Inc.
General Partner
| /S/ Richard A. Zimmerman | ||
| Richard A. Zimmerman | ||
| President and Chief Executive Officer | ||
Pursuant to the requirements of the Securities Exchange Act of 1934, this report has been signed below by the following persons on behalf of the registrant and in the capacities and on the dates indicated.
| Signature | Title | Date | ||||||||||||
| /S/ | Richard A. Zimmerman | Director, President and Chief Executive Officer | February 16, 2024 | |||||||||||
| Richard A. Zimmerman | (Principal Executive Officer) | |||||||||||||
| /S/ | Brian C. Witherow | Executive Vice President and Chief Financial Officer | February 16, 2024 | |||||||||||
| Brian C. Witherow | (Principal Financial Officer) | |||||||||||||
| /S/ | David R. Hoffman | Senior Vice President and Chief Accounting Officer | February 16, 2024 | |||||||||||
| David R. Hoffman | (Principal Accounting Officer) | |||||||||||||
| /S/ | Daniel J. Hanrahan | Chairman of the Board of Directors | February 16, 2024 | |||||||||||
| Daniel J. Hanrahan | ||||||||||||||
| /S/ | Nina Barton | Director | February 16, 2024 | |||||||||||
| Nina Barton | ||||||||||||||
| /S/ | Louis Carr | Director | February 16, 2024 | |||||||||||
| Louis Carr | ||||||||||||||
| /S/ | Michelle M. Frymire | Director | February 16, 2024 | |||||||||||
| Michelle M. Frymire | ||||||||||||||
| /S/ | Jennifer Mason | Director | February 16, 2024 | |||||||||||
| Jennifer Mason | ||||||||||||||
| /S/ | D. Scott Olivet | Director | February 16, 2024 | |||||||||||
| D. Scott Olivet | ||||||||||||||
| /S/ | Carlos A. Ruisanchez | Director | February 16, 2024 | |||||||||||
| Carlos A. Ruisanchez | ||||||||||||||
61