gfi-20231231false2023FY000117272400011727242023-01-012023-12-310001172724dei:BusinessContactMember2023-01-012023-12-310001172724gfi:ADR1Member2023-01-012023-12-3100011727242023-12-31xbrli:shares0001172724gfi:YearOneMember2023-12-31iso4217:USDutr:oz0001172724gfi:YearOneMember2022-12-310001172724gfi:YearOneMember2021-12-310001172724gfi:YearTwoMember2023-12-310001172724gfi:YearTwoMember2022-12-310001172724gfi:YearTwoMember2021-12-310001172724gfi:YearThreeMember2023-12-310001172724gfi:YearThreeMember2022-12-310001172724gfi:YearThreeMember2021-12-310001172724gfi:YearFourMember2023-12-310001172724gfi:YearFourMember2022-12-310001172724gfi:YearFourMember2021-12-310001172724gfi:YearFiveOnwardsMember2023-12-310001172724gfi:YearFiveOnwardsMember2022-12-310001172724gfi:YearFiveOnwardsMember2021-12-31iso4217:ZARutr:kgiso4217:AUDutr:oziso4217:USDutr:t0001172724country:GH2023-12-310001172724country:GH2022-12-310001172724country:GH2021-12-310001172724country:PE2022-12-310001172724country:PE2021-12-310001172724country:CL2023-12-310001172724country:CL2022-12-310001172724country:CL2021-12-310001172724country:ZA2023-01-012023-12-31xbrli:pure0001172724country:ZA2022-01-012022-12-310001172724country:ZA2021-01-012021-12-310001172724country:GH2023-01-012023-12-310001172724country:GH2022-01-012022-12-310001172724country:GH2021-01-012021-12-310001172724country:PE2023-01-012023-12-310001172724country:PE2022-01-012022-12-310001172724country:PE2021-01-012021-12-310001172724country:AU2023-01-012023-12-310001172724country:AU2022-01-012022-12-310001172724country:AU2021-01-012021-12-310001172724country:CL2023-01-012023-12-310001172724country:CL2022-01-012022-12-310001172724country:CL2021-01-012021-12-310001172724gfi:SouthDeepMember2023-01-012023-12-310001172724gfi:SouthDeepMember2022-01-012022-12-310001172724gfi:SouthDeepMember2021-01-012021-12-310001172724gfi:TarkwaMember2023-01-012023-12-310001172724gfi:TarkwaMember2022-01-012022-12-310001172724gfi:TarkwaMember2021-01-012021-12-310001172724gfi:DamangMember2023-01-012023-12-310001172724gfi:DamangMember2022-01-012022-12-310001172724gfi:DamangMember2021-01-012021-12-310001172724gfi:CerroCeronaMember2023-01-012023-12-310001172724gfi:CerroCeronaMember2022-01-012022-12-310001172724gfi:CerroCeronaMember2021-01-012021-12-310001172724gfi:StivesMember2023-01-012023-12-310001172724gfi:StivesMember2022-01-012022-12-310001172724gfi:StivesMember2021-01-012021-12-310001172724gfi:AgnewMember2023-01-012023-12-310001172724gfi:AgnewMember2022-01-012022-12-310001172724gfi:AgnewMember2021-01-012021-12-310001172724gfi:GrannySmithMember2023-01-012023-12-310001172724gfi:GrannySmithMember2022-01-012022-12-310001172724gfi:GrannySmithMember2021-01-012021-12-310001172724gfi:GruyereMember2023-01-012023-12-310001172724gfi:GruyereMember2022-01-012022-12-310001172724gfi:GruyereMember2021-01-012021-12-310001172724gfi:SalaresNorteMember2023-01-012023-12-310001172724gfi:SalaresNorteMember2022-01-012022-12-310001172724gfi:SalaresNorteMember2021-01-012021-12-310001172724currency:ZARgfi:YearOneMember2023-01-012023-12-31gfi:ExchangeRates0001172724currency:ZARgfi:YearOneMember2022-01-012022-12-310001172724currency:ZARgfi:YearOneMember2021-01-012021-12-310001172724gfi:YearTwoMembercurrency:ZAR2023-01-012023-12-310001172724gfi:YearTwoMembercurrency:ZAR2022-01-012022-12-310001172724gfi:YearTwoMembercurrency:ZAR2021-01-012021-12-310001172724gfi:YearThreeMembercurrency:ZAR2023-01-012023-12-310001172724gfi:YearThreeMembercurrency:ZAR2022-01-012022-12-310001172724gfi:YearThreeMembercurrency:ZAR2021-01-012021-12-310001172724gfi:YearFourMembercurrency:ZAR2023-01-012023-12-310001172724gfi:YearFourMembercurrency:ZAR2022-01-012022-12-310001172724gfi:YearFourMembercurrency:ZAR2021-01-012021-12-310001172724gfi:YearFiveOnwardsMembercurrency:ZAR2023-01-012023-12-310001172724gfi:YearFiveOnwardsMembercurrency:ZAR2022-01-012022-12-310001172724gfi:YearFiveOnwardsMembercurrency:ZAR2021-01-012021-12-310001172724currency:AUDgfi:YearOneMember2023-01-012023-12-310001172724currency:AUDgfi:YearOneMember2022-01-012022-12-310001172724currency:AUDgfi:YearOneMember2021-01-012021-12-310001172724currency:AUDgfi:YearTwoMember2023-01-012023-12-310001172724currency:AUDgfi:YearTwoMember2022-01-012022-12-310001172724currency:AUDgfi:YearTwoMember2021-01-012021-12-310001172724currency:AUDgfi:YearThreeMember2023-01-012023-12-310001172724currency:AUDgfi:YearThreeMember2022-01-012022-12-310001172724currency:AUDgfi:YearThreeMember2021-01-012021-12-310001172724currency:AUDgfi:YearFourMember2023-01-012023-12-310001172724currency:AUDgfi:YearFourMember2022-01-012022-12-310001172724currency:AUDgfi:YearFourMember2021-01-012021-12-310001172724currency:AUDgfi:YearFiveOnwardsMember2023-01-012023-12-310001172724currency:AUDgfi:YearFiveOnwardsMember2022-01-012022-12-310001172724currency:AUDgfi:YearFiveOnwardsMember2021-01-012021-12-31iso4217:USD00011727242022-12-310001172724gfi:PeruCashGeneratingUnitMember2023-01-012023-12-310001172724gfi:PeruCashGeneratingUnitMember2022-01-012022-12-310001172724gfi:TarkwaCashGeneratingUnitMember2023-01-012023-12-310001172724gfi:TarkwaCashGeneratingUnitMember2022-01-012022-12-3100011727242022-01-012022-12-3100011727242021-01-012021-12-310001172724gfi:YearOneToThreeMemberifrs-full:BottomOfRangeMember2023-12-310001172724gfi:YearOneToThreeMemberifrs-full:TopOfRangeMember2023-12-310001172724gfi:YearOneToThreeMemberifrs-full:BottomOfRangeMember2022-12-310001172724gfi:YearOneToThreeMemberifrs-full:TopOfRangeMember2022-12-310001172724gfi:YearFourOnwardsMember2023-12-310001172724gfi:YearFourOnwardsMember2022-12-310001172724gfi:AsankoGoldMember2023-12-212023-12-210001172724gfi:AsankoGoldMembergfi:ImpairmentExpenseMemberifrs-full:DiscontinuedOperationsMember2023-01-012023-12-310001172724gfi:AsankoGoldMembergfi:ImpairmentExpenseMemberifrs-full:DiscontinuedOperationsMember2022-01-012022-12-310001172724gfi:CanadianSubsidiaryMember2023-05-022023-05-020001172724gfi:WindfallProjectMember2023-05-022023-05-020001172724currency:ZAR2023-12-310001172724currency:USD2023-12-310001172724currency:CAD2023-12-310001172724currency:ZAR2022-12-310001172724currency:USD2022-12-310001172724currency:ZAR2021-12-310001172724currency:USD2021-12-310001172724currency:ZAR2023-01-012023-12-310001172724currency:USD2023-01-012023-12-310001172724currency:CAD2023-01-012023-12-310001172724currency:ZAR2022-01-012022-12-310001172724currency:USD2022-01-012022-12-310001172724currency:ZAR2021-01-012021-12-310001172724currency:USD2021-01-012021-12-31iso4217:USDxbrli:shares0001172724ifrs-full:DiscontinuedOperationsMember2023-01-012023-12-310001172724ifrs-full:DiscontinuedOperationsMember2022-01-012022-12-310001172724ifrs-full:DiscontinuedOperationsMember2021-01-012021-12-310001172724gfi:ShareCapitalMember2020-12-310001172724ifrs-full:AccumulatedOtherComprehensiveIncomeMember2020-12-310001172724ifrs-full:MiscellaneousOtherReservesMember2020-12-310001172724ifrs-full:RetainedEarningsMember2020-12-310001172724ifrs-full:EquityAttributableToOwnersOfParentMember2020-12-310001172724ifrs-full:NoncontrollingInterestsMember2020-12-3100011727242020-12-310001172724ifrs-full:AccumulatedOtherComprehensiveIncomeMember2021-01-012021-12-310001172724ifrs-full:RetainedEarningsMember2021-01-012021-12-310001172724ifrs-full:EquityAttributableToOwnersOfParentMember2021-01-012021-12-310001172724ifrs-full:NoncontrollingInterestsMember2021-01-012021-12-310001172724ifrs-full:MiscellaneousOtherReservesMember2021-01-012021-12-310001172724gfi:ShareCapitalMember2021-12-310001172724ifrs-full:AccumulatedOtherComprehensiveIncomeMember2021-12-310001172724ifrs-full:MiscellaneousOtherReservesMember2021-12-310001172724ifrs-full:RetainedEarningsMember2021-12-310001172724ifrs-full:EquityAttributableToOwnersOfParentMember2021-12-310001172724ifrs-full:NoncontrollingInterestsMember2021-12-3100011727242021-12-310001172724ifrs-full:AccumulatedOtherComprehensiveIncomeMember2022-01-012022-12-310001172724ifrs-full:RetainedEarningsMember2022-01-012022-12-310001172724ifrs-full:EquityAttributableToOwnersOfParentMember2022-01-012022-12-310001172724ifrs-full:NoncontrollingInterestsMember2022-01-012022-12-310001172724ifrs-full:MiscellaneousOtherReservesMember2022-01-012022-12-310001172724gfi:ShareCapitalMember2022-12-310001172724ifrs-full:AccumulatedOtherComprehensiveIncomeMember2022-12-310001172724ifrs-full:MiscellaneousOtherReservesMember2022-12-310001172724ifrs-full:RetainedEarningsMember2022-12-310001172724ifrs-full:EquityAttributableToOwnersOfParentMember2022-12-310001172724ifrs-full:NoncontrollingInterestsMember2022-12-310001172724ifrs-full:AccumulatedOtherComprehensiveIncomeMember2023-01-012023-12-310001172724ifrs-full:RetainedEarningsMember2023-01-012023-12-310001172724ifrs-full:EquityAttributableToOwnersOfParentMember2023-01-012023-12-310001172724ifrs-full:NoncontrollingInterestsMember2023-01-012023-12-310001172724ifrs-full:MiscellaneousOtherReservesMember2023-01-012023-12-310001172724gfi:ShareCapitalMember2023-12-310001172724ifrs-full:AccumulatedOtherComprehensiveIncomeMember2023-12-310001172724ifrs-full:MiscellaneousOtherReservesMember2023-12-310001172724ifrs-full:RetainedEarningsMember2023-12-310001172724ifrs-full:EquityAttributableToOwnersOfParentMember2023-12-310001172724ifrs-full:NoncontrollingInterestsMember2023-12-310001172724gfi:GoldProductsMember2023-01-012023-12-310001172724gfi:GoldProductsMember2022-01-012022-12-310001172724gfi:GoldProductsMember2021-01-012021-12-310001172724gfi:CopperMember2023-01-012023-12-310001172724gfi:CopperMember2022-01-012022-12-310001172724gfi:CopperMember2021-01-012021-12-310001172724gfi:GoldFieldsLimitedTwoThousandTwelveSharePlanMembergfi:PerformanceShares1Member2022-12-310001172724gfi:GoldFieldsLimitedTwoThousandTwelveSharePlanMembergfi:PerformanceShares1Member2021-12-310001172724gfi:GoldFieldsLimitedTwoThousandTwelveSharePlanMembergfi:PerformanceShares1Member2020-12-310001172724gfi:GoldFieldsLimitedTwoThousandTwelveSharePlanMembergfi:PerformanceShares1Member2023-01-012023-12-310001172724gfi:GoldFieldsLimitedTwoThousandTwelveSharePlanMembergfi:PerformanceShares1Member2022-01-012022-12-310001172724gfi:GoldFieldsLimitedTwoThousandTwelveSharePlanMembergfi:PerformanceShares1Member2021-01-012021-12-310001172724gfi:GoldFieldsLimitedTwoThousandTwelveSharePlanMembergfi:PerformanceShares1Member2023-12-310001172724gfi:PerformanceShares1Membergfi:GoldFieldsLimited2012SharePlanAmendedMember2023-01-012023-12-310001172724gfi:PerformanceShares1Membergfi:GoldFieldsLimited2012SharePlanAmendedMember2022-01-012022-12-310001172724gfi:PerformanceShares1Membergfi:GoldFieldsLimited2012SharePlanAmendedMember2021-01-012021-12-31iso4217:ZARxbrli:shares0001172724ifrs-full:TopOfRangeMemberifrs-full:OrdinarySharesMember2023-12-310001172724ifrs-full:OrdinarySharesMember2023-12-310001172724country:AU2023-01-012023-12-310001172724country:AU2022-01-012022-12-310001172724country:AU2021-01-012021-12-310001172724country:GH2023-01-012023-12-310001172724country:GH2022-01-012022-12-310001172724country:GH2021-01-012021-12-310001172724country:PE2023-01-012023-12-310001172724country:PE2022-01-012022-12-310001172724country:PE2021-01-012021-12-310001172724country:CL2023-01-012023-12-310001172724country:CL2022-01-012022-12-310001172724country:CL2021-01-012021-12-310001172724gfi:OtherMember2023-01-012023-12-310001172724gfi:OtherMember2022-01-012022-12-310001172724gfi:OtherMember2021-01-012021-12-310001172724gfi:FarSoutheastGoldResourcesIncorporatedMember2023-01-012023-12-310001172724gfi:FarSoutheastGoldResourcesIncorporatedMember2022-01-012022-12-310001172724gfi:FarSoutheastGoldResourcesIncorporatedMember2021-01-012021-12-310001172724gfi:PeruCashGeneratingUnitMember2021-01-012021-12-310001172724gfi:TarkwaCashGeneratingUnitMember2021-01-012021-12-310001172724ifrs-full:OtherPropertyPlantAndEquipmentMember2023-01-012023-12-310001172724ifrs-full:OtherPropertyPlantAndEquipmentMember2022-01-012022-12-310001172724ifrs-full:OtherPropertyPlantAndEquipmentMember2021-01-012021-12-310001172724gfi:LepantoConsolidatedMiningCompanyMembergfi:FarSoutheastGoldResourcesIncorporatedMember2021-01-012021-12-310001172724gfi:FarSoutheastGoldResourcesIncorporatedFSEMember2022-12-310001172724gfi:PeruCashGeneratingUnitMember2021-12-310001172724gfi:PeruCashGeneratingUnitMember2022-12-310001172724gfi:PeruCashGeneratingUnitMember2023-12-310001172724gfi:TarkwaCashGeneratingUnitMember2021-12-310001172724gfi:TarkwaCashGeneratingUnitMember2022-12-310001172724ifrs-full:ExplorationAndEvaluationAssetsMember2023-01-012023-12-310001172724ifrs-full:ExplorationAndEvaluationAssetsMember2022-01-012022-12-310001172724ifrs-full:ExplorationAndEvaluationAssetsMember2021-01-012021-12-310001172724gfi:RedundantAssetsInPeruMember2023-01-012023-12-310001172724gfi:RedundantAssetsInPeruMember2022-01-012022-12-310001172724gfi:RedundantAssetsInPeruMember2021-01-012021-12-310001172724gfi:RedundantAssetsInChileMember2023-01-012023-12-310001172724gfi:RedundantAssetsInChileMember2022-01-012022-12-310001172724gfi:RedundantAssetsInChileMember2021-01-012021-12-310001172724gfi:PeruCashGeneratingUnitMember2023-01-012023-12-310001172724gfi:TarkwaMember2022-01-012022-12-310001172724gfi:PeruCashGeneratingUnitMember2022-01-012022-12-310001172724gfi:YamanaMember2022-01-012022-12-310001172724country:ZA2023-01-012023-12-310001172724country:ZA2022-01-012022-12-310001172724country:ZA2021-01-012021-12-31gfi:Times0001172724ifrs-full:TopOfRangeMembercountry:ZA2023-01-012023-12-310001172724ifrs-full:BottomOfRangeMembergfi:RangeOneMember2023-01-012023-12-310001172724ifrs-full:TopOfRangeMembergfi:RangeOneMember2023-01-012023-12-310001172724gfi:GoldRoyaltyMembergfi:RangeOneMember2023-01-012023-12-310001172724ifrs-full:BottomOfRangeMembergfi:RangeTwoMember2023-01-012023-12-310001172724ifrs-full:TopOfRangeMembergfi:RangeTwoMember2023-01-012023-12-310001172724gfi:RangeTwoMembergfi:GoldRoyaltyMember2023-01-012023-12-310001172724gfi:RangeThreeMemberifrs-full:BottomOfRangeMember2023-01-012023-12-310001172724gfi:RangeThreeMemberifrs-full:TopOfRangeMember2023-01-012023-12-310001172724gfi:RangeThreeMembergfi:GoldRoyaltyMember2023-01-012023-12-310001172724gfi:RangeFourMemberifrs-full:BottomOfRangeMember2023-01-012023-12-310001172724gfi:RangeFourMembergfi:GoldRoyaltyMember2023-01-012023-12-310001172724country:PEifrs-full:BottomOfRangeMember2023-01-012023-12-310001172724country:PEifrs-full:TopOfRangeMember2023-01-012023-12-310001172724gfi:SouthAfricanTaxationMember2023-01-012023-12-310001172724gfi:SouthAfricanTaxationMember2022-01-012022-12-310001172724gfi:SouthAfricanTaxationMember2021-01-012021-12-310001172724gfi:ForeignTaxationMember2023-01-012023-12-310001172724gfi:ForeignTaxationMember2022-01-012022-12-310001172724gfi:ForeignTaxationMember2021-01-012021-12-310001172724gfi:CerroCeronaMember2023-01-012023-12-310001172724gfi:CerroCeronaMember2022-01-012022-12-310001172724gfi:CerroCeronaMember2021-01-012021-12-310001172724gfi:DamangAndTarkwaMember2023-01-012023-12-310001172724gfi:DamangAndTarkwaMember2022-01-012022-12-310001172724gfi:DamangAndTarkwaMember2021-01-012021-12-310001172724gfi:YamanaMember2022-01-012022-12-310001172724gfi:ForeignTaxationMembergfi:DamangAndTarkwaMember2022-01-012022-12-310001172724gfi:CerroCeronaMember2023-12-310001172724gfi:CerroCeronaMember2022-12-310001172724gfi:DeferredTaxAssetsNotRecognizedMember2021-12-310001172724gfi:DeferredTaxAssetsNotRecognizedMembergfi:CerroCeronaAndDamangMember2021-12-310001172724gfi:CerroCeronaAndDamangMember2021-01-012021-12-310001172724gfi:DeferredTaxAssetsNotRecognizedMembergfi:GhanaianOperationsMember2023-12-310001172724gfi:DeferredTaxAssetsNotRecognizedMembergfi:GhanaianOperationsMember2022-12-310001172724gfi:DeferredTaxAssetsNotRecognizedMembergfi:GhanaianOperationsMember2021-12-310001172724gfi:DeferredTaxAssetsRecognizedMembergfi:GhanaianOperationsMember2023-12-310001172724gfi:DeferredTaxAssetsRecognizedMembergfi:GhanaianOperationsMember2022-12-310001172724gfi:DeferredTaxAssetsRecognizedMembergfi:GhanaianOperationsMember2021-12-310001172724gfi:DeferredTaxAssetsRecognizedMembergfi:DamangMember2023-12-310001172724gfi:DeferredTaxAssetsRecognizedMembergfi:DamangMember2022-12-310001172724gfi:DeferredTaxAssetsRecognizedMembergfi:DamangMember2021-12-310001172724gfi:DamangMembergfi:DeferredTaxAssetsNotRecognizedMember2023-12-310001172724gfi:DamangMembergfi:DeferredTaxAssetsNotRecognizedMember2022-12-310001172724gfi:DamangMembergfi:DeferredTaxAssetsNotRecognizedMember2021-12-310001172724gfi:SalariesNorteMember2021-01-012021-12-310001172724gfi:SouthAfricanTaxationMembergfi:NonMiningTaxMember2023-01-012023-12-310001172724gfi:SouthAfricanTaxationMembergfi:NonMiningTaxMember2022-01-012022-12-310001172724gfi:SouthAfricanTaxationMembergfi:NonMiningTaxMember2021-01-012021-12-310001172724gfi:CompanyTaxRateMembergfi:SouthAfricanTaxationMember2023-01-012023-12-310001172724gfi:CompanyTaxRateMembergfi:SouthAfricanTaxationMember2022-01-012022-12-310001172724gfi:CompanyTaxRateMembergfi:SouthAfricanTaxationMember2021-01-012021-12-310001172724gfi:AustraliaTaxMembergfi:NonMiningTaxMember2023-01-012023-12-310001172724gfi:AustraliaTaxMembergfi:NonMiningTaxMember2022-01-012022-12-310001172724gfi:AustraliaTaxMembergfi:NonMiningTaxMember2021-01-012021-12-310001172724gfi:GhanaTaxMembergfi:NonMiningTaxMember2023-01-012023-12-310001172724gfi:GhanaTaxMembergfi:NonMiningTaxMember2022-01-012022-12-310001172724gfi:GhanaTaxMembergfi:NonMiningTaxMember2021-01-012021-12-310001172724gfi:PeruTaxMembergfi:NonMiningTaxMember2023-01-012023-12-310001172724gfi:PeruTaxMembergfi:NonMiningTaxMember2022-01-012022-12-310001172724gfi:PeruTaxMembergfi:NonMiningTaxMember2021-01-012021-12-310001172724gfi:MiningTaxMember2021-12-312021-12-310001172724gfi:MiningTaxMember2022-12-312022-12-31iso4217:ZAR0001172724gfi:MiningTaxMember2023-01-012023-12-310001172724gfi:MiningTaxMember2022-01-012022-12-310001172724gfi:MiningTaxMember2021-01-012021-12-310001172724srt:ScenarioForecastMembergfi:SouthAfricanTaxationMembergfi:NonMiningTaxMember2024-01-012024-12-310001172724gfi:SouthAfricanTaxationMembergfi:GoldFieldsOperationsLimitedMember2023-12-310001172724gfi:SouthAfricanTaxationMembergfi:GoldFieldsOperationsLimitedMember2022-12-310001172724gfi:SouthAfricanTaxationMembergfi:GFIJointVentureHoldingsProprietaryLimitedMember2023-12-310001172724gfi:SouthAfricanTaxationMembergfi:GFIJointVentureHoldingsProprietaryLimitedMember2022-12-310001172724gfi:GoldFieldsHoldingsCompanyLimitedMembergfi:SouthAfricanTaxationMember2023-12-310001172724gfi:GoldFieldsHoldingsCompanyLimitedMembergfi:SouthAfricanTaxationMember2022-12-310001172724gfi:SouthAfricanTaxationMember2023-12-310001172724gfi:SouthAfricanTaxationMember2022-12-310001172724gfi:ExplorationEntitiesMembergfi:InternationalOperationsMember2023-12-310001172724gfi:ExplorationEntitiesMembergfi:InternationalOperationsMember2022-12-310001172724gfi:MineraGoldFieldsSalaresNorteMembergfi:InternationalOperationsMember2023-12-310001172724gfi:MineraGoldFieldsSalaresNorteMembergfi:InternationalOperationsMember2022-12-310001172724gfi:AbossoGoldfieldsLimitedMembergfi:InternationalOperationsMember2023-12-310001172724gfi:AbossoGoldfieldsLimitedMembergfi:InternationalOperationsMember2022-12-310001172724gfi:GoldFieldsGhanaLimitedMembergfi:InternationalOperationsMember2023-12-310001172724gfi:GoldFieldsGhanaLimitedMembergfi:InternationalOperationsMember2022-12-310001172724gfi:InternationalOperationsMember2023-12-310001172724gfi:InternationalOperationsMember2022-12-310001172724gfi:ExplorationEntitiesMember2023-01-012023-12-310001172724gfi:ExplorationEntitiesMember2022-01-012022-12-310001172724gfi:ExplorationEntitiesMembergfi:TaxLossesExpiringBetweenOneAndTwoYearsMember2023-01-012023-12-310001172724gfi:ExplorationEntitiesMembergfi:TaxLossesExpiringBetweenOneAndTwoYearsMember2022-01-012022-12-310001172724gfi:ExplorationEntitiesMembergfi:TaxLossesExpiringBetweenTwoAndFiveYearsMember2023-01-012023-12-310001172724gfi:ExplorationEntitiesMembergfi:TaxLossesExpiringBetweenTwoAndFiveYearsMember2022-01-012022-12-310001172724gfi:TaxLossesExpiringBetweenFiveAndTenYearsMembergfi:ExplorationEntitiesMember2023-01-012023-12-310001172724gfi:TaxLossesExpiringBetweenFiveAndTenYearsMembergfi:ExplorationEntitiesMember2022-01-012022-12-310001172724gfi:ExplorationEntitiesMembergfi:TaxLossesExpiringAfterTenYearsMember2023-01-012023-12-310001172724gfi:ExplorationEntitiesMembergfi:TaxLossesExpiringAfterTenYearsMember2022-01-012022-12-310001172724gfi:NoExpiryDateMembergfi:ExplorationEntitiesMember2023-01-012023-12-310001172724gfi:NoExpiryDateMembergfi:ExplorationEntitiesMember2022-01-012022-12-310001172724gfi:TaxLossesExpireInThreeYearsMembergfi:AbossoGoldfieldsLimitedMember2023-01-012023-12-310001172724gfi:TaxLossesExpireInThreeYearsMembergfi:AbossoGoldfieldsLimitedMember2022-01-012022-12-310001172724gfi:TaxLossesExpireInFourYearsMembergfi:AbossoGoldfieldsLimitedMember2023-01-012023-12-310001172724gfi:TaxLossesExpireInFourYearsMembergfi:AbossoGoldfieldsLimitedMember2022-01-012022-12-310001172724gfi:DeferredTaxAssetsRecognizedMembergfi:DamangMember2023-01-012023-12-310001172724gfi:DeferredTaxAssetsRecognizedMembergfi:DamangMember2022-01-012022-12-310001172724srt:MinimumMember2023-12-310001172724gfi:FinalDividendsMember2022-01-012022-12-310001172724gfi:FinalDividendsMember2021-01-012021-12-310001172724gfi:FinalDividendsMember2020-01-012020-12-310001172724gfi:FinalDividendsMember2023-01-012023-12-310001172724gfi:InterimDividendsMember2023-01-012023-12-310001172724gfi:InterimDividendsMember2022-01-012022-12-310001172724gfi:InterimDividendsMember2021-01-012021-12-310001172724gfi:ApprovedDividendMember2023-01-012023-12-310001172724gfi:LoansToContractorsMember2023-01-012023-12-310001172724gfi:LoansToContractorsMember2022-01-012022-12-310001172724gfi:LoansToContractorsMember2021-01-012021-12-310001172724gfi:DamangMemberifrs-full:TradeReceivablesMember2023-01-012023-12-310001172724gfi:DamangMemberifrs-full:TradeReceivablesMember2022-01-012022-12-310001172724gfi:DamangMemberifrs-full:TradeReceivablesMember2021-01-012021-12-310001172724gfi:TarkwaMemberifrs-full:TradeReceivablesMember2023-01-012023-12-310001172724gfi:TarkwaMemberifrs-full:TradeReceivablesMember2022-01-012022-12-310001172724gfi:TarkwaMemberifrs-full:TradeReceivablesMember2021-01-012021-12-310001172724gfi:TradeAndOtherPayables12023-01-012023-12-310001172724gfi:LoansToContractorsExcl.InterestMember2023-01-012023-12-310001172724gfi:DamangMemberifrs-full:TradeReceivablesMember2023-12-310001172724gfi:TarkwaMemberifrs-full:TradeReceivablesMember2022-12-310001172724gfi:LoansToContractorsExcl.InterestMember2022-12-310001172724gfi:LoansToContractorsExcl.InterestMember2021-12-310001172724gfi:LoansToContractorsExcl.InterestMember2022-01-012022-12-310001172724gfi:LoansToContractorsExcl.InterestMember2023-12-310001172724gfi:GoldFieldsAndEngineersAndPlannersMembergfi:TwarkaAndDamangMembergfi:LoansToContractorsMember2020-12-310001172724gfi:GoldFieldsAndEngineersAndPlannersMembergfi:TwarkaAndDamangMembergfi:LoansToContractorsMember2023-12-310001172724gfi:LoanAdvancedContractorMemberifrs-full:LifetimeExpectedCreditLossesMember2022-12-310001172724gfi:GoldFieldsAndEngineersAndPlannersMembergfi:TwarkaAndDamangMembergfi:LoansToContractorsMember2022-12-310001172724gfi:EarningsMembergfi:AsankoGoldMemberifrs-full:DiscontinuedOperationsMember2023-01-012023-12-310001172724gfi:EarningsMembergfi:AsankoGoldMemberifrs-full:DiscontinuedOperationsMember2022-01-012022-12-310001172724gfi:EarningsMembergfi:AsankoGoldMemberifrs-full:DiscontinuedOperationsMember2021-01-012021-12-310001172724gfi:AsankoGoldMembergfi:ImpairmentExpenseMemberifrs-full:DiscontinuedOperationsMember2021-01-012021-12-310001172724gfi:GalianoGoldIncformerlyAsankoGoldIncMembergfi:AsankoGoldMember2023-12-310001172724srt:ScenarioForecastMembergfi:AsankoGoldMember2025-12-312025-12-310001172724srt:ScenarioForecastMembergfi:AsankoGoldMember2026-12-312026-12-310001172724gfi:AsankoGoldMembergfi:DeferredConsiderationMember2023-12-310001172724srt:ScenarioForecastMembergfi:AsankoGoldMember2023-12-212023-12-210001172724ifrs-full:ContingentConsiderationMembergfi:AsankoGoldMember2023-12-310001172724srt:ScenarioForecastMembergfi:AsankoGoldMember2024-01-012026-12-310001172724gfi:AsankoGoldMember2023-01-012023-12-310001172724gfi:GalianoGoldIncformerlyAsankoGoldIncMembergfi:AsankoGoldMember2023-01-012023-12-310001172724gfi:GhanaGovernmentMembergfi:AsankoGoldMember2023-01-012023-12-310001172724srt:ScenarioForecastMembergfi:AsankoGoldMember2024-01-012024-03-31utr:oz0001172724gfi:GalianoGoldIncformerlyAsankoGoldIncMember2023-01-012023-12-310001172724gfi:GalianoGoldIncformerlyAsankoGoldIncMembersrt:MaximumMember2023-12-310001172724ifrs-full:OtherDisposalsOfAssetsMembergfi:AsankoGoldMember2024-03-042024-03-040001172724gfi:GalianoGoldIncformerlyAsankoGoldIncMemberifrs-full:OtherDisposalsOfAssetsMember2024-03-040001172724gfi:AsankoGoldInvestmentMember2023-12-310001172724gfi:AsankoGoldInvestmentMember2022-12-310001172724gfi:AsankoGoldJointVentureMember2023-12-310001172724gfi:AsankoGoldJointVentureMember2022-12-310001172724gfi:AsankoRedeemablePreferenceSharesMember2023-12-310001172724gfi:AsankoRedeemablePreferenceSharesMember2022-12-310001172724gfi:RusoroMiningLimitedMember2023-12-310001172724gfi:RusoroMiningLimitedMember2022-12-310001172724srt:ScenarioForecastMembergfi:AsankoGoldMember2024-01-012026-12-310001172724gfi:RusoroMiningLimitedMemberifrs-full:OtherDisposalsOfAssetsMember2024-01-090001172724gfi:RusoroMiningLimitedMemberifrs-full:OtherDisposalsOfAssetsMember2024-01-092024-01-09utr:D0001172724gfi:RusoroMiningLimitedMember2023-12-310001172724gfi:LandMineralRightsAndRehabilitationAssetsMemberifrs-full:GrossCarryingAmountMember2021-12-310001172724gfi:MineDevelopmentInfrastructureAndOtherAssetsMemberifrs-full:GrossCarryingAmountMember2021-12-310001172724gfi:RightOfUseAssetsRelatingToMineDevelopmentInfrastructureAndOtherAssetsMemberifrs-full:GrossCarryingAmountMember2021-12-310001172724ifrs-full:GrossCarryingAmountMember2021-12-310001172724ifrs-full:GrossCarryingAmountMember2022-12-310001172724gfi:RightOfUseAssetsRelatingToMineDevelopmentInfrastructureAndOtherAssetsMemberifrs-full:GrossCarryingAmountMember2022-12-310001172724gfi:MineDevelopmentInfrastructureAndOtherAssetsMemberifrs-full:GrossCarryingAmountMember2022-12-310001172724gfi:LandMineralRightsAndRehabilitationAssetsMemberifrs-full:GrossCarryingAmountMember2022-12-310001172724gfi:LandMineralRightsAndRehabilitationAssetsMemberifrs-full:GrossCarryingAmountMember2022-01-012022-12-310001172724gfi:MineDevelopmentInfrastructureAndOtherAssetsMemberifrs-full:GrossCarryingAmountMember2022-01-012022-12-310001172724gfi:RightOfUseAssetsRelatingToMineDevelopmentInfrastructureAndOtherAssetsMemberifrs-full:GrossCarryingAmountMember2022-01-012022-12-310001172724ifrs-full:GrossCarryingAmountMember2022-01-012022-12-310001172724ifrs-full:GrossCarryingAmountMember2023-01-012023-12-310001172724gfi:RightOfUseAssetsRelatingToMineDevelopmentInfrastructureAndOtherAssetsMemberifrs-full:GrossCarryingAmountMember2023-01-012023-12-310001172724gfi:MineDevelopmentInfrastructureAndOtherAssetsMemberifrs-full:GrossCarryingAmountMember2023-01-012023-12-310001172724gfi:LandMineralRightsAndRehabilitationAssetsMemberifrs-full:GrossCarryingAmountMember2023-01-012023-12-310001172724ifrs-full:GrossCarryingAmountMember2023-12-310001172724gfi:RightOfUseAssetsRelatingToMineDevelopmentInfrastructureAndOtherAssetsMemberifrs-full:GrossCarryingAmountMember2023-12-310001172724gfi:MineDevelopmentInfrastructureAndOtherAssetsMemberifrs-full:GrossCarryingAmountMember2023-12-310001172724gfi:LandMineralRightsAndRehabilitationAssetsMemberifrs-full:GrossCarryingAmountMember2023-12-310001172724gfi:LandMineralRightsAndRehabilitationAssetsMemberifrs-full:AccumulatedDepreciationAmortisationAndImpairmentMember2021-12-310001172724gfi:MineDevelopmentInfrastructureAndOtherAssetsMemberifrs-full:AccumulatedDepreciationAmortisationAndImpairmentMember2021-12-310001172724gfi:RightOfUseAssetsRelatingToMineDevelopmentInfrastructureAndOtherAssetsMemberifrs-full:AccumulatedDepreciationAmortisationAndImpairmentMember2021-12-310001172724ifrs-full:AccumulatedDepreciationAmortisationAndImpairmentMember2021-12-310001172724ifrs-full:AccumulatedDepreciationAmortisationAndImpairmentMember2022-12-310001172724gfi:RightOfUseAssetsRelatingToMineDevelopmentInfrastructureAndOtherAssetsMemberifrs-full:AccumulatedDepreciationAmortisationAndImpairmentMember2022-12-310001172724gfi:MineDevelopmentInfrastructureAndOtherAssetsMemberifrs-full:AccumulatedDepreciationAmortisationAndImpairmentMember2022-12-310001172724gfi:LandMineralRightsAndRehabilitationAssetsMemberifrs-full:AccumulatedDepreciationAmortisationAndImpairmentMember2022-12-310001172724gfi:LandMineralRightsAndRehabilitationAssetsMemberifrs-full:AccumulatedDepreciationAmortisationAndImpairmentMember2022-01-012022-12-310001172724gfi:MineDevelopmentInfrastructureAndOtherAssetsMemberifrs-full:AccumulatedDepreciationAmortisationAndImpairmentMember2022-01-012022-12-310001172724gfi:RightOfUseAssetsRelatingToMineDevelopmentInfrastructureAndOtherAssetsMemberifrs-full:AccumulatedDepreciationAmortisationAndImpairmentMember2022-01-012022-12-310001172724ifrs-full:AccumulatedDepreciationAmortisationAndImpairmentMember2022-01-012022-12-310001172724ifrs-full:AccumulatedDepreciationAmortisationAndImpairmentMember2023-01-012023-12-310001172724gfi:RightOfUseAssetsRelatingToMineDevelopmentInfrastructureAndOtherAssetsMemberifrs-full:AccumulatedDepreciationAmortisationAndImpairmentMember2023-01-012023-12-310001172724gfi:MineDevelopmentInfrastructureAndOtherAssetsMemberifrs-full:AccumulatedDepreciationAmortisationAndImpairmentMember2023-01-012023-12-310001172724gfi:LandMineralRightsAndRehabilitationAssetsMemberifrs-full:AccumulatedDepreciationAmortisationAndImpairmentMember2023-01-012023-12-310001172724ifrs-full:AccumulatedDepreciationAmortisationAndImpairmentMember2023-12-310001172724gfi:RightOfUseAssetsRelatingToMineDevelopmentInfrastructureAndOtherAssetsMemberifrs-full:AccumulatedDepreciationAmortisationAndImpairmentMember2023-12-310001172724gfi:MineDevelopmentInfrastructureAndOtherAssetsMemberifrs-full:AccumulatedDepreciationAmortisationAndImpairmentMember2023-12-310001172724gfi:LandMineralRightsAndRehabilitationAssetsMemberifrs-full:AccumulatedDepreciationAmortisationAndImpairmentMember2023-12-310001172724gfi:LandMineralRightsAndRehabilitationAssetsMember2022-12-310001172724gfi:MineDevelopmentInfrastructureAndOtherAssetsMember2022-12-310001172724gfi:RightOfUseAssetsRelatingToMineDevelopmentInfrastructureAndOtherAssetsMember2022-12-310001172724gfi:RightOfUseAssetsRelatingToMineDevelopmentInfrastructureAndOtherAssetsMember2023-12-310001172724gfi:MineDevelopmentInfrastructureAndOtherAssetsMember2023-12-310001172724gfi:LandMineralRightsAndRehabilitationAssetsMember2023-12-310001172724gfi:SalaresNorteProjectMember2023-01-012023-12-310001172724gfi:SalaresNorteProjectMember2022-01-012022-12-310001172724gfi:OsiskoMiningIncorporatedMembergfi:WindfallProjectMember2023-05-022023-05-0200011727242023-05-02gfi:director0001172724gfi:WindfallProjectMember2023-05-022023-12-31iso4217:CAD0001172724gfi:WindfallProjectMember2023-07-312023-07-310001172724gfi:WindfallProjectMember2023-12-312023-12-310001172724gfi:A300mEnvironmentalImpactAssessmentEIAPermitMembergfi:WindfallProjectMember2023-12-310001172724gfi:A300mEnvironmentalImpactAssessmentEIAPermitMembergfi:WindfallProjectMember2023-05-020001172724gfi:A75mDevelopmentalExplorationProjectsAndTargetsMembergfi:WindfallProjectMember2023-12-310001172724gfi:A75mDevelopmentalExplorationProjectsAndTargetsMembergfi:WindfallProjectMember2023-05-020001172724gfi:WindfallProjectMember2023-05-032023-12-310001172724gfi:A300mEnvironmentalImpactAssessmentEIAPermitMembergfi:WindfallProjectMember2023-05-032023-12-310001172724gfi:A75mDevelopmentalExplorationProjectsAndTargetsMembergfi:WindfallProjectMember2023-05-032023-12-310001172724gfi:WindfallProjectMember2023-12-310001172724gfi:FarSoutheastGoldResourcesIncorporatedMember2023-12-310001172724gfi:FarSoutheastGoldResourcesIncorporatedMember2022-12-310001172724gfi:AsankoGoldMemberifrs-full:NoncurrentAssetsHeldForSaleMember2023-12-310001172724gfi:AsankoGoldMember2022-12-310001172724gfi:WindfallProjectMember2023-12-310001172724gfi:WindfallProjectMember2022-12-310001172724gfi:OtherAssociatesMember2023-12-310001172724gfi:OtherAssociatesMember2022-12-310001172724gfi:FarSoutheastGoldResourcesIncorporatedMember2023-01-012023-12-310001172724gfi:FarSoutheastGoldResourcesIncorporatedMember2022-01-012022-12-310001172724gfi:FarSoutheastGoldResourcesIncorporatedMember2021-01-012021-12-310001172724gfi:EarningsMembergfi:AsankoGoldMember2023-01-012023-12-310001172724gfi:EarningsMembergfi:AsankoGoldMember2022-01-012022-12-310001172724gfi:EarningsMembergfi:AsankoGoldMember2021-01-012021-12-310001172724gfi:AsankoGoldMembergfi:ImpairmentExpenseMember2023-01-012023-12-310001172724gfi:AsankoGoldMembergfi:ImpairmentExpenseMember2022-01-012022-12-310001172724gfi:AsankoGoldMembergfi:ImpairmentExpenseMember2021-01-012021-12-310001172724gfi:WindfallProjectMembergfi:ImpairmentExpenseMember2023-01-012023-12-310001172724gfi:WindfallProjectMembergfi:ImpairmentExpenseMember2022-01-012022-12-310001172724gfi:WindfallProjectMembergfi:ImpairmentExpenseMember2021-01-012021-12-310001172724gfi:OtherAssociatesMember2023-01-012023-12-310001172724gfi:OtherAssociatesMember2022-01-012022-12-310001172724gfi:OtherAssociatesMember2021-01-012021-12-310001172724ifrs-full:AggregateContinuingAndDiscontinuedOperationsMember2023-01-012023-12-310001172724ifrs-full:AggregateContinuingAndDiscontinuedOperationsMember2022-01-012022-12-310001172724ifrs-full:AggregateContinuingAndDiscontinuedOperationsMember2021-01-012021-12-310001172724gfi:LepantoConsolidatedMiningCompanyMember2023-01-012023-12-310001172724gfi:AsankoGoldGhanaLimitedMember2023-01-012023-12-310001172724gfi:ShikaGroupFinanceLimitedMember2023-01-012023-12-310001172724gfi:AdansiGoldCompanyGhanaLimitedMember2023-01-012023-12-310001172724gfi:AsankoGoldMember2023-12-310001172724gfi:AsankoGoldMember2023-01-012023-12-310001172724gfi:AsankoGoldMember2022-01-012022-12-310001172724gfi:AsankoGoldMember2023-12-310001172724gfi:AsankoGoldMember2022-12-310001172724gfi:AsankoGoldMembergfi:ImpairmentTriggerDuringTwoThousandTwentyMember2021-01-012021-12-310001172724gfi:WindfallProjectMember2023-07-312023-12-310001172724gfi:WindfallProjectMember2023-01-012023-12-310001172724gfi:WindfallProjectMember2022-12-310001172724gfi:WindfallProjectMember2023-12-310001172724gfi:LunnonMetalsLimitedMember2023-12-310001172724gfi:LunnonMetalsLimitedMember2022-12-310001172724gfi:RusoroMiningLimitedMember2022-12-310001172724gfi:LunnonMetalsLimitedMember2023-01-012023-12-310001172724gfi:LunnonMetalsLimitedMember2022-01-012022-12-310001172724gfi:RusoroMiningLimitedMember2023-01-012023-12-310001172724gfi:RusoroMiningLimitedMember2022-01-012022-12-310001172724gfi:RusoroMiningLimitedMember2016-08-222016-08-220001172724gfi:RusoroMiningLimitedMember2017-12-062017-12-060001172724gfi:RusoroMiningLimitedMember2018-10-190001172724gfi:RusoroMiningLimitedMember2023-07-100001172724gfi:GruyereGoldProjectMember2016-12-132016-12-130001172724ifrs-full:JointOperationsMember2023-12-31iso4217:AUD0001172724ifrs-full:JointOperationsMember2022-12-310001172724gfi:RedeemablePreferredStockMember1Membergfi:AsankoGoldMember2023-12-310001172724gfi:RedeemablePreferredStockMember1Membergfi:AsankoGoldMember2022-12-310001172724gfi:MagmaticResourcesLimitedMember2023-12-310001172724gfi:MagmaticResourcesLimitedMember2022-12-310001172724gfi:ChakanaCopperCorpMember2023-12-310001172724gfi:ChakanaCopperCorpMember2022-12-310001172724gfi:LefroyExplorationLimitedMember2023-12-310001172724gfi:LefroyExplorationLimitedMember2022-12-310001172724gfi:TorqResourcesIncMember2023-12-310001172724gfi:TorqResourcesIncMember2022-12-310001172724gfi:TesoroGoldLimitedMember2023-12-310001172724gfi:TesoroGoldLimitedMember2022-12-310001172724gfi:MineralResourcesLimitedMember2023-12-310001172724gfi:MineralResourcesLimitedMember2022-12-310001172724country:ZA2023-12-310001172724country:ZA2022-12-310001172724country:GH2023-12-310001172724country:GH2022-12-310001172724gfi:GoldSalesMember2023-12-310001172724gfi:GoldSalesMember2022-12-310001172724gfi:CopperConcentrateMember2023-12-310001172724gfi:CopperConcentrateMember2022-12-310001172724gfi:OtherMember2023-12-310001172724gfi:OtherMember2022-12-310001172724country:AU2023-12-310001172724country:AU2022-12-310001172724country:PE2023-12-310001172724country:PE2022-12-310001172724ifrs-full:OrdinarySharesMember2022-12-310001172724ifrs-full:OrdinarySharesMember2021-12-310001172724ifrs-full:OrdinarySharesMember2023-01-012023-12-310001172724ifrs-full:OrdinarySharesMember2022-01-012022-12-31gfi:votesPerShare0001172724ifrs-full:TopOfRangeMember2023-12-310001172724srt:MinimumMembergfi:GoldFieldsLtdMember2023-01-012023-12-310001172724gfi:PublicInvestmentCorporationMember2023-12-310001172724gfi:VanEckVectorsGoldMinersETFMember2023-12-310001172724gfi:DeferredTaxLiabilitiesMiningAssetsMember2023-12-310001172724gfi:DeferredTaxLiabilitiesMiningAssetsMember2022-12-310001172724ifrs-full:RightofuseAssetsMember2023-12-310001172724ifrs-full:RightofuseAssetsMember2022-12-310001172724gfi:DeferredTaxLiabilitiesEnvironmentalTrustFundsMember2023-12-310001172724gfi:DeferredTaxLiabilitiesEnvironmentalTrustFundsMember2022-12-310001172724gfi:DeferredTaxLiabilitiesInventoriesMember2023-12-310001172724gfi:DeferredTaxLiabilitiesInventoriesMember2022-12-310001172724gfi:DeferredTaxLiabilitiesOthersMember2023-12-310001172724gfi:DeferredTaxLiabilitiesOthersMember2022-12-310001172724gfi:DeferredTaxAssetsProvisionsMember2023-12-310001172724gfi:DeferredTaxAssetsProvisionsMember2022-12-310001172724gfi:DeferredTaxAssetsTaxLossesMember2023-12-310001172724gfi:DeferredTaxAssetsTaxLossesMember2022-12-310001172724gfi:DeferredTaxAssetsUnredeemedCapitalExpenditureMember2023-12-310001172724gfi:DeferredTaxAssetsUnredeemedCapitalExpenditureMember2022-12-310001172724gfi:DeferredTaxAssetsLeaseLiabilityMember2023-12-310001172724gfi:DeferredTaxAssetsLeaseLiabilityMember2022-12-310001172724gfi:FiveHundredMillionFiveYearNotesIssueMember2023-12-310001172724gfi:FiveHundredMillionFiveYearNotesIssueMember2023-01-012023-12-310001172724gfi:FiveHundredMillionFiveYearNotesIssueMember2022-12-310001172724gfi:FiveHundredMillionTenYearNotesIssueMember2023-12-310001172724gfi:FiveHundredMillionTenYearNotesIssueMember2023-01-012023-12-310001172724gfi:FiveHundredMillionTenYearNotesIssueMember2022-12-310001172724gfi:UsOneFiftyMillionRevolvingSeniorSecuredCreditFacilityNewMember2023-12-310001172724gfi:UsOneFiftyMillionRevolvingSeniorSecuredCreditFacilityNewMember2022-12-310001172724gfi:UsHundredMillionRevolvingCreditFacilitymemberMember2023-12-310001172724gfi:UsHundredMillionRevolvingCreditFacilitymemberMember2022-12-310001172724gfi:AUFiveHundredMillionDollarSyndicatedRevolvingCreditFacilityOldMember2023-12-310001172724gfi:AUFiveHundredMillionDollarSyndicatedRevolvingCreditFacilityOldMember2022-12-310001172724gfi:AufivehundredmilliondollarsyndicatedrevolvingcreditfacilitynewMember2023-12-310001172724gfi:AufivehundredmilliondollarsyndicatedrevolvingcreditfacilitynewMember2022-12-310001172724gfi:USOneThousandTwoHundredsMillionRevolvingCreditFacilitiesOldMember2023-12-310001172724gfi:USOneThousandTwoHundredsMillionRevolvingCreditFacilitiesOldMember2022-12-310001172724gfi:FacilityAUsSixHundredsMillionThreeYearsRevolvingCreditFacilityMember2023-12-310001172724gfi:FacilityAUsSixHundredsMillionThreeYearsRevolvingCreditFacilityMember2023-01-012023-12-310001172724gfi:FacilityAUsSixHundredsMillionThreeYearsRevolvingCreditFacilityMember2022-12-310001172724gfi:FacilityBUSSixHundredsMillionFiveYearsRevolvingCreditFacilityMember2023-12-310001172724gfi:FacilityBUSSixHundredsMillionFiveYearsRevolvingCreditFacilityMember2023-01-012023-12-310001172724gfi:FacilityBUSSixHundredsMillionFiveYearsRevolvingCreditFacilityMember2022-12-310001172724gfi:USOneThousandTwoHundredsMillionRevolvingCreditFacilitiesNewMember2023-05-250001172724gfi:USOneThousandTwoHundredsMillionRevolvingCreditFacilitiesNewMember2023-12-310001172724gfi:USOneThousandTwoHundredsMillionRevolvingCreditFacilitiesNewMember2022-12-310001172724gfi:ROneThousandFiveHundredMillionNedbankRevolvingCreditFacilityMember2023-12-310001172724gfi:ROneThousandFiveHundredMillionNedbankRevolvingCreditFacilityMember2022-12-310001172724gfi:RFiveHundredMillionNedbankRevolvingCreditFacilityMember2023-12-310001172724gfi:RFiveHundredMillionNedbankRevolvingCreditFacilityMember2022-12-310001172724gfi:RfivehundredmillionrandmerchantbankrevolvingcreditfacilityMember2023-12-310001172724gfi:RfivehundredmillionrandmerchantbankrevolvingcreditfacilityMember2022-12-310001172724gfi:ROneThousandMillionRandMerchantBankRevolvingCreditFacilityMember2023-12-310001172724gfi:ROneThousandMillionRandMerchantBankRevolvingCreditFacilityMember2022-12-310001172724gfi:RFiveHundredMillionABSABankRevolvingCreditFacilityMember2023-12-310001172724gfi:RFiveHundredMillionABSABankRevolvingCreditFacilityMember2022-12-310001172724gfi:RFiveHundredMillionABSABankRevolvingCreditFacilityNewMember2023-12-310001172724gfi:RFiveHundredMillionABSABankRevolvingCreditFacilityNewMember2022-12-310001172724gfi:RFiveHundredMillionStandardBankRevolvingCreditFacilityMember2023-12-310001172724gfi:RFiveHundredMillionStandardBankRevolvingCreditFacilityMember2022-12-310001172724gfi:ShorttermRandUncommittedCreditFacilitiesMember2023-12-310001172724gfi:ShorttermRandUncommittedCreditFacilitiesMember2022-12-310001172724gfi:UsFiveHundredMillionFiveYearNotesMember2019-05-090001172724gfi:FiveHundredMillionFiveYearNotesIssueMember2019-05-092019-05-090001172724gfi:UsFiveHundredMillionTenYearNotesMember2019-05-090001172724gfi:FiveHundredMillionTenYearNotesIssueMember2019-05-092019-05-0900011727242019-05-092019-05-090001172724gfi:UsFiveHundredMillionFiveYearNotesMember2023-12-310001172724gfi:UsFiveHundredMillionFiveYearNotesMember2022-12-310001172724gfi:UsFiveHundredMillionTenYearNotesMember2023-12-310001172724gfi:UsFiveHundredMillionTenYearNotesMember2022-12-310001172724gfi:UsOneFiftyMillionRevolvingSeniorSecuredCreditFacilityNewMembergfi:RevolvingCreditFacility1Member2021-04-150001172724gfi:UsHundredMillionRevolvingCreditFacilitymemberMembergfi:RevolvingCreditFacility1Member2021-09-270001172724gfi:AUFiveHundredMillionDollarSyndicatedRevolvingCreditFacilityOldMembergfi:RevolvingCreditFacility1Member2020-11-190001172724gfi:AufivehundredmilliondollarsyndicatedrevolvingcreditfacilitynewMembergfi:RevolvingCreditFacility1Member2023-09-260001172724gfi:AufivehundredmilliondollarsyndicatedrevolvingcreditfacilitynewMembergfi:RevolvingCreditFacilityAccordionOptionMember2020-11-19gfi:priority0001172724gfi:USOneThousandTwoHundredsMillionRevolvingCreditFacilitiesOldMember2019-07-250001172724gfi:GoldFieldsGhanaHoldingsMembergfi:RevolvingCreditFacility1Member2019-07-25gfi:tranche0001172724gfi:TranchesOneMembergfi:ThreeYearsRevolvingCreditFacilityMembergfi:GoldFieldsGhanaHoldingsMembergfi:RevolvingCreditFacility1Member2019-07-250001172724gfi:TranchesOneMembergfi:ThreeYearsRevolvingCreditFacilityMembergfi:GoldFieldsGhanaHoldingsMembergfi:RevolvingCreditFacility1Member2019-07-252019-07-250001172724gfi:FiveYearsRevolvingCreditFacilitMembergfi:GoldFieldsGhanaHoldingsMembergfi:TranchesTwoMembergfi:RevolvingCreditFacility1Member2019-07-250001172724gfi:FiveYearsRevolvingCreditFacilitMembergfi:GoldFieldsGhanaHoldingsMembergfi:TranchesTwoMembergfi:RevolvingCreditFacility1Member2019-07-252019-07-250001172724gfi:USOneThousandTwoHundredsMillionRevolvingCreditFacilitiesOldMembergfi:GoldFieldsGhanaHoldingsMembergfi:RevolvingCreditFacility1Member2020-07-310001172724gfi:USOneThousandTwoHundredsMillionRevolvingCreditFacilitiesOldMembergfi:GoldFieldsGhanaHoldingsMember2020-07-310001172724gfi:GoldFieldsGhanaHoldingsMembergfi:RevolvingCreditFacility1Member2020-07-012020-07-310001172724gfi:FacilityAUsSixHundredsMillionThreeYearsRevolvingCreditFacilityMembergfi:GoldFieldsGhanaHoldingsMembergfi:RevolvingCreditFacility1Memberifrs-full:NotLaterThanOneYearMember2020-07-310001172724gfi:FacilityAUsSixHundredsMillionThreeYearsRevolvingCreditFacilityMemberifrs-full:LaterThanOneYearAndNotLaterThanTwoYearsMembergfi:GoldFieldsGhanaHoldingsMembergfi:RevolvingCreditFacility1Member2020-07-310001172724gfi:FacilityBUSSixHundredsMillionFiveYearsRevolvingCreditFacilityMemberifrs-full:LaterThanOneYearAndNotLaterThanTwoYearsMembergfi:GoldFieldsGhanaHoldingsMembergfi:RevolvingCreditFacility1Member2020-07-310001172724gfi:FacilityBUSSixHundredsMillionFiveYearsRevolvingCreditFacilityMemberifrs-full:LaterThanTwoYearsAndNotLaterThanThreeYearsMembergfi:GoldFieldsGhanaHoldingsMembergfi:RevolvingCreditFacility1Member2020-07-310001172724gfi:USOneThousandTwoHundredsMillionRevolvingCreditFacilitiesOldMembergfi:GoldFieldsGhanaHoldingsMembergfi:RevolvingCreditFacility1Member2021-07-310001172724gfi:USOneThousandTwoHundredsMillionRevolvingCreditFacilitiesOldMembergfi:GoldFieldsGhanaHoldingsMember2021-07-310001172724gfi:USOneThousandTwoHundredsMillionRevolvingCreditFacilitiesOldMembergfi:GoldFieldsGhanaHoldingsMembergfi:RevolvingCreditFacility1Memberifrs-full:NotLaterThanOneYearMember2021-07-310001172724gfi:GoldFieldsGhanaHoldingsMembergfi:RevolvingCreditFacility1Memberifrs-full:NotLaterThanOneYearMember2021-07-012021-07-310001172724ifrs-full:LaterThanOneYearAndNotLaterThanTwoYearsMembergfi:USOneThousandTwoHundredsMillionRevolvingCreditFacilitiesOldMembergfi:GoldFieldsGhanaHoldingsMembergfi:RevolvingCreditFacility1Member2021-07-310001172724ifrs-full:LaterThanOneYearAndNotLaterThanTwoYearsMembergfi:GoldFieldsGhanaHoldingsMembergfi:RevolvingCreditFacility1Member2021-07-012021-07-310001172724gfi:FacilityAUsSixHundredsMillionThreeYearsRevolvingCreditFacilityMembergfi:GoldFieldsGhanaHoldingsMembergfi:RevolvingCreditFacility1Memberifrs-full:NotLaterThanOneYearMember2021-07-310001172724gfi:FacilityAUsSixHundredsMillionThreeYearsRevolvingCreditFacilityMemberifrs-full:LaterThanOneYearAndNotLaterThanThreeYearsMembergfi:GoldFieldsGhanaHoldingsMembergfi:RevolvingCreditFacility1Member2021-07-310001172724gfi:FacilityBUSSixHundredsMillionFiveYearsRevolvingCreditFacilityMemberifrs-full:LaterThanOneYearAndNotLaterThanThreeYearsMembergfi:GoldFieldsGhanaHoldingsMembergfi:RevolvingCreditFacility1Member2021-07-310001172724gfi:FacilityBUSSixHundredsMillionFiveYearsRevolvingCreditFacilityMembergfi:GoldFieldsGhanaHoldingsMembergfi:RevolvingCreditFacility1Memberifrs-full:LaterThanThreeYearsAndNotLaterThanFiveYearsMember2021-07-310001172724gfi:RevolvingCreditFacilityNewMembergfi:GoldFieldsGhanaHoldingsMember2023-05-250001172724gfi:RevolvingCreditFacilityNewMembergfi:GoldFieldsGhanaHoldingsMember2023-05-252023-05-25gfi:term0001172724gfi:WindfallMiningGroupPartnershipMembergfi:RevolvingCreditFacilityNewMember2023-10-310001172724gfi:ROneThousandFiveHundredMillionNedbankRevolvingCreditFacilityMember2023-05-080001172724gfi:RFiveHundredMillionNedbankRevolvingCreditFacilityMember2023-05-080001172724gfi:RfivehundredmillionrandmerchantbankrevolvingcreditfacilityMember2020-04-150001172724gfi:ROneThousandMillionRandMerchantBankRevolvingCreditFacilityMember2023-04-190001172724gfi:RFiveHundredMillionABSABankRevolvingCreditFacilityNewMember2023-05-050001172724gfi:RFiveHundredMillionStandardBankRevolvingCreditFacilityMember2023-05-080001172724currency:USDgfi:FiveHundredMillionFiveYearNotesIssueMember2022-12-310001172724currency:USDgfi:FiveHundredMillionFiveYearNotesIssueMember2021-12-310001172724currency:USDgfi:FiveHundredMillionFiveYearNotesIssueMember2023-01-012023-12-310001172724currency:USDgfi:FiveHundredMillionFiveYearNotesIssueMember2022-01-012022-12-310001172724currency:USDgfi:FiveHundredMillionFiveYearNotesIssueMember2023-12-310001172724currency:USDgfi:FiveHundredMillionTenYearNotesIssueMember2022-12-310001172724currency:USDgfi:FiveHundredMillionTenYearNotesIssueMember2021-12-310001172724currency:USDgfi:FiveHundredMillionTenYearNotesIssueMember2023-01-012023-12-310001172724currency:USDgfi:FiveHundredMillionTenYearNotesIssueMember2022-01-012022-12-310001172724currency:USDgfi:FiveHundredMillionTenYearNotesIssueMember2023-12-310001172724currency:USDgfi:UsOneFiftyMillionRevolvingSeniorSecuredCreditFacilityNewMember2022-12-310001172724currency:USDgfi:UsOneFiftyMillionRevolvingSeniorSecuredCreditFacilityNewMember2021-12-310001172724currency:USDgfi:UsOneFiftyMillionRevolvingSeniorSecuredCreditFacilityNewMember2023-12-310001172724currency:AUDgfi:AUFiveHundredMillionDollarSyndicatedRevolvingCreditFacilityOldMember2023-01-012023-12-310001172724currency:AUDgfi:AUFiveHundredMillionDollarSyndicatedRevolvingCreditFacilityOldMember2022-01-012022-12-310001172724currency:AUDgfi:AUFiveHundredMillionDollarSyndicatedRevolvingCreditFacilityOldMember2023-12-310001172724currency:AUDgfi:AUFiveHundredMillionDollarSyndicatedRevolvingCreditFacilityOldMember2022-12-310001172724currency:AUDgfi:AufivehundredmilliondollarsyndicatedrevolvingcreditfacilitynewMember2023-01-012023-12-310001172724currency:AUDgfi:AufivehundredmilliondollarsyndicatedrevolvingcreditfacilitynewMember2021-01-012021-12-310001172724currency:AUDgfi:AufivehundredmilliondollarsyndicatedrevolvingcreditfacilitynewMember2022-01-012022-12-310001172724currency:AUDgfi:AufivehundredmilliondollarsyndicatedrevolvingcreditfacilitynewMember2023-12-310001172724currency:AUDgfi:AufivehundredmilliondollarsyndicatedrevolvingcreditfacilitynewMember2022-12-310001172724currency:USDgfi:USOneThousandTwoHundredsMillionRevolvingCreditFacilitiesOldMember2023-01-012023-12-310001172724currency:USDgfi:USOneThousandTwoHundredsMillionRevolvingCreditFacilitiesOldMember2022-01-012022-12-310001172724currency:USDgfi:USOneThousandTwoHundredsMillionRevolvingCreditFacilitiesOldMember2023-12-310001172724currency:USDgfi:USOneThousandTwoHundredsMillionRevolvingCreditFacilitiesOldMember2022-12-310001172724currency:AUDgfi:USOneThousandTwoHundredsMillionRevolvingCreditFacilitiesNewMember2023-01-012023-12-310001172724currency:AUDgfi:USOneThousandTwoHundredsMillionRevolvingCreditFacilitiesNewMember2022-01-012022-12-310001172724currency:AUDgfi:USOneThousandTwoHundredsMillionRevolvingCreditFacilitiesNewMember2023-12-310001172724currency:AUDgfi:USOneThousandTwoHundredsMillionRevolvingCreditFacilitiesNewMember2022-12-310001172724currency:AUD2023-12-310001172724currency:AUD2022-12-310001172724gfi:USOneThousandTwoHundredsMillionRevolvingCreditFacilitiesNewMember2023-01-012023-12-310001172724gfi:WindfallProjectMembergfi:USOneThousandTwoHundredsMillionRevolvingCreditFacilitiesNewMember2023-01-012023-12-310001172724currency:CAD2022-12-310001172724ifrs-full:NotLaterThanOneYearMember2023-12-310001172724ifrs-full:NotLaterThanOneYearMember2022-12-310001172724ifrs-full:LaterThanOneYearAndNotLaterThanTwoYearsMember2023-12-310001172724ifrs-full:LaterThanOneYearAndNotLaterThanTwoYearsMember2022-12-310001172724ifrs-full:LaterThanTwoYearsAndNotLaterThanThreeYearsMember2023-12-310001172724ifrs-full:LaterThanTwoYearsAndNotLaterThanThreeYearsMember2022-12-310001172724ifrs-full:LaterThanThreeYearsAndNotLaterThanFiveYearsMember2023-12-310001172724ifrs-full:LaterThanThreeYearsAndNotLaterThanFiveYearsMember2022-12-310001172724gfi:YearOneMembercountry:ZA2023-12-310001172724gfi:YearTwoMembercountry:ZA2023-12-310001172724gfi:YearThreeMembercountry:ZA2023-12-310001172724gfi:YearFourOnwardsMembercountry:ZA2023-12-310001172724country:GHgfi:YearOneMember2023-12-310001172724gfi:YearTwoMembercountry:GH2023-12-310001172724gfi:YearThreeMembercountry:GH2023-12-310001172724gfi:YearFourOnwardsMembercountry:GH2023-12-310001172724country:GHifrs-full:BottomOfRangeMember2023-12-310001172724country:GHifrs-full:TopOfRangeMember2023-12-310001172724country:AUgfi:YearOneMember2023-12-310001172724gfi:YearTwoMembercountry:AU2023-12-310001172724gfi:YearThreeMembercountry:AU2023-12-310001172724gfi:YearFourOnwardsMembercountry:AU2023-12-310001172724country:AUifrs-full:BottomOfRangeMember2023-12-310001172724country:AUifrs-full:TopOfRangeMember2023-12-310001172724country:PEgfi:YearOneMember2023-12-310001172724gfi:YearTwoMembercountry:PE2023-12-310001172724gfi:YearThreeMembercountry:PE2023-12-310001172724gfi:YearFourOnwardsMembercountry:PE2023-12-310001172724gfi:YearOneMembercountry:CL2023-12-310001172724gfi:YearTwoMembercountry:CL2023-12-310001172724gfi:YearThreeMembercountry:CL2023-12-310001172724gfi:YearFourOnwardsMembercountry:CL2023-12-310001172724country:CL2023-12-310001172724gfi:YearOneMembercountry:ZA2022-12-310001172724gfi:YearTwoMembercountry:ZA2022-12-310001172724gfi:YearThreeMembercountry:ZA2022-12-310001172724gfi:YearFourOnwardsMembercountry:ZA2022-12-310001172724country:GHgfi:YearOneMember2022-12-310001172724gfi:YearTwoMembercountry:GH2022-12-310001172724gfi:YearThreeMembercountry:GH2022-12-310001172724gfi:YearFourOnwardsMembercountry:GH2022-12-310001172724country:GHifrs-full:BottomOfRangeMember2022-12-310001172724country:GHifrs-full:TopOfRangeMember2022-12-310001172724country:AUgfi:YearOneMember2022-12-310001172724gfi:YearTwoMembercountry:AU2022-12-310001172724gfi:YearThreeMembercountry:AU2022-12-310001172724gfi:YearFourOnwardsMembercountry:AU2022-12-310001172724country:AUifrs-full:BottomOfRangeMember2022-12-310001172724country:AUifrs-full:TopOfRangeMember2022-12-310001172724country:PEgfi:YearOneMember2022-12-310001172724gfi:YearTwoMembercountry:PE2022-12-310001172724gfi:YearThreeMembercountry:PE2022-12-310001172724gfi:YearFourOnwardsMembercountry:PE2022-12-310001172724gfi:YearOneMembercountry:CL2022-12-310001172724gfi:YearTwoMembercountry:CL2022-12-310001172724gfi:YearThreeMembercountry:CL2022-12-310001172724gfi:YearFourOnwardsMembercountry:CL2022-12-310001172724country:CL2022-12-310001172724gfi:SilicosisMember2023-12-310001172724gfi:SilicosisMember2022-12-310001172724gfi:SilicosisMembergfi:GovernmentBondsMember2023-12-310001172724gfi:SilicosisMembergfi:GovernmentBondsMember2022-12-310001172724country:CA2022-12-310001172724gfi:LaterThanOneYearsAndNotLaterThanFiveYearsMember2023-12-310001172724gfi:LaterThanOneYearsAndNotLaterThanFiveYearsMember2022-12-310001172724ifrs-full:LaterThanFiveYearsMember2023-12-310001172724ifrs-full:LaterThanFiveYearsMember2022-12-310001172724gfi:SalaresNorteMember2023-12-310001172724gfi:SalaresNorteMember2022-12-310001172724gfi:SouthAfricanPeruvianGhanaianAndAustralianOperationsMember2023-12-310001172724gfi:SouthAfricanPeruvianGhanaianAndAustralianOperationsMember2022-12-310001172724gfi:RandgoldAndExplorationSummonsMembergfi:AllegedTheftsMember2023-12-310001172724gfi:SilicosisMember2023-12-31gfi:company0001172724gfi:SilicosisMember2022-12-310001172724gfi:SilicosisMemberifrs-full:TopOfRangeMember2023-12-310001172724gfi:SilicosisMemberifrs-full:BottomOfRangeMember2023-12-310001172724gfi:SilicosisMember2023-01-012023-12-310001172724gfi:SilicosisMember2022-01-012022-12-310001172724gfi:DividendsDeclaredMember2024-02-232024-02-230001172724ifrs-full:FinancialAssetsAtFairValueMemberifrs-full:FinancialAssetsAtFairValueThroughProfitOrLossMandatorilyMeasuredAtFairValueCategoryMemberifrs-full:GrossCarryingAmountMember2023-12-310001172724ifrs-full:FinancialAssetsAtFairValueMemberifrs-full:GrossCarryingAmountMember2023-12-310001172724ifrs-full:FinancialAssetsAtFairValueMemberifrs-full:AtFairValueMember2023-12-310001172724ifrs-full:FinancialAssetsAtFairValueMemberifrs-full:GrossCarryingAmountMemberifrs-full:FinancialAssetsAtFairValueThroughOtherComprehensiveIncomeCategoryMember2023-12-310001172724ifrs-full:GrossCarryingAmountMemberifrs-full:FinancialAssetsAtAmortisedCostCategoryMembergfi:FinancialAssetsNotMeasuredAtFairValueMember2023-12-310001172724ifrs-full:GrossCarryingAmountMembergfi:FinancialAssetsNotMeasuredAtFairValueMember2023-12-310001172724ifrs-full:AtFairValueMembergfi:FinancialAssetsNotMeasuredAtFairValueMember2023-12-310001172724ifrs-full:FinancialLiabilitiesAtFairValueMembergfi:A300mEnvironmentalImpactAssessmentEIAPermitMemberifrs-full:GrossCarryingAmountMemberifrs-full:FinancialLiabilitiesAtFairValueThroughProfitOrLossCategoryMember2023-12-310001172724ifrs-full:FinancialLiabilitiesAtFairValueMembergfi:A300mEnvironmentalImpactAssessmentEIAPermitMemberifrs-full:GrossCarryingAmountMember2023-12-310001172724ifrs-full:FinancialLiabilitiesAtFairValueMembergfi:A300mEnvironmentalImpactAssessmentEIAPermitMemberifrs-full:AtFairValueMember2023-12-310001172724ifrs-full:FinancialLiabilitiesAtFairValueMemberifrs-full:GrossCarryingAmountMemberifrs-full:FinancialLiabilitiesAtFairValueThroughProfitOrLossCategoryMember2023-12-310001172724ifrs-full:FinancialLiabilitiesAtFairValueMemberifrs-full:GrossCarryingAmountMember2023-12-310001172724ifrs-full:FinancialLiabilitiesAtFairValueMemberifrs-full:AtFairValueMember2023-12-310001172724gfi:FinancialLiabilitiesNotMeasuredAtFairValueMembergfi:OtherFinancialLiabilitiesMeasuredAtAmortisedCostCategoryMemberifrs-full:GrossCarryingAmountMember2023-12-310001172724gfi:FinancialLiabilitiesNotMeasuredAtFairValueMemberifrs-full:GrossCarryingAmountMember2023-12-310001172724gfi:FinancialLiabilitiesNotMeasuredAtFairValueMemberifrs-full:AtFairValueMember2023-12-310001172724ifrs-full:FinancialLiabilitiesAtFairValueMembergfi:A75mDevelopmentalExplorationProjectsAndTargetsMembergfi:OtherFinancialLiabilitiesMeasuredAtAmortisedCostCategoryMemberifrs-full:GrossCarryingAmountMember2023-12-310001172724ifrs-full:FinancialLiabilitiesAtFairValueMembergfi:A75mDevelopmentalExplorationProjectsAndTargetsMemberifrs-full:GrossCarryingAmountMember2023-12-310001172724ifrs-full:FinancialLiabilitiesAtFairValueMembergfi:A75mDevelopmentalExplorationProjectsAndTargetsMemberifrs-full:AtFairValueMember2023-12-310001172724ifrs-full:FinancialAssetsAtFairValueMemberifrs-full:FinancialAssetsAtFairValueThroughProfitOrLossMandatorilyMeasuredAtFairValueCategoryMemberifrs-full:GrossCarryingAmountMember2022-12-310001172724ifrs-full:FinancialAssetsAtFairValueMemberifrs-full:GrossCarryingAmountMember2022-12-310001172724ifrs-full:FinancialAssetsAtFairValueMemberifrs-full:AtFairValueMember2022-12-310001172724ifrs-full:FinancialAssetsAtFairValueMemberifrs-full:GrossCarryingAmountMemberifrs-full:FinancialAssetsAtFairValueThroughOtherComprehensiveIncomeCategoryMember2022-12-310001172724ifrs-full:GrossCarryingAmountMemberifrs-full:FinancialAssetsAtAmortisedCostCategoryMembergfi:FinancialAssetsNotMeasuredAtFairValueMember2022-12-310001172724ifrs-full:GrossCarryingAmountMembergfi:FinancialAssetsNotMeasuredAtFairValueMember2022-12-310001172724ifrs-full:AtFairValueMembergfi:FinancialAssetsNotMeasuredAtFairValueMember2022-12-310001172724gfi:FinancialLiabilitiesNotMeasuredAtFairValueMembergfi:OtherFinancialLiabilitiesMeasuredAtAmortisedCostCategoryMemberifrs-full:GrossCarryingAmountMember2022-12-310001172724gfi:FinancialLiabilitiesNotMeasuredAtFairValueMembergfi:OtherFinancialLiabilitiesMeasuredAtAmortisedCostCategoryMemberifrs-full:AtFairValueMember2022-12-310001172724gfi:FiveHundredMillionFiveYearNotesIssueMember2022-01-012022-12-310001172724gfi:FiveHundredMillionTenYearNotesIssueMember2022-01-012022-12-310001172724ifrs-full:FinancialAssetsAtFairValueMembergfi:EnvironmentalTrustFundsMember2023-12-310001172724ifrs-full:FinancialAssetsAtFairValueMembergfi:EnvironmentalTrustFundsMemberifrs-full:Level1OfFairValueHierarchyMember2023-12-310001172724ifrs-full:FinancialAssetsAtFairValueMembergfi:EnvironmentalTrustFundsMemberifrs-full:Level2OfFairValueHierarchyMember2023-12-310001172724ifrs-full:FinancialAssetsAtFairValueMembergfi:EnvironmentalTrustFundsMemberifrs-full:Level3OfFairValueHierarchyMember2023-12-310001172724ifrs-full:FinancialAssetsAtFairValueMembergfi:EnvironmentalTrustFundsMember2022-12-310001172724ifrs-full:FinancialAssetsAtFairValueMembergfi:EnvironmentalTrustFundsMemberifrs-full:Level1OfFairValueHierarchyMember2022-12-310001172724ifrs-full:FinancialAssetsAtFairValueMembergfi:EnvironmentalTrustFundsMemberifrs-full:Level2OfFairValueHierarchyMember2022-12-310001172724ifrs-full:FinancialAssetsAtFairValueMembergfi:EnvironmentalTrustFundsMemberifrs-full:Level3OfFairValueHierarchyMember2022-12-310001172724ifrs-full:FinancialAssetsAtFairValueMembergfi:TradeReceivablesFromProvisionalCopperConcentrateSalesMember2023-12-310001172724ifrs-full:FinancialAssetsAtFairValueMemberifrs-full:Level1OfFairValueHierarchyMembergfi:TradeReceivablesFromProvisionalCopperConcentrateSalesMember2023-12-310001172724ifrs-full:FinancialAssetsAtFairValueMemberifrs-full:Level2OfFairValueHierarchyMembergfi:TradeReceivablesFromProvisionalCopperConcentrateSalesMember2023-12-310001172724ifrs-full:FinancialAssetsAtFairValueMemberifrs-full:Level3OfFairValueHierarchyMembergfi:TradeReceivablesFromProvisionalCopperConcentrateSalesMember2023-12-310001172724ifrs-full:FinancialAssetsAtFairValueMembergfi:TradeReceivablesFromProvisionalCopperConcentrateSalesMember2022-12-310001172724ifrs-full:FinancialAssetsAtFairValueMemberifrs-full:Level1OfFairValueHierarchyMembergfi:TradeReceivablesFromProvisionalCopperConcentrateSalesMember2022-12-310001172724ifrs-full:FinancialAssetsAtFairValueMemberifrs-full:Level2OfFairValueHierarchyMembergfi:TradeReceivablesFromProvisionalCopperConcentrateSalesMember2022-12-310001172724ifrs-full:FinancialAssetsAtFairValueMemberifrs-full:Level3OfFairValueHierarchyMembergfi:TradeReceivablesFromProvisionalCopperConcentrateSalesMember2022-12-310001172724ifrs-full:FinancialAssetsAtFairValueMembergfi:ListedInvestmentsMember2023-12-310001172724ifrs-full:FinancialAssetsAtFairValueMemberifrs-full:Level1OfFairValueHierarchyMembergfi:ListedInvestmentsMember2023-12-310001172724ifrs-full:FinancialAssetsAtFairValueMembergfi:ListedInvestmentsMemberifrs-full:Level2OfFairValueHierarchyMember2023-12-310001172724ifrs-full:FinancialAssetsAtFairValueMemberifrs-full:Level3OfFairValueHierarchyMembergfi:ListedInvestmentsMember2023-12-310001172724ifrs-full:FinancialAssetsAtFairValueMembergfi:ListedInvestmentsMember2022-12-310001172724ifrs-full:FinancialAssetsAtFairValueMemberifrs-full:Level1OfFairValueHierarchyMembergfi:ListedInvestmentsMember2022-12-310001172724ifrs-full:FinancialAssetsAtFairValueMembergfi:ListedInvestmentsMemberifrs-full:Level2OfFairValueHierarchyMember2022-12-310001172724ifrs-full:FinancialAssetsAtFairValueMemberifrs-full:Level3OfFairValueHierarchyMembergfi:ListedInvestmentsMember2022-12-310001172724ifrs-full:FinancialAssetsAtFairValueMembergfi:AsankoRedeemablePreferenceSharesMember2023-12-310001172724ifrs-full:FinancialAssetsAtFairValueMembergfi:AsankoRedeemablePreferenceSharesMemberifrs-full:Level1OfFairValueHierarchyMember2023-12-310001172724ifrs-full:FinancialAssetsAtFairValueMembergfi:AsankoRedeemablePreferenceSharesMemberifrs-full:Level2OfFairValueHierarchyMember2023-12-310001172724ifrs-full:FinancialAssetsAtFairValueMembergfi:AsankoRedeemablePreferenceSharesMemberifrs-full:Level3OfFairValueHierarchyMember2023-12-310001172724ifrs-full:FinancialAssetsAtFairValueMembergfi:AsankoRedeemablePreferenceSharesMember2022-12-310001172724ifrs-full:FinancialAssetsAtFairValueMembergfi:AsankoRedeemablePreferenceSharesMemberifrs-full:Level1OfFairValueHierarchyMember2022-12-310001172724ifrs-full:FinancialAssetsAtFairValueMembergfi:AsankoRedeemablePreferenceSharesMemberifrs-full:Level2OfFairValueHierarchyMember2022-12-310001172724ifrs-full:FinancialAssetsAtFairValueMembergfi:AsankoRedeemablePreferenceSharesMemberifrs-full:Level3OfFairValueHierarchyMember2022-12-310001172724gfi:EnvironmentalTrustFundsMembergfi:FinancialAssetsNotMeasuredAtFairValueMember2023-12-310001172724gfi:EnvironmentalTrustFundsMemberifrs-full:Level1OfFairValueHierarchyMembergfi:FinancialAssetsNotMeasuredAtFairValueMember2023-12-310001172724gfi:EnvironmentalTrustFundsMemberifrs-full:Level2OfFairValueHierarchyMembergfi:FinancialAssetsNotMeasuredAtFairValueMember2023-12-310001172724gfi:EnvironmentalTrustFundsMemberifrs-full:Level3OfFairValueHierarchyMembergfi:FinancialAssetsNotMeasuredAtFairValueMember2023-12-310001172724gfi:EnvironmentalTrustFundsMembergfi:FinancialAssetsNotMeasuredAtFairValueMember2022-12-310001172724gfi:EnvironmentalTrustFundsMemberifrs-full:Level1OfFairValueHierarchyMembergfi:FinancialAssetsNotMeasuredAtFairValueMember2022-12-310001172724gfi:EnvironmentalTrustFundsMemberifrs-full:Level2OfFairValueHierarchyMembergfi:FinancialAssetsNotMeasuredAtFairValueMember2022-12-310001172724gfi:EnvironmentalTrustFundsMemberifrs-full:Level3OfFairValueHierarchyMembergfi:FinancialAssetsNotMeasuredAtFairValueMember2022-12-310001172724gfi:LoanAdvancedContractorMembergfi:FinancialAssetsNotMeasuredAtFairValueMember2023-12-310001172724ifrs-full:Level1OfFairValueHierarchyMembergfi:LoanAdvancedContractorMembergfi:FinancialAssetsNotMeasuredAtFairValueMember2023-12-310001172724gfi:LoanAdvancedContractorMemberifrs-full:Level2OfFairValueHierarchyMembergfi:FinancialAssetsNotMeasuredAtFairValueMember2023-12-310001172724ifrs-full:Level3OfFairValueHierarchyMembergfi:LoanAdvancedContractorMembergfi:FinancialAssetsNotMeasuredAtFairValueMember2023-12-310001172724gfi:LoanAdvancedContractorMembergfi:FinancialAssetsNotMeasuredAtFairValueMember2022-12-310001172724ifrs-full:Level1OfFairValueHierarchyMembergfi:LoanAdvancedContractorMembergfi:FinancialAssetsNotMeasuredAtFairValueMember2022-12-310001172724gfi:LoanAdvancedContractorMemberifrs-full:Level2OfFairValueHierarchyMembergfi:FinancialAssetsNotMeasuredAtFairValueMember2022-12-310001172724ifrs-full:Level3OfFairValueHierarchyMembergfi:LoanAdvancedContractorMembergfi:FinancialAssetsNotMeasuredAtFairValueMember2022-12-310001172724ifrs-full:FinancialLiabilitiesAtFairValueMembergfi:A300mEnvironmentalImpactAssessmentEIAPermitMember2023-12-310001172724ifrs-full:FinancialLiabilitiesAtFairValueMemberifrs-full:Level1OfFairValueHierarchyMembergfi:A300mEnvironmentalImpactAssessmentEIAPermitMember2023-12-310001172724ifrs-full:FinancialLiabilitiesAtFairValueMembergfi:A300mEnvironmentalImpactAssessmentEIAPermitMemberifrs-full:Level2OfFairValueHierarchyMember2023-12-310001172724ifrs-full:FinancialLiabilitiesAtFairValueMemberifrs-full:Level3OfFairValueHierarchyMembergfi:A300mEnvironmentalImpactAssessmentEIAPermitMember2023-12-310001172724ifrs-full:FinancialLiabilitiesAtFairValueMembergfi:A300mEnvironmentalImpactAssessmentEIAPermitMember2022-12-310001172724ifrs-full:FinancialLiabilitiesAtFairValueMemberifrs-full:Level1OfFairValueHierarchyMembergfi:A300mEnvironmentalImpactAssessmentEIAPermitMember2022-12-310001172724ifrs-full:FinancialLiabilitiesAtFairValueMembergfi:A300mEnvironmentalImpactAssessmentEIAPermitMemberifrs-full:Level2OfFairValueHierarchyMember2022-12-310001172724ifrs-full:FinancialLiabilitiesAtFairValueMemberifrs-full:Level3OfFairValueHierarchyMembergfi:A300mEnvironmentalImpactAssessmentEIAPermitMember2022-12-310001172724gfi:FinancialLiabilitiesNotMeasuredAtFairValueMember2023-12-310001172724gfi:FinancialLiabilitiesNotMeasuredAtFairValueMemberifrs-full:Level1OfFairValueHierarchyMember2023-12-310001172724gfi:FinancialLiabilitiesNotMeasuredAtFairValueMemberifrs-full:Level2OfFairValueHierarchyMember2023-12-310001172724gfi:FinancialLiabilitiesNotMeasuredAtFairValueMemberifrs-full:Level3OfFairValueHierarchyMember2023-12-310001172724gfi:FinancialLiabilitiesNotMeasuredAtFairValueMember2022-12-310001172724gfi:FinancialLiabilitiesNotMeasuredAtFairValueMemberifrs-full:Level1OfFairValueHierarchyMember2022-12-310001172724gfi:FinancialLiabilitiesNotMeasuredAtFairValueMemberifrs-full:Level2OfFairValueHierarchyMember2022-12-310001172724gfi:FinancialLiabilitiesNotMeasuredAtFairValueMemberifrs-full:Level3OfFairValueHierarchyMember2022-12-310001172724gfi:CounterPartyExposureMember2023-01-012023-12-310001172724ifrs-full:CreditRiskMembergfi:EnvironmentalTrustFundsMember2023-12-310001172724ifrs-full:CreditRiskMembergfi:EnvironmentalTrustFundsMember2022-12-310001172724ifrs-full:CreditRiskMemberifrs-full:TradeReceivablesMember2023-12-310001172724ifrs-full:CreditRiskMemberifrs-full:TradeReceivablesMember2022-12-310001172724gfi:LoanAdvancedContractorMemberifrs-full:CreditRiskMember2023-12-310001172724gfi:LoanAdvancedContractorMemberifrs-full:CreditRiskMember2022-12-310001172724ifrs-full:CreditRiskMembergfi:CashAndCashEquivalentMember2023-12-310001172724ifrs-full:CreditRiskMembergfi:CashAndCashEquivalentMember2022-12-310001172724ifrs-full:TradeReceivablesMember2023-12-310001172724ifrs-full:TradeReceivablesMember2022-12-310001172724ifrs-full:CreditRiskMembercountry:GH2023-12-310001172724ifrs-full:CreditRiskMembercountry:GH2022-12-310001172724ifrs-full:CreditRiskMembercountry:AU2023-12-310001172724ifrs-full:CreditRiskMembercountry:AU2022-12-310001172724ifrs-full:CreditRiskMembercountry:PE2023-12-310001172724ifrs-full:CreditRiskMembercountry:PE2022-12-310001172724ifrs-full:CreditRiskMember2023-12-310001172724ifrs-full:CreditRiskMember2022-12-310001172724gfi:LoanAdvancedContractorMember2023-12-310001172724gfi:LoanAdvancedContractorMemberifrs-full:LifetimeExpectedCreditLossesMember2023-12-310001172724ifrs-full:LaterThanOneYearAndNotLaterThanFiveYearsMember2023-12-310001172724gfi:UsDollarBorrowingsMemberifrs-full:NotLaterThanOneYearMember2023-12-310001172724ifrs-full:LaterThanOneYearAndNotLaterThanFiveYearsMembergfi:UsDollarBorrowingsMember2023-12-310001172724gfi:UsDollarBorrowingsMemberifrs-full:LaterThanFiveYearsMember2023-12-310001172724gfi:UsDollarBorrowingsMember2023-12-310001172724gfi:CanadaDollarBorrowingsMemberifrs-full:NotLaterThanOneYearMember2023-12-310001172724ifrs-full:LaterThanOneYearAndNotLaterThanFiveYearsMembergfi:CanadaDollarBorrowingsMember2023-12-310001172724gfi:CanadaDollarBorrowingsMemberifrs-full:LaterThanFiveYearsMember2023-12-310001172724gfi:CanadaDollarBorrowingsMember2023-12-310001172724ifrs-full:LaterThanOneYearAndNotLaterThanFiveYearsMember2022-12-310001172724gfi:UsDollarBorrowingsMemberifrs-full:NotLaterThanOneYearMember2022-12-310001172724ifrs-full:LaterThanOneYearAndNotLaterThanFiveYearsMembergfi:UsDollarBorrowingsMember2022-12-310001172724gfi:UsDollarBorrowingsMemberifrs-full:LaterThanFiveYearsMember2022-12-310001172724gfi:UsDollarBorrowingsMember2022-12-310001172724currency:ZARgfi:ClosingForeignExchangeRateMember2023-12-310001172724currency:ZARgfi:ClosingForeignExchangeRateMember2022-12-310001172724ifrs-full:LiquidityRiskMembergfi:UsDollarBorrowingsMember2023-12-310001172724ifrs-full:LiquidityRiskMembergfi:UsDollarBorrowingsMember2022-12-310001172724ifrs-full:CreditRiskMembergfi:CanadaDollarBorrowingsMember2023-12-310001172724gfi:SouthAfricaAndGhanaMember2023-12-310001172724gfi:SouthAfricaAndGhanaMember2022-12-310001172724ifrs-full:MarketRiskMembergfi:GhanaOilHedgeMember2023-01-012023-12-310001172724ifrs-full:MarketRiskMembergfi:GhanaOilHedgeMember2022-01-012022-12-310001172724ifrs-full:MarketRiskMembergfi:GhanaOilHedgeMember2021-01-012021-12-310001172724gfi:PeruCopperHedgeMemberifrs-full:MarketRiskMember2023-01-012023-12-310001172724gfi:PeruCopperHedgeMemberifrs-full:MarketRiskMember2022-01-012022-12-310001172724gfi:PeruCopperHedgeMemberifrs-full:MarketRiskMember2021-01-012021-12-310001172724gfi:AustraliaGoldHedgeMemberifrs-full:MarketRiskMember2023-01-012023-12-310001172724gfi:AustraliaGoldHedgeMemberifrs-full:MarketRiskMember2022-01-012022-12-310001172724gfi:AustraliaGoldHedgeMemberifrs-full:MarketRiskMember2021-01-012021-12-310001172724ifrs-full:MarketRiskMembergfi:AustraliaOilHedgeMember2023-01-012023-12-310001172724ifrs-full:MarketRiskMembergfi:AustraliaOilHedgeMember2022-01-012022-12-310001172724ifrs-full:MarketRiskMembergfi:AustraliaOilHedgeMember2021-01-012021-12-310001172724gfi:SalaresNorteForeignCurrencyHedgeMemberifrs-full:MarketRiskMember2023-01-012023-12-310001172724gfi:SalaresNorteForeignCurrencyHedgeMemberifrs-full:MarketRiskMember2022-01-012022-12-310001172724gfi:SalaresNorteForeignCurrencyHedgeMemberifrs-full:MarketRiskMember2021-01-012021-12-310001172724gfi:MaverixWarrantsGainOnFairValueMemberifrs-full:MarketRiskMember2023-01-012023-12-310001172724gfi:MaverixWarrantsGainOnFairValueMemberifrs-full:MarketRiskMember2022-01-012022-12-310001172724gfi:MaverixWarrantsGainOnFairValueMemberifrs-full:MarketRiskMember2021-01-012021-12-310001172724ifrs-full:MarketRiskMember2023-01-012023-12-310001172724ifrs-full:MarketRiskMember2022-01-012022-12-310001172724ifrs-full:MarketRiskMember2021-01-012021-12-310001172724gfi:UnrealisedGainlossAndPriorYearMarktomarketReversalsOnDerivativeContractsMemberifrs-full:MarketRiskMember2023-01-012023-12-310001172724gfi:UnrealisedGainlossAndPriorYearMarktomarketReversalsOnDerivativeContractsMemberifrs-full:MarketRiskMember2022-01-012022-12-310001172724gfi:UnrealisedGainlossAndPriorYearMarktomarketReversalsOnDerivativeContractsMemberifrs-full:MarketRiskMember2021-01-012021-12-310001172724ifrs-full:MarketRiskMembergfi:RealisedLossGainOnDerivativeContractsMember2023-01-012023-12-310001172724ifrs-full:MarketRiskMembergfi:RealisedLossGainOnDerivativeContractsMember2022-01-012022-12-310001172724ifrs-full:MarketRiskMembergfi:RealisedLossGainOnDerivativeContractsMember2021-01-012021-12-310001172724ifrs-full:CurrencyRiskMember2022-12-310001172724ifrs-full:CurrencyRiskMember2023-12-310001172724gfi:DecreaseOfTenPercentageMember2023-01-012023-12-310001172724gfi:DecreaseOfFivePercentageMember2023-01-012023-12-310001172724gfi:IncreaseOfFivePercentageMember2023-01-012023-12-310001172724gfi:IncreaseOfTenPercentageMember2023-01-012023-12-310001172724gfi:DecreaseOfTenPercentageMember2022-01-012022-12-310001172724gfi:DecreaseOfFivePercentageMember2022-01-012022-12-310001172724gfi:IncreaseOfFivePercentageMember2022-01-012022-12-310001172724gfi:IncreaseOfTenPercentageMember2022-01-012022-12-310001172724gfi:DecreaseOfTwoAndAHalfPercentageMember2023-01-012023-12-310001172724gfi:IncreaseOfTwoAndAHalfPercentageMember2023-01-012023-12-310001172724gfi:DecreaseOfTwoAndAHalfPercentageMember2022-01-012022-12-310001172724gfi:IncreaseOfTwoAndAHalfPercentageMember2022-01-012022-12-310001172724gfi:OneYearEarlierMember2023-01-012023-12-310001172724gfi:OneYearLaterMember2023-01-012023-12-310001172724gfi:OneYearEarlierMember2022-01-012022-12-310001172724gfi:OneYearLaterMember2022-01-012022-12-310001172724gfi:DecreaseOfOnePercentageMember2023-01-012023-12-310001172724gfi:IncreaseOfOnePercentageMember2023-01-012023-12-310001172724gfi:SixMonthsEarlierMember2023-01-012023-12-310001172724gfi:SixMonthsLaterMember2023-01-012023-12-310001172724gfi:RevolvingCreditFacilityNewMember2023-12-310001172724ifrs-full:InterestRateRiskMembergfi:InterestBearingBorrowingsMember2023-12-310001172724ifrs-full:InterestRateRiskMembergfi:InterestBearingBorrowingsMember2022-12-310001172724gfi:RevolvingCreditFacilityNewMember2022-12-310001172724ifrs-full:InterestRateRiskMembergfi:ChangeInLondonInterbankOfferedRateSecuredOvernightFinancingRateAndCanadianDollarOfferedRateMembergfi:DecreaseOfOnePointFivePercentageMember2023-01-012023-12-310001172724ifrs-full:InterestRateRiskMembergfi:ChangeInLondonInterbankOfferedRateSecuredOvernightFinancingRateAndCanadianDollarOfferedRateMembergfi:DecreaseOfOnePercentageMember2023-01-012023-12-310001172724gfi:DecreaseOfZeroPointFivePercentageMemberifrs-full:InterestRateRiskMembergfi:ChangeInLondonInterbankOfferedRateSecuredOvernightFinancingRateAndCanadianDollarOfferedRateMember2023-01-012023-12-310001172724gfi:IncreaseOfZeroPointPercentagePointsMemberifrs-full:InterestRateRiskMembergfi:ChangeInLondonInterbankOfferedRateSecuredOvernightFinancingRateAndCanadianDollarOfferedRateMember2023-01-012023-12-310001172724gfi:IncreaseOfOnePercentageMemberifrs-full:InterestRateRiskMembergfi:ChangeInLondonInterbankOfferedRateSecuredOvernightFinancingRateAndCanadianDollarOfferedRateMember2023-01-012023-12-310001172724gfi:IncreaseOfOnePointFivePercentageMemberifrs-full:InterestRateRiskMembergfi:ChangeInLondonInterbankOfferedRateSecuredOvernightFinancingRateAndCanadianDollarOfferedRateMember2023-01-012023-12-310001172724ifrs-full:InterestRateRiskMembergfi:ChangeInBankBillSwapBidRateMembergfi:DecreaseOfOnePointFivePercentageMember2023-01-012023-12-310001172724ifrs-full:InterestRateRiskMembergfi:ChangeInBankBillSwapBidRateMembergfi:DecreaseOfOnePercentageMember2023-01-012023-12-310001172724gfi:DecreaseOfZeroPointFivePercentageMemberifrs-full:InterestRateRiskMembergfi:ChangeInBankBillSwapBidRateMember2023-01-012023-12-310001172724gfi:IncreaseOfZeroPointPercentagePointsMemberifrs-full:InterestRateRiskMembergfi:ChangeInBankBillSwapBidRateMember2023-01-012023-12-310001172724gfi:IncreaseOfOnePercentageMemberifrs-full:InterestRateRiskMembergfi:ChangeInBankBillSwapBidRateMember2023-01-012023-12-310001172724gfi:IncreaseOfOnePointFivePercentageMemberifrs-full:InterestRateRiskMembergfi:ChangeInBankBillSwapBidRateMember2023-01-012023-12-310001172724ifrs-full:InterestRateRiskMembergfi:DecreaseOfOnePointFivePercentageMember2023-01-012023-12-310001172724ifrs-full:InterestRateRiskMembergfi:DecreaseOfOnePercentageMember2023-01-012023-12-310001172724gfi:DecreaseOfZeroPointFivePercentageMemberifrs-full:InterestRateRiskMember2023-01-012023-12-310001172724gfi:IncreaseOfZeroPointPercentagePointsMemberifrs-full:InterestRateRiskMember2023-01-012023-12-310001172724gfi:IncreaseOfOnePercentageMemberifrs-full:InterestRateRiskMember2023-01-012023-12-310001172724gfi:IncreaseOfOnePointFivePercentageMemberifrs-full:InterestRateRiskMember2023-01-012023-12-310001172724ifrs-full:InterestRateRiskMembergfi:ChangeInLondonInterbankOfferedRateSecuredOvernightFinancingRateAndCanadianDollarOfferedRateMembergfi:DecreaseOfOnePointFivePercentageMember2022-01-012022-12-310001172724ifrs-full:InterestRateRiskMembergfi:ChangeInLondonInterbankOfferedRateSecuredOvernightFinancingRateAndCanadianDollarOfferedRateMembergfi:DecreaseOfOnePercentageMember2022-01-012022-12-310001172724gfi:DecreaseOfZeroPointFivePercentageMemberifrs-full:InterestRateRiskMembergfi:ChangeInLondonInterbankOfferedRateSecuredOvernightFinancingRateAndCanadianDollarOfferedRateMember2022-01-012022-12-310001172724gfi:IncreaseOfZeroPointPercentagePointsMemberifrs-full:InterestRateRiskMembergfi:ChangeInLondonInterbankOfferedRateSecuredOvernightFinancingRateAndCanadianDollarOfferedRateMember2022-01-012022-12-310001172724gfi:IncreaseOfOnePercentageMemberifrs-full:InterestRateRiskMembergfi:ChangeInLondonInterbankOfferedRateSecuredOvernightFinancingRateAndCanadianDollarOfferedRateMember2022-01-012022-12-310001172724gfi:IncreaseOfOnePointFivePercentageMemberifrs-full:InterestRateRiskMembergfi:ChangeInLondonInterbankOfferedRateSecuredOvernightFinancingRateAndCanadianDollarOfferedRateMember2022-01-012022-12-310001172724ifrs-full:InterestRateRiskMembergfi:ChangeInBankBillSwapBidRateMembergfi:DecreaseOfOnePointFivePercentageMember2022-01-012022-12-310001172724ifrs-full:InterestRateRiskMembergfi:ChangeInBankBillSwapBidRateMembergfi:DecreaseOfOnePercentageMember2022-01-012022-12-310001172724gfi:DecreaseOfZeroPointFivePercentageMemberifrs-full:InterestRateRiskMembergfi:ChangeInBankBillSwapBidRateMember2022-01-012022-12-310001172724gfi:IncreaseOfZeroPointPercentagePointsMemberifrs-full:InterestRateRiskMembergfi:ChangeInBankBillSwapBidRateMember2022-01-012022-12-310001172724gfi:IncreaseOfOnePercentageMemberifrs-full:InterestRateRiskMembergfi:ChangeInBankBillSwapBidRateMember2022-01-012022-12-310001172724gfi:IncreaseOfOnePointFivePercentageMemberifrs-full:InterestRateRiskMembergfi:ChangeInBankBillSwapBidRateMember2022-01-012022-12-310001172724ifrs-full:InterestRateRiskMembergfi:DecreaseOfOnePointFivePercentageMember2022-01-012022-12-310001172724ifrs-full:InterestRateRiskMembergfi:DecreaseOfOnePercentageMember2022-01-012022-12-310001172724gfi:DecreaseOfZeroPointFivePercentageMemberifrs-full:InterestRateRiskMember2022-01-012022-12-310001172724gfi:IncreaseOfZeroPointPercentagePointsMemberifrs-full:InterestRateRiskMember2022-01-012022-12-310001172724gfi:IncreaseOfOnePercentageMemberifrs-full:InterestRateRiskMember2022-01-012022-12-310001172724gfi:IncreaseOfOnePointFivePercentageMemberifrs-full:InterestRateRiskMember2022-01-012022-12-310001172724gfi:ChangeInBankBillSwapBidRateMembergfi:ClosingForeignExchangeRateMember2023-01-012023-12-310001172724gfi:ChangeInBankBillSwapBidRateMembergfi:ClosingForeignExchangeRateMember2022-01-012022-12-310001172724gfi:ExecutiveCommitteeAndNonexecutiveDirectorsMember2023-12-310001172724gfi:ExecutiveCommitteeAndNonexecutiveDirectorsMember2022-12-310001172724gfi:ExecutiveCommitteeAndNonexecutiveDirectorsMember2021-12-310001172724gfi:YsulemanMembergfi:IndependentNonExecutiveDirectorsMember2023-01-012023-12-310001172724gfi:IndependentNonExecutiveDirectorsMembergfi:BacchusMember2023-01-012023-12-310001172724gfi:SreidMembergfi:IndependentNonExecutiveDirectorsMember2023-01-012023-12-310001172724gfi:TgoodlaceMembergfi:IndependentNonExecutiveDirectorsMember2023-01-012023-12-310001172724gfi:AandaniMembergfi:IndependentNonExecutiveDirectorsMember2023-01-012023-12-310001172724gfi:IndependentNonExecutiveDirectorsMembergfi:PSibiyaMember2023-01-012023-12-310001172724gfi:IndependentNonExecutiveDirectorsMembergfi:JMcGillMember2023-01-012023-12-310001172724gfi:IndependentNonExecutiveDirectorsMembergfi:CBitarMember2023-01-012023-12-310001172724gfi:CSmitMembergfi:IndependentNonExecutiveDirectorsMember2023-01-012023-12-310001172724gfi:IndependentNonExecutiveDirectorsMember2023-01-012023-12-310001172724gfi:CcarolusMembergfi:IndependentNonExecutiveDirectorsMember2022-01-012022-12-310001172724gfi:YsulemanMembergfi:IndependentNonExecutiveDirectorsMember2022-01-012022-12-310001172724gfi:IndependentNonExecutiveDirectorsMembergfi:BacchusMember2022-01-012022-12-310001172724gfi:SreidMembergfi:IndependentNonExecutiveDirectorsMember2022-01-012022-12-310001172724gfi:TgoodlaceMembergfi:IndependentNonExecutiveDirectorsMember2022-01-012022-12-310001172724gfi:AandaniMembergfi:IndependentNonExecutiveDirectorsMember2022-01-012022-12-310001172724gfi:IndependentNonExecutiveDirectorsMembergfi:PSibiyaMember2022-01-012022-12-310001172724gfi:IndependentNonExecutiveDirectorsMembergfi:JMcGillMember2022-01-012022-12-310001172724gfi:IndependentNonExecutiveDirectorsMembergfi:CBitarMember2022-01-012022-12-310001172724gfi:IndependentNonExecutiveDirectorsMember2022-01-012022-12-310001172724ifrs-full:KeyManagementPersonnelOfEntityOrParentMembergfi:MpreeceMember2023-01-012023-12-310001172724ifrs-full:KeyManagementPersonnelOfEntityOrParentMembergfi:PschmidtMember2023-01-012023-12-310001172724gfi:ExecutiveDirectorsMemberifrs-full:KeyManagementPersonnelOfEntityOrParentMember2023-01-012023-12-310001172724ifrs-full:KeyManagementPersonnelOfEntityOrParentMembergfi:BMokoatleMember2023-01-012023-12-310001172724ifrs-full:KeyManagementPersonnelOfEntityOrParentMembergfi:LriveraMember2023-01-012023-12-310001172724ifrs-full:KeyManagementPersonnelOfEntityOrParentMembergfi:NchohanMember2023-01-012023-12-310001172724gfi:BmattisonMemberifrs-full:KeyManagementPersonnelOfEntityOrParentMember2023-01-012023-12-310001172724ifrs-full:KeyManagementPersonnelOfEntityOrParentMembergfi:TLeishmanMember2023-01-012023-12-310001172724gfi:AnagaserMemberifrs-full:KeyManagementPersonnelOfEntityOrParentMember2023-01-012023-12-310001172724gfi:SmathewsMemberifrs-full:KeyManagementPersonnelOfEntityOrParentMember2023-01-012023-12-310001172724gfi:RbardienMemberifrs-full:KeyManagementPersonnelOfEntityOrParentMember2023-01-012023-12-310001172724ifrs-full:KeyManagementPersonnelOfEntityOrParentMembergfi:JMortotiMember2023-01-012023-12-310001172724gfi:KCarterMemberifrs-full:KeyManagementPersonnelOfEntityOrParentMember2023-01-012023-12-310001172724ifrs-full:KeyManagementPersonnelOfEntityOrParentMembergfi:JMagagulaMember2023-01-012023-12-310001172724gfi:FSwanepoelMemberifrs-full:KeyManagementPersonnelOfEntityOrParentMember2023-01-012023-12-310001172724gfi:PrescribedOfficerMemberifrs-full:KeyManagementPersonnelOfEntityOrParentMember2023-01-012023-12-310001172724ifrs-full:KeyManagementPersonnelOfEntityOrParentMember2023-01-012023-12-310001172724gfi:PschmidtMember2023-01-012023-12-310001172724gfi:BmattisonMember2023-01-012023-12-310001172724ifrs-full:KeyManagementPersonnelOfEntityOrParentMembergfi:CGriffithMember2022-01-012022-12-310001172724ifrs-full:KeyManagementPersonnelOfEntityOrParentMembergfi:PschmidtMember2022-01-012022-12-310001172724gfi:ExecutiveDirectorsMemberifrs-full:KeyManagementPersonnelOfEntityOrParentMember2022-01-012022-12-310001172724ifrs-full:KeyManagementPersonnelOfEntityOrParentMembergfi:MpreeceMember2022-01-012022-12-310001172724ifrs-full:KeyManagementPersonnelOfEntityOrParentMembergfi:LriveraMember2022-01-012022-12-310001172724ifrs-full:KeyManagementPersonnelOfEntityOrParentMembergfi:RbutcherMember2022-01-012022-12-310001172724ifrs-full:KeyManagementPersonnelOfEntityOrParentMembergfi:NchohanMember2022-01-012022-12-310001172724gfi:BmattisonMemberifrs-full:KeyManagementPersonnelOfEntityOrParentMember2022-01-012022-12-310001172724ifrs-full:KeyManagementPersonnelOfEntityOrParentMembergfi:TLeishmanMember2022-01-012022-12-310001172724gfi:AnagaserMemberifrs-full:KeyManagementPersonnelOfEntityOrParentMember2022-01-012022-12-310001172724gfi:SmathewsMemberifrs-full:KeyManagementPersonnelOfEntityOrParentMember2022-01-012022-12-310001172724gfi:RbardienMemberifrs-full:KeyManagementPersonnelOfEntityOrParentMember2022-01-012022-12-310001172724ifrs-full:KeyManagementPersonnelOfEntityOrParentMembergfi:JMortotiMember2022-01-012022-12-310001172724gfi:PrescribedOfficerMemberifrs-full:KeyManagementPersonnelOfEntityOrParentMember2022-01-012022-12-310001172724ifrs-full:KeyManagementPersonnelOfEntityOrParentMember2022-01-012022-12-310001172724gfi:CGriffithMember2022-01-012022-12-310001172724gfi:PschmidtMember2022-01-012022-12-310001172724gfi:BmattisonMember2022-01-012022-12-310001172724ifrs-full:OperatingSegmentsMembercountry:ZAgfi:SouthDeepMember2023-01-012023-12-310001172724gfi:TarkwaMemberifrs-full:OperatingSegmentsMembercountry:GH2023-01-012023-12-310001172724ifrs-full:OperatingSegmentsMembergfi:DamangMembercountry:GH2023-01-012023-12-310001172724ifrs-full:OperatingSegmentsMembercountry:GH2023-01-012023-12-310001172724ifrs-full:OperatingSegmentsMembergfi:CerroCoronaMembercountry:PE2023-01-012023-12-310001172724ifrs-full:OperatingSegmentsMembergfi:SalaresNorteMembercountry:CL2023-01-012023-12-310001172724ifrs-full:OperatingSegmentsMembersrt:SouthAmericaMembergfi:SalaresNorteMember2023-01-012023-12-310001172724ifrs-full:OperatingSegmentsMembercountry:AUgfi:StivesMember2023-01-012023-12-310001172724ifrs-full:OperatingSegmentsMembercountry:AUgfi:AgnewLawlersMember2023-01-012023-12-310001172724ifrs-full:OperatingSegmentsMembergfi:GrannySmithMembercountry:AU2023-01-012023-12-310001172724ifrs-full:OperatingSegmentsMembercountry:AUgfi:GruyereAustraliaMember2023-01-012023-12-310001172724ifrs-full:OperatingSegmentsMembercountry:AU2023-01-012023-12-310001172724ifrs-full:OperatingSegmentsMembergfi:CorporateAndOtherDomain2023-01-012023-12-310001172724ifrs-full:OperatingSegmentsMember2023-01-012023-12-310001172724ifrs-full:OperatingSegmentsMembergfi:AsankoMembercountry:GHifrs-full:DiscontinuedOperationsMember2023-01-012023-12-310001172724ifrs-full:OperatingSegmentsMembercountry:ZAgfi:SouthDeepMember2023-12-310001172724gfi:TarkwaMemberifrs-full:OperatingSegmentsMembercountry:GH2023-12-310001172724ifrs-full:OperatingSegmentsMembergfi:DamangMembercountry:GH2023-12-310001172724ifrs-full:OperatingSegmentsMembercountry:GH2023-12-310001172724ifrs-full:OperatingSegmentsMembergfi:CerroCoronaMembercountry:PE2023-12-310001172724ifrs-full:OperatingSegmentsMembergfi:SalaresNorteMembercountry:CL2023-12-310001172724ifrs-full:OperatingSegmentsMembersrt:SouthAmericaMembergfi:SalaresNorteMember2023-12-310001172724ifrs-full:OperatingSegmentsMembercountry:AUgfi:StivesMember2023-12-310001172724ifrs-full:OperatingSegmentsMembercountry:AUgfi:AgnewLawlersMember2023-12-310001172724ifrs-full:OperatingSegmentsMembergfi:GrannySmithMembercountry:AU2023-12-310001172724ifrs-full:OperatingSegmentsMembercountry:AUgfi:GruyereAustraliaMember2023-12-310001172724ifrs-full:OperatingSegmentsMembercountry:AU2023-12-310001172724ifrs-full:OperatingSegmentsMembergfi:CorporateAndOtherDomain2023-12-310001172724ifrs-full:OperatingSegmentsMember2023-12-310001172724ifrs-full:OperatingSegmentsMembergfi:AsankoMembercountry:GHifrs-full:DiscontinuedOperationsMember2023-12-310001172724ifrs-full:AggregateContinuingAndDiscontinuedOperationsMember2023-12-310001172724gfi:SouthDeepMember2023-01-012023-12-310001172724gfi:PurchasePriceAllocationFairValueAdjustmentMembergfi:AsankoGoldMemberifrs-full:DiscontinuedOperationsMember2023-01-012023-12-310001172724gfi:AsankoMember2023-12-310001172724gfi:CorporateAndOtherDomain2023-01-012023-12-310001172724ifrs-full:OperatingSegmentsMembercountry:ZAgfi:SouthDeepMember2022-01-012022-12-310001172724gfi:TarkwaMemberifrs-full:OperatingSegmentsMembercountry:GH2022-01-012022-12-310001172724ifrs-full:OperatingSegmentsMembergfi:DamangMembercountry:GH2022-01-012022-12-310001172724ifrs-full:OperatingSegmentsMembercountry:GH2022-01-012022-12-310001172724ifrs-full:OperatingSegmentsMembergfi:CerroCoronaMembercountry:PE2022-01-012022-12-310001172724ifrs-full:OperatingSegmentsMembergfi:SalaresNorteMembercountry:CL2022-01-012022-12-310001172724ifrs-full:OperatingSegmentsMembersrt:SouthAmericaMembergfi:SalaresNorteMember2022-01-012022-12-310001172724ifrs-full:OperatingSegmentsMembercountry:AUgfi:StivesMember2022-01-012022-12-310001172724ifrs-full:OperatingSegmentsMembercountry:AUgfi:AgnewLawlersMember2022-01-012022-12-310001172724ifrs-full:OperatingSegmentsMembergfi:GrannySmithMembercountry:AU2022-01-012022-12-310001172724ifrs-full:OperatingSegmentsMembercountry:AUgfi:GruyereAustraliaMember2022-01-012022-12-310001172724ifrs-full:OperatingSegmentsMembercountry:AU2022-01-012022-12-310001172724ifrs-full:OperatingSegmentsMembergfi:CorporateAndOtherDomain2022-01-012022-12-310001172724ifrs-full:OperatingSegmentsMember2022-01-012022-12-310001172724ifrs-full:OperatingSegmentsMembergfi:AsankoMembercountry:GHifrs-full:DiscontinuedOperationsMember2022-01-012022-12-310001172724ifrs-full:OperatingSegmentsMembercountry:ZAgfi:SouthDeepMember2022-12-310001172724gfi:TarkwaMemberifrs-full:OperatingSegmentsMembercountry:GH2022-12-310001172724ifrs-full:OperatingSegmentsMembergfi:DamangMembercountry:GH2022-12-310001172724ifrs-full:OperatingSegmentsMembercountry:GH2022-12-310001172724ifrs-full:OperatingSegmentsMembergfi:CerroCoronaMembercountry:PE2022-12-310001172724ifrs-full:OperatingSegmentsMembergfi:SalaresNorteMembercountry:CL2022-12-310001172724ifrs-full:OperatingSegmentsMembersrt:SouthAmericaMembergfi:SalaresNorteMember2022-12-310001172724ifrs-full:OperatingSegmentsMembercountry:AUgfi:StivesMember2022-12-310001172724ifrs-full:OperatingSegmentsMembercountry:AUgfi:AgnewLawlersMember2022-12-310001172724ifrs-full:OperatingSegmentsMembergfi:GrannySmithMembercountry:AU2022-12-310001172724ifrs-full:OperatingSegmentsMembercountry:AUgfi:GruyereAustraliaMember2022-12-310001172724ifrs-full:OperatingSegmentsMembercountry:AU2022-12-310001172724ifrs-full:OperatingSegmentsMembergfi:CorporateAndOtherDomain2022-12-310001172724ifrs-full:OperatingSegmentsMember2022-12-310001172724ifrs-full:OperatingSegmentsMembergfi:AsankoMembercountry:GHifrs-full:DiscontinuedOperationsMember2022-12-310001172724ifrs-full:AggregateContinuingAndDiscontinuedOperationsMember2022-12-310001172724gfi:SouthDeepMember2022-01-012022-12-310001172724gfi:PurchasePriceAllocationFairValueAdjustmentMembergfi:AsankoGoldMemberifrs-full:DiscontinuedOperationsMember2022-01-012022-12-310001172724gfi:AsankoMember2022-12-310001172724gfi:CorporateAndOtherDomain2022-01-012022-12-310001172724ifrs-full:OperatingSegmentsMembercountry:ZAgfi:SouthDeepMember2021-01-012021-12-310001172724gfi:TarkwaMemberifrs-full:OperatingSegmentsMembercountry:GH2021-01-012021-12-310001172724ifrs-full:OperatingSegmentsMembergfi:DamangMembercountry:GH2021-01-012021-12-310001172724ifrs-full:OperatingSegmentsMembercountry:GH2021-01-012021-12-310001172724ifrs-full:OperatingSegmentsMembergfi:CerroCoronaMembercountry:PE2021-01-012021-12-310001172724ifrs-full:OperatingSegmentsMembergfi:SalaresNorteMembercountry:CL2021-01-012021-12-310001172724ifrs-full:OperatingSegmentsMembersrt:SouthAmericaMembergfi:SalaresNorteMember2021-01-012021-12-310001172724ifrs-full:OperatingSegmentsMembercountry:AUgfi:StivesMember2021-01-012021-12-310001172724ifrs-full:OperatingSegmentsMembercountry:AUgfi:AgnewLawlersMember2021-01-012021-12-310001172724ifrs-full:OperatingSegmentsMembergfi:GrannySmithMembercountry:AU2021-01-012021-12-310001172724ifrs-full:OperatingSegmentsMembercountry:AUgfi:GruyereAustraliaMember2021-01-012021-12-310001172724ifrs-full:OperatingSegmentsMembercountry:AU2021-01-012021-12-310001172724ifrs-full:OperatingSegmentsMembergfi:CorporateAndOtherDomain2021-01-012021-12-310001172724ifrs-full:OperatingSegmentsMember2021-01-012021-12-310001172724ifrs-full:OperatingSegmentsMembergfi:AsankoMembercountry:GHifrs-full:DiscontinuedOperationsMember2021-01-012021-12-310001172724ifrs-full:OperatingSegmentsMembercountry:ZAgfi:SouthDeepMember2021-12-310001172724gfi:TarkwaMemberifrs-full:OperatingSegmentsMembercountry:GH2021-12-310001172724ifrs-full:OperatingSegmentsMembergfi:DamangMembercountry:GH2021-12-310001172724ifrs-full:OperatingSegmentsMembercountry:GH2021-12-310001172724ifrs-full:OperatingSegmentsMembergfi:CerroCoronaMembercountry:PE2021-12-310001172724ifrs-full:OperatingSegmentsMembergfi:SalaresNorteMembercountry:CL2021-12-310001172724ifrs-full:OperatingSegmentsMembersrt:SouthAmericaMembergfi:SalaresNorteMember2021-12-310001172724ifrs-full:OperatingSegmentsMembercountry:AUgfi:StivesMember2021-12-310001172724ifrs-full:OperatingSegmentsMembercountry:AUgfi:AgnewLawlersMember2021-12-310001172724ifrs-full:OperatingSegmentsMembergfi:GrannySmithMembercountry:AU2021-12-310001172724ifrs-full:OperatingSegmentsMembercountry:AUgfi:GruyereAustraliaMember2021-12-310001172724ifrs-full:OperatingSegmentsMembercountry:AU2021-12-310001172724ifrs-full:OperatingSegmentsMembergfi:CorporateAndOtherDomain2021-12-310001172724ifrs-full:OperatingSegmentsMember2021-12-310001172724ifrs-full:OperatingSegmentsMembergfi:AsankoMembercountry:GHifrs-full:DiscontinuedOperationsMember2021-12-310001172724ifrs-full:AggregateContinuingAndDiscontinuedOperationsMember2021-12-310001172724gfi:SouthDeepMember2021-01-012021-12-310001172724gfi:PurchasePriceAllocationFairValueAdjustmentMembergfi:AsankoGoldMemberifrs-full:DiscontinuedOperationsMember2021-01-012021-12-310001172724gfi:AsankoMember2021-12-310001172724gfi:CorporateAndOtherDomain2021-01-012021-12-310001172724gfi:AbossoGoldfieldsLimitedMembergfi:ClassASharesMember2023-12-310001172724gfi:AbossoGoldfieldsLimitedMembergfi:ClassASharesMember2022-12-310001172724gfi:AbossoGoldfieldsLimitedMembergfi:ClassASharesMember2023-01-012023-12-310001172724gfi:AbossoGoldfieldsLimitedMembergfi:ClassASharesMember2022-01-012022-12-310001172724gfi:ClassBSharesMembergfi:AbossoGoldfieldsLimitedMember2023-12-310001172724gfi:ClassBSharesMembergfi:AbossoGoldfieldsLimitedMember2022-12-310001172724gfi:ClassBSharesMembergfi:AbossoGoldfieldsLimitedMember2023-01-012023-12-310001172724gfi:ClassBSharesMembergfi:AbossoGoldfieldsLimitedMember2022-01-012022-12-310001172724gfi:AgnewGoldMiningCompanyProprietaryLimitedMember2023-12-310001172724gfi:AgnewGoldMiningCompanyProprietaryLimitedMember2022-12-310001172724gfi:AgnewGoldMiningCompanyProprietaryLimitedMember2023-01-012023-12-310001172724gfi:AgnewGoldMiningCompanyProprietaryLimitedMember2022-01-012022-12-310001172724gfi:DarlotMiningCompanyProprietaryLimitedMember2023-12-310001172724gfi:DarlotMiningCompanyProprietaryLimitedMember2022-12-310001172724gfi:DarlotMiningCompanyProprietaryLimitedMember2023-01-012023-12-310001172724gfi:DarlotMiningCompanyProprietaryLimitedMember2022-01-012022-12-310001172724gfi:GFIJointVentureHoldingsProprietaryLimitedMember2023-12-310001172724gfi:GFIJointVentureHoldingsProprietaryLimitedMember2022-12-310001172724gfi:GFIJointVentureHoldingsProprietaryLimitedMember2023-01-012023-12-310001172724gfi:GFIJointVentureHoldingsProprietaryLimitedMember2022-01-012022-12-310001172724gfi:GFLMiningServicesLimitedMember2023-12-310001172724gfi:GFLMiningServicesLimitedMember2022-12-310001172724gfi:GFLMiningServicesLimitedMember2023-01-012023-12-310001172724gfi:GFLMiningServicesLimitedMember2022-01-012022-12-310001172724gfi:GoldFieldsGhanaLimitedMember2023-12-310001172724gfi:GoldFieldsGhanaLimitedMember2022-12-310001172724gfi:GoldFieldsGhanaLimitedMember2023-01-012023-12-310001172724gfi:GoldFieldsGhanaLimitedMember2022-01-012022-12-310001172724gfi:GoldFieldsGroupServicesProprietaryLimitedMember2023-12-310001172724gfi:GoldFieldsGroupServicesProprietaryLimitedMember2022-12-310001172724gfi:GoldFieldsGroupServicesProprietaryLimitedMember2023-01-012023-12-310001172724gfi:GoldFieldsGroupServicesProprietaryLimitedMember2022-01-012022-12-310001172724gfi:GoldFieldsHoldingsCompanyBVILimitedMember2023-12-310001172724gfi:GoldFieldsHoldingsCompanyBVILimitedMember2022-12-310001172724gfi:GoldFieldsHoldingsCompanyBVILimitedMember2023-01-012023-12-310001172724gfi:GoldFieldsHoldingsCompanyBVILimitedMember2022-01-012022-12-310001172724gfi:GoldFieldsLaCimaSAMember2023-12-310001172724gfi:GoldFieldsLaCimaSAMember2022-12-310001172724gfi:GoldFieldsLaCimaSAMember2023-01-012023-12-310001172724gfi:GoldFieldsLaCimaSAMember2022-01-012022-12-310001172724gfi:GoldFieldsOperationsLimitedMember2023-12-310001172724gfi:GoldFieldsOperationsLimitedMember2022-12-310001172724gfi:GoldFieldsOperationsLimitedMember2023-01-012023-12-310001172724gfi:GoldFieldsOperationsLimitedMember2022-01-012022-12-310001172724gfi:GoldFieldsOrogenHoldingsBVILimitedMember2023-12-310001172724gfi:GoldFieldsOrogenHoldingsBVILimitedMember2022-12-310001172724gfi:GoldFieldsOrogenHoldingsBVILimitedMember2023-01-012023-12-310001172724gfi:GoldFieldsOrogenHoldingsBVILimitedMember2022-01-012022-12-310001172724gfi:GruyereMiningCompanyProprietaryLimitedMember2023-12-310001172724gfi:GruyereMiningCompanyProprietaryLimitedMember2022-12-310001172724gfi:GruyereMiningCompanyProprietaryLimitedMember2023-01-012023-12-310001172724gfi:GruyereMiningCompanyProprietaryLimitedMember2022-01-012022-12-310001172724gfi:GSMMiningCompanyProprietaryLimitedMember2023-12-310001172724gfi:GSMMiningCompanyProprietaryLimitedMember2022-12-310001172724gfi:GSMMiningCompanyProprietaryLimitedMember2023-01-012023-12-310001172724gfi:GSMMiningCompanyProprietaryLimitedMember2022-01-012022-12-310001172724gfi:MineraGoldFieldsSalaresNorteSpAMember2023-12-310001172724gfi:MineraGoldFieldsSalaresNorteSpAMember2022-12-310001172724gfi:MineraGoldFieldsSalaresNorteSpAMember2023-01-012023-12-310001172724gfi:MineraGoldFieldsSalaresNorteSpAMember2022-01-012022-12-310001172724gfi:NewshelfEightNineNineProprietaryLimitedMembergfi:ClassASharesMember2023-12-310001172724gfi:NewshelfEightNineNineProprietaryLimitedMembergfi:ClassASharesMember2022-12-310001172724gfi:NewshelfEightNineNineProprietaryLimitedMembergfi:ClassASharesMember2023-01-012023-12-310001172724gfi:NewshelfEightNineNineProprietaryLimitedMembergfi:ClassASharesMember2022-01-012022-12-310001172724gfi:ClassBSharesMembergfi:NewshelfEightNineNineProprietaryLimitedMember2023-12-310001172724gfi:ClassBSharesMembergfi:NewshelfEightNineNineProprietaryLimitedMember2022-12-310001172724gfi:ClassBSharesMembergfi:NewshelfEightNineNineProprietaryLimitedMember2023-01-012023-12-310001172724gfi:ClassBSharesMembergfi:NewshelfEightNineNineProprietaryLimitedMember2022-01-012022-12-310001172724gfi:StivesGoldMiningCompanyProprietaryLimitedMember2023-12-310001172724gfi:StivesGoldMiningCompanyProprietaryLimitedMember2022-12-310001172724gfi:StivesGoldMiningCompanyProprietaryLimitedMember2023-01-012023-12-310001172724gfi:StivesGoldMiningCompanyProprietaryLimitedMember2022-01-012022-12-310001172724gfi:AbossoGoldfieldsLimitedMember2023-12-310001172724gfi:AbossoGoldfieldsLimitedMember2022-12-310001172724gfi:AbossoGoldfieldsLimitedMember2023-01-012023-12-310001172724gfi:AbossoGoldfieldsLimitedMember2022-01-012022-12-310001172724gfi:GoldFieldsOperationsLimitedMembergfi:ClassASharesMember2023-12-310001172724gfi:ClassBSharesMembergfi:SouthDeepBeeMember2023-12-310001172724gfi:ClassBSharesMembergfi:NewshelfEightNineNineProprietaryLimitedMembergfi:NotLaterThanTenYearsMember2023-01-012023-12-310001172724gfi:LaterThanTenYearsAndNotLaterFifeteenYearsMembergfi:ClassBSharesMembergfi:NewshelfEightNineNineProprietaryLimitedMember2023-01-012023-12-310001172724gfi:ClassBSharesMembergfi:NewshelfEightNineNineProprietaryLimitedMembergfi:LaterThanFifeteenYearsAndNotLaterTwentyYearsMember2023-01-012023-12-310001172724gfi:SouthDeepBeeMember2023-01-012023-12-310001172724gfi:ClassBSharesMembergfi:SouthDeepBeeMember2023-01-012023-12-310001172724ifrs-full:AssociatesMembergfi:RusoroMiningLimitedMember2023-12-310001172724ifrs-full:AssociatesMembergfi:RusoroMiningLimitedMember2022-12-310001172724ifrs-full:AssociatesMembergfi:RusoroMiningLimitedMember2023-01-012023-12-310001172724ifrs-full:AssociatesMembergfi:RusoroMiningLimitedMember2022-01-012022-12-310001172724ifrs-full:AssociatesMembergfi:LunnonMetalsLimitedMember2023-12-310001172724ifrs-full:AssociatesMembergfi:LunnonMetalsLimitedMember2022-12-310001172724ifrs-full:AssociatesMembergfi:LunnonMetalsLimitedMember2023-01-012023-12-310001172724ifrs-full:AssociatesMembergfi:LunnonMetalsLimitedMember2022-01-012022-12-310001172724ifrs-full:JointVenturesMembergfi:FarSoutheastGoldResourcesIncorporatedMember2023-12-310001172724ifrs-full:JointVenturesMembergfi:FarSoutheastGoldResourcesIncorporatedMember2022-12-310001172724ifrs-full:JointVenturesMembergfi:FarSoutheastGoldResourcesIncorporatedMember2023-01-012023-12-310001172724ifrs-full:JointVenturesMembergfi:FarSoutheastGoldResourcesIncorporatedMember2022-01-012022-12-310001172724ifrs-full:JointVenturesMembergfi:AsankoGoldGhanaLimitedMember2023-12-310001172724ifrs-full:JointVenturesMembergfi:AsankoGoldGhanaLimitedMember2022-12-310001172724ifrs-full:JointVenturesMembergfi:AsankoGoldGhanaLimitedMember2023-01-012023-12-310001172724ifrs-full:JointVenturesMembergfi:AsankoGoldGhanaLimitedMember2022-01-012022-12-310001172724gfi:AdansiGoldCompanyLimitedMemberifrs-full:JointVenturesMember2023-12-310001172724gfi:AdansiGoldCompanyLimitedMemberifrs-full:JointVenturesMember2022-12-310001172724gfi:AdansiGoldCompanyLimitedMemberifrs-full:JointVenturesMember2023-01-012023-12-310001172724gfi:AdansiGoldCompanyLimitedMemberifrs-full:JointVenturesMember2022-01-012022-12-310001172724ifrs-full:JointVenturesMembergfi:ShikaGroupFinanceLimitedMember2023-12-310001172724ifrs-full:JointVenturesMembergfi:ShikaGroupFinanceLimitedMember2022-12-310001172724ifrs-full:JointVenturesMembergfi:ShikaGroupFinanceLimitedMember2023-01-012023-12-310001172724ifrs-full:JointVenturesMembergfi:ShikaGroupFinanceLimitedMember2022-01-012022-12-310001172724ifrs-full:JointVenturesMembergfi:WindfallMiningGroupPartnershipMember2023-12-310001172724ifrs-full:JointVenturesMembergfi:WindfallMiningGroupPartnershipMember2022-12-310001172724ifrs-full:JointVenturesMembergfi:WindfallMiningGroupPartnershipMember2023-01-012023-12-310001172724ifrs-full:JointVenturesMembergfi:WindfallMiningGroupPartnershipMember2022-01-012022-12-310001172724ifrs-full:EquityInvestmentsMembergfi:GalianoGoldIncformerlyAsankoGoldIncMember2023-12-310001172724ifrs-full:EquityInvestmentsMembergfi:GalianoGoldIncformerlyAsankoGoldIncMember2022-12-310001172724ifrs-full:EquityInvestmentsMembergfi:GalianoGoldIncformerlyAsankoGoldIncMember2023-01-012023-12-310001172724ifrs-full:EquityInvestmentsMembergfi:GalianoGoldIncformerlyAsankoGoldIncMember2022-01-012022-12-310001172724ifrs-full:EquityInvestmentsMembergfi:TorqResourcesIncMember2023-12-310001172724ifrs-full:EquityInvestmentsMembergfi:TorqResourcesIncMember2022-12-310001172724ifrs-full:EquityInvestmentsMembergfi:TorqResourcesIncMember2023-01-012023-12-310001172724ifrs-full:EquityInvestmentsMembergfi:TorqResourcesIncMember2022-01-012022-12-310001172724ifrs-full:EquityInvestmentsMembergfi:TesoroGoldLimitedMember2023-12-310001172724ifrs-full:EquityInvestmentsMembergfi:TesoroGoldLimitedMember2022-12-310001172724ifrs-full:EquityInvestmentsMembergfi:TesoroGoldLimitedMember2023-01-012023-12-310001172724ifrs-full:EquityInvestmentsMembergfi:TesoroGoldLimitedMember2022-01-012022-12-310001172724ifrs-full:EquityInvestmentsMembergfi:HamelinGoldLimitedMember2023-12-310001172724ifrs-full:EquityInvestmentsMembergfi:HamelinGoldLimitedMember2022-12-310001172724ifrs-full:EquityInvestmentsMembergfi:HamelinGoldLimitedMember2023-01-012023-12-310001172724ifrs-full:EquityInvestmentsMembergfi:HamelinGoldLimitedMember2022-01-012022-12-310001172724ifrs-full:EquityInvestmentsMembergfi:RareXLimitedMember2023-12-310001172724ifrs-full:EquityInvestmentsMembergfi:RareXLimitedMember2022-12-310001172724ifrs-full:EquityInvestmentsMembergfi:RareXLimitedMember2023-01-012023-12-310001172724ifrs-full:EquityInvestmentsMembergfi:RareXLimitedMember2022-01-012022-12-310001172724gfi:VizslaCopperCorporationMemberifrs-full:EquityInvestmentsMember2023-12-310001172724gfi:VizslaCopperCorporationMemberifrs-full:EquityInvestmentsMember2022-12-310001172724gfi:VizslaCopperCorporationMemberifrs-full:EquityInvestmentsMember2023-01-012023-12-310001172724gfi:VizslaCopperCorporationMemberifrs-full:EquityInvestmentsMember2022-01-012022-12-310001172724gfi:LefroyExplorationLimitedMemberifrs-full:EquityInvestmentsMember2023-12-310001172724gfi:LefroyExplorationLimitedMemberifrs-full:EquityInvestmentsMember2022-12-310001172724gfi:LefroyExplorationLimitedMemberifrs-full:EquityInvestmentsMember2023-01-012023-12-310001172724gfi:LefroyExplorationLimitedMemberifrs-full:EquityInvestmentsMember2022-01-012022-12-310001172724gfi:MagmaticResourcesLimitedMemberifrs-full:EquityInvestmentsMember2023-12-310001172724gfi:MagmaticResourcesLimitedMemberifrs-full:EquityInvestmentsMember2022-12-310001172724gfi:MagmaticResourcesLimitedMemberifrs-full:EquityInvestmentsMember2023-01-012023-12-310001172724gfi:MagmaticResourcesLimitedMemberifrs-full:EquityInvestmentsMember2022-01-012022-12-310001172724ifrs-full:EquityInvestmentsMembergfi:MineralResourcesLimitedMember2023-12-310001172724ifrs-full:EquityInvestmentsMembergfi:MineralResourcesLimitedMember2022-12-310001172724ifrs-full:EquityInvestmentsMembergfi:MineralResourcesLimitedMember2023-01-012023-12-310001172724ifrs-full:EquityInvestmentsMembergfi:MineralResourcesLimitedMember2022-01-012022-12-310001172724ifrs-full:EquityInvestmentsMembergfi:OrsuMetalsCorporationMember2023-12-310001172724ifrs-full:EquityInvestmentsMembergfi:OrsuMetalsCorporationMember2022-12-310001172724ifrs-full:EquityInvestmentsMembergfi:OrsuMetalsCorporationMember2023-01-012023-12-310001172724ifrs-full:EquityInvestmentsMembergfi:OrsuMetalsCorporationMember2022-01-012022-12-310001172724ifrs-full:EquityInvestmentsMembergfi:ChakanaCopperCorp3Member2023-12-310001172724ifrs-full:EquityInvestmentsMembergfi:ChakanaCopperCorp3Member2022-12-310001172724ifrs-full:EquityInvestmentsMembergfi:ChakanaCopperCorp3Member2023-01-012023-12-310001172724ifrs-full:EquityInvestmentsMembergfi:ChakanaCopperCorp3Member2022-01-012022-12-310001172724ifrs-full:EquityInvestmentsMembergfi:AmarcResourcesLimitedMember2023-12-310001172724ifrs-full:EquityInvestmentsMembergfi:AmarcResourcesLimitedMember2022-12-310001172724ifrs-full:EquityInvestmentsMembergfi:AmarcResourcesLimitedMember2023-01-012023-12-310001172724ifrs-full:EquityInvestmentsMembergfi:AmarcResourcesLimitedMember2022-01-012022-12-31
As filed with the Securities and Exchange Commission on 28 March 2024
UNITED STATES
SECURITIES AND EXCHANGE COMMISSION
Washington, D.C. 20549
_______________________
Form 20-F
_______________________
(Mark One)
| |
| REGISTRATION STATEMENT PURSUANT TO SECTION 12(b) OR 12(g) OF THE SECURITIES EXCHANGE ACT OF 1934 |
or
| |
| ANNUAL REPORT PURSUANT TO SECTION 13 OR 15(d) OF THE SECURITIES EXCHANGE ACT OF 1934 |
For the fiscal year ended 31 December 2023
or
| |
| TRANSITION REPORT PURSUANT TO SECTION 13 OR 15(d) OF THE SECURITIES EXCHANGE ACT OF 1934 |
or
| |
| SHELL COMPANY REPORT PURSUANT TO SECTION 13 OR 15(d) OF THE SECURITIES EXCHANGE ACT OF 1934 |
Date of event requiring this shell company report
For the transition period from to
Commission file number: 1-31318
_______________________
Gold Fields Limited
(Exact name of registrant as specified in its charter)
_______________________
Republic of South Africa
(Jurisdiction of incorporation or organisation)
150 Helen Road
Sandown, Sandton, 2196
South Africa
011-27-11-562-9700
(Address of principal executive offices)
with copies to:
Kelly Carter
EVP Group Head of Legal & Compliance
Tel: +61 8 9211 9252
kelly.carter@goldfields.com
150 Helen Road
Sandown, Sandton, 2196
South Africa
Michael Z. Bienenfeld
Igor Rogovoy
Linklaters LLP
Tel: +44-20 7456 2000
One Silk Street
London EC2Y 8HQ
United Kingdom
(Name, Telephone, E-mail and/or Facsimile number and Address of Company Contact Person)
Securities registered or to be registered pursuant to Section 12(b) of the Act
| | | | |
| | | | Name of Each Exchange on Which Registered |
American Depositary Shares, each representing one ordinary share | | | | |
Ordinary shares of no par value each | | | | |
*Not for trading, but only in connection with the registration of the American Depositary Shares pursuant to the requirements of the Securities and Exchange Commission.
Securities registered or to be registered pursuant to Section 12(g) of the Act
None
(Title of Class)
Securities for which there is a reporting obligation pursuant to Section 15(d) of the Act
None
(Title of Class)
Indicate the number of outstanding shares of each of the issuer’s classes of capital
or common stock as of the close of the period covered by the Annual Report
893,540,813 ordinary shares of no par value
_______________________
Indicate by check mark if the registrant is a well-known seasoned issuer, as defined in Rule 405 of the Securities Act: Yes ☒ No ☐
If this report is an annual or transition report, indicate by check mark if the registrant is not required to file reports pursuant to Section 13 or 15(d) of the Securities Exchange Act of 1934 ☐ Yes
No ☒
Note—Checking the box above will not relieve any registrant required to file reports pursuant to Section 13 or 15(d) of the Securities Exchange Act of 1934 from their obligations under those
Sections.
Indicate by check mark whether the registrant (1) has filed all reports required to be filed by Section 13 or 15(d) of the Securities Exchange Act of 1934 during the preceding 12 months (or for
such shorter period that the registrant was required to file such reports), and (2) has been subject to such filing requirements for the past 90 days. ☒ Yes ☐ No
Indicate by check mark whether the registrant has submitted electronically every Interactive Data File required to be submitted pursuant to Rule 405 of Regulation S-T (§232.405 of this chapter)
during the preceding 12 months (or for such shorter period that the registrant was required to submit such files). ☒ Yes ☐ No
Indicate by check mark whether the registrant is a large accelerated filer, an accelerated filer, a non-accelerated filer, or an emerging growth company. See definition of “large accelerated filer,”
“accelerated filer,” and “emerging growth company” in Rule 12b-2 of the Exchange Act.
If an emerging growth company that prepares its financial statements in accordance with U.S. GAAP, indicate by check mark if the registrant has elected not to use the extended transition period
for complying with any new or revised financial accounting standards† provided pursuant to Section 13(a) of the Exchange Act. ☐
† The term “new or revised financial accounting standard” refers to any update issued by the Financial Accounting Standards Board to its Accounting Standards Codification after April 5, 2012.
Indicate by check mark whether the registrant has filed a report on and attestation to its management’s assessment of the effectiveness of its internal control over financial reporting under Section
404(b) of the Sarbanes-Oxley Act (15 U.S.C. 7262(b)) by the registered public accounting firm that prepared or issued its audit report. ☒
If securities are registered pursuant to Section 12(b) of the Act, indicate by check mark whether the financial statements of the registrant included in the filing reflect the correction of an error to
previously issued financial statement. ☐
Indicate by check mark whether any of those error corrections are restatements that required a recovery analysis of incentive-based compensation received by any of the registrant’s executive
officers during the relevant recovery period pursuant to §240.10D-1(b). ☐
Indicate by check mark which basis of accounting the registrant has used to prepare the financial statements included in this filing:
| | | | | | |
| | International Financial Reporting Standards | as issued by the International Accounting Standards Board | | | |
If “Other” has been checked in response to the previous question, indicate by check mark which financial statement item the registrant has elected to follow: Item 17 ☐ Item 18 ☐
If this is an annual report, indicate by check mark whether the registrant is a shell company (as defined in Rule 12b-2 of the Exchange Act). Yes ☐ No ☒
(APPLICABLE ONLY TO ISSUERS INVOLVED IN BANKRUPTCY PROCEEDINGS DURING THE PAST FIVE YEARS)
Indicate by check mark whether the registrant has filed all documents and reports required to be filed by Sections 12, 13 or 15(d) of the Securities Exchange Act of 1934 subsequent to the
distribution of securities under a plan confirmed by a court. Yes ☐ No ☐
Form 20-F Cross Reference Guide
| | | | | | |
| | | | Location in this document | |
| | | | | | |
| | Identity of directors, senior management and advisers | | | | |
| | Offer statistics and expected timetable | | | | |
| | | | | | |
| | (b)Capitalisation and indebtedness | | | | |
| | (c)Reasons for the offer and use of proceeds | | | | |
| | | | Further Information—Risk Factors | | |
| | Information on the Company | | | | |
| | (a)History and development of the Company | | Presentation of Financial and Other Information | | |
| | | | Further Information—Additional Information on the Company— Organisational Structure | | |
| | | | Annual Financial Report—Accounting Policies | | |
| | | | Further Information—Additional Information—Memorandum of Incorporation—General | | |
| | | | Integrated Annual Report—Administration and Corporate Information | | |
| | | | Integrated Annual Report—Our Business Model | | |
| | | | Integrated Annual Report—Chairperson’s Report | | |
| | | | Integrated Annual Report—Overview of Our Portfolio and Growth Strategy | | |
| | | | Annual Financial Report—Director’s Report—Significant Announcements in 2023 | | |
| | | | Annual Financial Report—Management’s Discussion and Analysis of Financial Statements—Overview | | |
| | | | Annual Financial Report—Management’s Discussion and Analysis of Financial Statements—Capital Expenditures | | |
| | | | Further Information—Description of Mining Business—Capital Expenditure | | |
| | | | Integrated Annual Report—Chief Executive Officer’s Report | | |
| | | | Further Information—Description of Mining Business—The Gold Mining Industry—Guidance for 2024 | | |
| | | | Further Information—Additional Information—Taxation— Documents on Display | | |
| | | | | | |
| | | | Further Information—Additional Information on the Company— Summary Disclosure of Mining Operations Pursuant to Item 1303 of Regulation S-K under the Securities Act | | |
| | | | Further Information—Additional Information on the Company— Individual Property Disclosure Pursuant to Item 1304 of Regulation S-K under the Securities Act | | |
| | | | Integrated Annual Report—Who We Are | | |
Form 20-F Cross Reference Guide continued
| | | | | | |
| | | | Location in this document | |
| | | | | | |
| | | | Integrated Annual Report—Chief Executive Officer’s Report | | |
| | | | Integrated Annual Report—Overview of Our Portfolio and Growth Strategy | | |
| | | | Integrated Annual Report—Production and Cost Performance | | |
| | | | Integrated Annual Report—Environmental Stewardship | | |
| | | | Integrated Annual Report—Summarised Governance Report | | |
| | | | Integrated Annual Report—Building a Safe and Respectful Workplace | | |
| | | | Integrated Annual Report—Governments | | |
| | | | Governance and Remuneration Report—Application of King IV within Gold Fields | | |
| | | | Annual Financial Report—Management’s Discussion and Analysis of the Financial Statements—Results for the period - years ended 31 December 2023 and 31 December 2022 | | |
| | | | Annual Financial Report—Management’s Discussion and Analysis of the Financial Statements—Results for the period - years ended 31 December 2022 and 31 December 2021 | | |
| | | | Annual Financial Report—Management’s Discussion and Analysis of the Financial Statements—Health and Safety Impact | | |
| | | | Annual Financial Report—Director’s Report—Environmental Obligations | | |
| | | | Annual Financial Report—Statement of Financial Position— Provision for Environmental Rehabilitation Costs | | |
| | | | Annual Financial Report—Accounting Policies—Basis for Preparation—Provision for Environmental Rehabilitation Costs | | |
| | | | Further Information—Description of Mining Business | | |
| | | | Further Information—Environmental and Regulatory Matters | | |
| | (c)Organisational structure | | Further Information—Additional Information on the Company— Organisational Structure | | |
| | (d)Property, plant and equipment | | Further Information—Additional Information on the Company— Summary Disclosure of Mining Operations Pursuant to Item 1303 of Regulation S-K under the Securities Act | | |
| | | | Further Information—Additional Information on the Company— Individual Property Disclosure Pursuant to Item 1304 of Regulation S-K under the Securities Act | | |
| | | | Further Information—Additional Information on the Company— Internal Controls Disclosure Pursuant to Item 1305 of Regulation S-K under the Securities Act | | |
| | | | Annual Financial Report—Management’s Discussion and Analysis of the Financial Statements | | |
| | | | Annual Financial Report—Accounting Policies—Property, Plant and Equipment | | |
| | | | Annual Financial Report—Notes to the Consolidated Financial Statements—Note 16. Property, Plant and Equipment | | |
Form 20-F Cross Reference Guide continued
| | | | | | |
| | | | Location in this document | |
| | | | | | |
| | | | Integrated Annual Report—Our Business Model | | |
| | | | Integrated Annual Report—Chief Executive Officer’s Report | | |
| | | | Further Information—Additional Information on the Company— Summary Disclosure of Mining Operations Pursuant to Item 1303 of Regulation S-K under the Securities Act—Summary of Mineral Resources and Reserves | | |
| | | | Integrated Annual Report—Environmental Stewardship | | |
| | | | Integrated Annual Report—Production and Cost Performance | | |
| | | | Integrated Annual Report—Overview of Our Portfolio and Growth Strategy | | |
| | | | Further Information—Environmental and Regulatory Matters | | |
| | Unresolved staff comments | | | | |
| | Operating and financial review and prospects | | | | |
| | | | Annual Financial Report—Management’s Discussion and Analysis of the Financial Statements | | |
| | | | Annual Financial Report—Accounting Policies—Foreign Operations | | |
| | | | Annual Financial Report—Notes to the Consolidated Financial Statements—Note 41. Risk Management Activities—Foreign Currency Sensitivity | | |
| | | | Annual Financial Report—Consolidated Statement of Comprehensive Income | | |
| | | | Integrated Annual Report—Our Operating Environment | | |
| | | | Integrated Annual Report—Governments | | |
| | | | Further Information—Environmental and Regulatory Matters | | |
| | (b)Liquidity and capital resources | | Annual Financial Report—Management’s Discussion and Analysis of the Financial Statements—Liquidity and Capital Resources— Years ended 31 December 2023 and 31 December 2022 | | |
| | | | Annual Financial Report—Management’s Discussion and Analysis of the Financial Statements—Liquidity and Capital Resources— Years ended 31 December 2022 and 31 December 2021 | | |
| | | | Annual Financial Report—Management’s Discussion and Analysis of the Financial Statements—Credit Facilities | | |
| | | | Annual Financial Report—Management’s Discussion and Analysis of the Financial Statements—Working Capital | | |
| | | | Annual Financial Report—Management’s Discussion and Analysis of the Financial Statements—Contractual Obligations, Commitments and Guarantees at 31 December 2023 | | |
| | | | Integrated Annual Report—Financial Performance | | |
| | | | Annual Financial Report—Notes to the Consolidated Financial Statements—Note 27. Borrowings | | |
| | | | Annual Financial Report—Notes to the Consolidated Financial Statements—Note 37. Commitments | | |
| | | | Annual Financial Report—Notes to the Consolidated Financial Statements—Note 40. Financial Instruments | | |
Form 20-F Cross Reference Guide continued
| | | | | | |
| | | | Location in this document | |
| | | | | | |
| | | | Annual Financial Report—Notes to the Consolidated Financial Statements—Note 41. Risk Management Activities | | |
| | | | Annual Financial Report—Notes to the Consolidated Financial Statements—Note 42. Capital Management | | |
| | (c)Research and development, patents and licences, etc. | | | | |
| | | | Annual Financial Report—Management’s Discussion and Analysis of the Financial Statements—Trend Outlook | | |
| | | | Integrated Annual Report—Our Operating Environment | | |
| | | | Integrated Annual Report—Chief Executive Officer’s Report | | |
| | (e)Off-balance sheet arrangements | | Annual Financial Report—Management’s Discussion and Analysis of the Financial Statements—Off-Balance Sheet Items | | |
| | (f)Tabular disclosure of contractual obligations | | Annual Financial Report—Management’s Discussion and Analysis of the Financial Statements—Contractual Obligations, Commitments and Guarantees at 31 December 2023 | | |
| | | | Forward-Looking Statements | | |
| | Directors, senior management and employees | | | | |
| | (a)Directors and senior management | | Governance and Remuneration Report—Our Board of Directors | | |
| | | | Integrated Annual Report—Our Board of Directors | | |
| | | | Further Information—Directors, Senior Management and Employees—Directors | | |
| | | | Further Information—Directors, Senior Management and Employees—Executive Committee | | |
| | | | Annual Financial Report—Directors’ Report | | |
| | | | Governance and Remuneration Report—Remuneration Report | | |
| | | | Annual Financial Report—Note 43. Related Parties | | |
| | | | Further Information—Directors, Senior Management and Employees | | |
| | | | Integrated Annual Report—Our Board of Directors | | |
| | | | Governance and Remuneration Report—Our Board of Directors | | |
| | | | Governance and Remuneration Report—Remuneration Report | | |
| | | | Governance and Remuneration Report—Board Committees | | |
| | | | Annual Financial Report—Audit Committee Report | | |
| | | | Governance and Remuneration Report—Application of King IV within Gold Fields | | |
Form 20-F Cross Reference Guide continued
| | | | | | |
| | | | Location in this document | |
| | | | | | |
| | | | Integrated Annual Report—Building a Safe and Respectful Workplace | | |
| | | | Integrated Annual Report—Where We Operate | | |
| | | | Integrated Annual Report—Summarised Governance Report | | |
| | | | Further Information—Directors, Senior Management and Employees—Employees | | |
| | | | Further Information—Directors, Senior Management and Employees—Safety | | |
| | | | Annual Financial Report—Management’s Discussion and Analysis of the Financial Statements—Labour Impact | | |
| | | | Annual Financial Report—Directors’ Report—Share Ownership of Directors and Executive Officers | | |
| | | | Governance and Remuneration Report—Remuneration Report | | |
| | | | Annual Financial Report—Notes to the Consolidated Financial Statements—Note 5. Share-based Payments | | |
| | Major Shareholders and Related Party Transactions | | | | |
| | | | Further Information—Major Shareholders and Related Party Transactions—Major Shareholders | | |
| | | | Annual Financial Report—Shareholders’ Information | | |
| | (b)Related party transactions | | Further Information— Major Shareholders and Related Party Transactions—Related Party Transactions | | |
| | | | Annual Financial Report—Notes to the Consolidated Financial Statements—Note 43. Related Parties | | |
| | (c)Interests of experts and counsel | | | | |
| | | | | | |
| | (a)Consolidated statements and other financial information | | Annual Financial Report—Management’s Discussion and Analysis of the Financial Statements | | |
| | | | Annual Financial Report—Consolidated Income Statement | | |
| | | | Annual Financial Report—Consolidated Statement of Comprehensive Income | | |
| | | | Annual Financial Report—Consolidated Statement of Financial Position | | |
| | | | Annual Financial Report—Consolidated Statement of Changes in Equity | | |
| | | | Annual Financial Report—Consolidated Statement of Cash Flows | | |
| | | | Annual Financial Report—Audit Committee Report | | |
| | | | Annual Financial Report—Accounting Policies—Basis of Preparation—Provision for Silicosis Settlement Costs | | |
| | | | Annual Financial Report—Accounting Policies—Basis of Preparation —Provision for Environmental Rehabilitation Costs | | |
| | | | Annual Financial Report—Notes to the Consolidated Financial Statements—Note 28. Provisions | | |
Form 20-F Cross Reference Guide continued
| | | | | | |
| | | | Location in this document | |
| | | | | | |
| | | | Annual Financial Report—Notes to the Consolidated Financial Statements—Note 38. Contingent Liabilities | | |
| | | | Annual Financial Report—Management’s Discussion and Analysis —Silicosis Settlement Costs Provision | | |
| | | | Annual Financial Report—Directors’ Report—Financial Affairs— Dividend Policy | | |
| | | | Integrated Annual Report—Financial Performance | | |
| | | | Annual Financial Report—Notes to the Consolidated Financial Statements—Note 39. Events After the Reporting Date | | |
| | | | | | |
| | | | Further Information—The Listing | | |
| | | | | | |
| | | | Integrated Annual Report—Where We Operate | | |
| | | | Annual Financial Report—Directors’ Report—Listings | | |
| | | | Annual Financial Report—Administration and Corporate Information | | |
| | | | | | |
| | | | | | |
| | | | | | |
| | | | | | |
| | | | | | |
| | (b)Memorandum and articles of association | | Further Information—Additional Information—Memorandum of Incorporation | | |
| | | | Further Information—Corporate Governance | | |
| | | | Governance and Remuneration Report—Our Governance Structure | | |
| | | | Further Information—Additional Information—Material Contracts | | |
| | | | Further Information—Additional Information—South African Exchange Control Limitations Affecting Security Holders | | |
| | | | Further Information—Additional Information—Taxation | | |
| | (f)Dividends and paying agents | | | | |
| | | | | | |
| | | | Further Information—Additional Information—Taxation— Documents On Display | | |
| | (i)Subsidiary information | | | | |
| | (j) Annual Report to Security Holders | | | | |
| | Quantitative and qualitative disclosures about market risk | | Annual Financial Report—Notes to the Consolidated Financial Statements—Note 41. Risk Management Activities | | |
| | Description of securities other than equity securities | | | | |
| | | | | | |
| | | | | | |
| | | | | | |
| | (d)American depositary shares | | Further Information—Additional Information—Material Contracts— Deposit Agreement | | |
Form 20-F Cross Reference Guide continued
| | | | | | |
| | | | Location in this document | |
| | | | | | |
| | Defaults, dividend arrearages and delinquencies | | | | |
| | Material modifications to the rights of security holders and use of proceeds | | | | |
| | | | Further Information—Controls and Procedures | | |
| | | | Annual Financial Report— Management’s Discussion and Analysis—Internal Control over Financial Reporting | | |
| | Audit Committee financial expert | | Further Information—Audit Committee Financial Expert | | |
| | | | Governance and Remuneration Report—Material Standards and Principles Guiding Our Governance | | |
| | Principal accountant fees and services | | Further Information—Principal Accountant Fees and Services | | |
| | Exemptions from the listing standards for audit committees | | | | |
| | Purchase of equity securities by the issuer and affiliated purchasers | | | | |
| | Change in registrant’s certifying accountant | | | | |
| | | | Further Information—Corporate Governance | | |
| | | | | | |
| | Disclosure regarding foreign jurisdictions that prevent inspections | | | | |
| | | | | | |
| | | | Annual Financial Report—Audit Committee Report—Information Communication and Technology Governance | | |
| | | | Annual Financial Report—Management’s Discussion and Analysis of the Financial Statements—Information and Communication and Technology (ICT) | | |
| | | | Governance and Remuneration Report—Application of King IV within Gold Fields | | |
| | | | | | |
| | | | Annual Financial Report—Report of Independent Registered Public Accounting Firm (PricewaterhouseCoopers, Inc., Johannesburg, South Africa, Audit Firm ID: 1308) | | |
| | | | Annual Financial Report—Consolidated Income Statement | | |
| | | | Annual Financial Report—Consolidated Statement of Comprehensive Income | | |
| | | | Annual Financial Report—Consolidated Statement of Financial Position | | |
| | | | Annual Financial Report—Consolidated Statement of Changes in Equity | | |
Form 20-F Cross Reference Guide continued
| | | | | | |
| | | | Location in this document | |
| | | | | | |
| | | | Annual Financial Report—Consolidated Statement of Cash Flows | | |
| | | | Annual Financial Report—Accounting Policies | | |
| | | | Annual Financial Report—Notes to the Consolidated Financial Statements | | |
| | | | | | |
Presentation of Financial and Other Information
Financial Information
Gold Fields Limited (Gold Fields or the Company) is a South African company and, in fiscal 2023, 45%, 13%, 32% and 10% of Gold
Fields’ operations, based on managed gold-equivalent production, were located in Australia, South Africa, Ghana (including the
Asanko JV (as defined below)) and Peru, respectively. The Gold Fields consolidated financial statements are presented in U.S. dollar
which is the Group’s presentation currency. The Group’s annual and interim financial statements are prepared in accordance with
IFRS Accounting Standards as issued by the International Accounting Standards Board (IASB), and as prescribed by law (refer to the
“Basis of preparation” section of the accounting policies to the consolidated financial statements).
Except as otherwise noted, the financial information included in this annual report has been prepared in accordance with IFRS
Accounting Standards as issued by the International Accounting Standards Board (IASB) and is presented in U.S. dollars, and for
descriptions of critical accounting policies, refer to accounting policies under IFRS Accounting Standards as issued by the
International Accounting Standards Board (IASB).
Rounding adjustments have been made in calculating some of the financial and operating information included in this annual report.
As a result, numerical figures shown as total amounts in some tables may not be exact arithmetic aggregations of the figures that
make up such total amounts.
For Gold Fields’ consolidated financial statements, unless otherwise stated, statement of financial position item amounts are
translated from Rand and A$ to U.S. dollars at the exchange rate prevailing on the statement of financial position date for fiscal
2023 (U.S.$0.68 per A$1.00 and Rand 18.30 per U.S.$1.00 as of 31 December 2023), except for specific items included within
shareholders’ equity and the statement of cash flows that are translated at the rate prevailing on the date the relevant transaction
was entered into, and income statement item amounts are translated from Rand and A$ to U.S. dollars at the weighted average
exchange rate for each period (U.S.$0.66 per A$1.00 and Rand 18.45 per U.S.$1.00 for fiscal 2023).
In this annual report, Gold Fields presents the financial items “all-in sustaining costs” (AISC), “all-in sustaining costs per ounce”, “all-in
costs” (AIC), and “all-in costs per ounce”, which have been determined using industry standards promulgated by the World Gold
Council (WGC) and are non-IFRS measures. An investor should not consider these items in isolation or as alternatives to cost of
sales, profit before tax, profit for the year, cash flows from operating activities or any other measure of financial performance
presented in accordance with IFRS Accounting Standards as issued by the International Accounting Standards Board (IASB). While
the WGC provided definitions for the calculation of AISC and AIC, the calculation of AISC, AISC per ounce, AIC and AIC per ounce
may vary significantly among gold mining companies, and by themselves do not necessarily provide a basis for comparison with
other gold mining companies. See “—Glossary of Terms—All-in sustaining costs” and “—Glossary of Terms—All-in costs”. For the
definitions and reconciliations of these non-IFRS measures to IFRS Accounting Standards as issued by the International Accounting
Standards Board (IASB), see “Annual Financial Report—Management’s Discussion and Analysis of the Financial Statements”.
Gold Fields also presents “adjusted free cash flow”, “net debt”, “adjusted EBITDA” and “normalised profit” in this annual report,
which are non-IFRS measures. An investor should not consider these items in isolation or as alternatives to cash flow from operating
activities, cash and cash equivalents or any other measure presented in accordance with IFRS Accounting Standards as issued by
the International Accounting Standards Board (IASB). Adjusted free cash flow is defined as net cash from operations less the South
Deep Dividend, net capital expenditure (additions to property, plant and equipment less proceeds on disposal of property, plant
and equipment), capital expenditure – working capital and Windfall capital contributions, contributions to environmental trust funds,
payments of principal lease liabilities and redemption of Asanko preference shares, as per the consolidated statement of cash
flows. Net debt (excluding lease liabilities) is defined as total borrowings less cash and cash equivalents. Net debt is defined as total
borrowings plus lease liabilities less cash and cash equivalents. Adjusted EBITDA is defined as profit or loss for the year adjusted
for interest, taxation, amortisation and depreciation and certain other costs. Normalised profit is defined as profit excluding gains
and losses on foreign exchange, financial instruments, non-recurring net realisable value adjustments to stockpiles and non-
recurring items after taxation and non-controlling interest effect. The definition for the calculation of adjusted free cash flow,
adjusted EBITDA and normalised profit may vary significantly between companies, and by themselves do not necessarily provide a
basis for comparison with other companies. See “—Glossary of Terms”. For the definitions and reconciliations of these non-IFRS
measures to IFRS Accounting Standards as issued by the International Accounting Standards Board (IASB), see “Annual Financial
Report—Management’s Discussion and Analysis of the Financial Statements”.
This annual report also contains data on Gold Fields’ Scope 1, 2 and 3 greenhouse gas emissions. Data for Scope 1 and 2 emissions
relate to Gold Fields’ own activities and supplied heat, power, and cooling which are measured using data from its own systems and
independently assured, as described in our 2023 Climate Change Report. Scope 3 emissions relate to other organisations’
emissions and are therefore subject to a range of uncertainties and challenges. At present Scope 3 data is not yet consistently
available in many value chains and is calculated, collected, or estimated in different ways. Gold Fields’ Scope 3 emissions data is
determined using the ISO 14064 part 1 standard. As value chain emissions data advances over time, Gold Fields expects to improve
the quality of its Scope 3 data and data reporting.
Presentation of Financial and Other Information continued
Operational Information
In this annual report, except where otherwise noted, all production and operating statistics are based on attribution of 100% of Gold
Fields’ total operations, which include production from the Damang and Tarkwa mines in Ghana and from the Cerro Corona mine in
Peru, a portion of which is attributable to the non-controlling shareholders in those mines. In addition, production and operating
statistics for Gruyere and Asanko (as defined below) are included on an attributable basis (based on Gold Fields’ 50% interest in
Gruyere and 45% interest in Asanko).
Market Information
This annual report includes industry data about Gold Fields’ markets obtained from industry surveys, industry publications, market
research and other publicly available third-party information. Industry surveys and industry publications generally state that the
information they contain has been obtained from sources believed to be reliable but that the accuracy and completeness of such
information is not guaranteed. Gold Fields and its advisers have not independently verified this data.
In addition, in many cases, statements in this annual report regarding the gold mining industry and Gold Fields’ position in that
industry have been made based on internal surveys, industry forecasts and market research, as well as Gold Fields’ own
experiences. While these statements are believed by Gold Fields to be reliable, they have not been independently verified.
Websites
References in this document to information on websites (and/or social media sites) are included as an aid to their location and such
information is not incorporated in, and does not form part of, this annual report on Form 20-F.
Glossary of Terms
The following explanations are not intended as technical definitions, but rather are intended to assist the reader in understanding
some of the terms used in this annual report. For additional terms, please see “Annual Financial Report—Glossary of Terms”.
“A$” and “Australian dollars” refer to Australian dollars.
“Adjusted EBITDA” is a non-IFRS measure which means profit or loss for the year adjusted for interest, taxation, amortisation and
depreciation and certain other costs. The definition of adjusted EBITDA is as defined in the U.S.$1,200 million sustainably linked
revolving credit facility agreement. For the calculation of adjusted EBITDA, refer to “Annual Financial Report—Notes to the
Consolidated Financial Statements—Note 42. Capital management”.
“Adjusted free cash flow” is defined as net cash from operations less the South Deep Dividend, net capital expenditure (additions
to property, plant and equipment less proceeds on disposal of property, plant and equipment), capital expenditure – working capital
and Windfall capital contributions, contributions to environmental trust funds, payment of principal lease liabilities and redemption
of Asanko preference shares, as per the consolidated statements of cash flows which is a non-IFRS measure. An investor should
not consider this item in isolation or as an alternative to cash flow from operating activities, cash and cash equivalents or any other
measure presented in accordance with IFRS Accounting Standards as issued by the International Accounting Standards Board
(IASB). The definition for the calculation of net cash flow may vary significantly between companies, and by itself does not
necessarily provide a basis for comparison with other companies. The following table sets out a reconciliation of Gold Fields’ “net
cash from operations” in accordance with IFRS Accounting Standards as issued by the International Accounting Standards Board
(IASB) (refer to the consolidated statement of cash flows) to “adjusted free cash flows”. For a reconciliation, see “Annual Financial
Report—Management’s Discussion and Analysis of the Financial Statements”.
| |
Net cash from operations(1) | |
| |
| |
Additions to property, plant and equipment(1) | |
Proceeds on disposal of property, plant and equipment(1) | |
Capital expenditure – working capital(1) | |
Capital expenditure – Windfall capital contributions(1) | |
Contributions to environmental trust funds(1) | |
Payment of principal lease liabilities | |
Redemption of Asanko preference shares(1) | |
| |
| |
| |
1. As per the consolidated statement of cash flows. |
“All-in costs” or “AIC” is a non-IFRS measure which means all-in sustaining costs plus additional costs relating to growth, including
non-sustaining capital expenditure and exploration, evaluation and feasibility costs not associated with current operations. For the
calculation of all-in costs, see “Annual Financial Report—Management’s Discussion and Analysis of the Financial Statements—
All-in Sustaining and All-in Costs”.
“All-in sustaining costs” or “AISC” is a non-IFRS measure which means operating costs excluding amortisation and depreciation,
plus all costs not included therein relating to sustaining current production including sustaining capital expenditure. For the
calculation of all-in sustaining costs, see “Annual Financial Report—Management’s Discussion and Analysis of the Financial
Statements—All-in Sustaining and All-in Costs”.
“Australia” means the Commonwealth of Australia.
“Ball mill” means a piece of machinery used to crush and grind ore which uses steel balls and the ore itself to achieve
comminution. The mill is shaped like a cylinder causing the grinding media and the ore itself to impact upon the ore.
“Brownfield” means exploration conducted in areas where mineral deposits have already previously been discovered and is also
termed near mine or extensional exploration.
“CAD” refers to Canadian dollars.
“Canada” means the Dominion of Canada.
“Carbon in Leach” or “CIL” is a metallurgical process whereby gold from milled ore is leached with sodium cyanide (NaCN) in order
to dissolve it into a pregnant leach solution; with this being undertaken simultaneously to the gold being recovered from the leach
solution through absorption onto carbon particles.
Glossary of Terms continued
“Chile” means the Republic of Chile.
“Cut-off grade” means the grade (i.e., the concentration of metal or mineral in rock) that determines the destination of the material
during mining. For purposes of establishing “prospects of economic extraction,” the cut-off grade is the grade that distinguishes
material deemed to have no economic value (it will not be mined in underground mining or if mined in surface mining, its destination
will be the waste dump) from material deemed to have economic value (its ultimate destination during mining will be a processing
facility). Other terms used in similar fashion as cut-off grade include net smelter return, pay limit, and break-even stripping ratio.
“Destress” means that by mining a five-metre high horizontal slice through the orebody package an optimal position is achieved to
create a destressed window. This window is created 50 to 60 metres above and below the associated horizon and provides the
necessary geotechnical stress conditions for safer extraction.
“Dilution” means low or zero grade (waste) material that is mined during the course of mining operations and forms part of the
Mineral Reserve.
“Dissolution” means the process whereby a metal is dissolved and becomes amenable to separation from the gangue material.
“DMRE” means the South African Department of Mineral Resources and Energy, the government body responsible for regulating
the mining industry in South Africa.
“Electrowinning” means the process of removing mineral from solution by the action of electric currents, known as electrolysis.
“EMR” means exclusive of mineral reserves.
“Exploration” means activities associated with ascertaining the existence, location, extent or quality of mineralisation, including
economic and technical evaluations of mineralisation.
“fiscal 2020” means the 12-month period ended 31 December 2020.
“fiscal 2021” means the 12-month period ended 31 December 2021.
“fiscal 2022” means the 12-month period ended 31 December 2022.
“fiscal 2023” means the 12-month period ended 31 December 2023.
“fiscal 2024” means the 12-month period ending 31 December 2024.
“fiscal 2025” means the 12-month period ending 31 December 2025.
“Gangue” means commercially valueless or waste material remaining after ore extraction from rock.
“GH” refers to Ghana Cedi.
“Ghana” means the Republic of Ghana.
“gold” means gold and gold equivalent ounces, unless otherwise specified or where the context suggests otherwise.
“gold equivalent ounces” means quantities of metals (such as copper) expressed as amounts of gold using the prevailing prices of
gold and the other metals. To calculate this, the accepted total value of the metal based on its weight and value is divided by the
accepted value of one troy ounce of gold.
“Gold Reserves” means the gold contained within “proven and probable Mineral Reserves” on the basis of recoverable material
(reported as mill delivered tonnes, head grade and ounces).
“Grinding” means reducing rock to the consistency of fine sand by crushing and abrading in a rotating steel grinding mill.
“Group” refers to Gold Fields Limited and its subsidiaries.
“Hypogene” means ore or mineral deposits formed by ascending fluids occurring deep below the earth’s surface, which tend to
form deposits of primary minerals, as opposed to supergene processes that occur at or near the surface, and tend to form
secondary minerals.
“IFRS” means the IFRS Accounting Standards as issued by the International Accounting Standards Board (IASB).
“In situ” means within unbroken rock or still in the ground.
“Indicated Mineral Resource” means that part of a Mineral Resource for which quantity and grade or quality are estimated on the
basis of adequate geological evidence and sampling. The level of geological certainty associated with an indicated Mineral
Resource is sufficient to allow a qualified person to apply modifying factors in sufficient detail to support mine planning and
evaluation of the economic viability of the deposit. Because an indicated Mineral Resource has a lower level of confidence than the
level of confidence of a Measured Mineral Resource, an Indicated Mineral Resource may only be converted to a Probable Mineral
Reserve.
Glossary of Terms continued
“Inferred Mineral Resource” means that part of a Mineral Resource for which quantity and grade or quality are estimated on the
basis of limited geological evidence and sampling. The level of geological uncertainty associated with an Inferred Mineral Resource
is too high to apply relevant technical and economic factors likely to influence the prospects of economic extraction in a manner
useful for evaluation of economic viability. Because an Inferred Mineral Resource has the lowest level of geological confidence of
all Mineral Resources, which prevents the application of the modifying factors in a manner useful for evaluation of economic viability,
an Inferred Mineral Resource may not be considered when assessing the economic viability of a mining project, and may not be
converted to a Mineral Reserve.
“Kriging” means a geostatistical estimation technique used in the evaluation of Mineral Reserves.
“Leaching” means dissolution of gold from the crushed and milled material, including reclaimed slime, for adsorption and
concentration onto the activated carbon.
“Level” means the horizontal tunnels of an underground mine used to access the workings or ore body.
“Life of mine”, or “LOM” means the expected remaining years of production, based on production schedules and proven and
probable Mineral Reserves.
“Life of mine plan”, or “LOM plan” means a design and financial/economic study of an existing operation in which appropriate
assessments have been made of existing geological, mining, metallurgical, economic, marketing, legal, environmental, social,
governmental, engineering, operational and all other modifying factors, which are considered in sufficient detail to demonstrate that
continued extraction is reasonably justified. This is completed to a minimum pre-feasibility level of study.
“London afternoon fixing price” means the afternoon fixing by the new electronic London Bullion Market Association, or LBMA
price-discovery process. The price continues to be set twice daily, at 10:30 and 15:00 London time.
“lost time injury” or “LTI” means a work-related injury resulting in the employee or contractor being unable to attend work for
a period of one or more days after the day of the injury (i.e., the employee or contractor is unable to perform any of his/her duties).
“Mark-to-market” means the current fair value of a derivative based on current market prices, or to calculate the current fair value
of a derivative based on current market prices, as the case may be.
“Measured Mineral Resource” means that part of a Mineral Resource for which quantity and grade or quality are estimated on the
basis of conclusive geological evidence and sampling. The level of geological certainty associated with a Measured Mineral
Resource is sufficient to allow a qualified person to apply modifying factors, as defined in this section, in sufficient detail to support
detailed mine planning and final evaluation of the economic viability of the deposit. Because a Measured Mineral Resource has
a higher level of confidence than the level of confidence of either an Indicated Mineral Resource or an Inferred Mineral Resource,
a Measured Mineral Resource may be converted to a Proven Mineral Reserve or to a Probable Mineral Reserve.
“Measures” means conversion factors from metric units to U.S. units are provided below.
| | |
| | |
| | |
| | |
| | |
| | |
| | 0.02917 ounces per short ton |
| | |
1 kilogram per tonne (1 kg/t) | | 29.16642 ounces per short ton |
| | |
| | |
| | |
| | |
| | |
“Metallurgical plant” means a processing plant used to treat ore and extract the contained minerals.
“Metallurgical recovery factor” means the proportion of metal in the ore delivered to the mill that is recovered by the metallurgical
process or processes.
“Metallurgy” means, in the context of this document, the science of extracting metals from ores and preparing them for sale.
“Mill delivered tonnes” means a quantity, expressed in tonnes, of ore delivered to the metallurgical plant.
Glossary of Terms continued
“Mine Call Factor” means the ratio, expressed as a percentage, of the specific product accounted for at the mill (including residue),
compared to the corresponding specific product ‘called for’ based on an operation’s measuring and valuation methods.
“Mineralisation” means the presence of a target mineral in a mass of host rock. A concentration (or occurrence) of material of
possible economic interest, in or on the earth’s crust, for which quantity and quality cannot be estimated with sufficient confidence
to be defined as a Mineral Resource. Mineralisation is not classified as a Mineral Resource or Mineral Reserve and can only be
reported under exploration results. The data and information relating to it must be sufficient to allow a considered and balanced
judgement of its significance and the process or processes by which a mineral or minerals are introduced into rock, resulting in
a potentially valuable deposit. Mineralisation generally incorporates various terms, including fissure filling, impregnation and
replacement, among others.
“Mineral Reserve” means an estimate of tonnage and grade or quality of Indicated and Measured Mineral Resources that, in the
opinion of the qualified person, can be the basis of an economically viable project. More specifically, it is the economically mineable
part of a Measured or Indicated Mineral Resource, which includes diluting materials and allowances for losses that may occur when
the material is mined or extracted.
“Mineral Resource” means a concentration or occurrence of material of economic interest in or on the Earth's crust in such form,
grade or quality, and quantity that there are reasonable prospects for economic extraction. A Mineral Resource is a reasonable
estimate of mineralisation, taking into account relevant factors such as cut-off grade, likely mining dimensions, location or continuity,
that, with the assumed and justifiable technical and economic conditions, is likely to, in whole or in part, become economically
extractable. It is not merely an inventory of all mineralisation drilled or sampled.
“medically treated injury” or “MTI” means a work-related injury sustained by an employee or contractor which does not
incapacitate that employee and who, after having received medical treatment, is deemed fit to immediately resume his/her normal
duties on the next calendar day, immediately following the treatment or re-treatment.
“Mpa” means a unit measurement of stress or pressure within the earth’s crust used to profile tectonic stress, which can impact
ground stability and ground support requirements in underground mining.
“Net debt” is a non-IFRS measure which means total borrowings and lease liabilities less cash and cash equivalents.
“Net debt (excluding lease liabilities)” is a non-IFRS measure which means total borrowings less cash and cash equivalents.
“Net smelter return”, or “NSR” means the volume of refined mineral sold during the relevant period multiplied by the average spot
mineral price and the average exchange rate for the period, less refining, transport and insurance costs.
“Normalised profit” is a non-IFRS measure which means profit excluding gains and losses on foreign exchange, financial
instruments, non-recurring net realisable value adjustments to stockpiles and non-recurring items after taxation and non-controlling
interest effect.
“Open pit” means mining where the ore is extracted from a surface mining operation or “pit”. The geometry of the pit may vary with
the characteristics of the ore body.
“Ore” means a mixture of material containing minerals from which at least one of the minerals can be mined and processed
profitably.
“Ore body” means a well-defined mass of material of sufficient mineral content to make extraction economically viable.
“Ore grade” means the average amount of mineral contained in a tonne of mineral-bearing ore expressed in grams per tonne,
or per cent. per tonne.
“Ounce” means one troy ounce, which equals 31.1035 grams.
“Overburden” means the soil and rock that must be removed in order to expose an ore body.
“Paste filling”, or “backfill” means a technique whereby cemented paste fill is placed in mined-out voids to improve and maintain
ground stability, minimise waste dilution and maximise extraction of the ore.
“Peru” means the Republic of Peru.
“Philippines” means the Republic of the Philippines.
“Porphyry” means an igneous rock of any composition that contains larger, well-formed mineral grains in a finer-grained
groundmass.
“Probable Mineral Reserve” means the economically mineable part of an Indicated and, in some cases, a Measured Mineral
Resource.
Glossary of Terms continued
“Production stockpile” means the selective accumulation of unprocessed ore which is actively managed as part of the current
mining and processing operations. Material resulting from mining or processing operations.
“Prospect” means to investigate a site with insufficient data available on mineralisation to determine if minerals are economically
recoverable.
“Prospecting right” means permission to explore an area for minerals.
“Proven Mineral Reserve” means the economically mineable part of a Measured Mineral Resource and can only result from a
conversion of a Measured Mineral Resource.
“R” and “Rand” refer to the South African Rand.
“Refining” means the final stage of metal production in which final impurities are removed from the molten metal by introducing air
and fluxes. The impurities are removed as gases or slag.
“Rehabilitation” means the process of restoring mined land to a condition approximating its original state.
“restricted work injury” or “RWI” means a work-related injury sustained by an employee or contractor which results in the
employee or contractor being unable to perform one or more of their routine functions for a full working day from the day after the
injury occurred, but the employee or contractor can still perform some of his/her duties.
“Rock dump” means the historical accumulation of waste or low grade material derived in the course of mining which could be
processed in order to take advantage of spare processing capacity.
“Run of Mine”, or “ROM” when used with regard to grade, is a term to describe the average grade of the ore mined.
“S/.” refers to the Peruvian Nuevo Sol.
“Sampling” means taking small pieces of rock at intervals in a representative manner along exposed mineralisation for assay
(to determine the mineral content).
“Seismicity” means a sudden movement within a given volume of rock that radiates detectable seismic waves. The amplitude and
frequency of seismic waves radiated from such a source depend, in general, on the strength and state of stress of the rock, the size
of the source of seismic radiation and the magnitude and the rate at which the rock moves during the fracturing process.
“Semi-autogenous grinding”, or “SAG mill” means a piece of machinery used to crush and grind ore which uses the ore itself to
achieve comminution. The mill is shaped like a cylinder causing the ore to impact upon itself.
“Shotcrete” means a sprayed concrete or specialist cement type product applied through a hose or similar device and
pneumatically projected at high velocity on the surface of excavations, as a geotechnical ground support technique to reinforce the
stability of underground faces.
“Slimes” means the finer fraction or tailings discharged from a processing plant after the valuable minerals have been recovered.
Also see ‘Tailings’.
“Slurry” means a fluid comprising fine solids suspended in a solution (generally water containing additives).
“Smelting” means thermal processing whereby mineral is liberated from molten beneficiated ore or concentrate, with impurities
separating as lighter slag.
“South Africa” means the Republic of South Africa.
“South Deep Dividend” means the dividend paid by South Deep to its indirect 10% outside shareholders held pursuant to its black
economic empowerment transaction, as set out in the consolidated statement of cash flows.
“Spot price” means the current price of a metal for immediate delivery.
“Stockpile” means a store of unprocessed ore, which is material resulting from mining or processing operations.
“Stope” means the underground excavation within the ore body where the main mineral production takes place.
“Stratigraphic” means the study of rock layers (strata) and layering (stratification) and is primarily used in the study of sedimentary
and layered volcanic rocks. Stratigraphic modelling is often important in profiling the regional and local geology that has played a
controlling role in mineralisation and ore body generation.
“Stripping” means the process of removing overburden (waste material) to expose the ore for mining.
“Sulphide” means a mineral characterised by the linkages of sulphur with a metal or semi-metal, such as pyrite (iron sulphide); also
a zone in which sulphide minerals occur.
Glossary of Terms continued
“Supergene” means ores or ore minerals formed where descending surface water oxidises the primary (hypogene) mineralised
rock and redistributes the ore minerals, often concentrating them in zones. Supergene enrichment occurs at the base of the
oxidised portion of the ore deposit.
“Tailings” means finely ground rock from which the bulk of valuable minerals have been extracted by metallurgical processes. Also
see ‘Slimes’.
“Tailings storage facility” or “TSF” typically means a dam used to store by-products or tailing from mining operations after
separating the ore from the gangue.
“Tonne” means one tonne and is equal to 1,000 kilograms (also known as a “metric” tonne).
“Tonnage” means the quantity of material where the tonne is an appropriate unit of measure. Typically used to measure Mineral
Reserves of mineral-bearing material, or quantities of ore and waste material mined, transported or milled.
“TRIFR” means the total recordable injury frequency rate at each Gold Fields operation. This includes the total number of fatalities,
LTI, MTI and RWI per million man hours.
“United States” or “U.S.” means United States of America, its territories and possessions and any state of the United States and the
District of Columbia.
“U.S. cents” refers to subunits of the U.S. dollar.
“$”, “U.S.$” and “U.S. dollars” refer to United States dollars.
“Waste” means rock mined with an insufficient mineral content to justify processing.
“Waste storage facility” or “WSF” typically means an area where waste rock is stored until such time as it can be processed,
reclaimed or rehabilitated.
“Yield” means the actual grade of ore realised after the mining and metallurgical treatment process.
Forward-looking statements
This annual report contains forward-looking statements within the meaning of Section 27A of the U.S. Securities Act of 1933 (the
Securities Act) and Section 21E of the U.S. Securities Exchange Act of 1934 (the Exchange Act) with respect to Gold Fields’ financial
condition, results of operations, business strategies, operating efficiencies, competitive position, growth opportunities for existing
services, plans and objectives of management, markets for stock and other matters.
These forward-looking statements, including, among others, those relating to the future business prospects, revenues, income and
2024 production and operational guidance of Gold Fields, wherever they may occur in this annual report and the exhibits to the
annual report, and including any climate change-related statements, targets and metrics, are necessarily estimates reflecting the
best judgement of the senior management of Gold Fields and involve a number of risks and uncertainties that could cause actual
results to differ materially from those suggested by the forward-looking statements. As a consequence, these forward-looking
statements should be considered in light of various important factors, including those set forth in this annual report. All statements
other than statements of historical facts included in this report may be forward-looking statements. Forward-looking statements also
often use words such as “will”, “forecast”, “potential”, “estimate”, “expect” and words of similar meaning. By their nature, forward-
looking statements involve risk and uncertainty because they relate to future events and circumstances and should be considered
in light of various important factors, including those set forth in this disclaimer. Readers are cautioned not to place undue reliance on
such statements. Important factors that could cause actual results to differ materially from estimates or projections contained in the
forward-looking statements include, without limitation:
•changes in the market price of gold, and to a lesser extent copper and silver;
•material changes in the value of the Australian dollar, Rand and non-U.S. dollar currencies;
•high and rising inflation, supply chain issues, volatile commodity costs and other inflationary pressures;
•difficulties, operational delays, cost pressures and impacts associated with the mine ramp-up at the Salares Norte operation in
Chile and the South Deep operation in South Africa;
•the challenges associated with replacing annual Mineral Reserve and Mineral Resource depletion, as well as growing the Mineral
Reserve and Mineral Resource base to extend the life of operations;
•the ability to achieve anticipated efficiencies and other cost savings in connection with its existing asset base, as well as past and
future acquisitions, combinations or joint ventures;
•the success of the Group’s business strategy, development activities and other initiatives, particularly at the Salares Norte project;
•changes in technical and economic assumptions underlying Gold Fields’ Mineral Resource and Mineral Reserve estimates;
•supply chain shortages and increases in the prices of production inputs;
•power cost increases, as well as unreliability of power supply, power deficits, potential total power failure in South Africa,
fluctuations and usage constraints;
•current debt levels posing a risk to viability and making the Group more vulnerable to adverse economic and competitive
conditions;
•the ability of the Group to protect its information technology and communication systems and the personal data it retains, as well
as the failure of such systems;
•the ability of the Group to protect its existing and future operational technology systems, as well as the failure of such systems;
•geotechnical challenges due to the ageing of certain mines and a trend toward mining deeper pits and more complex, often
deeper underground deposits;
•the continued status of South Africa’s credit rating as non-investment grade and its impact on Gold Fields’ ability to secure
financing;
•the inability to modernise operations and remain competitive within the mining industry;
•reliance on outside contractors to develop projects, conduct mining and other core activities at some of its operations;
•difficulty controlling theft of gold and copper bearing materials and illegal and artisanal mining on some Gold Fields properties;
•the impact of occupational diseases;
•the ability of the Group to comply with expectations that it provides benefits to affected communities;
•the effect of relevant government regulations, particularly labour, environmental, tax, royalty, health and safety, water, regulations
and potential new legislation affecting mining and mineral rights;
•court decisions affecting the South African mining industry, including, without limitation, regarding the interpretation of mineral
rights legislation and the treatment of health and safety claims;
•changes in health and safety regulations that could lead to claims or liability for regulatory breaches;
•the occurrence of operational disruptions such as stoppages related to environmental and industrial accidents and pollution
incidents;
•increasing regulation of environmental and sustainability matters such as greenhouse gas emissions and climate change, and the
impact of climate change on Gold Fields’ operations;
•the ability of the Group to meet its environmental, social and corporate governance targets or disclosure requirements;
•the ability to appoint, hire or retain qualified Board members, senior leadership and sufficiently skilled employees or attain
sufficient representation among marginalised or underrepresented persons in management positions or sufficient gender
diversity in senior management and Board level positions;
•discrimination or harassment preventing our employees from performing their roles;
•the ability to obtain, renew and comply with, water use licences and water quality discharge standards, or to otherwise source the
sufficient volumes and quality of water required to sustain its operations;
•the occurrence of future acid mine drainage related pollution;
Forward-looking statements continued
•economic, political or social instability in the countries where Gold Fields operates;
•ageing infrastructure, unplanned breakdowns and stoppages that may delay production, increase costs and industrial accidents;
•the effects of regional cessation of dewatering at South Deep;
•the effects of a failure of a tailings storage facility and the closure of adjacent mines;
•the costs and burdens associated with tenements in Australia which are subject to native title claims, including any compensation
payable to native title holders;
•actual or alleged breach or breaches of law or applicable governance processes, fraud, bribery, corruption or money-laundering
at Gold Fields’ operations that leads to censure, penalties or negative reputational impacts;
•the occurrence of labour disruptions and industrial actions;
•fluctuations in insurance cost, market conditions and availability and the adequacy of the Group’s insurance coverage;
•financial flexibility could be limited by South African exchange control regulations;
•difficulty with participating in future issues of securities, or in bringing an action against Gold Fields, for shareholders outside
South Africa;
•liquidity risks in trading ordinary shares on JSE Limited;
•Gold Fields’ ability to pay dividends or make similar payments to its shareholders; and
•shareholders’ equity interests in Gold Fields becoming diluted upon the exercise of outstanding share options.
These forward-looking statements speak only as of the date they are made. Gold Fields undertakes no obligation to update publicly
or release any revisions to these forward-looking statements to reflect events or circumstances after the date of this annual report
or to reflect the occurrence of unanticipated events.
Table of contents
| |
| |
| |
FORM 20-F CROSS REFERENCE GUIDE | |
PRESENTATION OF FINANCIAL AND OTHER INFORMATION | |
| |
FORWARD-LOOKING STATEMENTS | |
| |
| |
GOVERNANCE AND REMUNERATION REPORT | |
| |
| |
| |
| |
ADDITIONAL INFORMATION ON THE COMPANY | |
DESCRIPTION OF MINING BUSINESS | |
ENVIRONMENTAL AND REGULATORY MATTERS | |
DIRECTORS, SENIOR MANAGEMENT AND EMPLOYEES | |
MAJOR SHAREHOLDERS AND RELATED PARTY TRANSACTIONS | |
| |
| |
| |
AUDIT COMMITTEE FINANCIAL EXPERT | |
PRINCIPAL ACCOUNTANT FEES AND SERVICES | |
| |
| |
| |
Gold Fields Limited Integrated Annual Report 2023 Gold Fields IAR-1
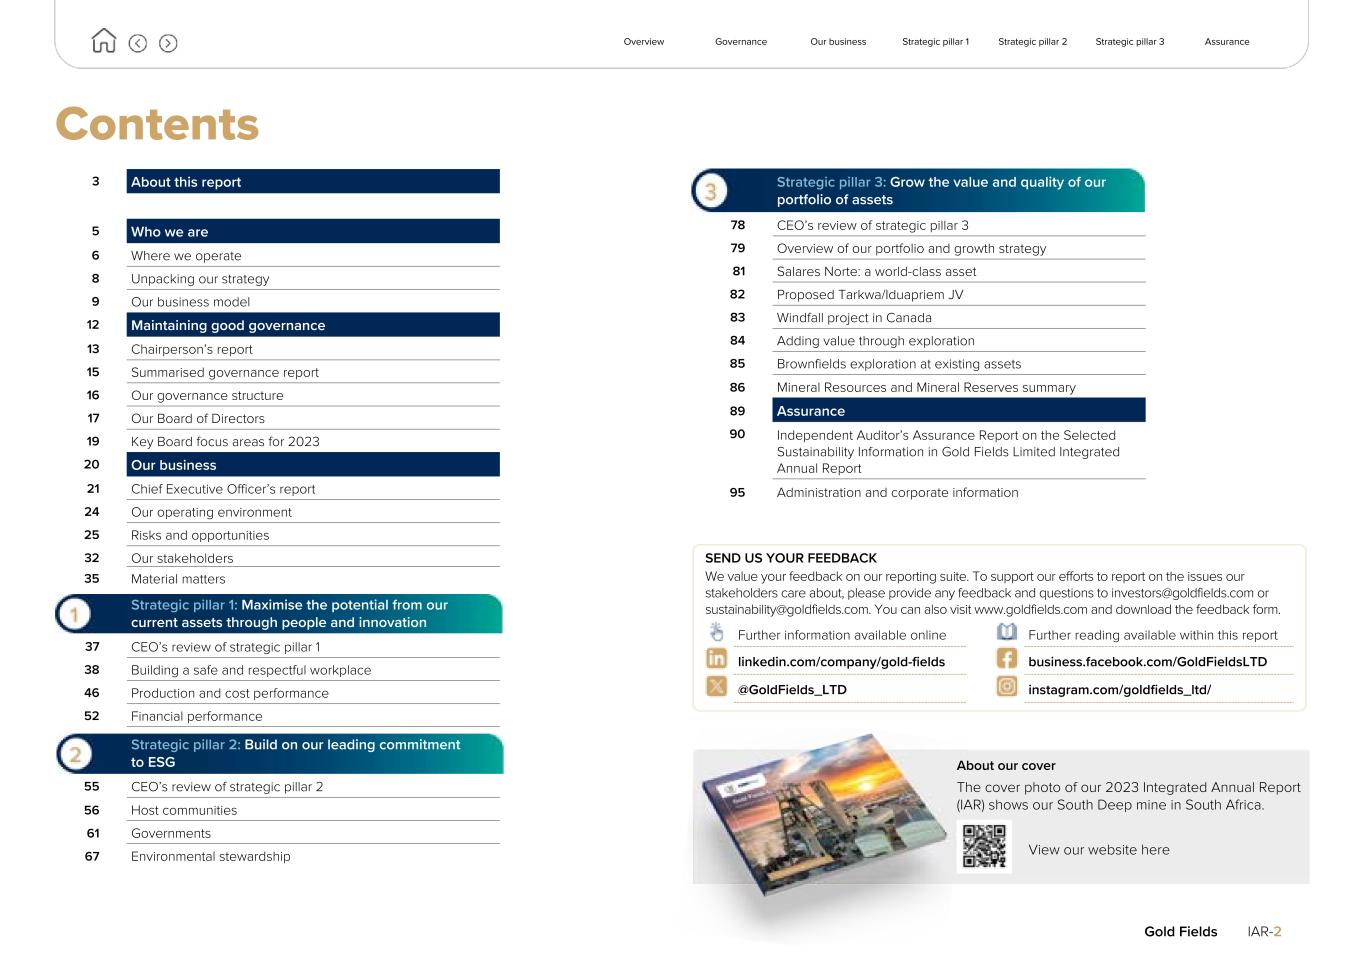
Contents 3 About this report 5 Who we are 6 Where we operate 8 Unpacking our strategy 9 Our business model 12 Maintaining good governance 13 Chairperson’s report 15 Summarised governance report 16 Our governance structure 17 Our Board of Directors 19 Key Board focus areas for 2023 20 Our business 21 Chief Executive Officer’s report 24 Our operating environment 25 Risks and opportunities 32 Our stakeholders 35 Material matters Strategic pillar 1: Maximise the potential from our current assets through people and innovation 37 CEO’s review of strategic pillar 1 38 Building a safe and respectful workplace 46 Production and cost performance 52 Financial performance Strategic pillar 2: Build on our leading commitment to ESG 55 CEO’s review of strategic pillar 2 56 Host communities 61 Governments 67 Environmental stewardship Strategic pillar 3: Grow the value and quality of our portfolio of assets 78 CEO’s review of strategic pillar 3 79 Overview of our portfolio and growth strategy 81 Salares Norte: a world-class asset 82 Proposed Tarkwa/Iduapriem JV 83 Windfall project in Canada 84 Adding value through exploration 85 Brownfields exploration at existing assets 86 Mineral Resources and Mineral Reserves summary 89 Assurance 90 Independent Auditor’s Assurance Report on the Selected Sustainability Information in Gold Fields Limited Integrated Annual Report 95 Administration and corporate information SEND US YOUR FEEDBACK We value your feedback on our reporting suite. To support our efforts to report on the issues our stakeholders care about, please provide any feedback and questions to investors@goldfields.com or sustainability@goldfields.com. You can also visit www.goldfields.com and download the feedback form. Further information available online Further reading available within this report linkedin.com/company/gold-fields business.facebook.com/GoldFieldsLTD @GoldFields_LTD instagram.com/goldfields_ltd/ About our cover The cover photo of our 2023 Integrated Annual Report (IAR) shows our South Deep mine in South Africa. View our website here Overview Governance Our business Strategic pillar 1 Strategic pillar 2 Strategic pillar 3 Assurance Gold Fields IAR-2
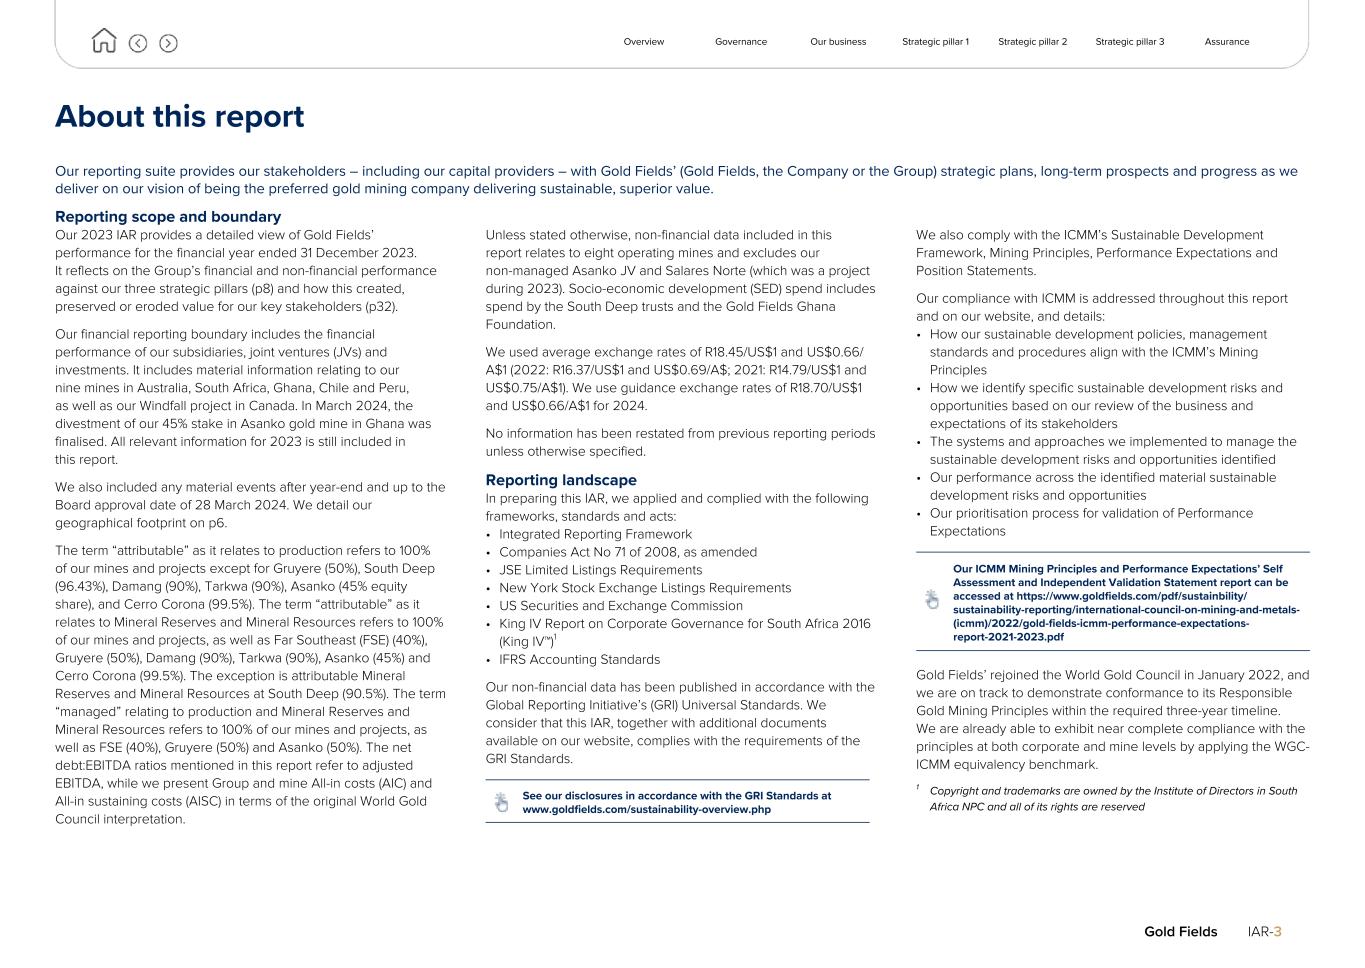
About this report Our reporting suite provides our stakeholders – including our capital providers – with Gold Fields’ (Gold Fields, the Company or the Group) strategic plans, long-term prospects and progress as we deliver on our vision of being the preferred gold mining company delivering sustainable, superior value. Reporting scope and boundary Our 2023 IAR provides a detailed view of Gold Fields’ performance for the financial year ended 31 December 2023. It reflects on the Group’s financial and non-financial performance against our three strategic pillars (p8) and how this created, preserved or eroded value for our key stakeholders (p32). Our financial reporting boundary includes the financial performance of our subsidiaries, joint ventures (JVs) and investments. It includes material information relating to our nine mines in Australia, South Africa, Ghana, Chile and Peru, as well as our Windfall project in Canada. In March 2024, the divestment of our 45% stake in Asanko gold mine in Ghana was finalised. All relevant information for 2023 is still included in this report. We also included any material events after year-end and up to the Board approval date of 28 March 2024. We detail our geographical footprint on p6. The term “attributable” as it relates to production refers to 100% of our mines and projects except for Gruyere (50%), South Deep (96.43%), Damang (90%), Tarkwa (90%), Asanko (45% equity share), and Cerro Corona (99.5%). The term “attributable” as it relates to Mineral Reserves and Mineral Resources refers to 100% of our mines and projects, as well as Far Southeast (FSE) (40%), Gruyere (50%), Damang (90%), Tarkwa (90%), Asanko (45%) and Cerro Corona (99.5%). The exception is attributable Mineral Reserves and Mineral Resources at South Deep (90.5%). The term “managed” relating to production and Mineral Reserves and Mineral Resources refers to 100% of our mines and projects, as well as FSE (40%), Gruyere (50%) and Asanko (50%). The net debt:EBITDA ratios mentioned in this report refer to adjusted EBITDA, while we present Group and mine All-in costs (AIC) and All-in sustaining costs (AISC) in terms of the original World Gold Council interpretation. Unless stated otherwise, non-financial data included in this report relates to eight operating mines and excludes our non-managed Asanko JV and Salares Norte (which was a project during 2023). Socio-economic development (SED) spend includes spend by the South Deep trusts and the Gold Fields Ghana Foundation. We used average exchange rates of R18.45/US$1 and US$0.66/ A$1 (2022: R16.37/US$1 and US$0.69/A$; 2021: R14.79/US$1 and US$0.75/A$1). We use guidance exchange rates of R18.70/US$1 and US$0.66/A$1 for 2024. No information has been restated from previous reporting periods unless otherwise specified. Reporting landscape In preparing this IAR, we applied and complied with the following frameworks, standards and acts: • Integrated Reporting Framework • Companies Act No 71 of 2008, as amended • JSE Limited Listings Requirements • New York Stock Exchange Listings Requirements • US Securities and Exchange Commission • King IV Report on Corporate Governance for South Africa 2016 (King IV™)1 • IFRS Accounting Standards Our non-financial data has been published in accordance with the Global Reporting Initiative’s (GRI) Universal Standards. We consider that this IAR, together with additional documents available on our website, complies with the requirements of the GRI Standards. See our disclosures in accordance with the GRI Standards at www.goldfields.com/sustainability-overview.php We also comply with the ICMM’s Sustainable Development Framework, Mining Principles, Performance Expectations and Position Statements. Our compliance with ICMM is addressed throughout this report and on our website, and details: • How our sustainable development policies, management standards and procedures align with the ICMM’s Mining Principles • How we identify specific sustainable development risks and opportunities based on our review of the business and expectations of its stakeholders • The systems and approaches we implemented to manage the sustainable development risks and opportunities identified • Our performance across the identified material sustainable development risks and opportunities • Our prioritisation process for validation of Performance Expectations Our ICMM Mining Principles and Performance Expectations’ Self Assessment and Independent Validation Statement report can be accessed at https://www.goldfields.com/pdf/sustainbility/ sustainability-reporting/international-council-on-mining-and-metals- (icmm)/2022/gold-fields-icmm-performance-expectations- report-2021-2023.pdf Gold Fields’ rejoined the World Gold Council in January 2022, and we are on track to demonstrate conformance to its Responsible Gold Mining Principles within the required three-year timeline. We are already able to exhibit near complete compliance with the principles at both corporate and mine levels by applying the WGC- ICMM equivalency benchmark. 1 Copyright and trademarks are owned by the Institute of Directors in South Africa NPC and all of its rights are reserved Overview Governance Our business Strategic pillar 1 Strategic pillar 2 Strategic pillar 3 Assurance Gold Fields IAR-3
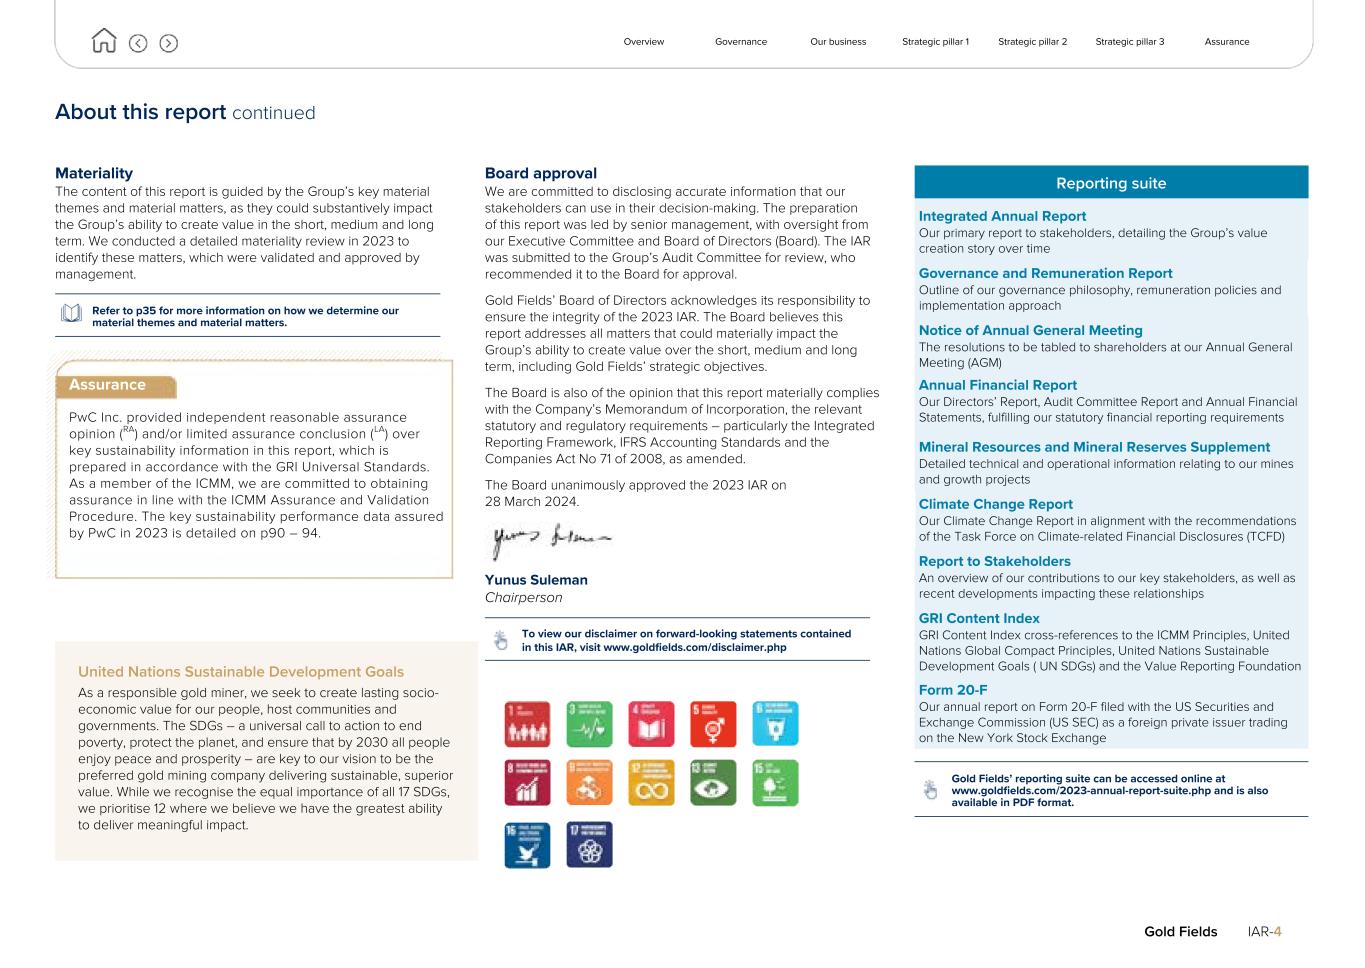
About this report continued Materiality The content of this report is guided by the Group’s key material themes and material matters, as they could substantively impact the Group’s ability to create value in the short, medium and long term. We conducted a detailed materiality review in 2023 to identify these matters, which were validated and approved by management. Refer to p35 for more information on how we determine our material themes and material matters. Assurance PwC Inc. provided independent reasonable assurance opinion (RA) and/or limited assurance conclusion (LA) over key sustainability information in this report, which is prepared in accordance with the GRI Universal Standards. As a member of the ICMM, we are committed to obtaining assurance in line with the ICMM Assurance and Validation Procedure. The key sustainability performance data assured by PwC in 2023 is detailed on p90 – 94. Board approval We are committed to disclosing accurate information that our stakeholders can use in their decision-making. The preparation of this report was led by senior management, with oversight from our Executive Committee and Board of Directors (Board). The IAR was submitted to the Group’s Audit Committee for review, who recommended it to the Board for approval. Gold Fields’ Board of Directors acknowledges its responsibility to ensure the integrity of the 2023 IAR. The Board believes this report addresses all matters that could materially impact the Group’s ability to create value over the short, medium and long term, including Gold Fields’ strategic objectives. The Board is also of the opinion that this report materially complies with the Company’s Memorandum of Incorporation, the relevant statutory and regulatory requirements – particularly the Integrated Reporting Framework, IFRS Accounting Standards and the Companies Act No 71 of 2008, as amended. The Board unanimously approved the 2023 IAR on 28 March 2024. Yunus Suleman Chairperson To view our disclaimer on forward-looking statements contained in this IAR, visit www.goldfields.com/disclaimer.php Reporting suite Integrated Annual Report Our primary report to stakeholders, detailing the Group’s value creation story over time Governance and Remuneration Report Outline of our governance philosophy, remuneration policies and implementation approach Notice of Annual General Meeting The resolutions to be tabled to shareholders at our Annual General Meeting (AGM) Annual Financial Report Our Directors’ Report, Audit Committee Report and Annual Financial Statements, fulfilling our statutory financial reporting requirements Mineral Resources and Mineral Reserves Supplement Detailed technical and operational information relating to our mines and growth projects Climate Change Report Our Climate Change Report in alignment with the recommendations of the Task Force on Climate-related Financial Disclosures (TCFD) Report to Stakeholders An overview of our contributions to our key stakeholders, as well as recent developments impacting these relationships GRI Content Index GRI Content Index cross-references to the ICMM Principles, United Nations Global Compact Principles, United Nations Sustainable Development Goals ( UN SDGs) and the Value Reporting Foundation Form 20-F Our annual report on Form 20-F filed with the US Securities and Exchange Commission (US SEC) as a foreign private issuer trading on the New York Stock Exchange Gold Fields’ reporting suite can be accessed online at www.goldfields.com/2023-annual-report-suite.php and is also available in PDF format. Overview Governance Our business Strategic pillar 1 Strategic pillar 2 Strategic pillar 3 Assurance Gold Fields IAR-4 United Nations Sustainable Development Goals As a responsible gold miner, we seek to create lasting socio- economic value for our people, host communities and governments. The SDGs – a universal call to action to end poverty, protect the planet, and ensure that by 2030 all people enjoy peace and prosperity – are key to our vision to be the preferred gold mining company delivering sustainable, superior value. While we recognise the equal importance of all 17 SDGs, we prioritise 12 where we believe we have the greatest ability to deliver meaningful impact.
Overview Governance Our business Strategic pillar 1 Strategic pillar 2 Strategic pillar 3 Assurance Gold Fields IAR-5 Who we are IN THIS SECTION 6 Where we operate ¢ 8 Unpacking our strategy ¢ 9 Our business model ¢ The underground pit at our Granny Smith mine in Western Australia
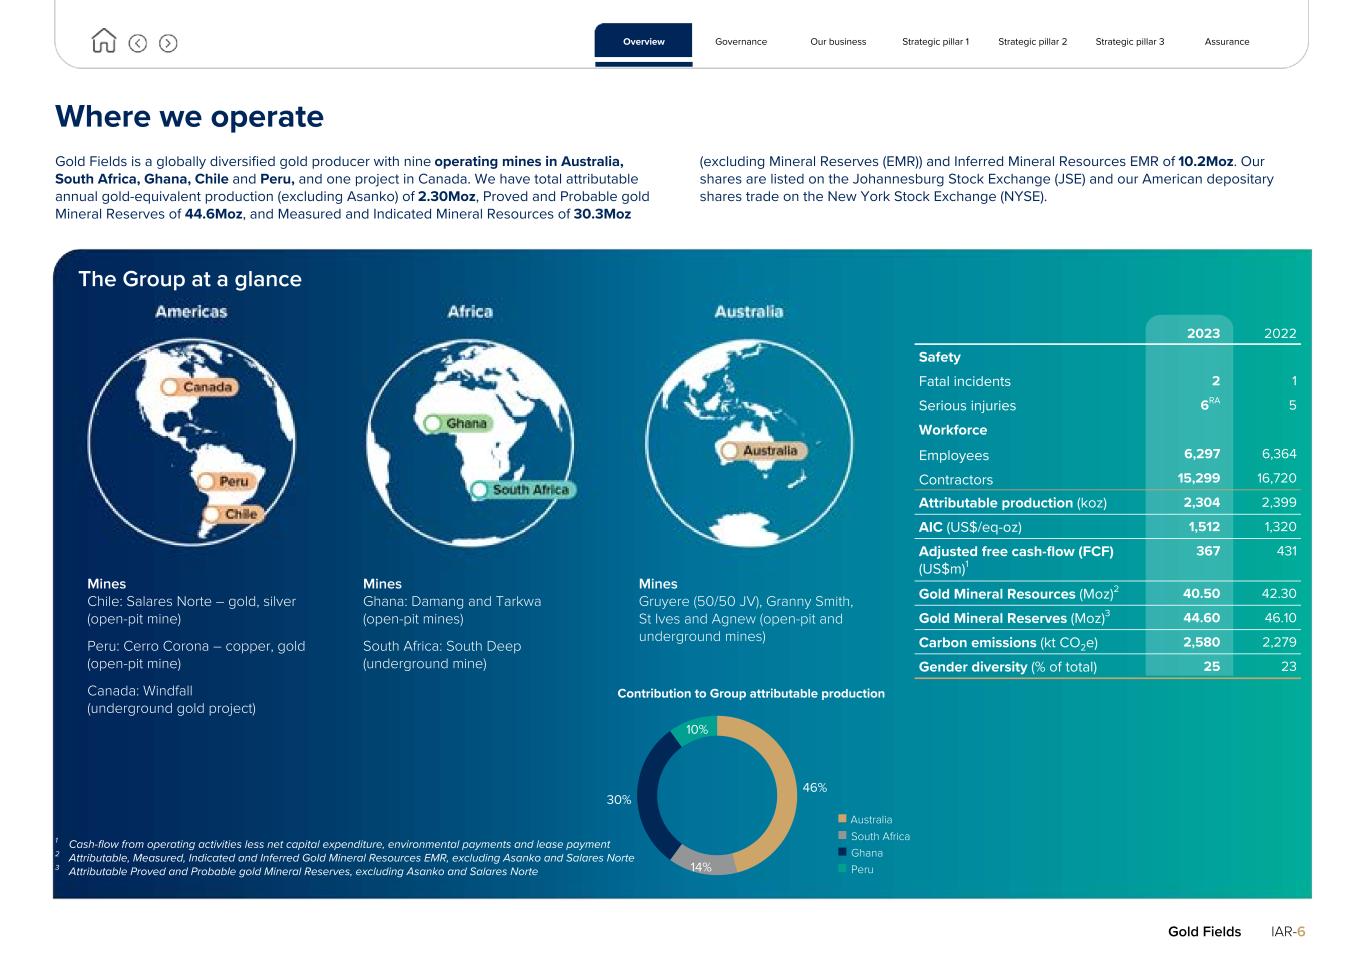
46% 14% 30% 10% Where we operate Gold Fields is a globally diversified gold producer with nine operating mines in Australia, South Africa, Ghana, Chile and Peru, and one project in Canada. We have total attributable annual gold-equivalent production (excluding Asanko) of 2.30Moz, Proved and Probable gold Mineral Reserves of 44.6Moz, and Measured and Indicated Mineral Resources of 30.3Moz (excluding Mineral Reserves (EMR)) and Inferred Mineral Resources EMR of 10.2Moz. Our shares are listed on the Johannesburg Stock Exchange (JSE) and our American depositary shares trade on the New York Stock Exchange (NYSE). The Group at a glance 2023 2022 Safety Fatal incidents 2 1 Serious injuries 6RA 5 Workforce Employees 6,297 6,364 Contractors 15,299 16,720 Attributable production (koz) 2,304 2,399 AIC (US$/eq-oz) 1,512 1,320 Adjusted free cash-flow (FCF) (US$m)1 367 431 Gold Mineral Resources (Moz)2 40.50 42.30 Gold Mineral Reserves (Moz)3 44.60 46.10 Carbon emissions (kt CO2e) 2,580 2,279 Gender diversity (% of total) 25 23 1 Cash-flow from operating activities less net capital expenditure, environmental payments and lease payment 2 Attributable, Measured, Indicated and Inferred Gold Mineral Resources EMR, excluding Asanko and Salares Norte 3 Attributable Proved and Probable gold Mineral Reserves, excluding Asanko and Salares Norte Overview Governance Our business Strategic pillar 1 Strategic pillar 2 Strategic pillar 3 Assurance Gold Fields IAR-6 Mines Chile: Salares Norte – gold, silver (open-pit mine) Peru: Cerro Corona – copper, gold (open-pit mine) Canada: Windfall (underground gold project) Mines Ghana: Damang and Tarkwa (open-pit mines) South Africa: South Deep (underground mine) Mines Gruyere (50/50 JV), Granny Smith, St Ives and Agnew (open-pit and underground mines) Contribution to Group attributable production n Australia n South Africa n Ghana n Peru
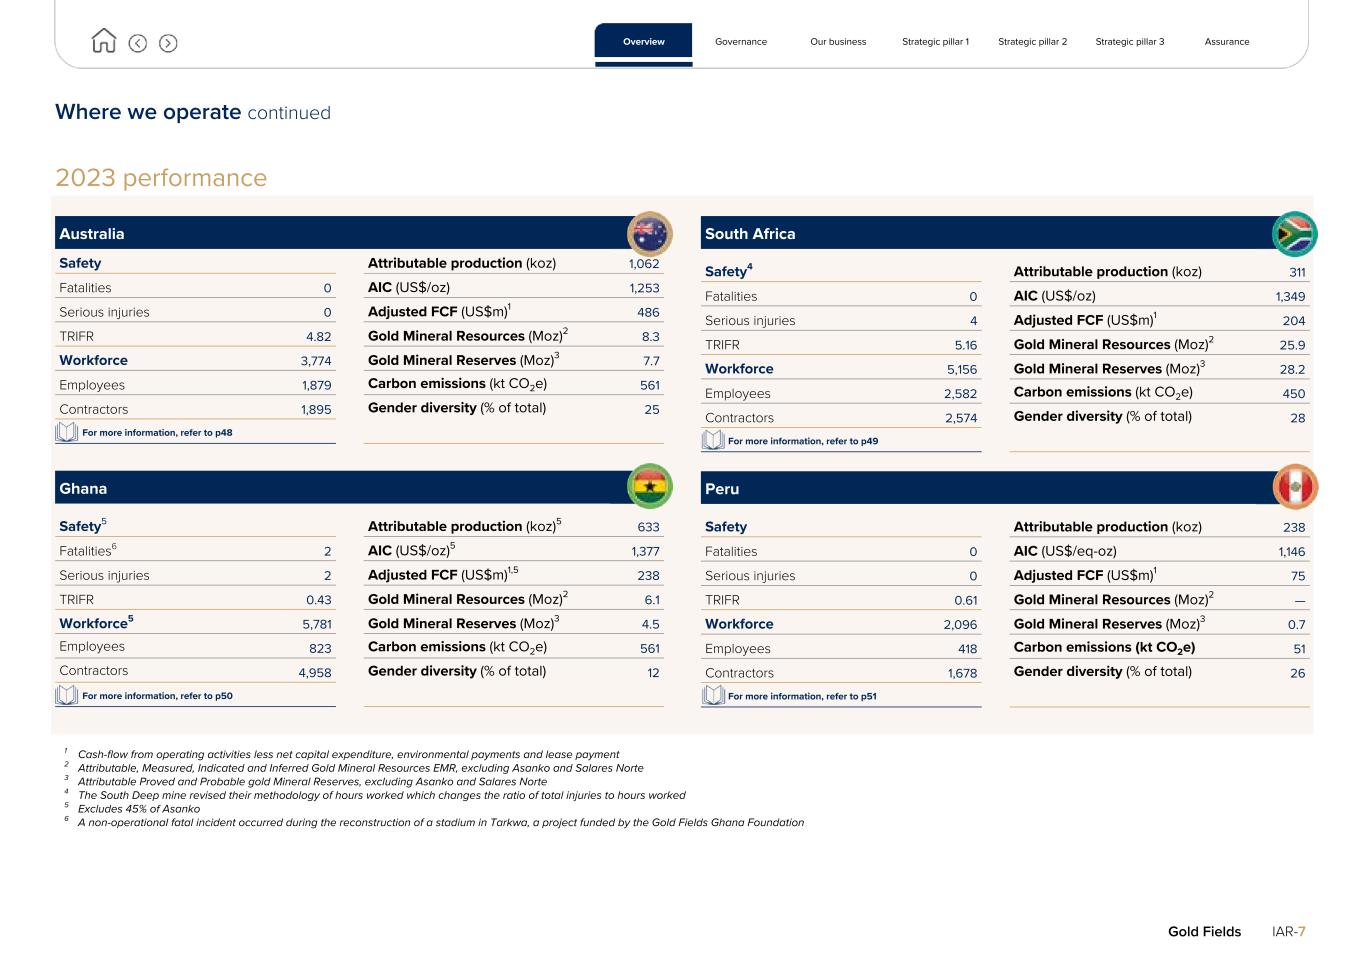
Where we operate continued 2023 performance Australia Safety Attributable production (koz) 1,062 Fatalities 0 AIC (US$/oz) 1,253 Serious injuries 0 Adjusted FCF (US$m)1 486 TRIFR 4.82 Gold Mineral Resources (Moz)2 8.3 Workforce 3,774 Gold Mineral Reserves (Moz)3 7.7 Employees 1,879 Carbon emissions (kt CO2e) 561 Contractors 1,895 Gender diversity (% of total) 25 For more information, refer to p48 Ghana Safety5 Attributable production (koz)5 633 Fatalities6 2 AIC (US$/oz)5 1,377 Serious injuries 2 Adjusted FCF (US$m)1,5 238 TRIFR 0.43 Gold Mineral Resources (Moz)2 6.1 Workforce5 5,781 Gold Mineral Reserves (Moz)3 4.5 Employees 823 Carbon emissions (kt CO2e) 561 Contractors 4,958 Gender diversity (% of total) 12 For more information, refer to p50 South Africa Safety4 Attributable production (koz) 311 Fatalities 0 AIC (US$/oz) 1,349 Serious injuries 4 Adjusted FCF (US$m)1 204 TRIFR 5.16 Gold Mineral Resources (Moz)2 25.9 Workforce 5,156 Gold Mineral Reserves (Moz)3 28.2 Employees 2,582 Carbon emissions (kt CO2e) 450 Contractors 2,574 Gender diversity (% of total) 28 For more information, refer to p49 Peru Safety Attributable production (koz) 238 Fatalities 0 AIC (US$/eq-oz) 1,146 Serious injuries 0 Adjusted FCF (US$m)1 75 TRIFR 0.61 Gold Mineral Resources (Moz)2 — Workforce 2,096 Gold Mineral Reserves (Moz)3 0.7 Employees 418 Carbon emissions (kt CO2e) 51 Contractors 1,678 Gender diversity (% of total) 26 For more information, refer to p51 1 Cash-flow from operating activities less net capital expenditure, environmental payments and lease payment 2 Attributable, Measured, Indicated and Inferred Gold Mineral Resources EMR, excluding Asanko and Salares Norte 3 Attributable Proved and Probable gold Mineral Reserves, excluding Asanko and Salares Norte 4 The South Deep mine revised their methodology of hours worked which changes the ratio of total injuries to hours worked 5 Excludes 45% of Asanko 6 A non-operational fatal incident occurred during the reconstruction of a stadium in Tarkwa, a project funded by the Gold Fields Ghana Foundation Overview Governance Our business Strategic pillar 1 Strategic pillar 2 Strategic pillar 3 Assurance Gold Fields IAR-7
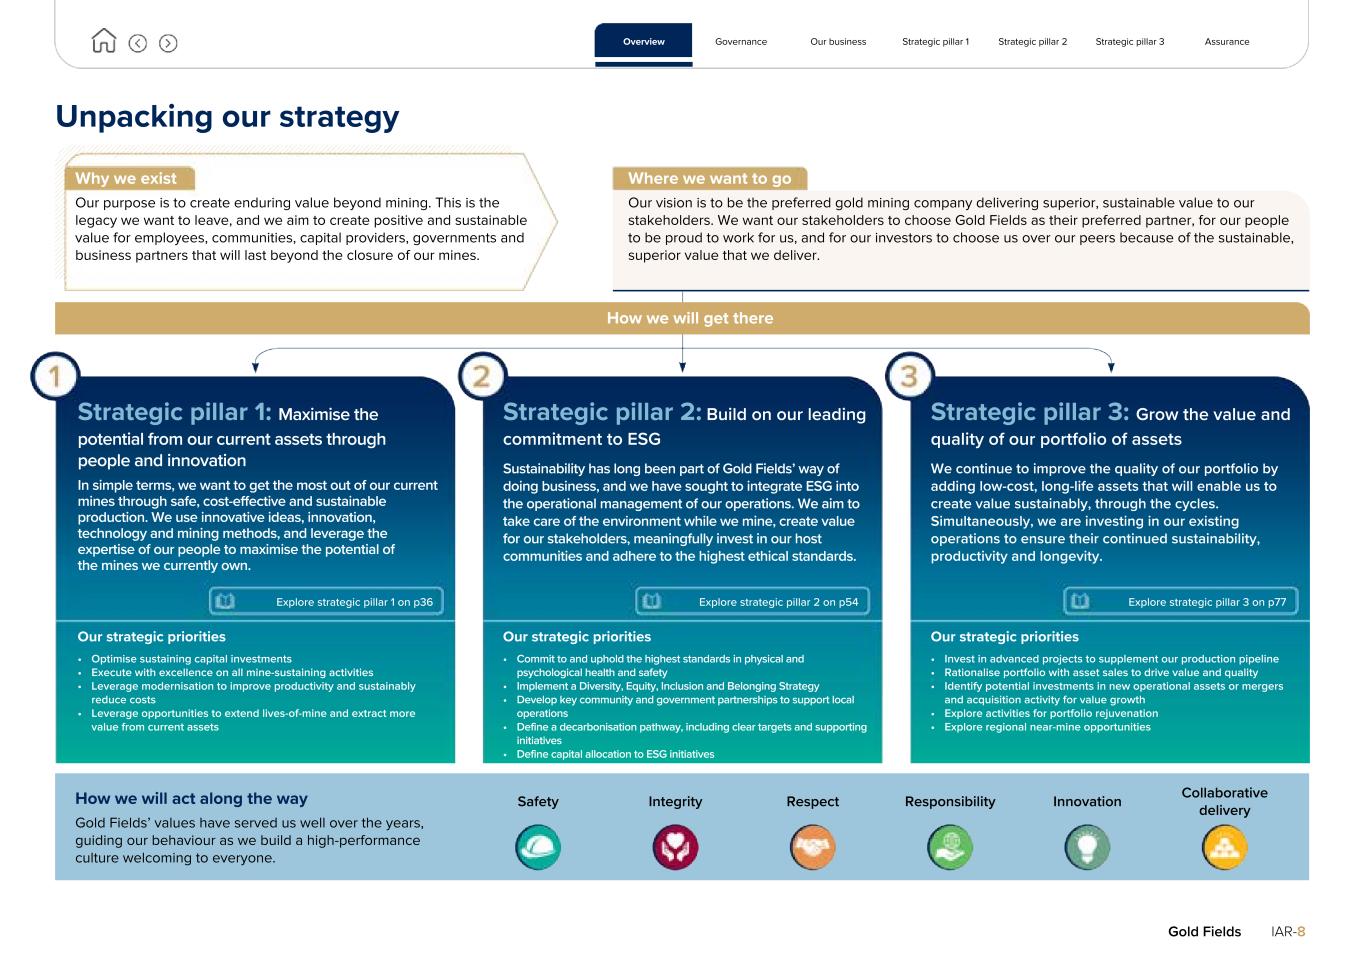
Unpacking our strategy Why we exist Where we want to go Our purpose is to create enduring value beyond mining. This is the legacy we want to leave, and we aim to create positive and sustainable value for employees, communities, capital providers, governments and business partners that will last beyond the closure of our mines. Our vision is to be the preferred gold mining company delivering superior, sustainable value to our stakeholders. We want our stakeholders to choose Gold Fields as their preferred partner, for our people to be proud to work for us, and for our investors to choose us over our peers because of the sustainable, superior value that we deliver. How we will get there Strategic pillar 1: Maximise the potential from our current assets through people and innovation In simple terms, we want to get the most out of our current mines through safe, cost-effective and sustainable production. We use innovative ideas, innovation, technology and mining methods, and leverage the expertise of our people to maximise the potential of the mines we currently own. Strategic pillar 2: Build on our leading commitment to ESG Sustainability has long been part of Gold Fields’ way of doing business, and we have sought to integrate ESG into the operational management of our operations. We aim to take care of the environment while we mine, create value for our stakeholders, meaningfully invest in our host communities and adhere to the highest ethical standards. Strategic pillar 3: Grow the value and quality of our portfolio of assets We continue to improve the quality of our portfolio by adding low-cost, long-life assets that will enable us to create value sustainably, through the cycles. Simultaneously, we are investing in our existing operations to ensure their continued sustainability, productivity and longevity. Explore strategic pillar 1 on p36 Explore strategic pillar 2 on p54 Explore strategic pillar 3 on p77 Our strategic priorities Our strategic priorities Our strategic priorities • Optimise sustaining capital investments • Execute with excellence on all mine-sustaining activities • Leverage modernisation to improve productivity and sustainably reduce costs • Leverage opportunities to extend lives-of-mine and extract more value from current assets • Commit to and uphold the highest standards in physical and psychological health and safety • Implement a Diversity, Equity, Inclusion and Belonging Strategy • Develop key community and government partnerships to support local operations • Define a decarbonisation pathway, including clear targets and supporting initiatives • Define capital allocation to ESG initiatives • Invest in advanced projects to supplement our production pipeline • Rationalise portfolio with asset sales to drive value and quality • Identify potential investments in new operational assets or mergers and acquisition activity for value growth • Explore activities for portfolio rejuvenation • Explore regional near-mine opportunities How we will act along the way Safety Integrity Respect Responsibility Innovation Collaborative delivery Gold Fields’ values have served us well over the years, guiding our behaviour as we build a high-performance culture welcoming to everyone. Overview Governance Our business Strategic pillar 1 Strategic pillar 2 Strategic pillar 3 Assurance Gold Fields IAR-8
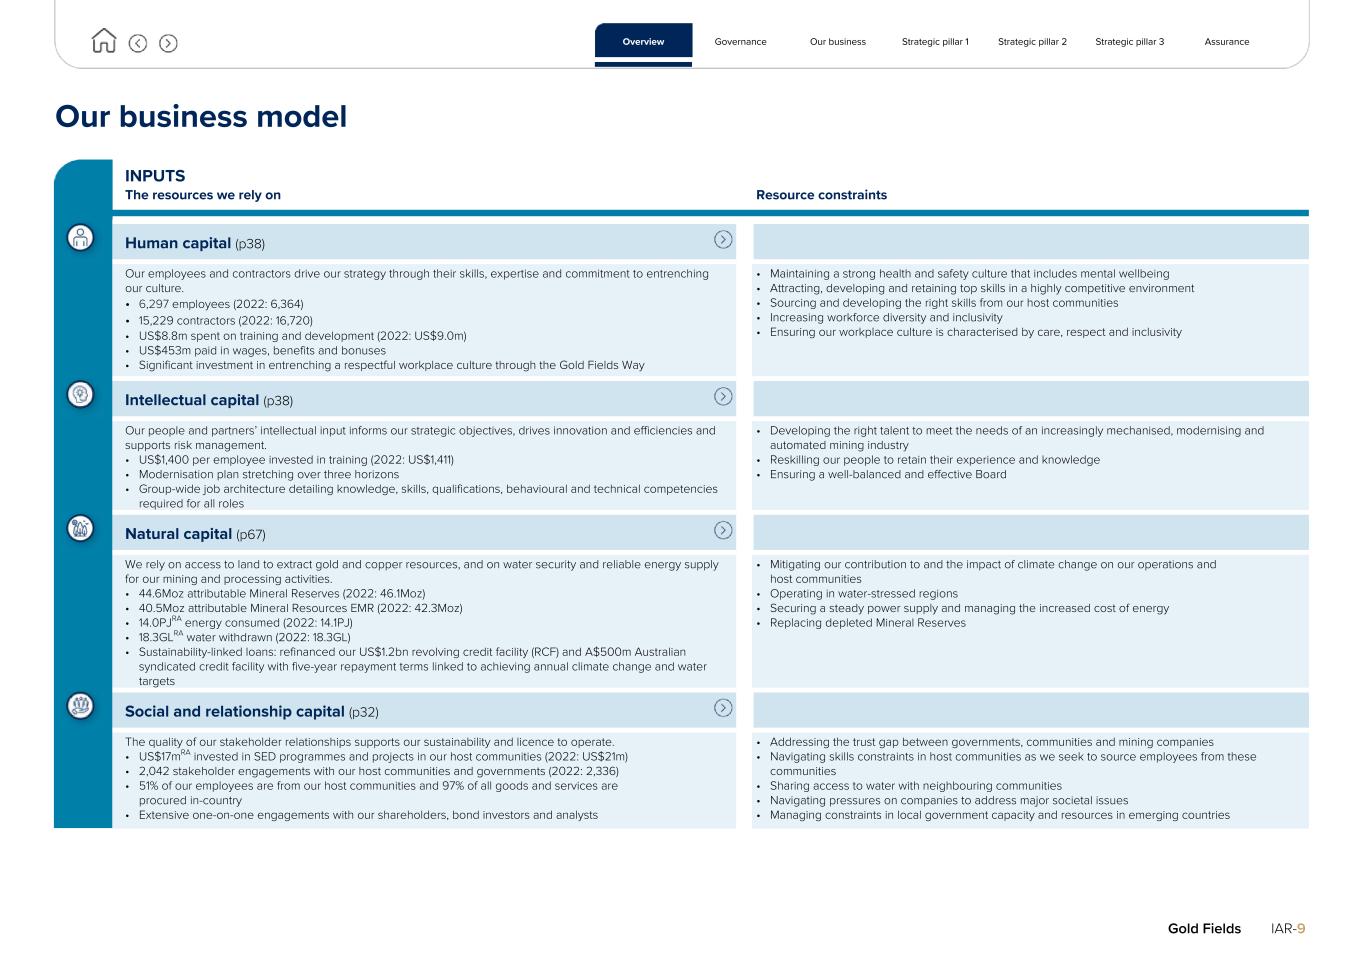
Our business model INPUTS The resources we rely on Resource constraints Human capital (p38) Our employees and contractors drive our strategy through their skills, expertise and commitment to entrenching our culture. • 6,297 employees (2022: 6,364) • 15,229 contractors (2022: 16,720) • US$8.8m spent on training and development (2022: US$9.0m) • US$453m paid in wages, benefits and bonuses • Significant investment in entrenching a respectful workplace culture through the Gold Fields Way • Maintaining a strong health and safety culture that includes mental wellbeing • Attracting, developing and retaining top skills in a highly competitive environment • Sourcing and developing the right skills from our host communities • Increasing workforce diversity and inclusivity • Ensuring our workplace culture is characterised by care, respect and inclusivity Intellectual capital (p38) Our people and partners’ intellectual input informs our strategic objectives, drives innovation and efficiencies and supports risk management. • US$1,400 per employee invested in training (2022: US$1,411) • Modernisation plan stretching over three horizons • Group-wide job architecture detailing knowledge, skills, qualifications, behavioural and technical competencies required for all roles • Developing the right talent to meet the needs of an increasingly mechanised, modernising and automated mining industry • Reskilling our people to retain their experience and knowledge • Ensuring a well-balanced and effective Board Natural capital (p67) We rely on access to land to extract gold and copper resources, and on water security and reliable energy supply for our mining and processing activities. • 44.6Moz attributable Mineral Reserves (2022: 46.1Moz) • 40.5Moz attributable Mineral Resources EMR (2022: 42.3Moz) • 14.0PJRA energy consumed (2022: 14.1PJ) • 18.3GLRA water withdrawn (2022: 18.3GL) • Sustainability-linked loans: refinanced our US$1.2bn revolving credit facility (RCF) and A$500m Australian syndicated credit facility with five-year repayment terms linked to achieving annual climate change and water targets • Mitigating our contribution to and the impact of climate change on our operations and host communities • Operating in water-stressed regions • Securing a steady power supply and managing the increased cost of energy • Replacing depleted Mineral Reserves Social and relationship capital (p32) The quality of our stakeholder relationships supports our sustainability and licence to operate. • US$17mRA invested in SED programmes and projects in our host communities (2022: US$21m) • 2,042 stakeholder engagements with our host communities and governments (2022: 2,336) • 51% of our employees are from our host communities and 97% of all goods and services are procured in-country • Extensive one-on-one engagements with our shareholders, bond investors and analysts • Addressing the trust gap between governments, communities and mining companies • Navigating skills constraints in host communities as we seek to source employees from these communities • Sharing access to water with neighbouring communities • Navigating pressures on companies to address major societal issues • Managing constraints in local government capacity and resources in emerging countries Overview Governance Our business Strategic pillar 1 Strategic pillar 2 Strategic pillar 3 Assurance Gold Fields IAR-9
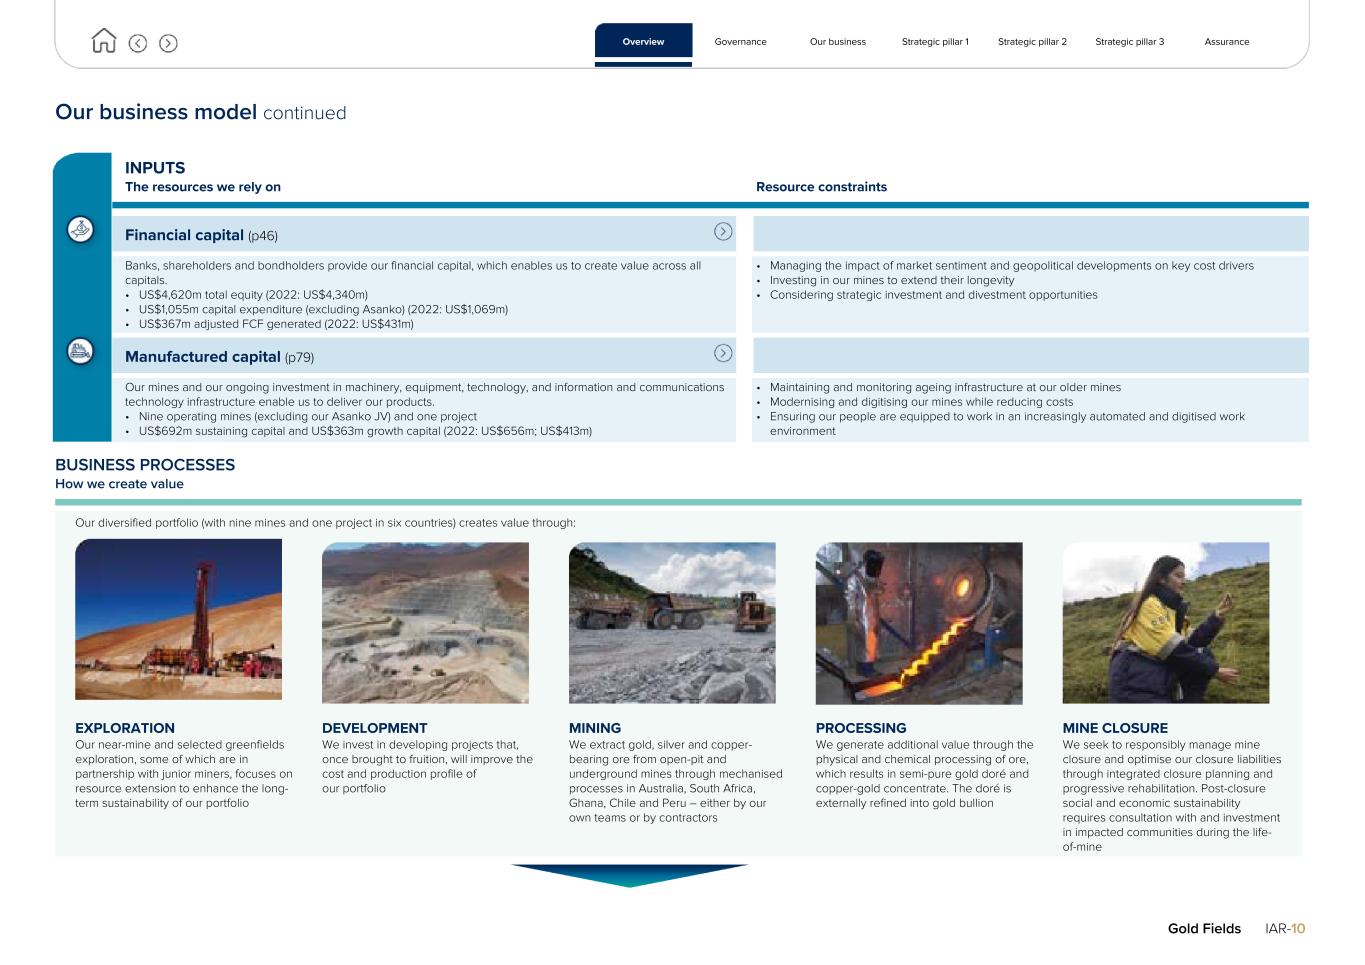
Our business model continued INPUTS The resources we rely on Resource constraints Financial capital (p46) Banks, shareholders and bondholders provide our financial capital, which enables us to create value across all capitals. • US$4,620m total equity (2022: US$4,340m) • US$1,055m capital expenditure (excluding Asanko) (2022: US$1,069m) • US$367m adjusted FCF generated (2022: US$431m) • Managing the impact of market sentiment and geopolitical developments on key cost drivers • Investing in our mines to extend their longevity • Considering strategic investment and divestment opportunities Manufactured capital (p79) Our mines and our ongoing investment in machinery, equipment, technology, and information and communications technology infrastructure enable us to deliver our products. • Nine operating mines (excluding our Asanko JV) and one project • US$692m sustaining capital and US$363m growth capital (2022: US$656m; US$413m) • Maintaining and monitoring ageing infrastructure at our older mines • Modernising and digitising our mines while reducing costs • Ensuring our people are equipped to work in an increasingly automated and digitised work environment BUSINESS PROCESSES How we create value Our diversified portfolio (with nine mines and one project in six countries) creates value through: EXPLORATION Our near-mine and selected greenfields exploration, some of which are in partnership with junior miners, focuses on resource extension to enhance the long- term sustainability of our portfolio DEVELOPMENT We invest in developing projects that, once brought to fruition, will improve the cost and production profile of our portfolio MINING We extract gold, silver and copper- bearing ore from open-pit and underground mines through mechanised processes in Australia, South Africa, Ghana, Chile and Peru – either by our own teams or by contractors PROCESSING We generate additional value through the physical and chemical processing of ore, which results in semi-pure gold doré and copper-gold concentrate. The doré is externally refined into gold bullion MINE CLOSURE We seek to responsibly manage mine closure and optimise our closure liabilities through integrated closure planning and progressive rehabilitation. Post-closure social and economic sustainability requires consultation with and investment in impacted communities during the life- of-mine Overview Governance Our business Strategic pillar 1 Strategic pillar 2 Strategic pillar 3 Assurance Gold Fields IAR-10
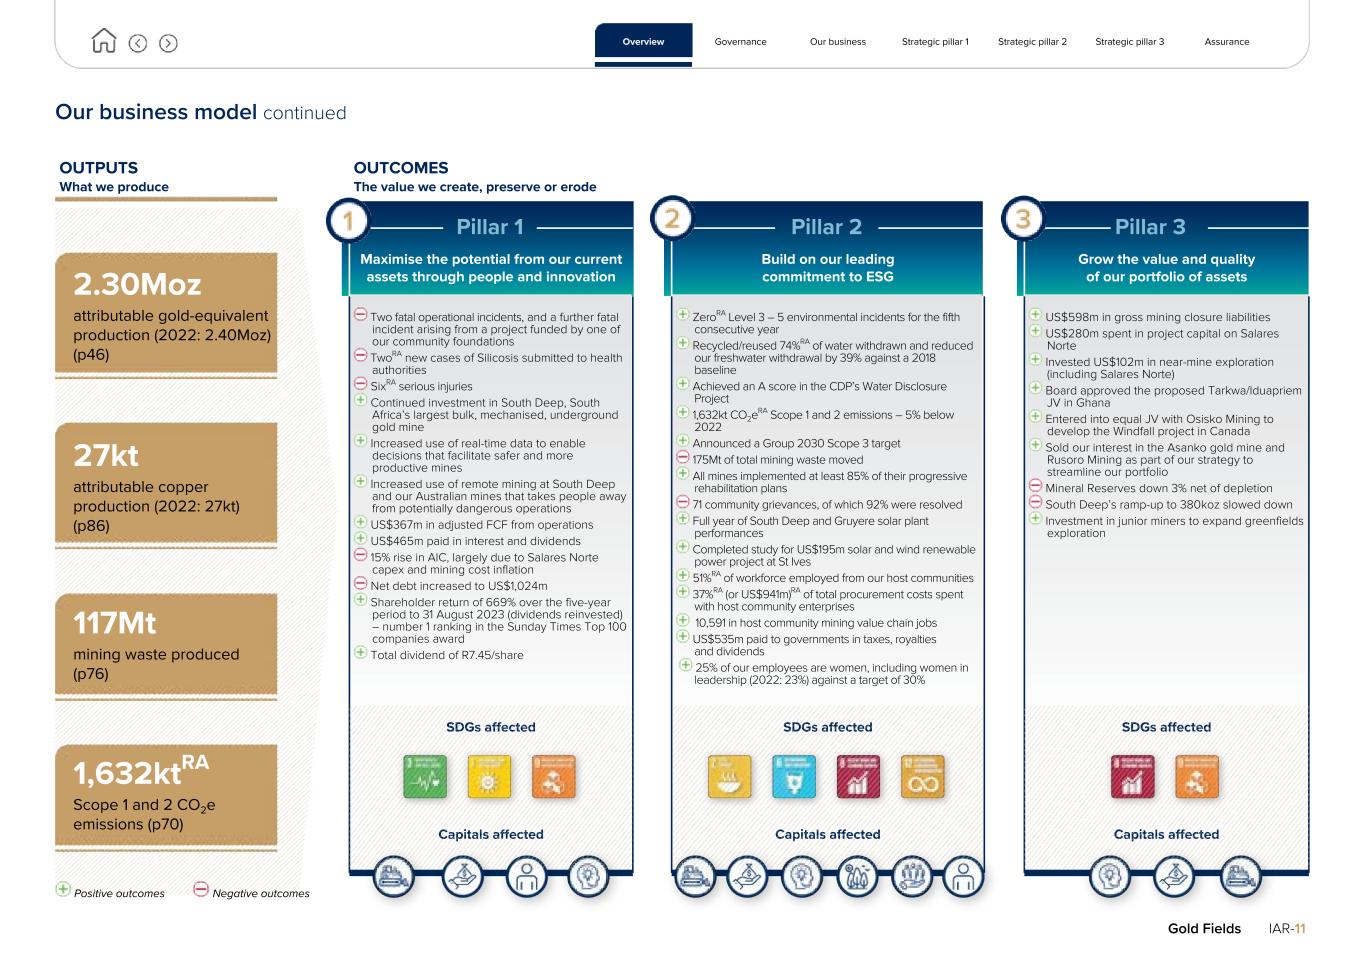
Our business model continued OUTPUTS What we produce OUTCOMES The value we create, preserve or erode Pillar 1 Pillar 2 Pillar 3 2.30Moz attributable gold-equivalent production (2022: 2.40Moz) (p46) Maximise the potential from our current assets through people and innovation Build on our leading commitment to ESG Grow the value and quality of our portfolio of assets Two fatal operational incidents, and a further fatal incident arising from a project funded by one of our community foundations TwoRA new cases of Silicosis submitted to health authorities SixRA serious injuries Continued investment in South Deep, South Africa’s largest bulk, mechanised, underground gold mine Increased use of real-time data to enable decisions that facilitate safer and more productive mines Increased use of remote mining at South Deep and our Australian mines that takes people away from potentially dangerous operations US$367m in adjusted FCF from operations US$465m paid in interest and dividends 15% rise in AIC, largely due to Salares Norte capex and mining cost inflation Net debt increased to US$1,024m Shareholder return of 669% over the five-year period to 31 August 2023 (dividends reinvested) – number 1 ranking in the Sunday Times Top 100 companies award Total dividend of R7.45/share ZeroRA Level 3 – 5 environmental incidents for the fifth consecutive year Recycled/reused 74%RA of water withdrawn and reduced our freshwater withdrawal by 39% against a 2018 baseline Achieved an A score in the CDP’s Water Disclosure Project 1,632kt CO2e RA Scope 1 and 2 emissions – 5% below 2022 Announced a Group 2030 Scope 3 target 175Mt of total mining waste moved All mines implemented at least 85% of their progressive rehabilitation plans 71 community grievances, of which 92% were resolved Full year of South Deep and Gruyere solar plant performances Completed study for US$195m solar and wind renewable power project at St Ives 51%RA of workforce employed from our host communities 37%RA (or US$941m)RA of total procurement costs spent with host community enterprises 10,591 in host community mining value chain jobs US$535m paid to governments in taxes, royalties and dividends 25% of our employees are women, including women in leadership (2022: 23%) against a target of 30% US$598m in gross mining closure liabilities US$280m spent in project capital on Salares Norte Invested US$102m in near-mine exploration (including Salares Norte) Board approved the proposed Tarkwa/Iduapriem JV in Ghana Entered into equal JV with Osisko Mining to develop the Windfall project in Canada Sold our interest in the Asanko gold mine and Rusoro Mining as part of our strategy to streamline our portfolio Mineral Reserves down 3% net of depletion South Deep’s ramp-up to 380koz slowed down Investment in junior miners to expand greenfields exploration 27kt attributable copper production (2022: 27kt) (p86) 117Mt mining waste produced (p76) 1,632ktRA Scope 1 and 2 CO2e emissions (p70) SDGs affected SDGs affected SDGs affected Capitals affected Capitals affected Capitals affected Positive outcomes Negative outcomes Overview Governance Our business Strategic pillar 1 Strategic pillar 2 Strategic pillar 3 Assurance Gold Fields IAR-11
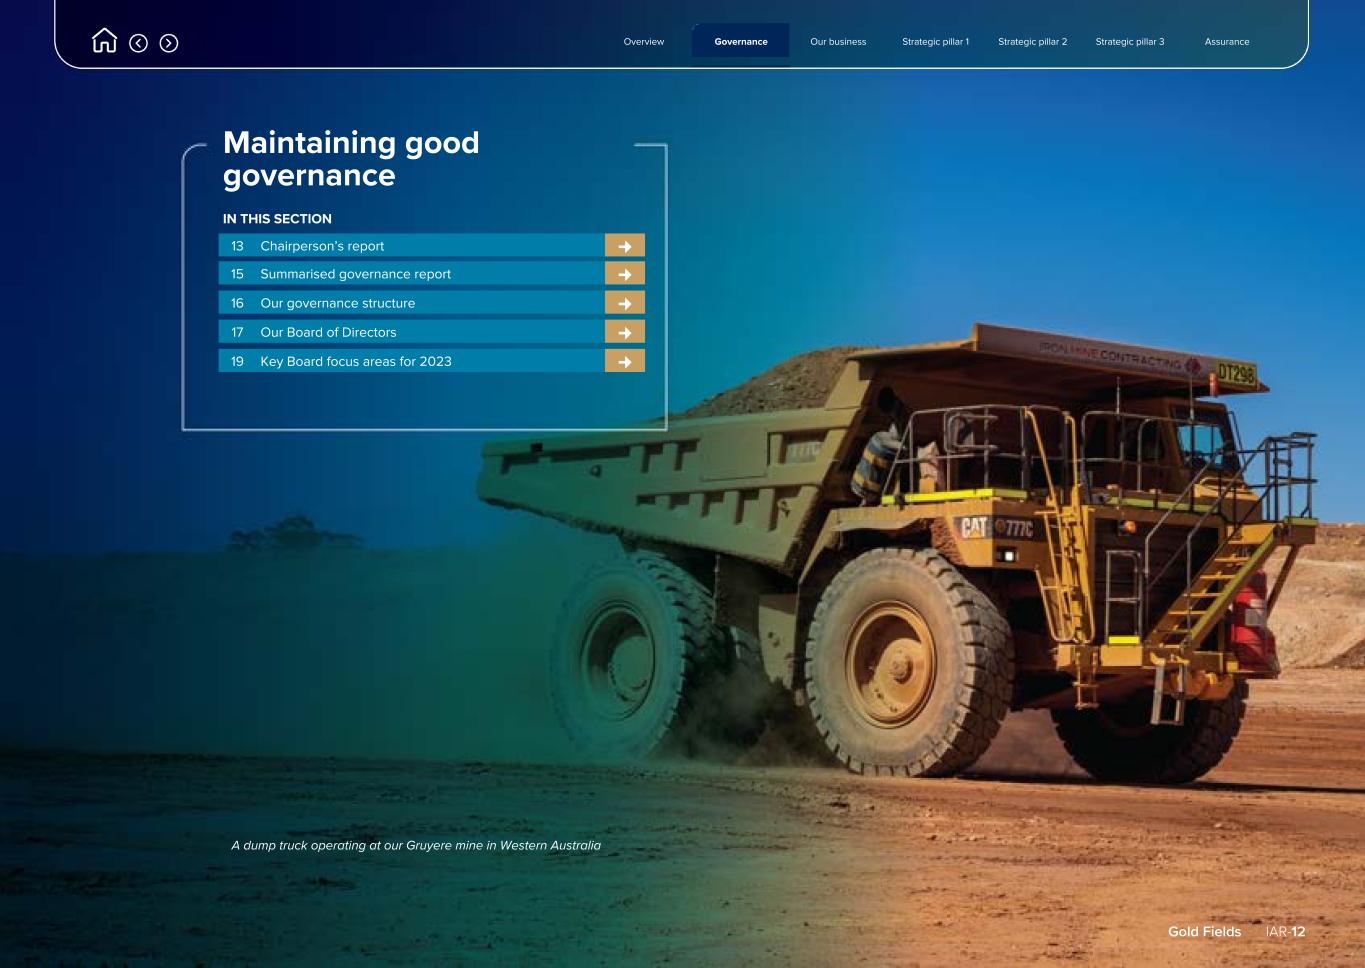
Overview Governance Our business Strategic pillar 1 Strategic pillar 2 Strategic pillar 3 Assurance Gold Fields IAR-12 Maintaining good governance IN THIS SECTION 13 Chairperson’s report ¢ 15 Summarised governance report ¢ 16 Our governance structure ¢ 17 Our Board of Directors ¢ 19 Key Board focus areas for 2023 ¢ A dump truck operating at our Gruyere mine in Western Australia
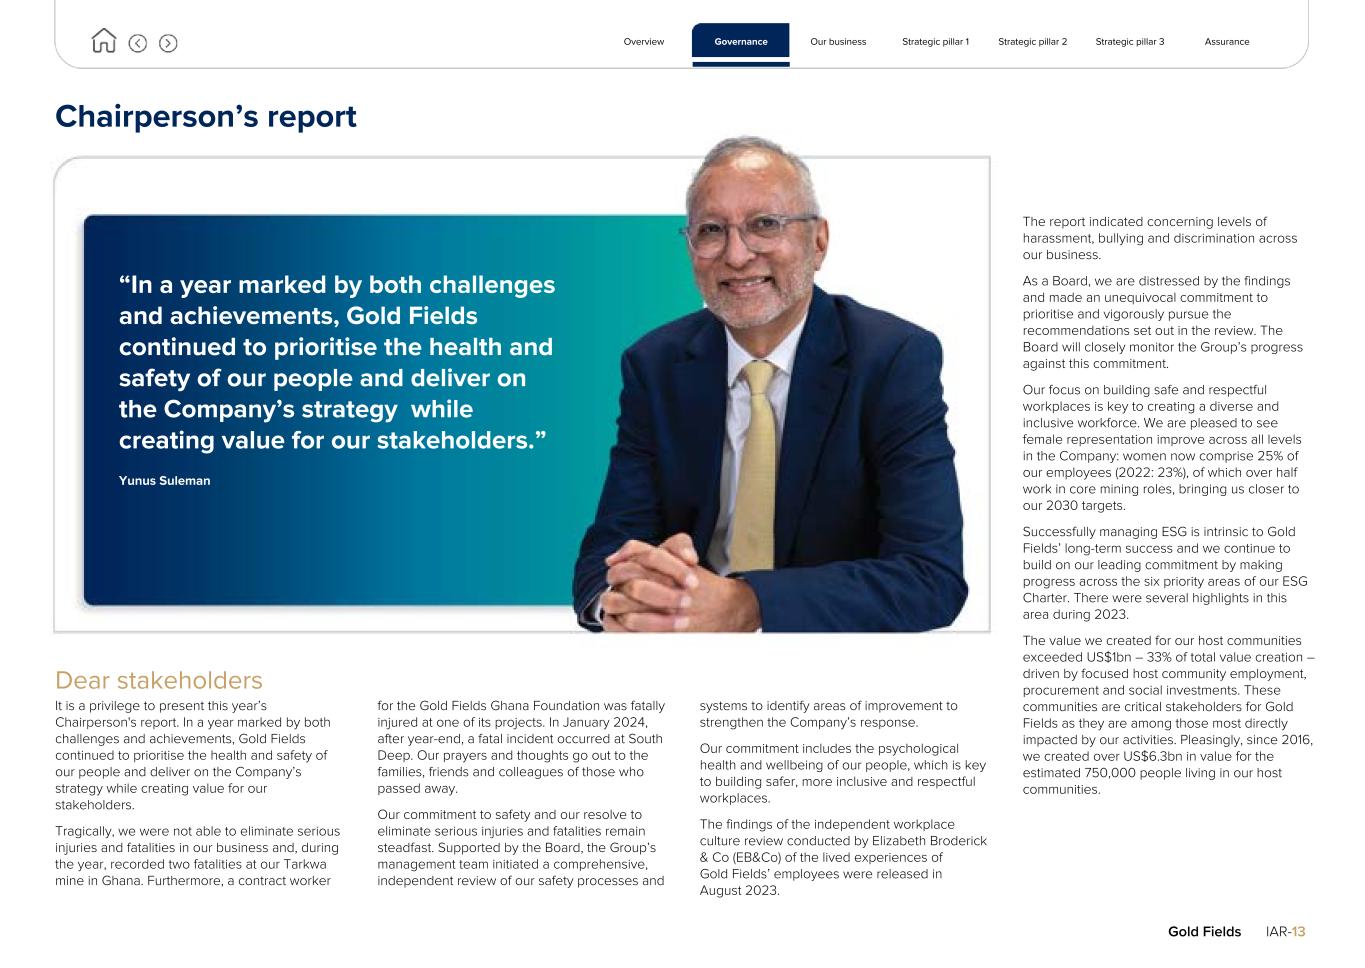
Chairperson’s report “In a year marked by both challenges and achievements, Gold Fields continued to prioritise the health and safety of our people and deliver on the Company’s strategy while creating value for our stakeholders.” Yunus Suleman Dear stakeholders It is a privilege to present this year’s Chairperson's report. In a year marked by both challenges and achievements, Gold Fields continued to prioritise the health and safety of our people and deliver on the Company’s strategy while creating value for our stakeholders. Tragically, we were not able to eliminate serious injuries and fatalities in our business and, during the year, recorded two fatalities at our Tarkwa mine in Ghana. Furthermore, a contract worker for the Gold Fields Ghana Foundation was fatally injured at one of its projects. In January 2024, after year-end, a fatal incident occurred at South Deep. Our prayers and thoughts go out to the families, friends and colleagues of those who passed away. Our commitment to safety and our resolve to eliminate serious injuries and fatalities remain steadfast. Supported by the Board, the Group’s management team initiated a comprehensive, independent review of our safety processes and systems to identify areas of improvement to strengthen the Company’s response. Our commitment includes the psychological health and wellbeing of our people, which is key to building safer, more inclusive and respectful workplaces. The findings of the independent workplace culture review conducted by Elizabeth Broderick & Co (EB&Co) of the lived experiences of Gold Fields’ employees were released in August 2023. Overview Governance Our business Strategic pillar 1 Strategic pillar 2 Strategic pillar 3 Assurance Gold Fields IAR-13 The report indicated concerning levels of harassment, bullying and discrimination across our business. As a Board, we are distressed by the findings and made an unequivocal commitment to prioritise and vigorously pursue the recommendations set out in the review. The Board will closely monitor the Group’s progress against this commitment. Our focus on building safe and respectful workplaces is key to creating a diverse and inclusive workforce. We are pleased to see female representation improve across all levels in the Company: women now comprise 25% of our employees (2022: 23%), of which over half work in core mining roles, bringing us closer to our 2030 targets. Successfully managing ESG is intrinsic to Gold Fields’ long-term success and we continue to build on our leading commitment by making progress across the six priority areas of our ESG Charter. There were several highlights in this area during 2023. The value we created for our host communities exceeded US$1bn – 33% of total value creation – driven by focused host community employment, procurement and social investments. These communities are critical stakeholders for Gold Fields as they are among those most directly impacted by our activities. Pleasingly, since 2016, we created over US$6.3bn in value for the estimated 750,000 people living in our host communities.
Chairperson’s report continued We continue to drive our decarbonisation efforts, with our investment in renewable energy contributing to the reduction in Group Scope 1 and 2 emissions during 2023. Thanks to our new solar plants at South Deep and Gruyere, we derived 17% of our electricity from renewable sources in 2023. We expect that this will continue to improve: in February 2024, the Board approved the construction of a US$195m renewable power project at St Ives, which is set to generate up to 73% of its electricity requirements. We announced our 2030 target to reduce Scope 3 emissions by 10% from a 2022 baseline. Achieving this target will require extensive collaboration with our key suppliers to decarbonise their operations. Looking at the Company’s operational and financial performance, we are pleased to note that, despite the considerable inflationary headwinds faced by the industry, Gold Fields was once again one of the few gold mining companies to meet its cost guidance, as well as 99.7% of its production guidance for the year. Our mines generated approximately US$1bn in cash during 2023, enabling us to fund growth, pay strong dividends and ensure debt levels continue to remain stable. Shareholders would also be pleased with the performance of our share price. In 2023, Gold Fields ranked first in the Sunday Times Top 100 Companies awards. We were the top performer among JSE-listed companies, delivering total returns of 668% between September 2018 and August 2023, assuming all dividends paid over the period were reinvested. The Board believes this award recognises the Company’s sound operational, financial and sustainability performance. The Board remains focused on ensuring our portfolio of assets is structured to not only drive competitive returns for the Group’s shareholders, but also provide long-term growth and value to our host communities and governments. During 2023, the Board reaffirmed its support for the Company’s growth strategy. We remain committed to exploring alternative reserve replacement and growth options in our existing jurisdictions and other top-tier mining countries. Looking forward, in addition to our existing focus on near-mine and district exploration, we will pursue greenfields exploration, development projects, bolt-on acquisitions of producing assets and strategic JV partnerships. There were several positive developments during 2023 that will significantly improve the quality and value of our portfolio. In March, the Board approved the proposed Tarkwa/ Iduapriem JV with AngloGold Ashanti which, once approved by the government of Ghana, will create shared value not only for Gold Fields and AngloGold Ashanti, but also for government and local communities in the form of increased and prolonged contributions to the fiscus, local employment and investment in host communities. Gold Fields will have the majority stake and will manage the combined asset, set to be the largest gold mine in Africa, and one of the largest in the world. In May, the Board approved the JV with Osisko Mining to develop the Windfall project in Canada, a world-class asset in a premium mining jurisdiction. The Windfall Mining Group team is being formed, and is well supported by expertise from both parties. We expect to complete the project’s Environmental Impact Assessment (EIA) process over the next year. Most importantly, the Board continued to monitor the development of Salares Norte in Chile, and was briefed on the delays to the scheduled start-up. While these will impact Gold Fields’ production outlook for 2024, the Board looks forward to the positive, material impact Salares Norte will have on the Group’s long-term production and cost performance. Several critical leadership changes happened at Gold Fields over the past year. On 1 January 2024, Mike Fraser assumed the role of CEO, succeeding Martin Preece, who served as Interim CEO during 2023. Mike’s appointment follows a rigorous and comprehensive selection process to identify an individual with the necessary vision, skills and experience to guide Gold Fields into the future. Martin, who in March 2024 was appointed Chief Operating Officer of the Company, has ensured a seamless leadership transition. We want to thank him again for stepping in and maintaining momentum at such a critical time, demonstrating both care and accountability for our people and assets. The Board made good progress in its search to fill a number of executive positions, including a Chief Financial Officer (CFO) to replace Paul Schmidt, who announced his retirement during the year. We will provide further details on this in the months that follow. Other changes to our leadership team were mostly due to resignations for personal reasons, or age-related retirements of long-serving executives. This provided an opportunity to promote existing talent from within Gold Fields, as well as attract high-quality external candidates. The Board is very confident Gold Fields’ current leadership team, under Mike’s guidance, is fully equipped to lead the Company for many years to come and ensure the Group’s strategy is implemented successfully. At the same time, the Board is working on succession planning for non-executive directors and identifying candidates who offer a range of relevant knowledge, expertise, technical and business experience, enabling them to exercise independent judgement. The Board seeks to ensure adequate diversity in race, gender, culture, age, skills, and geographic and academic backgrounds. In conclusion, I would like to sincerely thank the many colleagues who supported me during the year. Firstly, my appreciation goes to my fellow directors, many of whom have been on the Board with me for several years. Secondly, I want to express my gratitude to Mike, Martin and the executive leadership team for keeping the ship steady in the face of some difficult challenges and high cost inflation. Finally, I want to thank the people of Gold Fields. The fact that we emerged from a challenging year with sound financial and operational results, a strong share price performance and ESG firmly embedded in the business is, first and foremost, a reflection of the quality of the teams we have in place at our mines and offices. I thank the over 23,000 employees and contractors of Gold Fields for ensuring we continue to create enduring value for all our stakeholders. Yunus Suleman Chairperson Overview Governance Our business Strategic pillar 1 Strategic pillar 2 Strategic pillar 3 Assurance Gold Fields IAR-14
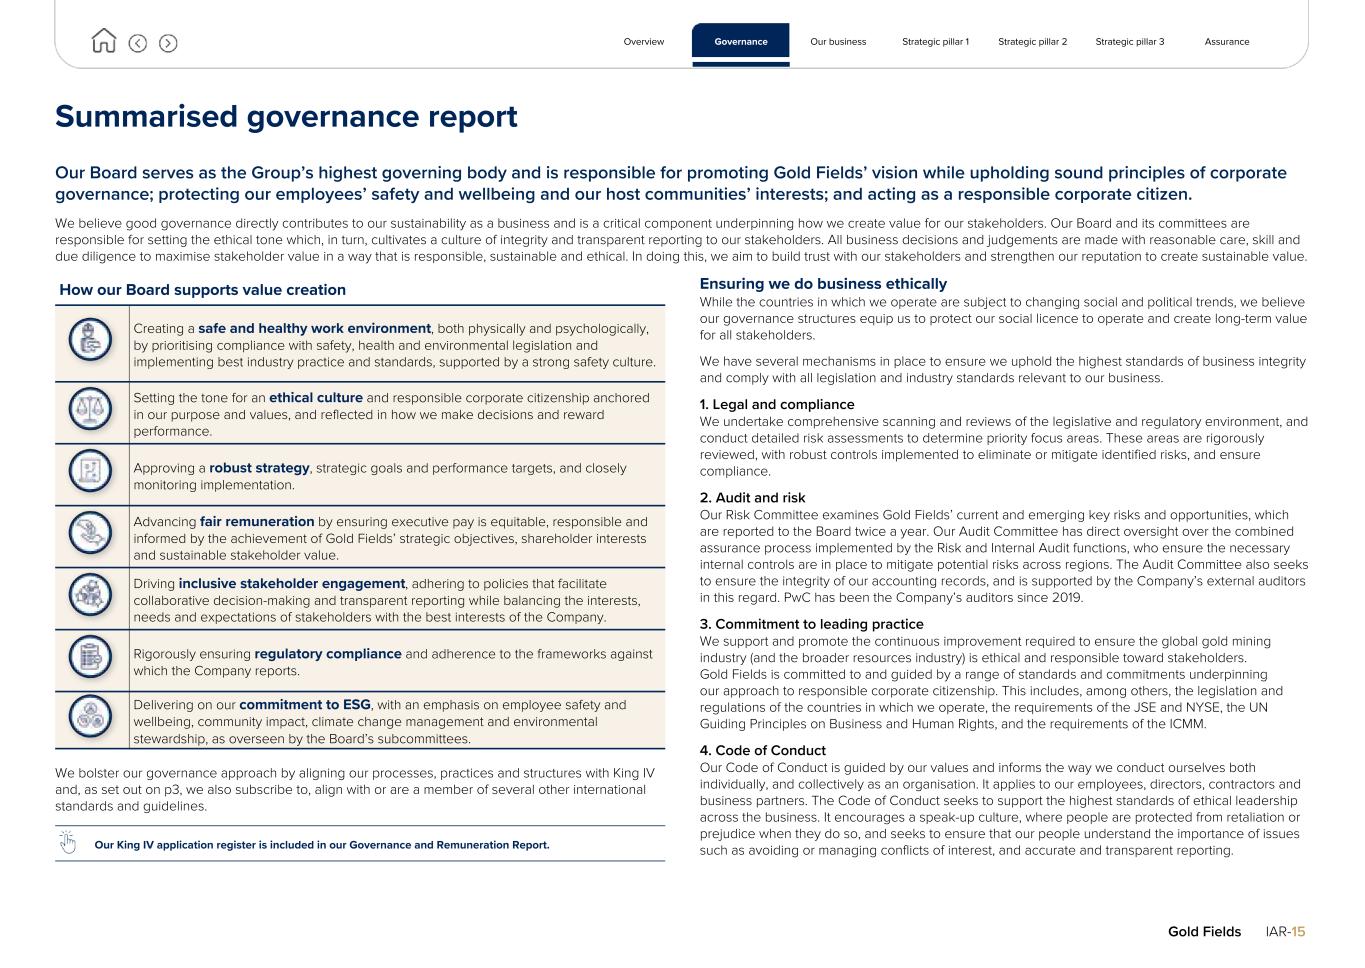
Summarised governance report Our Board serves as the Group’s highest governing body and is responsible for promoting Gold Fields’ vision while upholding sound principles of corporate governance; protecting our employees’ safety and wellbeing and our host communities’ interests; and acting as a responsible corporate citizen. We believe good governance directly contributes to our sustainability as a business and is a critical component underpinning how we create value for our stakeholders. Our Board and its committees are responsible for setting the ethical tone which, in turn, cultivates a culture of integrity and transparent reporting to our stakeholders. All business decisions and judgements are made with reasonable care, skill and due diligence to maximise stakeholder value in a way that is responsible, sustainable and ethical. In doing this, we aim to build trust with our stakeholders and strengthen our reputation to create sustainable value. How our Board supports value creation Creating a safe and healthy work environment, both physically and psychologically, by prioritising compliance with safety, health and environmental legislation and implementing best industry practice and standards, supported by a strong safety culture. Setting the tone for an ethical culture and responsible corporate citizenship anchored in our purpose and values, and reflected in how we make decisions and reward performance. Approving a robust strategy, strategic goals and performance targets, and closely monitoring implementation. Advancing fair remuneration by ensuring executive pay is equitable, responsible and informed by the achievement of Gold Fields’ strategic objectives, shareholder interests and sustainable stakeholder value. Driving inclusive stakeholder engagement, adhering to policies that facilitate collaborative decision-making and transparent reporting while balancing the interests, needs and expectations of stakeholders with the best interests of the Company. Rigorously ensuring regulatory compliance and adherence to the frameworks against which the Company reports. Delivering on our commitment to ESG, with an emphasis on employee safety and wellbeing, community impact, climate change management and environmental stewardship, as overseen by the Board’s subcommittees. We bolster our governance approach by aligning our processes, practices and structures with King IV and, as set out on p3, we also subscribe to, align with or are a member of several other international standards and guidelines. Our King IV application register is included in our Governance and Remuneration Report. Ensuring we do business ethically While the countries in which we operate are subject to changing social and political trends, we believe our governance structures equip us to protect our social licence to operate and create long-term value for all stakeholders. We have several mechanisms in place to ensure we uphold the highest standards of business integrity and comply with all legislation and industry standards relevant to our business. 1. Legal and compliance We undertake comprehensive scanning and reviews of the legislative and regulatory environment, and conduct detailed risk assessments to determine priority focus areas. These areas are rigorously reviewed, with robust controls implemented to eliminate or mitigate identified risks, and ensure compliance. 2. Audit and risk Our Risk Committee examines Gold Fields’ current and emerging key risks and opportunities, which are reported to the Board twice a year. Our Audit Committee has direct oversight over the combined assurance process implemented by the Risk and Internal Audit functions, who ensure the necessary internal controls are in place to mitigate potential risks across regions. The Audit Committee also seeks to ensure the integrity of our accounting records, and is supported by the Company’s external auditors in this regard. PwC has been the Company’s auditors since 2019. 3. Commitment to leading practice We support and promote the continuous improvement required to ensure the global gold mining industry (and the broader resources industry) is ethical and responsible toward stakeholders. Gold Fields is committed to and guided by a range of standards and commitments underpinning our approach to responsible corporate citizenship. This includes, among others, the legislation and regulations of the countries in which we operate, the requirements of the JSE and NYSE, the UN Guiding Principles on Business and Human Rights, and the requirements of the ICMM. 4. Code of Conduct Our Code of Conduct is guided by our values and informs the way we conduct ourselves both individually, and collectively as an organisation. It applies to our employees, directors, contractors and business partners. The Code of Conduct seeks to support the highest standards of ethical leadership across the business. It encourages a speak-up culture, where people are protected from retaliation or prejudice when they do so, and seeks to ensure that our people understand the importance of issues such as avoiding or managing conflicts of interest, and accurate and transparent reporting. Overview Governance Our business Strategic pillar 1 Strategic pillar 2 Strategic pillar 3 Assurance Gold Fields IAR-15
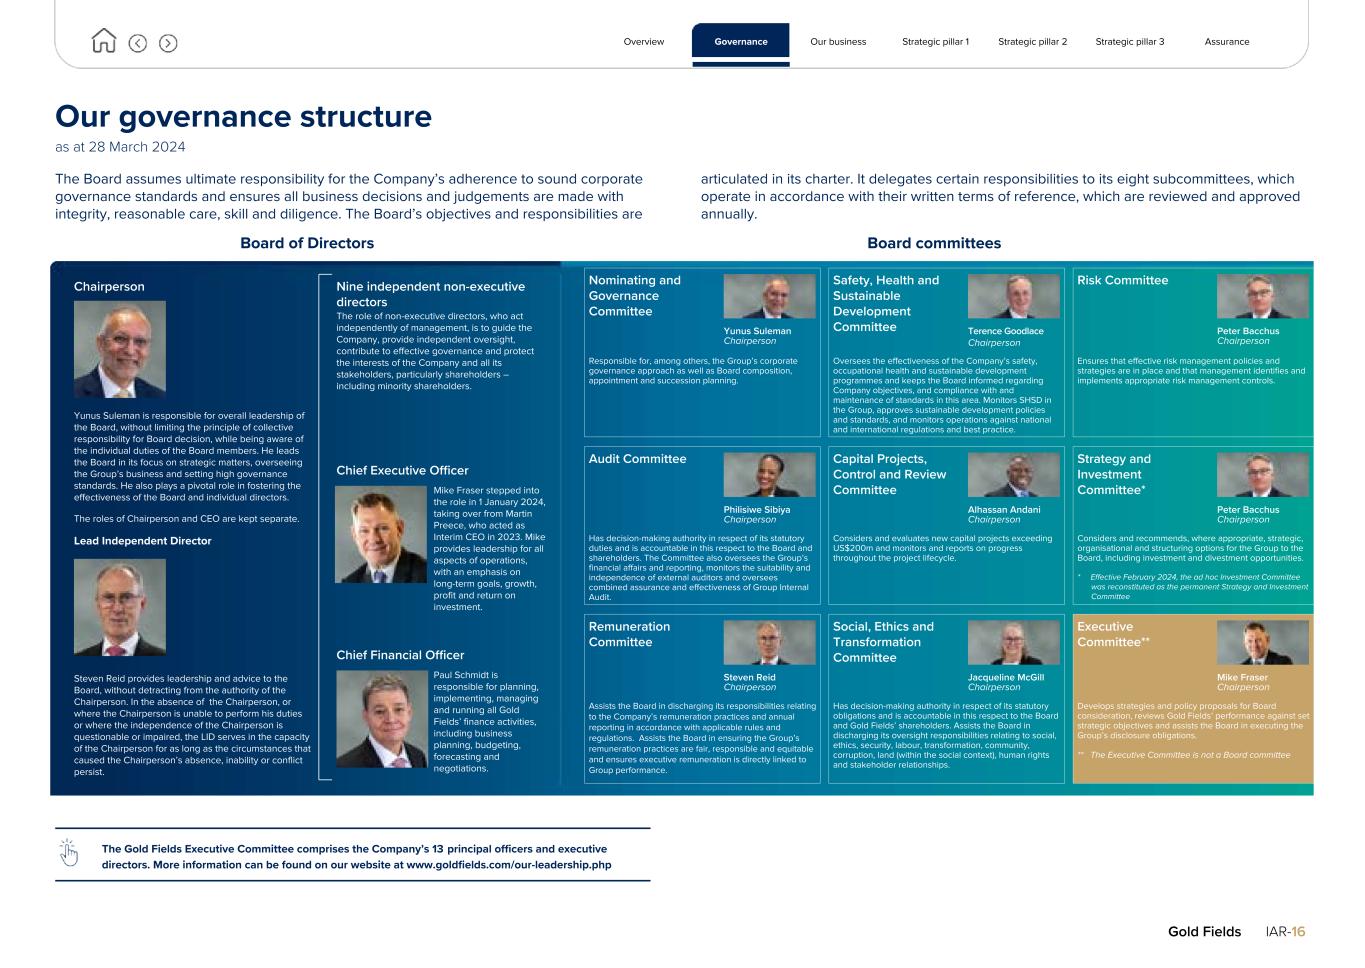
Our governance structure as at 28 March 2024 The Board assumes ultimate responsibility for the Company’s adherence to sound corporate governance standards and ensures all business decisions and judgements are made with integrity, reasonable care, skill and diligence. The Board’s objectives and responsibilities are articulated in its charter. It delegates certain responsibilities to its eight subcommittees, which operate in accordance with their written terms of reference, which are reviewed and approved annually. Board of Directors Board committees Chairperson Yunus Suleman is responsible for overall leadership of the Board, without limiting the principle of collective responsibility for Board decision, while being aware of the individual duties of the Board members. He leads the Board in its focus on strategic matters, overseeing the Group’s business and setting high governance standards. He also plays a pivotal role in fostering the effectiveness of the Board and individual directors. The roles of Chairperson and CEO are kept separate. Lead Independent Director Steven Reid provides leadership and advice to the Board, without detracting from the authority of the Chairperson. In the absence of the Chairperson, or where the Chairperson is unable to perform his duties or where the independence of the Chairperson is questionable or impaired, the LID serves in the capacity of the Chairperson for as long as the circumstances that caused the Chairperson’s absence, inability or conflict persist. Nine independent non-executive directors The role of non-executive directors, who act independently of management, is to guide the Company, provide independent oversight, contribute to effective governance and protect the interests of the Company and all its stakeholders, particularly shareholders – including minority shareholders. Chief Executive Officer Mike Fraser stepped into the role in 1 January 2024, taking over from Martin Preece, who acted as Interim CEO in 2023. Mike provides leadership for all aspects of operations, with an emphasis on long-term goals, growth, profit and return on investment. Chief Financial Officer Paul Schmidt is responsible for planning, implementing, managing and running all Gold Fields’ finance activities, including business planning, budgeting, forecasting and negotiations. The Gold Fields Executive Committee comprises the Company’s 13 principal officers and executive directors. More information can be found on our website at www.goldfields.com/our-leadership.php Overview Governance Our business Strategic pillar 1 Strategic pillar 2 Strategic pillar 3 Assurance Gold Fields IAR-16 Nominating and Governance Committee Yunus Suleman Chairperson Safety, Health and Sustainable Development Committee Terence Goodlace Chairperson Risk Committee Peter Bacchus Chairperson Responsible for, among others, the Group’s corporate governance approach as well as Board composition, appointment and succession planning. Oversees the effectiveness of the Company’s safety, occupational health and sustainable development programmes and keeps the Board informed regarding Company objectives, and compliance with and maintenance of standards in this area. Monitors SHSD in the Group, approves sustainable development policies and standards, and monitors operations against national and international regulations and best practice. Ensures that effective risk management policies and strategies are in place and that management identifies and implements appropriate risk management controls. Audit Committee Philisiwe Sibiya Chairperson Capital Projects, Control and Review Committee Alhassan Andani Chairperson Strategy and Investment Committee* Peter Bacchus Chairperson Has decision-making authority in respect of its statutory duties and is accountable in this respect to the Board and shareholders. The Committee also oversees the Group’s financial affairs and reporting, monitors the suitability and independence of external auditors and oversees combined assurance and effectiveness of Group Internal Audit. Considers and evaluates new capital projects exceeding US$200m and monitors and reports on progress throughout the project lifecycle. Considers and recommends, where appropriate, strategic, organisational and structuring options for the Group to the Board, including investment and divestment opportunities. * Effective February 2024, the ad hoc Investment Committee was reconstituted as the permanent Strategy and Investment Committee Remuneration Committee Steven Reid Chairperson Social, Ethics and Transformation Committee Jacqueline McGill Chairperson Executive Committee** Mike Fraser Chairperson Assists the Board in discharging its responsibilities relating to the Company’s remuneration practices and annual reporting in accordance with applicable rules and regulations. Assists the Board in ensuring the Group’s remuneration practices are fair, responsible and equitable and ensures executive remuneration is directly linked to Group performance. Has decision-making authority in respect of its statutory obligations and is accountable in this respect to the Board and Gold Fields’ shareholders. Assists the Board in discharging its oversight responsibilities relating to social, ethics, security, labour, transformation, community, corruption, land (within the social context), human rights and stakeholder relationships. Develops strategies and policy proposals for Board consideration, reviews Gold Fields’ performance against set strategic objectives and assists the Board in executing the Group’s disclosure obligations. ** The Executive Committee is not a Board committee
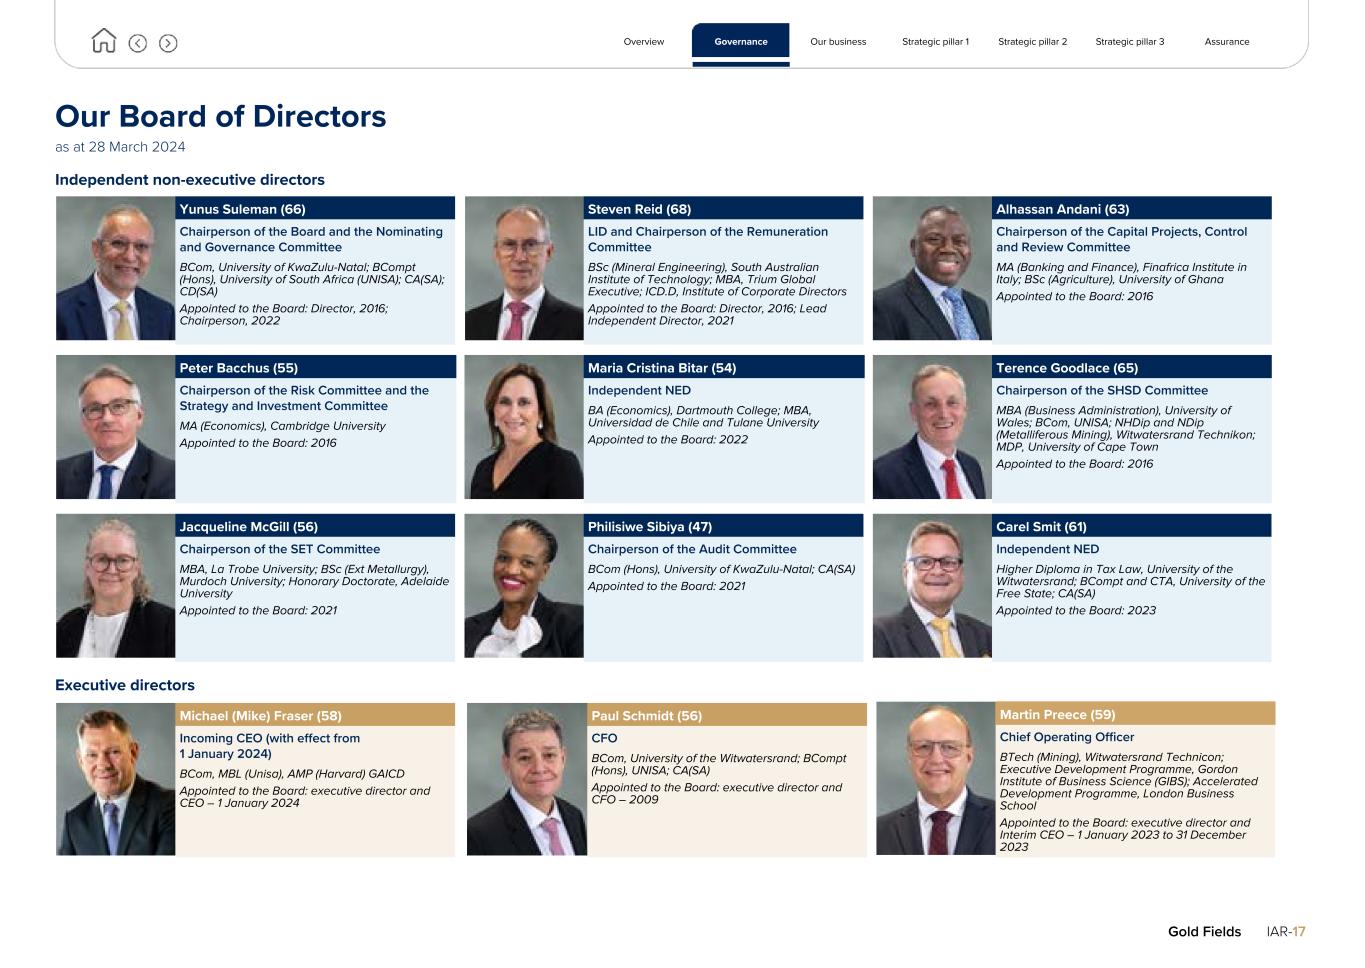
Our Board of Directors as at 28 March 2024 Independent non-executive directors Yunus Suleman (66) Chairperson of the Board and the Nominating and Governance Committee BCom, University of KwaZulu-Natal; BCompt (Hons), University of South Africa (UNISA); CA(SA); CD(SA) Appointed to the Board: Director, 2016; Chairperson, 2022 Steven Reid (68) LID and Chairperson of the Remuneration Committee BSc (Mineral Engineering), South Australian Institute of Technology; MBA, Trium Global Executive; ICD.D, Institute of Corporate Directors Appointed to the Board: Director, 2016; Lead Independent Director, 2021 Alhassan Andani (63) Chairperson of the Capital Projects, Control and Review Committee MA (Banking and Finance), Finafrica Institute in Italy; BSc (Agriculture), University of Ghana Appointed to the Board: 2016 Peter Bacchus (55) Chairperson of the Risk Committee and the Strategy and Investment Committee MA (Economics), Cambridge University Appointed to the Board: 2016 Maria Cristina Bitar (54) Independent NED BA (Economics), Dartmouth College; MBA, Universidad de Chile and Tulane University Appointed to the Board: 2022 Terence Goodlace (65) Chairperson of the SHSD Committee MBA (Business Administration), University of Wales; BCom, UNISA; NHDip and NDip (Metalliferous Mining), Witwatersrand Technikon; MDP, University of Cape Town Appointed to the Board: 2016 Jacqueline McGill (56) Chairperson of the SET Committee MBA, La Trobe University; BSc (Ext Metallurgy), Murdoch University; Honorary Doctorate, Adelaide University Appointed to the Board: 2021 Philisiwe Sibiya (47) Chairperson of the Audit Committee BCom (Hons), University of KwaZulu-Natal; CA(SA) Appointed to the Board: 2021 Carel Smit (61) Independent NED Higher Diploma in Tax Law, University of the Witwatersrand; BCompt and CTA, University of the Free State; CA(SA) Appointed to the Board: 2023 Executive directors Michael (Mike) Fraser (58) Incoming CEO (with effect from 1 January 2024) BCom, MBL (Unisa), AMP (Harvard) GAICD Appointed to the Board: executive director and CEO – 1 January 2024 Paul Schmidt (56) CFO BCom, University of the Witwatersrand; BCompt (Hons), UNISA; CA(SA) Appointed to the Board: executive director and CFO – 2009 Martin Preece (59) Chief Operating Officer BTech (Mining), Witwatersrand Technicon; Executive Development Programme, Gordon Institute of Business Science (GIBS); Accelerated Development Programme, London Business School Appointed to the Board: executive director and Interim CEO – 1 January 2023 to 31 December 2023 Overview Governance Our business Strategic pillar 1 Strategic pillar 2 Strategic pillar 3 Assurance Gold Fields IAR-17
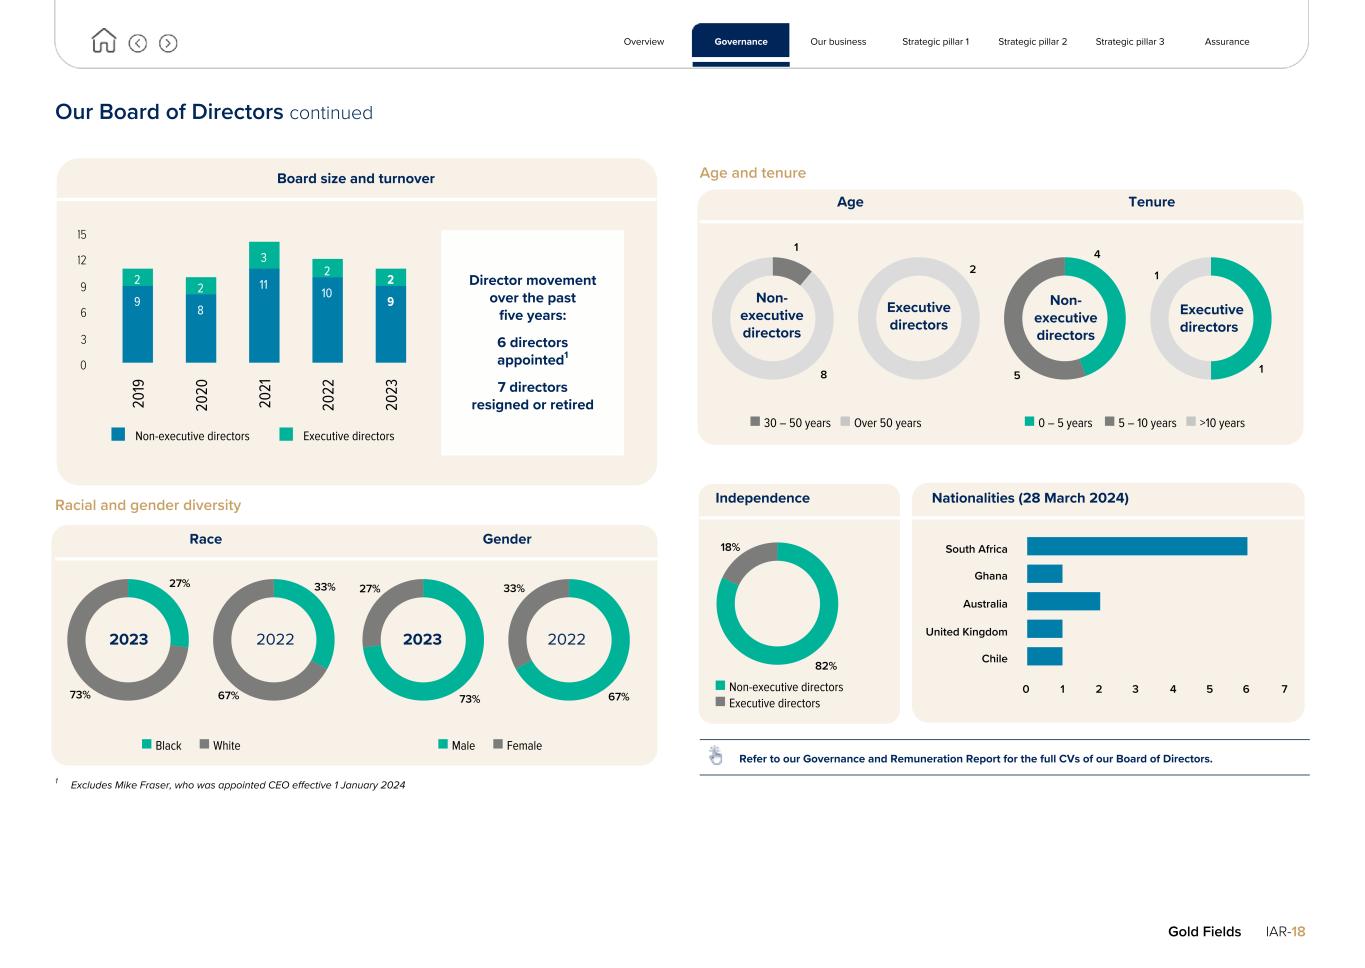
Our Board of Directors continued Board size and turnover 9 8 11 10 9 2 2 3 2 2 Non-executive directors Executive directors 20 19 20 20 20 21 20 22 20 23 0 3 6 9 12 15 Racial and gender diversity Race Gender 27% 73% 33% 67% 73% 27% 67% 33% n Black n White n Male n Female 1 Excludes Mike Fraser, who was appointed CEO effective 1 January 2024 Age and tenure Age Tenure 1 8 2 4 5 1 1 n 30 – 50 years n Over 50 years n 0 – 5 years n 5 – 10 years n >10 years Independence Nationalities (28 March 2024) 82% 18% South Africa Ghana Australia United Kingdom Chile 0 1 2 3 4 5 6 7 Refer to our Governance and Remuneration Report for the full CVs of our Board of Directors. Overview Governance Our business Strategic pillar 1 Strategic pillar 2 Strategic pillar 3 Assurance Gold Fields IAR-18 2023 20232022 2022 Non- executive directors Executive directors Executive directors Non- executive directors Director movement over the past five years: 6 directors appointed1 7 directors resigned or retired n Non-executive directors n Executive directors
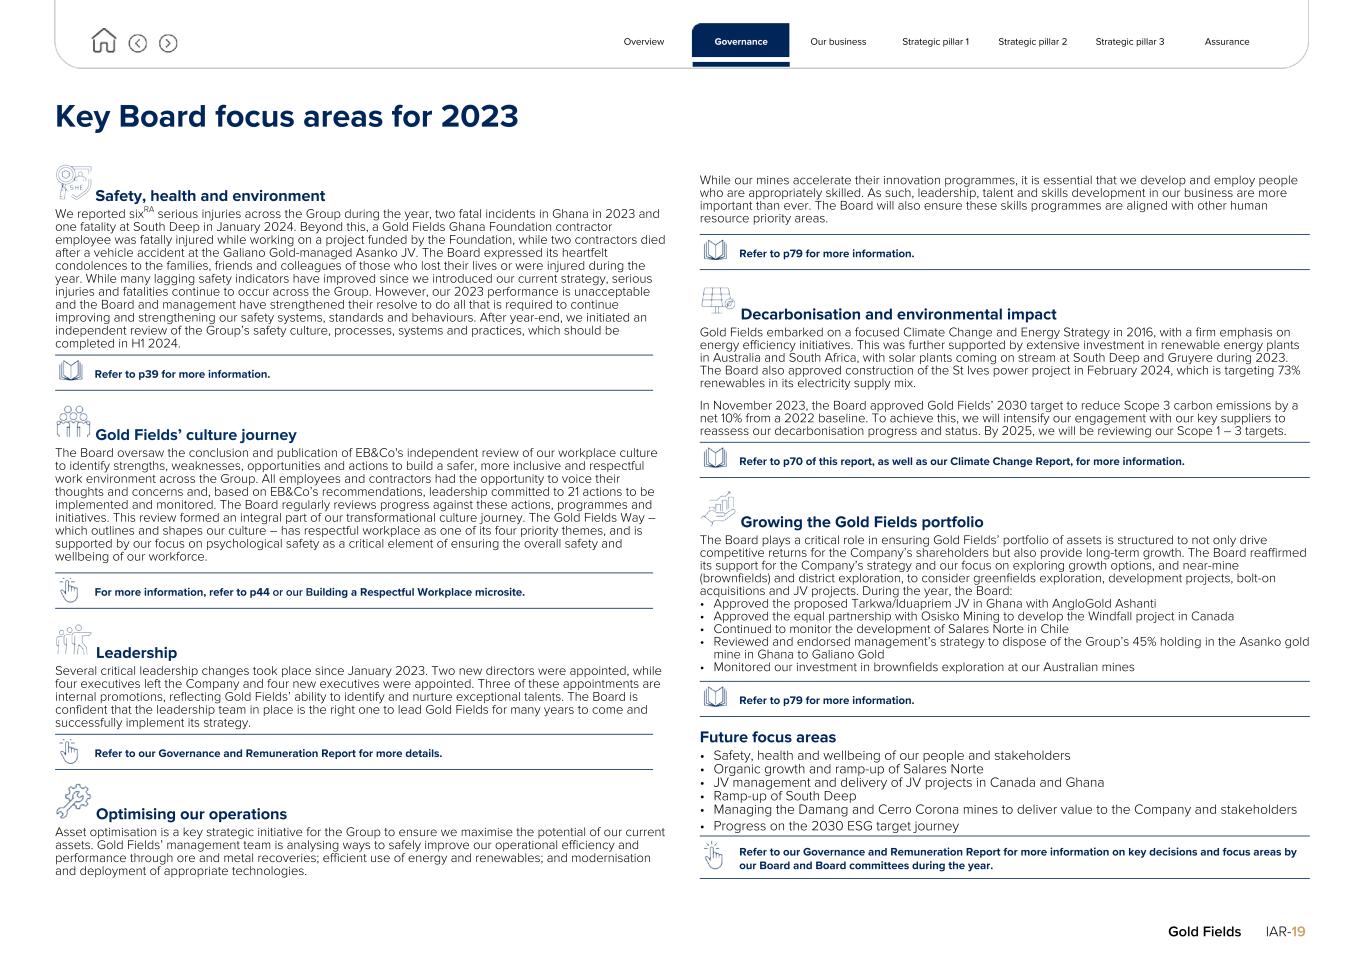
Key Board focus areas for 2023 Safety, health and environment We reported sixRA serious injuries across the Group during the year, two fatal incidents in Ghana in 2023 and one fatality at South Deep in January 2024. Beyond this, a Gold Fields Ghana Foundation contractor employee was fatally injured while working on a project funded by the Foundation, while two contractors died after a vehicle accident at the Galiano Gold-managed Asanko JV. The Board expressed its heartfelt condolences to the families, friends and colleagues of those who lost their lives or were injured during the year. While many lagging safety indicators have improved since we introduced our current strategy, serious injuries and fatalities continue to occur across the Group. However, our 2023 performance is unacceptable and the Board and management have strengthened their resolve to do all that is required to continue improving and strengthening our safety systems, standards and behaviours. After year-end, we initiated an independent review of the Group’s safety culture, processes, systems and practices, which should be completed in H1 2024. Refer to p39 for more information. Gold Fields’ culture journey The Board oversaw the conclusion and publication of EB&Co's independent review of our workplace culture to identify strengths, weaknesses, opportunities and actions to build a safer, more inclusive and respectful work environment across the Group. All employees and contractors had the opportunity to voice their thoughts and concerns and, based on EB&Co’s recommendations, leadership committed to 21 actions to be implemented and monitored. The Board regularly reviews progress against these actions, programmes and initiatives. This review formed an integral part of our transformational culture journey. The Gold Fields Way – which outlines and shapes our culture – has respectful workplace as one of its four priority themes, and is supported by our focus on psychological safety as a critical element of ensuring the overall safety and wellbeing of our workforce. For more information, refer to p44 or our Building a Respectful Workplace microsite. Leadership Several critical leadership changes took place since January 2023. Two new directors were appointed, while four executives left the Company and four new executives were appointed. Three of these appointments are internal promotions, reflecting Gold Fields’ ability to identify and nurture exceptional talents. The Board is confident that the leadership team in place is the right one to lead Gold Fields for many years to come and successfully implement its strategy. Refer to our Governance and Remuneration Report for more details. Optimising our operations Asset optimisation is a key strategic initiative for the Group to ensure we maximise the potential of our current assets. Gold Fields’ management team is analysing ways to safely improve our operational efficiency and performance through ore and metal recoveries; efficient use of energy and renewables; and modernisation and deployment of appropriate technologies. While our mines accelerate their innovation programmes, it is essential that we develop and employ people who are appropriately skilled. As such, leadership, talent and skills development in our business are more important than ever. The Board will also ensure these skills programmes are aligned with other human resource priority areas. Refer to p79 for more information. Decarbonisation and environmental impact Gold Fields embarked on a focused Climate Change and Energy Strategy in 2016, with a firm emphasis on energy efficiency initiatives. This was further supported by extensive investment in renewable energy plants in Australia and South Africa, with solar plants coming on stream at South Deep and Gruyere during 2023. The Board also approved construction of the St Ives power project in February 2024, which is targeting 73% renewables in its electricity supply mix. In November 2023, the Board approved Gold Fields’ 2030 target to reduce Scope 3 carbon emissions by a net 10% from a 2022 baseline. To achieve this, we will intensify our engagement with our key suppliers to reassess our decarbonisation progress and status. By 2025, we will be reviewing our Scope 1 – 3 targets. Refer to p70 of this report, as well as our Climate Change Report, for more information. Growing the Gold Fields portfolio The Board plays a critical role in ensuring Gold Fields’ portfolio of assets is structured to not only drive competitive returns for the Company’s shareholders but also provide long-term growth. The Board reaffirmed its support for the Company’s strategy and our focus on exploring growth options, and near-mine (brownfields) and district exploration, to consider greenfields exploration, development projects, bolt-on acquisitions and JV projects. During the year, the Board: • Approved the proposed Tarkwa/Iduapriem JV in Ghana with AngloGold Ashanti • Approved the equal partnership with Osisko Mining to develop the Windfall project in Canada • Continued to monitor the development of Salares Norte in Chile • Reviewed and endorsed management’s strategy to dispose of the Group’s 45% holding in the Asanko gold mine in Ghana to Galiano Gold • Monitored our investment in brownfields exploration at our Australian mines Refer to p79 for more information. Future focus areas • Safety, health and wellbeing of our people and stakeholders • Organic growth and ramp-up of Salares Norte • JV management and delivery of JV projects in Canada and Ghana • Ramp-up of South Deep • Managing the Damang and Cerro Corona mines to deliver value to the Company and stakeholders • Progress on the 2030 ESG target journey Refer to our Governance and Remuneration Report for more information on key decisions and focus areas by our Board and Board committees during the year. Overview Governance Our business Strategic pillar 1 Strategic pillar 2 Strategic pillar 3 Assurance Gold Fields IAR-19
Overview Governance Our business Strategic pillar 1 Strategic pillar 2 Strategic pillar 3 Assurance Gold Fields IAR-20 Our business IN THIS SECTION 21 Chief Executive Officer’s report ¢ 24 Our operating environment ¢ 25 Risks and opportunities ¢ 32 Our stakeholders ¢ 35 Material matters ¢ The processing plant at our Agnew mine in Western Australia
Chief Executive Officer’s report “Gold Fields’ success is driven by talented and dedicated people who care deeply about the work they do in pursuit of delivering value to our stakeholders.” Mike Fraser Dear stakeholders I am pleased to present my first report as Gold Fields’ CEO. Since joining the Group on 1 January 2024, I have had the opportunity to visit our operations and meet our teams. It is clear that Gold Fields’ success is driven by talented and dedicated people who care deeply about the work they do in pursuit of delivering value to all our stakeholders. I was appointed to drive the successful implementation of Gold Fields’ three-pillar strategy, which is underscored by our purpose of creating enduring value beyond mining. Our teams are making good progress in many areas, illustrated by our sound operational and financial performance in 2023, as well as the progress made toward meeting our 2030 ESG targets. Prioritising health and safety The safety and health of our people remain our first and most important value, and we are committed to getting our people home safe and healthy every day. Regrettably, we fell far short of this commitment during 2023, as we again failed to eliminate serious injuries and fatalities at our mines. Two fatalities occurred during the year at our Tarkwa mine in Ghana, both of which involved contractors. We also recorded a fatal incident during the construction of the Tarkwa and Aboso stadium, a project funded by the Gold Fields Ghana Foundation. After year-end, on 2 January 2024, a trackless mechanical supervisor at South Deep was fatally injured in an underground incident. Overview Governance Our business Strategic pillar 1 Strategic pillar 2 Strategic pillar 3 Assurance Gold Fields IAR-21 We owe it to these colleagues and all our people to improve our safety performance significantly. As a first step, we initiated an independent review of the Group’s safety culture, processes, systems and practices, which should be completed during 2024. The findings will identify gaps, high-risk areas and opportunities to accelerate our safety journey and standardise safety approaches across our business. We also appointed a dedicated Group safety executive to oversee the review and the implementation of the recommendations. Our commitment also extends to psychological health and wellbeing, which is key to building safe workplaces. In August 2023, we released the findings of EB&Co’s review of our people’s lived experiences in the workplace. We are implementing recommendations, with progress being monitored by management and the Board. We will conduct a follow-up review in 2026. We also conducted a comprehensive review of our facilities, improved our confidential reporting hotline, launched internal policies and will provide additional development opportunities to our leadership. The findings of EB&Co’s review, as well as the planned independent safety review, are integral to our ongoing transformational culture journey, which started in early 2022. 2023 financial and operational performance Once again, the Group delivered on its cost guidance despite operational challenges and persistent inflationary pressures in the industry. Group attributable production for the year was 2.304Moz – 99.7% of the year’s guidance.
Chief Executive Officer’s report continued The strong 2023 average gold price of US$1,942/oz (2022: US$1,785/oz), as well as the favourable Australian Dollar and South African Rand exchange rates, provided notable tailwinds for our financial performance. We reported normalised earnings at US$900m (2022: US$860m), generated FCF from operations of US$1,002m (2022: US$855m) and adjusted FCF of US$367m (2022: US$431m). This allowed us to maintain an unchanged total dividend of R7.45/share for 2023, equal to 40% of our normalised earnings. It also cushioned our balance sheet amid high capex spend, due to, among others, construction of Salares Norte. While net debt increased by US$320m to US$1.02bn, the net debt:EBITDA ratio remained healthy at 0.42x. We are mindful that the favourable gold price and exchange rate support will not persist. We remain committed to continuing to build a resilient business that delivers sustainable value for stakeholders, including competitive returns to shareholders, through the price cycles. Key to this is running the Group and our mines more efficiently, as high inflation in the industry in recent years has started to erode margins and asset valuations. Our asset optimisation programme is one of the key initiatives to achieve this. It is gaining traction across the Company, with each operation identifying initiatives to implement over the next two years that will improve ore movement and metal recovery, as well as optimise energy use – including renewable energy – and reduce our emissions. We expect to see the benefits from 2024 onwards. We also aim to improve how we mine by modernising our mining practices and deploying innovative technologies. This offers opportunities to upskill and reskill our people, as well as recruit individuals with the expertise required to meet the demands of an increasingly digitised working environment. We are reviewing the Group’s operating model, which currently comprises our Corporate Office, four regional offices and our nine mines and projects. In 2024, we intend to transition to a functional leadership model that will be delivered through a two-tier structure. In this way, our operations will focus on safe, consistent and profitable production. The Australian and African mines will report directly to Martin Preece, our newly appointed Chief Operating Officer, while our operations in Peru and Chile will continue to report into Luis Rivera, our EVP South America. The operations will be supported by functional leaders. These changes will enable us to align functions, reduce duplication and facilitate collaboration across the Group. Growth and capital allocation Disciplined capital allocation is integral to the delivery of our strategy. We must manage the trade-offs between short-term returns with the investment in the long-term sustainability of our business. Long-term growth is achieved by replacing Mineral Reserves from our existing assets and pursuing value-accretive growth opportunities to maximise the quality of our portfolio. Our Capital Allocation Strategy seeks to balance the following priorities: • Investment in our existing operations, directed at ensuring safe, efficient and consistent production that delivers sustainable returns • Shareholder returns, which are delivered through a base dividend of between 30% – 45% of normalised earnings in line with our Dividend Policy If there is excess cash available after that, the following priorities will be considered: • Growth of our asset base through the expansion of existing operations and the execution of strategic acquisitions. These options are evaluated based on their anticipated financial returns, as well as their potential to accelerate the delivery of our strategic priorities • Where market conditions are favourable, provide shareholders with additional returns Our production base is underpinned by our Australian assets, which we expect to continue producing approximately 1Moz per annum for at least until the end of the decade. Our Australian mines have a strong track record of replacing Mineral Reserves. During 2023, however, the region’s Proved and Probable Mineral Reserves declined by 3% to 7.7Moz. This was in line with Group Mineral Reserves, which decreased by 3% to 44.6Moz. Group attributable Mineral Resources (excluding Mineral Reserves) totalled 30.3Moz (2022: 31.1Moz). The decrease in Mineral Resources and Mineral Reserves was primarily due to depletion and cost inflation. As the largest mine in our portfolio, Tarkwa can continue delivering approximately 500koz per annum for at least the next 10 years on a standalone basis. We are currently making progress in our negotiations with the Ghanaian government for the approval of the proposed Tarkwa/Iduapriem JV with AngloGold Ashanti. If approved, we expect to further leverage operating efficiencies to unlock higher production rates and grades to extend the life-of-mine of the combined operation to at least 18 years, making this a cornerstone asset in our business. We are managing the future of Damang and Cerro Corona, both of which are reaching the end of their lives. Our approach is to deliver value for Gold Fields while being responsible toward the relevant stakeholders. The recent sale of our 45% interest in Asanko to our JV partner Galiano Gold – as well as the disposal of our 24% interest in Rusoro Mining – demonstrates our commitment to actively manage the assets within the portfolio. Our CEO’s review of each strategic pillar can be found on the following pages: Strategic pillar 1: Maximise the potential from our current assets through people and innovation Strategic pillar 2: Build on our leading commitment to ESG Strategic pillar 3: Grow the value and quality of our portfolio of assets Explore strategic pillar 1 on p36 Explore strategic pillar 2 on p54 Explore strategic pillar 3 on p77 Overview Governance Our business Strategic pillar 1 Strategic pillar 2 Strategic pillar 3 Assurance Gold Fields IAR-22
Chief Executive Officer’s report continued Growth beyond the Group’s core portfolio will be driven by Salares Norte in Chile, which is set to achieve first gold in April 2024. This world-class mine will boost long-term Group production and also significantly improve our cost profile. In May 2023, we announced our 50/50 partnership with Osisko Mining to develop and mine the underground Windfall project in Québec, Canada. This is a unique opportunity for Gold Fields to co-develop and operate a world-class ore body in a sought-after mining jurisdiction. Subject to completing studies to enhance detail of the project’s engineering, costing, execution and management plans and achieving environmental approvals (expected by Q1 2025), the project is expected to start producing gold by Q4 2026. Other longer-term growth opportunities will include greenfields exploration targets, development projects and bolt-on acquisitions of producing assets. Our greenfields exploration strategy will include taking minority stakes in junior exploration companies, as we have done with Great Southern Mining in Australia, Tesoro Gold and Torg Resources in Chile and Chakana Copper in Peru. It is unlikely that Gold Fields will pursue large-scale mergers or acquisitions at a premium in the near future. Acquisitions of this nature have become more expensive as global gold production inches toward its peak and exploration activities yield limited success. Changes to our leadership We saw several key leadership changes within the Company in 2023 and early 2024. More appointments will follow in the year ahead, given the retirement of Paul Schmidt as CFO, Stuart Mathews as EVP Australia and Naseem Chohan as EVP Sustainable Development. The searches to fill the CFO and EVP Sustainable Development positions are well underway, while filling the Australia role will await the outcome of the new operating model structure. On 1 January 2024, I succeeded Martin Preece, who served as Interim CEO in 2023. Martin ensured a seamless leadership transition, and remains with the Company as Chief Operating Officer for the Australian and African mines. Martin’s knowledge of our operations and people will be invaluable in this role. During 2023, four EVPs left the Company and were replaced. Three of these appointments – Kelly Carter, EVP Legal and Compliance; Francois Swanepoel, Chief Technical Officer; and Benford Mokoatle, EVP South Africa – were internal promotions, reflecting Gold Fields’ ability to identify and nurture leaders from within its ranks. In addition, Jongisa Magagula was recruited from outside the Company as EVP Investor Relations and Corporate Affairs. As at 28 March 2024, only two members of the Executive Committee were still serving in an acting capacity. Delivering on our ESG commitments Gold Fields has embedded ESG into its operations and set 2030 targets for six priority areas. Three of these relate to our people and stakeholders – safety, wellbeing and environment; gender diversity; and stakeholder value creation – while three relate to environmental issues that also impact our stakeholders – decarbonisation; tailings management; and water stewardship. During 2023, we made notable progress across each of these. Female representation was 25% at year-end (2022: 23%), over 50% of which are women in core mining roles. We distributed US$3.8bn in value to national economies. Of this, US$1bn – 33% of the total – was shared with our host communities through employment and procurement, as well as SED investments. Gold Fields made significant strides in its decarbonisation journey. Scope 1 and 2 emissions declined by 5% from 2022, a reduction made possible by our investments in renewable electricity projects over the past four years. Renewable energy accounted for 17% (2022: 13%) of the Group’s total electricity consumption and 100% of electricity usage by Cerro Corona in Peru, 50% of Agnew in Australia and 15% of South Deep in South Africa. We are taking meaningful steps toward our 2030 target of reducing emissions by 30% from our 2016 baseline. At year-end, we were 4% below this baseline. In February 2024, our Board approved the renewable power project at St Ives at a cost of approximately A$296m (US$195m). The final renewables hub will be the largest in the Group’s portfolio and is expected to provide 73% of St Ives’ energy requirements once operational toward the end of 2025. It is set to help reduce the mine’s Scope 1 and 2 emissions by an estimated 50% in 2030 against the 2016 baseline, while increasing the renewables component in the Group electricity mix to 24%. Our future renewables projects will be evaluated in line with our Capital Allocation Framework, as these investments generally provide the business with enhanced supply security and cheaper electricity, in addition to the environmental benefits they bring. In November 2023, we announced our 2030 target of reducing Scope 3 emissions by a net 10% from a 2022 base. Outlook and 2024 guidance Given the safety challenges we are experiencing, our top priority will be to ensure the physical and psychological safety and wellbeing of our people. We will also focus on: • Safe delivery against our production and cost guidance for the year • Delivering the Salares Norte ramp-up • Making progress toward our 2030 ESG targets • Continuing to improve the value and quality of our portfolio • Finalising the leadership team and implementing our new operating model For 2024, we expect attributable gold- equivalent production (excluding Asanko) of 2.33Moz – 2.43Moz (2023: 2.24Moz). AISC is guided at US$1,410/oz – US$1,460/oz, and AIC at US$1,600/oz – US$1,650/oz. This year will, once again, see significant capex given the remaining project capital at Salares Norte, the likely investment at the Windfall project and the renewables power project at St Ives, as well as the elevated level of sustaining capex across the portfolio to maintain the Group’s production base. We expect total capex of US$1.130bn – US$1.190bn, of which sustaining capital is set to comprise US$860m – US$890m. The increase in sustaining capital from US$692m in 2023 is driven largely by: • US$132m for St Ives’ renewable power project • Increased development and infrastructure capital at St Ives, particularly for the Invincible expansion • Increased capital waste stripping at Gruyere • Mine infrastructure upgrades and fleet replacement at South Deep Note of thanks When I joined the Group in January 2024, my fellow directors and Executive Committee members were there to support the transition. Martin Preece, in particular, was extremely generous with his time, experience and knowledge to help me settle into my new role. I am delighted that he is staying on as a critical member of our executive team. I would like to express my sincere gratitude to my fellow directors – particularly our Chairperson, Yunus Suleman – for providing guidance and support in my first few months. As I get to know my colleagues across the countries where we operate, I am gaining a deep appreciation for our people’s commitment, knowledge and experience. The smooth operation of our mines despite external challenges is a credit to our strong operational and functional teams. I look forward to what lies ahead in 2024 and beyond. Mike Fraser Chief Executive Officer Overview Governance Our business Strategic pillar 1 Strategic pillar 2 Strategic pillar 3 Assurance Gold Fields IAR-23
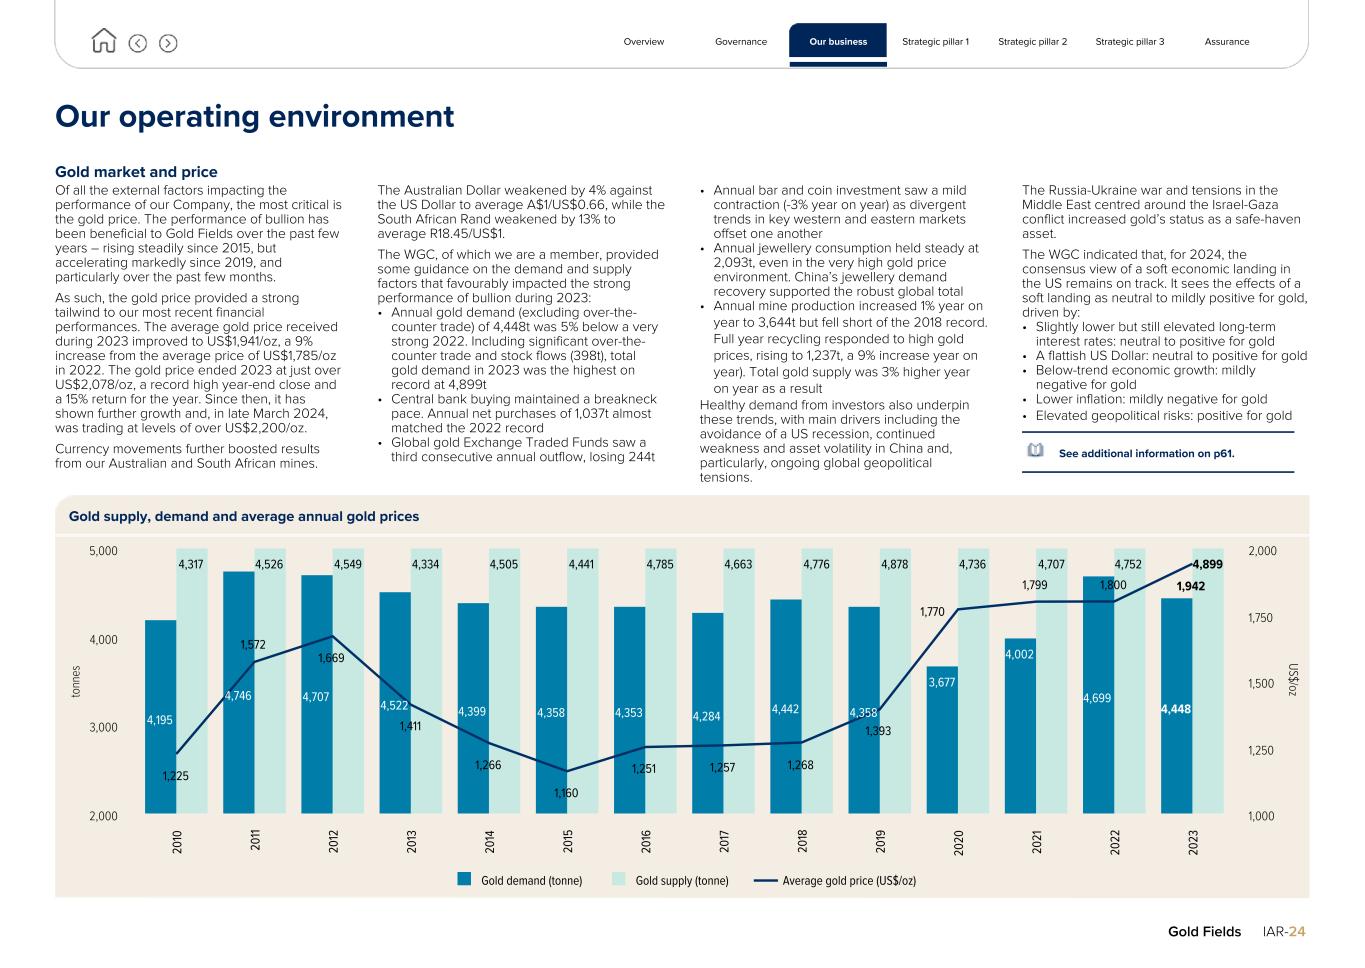
Our operating environment Gold market and price Of all the external factors impacting the performance of our Company, the most critical is the gold price. The performance of bullion has been beneficial to Gold Fields over the past few years – rising steadily since 2015, but accelerating markedly since 2019, and particularly over the past few months. As such, the gold price provided a strong tailwind to our most recent financial performances. The average gold price received during 2023 improved to US$1,941/oz, a 9% increase from the average price of US$1,785/oz in 2022. The gold price ended 2023 at just over US$2,078/oz, a record high year-end close and a 15% return for the year. Since then, it has shown further growth and, in late March 2024, was trading at levels of over US$2,200/oz. Currency movements further boosted results from our Australian and South African mines. The Australian Dollar weakened by 4% against the US Dollar to average A$1/US$0.66, while the South African Rand weakened by 13% to average R18.45/US$1. The WGC, of which we are a member, provided some guidance on the demand and supply factors that favourably impacted the strong performance of bullion during 2023: • Annual gold demand (excluding over-the- counter trade) of 4,448t was 5% below a very strong 2022. Including significant over-the- counter trade and stock flows (398t), total gold demand in 2023 was the highest on record at 4,899t • Central bank buying maintained a breakneck pace. Annual net purchases of 1,037t almost matched the 2022 record • Global gold Exchange Traded Funds saw a third consecutive annual outflow, losing 244t • Annual bar and coin investment saw a mild contraction (-3% year on year) as divergent trends in key western and eastern markets offset one another • Annual jewellery consumption held steady at 2,093t, even in the very high gold price environment. China’s jewellery demand recovery supported the robust global total • Annual mine production increased 1% year on year to 3,644t but fell short of the 2018 record. Full year recycling responded to high gold prices, rising to 1,237t, a 9% increase year on year). Total gold supply was 3% higher year on year as a result Healthy demand from investors also underpin these trends, with main drivers including the avoidance of a US recession, continued weakness and asset volatility in China and, particularly, ongoing global geopolitical tensions. The Russia-Ukraine war and tensions in the Middle East centred around the Israel-Gaza conflict increased gold’s status as a safe-haven asset. The WGC indicated that, for 2024, the consensus view of a soft economic landing in the US remains on track. It sees the effects of a soft landing as neutral to mildly positive for gold, driven by: • Slightly lower but still elevated long-term interest rates: neutral to positive for gold • A flattish US Dollar: neutral to positive for gold • Below-trend economic growth: mildly negative for gold • Lower inflation: mildly negative for gold • Elevated geopolitical risks: positive for gold See additional information on p61. Gold supply, demand and average annual gold prices to nn es US$/oz 4,195 4,746 4,707 4,522 4,399 4,358 4,353 4,284 4,442 4,358 3,677 4,002 4,699 4,448 4,317 4,526 4,549 4,334 4,505 4,441 4,785 4,663 4,776 4,878 4,736 4,707 4,752 4,899 1,225 1,572 1,669 1,411 1,266 1,160 1,251 1,257 1,268 1,393 1,770 1,799 1,800 1,942 Gold demand (tonne) Gold supply (tonne) Average gold price (US$/oz) 20 10 20 11 20 12 20 13 20 14 20 15 20 16 20 17 20 18 20 19 20 20 20 21 20 22 20 23 2,000 3,000 4,000 5,000 1,000 1,250 1,500 1,750 2,000 Overview Governance Our business Strategic pillar 1 Strategic pillar 2 Strategic pillar 3 Assurance Gold Fields IAR-24
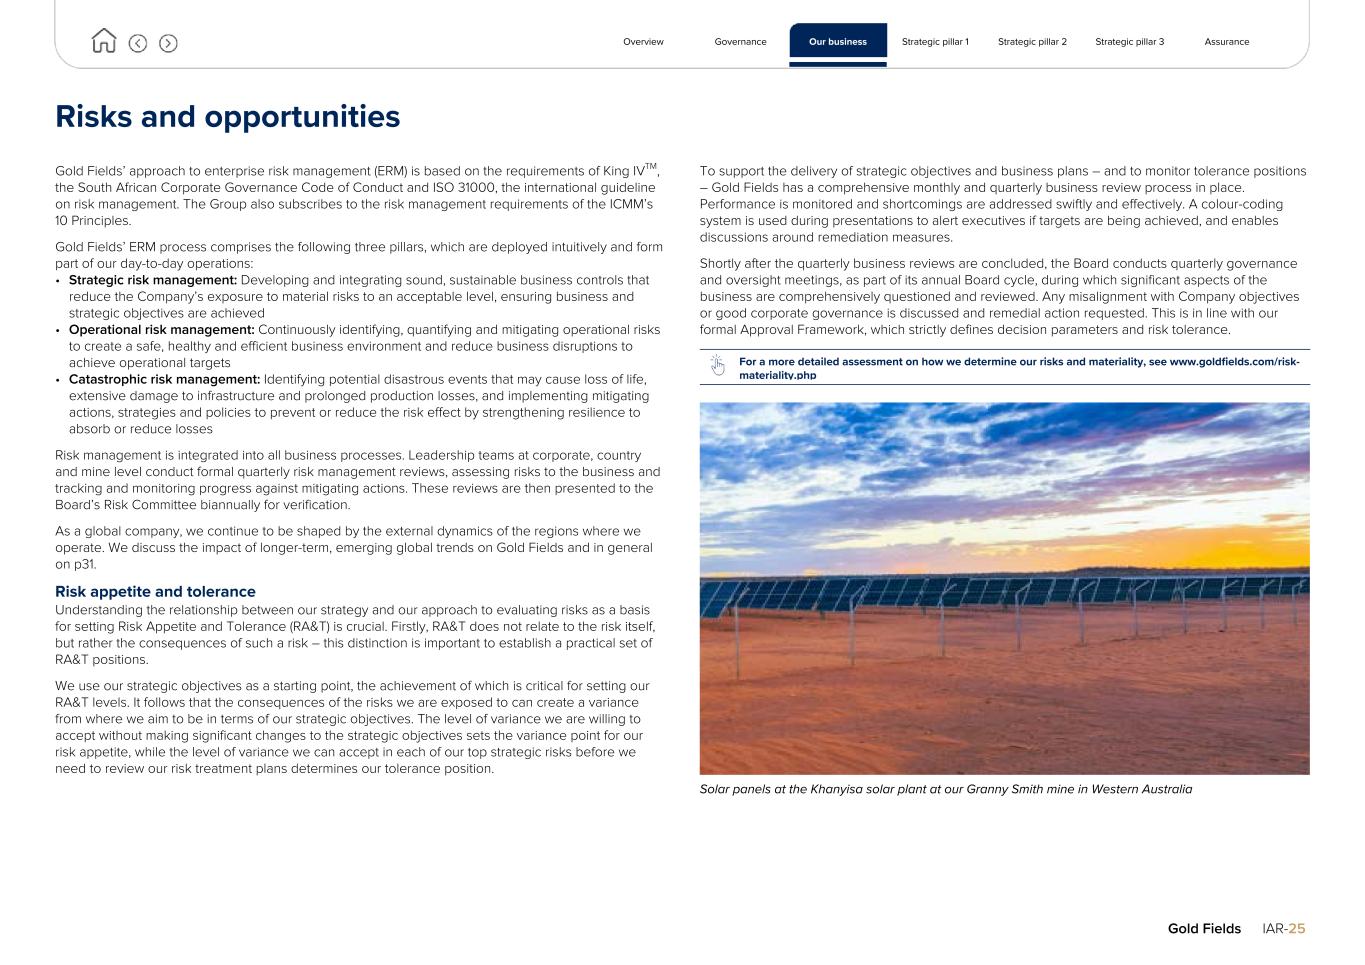
Risks and opportunities Gold Fields’ approach to enterprise risk management (ERM) is based on the requirements of King IVTM, the South African Corporate Governance Code of Conduct and ISO 31000, the international guideline on risk management. The Group also subscribes to the risk management requirements of the ICMM’s 10 Principles. Gold Fields’ ERM process comprises the following three pillars, which are deployed intuitively and form part of our day-to-day operations: • Strategic risk management: Developing and integrating sound, sustainable business controls that reduce the Company’s exposure to material risks to an acceptable level, ensuring business and strategic objectives are achieved • Operational risk management: Continuously identifying, quantifying and mitigating operational risks to create a safe, healthy and efficient business environment and reduce business disruptions to achieve operational targets • Catastrophic risk management: Identifying potential disastrous events that may cause loss of life, extensive damage to infrastructure and prolonged production losses, and implementing mitigating actions, strategies and policies to prevent or reduce the risk effect by strengthening resilience to absorb or reduce losses Risk management is integrated into all business processes. Leadership teams at corporate, country and mine level conduct formal quarterly risk management reviews, assessing risks to the business and tracking and monitoring progress against mitigating actions. These reviews are then presented to the Board’s Risk Committee biannually for verification. As a global company, we continue to be shaped by the external dynamics of the regions where we operate. We discuss the impact of longer-term, emerging global trends on Gold Fields and in general on p31. Risk appetite and tolerance Understanding the relationship between our strategy and our approach to evaluating risks as a basis for setting Risk Appetite and Tolerance (RA&T) is crucial. Firstly, RA&T does not relate to the risk itself, but rather the consequences of such a risk – this distinction is important to establish a practical set of RA&T positions. We use our strategic objectives as a starting point, the achievement of which is critical for setting our RA&T levels. It follows that the consequences of the risks we are exposed to can create a variance from where we aim to be in terms of our strategic objectives. The level of variance we are willing to accept without making significant changes to the strategic objectives sets the variance point for our risk appetite, while the level of variance we can accept in each of our top strategic risks before we need to review our risk treatment plans determines our tolerance position. To support the delivery of strategic objectives and business plans – and to monitor tolerance positions – Gold Fields has a comprehensive monthly and quarterly business review process in place. Performance is monitored and shortcomings are addressed swiftly and effectively. A colour-coding system is used during presentations to alert executives if targets are being achieved, and enables discussions around remediation measures. Shortly after the quarterly business reviews are concluded, the Board conducts quarterly governance and oversight meetings, as part of its annual Board cycle, during which significant aspects of the business are comprehensively questioned and reviewed. Any misalignment with Company objectives or good corporate governance is discussed and remedial action requested. This is in line with our formal Approval Framework, which strictly defines decision parameters and risk tolerance. For a more detailed assessment on how we determine our risks and materiality, see www.goldfields.com/risk- materiality.php Solar panels at the Khanyisa solar plant at our Granny Smith mine in Western Australia Overview Governance Our business Strategic pillar 1 Strategic pillar 2 Strategic pillar 3 Assurance Gold Fields IAR-25
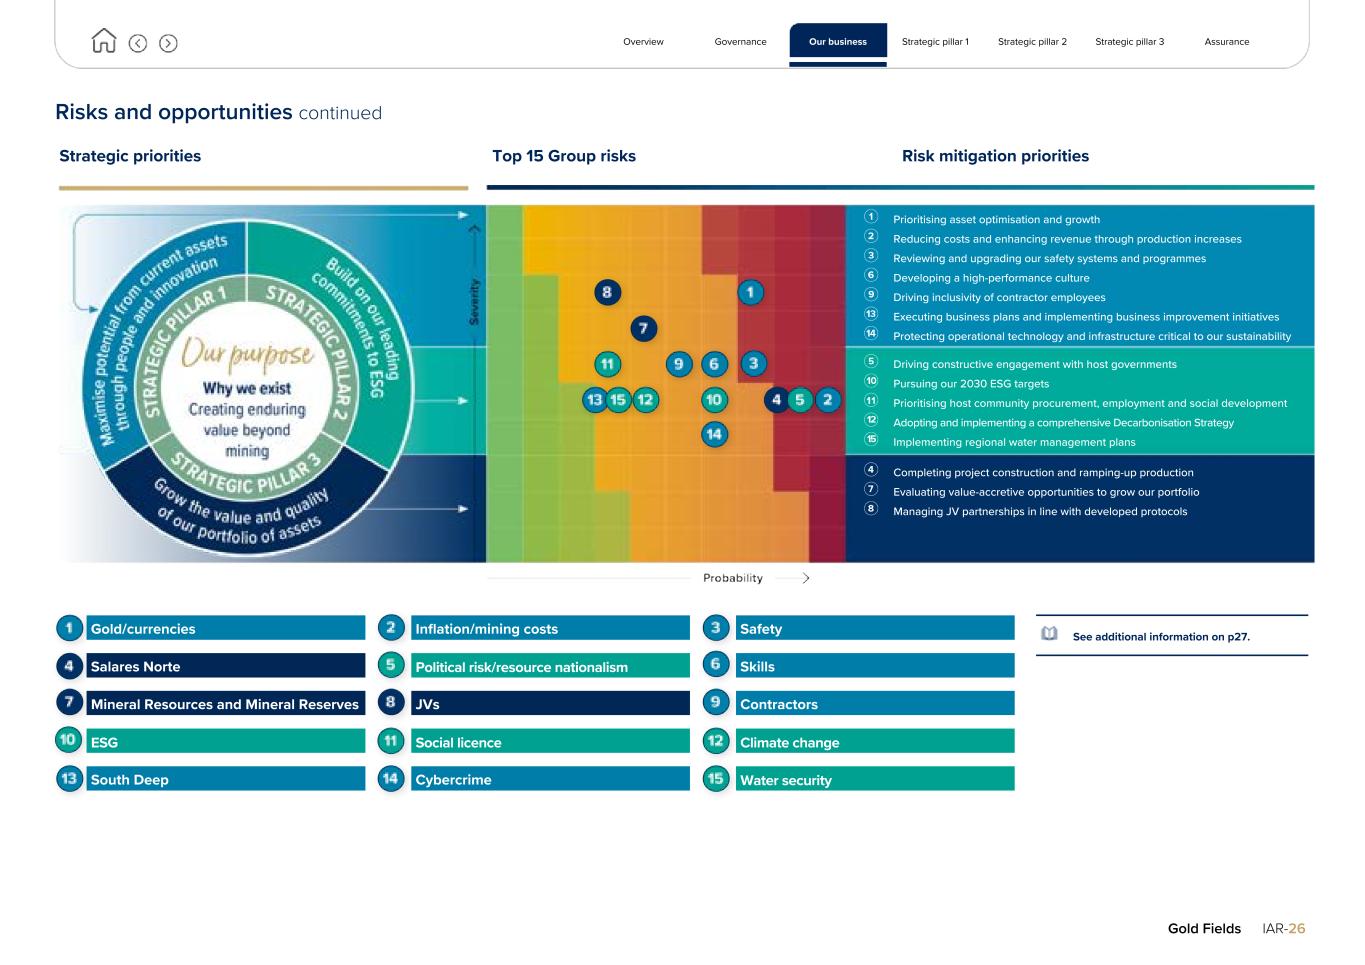
Risks and opportunities continued Strategic priorities Top 15 Group risks Risk mitigation priorities Overview Governance Our business Strategic pillar 1 Strategic pillar 2 Strategic pillar 3 Assurance Gold Fields IAR-26 Prioritising asset optimisation and growth Reducing costs and enhancing revenue through production increases Reviewing and upgrading our safety systems and programmes Developing a high-performance culture Driving inclusivity of contractor employees Executing business plans and implementing business improvement initiatives Protecting operational technology and infrastructure critical to our sustainability Driving constructive engagement with host governments Pursuing our 2030 ESG targets Prioritising host community procurement, employment and social development Adopting and implementing a comprehensive Decarbonisation Strategy Implementing regional water management plans Completing project construction and ramping-up production Evaluating value-accretive opportunities to grow our portfolio Managing JV partnerships in line with developed protocols See additional information on p27.Gold/currencies Inflation/mining costs Safety Salares Norte Political risk/resource nationalism Skills Mineral Resources and Mineral Reserves JVs Contractors ESG Social licence Climate change South Deep Cybercrime Water security
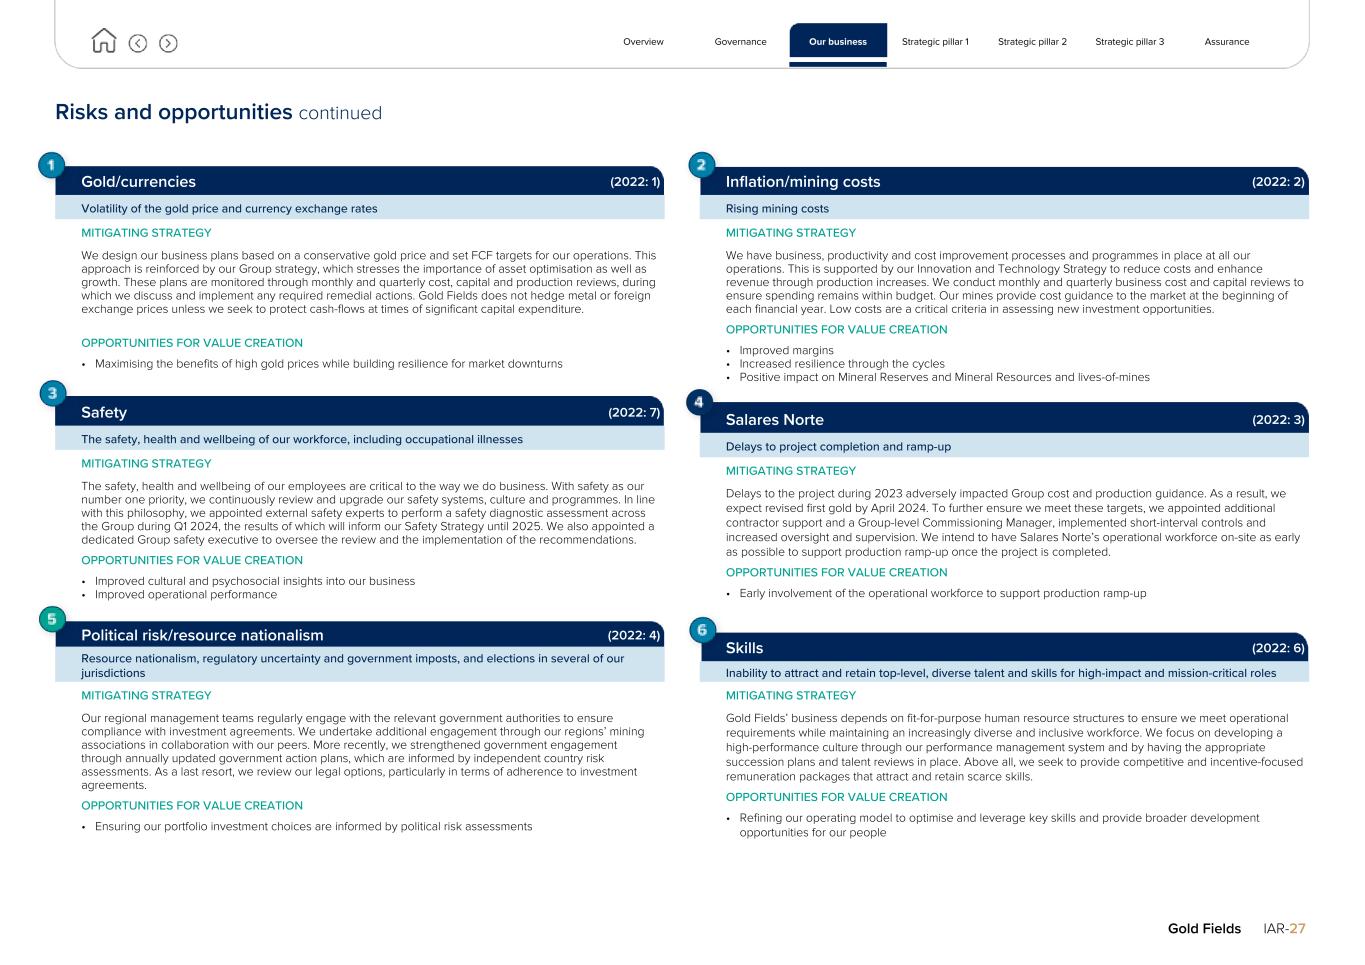
Risks and opportunities continued Gold/currencies (2022: 1) Volatility of the gold price and currency exchange rates MITIGATING STRATEGY We design our business plans based on a conservative gold price and set FCF targets for our operations. This approach is reinforced by our Group strategy, which stresses the importance of asset optimisation as well as growth. These plans are monitored through monthly and quarterly cost, capital and production reviews, during which we discuss and implement any required remedial actions. Gold Fields does not hedge metal or foreign exchange prices unless we seek to protect cash-flows at times of significant capital expenditure. OPPORTUNITIES FOR VALUE CREATION • Maximising the benefits of high gold prices while building resilience for market downturns Safety (2022: 7) The safety, health and wellbeing of our workforce, including occupational illnesses MITIGATING STRATEGY The safety, health and wellbeing of our employees are critical to the way we do business. With safety as our number one priority, we continuously review and upgrade our safety systems, culture and programmes. In line with this philosophy, we appointed external safety experts to perform a safety diagnostic assessment across the Group during Q1 2024, the results of which will inform our Safety Strategy until 2025. We also appointed a dedicated Group safety executive to oversee the review and the implementation of the recommendations. OPPORTUNITIES FOR VALUE CREATION • Improved cultural and psychosocial insights into our business • Improved operational performance Political risk/resource nationalism (2022: 4) Resource nationalism, regulatory uncertainty and government imposts, and elections in several of our jurisdictions MITIGATING STRATEGY Our regional management teams regularly engage with the relevant government authorities to ensure compliance with investment agreements. We undertake additional engagement through our regions’ mining associations in collaboration with our peers. More recently, we strengthened government engagement through annually updated government action plans, which are informed by independent country risk assessments. As a last resort, we review our legal options, particularly in terms of adherence to investment agreements. OPPORTUNITIES FOR VALUE CREATION • Ensuring our portfolio investment choices are informed by political risk assessments Inflation/mining costs (2022: 2) Rising mining costs MITIGATING STRATEGY We have business, productivity and cost improvement processes and programmes in place at all our operations. This is supported by our Innovation and Technology Strategy to reduce costs and enhance revenue through production increases. We conduct monthly and quarterly business cost and capital reviews to ensure spending remains within budget. Our mines provide cost guidance to the market at the beginning of each financial year. Low costs are a critical criteria in assessing new investment opportunities. OPPORTUNITIES FOR VALUE CREATION • Improved margins • Increased resilience through the cycles • Positive impact on Mineral Reserves and Mineral Resources and lives-of-mines Salares Norte (2022: 3) Delays to project completion and ramp-up MITIGATING STRATEGY Delays to the project during 2023 adversely impacted Group cost and production guidance. As a result, we expect revised first gold by April 2024. To further ensure we meet these targets, we appointed additional contractor support and a Group-level Commissioning Manager, implemented short-interval controls and increased oversight and supervision. We intend to have Salares Norte’s operational workforce on-site as early as possible to support production ramp-up once the project is completed. OPPORTUNITIES FOR VALUE CREATION • Early involvement of the operational workforce to support production ramp-up Skills (2022: 6) Inability to attract and retain top-level, diverse talent and skills for high-impact and mission-critical roles MITIGATING STRATEGY Gold Fields’ business depends on fit-for-purpose human resource structures to ensure we meet operational requirements while maintaining an increasingly diverse and inclusive workforce. We focus on developing a high-performance culture through our performance management system and by having the appropriate succession plans and talent reviews in place. Above all, we seek to provide competitive and incentive-focused remuneration packages that attract and retain scarce skills. OPPORTUNITIES FOR VALUE CREATION • Refining our operating model to optimise and leverage key skills and provide broader development opportunities for our people Overview Governance Our business Strategic pillar 1 Strategic pillar 2 Strategic pillar 3 Assurance Gold Fields IAR-27
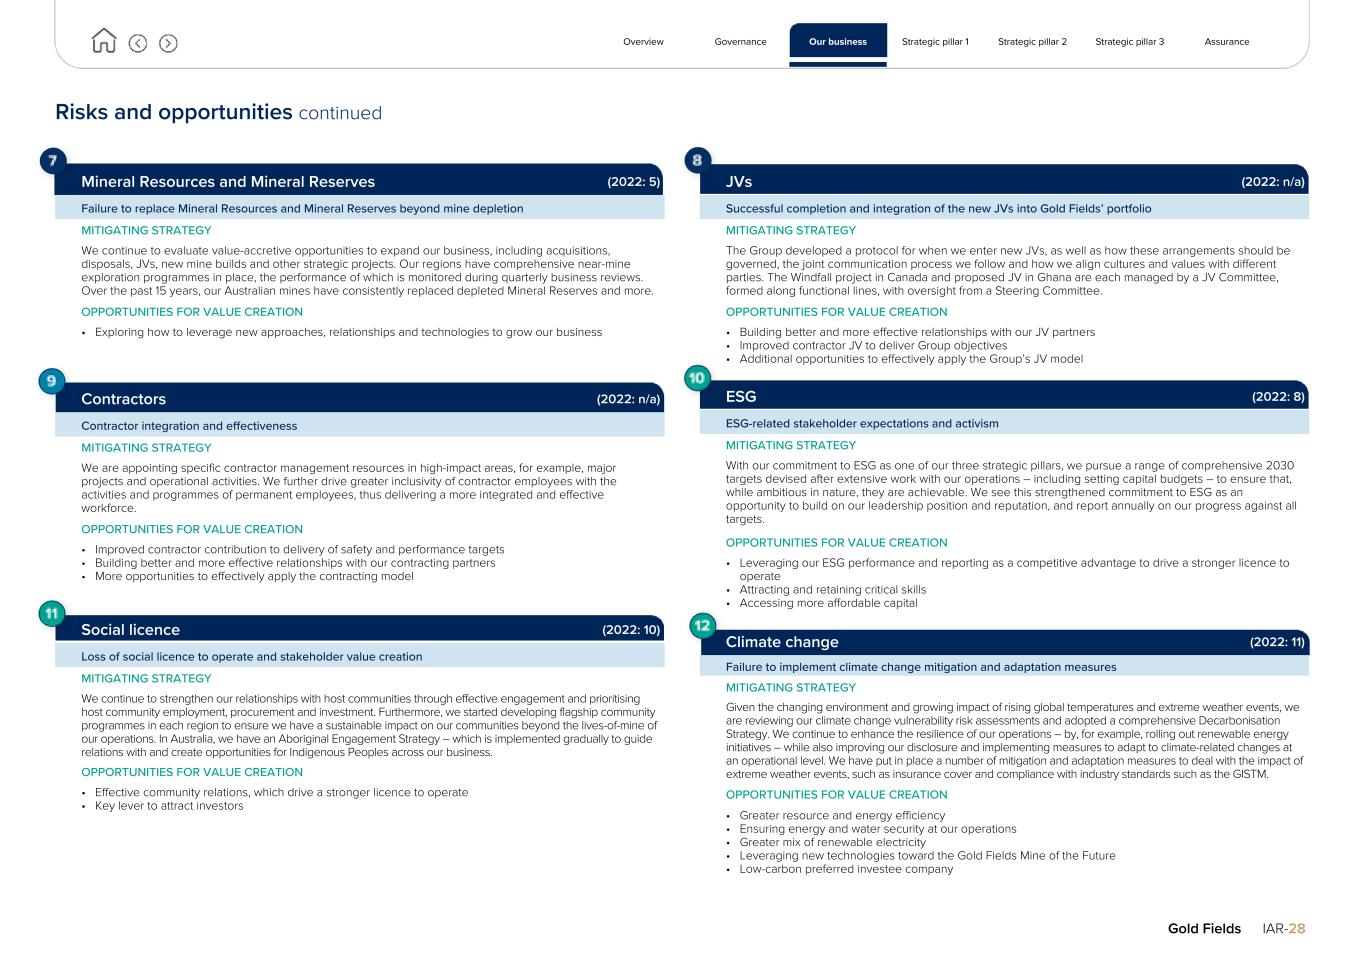
Risks and opportunities continued Mineral Resources and Mineral Reserves (2022: 5) Failure to replace Mineral Resources and Mineral Reserves beyond mine depletion MITIGATING STRATEGY We continue to evaluate value-accretive opportunities to expand our business, including acquisitions, disposals, JVs, new mine builds and other strategic projects. Our regions have comprehensive near-mine exploration programmes in place, the performance of which is monitored during quarterly business reviews. Over the past 15 years, our Australian mines have consistently replaced depleted Mineral Reserves and more. OPPORTUNITIES FOR VALUE CREATION • Exploring how to leverage new approaches, relationships and technologies to grow our business Contractors (2022: n/a) Contractor integration and effectiveness MITIGATING STRATEGY We are appointing specific contractor management resources in high-impact areas, for example, major projects and operational activities. We further drive greater inclusivity of contractor employees with the activities and programmes of permanent employees, thus delivering a more integrated and effective workforce. OPPORTUNITIES FOR VALUE CREATION • Improved contractor contribution to delivery of safety and performance targets • Building better and more effective relationships with our contracting partners • More opportunities to effectively apply the contracting model Social licence (2022: 10) Loss of social licence to operate and stakeholder value creation MITIGATING STRATEGY We continue to strengthen our relationships with host communities through effective engagement and prioritising host community employment, procurement and investment. Furthermore, we started developing flagship community programmes in each region to ensure we have a sustainable impact on our communities beyond the lives-of-mine of our operations. In Australia, we have an Aboriginal Engagement Strategy – which is implemented gradually to guide relations with and create opportunities for Indigenous Peoples across our business. OPPORTUNITIES FOR VALUE CREATION • Effective community relations, which drive a stronger licence to operate • Key lever to attract investors JVs (2022: n/a) Successful completion and integration of the new JVs into Gold Fields’ portfolio MITIGATING STRATEGY The Group developed a protocol for when we enter new JVs, as well as how these arrangements should be governed, the joint communication process we follow and how we align cultures and values with different parties. The Windfall project in Canada and proposed JV in Ghana are each managed by a JV Committee, formed along functional lines, with oversight from a Steering Committee. OPPORTUNITIES FOR VALUE CREATION • Building better and more effective relationships with our JV partners • Improved contractor JV to deliver Group objectives • Additional opportunities to effectively apply the Group’s JV model ESG (2022: 8) ESG-related stakeholder expectations and activism MITIGATING STRATEGY With our commitment to ESG as one of our three strategic pillars, we pursue a range of comprehensive 2030 targets devised after extensive work with our operations – including setting capital budgets – to ensure that, while ambitious in nature, they are achievable. We see this strengthened commitment to ESG as an opportunity to build on our leadership position and reputation, and report annually on our progress against all targets. OPPORTUNITIES FOR VALUE CREATION • Leveraging our ESG performance and reporting as a competitive advantage to drive a stronger licence to operate • Attracting and retaining critical skills • Accessing more affordable capital Climate change (2022: 11) Failure to implement climate change mitigation and adaptation measures MITIGATING STRATEGY Given the changing environment and growing impact of rising global temperatures and extreme weather events, we are reviewing our climate change vulnerability risk assessments and adopted a comprehensive Decarbonisation Strategy. We continue to enhance the resilience of our operations – by, for example, rolling out renewable energy initiatives – while also improving our disclosure and implementing measures to adapt to climate-related changes at an operational level. We have put in place a number of mitigation and adaptation measures to deal with the impact of extreme weather events, such as insurance cover and compliance with industry standards such as the GISTM. OPPORTUNITIES FOR VALUE CREATION • Greater resource and energy efficiency • Ensuring energy and water security at our operations • Greater mix of renewable electricity • Leveraging new technologies toward the Gold Fields Mine of the Future • Low-carbon preferred investee company Overview Governance Our business Strategic pillar 1 Strategic pillar 2 Strategic pillar 3 Assurance Gold Fields IAR-28
Risks and opportunities continued South Deep (2022: 14) Failure to maintain performance momentum and alignment with the build-up plan MITIGATING STRATEGY The South Deep team will continue to implement its management systems to drive disciplined execution of the mine’s plans while implementing business improvement initiatives across the value chain. Performance against agreed targets and milestones is measured monthly and reported quarterly to the Corporate Office and the Group’s Board. OPPORTUNITIES FOR VALUE CREATION • Establishing a robust mine planning process as a fundamental driver of performance Cybercrime (2022: 12) Cybercrime/loss of information and communication technologies (ICT) data MITIGATING STRATEGY We continue to protect operational technology to decrease disruptions and ensure business continuity. Due to the dramatic increase in cybercrime globally, we implemented a software platform across the Group to safeguard infrastructure critical to our sustainability. All our mines and offices, except for those in Chile, are ISO 27001 cybersecurity certified. OPPORTUNITIES FOR VALUE CREATION • Improved identification and classification of data • Rationalisation and standardisation of operational technology Water security (2022: 13) Water pollution, security and reduction in freshwater consumption MITIGATING STRATEGY All our operations are certified to the ISO 14001 environmental standard, which requires sound water management and disclosure. Furthermore, in 2021 we developed and integrated three-year regional water management plans across our operations. Finally, water recycling, reuse and conservation practices are in place in all regions, and we are on track to meet our 2030 targets. OPPORTUNITIES FOR VALUE CREATION • Ensuring water security for all catchment stakeholders • Building sound relationships with communities and other catchment stakeholders • Cleaner and more resilient catchments and their ecosystems, with improved ecosystem services Gold Fields employees walking past the wind turbines at our Agnew mine in Western Australia Overview Governance Our business Strategic pillar 1 Strategic pillar 2 Strategic pillar 3 Assurance Gold Fields IAR-29
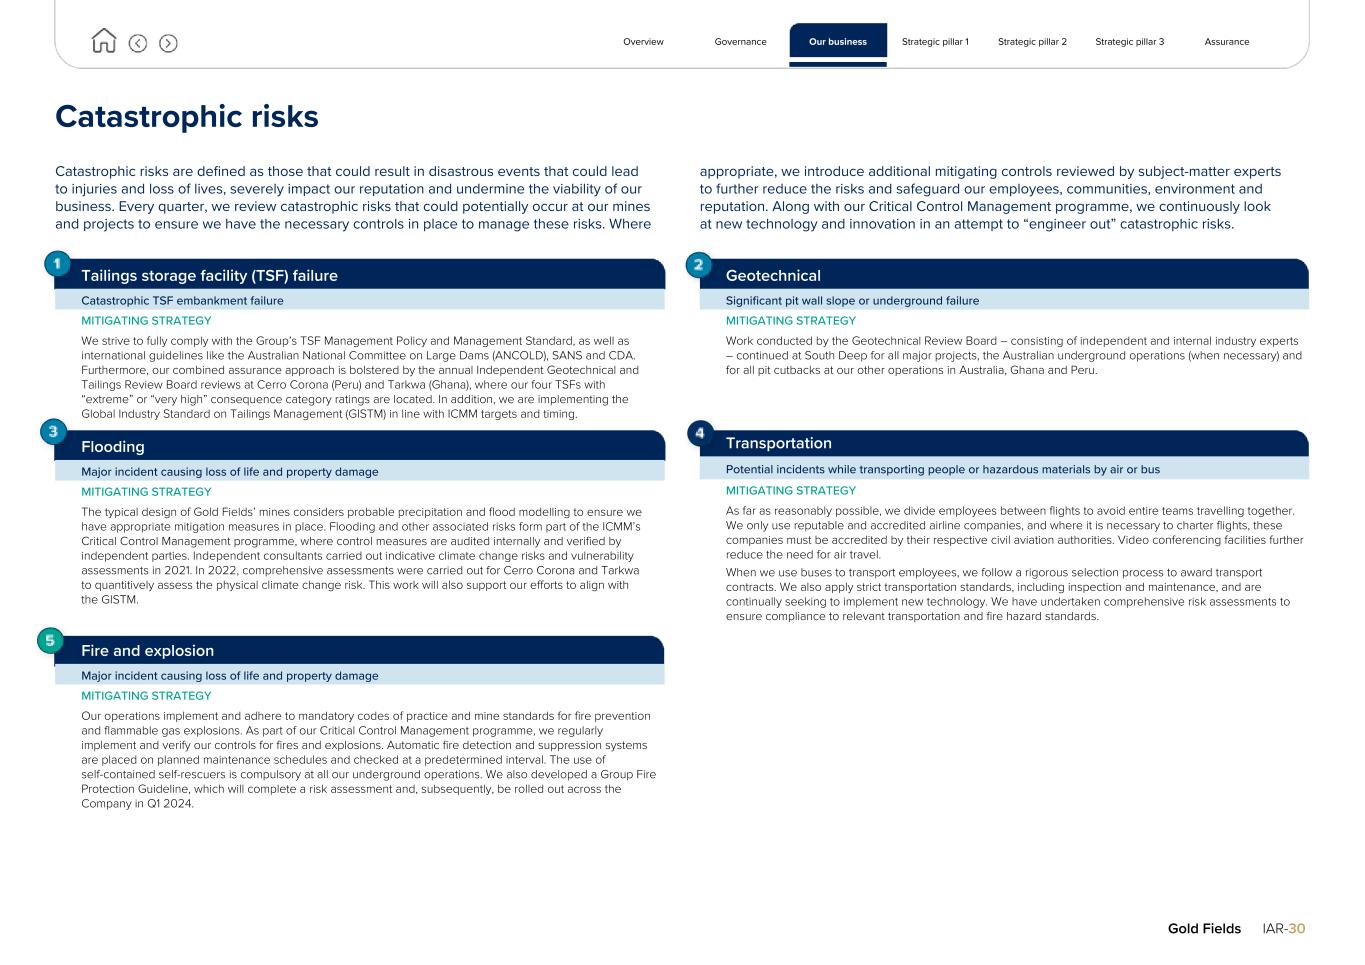
Catastrophic risks Catastrophic risks are defined as those that could result in disastrous events that could lead to injuries and loss of lives, severely impact our reputation and undermine the viability of our business. Every quarter, we review catastrophic risks that could potentially occur at our mines and projects to ensure we have the necessary controls in place to manage these risks. Where appropriate, we introduce additional mitigating controls reviewed by subject-matter experts to further reduce the risks and safeguard our employees, communities, environment and reputation. Along with our Critical Control Management programme, we continuously look at new technology and innovation in an attempt to “engineer out” catastrophic risks. Tailings storage facility (TSF) failure Catastrophic TSF embankment failure MITIGATING STRATEGY We strive to fully comply with the Group’s TSF Management Policy and Management Standard, as well as international guidelines like the Australian National Committee on Large Dams (ANCOLD), SANS and CDA. Furthermore, our combined assurance approach is bolstered by the annual Independent Geotechnical and Tailings Review Board reviews at Cerro Corona (Peru) and Tarkwa (Ghana), where our four TSFs with “extreme” or “very high” consequence category ratings are located. In addition, we are implementing the Global Industry Standard on Tailings Management (GISTM) in line with ICMM targets and timing. Flooding Major incident causing loss of life and property damage MITIGATING STRATEGY The typical design of Gold Fields’ mines considers probable precipitation and flood modelling to ensure we have appropriate mitigation measures in place. Flooding and other associated risks form part of the ICMM’s Critical Control Management programme, where control measures are audited internally and verified by independent parties. Independent consultants carried out indicative climate change risks and vulnerability assessments in 2021. In 2022, comprehensive assessments were carried out for Cerro Corona and Tarkwa to quantitively assess the physical climate change risk. This work will also support our efforts to align with the GISTM. Fire and explosion Major incident causing loss of life and property damage MITIGATING STRATEGY Our operations implement and adhere to mandatory codes of practice and mine standards for fire prevention and flammable gas explosions. As part of our Critical Control Management programme, we regularly implement and verify our controls for fires and explosions. Automatic fire detection and suppression systems are placed on planned maintenance schedules and checked at a predetermined interval. The use of self-contained self-rescuers is compulsory at all our underground operations. We also developed a Group Fire Protection Guideline, which will complete a risk assessment and, subsequently, be rolled out across the Company in Q1 2024. Geotechnical Significant pit wall slope or underground failure MITIGATING STRATEGY Work conducted by the Geotechnical Review Board – consisting of independent and internal industry experts – continued at South Deep for all major projects, the Australian underground operations (when necessary) and for all pit cutbacks at our other operations in Australia, Ghana and Peru. Transportation Potential incidents while transporting people or hazardous materials by air or bus MITIGATING STRATEGY As far as reasonably possible, we divide employees between flights to avoid entire teams travelling together. We only use reputable and accredited airline companies, and where it is necessary to charter flights, these companies must be accredited by their respective civil aviation authorities. Video conferencing facilities further reduce the need for air travel. When we use buses to transport employees, we follow a rigorous selection process to award transport contracts. We also apply strict transportation standards, including inspection and maintenance, and are continually seeking to implement new technology. We have undertaken comprehensive risk assessments to ensure compliance to relevant transportation and fire hazard standards. Overview Governance Our business Strategic pillar 1 Strategic pillar 2 Strategic pillar 3 Assurance Gold Fields IAR-30
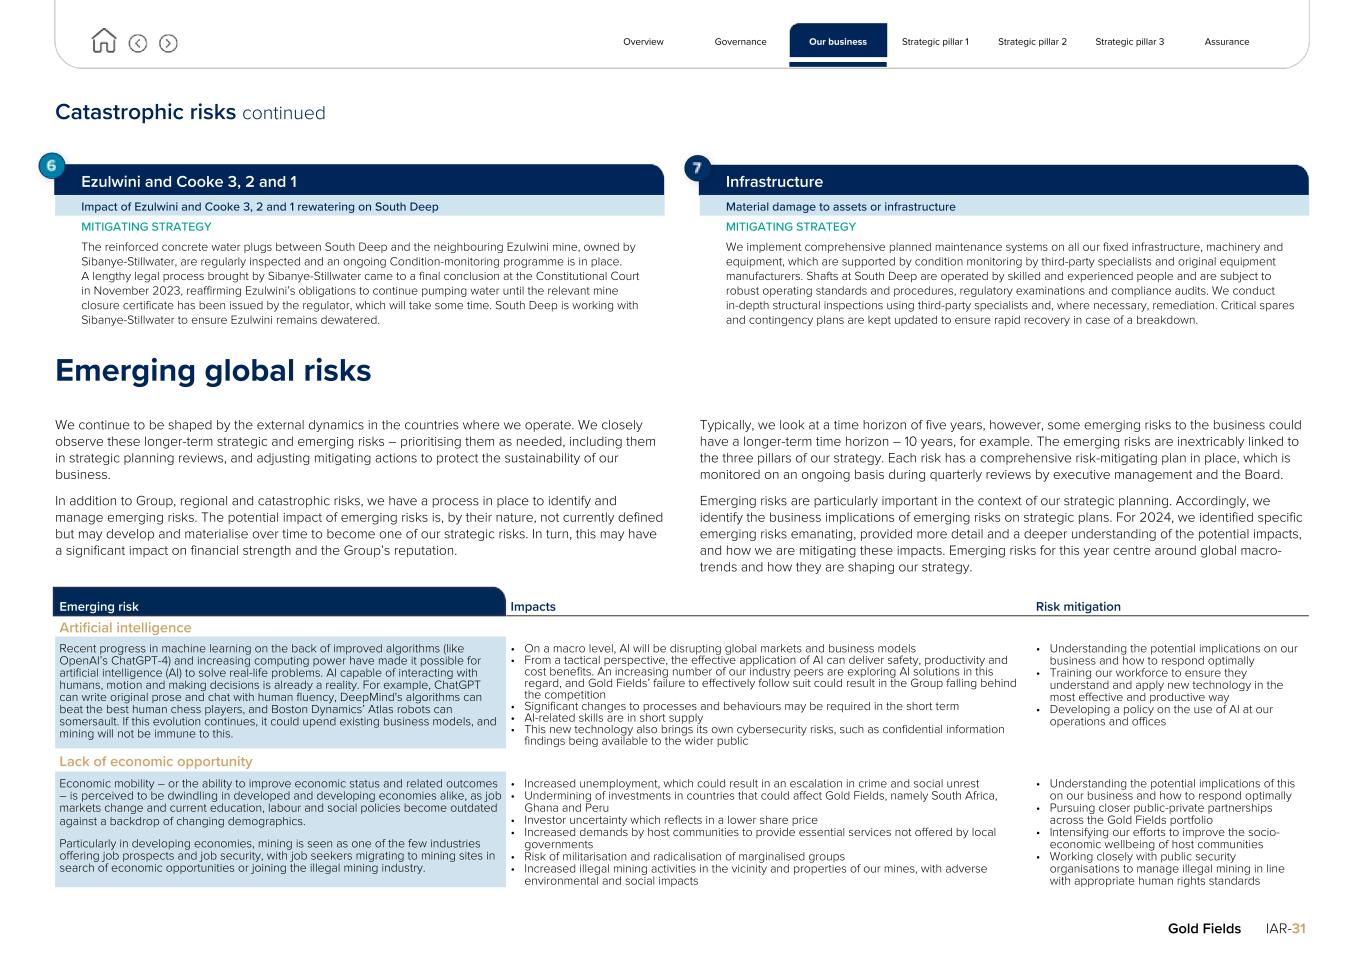
Catastrophic risks continued Ezulwini and Cooke 3, 2 and 1 Impact of Ezulwini and Cooke 3, 2 and 1 rewatering on South Deep MITIGATING STRATEGY The reinforced concrete water plugs between South Deep and the neighbouring Ezulwini mine, owned by Sibanye-Stillwater, are regularly inspected and an ongoing Condition-monitoring programme is in place. A lengthy legal process brought by Sibanye-Stillwater came to a final conclusion at the Constitutional Court in November 2023, reaffirming Ezulwini’s obligations to continue pumping water until the relevant mine closure certificate has been issued by the regulator, which will take some time. South Deep is working with Sibanye-Stillwater to ensure Ezulwini remains dewatered. Infrastructure Material damage to assets or infrastructure MITIGATING STRATEGY We implement comprehensive planned maintenance systems on all our fixed infrastructure, machinery and equipment, which are supported by condition monitoring by third-party specialists and original equipment manufacturers. Shafts at South Deep are operated by skilled and experienced people and are subject to robust operating standards and procedures, regulatory examinations and compliance audits. We conduct in-depth structural inspections using third-party specialists and, where necessary, remediation. Critical spares and contingency plans are kept updated to ensure rapid recovery in case of a breakdown. Emerging global risks We continue to be shaped by the external dynamics in the countries where we operate. We closely observe these longer-term strategic and emerging risks – prioritising them as needed, including them in strategic planning reviews, and adjusting mitigating actions to protect the sustainability of our business. In addition to Group, regional and catastrophic risks, we have a process in place to identify and manage emerging risks. The potential impact of emerging risks is, by their nature, not currently defined but may develop and materialise over time to become one of our strategic risks. In turn, this may have a significant impact on financial strength and the Group’s reputation. Typically, we look at a time horizon of five years, however, some emerging risks to the business could have a longer-term time horizon – 10 years, for example. The emerging risks are inextricably linked to the three pillars of our strategy. Each risk has a comprehensive risk-mitigating plan in place, which is monitored on an ongoing basis during quarterly reviews by executive management and the Board. Emerging risks are particularly important in the context of our strategic planning. Accordingly, we identify the business implications of emerging risks on strategic plans. For 2024, we identified specific emerging risks emanating, provided more detail and a deeper understanding of the potential impacts, and how we are mitigating these impacts. Emerging risks for this year centre around global macro- trends and how they are shaping our strategy. Emerging risk Impacts Risk mitigation Artificial intelligence Recent progress in machine learning on the back of improved algorithms (like OpenAI’s ChatGPT-4) and increasing computing power have made it possible for artificial intelligence (AI) to solve real-life problems. AI capable of interacting with humans, motion and making decisions is already a reality. For example, ChatGPT can write original prose and chat with human fluency, DeepMind's algorithms can beat the best human chess players, and Boston Dynamics’ Atlas robots can somersault. If this evolution continues, it could upend existing business models, and mining will not be immune to this. • On a macro level, AI will be disrupting global markets and business models • From a tactical perspective, the effective application of AI can deliver safety, productivity and cost benefits. An increasing number of our industry peers are exploring AI solutions in this regard, and Gold Fields’ failure to effectively follow suit could result in the Group falling behind the competition • Significant changes to processes and behaviours may be required in the short term • AI-related skills are in short supply • This new technology also brings its own cybersecurity risks, such as confidential information findings being available to the wider public • Understanding the potential implications on our business and how to respond optimally • Training our workforce to ensure they understand and apply new technology in the most effective and productive way • Developing a policy on the use of AI at our operations and offices Lack of economic opportunity Economic mobility – or the ability to improve economic status and related outcomes – is perceived to be dwindling in developed and developing economies alike, as job markets change and current education, labour and social policies become outdated against a backdrop of changing demographics. Particularly in developing economies, mining is seen as one of the few industries offering job prospects and job security, with job seekers migrating to mining sites in search of economic opportunities or joining the illegal mining industry. • Increased unemployment, which could result in an escalation in crime and social unrest • Undermining of investments in countries that could affect Gold Fields, namely South Africa, Ghana and Peru • Investor uncertainty which reflects in a lower share price • Increased demands by host communities to provide essential services not offered by local governments • Risk of militarisation and radicalisation of marginalised groups • Increased illegal mining activities in the vicinity and properties of our mines, with adverse environmental and social impacts • Understanding the potential implications of this on our business and how to respond optimally • Pursuing closer public-private partnerships across the Gold Fields portfolio • Intensifying our efforts to improve the socio- economic wellbeing of host communities • Working closely with public security organisations to manage illegal mining in line with appropriate human rights standards Overview Governance Our business Strategic pillar 1 Strategic pillar 2 Strategic pillar 3 Assurance Gold Fields IAR-31
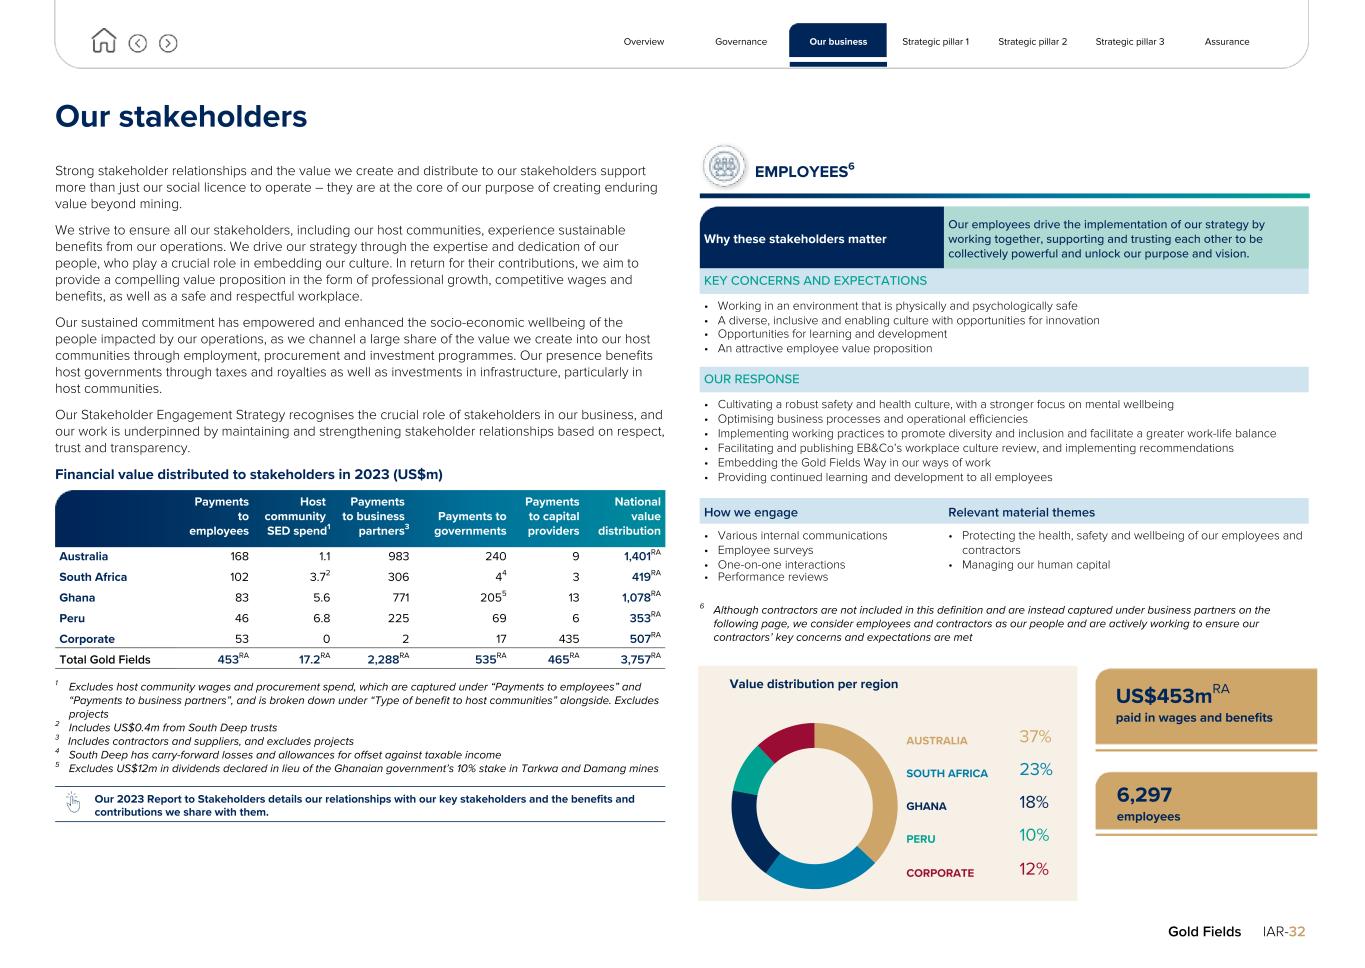
Our stakeholders Strong stakeholder relationships and the value we create and distribute to our stakeholders support more than just our social licence to operate – they are at the core of our purpose of creating enduring value beyond mining. We strive to ensure all our stakeholders, including our host communities, experience sustainable benefits from our operations. We drive our strategy through the expertise and dedication of our people, who play a crucial role in embedding our culture. In return for their contributions, we aim to provide a compelling value proposition in the form of professional growth, competitive wages and benefits, as well as a safe and respectful workplace. Our sustained commitment has empowered and enhanced the socio-economic wellbeing of the people impacted by our operations, as we channel a large share of the value we create into our host communities through employment, procurement and investment programmes. Our presence benefits host governments through taxes and royalties as well as investments in infrastructure, particularly in host communities. Our Stakeholder Engagement Strategy recognises the crucial role of stakeholders in our business, and our work is underpinned by maintaining and strengthening stakeholder relationships based on respect, trust and transparency. Financial value distributed to stakeholders in 2023 (US$m) Payments to employees Host community SED spend1 Payments to business partners3 Payments to governments Payments to capital providers National value distribution Australia 168 1.1 983 240 9 1,401RA South Africa 102 3.72 306 44 3 419RA Ghana 83 5.6 771 2055 13 1,078RA Peru 46 6.8 225 69 6 353RA Corporate 53 0 2 17 435 507RA Total Gold Fields 453RA 17.2RA 2,288RA 535RA 465RA 3,757RA 1 Excludes host community wages and procurement spend, which are captured under “Payments to employees” and “Payments to business partners”, and is broken down under “Type of benefit to host communities” alongside. Excludes projects 2 Includes US$0.4m from South Deep trusts 3 Includes contractors and suppliers, and excludes projects 4 South Deep has carry-forward losses and allowances for offset against taxable income 5 Excludes US$12m in dividends declared in lieu of the Ghanaian government’s 10% stake in Tarkwa and Damang mines Our 2023 Report to Stakeholders details our relationships with our key stakeholders and the benefits and contributions we share with them. EMPLOYEES6 Why these stakeholders matter Our employees drive the implementation of our strategy by working together, supporting and trusting each other to be collectively powerful and unlock our purpose and vision. KEY CONCERNS AND EXPECTATIONS • Working in an environment that is physically and psychologically safe • A diverse, inclusive and enabling culture with opportunities for innovation • Opportunities for learning and development • An attractive employee value proposition OUR RESPONSE • Cultivating a robust safety and health culture, with a stronger focus on mental wellbeing • Optimising business processes and operational efficiencies • Implementing working practices to promote diversity and inclusion and facilitate a greater work-life balance • Facilitating and publishing EB&Co’s workplace culture review, and implementing recommendations • Embedding the Gold Fields Way in our ways of work • Providing continued learning and development to all employees How we engage Relevant material themes • Various internal communications • Employee surveys • One-on-one interactions • Performance reviews • Protecting the health, safety and wellbeing of our employees and contractors • Managing our human capital 6 Although contractors are not included in this definition and are instead captured under business partners on the following page, we consider employees and contractors as our people and are actively working to ensure our contractors’ key concerns and expectations are met Value distribution per region Overview Governance Our business Strategic pillar 1 Strategic pillar 2 Strategic pillar 3 Assurance Gold Fields IAR-32 US$453mRA paid in wages and benefits 6,297 employees AUSTRALIA 37% SOUTH AFRICA 23% GHANA 18% PERU 10% CORPORATE 12%
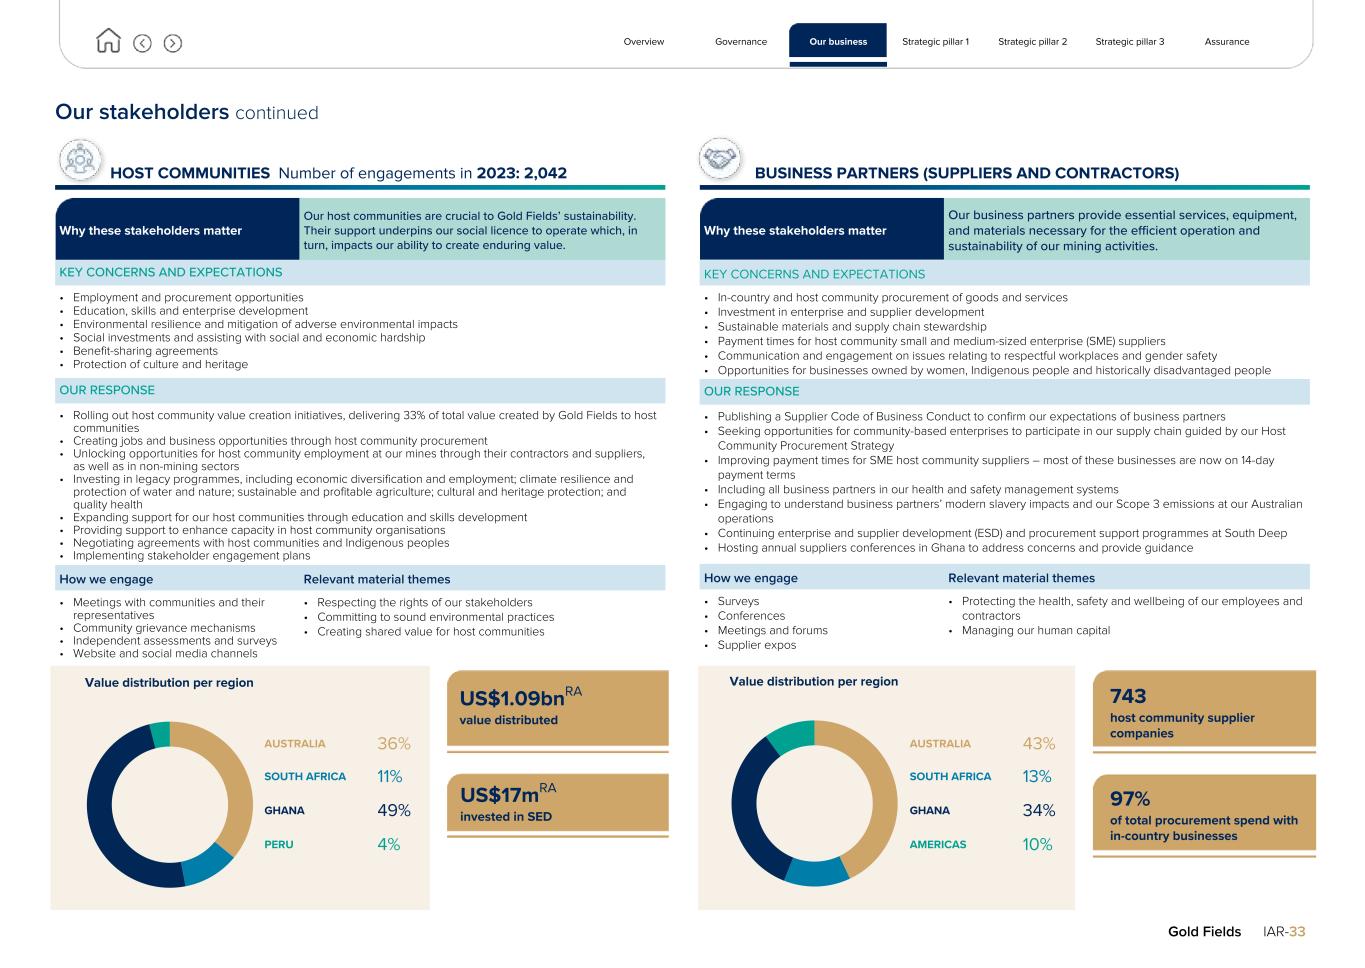
Our stakeholders continued HOST COMMUNITIES Number of engagements in 2023: 2,042 Why these stakeholders matter Our host communities are crucial to Gold Fields’ sustainability. Their support underpins our social licence to operate which, in turn, impacts our ability to create enduring value. KEY CONCERNS AND EXPECTATIONS • Employment and procurement opportunities • Education, skills and enterprise development • Environmental resilience and mitigation of adverse environmental impacts • Social investments and assisting with social and economic hardship • Benefit-sharing agreements • Protection of culture and heritage OUR RESPONSE • Rolling out host community value creation initiatives, delivering 33% of total value created by Gold Fields to host communities • Creating jobs and business opportunities through host community procurement • Unlocking opportunities for host community employment at our mines through their contractors and suppliers, as well as in non-mining sectors • Investing in legacy programmes, including economic diversification and employment; climate resilience and protection of water and nature; sustainable and profitable agriculture; cultural and heritage protection; and quality health • Expanding support for our host communities through education and skills development • Providing support to enhance capacity in host community organisations • Negotiating agreements with host communities and Indigenous peoples • Implementing stakeholder engagement plans How we engage Relevant material themes • Meetings with communities and their representatives • Community grievance mechanisms • Independent assessments and surveys • Website and social media channels • Respecting the rights of our stakeholders • Committing to sound environmental practices • Creating shared value for host communities Value distribution per region BUSINESS PARTNERS (SUPPLIERS AND CONTRACTORS) Why these stakeholders matter Our business partners provide essential services, equipment, and materials necessary for the efficient operation and sustainability of our mining activities. KEY CONCERNS AND EXPECTATIONS • In-country and host community procurement of goods and services • Investment in enterprise and supplier development • Sustainable materials and supply chain stewardship • Payment times for host community small and medium-sized enterprise (SME) suppliers • Communication and engagement on issues relating to respectful workplaces and gender safety • Opportunities for businesses owned by women, Indigenous people and historically disadvantaged people OUR RESPONSE • Publishing a Supplier Code of Business Conduct to confirm our expectations of business partners • Seeking opportunities for community-based enterprises to participate in our supply chain guided by our Host Community Procurement Strategy • Improving payment times for SME host community suppliers – most of these businesses are now on 14-day payment terms • Including all business partners in our health and safety management systems • Engaging to understand business partners’ modern slavery impacts and our Scope 3 emissions at our Australian operations • Continuing enterprise and supplier development (ESD) and procurement support programmes at South Deep • Hosting annual suppliers conferences in Ghana to address concerns and provide guidance How we engage Relevant material themes • Surveys • Conferences • Meetings and forums • Supplier expos • Protecting the health, safety and wellbeing of our employees and contractors • Managing our human capital Value distribution per region Overview Governance Our business Strategic pillar 1 Strategic pillar 2 Strategic pillar 3 Assurance Gold Fields IAR-33 AUSTRALIA 36% SOUTH AFRICA 11% GHANA 49% PERU 4% US$1.09bnRA value distributed US$17mRA invested in SED 97% of total procurement spend with in-country businesses 743 host community supplier companies AUSTRALIA 43% SOUTH AFRICA 13% GHANA 34% AMERICAS 10%
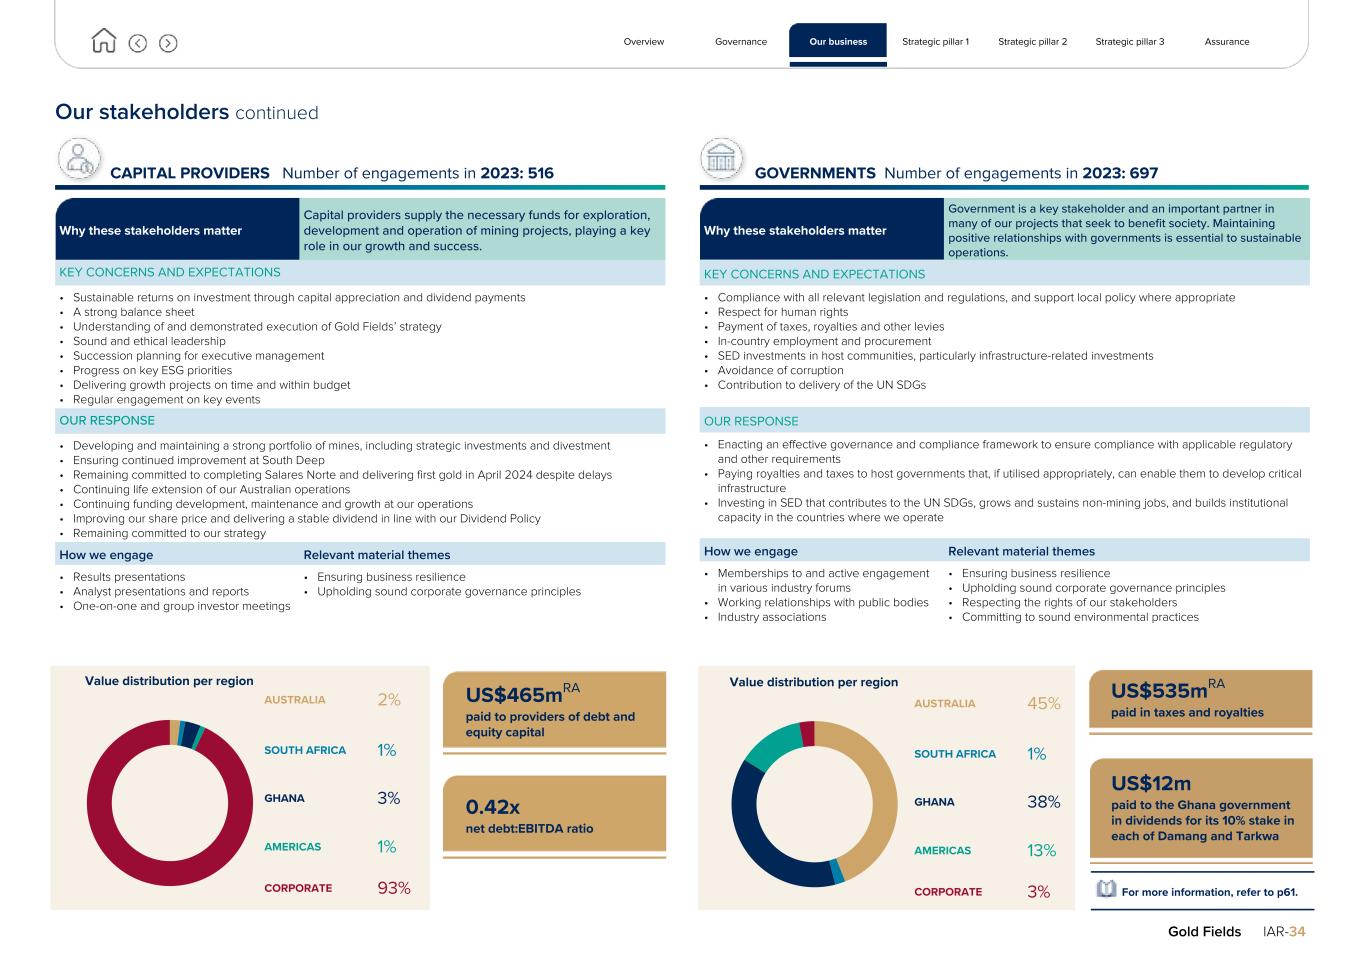
Our stakeholders continued CAPITAL PROVIDERS Number of engagements in 2023: 516 Why these stakeholders matter Capital providers supply the necessary funds for exploration, development and operation of mining projects, playing a key role in our growth and success. KEY CONCERNS AND EXPECTATIONS • Sustainable returns on investment through capital appreciation and dividend payments • A strong balance sheet • Understanding of and demonstrated execution of Gold Fields’ strategy • Sound and ethical leadership • Succession planning for executive management • Progress on key ESG priorities • Delivering growth projects on time and within budget • Regular engagement on key events OUR RESPONSE • Developing and maintaining a strong portfolio of mines, including strategic investments and divestment • Ensuring continued improvement at South Deep • Remaining committed to completing Salares Norte and delivering first gold in April 2024 despite delays • Continuing life extension of our Australian operations • Continuing funding development, maintenance and growth at our operations • Improving our share price and delivering a stable dividend in line with our Dividend Policy • Remaining committed to our strategy How we engage Relevant material themes • Results presentations • Analyst presentations and reports • One-on-one and group investor meetings • Ensuring business resilience • Upholding sound corporate governance principles Value distribution per region GOVERNMENTS Number of engagements in 2023: 697 Why these stakeholders matter Government is a key stakeholder and an important partner in many of our projects that seek to benefit society. Maintaining positive relationships with governments is essential to sustainable operations. KEY CONCERNS AND EXPECTATIONS • Compliance with all relevant legislation and regulations, and support local policy where appropriate • Respect for human rights • Payment of taxes, royalties and other levies • In-country employment and procurement • SED investments in host communities, particularly infrastructure-related investments • Avoidance of corruption • Contribution to delivery of the UN SDGs OUR RESPONSE • Enacting an effective governance and compliance framework to ensure compliance with applicable regulatory and other requirements • Paying royalties and taxes to host governments that, if utilised appropriately, can enable them to develop critical infrastructure • Investing in SED that contributes to the UN SDGs, grows and sustains non-mining jobs, and builds institutional capacity in the countries where we operate How we engage Relevant material themes • Memberships to and active engagement in various industry forums • Working relationships with public bodies • Industry associations • Ensuring business resilience • Upholding sound corporate governance principles • Respecting the rights of our stakeholders • Committing to sound environmental practices Value distribution per region Overview Governance Our business Strategic pillar 1 Strategic pillar 2 Strategic pillar 3 Assurance Gold Fields IAR-34 AUSTRALIA 2% SOUTH AFRICA 1% GHANA 3% AMERICAS 1% CORPORATE 93% 0.42x net debt:EBITDA ratio US$465mRA paid to providers of debt and equity capital US$12m paid to the Ghana government in dividends for its 10% stake in each of Damang and Tarkwa US$535mRA paid in taxes and royalties For more information, refer to p61. AUSTRALIA 45% SOUTH AFRICA 1% GHANA 38% AMERICAS 13% CORPORATE 3%
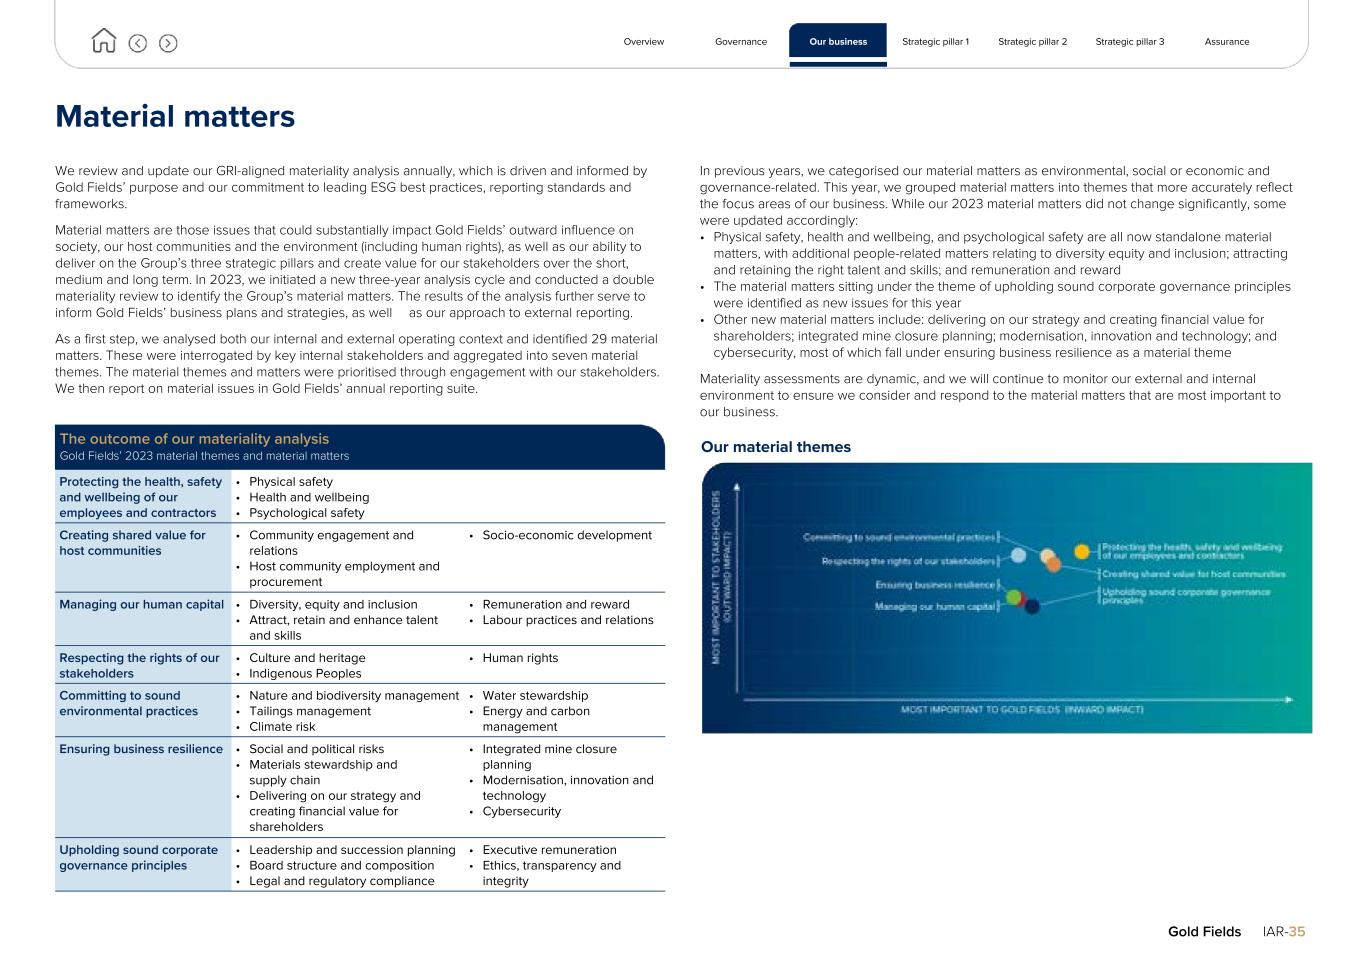
Material matters We review and update our GRI-aligned materiality analysis annually, which is driven and informed by Gold Fields’ purpose and our commitment to leading ESG best practices, reporting standards and frameworks. Material matters are those issues that could substantially impact Gold Fields’ outward influence on society, our host communities and the environment (including human rights), as well as our ability to deliver on the Group’s three strategic pillars and create value for our stakeholders over the short, medium and long term. In 2023, we initiated a new three-year analysis cycle and conducted a double materiality review to identify the Group’s material matters. The results of the analysis further serve to inform Gold Fields’ business plans and strategies, as well as our approach to external reporting. As a first step, we analysed both our internal and external operating context and identified 29 material matters. These were interrogated by key internal stakeholders and aggregated into seven material themes. The material themes and matters were prioritised through engagement with our stakeholders. We then report on material issues in Gold Fields’ annual reporting suite. In previous years, we categorised our material matters as environmental, social or economic and governance-related. This year, we grouped material matters into themes that more accurately reflect the focus areas of our business. While our 2023 material matters did not change significantly, some were updated accordingly: • Physical safety, health and wellbeing, and psychological safety are all now standalone material matters, with additional people-related matters relating to diversity equity and inclusion; attracting and retaining the right talent and skills; and remuneration and reward • The material matters sitting under the theme of upholding sound corporate governance principles were identified as new issues for this year • Other new material matters include: delivering on our strategy and creating financial value for shareholders; integrated mine closure planning; modernisation, innovation and technology; and cybersecurity, most of which fall under ensuring business resilience as a material theme Materiality assessments are dynamic, and we will continue to monitor our external and internal environment to ensure we consider and respond to the material matters that are most important to our business. The outcome of our materiality analysis Gold Fields’ 2023 material themes and material matters Protecting the health, safety and wellbeing of our employees and contractors • Physical safety • Health and wellbeing • Psychological safety Creating shared value for host communities • Community engagement and relations • Host community employment and procurement • Socio-economic development Managing our human capital • Diversity, equity and inclusion • Attract, retain and enhance talent and skills • Remuneration and reward • Labour practices and relations Respecting the rights of our stakeholders • Culture and heritage • Indigenous Peoples • Human rights Committing to sound environmental practices • Nature and biodiversity management • Tailings management • Climate risk • Water stewardship • Energy and carbon management Ensuring business resilience • Social and political risks • Materials stewardship and supply chain • Delivering on our strategy and creating financial value for shareholders • Integrated mine closure planning • Modernisation, innovation and technology • Cybersecurity Upholding sound corporate governance principles • Leadership and succession planning • Board structure and composition • Legal and regulatory compliance • Executive remuneration • Ethics, transparency and integrity Overview Governance Our business Strategic pillar 1 Strategic pillar 2 Strategic pillar 3 Assurance Gold Fields IAR-35 Our material themes
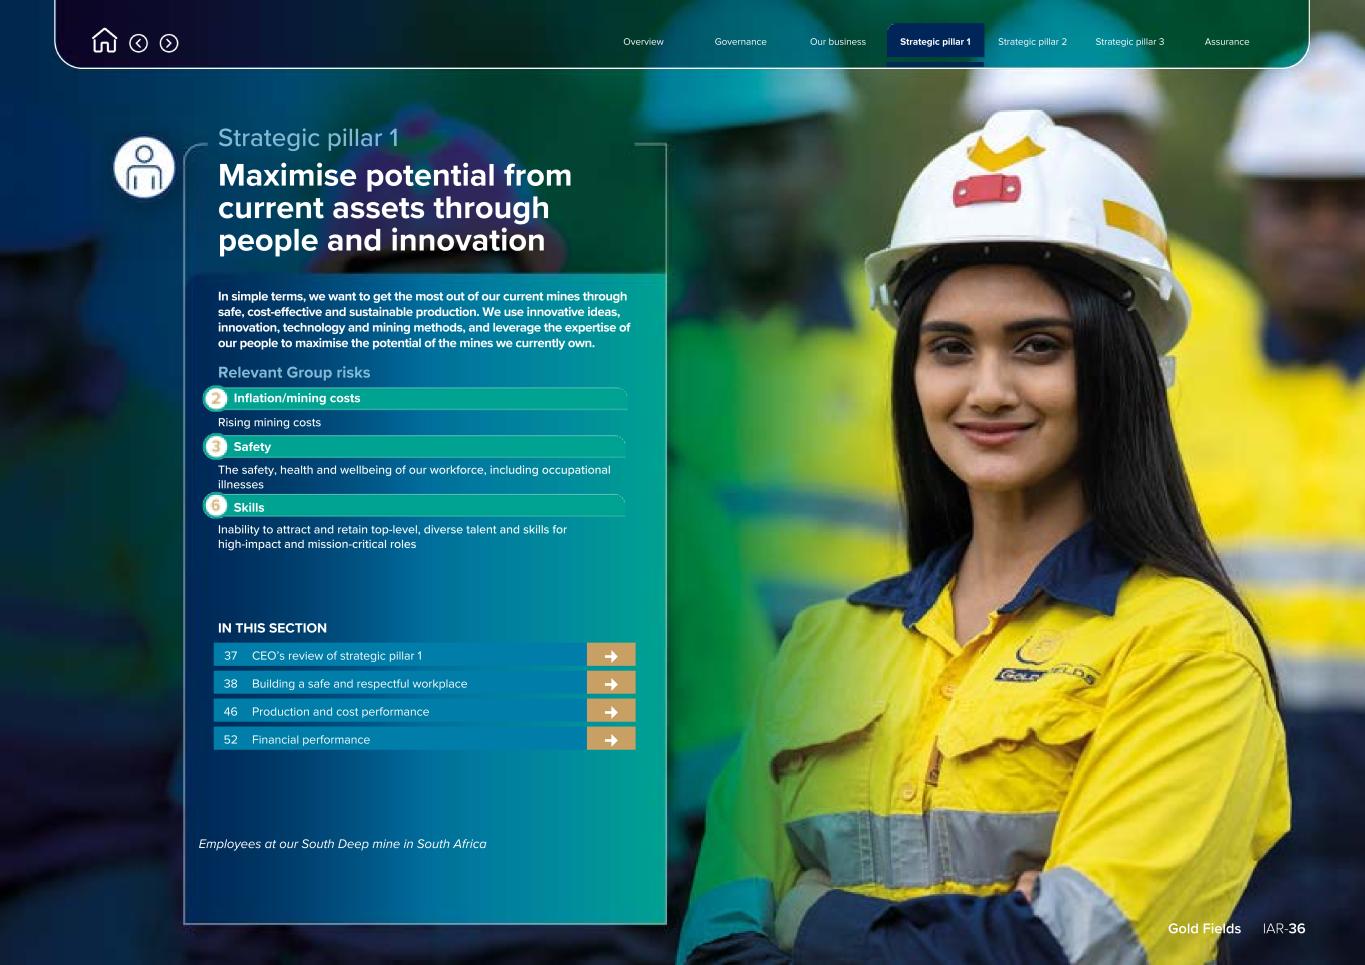
Overview Governance Our business Strategic pillar 1 Strategic pillar 2 Strategic pillar 3 Assurance Gold Fields IAR-36 IN THIS SECTION 37 CEO’s review of strategic pillar 1 ¢ 38 Building a safe and respectful workplace ¢ 46 Production and cost performance ¢ 52 Financial performance ¢ Strategic pillar 1 Maximise potential from current assets through people and innovation In simple terms, we want to get the most out of our current mines through safe, cost-effective and sustainable production. We use innovative ideas, innovation, technology and mining methods, and leverage the expertise of our people to maximise the potential of the mines we currently own. Relevant Group risks Inflation/mining costs Rising mining costs Safety The safety, health and wellbeing of our workforce, including occupational illnesses Skills Inability to attract and retain top-level, diverse talent and skills for high-impact and mission-critical roles Employees at our South Deep mine in South Africa
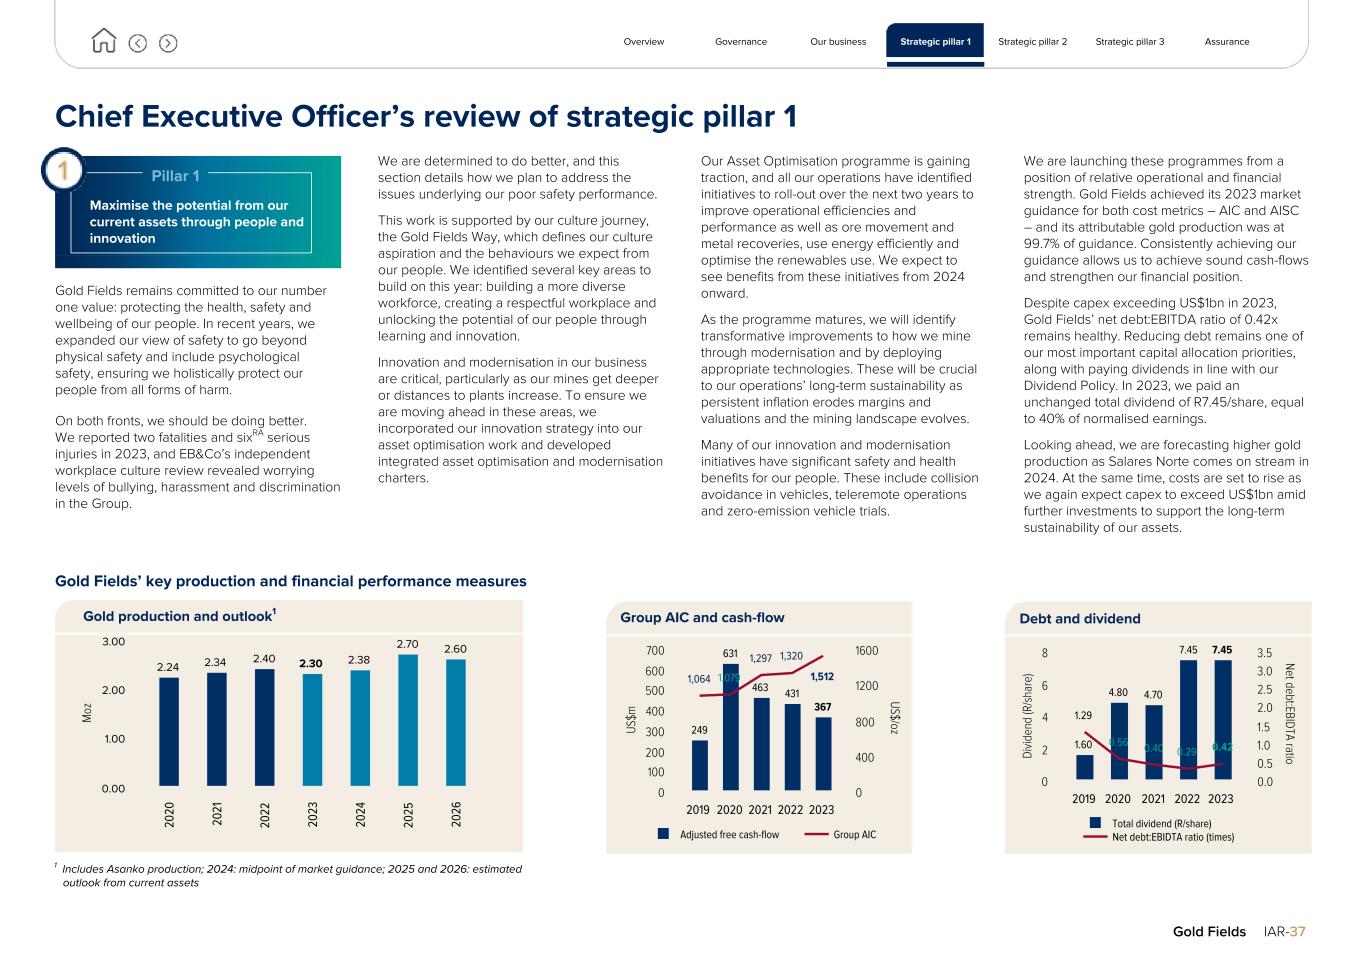
Chief Executive Officer’s review of strategic pillar 1 Pillar 1 Maximise the potential from our current assets through people and innovation Gold Fields remains committed to our number one value: protecting the health, safety and wellbeing of our people. In recent years, we expanded our view of safety to go beyond physical safety and include psychological safety, ensuring we holistically protect our people from all forms of harm. On both fronts, we should be doing better. We reported two fatalities and sixRA serious injuries in 2023, and EB&Co’s independent workplace culture review revealed worrying levels of bullying, harassment and discrimination in the Group. We are determined to do better, and this section details how we plan to address the issues underlying our poor safety performance. This work is supported by our culture journey, the Gold Fields Way, which defines our culture aspiration and the behaviours we expect from our people. We identified several key areas to build on this year: building a more diverse workforce, creating a respectful workplace and unlocking the potential of our people through learning and innovation. Innovation and modernisation in our business are critical, particularly as our mines get deeper or distances to plants increase. To ensure we are moving ahead in these areas, we incorporated our innovation strategy into our asset optimisation work and developed integrated asset optimisation and modernisation charters. Our Asset Optimisation programme is gaining traction, and all our operations have identified initiatives to roll-out over the next two years to improve operational efficiencies and performance as well as ore movement and metal recoveries, use energy efficiently and optimise the renewables use. We expect to see benefits from these initiatives from 2024 onward. As the programme matures, we will identify transformative improvements to how we mine through modernisation and by deploying appropriate technologies. These will be crucial to our operations’ long-term sustainability as persistent inflation erodes margins and valuations and the mining landscape evolves. Many of our innovation and modernisation initiatives have significant safety and health benefits for our people. These include collision avoidance in vehicles, teleremote operations and zero-emission vehicle trials. We are launching these programmes from a position of relative operational and financial strength. Gold Fields achieved its 2023 market guidance for both cost metrics – AIC and AISC – and its attributable gold production was at 99.7% of guidance. Consistently achieving our guidance allows us to achieve sound cash-flows and strengthen our financial position. Despite capex exceeding US$1bn in 2023, Gold Fields’ net debt:EBITDA ratio of 0.42x remains healthy. Reducing debt remains one of our most important capital allocation priorities, along with paying dividends in line with our Dividend Policy. In 2023, we paid an unchanged total dividend of R7.45/share, equal to 40% of normalised earnings. Looking ahead, we are forecasting higher gold production as Salares Norte comes on stream in 2024. At the same time, costs are set to rise as we again expect capex to exceed US$1bn amid further investments to support the long-term sustainability of our assets. Gold Fields’ key production and financial performance measures M oz 2.24 2.34 2.40 2.30 2.38 2.70 2.60 20 20 20 21 20 22 20 23 20 24 20 25 20 26 0.00 1.00 2.00 3.00 Overview Governance Our business Strategic pillar 1 Strategic pillar 2 Strategic pillar 3 Assurance Gold Fields IAR-37 US $m US$/oz249 631 463 431 367 1,064 1,079 1,297 1,320 1,512 Adjusted free cash-flow Group AIC 2019 2020 2021 2022 2023 0 100 200 300 400 500 600 700 0 400 800 1200 1600 Di vi de nd (R /s ha re ) Net debt:EBIDTA ratio 1.60 4.80 4.70 7.45 7.45 1.29 0.56 0.40 0.29 0.42 Total dividend (R/share) Net debt:EBIDTA ratio (times) 2019 2020 2021 2022 2023 0 2 4 6 8 0.0 0.5 1.0 1.5 2.0 2.5 3.0 3.5 Debt and dividend Group AIC and cash-flow Gold production and outlook1 1 Includes Asanko production; 2024: midpoint of market guidance; 2025 and 2026: estimated outlook from current assets
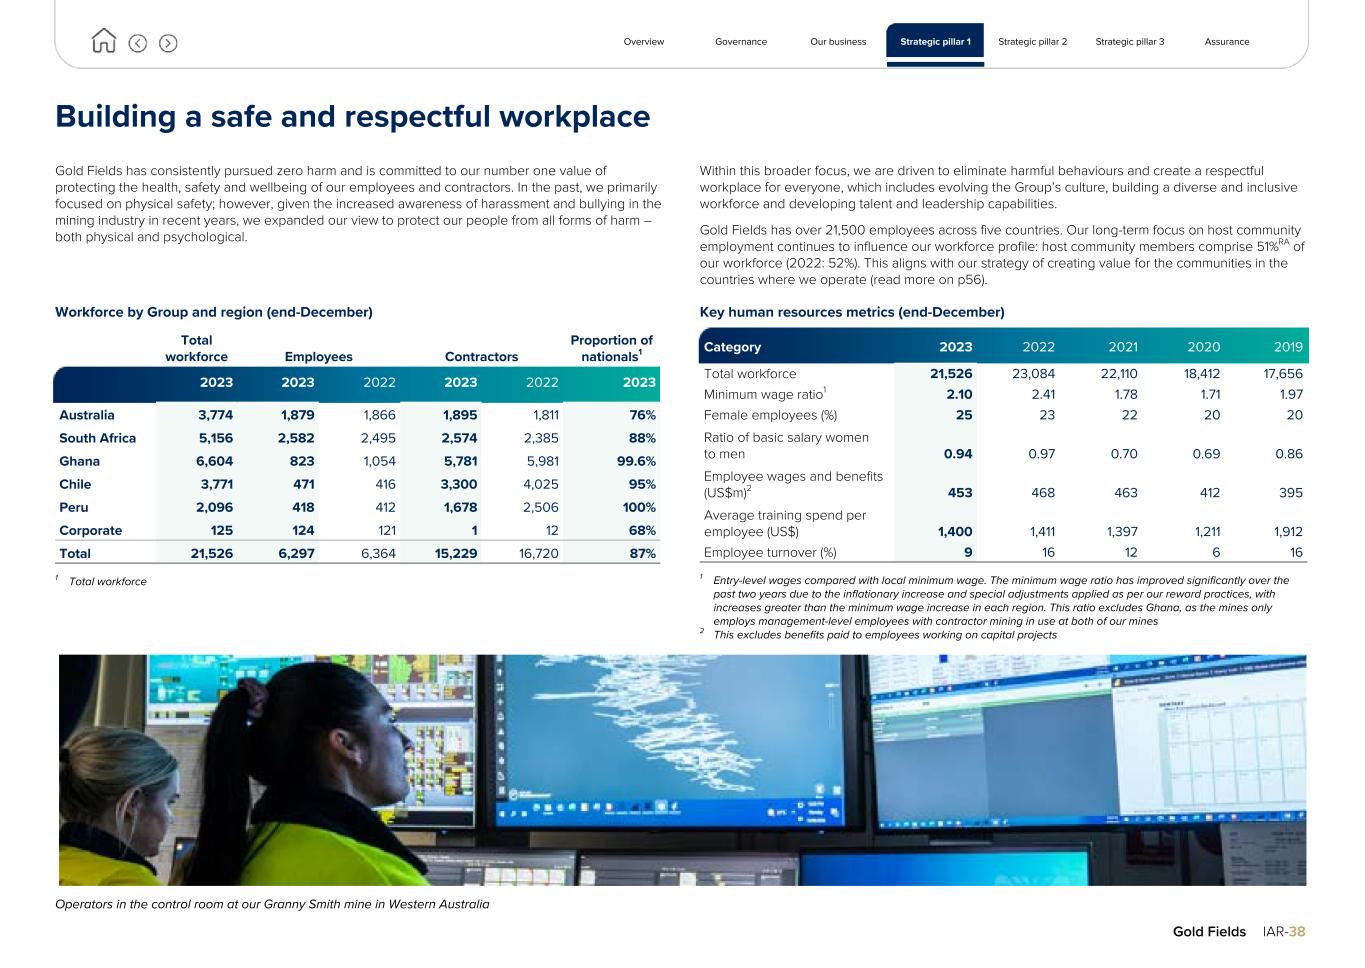
Building a safe and respectful workplace Gold Fields has consistently pursued zero harm and is committed to our number one value of protecting the health, safety and wellbeing of our employees and contractors. In the past, we primarily focused on physical safety; however, given the increased awareness of harassment and bullying in the mining industry in recent years, we expanded our view to protect our people from all forms of harm – both physical and psychological. Within this broader focus, we are driven to eliminate harmful behaviours and create a respectful workplace for everyone, which includes evolving the Group’s culture, building a diverse and inclusive workforce and developing talent and leadership capabilities. Gold Fields has over 21,500 employees across five countries. Our long-term focus on host community employment continues to influence our workforce profile: host community members comprise 51%RA of our workforce (2022: 52%). This aligns with our strategy of creating value for the communities in the countries where we operate (read more on p56). Workforce by Group and region (end-December) Total workforce Employees Contractors Proportion of nationals1 2023 2023 2022 2023 2022 2023 Australia 3,774 1,879 1,866 1,895 1,811 76% South Africa 5,156 2,582 2,495 2,574 2,385 88% Ghana 6,604 823 1,054 5,781 5,981 99.6% Chile 3,771 471 416 3,300 4,025 95% Peru 2,096 418 412 1,678 2,506 100% Corporate 125 124 121 1 12 68% Total 21,526 6,297 6,364 15,229 16,720 87% 1 Total workforce Key human resources metrics (end-December) Category 2023 2022 2021 2020 2019 Total workforce 21,526 23,084 22,110 18,412 17,656 Minimum wage ratio1 2.10 2.41 1.78 1.71 1.97 Female employees (%) 25 23 22 20 20 Ratio of basic salary women to men 0.94 0.97 0.70 0.69 0.86 Employee wages and benefits (US$m)2 453 468 463 412 395 Average training spend per employee (US$) 1,400 1,411 1,397 1,211 1,912 Employee turnover (%) 9 16 12 6 16 1 Entry-level wages compared with local minimum wage. The minimum wage ratio has improved significantly over the past two years due to the inflationary increase and special adjustments applied as per our reward practices, with increases greater than the minimum wage increase in each region. This ratio excludes Ghana, as the mines only employs management-level employees with contractor mining in use at both of our mines 2 This excludes benefits paid to employees working on capital projects Operators in the control room at our Granny Smith mine in Western Australia Overview Governance Our business Strategic pillar 1 Strategic pillar 2 Strategic pillar 3 Assurance Gold Fields IAR-38
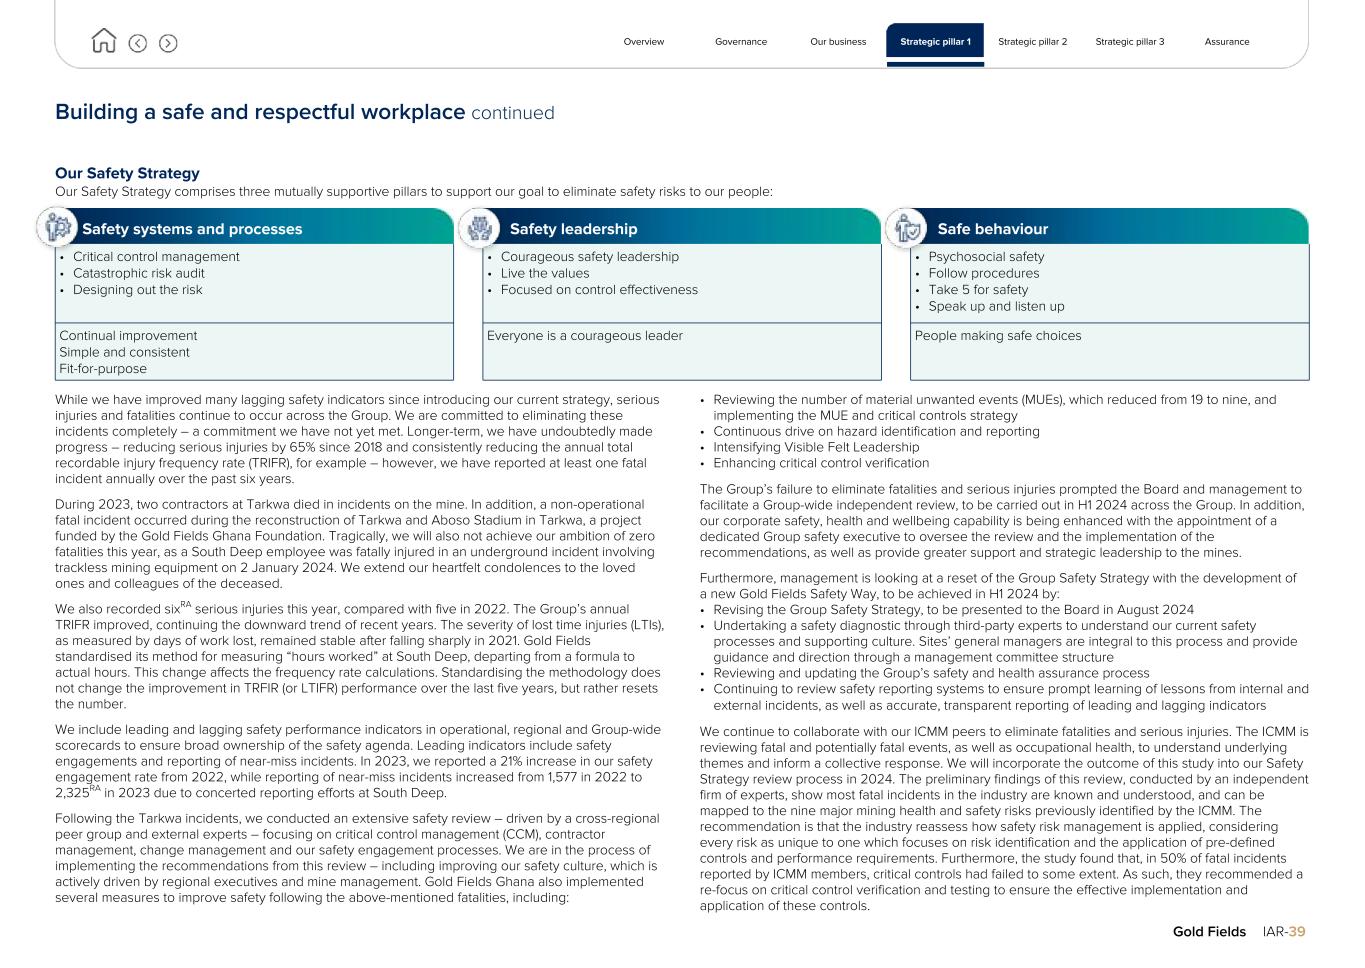
Building a safe and respectful workplace continued Our Safety Strategy Our Safety Strategy comprises three mutually supportive pillars to support our goal to eliminate safety risks to our people: Safety systems and processes Safety leadership Safe behaviour • Critical control management • Catastrophic risk audit • Designing out the risk • Courageous safety leadership • Live the values • Focused on control effectiveness • Psychosocial safety • Follow procedures • Take 5 for safety • Speak up and listen up Continual improvement Simple and consistent Fit-for-purpose Everyone is a courageous leader People making safe choices While we have improved many lagging safety indicators since introducing our current strategy, serious injuries and fatalities continue to occur across the Group. We are committed to eliminating these incidents completely – a commitment we have not yet met. Longer-term, we have undoubtedly made progress – reducing serious injuries by 65% since 2018 and consistently reducing the annual total recordable injury frequency rate (TRIFR), for example – however, we have reported at least one fatal incident annually over the past six years. During 2023, two contractors at Tarkwa died in incidents on the mine. In addition, a non-operational fatal incident occurred during the reconstruction of Tarkwa and Aboso Stadium in Tarkwa, a project funded by the Gold Fields Ghana Foundation. Tragically, we will also not achieve our ambition of zero fatalities this year, as a South Deep employee was fatally injured in an underground incident involving trackless mining equipment on 2 January 2024. We extend our heartfelt condolences to the loved ones and colleagues of the deceased. We also recorded sixRA serious injuries this year, compared with five in 2022. The Group’s annual TRIFR improved, continuing the downward trend of recent years. The severity of lost time injuries (LTIs), as measured by days of work lost, remained stable after falling sharply in 2021. Gold Fields standardised its method for measuring “hours worked” at South Deep, departing from a formula to actual hours. This change affects the frequency rate calculations. Standardising the methodology does not change the improvement in TRFIR (or LTIFR) performance over the last five years, but rather resets the number. We include leading and lagging safety performance indicators in operational, regional and Group-wide scorecards to ensure broad ownership of the safety agenda. Leading indicators include safety engagements and reporting of near-miss incidents. In 2023, we reported a 21% increase in our safety engagement rate from 2022, while reporting of near-miss incidents increased from 1,577 in 2022 to 2,325RA in 2023 due to concerted reporting efforts at South Deep. Following the Tarkwa incidents, we conducted an extensive safety review – driven by a cross-regional peer group and external experts – focusing on critical control management (CCM), contractor management, change management and our safety engagement processes. We are in the process of implementing the recommendations from this review – including improving our safety culture, which is actively driven by regional executives and mine management. Gold Fields Ghana also implemented several measures to improve safety following the above-mentioned fatalities, including: • Reviewing the number of material unwanted events (MUEs), which reduced from 19 to nine, and implementing the MUE and critical controls strategy • Continuous drive on hazard identification and reporting • Intensifying Visible Felt Leadership • Enhancing critical control verification The Group’s failure to eliminate fatalities and serious injuries prompted the Board and management to facilitate a Group-wide independent review, to be carried out in H1 2024 across the Group. In addition, our corporate safety, health and wellbeing capability is being enhanced with the appointment of a dedicated Group safety executive to oversee the review and the implementation of the recommendations, as well as provide greater support and strategic leadership to the mines. Furthermore, management is looking at a reset of the Group Safety Strategy with the development of a new Gold Fields Safety Way, to be achieved in H1 2024 by: • Revising the Group Safety Strategy, to be presented to the Board in August 2024 • Undertaking a safety diagnostic through third-party experts to understand our current safety processes and supporting culture. Sites’ general managers are integral to this process and provide guidance and direction through a management committee structure • Reviewing and updating the Group’s safety and health assurance process • Continuing to review safety reporting systems to ensure prompt learning of lessons from internal and external incidents, as well as accurate, transparent reporting of leading and lagging indicators We continue to collaborate with our ICMM peers to eliminate fatalities and serious injuries. The ICMM is reviewing fatal and potentially fatal events, as well as occupational health, to understand underlying themes and inform a collective response. We will incorporate the outcome of this study into our Safety Strategy review process in 2024. The preliminary findings of this review, conducted by an independent firm of experts, show most fatal incidents in the industry are known and understood, and can be mapped to the nine major mining health and safety risks previously identified by the ICMM. The recommendation is that the industry reassess how safety risk management is applied, considering every risk as unique to one which focuses on risk identification and the application of pre-defined controls and performance requirements. Furthermore, the study found that, in 50% of fatal incidents reported by ICMM members, critical controls had failed to some extent. As such, they recommended a re-focus on critical control verification and testing to ensure the effective implementation and application of these controls. Overview Governance Our business Strategic pillar 1 Strategic pillar 2 Strategic pillar 3 Assurance Gold Fields IAR-39
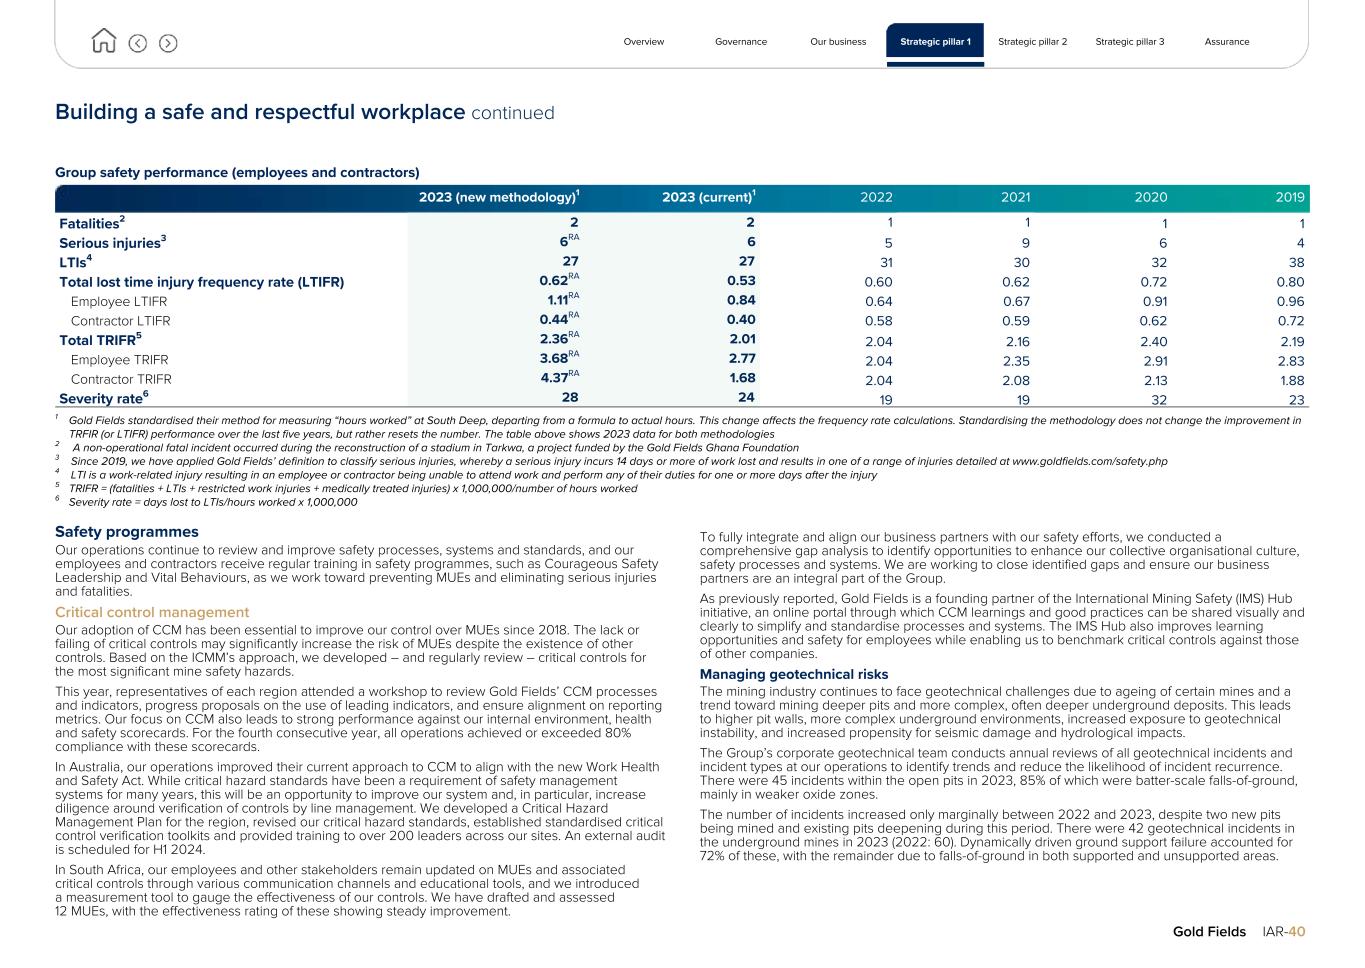
Building a safe and respectful workplace continued Group safety performance (employees and contractors) 2023 (new methodology)1 2023 (current)1 2022 2021 2020 2019 Fatalities2 2 2 1 1 1 1 Serious injuries3 6RA 6 5 9 6 4 LTIs4 27 27 31 30 32 38 Total lost time injury frequency rate (LTIFR) 0.62RA 0.53 0.60 0.62 0.72 0.80 Employee LTIFR 1.11RA 0.84 0.64 0.67 0.91 0.96 Contractor LTIFR 0.44RA 0.40 0.58 0.59 0.62 0.72 Total TRIFR5 2.36RA 2.01 2.04 2.16 2.40 2.19 Employee TRIFR 3.68RA 2.77 2.04 2.35 2.91 2.83 Contractor TRIFR 4.37RA 1.68 2.04 2.08 2.13 1.88 Severity rate6 28 24 19 19 32 23 1 Gold Fields standardised their method for measuring “hours worked” at South Deep, departing from a formula to actual hours. This change affects the frequency rate calculations. Standardising the methodology does not change the improvement in TRFIR (or LTIFR) performance over the last five years, but rather resets the number. The table above shows 2023 data for both methodologies 2 A non-operational fatal incident occurred during the reconstruction of a stadium in Tarkwa, a project funded by the Gold Fields Ghana Foundation 3 Since 2019, we have applied Gold Fields’ definition to classify serious injuries, whereby a serious injury incurs 14 days or more of work lost and results in one of a range of injuries detailed at www.goldfields.com/safety.php 4 LTI is a work-related injury resulting in an employee or contractor being unable to attend work and perform any of their duties for one or more days after the injury 5 TRIFR = (fatalities + LTIs + restricted work injuries + medically treated injuries) x 1,000,000/number of hours worked 6 Severity rate = days lost to LTIs/hours worked x 1,000,000 Safety programmes Our operations continue to review and improve safety processes, systems and standards, and our employees and contractors receive regular training in safety programmes, such as Courageous Safety Leadership and Vital Behaviours, as we work toward preventing MUEs and eliminating serious injuries and fatalities. Critical control management Our adoption of CCM has been essential to improve our control over MUEs since 2018. The lack or failing of critical controls may significantly increase the risk of MUEs despite the existence of other controls. Based on the ICMM’s approach, we developed – and regularly review – critical controls for the most significant mine safety hazards. This year, representatives of each region attended a workshop to review Gold Fields’ CCM processes and indicators, progress proposals on the use of leading indicators, and ensure alignment on reporting metrics. Our focus on CCM also leads to strong performance against our internal environment, health and safety scorecards. For the fourth consecutive year, all operations achieved or exceeded 80% compliance with these scorecards. In Australia, our operations improved their current approach to CCM to align with the new Work Health and Safety Act. While critical hazard standards have been a requirement of safety management systems for many years, this will be an opportunity to improve our system and, in particular, increase diligence around verification of controls by line management. We developed a Critical Hazard Management Plan for the region, revised our critical hazard standards, established standardised critical control verification toolkits and provided training to over 200 leaders across our sites. An external audit is scheduled for H1 2024. In South Africa, our employees and other stakeholders remain updated on MUEs and associated critical controls through various communication channels and educational tools, and we introduced a measurement tool to gauge the effectiveness of our controls. We have drafted and assessed 12 MUEs, with the effectiveness rating of these showing steady improvement. To fully integrate and align our business partners with our safety efforts, we conducted a comprehensive gap analysis to identify opportunities to enhance our collective organisational culture, safety processes and systems. We are working to close identified gaps and ensure our business partners are an integral part of the Group. As previously reported, Gold Fields is a founding partner of the International Mining Safety (IMS) Hub initiative, an online portal through which CCM learnings and good practices can be shared visually and clearly to simplify and standardise processes and systems. The IMS Hub also improves learning opportunities and safety for employees while enabling us to benchmark critical controls against those of other companies. Managing geotechnical risks The mining industry continues to face geotechnical challenges due to ageing of certain mines and a trend toward mining deeper pits and more complex, often deeper underground deposits. This leads to higher pit walls, more complex underground environments, increased exposure to geotechnical instability, and increased propensity for seismic damage and hydrological impacts. The Group’s corporate geotechnical team conducts annual reviews of all geotechnical incidents and incident types at our operations to identify trends and reduce the likelihood of incident recurrence. There were 45 incidents within the open pits in 2023, 85% of which were batter-scale falls-of-ground, mainly in weaker oxide zones. The number of incidents increased only marginally between 2022 and 2023, despite two new pits being mined and existing pits deepening during this period. There were 42 geotechnical incidents in the underground mines in 2023 (2022: 60). Dynamically driven ground support failure accounted for 72% of these, with the remainder due to falls-of-ground in both supported and unsupported areas. Overview Governance Our business Strategic pillar 1 Strategic pillar 2 Strategic pillar 3 Assurance Gold Fields IAR-40
Building a safe and respectful workplace continued Managing geotechnical risks continued Our portfolio consists of deep-level mines which are seismically active due to induced stresses approaching or exceeding the strength of the rock mass. Seismicity can contribute to incidents in these mines, and destress activities pose the highest risk for seismic-induced falls-of-ground. South Deep had 15 seismic incidents in 2023, while our underground mines in Western Australia – at Granny Smith, Agnew and St Ives – recorded four incidents. We aim to use industry best practices in seismological monitoring and analysis, in addition to using dynamic ground support in these operations. We further mitigate this risk through geotechnical projects like improved support and standards, backfilling and stabilising pillars and, to identify seismic activity early, we perform seismic analysis and have seismic monitoring systems in place. At South Deep, pre-conditioning is undertaken in all destress areas to fracture the rock mass ahead of work being done. We also appointed the Geotechnical Review Boards to help implement industry best practice geotechnical design; monitoring; mine design; extraction sequencing; and ground support implementation, specifically at Cerro Corona, South Deep and the Wallaby mine at Granny Smith. Modernisation and mechanisation to improve safety and health Advancements in technology continue to transform the mining industry, and safety is one of our key drivers to further modernise and mechanise activities in our mines. This is an ongoing focus area, and dedicated teams in all regions are tasked with identifying how we can leverage technology to keep our people safer and healthier. Safety interventions implemented for fatigue management are significantly improving the number of fatigue events reported, as well as operator discipline. In Ghana, our collision avoidance system is operational, with improvements in installed operational equipment and maintenance. At South Deep, work is far advanced in introducing extensive collision avoidance systems in line with government regulations, which are set to be finalised by year-end. In Australia, Gruyere started deploying it surface commission avoidance system. Granny Smith’s underground situational awareness system was in full operation, with plans to roll-out across the Australian underground mines in 2024. At present, collision avoidance technology in machines alert operators to the presence of a person or vehicle, who can then respond accordingly. At year-end, the installation of more advanced detection sensors will seek to prevent machine-to-machine or machine-to-person collisions by slowing down and then stopping the machine completely. Cap lamp detectors will help prevent machine-to-person or machine-to-machine collisions by slowing down the machine and stopping it automatically. We continued to remove people from active mining areas at all our mines via teleremote loading, rock breaking and underground mining activities from surface. At South Deep, during 2023, we installed teleremote longhole stope drilling capabilities, while teleremote load haul dump surface operations are use across Australian underground mines. Using battery-electric vehicles (BEVs) underground can reduce the heat load and minimise the impacts of diesel particulates and reduce carbon emissions. We initiated several programmes to decarbonise movement of mining material and waste. Our 2030 target is to reduce diesel usage at our mines by approximately 20%. Most prominently, we initiated trials of BEVs at various sites in partnership with OEMs. These trials aim not only to reduce emissions and DPMs but also improve vehicle safety. Gold Fields is also actively involved in the Innovation for Cleaner Safer Vehicles initiative, which is partnering ICMM members with leading mining vehicle OEMs. The initiative is seeking vehicle development with lower carbon and diesel particular matter (DPM) emissions, but is also working toward advanced collision avoidance technology to eliminate fatalities from vehicle interactions. Refer to our Climate Change Report for more details. Safety leadership and safe behaviour We continued driving our CSL programme, which encourages all employees and contractors to model safe behaviour for others. The programme gives employees practical tools to become safety leaders and focuses on creating a safe environment for people to speak up and stop work in an unsafe situation. In 2023, our focus shifted to developing a refresher course to ensure safety leadership remains at the forefront of our operations. In doing this, we align the programme with the Gold Fields Way (p44), aim to reinvigorate the focus on safety leadership, drive team participation and create links to CCM. From a behavioural perspective, we continued implementing programmes to drive positive safety behaviours within the workplace. This includes our Vital Behaviours programme, through which all employees demonstrate their commitment to safety practices. During the year, we trained 4,251 employees and contractors in the CSL programme and, to date, over 28,000 people have completed this programme. Health and wellness Occupational diseases Our workforce is potentially exposed to hazards that could cause a range of occupational diseases. These include noise-induced hearing loss (NIHL), Silicosis and Cardio-respiratory Tuberculosis (CRTB), and musculoskeletal disorders (MSD). The degree of exposure risk varies between our sites due to the nature of our operations. We balance leadership, behaviours and fit-for-purpose management systems, and protocols and controls to protect our employees from exposure to these risks, all of which align with our commitment to upholding human rights. We manage occupational diseases through our CCM approach and Occupational Health Strategic Framework. We also formed a Health Working Group to consolidate and align occupational health management practices and develop consistent approaches to mental health and psychosocial risk assessments across the Group. The number of occupational disease cases recorded during 2023 rose to 29 from 27 in 2022. MSDs made up nine of the cases (2022: 10), NIHL eightRA (2022: four), CRTB eight (2022: nine) and Silicosis twoRA (2022: two). Silicosis and CRTB only occurred at South Deep, while MSDs occurred in Ghana, South Africa and Australia. No occupational diseases were reported in Peru and Chile. DPM poses a risk for employees operating diesel-powered vehicles or working with machinery in confined underground spaces. This risk is more pronounced at our Australian and South African mines than our open-pit operations in Ghana and Peru. During the year, DPM levels continued to fall significantly, and only 3% of personal samples exceeded the occupational exposure limit (2022: 4%). Silicosis and Tuberculosis Airborne pollutant exposures and suppression remain a key focus area for South Deep, which recorded all cases of CRTB in the Group and twoRA Silicosis cases (2022: two), which were submitted for compensation. While high, the trend is improving amid a decline in respirable silica dust exposures as the mine has expanded the number of dust suppression units. In line with industry milestones, South Deep has not had any Silicosis cases for individuals who joined the industry after 2008. All employees diagnosed with Silicosis go on a six-month prophylactic CRTB course of medication to reduce the risk of contracting CRTB. Overview Governance Our business Strategic pillar 1 Strategic pillar 2 Strategic pillar 3 Assurance Gold Fields IAR-41
Building a safe and respectful workplace continued Silicosis and Tuberculosis continued Wider dust mitigation strategies include extensive dust monitoring and measuring, automated dust suppression systems and, as far as practical, removing people from risk. Training, education and awareness programmes, as well as appropriate protection equipment, are provided to employees. Annual and ad hoc medical screening help with early identification. In May 2018, Gold Fields and five other South African gold companies reached a historic settlement with claimant attorneys in a Silicosis and Tuberculosis class action. A settlement trust, known as the Tshiamiso Trust, was established to execute the terms of the settlement and ensure all eligible current and former mineworkers across southern Africa with Silicosis or work-related Tuberculosis (or their dependants, where the mineworker has passed away) are compensated. By 7 March 2024, the Trust had paid out R1.47bn (US$79.5m) to 16,102 industry claimants. At 31 December 2023, the provision for Gold Fields’ share of the settlement of the class action claims and related costs amounted to R94m (US$5m). While no Silicosis or CRTB cases were recorded in West Africa for the past two years, we continue to implement wider dust mitigation strategies in the country, including extensive dust monitoring and measuring, automated dust suppression systems and, as far as practical, removing people from risk. Training, education and awareness programmes, as well as appropriate protection equipment, are provided to employees. Annual and ad hoc medical screening also help with early identification. Noise-Induced Hearing Loss NIHL is a risk for employees exposed to ongoing high noise levels from machinery and equipment. New NIHL cases increased slightly, with six cases reported at South Deep (2022: four) and two in Australia (2022: zero). The majority of the employees affected in South Africa have over 36 years experience in the industry. All new equipment purchased, as far as reasonably practical, should not exceed noise levels of 107 dB(A), in line with the 2024 industry milestone. South Deep continues to mitigate exposure by applying engineering and administrative controls at all high noise-emitting sources. This includes installing silencers; purchasing less noisy equipment where possible; identifying and zoning noise areas; and providing personalised hearing protection devices to employees. We also continue to encourage original equipment manufacturers to develop quieter equipment through our participation in the Minerals Council South Africa. HIV/Aids HIV/Aids is a particular risk for the South African population and is therefore a focus at South Deep. The percentage of HIV/Aids cases increased slightly to 19.7% (2022: 19.4%), mainly due to the increase in our workforce. At end-2023, 979 employees were living with HIV/Aids. We offer voluntary counselling and testing (VCT) to prospective and permanent employees, including contractors, and 98% of the workforce underwent VCT in 2023. We also provide HIV-positive employees with free highly active anti-retroviral therapy (HAART) and 580 employees are enrolled in this programme at present. Employees’ dependants can access HAART through the Company’s medical aid schemes. HIV/Aids is less of a risk in Ghana, where the national HIV/Aids rate is below 2%. However, we offer free VCT to employees and contractors and run several educational programmes. During 2023, 47% of our workforce in Ghana underwent VCT (2022: 61%) and nine employees are enrolled in HAART (2022: eight). We identified three new HIV/Aids positive cases among our Ghana workforce. In total, 8,184 Gold Fields employees underwent VCT in 2023, while 589 were enrolled in HAART. Malaria In Ghana, our employees face a high risk of exposure to malaria. The region has a comprehensive malaria control strategy in place, which includes education initiatives, prevention, prophylaxis and treatment. We also provide mosquito repellent to our workers, support for community health facilities and rapid diagnosis and treatment. In 2023, 460RA employees (2022: 260) tested positive for malaria. We continue to assist our employees and communities under the indoor spraying programme. Covid-19 In May 2023, the World Health Organization declared an end to Covid-19 as a public health emergency. The pandemic had a limited impact on our operations in 2023. We continued to screen employees as needed and had no active cases as at end-December 2023. We also did not record any Covid-19-related deaths during the year. Nevertheless, our operations remain ready to implement the necessary hygiene and distancing measures should new Covid-19 waves emerge. Psychosocial harm Our aspiration for zero harm extends to protecting our people’s psychological and emotional health. We do not tolerate any form of harassment, bullying, discrimination or harmful behaviour, and are seeking to creating a safe workplace where everyone feels respected, valued and empowered to speak up. To achieve this, we need to build a culture centred on respect and care – one that values diversity, is inclusive and upholds the fundamental human rights of all our people. Therefore, in 2022, Gold Fields engaged EB&Co to conduct an expert independent review of our workplace culture. The findings of EB&Co’s review were released in August 2023 and provided a better understanding of our people’s lived experiences in relation to harmful behaviour in the workplace, including bullying, sexual harassment and racism. The findings highlighted the need for significant efforts to create the secure, diverse and respectful work environments our employees rightfully expect and our leadership recognises as essential for our business to successfully execute its strategy. A total of 2,855 employees responded to the online survey, amounting to 45% of employees across our regions. A far smaller number (7%) of our contractors participated, in part due to legal restrictions in certain regions. While the review identified many strengths – including the directional change in culture, team collaboration and the Group’s focus on physical safety – approximately half of the respondents reported having experienced harmful behaviour at work in the past five years, mainly relating to bullying; gender inequality; sexual harassment; and racism. The Board and management reviewed the findings and committed to the following principles: • Implementation of EB&Co’s recommendations in full and conduct a follow-up survey in three years time to monitor our progress • Build a respectful workplace framework as a key element of developing greater psychological safety across the business • Build greater understanding and awareness of what diversity, equity, inclusion and belonging (DEIB) means in our business. Gold Fields is committed to making our Company a working environment free from harmful behaviours. We intend to take important steps to ensure we eliminate these kinds of behaviour and are actively implementing the remedial recommendations stemming from the EB&Co review. The dashboard on the following page shows our progress in our actions to build a more respectful workplace. Overview Governance Our business Strategic pillar 1 Strategic pillar 2 Strategic pillar 3 Assurance Gold Fields IAR-42
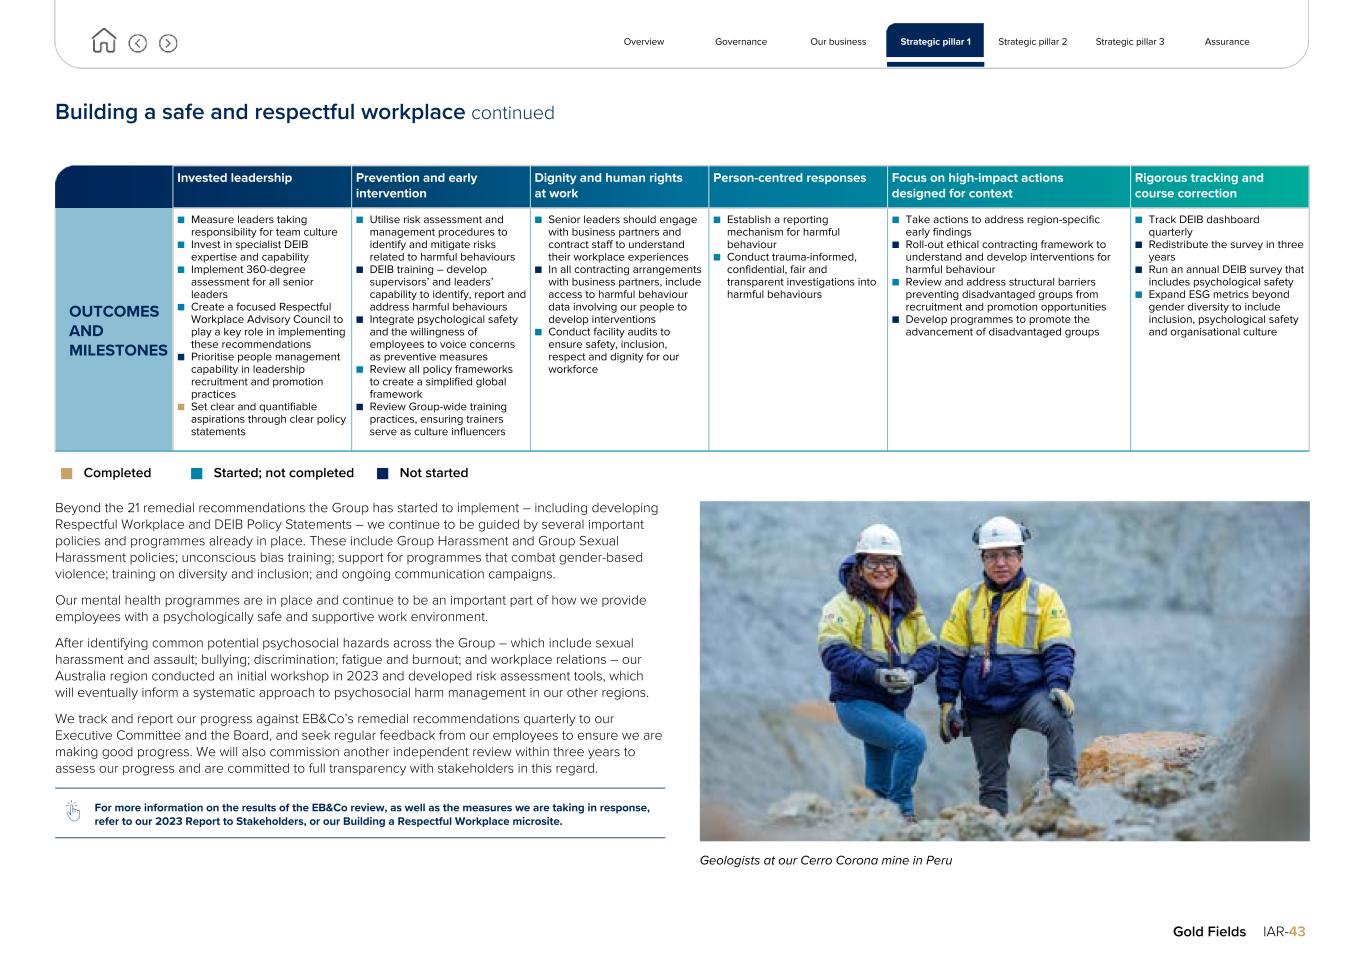
Building a safe and respectful workplace continued Invested leadership Prevention and early intervention Dignity and human rights at work Person-centred responses Focus on high-impact actions designed for context Rigorous tracking and course correction OUTCOMES AND MILESTONES ■ Measure leaders taking responsibility for team culture ■ Invest in specialist DEIB expertise and capability ■ Implement 360-degree assessment for all senior leaders ■ Create a focused Respectful Workplace Advisory Council to play a key role in implementing these recommendations ■ Prioritise people management capability in leadership recruitment and promotion practices ■ Set clear and quantifiable aspirations through clear policy statements ■ Utilise risk assessment and management procedures to identify and mitigate risks related to harmful behaviours ■ DEIB training – develop supervisors’ and leaders’ capability to identify, report and address harmful behaviours ■ Integrate psychological safety and the willingness of employees to voice concerns as preventive measures ■ Review all policy frameworks to create a simplified global framework ■ Review Group-wide training practices, ensuring trainers serve as culture influencers ■ Senior leaders should engage with business partners and contract staff to understand their workplace experiences ■ In all contracting arrangements with business partners, include access to harmful behaviour data involving our people to develop interventions ■ Conduct facility audits to ensure safety, inclusion, respect and dignity for our workforce ■ Establish a reporting mechanism for harmful behaviour ■ Conduct trauma-informed, confidential, fair and transparent investigations into harmful behaviours ■ Take actions to address region-specific early findings ■ Roll-out ethical contracting framework to understand and develop interventions for harmful behaviour ■ Review and address structural barriers preventing disadvantaged groups from recruitment and promotion opportunities ■ Develop programmes to promote the advancement of disadvantaged groups ■ Track DEIB dashboard quarterly ■ Redistribute the survey in three years ■ Run an annual DEIB survey that includes psychological safety ■ Expand ESG metrics beyond gender diversity to include inclusion, psychological safety and organisational culture n Completed n Started; not completed n Not started Beyond the 21 remedial recommendations the Group has started to implement – including developing Respectful Workplace and DEIB Policy Statements – we continue to be guided by several important policies and programmes already in place. These include Group Harassment and Group Sexual Harassment policies; unconscious bias training; support for programmes that combat gender-based violence; training on diversity and inclusion; and ongoing communication campaigns. Our mental health programmes are in place and continue to be an important part of how we provide employees with a psychologically safe and supportive work environment. After identifying common potential psychosocial hazards across the Group – which include sexual harassment and assault; bullying; discrimination; fatigue and burnout; and workplace relations – our Australia region conducted an initial workshop in 2023 and developed risk assessment tools, which will eventually inform a systematic approach to psychosocial harm management in our other regions. We track and report our progress against EB&Co’s remedial recommendations quarterly to our Executive Committee and the Board, and seek regular feedback from our employees to ensure we are making good progress. We will also commission another independent review within three years to assess our progress and are committed to full transparency with stakeholders in this regard. For more information on the results of the EB&Co review, as well as the measures we are taking in response, refer to our 2023 Report to Stakeholders, or our Building a Respectful Workplace microsite. Geologists at our Cerro Corona mine in Peru Overview Governance Our business Strategic pillar 1 Strategic pillar 2 Strategic pillar 3 Assurance Gold Fields IAR-43
Building a safe and respectful workplace continued Evolving the Gold Fields culture Early in 2023, building on several months of consultation, we launched the Gold Fields Way to shape our actions and define our culture in our pursuit of being #StrongerTogether. The Gold Fields Way details our culture aspiration and the behavioural attributes we expect from our employees. With this as our foundation, we will purposefully build a new culture based on four key areas: being one, caring, inclusive and empowered team; creating a respectful workplace with guaranteed dignity; working smarter together; and unlocking potential through learning and innovation. These key areas are further supported by ten behaviours that our employees identified as being critical to driving our aspired culture. We launched a culture roll-out programme, which is supported by several initiatives: capability and skills programmes to reinforce the role of leadership within the Group; workshops and conversations across regions; talent and performance processes; and specific targeted interventions to drive the change. A key milestone on our journey was the Gold Fields Way Summit held in London in June 2023. This brought together 92 leaders from our business to align on the key actions our leaders need to own and implement to propel our culture journey. These leaders will act as change agents to drive the Gold Fields Way across the business. We have already implemented several changes to help shape our journey going forward, including convening a Culture Guardian Committee, comprising regional Executive Vice-Presidents and General Managers (GM) to drive culture changes. Our GM Forum will also improve collaboration across the business. Through our culture future forum, comprising a representative group of Gold Fields employees and chaired by the CEO, we continue to identify practical ways to build the culture that Gold Fields aspires for. Over the next two to three years, Gold Fields will implement recommendations from the Culture Future Forum and the EB&Co review. We will measure the maturity of our culture journey based on five key elements, detailed hereafter. Creating a diverse and inclusive workforce At Gold Fields, we understand that the key to realising our full potential is by embracing the diverse attributes and perspectives of our people. We want our organisation to better reflect the demographics of the countries and communities in which we operate and have specific targets in place to address this. This goal can only be realised by building a workplace culture that holds safety, inclusivity and respect at its core. During 2023, we evolved our Diversity and Inclusion Strategy to a Diversity, Equity, Inclusion and Belonging Strategy. In January 2024, our Board approved the Group’s updated Diversity, Equity, Inclusion and Belonging Policy Statement to ensure we work in an environment where everyone contributes to Gold Fields’ vision. In June 2022, the ICMM announced updates to the Mining Principles to improve individual company performance related to diversity, equity and inclusion. Following this, the ICMM launched its Diversity, Equity and Inclusion Position Statement in June 2023. As a member of the ICMM, Gold Fields provided input on both developments and will review the updates against our current practices. We continued to measure progress against our diversity and inclusion dashboard, which measures lead indicators such as succession planning, risk of employee departures and other key factors that drive our workforce composition. At the end of December 2023, 25% of Gold Fields’ employees were women (2022: 23%). The percentage of women in core mining roles remained stable at 55% (2022: 55%), while the percentage of women in leadership improved from 25% to 27%. While these statistics show room for improvement, it is pleasing to see the steady increase in female representation over time: in 2016, only 16% of our workforce were women; 15% at management level and 8% in core mining roles. The basic salary ratio for women to men was 0.94 in 2023 (2022: 0.97), reflecting our focused recruitment, retention and development of women, as well as salary adjustments where necessary. Gold Fields was included in the Bloomberg Gender-Equality Index for the sixth year in a row – one of only about 500 companies globally to achieve this. In South Africa, legislation requires strong presentation by Historically Disadvantaged Persons (HDP) in the workplace. South Deep is making good progress in this regard, with 79% of employees HDPs and 65% of senior management. HDPs include white, women but not foreign national employees. Talent and leadership development Our training and development programmes attract new talent and develop the skills required by increasingly mechanised, modernised and automated mines. In 2023, we invested US$1,400 per employee in training (2022: US$1,411). Leadership competencies are critical in helping us achieve our business plan. We have developed leadership programmes to meet specific objectives for senior managers, middle managers and graduates, which were rolled out in 2023. We have also finalised Gold Fields’ job architecture for all roles across disciplines and career paths. Culture and talent development help us attract and retain the right people. Critical role turnover for the Group was 9% against a target of 5%. Our Western Australian and Chilean operations in particular had high turnover levels of 15% and 13% respectively amid retention challenges in a fiercely competitive skills market. Factors influencing the workforce in Australia include skills shortages in crucial job categories and the mobile nature of the fly-in, fly-out (FIFO) workforce. In Chile, the remote location and high altitudes of Salares Norte also contribute to employee turnover. The shortages of long-hole drill operators at South Deep amid new projects in the diamond industry coming on stream, abated in H2 2023 as the mine was able to recruit from the platinum group metals sector, where operations have had to scale back employment due to price pressures. To address the wider turnover challenges, we focus on building our brand, talent attraction and retention, and employee benefit programmes. Overview Governance Our business Strategic pillar 1 Strategic pillar 2 Strategic pillar 3 Assurance Gold Fields IAR-44
Building a safe and respectful workplace continued Refining the operating model A well-designed operating model is the backbone of any successful organisation, providing a blueprint for how different components work together to achieve strategic objectives. It aligns various functions, reduces duplication and waste, and ensures collaboration across functions and operations. In February 2024, Gold Fields announced that it will change its operating model from a three-layered organisation (Group, region, asset) to a two-layer functional guidance model (Group, assets), with the Group providing stronger functional guidance and support and leadership to the assets who, in turn, will be responsible for ensuring safe, reliable and cost-effective production. With the regional structure removed, the Group’s seven Australian and African mines will report into a newly created COO position. Martin Preece, our previous Interim CEO and EVP South Africa, was appointed to this position. The Cerro Corona and Salares Norte mines in South America will continue to report to the EVP South America, Luis Rivera. The implementation of the new operating model should be finalised during Q2 2024. Restructuring in Ghana At the end of 2022, we started the process of combining Damang and Tarkwa’s management teams to maintain maximum efficiency as Damang heads toward closure. Because of this, about 20% of the workforce was retrenched at the beginning of 2023. While the one-mine model and restructuring reduced host community employment, some host community employees were re-employed by contractors in April. The process was based on extensive engagement with members of our host community, who understood the need for exercise and the impacts thereof. We will continue to prioritise employing members from our host communities for future roles. In March 2023, we also announced the proposed Tarkwa/Iduapriem JV with AngloGold Ashanti which, if approved, will create the largest gold mine in Africa and one of the largest in the world. The joint operation is expected to be supported by a substantial mineral endowment and an initial life-of-mine until 2042. While there may be some management positions impacted by the JV, if approved, the consolidated operation will ensure longer-term employment opportunities for the majority of the employees and contractors at both operations. We continue to engage with the Government of Ghana to obtain approval for the JV. For more information, refer to p82. Organised labour We uphold our employees’ rights to freedom of association and collective bargaining, and we ensure our contractors also abide by these standards. Trade union membership among our employees is as follows: • South Africa: 76% • Ghana: 0% employees and an estimated 36% of contractors • Chile: 59% of employees and 50% of contractors • Peru: 23% of employees and 12% of contractors In Australia, in accordance with legislative requirements, we do not collect data around union representation for employees or contractors. Early in 2024, to foster a stable employee relations environment ahead of the planned increase in production and gold recovery – and to help attract and retain key skills and talent – South Deep extended its wage agreement with the National Union of Mineworkers and United Association of South Africa by two years to February 2026. To secure the agreement, the mine raised the wage increase for entry-level with 8% to 9% in 2023, while miners, artisans and officials received an increase of 7.5% – 8%. In 2024, the increase will be based on consumer price index (CPI) plus 2% for entry-level employees and CPI plus 1% for miners, artisans and officials. Following the conclusion of the extended wage agreement, employee turnover with defined labour unions seemed to have stabilised – particularly among artisans and long hole stope operators. This is also attributed to a salary progression model implemented for long hole stope operators to provide for salary adjustments and enable greater versatility, self-sufficiency, and proficiency. In Chile, upcoming collective bargaining with the Sindicato No 1 de Trabajadores trade union will set the precedent for mutual understanding and expectations around employment conditions – including wages, breaks, housing, benefits and bonuses. We are also gradually implementing a 40-hour work week in line with new legislation, with full implementation required by 2028. In 2023, we instituted a 44-hour work week as part of our commitment to comply within the required timelines. In Peru, two of our principal contractors – Newrest Peru and MUR WY – were able to secure collective agreements through open and constructive dialogue. These agreements are valid for three years, and are a significant step up from the previously standard one-year agreements. Overview Governance Our business Strategic pillar 1 Strategic pillar 2 Strategic pillar 3 Assurance Gold Fields IAR-45
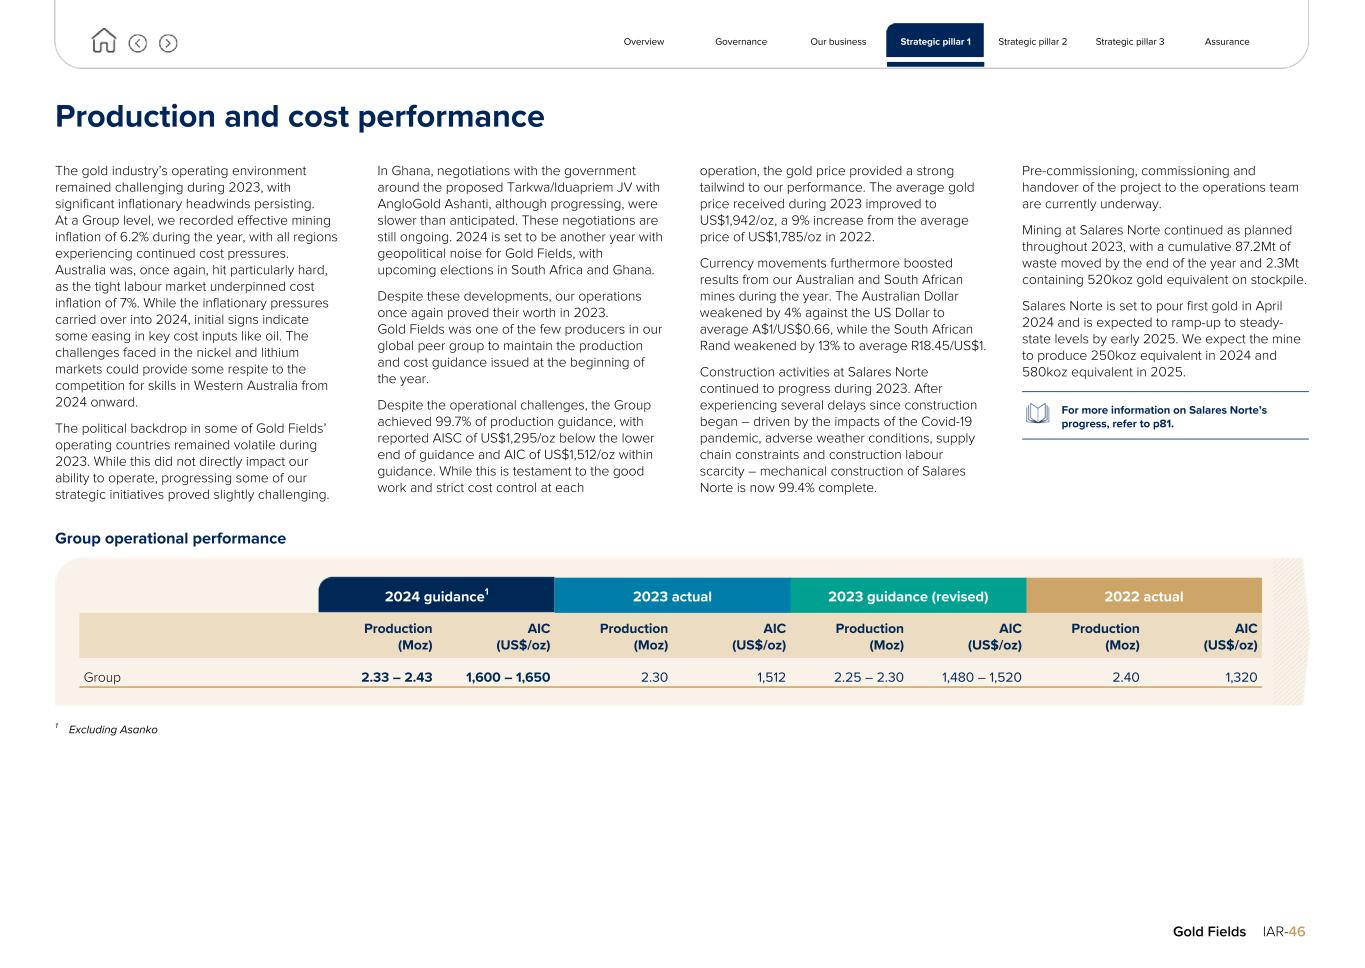
Production and cost performance The gold industry’s operating environment remained challenging during 2023, with significant inflationary headwinds persisting. At a Group level, we recorded effective mining inflation of 6.2% during the year, with all regions experiencing continued cost pressures. Australia was, once again, hit particularly hard, as the tight labour market underpinned cost inflation of 7%. While the inflationary pressures carried over into 2024, initial signs indicate some easing in key cost inputs like oil. The challenges faced in the nickel and lithium markets could provide some respite to the competition for skills in Western Australia from 2024 onward. The political backdrop in some of Gold Fields’ operating countries remained volatile during 2023. While this did not directly impact our ability to operate, progressing some of our strategic initiatives proved slightly challenging. In Ghana, negotiations with the government around the proposed Tarkwa/Iduapriem JV with AngloGold Ashanti, although progressing, were slower than anticipated. These negotiations are still ongoing. 2024 is set to be another year with geopolitical noise for Gold Fields, with upcoming elections in South Africa and Ghana. Despite these developments, our operations once again proved their worth in 2023. Gold Fields was one of the few producers in our global peer group to maintain the production and cost guidance issued at the beginning of the year. Despite the operational challenges, the Group achieved 99.7% of production guidance, with reported AISC of US$1,295/oz below the lower end of guidance and AIC of US$1,512/oz within guidance. While this is testament to the good work and strict cost control at each operation, the gold price provided a strong tailwind to our performance. The average gold price received during 2023 improved to US$1,942/oz, a 9% increase from the average price of US$1,785/oz in 2022. Currency movements furthermore boosted results from our Australian and South African mines during the year. The Australian Dollar weakened by 4% against the US Dollar to average A$1/US$0.66, while the South African Rand weakened by 13% to average R18.45/US$1. Construction activities at Salares Norte continued to progress during 2023. After experiencing several delays since construction began – driven by the impacts of the Covid-19 pandemic, adverse weather conditions, supply chain constraints and construction labour scarcity – mechanical construction of Salares Norte is now 99.4% complete. Pre-commissioning, commissioning and handover of the project to the operations team are currently underway. Mining at Salares Norte continued as planned throughout 2023, with a cumulative 87.2Mt of waste moved by the end of the year and 2.3Mt containing 520koz gold equivalent on stockpile. Salares Norte is set to pour first gold in April 2024 and is expected to ramp-up to steady- state levels by early 2025. We expect the mine to produce 250koz equivalent in 2024 and 580koz equivalent in 2025. For more information on Salares Norte’s progress, refer to p81. Group operational performance 2024 guidance1 2023 actual 2023 guidance (revised) 2022 actual Production (Moz) AIC (US$/oz) Production (Moz) AIC (US$/oz) Production (Moz) AIC (US$/oz) Production (Moz) AIC (US$/oz) Group 2.33 – 2.43 1,600 – 1,650 2.30 1,512 2.25 – 2.30 1,480 – 1,520 2.40 1,320 1 Excluding Asanko Overview Governance Our business Strategic pillar 1 Strategic pillar 2 Strategic pillar 3 Assurance Gold Fields IAR-46
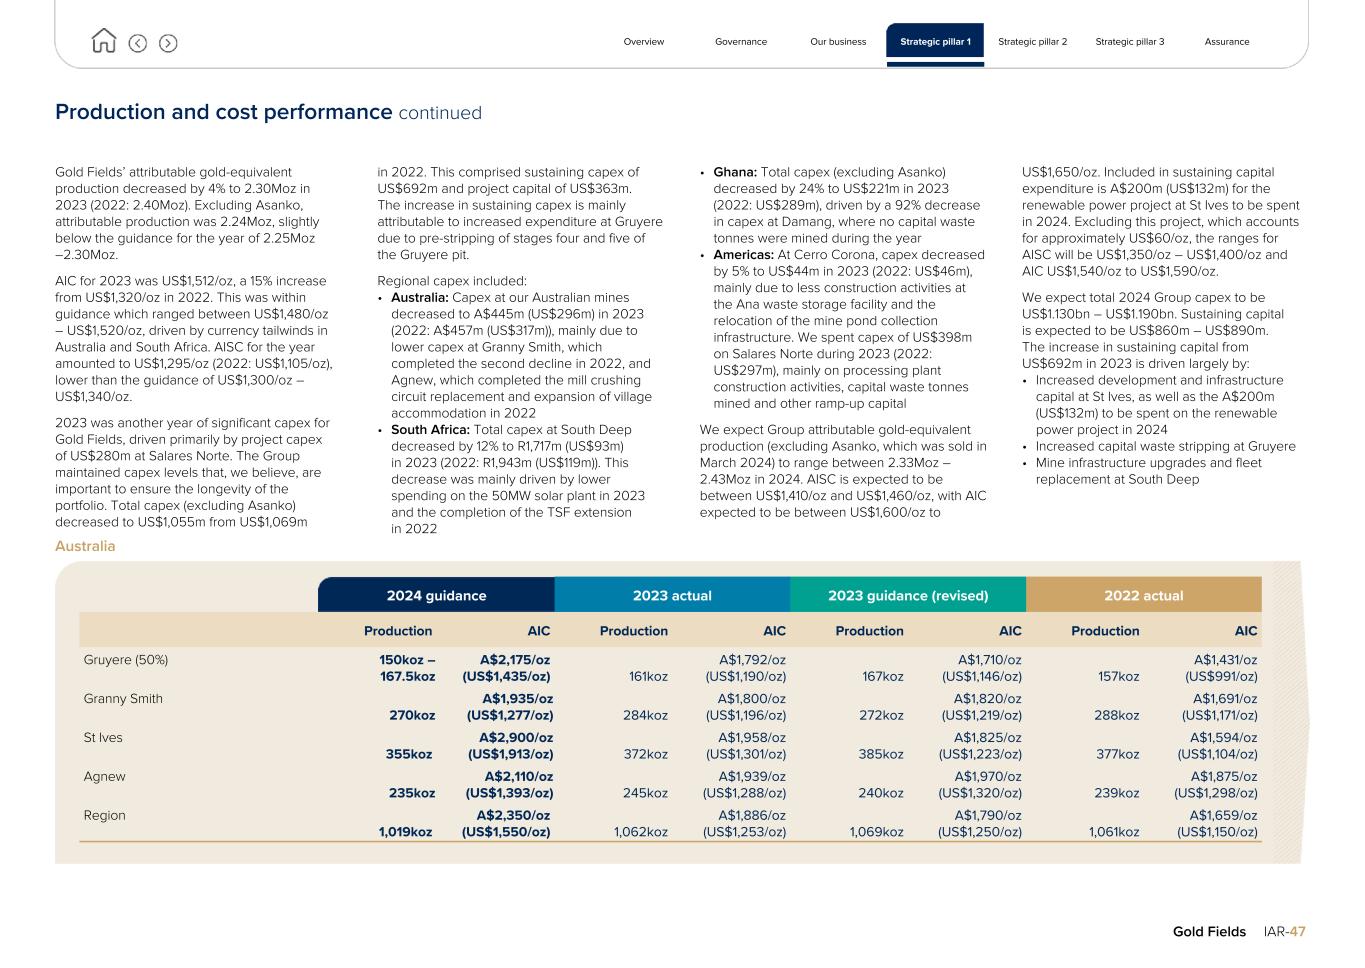
Production and cost performance continued Gold Fields’ attributable gold-equivalent production decreased by 4% to 2.30Moz in 2023 (2022: 2.40Moz). Excluding Asanko, attributable production was 2.24Moz, slightly below the guidance for the year of 2.25Moz –2.30Moz. AIC for 2023 was US$1,512/oz, a 15% increase from US$1,320/oz in 2022. This was within guidance which ranged between US$1,480/oz – US$1,520/oz, driven by currency tailwinds in Australia and South Africa. AISC for the year amounted to US$1,295/oz (2022: US$1,105/oz), lower than the guidance of US$1,300/oz – US$1,340/oz. 2023 was another year of significant capex for Gold Fields, driven primarily by project capex of US$280m at Salares Norte. The Group maintained capex levels that, we believe, are important to ensure the longevity of the portfolio. Total capex (excluding Asanko) decreased to US$1,055m from US$1,069m in 2022. This comprised sustaining capex of US$692m and project capital of US$363m. The increase in sustaining capex is mainly attributable to increased expenditure at Gruyere due to pre-stripping of stages four and five of the Gruyere pit. Regional capex included: • Australia: Capex at our Australian mines decreased to A$445m (US$296m) in 2023 (2022: A$457m (US$317m)), mainly due to lower capex at Granny Smith, which completed the second decline in 2022, and Agnew, which completed the mill crushing circuit replacement and expansion of village accommodation in 2022 • South Africa: Total capex at South Deep decreased by 12% to R1,717m (US$93m) in 2023 (2022: R1,943m (US$119m)). This decrease was mainly driven by lower spending on the 50MW solar plant in 2023 and the completion of the TSF extension in 2022 • Ghana: Total capex (excluding Asanko) decreased by 24% to US$221m in 2023 (2022: US$289m), driven by a 92% decrease in capex at Damang, where no capital waste tonnes were mined during the year • Americas: At Cerro Corona, capex decreased by 5% to US$44m in 2023 (2022: US$46m), mainly due to less construction activities at the Ana waste storage facility and the relocation of the mine pond collection infrastructure. We spent capex of US$398m on Salares Norte during 2023 (2022: US$297m), mainly on processing plant construction activities, capital waste tonnes mined and other ramp-up capital We expect Group attributable gold-equivalent production (excluding Asanko, which was sold in March 2024) to range between 2.33Moz – 2.43Moz in 2024. AISC is expected to be between US$1,410/oz and US$1,460/oz, with AIC expected to be between US$1,600/oz to US$1,650/oz. Included in sustaining capital expenditure is A$200m (US$132m) for the renewable power project at St Ives to be spent in 2024. Excluding this project, which accounts for approximately US$60/oz, the ranges for AISC will be US$1,350/oz – US$1,400/oz and AIC US$1,540/oz to US$1,590/oz. We expect total 2024 Group capex to be US$1.130bn – US$1.190bn. Sustaining capital is expected to be US$860m – US$890m. The increase in sustaining capital from US$692m in 2023 is driven largely by: • Increased development and infrastructure capital at St Ives, as well as the A$200m (US$132m) to be spent on the renewable power project in 2024 • Increased capital waste stripping at Gruyere • Mine infrastructure upgrades and fleet replacement at South Deep Australia 2024 guidance 2023 actual 2023 guidance (revised) 2022 actual Production AIC Production AIC Production AIC Production AIC Gruyere (50%) 150koz – 167.5koz A$2,175/oz (US$1,435/oz) 161koz A$1,792/oz (US$1,190/oz) 167koz A$1,710/oz (US$1,146/oz) 157koz A$1,431/oz (US$991/oz) Granny Smith 270koz A$1,935/oz (US$1,277/oz) 284koz A$1,800/oz (US$1,196/oz) 272koz A$1,820/oz (US$1,219/oz) 288koz A$1,691/oz (US$1,171/oz) St Ives 355koz A$2,900/oz (US$1,913/oz) 372koz A$1,958/oz (US$1,301/oz) 385koz A$1,825/oz (US$1,223/oz) 377koz A$1,594/oz (US$1,104/oz) Agnew 235koz A$2,110/oz (US$1,393/oz) 245koz A$1,939/oz (US$1,288/oz) 240koz A$1,970/oz (US$1,320/oz) 239koz A$1,875/oz (US$1,298/oz) Region 1,019koz A$2,350/oz (US$1,550/oz) 1,062koz A$1,886/oz (US$1,253/oz) 1,069koz A$1,790/oz (US$1,250/oz) 1,061koz A$1,659/oz (US$1,150/oz) Overview Governance Our business Strategic pillar 1 Strategic pillar 2 Strategic pillar 3 Assurance Gold Fields IAR-47
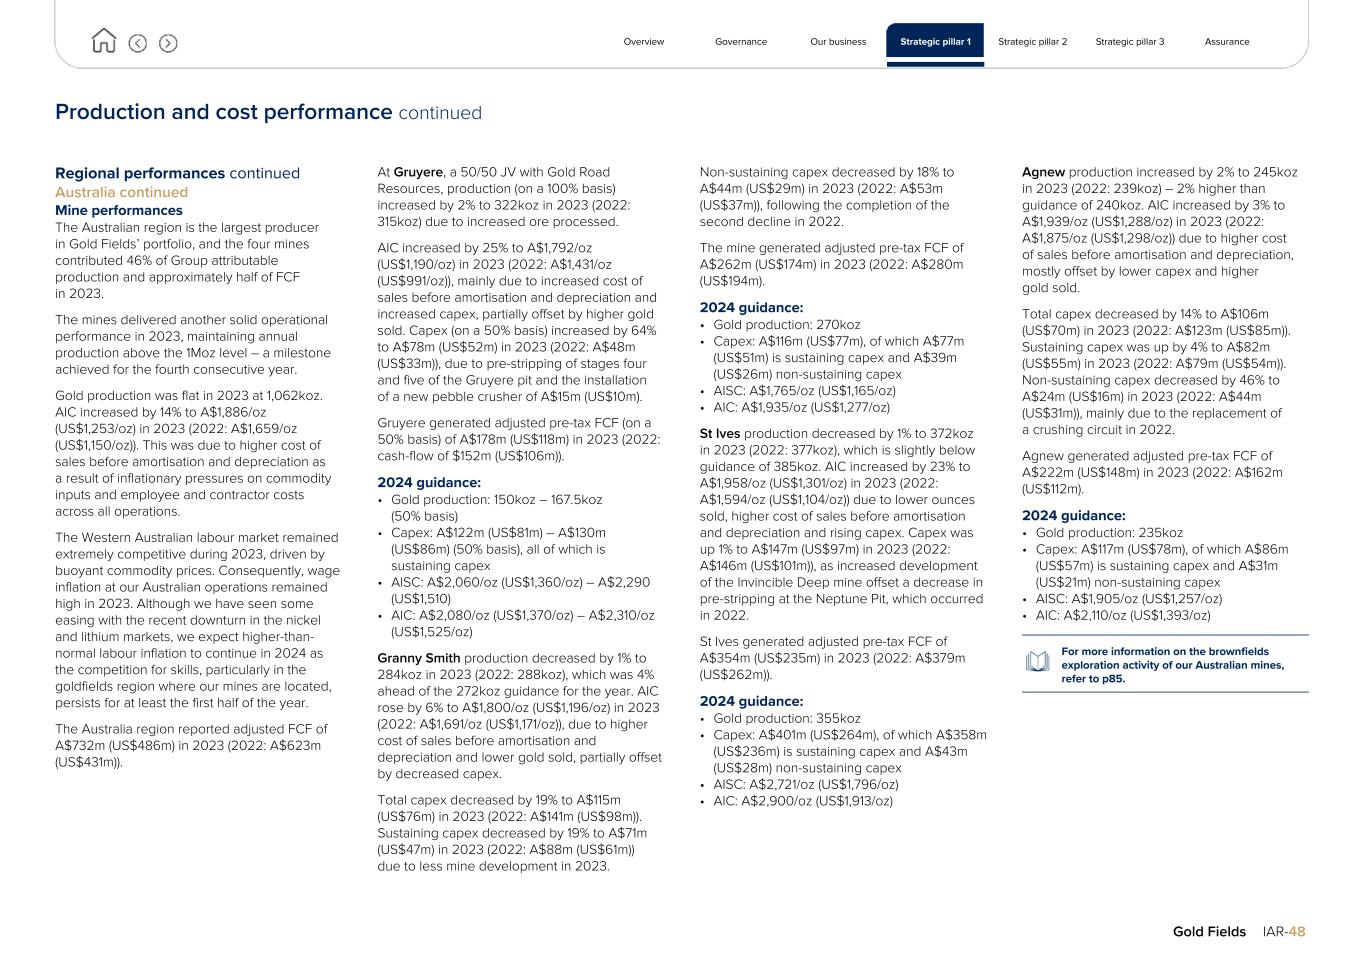
Production and cost performance continued Regional performances continued Australia continued Mine performances The Australian region is the largest producer in Gold Fields’ portfolio, and the four mines contributed 46% of Group attributable production and approximately half of FCF in 2023. The mines delivered another solid operational performance in 2023, maintaining annual production above the 1Moz level – a milestone achieved for the fourth consecutive year. Gold production was flat in 2023 at 1,062koz. AIC increased by 14% to A$1,886/oz (US$1,253/oz) in 2023 (2022: A$1,659/oz (US$1,150/oz)). This was due to higher cost of sales before amortisation and depreciation as a result of inflationary pressures on commodity inputs and employee and contractor costs across all operations. The Western Australian labour market remained extremely competitive during 2023, driven by buoyant commodity prices. Consequently, wage inflation at our Australian operations remained high in 2023. Although we have seen some easing with the recent downturn in the nickel and lithium markets, we expect higher-than- normal labour inflation to continue in 2024 as the competition for skills, particularly in the goldfields region where our mines are located, persists for at least the first half of the year. The Australia region reported adjusted FCF of A$732m (US$486m) in 2023 (2022: A$623m (US$431m)). At Gruyere, a 50/50 JV with Gold Road Resources, production (on a 100% basis) increased by 2% to 322koz in 2023 (2022: 315koz) due to increased ore processed. AIC increased by 25% to A$1,792/oz (US$1,190/oz) in 2023 (2022: A$1,431/oz (US$991/oz)), mainly due to increased cost of sales before amortisation and depreciation and increased capex, partially offset by higher gold sold. Capex (on a 50% basis) increased by 64% to A$78m (US$52m) in 2023 (2022: A$48m (US$33m)), due to pre-stripping of stages four and five of the Gruyere pit and the installation of a new pebble crusher of A$15m (US$10m). Gruyere generated adjusted pre-tax FCF (on a 50% basis) of A$178m (US$118m) in 2023 (2022: cash-flow of $152m (US$106m)). 2024 guidance: • Gold production: 150koz – 167.5koz (50% basis) • Capex: A$122m (US$81m) – A$130m (US$86m) (50% basis), all of which is sustaining capex • AISC: A$2,060/oz (US$1,360/oz) – A$2,290 (US$1,510) • AIC: A$2,080/oz (US$1,370/oz) – A$2,310/oz (US$1,525/oz) Granny Smith production decreased by 1% to 284koz in 2023 (2022: 288koz), which was 4% ahead of the 272koz guidance for the year. AIC rose by 6% to A$1,800/oz (US$1,196/oz) in 2023 (2022: A$1,691/oz (US$1,171/oz)), due to higher cost of sales before amortisation and depreciation and lower gold sold, partially offset by decreased capex. Total capex decreased by 19% to A$115m (US$76m) in 2023 (2022: A$141m (US$98m)). Sustaining capex decreased by 19% to A$71m (US$47m) in 2023 (2022: A$88m (US$61m)) due to less mine development in 2023. Non-sustaining capex decreased by 18% to A$44m (US$29m) in 2023 (2022: A$53m (US$37m)), following the completion of the second decline in 2022. The mine generated adjusted pre-tax FCF of A$262m (US$174m) in 2023 (2022: A$280m (US$194m). 2024 guidance: • Gold production: 270koz • Capex: A$116m (US$77m), of which A$77m (US$51m) is sustaining capex and A$39m (US$26m) non-sustaining capex • AISC: A$1,765/oz (US$1,165/oz) • AIC: A$1,935/oz (US$1,277/oz) St Ives production decreased by 1% to 372koz in 2023 (2022: 377koz), which is slightly below guidance of 385koz. AIC increased by 23% to A$1,958/oz (US$1,301/oz) in 2023 (2022: A$1,594/oz (US$1,104/oz)) due to lower ounces sold, higher cost of sales before amortisation and depreciation and rising capex. Capex was up 1% to A$147m (US$97m) in 2023 (2022: A$146m (US$101m)), as increased development of the Invincible Deep mine offset a decrease in pre-stripping at the Neptune Pit, which occurred in 2022. St Ives generated adjusted pre-tax FCF of A$354m (US$235m) in 2023 (2022: A$379m (US$262m)). 2024 guidance: • Gold production: 355koz • Capex: A$401m (US$264m), of which A$358m (US$236m) is sustaining capex and A$43m (US$28m) non-sustaining capex • AISC: A$2,721/oz (US$1,796/oz) • AIC: A$2,900/oz (US$1,913/oz) Agnew production increased by 2% to 245koz in 2023 (2022: 239koz) – 2% higher than guidance of 240koz. AIC increased by 3% to A$1,939/oz (US$1,288/oz) in 2023 (2022: A$1,875/oz (US$1,298/oz)) due to higher cost of sales before amortisation and depreciation, mostly offset by lower capex and higher gold sold. Total capex decreased by 14% to A$106m (US$70m) in 2023 (2022: A$123m (US$85m)). Sustaining capex was up by 4% to A$82m (US$55m) in 2023 (2022: A$79m (US$54m)). Non-sustaining capex decreased by 46% to A$24m (US$16m) in 2023 (2022: A$44m (US$31m)), mainly due to the replacement of a crushing circuit in 2022. Agnew generated adjusted pre-tax FCF of A$222m (US$148m) in 2023 (2022: A$162m (US$112m). 2024 guidance: • Gold production: 235koz • Capex: A$117m (US$78m), of which A$86m (US$57m) is sustaining capex and A$31m (US$21m) non-sustaining capex • AISC: A$1,905/oz (US$1,257/oz) • AIC: A$2,110/oz (US$1,393/oz) For more information on the brownfields exploration activity of our Australian mines, refer to p85. Overview Governance Our business Strategic pillar 1 Strategic pillar 2 Strategic pillar 3 Assurance Gold Fields IAR-48
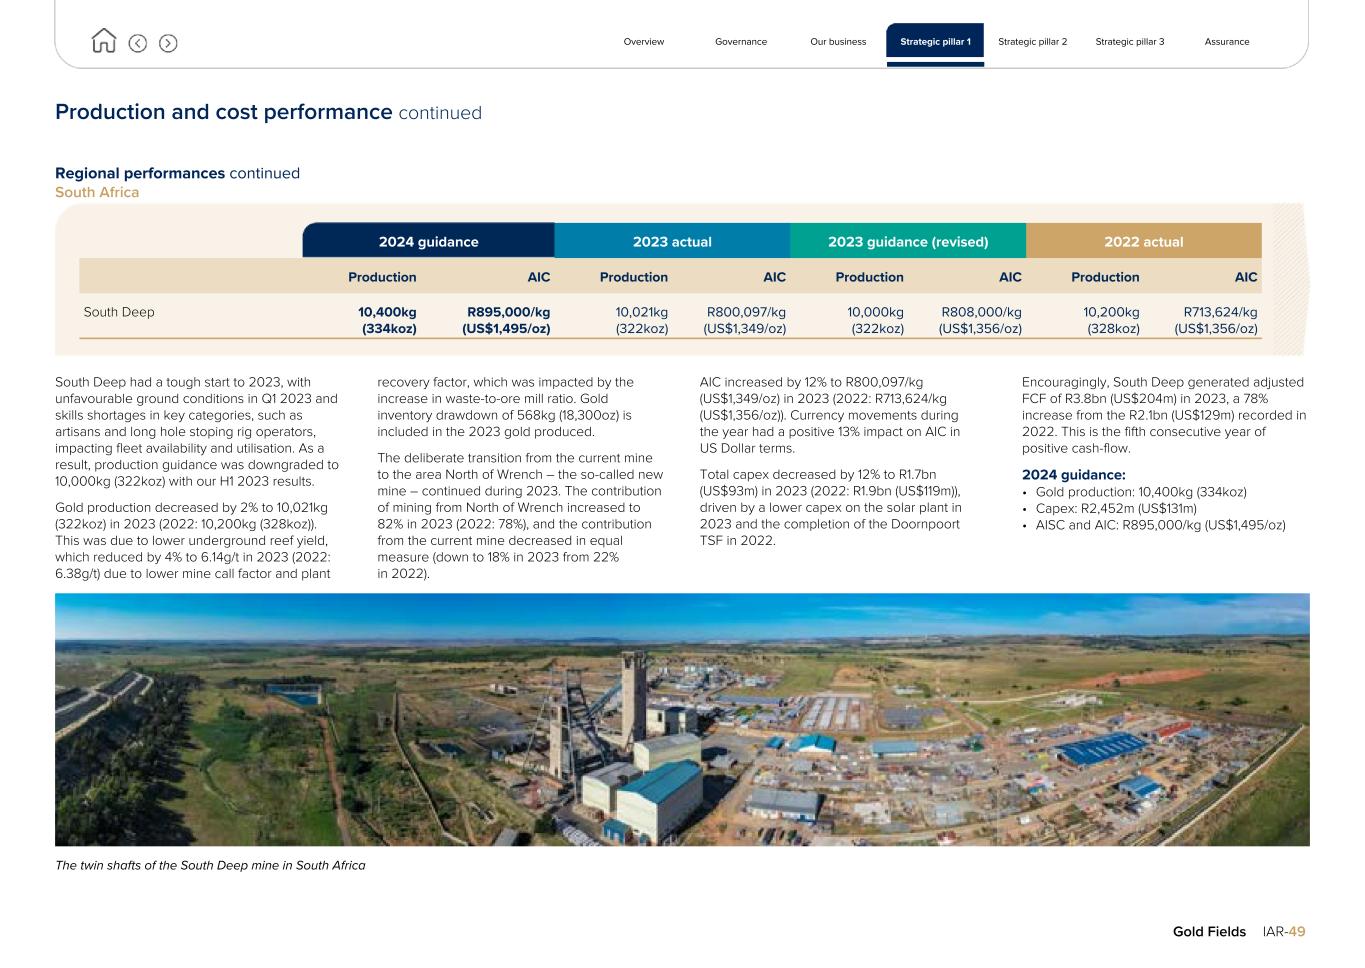
Production and cost performance continued Regional performances continued South Africa 2024 guidance 2023 actual 2023 guidance (revised) 2022 actual Production AIC Production AIC Production AIC Production AIC South Deep 10,400kg (334koz) R895,000/kg (US$1,495/oz) 10,021kg (322koz) R800,097/kg (US$1,349/oz) 10,000kg (322koz) R808,000/kg (US$1,356/oz) 10,200kg (328koz) R713,624/kg (US$1,356/oz) South Deep had a tough start to 2023, with unfavourable ground conditions in Q1 2023 and skills shortages in key categories, such as artisans and long hole stoping rig operators, impacting fleet availability and utilisation. As a result, production guidance was downgraded to 10,000kg (322koz) with our H1 2023 results. Gold production decreased by 2% to 10,021kg (322koz) in 2023 (2022: 10,200kg (328koz)). This was due to lower underground reef yield, which reduced by 4% to 6.14g/t in 2023 (2022: 6.38g/t) due to lower mine call factor and plant recovery factor, which was impacted by the increase in waste-to-ore mill ratio. Gold inventory drawdown of 568kg (18,300oz) is included in the 2023 gold produced. The deliberate transition from the current mine to the area North of Wrench – the so-called new mine – continued during 2023. The contribution of mining from North of Wrench increased to 82% in 2023 (2022: 78%), and the contribution from the current mine decreased in equal measure (down to 18% in 2023 from 22% in 2022). AIC increased by 12% to R800,097/kg (US$1,349/oz) in 2023 (2022: R713,624/kg (US$1,356/oz)). Currency movements during the year had a positive 13% impact on AIC in US Dollar terms. Total capex decreased by 12% to R1.7bn (US$93m) in 2023 (2022: R1.9bn (US$119m)), driven by a lower capex on the solar plant in 2023 and the completion of the Doornpoort TSF in 2022. Encouragingly, South Deep generated adjusted FCF of R3.8bn (US$204m) in 2023, a 78% increase from the R2.1bn (US$129m) recorded in 2022. This is the fifth consecutive year of positive cash-flow. 2024 guidance: • Gold production: 10,400kg (334koz) • Capex: R2,452m (US$131m) • AISC and AIC: R895,000/kg (US$1,495/oz) The twin shafts of the South Deep mine in South Africa Overview Governance Our business Strategic pillar 1 Strategic pillar 2 Strategic pillar 3 Assurance Gold Fields IAR-49
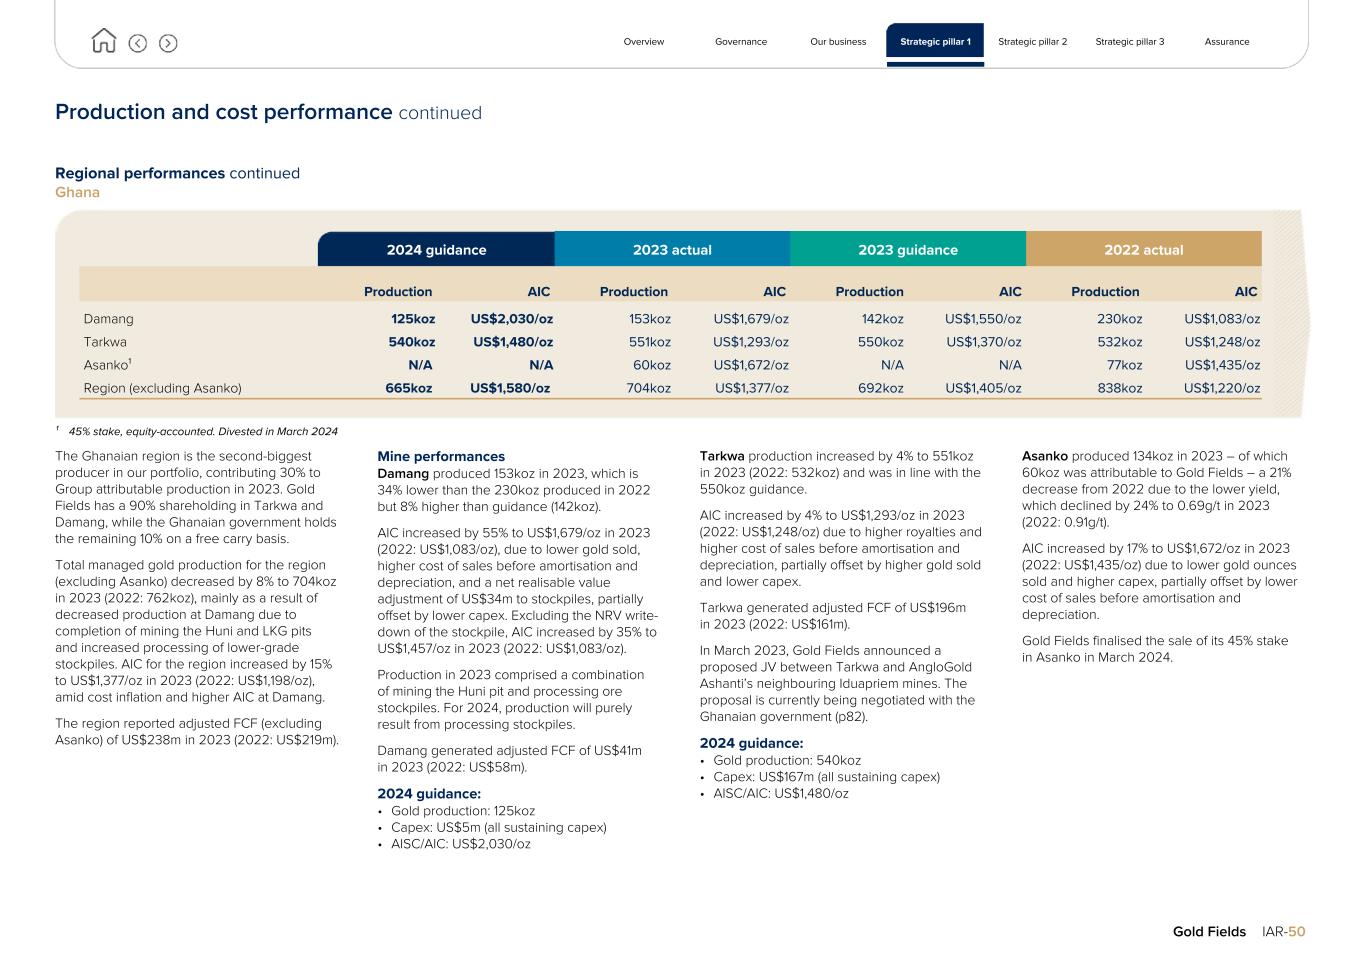
Production and cost performance continued Regional performances continued Ghana 2024 guidance 2023 actual 2023 guidance 2022 actual Production AIC Production AIC Production AIC Production AIC Damang 125koz US$2,030/oz 153koz US$1,679/oz 142koz US$1,550/oz 230koz US$1,083/oz Tarkwa 540koz US$1,480/oz 551koz US$1,293/oz 550koz US$1,370/oz 532koz US$1,248/oz Asanko¹ N/A N/A 60koz US$1,672/oz N/A N/A 77koz US$1,435/oz Region (excluding Asanko) 665koz US$1,580/oz 704koz US$1,377/oz 692koz US$1,405/oz 838koz US$1,220/oz ¹ 45% stake, equity-accounted. Divested in March 2024 The Ghanaian region is the second-biggest producer in our portfolio, contributing 30% to Group attributable production in 2023. Gold Fields has a 90% shareholding in Tarkwa and Damang, while the Ghanaian government holds the remaining 10% on a free carry basis. Total managed gold production for the region (excluding Asanko) decreased by 8% to 704koz in 2023 (2022: 762koz), mainly as a result of decreased production at Damang due to completion of mining the Huni and LKG pits and increased processing of lower-grade stockpiles. AIC for the region increased by 15% to US$1,377/oz in 2023 (2022: US$1,198/oz), amid cost inflation and higher AIC at Damang. The region reported adjusted FCF (excluding Asanko) of US$238m in 2023 (2022: US$219m). Mine performances Damang produced 153koz in 2023, which is 34% lower than the 230koz produced in 2022 but 8% higher than guidance (142koz). AIC increased by 55% to US$1,679/oz in 2023 (2022: US$1,083/oz), due to lower gold sold, higher cost of sales before amortisation and depreciation, and a net realisable value adjustment of US$34m to stockpiles, partially offset by lower capex. Excluding the NRV write- down of the stockpile, AIC increased by 35% to US$1,457/oz in 2023 (2022: US$1,083/oz). Production in 2023 comprised a combination of mining the Huni pit and processing ore stockpiles. For 2024, production will purely result from processing stockpiles. Damang generated adjusted FCF of US$41m in 2023 (2022: US$58m). 2024 guidance: • Gold production: 125koz • Capex: US$5m (all sustaining capex) • AISC/AIC: US$2,030/oz Tarkwa production increased by 4% to 551koz in 2023 (2022: 532koz) and was in line with the 550koz guidance. AIC increased by 4% to US$1,293/oz in 2023 (2022: US$1,248/oz) due to higher royalties and higher cost of sales before amortisation and depreciation, partially offset by higher gold sold and lower capex. Tarkwa generated adjusted FCF of US$196m in 2023 (2022: US$161m). In March 2023, Gold Fields announced a proposed JV between Tarkwa and AngloGold Ashanti’s neighbouring Iduapriem mines. The proposal is currently being negotiated with the Ghanaian government (p82). 2024 guidance: • Gold production: 540koz • Capex: US$167m (all sustaining capex) • AISC/AIC: US$1,480/oz Asanko produced 134koz in 2023 – of which 60koz was attributable to Gold Fields – a 21% decrease from 2022 due to the lower yield, which declined by 24% to 0.69g/t in 2023 (2022: 0.91g/t). AIC increased by 17% to US$1,672/oz in 2023 (2022: US$1,435/oz) due to lower gold ounces sold and higher capex, partially offset by lower cost of sales before amortisation and depreciation. Gold Fields finalised the sale of its 45% stake in Asanko in March 2024. Overview Governance Our business Strategic pillar 1 Strategic pillar 2 Strategic pillar 3 Assurance Gold Fields IAR-50
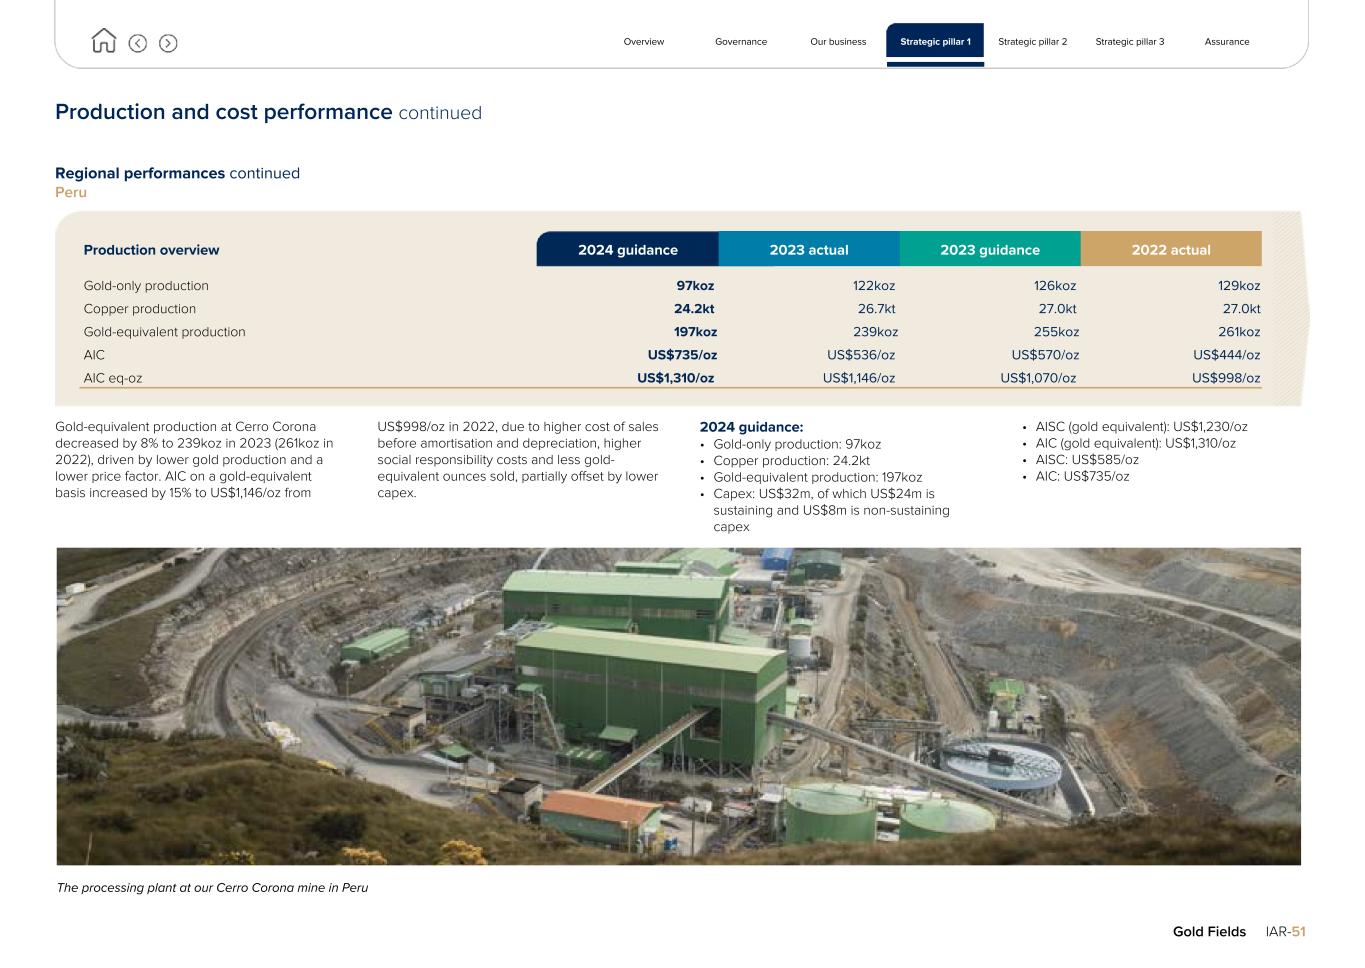
Production and cost performance continued Regional performances continued Peru Production overview 2024 guidance 2023 actual 2023 guidance 2022 actual Gold-only production 97koz 122koz 126koz 129koz Copper production 24.2kt 26.7kt 27.0kt 27.0kt Gold-equivalent production 197koz 239koz 255koz 261koz AIC US$735/oz US$536/oz US$570/oz US$444/oz AIC eq-oz US$1,310/oz US$1,146/oz US$1,070/oz US$998/oz Gold-equivalent production at Cerro Corona decreased by 8% to 239koz in 2023 (261koz in 2022), driven by lower gold production and a lower price factor. AIC on a gold-equivalent basis increased by 15% to US$1,146/oz from US$998/oz in 2022, due to higher cost of sales before amortisation and depreciation, higher social responsibility costs and less gold- equivalent ounces sold, partially offset by lower capex. 2024 guidance: • Gold-only production: 97koz • Copper production: 24.2kt • Gold-equivalent production: 197koz • Capex: US$32m, of which US$24m is sustaining and US$8m is non-sustaining capex • AISC (gold equivalent): US$1,230/oz • AIC (gold equivalent): US$1,310/oz • AISC: US$585/oz • AIC: US$735/oz Overview Governance Our business Strategic pillar 1 Strategic pillar 2 Strategic pillar 3 Assurance Gold Fields IAR-51 The processing plant at our Cerro Corona mine in Peru
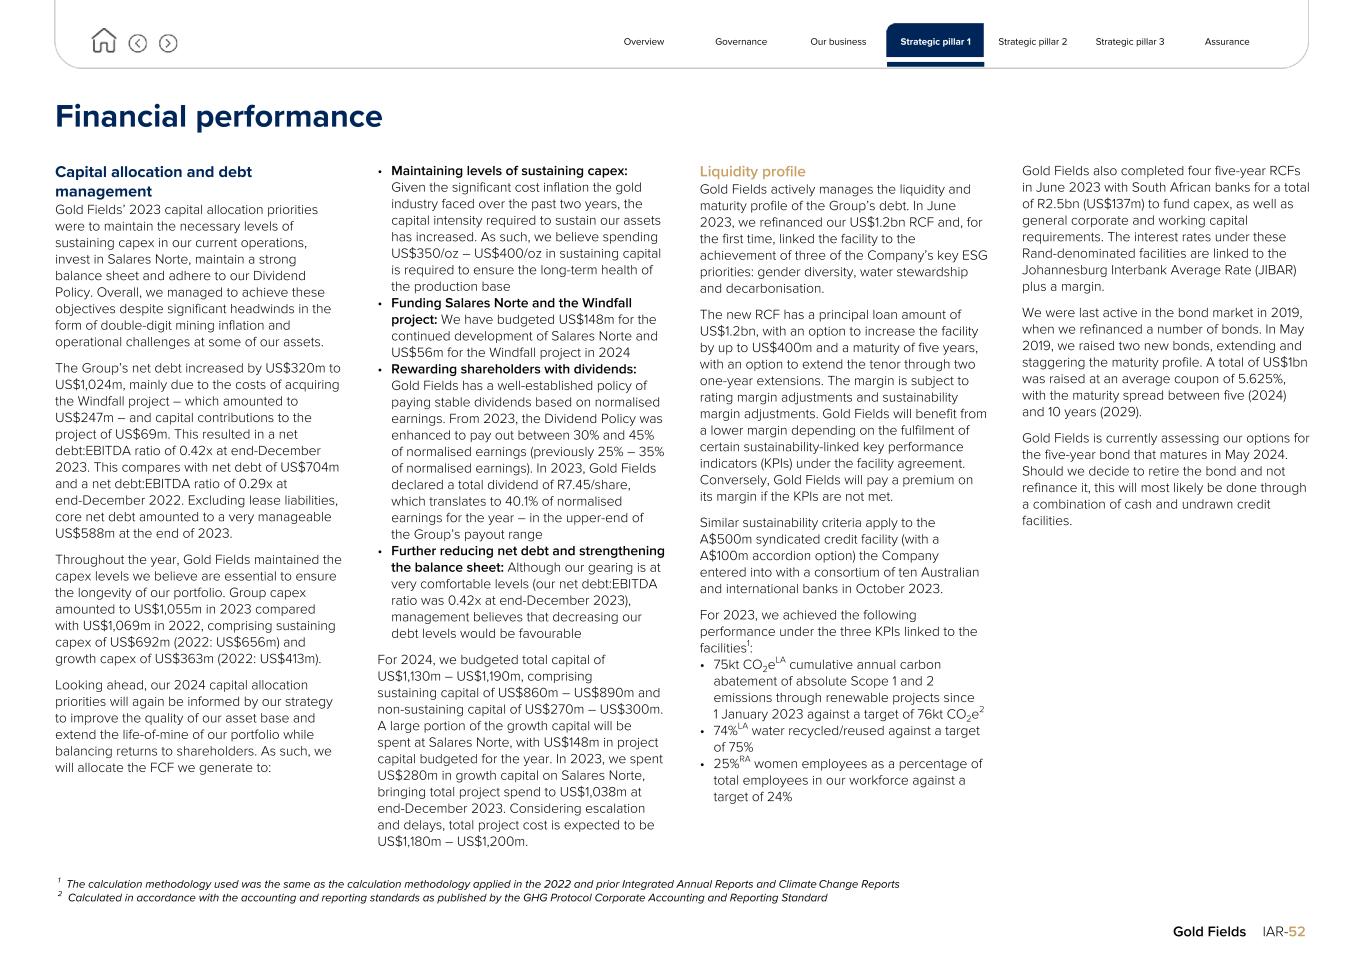
Financial performance Capital allocation and debt management Gold Fields’ 2023 capital allocation priorities were to maintain the necessary levels of sustaining capex in our current operations, invest in Salares Norte, maintain a strong balance sheet and adhere to our Dividend Policy. Overall, we managed to achieve these objectives despite significant headwinds in the form of double-digit mining inflation and operational challenges at some of our assets. The Group’s net debt increased by US$320m to US$1,024m, mainly due to the costs of acquiring the Windfall project – which amounted to US$247m – and capital contributions to the project of US$69m. This resulted in a net debt:EBITDA ratio of 0.42x at end-December 2023. This compares with net debt of US$704m and a net debt:EBITDA ratio of 0.29x at end-December 2022. Excluding lease liabilities, core net debt amounted to a very manageable US$588m at the end of 2023. Throughout the year, Gold Fields maintained the capex levels we believe are essential to ensure the longevity of our portfolio. Group capex amounted to US$1,055m in 2023 compared with US$1,069m in 2022, comprising sustaining capex of US$692m (2022: US$656m) and growth capex of US$363m (2022: US$413m). Looking ahead, our 2024 capital allocation priorities will again be informed by our strategy to improve the quality of our asset base and extend the life-of-mine of our portfolio while balancing returns to shareholders. As such, we will allocate the FCF we generate to: • Maintaining levels of sustaining capex: Given the significant cost inflation the gold industry faced over the past two years, the capital intensity required to sustain our assets has increased. As such, we believe spending US$350/oz – US$400/oz in sustaining capital is required to ensure the long-term health of the production base • Funding Salares Norte and the Windfall project: We have budgeted US$148m for the continued development of Salares Norte and US$56m for the Windfall project in 2024 • Rewarding shareholders with dividends: Gold Fields has a well-established policy of paying stable dividends based on normalised earnings. From 2023, the Dividend Policy was enhanced to pay out between 30% and 45% of normalised earnings (previously 25% – 35% of normalised earnings). In 2023, Gold Fields declared a total dividend of R7.45/share, which translates to 40.1% of normalised earnings for the year – in the upper-end of the Group’s payout range • Further reducing net debt and strengthening the balance sheet: Although our gearing is at very comfortable levels (our net debt:EBITDA ratio was 0.42x at end-December 2023), management believes that decreasing our debt levels would be favourable For 2024, we budgeted total capital of US$1,130m – US$1,190m, comprising sustaining capital of US$860m – US$890m and non-sustaining capital of US$270m – US$300m. A large portion of the growth capital will be spent at Salares Norte, with US$148m in project capital budgeted for the year. In 2023, we spent US$280m in growth capital on Salares Norte, bringing total project spend to US$1,038m at end-December 2023. Considering escalation and delays, total project cost is expected to be US$1,180m – US$1,200m. Liquidity profile Gold Fields actively manages the liquidity and maturity profile of the Group’s debt. In June 2023, we refinanced our US$1.2bn RCF and, for the first time, linked the facility to the achievement of three of the Company’s key ESG priorities: gender diversity, water stewardship and decarbonisation. The new RCF has a principal loan amount of US$1.2bn, with an option to increase the facility by up to US$400m and a maturity of five years, with an option to extend the tenor through two one-year extensions. The margin is subject to rating margin adjustments and sustainability margin adjustments. Gold Fields will benefit from a lower margin depending on the fulfilment of certain sustainability-linked key performance indicators (KPIs) under the facility agreement. Conversely, Gold Fields will pay a premium on its margin if the KPIs are not met. Similar sustainability criteria apply to the A$500m syndicated credit facility (with a A$100m accordion option) the Company entered into with a consortium of ten Australian and international banks in October 2023. For 2023, we achieved the following performance under the three KPIs linked to the facilities1: • 75kt CO2eLA cumulative annual carbon abatement of absolute Scope 1 and 2 emissions through renewable projects since 1 January 2023 against a target of 76kt CO2e2 • 74%LA water recycled/reused against a target of 75% • 25%RA women employees as a percentage of total employees in our workforce against a target of 24% Gold Fields also completed four five-year RCFs in June 2023 with South African banks for a total of R2.5bn (US$137m) to fund capex, as well as general corporate and working capital requirements. The interest rates under these Rand-denominated facilities are linked to the Johannesburg Interbank Average Rate (JIBAR) plus a margin. We were last active in the bond market in 2019, when we refinanced a number of bonds. In May 2019, we raised two new bonds, extending and staggering the maturity profile. A total of US$1bn was raised at an average coupon of 5.625%, with the maturity spread between five (2024) and 10 years (2029). Gold Fields is currently assessing our options for the five-year bond that matures in May 2024. Should we decide to retire the bond and not refinance it, this will most likely be done through a combination of cash and undrawn credit facilities. Overview Governance Our business Strategic pillar 1 Strategic pillar 2 Strategic pillar 3 Assurance Gold Fields IAR-52 1 The calculation methodology used was the same as the calculation methodology applied in the 2022 and prior Integrated Annual Reports and Climate Change Reports 2 Calculated in accordance with the accounting and reporting standards as published by the GHG Protocol Corporate Accounting and Reporting Standard
Financial performance continued Hedging Given the cyclical nature of our business and the volatility of the gold price, Gold Fields has implemented an active hedging programme in the past. We do not enter long-term systematic hedges, but instead regularly evaluate the Company’s position and outlook to determine whether short-term hedging is appropriate. Our policy allows for hedging to protect cash-flows: • During times of significant capex • For specific debt servicing requirements • To safeguard the viability of higher-cost operations We did not have any revenue hedges (gold and copper price), cost input hedges or currency hedges in place during 2023 and remain in an unhedged position. Financial strategy Being a single-commodity business and operating in a cyclical industry, Gold Fields approaches balance sheet management prudently, with one of our strategic priorities being to reduce our gearing. Despite elevated capex levels, we managed to reduce our net debt from a peak of US$1.664bn in 2019 to US$704m at end-December 2022 (US$310m, excluding lease liabilities). Our net debt increased during 2023, driven by continued investment in Salares Norte and the acquisition of our 50% stake in the Windfall project. We finished the year at US$1,024m (US$588m, excluding lease liabilities). Although our gearing remains at very manageable levels (net debt:EBITDA of 0.42x), our focus is to reduce our level of debt given the cyclical nature of the gold industry, along with the limited control we have over key cost drivers such as currencies, wage inflation, consumables and the oil price. Gold Fields’ business strategy focuses on growing margin and FCF through the cycle. However, given the finite nature of our mines, ongoing investment is necessary to ensure the longevity of the portfolio. 2023 was another year of relatively high capex, with US$280m growth capital spent on advancing Salares Norte in Chile. Despite this, higher-than-planned gold prices enabled us to adhere to our well- established Dividend Policy and maintain the Group’s net debt at a comfortable level during the year. The 2024 financial year will again see significant investment into the Group’s assets, with US$148m budgeted for Salares Norte and US$56m budgeted for the Windfall project in Canada. Financial highlights The high gold price again provided a tailwind to Gold Fields’ financial results in 2023. The average gold price received by the Group increased by 9% in US Dollar terms to US$1,942/oz, while the weakening of our key operating currencies meant the average Australian Dollar gold price increased by 13% to A$2,937/oz and the average South African Rand gold price increased by 22% to R1,149,066/kg. Group revenue increased to US$4.5bn in 2023 from US$4.3bn in 2022. Cost of sales before amortisation and depreciation increased by 11% to US$1,952bn in 2023. AIC at US$1,512/oz and AISC at US$1,295/oz (excluding Asanko) increased by 15% and 17%, respectively, from 2022 to 2023 – but were both within guidance for the year. Other salient features during 2023 included the following: • Royalty expenses increased by 5% to US$116m • The Group’s taxation charge increased by 5% to US$465m from US$442m in 2022 • Total capex decreased by 1% to US$1,055m in 2023 from US$1,069m in 2022, in line with guidance • Total impairments amounted to US$156m (pre-tax), driven by some adjustments to Cerro Corona’s life-of-mine plan and sterilisation of resources Considering the above, attributable profits for 2023 totalled US$703m – a 1% decrease from the US$711m reported in 2022 – while normalised earnings increased by 5% to US$900m (2022: US$860m). We provide a detailed analysis of our financial performance in the management’s discussion and analysis of the Group’s Annual Financial Statements in the 2023 Annual Financial Report (AFR). The consolidated income statement, statement of financial position and cash-flow statement can is also included in our 2023 AFR. Overview Governance Our business Strategic pillar 1 Strategic pillar 2 Strategic pillar 3 Assurance Gold Fields IAR-53
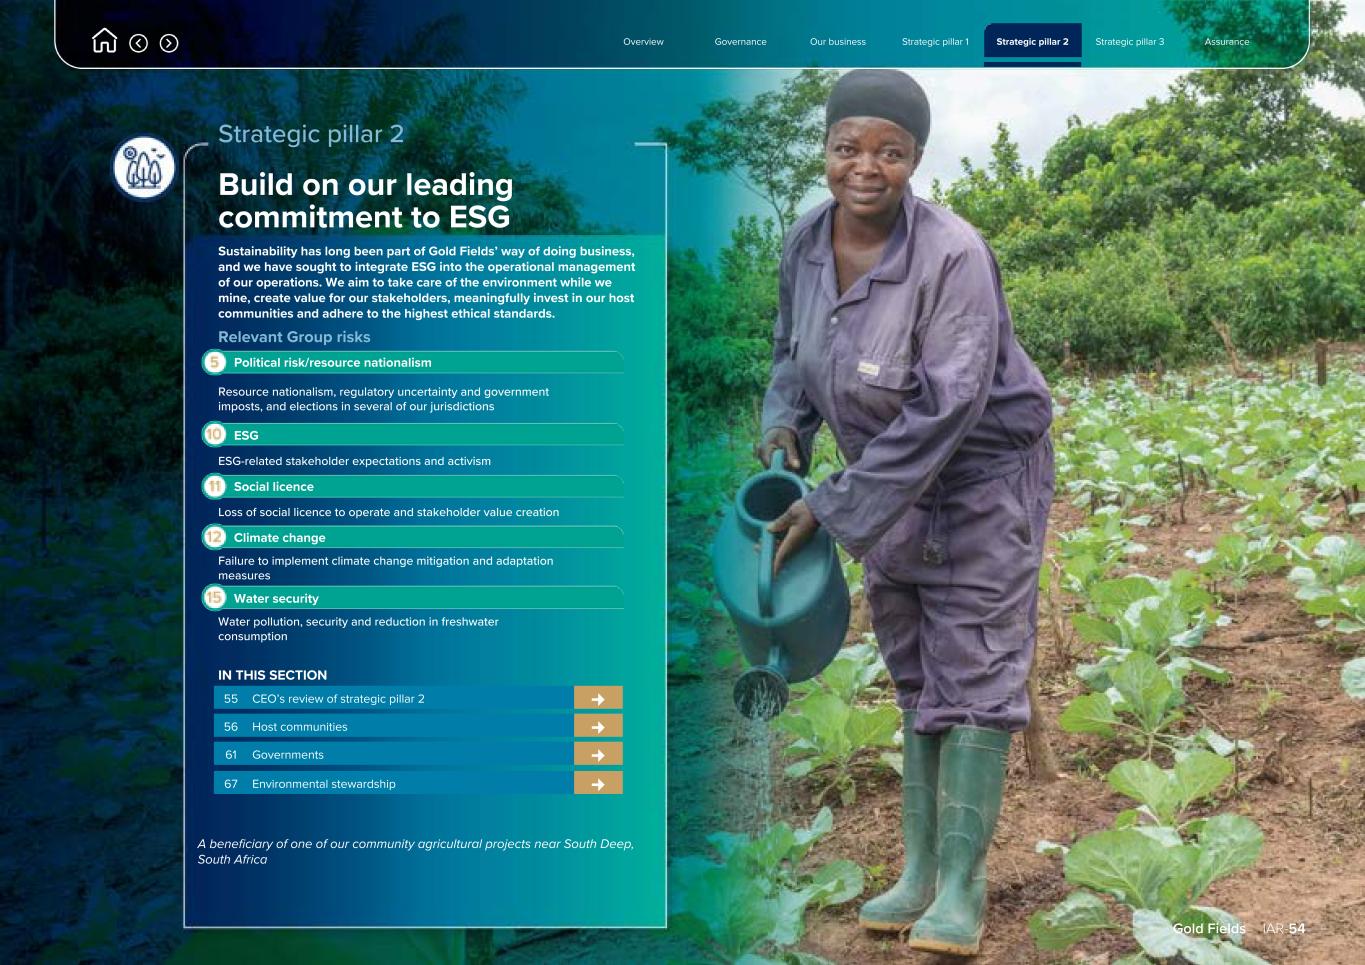
Overview Governance Our business Strategic pillar 1 Strategic pillar 2 Strategic pillar 3 Assurance Gold Fields IAR-54 Strategic pillar 2 Build on our leading commitment to ESG Sustainability has long been part of Gold Fields’ way of doing business, and we have sought to integrate ESG into the operational management of our operations. We aim to take care of the environment while we mine, create value for our stakeholders, meaningfully invest in our host communities and adhere to the highest ethical standards. Relevant Group risks Political risk/resource nationalism Resource nationalism, regulatory uncertainty and government imposts, and elections in several of our jurisdictions ESG ESG-related stakeholder expectations and activism Social licence Loss of social licence to operate and stakeholder value creation Climate change Failure to implement climate change mitigation and adaptation measures Water security Water pollution, security and reduction in freshwater consumption IN THIS SECTION 55 CEO’s review of strategic pillar 2 ¢ 56 Host communities ¢ 61 Governments ¢ 67 Environmental stewardship ¢ A beneficiary of one of our community agricultural projects near South Deep, South Africa
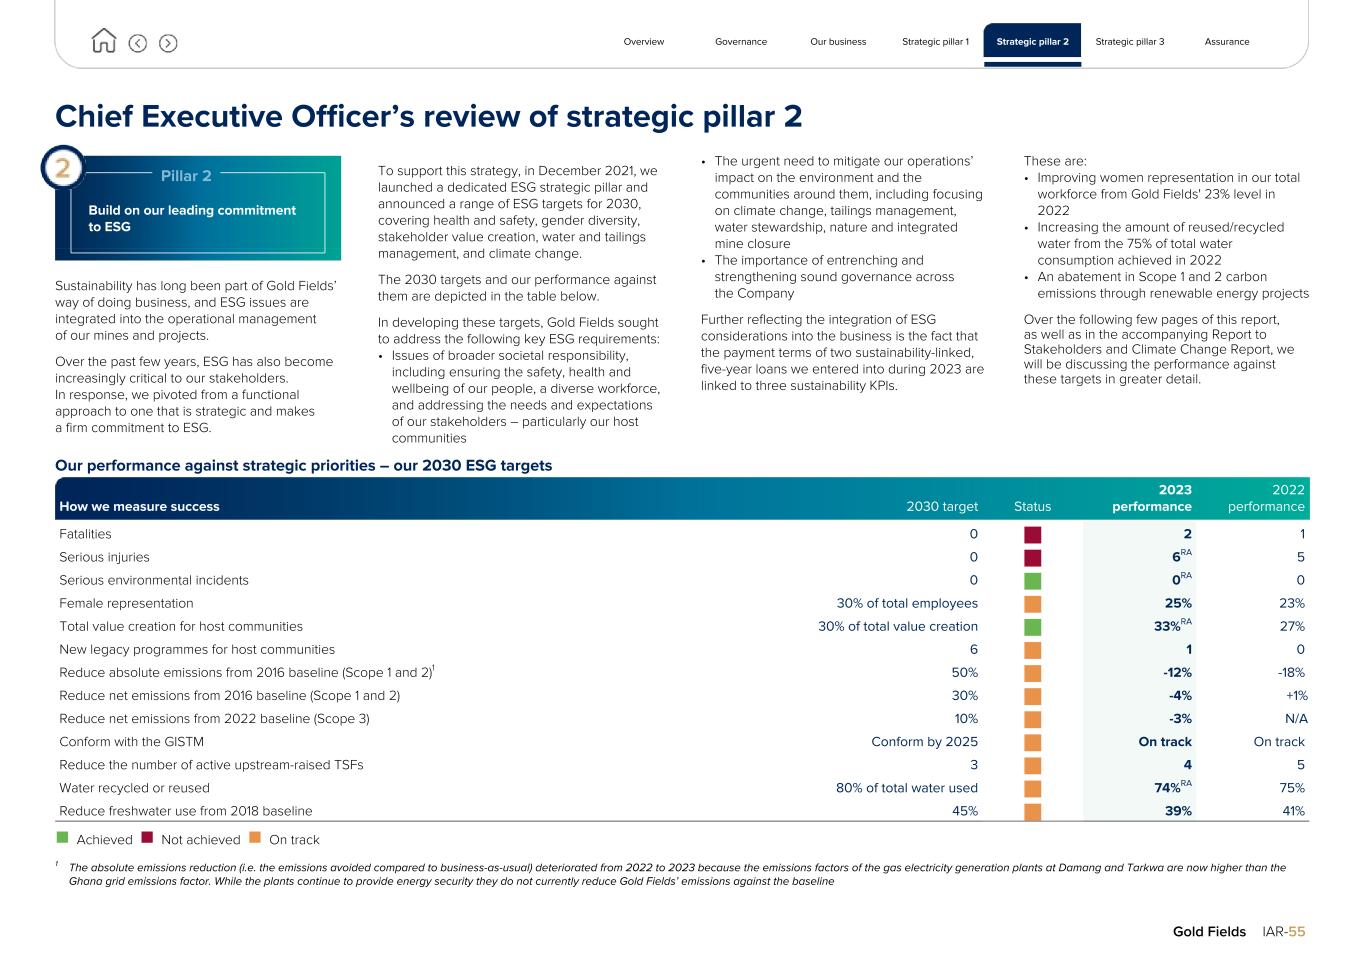
Chief Executive Officer’s review of strategic pillar 2 Pillar 2 Build on our leading commitment to ESG Sustainability has long been part of Gold Fields’ way of doing business, and ESG issues are integrated into the operational management of our mines and projects. Over the past few years, ESG has also become increasingly critical to our stakeholders. In response, we pivoted from a functional approach to one that is strategic and makes a firm commitment to ESG. To support this strategy, in December 2021, we launched a dedicated ESG strategic pillar and announced a range of ESG targets for 2030, covering health and safety, gender diversity, stakeholder value creation, water and tailings management, and climate change. The 2030 targets and our performance against them are depicted in the table below. In developing these targets, Gold Fields sought to address the following key ESG requirements: • Issues of broader societal responsibility, including ensuring the safety, health and wellbeing of our people, a diverse workforce, and addressing the needs and expectations of our stakeholders – particularly our host communities • The urgent need to mitigate our operations’ impact on the environment and the communities around them, including focusing on climate change, tailings management, water stewardship, nature and integrated mine closure • The importance of entrenching and strengthening sound governance across the Company Further reflecting the integration of ESG considerations into the business is the fact that the payment terms of two sustainability-linked, five-year loans we entered into during 2023 are linked to three sustainability KPIs. These are: • Improving women representation in our total workforce from Gold Fields' 23% level in 2022 • Increasing the amount of reused/recycled water from the 75% of total water consumption achieved in 2022 • An abatement in Scope 1 and 2 carbon emissions through renewable energy projects Over the following few pages of this report, as well as in the accompanying Report to Stakeholders and Climate Change Report, we will be discussing the performance against these targets in greater detail. Our performance against strategic priorities – our 2030 ESG targets How we measure success 2030 target Status 2023 performance 2022 performance Fatalities 0 n 2 1 Serious injuries 0 n 6RA 5 Serious environmental incidents 0 n 0RA 0 Female representation 30% of total employees n 25% 23% Total value creation for host communities 30% of total value creation n 33%RA 27% New legacy programmes for host communities 6 n 1 0 Reduce absolute emissions from 2016 baseline (Scope 1 and 2)1 50% n -12% -18% Reduce net emissions from 2016 baseline (Scope 1 and 2) 30% n -4% +1% Reduce net emissions from 2022 baseline (Scope 3) 10% n -3% N/A Conform with the GISTM Conform by 2025 n On track On track Reduce the number of active upstream-raised TSFs 3 n 4 5 Water recycled or reused 80% of total water used n 74%RA 75% Reduce freshwater use from 2018 baseline 45% n 39% 41% n Achieved n Not achieved n On track 1 The absolute emissions reduction (i.e. the emissions avoided compared to business-as-usual) deteriorated from 2022 to 2023 because the emissions factors of the gas electricity generation plants at Damang and Tarkwa are now higher than the Ghana grid emissions factor. While the plants continue to provide energy security they do not currently reduce Gold Fields’ emissions against the baseline Overview Governance Our business Strategic pillar 1 Strategic pillar 2 Strategic pillar 3 Assurance Gold Fields IAR-55
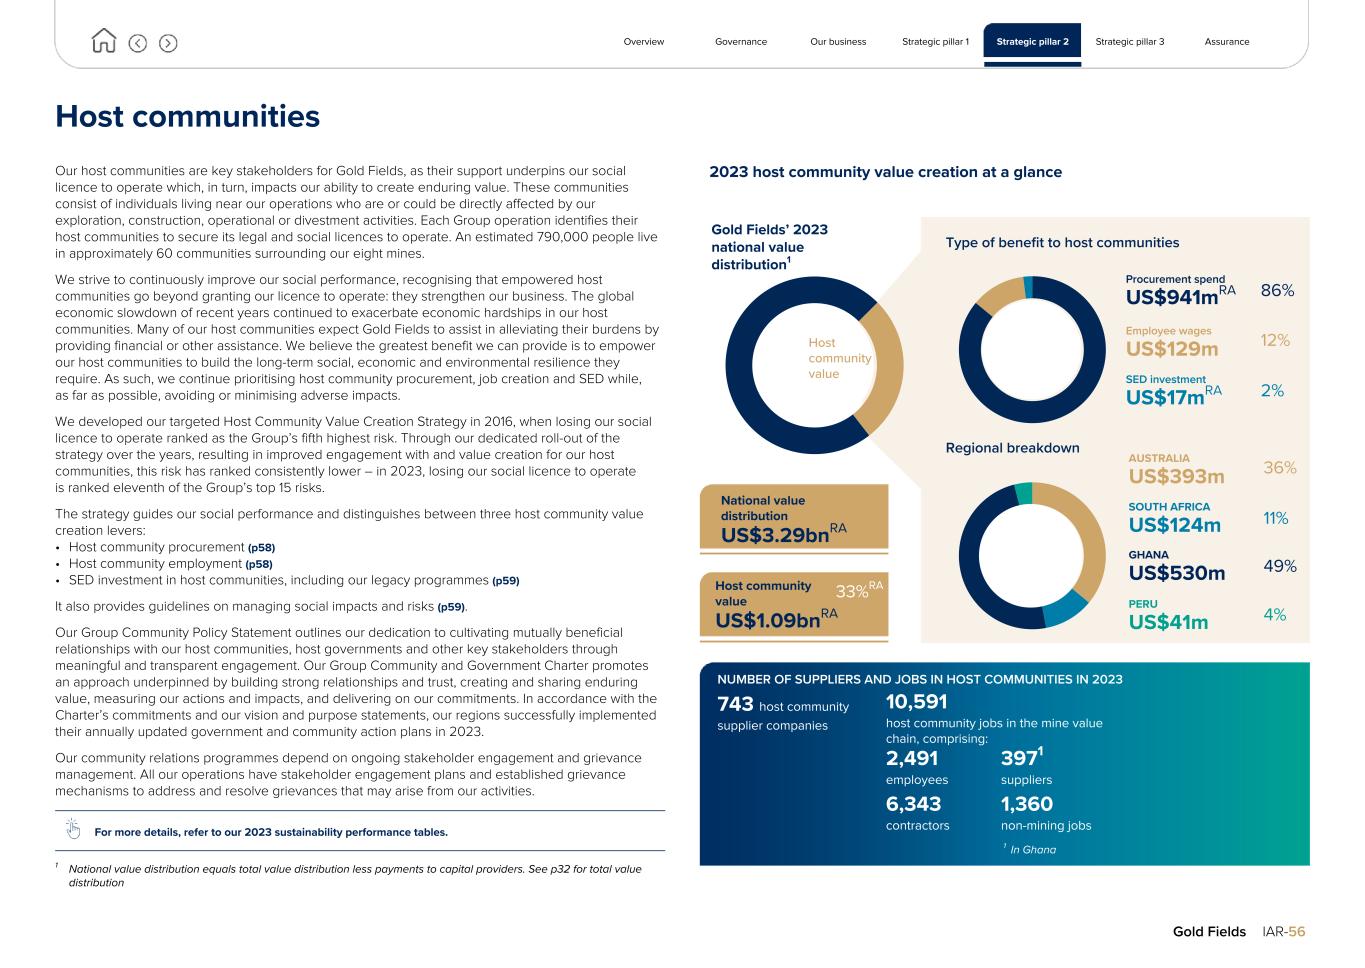
Host communities Our host communities are key stakeholders for Gold Fields, as their support underpins our social licence to operate which, in turn, impacts our ability to create enduring value. These communities consist of individuals living near our operations who are or could be directly affected by our exploration, construction, operational or divestment activities. Each Group operation identifies their host communities to secure its legal and social licences to operate. An estimated 790,000 people live in approximately 60 communities surrounding our eight mines. We strive to continuously improve our social performance, recognising that empowered host communities go beyond granting our licence to operate: they strengthen our business. The global economic slowdown of recent years continued to exacerbate economic hardships in our host communities. Many of our host communities expect Gold Fields to assist in alleviating their burdens by providing financial or other assistance. We believe the greatest benefit we can provide is to empower our host communities to build the long-term social, economic and environmental resilience they require. As such, we continue prioritising host community procurement, job creation and SED while, as far as possible, avoiding or minimising adverse impacts. We developed our targeted Host Community Value Creation Strategy in 2016, when losing our social licence to operate ranked as the Group’s fifth highest risk. Through our dedicated roll-out of the strategy over the years, resulting in improved engagement with and value creation for our host communities, this risk has ranked consistently lower – in 2023, losing our social licence to operate is ranked eleventh of the Group’s top 15 risks. The strategy guides our social performance and distinguishes between three host community value creation levers: • Host community procurement (p58) • Host community employment (p58) • SED investment in host communities, including our legacy programmes (p59) It also provides guidelines on managing social impacts and risks (p59). Our Group Community Policy Statement outlines our dedication to cultivating mutually beneficial relationships with our host communities, host governments and other key stakeholders through meaningful and transparent engagement. Our Group Community and Government Charter promotes an approach underpinned by building strong relationships and trust, creating and sharing enduring value, measuring our actions and impacts, and delivering on our commitments. In accordance with the Charter’s commitments and our vision and purpose statements, our regions successfully implemented their annually updated government and community action plans in 2023. Our community relations programmes depend on ongoing stakeholder engagement and grievance management. All our operations have stakeholder engagement plans and established grievance mechanisms to address and resolve grievances that may arise from our activities. For more details, refer to our 2023 sustainability performance tables. 1 National value distribution equals total value distribution less payments to capital providers. See p32 for total value distribution 2023 host community value creation at a glance Overview Governance Our business Strategic pillar 1 Strategic pillar 2 Strategic pillar 3 Assurance Gold Fields IAR-56 743 host community supplier companies NUMBER OF SUPPLIERS AND JOBS IN HOST COMMUNITIES IN 2023 10,591 host community jobs in the mine value chain, comprising: 2,491 employees 6,343 contractors 3971 suppliers 1,360 non-mining jobs Regional breakdown Procurement spend US$941m 86% Employee wages US$129m 12% SED investment US$17m 2% Type of benefit to host communities AUSTRALIA US$393m 36% SOUTH AFRICA US$124m 11% GHANA US$530m 49% PERU US$41m 4% Host community value Gold Fields’ 2023 national value distribution1 National value distribution US$3.29bnRA Host community value US$1.09bnRA 33%RA 1 In Ghana RA RA
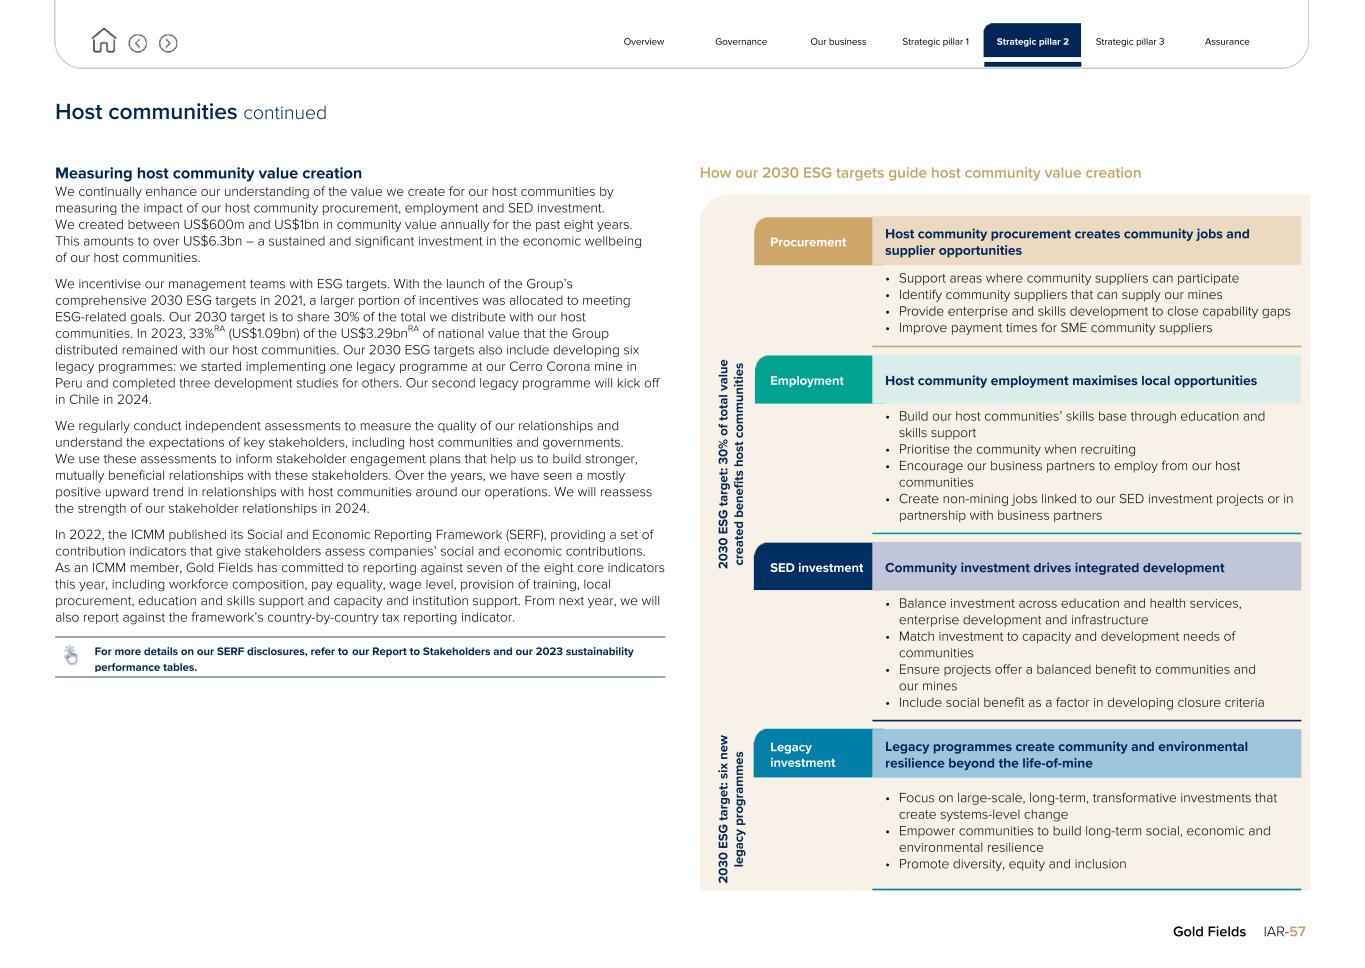
Host communities continued Measuring host community value creation We continually enhance our understanding of the value we create for our host communities by measuring the impact of our host community procurement, employment and SED investment. We created between US$600m and US$1bn in community value annually for the past eight years. This amounts to over US$6.3bn – a sustained and significant investment in the economic wellbeing of our host communities. We incentivise our management teams with ESG targets. With the launch of the Group’s comprehensive 2030 ESG targets in 2021, a larger portion of incentives was allocated to meeting ESG-related goals. Our 2030 target is to share 30% of the total we distribute with our host communities. In 2023, 33%RA (US$1.09bn) of the US$3.29bnRA of national value that the Group distributed remained with our host communities. Our 2030 ESG targets also include developing six legacy programmes: we started implementing one legacy programme at our Cerro Corona mine in Peru and completed three development studies for others. Our second legacy programme will kick off in Chile in 2024. We regularly conduct independent assessments to measure the quality of our relationships and understand the expectations of key stakeholders, including host communities and governments. We use these assessments to inform stakeholder engagement plans that help us to build stronger, mutually beneficial relationships with these stakeholders. Over the years, we have seen a mostly positive upward trend in relationships with host communities around our operations. We will reassess the strength of our stakeholder relationships in 2024. In 2022, the ICMM published its Social and Economic Reporting Framework (SERF), providing a set of contribution indicators that give stakeholders assess companies’ social and economic contributions. As an ICMM member, Gold Fields has committed to reporting against seven of the eight core indicators this year, including workforce composition, pay equality, wage level, provision of training, local procurement, education and skills support and capacity and institution support. From next year, we will also report against the framework’s country-by-country tax reporting indicator. For more details on our SERF disclosures, refer to our Report to Stakeholders and our 2023 sustainability performance tables. How our 2030 ESG targets guide host community value creation 20 30 E SG ta rg et : 3 0% o f t ot al v al ue cr ea te d be ne fit s ho st c om m un iti es Procurement Host community procurement creates community jobs and supplier opportunities • Support areas where community suppliers can participate • Identify community suppliers that can supply our mines • Provide enterprise and skills development to close capability gaps • Improve payment times for SME community suppliers Employment Host community employment maximises local opportunities • Build our host communities’ skills base through education and skills support • Prioritise the community when recruiting • Encourage our business partners to employ from our host communities • Create non-mining jobs linked to our SED investment projects or in partnership with business partners SED investment Community investment drives integrated development • Balance investment across education and health services, enterprise development and infrastructure • Match investment to capacity and development needs of communities • Ensure projects offer a balanced benefit to communities and our mines • Include social benefit as a factor in developing closure criteria 20 30 E SG ta rg et : s ix n ew le ga cy p ro gr am m es Legacy investment Legacy programmes create community and environmental resilience beyond the life-of-mine • Focus on large-scale, long-term, transformative investments that create systems-level change • Empower communities to build long-term social, economic and environmental resilience • Promote diversity, equity and inclusion Overview Governance Our business Strategic pillar 1 Strategic pillar 2 Strategic pillar 3 Assurance Gold Fields IAR-57
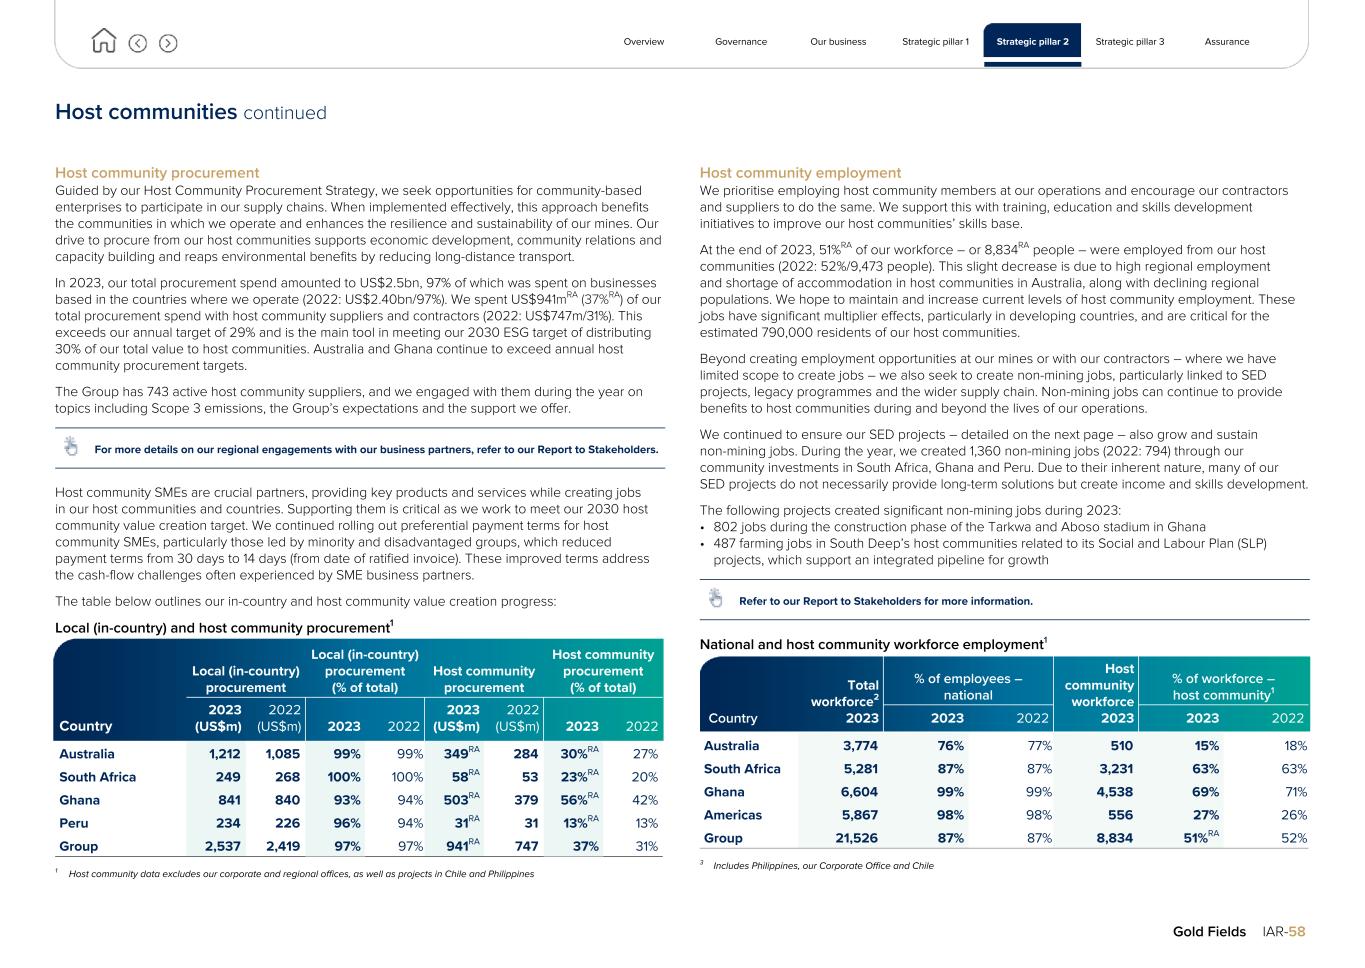
Host communities continued Host community procurement Guided by our Host Community Procurement Strategy, we seek opportunities for community-based enterprises to participate in our supply chains. When implemented effectively, this approach benefits the communities in which we operate and enhances the resilience and sustainability of our mines. Our drive to procure from our host communities supports economic development, community relations and capacity building and reaps environmental benefits by reducing long-distance transport. In 2023, our total procurement spend amounted to US$2.5bn, 97% of which was spent on businesses based in the countries where we operate (2022: US$2.40bn/97%). We spent US$941mRA (37%RA) of our total procurement spend with host community suppliers and contractors (2022: US$747m/31%). This exceeds our annual target of 29% and is the main tool in meeting our 2030 ESG target of distributing 30% of our total value to host communities. Australia and Ghana continue to exceed annual host community procurement targets. The Group has 743 active host community suppliers, and we engaged with them during the year on topics including Scope 3 emissions, the Group’s expectations and the support we offer. For more details on our regional engagements with our business partners, refer to our Report to Stakeholders. Host community SMEs are crucial partners, providing key products and services while creating jobs in our host communities and countries. Supporting them is critical as we work to meet our 2030 host community value creation target. We continued rolling out preferential payment terms for host community SMEs, particularly those led by minority and disadvantaged groups, which reduced payment terms from 30 days to 14 days (from date of ratified invoice). These improved terms address the cash-flow challenges often experienced by SME business partners. The table below outlines our in-country and host community value creation progress: Local (in-country) and host community procurement1 Local (in-country) procurement Local (in-country) procurement (% of total) Host community procurement Host community procurement (% of total) Country 2023 (US$m) 2022 (US$m) 2023 2022 2023 (US$m) 2022 (US$m) 2023 2022 Australia 1,212 1,085 99% 99% 349RA 284 30%RA 27% South Africa 249 268 100% 100% 58RA 53 23%RA 20% Ghana 841 840 93% 94% 503RA 379 56%RA 42% Peru 234 226 96% 94% 31RA 31 13%RA 13% Group 2,537 2,419 97% 97% 941RA 747 37% 31% 1 Host community data excludes our corporate and regional offices, as well as projects in Chile and Philippines Host community employment We prioritise employing host community members at our operations and encourage our contractors and suppliers to do the same. We support this with training, education and skills development initiatives to improve our host communities’ skills base. At the end of 2023, 51%RA of our workforce – or 8,834RA people – were employed from our host communities (2022: 52%/9,473 people). This slight decrease is due to high regional employment and shortage of accommodation in host communities in Australia, along with declining regional populations. We hope to maintain and increase current levels of host community employment. These jobs have significant multiplier effects, particularly in developing countries, and are critical for the estimated 790,000 residents of our host communities. Beyond creating employment opportunities at our mines or with our contractors – where we have limited scope to create jobs – we also seek to create non-mining jobs, particularly linked to SED projects, legacy programmes and the wider supply chain. Non-mining jobs can continue to provide benefits to host communities during and beyond the lives of our operations. We continued to ensure our SED projects – detailed on the next page – also grow and sustain non-mining jobs. During the year, we created 1,360 non-mining jobs (2022: 794) through our community investments in South Africa, Ghana and Peru. Due to their inherent nature, many of our SED projects do not necessarily provide long-term solutions but create income and skills development. The following projects created significant non-mining jobs during 2023: • 802 jobs during the construction phase of the Tarkwa and Aboso stadium in Ghana • 487 farming jobs in South Deep’s host communities related to its Social and Labour Plan (SLP) projects, which support an integrated pipeline for growth Refer to our Report to Stakeholders for more information. National and host community workforce employment1 Total workforce2 2023 % of employees – national Host community workforce 2023 % of workforce – host community1 Country 2023 2022 2023 2022 Australia 3,774 76% 77% 510 15% 18% South Africa 5,281 87% 87% 3,231 63% 63% Ghana 6,604 99% 99% 4,538 69% 71% Americas 5,867 98% 98% 556 27% 26% Group 21,526 87% 87% 8,834 51%RA 52% 3 Includes Philippines, our Corporate Office and Chile Overview Governance Our business Strategic pillar 1 Strategic pillar 2 Strategic pillar 3 Assurance Gold Fields IAR-58
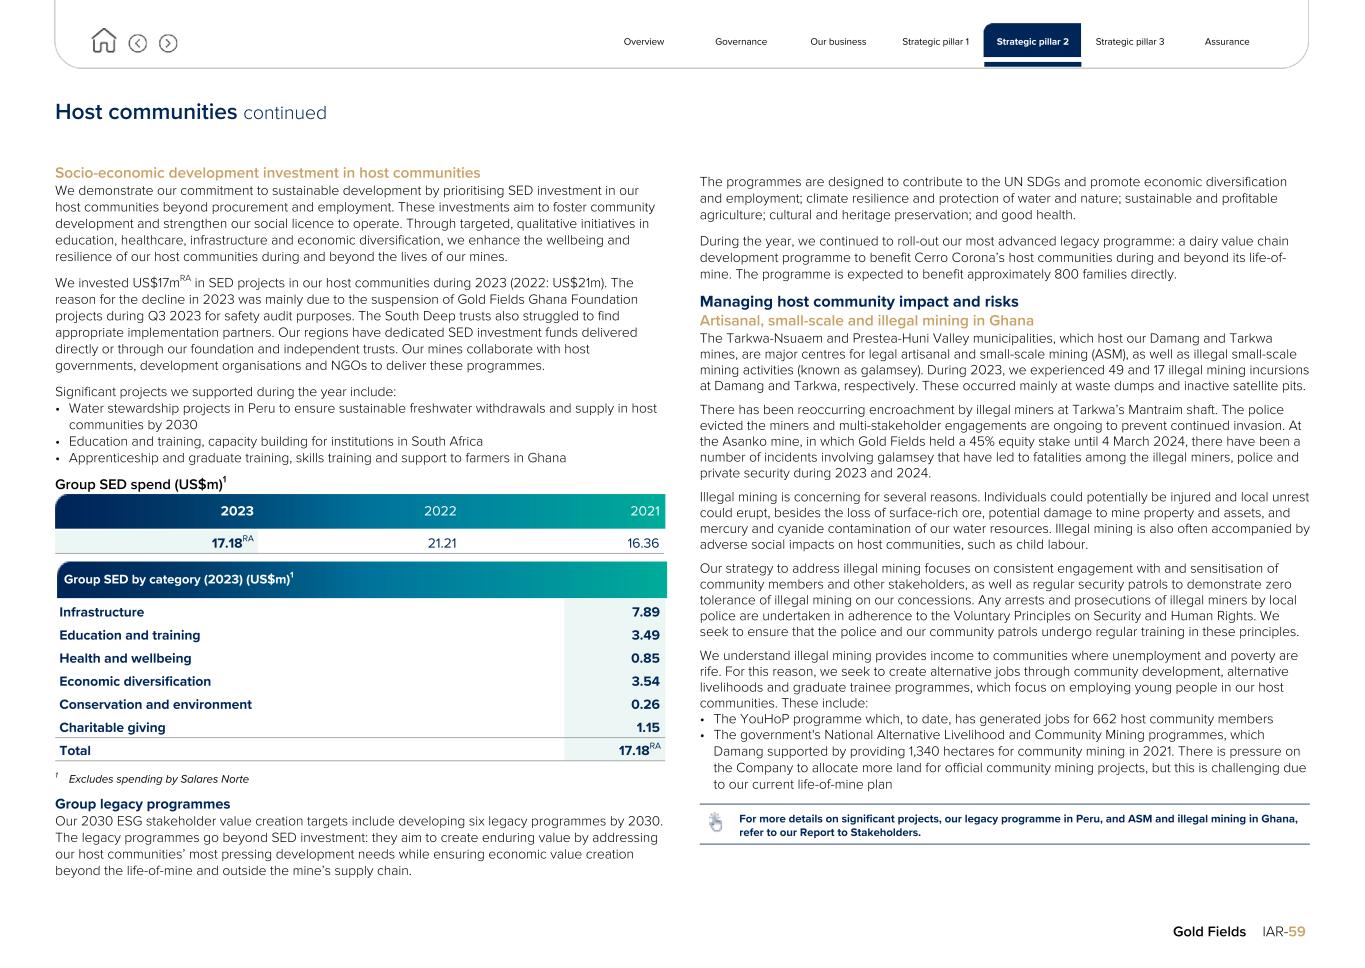
Host communities continued Socio-economic development investment in host communities We demonstrate our commitment to sustainable development by prioritising SED investment in our host communities beyond procurement and employment. These investments aim to foster community development and strengthen our social licence to operate. Through targeted, qualitative initiatives in education, healthcare, infrastructure and economic diversification, we enhance the wellbeing and resilience of our host communities during and beyond the lives of our mines. We invested US$17mRA in SED projects in our host communities during 2023 (2022: US$21m). The reason for the decline in 2023 was mainly due to the suspension of Gold Fields Ghana Foundation projects during Q3 2023 for safety audit purposes. The South Deep trusts also struggled to find appropriate implementation partners. Our regions have dedicated SED investment funds delivered directly or through our foundation and independent trusts. Our mines collaborate with host governments, development organisations and NGOs to deliver these programmes. Significant projects we supported during the year include: • Water stewardship projects in Peru to ensure sustainable freshwater withdrawals and supply in host communities by 2030 • Education and training, capacity building for institutions in South Africa • Apprenticeship and graduate training, skills training and support to farmers in Ghana Group SED spend (US$m)1 2023 2022 2021 17.18RA 21.21 16.36 Group SED by category (2023) (US$m)1 Infrastructure 7.89 Education and training 3.49 Health and wellbeing 0.85 Economic diversification 3.54 Conservation and environment 0.26 Charitable giving 1.15 Total 17.18RA 1 Excludes spending by Salares Norte Group legacy programmes Our 2030 ESG stakeholder value creation targets include developing six legacy programmes by 2030. The legacy programmes go beyond SED investment: they aim to create enduring value by addressing our host communities’ most pressing development needs while ensuring economic value creation beyond the life-of-mine and outside the mine’s supply chain. The programmes are designed to contribute to the UN SDGs and promote economic diversification and employment; climate resilience and protection of water and nature; sustainable and profitable agriculture; cultural and heritage preservation; and good health. During the year, we continued to roll-out our most advanced legacy programme: a dairy value chain development programme to benefit Cerro Corona’s host communities during and beyond its life-of- mine. The programme is expected to benefit approximately 800 families directly. Managing host community impact and risks Artisanal, small-scale and illegal mining in Ghana The Tarkwa-Nsuaem and Prestea-Huni Valley municipalities, which host our Damang and Tarkwa mines, are major centres for legal artisanal and small-scale mining (ASM), as well as illegal small-scale mining activities (known as galamsey). During 2023, we experienced 49 and 17 illegal mining incursions at Damang and Tarkwa, respectively. These occurred mainly at waste dumps and inactive satellite pits. There has been reoccurring encroachment by illegal miners at Tarkwa’s Mantraim shaft. The police evicted the miners and multi-stakeholder engagements are ongoing to prevent continued invasion. At the Asanko mine, in which Gold Fields held a 45% equity stake until 4 March 2024, there have been a number of incidents involving galamsey that have led to fatalities among the illegal miners, police and private security during 2023 and 2024. Illegal mining is concerning for several reasons. Individuals could potentially be injured and local unrest could erupt, besides the loss of surface-rich ore, potential damage to mine property and assets, and mercury and cyanide contamination of our water resources. Illegal mining is also often accompanied by adverse social impacts on host communities, such as child labour. Our strategy to address illegal mining focuses on consistent engagement with and sensitisation of community members and other stakeholders, as well as regular security patrols to demonstrate zero tolerance of illegal mining on our concessions. Any arrests and prosecutions of illegal miners by local police are undertaken in adherence to the Voluntary Principles on Security and Human Rights. We seek to ensure that the police and our community patrols undergo regular training in these principles. We understand illegal mining provides income to communities where unemployment and poverty are rife. For this reason, we seek to create alternative jobs through community development, alternative livelihoods and graduate trainee programmes, which focus on employing young people in our host communities. These include: • The YouHoP programme which, to date, has generated jobs for 662 host community members • The government's National Alternative Livelihood and Community Mining programmes, which Damang supported by providing 1,340 hectares for community mining in 2021. There is pressure on the Company to allocate more land for official community mining projects, but this is challenging due to our current life-of-mine plan For more details on significant projects, our legacy programme in Peru, and ASM and illegal mining in Ghana, refer to our Report to Stakeholders. Overview Governance Our business Strategic pillar 1 Strategic pillar 2 Strategic pillar 3 Assurance Gold Fields IAR-59
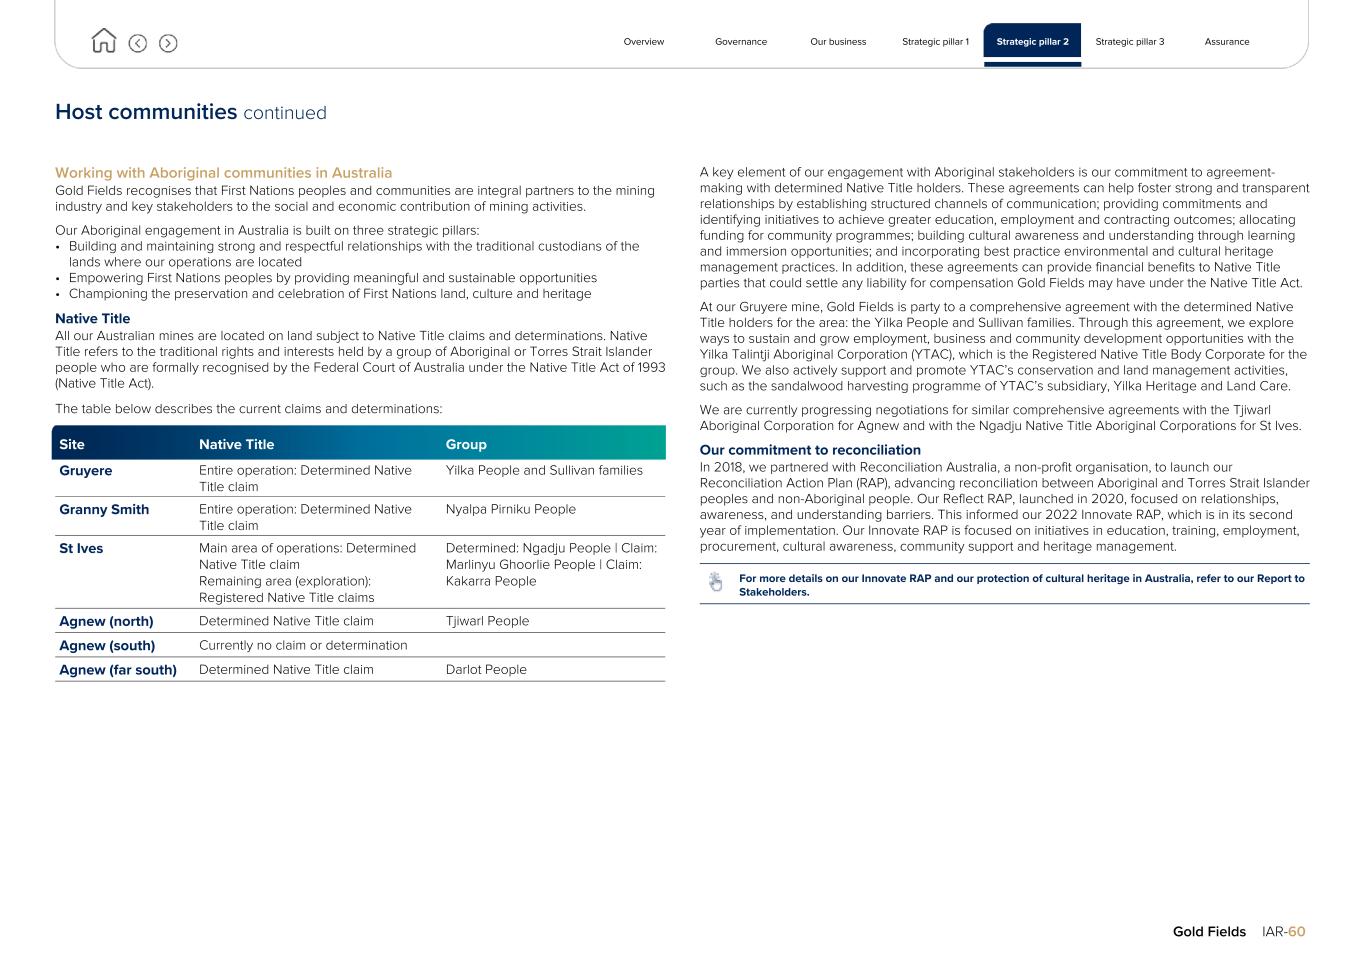
Host communities continued Working with Aboriginal communities in Australia Gold Fields recognises that First Nations peoples and communities are integral partners to the mining industry and key stakeholders to the social and economic contribution of mining activities. Our Aboriginal engagement in Australia is built on three strategic pillars: • Building and maintaining strong and respectful relationships with the traditional custodians of the lands where our operations are located • Empowering First Nations peoples by providing meaningful and sustainable opportunities • Championing the preservation and celebration of First Nations land, culture and heritage Native Title All our Australian mines are located on land subject to Native Title claims and determinations. Native Title refers to the traditional rights and interests held by a group of Aboriginal or Torres Strait Islander people who are formally recognised by the Federal Court of Australia under the Native Title Act of 1993 (Native Title Act). The table below describes the current claims and determinations: Site Native Title Group Gruyere Entire operation: Determined Native Title claim Yilka People and Sullivan families Granny Smith Entire operation: Determined Native Title claim Nyalpa Pirniku People St Ives Main area of operations: Determined Native Title claim Remaining area (exploration): Registered Native Title claims Determined: Ngadju People | Claim: Marlinyu Ghoorlie People | Claim: Kakarra People Agnew (north) Determined Native Title claim Tjiwarl People Agnew (south) Currently no claim or determination Agnew (far south) Determined Native Title claim Darlot People A key element of our engagement with Aboriginal stakeholders is our commitment to agreement- making with determined Native Title holders. These agreements can help foster strong and transparent relationships by establishing structured channels of communication; providing commitments and identifying initiatives to achieve greater education, employment and contracting outcomes; allocating funding for community programmes; building cultural awareness and understanding through learning and immersion opportunities; and incorporating best practice environmental and cultural heritage management practices. In addition, these agreements can provide financial benefits to Native Title parties that could settle any liability for compensation Gold Fields may have under the Native Title Act. At our Gruyere mine, Gold Fields is party to a comprehensive agreement with the determined Native Title holders for the area: the Yilka People and Sullivan families. Through this agreement, we explore ways to sustain and grow employment, business and community development opportunities with the Yilka Talintji Aboriginal Corporation (YTAC), which is the Registered Native Title Body Corporate for the group. We also actively support and promote YTAC’s conservation and land management activities, such as the sandalwood harvesting programme of YTAC’s subsidiary, Yilka Heritage and Land Care. We are currently progressing negotiations for similar comprehensive agreements with the Tjiwarl Aboriginal Corporation for Agnew and with the Ngadju Native Title Aboriginal Corporations for St Ives. Our commitment to reconciliation In 2018, we partnered with Reconciliation Australia, a non-profit organisation, to launch our Reconciliation Action Plan (RAP), advancing reconciliation between Aboriginal and Torres Strait Islander peoples and non-Aboriginal people. Our Reflect RAP, launched in 2020, focused on relationships, awareness, and understanding barriers. This informed our 2022 Innovate RAP, which is in its second year of implementation. Our Innovate RAP is focused on initiatives in education, training, employment, procurement, cultural awareness, community support and heritage management. For more details on our Innovate RAP and our protection of cultural heritage in Australia, refer to our Report to Stakeholders. Overview Governance Our business Strategic pillar 1 Strategic pillar 2 Strategic pillar 3 Assurance Gold Fields IAR-60
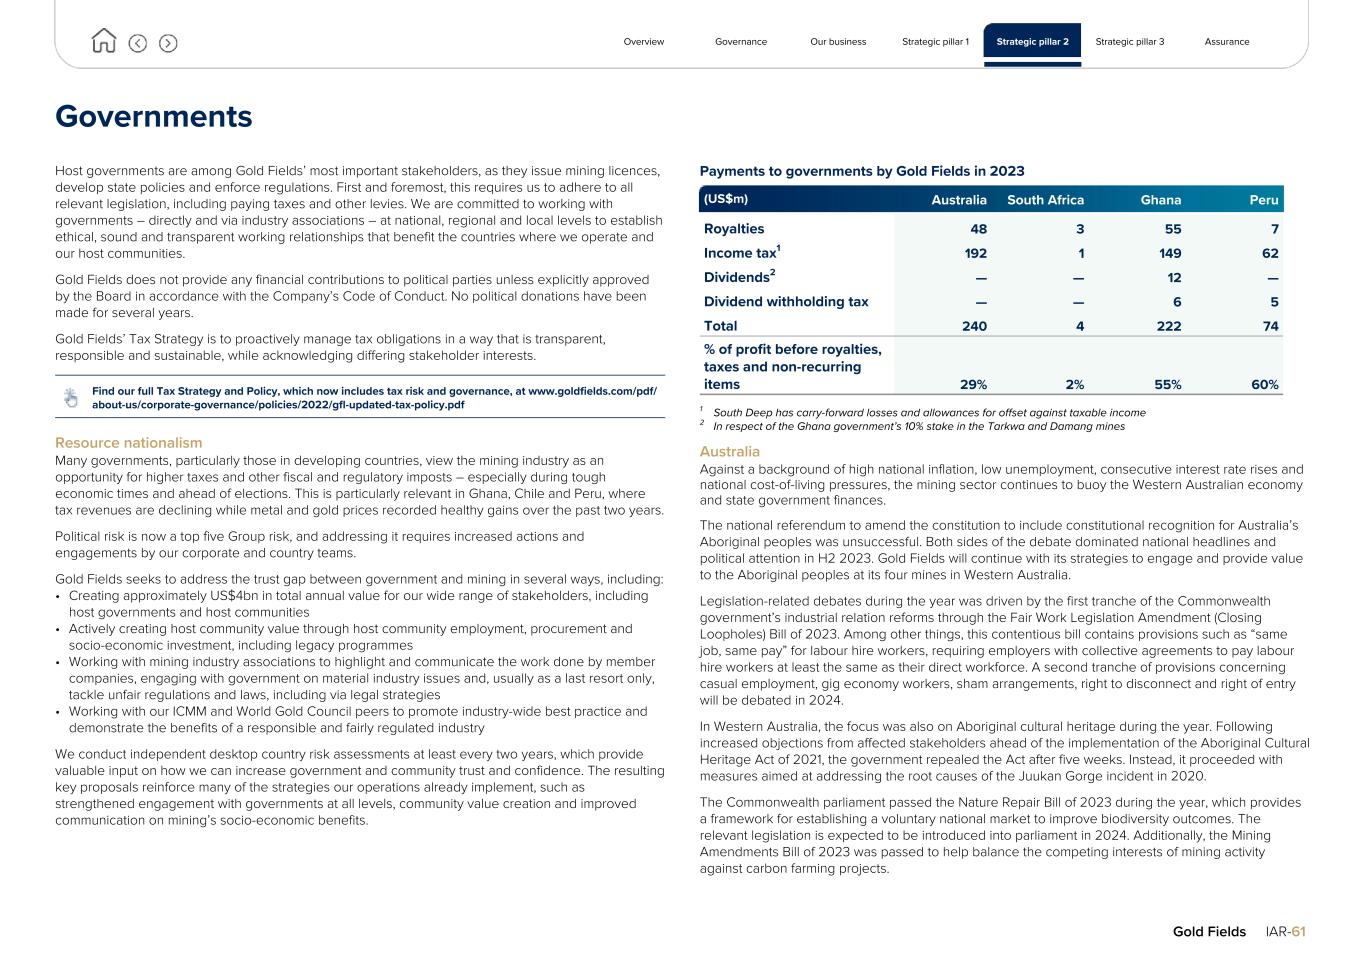
Governments Host governments are among Gold Fields’ most important stakeholders, as they issue mining licences, develop state policies and enforce regulations. First and foremost, this requires us to adhere to all relevant legislation, including paying taxes and other levies. We are committed to working with governments – directly and via industry associations – at national, regional and local levels to establish ethical, sound and transparent working relationships that benefit the countries where we operate and our host communities. Gold Fields does not provide any financial contributions to political parties unless explicitly approved by the Board in accordance with the Company’s Code of Conduct. No political donations have been made for several years. Gold Fields’ Tax Strategy is to proactively manage tax obligations in a way that is transparent, responsible and sustainable, while acknowledging differing stakeholder interests. Find our full Tax Strategy and Policy, which now includes tax risk and governance, at www.goldfields.com/pdf/ about-us/corporate-governance/policies/2022/gfl-updated-tax-policy.pdf Resource nationalism Many governments, particularly those in developing countries, view the mining industry as an opportunity for higher taxes and other fiscal and regulatory imposts – especially during tough economic times and ahead of elections. This is particularly relevant in Ghana, Chile and Peru, where tax revenues are declining while metal and gold prices recorded healthy gains over the past two years. Political risk is now a top five Group risk, and addressing it requires increased actions and engagements by our corporate and country teams. Gold Fields seeks to address the trust gap between government and mining in several ways, including: • Creating approximately US$4bn in total annual value for our wide range of stakeholders, including host governments and host communities • Actively creating host community value through host community employment, procurement and socio-economic investment, including legacy programmes • Working with mining industry associations to highlight and communicate the work done by member companies, engaging with government on material industry issues and, usually as a last resort only, tackle unfair regulations and laws, including via legal strategies • Working with our ICMM and World Gold Council peers to promote industry-wide best practice and demonstrate the benefits of a responsible and fairly regulated industry We conduct independent desktop country risk assessments at least every two years, which provide valuable input on how we can increase government and community trust and confidence. The resulting key proposals reinforce many of the strategies our operations already implement, such as strengthened engagement with governments at all levels, community value creation and improved communication on mining’s socio-economic benefits. Payments to governments by Gold Fields in 2023 (US$m) Australia South Africa Ghana Peru Royalties 48 3 55 7 Income tax1 192 1 149 62 Dividends2 — — 12 — Dividend withholding tax — — 6 5 Total 240 4 222 74 % of profit before royalties, taxes and non-recurring items 29% 2% 55% 60% 1 South Deep has carry-forward losses and allowances for offset against taxable income 2 In respect of the Ghana government’s 10% stake in the Tarkwa and Damang mines Australia Against a background of high national inflation, low unemployment, consecutive interest rate rises and national cost-of-living pressures, the mining sector continues to buoy the Western Australian economy and state government finances. The national referendum to amend the constitution to include constitutional recognition for Australia’s Aboriginal peoples was unsuccessful. Both sides of the debate dominated national headlines and political attention in H2 2023. Gold Fields will continue with its strategies to engage and provide value to the Aboriginal peoples at its four mines in Western Australia. Legislation-related debates during the year was driven by the first tranche of the Commonwealth government’s industrial relation reforms through the Fair Work Legislation Amendment (Closing Loopholes) Bill of 2023. Among other things, this contentious bill contains provisions such as “same job, same pay” for labour hire workers, requiring employers with collective agreements to pay labour hire workers at least the same as their direct workforce. A second tranche of provisions concerning casual employment, gig economy workers, sham arrangements, right to disconnect and right of entry will be debated in 2024. In Western Australia, the focus was also on Aboriginal cultural heritage during the year. Following increased objections from affected stakeholders ahead of the implementation of the Aboriginal Cultural Heritage Act of 2021, the government repealed the Act after five weeks. Instead, it proceeded with measures aimed at addressing the root causes of the Juukan Gorge incident in 2020. The Commonwealth parliament passed the Nature Repair Bill of 2023 during the year, which provides a framework for establishing a voluntary national market to improve biodiversity outcomes. The relevant legislation is expected to be introduced into parliament in 2024. Additionally, the Mining Amendments Bill of 2023 was passed to help balance the competing interests of mining activity against carbon farming projects. Overview Governance Our business Strategic pillar 1 Strategic pillar 2 Strategic pillar 3 Assurance Gold Fields IAR-61
Governments continued Throughout 2023, we engaged with the Western Australian government through the Chamber of Minerals and Energy of Western Australia and our Australian gold sector peers through the Gold Industry Group on issues impacting the gold sector and the mining sector. We also formally committed to supporting the state government’s Respect in Mining programme pilot to improve gender equality and the safety of women in mining. The pilot will run at our Australian operations in 2024, embedding gender equality policies and practices to benefit all our people. Ghana The Ghanaian economy experienced its worst crisis in 40 years, driven by rising debt, inflation and living costs, as well as stagnant economic growth. Without a parliamentary majority for the ruling party before the 2024 general election, the government is unlikely to significantly address the effects of this crisis or the risks related to increasing taxation and regulatory interventions, poor public perceptions of the mining industry, illegal mining and poorly regulated ASM (see p59). After subscribing to a three-year loan from the International Monetary Fund (IMF) of US$3bn, the economy showed some signs of recovery, while inflation more than halved to levels of around 22% early in 2024. Subject to economic reforms and greater fiscal discipline, the funds provided by the IMF should return a level of stability to the economy; however, the government continues to look for ways to shore up its revenues – and the country’s gold mining sector is an obvious target. The Group’s fiscal relationship with the government is governed by a 2016 Development Agreement (DA) for Damang and Tarkwa, which requires Gold Fields to invest in these mines over a specific time in return for a flexible corporate tax rate from 32.5% to 35% and a royalty tax on a sliding scale based on the gold price. For 2023, Gold Fields Ghana contributed US$222m in the form of taxes, royalties and dividends to the government. The Company is currently contending with the government’s need to shore up revenue and the impact thereof on the renewal of exemptions under the DA and compliance with in-country regulations. Among these are the government’s refusal to renew DA fuel exemptions for Damang and Tarkwa with effect from 1 January 2023, as well as a Covid-19 levy, both of which are being contested. Customs exemptions on other items have been approved. A transfer pricing audit for 2014 – 2019 on Gold Fields was conducted by the Ghana Revenue Authority (GRA). The audit was resolved and a negotiated position reached, in terms of which Gold Fields had to pay an additional US$8m. A comprehensive 2018 – 2020 tax audit was resolved, with the GRA dropping DA-related issues, while a GRA customs clearance audit for 2018 – 2022 concluded with immaterial exposures for Gold Fields. In 2023, under the domestic gold purchase programme, Gold Fields Ghana sold 127.4koz gold (18% of Damang and Tarkwa’s 2023 production) to the Bank of Ghana (BOG), pursuant to a gold purchasing agreement. Payment was made by BOG in Ghana Cedi at the prevailing gold market price. The payment forms part of our DA requirement to convert at least 30% of our gold proceeds into the local currency to cover local costs. The Ghana Chamber of Mines is still finalising negotiations with the BOG on the volumes of gold to be sold by mining companies for 2024, though it is likely to remain consistent with 2023. Gold Fields is engaging with the Minerals Commission of Ghana on the proposed JV between Tarkwa and AngloGold Ashanti’s neighbouring Iduapriem mines, with the government’s shareholding and tax issues the major negotiating points. In February 2024, the government approved the sale of our 45% holding in the Asanko gold mine to our JV partner Galiano Gold. Chile In Chile, most political and social stakeholders support our decision to proceed with the Salares Norte mine’s construction in the Atacama region of northern Chile. Salares Norte has been one of Chile’s largest investment projects over the past few years, and was identified by the government as a key project for economic upturn in the Atacama region. The project is governed by an investment stability agreement with the Chilean government. Although there was initial uncertainty regarding left-wing President Gabriel Boric’s economic and regulatory policy direction when he took office in 2022, he had limited political capital and support in congress to push forward structural reforms. In fact, during the current administration the mining sector has continued to operate normally and, in recent months, a number of large projects have been inaugurated. In December 2023, the second attempt to approve a new constitution was rejected by Chileans in an exit plebiscite. The government has ruled out a third constitutional vote, in the short term at least. On the regulatory front, the mining royalty bill was approved by congress in May 2023 but, for now, this only applies to the copper and lithium mining sectors. The bill aims to achieve higher tax revenues and regional benefits without affecting critical mining investments. Environmental mining regulations have been far more rigorously enforced under the Boric presidency, which has seen a number of mining projects halted and penalties imposed for infringements. Our engagements in Chile focus on supporting communities close to Salares Norte in coordination with regional and local governments. These efforts are aimed at promoting social development initiatives focused on education and health, and will continue during Salares Norte’s ramp-up to full production. Peru In Peru, we engage at local, regional and national government levels to address operational, social and sustainability matters. While prior years were characterised by political instability and widespread community unrest, the government under President Dina Boluarte, who took office in December 2022, has seen greater political and social stability. Community unrest has become far more isolated and limited to the south of the country. Even during the height of social unrest, when certain mines were targeted, protests were not widely spread or violent in the Cajamarca province where our Cerro Corona mine is located. Overview Governance Our business Strategic pillar 1 Strategic pillar 2 Strategic pillar 3 Assurance Gold Fields IAR-62
Governments continued Our engagement with national government and congress, particularly on regulatory matters, primarily takes place through the National Chamber of Mines, Oil and Energy (SNMPE). The industry has good working relationships with various public bodies at all levels of government. Our main challenges has been the increase in public officials’ turnover at national level due to political instability, which increased the risk of permits delays and policy uncertainty. This was managed through close monitoring and timely engagement with government. We continue to build trust between Cerro Corona and its host communities through ongoing stakeholder engagement and Shared Value projects, including rolling out comprehensive water infrastructure. We implemented social development projects in partnership with the government, through the Works for Taxes and government grants programmes, focused on water and sanitation infrastructure and agricultural development. As we consider future options for Cerro Corona, we will develop more long-term community investment programmes that extend beyond any potential closure. Gold Fields’ first legacy programme, as part of our 2030 ESG targets, is the dairy value chain development benefiting farmers near the mine by generating an alternative source of income for host communities. This is currently undergoing the baseline studies phase prior to implementation. South Africa South Africa is currently experiencing low economic growth caused by ongoing electricity shortages, infrastructure degradation and, in the mining sector, lower commodity prices. In addition, South Africa continues to be confronted with challenges relating to economic disparity, poor service delivery, political and social instability, and corruption, which increase the risk of social unrest and rising social demands. With a general election scheduled for May 2024, the weak economic environment could very well lead the governing African National Congress (ANC) party adopting more populist economic measures, as it is facing opposition from leftist parties. From a regulatory perspective, South Deep is guided primarily by the Mineral and Petroleum Resources Development Act No 28 of 2002 (MPRDA). One of the MPRDA’s key requirements is to facilitate meaningful and substantial participation of Historically Disadvantaged South Africans (HDSAs) in the mining industry. To address this requirement, the Mining Charter provides several empowerment actions and community investment programmes with a corollary timeframe. All mining right holders must submit an annual compliance detailing progress against the Mining Charter and their Social and Labour Plan (SLP), a mechanism used to achieve the objectives of the Mining Charter. The main objective of the SLP is to contribute to the transformation of the mining industry and ensure host communities benefit from the exploitation of mineral resources. This includes promoting employment and advancing the social and economic welfare of all South Africans. The SLP requires the mining industry to develop and implement comprehensive human resources development programmes (including employment equity plans) and local economic development programmes, as well as processes to protect jobs and manage downscaling and/or the closure of mining projects. The latest version of the charter – Mining Charter 3 (MC3) – was tabled in September 2018. It de facto confirmed South Deep’s current BEE ownership level of 35%, which we believe meets the principles and spirit of the Charter. It has also created the framework for the mine’s ongoing transformation. As part of the mine’s empowerment structure, South Deep established two independent trusts in 2010 to channel dividend and other income to communities living near the mine and in labour-sending areas. These are the South Deep Community Trust and the South Deep Education Trust. Since their launch, these trusts have invested R15m and R91m in community and education projects, respectively. The MCSA and Gold Fields also engaged with the government around reforms to regulations on self-generating electricity supplied by private sector companies. The regulatory approval process around South Deep’s pioneering 50MW Khanyisa solar plant assisted in easing restrictions, facilitating a self-generating power supply – particularly for those using renewable energy sources. Gold Fields is also engaging with the regulator and the public electricity utility, Eskom, around selling surplus renewables electricity back into the public grid. Mining Charter Scorecard In reviewing South Deep’s 2023 – 2027 SLP (SLP III) submission, the Department of Mineral Resources and Energy (DMRE) indicated that it did not satisfy regulation 46 of the MPRDA, mainly because of an administrative misalignment between South Deep’s SLP III submission cycles and the prescribed five- year SLP cycles calculated since inception of the South Deep-converted Mining Right in 2010. To restore the SLP cycle alignment, South Deep agreed to reconstitute SLP III to cover the five-year period from 2020 to 2024 (instead of 2023 – 2027). Because South Deep had already submitted its programmes for 2020 – 2022, the revised SLP III cycle had to include 2020 – 2022 targets and actuals and only targets and programmes for 2023 and 2024. When formulating SLP II and SLP III, South Deep engaged and consulted with the relevant stakeholders and, as such, the reconstituted SLP III does not require further engagement. It should be noted that the DMRE issued a directive requesting the mine not to start any of the planned local economic development projects for 2023 and 2024 pending its approval of the reconstituted SLP III. As part of SLP III, we spent over R62m (US$3.4m) for 2023 on SED projects that supported education and training, infrastructure development, healthcare, supplier and enterprise development water and sanitation in 2023. Combined with the South Deep Community and Education trusts, the amount is over R69m. In addition, South Deep spent R302m (US$18m) between 2020 – 2023 on skills development and training for its employees, as well as various initiatives to upskill community members, including adult education programmes. Worth noting are two youth-focused employment and skills programmes: • In partnership with the Yes4Youth organisation, South Deep enrolled 80 unemployed youth from the local community to work on the mine to gain work experience and equip them for jobs in the mining industry. This programme will continue during the current SLP cycle, with a further 65 cadets enrolled in 2023 of which 54 are still on the programme • The mine also partnered with the Signa Academy to engage disabled youth into a workplace emersion programme. During 2022, a total of 87 disabled youth were enrolled with 86% completing the programme, while 58 or 84% of the second cycle completed their programmes during 2023. For the third cycle intake, the mine enrolled 56 candidates who are expected to complete their training later in 2024 Overview Governance Our business Strategic pillar 1 Strategic pillar 2 Strategic pillar 3 Assurance Gold Fields IAR-63
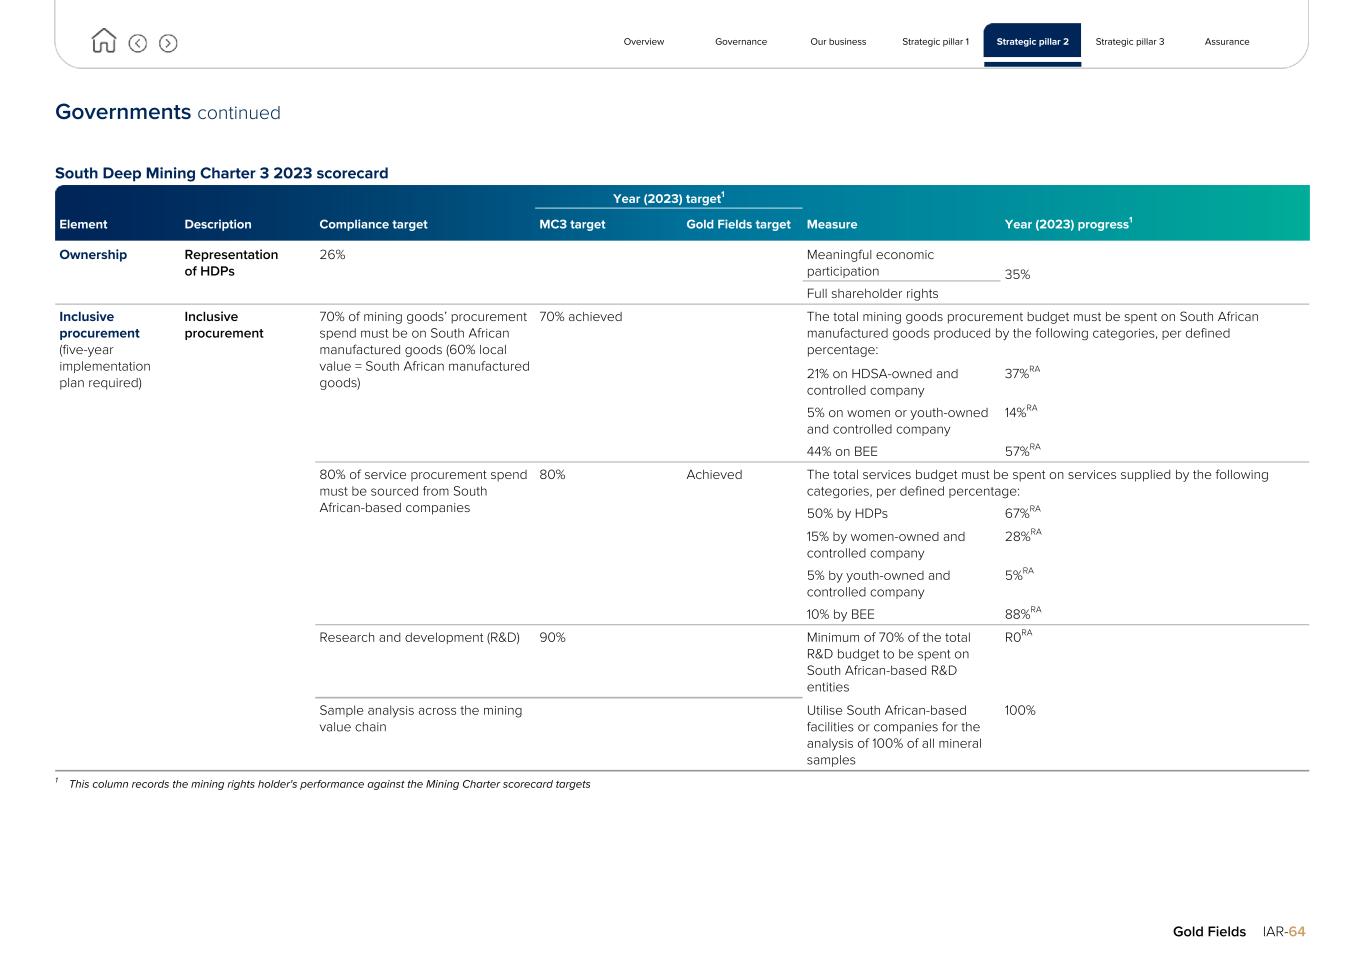
Governments continued South Deep Mining Charter 3 2023 scorecard Element Description Compliance target Year (2023) target1 Measure Year (2023) progress1MC3 target Gold Fields target Ownership Representation of HDPs 26% Meaningful economic participation 35% Full shareholder rights Inclusive procurement (five-year implementation plan required) Inclusive procurement 70% of mining goods’ procurement spend must be on South African manufactured goods (60% local value = South African manufactured goods) 70% achieved The total mining goods procurement budget must be spent on South African manufactured goods produced by the following categories, per defined percentage: 21% on HDSA-owned and controlled company 37%RA 5% on women or youth-owned and controlled company 14%RA 44% on BEE 57%RA 80% of service procurement spend must be sourced from South African-based companies 80% Achieved The total services budget must be spent on services supplied by the following categories, per defined percentage: 50% by HDPs 67%RA 15% by women-owned and controlled company 28%RA 5% by youth-owned and controlled company 5%RA 10% by BEE 88%RA Research and development (R&D) 90% Minimum of 70% of the total R&D budget to be spent on South African-based R&D entities R0RA Sample analysis across the mining value chain Utilise South African-based facilities or companies for the analysis of 100% of all mineral samples 100% 1 This column records the mining rights holder's performance against the Mining Charter scorecard targets Overview Governance Our business Strategic pillar 1 Strategic pillar 2 Strategic pillar 3 Assurance Gold Fields IAR-64
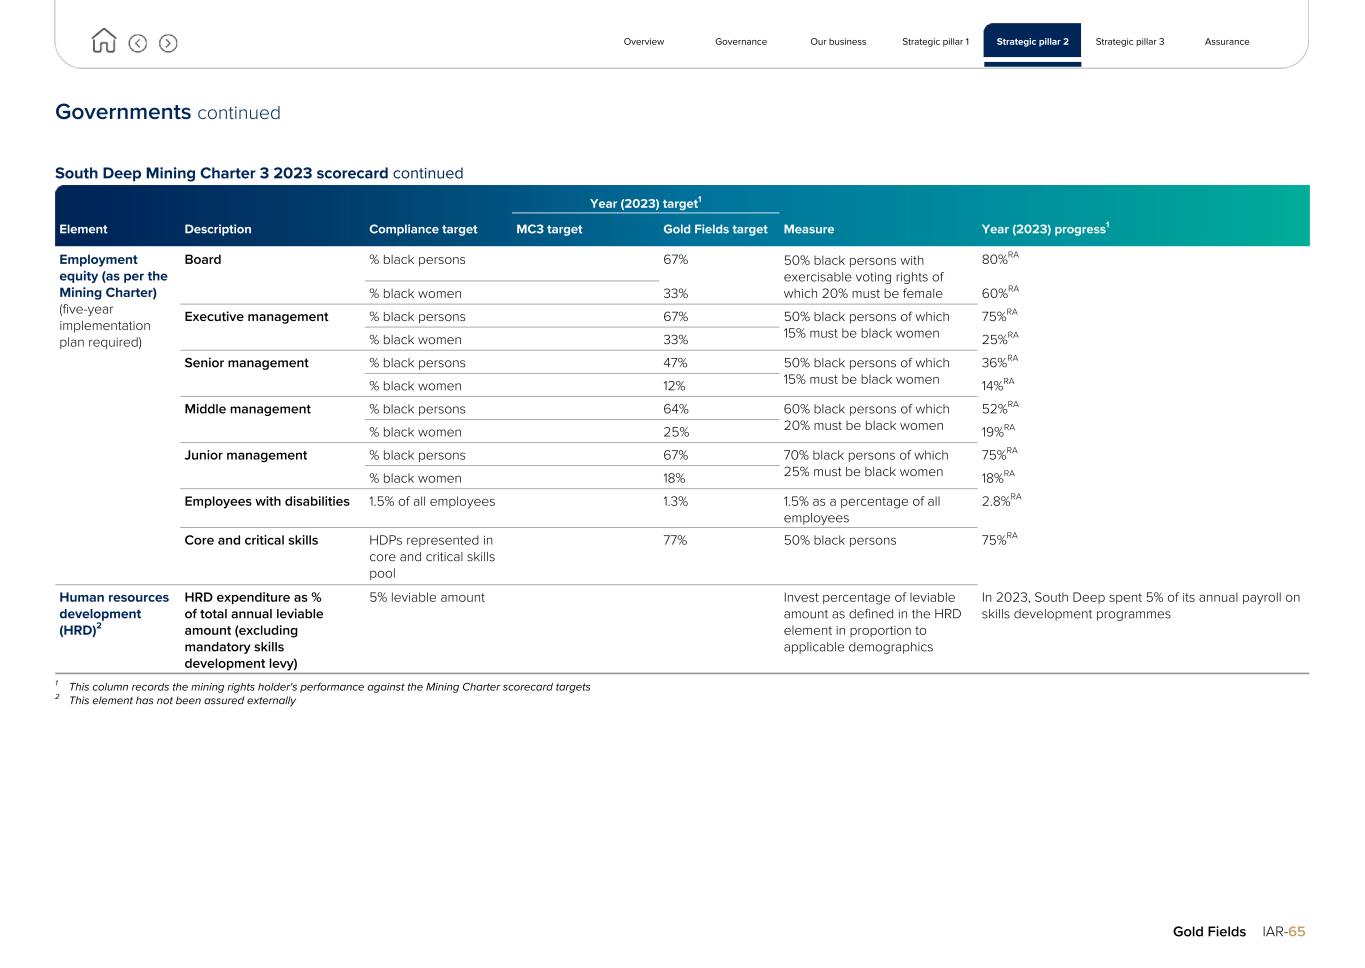
Governments continued South Deep Mining Charter 3 2023 scorecard continued Element Description Compliance target Year (2023) target1 Measure Year (2023) progress1MC3 target Gold Fields target Employment equity (as per the Mining Charter) (five-year implementation plan required) Board % black persons 67% 50% black persons with exercisable voting rights of which 20% must be female 80%RA % black women 33% 60%RA Executive management % black persons 67% 50% black persons of which 15% must be black women 75%RA % black women 33% 25%RA Senior management % black persons 47% 50% black persons of which 15% must be black women 36%RA % black women 12% 14%RA Middle management % black persons 64% 60% black persons of which 20% must be black women 52%RA % black women 25% 19%RA Junior management % black persons 67% 70% black persons of which 25% must be black women 75%RA % black women 18% 18%RA Employees with disabilities 1.5% of all employees 1.3% 1.5% as a percentage of all employees 2.8%RA Core and critical skills HDPs represented in core and critical skills pool 77% 50% black persons 75%RA Human resources development (HRD)2 HRD expenditure as % of total annual leviable amount (excluding mandatory skills development levy) 5% leviable amount Invest percentage of leviable amount as defined in the HRD element in proportion to applicable demographics In 2023, South Deep spent 5% of its annual payroll on skills development programmes 1 This column records the mining rights holder's performance against the Mining Charter scorecard targets 2 This element has not been assured externally Overview Governance Our business Strategic pillar 1 Strategic pillar 2 Strategic pillar 3 Assurance Gold Fields IAR-65
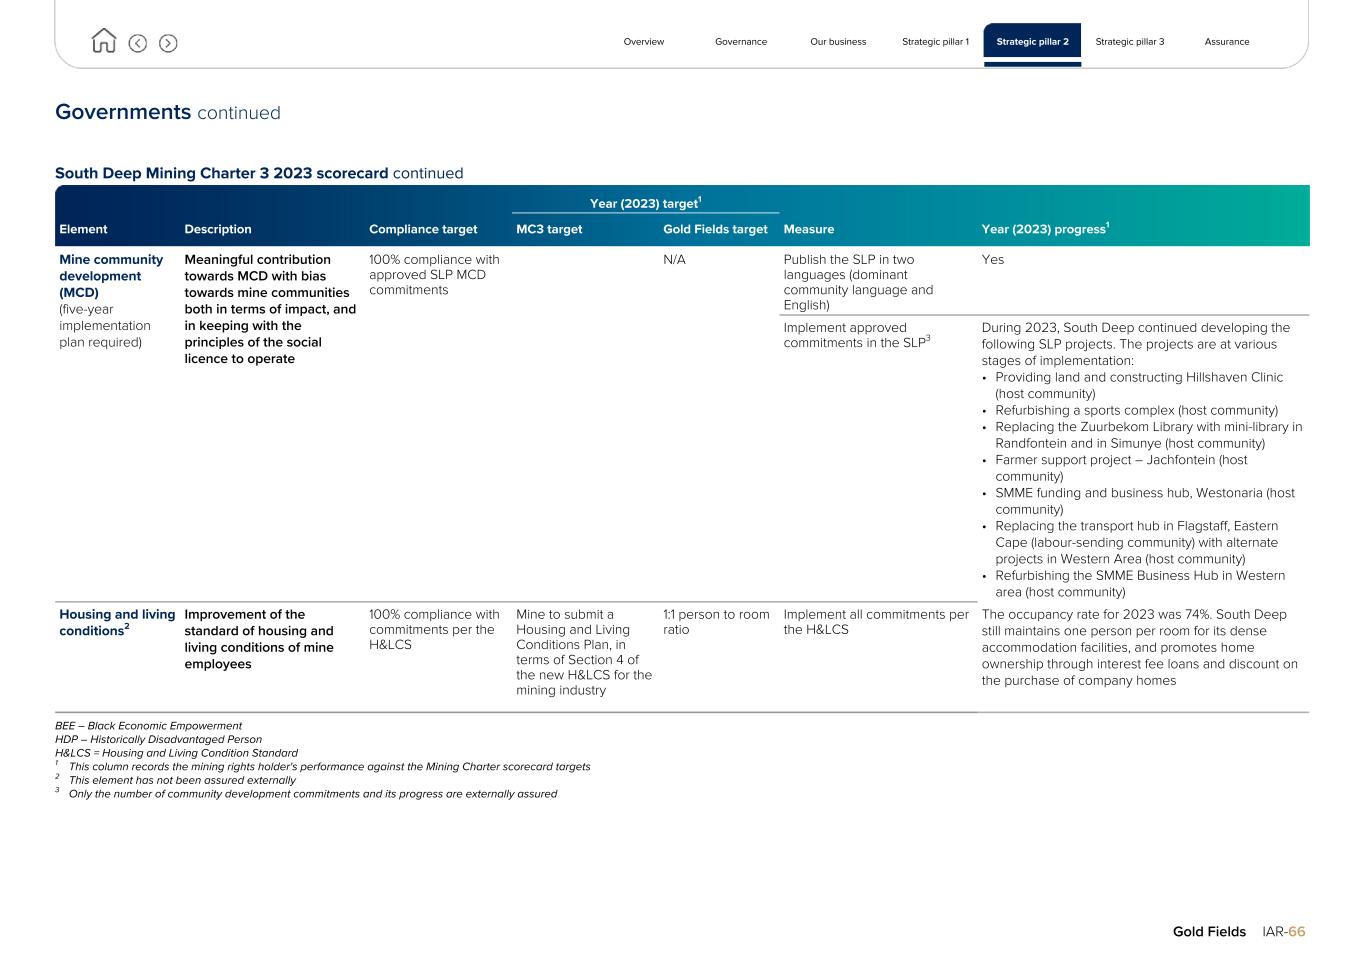
Governments continued South Deep Mining Charter 3 2023 scorecard continued Element Description Compliance target Year (2023) target1 Measure Year (2023) progress1MC3 target Gold Fields target Mine community development (MCD) (five-year implementation plan required) Meaningful contribution towards MCD with bias towards mine communities both in terms of impact, and in keeping with the principles of the social licence to operate 100% compliance with approved SLP MCD commitments N/A Publish the SLP in two languages (dominant community language and English) Yes Implement approved commitments in the SLP3 During 2023, South Deep continued developing the following SLP projects. The projects are at various stages of implementation: • Providing land and constructing Hillshaven Clinic (host community) • Refurbishing a sports complex (host community) • Replacing the Zuurbekom Library with mini-library in Randfontein and in Simunye (host community) • Farmer support project – Jachfontein (host community) • SMME funding and business hub, Westonaria (host community) • Replacing the transport hub in Flagstaff, Eastern Cape (labour-sending community) with alternate projects in Western Area (host community) • Refurbishing the SMME Business Hub in Western area (host community) Housing and living conditions2 Improvement of the standard of housing and living conditions of mine employees 100% compliance with commitments per the H&LCS Mine to submit a Housing and Living Conditions Plan, in terms of Section 4 of the new H&LCS for the mining industry 1:1 person to room ratio Implement all commitments per the H&LCS The occupancy rate for 2023 was 74%. South Deep still maintains one person per room for its dense accommodation facilities, and promotes home ownership through interest fee loans and discount on the purchase of company homes BEE – Black Economic Empowerment HDP – Historically Disadvantaged Person H&LCS = Housing and Living Condition Standard 1 This column records the mining rights holder's performance against the Mining Charter scorecard targets 2 This element has not been assured externally 3 Only the number of community development commitments and its progress are externally assured Overview Governance Our business Strategic pillar 1 Strategic pillar 2 Strategic pillar 3 Assurance Gold Fields IAR-66
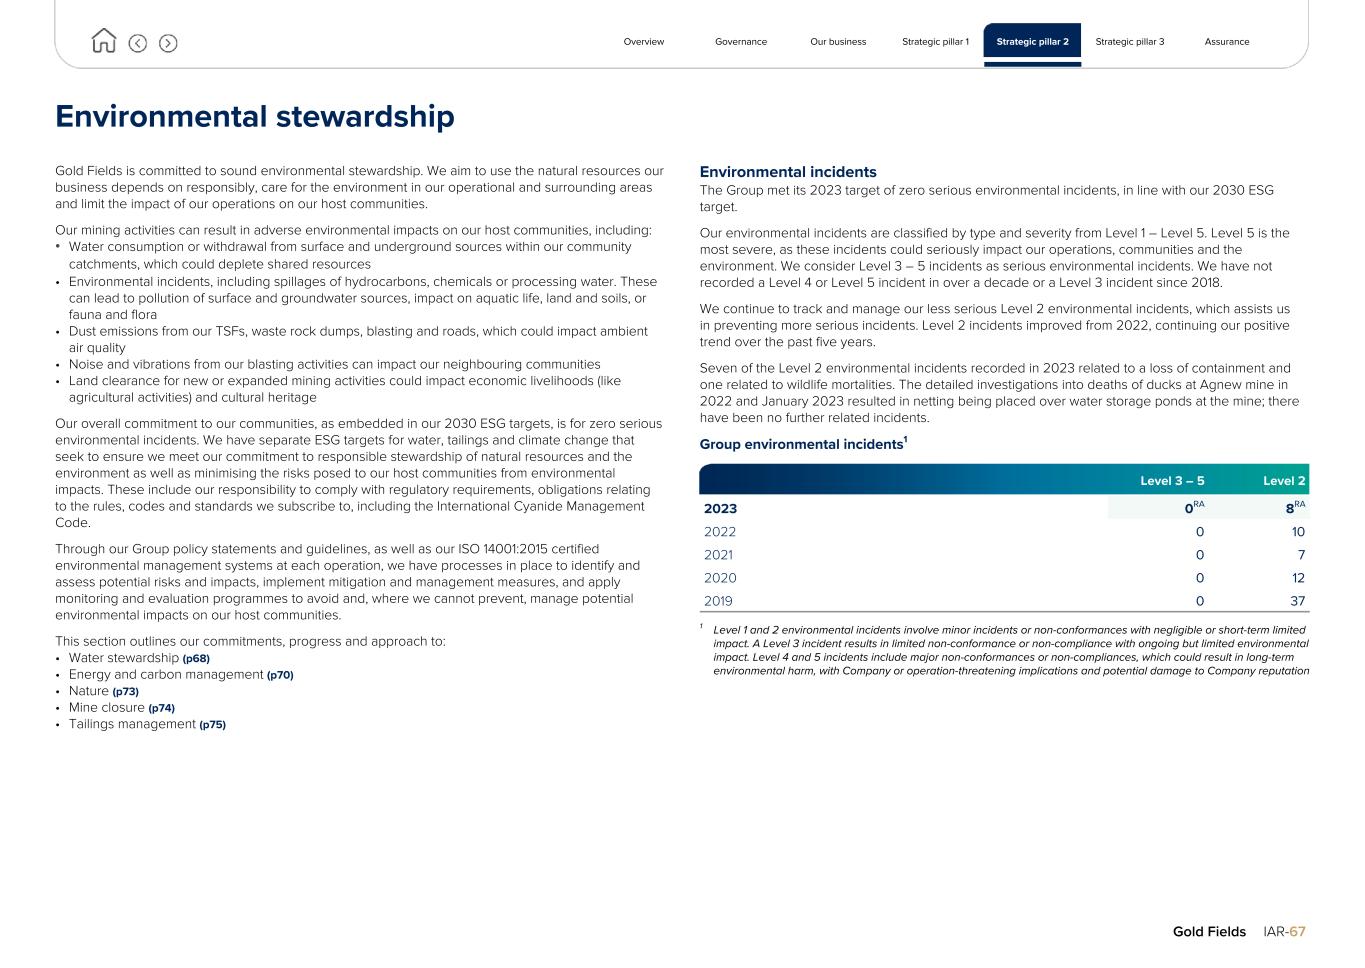
Environmental stewardship Gold Fields is committed to sound environmental stewardship. We aim to use the natural resources our business depends on responsibly, care for the environment in our operational and surrounding areas and limit the impact of our operations on our host communities. Our mining activities can result in adverse environmental impacts on our host communities, including: • Water consumption or withdrawal from surface and underground sources within our community catchments, which could deplete shared resources • Environmental incidents, including spillages of hydrocarbons, chemicals or processing water. These can lead to pollution of surface and groundwater sources, impact on aquatic life, land and soils, or fauna and flora • Dust emissions from our TSFs, waste rock dumps, blasting and roads, which could impact ambient air quality • Noise and vibrations from our blasting activities can impact our neighbouring communities • Land clearance for new or expanded mining activities could impact economic livelihoods (like agricultural activities) and cultural heritage Our overall commitment to our communities, as embedded in our 2030 ESG targets, is for zero serious environmental incidents. We have separate ESG targets for water, tailings and climate change that seek to ensure we meet our commitment to responsible stewardship of natural resources and the environment as well as minimising the risks posed to our host communities from environmental impacts. These include our responsibility to comply with regulatory requirements, obligations relating to the rules, codes and standards we subscribe to, including the International Cyanide Management Code. Through our Group policy statements and guidelines, as well as our ISO 14001:2015 certified environmental management systems at each operation, we have processes in place to identify and assess potential risks and impacts, implement mitigation and management measures, and apply monitoring and evaluation programmes to avoid and, where we cannot prevent, manage potential environmental impacts on our host communities. This section outlines our commitments, progress and approach to: • Water stewardship (p68) • Energy and carbon management (p70) • Nature (p73) • Mine closure (p74) • Tailings management (p75) Environmental incidents The Group met its 2023 target of zero serious environmental incidents, in line with our 2030 ESG target. Our environmental incidents are classified by type and severity from Level 1 – Level 5. Level 5 is the most severe, as these incidents could seriously impact our operations, communities and the environment. We consider Level 3 – 5 incidents as serious environmental incidents. We have not recorded a Level 4 or Level 5 incident in over a decade or a Level 3 incident since 2018. We continue to track and manage our less serious Level 2 environmental incidents, which assists us in preventing more serious incidents. Level 2 incidents improved from 2022, continuing our positive trend over the past five years. Seven of the Level 2 environmental incidents recorded in 2023 related to a loss of containment and one related to wildlife mortalities. The detailed investigations into deaths of ducks at Agnew mine in 2022 and January 2023 resulted in netting being placed over water storage ponds at the mine; there have been no further related incidents. Group environmental incidents1 Level 3 – 5 Level 2 2023 0RA 8RA 2022 0 10 2021 0 7 2020 0 12 2019 0 37 1 Level 1 and 2 environmental incidents involve minor incidents or non-conformances with negligible or short-term limited impact. A Level 3 incident results in limited non-conformance or non-compliance with ongoing but limited environmental impact. Level 4 and 5 incidents include major non-conformances or non-compliances, which could result in long-term environmental harm, with Company or operation-threatening implications and potential damage to Company reputation Overview Governance Our business Strategic pillar 1 Strategic pillar 2 Strategic pillar 3 Assurance Gold Fields IAR-67
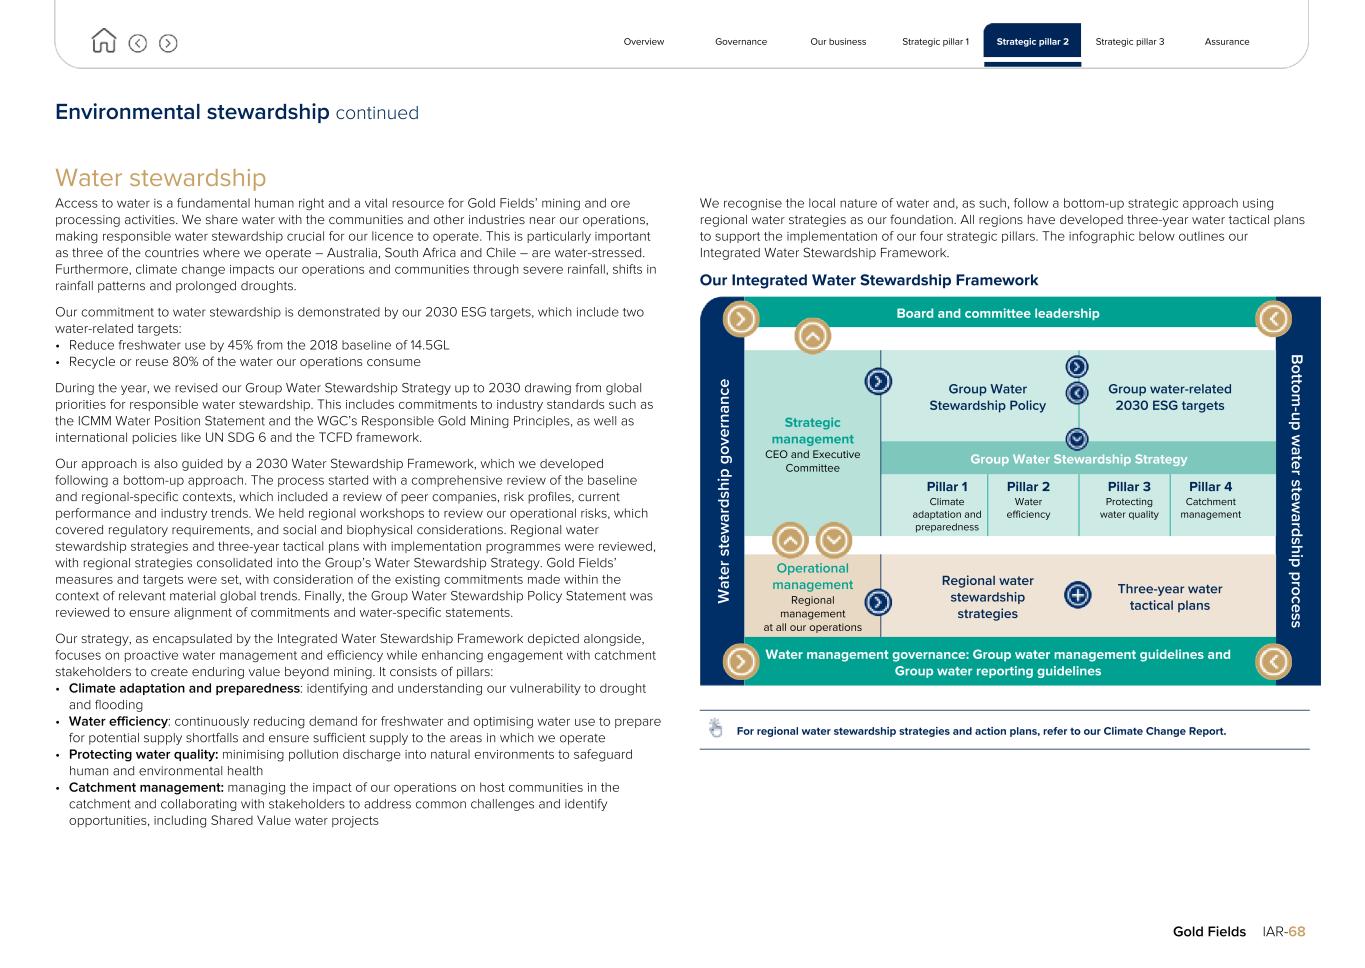
Environmental stewardship continued Water stewardship Access to water is a fundamental human right and a vital resource for Gold Fields’ mining and ore processing activities. We share water with the communities and other industries near our operations, making responsible water stewardship crucial for our licence to operate. This is particularly important as three of the countries where we operate – Australia, South Africa and Chile – are water-stressed. Furthermore, climate change impacts our operations and communities through severe rainfall, shifts in rainfall patterns and prolonged droughts. Our commitment to water stewardship is demonstrated by our 2030 ESG targets, which include two water-related targets: • Reduce freshwater use by 45% from the 2018 baseline of 14.5GL • Recycle or reuse 80% of the water our operations consume During the year, we revised our Group Water Stewardship Strategy up to 2030 drawing from global priorities for responsible water stewardship. This includes commitments to industry standards such as the ICMM Water Position Statement and the WGC’s Responsible Gold Mining Principles, as well as international policies like UN SDG 6 and the TCFD framework. Our approach is also guided by a 2030 Water Stewardship Framework, which we developed following a bottom-up approach. The process started with a comprehensive review of the baseline and regional-specific contexts, which included a review of peer companies, risk profiles, current performance and industry trends. We held regional workshops to review our operational risks, which covered regulatory requirements, and social and biophysical considerations. Regional water stewardship strategies and three-year tactical plans with implementation programmes were reviewed, with regional strategies consolidated into the Group’s Water Stewardship Strategy. Gold Fields’ measures and targets were set, with consideration of the existing commitments made within the context of relevant material global trends. Finally, the Group Water Stewardship Policy Statement was reviewed to ensure alignment of commitments and water-specific statements. Our strategy, as encapsulated by the Integrated Water Stewardship Framework depicted alongside, focuses on proactive water management and efficiency while enhancing engagement with catchment stakeholders to create enduring value beyond mining. It consists of pillars: • Climate adaptation and preparedness: identifying and understanding our vulnerability to drought and flooding • Water efficiency: continuously reducing demand for freshwater and optimising water use to prepare for potential supply shortfalls and ensure sufficient supply to the areas in which we operate • Protecting water quality: minimising pollution discharge into natural environments to safeguard human and environmental health • Catchment management: managing the impact of our operations on host communities in the catchment and collaborating with stakeholders to address common challenges and identify opportunities, including Shared Value water projects We recognise the local nature of water and, as such, follow a bottom-up strategic approach using regional water strategies as our foundation. All regions have developed three-year water tactical plans to support the implementation of our four strategic pillars. The infographic below outlines our Integrated Water Stewardship Framework. Our Integrated Water Stewardship Framework W at er s te w ar ds hi p go ve rn an ce Board and committee leadership Bottom -up w ater stew ardship process Strategic management CEO and Executive Committee Group Water Stewardship Policy Group water-related 2030 ESG targets Group Water Stewardship Strategy Pillar 1 Climate adaptation and preparedness Pillar 2 Water efficiency Pillar 3 Protecting water quality Pillar 4 Catchment management Operational management Regional management at all our operations Regional water stewardship strategies Three-year water tactical plans Water management governance: Group water management guidelines and Group water reporting guidelines For regional water stewardship strategies and action plans, refer to our Climate Change Report. Overview Governance Our business Strategic pillar 1 Strategic pillar 2 Strategic pillar 3 Assurance Gold Fields IAR-68
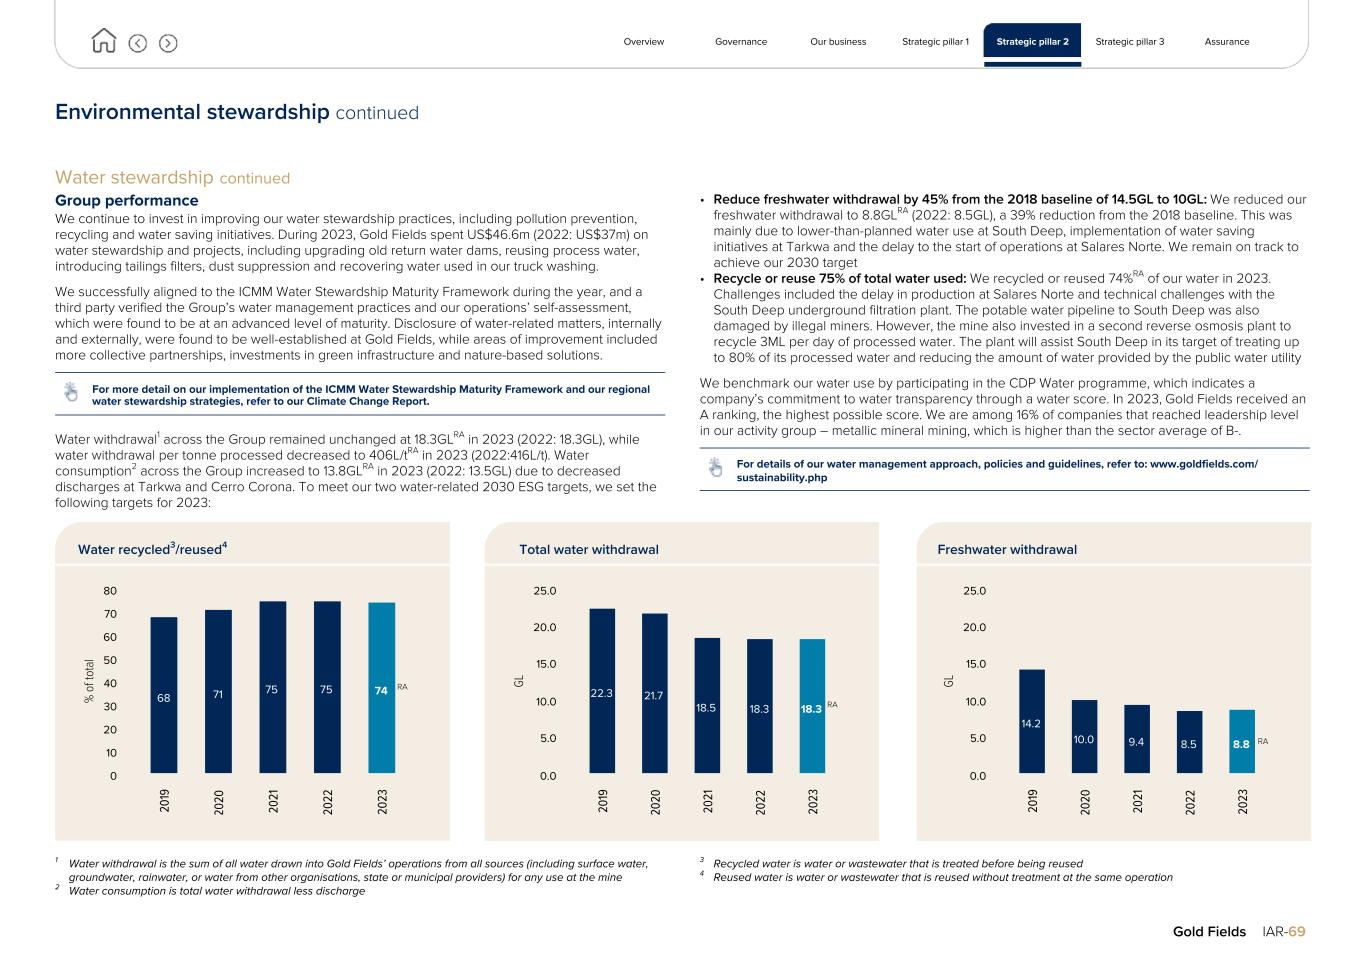
Environmental stewardship continued Water stewardship continued Group performance We continue to invest in improving our water stewardship practices, including pollution prevention, recycling and water saving initiatives. During 2023, Gold Fields spent US$46.6m (2022: US$37m) on water stewardship and projects, including upgrading old return water dams, reusing process water, introducing tailings filters, dust suppression and recovering water used in our truck washing. We successfully aligned to the ICMM Water Stewardship Maturity Framework during the year, and a third party verified the Group’s water management practices and our operations’ self-assessment, which were found to be at an advanced level of maturity. Disclosure of water-related matters, internally and externally, were found to be well-established at Gold Fields, while areas of improvement included more collective partnerships, investments in green infrastructure and nature-based solutions. For more detail on our implementation of the ICMM Water Stewardship Maturity Framework and our regional water stewardship strategies, refer to our Climate Change Report. Water withdrawal1 across the Group remained unchanged at 18.3GLRA in 2023 (2022: 18.3GL), while water withdrawal per tonne processed decreased to 406L/tRA in 2023 (2022:416L/t). Water consumption2 across the Group increased to 13.8GLRA in 2023 (2022: 13.5GL) due to decreased discharges at Tarkwa and Cerro Corona. To meet our two water-related 2030 ESG targets, we set the following targets for 2023: • Reduce freshwater withdrawal by 45% from the 2018 baseline of 14.5GL to 10GL: We reduced our freshwater withdrawal to 8.8GLRA (2022: 8.5GL), a 39% reduction from the 2018 baseline. This was mainly due to lower-than-planned water use at South Deep, implementation of water saving initiatives at Tarkwa and the delay to the start of operations at Salares Norte. We remain on track to achieve our 2030 target • Recycle or reuse 75% of total water used: We recycled or reused 74%RA of our water in 2023. Challenges included the delay in production at Salares Norte and technical challenges with the South Deep underground filtration plant. The potable water pipeline to South Deep was also damaged by illegal miners. However, the mine also invested in a second reverse osmosis plant to recycle 3ML per day of processed water. The plant will assist South Deep in its target of treating up to 80% of its processed water and reducing the amount of water provided by the public water utility We benchmark our water use by participating in the CDP Water programme, which indicates a company’s commitment to water transparency through a water score. In 2023, Gold Fields received an A ranking, the highest possible score. We are among 16% of companies that reached leadership level in our activity group – metallic mineral mining, which is higher than the sector average of B-. For details of our water management approach, policies and guidelines, refer to: www.goldfields.com/ sustainability.php Water recycled3/reused4 % o f t ot al 68 71 75 75 74 20 19 20 20 20 21 20 22 20 23 0 10 20 30 40 50 60 70 80 Total water withdrawal GL 22.3 21.7 18.5 18.3 18.3 20 19 20 20 20 21 20 22 20 23 0.0 5.0 10.0 15.0 20.0 25.0 Freshwater withdrawal GL 14.2 10.0 9.4 8.5 8.8 20 19 20 20 20 21 20 22 20 23 0.0 5.0 10.0 15.0 20.0 25.0 1 Water withdrawal is the sum of all water drawn into Gold Fields’ operations from all sources (including surface water, groundwater, rainwater, or water from other organisations, state or municipal providers) for any use at the mine 2 Water consumption is total water withdrawal less discharge 3 Recycled water is water or wastewater that is treated before being reused 4 Reused water is water or wastewater that is reused without treatment at the same operation Overview Governance Our business Strategic pillar 1 Strategic pillar 2 Strategic pillar 3 Assurance Gold Fields IAR-69 RA RA RA
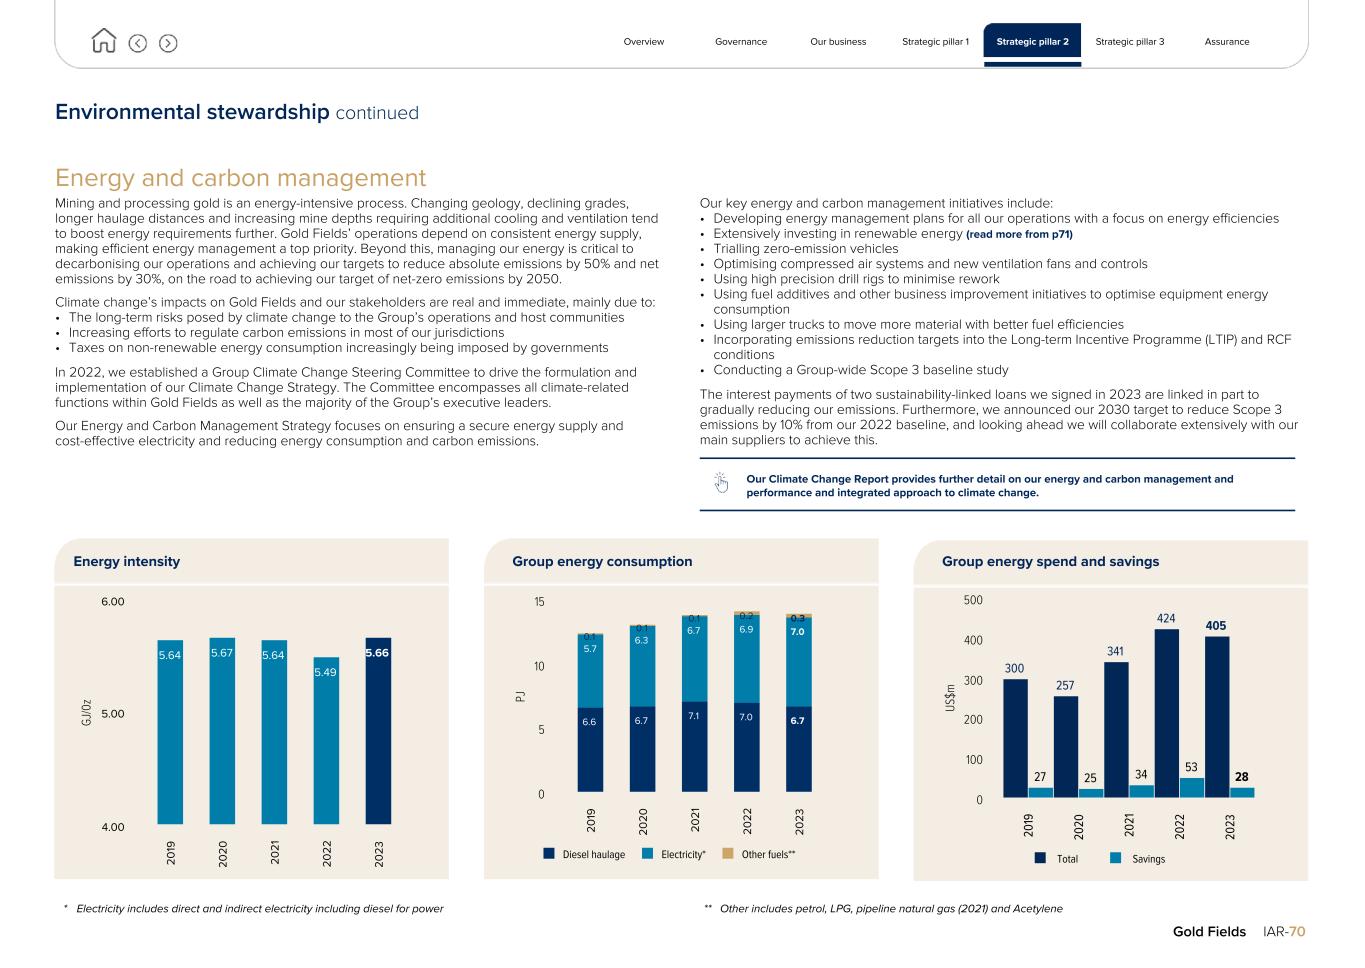
Environmental stewardship continued Energy and carbon management Mining and processing gold is an energy-intensive process. Changing geology, declining grades, longer haulage distances and increasing mine depths requiring additional cooling and ventilation tend to boost energy requirements further. Gold Fields’ operations depend on consistent energy supply, making efficient energy management a top priority. Beyond this, managing our energy is critical to decarbonising our operations and achieving our targets to reduce absolute emissions by 50% and net emissions by 30%, on the road to achieving our target of net-zero emissions by 2050. Climate change’s impacts on Gold Fields and our stakeholders are real and immediate, mainly due to: • The long-term risks posed by climate change to the Group’s operations and host communities • Increasing efforts to regulate carbon emissions in most of our jurisdictions • Taxes on non-renewable energy consumption increasingly being imposed by governments In 2022, we established a Group Climate Change Steering Committee to drive the formulation and implementation of our Climate Change Strategy. The Committee encompasses all climate-related functions within Gold Fields as well as the majority of the Group’s executive leaders. Our Energy and Carbon Management Strategy focuses on ensuring a secure energy supply and cost-effective electricity and reducing energy consumption and carbon emissions. Our key energy and carbon management initiatives include: • Developing energy management plans for all our operations with a focus on energy efficiencies • Extensively investing in renewable energy (read more from p71) • Trialling zero-emission vehicles • Optimising compressed air systems and new ventilation fans and controls • Using high precision drill rigs to minimise rework • Using fuel additives and other business improvement initiatives to optimise equipment energy consumption • Using larger trucks to move more material with better fuel efficiencies • Incorporating emissions reduction targets into the Long-term Incentive Programme (LTIP) and RCF conditions • Conducting a Group-wide Scope 3 baseline study The interest payments of two sustainability-linked loans we signed in 2023 are linked in part to gradually reducing our emissions. Furthermore, we announced our 2030 target to reduce Scope 3 emissions by 10% from our 2022 baseline, and looking ahead we will collaborate extensively with our main suppliers to achieve this. Our Climate Change Report provides further detail on our energy and carbon management and performance and integrated approach to climate change. Energy intensity GJ /0 z 5.64 5.67 5.64 5.49 5.66 20 19 20 20 20 21 20 22 20 23 4.00 5.00 6.00 Group energy consumption PJ 6.6 6.7 7.1 7.0 6.7 5.7 6.3 6.7 6.9 7.00.1 0.1 0.1 0.2 0.3 Diesel haulage Electricity* Other fuels** 20 19 20 20 20 21 20 22 20 23 0 5 10 15 Group energy spend and savings US $m 300 257 341 424 405 27 25 34 53 28 Total Savings 20 19 20 20 20 21 20 22 20 23 0 100 200 300 400 500 Overview Governance Our business Strategic pillar 1 Strategic pillar 2 Strategic pillar 3 Assurance Gold Fields IAR-70 * Electricity includes direct and indirect electricity including diesel for power ** Other includes petrol, LPG, pipeline natural gas (2021) and Acetylene
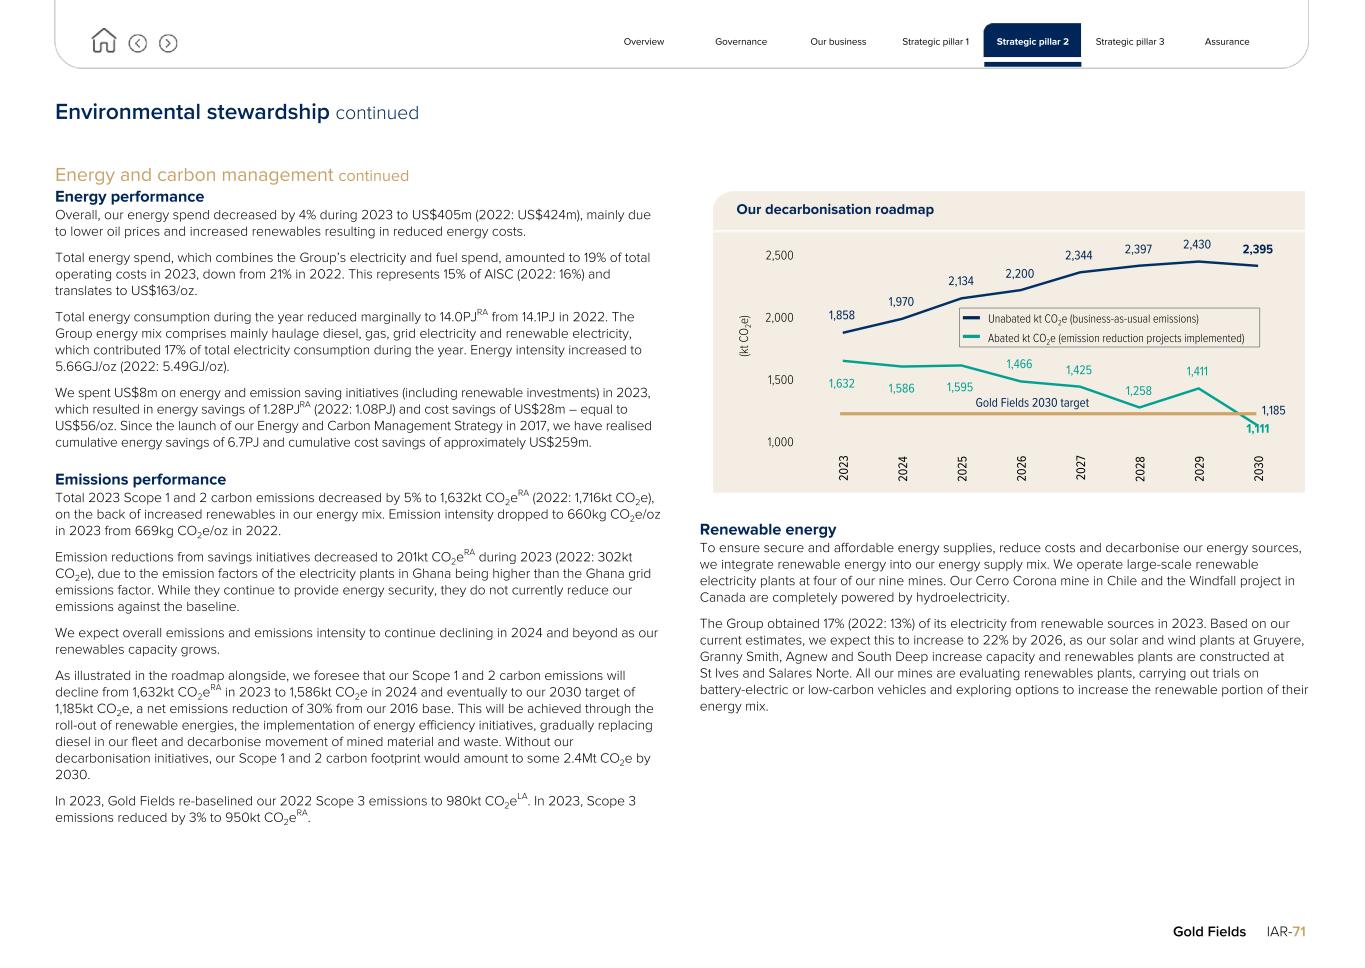
Environmental stewardship continued Energy and carbon management continued Energy performance Overall, our energy spend decreased by 4% during 2023 to US$405m (2022: US$424m), mainly due to lower oil prices and increased renewables resulting in reduced energy costs. Total energy spend, which combines the Group’s electricity and fuel spend, amounted to 19% of total operating costs in 2023, down from 21% in 2022. This represents 15% of AISC (2022: 16%) and translates to US$163/oz. Total energy consumption during the year reduced marginally to 14.0PJRA from 14.1PJ in 2022. The Group energy mix comprises mainly haulage diesel, gas, grid electricity and renewable electricity, which contributed 17% of total electricity consumption during the year. Energy intensity increased to 5.66GJ/oz (2022: 5.49GJ/oz). We spent US$8m on energy and emission saving initiatives (including renewable investments) in 2023, which resulted in energy savings of 1.28PJRA (2022: 1.08PJ) and cost savings of US$28m – equal to US$56/oz. Since the launch of our Energy and Carbon Management Strategy in 2017, we have realised cumulative energy savings of 6.7PJ and cumulative cost savings of approximately US$259m. Emissions performance Total 2023 Scope 1 and 2 carbon emissions decreased by 5% to 1,632kt CO2eRA (2022: 1,716kt CO2e), on the back of increased renewables in our energy mix. Emission intensity dropped to 660kg CO2e/oz in 2023 from 669kg CO2e/oz in 2022. Emission reductions from savings initiatives decreased to 201kt CO2eRA during 2023 (2022: 302kt CO2e), due to the emission factors of the electricity plants in Ghana being higher than the Ghana grid emissions factor. While they continue to provide energy security, they do not currently reduce our emissions against the baseline. We expect overall emissions and emissions intensity to continue declining in 2024 and beyond as our renewables capacity grows. As illustrated in the roadmap alongside, we foresee that our Scope 1 and 2 carbon emissions will decline from 1,632kt CO2eRA in 2023 to 1,586kt CO2e in 2024 and eventually to our 2030 target of 1,185kt CO2e, a net emissions reduction of 30% from our 2016 base. This will be achieved through the roll-out of renewable energies, the implementation of energy efficiency initiatives, gradually replacing diesel in our fleet and decarbonise movement of mined material and waste. Without our decarbonisation initiatives, our Scope 1 and 2 carbon footprint would amount to some 2.4Mt CO2e by 2030. In 2023, Gold Fields re-baselined our 2022 Scope 3 emissions to 980kt CO2eLA. In 2023, Scope 3 emissions reduced by 3% to 950kt CO2eRA. Our decarbonisation roadmap 1,858 1,970 2,134 2,200 2,344 2,397 2,430 2,395 1,632 1,586 1,595 1,466 1,425 1,258 1,411 1,111 20 23 20 24 20 25 20 26 20 27 20 28 20 29 20 30 1,000 1,500 2,000 2,500 Renewable energy To ensure secure and affordable energy supplies, reduce costs and decarbonise our energy sources, we integrate renewable energy into our energy supply mix. We operate large-scale renewable electricity plants at four of our nine mines. Our Cerro Corona mine in Chile and the Windfall project in Canada are completely powered by hydroelectricity. The Group obtained 17% (2022: 13%) of its electricity from renewable sources in 2023. Based on our current estimates, we expect this to increase to 22% by 2026, as our solar and wind plants at Gruyere, Granny Smith, Agnew and South Deep increase capacity and renewables plants are constructed at St Ives and Salares Norte. All our mines are evaluating renewables plants, carrying out trials on battery-electric or low-carbon vehicles and exploring options to increase the renewable portion of their energy mix. Overview Governance Our business Strategic pillar 1 Strategic pillar 2 Strategic pillar 3 Assurance Gold Fields IAR-71 1,185 Gold Fields 2030 target Unabated kt CO2e (business-as-usual emissions) Abated kt CO2e (emission reduction projects implemented) (k t C O 2e )
Environmental stewardship continued Energy and carbon management continued Renewable energy continued Our renewables plants at our Australian mines are managed by independent power producers (IPPs), who recoup their capital investment via a long-term supply agreement with our mines. Where funding from Gold Fields is required, this is largely from operational cash-flows. However, at South Deep and, this year, at St Ives, we decided to build the plants ourself to gain the full benefit of the cost savings that renewable energy plants have over grid tariffs. We are working toward ensuring that renewables account for approximately 70% of the Group’s electricity mix by 2030 and 100% by 2050. The remaining emission savings will stem from further energy efficiency initiatives, as well as the gradual replacement of our diesel-powered fleet with zero-emission equipment. We are piloting some of these vehicles at various mines while also working with our peers in the ICMM to ensure rapid progress in rolling out safer and cleaner vehicles. Australia During 2023, 13% (2022: 12%) of the region’s electricity requirements were met through renewables. The investments in renewables and energy efficiency initiatives were responsible for the region’s 2023 carbon emission savings of 96kt CO2e. Agnew is our flagship renewables mine and one of the first gold mines in the world to generate over half of its electricity requirements from renewable sources. Wind and solar provided 50% of the mine’s electricity during the year. A 4MW gas power station and a 9MW solar farm expansion will be commissioned in 2024 to cater for increasing demand. Granny Smith’s hybrid system – comprising 8MW on-site solar, a 2MW battery power system and a gas power plant – generated 7% of its electricity supply from renewables during the year. Gruyere’s 12MW solar plant provided 9% of its electricity during the year, and a pre-feasibility study to increase the renewable energy capacity to 60% was completed. In February 2024, the Board approved the construction of a US$195m solar and wind plant at St Ives. When completed, up to 73% of the mine's electricity is expected to be sourced from renewables – significantly reducing the Group’s future Scope 1 and 2 emissions. South Africa In South Africa, the mining sector continues to be impacted by extensive loadshedding. Because of this, South Deep has to curtail certain operational activities at times and, as a last resort, utilise diesel-powered generators. The mine alternates between hoisting and milling activities to minimise the impact on production. To reduce our reliance on Eskom and achieve cost benefits, South Deep constructed the 50MW Khanyisa solar plant, which completed its first year of production in 2023. We invested R715m (US$46m) in the plant’s construction. The solar plant provided approximately 15% of South Deep’s electricity needs during the year and led to R150m (US$7.1m) in savings. Once ramped-up to full capacity, it is expected to provide 23% of the mine’s electricity needs and reduce annual emissions by 110kt CO2e. To improve performance, South Deep applied to Eskom for net-billing to enable the plant to produce the maximum possible energy and feed the excess into the Eskom grid. South Deep is studying the use of wind power and battery storage. The mine commissioned a meteorological mast in 2022 to evaluate wind as a source of energy to supplement solar electricity and provide additional electricity at night. The feasibility study indicated positive results. If approved, construction is expected to start in 2025 at cost of around R1.2bn (US$70m) and will include six to seven wind turbines producing 7MW each. Chile The 7.7MW solar plant of Salares Norte’s 26MW hybrid diesel-solar power project received environmental approval during 2023. Construction is expected to start in 2025, roughly a year after first gold. Diesel generators currently provide 16MW, with the 8MW solar plant to be added in early 2025. Once fully operational, it will be the highest solar plant in the world at over 4,500m above sea level, providing approximately 20% of the mine’s electricity. The plant is set to save the mine over US$7m in energy costs over the first 10 years and reduce carbon emissions by 10kt CO2e a year. Climate adaptation The rapidly changing climate and the increased rainfall intensity that our mines are experiencing presents a significant risk to our operations, particularly open pits. Gold Fields has appointed external geotechnical review boards to help implement industry best practice geotechnical design, monitoring, mine design, extraction sequencing, and ground support implementation, specifically at Cerro Corona, South Deep and the Wallaby mine at Granny Smith. Geotechnical instabilities at the mines are often affected by severe climate events, such as severe weather and rainfall, which may lead to periodic floods, mudslides, and wall instability. With the help of the boards, we seek to mitigate these risks. Gold Fields and other multinational mining houses are members of the Large Open Pit Consortium (an industry-sponsored, international research and technology transfer project) which commissioned an external review of the potential risk and impact of climate change on open-pit mines and waste dumps. The findings indicated the main risk related to extended periods of freeze and thaw affecting slope stability. At present, Gold Fields does not have any operations that are affected by these conditions, and therefore any climate change risks associated with Gold Fields’ open pits are considered negligible. Overview Governance Our business Strategic pillar 1 Strategic pillar 2 Strategic pillar 3 Assurance Gold Fields IAR-72
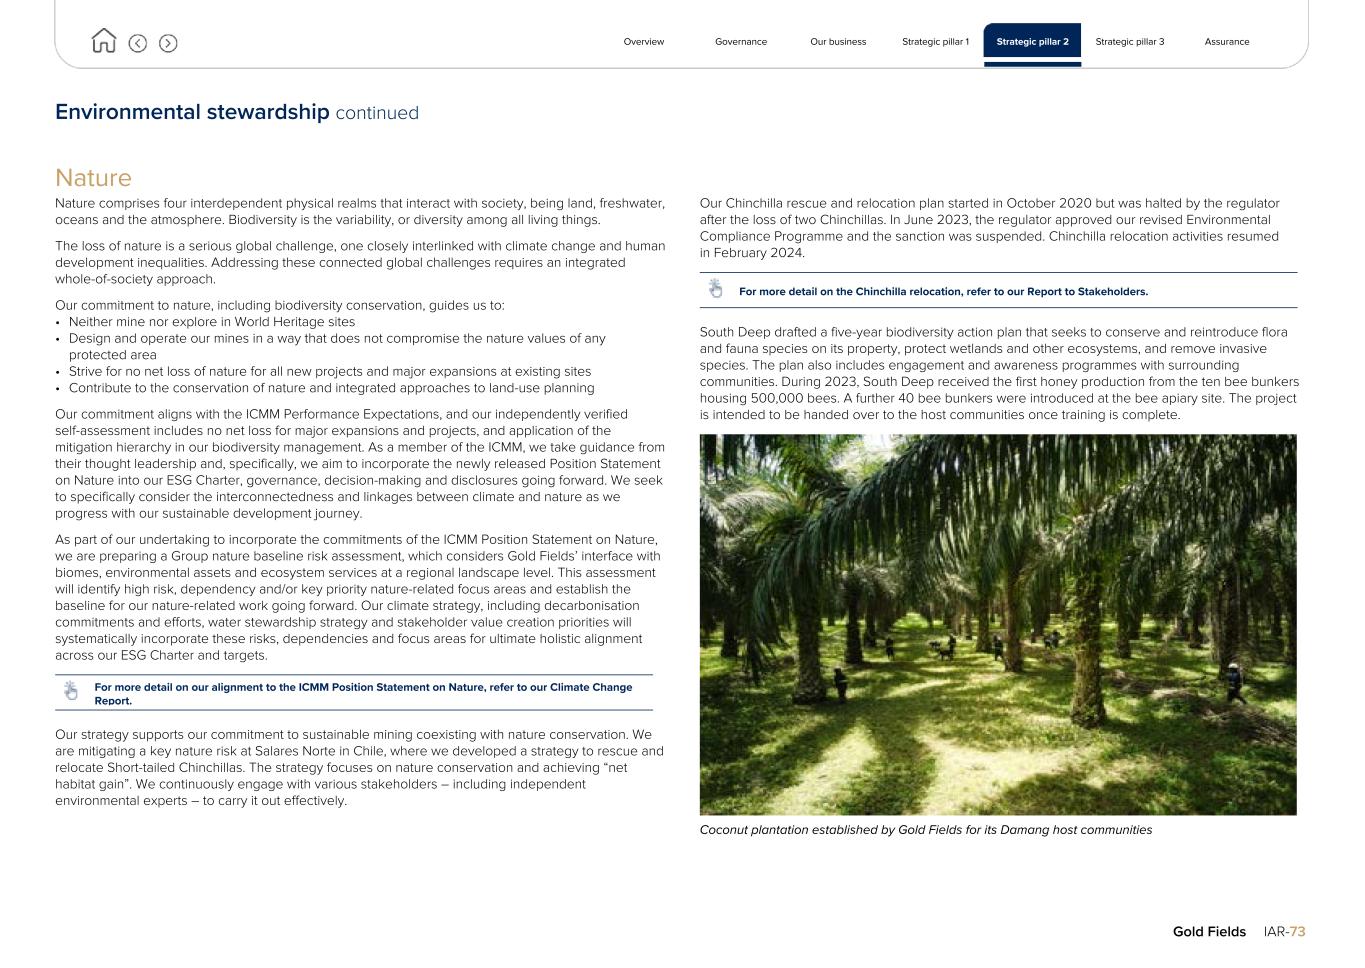
Environmental stewardship continued Nature Nature comprises four interdependent physical realms that interact with society, being land, freshwater, oceans and the atmosphere. Biodiversity is the variability, or diversity among all living things. The loss of nature is a serious global challenge, one closely interlinked with climate change and human development inequalities. Addressing these connected global challenges requires an integrated whole-of-society approach. Our commitment to nature, including biodiversity conservation, guides us to: • Neither mine nor explore in World Heritage sites • Design and operate our mines in a way that does not compromise the nature values of any protected area • Strive for no net loss of nature for all new projects and major expansions at existing sites • Contribute to the conservation of nature and integrated approaches to land-use planning Our commitment aligns with the ICMM Performance Expectations, and our independently verified self-assessment includes no net loss for major expansions and projects, and application of the mitigation hierarchy in our biodiversity management. As a member of the ICMM, we take guidance from their thought leadership and, specifically, we aim to incorporate the newly released Position Statement on Nature into our ESG Charter, governance, decision-making and disclosures going forward. We seek to specifically consider the interconnectedness and linkages between climate and nature as we progress with our sustainable development journey. As part of our undertaking to incorporate the commitments of the ICMM Position Statement on Nature, we are preparing a Group nature baseline risk assessment, which considers Gold Fields’ interface with biomes, environmental assets and ecosystem services at a regional landscape level. This assessment will identify high risk, dependency and/or key priority nature-related focus areas and establish the baseline for our nature-related work going forward. Our climate strategy, including decarbonisation commitments and efforts, water stewardship strategy and stakeholder value creation priorities will systematically incorporate these risks, dependencies and focus areas for ultimate holistic alignment across our ESG Charter and targets. For more detail on our alignment to the ICMM Position Statement on Nature, refer to our Climate Change Report. Our strategy supports our commitment to sustainable mining coexisting with nature conservation. We are mitigating a key nature risk at Salares Norte in Chile, where we developed a strategy to rescue and relocate Short-tailed Chinchillas. The strategy focuses on nature conservation and achieving “net habitat gain”. We continuously engage with various stakeholders – including independent environmental experts – to carry it out effectively. Our Chinchilla rescue and relocation plan started in October 2020 but was halted by the regulator after the loss of two Chinchillas. In June 2023, the regulator approved our revised Environmental Compliance Programme and the sanction was suspended. Chinchilla relocation activities resumed in February 2024. For more detail on the Chinchilla relocation, refer to our Report to Stakeholders. South Deep drafted a five-year biodiversity action plan that seeks to conserve and reintroduce flora and fauna species on its property, protect wetlands and other ecosystems, and remove invasive species. The plan also includes engagement and awareness programmes with surrounding communities. During 2023, South Deep received the first honey production from the ten bee bunkers housing 500,000 bees. A further 40 bee bunkers were introduced at the bee apiary site. The project is intended to be handed over to the host communities once training is complete. Coconut plantation established by Gold Fields for its Damang host communities Overview Governance Our business Strategic pillar 1 Strategic pillar 2 Strategic pillar 3 Assurance Gold Fields IAR-73
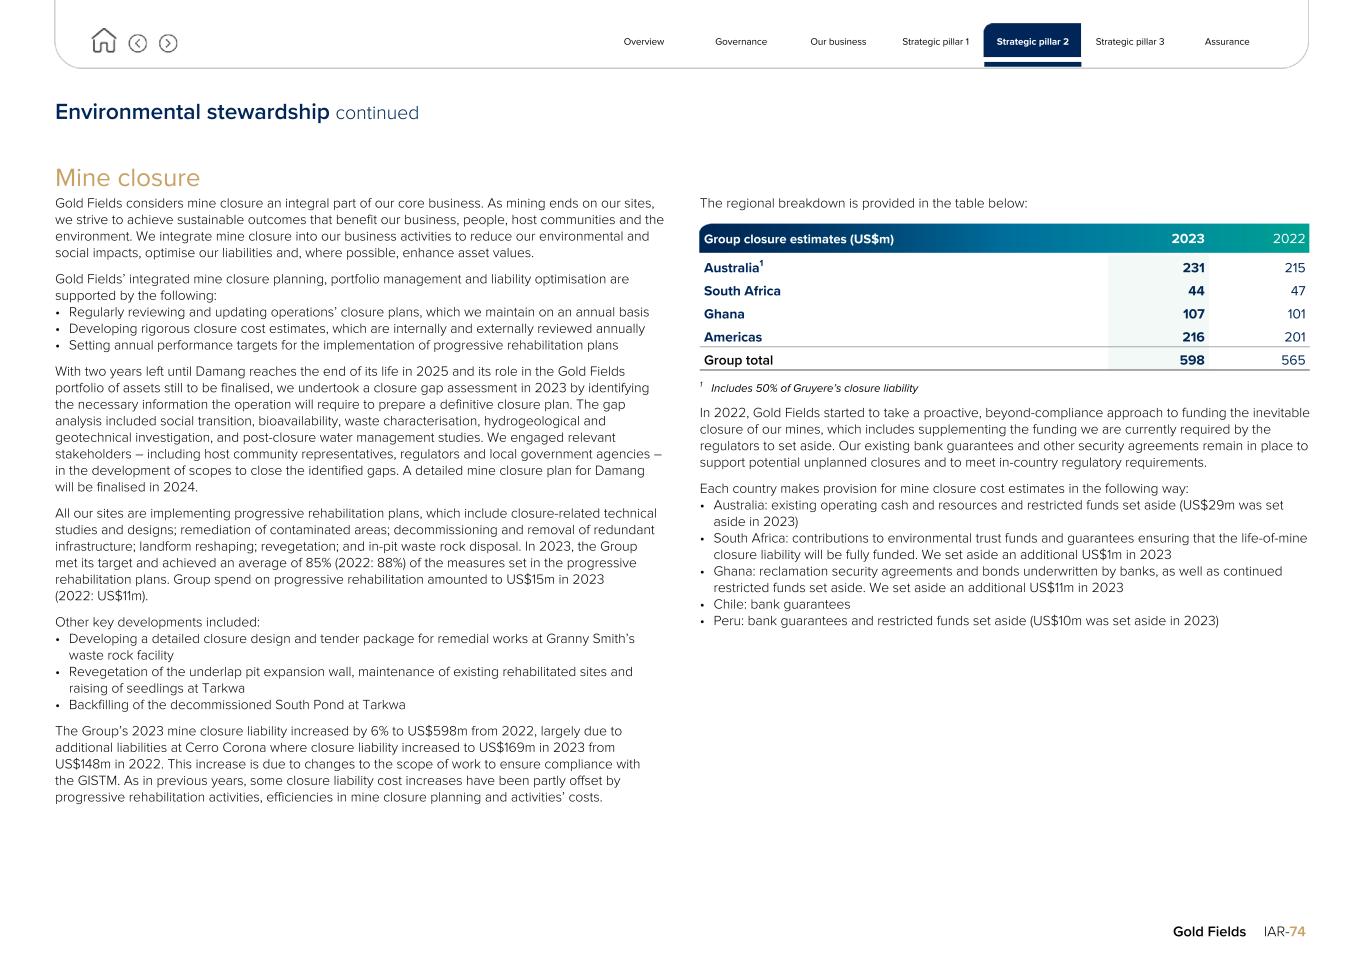
Environmental stewardship continued Mine closure Gold Fields considers mine closure an integral part of our core business. As mining ends on our sites, we strive to achieve sustainable outcomes that benefit our business, people, host communities and the environment. We integrate mine closure into our business activities to reduce our environmental and social impacts, optimise our liabilities and, where possible, enhance asset values. Gold Fields’ integrated mine closure planning, portfolio management and liability optimisation are supported by the following: • Regularly reviewing and updating operations’ closure plans, which we maintain on an annual basis • Developing rigorous closure cost estimates, which are internally and externally reviewed annually • Setting annual performance targets for the implementation of progressive rehabilitation plans With two years left until Damang reaches the end of its life in 2025 and its role in the Gold Fields portfolio of assets still to be finalised, we undertook a closure gap assessment in 2023 by identifying the necessary information the operation will require to prepare a definitive closure plan. The gap analysis included social transition, bioavailability, waste characterisation, hydrogeological and geotechnical investigation, and post-closure water management studies. We engaged relevant stakeholders – including host community representatives, regulators and local government agencies – in the development of scopes to close the identified gaps. A detailed mine closure plan for Damang will be finalised in 2024. All our sites are implementing progressive rehabilitation plans, which include closure-related technical studies and designs; remediation of contaminated areas; decommissioning and removal of redundant infrastructure; landform reshaping; revegetation; and in-pit waste rock disposal. In 2023, the Group met its target and achieved an average of 85% (2022: 88%) of the measures set in the progressive rehabilitation plans. Group spend on progressive rehabilitation amounted to US$15m in 2023 (2022: US$11m). Other key developments included: • Developing a detailed closure design and tender package for remedial works at Granny Smith’s waste rock facility • Revegetation of the underlap pit expansion wall, maintenance of existing rehabilitated sites and raising of seedlings at Tarkwa • Backfilling of the decommissioned South Pond at Tarkwa The Group’s 2023 mine closure liability increased by 6% to US$598m from 2022, largely due to additional liabilities at Cerro Corona where closure liability increased to US$169m in 2023 from US$148m in 2022. This increase is due to changes to the scope of work to ensure compliance with the GISTM. As in previous years, some closure liability cost increases have been partly offset by progressive rehabilitation activities, efficiencies in mine closure planning and activities’ costs. The regional breakdown is provided in the table below: Group closure estimates (US$m) 2023 2022 Australia1 231 215 South Africa 44 47 Ghana 107 101 Americas 216 201 Group total 598 565 1 Includes 50% of Gruyere’s closure liability In 2022, Gold Fields started to take a proactive, beyond-compliance approach to funding the inevitable closure of our mines, which includes supplementing the funding we are currently required by the regulators to set aside. Our existing bank guarantees and other security agreements remain in place to support potential unplanned closures and to meet in-country regulatory requirements. Each country makes provision for mine closure cost estimates in the following way: • Australia: existing operating cash and resources and restricted funds set aside (US$29m was set aside in 2023) • South Africa: contributions to environmental trust funds and guarantees ensuring that the life-of-mine closure liability will be fully funded. We set aside an additional US$1m in 2023 • Ghana: reclamation security agreements and bonds underwritten by banks, as well as continued restricted funds set aside. We set aside an additional US$11m in 2023 • Chile: bank guarantees • Peru: bank guarantees and restricted funds set aside (US$10m was set aside in 2023) Overview Governance Our business Strategic pillar 1 Strategic pillar 2 Strategic pillar 3 Assurance Gold Fields IAR-74
Environmental stewardship continued Tailings management All Gold Fields-managed operations have tailings management plans in place that promote continuous risk reduction and mitigation over the lifecycle of each TSF, which are also operated and managed in accordance with the Group’s TSF Management Standard and Framework. In addition, we manage and maintain critical controls and performance objectives to ensure TSF embankments remain stable over the life of these facilities. We are also developing Water Storage Facility and Stormwater Management Infrastructure Design guidelines, as well as a TSF-specific Risk Management Guideline. Our 2030 ESG targets relating to TSF management are twofold: reduce the number of active upstream-raised TSFs from five to three and ensure we conform with the GISTM. During the year, we reduced the number of active upstream-raised TSFs to four and are on track to achieving our goal of three by 2030. As at end-2023, our 11 operations (including our two non-managed JVs, Asanko in Ghana and Far Southeast in the Philippines) have 38 TSFs, of which 11 are active. Of the active TSFs, two are in-pit TSFs – at Agnew and St Ives – five are downstream/centre-line TSFs, and four are upstream-raised TSFs. In addition, one TSF is under construction – a new filtered stack at Salares Norte. Over the past two years, we converted one of Tarkwa’s TSFs from an upstream-raised facility to a downstream-raised facility. All future raises will be downstream. A second TSF at Tarkwa is also in the process of being converted, with an expected completion date of Q4 2025. Our Australian and South African mines are located in relatively dry regions, and the TSFs are operated with minimal supernatant water ponds. In Ghana, TSFs at Tarkwa and Damang are designed to withstand exceptionally high seasonal rainfalls. In contrast, Salares Norte’s TSF is a filtered stack located in an arid/desert environment, and will be commissioned in H1 2024 soon after the mine starts operating in April 2024. A detailed profile of Gold Fields’ TSFs can be found on our website at www.goldfields.com/environment-tsf.php Global Industry Standard on Tailings Management In August 2022, the ICMM launched the GISTM as part of its vision to improve sustainable development in the mining and metals industry. The GISTM provides a new, international best practice for governance, engineering, environmental and social aspects of tailings management and emphasises the importance of proper and meaningful engagement with affected stakeholders throughout the lifecycle of the tailings facility. Member companies had until August 2023 to ensure TSFs classified as having “extreme” or “very high” potential consequences conform with the GISTM, and August 2025 for all other TSFs. The GISTM framework comprises six key topics to assist companies in achieving and maintaining safe and stable TSFs throughout their lifecycle, including the design, operation, closure and post-closure. Our Cerro Corona TSF has an “extreme” consequence category rating, and Tarkwa’s TSFs 1, 2 and 3 are "very high” consequence classification facilities. Consequently, the teams at Cerro Corona and Tarkwa spent the last three years working diligently to conform with the GISTM requirements. As part of this, we had to complete and provide evidence for over 220 physical deliverables and documents per TSF. It is important to note that all significant dam safety and environmental-related requirements were identified, addressed and effectively managed. Gold Fields identified areas for further improvement, particularly in community engagement and consultation and addressing human rights risks with respect to emergency response and preparedness. These gaps will be addressed over the next 18 to 24 months. The 2024 GISTM disclosure reports for both Cerro Corona and Tarkwa are available on our website. The disclosure documents have been prepared in accordance with the requirements of Principle 15 of the GISTM. Work is underway to conduct self-assessments for the lower consequence classification facilities at our other mines, due for GISTM conformance by August 2025. For Tarkwa’s GISTM Annual Disclosure Report, refer to https://www.goldfields.com/pdf/sustainbility/ sustainability-reporting/gistm/tarkwa-gistm-disclosure-report-2023.pdf and, for Cerro Corona, refer to https://www.goldfields.com/pdf/sustainbility/sustainability-reporting/gistm/cerro-corona-2023-disclosure- report-2023.pdf. Future GISTM disclosures will be made in March each year as part of our annual reporting. In January 2023, on the fourth anniversary of the Brumadinho Tailings dam disaster, the United Nations Environment Programme and investors representing the Principles for Responsible Investment announced the formation of the Global Tailings Management Institute (GTMI), which will drive and implement mining industry safety standards related to TSFs. The GTMI will be central to the independent auditing required of companies to ensure they conform with the GISTM. Overview Governance Our business Strategic pillar 1 Strategic pillar 2 Strategic pillar 3 Assurance Gold Fields IAR-75
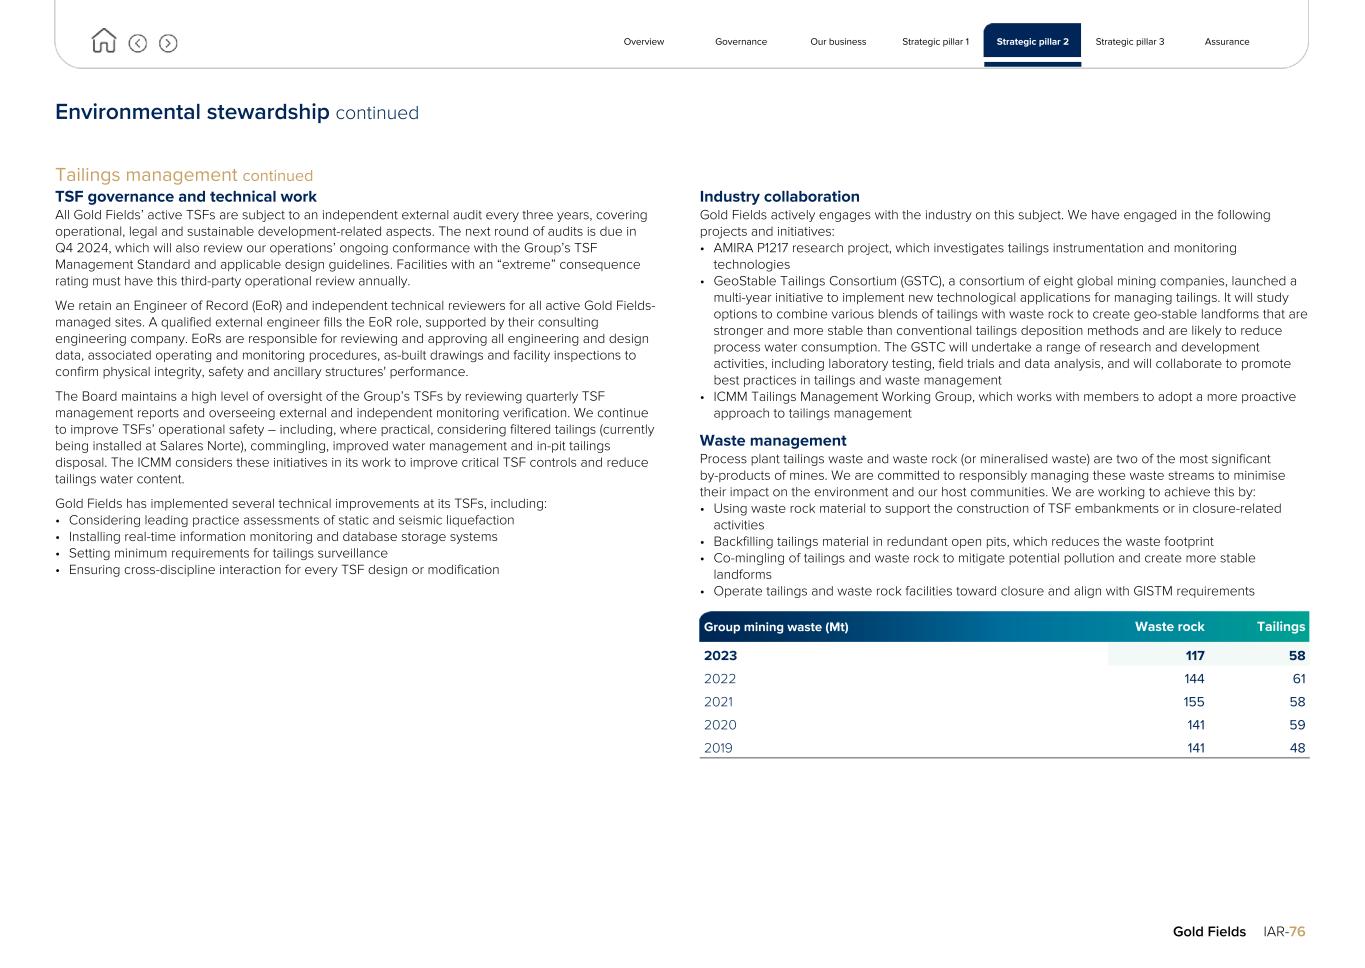
Environmental stewardship continued Tailings management continued TSF governance and technical work All Gold Fields’ active TSFs are subject to an independent external audit every three years, covering operational, legal and sustainable development-related aspects. The next round of audits is due in Q4 2024, which will also review our operations’ ongoing conformance with the Group’s TSF Management Standard and applicable design guidelines. Facilities with an “extreme” consequence rating must have this third-party operational review annually. We retain an Engineer of Record (EoR) and independent technical reviewers for all active Gold Fields- managed sites. A qualified external engineer fills the EoR role, supported by their consulting engineering company. EoRs are responsible for reviewing and approving all engineering and design data, associated operating and monitoring procedures, as-built drawings and facility inspections to confirm physical integrity, safety and ancillary structures' performance. The Board maintains a high level of oversight of the Group’s TSFs by reviewing quarterly TSF management reports and overseeing external and independent monitoring verification. We continue to improve TSFs’ operational safety – including, where practical, considering filtered tailings (currently being installed at Salares Norte), commingling, improved water management and in-pit tailings disposal. The ICMM considers these initiatives in its work to improve critical TSF controls and reduce tailings water content. Gold Fields has implemented several technical improvements at its TSFs, including: • Considering leading practice assessments of static and seismic liquefaction • Installing real-time information monitoring and database storage systems • Setting minimum requirements for tailings surveillance • Ensuring cross-discipline interaction for every TSF design or modification Industry collaboration Gold Fields actively engages with the industry on this subject. We have engaged in the following projects and initiatives: • AMIRA P1217 research project, which investigates tailings instrumentation and monitoring technologies • GeoStable Tailings Consortium (GSTC), a consortium of eight global mining companies, launched a multi-year initiative to implement new technological applications for managing tailings. It will study options to combine various blends of tailings with waste rock to create geo-stable landforms that are stronger and more stable than conventional tailings deposition methods and are likely to reduce process water consumption. The GSTC will undertake a range of research and development activities, including laboratory testing, field trials and data analysis, and will collaborate to promote best practices in tailings and waste management • ICMM Tailings Management Working Group, which works with members to adopt a more proactive approach to tailings management Waste management Process plant tailings waste and waste rock (or mineralised waste) are two of the most significant by-products of mines. We are committed to responsibly managing these waste streams to minimise their impact on the environment and our host communities. We are working to achieve this by: • Using waste rock material to support the construction of TSF embankments or in closure-related activities • Backfilling tailings material in redundant open pits, which reduces the waste footprint • Co-mingling of tailings and waste rock to mitigate potential pollution and create more stable landforms • Operate tailings and waste rock facilities toward closure and align with GISTM requirements Group mining waste (Mt) Waste rock Tailings 2023 117 58 2022 144 61 2021 155 58 2020 141 59 2019 141 48 Overview Governance Our business Strategic pillar 1 Strategic pillar 2 Strategic pillar 3 Assurance Gold Fields IAR-76
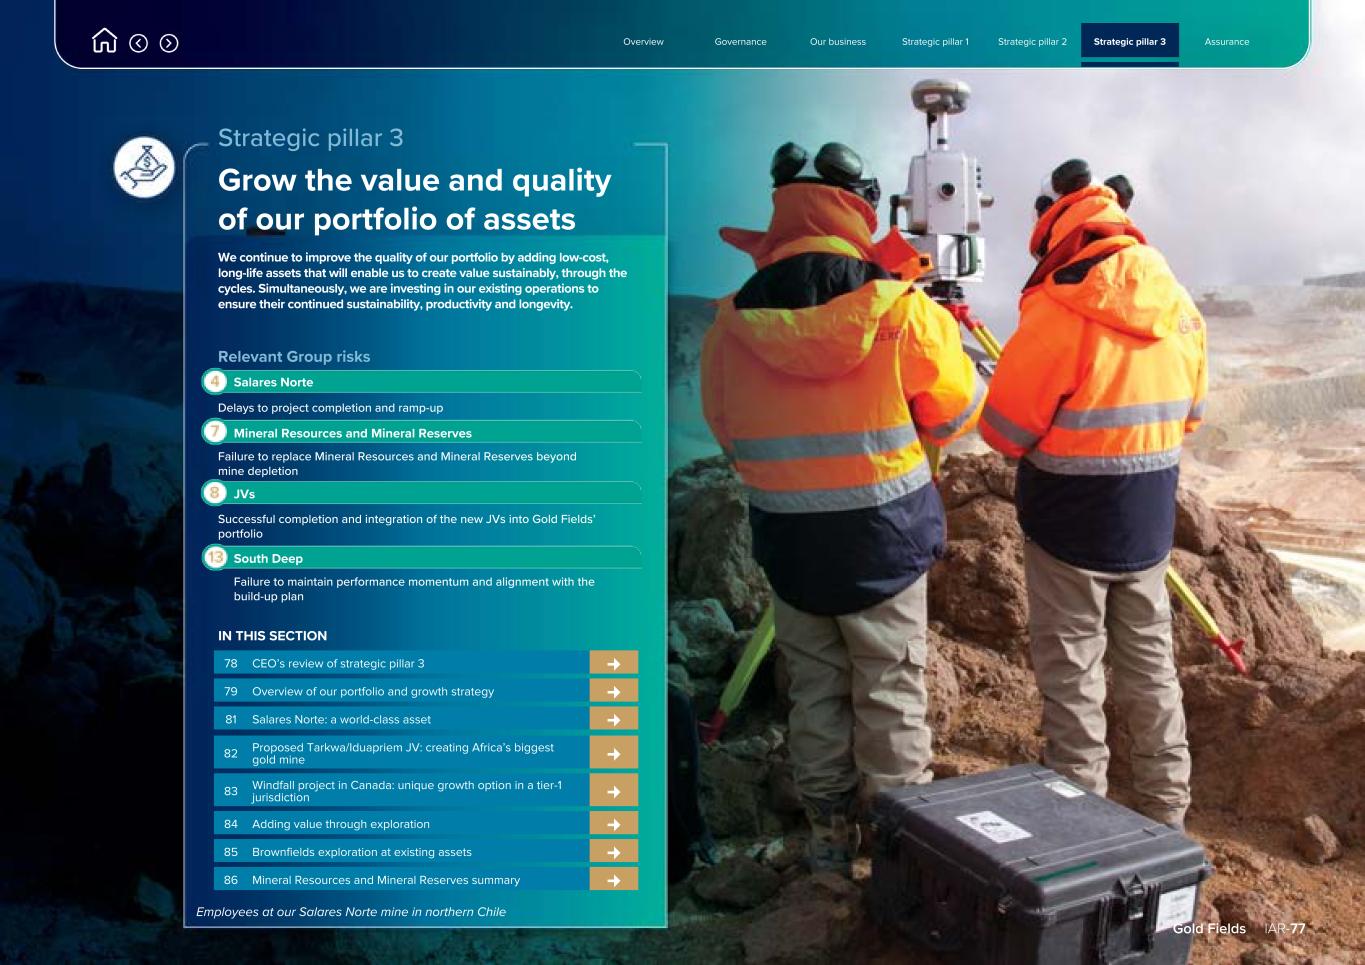
Overview Governance Our business Strategic pillar 1 Strategic pillar 2 Strategic pillar 3 Assurance Gold Fields IAR-77 Strategic pillar 3 Grow the value and quality of our portfolio of assets We continue to improve the quality of our portfolio by adding low-cost, long-life assets that will enable us to create value sustainably, through the cycles. Simultaneously, we are investing in our existing operations to ensure their continued sustainability, productivity and longevity. Relevant Group risks Salares Norte Delays to project completion and ramp-up Mineral Resources and Mineral Reserves Failure to replace Mineral Resources and Mineral Reserves beyond mine depletion JVs Successful completion and integration of the new JVs into Gold Fields’ portfolio South Deep Failure to maintain performance momentum and alignment with the build-up plan IN THIS SECTION 78 CEO’s review of strategic pillar 3 ¢ 79 Overview of our portfolio and growth strategy ¢ 81 Salares Norte: a world-class asset ¢ 82 Proposed Tarkwa/Iduapriem JV: creating Africa’s biggest gold mine ¢ 83 Windfall project in Canada: unique growth option in a tier-1 jurisdiction ¢ 84 Adding value through exploration ¢ 85 Brownfields exploration at existing assets ¢ 86 Mineral Resources and Mineral Reserves summary ¢ Employees at our Salares Norte mine in northern Chile
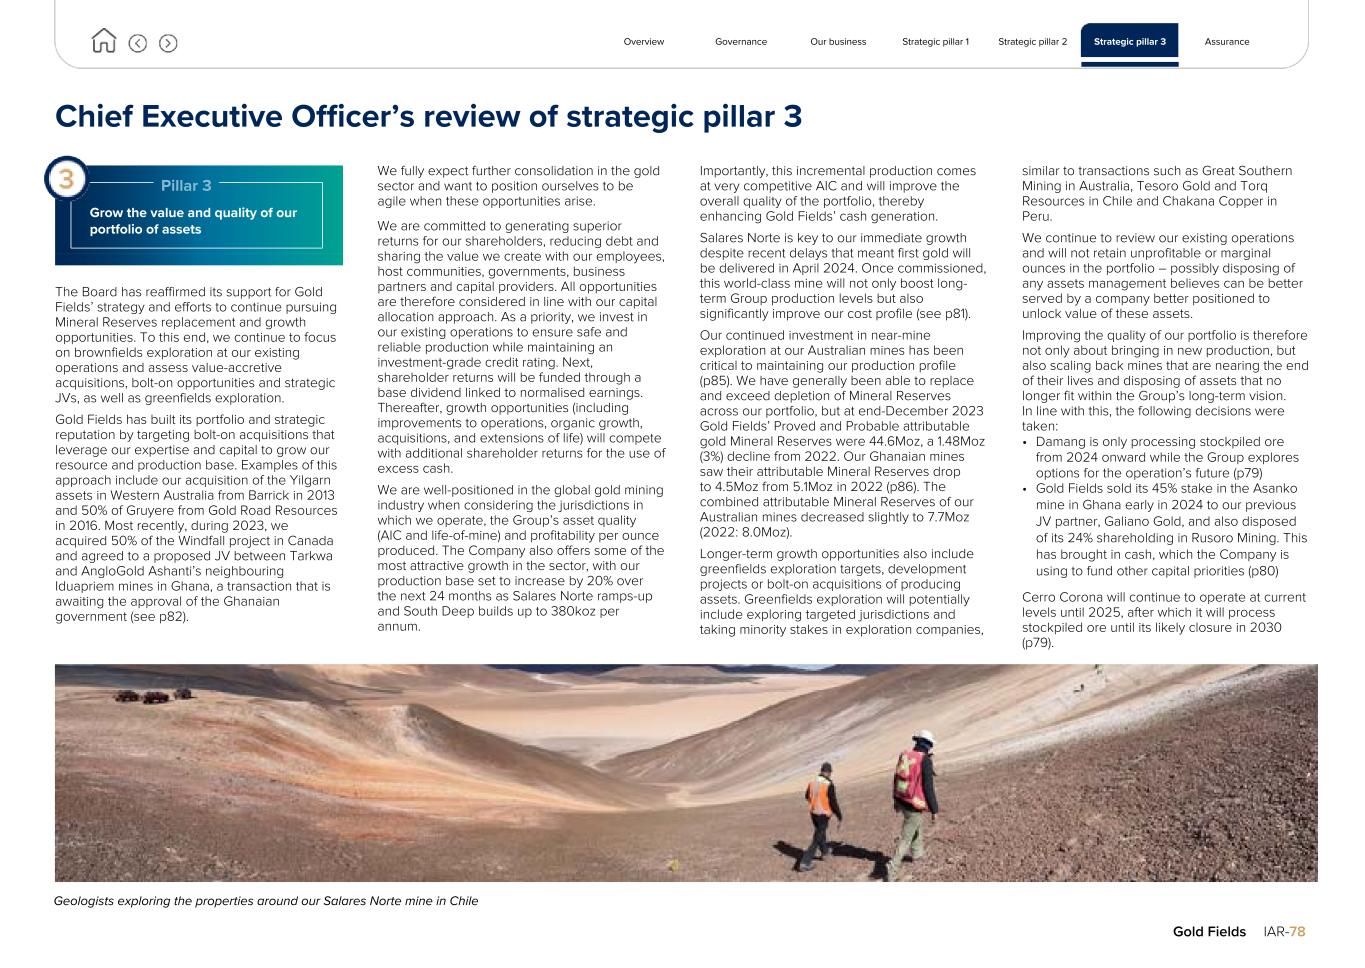
Chief Executive Officer’s review of strategic pillar 3 Pillar 3 Grow the value and quality of our portfolio of assets The Board has reaffirmed its support for Gold Fields’ strategy and efforts to continue pursuing Mineral Reserves replacement and growth opportunities. To this end, we continue to focus on brownfields exploration at our existing operations and assess value-accretive acquisitions, bolt-on opportunities and strategic JVs, as well as greenfields exploration. Gold Fields has built its portfolio and strategic reputation by targeting bolt-on acquisitions that leverage our expertise and capital to grow our resource and production base. Examples of this approach include our acquisition of the Yilgarn assets in Western Australia from Barrick in 2013 and 50% of Gruyere from Gold Road Resources in 2016. Most recently, during 2023, we acquired 50% of the Windfall project in Canada and agreed to a proposed JV between Tarkwa and AngloGold Ashanti’s neighbouring Iduapriem mines in Ghana, a transaction that is awaiting the approval of the Ghanaian government (see p82). We fully expect further consolidation in the gold sector and want to position ourselves to be agile when these opportunities arise. We are committed to generating superior returns for our shareholders, reducing debt and sharing the value we create with our employees, host communities, governments, business partners and capital providers. All opportunities are therefore considered in line with our capital allocation approach. As a priority, we invest in our existing operations to ensure safe and reliable production while maintaining an investment-grade credit rating. Next, shareholder returns will be funded through a base dividend linked to normalised earnings. Thereafter, growth opportunities (including improvements to operations, organic growth, acquisitions, and extensions of life) will compete with additional shareholder returns for the use of excess cash. We are well-positioned in the global gold mining industry when considering the jurisdictions in which we operate, the Group’s asset quality (AIC and life-of-mine) and profitability per ounce produced. The Company also offers some of the most attractive growth in the sector, with our production base set to increase by 20% over the next 24 months as Salares Norte ramps-up and South Deep builds up to 380koz per annum. Importantly, this incremental production comes at very competitive AIC and will improve the overall quality of the portfolio, thereby enhancing Gold Fields’ cash generation. Salares Norte is key to our immediate growth despite recent delays that meant first gold will be delivered in April 2024. Once commissioned, this world-class mine will not only boost long- term Group production levels but also significantly improve our cost profile (see p81). Our continued investment in near-mine exploration at our Australian mines has been critical to maintaining our production profile (p85). We have generally been able to replace and exceed depletion of Mineral Reserves across our portfolio, but at end-December 2023 Gold Fields’ Proved and Probable attributable gold Mineral Reserves were 44.6Moz, a 1.48Moz (3%) decline from 2022. Our Ghanaian mines saw their attributable Mineral Reserves drop to 4.5Moz from 5.1Moz in 2022 (p86). The combined attributable Mineral Reserves of our Australian mines decreased slightly to 7.7Moz (2022: 8.0Moz). Longer-term growth opportunities also include greenfields exploration targets, development projects or bolt-on acquisitions of producing assets. Greenfields exploration will potentially include exploring targeted jurisdictions and taking minority stakes in exploration companies, similar to transactions such as Great Southern Mining in Australia, Tesoro Gold and Torq Resources in Chile and Chakana Copper in Peru. We continue to review our existing operations and will not retain unprofitable or marginal ounces in the portfolio – possibly disposing of any assets management believes can be better served by a company better positioned to unlock value of these assets. Improving the quality of our portfolio is therefore not only about bringing in new production, but also scaling back mines that are nearing the end of their lives and disposing of assets that no longer fit within the Group’s long-term vision. In line with this, the following decisions were taken: • Damang is only processing stockpiled ore from 2024 onward while the Group explores options for the operation’s future (p79) • Gold Fields sold its 45% stake in the Asanko mine in Ghana early in 2024 to our previous JV partner, Galiano Gold, and also disposed of its 24% shareholding in Rusoro Mining. This has brought in cash, which the Company is using to fund other capital priorities (p80) Cerro Corona will continue to operate at current levels until 2025, after which it will process stockpiled ore until its likely closure in 2030 (p79). Overview Governance Our business Strategic pillar 1 Strategic pillar 2 Strategic pillar 3 Assurance Gold Fields IAR-78 Geologists exploring the properties around our Salares Norte mine in Chile
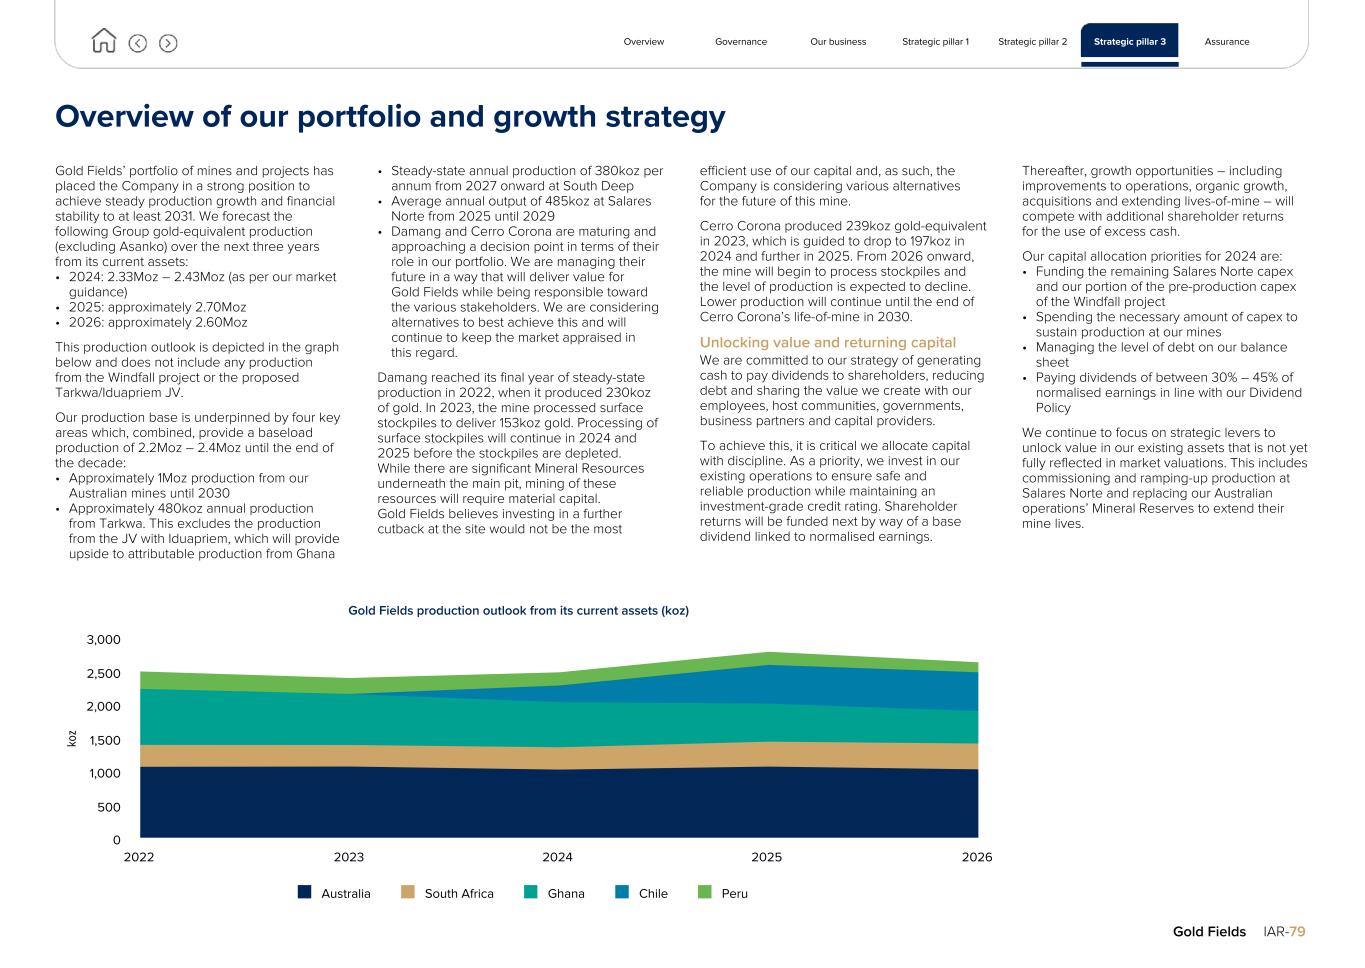
Overview of our portfolio and growth strategy Gold Fields’ portfolio of mines and projects has placed the Company in a strong position to achieve steady production growth and financial stability to at least 2031. We forecast the following Group gold-equivalent production (excluding Asanko) over the next three years from its current assets: • 2024: 2.33Moz – 2.43Moz (as per our market guidance) • 2025: approximately 2.70Moz • 2026: approximately 2.60Moz This production outlook is depicted in the graph below and does not include any production from the Windfall project or the proposed Tarkwa/Iduapriem JV. Our production base is underpinned by four key areas which, combined, provide a baseload production of 2.2Moz – 2.4Moz until the end of the decade: • Approximately 1Moz production from our Australian mines until 2030 • Approximately 480koz annual production from Tarkwa. This excludes the production from the JV with Iduapriem, which will provide upside to attributable production from Ghana • Steady-state annual production of 380koz per annum from 2027 onward at South Deep • Average annual output of 485koz at Salares Norte from 2025 until 2029 • Damang and Cerro Corona are maturing and approaching a decision point in terms of their role in our portfolio. We are managing their future in a way that will deliver value for Gold Fields while being responsible toward the various stakeholders. We are considering alternatives to best achieve this and will continue to keep the market appraised in this regard. Damang reached its final year of steady-state production in 2022, when it produced 230koz of gold. In 2023, the mine processed surface stockpiles to deliver 153koz gold. Processing of surface stockpiles will continue in 2024 and 2025 before the stockpiles are depleted. While there are significant Mineral Resources underneath the main pit, mining of these resources will require material capital. Gold Fields believes investing in a further cutback at the site would not be the most efficient use of our capital and, as such, the Company is considering various alternatives for the future of this mine. Cerro Corona produced 239koz gold-equivalent in 2023, which is guided to drop to 197koz in 2024 and further in 2025. From 2026 onward, the mine will begin to process stockpiles and the level of production is expected to decline. Lower production will continue until the end of Cerro Corona’s life-of-mine in 2030. Unlocking value and returning capital We are committed to our strategy of generating cash to pay dividends to shareholders, reducing debt and sharing the value we create with our employees, host communities, governments, business partners and capital providers. To achieve this, it is critical we allocate capital with discipline. As a priority, we invest in our existing operations to ensure safe and reliable production while maintaining an investment-grade credit rating. Shareholder returns will be funded next by way of a base dividend linked to normalised earnings. Thereafter, growth opportunities – including improvements to operations, organic growth, acquisitions and extending lives-of-mine – will compete with additional shareholder returns for the use of excess cash. Our capital allocation priorities for 2024 are: • Funding the remaining Salares Norte capex and our portion of the pre-production capex of the Windfall project • Spending the necessary amount of capex to sustain production at our mines • Managing the level of debt on our balance sheet • Paying dividends of between 30% – 45% of normalised earnings in line with our Dividend Policy We continue to focus on strategic levers to unlock value in our existing assets that is not yet fully reflected in market valuations. This includes commissioning and ramping-up production at Salares Norte and replacing our Australian operations’ Mineral Reserves to extend their mine lives. ko z Gold Fields production outlook from its current assets (koz) Australia South Africa Ghana Chile Peru 2022 2023 2024 2025 2026 0 500 1,000 1,500 2,000 2,500 3,000 Overview Governance Our business Strategic pillar 1 Strategic pillar 2 Strategic pillar 3 Assurance Gold Fields IAR-79
Overview of our portfolio and growth strategy continued Improving our portfolio’s jurisdictional and asset quality In addition to the quality of individual assets, the jurisdictions in which our mines are located are an important part of our decision-making process. This approach has served the business well and we continue to be selective about the jurisdictions we consider when assessing our strategic options for the Group’s future. We remain targeted with the countries in which we choose to deploy capital. South Deep accounts for over 60% of our Mineral Reserves base (28.2Moz at end-December 2023). Our strategy over the past decade has targeted continued geographical diversification beyond South Africa. At year-end, approximately 36% of our Proven and Probable gold Mineral Reserves were outside of South Africa, with 7.7Moz in Australia, 4.5Moz in Ghana, 0.8Moz in Peru and 3.4Moz in Chile. During 2023, Gold Fields executed several strategic initiatives to further diversify our geographic footprint and improve the long-term quality of our production base. These include Salares Norte (p81), the Windfall project in Canada with Osisko Mining (p83) and the proposed JV between Tarkwa and AngloGold Ashanti’s neighbouring Iduapriem mines (p82). Addressing longer-term production sustainability The Group does not focus on the absolute level of production, but rather the quality and, ultimately, cash-flow per ounce of gold we produce. However, gold assets are finite by nature and it is therefore necessary to continue investing in the portfolio while looking at external growth opportunities. In addition to our focus on near-mine (brownfields) and district exploration, when assessing our strategic options, we consider development projects, bolt-on acquisitions of producing assets and greenfields exploration. During 2023, we invested US$102m in brownfields exploration (of which 55% was at our Australian mines) to extend the life of our current asset base, capitalise on in-country opportunities, and leverage our existing footprint, infrastructure and skills. For more details, see p85. Recently, we also enhanced our focus on greenfields exploration and allocated additional budget toward these activities. Our greenfields exploration strategy is targeted across specific jurisdictions and often involves acquiring minority stakes in exploration companies (for details, see p84). Disposal of assets Improving the quality of our portfolio is not only about bringing in new production, but also disposing of assets that no longer fit within the Group’s long-term vision. In December 2023, we announced the divestment of our 45% shareholding in Asanko to Galiano Gold for a total consideration of US$170m. The transaction closed in March 2024 and Gold Fields received an upfront payment of US$85m, settled in cash (US$65m) and US$20m in Galiano shares. This increased the Group’s shareholding in Galiano Gold to 19.9%. The outstanding US$85m will be staggered over three future payments. In addition, we will receive a 1% net smelter royalty on future production from the Nkran deposit, the main deposit at the mine, once certain conditions have been met. This is capped at a volume of 447koz. In 2023, Asanko’s production attributable to Gold Fields was 60koz (2022: 77koz). After year-end, we announced the sale of our 24% equity holding in Rusoro Mining for an initial amount of US$62.3m to Fulcrum Global Markets. The sale provided good value for a holding that had a zero carrying value since 2010. Gold Fields’ shareholding in Rusoro were as a result of the divestment of the Company’s interest in the Choco 10 gold mine in Venezuela to Rusoro in 2007 for C$210m (US$156m) in the form of, among others, Rusoro shares. The Venezuelan government nationalised the gold industry – including Rusoro’s assets – in 2011 and, since then, the value of the Rusoro shares has been only nominal. Since early 2022, Gold Fields has sought to sell its 40% stake in Far Southeast Gold Resources, which manages the Far Southeast (FSE) project in the Philippines. Lepanto Consolidated Mining Company (Lepanto) in the Philippines holds the remaining 60% interest, as well as the mining rights, and manages the existing mining operation adjacent to FSE. The carrying value we attribute to FSE has been written down from US$114m at the end of 2021 to zero. In 2015, Lepanto, the owner of the underlying mineral rights including the FSE property, was unable to renew its 25-yearly mining licence when the Philippine government ruled Free Prior and Informed Consent (FPIC) was required for the renewal. This requirement was overturned during independent arbitration and, in 2018, by the country’s Court of Appeals. In 2019, the government appealed this ruling in the Supreme Court. In December 2022, the Supreme Court ruled that FPIC was required and, in January 2023, Lepanto and Far Southeast Gold Resources filed a motion for reconsideration of the decision. The motion was denied by the Supreme Court, and Lepanto and Far Southeast Gold Resources are currently undertaking the FPIC process. Gold Fields’ monthly holding costs in FSE are approximately US$0.16m. Overview Governance Our business Strategic pillar 1 Strategic pillar 2 Strategic pillar 3 Assurance Gold Fields IAR-80
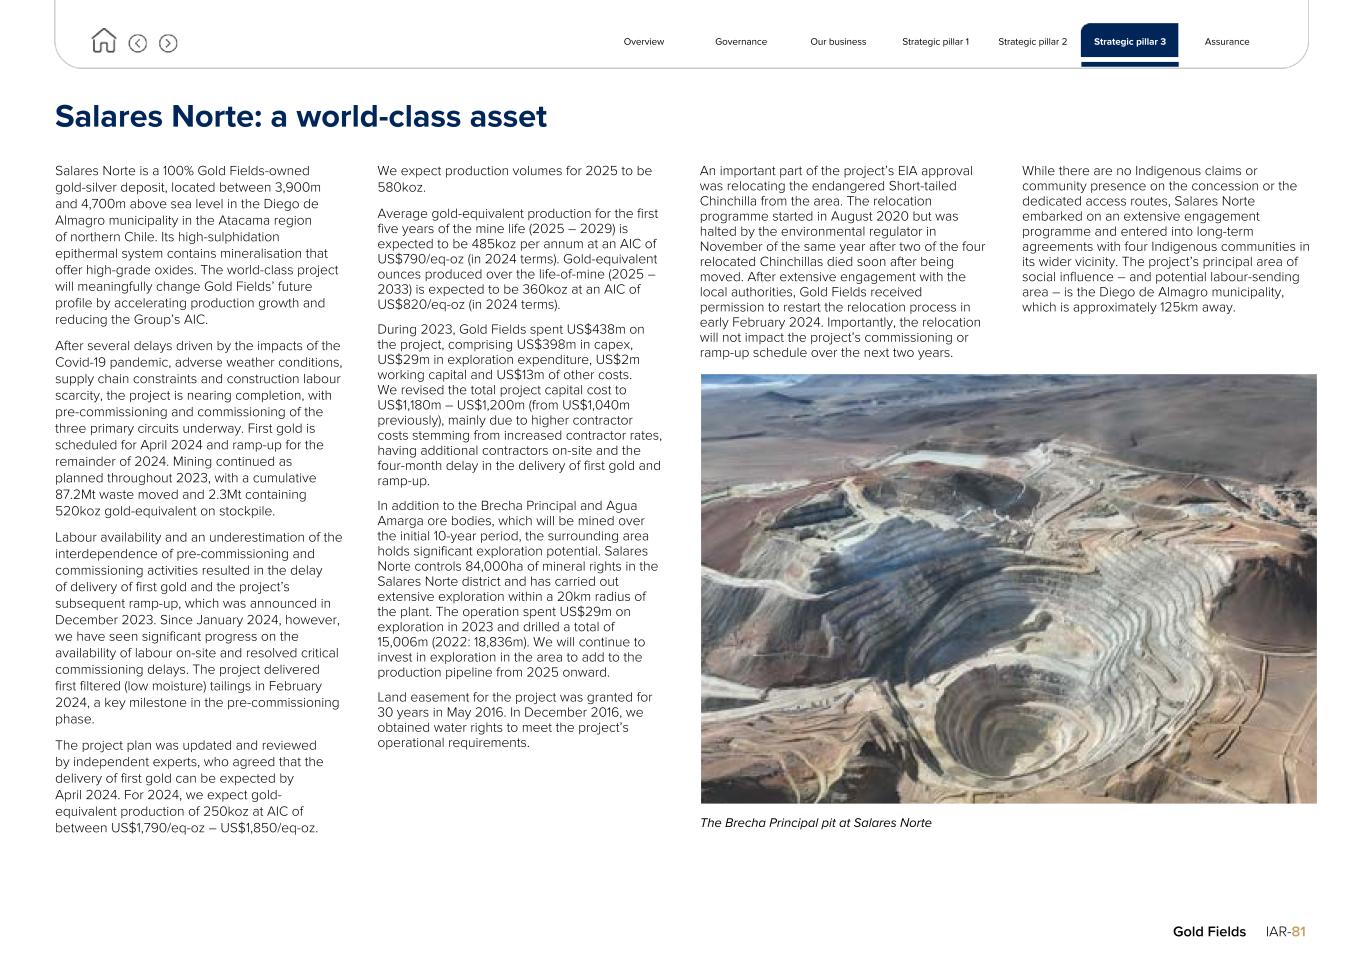
Salares Norte: a world-class asset Salares Norte is a 100% Gold Fields-owned gold-silver deposit, located between 3,900m and 4,700m above sea level in the Diego de Almagro municipality in the Atacama region of northern Chile. Its high-sulphidation epithermal system contains mineralisation that offer high-grade oxides. The world-class project will meaningfully change Gold Fields’ future profile by accelerating production growth and reducing the Group’s AIC. After several delays driven by the impacts of the Covid-19 pandemic, adverse weather conditions, supply chain constraints and construction labour scarcity, the project is nearing completion, with pre-commissioning and commissioning of the three primary circuits underway. First gold is scheduled for April 2024 and ramp-up for the remainder of 2024. Mining continued as planned throughout 2023, with a cumulative 87.2Mt waste moved and 2.3Mt containing 520koz gold-equivalent on stockpile. Labour availability and an underestimation of the interdependence of pre-commissioning and commissioning activities resulted in the delay of delivery of first gold and the project’s subsequent ramp-up, which was announced in December 2023. Since January 2024, however, we have seen significant progress on the availability of labour on-site and resolved critical commissioning delays. The project delivered first filtered (low moisture) tailings in February 2024, a key milestone in the pre-commissioning phase. The project plan was updated and reviewed by independent experts, who agreed that the delivery of first gold can be expected by April 2024. For 2024, we expect gold- equivalent production of 250koz at AIC of between US$1,790/eq-oz – US$1,850/eq-oz. We expect production volumes for 2025 to be 580koz. Average gold-equivalent production for the first five years of the mine life (2025 – 2029) is expected to be 485koz per annum at an AIC of US$790/eq-oz (in 2024 terms). Gold-equivalent ounces produced over the life-of-mine (2025 – 2033) is expected to be 360koz at an AIC of US$820/eq-oz (in 2024 terms). During 2023, Gold Fields spent US$438m on the project, comprising US$398m in capex, US$29m in exploration expenditure, US$2m working capital and US$13m of other costs. We revised the total project capital cost to US$1,180m – US$1,200m (from US$1,040m previously), mainly due to higher contractor costs stemming from increased contractor rates, having additional contractors on-site and the four-month delay in the delivery of first gold and ramp-up. In addition to the Brecha Principal and Agua Amarga ore bodies, which will be mined over the initial 10-year period, the surrounding area holds significant exploration potential. Salares Norte controls 84,000ha of mineral rights in the Salares Norte district and has carried out extensive exploration within a 20km radius of the plant. The operation spent US$29m on exploration in 2023 and drilled a total of 15,006m (2022: 18,836m). We will continue to invest in exploration in the area to add to the production pipeline from 2025 onward. Land easement for the project was granted for 30 years in May 2016. In December 2016, we obtained water rights to meet the project’s operational requirements. An important part of the project’s EIA approval was relocating the endangered Short-tailed Chinchilla from the area. The relocation programme started in August 2020 but was halted by the environmental regulator in November of the same year after two of the four relocated Chinchillas died soon after being moved. After extensive engagement with the local authorities, Gold Fields received permission to restart the relocation process in early February 2024. Importantly, the relocation will not impact the project’s commissioning or ramp-up schedule over the next two years. While there are no Indigenous claims or community presence on the concession or the dedicated access routes, Salares Norte embarked on an extensive engagement programme and entered into long-term agreements with four Indigenous communities in its wider vicinity. The project’s principal area of social influence – and potential labour-sending area – is the Diego de Almagro municipality, which is approximately 125km away. Overview Governance Our business Strategic pillar 1 Strategic pillar 2 Strategic pillar 3 Assurance Gold Fields IAR-81 The Brecha Principal pit at Salares Norte
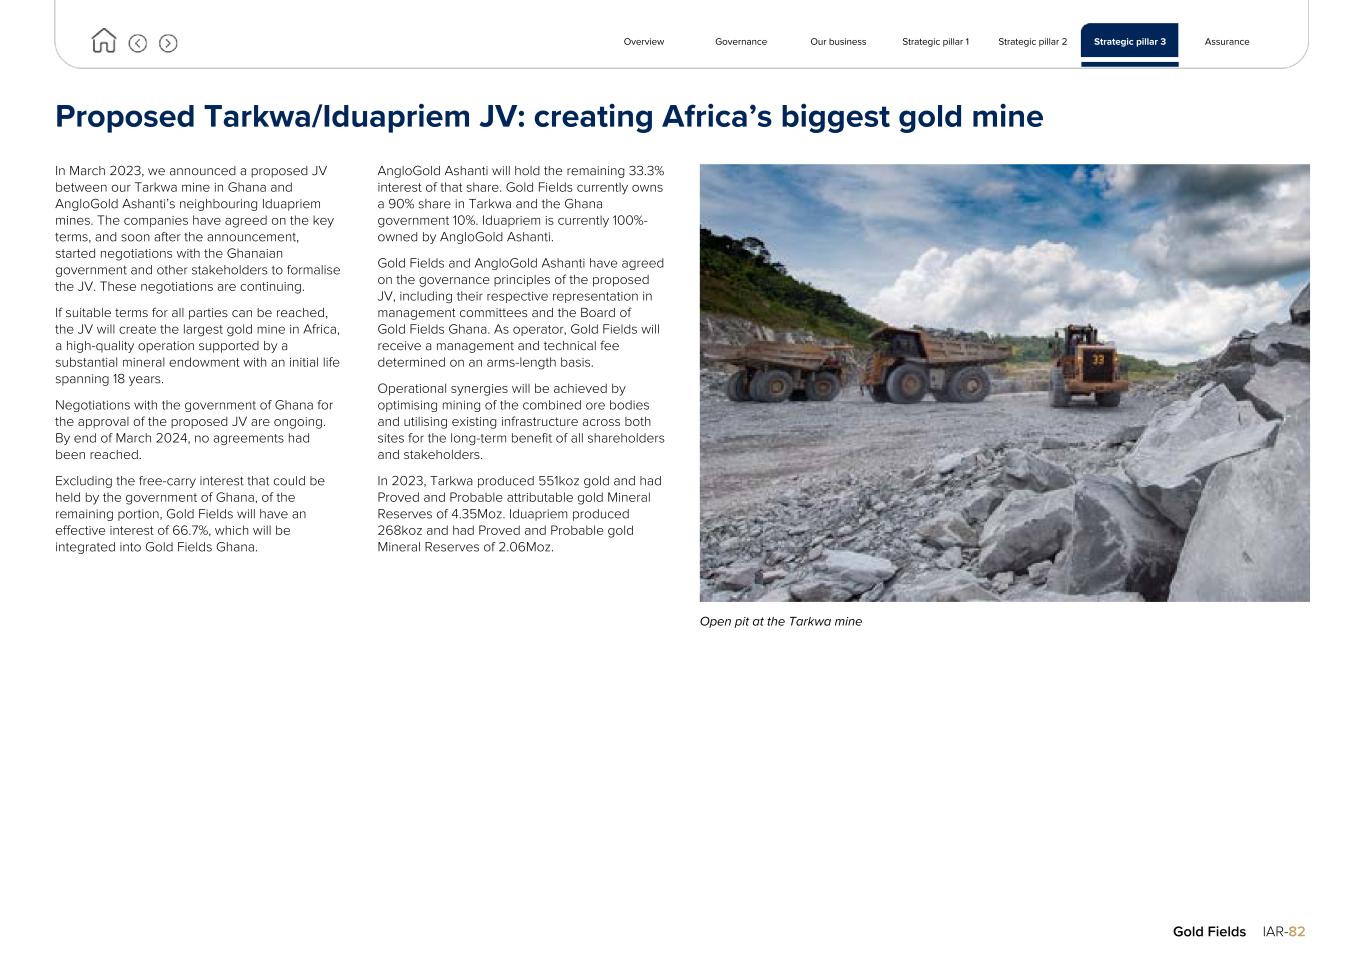
Proposed Tarkwa/Iduapriem JV: creating Africa’s biggest gold mine In March 2023, we announced a proposed JV between our Tarkwa mine in Ghana and AngloGold Ashanti’s neighbouring Iduapriem mines. The companies have agreed on the key terms, and soon after the announcement, started negotiations with the Ghanaian government and other stakeholders to formalise the JV. These negotiations are continuing. If suitable terms for all parties can be reached, the JV will create the largest gold mine in Africa, a high-quality operation supported by a substantial mineral endowment with an initial life spanning 18 years. Negotiations with the government of Ghana for the approval of the proposed JV are ongoing. By end of March 2024, no agreements had been reached. Excluding the free-carry interest that could be held by the government of Ghana, of the remaining portion, Gold Fields will have an effective interest of 66.7%, which will be integrated into Gold Fields Ghana. AngloGold Ashanti will hold the remaining 33.3% interest of that share. Gold Fields currently owns a 90% share in Tarkwa and the Ghana government 10%. Iduapriem is currently 100%- owned by AngloGold Ashanti. Gold Fields and AngloGold Ashanti have agreed on the governance principles of the proposed JV, including their respective representation in management committees and the Board of Gold Fields Ghana. As operator, Gold Fields will receive a management and technical fee determined on an arms-length basis. Operational synergies will be achieved by optimising mining of the combined ore bodies and utilising existing infrastructure across both sites for the long-term benefit of all shareholders and stakeholders. In 2023, Tarkwa produced 551koz gold and had Proved and Probable attributable gold Mineral Reserves of 4.35Moz. Iduapriem produced 268koz and had Proved and Probable gold Mineral Reserves of 2.06Moz. Open pit at the Tarkwa mine Overview Governance Our business Strategic pillar 1 Strategic pillar 2 Strategic pillar 3 Assurance Gold Fields IAR-82
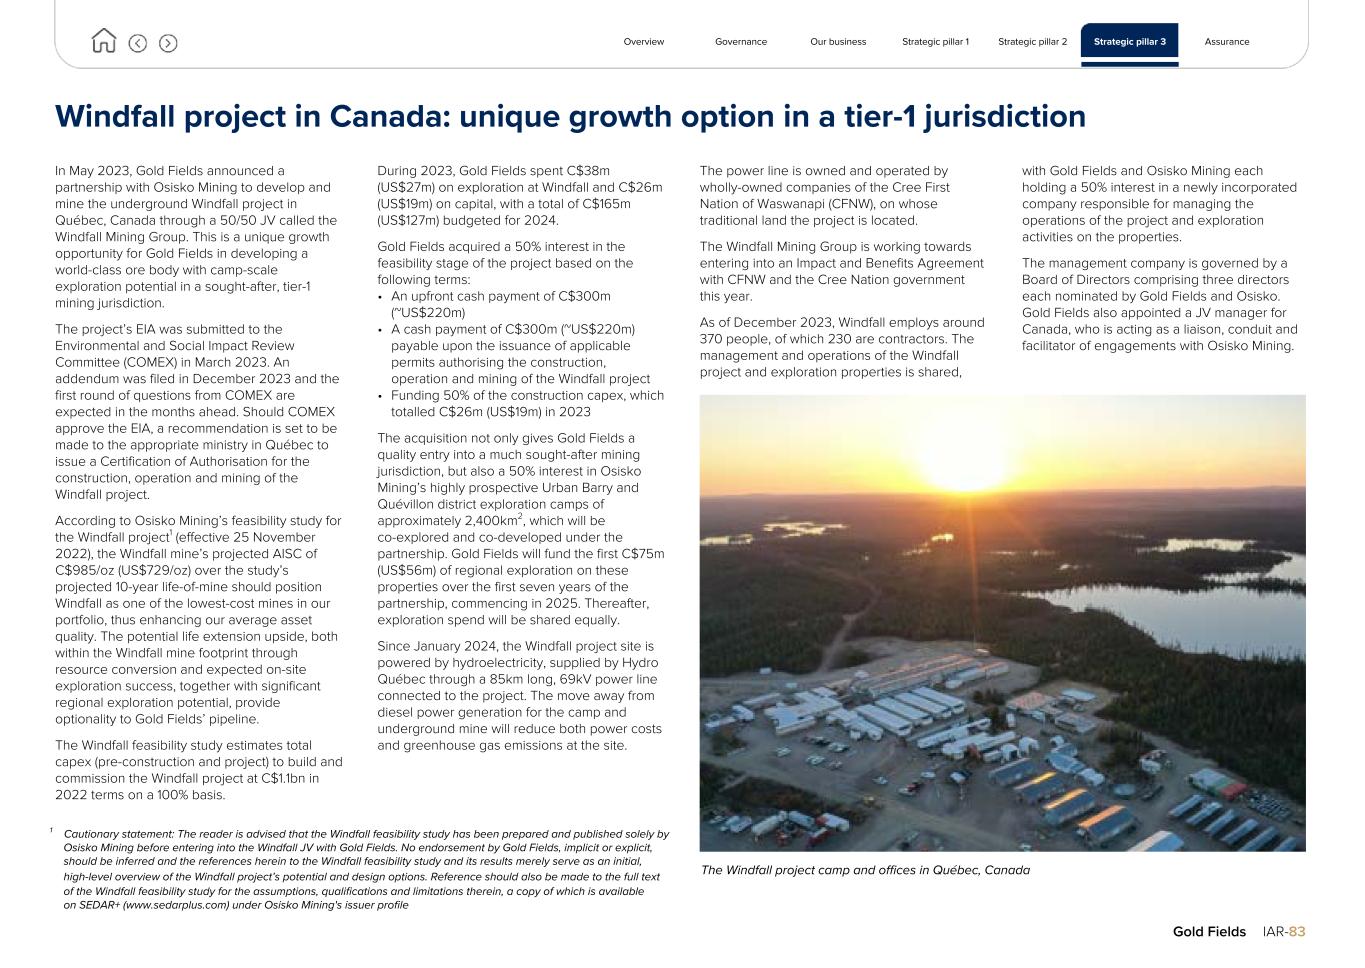
Windfall project in Canada: unique growth option in a tier-1 jurisdiction In May 2023, Gold Fields announced a partnership with Osisko Mining to develop and mine the underground Windfall project in Québec, Canada through a 50/50 JV called the Windfall Mining Group. This is a unique growth opportunity for Gold Fields in developing a world-class ore body with camp-scale exploration potential in a sought-after, tier-1 mining jurisdiction. The project’s EIA was submitted to the Environmental and Social Impact Review Committee (COMEX) in March 2023. An addendum was filed in December 2023 and the first round of questions from COMEX are expected in the months ahead. Should COMEX approve the EIA, a recommendation is set to be made to the appropriate ministry in Québec to issue a Certification of Authorisation for the construction, operation and mining of the Windfall project. According to Osisko Mining’s feasibility study for the Windfall project1 (effective 25 November 2022), the Windfall mine’s projected AISC of C$985/oz (US$729/oz) over the study’s projected 10-year life-of-mine should position Windfall as one of the lowest-cost mines in our portfolio, thus enhancing our average asset quality. The potential life extension upside, both within the Windfall mine footprint through resource conversion and expected on-site exploration success, together with significant regional exploration potential, provide optionality to Gold Fields’ pipeline. The Windfall feasibility study estimates total capex (pre-construction and project) to build and commission the Windfall project at C$1.1bn in 2022 terms on a 100% basis. During 2023, Gold Fields spent C$38m (US$27m) on exploration at Windfall and C$26m (US$19m) on capital, with a total of C$165m (US$127m) budgeted for 2024. Gold Fields acquired a 50% interest in the feasibility stage of the project based on the following terms: • An upfront cash payment of C$300m (~US$220m) • A cash payment of C$300m (~US$220m) payable upon the issuance of applicable permits authorising the construction, operation and mining of the Windfall project • Funding 50% of the construction capex, which totalled C$26m (US$19m) in 2023 The acquisition not only gives Gold Fields a quality entry into a much sought-after mining jurisdiction, but also a 50% interest in Osisko Mining’s highly prospective Urban Barry and Quévillon district exploration camps of approximately 2,400km2, which will be co-explored and co-developed under the partnership. Gold Fields will fund the first C$75m (US$56m) of regional exploration on these properties over the first seven years of the partnership, commencing in 2025. Thereafter, exploration spend will be shared equally. Since January 2024, the Windfall project site is powered by hydroelectricity, supplied by Hydro Québec through a 85km long, 69kV power line connected to the project. The move away from diesel power generation for the camp and underground mine will reduce both power costs and greenhouse gas emissions at the site. The power line is owned and operated by wholly-owned companies of the Cree First Nation of Waswanapi (CFNW), on whose traditional land the project is located. The Windfall Mining Group is working towards entering into an Impact and Benefits Agreement with CFNW and the Cree Nation government this year. As of December 2023, Windfall employs around 370 people, of which 230 are contractors. The management and operations of the Windfall project and exploration properties is shared, with Gold Fields and Osisko Mining each holding a 50% interest in a newly incorporated company responsible for managing the operations of the project and exploration activities on the properties. The management company is governed by a Board of Directors comprising three directors each nominated by Gold Fields and Osisko. Gold Fields also appointed a JV manager for Canada, who is acting as a liaison, conduit and facilitator of engagements with Osisko Mining. Overview Governance Our business Strategic pillar 1 Strategic pillar 2 Strategic pillar 3 Assurance Gold Fields IAR-83 The Windfall project camp and offices in Québec, Canada 1 Cautionary statement: The reader is advised that the Windfall feasibility study has been prepared and published solely by Osisko Mining before entering into the Windfall JV with Gold Fields. No endorsement by Gold Fields, implicit or explicit, should be inferred and the references herein to the Windfall feasibility study and its results merely serve as an initial, high-level overview of the Windfall project’s potential and design options. Reference should also be made to the full text of the Windfall feasibility study for the assumptions, qualifications and limitations therein, a copy of which is available on SEDAR+ (www.sedarplus.com) under Osisko Mining's issuer profile
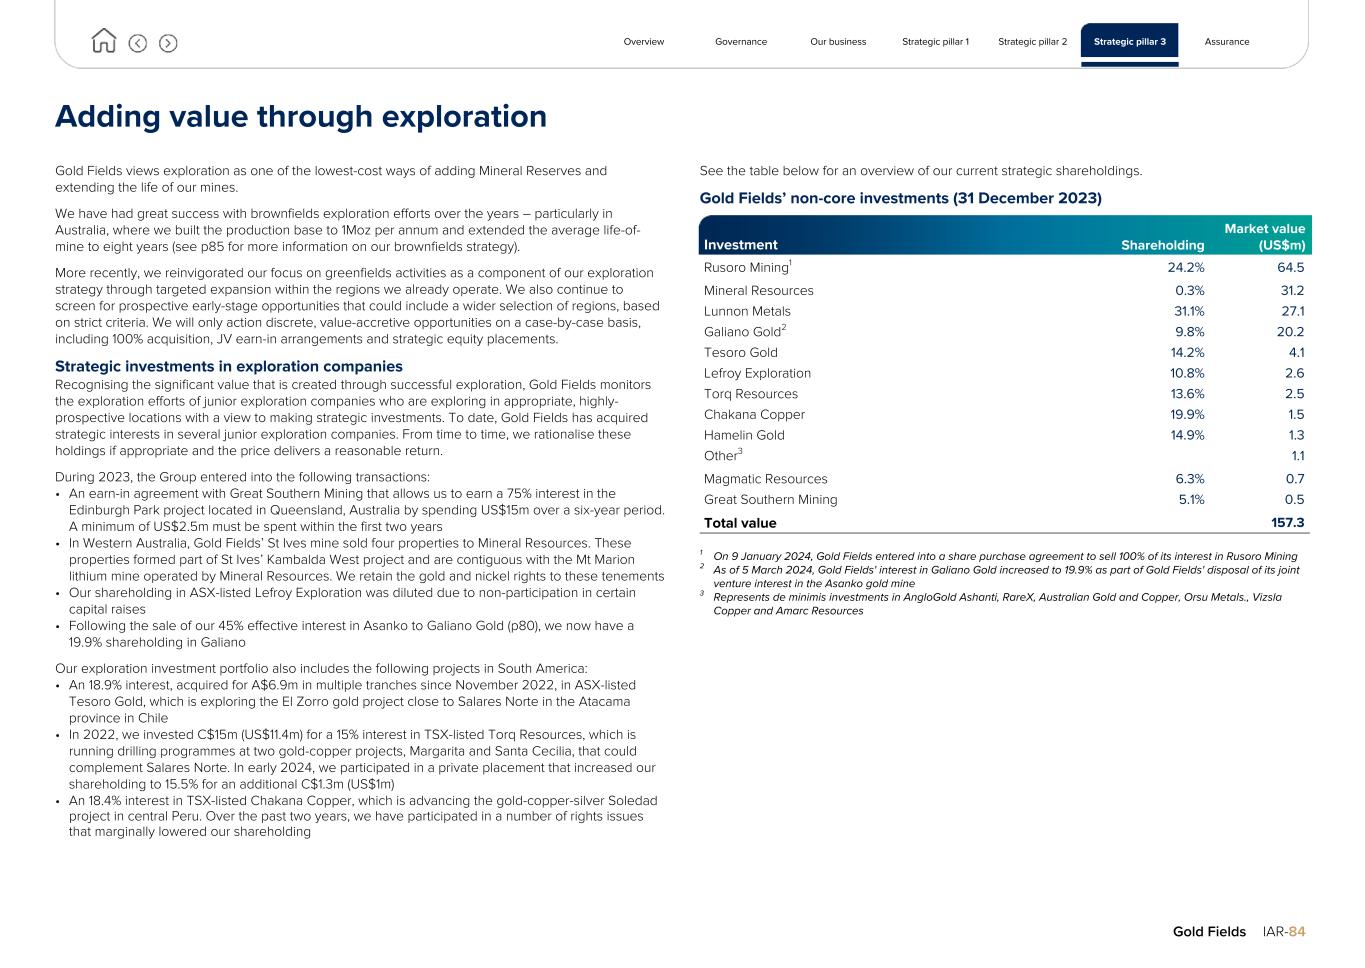
Adding value through exploration Gold Fields views exploration as one of the lowest-cost ways of adding Mineral Reserves and extending the life of our mines. We have had great success with brownfields exploration efforts over the years – particularly in Australia, where we built the production base to 1Moz per annum and extended the average life-of- mine to eight years (see p85 for more information on our brownfields strategy). More recently, we reinvigorated our focus on greenfields activities as a component of our exploration strategy through targeted expansion within the regions we already operate. We also continue to screen for prospective early-stage opportunities that could include a wider selection of regions, based on strict criteria. We will only action discrete, value-accretive opportunities on a case-by-case basis, including 100% acquisition, JV earn-in arrangements and strategic equity placements. Strategic investments in exploration companies Recognising the significant value that is created through successful exploration, Gold Fields monitors the exploration efforts of junior exploration companies who are exploring in appropriate, highly- prospective locations with a view to making strategic investments. To date, Gold Fields has acquired strategic interests in several junior exploration companies. From time to time, we rationalise these holdings if appropriate and the price delivers a reasonable return. During 2023, the Group entered into the following transactions: • An earn-in agreement with Great Southern Mining that allows us to earn a 75% interest in the Edinburgh Park project located in Queensland, Australia by spending US$15m over a six-year period. A minimum of US$2.5m must be spent within the first two years • In Western Australia, Gold Fields’ St Ives mine sold four properties to Mineral Resources. These properties formed part of St Ives’ Kambalda West project and are contiguous with the Mt Marion lithium mine operated by Mineral Resources. We retain the gold and nickel rights to these tenements • Our shareholding in ASX-listed Lefroy Exploration was diluted due to non-participation in certain capital raises • Following the sale of our 45% effective interest in Asanko to Galiano Gold (p80), we now have a 19.9% shareholding in Galiano Our exploration investment portfolio also includes the following projects in South America: • An 18.9% interest, acquired for A$6.9m in multiple tranches since November 2022, in ASX-listed Tesoro Gold, which is exploring the El Zorro gold project close to Salares Norte in the Atacama province in Chile • In 2022, we invested C$15m (US$11.4m) for a 15% interest in TSX-listed Torq Resources, which is running drilling programmes at two gold-copper projects, Margarita and Santa Cecilia, that could complement Salares Norte. In early 2024, we participated in a private placement that increased our shareholding to 15.5% for an additional C$1.3m (US$1m) • An 18.4% interest in TSX-listed Chakana Copper, which is advancing the gold-copper-silver Soledad project in central Peru. Over the past two years, we have participated in a number of rights issues that marginally lowered our shareholding See the table below for an overview of our current strategic shareholdings. Gold Fields’ non-core investments (31 December 2023) Investment Shareholding Market value (US$m) Rusoro Mining1 24.2% 64.5 Mineral Resources 0.3% 31.2 Lunnon Metals 31.1% 27.1 Galiano Gold2 9.8% 20.2 Tesoro Gold 14.2% 4.1 Lefroy Exploration 10.8% 2.6 Torq Resources 13.6% 2.5 Chakana Copper 19.9% 1.5 Hamelin Gold 14.9% 1.3 Other3 1.1 Magmatic Resources 6.3% 0.7 Great Southern Mining 5.1% 0.5 Total value 157.3 1 On 9 January 2024, Gold Fields entered into a share purchase agreement to sell 100% of its interest in Rusoro Mining 2 As of 5 March 2024, Gold Fields' interest in Galiano Gold increased to 19.9% as part of Gold Fields' disposal of its joint venture interest in the Asanko gold mine 3 Represents de minimis investments in AngloGold Ashanti, RareX, Australian Gold and Copper, Orsu Metals., Vizsla Copper and Amarc Resources Overview Governance Our business Strategic pillar 1 Strategic pillar 2 Strategic pillar 3 Assurance Gold Fields IAR-84
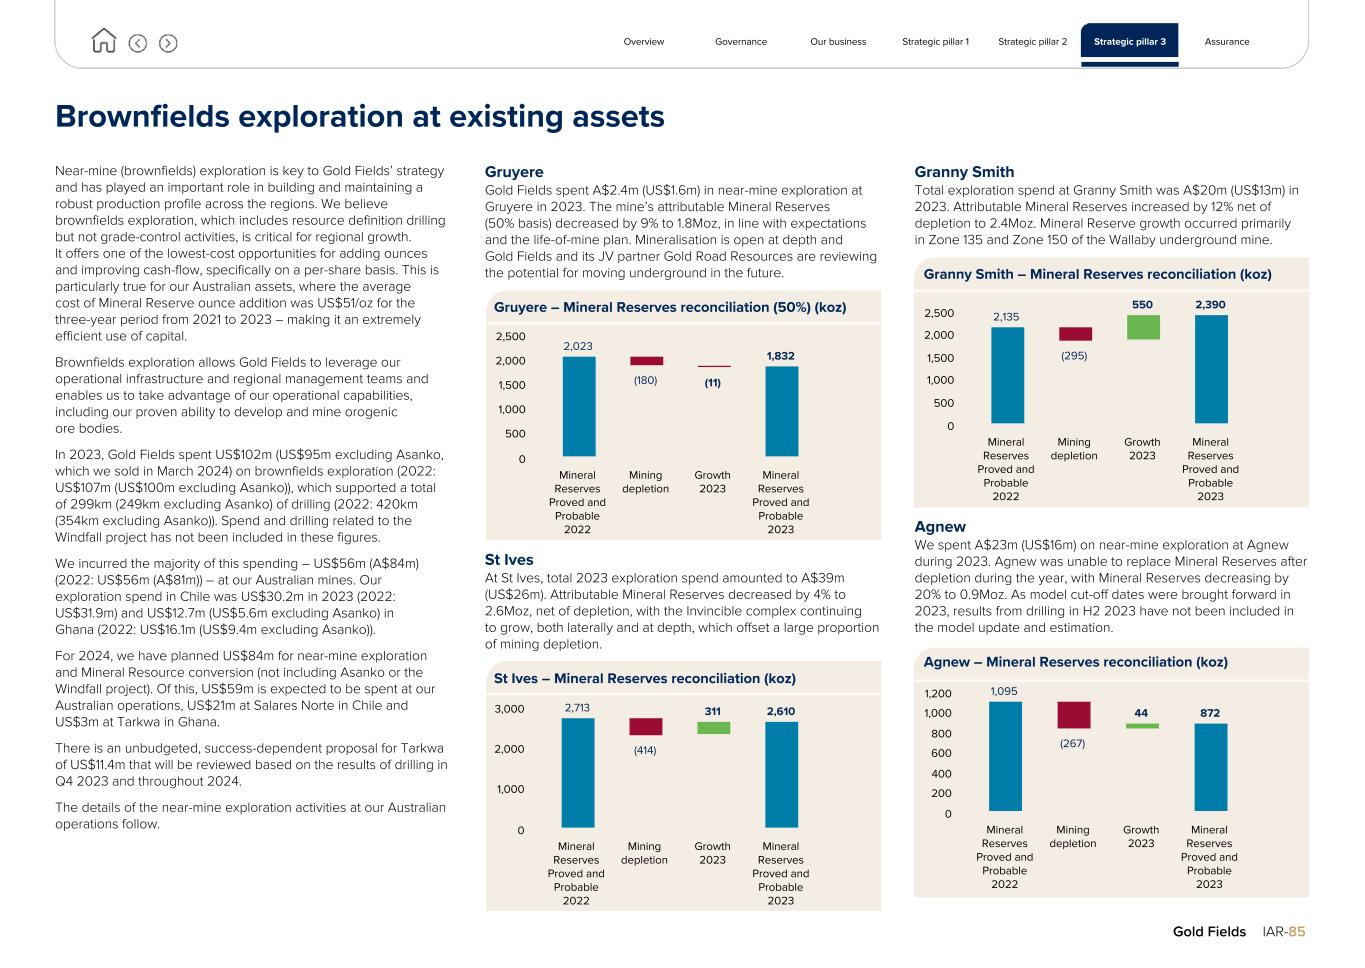
Brownfields exploration at existing assets Near-mine (brownfields) exploration is key to Gold Fields’ strategy and has played an important role in building and maintaining a robust production profile across the regions. We believe brownfields exploration, which includes resource definition drilling but not grade-control activities, is critical for regional growth. It offers one of the lowest-cost opportunities for adding ounces and improving cash-flow, specifically on a per-share basis. This is particularly true for our Australian assets, where the average cost of Mineral Reserve ounce addition was US$51/oz for the three-year period from 2021 to 2023 – making it an extremely efficient use of capital. Brownfields exploration allows Gold Fields to leverage our operational infrastructure and regional management teams and enables us to take advantage of our operational capabilities, including our proven ability to develop and mine orogenic ore bodies. In 2023, Gold Fields spent US$102m (US$95m excluding Asanko, which we sold in March 2024) on brownfields exploration (2022: US$107m (US$100m excluding Asanko)), which supported a total of 299km (249km excluding Asanko) of drilling (2022: 420km (354km excluding Asanko)). Spend and drilling related to the Windfall project has not been included in these figures. We incurred the majority of this spending – US$56m (A$84m) (2022: US$56m (A$81m)) – at our Australian mines. Our exploration spend in Chile was US$30.2m in 2023 (2022: US$31.9m) and US$12.7m (US$5.6m excluding Asanko) in Ghana (2022: US$16.1m (US$9.4m excluding Asanko)). For 2024, we have planned US$84m for near-mine exploration and Mineral Resource conversion (not including Asanko or the Windfall project). Of this, US$59m is expected to be spent at our Australian operations, US$21m at Salares Norte in Chile and US$3m at Tarkwa in Ghana. There is an unbudgeted, success-dependent proposal for Tarkwa of US$11.4m that will be reviewed based on the results of drilling in Q4 2023 and throughout 2024. The details of the near-mine exploration activities at our Australian operations follow. Gruyere Gold Fields spent A$2.4m (US$1.6m) in near-mine exploration at Gruyere in 2023. The mine’s attributable Mineral Reserves (50% basis) decreased by 9% to 1.8Moz, in line with expectations and the life-of-mine plan. Mineralisation is open at depth and Gold Fields and its JV partner Gold Road Resources are reviewing the potential for moving underground in the future. Gruyere – Mineral Reserves reconciliation (50%) (koz) 2,023 (180) (11) 1,832 Mineral Reserves Proved and Probable 2022 Mining depletion Growth 2023 Mineral Reserves Proved and Probable 2023 0 500 1,000 1,500 2,000 2,500 St Ives At St Ives, total 2023 exploration spend amounted to A$39m (US$26m). Attributable Mineral Reserves decreased by 4% to 2.6Moz, net of depletion, with the Invincible complex continuing to grow, both laterally and at depth, which offset a large proportion of mining depletion. St Ives – Mineral Reserves reconciliation (koz) 2,713 (414) 311 2,610 Mineral Reserves Proved and Probable 2022 Mining depletion Growth 2023 Mineral Reserves Proved and Probable 2023 0 1,000 2,000 3,000 Granny Smith Total exploration spend at Granny Smith was A$20m (US$13m) in 2023. Attributable Mineral Reserves increased by 12% net of depletion to 2.4Moz. Mineral Reserve growth occurred primarily in Zone 135 and Zone 150 of the Wallaby underground mine. Granny Smith – Mineral Reserves reconciliation (koz) 2,135 (295) 550 2,390 Mineral Reserves Proved and Probable 2022 Mining depletion Growth 2023 Mineral Reserves Proved and Probable 2023 0 500 1,000 1,500 2,000 2,500 Agnew We spent A$23m (US$16m) on near-mine exploration at Agnew during 2023. Agnew was unable to replace Mineral Reserves after depletion during the year, with Mineral Reserves decreasing by 20% to 0.9Moz. As model cut-off dates were brought forward in 2023, results from drilling in H2 2023 have not been included in the model update and estimation. Agnew – Mineral Reserves reconciliation (koz) 1,095 (267) 44 872 Mineral Reserves Proved and Probable 2022 Mining depletion Growth 2023 Mineral Reserves Proved and Probable 2023 0 200 400 600 800 1,000 1,200 Overview Governance Our business Strategic pillar 1 Strategic pillar 2 Strategic pillar 3 Assurance Gold Fields IAR-85
Mineral Resources and Mineral Reserves summary Managing our Mineral Resources and Mineral Reserves is central to delivering on our strategic goals. The Group continued to focus on near-mine exploration to extend mine life during the year. As in 2022, we were unable to replace all mined Mineral Reserves through exploration and mine extensional drilling. Nevertheless, we added significant Mineral Reserves and Mineral Resources to reduce the impact of depletion. Replacing Mineral Reserves through extensional drilling and exploration is a multi-year commitment, and we cannot expect a smooth replacement trajectory. Gold Fields remains committed to a Mineral Reserves replacement programme at its operations. Cost pressures and mining depletion had a negative impact and overall decline on Mineral Resources and Mineral Reserves across all operations, except for Granny Smith. Studies are underway to identify how to address this through asset optimisation, project ramp-ups, expansions and increased efficiencies. We continue to plan for exploration and extensional drilling to define additional Mineral Resources and Mineral Reserves during 2024. Despite the decrease in Mineral Resources and Mineral Reserves, we are well placed to deliver on production guidance in the near term. In 2023, our Mineral Resources and Mineral Reserves pricing assumptions for gold were US$1,600/oz and US$1,400/oz, respectively. However, we updated exchange rates for the Australian Dollar and South African Rand, with consequent changes in local currency gold prices. Refer to our Mineral Resources and Mineral Reserves Supplement (the MRMR Supplement) for more details. Due to the timing of the exchange rates changes, we primarily applied the changes in pricing assumptions to financial modelling and not to all aspects of mine planning and optimisation for our Australian operations. Our sites continue to drive Mineral Resources to Mineral Reserves conversion; strive for Mineral Reserves growth to replace annual depletion; improve cash-flow and cost per ounce; and deliver on strategic opportunities to extend mine life. 2023 performance The life-of-mine Mineral Reserves incorporate the first two years of the business plan schedule. Our 2023 estimations were brought forward to October 2023 to align with the models used in our business planning cycles. Depletions are based on 11 months of actual depletions (January to November 2023) plus a projection for December 2023. As a result, the 2023 Mineral Resources and Mineral Reserves estimation period was shorter than 2022, which was based on a full year of actuals. This reduced Mineral Reserves replacement between 2022 and 2023. At end-2023, Group attributable Proved and Probable Mineral Reserves were estimated at 44.6Moz gold (2022: 46.1Moz), 336Mlbs copper (2022: 398Mlbs) and 41.9Moz silver (2022: 42.2Moz). Gold Mineral Reserves decreased by 1.48Moz on an attributable basis net depletion of approximately 2.3Moz. Copper Mineral Reserves decreased by 62Mlbs on an attributable basis net depletion of 80Mlbs. Silver Reserves at Salares Norte in Chile decreased by 0.2Moz. Attributable Mineral Reserves changes include increases of 0.3Moz (12%) at Granny Smith net of annual depletion, which was offset by Mineral Reserves decreases of 0.2Moz (-9%) at Gruyere, 0.1Moz (-4%) at St Ives, 0.2Moz (-20%) at Agnew, 0.4Moz (-2%) at South Deep, 0.1Moz (-37%) at Damang, 0.5Moz (-10%) at Tarkwa, 0.04Moz (-1%) at Salares Norte and 0.1Moz (-14%) at Cerro Corona, all including annual depletion. Silver Mineral Reserves decreased by 0.2Moz (-1%) at Salares Norte and copper Mineral Reserves decreased by 63Mlb (-16%) at Cerro Corona. Group attributable Measured and Indicated Mineral Resources EMR amounted to 30.3Moz gold (2022: 31.1Moz), 0.0Mlbs copper (2022: 300.0Mlbs) and 2.2Moz silver (2022: 2.5Moz). The reduction in copper Mineral Resources EMR is the result of sterilisation of Mineral Resources at Cerro Corona due to planned placement of in-pit tailings. Group attributable Inferred Mineral Resources EMR were 10.2Moz gold (2022: 11.2Moz), 0.0Mlbs copper (2022: 1.1Mlbs) and 0.1Moz silver (2022: 0.5Moz). Measured and Indicated attributable Mineral Resources EMR gold changes during 2023 include increases of 0.3Moz (16%) at Granny Smith and 0.7Moz (26%) at Tarkwa. This was offset by decreases of 0.1Moz (-9%) at Gruyere, 0.2Moz (-1%) at South Deep, and 0.9Moz (-30%) at Damang. Similar to copper, no Mineral Resources EMR gold was reported at Cerro Corona in 2023 as a result of planned placement of in-pit tailings. Silver EMR decreased by 0.3Moz (-12%) at Salares Norte and copper decreased by 300Mlbs (100%) at Cerro Corona. Gold Inferred Mineral Resources EMR decreased by 0.1Moz (-13%) at Gruyere, 0.2Moz (-15%) at Granny Smith, 0.4Moz (-28%) at St Ives, 0.1Moz (-29%) at Tarkwa. Silver decreased by 0.4Moz (-84%) at Salares Norte and copper decreased by 1Mlbs (100%) at Cerro Corona. The decreases in Mineral Resources and Mineral Reserves were primarily due to depletion and increased cut-off grades from mining inflation, only partly offset by additions from exploration. Depletions from Mineral Resources can occur due to mining of mineralised material not in reserve, which may be opportunistic, incrementally costed or part of the business plan guided by grade-control drilling completed during the year. In 2023, Gold Fields entered into an agreement to sell its direct interest in the Asanko gold mine in Ghana to Galiano Gold for US$170m, plus a 1% net smelter royalty on future production from the Nkran deposit, capped at a volume of 447koz. The sale was finalised in March 2024. No Mineral Resources and Mineral Reserves are reported for Asanko. This is consistent with previous years, as the Asanko Mineral Resources and Mineral Reserves were not considered material. During the year, we entered into a JV with Osisko Mining to form the 50/50 Windfall project. The project’s EIA has not yet been approved, and no decision has been made to start development. No Mineral Resources or Mineral Reserves are disclosed for 2023. Governance The consolidated summary of Gold Fields’ Mineral Resources and Mineral Reserves in this section should be read with our MRMR Supplement and Form 20-F, available on our website. The MRMR Supplement details important technical information on our Mineral Resources and Mineral Reserves at year-end. It is prepared in line with the South African Code for the Reporting of Exploration Results, Mineral Resources and Mineral Reserves, 2016 edition and other leading standards and regulations, including the US SEC’s SK-1300. Supplementary information is available in the Technical Report Summaries filed as exhibits to our Form 20-F. While there are some differences in the formatting of the documents due to different reporting guidelines, they are nevertheless substantially similar. The Mineral Reserves and Mineral Resources statements were prepared under the supervision of the Group Competent Persons, Julian Verbeek and Jason Sander, who are members of Gold Fields’ Corporate Technical Services team. They both consent to the disclosure of these statements in the form they are presented. Details of experience and affiliation are provided in the MRMR Supplement. Overview Governance Our business Strategic pillar 1 Strategic pillar 2 Strategic pillar 3 Assurance Gold Fields IAR-86
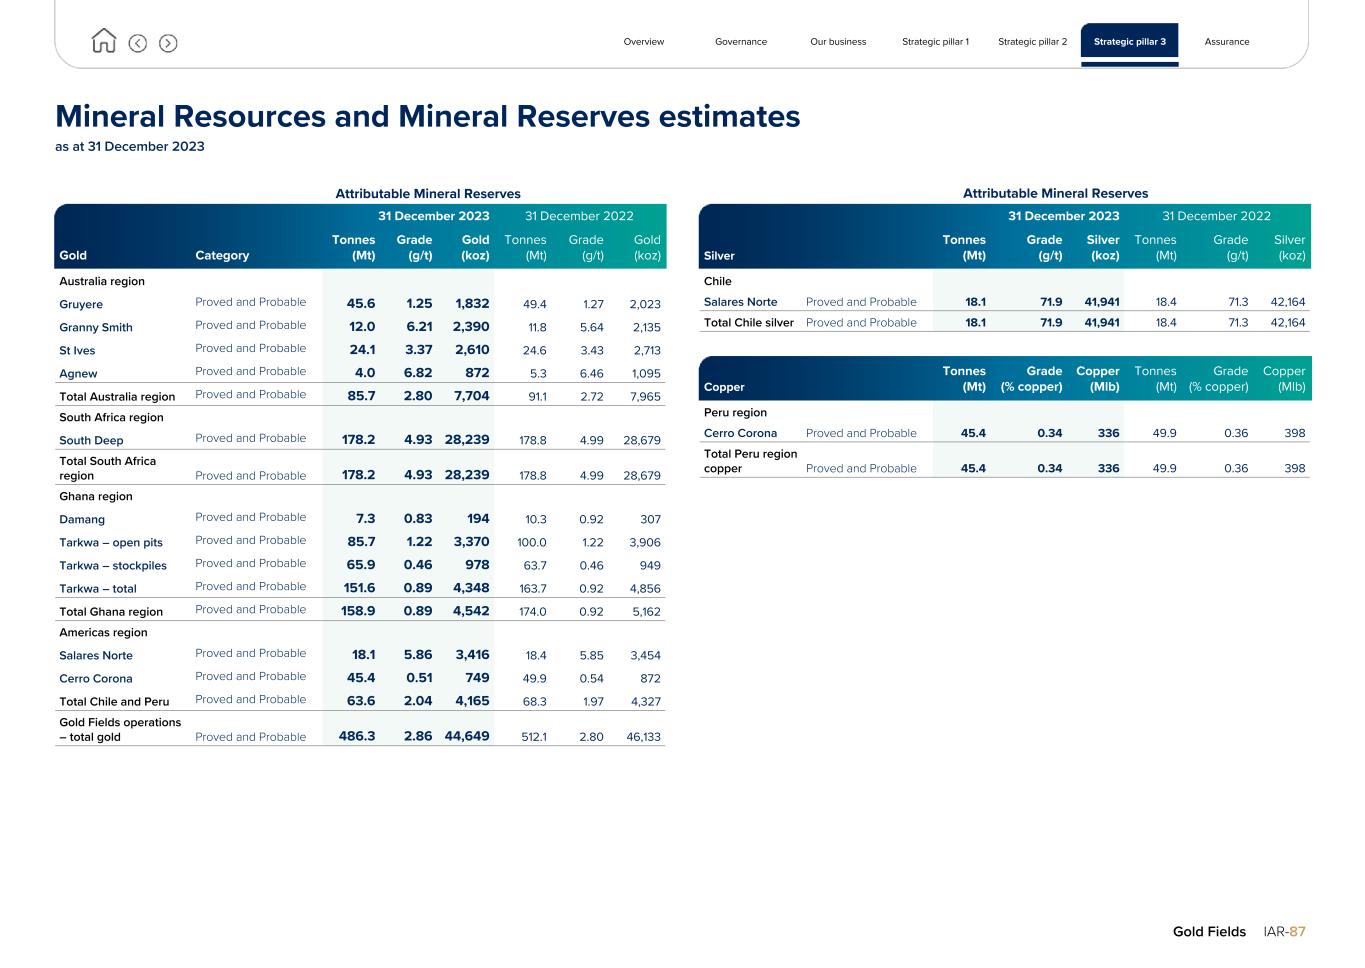
Mineral Resources and Mineral Reserves estimates as at 31 December 2023 Attributable Mineral Reserves 31 December 2023 31 December 2022 Gold Category Tonnes (Mt) Grade (g/t) Gold (koz) Tonnes (Mt) Grade (g/t) Gold (koz) Australia region Gruyere Proved and Probable 45.6 1.25 1,832 49.4 1.27 2,023 Granny Smith Proved and Probable 12.0 6.21 2,390 11.8 5.64 2,135 St Ives Proved and Probable 24.1 3.37 2,610 24.6 3.43 2,713 Agnew Proved and Probable 4.0 6.82 872 5.3 6.46 1,095 Total Australia region Proved and Probable 85.7 2.80 7,704 91.1 2.72 7,965 South Africa region South Deep Proved and Probable 178.2 4.93 28,239 178.8 4.99 28,679 Total South Africa region Proved and Probable 178.2 4.93 28,239 178.8 4.99 28,679 Ghana region Damang Proved and Probable 7.3 0.83 194 10.3 0.92 307 Tarkwa – open pits Proved and Probable 85.7 1.22 3,370 100.0 1.22 3,906 Tarkwa – stockpiles Proved and Probable 65.9 0.46 978 63.7 0.46 949 Tarkwa – total Proved and Probable 151.6 0.89 4,348 163.7 0.92 4,856 Total Ghana region Proved and Probable 158.9 0.89 4,542 174.0 0.92 5,162 Americas region Salares Norte Proved and Probable 18.1 5.86 3,416 18.4 5.85 3,454 Cerro Corona Proved and Probable 45.4 0.51 749 49.9 0.54 872 Total Chile and Peru Proved and Probable 63.6 2.04 4,165 68.3 1.97 4,327 Gold Fields operations – total gold Proved and Probable 486.3 2.86 44,649 512.1 2.80 46,133 Attributable Mineral Reserves 31 December 2023 31 December 2022 Silver Tonnes (Mt) Grade (g/t) Silver (koz) Tonnes (Mt) Grade (g/t) Silver (koz) Chile Salares Norte Proved and Probable 18.1 71.9 41,941 18.4 71.3 42,164 Total Chile silver Proved and Probable 18.1 71.9 41,941 18.4 71.3 42,164 Copper Tonnes (Mt) Grade (% copper) Copper (Mlb) Tonnes (Mt) Grade (% copper) Copper (Mlb) Peru region Cerro Corona Proved and Probable 45.4 0.34 336 49.9 0.36 398 Total Peru region copper Proved and Probable 45.4 0.34 336 49.9 0.36 398 Overview Governance Our business Strategic pillar 1 Strategic pillar 2 Strategic pillar 3 Assurance Gold Fields IAR-87
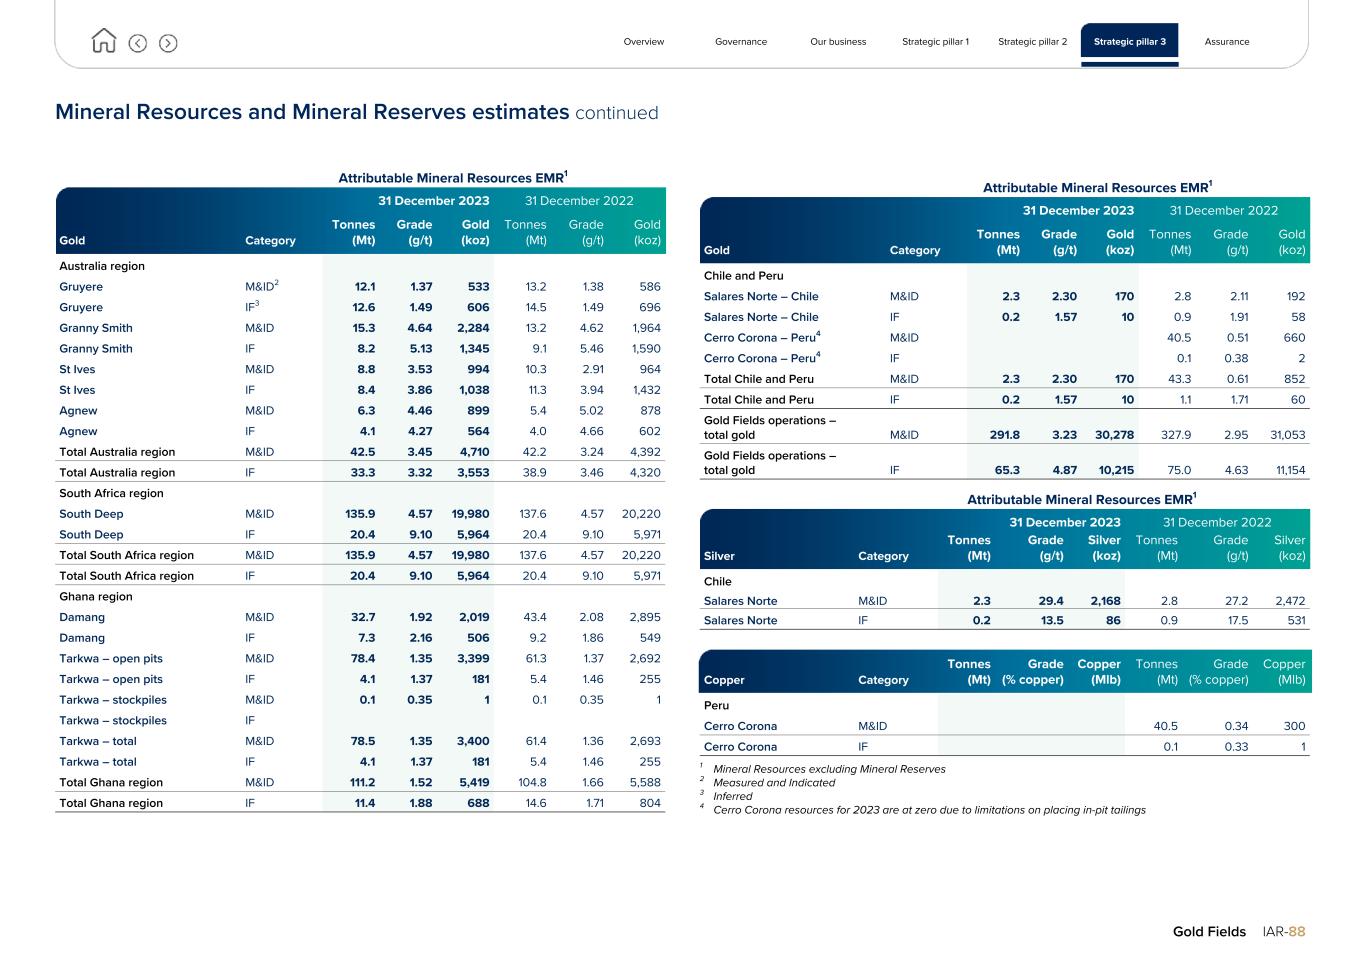
Mineral Resources and Mineral Reserves estimates continued Australia region Gruyere M&ID2 12.1 1.37 533 13.2 1.38 586 Gruyere IF3 12.6 1.49 606 14.5 1.49 696 Granny Smith M&ID 15.3 4.64 2,284 13.2 4.62 1,964 Granny Smith IF 8.2 5.13 1,345 9.1 5.46 1,590 St Ives M&ID 8.8 3.53 994 10.3 2.91 964 St Ives IF 8.4 3.86 1,038 11.3 3.94 1,432 Agnew M&ID 6.3 4.46 899 5.4 5.02 878 Agnew IF 4.1 4.27 564 4.0 4.66 602 Total Australia region M&ID 42.5 3.45 4,710 42.2 3.24 4,392 Total Australia region IF 33.3 3.32 3,553 38.9 3.46 4,320 South Africa region South Deep M&ID 135.9 4.57 19,980 137.6 4.57 20,220 South Deep IF 20.4 9.10 5,964 20.4 9.10 5,971 Total South Africa region M&ID 135.9 4.57 19,980 137.6 4.57 20,220 Total South Africa region IF 20.4 9.10 5,964 20.4 9.10 5,971 Ghana region Damang M&ID 32.7 1.92 2,019 43.4 2.08 2,895 Damang IF 7.3 2.16 506 9.2 1.86 549 Tarkwa – open pits M&ID 78.4 1.35 3,399 61.3 1.37 2,692 Tarkwa – open pits IF 4.1 1.37 181 5.4 1.46 255 Tarkwa – stockpiles M&ID 0.1 0.35 1 0.1 0.35 1 Tarkwa – stockpiles IF Tarkwa – total M&ID 78.5 1.35 3,400 61.4 1.36 2,693 Tarkwa – total IF 4.1 1.37 181 5.4 1.46 255 Total Ghana region M&ID 111.2 1.52 5,419 104.8 1.66 5,588 Total Ghana region IF 11.4 1.88 688 14.6 1.71 804 Attributable Mineral Resources EMR1 31 December 2023 31 December 2022 Gold Category Tonnes (Mt) Grade (g/t) Gold (koz) Tonnes (Mt) Grade (g/t) Gold (koz) Attributable Mineral Resources EMR1 31 December 2023 31 December 2022 Gold Category Tonnes (Mt) Grade (g/t) Gold (koz) Tonnes (Mt) Grade (g/t) Gold (koz) Chile and Peru Salares Norte – Chile M&ID 2.3 2.30 170 2.8 2.11 192 Salares Norte – Chile IF 0.2 1.57 10 0.9 1.91 58 Cerro Corona – Peru4 M&ID 40.5 0.51 660 Cerro Corona – Peru4 IF 0.1 0.38 2 Total Chile and Peru M&ID 2.3 2.30 170 43.3 0.61 852 Total Chile and Peru IF 0.2 1.57 10 1.1 1.71 60 Gold Fields operations – total gold M&ID 291.8 3.23 30,278 327.9 2.95 31,053 Gold Fields operations – total gold IF 65.3 4.87 10,215 75.0 4.63 11,154 Attributable Mineral Resources EMR1 31 December 2023 31 December 2022 Silver Category Tonnes (Mt) Grade (g/t) Silver (koz) Tonnes (Mt) Grade (g/t) Silver (koz) Chile Salares Norte M&ID 2.3 29.4 2,168 2.8 27.2 2,472 Salares Norte IF 0.2 13.5 86 0.9 17.5 531 Category Tonnes (Mt) Grade (% copper) Copper (Mlb) Tonnes (Mt) Grade (% copper) Copper (Mlb)Copper Peru Cerro Corona M&ID 40.5 0.34 300 Cerro Corona IF 0.1 0.33 1 1 Mineral Resources excluding Mineral Reserves 2 Measured and Indicated 3 Inferred 4 Cerro Corona resources for 2023 are at zero due to limitations on placing in-pit tailings Overview Governance Our business Strategic pillar 1 Strategic pillar 2 Strategic pillar 3 Assurance Gold Fields IAR-88
Overview Governance Our business Strategic pillar 1 Strategic pillar 2 Strategic pillar 3 Assurance Gold Fields IAR-89 Assurance IN THIS SECTION 90 Independent Auditor’s Assurance Report on the Selected Sustainability Information in Gold Fields Limited Integrated Annual Report ¢ 95 Administration and corporate information ¢ Mine employees at our Tarkwa mine in Ghana
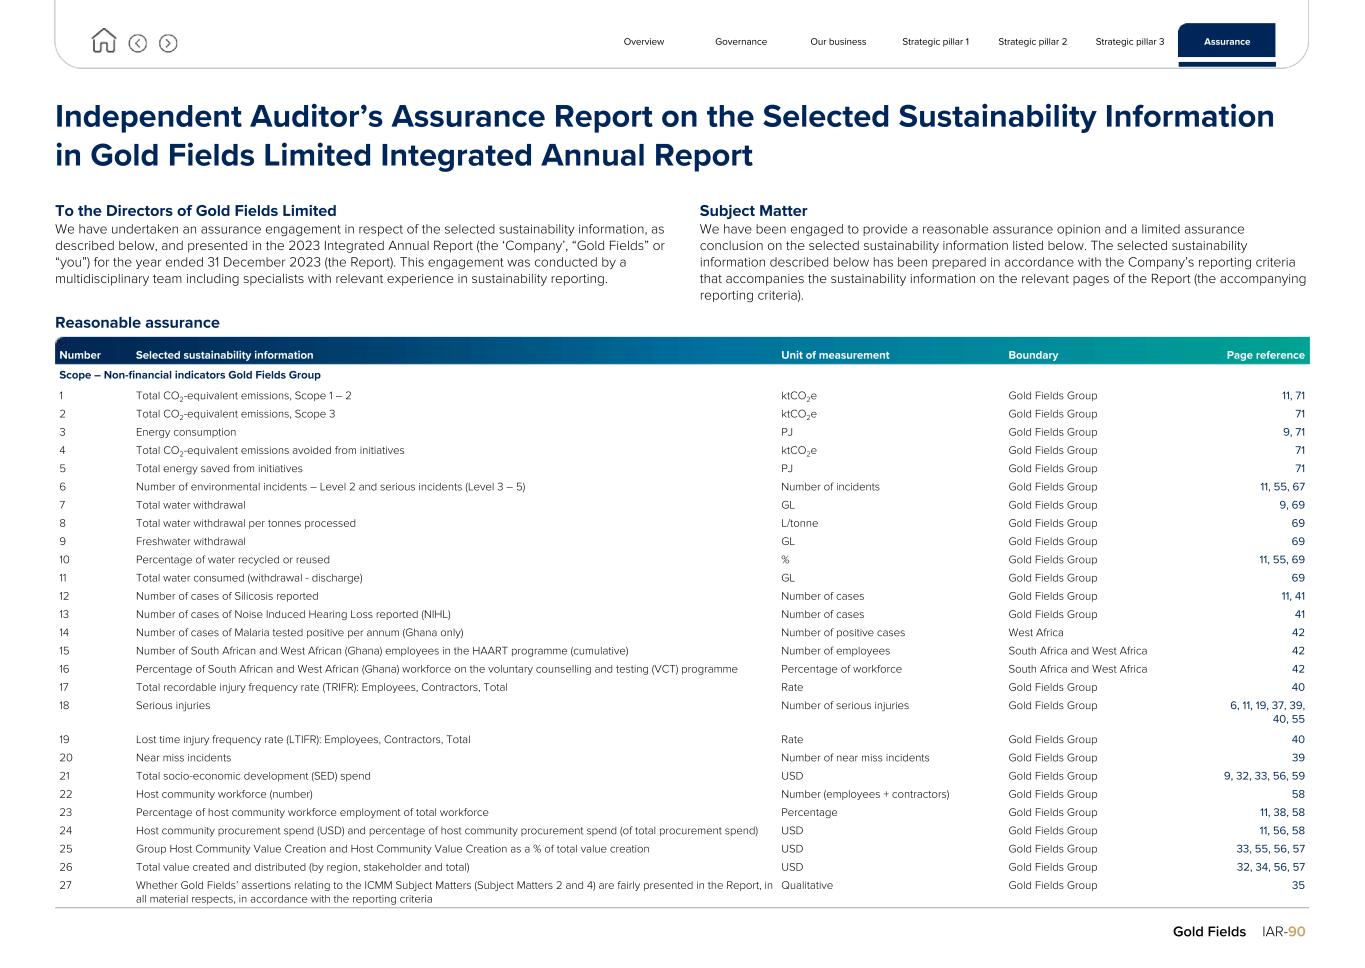
Independent Auditor’s Assurance Report on the Selected Sustainability Information in Gold Fields Limited Integrated Annual Report To the Directors of Gold Fields Limited We have undertaken an assurance engagement in respect of the selected sustainability information, as described below, and presented in the 2023 Integrated Annual Report (the ‘Company’, “Gold Fields” or “you”) for the year ended 31 December 2023 (the Report). This engagement was conducted by a multidisciplinary team including specialists with relevant experience in sustainability reporting. Subject Matter We have been engaged to provide a reasonable assurance opinion and a limited assurance conclusion on the selected sustainability information listed below. The selected sustainability information described below has been prepared in accordance with the Company’s reporting criteria that accompanies the sustainability information on the relevant pages of the Report (the accompanying reporting criteria). Reasonable assurance Number Selected sustainability information Unit of measurement Boundary Page reference Scope – Non-financial indicators Gold Fields Group 1 Total CO2-equivalent emissions, Scope 1 – 2 ktCO2e Gold Fields Group 11, 71 2 Total CO2-equivalent emissions, Scope 3 ktCO2e Gold Fields Group 71 3 Energy consumption PJ Gold Fields Group 9, 71 4 Total CO2-equivalent emissions avoided from initiatives ktCO2e Gold Fields Group 71 5 Total energy saved from initiatives PJ Gold Fields Group 71 6 Number of environmental incidents – Level 2 and serious incidents (Level 3 – 5) Number of incidents Gold Fields Group 11, 55, 67 7 Total water withdrawal GL Gold Fields Group 9, 69 8 Total water withdrawal per tonnes processed L/tonne Gold Fields Group 69 9 Freshwater withdrawal GL Gold Fields Group 69 10 Percentage of water recycled or reused % Gold Fields Group 11, 55, 69 11 Total water consumed (withdrawal - discharge) GL Gold Fields Group 69 12 Number of cases of Silicosis reported Number of cases Gold Fields Group 11, 41 13 Number of cases of Noise Induced Hearing Loss reported (NIHL) Number of cases Gold Fields Group 41 14 Number of cases of Malaria tested positive per annum (Ghana only) Number of positive cases West Africa 42 15 Number of South African and West African (Ghana) employees in the HAART programme (cumulative) Number of employees South Africa and West Africa 42 16 Percentage of South African and West African (Ghana) workforce on the voluntary counselling and testing (VCT) programme Percentage of workforce South Africa and West Africa 42 17 Total recordable injury frequency rate (TRIFR): Employees, Contractors, Total Rate Gold Fields Group 40 18 Serious injuries Number of serious injuries Gold Fields Group 6, 11, 19, 37, 39, 40, 55 19 Lost time injury frequency rate (LTIFR): Employees, Contractors, Total Rate Gold Fields Group 40 20 Near miss incidents Number of near miss incidents Gold Fields Group 39 21 Total socio-economic development (SED) spend USD Gold Fields Group 9, 32, 33, 56, 59 22 Host community workforce (number) Number (employees + contractors) Gold Fields Group 58 23 Percentage of host community workforce employment of total workforce Percentage Gold Fields Group 11, 38, 58 24 Host community procurement spend (USD) and percentage of host community procurement spend (of total procurement spend) USD Gold Fields Group 11, 56, 58 25 Group Host Community Value Creation and Host Community Value Creation as a % of total value creation USD Gold Fields Group 33, 55, 56, 57 26 Total value created and distributed (by region, stakeholder and total) USD Gold Fields Group 32, 34, 56, 57 27 Whether Gold Fields’ assertions relating to the ICMM Subject Matters (Subject Matters 2 and 4) are fairly presented in the Report, in all material respects, in accordance with the reporting criteria Qualitative Gold Fields Group 35 Overview Governance Our business Strategic pillar 1 Strategic pillar 2 Strategic pillar 3 Assurance Gold Fields IAR-90
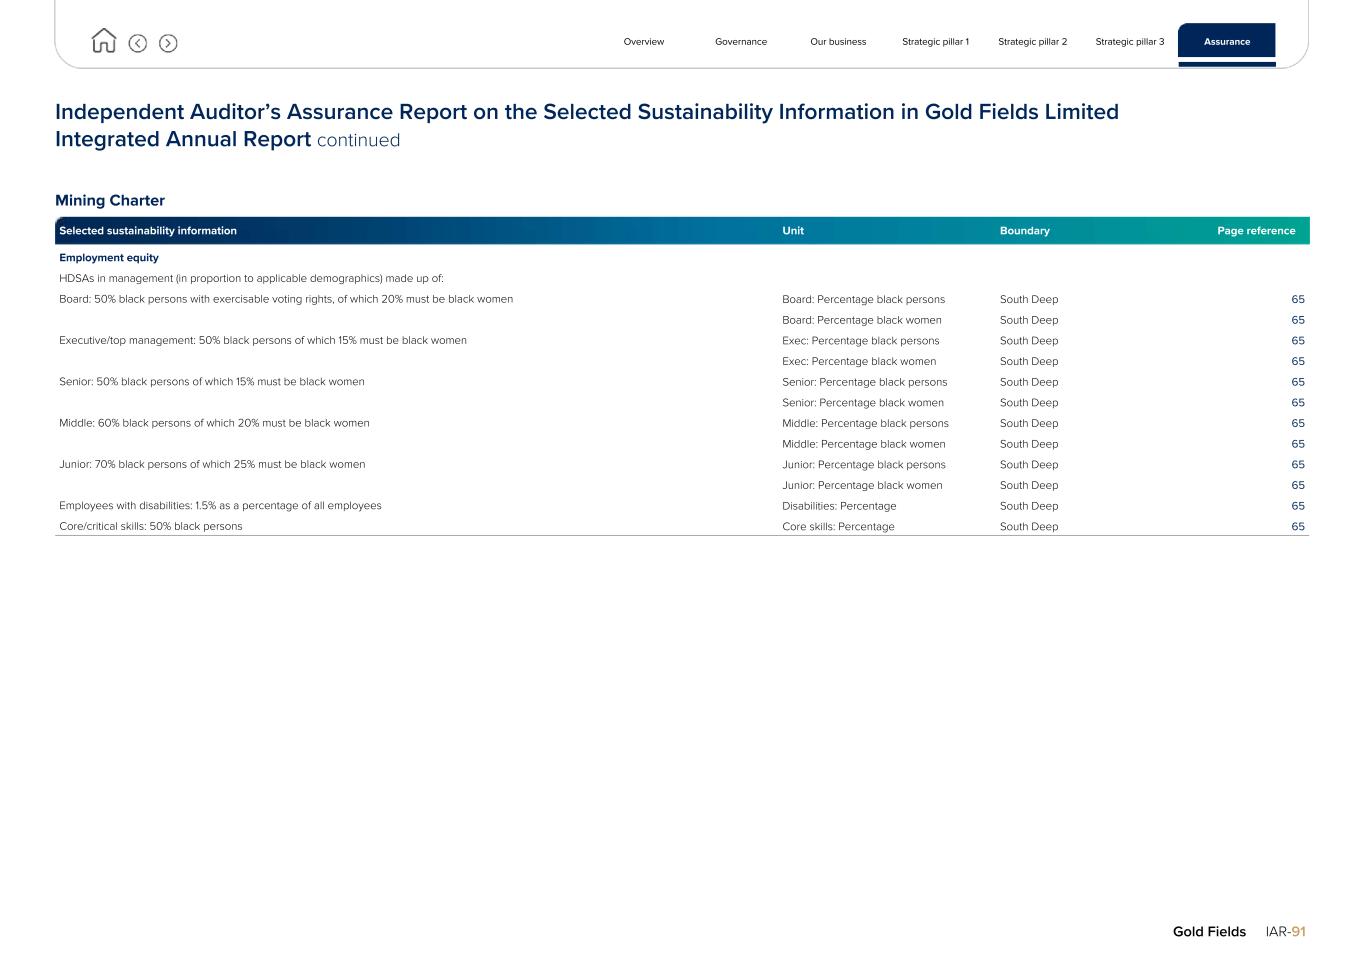
Independent Auditor’s Assurance Report on the Selected Sustainability Information in Gold Fields Limited Integrated Annual Report continued Mining Charter Selected sustainability information Unit Boundary Page reference Employment equity HDSAs in management (in proportion to applicable demographics) made up of: Board: 50% black persons with exercisable voting rights, of which 20% must be black women Board: Percentage black persons South Deep 65 Board: Percentage black women South Deep 65 Executive/top management: 50% black persons of which 15% must be black women Exec: Percentage black persons South Deep 65 Exec: Percentage black women South Deep 65 Senior: 50% black persons of which 15% must be black women Senior: Percentage black persons South Deep 65 Senior: Percentage black women South Deep 65 Middle: 60% black persons of which 20% must be black women Middle: Percentage black persons South Deep 65 Middle: Percentage black women South Deep 65 Junior: 70% black persons of which 25% must be black women Junior: Percentage black persons South Deep 65 Junior: Percentage black women South Deep 65 Employees with disabilities: 1.5% as a percentage of all employees Disabilities: Percentage South Deep 65 Core/critical skills: 50% black persons Core skills: Percentage South Deep 65 Overview Governance Our business Strategic pillar 1 Strategic pillar 2 Strategic pillar 3 Assurance Gold Fields IAR-91
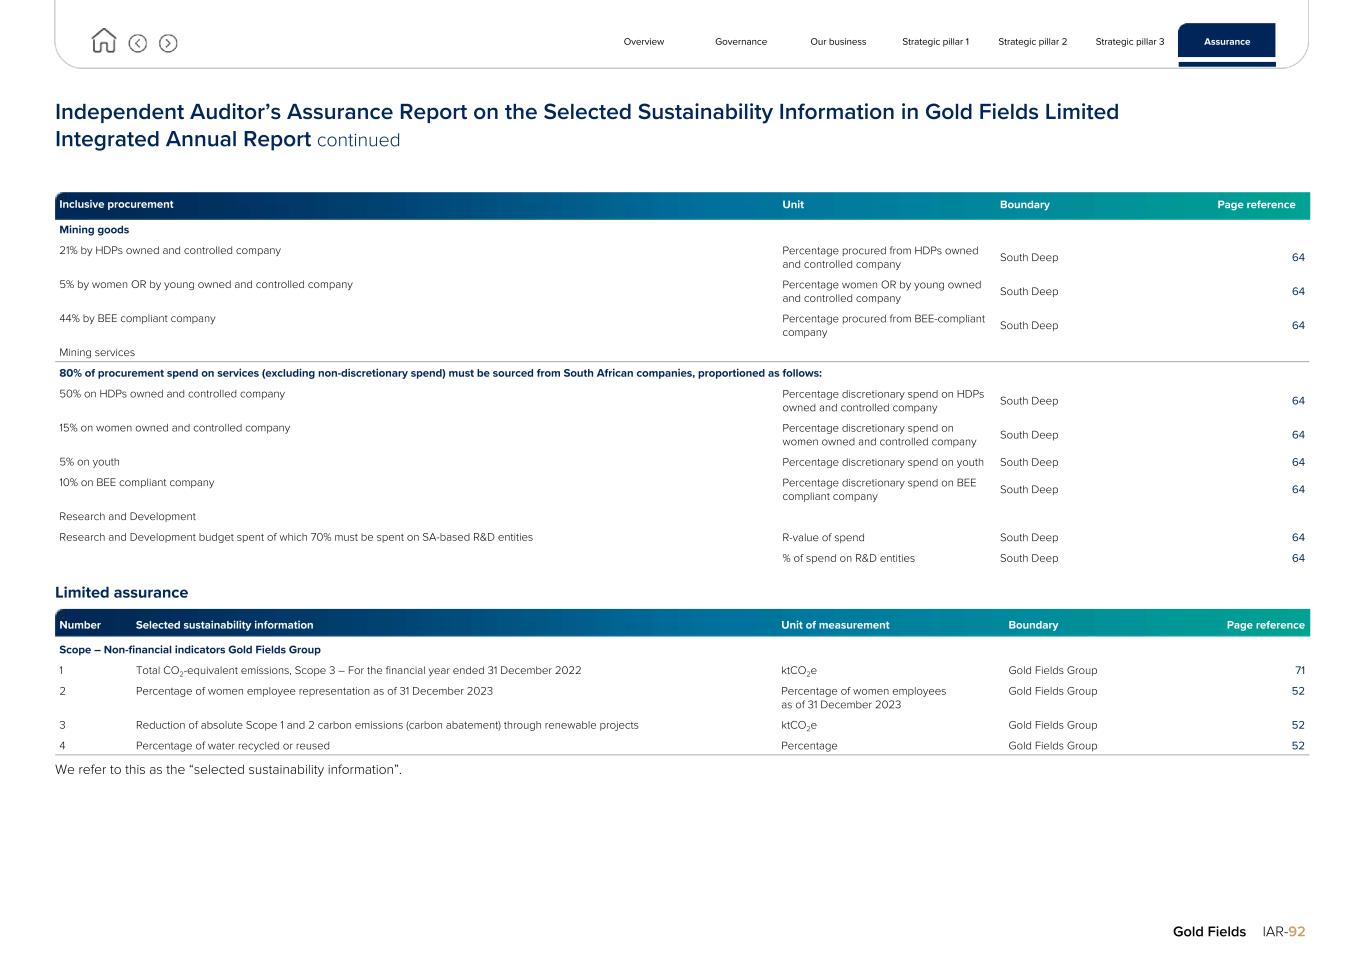
Independent Auditor’s Assurance Report on the Selected Sustainability Information in Gold Fields Limited Integrated Annual Report continued Inclusive procurement Unit Boundary Page reference Mining goods 21% by HDPs owned and controlled company Percentage procured from HDPs owned and controlled company South Deep 64 5% by women OR by young owned and controlled company Percentage women OR by young owned and controlled company South Deep 64 44% by BEE compliant company Percentage procured from BEE-compliant company South Deep 64 Mining services 80% of procurement spend on services (excluding non-discretionary spend) must be sourced from South African companies, proportioned as follows: 50% on HDPs owned and controlled company Percentage discretionary spend on HDPs owned and controlled company South Deep 64 15% on women owned and controlled company Percentage discretionary spend on women owned and controlled company South Deep 64 5% on youth Percentage discretionary spend on youth South Deep 64 10% on BEE compliant company Percentage discretionary spend on BEE compliant company South Deep 64 Research and Development Research and Development budget spent of which 70% must be spent on SA-based R&D entities R-value of spend South Deep 64 % of spend on R&D entities South Deep 64 Limited assurance Number Selected sustainability information Unit of measurement Boundary Page reference Scope – Non-financial indicators Gold Fields Group 1 Total CO2-equivalent emissions, Scope 3 – For the financial year ended 31 December 2022 ktCO2e Gold Fields Group 71 2 Percentage of women employee representation as of 31 December 2023 Percentage of women employees as of 31 December 2023 Gold Fields Group 52 3 Reduction of absolute Scope 1 and 2 carbon emissions (carbon abatement) through renewable projects ktCO2e Gold Fields Group 52 4 Percentage of water recycled or reused Percentage Gold Fields Group 52 We refer to this as the “selected sustainability information”. Overview Governance Our business Strategic pillar 1 Strategic pillar 2 Strategic pillar 3 Assurance Gold Fields IAR-92
Independent Auditor’s Assurance Report on the Selected Sustainability Information in Gold Fields Limited Integrated Annual Report continued Management’s responsibilities The Executive Vice President: Sustainable Development, representing management and Gold Fields Limited, is responsible for the selection, preparation and presentation of the selected sustainability information in accordance with the accompanying reporting criteria as set out at www.goldfields.com/sustainability- performance.php (the “Reporting Criteria”). This responsibility includes: • the identification of stakeholders and stakeholder requirements, material issues, commitments with respect to sustainability performance, and • the design, implementation and maintenance of internal control relevant to the preparation of the Report that is free from material misstatement, whether due to fraud or error. Management are also responsible for determining the appropriateness of the measurement and reporting criteria in view of the intended users of the selected sustainability information and for ensuring that those criteria are publicly available to the Report users. Inherent limitations Non-financial performance information is subject to more inherent limitations than financial information, given the characteristics of the subject matter and the methods used for determining, calculating, sampling and estimating such information. The absence of a significant body of established practices on which to draw allows for the selection of different but acceptable measurement techniques which can result in materially different measurements and can impact comparability. Qualitative interpretations of relevance, materiality and the accuracy of data are subject to individual assumptions and judgements. The precision of different measurement techniques may also vary. Furthermore, the nature and methods used to determine such information, as well as the measurement criteria and the precision thereof, may change over time. In particular, where the information relies on carbon and other emissions conversion factors derived by independent third parties, or internal laboratory results, our assurance work will not include examination of the derivation of those factors and other third party or laboratory information. Our Independence and Quality Management We have complied with the independence and other ethical requirements of the Code of Professional Conduct for Registered Auditors, issued by the Independent Regulatory Board for Auditors’ (IRBA Code), which is founded on fundamental principles of integrity, objectivity, professional competence and due care, confidentiality and professional behaviour. The IRBA Code is consistent with the corresponding sections of the International Ethics Standards Board for Accountants’ International Code of Ethics for Professional Accountants (including International Independence Standards). The firm applies the International Standard on Quality Management 1, Quality Management for Firms that Perform Audits or Reviews of Financial Statements, or Other Assurance or Related Services Engagements, which requires the firm to design, implement and operate a system of quality management, including policies or procedures regarding compliance with ethical requirements, professional standards and applicable legal and regulatory requirements. Our responsibility Our responsibility is to express either a reasonable assurance opinion or limited assurance conclusion on the selected sustainability information as set out in the Subject Matter paragraph, based on the procedures we have performed and the evidence we have obtained. We conducted our assurance engagement in accordance with the International Standard on Assurance Engagements 3000 (Revised), Assurance Engagements other than Audits or Reviews of Historical Financial Information (ISAE 3000(Revised)), and, in respect of greenhouse gas emissions, International Standard on Assurance Engagements 3410, Assurance Engagements on Greenhouse Gas Statements (ISAE 3410) issued by the International Auditing and Assurance Standards Board. These Standards require that we plan and perform our engagement to obtain the appropriate level of assurance about whether the selected sustainability information are free from material misstatement. The procedures performed in a limited assurance engagement vary in nature and timing, and are less in extent than for a reasonable assurance engagement. As a result the level of assurance obtained in a limited assurance engagement is substantially lower than the assurance that would have been obtained had we performed a reasonable assurance engagement. Overview Governance Our business Strategic pillar 1 Strategic pillar 2 Strategic pillar 3 Assurance Gold Fields IAR-93
Independent Auditor’s Assurance Report on the Selected Sustainability Information in Gold Fields Limited Integrated Annual Report continued (a) Reasonable assurance A reasonable assurance engagement in accordance with ISAE 3000 (Revised) ,and ISAE 3410, involves performing procedures to obtain evidence about the measurement of the selected sustainability information and related disclosures in the Report. The nature, timing and extent of procedures selected depend on the auditor’s professional judgement, including the assessment of the risks of material misstatement of the selected sustainability information, whether due to fraud or error. In making those risk assessments we have considered internal control relevant to the Company’s preparation of the selected sustainability information. A reasonable assurance engagement also includes: • Evaluating the appropriateness of quantification methods, reporting policies and internal guidelines used and the reasonableness of estimates made by the Company; • Assessing the suitability in the circumstances of the Company’s use of the applicable reporting criteria as a basis for preparing the selected sustainability information; and • Evaluating the overall presentation of the selected sustainability performance information. We believe that the evidence we have obtained is sufficient and appropriate to provide a basis for our reasonable assurance opinion. (b) Limited assurance A limited assurance engagement undertaken in accordance with ISAE 3000 (Revised), and ISAE 3410, involves assessing the suitability in the circumstances of the Company’s use of its reporting criteria as the basis of preparation for the selected sustainability information, assessing the risks of material misstatement of the selected sustainability information whether due to fraud or error, responding to the assessed risks as necessary in the circumstances, and evaluating the overall presentation of the selected sustainability information. A limited assurance engagement is substantially less in scope than a reasonable assurance engagement in relation to both risk assessment procedures, including an understanding of internal control, and the procedures performed in response to the assessed risks. Accordingly, for the selected sustainability information where limited assurance was obtained, we do not express a reasonable assurance opinion about whether the Company’s selected sustainability information have been prepared, in all material respects, in accordance with the accompanying reporting criteria. The procedures we performed were based on our professional judgement and included inquiries, observation of processes followed, inspection of documents, analytical procedures, evaluating the appropriateness of quantification methods and reporting policies, and agreeing or reconciling with underlying records. Given the circumstances of the engagement, in performing the procedures listed above we: • Interviewed management to obtain an understanding of the internal control environment, risk assessment process and information systems relevant to the sustainability reporting process; • Inspected documentation to corroborate the statements of management in our interviews; • Tested the processes and systems to generate, collate, aggregate, monitor and report the selected sustainability information; • Performed a controls walkthrough of identified key controls; • Inspected supporting documentation on a sample basis and performed analytical procedures to evaluate the data generation and reporting processes against the reporting criteria; • Evaluated the reasonableness and appropriateness of significant estimates and judgments made by management in the preparation of the selected sustainability information; and • Evaluated whether the selected sustainability information presented in the Report are consistent with our overall knowledge and experience of sustainability management and performance at the Company. Reasonable Assurance Opinion and Limited Assurance Conclusion (a) Reasonable assurance opinion In our opinion and subject to the inherent limitations outlined elsewhere in this report, the selected sustainability information set out in the Subject Matter paragraph above for the year ended 31 December 2023 are prepared, in all material respects, in accordance with the reporting criteria. (b) Limited assurance conclusion Based on the procedures we have performed and the evidence we have obtained, and subject to the inherent limitations outlined elsewhere in this report, nothing has come to our attention that causes us to believe that the selected sustainability information as set out the Subject Matter paragraph above for the year ended 31 December 2023 are not prepared, in all material respects, in accordance with the reporting criteria. Other Matter The maintenance and integrity of Gold Fields Limited’s website is the responsibility of Gold Fields Limited’s management. Our procedures did not involve consideration of these matters and, accordingly we accept no responsibility for any changes to either the information in the Report or our independent assurance report that may have occurred since the initial date of presentation on Gold Fields Limited’s website. Restriction of liability Our work has been undertaken to enable us to express a reasonable assurance opinion and limited assurance conclusion on the selected sustainability information to the directors of the Company in accordance with the terms of our engagement, and for no other purpose. We do not accept or assume liability to any party other than the Company, for our work, for this report, or for the conclusion we have reached. PricewaterhouseCoopers Inc. Director: Oswald Wentworth Registered Auditor Johannesburg, South Africa 28 March 2024 Overview Governance Our business Strategic pillar 1 Strategic pillar 2 Strategic pillar 3 Assurance Gold Fields IAR-94
Administration and corporate information Company Secretary Anré Weststrate Tel: +27 11 562 9719 Fax: +27 86 720 2704 email: anre.weststrate@goldfields.com Registered Office Johannesburg Gold Fields Limited 150 Helen Road Sandown Sandton 2196 Postnet Suite 252 Private Bag X30500 Houghton 2041 Tel: +27 11 562 9700 Office of the United Kingdom Secretaries London St James’s Corporate Services Limited Suite 31, Second Floor 107 Cheapside London EC2V 6DN United Kingdom Tel: +44 (0) 20 7796 8644 email: general@corpserv.co.uk American depository receipts transfer agent Shareholder correspondence should be mailed to: BNY Mellon PO Box 43006 Providence RI 02940-3078 Overnight correspondence should be sent to: BNY Mellon 150 Royall Street, Suite 101 Canton, MA 02021 email: shrrelations@cpushareownerservices.com Tel: 866 247 3871 Domestic Tel: 201 680 6825 Foreign Sponsor J.P. Morgan Equities South Africa Proprietary Limited 1 Fricker Road Illovo, Johannesburg 2196 South Africa Gold Fields Limited Incorporated in the Republic of South Africa Registration number 1968/004880/06 Share code: GFI Issuer code: GOGOF ISIN: ZAE000018123 Investor enquiries Jongisa Magagula Tel: +27 11 562 9775 Mobile: +27 82 562 5288 email: jongisa.magagula@goldfields.com Thomas Mengel Tel: +27 11 562 9849 Mobile: +27 72 493 5170 email: thomas.mengel@goldfields.com Media enquiries Sven Lunsche Tel: +27 11 562 9763 Mobile: +27 83 260 9279 email: sven.lunsche@goldfields.com Transfer secretaries South Africa Computershare Investor Services Proprietary Limited Rosebank Towers 15 Biermann Avenue Rosebank Johannesburg 2196 Private Bag X9000 Saxonwold 2132 Tel: +27 11 370 5000 Fax: +27 11 688 5248 United Kingdom Link Asset Services The Registry 34 Beckenham Road Beckenham Kent BR3 4TU England Tel: 0871 664 0300 If you are outside the United Kingdom please call (0) 371 664 0300. Calls are charged at the standard geographic rate and will vary by provider. Calls outside the United Kingdom will be charged at the applicable international rate. Business is open between 09:00 and 17:30, Monday to Friday excluding public holidays in England and Wales. email: shareholderenquiries@linkgroup.co.uk Listings JSE/NYSE/GFI Directors: YGH Suleman (Chairperson), MJ Fraser* (Chief Executive Officer), PA Schmidt* (Chief Financial Officer), A Andani#, PJ Bacchus†, MC Bitar@, TP Goodlace, JE McGill^, SP Reid^, PG Sibiya, CAT Smit South African unless otherwise stated. ˆAustralian, †British, @Chilean, #Ghanaian, *Executive director www.goldfields.com Overview Governance Our business Strategic pillar 1 Strategic pillar 2 Strategic pillar 3 Assurance Gold Fields IAR-95

Creating enduring value beyond mining
Gold Fields Limited
Annual Financial Report 2023
Gold Fields is a globally diversified gold producer with nine operating mines in Australia, South Africa, Ghana and Peru and
two projects in Canada and Chile. We have total attributable annual gold-equivalent production of 2.30Moz, proved and
probable gold Mineral Reserves of 46.1Moz, measured and indicated gold Mineral Resources of 31.1Moz (excluding Mineral
Reserves) and inferred Gold Mineral Resources of 11.2Moz (excluding Mineral Reserves). Our shares are listed on the
Johannesburg Stock Exchange (JSE) and our American depositary shares trade on the New York Exchange (NYSE).
Contents
| | |
| | |
| | |
| | Statement of responsibility by the Board of Directors |
| | Company Secretary’s Certificate |
| | Chief Executive Officer and Chief Financial Officer Responsibility Statement |
| | |
| | |
| | Management’s discussion and analysis of the financial statements |
| | Report of Independent Registered Public Accounting Firm |
| | |
| | Consolidated income statement |
| | Consolidated statement of comprehensive income |
| | Consolidated statement of financial position |
| | Consolidated statement of changes in equity |
| | Consolidated statement of cash-flows |
| | Notes to the consolidated financial statements |
| | Operating and financial information by mine (unaudited) |
| | Shareholders’ information (unaudited) |
| | |
| | Administration and corporate information |
Notes
The audited financial statements for the year ended 31 December 2023 were prepared by the corporate accounting staff
of Gold Fields headed by Tzvet Ilarionova, the Group Financial Controller. This process was supervised by Paul Schmidt,
the Group’s Chief Financial Officer (CFO).
| | | | |
|
We value your feedback on our reporting suite. To support our efforts to report on the issues our stakeholders care about, please provide any feedback and questions to investors@goldfields.com or sustainability@goldfields.com. You can also visit www.goldfields.com and download the feedback form. |
| Further information available online | | | Further reading available within this report |
Statement of responsibility by the Board of Directors
The directors are responsible for the preparation, integrity and fair presentation of the Annual Financial Statements (AFS) of
Gold Fields Limited (Gold Fields) and its subsidiaries (together referred to as the Group or the Company), comprising the
Consolidated Statement of Financial Position at 31 December 2023, the Consolidated Income Statement and Consolidated
Statement of Comprehensive Income, Changes in Equity and Cash-Flows for the year then ended, the accounting policies
and the notes to the Consolidated Financial Statements, as well as the Directors’ Report. These financial statements
presented on p15 – 177 were prepared in accordance with the IFRS® Accounting Standards and the requirements of the
South African Companies Act No 71 of 2008, as amended (Companies Act), the JSE Limited Listing Requirements and
include amounts based on judgements and estimates made by management.
The directors consider that, in preparing the financial statements, they have used the most appropriate accounting policies,
consistently applied and supported by reasonable and prudent judgements and estimates, and that all IFRS Accounting
Standards they consider to be applicable have been followed. The directors are satisfied that the information contained in
the AFS fairly presents the results of operations and cash-flows for the year and the financial position of the Group at year-
end. The directors also prepared the other information included in the Annual Financial Report (AFR) and are responsible for
both its accuracy and its consistency with the financial statements.
The directors are responsible for ensuring accounting records are kept. The accounting records should disclose with
reasonable accuracy the financial position of the Group to enable the directors to ensure the financial statements comply
with the relevant legislation.
The directors are also responsible for such internal controls as they deem necessary to enable the preparation of financial
statements that are free from material misstatement, whether due to fraud or error, and for maintaining adequate accounting
records and an effective system of risk management.
The directors are also responsible for the controls over and the security of the website and, where applicable, for
establishing and controlling the process for electronically distributing annual reports and other financial information to
shareholders and to the Companies and Intellectual Property Commission (CIPC).
The auditors are responsible for reporting on whether the Consolidated Financial Statements are fairly presented in
accordance with the applicable financial reporting framework.
The going concern basis has been adopted in preparing the financial statements. The directors have no reason to believe
that the Group, or any company within the Group, will not be a going concern in the foreseeable future, based on forecasts
and available cash resources. These financial statements support the viability of the Group.
Gold Fields has adopted a Code of Conduct, which is available on the Gold Fields website and which is adhered to by
the Group.
The Group’s external auditors, PricewaterhouseCoopers Inc (PwC), audited the financial statements, and their report is
presented on p88 – 90.
Approval of consolidated annual financial statements
Gold Fields’ consolidated AFS, as identified in the first paragraph, were approved by the Board of Directors (Board) on
28 March 2024 and are signed on its behalf by:
Mike FraserPaul Schmidt
Chief Executive OfficerChief Financial Officer
Authorised directorAuthorised director
Company Secretary’s Certificate
In terms of section 88(2)(e) of the Companies Act, I certify that the Company has lodged with the CIPC all such returns
required to be lodged by a public company in terms of the Companies Act, and that all such returns are true, correct and
up to date.
Anré Weststrate
Company Secretary
28 March 2024
Chief Executive Officer and Chief Financial Officer
Responsibility Statement
In terms of section 3.84(k) of the JSE Listings Requirements, the directors, whose names are stated below, hereby confirm that:
a.The AFS set out on p91 – 177 fairly present in all material respects the financial position, financial performance and
cash-flows of the issuer in terms of IFRS Accounting Standards;
b.To the best of our knowledge and belief, no facts have been omitted or untrue statements made that would make the
AFS false or misleading;
c.Internal financial controls have been put in place to ensure material information relating to the issuer and its
consolidated subsidiaries have been provided to effectively prepare the financial statements of the issuer;
d.The internal financial controls are adequate and effective and can be relied upon in compiling the AFS, having fulfilled
our role and function as executive directors with primary responsibility for implementation and execution of controls;
e.Where we are not satisfied, we have disclosed to the Audit Committee and the auditors any deficiencies in design and
operational effectiveness of the internal financial controls, and have remediated the deficiencies/taken steps to
remedy the deficiencies; and
f.We are not aware of any fraud involving directors.
Mike FraserPaul Schmidt
Chief Executive OfficerChief Financial Officer
Audit Committee Report
for the year ended 31 December 2023
The members of Gold Fields’ Audit Committee (the Committee) were appointed by our shareholders at the AGM on 1 June
2023. At the AGM, Ms PG Sibiya – who joined the Board and Audit Committee in 2021 – became Chairperson of the Audit
Committee, replacing Mr YGH Suleman, who took over as Board Chairperson on that day. The Committee members are all
independent NEDs. Mr CAT Smit joined the Board and the Committee on 1 June 2023.
Details of the number of meetings held during the year, as well as the attendance thereof by Committee members, are on
p6 of the Governance and Remuneration Report (GRR). Gold Fields’ Board continues to believe that, as a collective, the
Committee members have the necessary skills to carry out their duties effectively and with due care.
The Committee has certain reporting responsibilities to both the shareholders and the Board and is accountable to them.
Its duties, as set out in the Committee Charter, are reviewed annually and incorporate the Committee’s statutory obligations
as set out in the Companies Act, King IV, and paragraph 3.84(g) of the JSE Listings Requirements. A work plan is drawn up
every year, encompassing all these duties, and progress is monitored continually to ensure these obligations are fulfilled
by the Committee.
Among other things, the Committee monitors and reviews:
•The preparation of the AFS, ensuring fair presentation and compliance with IFRS Accounting Standards and the
Companies Act, and recommending same to the Board for approval
•The integrity of the IAR by ensuring its content is reliable and includes all relevant operational, financial and other non-
financial information, risks and other relevant factors
•Together with Board, quarterly, interim and other shareholder-specific financial information
•Filing of the Form 20-F with the US SEC
•Accounting policies of the Group and proposed revisions, and significant and unusual transactions, estimates and
accounting judgements
•The effectiveness of the internal control environment
•The effectiveness of both the internal and external audit functions
•The effectiveness of the Company's Sarbanes-Oxley Act (SOX) controls
•The recommendation and appointment of Gold Fields’ external auditors, and approves their remuneration, reviews the
scope of their audit, their reports and findings, and pre-approves non-audit services in line with Company policy
•JSE attestation and the evaluation of the performance of the CFO
•The adequacy and effectiveness of the Group’s enterprise-wide risk management policies, processes and mitigating
strategies
•The governance of information communication technology (ICT) and the effectiveness of the Group’s information systems
•The cash/debt position of the Group to determine whether the going concern basis of reporting is appropriate
•The Group dividend policy and dividend payments in line with this policy
•The combined assurance model, and provides independent oversight of the effectiveness of the Group’s assurance
functions and services, with particular focus on combined assurance arrangements
•Compliance with applicable legislation, requirements of appropriate regulatory authorities and the Company’s Code of
Conduct
•Policies and procedures for mitigating fraud
•Approval of hedging activities as mandated by the Board
•Consideration of JSE Proactive Monitoring and Combined Findings reports in 2023
Audit Committee Report continued
for the year ended 31 December 2023
External audit
The Committee is responsible for recommending the appointment or reappointment of a firm of external auditors to the
Board that, in turn, will recommend the appointment to shareholders. Upon this recommendation, the Committee is
responsible for determining whether the designated appointee firm and audit partner have the necessary independence,
experience, qualifications and skills, and that the audit fee is adequate.
An external audit fee of R63.5m (US$3.5m) for 2023 was approved, as well as R7.6m (US$0.4m) for other fees.
The Committee reviewed the annual external audit plan presented at its meeting on 14 August 2023, including the scope,
materiality levels and significant risk areas, and established the approach would appropriately respond to organisational and
regulatory changes, as well as any other applicable requirements and risks. The audit plan forms the basis of providing the
Committee with the necessary assurances on risk management, the internal control environment and IT governance. The
plan was approved by the Committee.
PwC had direct access to the Committee throughout the year and met with the Chairperson of the Committee before each
meeting and, when required, on an ad hoc basis. PwC reported to the Committee at each quarterly meeting, as well as at
the year-end meeting. In addition, the Committee regularly met with PwC separately without other invitees present. The
Committee is satisfied that PwC is independent of the Group.
During the year, the Committee reviewed the quality and suitability of the external auditors work focusing on internal quality
control procedures, and in particular external reviews performed by audit Regulators on the firm and the lead engagement
partner. The Audit Committee reviewed reports from PWC relating to quality assessment reviews undertaken internally and
by the Independent Regulatory Board for Auditors (IRBA) and the Public Company Accounting Oversight Board (PCAOB),
including remediation plans to address findings as necessary. There are no significant matters to report to the shareholders.
The Committee concluded the work of the external auditor was satisfactory.
Significant accounting judgements and estimates
Significant areas requiring the use of management estimates and assumptions are detailed in note 1 to the accounting
policies (p94 – 101). Management presented position papers to the Committee detailing estimates and assumptions used,
the external sources and experts consulted, and the basis on which they were applied in the calculations.
Internal audit
Gold Fields Internal Audit (GFIA) is an independent department within the Company, headed by a Vice President Internal
Audit (VP IA) who is appointed and, if necessary, dismissed by the Committee. The VP IA reports directly to the Committee
and has direct access to the Chairperson and members of the Committee, as well as the Board Chairperson. The Committee
Chairperson meets with the VP IA once per quarter and on an ad hoc basis, as required. The VP IA also meets with the
Committee, without management, at least annually and whenever deemed necessary by either the VP IA or the Committee.
The Committee is satisfied that the resources available to GFIA, along with the skills and experience of the department, will
allow the team to fulfil its mandate.
The Committee determines the purpose, authority and responsibility of GFIA in an Internal Audit Charter, which is reviewed
and approved annually. The Committee assesses the performance of GFIA every year. GFIA operates in accordance with
the International Standards for the Professional Practice of Internal Auditing as prescribed by the Institute of Internal
Auditors. The internal audit activities carried out during the year were identified through a combination of the Gold Fields risk
management framework, which includes the combined assurance framework, and the risk-based methodologies adopted by
GFIA. The Committee approves the annual internal audit assurance plan presented by GFIA and monitors progress against
the plan reported to the Committee each quarter.
GFIA ensured that its framework is aligned with the Committee of Sponsoring Organizations of the Treadway Commission’s
(COSO) 2013 internal control framework.
The Group’s internal control systems are designed to provide reasonable assurance on the maintenance of proper
accounting records and the reliability of financial information. It also covers operational areas, compliance with the Gold
Fields Code of Conduct and sustainability records. These systems are monitored by GFIA and its findings and
recommendations are reported to the Committee and senior management.
GFIA reports deficiencies to the Committee every quarter, together with recommended remedial actions, which are then
followed up on to ensure the necessary action has been taken.
GFIA provided the Committee with a written assurance statement on the adequacy and effectiveness of governance, risk
management and controls. No significant events occurred, nor have any been brought to GFIA’s attention, to believe that
governance, risk management and the control environment are inadequate or ineffective.
Information communication and technology governance
ICT governance remains a key focus area for the Group, the responsibility of which was delegated to the Committee by the
Board. The Committee also works with the Risk Committee on related ICT matters.
Gold Fields’ ICT Charter defines the overall direction and governance for ICT across the Group. The VP and Group Head of
ICT is responsible for executing ICT governance procedures in line with this Charter, and reports to the Committee at each
meeting. The Committee reviews his report, which includes the results of all review and testing conducted by management
and GFIA.
Gold Fields adopted the Control Objectives for Information and Related Technology (COBIT) as a governance framework,
and regular assessments are conducted to determine the maturity of ICT governance processes. Gold Fields’ ICT at its
various operations is operating at an overall maturity level of between three and four out of five, indicating that the Group’s
ICT governance framework and processes are established and predictable. Areas of ICT risks across the Group were
defined as part of the Group’s overall risk management framework, and formal policies and procedures are documented and
updated regularly for these areas.
Given the nature of cybersecurity and the rising global cyber risk, cybersecurity has now become a key component of the
Group’s ICT governance and risk agenda. Gold Fields further enhanced its cybersecurity management controls by achieving
the ISO 27001 information security management system certification for all its mines and corporate offices, with the
exception of our offices and operation in Chile.
The ICT Governance, Risk, Architecture, Standards, and Security Compliance (GRASSC) Committee is responsible for
ensuring compliance and adherence to the Group’s ICT policies and procedures. The ICT GRASSC Committee reviews
compliance to the governance framework quarterly and recommends improvements as appropriate.
Chief Financial Officer
The Committee evaluated the expertise and performance of the CFO, Mr PA Schmidt, and continues to be satisfied that he
has the appropriate expertise and experience to carry out his duties as CFO of the Company and the Group and is
supported by highly qualified and competent senior staff. This conclusion is supported by input from both internal and
external auditors. In August 2023, we announced Mr Schmidt's decision to proceed to early retirement by end-April 2024.
The process to appoint a new CFO is led by the Nominations and Governance Committee.
Going concern
After having duly considered the Group’s solvency and liquidity position, the Board has a reasonable belief that the Group
will continue as a going concern for the foreseeable future.
Group compliance governance
The Committee is also responsible for monitoring compliance governance for the Group – a key focus area for the Board
and management as a whole.
The Group Compliance Officer has a detailed, systematic and risk-based framework in place which is overseen, managed
and maintained by an online and interactive Group Compliance Governance Portal. The framework is applied to identify all
laws, regulations and adopted, rules, codes and standards (instruments) applicable to Gold Fields in all jurisdictions in which
the Group operates. Updates on regulatory changes are sourced from external legal sources and internally assessed for
application and impact. Changes are recorded and monitored on a monthly basis. The assessment of potential and/or actual
risk exposure of non-compliance regarding the identified applicable instruments per jurisdiction, includes potential exposure
to financial loss, as well as operational and reputational risks, and the adequacy of recorded controls. Mitigating controls
designed to manage the risks are identified, documented and maintained proactively. GFIA carries out a review of the
effectiveness (in terms of design and operating effectiveness) of the control procedures and reports on the level of
compliance. The results are reported to the Committee in detailed schedules.
Under the ambit of risk exposure assessment, all active suppliers and contractors are screened on a monthly basis based on
an array of predefined risk criteria and adverse media exposure. A screening risk calculator is applied to those assessed
entities posing a risk to Gold Fields, based on the outcome of the screening due diligence.
Audit Committee Report continued
for the year ended 31 December 2023
Apart from conducting screening due diligence, the Committee also oversees the engagement with, and commitments
made, to external stakeholders in terms of the nature and extent of the interactions, and the outcome of these
engagements.
The Committee also ensures Gold Fields’ Code of Conduct is effective and implemented diligently throughout the Group.
Part of the Committee’s oversight role is the analysis of declarations completed by employees, as well as the outcome of
internal disciplinary cases where Code of Conduct transgressions have been identified.
| |
| |
| The Code is available on the Gold Fields website at www.goldfields.com/code-of-conduct.php |
| |
Another focus area is the protection of personal information. Part of the Compliance Governance Framework is dealing with
ensuring the protection of personal information during Group processes and, furthermore, the privacy of this information.
The Committee is also responsible for ensuring all calls to the Gold Fields tip-offs line – administered by an independent
external party – are proactively dealt with. The Chairperson of the Committee, together with GFIA, are custodians of the
formalised and documented investigation procedure in place and, where appropriate and necessary, will make use of
external advisors and experts to investigate matters or follow up on processes. The number and nature of these calls are
reported at the quarterly Committee meetings. The details of the investigations, including details on any action taken, are
also reported to the SET Committee.
The Group’s Risk Committee deals with Group operational and financial risks, as well as the requisite reporting as required
annually. While there is ongoing interaction between the Risk and Audit Committees, the management of financial risk
remains a key focus of the Committee, management and GFIA. Gold Fields’ Group risk disclosures are on p26 – 29 of the
IAR.
Internal control statement
In terms of the US SEC’s listing requirements, Gold Fields has to comply with the requirement of the Sarbanes-Oxley Act of
2002, which requires management to establish and maintain adequate internal control over financial reporting using a
recognised internal controls framework.
Management is accountable to the Board for the design, implementation, monitoring and integration of internal financial
controls for the day-to-day running of the Group, focusing on the efficiency and effectiveness of operations, safeguarding
the Group’s assets, legal and regulatory compliance, business sustainability and reliable reporting, including financial
reporting.
The Committee believes that Gold Fields’ internal controls are effective, and that the financial records can be relied upon as
a reasonable basis for the preparation of the AFS.
Audit Committee Report continued
for the year ended 31 December 2023
Audit Committee statement
The Committee considered and discussed the AFR, the GRR, and IAR with both management and the external auditors.
During this process, the Committee:
•Reviewed the AFS included in the AFR for consistency, fair presentation and compliance with IFRS Accounting Standards
•Evaluated significant estimates and judgements and reporting decisions
•Reviewed the documentation supporting the going concern basis of accounting and concluded that it is appropriate
•Evaluated the material factors and risks that could impact the AFR and IAR
•Evaluated the completeness of the financial and sustainability disclosures
•Discussed the treatment of significant and unusual transactions with management and the external auditors
•Reviewed and discussed the sustainability information disclosed in the IAR and, based on these discussions, is satisfied
that the information is reliable
The Committee considers that the AFR, GRR and the IAR comply with the statutory requirements of the various regulations
governing disclosure and reporting in all material respects, and that the AFS comply in all material respects with the
Companies Act and IFRS Accounting Standards.
The Committee recommended to the Board that the AFS included in the AFR be adopted and approved.
Philisiwe Sibiya
Chairperson: Audit Committee
28 March 2024
Directors’ report
The directors have pleasure in submitting their report and the AFS of the Group for the year ended 31 December 2023.
Review of operations
The activities of the various Gold Fields operations are detailed in our 2023 IAR.
Financial results
The information on the financial position of the Group for the period ended 31 December 2023 is set out on p91 – 177 of this
AFR. The income statement for the Group shows a profit attributable to Gold Fields’ shareholders of US$722m for the year
ended 31 December 2023, compared with a profit of US$711m for the year ended 31 December 2022.
Compliance with financial reporting standards
The Group’s AFS were prepared in accordance with IFRS Accounting Standards as issued by the International Accounting
Standards Board (IASB), the South African Institute of Chartered Accountants (SAICA) Financial Reporting Guides as issued
by the Accounting Practices Committee, Financial Reporting Pronouncements as issued by the Financial Reporting
Standards Council, the JSE Listings Requirements and the Companies Act.
Listings
The abbreviated name under which the Company is listed on the JSE is GFIELDS, and the short code is GFI. The Company
also has a secondary listing on the NYSE.
At 31 December 2023, the Company had in issue, through The Bank of New York Mellon (BNY Mellon) on the NYSE,
201,570,395 (31 December 2022: 248,658,524) American Depository Receipts (ADRs). Each ADR is equal to one ordinary
share.
Directorate
Composition of the Board
The Board currently consists of two executive directors and eight NEDs.
Rotation of directors
Directors retiring in terms of the Company’s MoI are Messrs MJ Fraser, CAT Smit and SP Reid, all of whom are eligible and
offer themselves for re-election.
The boards of Gold Fields’ various subsidiaries comprise some of the executive officers and one or both of the executive
directors, where appropriate, as well as NEDs of the Group.
Directors’ and officers’ disclosure of interests in contracts
During the period under review, no contracts were entered into in which directors and officers of the Company had an
interest, and which significantly affected the business of the Group.
For the year ended 31 December 2023, the directors’ beneficial interest in the issued share capital and listed share capital of
the Company (see adjacent table) was approximately 0.1%. No one director individually exceeded 1% of the issued share
capital or voting control of the Company.
Directors’ report continued
| | | | |
Share ownership of directors and executive officers |
| |
| | |
| | | | |
| | | | |
| | | | |
| | | | |
| | | | |
| | | | |
| | | | |
| | | | |
| | | | |
| | | | |
| | | | |
| | | | |
| | | | |
| | | | |
| | | | |
| | | | |
| | | | |
| | | | |
| | | | |
| | | | |
| | | | |
| | | | |
| | | | |
| | | | |
| | | | |
| | | | |
| | | | |
| | | | |
| | | | |
| | | | |
| | | | |
1Direct ownership – shares owned outright; includes personal investment shares. Subject to tax gross-up at top marginal rate of individual taxation for
minimum shareholding requirement purposes.
2Indirect ownership – restricted MSR shares pledged from performance shares granted under the LTI plan and held in escrow. Not grossed-up for tax.
3Mr Griffith stepped down as CEO and exited the Company with effect from 31 December 2022, and therefore his holdings are not disclosed for 2022.
4S Reid acquired Gold Fields American Depository Receipts (“ADR”) on the open market on 27 November 2023.
5T Leishman, BJ Mattison and C Nagaser, post their resignation in October 2022 and after the closed period was lifted in November 2022, were given
permission by the CEO and Chair of RemCo to trade their restricted MSR shares.
6In accordance with the provisions of the Company’s Minimum Shareholding Requirement (MSR), R Bardien's Indirect Beneficial Holding was released after
the MSR holding period lapsed of which 18,317 Gold Fields shares were retained at the trading date of 30 June 2023.
Related-party information is disclosed in note 43 of the AFR.
Save as disclosed on the Stock Exchange News Services on 27 February 2024 and 6 March 2024, there are no changes in
the directors’ interests occurring between the end of the financial year and the date of approval of the AFR.
Financial affairs
Dividend Policy
The Company’s Dividend Policy is to declare an interim and final dividend of 30% – 45% of normalised earnings. On
22 February 2024, the Company declared a final cash dividend number 99 of 420 South African cents per ordinary share
(2023: 445 South African cents) to shareholders reflected in the register of the Company on 12 March 2024. This dividend
was paid on 18 March 2024. The dividend resulted in a total dividend of 745 South African cents per share for the year
ended 31 December 2023 (2022: 745 South African cents), with the final dividend being accounted for in 2024.
Borrowing powers
In terms of the provisions of section 19(1) of the Companies Act, read together with clause 4 of the Company’s MoI, the
borrowing powers of the Company are unlimited. As at 31 December 2023, the Company’s borrowings totalled US$1,237m,
compared with total borrowings of US$1,079m at 31 December 2022.
Capital expenditure
Capital expenditure (capex) for the year ended 31 December 2023 amounted to US$1,055m compared with US$1,069m for
the year ended 2022. Estimated capex for 2024 is US$1,130m – US$1,190m and is intended to be funded from internal
sources and, to the extent necessary, borrowings.
Significant announcements in 2023
Gold Fields' ESG achievements
31 January 2023
Gold Fields announces three significant achievements in the ESG space: membership of the Bloomberg Gender-Equality
Index, 5th place among over 150 mining in the Dow Jones Sustainability Index ranking and a A- rating in the Carbon
Disclosure Project Water assessment, a step below the highest possible level.
Gold Fields and AngloGold Ashanti propose Tarkwa/Iduapriem JV
16 March 2023
Gold Fields and AngloGold Ashanti propose a joint venture between Gold Fields' Tarkwa mine and the neighbouring
Iduapriem mine managed by AngloGold. Excluding the interest to be held by the Government of Ghana, Gold Fields will
have an interest of 66.7% and AngloGold a 33.3% interest, with the proposed JV managed by Gold Fields Ghana. The
proposal is awaiting the approval by government.
Gold Fields partners with Osisko to develop the Windfall project in Quebec
2 May 2023
Gold Fields announces a partnership with Osisko Mining of Canada to develop and mine the world class underground
Windfall Project in Québec, Canada. Gold Fields bought a 50% interest in the project and near-by exploration ventures for
cash payment of C$300m with a further C$300m payable on receipt of key environmental permits.
Gold Fields appoints new non-executive director
26 May 2023
Gold Fields announces the appointment of Carel Smit as a non-executive director of the company with effect from 1 June
2024. He also joins the Audit Committee of the Board.
Gold Fields announces first sustainability linked loan
5 June 2023
Gold Fields announces that it has successfully refinanced its US$1.2bn 2019 revolving credit facility with a new US$1,.2bn
facility, with an option to increase it by up to US$400m. For the first time, the new facility is linked to the achievement of
three of Gold Fields' key ESG priorities: gender diversity, water stewardship and decarbonisation. A similar payment
structure is implemented for a new A$500m syndicated credit facility announced in October 2024.
Gold Fields issues GISTM conformance reports for priority TSFs
3 August 2023
Gold Fields releases two Tailings Disclosure reports for its Tarkwa and Cerro Corona mines in Ghana and Peru, detailing
their level of conformance against the Global Industry Standard on Tailings Management (GISTM).
Gold Fields releases independent workplace culture report
30 August 2023
Gold Fields releases the findings of an independent review into workplace culture undertaken by Elizabeth Broderick & Co
(EB&Co). The report finds that almost 50% of employees surveyed had experienced some level of bullying, harassment or
discrimination over the past five years. Gold Fields commits to implementing all the recommendations proposed by EB&Co.
Gold Fields appoints Mike Fraser as CEO
9 October 2023
The Board of Directors appoints Mike Fraser as CEO and Executive Director of the Company with effect from 1 January
2024. Fraser was CEO of AIM-listed Chaarat Gold Holdings and before that President and Chief Operating Officer of
South32's key metal businesses. He takes over from Martin Preece, who was Interim CEO from 1 January 2023 onwards.
Gold Fields ranked No 1 in Sunday Times Top 100 Companies ranking
14 November 2023
Gold Fields ranks first in the Sunday Times Top 100 Companies for 2023 by delivering total returns of 668% to shareholders
over the five-year rating period from 1 September 2018 to 31 August 2023, assuming all dividends were reinvested.
Directors’ report continued
Gold Fields announces Scope 3 carbon emissions target for 2030
27 November 2023
Gold Fields announces a 2030 target to reduce Scope 3 carbon emissions by a net 10% from a 2022 baseline. Gold Fields
arrived at its Scope 3 target after spending 18 months working with key suppliers to establish its emissions profile.
Gold Fields sells its 45% shareholding in Asanko
21 December 2023
Gold Fields announces the divestment of its 45% shareholding in the Asanko gold mine in Ghana to JV partner Galiano Gold
for a total consideration of US$170m in cash and shares and a 1% royalty on future production. The transaction completes in
March 2024, with Gold Fields now a 19.9% shareholder in Galiano.
Gold Fields delays first gold production at Salares Norte
28 December 2023
Gold Fields announces a delay in first gold from its Salares Norte Project in Chile to April 2024, after the project is impacted
by delays in pre-commissioning and commissioning activities. Production volumes for 2024 have been revised down and
are expected to fall within a range of 220,000 – 250,000 gold-equivalent ounces.
Going concern
Gold Fields’ AFS were prepared using appropriate accounting policies, supported by reasonable judgements and estimates.
The directors have reasonable belief the Company and Group have adequate resources to continue as a going concern for
the foreseeable future.
Dematerialisation of the shares
Shareholders are reminded that, as a result of the clearing and settlement of trades through Strate, the Company’s share
certificates are no longer good for delivery for trading. Dematerialisation of the Company’s share certificates is a prerequisite
when dealing in the Company’s shares.
Property
The register of property and mineral rights is available for inspection at the registered office of the Company during normal
business hours.
Environmental obligations
The Company’s total gross closure liability for environmental rehabilitation costs amounted to US$598m at 31 December 2023
compared with US$565m at 31 December 2022. The regional gross closure liabilities are as follows:
•Australia: US$231m
•South Africa: US$44m
•West Africa: US$107m
•Americas: US$216m
The funding methods used by each region to make provision for the mine closure cost estimates are:
•Australia – self-funding, using existing cash resources
•South Africa – contributions into environmental trust funds and guarantees
•West Africa – reclamation security agreement bonds underwritten by banks and restricted cash
•Americas – bank guarantees
Contingent liabilities and litigation
A material Group Litigation Report is presented at each Audit Committee meeting for discussion and consideration on
whether the matter remains contingent or whether a provision has to be recognised. Details of Gold Fields’ contingent
liabilities and litigation matters can be found in note 38 of the AFR.
Administration
Ms A Weststrate held the position of Company Secretary for the period under review.
Computershare Investor Services Proprietary Limited (Computershare) is the Company’s South African transfer secretary and
Link Asset Services is the registrar of the Company in the UK.
Auditors
The Audit Committee has recommended to the Board that PwC be appointed as the external auditors of the Company, until
the conclusion of the next AGM, in accordance with section 90(1) of the Companies Act.
Subsidiary Company
Details of major subsidiary companies in which the Company has a direct or indirect interest are set out in note 45 of the
AFR.
Management’s discussion and analysis of the
financial statements
The following Management’s Discussion and Analysis of the Financial Statements should be read together with the
Gold Fields consolidated financial statements, including the notes accompanying these financial statements.
Overview
Gold Fields is a significant producer of gold and a major holder of gold reserves and resources in South Africa, Ghana,
Australia and Peru. In Peru, Gold Fields also produces copper. In Chile, Gold Fields will produce silver and gold from 2024.
Gold Fields is primarily involved in underground and surface gold and surface copper mining and silver from 2024 and
related activities, including exploration, extraction, processing and smelting.
In 2023, the South African, Ghanaian (including Asanko), Peruvian and Australian operations produced 13%, 32%, 10% and
45% of its total gold production, respectively.
Gold Fields’ economic interest in the South Deep mine in South Africa is 96.43%. Gold Fields also owns a 100% of the
St Ives, Agnew, Granny Smith mines and 50% of the Gruyere gold mine in Australia, 90.0% of the Tarkwa and Damang mines
in Ghana and 45% of the Asanko mine in Ghana. Gold Fields also owns 99.5% of the Cerro Corona mine in Peru.
Salares Norte
The Salares Norte Project (100% owned) presents significant growth and value uplift for our portfolio. After several delays
driven by the impacts of the Covid-19 pandemic, adverse weather conditions, supply chain constraints and construction
labour scarcity, the project is nearing completion, with pre-commissioning and commissioning of the three primary circuits
underway. First gold is scheduled for April 2024 and ramp-up for the remainder of 2024. Mining continued as planned
throughout 2023 and early 2024, with a cumulative 87.2Mt waste moved by end-February 2024 and 2.3Mt containing
520koz gold-equivalent on stockpile.
As announced on 28 December 2023, labour availability and an underestimation of the interdependence of pre-
commissioning and commissioning activities have recently delayed the delivery of first gold from the project and its
subsequent ramp-up. Since the beginning of 2024, we have seen progress on labour availability on site and resolved critical
commissioning delays. First dry stack tailings were delivered in February 2024, a key milestone in the pre-commissioning
process.
The project plan has been updated and has been reviewed by independent experts, who have confirmed that they are in
agreement with the project plan for the delivery of first gold by April 2024. The second phase of the review, which is to
confirm the ramp up schedule, is underway and is expected to be completed shortly. For 2024, we are now forecasting
gold-equivalent production of 250koz at AIC of US$1,790/eq oz – US$1,850/eq oz.
Average gold equivalent production for the first five years of the mine life (2025 – 2029) is expected to be 485koz per
annum at an AIC of US$790/eq oz (in 2024 money). Gold equivalent ounces produced over the life of mine (2025 – 2033)
is expected to be 360koz at an AIC of US$820/eq oz (in 2024 money).
During 2023, US$438 million was spent on the project, comprising US$398 million in capital expenditure, US$29 million in
exploration expenditure, US$2 million release of working capital and US$13 million in other cost. The total project capital
cost has been revised to US$1,18 billion – US$1,20 billion (from US$1,04 billion previously), mainly due to additional
contractor costs arising from the delay in the delivery of first gold and ramp up.
We will continue to invest in exploration within the area of the project to add to the life of mine production pipeline. Over
15,000 metres of exploration drilling occurred in 2023 compared to 18,836 metres in 2022.
Our chinchilla rescue and relocation plan started in October 2020 but was halted by the regulator after the loss of two
chinchillas. In June 2023, the regulator approved our revised Environmental Compliance Programme and the sanction was
suspended. Chinchilla relocation activities resumed from February 2024.
Management’s discussion and analysis of the financial statements continued
Asanko Gold
On 21 December 2023, Gold Fields announced the divestment of its 45% shareholding in Asanko Gold (both the preference
shares and equity-accounted investee) to the joint venture partner Galiano Gold for a total consideration of US$170 million.
Gold Fields will also receive a 1% net smelter royalty on future production from the Nkran deposit, the main deposit at the
mine. The transaction was subject to a number of conditions and was concluded on 4 March 2024 with the receipt of
US$65 million cash and 28.5 million Galiano shares. Refer notes 15, 18 and 20 for further details.
The share of results of equity investee of Asanko Gold have been presented as a discontinued operation in the
consolidated financial statements and the comparative income statement have been presented as if Asanko Gold had been
discontinued from the start of the comparative years. The investment in Asanko Gold, including the Asanko redeemable
preference shares, has been presented as an asset held for sale.
Rusoro
On 9 January 2024, Gold Fields announced that it has entered into a share purchase agreement with Fulcrum Global
Markets LLC, a Delaware limited liability company, to sell its 140,000,001 common shares in the capital of Rusoro for an
aggregate initial cash purchase price of US$62.3 million and certain additional contingent consideration upon the
occurrence of specified events. The transaction was concluded on 22 January 2024 when the US$62.3 million was
received by Gold Fields. Refer note 15 for further details.
The investment in Rusoro has been presented as an asset held for sale at US$nil as Fulcrum was in advanced discussions
with Gold Fields at 31 December 2023 to purchase the Rusoro shares from Gold Fields.
Reserves
As of 31 December 2023, Gold Fields reported attributable proved and probable gold and copper reserves of approximately
45 million ounces (2022: 46 million ounces) of gold and 336 million pounds (2022: 398 million pounds) of copper.
Gold production
| | | | | | |
| | | |
Figures in thousands unless otherwise stated | | Gold produced – oz Attributable | | Gold produced – oz Attributable | | Gold produced – oz Attributable |
| | | | | | |
| | | | | | |
| | | | | | |
| | | | | | |
| | | | | | |
| | | | | | |
| | | | | | |
| | | | | | |
| | | | | | |
| | | | | | |
| | | | | | |
| | | | | | |
| | | | | | |
| | | | | | |
| | | | | | |
Continuing and discontinued operations | | | | | | |
Managed gold production for the Group (including Asanko) was 2,387 million ounces (2022: 2,488 million ounces and 2021:
2,430 million ounces) of gold equivalents in 2023, 2,304 million ounces (2022: 2,399 million ounces and 2021: 2,341 million
ounces) of which were attributable to Gold Fields with the remainder attributable to non-controlling shareholders in Ghana,
Peru and South Deep.
Managed gold production for the Group (excluding Asanko) was 2,327 million ounces (2022: 2,411 million ounces and 2021:
2,336 million ounces) of gold equivalents in 2023, 2,244 million ounces (2022: 2,322 million ounces and 2021: 2,246 million
ounces) of which were attributable to Gold Fields with the remainder attributable to non-controlling shareholders in Ghana,
Peru and South Deep.
Continuing operations
At South Deep in South Africa, production decreased by 2% from 10,200 kilograms (327,900 ounces) in 2022 to 10,021
kilograms (322,200 ounces) in 2023. The decrease was due to lower underground reef yield as a result of lower mine call
factor and plant recovery factor which was impacted by the increase in waste to ore mill ratio.
At the Ghanaian operations (excluding Asanko), gold production decreased by 8% from 761,600 ounces in 2022 to 703,600
ounces in 2023, mainly due to decreased production at Damang with the completion of mining at the Huni and Lima Kwesi
Gap (LKG) pits and increased processing of low-grade stockpiles. At Tarkwa, gold production increased by 4% from 531,600
ounces in 2022 to 551,100 ounces in 2023 due to higher tonnes processed and improved yield. At Damang, gold
production decreased by 34% from 230,000 ounces in 2022 to 152,600 ounces in 2023 mainly due to lower yield resulting
from lower grade of ore processed.
Gold equivalent production at Cerro Corona decreased by 8% from 260,500 ounces in 2022 to 239,200 ounces in 2023
mainly due to lower tonnes processed combined with lower grade gold processed as well as the lower price factor.
At the Australian operations, gold production increased marginally from 1,061,100 ounces in 2022 to 1,061,500 ounces in
2023. St Ives’ gold production decreased by 1% from 376,700 ounces in 2022 to 371,800 ounces in 2023. At Agnew, gold
production increased by 2% from 239,200 ounces in 2022 to 244,900 ounces in 2023 due to a 12% increase in ore tonnes
processed, partially offset by a 9% decrease in yield. At Granny Smith, gold production decreased by 1% from 287,900
ounces in 2022 to 283,900 ounces in 2023 due to a 12% decrease in yield on lower grades mined, partially offset by
increased ore tonnes processed. At Gruyere, gold production attributable to Gold Fields increased by 2% from 157,300
ounces in 2022 to 161,000 ounces in 2023 due to increased ore processed.
Discontinued operations
At Asanko, gold production attributable to Gold Fields decreased by 21% from 76,700 ounces in 2022 to 60,300 ounces in
2023 mainly due to lower yield as a result of processing of stockpiles.
Non-IFRS measures
The Annual Financial Report (“AFR”) contains certain non-IFRS financial measures in respect of the Group’s financial
performance, the statement of financial position and cash flows presented in order to provide users with relevant information
and measures used by the Group to assess performance. Non-IFRS financial measures are financial measures other than
those defined or specified under relevant accounting standards. They are presented for illustrative purposes only and due
to their nature may not fairly present Gold Fields’ financial position, changes in equity, results of operations or cash flows.
In addition, these measures may not be comparable to similarly titled measures used by other companies. The following
table sets out the Non-IFRS financial measures disclosed throughout the AFR and where they are reconciled to IFRS
Accounting Standards:
| | | | |
| | | | Reference to where reconciled to IFRS Accounting Standards |
| | | | |
All-in sustaining costs (“AISC”) | | Intended to provide transparency into the costs associated with producing and selling an ounce of gold. | | |
| | Intended to provide transparency into the costs associated with producing and selling an ounce of gold (including growth capital). | | |
| | | | |
| | | |
Net debt (excluding lease liabilities) | | Used in the ratio to monitor the capital of the Group. | |
Net debt to adjusted EBITDA | | | |
| | Used to measure the cash generated by the core business. | | |
Adjusted free cash flow from operations | | Used to measure the cash generated by the core business. | | |
Sustaining and non-sustaining capital expenditure | | Used in the determination of AISC and AIC. | | |
Normalised profit attributable to owners of the parent and normalised profit per share attributable to owners of the parent | | Forms the basis of the dividend pay-out policy. | | |
Management’s discussion and analysis of the financial statements continued
Revenues
Substantially all of Gold Fields’ revenues are derived from the sale of gold and copper. As a result, Gold Fields’ revenues are
directly related to the prices of gold and copper. Historically, the prices of gold and copper have fluctuated widely. The gold
and copper prices are affected by numerous factors over which Gold Fields does not have control. The volatility of gold
and copper prices is illustrated in the following tables, which show the annual high, low and average of the London
afternoon fixing price of gold and the London Metal Exchange (“LME”) cash settlement price for copper in US Dollar for the
past 12 calendar years (2012 to 2023):
Source: Iress
1Rounded to the nearest US Dollar.
On 20 March 2024, the London afternoon fixing price of gold was US$2,157/oz.
Source: Iress
1Rounded to the nearest US Dollar.
On 20 March 2024, the LME cash settlement price for copper was US$8,790/t.
Gold Fields sells the gold it produces at market prices to obtain the maximum benefit from prevailing gold prices. As a
general rule, Gold Fields does not enter into hedging arrangements such as forward sales or derivatives which establish
a price in advance for the sale of its future gold production. However, hedges can be undertaken in one or more of the
following circumstances:
•to protect cash flows at times of significant capital expenditures;
•for specific debt servicing requirements; and
•to safeguard the viability of higher cost operations.
Significant changes in the prices of gold and copper over a sustained period of time may lead Gold Fields to increase or
decrease its production in the near term, which could have a material impact on Gold Fields’ revenues.
Sales of copper concentrate are “provisionally priced” – that is, the selling price is subject to final adjustment at the end of a
period normally ranging from 30 to 90 days after delivery to the customer, based on market prices at the relevant quotation
points stipulated in the contract.
Revenue on provisionally priced copper concentrate sales is recorded on the date of shipment, net of refining and treatment
charges, using the forward LME price to the estimated final pricing date, adjusted for the specific terms of the agreements.
Variations between the price used to recognise revenue and the actual final price received can be caused by changes in
prevailing copper and gold prices. Changes in the fair value as a result of changes in forward metal prices are classified as
provisional price adjustments and included as a component of revenue.
Gold Fields’ realised gold and copper prices
The following table sets out the average, the high and the low London afternoon fixing price per ounce of gold and Gold
Fields’ average US Dollar realised gold price during the past three years.
| | | |
| | | |
| | | |
| | | |
| | | |
| | | |
Gold Fields’ average realised gold price2 | | | |
1Prices stated per ounce.
2Gold Fields’ average realised gold price (excluding Asanko) may differ from the average gold price due to the timing of its sales of gold within each year.
The following table sets out the average, the high and the low LME cash settlement price per tonne for copper and Gold
Fields’ average US Dollar realised copper price during the past three years.
| | | |
| | | |
| | | |
| | | |
| | | |
| | | |
Gold Fields’ average realised copper price2 | | | |
1Prices stated per tonne.
2Gold Fields’ average realised copper price may differ from the average copper price due to the timing of its sales of copper within each year.
Production
Gold Fields’ revenues are primarily driven by its production levels and the price it realises on the sale of gold. Production
levels are affected by a number of factors, some of which are described below. Total managed production for the Group
(including Asanko) decreased by 4% from 2,488 million ounces in 2022 to 2,387 million ounces in 2023. Total managed
production (excluding Asanko) decreased by 3% from 2,411 million ounces in 2022 to 2,327 million ounces in 2023.
Labour impact
In recent years, Gold Fields has not experienced union activity in the countries in which it operates.
Over the years, Gold Fields has sought to develop relationships with trade unions that are supportive of the delivery of our
business objectives, and the Group remains committed to this engagement.
There were no work stoppages as a result of strikes during 2022 and 2023 at any of the Gold Fields operations.
Management’s discussion and analysis of the financial statements continued
Health and safety impact
Gold Fields’ operations are also subject to various health and safety laws and regulations that impose various duties on
Gold Fields’ mines while granting the authorities broad powers to, among other things, close or suspend operations at
unsafe mines and order corrective action relating to health and safety matters. Additionally, it is Gold Fields’ policy to halt
production at its operations when serious accidents occur in order to rectify dangerous situations and, if necessary, retrain
workers.
In 2023, two fatalities occurred at our Tarkwa mine in Ghana both involving contractors working on site. Furthermore, we
recorded a fatal incident during the reconstruction of the T&A Stadium in Tarkwa, a project funded by the Gold Fields
Ghana Foundation.
After year-end, on 2 January 2024, a trackless mechanical supervisor at South Deep in South Africa was fatally injured
underground in a trackless equipment related incident.
Gold Fields expects that should the above factors continue, production levels and costs in the future will be impacted.
Costs
Over the last three years, Gold Fields’ production costs consisted primarily of labour and contractor costs, power, water and
consumable stores, which include explosives, diesel fuel, other petroleum products and other consumables. Gold Fields
expects that its total costs, particularly the input costs noted above, are likely to continue to increase in the near future
driven by general economic trends, market dynamics and other regulatory changes.
In order to counter the effect of increasing costs in the mining industry, the Group rationalised and prioritised capital
expenditure without undermining the sustainability of its operations and continued prioritisation of cash generation over
production volumes. The Group also undertook further reductions in labour costs.
South Africa region
South Deep is labour intensive due to the use of deep level underground mining methods. As a result, over the last three
fiscal years labour has represented on average 26% of AIC, as defined on page 22. In 2023, labour represented 26% of AIC
at South Deep.
At South Deep, power and water made up on average 9% of AIC over the last three years. In 2023, power and water costs
made up 9% of AIC.
Gold Fields’ South Deep mining operation depends on electrical power generated by the state-owned power provider
Eskom which is regulated by the National Energy Regulator of South Africa (“NERSA”). Eskom tariffs are determined through
a consultative multi-year price determination (“MYPD”) process, with occasional tariff increase adjustments under the NERSA
regulated Regulatory Clearing Account (“RCA”) mechanism. In the most recent MYPD process, NERSA granted Eskom tariff
increases of 9.61% for the period 2022/2023 and 18.65% for the period 2023/2024, which includes an RCA amount of
R15 billion. In January 2023, NERSA granted Eskom a 12.74% tariff increase for the period 2024/2025, which will take effect
in April 2024.
South Deep has completed the construction on a 50MW solar power plant with studies underway to expand the renewable
energy base load with wind turbines. A surveillance program has also been implemented at South Deep to proactively
detect anomalies, conduct repairs and restore the integrity of the transmission line.
South Deep commissioned a meteorological mast in 2022 to collect data required to evaluate wind as a source of energy.
An Environmental Impact Assessment commenced in December 2022 and will be completed in approximately 17 months.
Eskom is currently undergoing a vertical unbundling to separate its generation, transmission and distribution functions. The
exact timing and impact of the vertical unbundling is not known but it may result in tariff increases, price instability and/or
poor reliability in the supply of electricity. In July 2023, NERSA approved a 25-year transmission licence for the National
Transmission Company of South Africa (“NTCSA”), which is a wholly owned subsidiary of Eskom Holdings and further
approved the trading licence and import/export licence in September 2023. Eskom has reported that the transmission
company will be operational by 2025. Integrity of transmission lines are also at risk due to poor maintenance and criminal
interventions resulting in failure.
West Africa region
In Ghana, Tarkwa and Damang mines are primarily supplied power by Genser Energy Ghana Limited (“GEGL”), an
independent power producer with on-site gas turbines through a long-term power purchase agreement. Prior to installation
of the on-site turbines, Tarkwa and Damang were supplied power by Volta River Authority (“VRA”) and Electricity Company
of Ghana (“ECG”), respectively. The supply provided by the VRA and ECG was unreliable, with high tariffs and to reduce their
reliance on power supplied by the VRA and ECG, Tarkwa and Damang entered into a power purchasing agreement with
GEGL. Both VRA and ECG now serve as back supply for the Tarkwa and Damang mines, respectively.
The independent power supply accounts for 98% of the electricity consumed at Tarkwa mine and 100% at Damang mine
with a 27.5MW power plant at Damang and a 55MW power plant at Tarkwa mine. Tarkwa and Damang are supplied with
natural gas via a 77km buried pipeline from Takoradi. GEGL, at Tarkwa Mine’s request, installed a turbine to allow the mine
to operate in Island mode, eliminating stoppages caused by technical issues with the national grid.
Both mines are certified to ISO 50001 (energy management systems standard) since 2018.
Power and water costs represented on average 3% of AIC at Tarkwa over the last three years, and 3% of AIC during 2023.
Over the last three years, power and water costs represented on average 7% of AIC at Damang with 7% in 2023.
Contractor costs represented on average 29% of AIC at Tarkwa over the last three years, and 32% of AIC during 2023. Over
the last three years, contractor costs represented on average 35% of AIC at Damang with 27% in 2023. The decrease is due
to the completion of mining during the December 2023 quarter. Direct labour costs represent on average a further 9% of
AIC at Tarkwa over the last three years and 8% in 2023. Over the last three years, direct labour costs represented on
average 12% at Damang and 9% in 2023.
South American region
Gold Fields is developing a 26MW hybrid solar and thermal power solution for the Salares Norte project. Diesel generators
provide 16MW and a 8MW solar plant will be added in early 2025 and will provide about 20% of the mine’s electricity.
Cerro Corona’s electricity supply from Kallpa has been certified as renewable since 2021. The mine has been certified to
ISO 50001 since 2018.
At Cerro Corona, contractor costs represented on average 36% of AIC over the last three years and 38% of AIC during
2023. Direct labour costs represent on average a further 16% of AIC over the last three years and 17% in 2023. Power and
water made up on average a further 5% of AIC over the last three years and 5% in 2023.
Australia region
Agnew’s microgrid of 18MW wind, 4MW solar, 13MW/4MWh battery storage, 18MW gas, 3MW diesel averaged 50% overall
renewable electricity in 2023, with up to 85% in good weather conditions. Granny Smith’s hybrid system, comprising 8MW
solar, 2MW/1MWh battery storage, 35MW gas and 5MW diesel, generated 7% of its electricity supply from renewables.
A 12MW solar plant, supplemented by 4.4 MW/4.4MWh battery storage, 53MW gas and 3MW diesel at Gruyere mine
supplied 9% renewable electricity in 2023.
St Ives’ electricity is currently generated from natural gas and sourced through a power purchase agreement. A renewable
energy plant is planned to supply 73% of the mine’s electricity requirements from 2026.
The four mines were certified to ISO 50001 (energy management systems standard) during 2023.
Management’s discussion and analysis of the financial statements continued
At the Australian operations, mining operations have historically and continue to conducted by a mix of owner and
contractor mining. At Agnew, underground mining is undertaken by a mix of owner and contractor mining, while the open pit
mining is conducted by outside contractors. At St Ives, underground mining is undertaken by contractors, while the open pit
mining is a mix of owner and contractor mining. Over the last three years, total contractor costs represented on average
29% at St Ives and 27% at Agnew of AIC and direct labour costs represented on average a further 11% at St Ives and 12% at
Agnew of AIC. In 2023, contractors and direct labour costs represented 30% and 10% at St Ives and 29% and 12% at Agnew,
respectively. Power and water made up, on average, a further 5% and 1% of AIC over the last three years and 5% and 1% of
AIC in 2023 at St Ives and Agnew, respectively. At Granny Smith, mining operations and development are conducted
through owner mining. Over the last three years, contractors and direct labour costs represented, on average, 9% and 20%,
respectively, at Granny Smith. In 2023, contractors and direct labour costs represented 10% and 21% at Granny Smith. Power
and water made up, on average, a further 5% of AIC over the last three years and 6% of AIC in 2023 at Granny Smith. At
Gruyere, mining operations and development are conducted by contractor mining. Over the last three years, contractors
and direct labour costs represented, on average, 16% and 7%, respectively, at Gruyere. In 2023, contractors and direct
labour costs represented 14% and 6% at Gruyere. Power and water made up a further 8% of AIC over the last three years
and 8% in 2023 at Gruyere. In 2023, there were significant mining contractor rate increases affecting St Ives, Agnew and
Gruyere.
The remainder of Gold Fields’ total costs consists primarily of amortisation and depreciation, exploration costs and selling,
administration and general and corporate charges.
All-in sustaining and all-in costs
The World Gold Council worked closely with its member companies to develop definitions for AISC and AIC. The World Gold
Council is not a regulatory industry organisation and does not have the authority to develop accounting standards or
disclosure requirements. AISC and AIC are non-IFRS measures. These non-IFRS measures are intended to provide further
transparency into the costs associated with producing and selling an ounce of gold. These metrics are helpful to investors,
governments, local communities and other stakeholders in understanding the economics of gold mining. The AISC
incorporates costs related to sustaining current production. The AIC include additional costs which relate to the growth of
the Group. AISC, as defined by the World Gold Council, are operating costs plus all costs not already included therein
relating to sustaining current production, including sustaining capital expenditure. The value of by-product revenues such
as silver and copper is deducted from operating costs as it effectively reduces the cost of gold production. AIC starts with
AISC and adds additional costs which relate to the growth of the Group, including non-sustaining capital expenditure and
exploration, evaluation and feasibility costs not associated with current operations.
AISC and AIC are reported on a per ounce of gold basis, net of by-product revenues (as per the World Gold Council
definition) as well as on a per ounce of gold equivalent basis, gross of by-product revenues.
An investor should not consider AISC and AIC or operating costs in isolation or as alternatives to operating costs, cash flows
from operating activities or any other measure of financial performance presented in accordance with IFRS Accounting
Standards. AISC and AIC as presented in this Annual Financial Report may not be comparable to other similarly titled
measures of performance of other companies.
The tables on the following pages set out a reconciliation of Gold Fields’ cost of sales before gold inventory change and
amortisation and depreciation, as calculated in accordance with IFRS Accounting Standards (refer to the consolidated
financial statements), to its AISC and AIC net of by-product revenues per ounce of gold sold for 2023 and 2022. The
following tables also set out AISC and AIC gross of by-product revenue on a gold equivalent ounce basis for 2023
and 2022.
| | | | | | | | | | | | | |
| |
| | | AISC and AIC, net of by-product revenue per ounce of gold | | |
| | | | For the year ended 31 December 2023 | | | | | |
Figures in millions unless otherwise stated | | | | | | | | | | | | | Continuing and discontinued operations |
| | | | | | | | | | | | | |
Cost of sales before gold inventory change and amortisation and depreciation | | | | | | | | | | | | | |
| | | | | | | | | | | | | |
| | | | | | | | | | | | | |
Community/social responsibility costs7 | | | | | | | | | | | | | |
Non-cash remuneration (share-based payments) | | | | | | | | | | | | | |
Cash remuneration (long-term employee benefits)7 | | | | | | | | | | | | | |
| | | | | | | | | | | | | |
| | | | | | | | | | | | | |
Rehabilitation, amortisation and interest7 | | | | | | | | | | | | | |
Sustaining capital expenditure3,7 | | | | | | | | | | | | | |
| | | | | | | | | | | | | |
Exploration, feasibility and evaluation costs | | | | | | | | | | | | | |
| | | | | | | | | | | | | |
Realised gains/losses on capital cost hedges7 | | | | | | | | | | | | | |
Non-cash remuneration (share- based payments) | | | | | | | | | | | | | |
Cash remuneration (long-term employee benefits)7 | | | | | | | | | | | | | |
| | | | | | | | | | | | | |
Exploration, feasibility and evaluation costs5,7 | | | | | | | | | | | | | |
Non-sustaining capital expenditure3,7 | | | | | | | | | | | | | |
| | | | | | | | | | | | | |
Gold only ounces sold ('000oz) | | | | | | | | | | | | | |
| | | | | | | | | | | | | |
All-in sustaining costs net of by-product revenue per ounce of gold sold (US$/oz) | | | | | | | | | | | | | |
| | | | | | | | | | | | | |
All-in costs net of by-product revenue per ounce of gold sold (US$) | | | | | | | | | | | | | |
1Equity-accounted joint venture. Asanko has been presented as a discontinued operation, refer note 14 of the AFR for further details.
2By-product revenue at Cerro Corona relates to copper. For all the other operations, by-product revenue relates to silver.
3Sustaining capital expenditure represents the majority of capital expenditures at existing operations, including underground mine development costs,
ongoing replacement of mine equipment and other capital facilities and other capital expenditures at existing operations and is calculated as total capital
expenditure of US$1,054.7 million per note 44 to the consolidated financial statements, less non-sustaining capital expenditures. Non-sustaining capital
expenditures (or growth capital) represent capital expenditures for major growth projects as well as enhancement capital for significant infrastructure
improvements at existing operations. The corporate and projects non-sustaining capital expenditure of US$19.0 million relates to the Windfall Project capital.
4This total may not reflect the sum of the line items due to rounding.
5Includes exploration, feasibility and evaluation and share of equity-accounted losses of Far Southeast Gold Resources Incorporated (“FSE”).
6Other includes offshore structure costs and management fees.
7Based on information underlying the audited consolidated annual financial statements of Gold Fields Limited for the year ended 31 December 2023.
Management’s discussion and analysis of the financial statements continued
| | | | | | | | | | | | | |
| |
| | | AISC and AIC, gross of by-product revenue per ounce of gold | | |
| | | | For the year ended 31 December 2023 | | | | | |
Figures in millions unless otherwise stated | | | | | | | | | | | | | Continuing and discontinued operations |
| | | | | | | | | | | | | |
All-in sustaining costs (per table above) | | | | | | | | | | | | | |
Add back by-product revenue2,4 | | | | | | | | | | | | | |
All-in sustaining costs gross of by-product revenue3 | | | | | | | | | | | | | |
All-in costs (per table above) | | | | | | | | | | | | | |
Add back by-product revenue2,4 | | | | | | | | | | | | | |
All-in costs gross of by- product revenue3 | | | | | | | | | | | | | |
Gold equivalent ounces sold | | | | | | | | | | | | | |
All-in sustaining costs gross of by-product revenue (US$/ equivalent oz) | | | | | | | | | | | | | |
All-in costs gross of by- product revenue (US$ equivalent oz) | | | | | | | | | | | | | |
1Equity-accounted joint venture. Asanko has been presented as a discontinued operation, refer note 14 of the AFR for further details.
2By-product revenue at Cerro Corona relates to copper. For all the other operations, by-product revenue relates to silver.
3This total may not reflect the sum of the line items due to rounding.
4Based on information underlying the audited consolidated annual financial statements of Gold Fields Limited for the year ended 31 December 2023.
| | | | | | | | | | | | | |
| |
| | | AISC and AIC, net of by-product revenue per ounce of gold | | |
| | | | For the year ended 31 December 2022 | | | | | |
Figures in millions unless otherwise stated | | | | | | | | | | | | | Continuing and discontinued operations |
| | | | | | | | | | | | | |
Cost of sales before gold inventory change and amortisation and depreciation | | | | | | | | | | | | | |
| | | | | | | | | | | | | |
| | | | | | | | | | | | | |
Realised gains or losses on commodity cost hedges7 | | | | | | | | | | | | | |
Community/social responsibility costs7 | | | | | | | | | | | | | |
Non-cash remuneration (share-based payments) | | | | | | | | | | | | | |
Cash remuneration (long- term employee benefits)7 | | | | | | | | | | | | | |
| | | | | | | | | | | | | |
| | | | | | | | | | | | | |
Rehabilitation, amortisation and interest7 | | | | | | | | | | | | | |
Sustaining capital expenditure3,7 | | | | | | | | | | | | | |
| | | | | | | | | | | | | |
Exploration, feasibility and evaluation costs | | | | | | | | | | | | | |
| | | | | | | | | | | | | |
Realised gains/losses on capital cost hedges7 | | | | | | | | | | | | | |
Non-cash remuneration (share-based payments) | | | | | | | | | | | | | |
Cash remuneration (long- term employee benefits)7 | | | | | | | | | | | | | |
| | | | | | | | | | | | | |
Exploration, feasibility and evaluation costs5,7 | | | | | | | | | | | | | |
Non-sustaining capital expenditure3,7 | | | | | | | | | | | | | |
| | | | | | | | | | | | | |
Gold only ounces sold ('000oz) | | | | | | | | | | | | | |
| | | | | | | | | | | | | |
All-in sustaining costs net of by-product revenue per ounce of gold sold (US$/oz) | | | | | | | | | | | | | |
| | | | | | | | | | | | | |
All-in costs net of by- product revenue per ounce of gold sold (US$) | | | | | | | | | | | | | |
1Equity-accounted joint venture. Asanko has been presented as a discontinued operation, refer note 14 of the AFR for further details.
2By-product revenue at Cerro Corona relates to copper. For all the other operations, by-product revenue relates to silver.
3Sustaining capital expenditure represents the majority of capital expenditures at existing operations, including underground mine development costs,
ongoing replacement of mine equipment and other capital facilities and other capital expenditures at existing operations and is calculated as total capital
expenditure of US$1,069.3 million per note 44 to the consolidated financial statements, less non-sustaining capital expenditures. Non-sustaining capital
expenditures (or growth capital) represent capital expenditures for major growth projects as well as enhancement capital for significant infrastructure
improvements at existing operations.
4This total may not reflect the sum of the line items due to rounding.
5Includes exploration, feasibility and evaluation and share of equity-accounted losses of Far Southeast Gold Resources Incorporated (“FSE”).
6Other includes offshore structure costs and management fees.
7Based on information underlying the audited consolidated annual financial statements of Gold Fields Limited for the year ended 31 December 2022.
8The comparatives for Salares Norte have been reclassified from the Corporate and Projects Segment.
Management’s discussion and analysis of the financial statements continued
| | | | | | | | | | | | | |
| |
| | | AISC and AIC, gross of by-product revenue per ounce of gold | | |
| | | | For the year ended 31 December 2022 | | | | | |
Figures in millions unless otherwise stated | | | | | | | | | | | | | Continuing and discontinued operations |
| | | | | | | | | | | | | |
All-in sustaining costs (per table above) | | | | | | | | | | | | | |
Add back by-product revenue2,4 | | | | | | | | | | | | | |
All-in sustaining costs gross of by-product revenue3 | | | | | | | | | | | | | |
All-in costs (per table above) | | | | | | | | | | | | | |
Add back by-product revenue2,4 | | | | | | | | | | | | | |
All-in costs gross of by- product revenue3 | | | | | | | | | | | | | |
Gold equivalent ounces sold | | | | | | | | | | | | | |
All-in sustaining costs gross of by-product revenue (US$/equivalent oz) | | | | | | | | | | | | | |
All-in costs gross of by- product revenue (US$ equivalent oz) | | | | | | | | | | | | | |
1Equity-accounted joint venture. Asanko has been presented as a discontinued operation, refer note 14 of the AFR for further details.
2By-product revenue at Cerro Corona relates to copper. For all the other operations, by-product revenue relates to silver.
3This total may not reflect the sum of the line items due to rounding.
4Based on information underlying the audited consolidated annual financial statements of Gold Fields Limited for the year ended 31 December 2022.
5The comparatives for Salares Norte have been reclassified from the Corporate and Projects Segment.
AISC and AIC
AISC net of by-product revenues (including Asanko) increased by 17% from US$1,105 per ounce of gold in 2022 to
US$1,295 per ounce of gold in 2023, mainly due to lower gold sold, higher sustaining capital expenditure and higher cost
of sales before amortisation and depreciation, partially offset by the 13% weakening of the South African Rand against the
US Dollar and 4% weakening of the Australian Dollar against the US Dollar. AIC net of by-product revenues (including
Asanko) increased by 15% from US$1,320 per ounce of gold in 2022 to US$1,512 per ounce of gold in 2023, due the same
reasons as above, partially offset by lower non-sustaining capital expenditure.
AISC net of by-product revenues (excluding Asanko) increased by 18% from US$1,097 per ounce of gold in 2022 to
US$1,289 per ounce of gold in 2023, due to the same reasons as above. AIC net of by-product revenues (excluding Asanko)
increased by 14% from US$1,317 per ounce of gold in 2022 to US$1,507 per ounce of gold in 2023, due to the same reasons
as above.
AISC gross of by-product revenues (including Asanko) increased by 17% from US$1,130 per ounce of gold in 2022 to
US$1,321 per ounce of gold in 2023, due to the same reasons as above. AIC gross of by-product revenues (including
Asanko) increased by 14% from US$1,334 per ounce of gold in 2022 to US$1,527 per ounce of gold in 2023, due to the
same reasons as above.
AISC gross of by-product revenues (excluding Asanko) increased by 17% from US$1,124 per ounce of gold in 2022 to
US$1,316 per ounce of gold in 2023, due to the same reasons as above. AIC gross of by-product revenues (excluding
Asanko) increased by 15% from US$1,331 per ounce of gold in 2022 to US$1,524 per ounce of gold in 2023, due to the
same reasons as above.
The tables on the following pages set out a reconciliation of Gold Fields’ cost of sales before gold inventory change and
amortisation and depreciation, as calculated in accordance with IFRS (refer to the consolidated financial statements), to its
AISC and AIC net of by-product revenues per ounce of gold sold for 2021. The following tables also set out AISC and AIC
gross of by-product revenue on a gold equivalent ounce basis for 2021.
| | | | | | | | | | | | |
| |
| | | AISC and AIC, net of by-product revenue per ounce of gold | | |
| | | | For the year ended 31 December 2021 | | | | |
Figures in millions unless otherwise stated | | | | | | | | | | | | Continuing and discontinued operations |
| | | | | | | | | | | | |
Cost of sales before gold inventory change and amortisation and depreciation | | | | | | | | | | | | |
| | | | | | | | | | | | |
| | | | | | | | | | | | |
Realised gains or losses on commodity cost hedges7 | | | | | | | | | | | | |
Community/social responsibility costs7 | | | | | | | | | | | | |
Non-cash remuneration (share- based payments) | | | | | | | | | | | | |
Cash remuneration (long-term employee benefits)7 | | | | | | | | | | | | |
| | | | | | | | | | | | |
| | | | | | | | | | | | |
Rehabilitation, amortisation and interest7 | | | | | | | | | | | | |
Sustaining capital expenditure3,7 | | | | | | | | | | | | |
| | | | | | | | | | | | |
Exploration, feasibility and evaluation costs | | | | | | | | | | | | |
| | | | | | | | | | | | |
Realised gains/losses on capital cost hedges7 | | | | | | | | | | | | |
Non-cash remuneration (share- based payments) | | | | | | | | | | | | |
Cash remuneration (long-term employee benefits)7 | | | | | | | | | | | | |
| | | | | | | | | | | | |
| | | | | | | | | | | | |
Exploration, feasibility and evaluation costs5,7 | | | | | | | | | | | | |
Non-sustaining capital expenditure3,7 | | | | | | | | | | | | |
| | | | | | | | | | | | |
Gold only ounces sold ('000oz) | | | | | | | | | | | | |
| | | | | | | | | | | | |
All-in sustaining costs net of by-product revenue per ounce of gold sold (US$/oz) | | | | | | | | | | | | |
| | | | | | | | | | | | |
All-in costs net of by-product revenue per ounce of gold sold (US$) | | | | | | | | | | | | |
1Equity-accounted joint venture. Asanko has been presented as a discontinued operation, refer note 14 of the AFR for further details.
2By-product revenue at Cerro Corona relates to copper. For all the other operations, by-product revenue relates to silver.
3Sustaining capital expenditure represents the majority of capital expenditures at existing operations, including underground mine development costs,
ongoing replacement of mine equipment and other capital facilities and other capital expenditures at existing operations and is calculated as total capital
expenditure of US$1,088.7 million per note 44 to the consolidated financial statements, less non-sustaining capital expenditures. Non-sustaining capital
expenditures (or growth capital) represent capital expenditures for major growth projects as well as enhancement capital for significant infrastructure
improvements at existing operations.
4This total may not reflect the sum of the line items due to rounding.
5Includes exploration, feasibility and evaluation and share of equity-accounted losses of Far Southeast Gold Resources Incorporated (“FSE”).
6Other includes offshore structure costs and management fees.
7Based on information underlying the audited consolidated annual financial statements of Gold Fields Limited for the year ended 31 December 2021.
Management’s discussion and analysis of the financial statements continued
| | | | | | | | | | | | |
| |
| | | AISC and AIC, gross of by-product revenue per ounce of gold | | |
| | | | For the year ended 31 December 2021 | | | | |
Figures in millions unless otherwise stated | | | | | | | | | | | | Continuing and discontinued operations |
| | | | | | | | | | | | |
All-in sustaining costs (per table above) | | | | | | | | | | | | |
Add back by-product revenue2,4 | | | | | | | | | | | | |
All-in sustaining costs gross of by-product revenue3 | | | | | | | | | | | | |
All-in costs (per table above) | | | | | | | | | | | | |
Add back by-product revenue2,4 | | | | | | | | | | | | |
All-in costs gross of by-product revenue3 | | | | | | | | | | | | |
Gold equivalent ounces sold | | | | | | | | | | | | |
All-in sustaining costs gross of by-product revenue (US$/ equivalent oz) | | | | | | | | | | | | |
All-in costs gross of by-product revenue (US$ equivalent oz) | | | | | | | | | | | | |
1Equity-accounted joint venture. Asanko has been presented as a discontinued operation, refer note 14 of the AFR for further details.
2By-product revenue at Cerro Corona relates to copper. For all the other operations, by-product revenue relates to silver.
3This total may not reflect the sum of the line items due to rounding.
4Based on information underlying the audited consolidated annual financial statements of Gold Fields Limited for the year ended 31 December 2021.
5The comparatives for Salares Norte have been reclassified from the Corporate and Projects Segment.
AISC and AIC
AISC net of by-product revenues (including Asanko) increased by 4% from US$1,063 per ounce of gold in 2021 to
US$1,105 per ounce of gold in 2022, mainly due to higher sustaining capital expenditure and higher cost of sales before
amortisation and depreciation, partially offset by higher gold sold and the 11% weakening of the South African Rand against
the US Dollar and 8% weakening of the Australian Dollar against US Dollar. AIC net of by-product revenues (including
Asanko) increased by 2% from US$1,297 per ounce of gold in 2021 to US$1,320 per ounce of gold in 2022, mainly due to
higher sustaining capital expenditure and higher cost of sales before amortisation and depreciation, partially offset by higher
gold sold, lower non-sustaining capital expenditure and the 11% weakening of the South African Rand against the US Dollar
and 8% weakening of the Australian Dollar against the US Dollar.
AISC net of by-product revenues (excluding Asanko) increased by 5% from US$1,047 per ounce of gold in 2021 to
US$1,097 per ounce of gold in 2022, mainly due to higher sustaining capital expenditure and higher cost of sales before
amortisation and depreciation, partially offset by higher gold sold and the 11% weakening of the South African Rand against
the US Dollar and 8% weakening of the Australian Dollar against the US Dollar. AIC net of by-product revenues (excluding
Asanko) increased by 2% from US$1,285 per ounce of gold in 2021 to US$1,317 per ounce of gold in 2022, mainly due to
higher sustaining capital expenditure and higher cost of sales before amortisation and depreciation, partially offset by higher
gold sold, lower non-sustaining capital expenditure and the 11% weakening of the South African Rand against the US Dollar
and 8% weakening of the Australian Dollar against the US Dollar.
AISC gross of by-product revenues (including Asanko) increased by 3% from US$1,101 per ounce of gold in 2021 to
US$1,130 per ounce of gold in 2022, mainly due to higher sustaining capital expenditure and higher cost of sales before
amortisation and depreciation, partially offset by higher gold sold and the 11% weakening of the South African Rand against
the US Dollar and 8% weakening of the Australian Dollar against the US Dollar. AIC gross of by-product revenues (including
Asanko) increased by 1% from US$1,322 per ounce of gold in 2021 to US$1,334 per ounce of gold in 2022, mainly due to
higher sustaining capital expenditure and higher cost of sales before amortisation and depreciation, partially offset by higher
gold sold, lower non-sustaining capital expenditure and the 11% weakening of the South African Rand against the US Dollar
and 8% weakening of the Australian Dollar against the US Dollar.
AISC gross of by-product revenues (excluding Asanko) increased by 3% from US$1,087 per ounce of gold in 2021 to
US$1,124 per ounce of gold in 2022, mainly due to higher sustaining capital expenditure and higher cost of sales before
amortisation and depreciation, partially offset by higher gold sold and the 11% weakening of the South African Rand against
the US Dollar and 8% weakening of the Australian Dollar against the US Dollar. AIC gross of by-product revenues (excluding
Asanko) increased by 1% from US$1,312 per ounce of gold in 2021 to US$1,331 per ounce of gold in 2022, mainly due to
higher sustaining capital expenditure and higher cost of sales before amortisation and depreciation, partially offset by higher
gold sold, lower non-sustaining capital expenditure and the 11% weakening of the South African Rand against the US Dollar
and 8% weakening of the Australian Dollar against the US Dollar.
Royalties
South Africa
The Royalty Act was promulgated on 24 November 2008 and came into operation on 1 March 2010. The Royalty Act
imposes a royalty on refined and unrefined minerals payable to the South African government.
The royalty in respect of refined minerals (which include gold and platinum) is calculated by dividing earnings before interest
and taxes (“EBIT”), as defined by the Royalty Act, by the product of 12.5 times gross revenue calculated as a percentage,
plus an additional 0.5%. EBIT refers to taxable mining income (with certain exceptions such as no deduction for interest
payable and foreign exchange losses) before assessed losses but after capital expenditure. A maximum royalty of 5% is
levied on refined minerals.
For Gold Fields, this means that currently it pays a royalty based on the refined minerals royalty calculation as applied to its
gross revenue. The rate of royalty tax payable for 2023, 2022 and 2021 was 0.5% of revenue.
Ghana
Minerals are owned by the Republic of Ghana and held in trust by the President. Under the terms of the March 2016
Development Agreement (“DA”) entered into with the government of Ghana, Tarkwa and Damang have been subject to a
sliding scale for royalty rates, linked to the prevailing gold price from 1 January 2021. The royalty sliding scale is as follows:
The average rate of royalty tax payable for 2023, 2022 and 2021 based on the above sliding scale was 4.1%, 4.1% and 4.1%
on revenue, respectively. Asanko does not have a DA with the government and was subject to a 5% royalty tax rate for
2023, 2022 and 2021.
Australia
Royalties are payable to the state based on the amount of gold produced from a mining tenement. Royalties are payable
quarterly at a fixed rate of 2.5% of the royalty value of gold sold. The royalty value of gold is the amount of gold produced
during the month multiplied by the average gold spot price for the month.
Peru
Royalties and Special Mining Tax are both calculated with reference to the operating margin and ranging from 1%
(for operating margins less than 10%) to 12% (for operating margins of more than 80%), or 1% of revenue, the highest of both
amounts. Cerro Corona’s effective royalty and Special Mining Tax rate for 2023, 2022 and 2021 was 4.1%, 4.2% and 4.4%
of operating profit, respectively.
Chile
Chile levies a royalty (referred to as the special mining income tax) on all medium to large scale mining operations in Chile.
Gold Fields anticipates that its Chilean subsidiary will be treated as a large scale mineral producer. This is because it will
produce annual gold equivalent ounces in excess of 50,000 metric tonnes of fine copper. The applicable mining tax
percentage is calculated on a sliding scale with reference to the mining operational profit margin. The tax rate is from 5%
(for operating margins equal to or less than 35%) to 14% (for operating margins of 85% or more). The mining tax payable is
calculated at the applicable tax rate on the net operating income of the Chilean subsidiary. The mining tax is a deductible
expense in the calculation of the Chilean corporate tax.
Management’s discussion and analysis of the financial statements continued
Income and mining taxes
Gold Fields tax strategy and policy
The Gold Fields tax strategy is to proactively manage its tax obligations in a transparent, responsible and sustainable
manner, acknowledging the differing interests of all stakeholders.
The Group does not engage in aggressive tax planning and seeks to maintain professional real-time relationships with the
relevant tax authorities. In material or complex matters, the Group would generally seek advance tax rulings, or alternatively
obtain external counsel opinion.
The Group does not embark on intra-group gold sales and only sells its gold (or gold-equivalent product) directly to
independent third parties at arm’s-length prices – generally at the prevailing gold spot price. Active business income is
therefore fully declared and taxed in the source country where the relevant mining operation is located, with the revenue
accruing to the source country.
Gold Fields has appropriate controls and procedures in place to ensure compliance with relevant tax legislation in all the
jurisdictions in which it operates. This includes compliance with transfer pricing (“TP”) legislation and associated TP
documentation requirements, which is governed by the Group TP policy. The Group TP policy is fully compliant with OECD
guidelines and is regularly updated and benchmarked by independent experts. Uncertain tax positions are properly
evaluated, and reported in terms of (IAS) 37 Provisions, Contingent Liabilities and Contingent Assets. All material uncertain
tax positions as per IAS 37 are fully disclosed to and evaluated by our external auditors.
The Group is subject to South African Controlled Foreign Companies (“CFC”) tax legislation which is aimed at taxing passive
income and capital gains realised by its foreign subsidiaries (to the extent that it was not taxed in the foreign jurisdiction).
The Group is reporting its key financial figures on a country-by-country basis as from 2017 onwards. The country-by-country
reports are filed with the South African Revenue Service, which will exchange the information with all the relevant
jurisdictions with which it has concluded or negotiated exchange of information agreements. Gold Fields also reports its total
tax contribution and indicative tax rate per country in its Annual Financial Report.
The Group oversees its tax affairs through multiple levels of management. The Group has invested and allocated
appropriate resources in the Group tax department to ensure we comply with our global tax obligations. The Group has a
global team of tax professionals; located in all of its operating jurisdictions, charged with managing their respective tax affairs
in line with Group’s Code of Conduct, global tax strategy and internal policies.
The Chief Financial Officer has ultimate responsibility for setting Group’ tax strategy. The day-to-day operational
responsibility for the execution of tax policy resides with the Vice President and Group Head of Tax. The Vice President and
Group Head of Tax and Chief Financial Officer reports tax matters to the Board’s Audit Committee on a regular basis. The
Group’s tax strategy is reviewed and approved formally by the Audit Committee and the Board on an annual basis.
The Group seeks to maintain open, constructive and ethical relationships with tax authorities. The Group strives for
transparency in all its dealings with tax authorities. The Group attempts to work collaboratively with tax authorities to resolve
disputes where tax laws are unclear, in a timely manner. The Group will seek to protect its position in the courts where it
believes a tax authority has assessed a transaction or position incorrectly or unfairly under the law. The Group also interacts
with governments on the development of fair, clear and predictable tax laws. The Group does this directly or through various
industry organisations.
South Africa
Generally, South Africa imposes tax on the worldwide income (including capital gains) of all of Gold Fields’ South African
incorporated and tax resident entities. Certain classes of passive income such as interest and royalties, and certain capital
gains, derived by Controlled Foreign Companies (“CFC”) could be subject to South African tax on a notional imputation
basis. CFCs generally constitute a foreign company in which Gold Fields owns or controls more than 50% of the
shareholding.
Gold Fields pays taxes on its taxable income generated by its mining and non-mining tax entities. Under South African law,
gold mining companies and non-gold mining companies are taxed at different rates. Companies in the Group not carrying
on direct gold mining operations were taxed at a statutory rate of 27%.
The corporate income tax rate was reduced from 28% to 27% for tax years ending on or after 31 March 2023 and was
effective for the year ended 31 December 2023. At the same time, Companies will be entitled to set off any balance of
assessed losses to the extent that the set-off amount does not exceed the higher of R1 million and 80% of the taxable
income for that year.
Gold Fields Operations Limited (“GFO”), and GFI Joint Venture Holdings Proprietary Limited (“GFIJVH”), jointly own the
South Deep mine and constitute gold mining companies for South African taxation purposes. These companies are subject
to the gold formula on their mining income.
During June 2022, the South African Revenue Services published the draft 2022 Rates & Monetary Bill, inclusive of an
amendment to the gold tax formula from Y = 34 – 170/X to Y = 33 – 165/X in respect of year assessments ending on or after
31 March 2023 and this amendment was effective for the year ended 31 December 2023. This resulted in the effective
mining tax rate for Gold Fields Operations Limited (“GFO”) and GFI Joint Venture Holdings (Proprietary) Limited (“GFIJVH”),
owners of the South Deep mine, decreasing from 29% at 31 December 2021 to 28% at 31 December 2022 (2023: 28%,
2022: 28% and 2021: 29%).
Ghana
Ghanaian resident entities are subject to tax on a worldwide income basis however, general source based tax principles are
applied. Where income has a source in Ghana, it accrues in or is derived from Ghana. Under the terms of the Development
Agreement (“DA”) entered into with the government of Ghana, Tarkwa and Damang are liable to a 32.5% corporate income
tax rate. Asanko does not have a DA with the government and is subject to a 35% corporate income tax rate.
Dividends paid by Tarkwa and Damang are subject to an 8% withholding tax rate, reduced if terms and conditions of an
applicable Double Tax Agreement are met.
Tarkwa and Damang are allowed to deduct 20% on a straight-line basis for capital allowances on depreciable assets (i.e.
over five years). Any capital allowances which are not utilised in a particular year are added to operating losses (if any),
thereby increasing operating losses and then carried forward for five years. Any operating losses carried forward are
extinguished if not utilised within five years on a first in, first out basis.
The Revenue Administration Act, 2016 (Act 915) became effective on 1 January 2017. Act 915 consolidates the tax
administration provisions from the various tax laws (income tax, value added tax, customs) into a single Act and introduces
a more stringent tax compliance framework. Act 915 enables taxpayers to offset surpluses and liabilities arising from different
tax types. It should be noted that the tax authorities are again expected to release guidance notes to allow taxpayers to fully
utilise the offset mechanism.
Eight years after the introduction of TP regulations in Ghana, the government has repealed and replaced the TP regulations
with new TP regulations in 2020. The new TP rules are intended to ease the compliance burden and provide additional
clarity. The tax authorities are yet to release guidance notes or updated return templates to aid in implementation and
administration.
Ghana Revenue Authority and Transfer Pricing audit
In the wake of the Ghanaian fiscal crisis, the Ghanaian government conducted stringent audits on its biggest corporate
taxpayers (many of them multinationals), including Gold Fields, and imposed additional tax liabilities during 2022. In addition,
Gold Fields experienced more onerous processes in claiming and renewing rebates and exemptions under the
Development Agreement. The two audits in 2022 by the Ghana Revenue Authority were a transfer pricing audit covering
2014 to 2019 and a tax audit for 2018 to 2020. Both of these audits were finalised and settled during 2023.
Australia
Generally, Australia imposes tax on the worldwide income (including capital gains) of all of Gold Fields’ Australian
incorporated and tax resident entities. The current income tax rate for companies with turnover of A$50 million or more is
30%. Exploration expenditure is deductible in full as incurred. The Australian Uniform Capital Allowance regime allows tax
deductions for the decline in value of depreciable assets and certain other capital expenditures over the effective lives of
the assets acquired or constructed.
Gold Fields Australia and its eligible related Australian sister companies, together with all wholly owned Australian
subsidiaries, have elected to be treated as a tax consolidated group for income taxation purposes. As a tax consolidated
group, a single income tax return is lodged for the Group based on the consolidated results of all companies within
the Group.
Withholding tax is payable on dividends, interest and royalties paid by Australian residents to non-residents. In the case of
dividend payments to non-residents, withholding tax at a rate of 30% will apply. However, where the recipient of the
dividend is a resident of a country with which Australia has concluded a double taxation agreement, the rate of withholding
tax is generally limited to between 0% and 15%, depending on the applicable agreement and shareholding percentage.
Where dividends are paid out of profits that have been subject to Australian corporate tax there is no withholding tax,
regardless of whether a double taxation agreement is in place.
Management’s discussion and analysis of the financial statements continued
Peru
Peruvian taxes for resident individuals and domiciled corporations are based on their worldwide income, and for non-
resident individuals and non-domiciled corporations are based on their Peruvian income source. The general income tax
rate applicable to domiciled corporations is 29.5% on taxable income and to non-resident corporations is 30%. The income
tax applied to interest paid to non-residents is 4.99%. The dividends tax rate (to residents and non-residents) is 5%. Capital
gains are also taxed as ordinary income for domiciled corporations.
Chile
Gold Fields anticipates that its Chilean subsidiary will be subject to the 27% corporate tax rate, and that dividends paid by
the Chilean subsidiary to the parent company will be subject to a 35% withholding tax rate, but that the 27% corporate tax
paid will fully count as a credit against the withholding tax levied, so that the effective dividend withholding tax rate will
approximate 8%.
Organisation for Economic Co-operation and Development (“OECD”) Pillar Two model rules
The Group is within the scope of the OECD Pillar Two model rules. The Group operates in the Netherlands as well as in
Switzerland which have both enacted new legislation to implement the global top-up tax during December 2023. This
legislation is effective from 1 January 2024. Since the newly enacted Pillar Two legislation is only effective from 1 January
2024, the Group has no related current tax impact for the year ended 31 December 2023. The Group applies a temporary
mandatory relief in respect of recognising and disclosing information about deferred tax assets and liabilities related to
Pillar Two income taxes, as provided in the amendments to IAS 12 issued in May 2023.
Under the legislation, the Group may be liable to pay a top-up tax for the difference between its Global Anti-Base Erosion
(“GloBE”) effective tax rate per jurisdiction and the 15% minimum rate. All entities within the Group have a GloBE effective tax
rate that exceeds 15%.
The Group has performed a preliminary impact assessment, based on relevant 2022 financial information, of its potential
exposure in relation to the Pillar Two legislation once it comes into effect. Although the complexities in applying the
legislation and calculating the GloBE effective tax rate create difficulties in determining reasonable estimates of the
quantitative impact of the enacted or substantively enacted legislation, based on the outcome of the preliminary impact
assessment, the Group does not anticipate being subject to the top-up tax in any of the jurisdictions in which it operates as
all the jurisdictions either meet the conditions of one of the transitional safe harbours or the relevant constituent entity has
a GloBE effective tax rate of at least 15%.
Exchange rates
Gold Fields’ Australian and South African revenues and costs are very sensitive to the Australian Dollar/US Dollar exchange
rate and the Rand/US Dollar exchange rate, because revenues are generated using a gold price denominated in US Dollar,
while the costs of the Australian and South African operations are incurred principally in Australian Dollar and Rand,
respectively. Depreciation of the Australian Dollar and Rand against the US Dollar reduces Gold Fields’ average costs when
they are translated into US Dollar, thereby increasing the operating margin of the Australian and South African operations.
Conversely, appreciation of the Australian Dollar and Rand results in Australian and South African operating costs being
translated into US Dollar at a lower Australian Dollar/US Dollar exchange rate and Rand/US Dollar exchange rate, resulting
in higher costs in US Dollar terms and in lower operating margins.
The impact on profitability of any change in the value of the Australian Dollar and Rand against the US Dollar can be
substantial. Furthermore, the exchange rates obtained when converting US Dollar to Australian Dollar and Rand are set
by foreign exchange markets, over which Gold Fields has no control. In 2023, the Rand weakened by 13% against the
US Dollar, from an average of R16.37 per US$1.00 in 2022 to R18.45 per US$1.00 in 2023. The Australian Dollar weakened
by 4% at an average of A$1.00 per US$0.69 in 2022 to A$1.00 per US$0.66 in 2023.
With respect to its operations in Ghana and Peru, a substantial portion of Gold Fields’ operating costs (including wages) are
either directly incurred in US Dollar or are translated to US Dollar. Accordingly, fluctuations in the Ghanaian Cedi and
Peruvian Nuevo Soles do not materially impact operating results for the Ghana and Peru operations.
A portion of the Salares Norte project’s capital expenditure is denominated in Chilean pesos. Depreciation or appreciation
of the Chilean peso against the US dollar will reduce or increase their capital expenditure when translating into US dollars.
In 2020, Gold Fields entered into a foreign currency hedge to mitigate the full exchange rate exposure. The contract
matured in 2022 and no further hedges were entered into during 2023.
Salares Norte foreign currency hedge
In March 2020, a total notional amount of US$544.5 million was hedged at a rate of CLP/US$836.45 for the period July 2020
to December 2022.
At 31 December 2022, the mark-to-market value on the hedge was US$nil as the hedge had matured with a realised loss
of US$4.6 million and an unrealised gain and prior year mark-to-market reversals of US$6.8 million for the year ended
31 December 2022. For the period July 2020 to December 2022, the hedge realised a gain of US$33 million.
Inflation
A period of significant inflation could adversely affect Gold Fields’ results and financial condition. Further, over the past
several years, production costs have increased considerably. In 2023, there were significant inflationary pressures on
commodity inputs (specifically fuel and explosives) and employee and contractor costs. The effect of these increases has
adversely affected, and may continue to adversely affect, the profitability of Gold Fields’ operations.
Effective mining inflation for 2023 was as follows:
•6.9% in South Africa;
•7.3% in Ghana (US based);
•0.6% in Peru (US based);
•5.3% in Chile (US based);
•4.4% (not adjusted for payroll retentions paid in 2022) and 7.0% (adjusted for payroll retentions paid in 2022) in Australia;
and
•5.3% (not adjusted for payroll retentions paid in Australia in 2022) and 6.2% (adjusted for payroll retentions paid in
Australia in 2022) Group weighted inflation.
The Group continued rationalising and prioritising capital expenditure without undermining the sustainability of its operations
and continued prioritisation of cash generation over production volumes.
Further, the majority of Gold Fields’ costs at the South African operations are in Rand and revenues from gold sales are in
US Dollar. Generally, when inflation is high, the Rand potentially devalues thereby increasing Rand revenues and potentially
offsetting the increase in costs. However, there can be no guarantee that any cost-saving measures or the effects of any
potential devaluation of the South African Rand will offset the effects of increased inflation and production costs.
The same applies to the Australian operations with regard to the link between the Australian Dollar and US Dollar. The
Peruvian and Ghanaian operations, on the other hand, are affected by inflation without a potential similar effect on revenue
proceeds, thereby increasing the impact of inflation on the operating margins.
Capital expenditures
Gold Fields will continue to be required to make capital investments in both new and existing infrastructure and
opportunities and, therefore, management will be required to continue to balance the demands for capital expenditure in the
business and allocate Gold Fields’ resources in a focused manner to achieve its sustainable growth objectives. Gold Fields
expects that its use of available capital resources and allocation of its capital expenditures may shift in future periods as it
increases investment in certain of its exploration projects.
Group
Capital expenditure for the Group (excluding Asanko) decreased by 1% from US$1,069 million in 2022 (comprising sustaining
capital expenditure of US$656 million and growth capital expenditure of US$413 million) to US$1,055 million in 2023
(comprising sustaining capital expenditure of US$692 million and growth capital expenditure of US$363 million).
Set out on the following page are the capital expenditures made by Gold Fields during 2023. Also, refer to “Cash flows from
investing activities” section.
Management’s discussion and analysis of the financial statements continued
| | | | | | |
| |
| | |
Figures in million unless otherwise stated | | | | | | |
| | | | | | |
| | | | | | |
| | | | | | |
| | | | | | |
| | | | | | |
| | | | | | |
| | | | | | |
| | | | | | |
| | | | | | |
| | | | | | |
| | | | | | |
| | | | | | |
| | | | | | |
| | | | | | |
| | | | | | |
| | | | | | |
Continuing operations
South African region
Gold Fields spent R1,717 million (US$93 million) on sustaining capital expenditure at South Deep in 2023 and has budgeted
approximately R2,452 million (US$140 million) for only sustaining capital expenditure at South Deep in 2024.
Ghanaian region
Gold Fields spent US$216 million on sustaining capital expenditure at Tarkwa in 2023 and has budgeted US$167 million for
only sustaining capital expenditure at Tarkwa for 2024.
Gold Fields spent US$5 million on sustaining capital expenditure at Damang in 2023 and has budgeted US$5 million for
only sustaining capital expenditure at Damang for 2024.
South American region
Gold Fields spent US$44 million on capital expenditure at Cerro Corona in 2023 and has budgeted US$32 million for capital
expenditure at Cerro Corona for 2024. The capital expenditure of US$44 million in 2023 comprised US$31 million sustaining
capital expenditure and US$13 million growth capital. The budgeted capital expenditure of US$32 million comprises
sustaining capital expenditure of US$24 million and growth capital expenditure of US$8 million.
Gold Fields spent US$398 million on growth capital expenditure at Salares Norte in 2023 and has budgeted US$269 million
for capital expenditure at Salares Norte for 2024. The capital expenditure of US$398 million in 2023 comprised
US$118 million sustaining capital expenditure and US$280 million growth capital. The budgeted capital expenditure of
US$269 million comprises sustaining capital expenditure of US$153 million and growth capital expenditure of US$116 million.
Australian region
Gold Fields spent A$147 million (US$97 million) on capital expenditure at St Ives in 2023 and has budgeted A$400 million
(US$280 million) for capital expenditure at St Ives in 2024. The capital expenditure of A$147 million (US$97 million) in 2023
comprised A$109 million (US$72 million) sustaining capital expenditure and A$38 million (US$25 million) growth capital. The
budgeted capital expenditure of A$400 million (US$280 million) comprises sustaining capital expenditure of A$358 million
(US$250 million) and growth capital expenditure of A$42 million (US$30 million).
Gold Fields spent A$106 million (US$71 million) on capital expenditure at Agnew in 2023 and has budgeted A$117 million
(US$82 million) for capital expenditure at Agnew for 2024. The capital expenditure of A$106 million (US$71 million) in 2023
comprised A$82 million (US$55 million) sustaining capital expenditure and A$24 million (US$16 million) growth capital. The
budgeted capital expenditure of A$117 million (US$82 million) comprises sustaining capital expenditure of A$86 million
(US$60 million) and growth capital expenditure of A$31 million (US$22 million).
Gold Fields spent A$115 million (US$76 million) on capital expenditure at Granny Smith in 2023 and has budgeted
A$116 million (US$82 million) for capital expenditure at Granny Smith for 2024. The capital expenditure of A$115 million
(US$76 million) in 2023 comprised A$71 million (US$47 million) sustaining capital expenditure and A$44 million
(US$29 million) growth capital. The budgeted capital expenditure of A$116 million (US$82 million) comprises sustaining
capital expenditure of A$77 million (US$54 million) and growth capital expenditure of A$39 million (US$27 million).
Gold Fields spent A$78 million (US$52 million) on sustaining capital expenditure at Gruyere (50%) in 2023 and has budgeted
between A$126 million (US$88 million) for sustaining capital expenditure for 2024.
The actual capital expenditure for continuing operations for the future periods noted above may be different from the
amounts set out above and the amount of actual capital expenditure will depend on a number of factors, such as production
volumes, the price of gold, copper and other minerals mined by Gold Fields and general economic conditions. Some of the
factors are outside of the control of Gold Fields.
Discontinued operation
The capital expenditure at Asanko (45%) for 2023 was US$25 million. The capital expenditure of US$25 million in 2023
comprised sustaining capital expenditure of US$19 million and growth capital expenditure of US$6 million. Based on the
impending divestment of Asanko, no guidance is provided.
Significant accounting judgements and estimates
Gold Fields’ significant accounting policies are fully described in the accounting policies to its consolidated financial
statements included in this Annual Financial Report (refer pages 91 to 113). Some of Gold Fields’ accounting policies require
the application of significant judgements and estimates by management that can affect the amounts reported in the
consolidated financial statements. By their nature, these judgements are subject to a degree of uncertainty and are based
on Gold Fields’ historical experience, terms of existing contracts, management’s view on trends in the gold mining industry,
information from outside sources and other assumptions that Gold Fields considers to be reasonable under the
circumstances. Actual results could differ from these estimates under different assumptions or conditions.
Results for the period – years ended 31 December 2023 and 31 December 2022
Profit attributable to owners of the parent for the Group decreased by 1% from US$711 million (or US$0.80 per share) in 2022
to US$703 million (or US$0.79 per share) in 2023. The reasons for this decrease are discussed on the following pages.
Revenue
Revenue increased by 5% from US$4,287 million in 2022 to US$4,501 million in 2023. The increase in revenue of
US$214 million was due to the higher gold price received, partially offset by the lower gold sold.
The average US Dollar gold price achieved by the Group (excluding Asanko) increased by 9% from US$1,785 per equivalent
ounce in 2022 to US$1,942 per equivalent ounce in 2023. The average Rand gold price increased by 22% from R943,581
per kilogram in 2022 to R1,149,066 per kilogram in 2023. The average Australian Dollar gold price increased by 13% from
A$2,592 per ounce in 2022 to A$2,937 per ounce in 2023. The average US Dollar gold price for the Ghanaian operations
(excluding Asanko) increased by 8% from US$1,806 per ounce in 2022 to US$1,949 per ounce in 2023. The average
equivalent US Dollar gold price, net of treatment and refining charges, for Cerro Corona increased by 13% from US$1,671 per
equivalent ounce in 2022 to US$1,895 per equivalent ounce in 2023. The average US Dollar/Rand exchange rate
weakened by 13% against the US Dollar, from an average of R16.37 per US$1.00 in 2022 to R18.45 per US$1.00 in 2023.
The Australian Dollar weakened by 4% at an average of A$1.00 per US$0.69 in 2022 to A$1.00 per US$0.66 in 2023.
Gold sales from continuing operations (excluding Asanko) decreased by 4% from 2,401,900 equivalent ounces in 2022 to
2,317,000 equivalent ounces in 2023. Gold sales at the South African operation decreased by 2% from 10,200 kilograms
(327,900 ounces) in 2022 to 10,000 kilograms (321,500 ounces) in 2023. Gold sales at the Ghanaian operations (excluding
Asanko) decreased by 8% from 758,000 ounces in 2022 to 700,700 ounces in 2023. Gold equivalent sales at the Peruvian
operation (Cerro Corona) decreased by 8% from 260,100 equivalent ounces in 2022 to 238,200 equivalent ounces in 2023.
At the Australian operations, gold sales increased marginally from 1,055,800 ounces in 2022 to 1,056,500 ounces in 2023.
As a general rule, Gold Fields sells all the gold it produces.
Management’s discussion and analysis of the financial statements continued
| | | | | | |
| | |
| | | | | | |
| | | | | | |
| | | | | | |
| | | | | | |
| | | | | | |
| | | | | | |
| | | | | | |
| | | | | | |
| | | | | | |
| | | | | | |
| | | | | | |
| | | | | | |
Continuing and discontinued operations | | | | | | |
1Equity-accounted joint venture. Asanko has been presented as a discontinued operation, refer note 14 of the AFR for further details. Included above for
information only, not included in revenue for the Group.
Continuing operations
At South Deep in South Africa, gold sales decreased by 2% from 10,200 kilograms (327,900 ounces) in 2022 to 10,000
kilograms (321,500 ounces) in 2023 due to lower underground reef yield as a result of lower mine call factor and plant
recovery factor which was impacted by the increase in waste to ore mill ratio.
At the Ghanaian operations, gold sales at Tarkwa increased by 4% from 529,100 ounces in 2022 to 548,100 ounces in 2023
mainly due to higher tonnes processed and improved yield. Damang’s gold sales decreased by 33% from 228,900 ounces
in 2022 to 152,600 ounces in 2023 mainly due to lower yield as a result of lower grade of ore processed as a result of
cessation of mining and processing of stockpiles.
At Cerro Corona in Peru, copper sales decreased marginally from 26,704 tonnes in 2022 to 26,654 tonnes in 2023 due to
lower ore tonnes processed, while gold sales decreased by 7% from 130,555 ounces in 2022 to 121,978 ounces in 2023 due
to lower grade ore mined and processed and lower ore tonnes processed. Gold equivalent sales decreased by 8% from
260,100 ounces in 2022 to 238,200 ounces in 2023.
At the Australian operations, gold sales at St Ives decreased by 1% from 373,200 ounces in 2022 to 368,700 ounces in
2023. Agnew, gold sales increased by 1% from 238,700 ounces in 2022 to 242,000 ounces in 2023 due to a 12% increase
in ore tonnes processed, partially off-set by 9% decrease in yield. At Granny Smith, gold sales decreased by 1% from
287,400 ounces in 2022 to 284,400 ounces in 2023 due to a 12% decrease in yield on lower grades mined, partially offset
by an increase in ore tonnes processed. At Gruyere, gold sales increased by 3% from 156,400 ounces in 2022 to 161,400
ounces in 2023 due to increased ore processed.
Discontinued operation
Gold sales at Asanko decreased by 20% from 75,500 ounces in 2022 to 60,400 ounces in 2023 mainly due to lower yield
due to processing of stockpiles.
Cost of sales
Cost of sales, which comprises cost of sales before gold inventory change and amortisation and depreciation, gold inventory
change and amortisation and depreciation, increased by 5% from US$2,608 million in 2022 to US$2,747 million in 2023.
The reasons for this increase are described below.
Cost of sales before gold inventory change and amortisation and depreciation
Continuing operations
Cost of sales before gold inventory change and amortisation and depreciation increased by 6% from US$1,932 million in
2022 to US$2,042 million in 2023 mainly due to inflationary increases affecting all the regions, partially offset by the
weakening of the South African Rand and Australian Dollar.
At South Deep in South Africa, cost of sales before gold inventory change and amortisation and depreciation increased by
9% from R5,314 million (US$325 million) in 2022 to R5,815 million (US$315 million) in 2023 due to an increase in permanent
employees and underground support construction contractors to support the build-up in the operational plan, the 9%
increase in underground tonnes mined and the overall impact of 6.9% mining inflation.
At the Ghanaian operations (excluding Asanko), cost of sales before gold inventory change and amortisation and
depreciation increased by 6% from US$600 million in 2022 to US$633 million in 2023. At Tarkwa, cost of sales before gold
inventory change and amortisation and depreciation increased by 12% from US$407 million in 2022 to US$455 million in
2023 mainly due to a 25% increase in ore tonnes mined and a 16% increase in operational waste tonnes mined, partially
offset by lower fuel cost. At Damang, cost of sales before gold inventory change and amortisation and depreciation
decreased by 8% from US$193 million in 2022 to US$178 million in 2023 mainly due to a 39% decrease in ore tonnes mined
and a 17% decrease in operational waste tonnes mined.
At Cerro Corona in Peru, cost of sales before gold inventory change and amortisation and depreciation increased by 1% from
US$225 million in 2022 to US$227 million in 2023 despite lower ore mined, mainly due to an increase in operational costs
impacted by inflation, such as electricity, fuel, explosives and grinding media as well as additional cost relating to the East
Wall unloading due to geo-technical constraints.
At the Australian operations, cost of sales before gold inventory change and amortisation and depreciation increased by
15% from A$1,122 million (US$777 million) in 2022 to A$1,288 million (US$855 million) in 2023. At St Ives, cost of sales before
gold inventory change and amortisation and depreciation increased by 23% from A$396 million (US$274 million) in 2022 to
A$486 million (US$323 million) in 2023 mainly due to a 16% increase in total ore tonnes mined combined with inflationary
pressures on commodity inputs and employee and contractor costs, including contractor rate increases. At Agnew, cost of
sales before gold inventory change and amortisation and depreciation increased by 14% from A$264 million (US$183 million)
in 2022 to A$302 million (US$200 million) in 2023 due to a 20% increase in ore tonnes mined and 12% increase in ore
tonnes processed combined with inflationary pressures on commodity inputs and employee and contractor costs. At Granny
Smith, cost of sales before gold inventory change and amortisation and depreciation increased by 14% from A$295 million
(US$204 million) in 2022 to A$337 million (US$224 million) in 2023 mainly due to increased ore production, as well as
inflationary pressures on commodity inputs and employee and contractor costs, including contractor rate increases. At
Gruyere, cost of sales before gold inventory change and amortisation and depreciation decreased by 2% from A$167 million
(US$116 million) in 2022 to A$163 million (US$108 million) in 2023 mainly due to lower ore and operational waste mined in
2023, partially offset by contractor rate increases.
Discontinued operation
Asanko was accounted for as an equity accounted investee and Gold Fields share of its cost of sales before gold inventory
change and amortisation and depreciation is not included the Group cost of sales before gold inventory change and
amortisation and depreciation. At Asanko, cost of sales before gold inventory change and amortisation and depreciation
(45% basis) decreased by 16% from US$73 million in 2022 to US$61 million in 2023 mainly due to a 99% decrease in ore
tonnes mined and a 100% decrease in operational waste tonnes mined as mining activities recommenced in October 2023
with capital pre-stripping in Abore. Processing volume increased by 4% year-on-year.
Gold inventory change
The gold inventory credit to costs decreased by 37% from US$168 million in 2022 to US$91 million in 2023.
Continuing operations
At South Deep, the gold inventory credit to costs of R175 million (US$11 million) in 2022 compared to a charge to costs of
R254 million (US$14 million) in 2023, due to a decrease of stockpiles and gold in circuit.
At Tarkwa, the gold inventory credit to costs increased by 47% from US$36 million in 2022 to US$53 million in 2023, due
to a build-up of stockpiles.
At Damang, the gold inventory credit to costs of US$41 million in 2022 compared to a charge to costs of US$45 million in
2023, mainly due to depletion of stockpiles in 2023 with the completion of mining activities and a net realisable value write
down of US$34 million. Gold inventory costs will continue to unwind until 2025 at Damang.
At Cerro Corona, the gold inventory credit to costs decreased by 8% from US$50 million in 2022 to US$46 million in 2023,
due to a lower build-up of low-grade ore stockpiles, in line with the life-of-mine strategy. Gold inventory costs will build-up
until 2025 and will then start to unwind at Cerro Corona.
At St Ives, the credit to costs of A$9 million (US$6 million) in 2022 compared to a charge to costs of A$5 million
(US$4 million) in 2023. A credit was generated in 2022 with low cost historic stockpiles being utilised in the first half of the
year and a build up of ore in the second half of 2022 from the Neptune pit at higher cost. The charge in 2023 mainly relates
to the draw down of Neptune’s stockpiled ore. The oxide ore from Neptune must be blended with fresh ore in the mill and is
therefore stockpiled before processing.
Management’s discussion and analysis of the financial statements continued
At Agnew, the charge to costs of A$2 million (US$1 million) in 2022 compared to a credit to costs of A$8 million
(US$5 million) in 2023.
At Granny Smith, the credit to costs of A$2 million (US$1 million) in 2022 compared to a charge to costs of A$1 million
(US$nil) in 2023.
At Gruyere, the credit to costs of A$22 million (US$15 million) in 2022 compared to a charge to costs of A$12 million
(US$8 million) in 2023, with a buildup of stockpiles in 2022 compared to a draw down in 2023 as mining focused on
stripping stages 4 and 5 of the Gruyere pit.
Discontinued operation
At Asanko, the gold inventory charge to costs decreased by 56% from US$9 million in 2022 to US$4 million in 2023, as the
majority of stockpiles treated in 2023 were from low grade stockpiles.
Amortisation and depreciation
Amortisation and depreciation is calculated on the units-of-production method and is based on current gold production as a
percentage of total expected gold production over the lives of the different mines based on proved and probable reserves.
The amortisation in 2023 was based on the reserves as at 31 December 2022. The life-of-mine information is based on the
operations reserve life of mine models. In basic terms, amortisation is calculated using the life-of-mine for each operation,
which is based on: (1) the proved and probable reserves for the operation at the start of the relevant year; and (2) the amount
of gold produced/mined by the operation during the year.
| | |
| Amortisation for the year ended |
| 31 December 2023 US$ million | 31 December 2022 US$ million |
| | |
| | |
| | |
| | |
| | |
| | |
| | |
| | |
| | |
| | |
| | |
| | |
| | |
| | |
| | |
Total amortisation and depreciation | | |
Amortisation and depreciation decreased by 6% from US$844 million in 2022 to US$795 million in 2023.
Continuing operations
At South Deep in South Africa, amortisation and depreciation increased by 20% from R848 million (US$52 million) in 2022 to
R1,018 million (US$55 million) in 2023 due to a reduction in reserves combined with underground and surface infrastructure
capital, as well as higher fleet refurbishments and major components.
At the Ghanaian operations (excluding Asanko), amortisation and depreciation decreased by 12% from US$318 million in
2022 to US$281 million in 2023. Tarkwa decreased by 9% from US$221 million in 2022 to US$201 million in 2023 mainly
due to asset impairment of US$325 million at the end of 2022. Damang decreased by 16% from US$97 million in 2022 to
US$81 million in 2023 mainly due to lower ounces mined, as well as the completion of amortisation at the DPCB pit in 2022.
At Cerro Corona in Peru, amortisation and depreciation decreased by 12% from US$126 million in 2022 to US$111 million in
2023 mainly due to lower gold ounces mined, combined with the impairment of US$63 million in December 2022.
At the Australian operations, amortisation and depreciation decreased by 8% from A$473 million (US$328 million) in 2022
to A$433 million (US$288 million) in 2023. At St Ives, amortisation and depreciation decreased by 30% from A$157 million
(US$109 million) in 2022 to A$110 million (US$73 million) in 2023 mainly due to the impact of increased reserves on the
depreciation of underground development. At Agnew, amortisation and depreciation increased by 8% from A$102 million
(US$71 million) in 2022 to A$110 million (US$73 million) in 2023 mainly due to increased amortisation on higher ounce
production at the Barren Lands open pit. At Granny Smith, amortisation and depreciation increased by 6% from A$97 million
(US$67 million) in 2022 to A$103 million (US$68 million) in 2023 mainly due an increasing cost base with a further year's
development at the Wallaby underground. At Gruyere, amortisation and depreciation decreased by 5% from A$117 million
(US$81 million) in 2022 to A$111 million (US$74 million) in 2023 with ounces being extracted from stages 3 and 4 of the
Gruyere pit which had higher capital base than stage 2 where substantial ounces were extracted in 2022.
All-in sustaining and total all-in costs
The following table sets out for each operation and the Group, total gold sales in ounces, all-in sustaining costs and total
all-in costs, net of by-product revenue, in US$/oz for 2023 and 2022:
| | | | | | |
| | |
Figures in thousands unless otherwise stated | | All-in sustaining costs – US$/oz | | | All-in sustaining costs – US$/oz | |
| | | | | | |
| | | | | | |
| | | | | | |
| | | | | | |
| | | | | | |
| | | | | | |
| | | | | | |
| | | | | | |
| | | | | | |
| | | | | | |
| | | | | | |
| | | | | | |
| | | | | | |
| | | | | | |
| | | | | | |
Continuing and discontinued operations | | | | | | |
All-in costs are calculated in accordance with the World Gold Council Industry standard. Refer pages 22 to 28 for detailed calculations and discussion of AIC.
1Gold sold at Cerro Corona excludes copper equivalents of 129,592 ounces in 2022 and 116,262 ounces in 2023.
2Equity-accounted joint venture. Asanko has been presented as a discontinued operation, refer to note 14 of the AFR for further details.
Figures above may not add as they are rounded independently.
AISC and AIC
AISC net of by-product revenues (including Asanko) increased by 17% from US$1,105 per ounce of gold in 2022 to
US$1,295 per ounce of gold in 2023, mainly due to lower gold sold, higher sustaining capital expenditure and higher cost
of sales before amortisation and depreciation, partially offset by the 13% weakening of the South African Rand against the
US Dollar and 4% weakening of the Australian Dollar against the US Dollar.
AIC net of by-product revenues (including Asanko) increased by 15% from US$1,320 per ounce of gold in 2022 to
US$1,512 per ounce of gold in 2023 mainly due to the same reasons as AISC, partially offset by lower non-sustaining capital.
AISC net of by-product revenues (excluding Asanko) increased by 18% from US$1,097 per ounce of gold in 2022 to
US$1,289 per ounce of gold in 2023, mainly due to lower gold sold, higher sustaining capital expenditure and higher cost
of sales before amortisation and depreciation, partially offset by the 13% weakening of the South African Rand against the
US Dollar and 4% weakening of the Australian Dollar against the US Dollar. AIC net of by-product revenues (excluding
Asanko) increased by 14% from US$1,317 per ounce of gold in 2022 to US$1,507 per ounce of gold in 2023 mainly due to
the same reasons as AISC, partially offset by lower non-sustaining capital.
Management’s discussion and analysis of the financial statements continued
Continuing operations
At South Deep in South Africa, AISC increased by 18% from R680,931 per kilogram (US$1,294 per ounce) in 2022 in to
R800,097 per kilogram (US$1,349 per ounce) in 2023 due to higher cost of sales before amortisation and depreciation,
higher sustaining capital costs and lower gold sold. AIC increased by 12% from R713,624 per kilogram (US$1,356 per ounce)
in 2022 to R800,097 per kilogram (US$1,349 per ounce) in 2023 due to the same reasons as AISC, partially offset by lower
non-sustaining capital.
At the Ghanaian operations (excluding Asanko), AISC increased by 17% from US$1,172 per ounce in 2022 to US$1,373 per
ounce in 2023 and AIC increased by 15% from US$1,198 per ounce in 2022 to US$1,377 per ounce in 2023. At Tarkwa, AISC
and AIC increased by 4% from US$1,248 per ounce in 2022 to US$1,293 per ounce in 2023 due to higher royalties and
higher cost of sales before amortisation and depreciation, partially offset by higher gold sold and lower capital expenditure.
At Damang, AISC increased by 66% from US$998 per ounce in 2022 to US$1,659 per ounce in 2023 due to lower gold
sold, higher cost of sales before amortisation and depreciation and a net realisable value adjustment of US$34m to
stockpiles, partially offset by lower sustaining capital expenditure. AIC increased by 55% from US$1,083 per ounce in 2022
to US$1,679 per ounce in 2023 due to the same reasons as AISC, partially offset by lower non-sustaining capital
expenditure.
At Cerro Corona in Peru, AISC increased by 28% from US$310 per ounce in 2022 to US$397 per ounce in 2023 as a result
of higher cost of sales before amortisation and depreciation, higher social responsibility costs and lower gold sold. AIC per
ounce increased by 21% from US$444 per ounce in 2022 to US$536 per ounce in 2023 mainly due to the same reasons for
AISC, partially offset by lower non-sustaining capital. AISC per equivalent ounce increased by 16% from US$930 per
equivalent ounce in 2022 to US$1,075 per equivalent ounce in 2023 mainly due the same reasons as for AISC, combined
with lower equivalent ounces sold. AIC per equivalent ounce increased by 15% from US$998 per equivalent ounce in 2022
to US$1,146 per equivalent ounce in 2023 mainly due the same reasons as for AISC.
At the Australian operations, AISC increased by 16% from A$1,503 per ounce (US$1,041 per ounce) in 2022 to A$1,740 per
ounce (US$1,156 per ounce) in 2023. AIC increased by 14% from A$1,659 per ounce (US$1,150 per ounce) in 2022 to
A$1,886 per ounce (US$1,253 per ounce) in 2022. At St Ives, AISC increased by 20% from A$1,485 per ounce (US$1,029 per
ounce) in 2022 to A$1,787 per ounce (US$1,187 per ounce) in 2023 due to lower ounces sold and higher cost of sales before
amortisation and depreciation, partially offset by lower sustaining capital expenditure. AIC increased by 23% from A$1,594
per ounce (US$1,104 per ounce) in 2022 to A$1,958 per ounce (US$1,301 per ounce) in 2023 due to the same reasons as
AISC, as well as higher non-sustaining capital expenditure. At Agnew, AISC increased by 9% from A$1,632 per ounce
(US$1,130 per ounce) in 2022 to A$1,779 per ounce (US$1,182 per ounce) in 2023 due to higher cost of sales before
amortisation and depreciation and higher sustaining capital expenditure, partially offset by higher gold sold. AIC increased
by 3% from A$1,875 per ounce (US$1,298 per ounce) in 2022 to A$1,939 per ounce (US$1,288 per ounce) in 2023 due to the
same reasons as AISC, partially offset by lower non-sustaining capital expenditure. At Granny Smith, AISC increased by 11%
from A$1,466 per ounce (US$1,016 per ounce) in 2022 to A$1,627 per ounce (US$1,081 per ounce) in 2023 due to higher
cost of sales before amortisation and depreciation and lower gold sold, partially offset by decreased sustaining capital
expenditure. AIC increased by 6% from A$1,691 per ounce (US$1,171 per ounce) in 2022 to A$1,800 per ounce (US$1,196 per
ounce) in 2023 due to the same reasons as AISC, partially offset by lower non-sustaining capital expenditure. At Gruyere,
AISC increased by 25% from A$1,415 per ounce (US$980 per ounce) in 2022 to A$1,774 per ounce (US$1,178 per ounce) in
2023 due to increased cost of sales before amortisation and depreciation and increased capital expenditure, partially offset
by higher gold sold. AIC increased by 25% from A$1,431 per ounce (US$991 per ounce) in 2022 to A$1,792 per ounce
(US$1,190 per ounce) in 2023 due to the same reasons as AISC.
Discontinued operation
At Asanko, AISC increased by 13% from US$1,346 per ounce in 2022 to US$1,516 per ounce in 2023 due to lower gold
ounces sold and higher sustaining capital expenditure, partially offset by lower cost of sales before amortisation and
depreciation. AIC increased by 17% from US$1,435 in 2022 to US$1,672 in 2023 due the same reasons as AISC, as well as
higher non-sustaining capital expenditure.
Investment income
Income from investments increased by 92% from US$13 million in 2022 to US$25 million in 2023.
The investment income in 2023 of US$25 million comprised US$1 million interest on monies invested in the South African
and Ghanaian rehabilitation trust funds and US$24 million interest on other cash and cash equivalent balances.
The investment income in 2022 of US$13 million comprised US$1 million interest on monies invested in the South African
and Ghanaian rehabilitation trust funds and US$12 million interest on other cash and cash equivalent balances.
Interest received on the South African and Ghanaian rehabilitation trust funds remained flat at US$1 million.
Interest on other cash balances increased by 100% from US$12 million in 2022 to US$24 million in 2023 mainly due to
higher average cash balances and higher interest rates in 2023.
Finance expense
Finance expense decreased by 14% from US$73 million in 2022 to US$63 million in 2023.
The finance expense of US$63 million in 2023 comprised US$22 million relating to the accretion of the environmental
rehabilitation liability, US$1 million relating to the unwinding of the silicosis provision, US$23 million lease interest and
US$82 million on various Group borrowings, partially offset by borrowing costs capitalised of US$65 million.
The finance expense of US$73 million in 2022 comprised US$12 million relating to the accretion of the environmental
rehabilitation liability, US$1 million relating to the unwinding of the silicosis provision, US$23 million lease interest and
US$75 million on various Group borrowings, partially offset by borrowing costs capitalised of US$38 million.
The environmental rehabilitation liability accretion expense increased by 83% from US$12 million in 2022 to US$22 million
in 2023 due to higher gross cost estimates at the end of 2022.
The unwinding of the silicosis provision remained flat at US$1 million.
The interest expense on lease liability remained flat at US$23 million.
Capitalised interest increased by 71% from US$38 million in 2022 to US$65 million in 2023 due to higher asset carrying
values at Salares Norte. An average interest capitalisation rate of 6.6% (2022: 6.4%) was applied. The interest was
capitalised in terms of IAS 23 Borrowing Costs. IAS 23 requires capitalisation of borrowing costs whenever general or
specific borrowings are used to finance qualifying projects.
Interest on Group borrowings increased by 9% from US$75 million in 2022 to US$82 million in 2023.
Below is an analysis of the components making up the interest on the various Group borrowings, stated on a comparative basis:
| | |
| |
Figures in millions unless otherwise stated | | |
| | |
Interest on borrowings to fund capital expenditure and operating costs at the South African operation | | |
Interest on US$500 million 5-year notes issue | | |
Interest on US$500 million 10-year notes issue | | |
Interest on US$100 million revolving senior secured credit facility | | |
Interest on US$150 million revolving senior secured credit facility | | |
Interest on A$500 million syndicated revolving credit facility – old | | |
Interest on A$500 million syndicated revolving credit facility – new | | |
Interest on US$1,200 million term loan and revolving credit facilities – old | | |
Interest on US$1,200 million term loan and revolving credit facility – new | | |
| | |
Interest on borrowings at the South African operation remained flat at US$2 million. The Rand facilities are fully undrawn and
the expense relates to commitment fees.
Interest on the US$500 million 5-year notes issue and the US$500 million 10-year notes issue remained flat at US$26 million
and US$31 million, respectively.
Interest on the US$100 million term revolving senior secured credit facility remained flat at US$1 million. The facility is fully
undrawn and the expense relates to commitment fees.
Interest on the US$150 million revolving senior secured increased by 33% from US$3 million in 2022 to US$4 million in 2023
due to an increase in the interest rate.
Interest on the old A$500 million syndicated revolving credit facility increased by 33% from US$6 million in 2022 to
US$8 million in 2023 due to higher drawdowns during 2023. On 26 September 2023, the facility was refinanced with a new
US$500 million syndicated revolving credit facility and cancelled. Interest on the new A$500 million syndicated revolving
credit facility was US$1 million in 2023.
Management’s discussion and analysis of the financial statements continued
Interest on the old US$1,200 million term loan and revolving credit facilities decreased by 33% from US$6 million in 2022 to
US$4 million in 2023. On 25 May 2023, the old US$1,200 million term loan and revolving credit facilities was refinanced with
the new US$1,200 million term loan and revolving credit facility and cancelled. Interest on the new US$1,200 million term
loan and revolving credit facility was US$5 million in 2023.
Gain/(loss) on financial instruments
The gain on financial instruments decreased by 100% from US$24 million in 2022 to US$nil in 2023 as all derivative financial
instruments matured in 2022.
The gain on financial instrument of US$24 million in 2022 comprised:
| | | |
| | |
Figures in millions unless otherwise stated | Unrealised (losses)/gains and prior year mark-to- market reversals | | |
| | | |
| | | |
| | | |
Salares Norte foreign currency hedge | | | |
| | | |
Ghana oil hedge
In May 2017 and June 2017, the Ghanaian operations entered into fixed price ICE Gasoil cash-settled swap transaction for
a total of 125.8 million litres of diesel for the period June 2017 to December 2019. The average swap price is US$457.2 per
metric tonne (equivalent US$61.4 per barrel). At the time of the transactions, the average Brent swap equivalent over the
tenure was US$49.8 per barrel.
In June 2019, fixed price ICE Gasoil cash-settled swap transactions were entered into for a total of 123.2 million litres of
diesel for the period January 2020 to December 2022 based on 50% of usage over the specified period. The average
swap price is US$575 per metric tonne (equivalent to US$75.8 per barrel). At the time of the transactions, the average Brent
swap equivalent over the tenor was US$59.2 per barrel.
At 31 December 2022, the mark-to-market value on the hedge was US$nil as the hedge matured, with a realised gain of
US$17 million and an unrealised loss and prior year mark-to-market reversals of US$3 million.
Australia oil hedge
In May 2017 and June 2017, the Australian operations entered into fixed price Singapore 10ppm Gasoil cash-settled swap
transactions for a total of 77.5 million litres of diesel for the period June 2017 to December 2019. The average swap price is
US$61.2 per barrel. At the time of the transactions, the average Brent swap equivalent over the tenure was US$49.9 per
barrel.
In June 2019, fixed price Singapore 10ppm Gasoil cash-settled swap transactions were entered into for a total of 75.0 million
litres of diesel for the period January 2020 to December 2022 based on 50% of usage over the specified period. The
average swap price is US$74.0 per barrel. At the time of the transactions, the average Brent swap equivalent over the tenor
was US$57.4 per barrel.
At 31 December 2022, the mark-to-market value on the hedge was A$nil (US$nil) as the hedge matured, with a realised gain
of A$15 million and an unrealised loss and prior year mark-to-market reversals of A$3 million (US$2 million) for the year
ended 31 December 2022.
Salares Norte
In March 2020, a total notional amount of US$544.5 million was hedged at a rate of CLP/US$836.45 for the period
July 2020 to December 2022.
At 31 December 2022, the mark-to-market value on the hedge was US$nil as the hedge matured, with a realised loss
of US$5 million and an unrealised gain and prior year mark-to-market reversals of US$7 million for the year ended
31 December 2022. For the period July 2020 to December 2022, the hedge realised a gain of US$33 million.
Foreign exchange (loss)/gain
The foreign exchange gain of US$7 million in 2022 compared with a loss of US$6 million in 2023. These gains or losses
on foreign exchange related to the conversion of offshore cash holdings into their functional currencies.
Other costs, net
Other costs, net increased by 227% from US$15 million in 2022 to US$49 million in 2023.
The costs in 2023 are mainly made up of:
•Social contributions of US$19 million;
•Offshore structure costs of US$15 million;
•Facility fees of US$4 million relating to the refinancing of the old US$1,200 million revolving credit facilities with the new
US$1,200 million revolving credit facility; and
•Rehabilitation expense of US$4 million as a result of changes in estimates relating to the provision for environmental
rehabilitation costs recognised in profit or loss.
The costs in 2022 are mainly made up of:
•Social contributions of US$19 million; and
•Offshore structure costs of US$15 million.
The above costs in 2022 were partially offset by the following:
•Rehabilitation income of US$9 million as a result of changes in estimates relating to the provision for environmental
rehabilitation costs recognised in profit or loss.
Share-based payments
Gold Fields recognises the cost of share options granted (share-based payments) in terms of IFRS 2 Share-based Payment.
The Group grants share options and restricted shares to Executive Committee members (including regional Executive
Committee members) under the Gold Fields Limited 2012 share plan amended. Gold Fields has adopted appropriate
valuation models (Monte Carlo simulation) to fair value share-based payments. The value of the equity-settled instruments
is determined at the grant date of the options and depending on the rules of the plan expensed on a straight-line basis over
a three-year vesting period, adjusted for forfeitures as appropriate.
Only Executive Committee members (including regional Executive Committee members) receive awards under the Gold
Fields Limited 2012 share plan amended, while senior and middle management receive awards under the revised long-term
incentive plan (“LTIP”).
Share-based payments increased by 29% from US$7 million in 2022 to US$9 million in 2023 mainly due to higher forecast
vesting percentages of the scheme and higher value allocations made in 2023. The corresponding entry for the share-
based payment expense was the share-based payment reserve within shareholders’ equity.
Long-term incentive plan expense
Gold Fields recognises the long-term incentive plan expense in terms of IAS 19 Employee Benefits.
On 1 March 2014, the Remuneration Committee approved the Gold Fields Limited long-term incentive plan (“LTIP”). The plan
provided for Executive Directors, certain officers and employees to receive a cash award, conditional on the achievement
of specified performance conditions relating to total shareholder return and free cash flow margin. The conditions were
assessed over the performance cycle which runs over three calendar years. The expected timing of the cash outflows in
respect of each grant was at the end of three years after the original award was made. The last award under this plan was
made in 2015.
Executive Committee members (including regional Executive Committee members) receive awards under the Gold Fields
Limited 2012 share plan amended, while senior and middle management receive awards under the revised LTIP. The
performance conditions of the revised LTIP are approved annually by the Remuneration Committee. The expected timing
of the cash outflows in respect of each grant is at the end of three years after the original award was made.
The LTIP expense increased by 93% from US$29 million in 2022 to US$56 million in 2023 due to the improved vesting
percentages on the absolute and relative Gold Fields share price performance as well as improved ESG performance
versus target.
Management’s discussion and analysis of the financial statements continued
Exploration expense
The exploration expense decreased by 6% from US$81 million in 2022 to US$76 million in 2023 mainly due to lower spend
in Chile and Ghana, as well as the weakening of the Australian Dollar.
| | |
| |
Figures in millions unless otherwise stated | | |
| | |
| | |
| | |
| | |
| | |
| | |
Total exploration expense | | |
Share of results of equity-accounted investees, net of taxation
The share of results of equity-accounted investees, net of taxation increased by 1,000% from a loss of US$3 million in 2022
to a loss of US$33 million in 2023.
| | |
| |
Figures in millions unless otherwise stated | | |
| | |
Far South East Resources Incorporated (“FSE”) | | |
| | |
Asanko Gold Inc (“Asanko”) | | |
Asanko – profit before impairment | | |
| | |
Lunnon Metals Limited (“Lunnon”) | | |
Share of result of equity-accounted investees, net of taxation | | |
Asanko Gold – recognised as a discontinued operation | | |
Share of result of equity-accounted investees, net of taxation – continuing operations | | |
Continuing operations
FSE’s share of loss of equity-accounted investees, net of taxation increased by 50% from US$1 million in 2022 to
US$2 million in 2023.
On 2 May 2023, Gold Fields, through a 100% held Canadian subsidiary, acquired a 50% interest in the Windfall Project in
Québec, Canada, which is in the feasibility stage, from Osisko Mining Incorporated (the “Partnership”). Gold Fields and
Osisko have joint control over the Windfall Project, the transaction is structured as a separate vehicle and the Group has
a residual interest in the net assets of the Windfall Project. Accordingly, the Group has classified its interest in the Windfall
Project as a joint venture. Windfall’s share of loss of equity-accounted investees, net of taxation was US$28 million in 2023.
Lunnon’s share of losses of equity-accounted investees increased by 50% from US$2 million in 2022 to US$3 million in
2023. Gold Fields holds 31.1% (2022: 33.96%) of Lunnon at 31 December 2023.
Discontinued operation
On 21 December 2023, Gold Fields announced the divestment of its 45% shareholding in Asanko Gold to the joint venture
partner Galiano Gold for a total consideration of US$170 million. Gold Fields will also receive a 1% net smelter royalty on
future production from the Nkran deposit, the main deposit at the mine. The transaction was subject to a number of
conditions and was concluded on 4 March 2024 with the receipt of US$65 million cash and 28.5 million Galiano shares.
The share of results of equity investee of Asanko Gold has been presented as a discontinued operation in the consolidated
financial statements and the comparative income statement has been presented as if Asanko Gold had been discontinued
from the start of the comparative years.
Asanko’s share of results of equity-accounted investees, net of taxation was a profit of US$13 million in 2022 compared to
a loss of US$19 million in 2023. The loss of US$19 million in 2023 comprised earnings of US$28 million, offset by an
impairment of US$47 million. The profit of US$13 million in 2022 comprises earnings only. The increase in Asanko’s earnings
is mainly due to higher profitability in 2023. As a result of the sale transaction, the investment in Asanko has been classified
as an asset held for sale at 31 December 2023 and the investment is required to be measured at the lower of carrying value
or fair value less costs to sell. Management determined the fair value less costs to sell based on the consideration to be
received per the sale agreement, which resulted in an impairment of US$47 million for the year ended 31 December 2023.
Yamana break fee
US$300 million income in 2022 related to the Yamana break fee. As a result of Yamana entering into an arrangement
agreement with Pan American Silver Corp and Agnico Eagle Mines Limited, Gold Fields terminated the agreement in respect
of the proposed acquisition of Yamana. In accordance, within the terms of the arrangement agreement, Yamana was
required to pay Gold Fields a termination fee of US$300 million.
Yamana transaction costs
The transaction costs of US$33 million in 2022 related mainly to amounts paid to advisors, bankers, lawyers and accountants
in connection with the proposed acquisition of Yamana.
Restructuring costs
Restructuring costs decreased by 27% from US$11 million in 2022 to US$8 million in 2023. The cost in 2023 related to the
separation packages at Tarkwa, Damang and St Ives and the cost in 2022 related mainly to separation packages at Tarkwa
and Damang.
Silicosis settlement costs
Silicosis settlement credits increased by 100% from US$2 million in 2022 to US$4 million in 2023.
A consolidated application was brought against several South African mining companies, including Gold Fields, for
certification of a class action on behalf of current or former mineworkers (and their dependants) who have allegedly
contracted silicosis and/or tuberculosis while working for one or more of the mining companies listed in the application
(refer to notes 28.2 and 38 of the consolidated financial statements for further details).
During 2023 and 2022, reversal of costs related to changes in the expected timing of the cash flows and an increase in the
discount rate.
Impairment of investments and assets
Impairment of investments and assets decreased by 69% from US$505 million in 2022 to US$156 million in 2023.
| | |
| |
Figures in millions unless otherwise stated | | |
| | |
Peru and Chile redundant assets | | |
Peru cash-generating unit | | |
Tarkwa cash-generating unit | | |
| | |
| | |
Management’s discussion and analysis of the financial statements continued
The impairment of US$156 million in 2023 comprised of:
•US$156 million impairment of Peru cash-generating unit. The recoverable amount was based on its fair value less cost of
disposal (“FVLCOD”) calculated using a combination of the market (resource value) and the income approach (level 3 of
the fair value hierarchy). The impairment is mainly due to the increased costs and capital expenditure as a result of a
change in the life-of-mine plan to accommodate the unloading of the east wall and continued cost pressures, as well as
the derecognition of the resource as a result of the life-of-mine sterilising the resource through the deposition of in-pit
tailings from 2026 onwards. The recoverable amount at 31 December 2023 is US$419 million using the following
assumptions based on the 2023 life-of-mine plan:
–Gold price:
• 2024 – US$1,910 per ounce;
• 2025 – US$1,875 per ounce;
• 2026 – US$1,800 per ounce;
• 2027 – US$1,760 per ounce; and
• Long-term – US$1,720 per ounce.
–Copper price:
• 2024 – US$8,500 per tonne;
• 2025 – US$8,700 per tonne;
• 2026 – US$8,900 per tonne;
• 2027 – US$8,600 per tonne; and
• Long-term – US$8,400 per ounce.
–Life-of-mine: 7 years; and
–Discount rate of 7.7%.
The impairment of US$505 million in 2022 comprised of:
•US$3 million impairment of redundant assets at Peru and Chile;
•US$63 million impairment of Peru cash-generating unit. The recoverable amount was based on its fair value less cost of
disposal (“FVLCOD”) calculated using a combination of the market (resource value) and the income approach (level 3 of
the fair value hierarchy). The impairment was mainly due to the increase in the discount rate from 4.8% to 8.1% as a result
of increases in the risk free rate as well as inflationary cost pressures experienced in 2022. The recoverable amount at
31 December 2022 was US$477 million using the following assumptions based on the 2022 life-of-mine plan:
–Gold price:
• 2023 – US$1,740 per ounce;
• 2024 – US$1,730 per ounce;
• 2025 – US$1,700 per ounce;
• 2026 – US$1,650 per ounce; and
• Long-term – US$1,620 per ounce.
–Copper price:
• 2023 – US$7,700 per tonne;
• 2024 – US$8,150 per tonne;
• 2025 – US$8,150 per tonne;
• 2026 – US$8,150 per tonne; and
• Long-term – US$7,700 per ounce.
–Resource price of US$30 per ounce;
–Resource ounces of 1.0 million ounces;
–Life-of-mine: 8 years; and
–Discount rate of 8.1%.
•US$325 million impairment of Tarkwa cash-generating unit. The recoverable amount was based on its fair value less cost
of disposal (“FVLCOD”) calculated using a combination of the market (resource value) and the income approach (level 3
of the fair value hierarchy). The impairment was mainly due to the increase in the discount rate from 8.3% to 15.9% as a
result of increases in the Ghana country risk premium and the risk free rate as well as inflationary cost pressures
experienced in 2022.
•The recoverable amount at 31 December 2022 was US$812 million using the following assumptions based on the 2022
life-of-mine plan:
–Gold price:
• 2023 – US$1,740 per ounce;
• 2024 – US$1,730 per ounce;
• 2025 – US$1,700 per ounce;
• 2026 – US$1,650 per ounce; and
• Long-term – US$1,620 per ounce.
–Resource price of US$71 per ounce;
–Resource ounces of 24.5 million ounces;
–Life-of-mine: 13 years; and
–Discount rate of 15.9%.
•Impairment of FSE of US$114 million. Management was actively engaged in the process of disposing of FSE in 2022. The
disposal process proved unsuccessful and no offers were received. Management’s assessment is that it is unlikely the
investment could be sold for any value and wrote off the investment by US$114 million to a carrying value of US$nil.
Ghana expected credit loss
Ghana expected credit loss (“ECL”) increased by 83% from US$18 million in 2022 to US$33 million in 2023.
The ECL of US$33 million in 2023 comprises US$25 million raised against a contractor loan receivable at Tarkwa and
US$8 million raised against a Damang receivable. The ECL of US$18 million in 2022 comprises US$4 million raised against
a contractor loan receivable and US$14 million raised against a Tarkwa receivable. Due to issues with fleet availability at
both Tarkwa and Damang, an agreement was entered into between Gold Fields and Engineers and Planners (“E&P”) to
provide financial assistance to E&P in order to procure new fleet in 2020. The initial contractor loan receivable amounted
to US$68 million and at 31 December 2023 a cumulative impairment of US$68 million (2022: US$45 million and 2021:
US$4 million) was raised, resulting in a net balance of US$nil.
Profit on disposal of assets
Profit on disposal of assets increased by 220% from US$10 million in 2022 to US$32 million in 2023. The profit in 2023
related mainly to a gain on disposal of the Kambalda tenements at St Ives in exchange for shares in Mineral Resources
Limited. The profit in 2022 related mainly to the sale of redundant assets at South Deep and Australia.
Royalties
Royalties increased by 5% from US$110 million in 2022 to US$116 million in 2023 and are made up as follows:
| | |
| |
Figures in millions unless otherwise stated | | |
| | |
| | |
| | |
| | |
| | |
| | |
The royalty in South Africa remained flat at US$3 million mainly due to the weakening of the South African Rand to the
US Dollar. In South African Rand, the royalty increased by 21% from R48 million in 2022 to R58 million in 2023 in line with
the increase in revenue.
The royalty in Ghana remained flat at US$55 million.
The royalty in Peru increased by 17% from US$6 million in 2022 to US$7 million in 2023 due to an increase in operating
profit margin in 2023.
The royalty in Australia increased by 11% from US$46 million in 2022 to US$51 million in line with the increase in revenue.
In Australian Dollar, the royalty increased by 15% from A$68 million in 2022 to A$78 million in 2023 for the same reason
as above.
Management’s discussion and analysis of the financial statements continued
Mining and income tax
The mining and income tax charge increased by 5% from US$442 million in 2022 to US$465 million in 2023.
The table below indicates Gold Fields’ effective tax rate in 2023 and 2022:
| | |
| |
Figures in millions unless otherwise stated | | |
| | |
Income and mining tax charge (US$ million) | | |
| | |
In 2023, the effective tax rate of 38.0% was higher than the maximum South African mining statutory tax rate of 34% mainly
due to the tax effect of the following:
•US$57 million adjustment to reflect the actual realised company tax rates in South Africa and offshore;
•US$3 million deferred tax movement on Peruvian Nuevo Sol devaluation against US Dollar; and
•USS$3 million prior year adjustments.
The above were offset by the following tax effected charges:
•US$3 million non-deductible share-based payments;
•US$22 million non-deductible interest paid
•US11 million of non-deductible share of results of equity-accounted investees, net of taxation;;
•US$14 million dividend withholding tax;
•US$18 million of net non-deductible expenditure and non-taxable income;
•US$6 million of various Peruvian non-deductible expenses; and
•US$31 million deferred tax assets utilised at Tarkwa and Damang.
In 2022, the effective tax rate of 38% was higher than the maximum South African mining statutory tax rate of 34% mainly
due to the tax effect of the following:
•US$66 million adjustment to reflect the actual realised company tax rates in South Africa and offshore;
•US$3 million of non-deductible share of results of equity-accounted investees, net of taxation;
•US$18 million exclusion from capital gains tax of Yamana break fee and transaction costs;
•US$4 million deferred tax movement on Peruvian Nuevo Sol devaluation against US Dollar; and
•US$1 million deferred tax assets utilised at Tarkwa and Damang.
The above were offset by the following tax effected charges:
•US$2 million non-deductible share-based payments;
•US$39 million not recognised on FSE impairment;
•US$22 million non-deductible interest paid;
•US$21 million dividend withholding tax;
•US$18 million of net non-deductible expenditure and non-taxable income;
•US$5 million of various Peruvian non-deductible expenses;
•US$14 million deferred tax assets not recognised at Cerro Corona;
•USS$3 million prior year adjustments; and
•US$6 million deferred tax charge on change of tax rate at South Deep.
Gold Fields continues to believe that it will recover the withholding tax receivable of US$76 million (CAD100 million) (2022:
US$76 million (CAD100 million)) relating to the withholding tax deducted and paid to the Canadian tax authority in 2022 on
the Yamana break fee.
Profit from continuing operations
As a result of the factors discussed above, the profit increased by 5% from US$709 million in 2022 to US$745 million
in 2023.
(Loss)/profit from discontinued operation
Profit for the year from discontinued operation of US$13 million in 2022 compared to a loss of US$19 million in 2023. The
loss of US$19 million in 2023 comprises an impairment of the equity investment in Asanko of US$47 million, partially offset
by share of profits realised during the year of US$28 million. The profit of US$13 million in 2022 comprises the share of
profits realised during the year.
Profit attributable to owners of the parent from continuing operations
Profit attributable to owners of the parent from continuing increased by 3% from US$698 million in 2022 to US$722 million
in 2023.
Profit attributable to non-controlling interests
Profit attributable to non-controlling interests increased by 109% from US$11 million in 2022 to US$23 million in 2023.
The non-controlling interest at the end of 2023 and 2022 consists of Gold Fields Ghana Limited (Tarkwa) and Abosso
Goldfields Limited (Damang) at 10% each, Gold Fields La Cima S.A. (Cerro Corona) at 0.47% and Newshelf 899 (Proprietary)
Limited (South Deep) at 3.57%.
The amount making up the non-controlling interest is shown below:
| | | | |
| | | | |
| Non-controlling interest Effective* | Non-controlling interest Effective* | | |
| | | | |
Gold Fields Ghana – Tarkwa | | | | |
Abosso Goldfields – Damang | | | | |
Gold Fields La Cima – Cerro Corona | | | | |
Newshelf 899 – South Deep | | | | |
| | | | |
*Average for the year.
Basic earnings per share
As a result of the above, Gold Fields earnings per share decreased by 1% from US$0.80 per share in 2022 to US$0.79 per
share in 2023.
Basic earnings per share from continuing operations
As a result of the above, Gold Fields earnings per share from continuing operations increased by 3% from US$0.79 per
share in 2022 to US$0.81 per share in 2023.
Basic earnings per share from discontinued operation
As a result of the above, Gold Fields earnings per share from discontinued operation was an earnings of US$0.01 per share
in 2022 compared to a loss of US$0.02 per share in 2023.
Normalised profit attributable to owners of the parent
Normalised profit attributable to owners of the parent is considered an important measure by Gold Fields of the profit
realised by the Group in the ordinary course of operations. In addition, it forms the basis of the dividend pay-out policy.
Normalised profit is defined as profit excluding gains and losses on foreign exchange, financial instruments, non-recurring
net realisable value adjustment to stockpiles and non-recurring items after taxation and non-controlling interest effect.
Normalised profit attributable to owners of the parent from continuing operations increased by 3% from US$847 million or
US$0.96 per share in 2022 to US$872 million or US$0.98 per share in 2022.
Normalised profit attributable to owners of the parent from discontinued operation increased by 115% from US$13 million or
US$0.01 per share in 2022 to US$28 million or US$0.03 per share in 2023.
Management’s discussion and analysis of the financial statements continued
Normalised profit attributable to owners of the parent from continuing operations reconciliation for the Group is calculated
as follows:
| | |
| |
Figures in millions unless otherwise stated | | |
| | |
Profit for the year attributable to owners of the parent from continuing operations | | |
Adjusted for the following: | | |
| | |
Tax effect of non-recurring items* | | |
Non-controlling interest effect of non-recurring items* | | |
Loss/(gain) on foreign exchange | | |
Tax effect on foreign exchange* | | |
Non-controlling interest effect of foreign exchange* | | |
Gain on financial instruments | | |
Tax effect on financial instruments* | | |
Non-controlling interest effect of financial instruments* | | |
Damang net realisable value adjustment to stockpiles | | |
Non-controlling interest effect on Damang net realisable value adjustment* | | |
South Deep deferred tax change* | | |
Exchange rate adjustment* | | |
Normalised profit attributable to owners of the parent from continuing operations | | |
1Non-recurring items are considered unusual and not expected during regular business operations and comprise the following:
| | |
| |
Figures in millions unless otherwise stated | | |
| | |
Profit on the sale of assets | | |
| | |
| | |
| | |
| | |
Rehabilitation adjustments | | |
Ghana expected credit losses | | |
Other non-recurring items* | | |
Total non-recurring items | | |
*Based on information underlying the audited consolidated annual financial statements of Gold Fields Limited for the year ended 31 December 2023.
Normalised profit attributable to owners of the parent from discontinued operation reconciliation for the Group is calculated
as follows:
| | |
| |
Figures in millions unless otherwise stated | | |
| | |
(Loss)/profit for the year attributable to owners of the parent from discontinued operation | | |
Adjusted for the following: | | |
Impairment of Asanko Gold | | |
Normalised profit attributable to owners of the parent from discontinued operation | | |
Results for the period – years ended 31 December 2022 and 31 December 2021
Profit attributable to owners of the parent for the Group decreased by 10% from US$789 million (or US$0.89 per share) in
2021 to US$711 million (or US$0.80 per share) in 2022. The reasons for this decrease are discussed on the following pages.
Revenue
Revenue increased by 2% from US$4,195 million in 2021 to US$4,287 million in 2022. The increase in revenue of
US$92 million was due to higher gold sold.
The average US Dollar gold price achieved by the Group (excluding Asanko) decreased by 1% from US$1,794 per equivalent
ounce in 2021 to US$1,785 per equivalent ounce in 2022. The average Rand gold price increased by 11% from R851,102 per
kilogram in 2021 to R943,581 per kilogram in 2022. The average Australian Dollar gold price increased by 8% from
A$2,401 per ounce in 2021 to A$2,592 per ounce in 2022. The average US Dollar gold price for the Ghanaian operations
(including Asanko) increased marginally from US$1,794 per ounce in 2021 to US$1,802 per ounce in 2022 and the average
US Dollar gold price for the Ghanaian operations (excluding Asanko) increased by 1% from US$1,797 per ounce in 2021 to
US$1,806 per ounce in 2022. The average equivalent US Dollar gold price, net of treatment and refining charges, for
Cerro Corona decreased by 5% from US$1,750 per equivalent ounce in 2021 to US$1,671 per equivalent ounce in 2022. The
average US Dollar/Rand exchange rate weakened by 11% against the US Dollar, from an average of R14.79 per US$1.00 in
2021 to R16.37 per US$1.00 in 2022. The Australian Dollar weakened by 8% at an average of A$1.00 per US$0.75 in 2021 to
A$1.00 per US$0.69 in 2022.
Gold sales from continuing operations (excluding Asanko) increased by 3% from 2,339,100 equivalent ounces in 2021 to
2,401,900 equivalent ounces in 2022. Gold sales at the South African operation increased by 12% from 9,102 kilograms
(292,600 ounces) in 2021 to 10,200 kilograms (327,900 ounces) in 2022. Gold sales at the Ghanaian operations (excluding
Asanko) increased by 2% from 776,100 ounces in 2021 to 758,000 ounces in 2022. Gold equivalent sales at the Peruvian
operation (Cerro Corona) increased by 5% from 248,400 equivalent ounces in 2021 to 260,100 equivalent ounces in 2022.
At the Australian operations, gold sales increased by 3% from 1,021,900 ounces in 2021 to 1,055,800 ounces in 2022. As a
general rule, Gold Fields sells all the gold it produces.
| | | | | | |
| | |
| | | | | | |
| | | | | | |
| | | | | | |
| | | | | | |
| | | | | | |
| | | | | | |
| | | | | | |
| | | | | | |
| | | | | | |
| | | | | | |
| | | | | | |
| | | | | | |
Continuing and discontinued operations | | | | | | |
1Equity-accounted joint venture. Asanko has been presented as a discontinued operation, refer to note 14 of the AFR for further details. Included above for
information only, not included in revenue for the Group.
Continuing operations
At South Deep in South Africa, gold sales increased by 12% from 9,102 kilograms (292,600 ounces) in 2021 to 10,200
kilograms (327,900 ounces) in 2022 due to improved efficiencies resulting in increased volumes mined and processed as
well as improved mine call factor and plant recovery factor.
At the Ghanaian operations, gold sales at Tarkwa increased by 1% from 521,700 ounces in 2021 to 529,100 ounces in 2022
mainly due to higher tonnes processed and yield. Damang’s gold sales decreased by 10% from 254,400 ounces in 2021 to
228,900 ounces in 2022 mainly due to lower yield as a result of lower grade of ore processed.
Management’s discussion and analysis of the financial statements continued
At Cerro Corona in Peru, copper sales increased by 4% from 25,795 tonnes in 2021 to 26,704 tonnes in 2022 due to higher
copper recoveries, while gold sales increased by 16% from 112,957 ounces in 2021 to 130,555 ounces in 2022 due to
selective processing of higher grade ore and higher gold recoveries. Gold equivalent sales increased by 5% from 248,400
ounces in 2021 to 260,100 ounces in 2022.
At the Australian operations, gold sales at St Ives decreased by 5% from 391,100 ounces in 2021 to 373,200 ounces in 2022
due to a 6% decrease in tonnes processed. Agnew, gold sales increased by 7% from 222,800 ounces in 2021 to 238,700
ounces in 2022 due to an increase in yield, partially off-set by decreased ore tonnes processed. At Granny Smith, gold sales
increased by 1% from 283,600 ounces in 2021 to 287,400 ounces in 2022 due to an increase in yield on higher grades
mined, partially offset by decreased ore tonnes processed. At Gruyere, gold sales increased by 26% from 124,400 ounces
in 2021 to 156,400 ounces in 2022 due to increased ore processed at higher grade.
Discontinued operation
Gold sales at Asanko decreased by 22% from 97,200 ounces in 2021 to 75,500 ounces in 2022 mainly due to lower yield.
Cost of sales
Cost of sales, which comprises cost of sales before gold inventory change and amortisation and depreciation, gold inventory
change and amortisation and depreciation, increased by 10% from US$2,375 million in 2021 to US$2,608 million in 2022.
The reasons for this increase are described below.
Cost of sales before gold inventory change and amortisation and depreciation
Continuing operations
Cost of sales before gold inventory change and amortisation and depreciation increased by 8% from US$1,785 million in
2021 to US$1,932 million in 2022 mainly due to inflationary increases affecting all the regions, partially offset by the
weakening of the South African Rand and Australian Dollar.
At South Deep in South Africa, cost of sales before gold inventory change and amortisation and depreciation increased by
15% from R4,618 million (US$312 million) in 2021 to R5,314 million (US$325 million) in 2022 mainly due to a 5% increase in
total tonnes mined, a 2% increase in total tonnes milled and inflationary increases on consumables, contractors, electricity
and employee costs
At the Ghanaian operations (excluding Asanko), cost of sales before gold inventory change and amortisation and
depreciation increased by 7% from US$562 million in 2021 to US$600 million in 2022. At Tarkwa, cost of sales before gold
inventory change and amortisation and depreciation increased by 20% from US$340 million in 2021 to US$407 million in
2022 mainly due to a 19% increase in ore tonnes mined, a 12% increase in operational waste tonnes mined and inflationary
increases mainly impacting fuel, explosives, grinding media and employee costs. At Damang, cost of sales before gold
inventory change and amortisation and depreciation decreased by 13% from US$222 million in 2021 to US$193 million in
2022 mainly due to a 29% decrease in ore tonnes mined and a 47% decrease in operational waste tonnes mined despite
processing volume remaining similar, partially offset by inflationary increases mainly impacting fuel, explosives, grinding
media and employee costs.
At Cerro Corona in Peru, cost of sales before gold inventory change and amortisation and depreciation increased by 18%
from US$190 million in 2021 to US$225 million in 2022 mainly due to a 54% increase in ore tonnes mined partially offset by
a 20% decrease in operational waste tonnes mined. Operational costs were also impacted by inflationary increases mainly
impacting fuel, explosives, grinding media and employee costs.
At the Australian operations, cost of sales before gold inventory change and amortisation and depreciation increased by
17% from A$959 million (US$721 million) in 2021 to A$1,122 million (US$777 million) in 2022. At St Ives, cost of sales before
gold inventory change and amortisation and depreciation increased by 11% from A$357 million (US$268 million) in 2021 to
A$396 million (US$274 million) in 2022 mainly due to a 45% increase in operational waste tonnes mined at the Neptune
open pit combined with inflationary pressures on commodity inputs and employee and contractor costs which resulted in
higher production costs. At Agnew, cost of sales before gold inventory change and amortisation and depreciation increased
by 18% from A$224 million (US$168 million) in 2021 to A$264 million (US$183 million) in 2022 mainly due to a 6% increase in
operational waste tonnes mined combined with inflationary pressures on commodity inputs and employee and contractor
costs which resulted in higher production costs. At Granny Smith, cost of sales before gold inventory change and
amortisation and depreciation increased by 16% from A$255 million (US$191 million) in 2021 to A$295 million
(US$204 million) in 2022 mainly due to inflationary pressures on commodity inputs and employee and contractor costs
which resulted in higher production costs combined with structural increases in costs related to support and paste fill due to
increase in depth at the Wallaby underground mine. At Gruyere, cost of sales before gold inventory change and amortisation
and depreciation increased by 36% from A$123 million (US$93 million) in 2021 to A$167 million (US$116 million) in 2022
mainly due a 278% increase in operational waste tonnes mined, combined with inflationary pressures on commodity inputs
and employee and contractor costs which resulted in higher production costs.
Discontinued operation
Asanko was accounted for as an equity accounted investees and Gold Fields share of its cost of sales before gold inventory
change and amortisation and depreciation is not included the Group cost of sales before gold inventory change and
amortisation and depreciation. At Asanko, cost of sales before gold inventory change and amortisation and depreciation
(45% basis) decreased by 37% from US$115 million in 2021 to US$73 million in 2022 mainly due to a 70% decrease in ore
tonnes mined and a 81% decrease in operational waste tonnes mined due to the temporary cessation of mining activities in
June 2022. Processing volume remained similar year-on-year.
Gold inventory change
The gold inventory credit to costs increased by 37% from US$123 million in 2021 to US$168 million in 2022.
Continuing operations
At South Deep, the gold inventory credit to costs increased by 62% from R108 million (US$7 million) in 2021 to R175 million
(US$11 million) in 2022, due to a build up of stockpiles and gold in circuit.
At Tarkwa, the gold inventory credit to costs increased by 20% from US$30 million in 2021 to US$36 million in 2022, due to
a build-up of stockpiles.
At Damang, the gold inventory credit to costs decreased by 43% from US$72 million in 2021 to US$41 million in 2022, due to
a lower build-up of stockpiles.
At Cerro Corona, the gold inventory credit to costs increased by 257% from US$14 million in 2021 to US$50 million in 2022,
due to a build-up of stockpiles in line with the life of mine strategy.
At St Ives, the charge to costs of A$7 million (US$5 million) in 2021 compared to a credit to costs of A$9 million (US$6 million)
in 2021.
At Agnew, the charge to costs decreased by 67% from A$6 million (US$4 million) in 2021 to A$2 million (US$1 million) in 2022.
At Granny Smith, the charge to costs of A$3 million (US$2 million) in 2021 compared to a credit to costs of A$2 million (US$1 million)
in 2022.
At Gruyere, the credit to costs increased by 47% from A$15 million (US$11 million) in 2021 to A$22 million (US$15 million) in
2022, due to a build up of stockpiles.
Discontinued operation
At Asanko, the gold inventory credit to costs of US$5 million in 2021 compared to a charge to costs of US$9 million in 2022,
as the operation treated stockpiles in H2 2022.
Amortisation and depreciation
Amortisation and depreciation is calculated on the units-of-production method and is based on current gold production as a
percentage of total expected gold production over the lives of the different mines based on proved and probable reserves.
The amortisation in 2022 was based on the reserves as at 31 December 2021. The life-of-mine information is based on the
operations reserve life of mine models. In basic terms, amortisation is calculated using the life-of-mine for each operation,
which is based on: (1) the proved and probable reserves for the operation at the start of the relevant year; and (2) the amount
of gold produced/mined by the operation during the year.
Management’s discussion and analysis of the financial statements continued
| | |
| Amortisation for the year ended |
| 31 December 2022 US$ million | 31 December 2021 US$ million |
| | |
| | |
| | |
| | |
| | |
| | |
| | |
| | |
| | |
| | |
| | |
| | |
| | |
| | |
| | |
Total amortisation and depreciation | | |
Amortisation and depreciation increased by 18% from US$713 million in 2021 to US$844 million in 2022 mainly due to the
higher ounces mined in 2022.
Continuing operations
At South Deep in South Africa, amortisation and depreciation increased by 33% from R636 million (US$43 million) in 2021 to
R848 million (US$52 million) in 2022 due to higher ounces mined.
At the Ghanaian operations (excluding Asanko), amortisation and depreciation increased by 20% from US$265 million in
2021 to US$318 million in 2022. Tarkwa increased by 28% from US$172 million in 2021 to US$221 million in 2022 mainly due
to higher ounces mined. Damang increased by 4% from US$93 million in 2021 to US$97 million in 2022 mainly due a shorter
reserve life.
At Cerro Corona in Peru, amortisation and depreciation increased by 43% from US$88 million in 2021 to US$126 million in
2022 mainly due to higher gold and copper ounces mined.
At the Australian operations, amortisation and depreciation increased by 19% from A$399 million (US$300 million) in 2021
to A$473 million (US$328 million) in 2022. At St Ives, amortisation and depreciation increased by 39% from A$113 million
(US$85 million) in 2021 to A$157 million (US$109 million) in 2022 mainly due to increased unit rates for Neptune stage 7 and
lower Hamlet development. At Agnew, amortisation and depreciation increased by 19% from A$86 million (US$65 million) in
2021 to A$102 million (US$71 million) in 2022 mainly due to effect of shorter useful life at New Holland. At Granny Smith,
amortisation and depreciation increased by 1% from A$96 million (US$72 million) in 2021 to A$97 million (US$67 million) in
2022 mainly due increased ounces mined. At Gruyere, amortisation and depreciation increased by 14% from A$103 million
(US$78 million) in 2021 to A$117 million (US$81 million) in 2022 due to increased ounces mined.
All-in sustaining and total all-in costs
The following table sets out for each operation and the Group, total gold sales in ounces, all-in sustaining costs and total all-
in costs, net of by-product revenue, in US$/oz for 2022 and 2021:
| | | | | | |
| | |
Figures in thousands unless otherwise stated | | All-in sustaining costs – US$/oz | | | All-in sustaining costs – US$/oz | |
| | | | | | |
| | | | | | |
| | | | | | |
| | | | | | |
| | | | | | |
| | | | | | |
| | | | | | |
| | | | | | |
| | | | | | |
| | | | | | |
| | | | | | |
| | | | | | |
| | | | | | |
| | | | | | |
| | | | | | |
Continuing and discontinued operations | | | | | | |
All-in costs are calculated in accordance with the World Gold Council Industry standard. Refer pages 22 to 28 for detailed calculations and discussion of AIC.
1Equity-accounted joint venture.
2Gold sold at Cerro Corona excludes copper equivalents of 135,443 ounces in 2021 and 129,592 ounces in 2022. Asanko has been presented as a
discontinued operation, refer note 14 for further details.
Figures above may not add as they are rounded independently.
AISC and AIC
AISC net of by-product revenues (including Asanko) increased by 4% from US$1,063 per ounce of gold in 2021 to
US$1,105 per ounce of gold in 2022, mainly due to higher sustaining capital expenditure and higher cost of sales before
amortisation and depreciation, partially offset by higher gold sold and the 11% weakening of the South African Rand and
8% weakening of the Australian Dollar.
AIC net of by-product revenues (including Asanko) increased by 2% from US$1,297 per ounce of gold in 2021 to
US$1,320 per ounce of gold in 2022 mainly due to the same reasons as AISC, partially offset by lower non-sustaining capital.
AISC net of by-product revenues (excluding Asanko) increased by 5% from US$1,047 per ounce of gold in 2021 to
US$1,097 per ounce of gold in 2022, mainly due to higher sustaining capital expenditure and higher cost of sales before
amortisation and depreciation, partially offset by higher gold sold and the 11% weakening of the South African Rand and
8% weakening of the Australian Dollar. AIC net of by-product revenues (excluding Asanko) increased by 2% from
US$1,285 per ounce of gold in 2021 to US$1,317 per ounce of gold in 2022 mainly due to the same reasons as AISC, partially
offset by lower non-sustaining capital.
Continuing operations
At South Deep in South Africa, AISC increased by 9% from R622,726 per kilogram (US$1,310 per ounce) in 2021 in 2021 to
R680,931 per kilogram (US$1,294 per ounce) in 2022 due to the prevailing inflationary pressures and higher sustaining
capital costs partially offset by higher gold sales. AIC increased by 9% from R655,826 per kilogram (US$1,379 per ounce)
in 2021 to R713,624 per kilogram (US$1,356 per ounce) in 2022 due to the same reasons as AISC as well as higher non-
sustaining capital.
Management’s discussion and analysis of the financial statements continued
At the Ghanaian operations, AISC increased by 10% from US$1,083 per ounce in 2021 to US$1,188 per ounce in 2022 and
AIC increased by 10% from US$1,112 per ounce in 2021 to US$1,220 per ounce in 2022. At Tarkwa, AISC and AIC increased
by 8% from US$1,155 per ounce in 2021 to US$1,248 per ounce in 2022 due to higher capital expenditure and higher cost of
sales before amortisation and depreciation, partially offset by higher ounces sold. At Damang, AISC increased by 24% from
US$802 per ounce in 2021 to US$998 per ounce in 2022 due to lower gold sold, higher sustaining capital expenditure and
higher cost of sales before amortisation and depreciation. AIC increased by 27% from US$852 per ounce in 2021 to
US$1,083 per ounce in 2022 due to the same reasons as AISC and higher non-sustaining capital.
At Cerro Corona in Peru, AISC was a credit of US$34 per ounce in 2021 compared to a cost of US$310 per ounce in 2022
mainly as a result of higher operating cost due to inflation and lower by-product credits due to a lower copper price and
higher sustaining capital, partially off-set by higher gold inventory credit due to higher low-grade stocking and higher gold
ounces sold. AIC per ounce increased by 93% from US$230 per equivalent ounce in 2021 to US$444 per equivalent ounce
in 2022 mainly due to the same reasons for AISC, partially offset by lower non-sustaining capital. AISC per equivalent ounce
increased by 1% from US$920 per equivalent ounce in 2021 to US$930 per equivalent ounce in 2022 mainly due higher
operating cost due to inflation and higher sustaining capital expenditure, partially offset by higher equivalent ounces sold
and higher gold inventory credit as a result of higher build-up of low grade stockpile in 2022. AIC per equivalent ounce
decreased by 4% from US$1,040 per equivalent ounce in 2021 to US$998 per equivalent ounce in 2022 mainly due to
higher equivalent ounces sold, higher gold inventory credit as a result of higher build-up of low grade stockpile in 2022 and
lower non-sustaining capital expenditure, partially offset by higher operating cost due to inflation.
At the Australian operations, AISC increased by 6% from A$1,418 per ounce (US$1,065 per ounce) in 2021 to A$1,503 per
ounce (US$1,041 per ounce) in 2022. AIC increased by 9% from A$1,526 per ounce (US$1,146 per ounce) in 2021 to A$1,659
per ounce (US$1,150 per ounce) in 2022. At St Ives, AISC increased by 11% from A$1,339 per ounce (US$1,006 per ounce) in
2021 to A$1,485 per ounce (US$1,029 per ounce) in 2022 due to lower ounces sold, higher cost of sales before amortisation
and depreciation and higher sustaining capital expenditure. AIC increased by 15% from A$1,385 per ounce (US$1,040 per
ounce) in 2021 to A$1,594 per ounce (US$1,104 per ounce) in 2021 due to the same reasons as AISC. At Agnew, AISC
increased by 5% from A$1,550 per ounce (US$1,164 per ounce) in 2021 to A$1,632 per ounce (US$1,130 per ounce) in 2022
due to increased sustaining capital expenditure and inflationary pressures on commodity inputs and employee and
contractor costs, which resulted in higher production costs. The production and capital cost increases were partially offset
by increased gold sold. AIC increased by 8% from A$1,741 per ounce (US$1,308 per ounce) in 2021 to A$1,875 per ounce
(US$1,298 per ounce) in 2022 due to the same reasons as AISC. At Granny Smith, AISC increased by 7% from A$1,376 per
ounce (US$1,033 per ounce) in 2021 to A$1,466 per ounce (US$1,016 per ounce) in 2022 due to increased sustaining capital
expenditure and inflationary pressures on commodity inputs and employee and contractor costs, which resulted in higher
production costs. The production and capital cost increases were partially offset by increased gold sold. AIC increased by
9% from A$1,545 per ounce (US$1,161 per ounce) in 2021 to A$1,691 per ounce (US$1,171 per ounce) in 2022 mainly due to
the same reasons as AISC. At Gruyere, AISC decreased by 7% from A$1,525 per ounce (US$1,146 per ounce) in 2021 to
A$1,415 per ounce (US$980 per ounce) in 2022 due to higher gold sold and lower capital expenditure, partially offset by
higher cost of sales before amortisation and depreciation. AIC decreased by 7% from A$1,541 per ounce (US$1,158 per
ounce) in 2021 to A$1,431 per ounce (US$991 per ounce) in 2022 due to the same reasons as all-in sustaining costs.
Discontinued operation
At Asanko, AISC decreased by 6% from US$1,431 per ounce in 2021 to US$1,346 per ounce in 2022 due to lower cost of
sales before amortisation and depreciation and sustaining capital expenditure, partially offset by lower gold ounces sold.
AIC decreased by 8% from US$1,559 in 2021 to US$1,435 in 2022 due the same reasons as AISC as well as lower non-
sustaining capital.
Investment income
Income from investments increased by 63% from US$8 million in 2021 to US$13 million in 2022.
The investment income in 2022 of US$13 million comprised US$1 million interest on monies invested in the South African
rehabilitation trust fund and US$12 million interest on other cash and cash equivalent balances.
The investment income in 2021 of US$8 million comprised US$1 million interest on monies invested in the South African
rehabilitation trust fund and US$7 million interest on other cash and cash equivalent balances.
Interest received on the South African rehabilitation trust fund remained flat at US$1 million.
Interest on other cash balances increased by 71% from US$7 million in 2021 to US$12 million in 2022 mainly due to higher
cash balances and higher interest rates in 2022.
Finance expense
Finance expense decreased by 28% from US$101 million in 2021 to US$73 million in 2022.
The finance expense of US$73 million in 2022 comprised US$12 million relating to the accretion of the environmental
rehabilitation liability, US$1 million relating to the unwinding of the silicosis provision, US$23 million lease interest and
US$75 million on various Group borrowings, partially offset by borrowing costs capitalised of US$38 million.
The finance expense of US$101 million in 2021 comprised US$9 million relating to the accretion of the environmental
rehabilitation liability, US$1 million relating to the unwinding of the silicosis provision, US$24 million lease interest and
US$80 million on various Group borrowings, partially offset by borrowing costs capitalised of US$13 million.
The environmental rehabilitation liability accretion expense increased by 33% from US$9 million in 2021 to US$12 million
in 2022 due to higher gross cost estimates at the end of 2021.
The unwinding of the silicosis provision remained flat at US$1 million.
The interest expense on lease liability decreased by 4% from US$24 million in 2021 to US$23 million in 2022 due to a
decrease in the lease liability in 2022.
Capitalised interest increased by 192% from US$13 million in 2021 to US$38 million in 2022 due to increased capital
expenditure at Salares Norte. The Salares Norte project was approved by the Board and capital expenditure commenced
in April 2020. An average interest capitalisation rate of 6.4% (2021: 5.9%) was applied. The interest was capitalised in terms
of IAS 23 Borrowing Costs. IAS 23 requires capitalisation of borrowing costs whenever general or specific borrowings are
used to finance qualifying projects.
Below is an analysis of the components making up the interest on the various Group borrowings, stated on a comparative
basis:
| | |
| |
Figures in millions unless otherwise stated | | |
| | |
Interest on borrowings to fund capital expenditure and operating costs at the South African operation | | |
Interest on US$500 million 5-year notes issue | | |
Interest on US$500 million 10-year notes issue | | |
Interest on US$100 million revolving senior secured credit facility | | |
Interest on US$150 million revolving senior secured credit facility | | |
Interest on A$500 million syndicated revolving credit facility | | |
Interest on US$1,200 million term loan and revolving credit facilities | | |
| | |
| | |
Interest on borrowings to fund capital expenditure and operating costs at the South African operation remained flat at
US$2 million. The Rand facilities are fully undrawn and the expense relates to commitment fees.
Interest on the US$500 million 5-year notes issue and US$500 million 10-year notes issue remained flat at US$26 million
and US$31 million, respectively.
Interest on the US$100 million term revolving senior secured credit facility decreased by 50% from US$2 million in 2021 to
US$1 million in 2022. The facility was repaid in full in 2019 and the expense relates to commitment fees.
Interest on the US$150 million revolving senior secured credit facility remained flat at US$3 million.
Interest on the A$500 million syndicated revolving credit facility decreased by 14% from US$7 million in 2021 to US$6 million
in 2022. The facility is fully undrawn at 31 December 2022 and the expense relates to drawings during the year that were
repaid.
Interest on the US$1,200 million term loan and revolving credit facilities decreased by 25% from US$8 million in 2021 to
US$6 million in 2022. The facilities are fully undrawn at 31 December 2022 and the expense relates to drawings during the
year that were repaid.
Management’s discussion and analysis of the financial statements continued
Gain/(loss) on financial instruments
The loss on financial instruments of US$100 million in 2021 compared to a gain of US$24 million in 2022.
The gain on financial instrument of US$24 million in 2022 comprised:
| | | |
| | |
Figures in millions unless otherwise stated | Unrealised (losses)/gains and prior year mark-to- market reversals | | |
| | | |
| | | |
| | | |
Salares Norte foreign currency hedge | | | |
| | | |
The loss on financial instrument of US$100 million in 2021 comprised:
| | | |
| | |
Figures in millions unless otherwise stated | Unrealised (losses)/gains and prior year mark-to- market reversals | | |
| | | |
| | | |
| | | |
Salares Norte foreign currency hedge | | | |
| | | |
| | | |
Maverix warrants – loss on fair value | | | |
| | | |
Ghana oil hedge
In May 2017 and June 2017, the Ghanaian operations entered into fixed price ICE Gasoil cash-settled swap transaction for
a total of 125.8 million litres of diesel for the period June 2017 to December 2019. The average swap price is US$457.2 per
metric tonne (equivalent US$61.4 per barrel). At the time of the transactions, the average Brent swap equivalent over the
tenure was US$49.8 per barrel.
In June 2019, fixed price ICE Gasoil cash-settled swap transactions were entered into for a total of 123.2 million litres of
diesel for the period January 2020 to December 2022 based on 50% of usage over the specified period. The average
swap price is US$575 per metric tonne (equivalent to US$75.8 per barrel). At the time of the transactions, the average
Brent swap equivalent over the tenor was US$59.2 per barrel.
At 31 December 2022, the mark-to-market value on the hedge was US$nil (2021: positive US$3 million) as the hedge
matured, with a realised gain of US$17 million (2021: US$nil) and an unrealised loss and prior year mark-to-market reversals
of US$3 million (2021: gain of US$13 million).
Australia oil hedge
In May 2017 and June 2017, the Australian operations entered into fixed price Singapore 10ppm Gasoil cash-settled swap
transactions for a total of 77.5 million litres of diesel for the period June 2017 to December 2019. The average swap price
is US$61.2 per barrel. At the time of the transactions, the average Brent swap equivalent over the tenure was US$49.9 per
barrel.
In June 2019, fixed price Singapore 10ppm Gasoil cash-settled swap transactions were entered into for a total of 75.0 million
litres of diesel for the period January 2020 to December 2022 based on 50% of usage over the specified period. The
average swap price is US$74.0 per barrel. At the time of the transactions, the average Brent swap equivalent over the tenor
was US$57.4 per barrel.
At 31 December 2022, the mark-to-market value on the hedge was A$nil (US$nil) (2021: positive A$3 million (US$2 million))
as the hedge matured, with a realised gain of A$15 million (US$10 million) (2021: A$1 million (US$1 million)) and an unrealised
loss and prior year mark-to-market reversals of A$3 million (US$2 million) (2021: gain of A$9 million (US$7 million)) for the
year ended 31 December 2022.
Salares Norte
In March 2020, a total notional amount of US$544.5 million was hedged at a rate of CLP/US$836.45 for the period July 2020
to December 2022.
At 31 December 2022, the mark-to-market value on the hedge was US$nil (2021: negative US$7 million) as the hedge
matured, with a realised loss of US$5 million (2021: gain of US$33 million) and an unrealised gain and prior year mark-to-
market reversals of US$7 million (2021: loss of US$93 million) for the year ended 31 December 2022. For the period July 2020
to December 2022, the hedge realised a gain of US$33 million.
Foreign exchange gain/(loss)
The foreign exchange loss of US$2 million in 2021 compared with a gain of US$7 million in 2022.
These gains or losses on foreign exchange related to the conversion of offshore cash holdings into their functional
currencies. The exchange gain of US$7m in 2022 is mainly due to the weakening of the South African Rand, Australian
Dollar, Chilean Peso, Peruvian Soles and Ghanaian Cedi against the US Dollar. The exchange loss of US$2m in 2021 is
mainly due to the strengthening of the Peruvian Soles and Chilean Peso, partially offset by the weakening of the
Ghanaian Cedi.
Other costs, net
Other costs, net decreased by 69% from US$49 million in 2021 to US$15 million in 2022.
The costs in 2022 are mainly made up of:
•Social contributions of US$19 million; and
•Offshore structure costs of US$15 million.
The above were partially offset by the following:
•Rehabilitation income of US$9 million as a result of changes in estimates relating to the provision for environmental
rehabilitation costs recognised in profit or loss.
The costs in 2021 are mainly made up of:
•Social contributions of US$18 million;
•Offshore structure costs of US$15 million;
•Donations of US$1 million made to various bodies in response to Covid-19; and
•Rehabilitation expense of US$11 million as a result of changes in estimates relating to the provision for environmental
rehabilitation costs recognised in profit or loss.
Share-based payments
Gold Fields recognises the cost of share options granted (share-based payments) in terms of IFRS 2 Share-based Payment.
The Group grants share options and restricted shares to Executive Committee members (including regional Executive
Committee members) under the Gold Fields Limited 2012 share plan amended. Gold Fields has adopted appropriate
valuation models (Black-Scholes simulation) to fair value share-based payments. The value of the equity-settled instruments
is determined at the grant date of the options and depending on the rules of the plan expensed on a straight-line basis over
a three-year vesting period, adjusted for forfeitures as appropriate.
Only Executive Committee members (including regional Executive Committee members) receive awards under the Gold
Fields Limited 2012 share plan amended, while senior and middle management receive awards under the revised long-term
incentive plan (“LTIP”).
Share-based payments decreased by 46% from US$13 million in 2021 to US$7 million in 2022 mainly due to lower forecast
vesting percentages of the scheme and lower allocations made in 2022. The corresponding entry for the share-based
payment expense was the share-based payment reserve within shareholders’ equity.
Management’s discussion and analysis of the financial statements continued
Long-term incentive plan expense
Gold Fields recognises the long-term incentive plan expense in terms of IAS 19 Employee Benefits.
On 1 March 2014, the Remuneration Committee approved the Gold Fields Limited long-term incentive plan (“LTIP”). The plan
provided for Executive Directors, certain officers and employees to receive a cash award, conditional on the achievement
of specified performance conditions relating to total shareholder return and free cash flow margin. The conditions were
assessed over the performance cycle which runs over three calendar years. The expected timing of the cash outflows in
respect of each grant was at the end of three years after the original award was made. The last award under this plan was
made in 2015.
Executive Committee members (including regional Executive Committee members) receive awards under the Gold Fields
Limited 2012 share plan amended, while senior and middle management receive awards under the revised LTIP. The
performance conditions of the revised LTIP are approved annually by the Remuneration Committee. The expected timing
of the cash outflows in respect of each grant is at the end of three years after the original award was made.
The LTIP expense remained flat at US$29 million.
Exploration expense
The exploration expense increased by 33% from US$61 million in 2021 to US$81 million in 2022.
| | |
| |
Figures in millions unless otherwise stated | | |
| | |
| | |
| | |
| | |
| | |
| | |
Total exploration expense | | |
Share of results of equity-accounted investees, net of taxation
The share of results of equity-accounted investees, net of taxation remained flat at a loss of US$3 million.
| | |
| |
Figures in millions unless otherwise stated | | |
| | |
Far South East Resources Incorporated (“FSE”) | | |
Asanko Gold Inc (“Asanko”) | | |
Asanko – profit before impairment | | |
| | |
Lunnon Metals Limited (“Lunnon”) | | |
Total share of result of equity-accounted investees, net of taxation | | |
Asanko Gold – recognised as a discontinued operation | | |
Share of result of equity-accounted investees, net of taxation – continuing operations | | |
Continuing operations
FSE’s share of loss of equity-accounted investees, net of taxation decreased by 50% from US$2 million in 2021 to
US$1 million in 2022.
Lunnon's share of losses of equity-accounted investees increased by 100% from US$1 million in 2021 to US$2 million in
2022. During 2022, Gold Fields acquired an additional 2.31 % and holds 33.96 % (2021: 31.65%) at 31 December 2022.
Discontinued operation
Asanko’s share of results of equity-accounted investees, net of taxation was a loss of US$29 million in 2021 compared to
a profit of US$13 million in 2022. The loss of US$29 million in 2021 comprised earnings of US$24 million, offset by an
impairment of US$53 million. The profit of US$13 million in 2022 comprises earnings only. The decrease in Asanko’s
earnings is mainly due to lower profitability in 2022 as a result of the temporary cessation of mining activities in 2022 and
processing mainly stockpiles. The impairment of Asanko in 2021 related to an impairment of US$53m of the Asanko gold
mine following the identification of an impairment trigger. Due to the re-evaluation of the geological modelling by our JV
partner, Galiano, which was not complete in 31 December 2021, Gold Fields was not in a position to provide a reserve and
resource estimate for Asanko as at 31 December 2021. Taking this into consideration, management modelled various
scenarios for the Asanko Life of Mine (LoM) in order to determine their best estimates of the future cash flows of the Asanko
gold mine. The various LoM scenario runs were undertaken in an attempt to model Asanko’s future cash flows in the
absence of a revised Resource and Reserve for 31 December 2021. These scenarios were based on the pre-feasibility study
completed in 2019, in order to declare a Reserve at 31 December 2019, but were modified where appropriate to reflect
prevailing circumstances. During 2022, there were no changes in status with respect to the completion of the technical and
economic work required to generate a Reserve and Resources estimate based on a LoM. Taking this into consideration,
management utilised the LoM developed for the 2022 impairment calculations and this resulted in no impairment for the
year ended 31 December 2022.
Yamana break fee
US$300 million income in 2022 related to the Yamana break fee. As a result of Yamana entering into an arrangement
agreement with Pan American Silver Corp and Agnico Eagle Mines Limited, Gold Fields terminated the agreement in respect
of the proposed acquisition of Yamana. In accordance, within the terms of the arrangement agreement, Yamana was
required to pay Gold Fields a termination fee of US$300 million.
Yamana transaction costs
The transaction costs of US$33 million related mainly to amounts paid to advisors, bankers, lawyers and accountants in
connection with the proposed acquisition of Yamana.
Restructuring costs
Restructuring costs increased by 1,000% from US$1 million in 2021 to US$11 million in 2022. The cost in 2022 relates to the
separation packages at Tarkwa and Damang and the cost in 2021 relates mainly to the separation packages at Tarkwa.
Silicosis settlement costs
Silicosis settlement credits increased by 100% from US$1 million in 2021 to US$2 million in 2022.
A consolidated application was brought against several South African mining companies, including Gold Fields, for
certification of a class action on behalf of current or former mineworkers (and their dependants) who have allegedly
contracted silicosis and/or tuberculosis while working for one or more of the mining companies listed in the application
(refer to notes 25.2 and 35 of the consolidated financial statements for further details).
During 2022, reversal of costs of US$2 million, related to a change in the expected timing of the cash flows and an increase
in the discount rate.
During 2021, reversal of costs of US$1 million, related to a change in the expected timing of the cash flows and an increase
in the discount rate.
Impairment of investments and assets
Impairment of investments and assets increased by 1,102% from US$42 million in 2021 to US$505 million in 2022.
| | |
| |
Figures in millions unless otherwise stated | | |
| | |
| | |
| | |
Peru cash-generating unit | | |
Tarkwa cash-generating unit | | |
Capitalised exploration costs at St Ives | | |
| | |
| | |
Management’s discussion and analysis of the financial statements continued
The impairment of US$505 million in 2022 comprised of:
•US$2 million impairment of redundant assets at Peru;
•US$63 million impairment of Peru cash-generating unit. The recoverable amount was based on its fair value lest cost of
disposal (“FVLCOD”) calculated using a combination of the market (resource value) and the income approach (level 3 of
the fair value hierarchy). The impairment is mainly due to the increase in the discount rate from 4.8% to 8.1% as a result of
increases in the risk free rate as well as inflationary cost pressures experienced in 2022. The recoverable amount at
31 December 2022 is US$477million using the following assumptions based on the 2022 life-of-mine plan:
–Gold price:
• 2023 – US$1,740 per ounce;
• 2024 – US$1,730 per ounce;
• 2025 – US$1,700 per ounce;
• 2026 – US$1,650 per ounce; and
• Long-term – US$1,620 per ounce.
–Copper price:
• 2023 – US$7,700 per tonne;
• 2024 – US$8,150 per tonne;
• 2025 – US$8,150 per tonne;
• 2026 – US$8,150 per tonne; and
• Long-term – US$7,700 per ounce.
–Resource price of US$30 per ounce;
–Resource ounces of 1.0 million ounces;
–Life-of-mine: 8 years; and
–Discount rate of 8.1%.
•US$325 million impairment of Tarkwa cash-generating unit. The recoverable amount was based on its fair value lest cost
of disposal (“FVLCOD”) calculated using a combination of the market (resource value) and the income approach (level 3
of the fair value hierarchy). The impairment is mainly due to the increase in the discount rate from 8.3% to 15.9% as a result
of increases in the Ghana country risk premium and the risk free rate as well as inflationary cost pressures experienced in
2022. The recoverable amount at 31 December 2022 is US$812 million using the following assumptions based on the
2022 life-of-mine plan:
–Gold price:
• 2023 – US$1,740 per ounce;
• 2024 – US$1,730 per ounce;
• 2025 – US$1,700 per ounce;
• 2026 – US$1,650 per ounce; and
• Long-term – US$1,620 per ounce.
–Resource price of US$71 per ounce;
–Resource ounces of 24.5 million ounces;
–Life-of-mine: 13 years; and
–Discount rate of 15.9%.
•Impairment of FSE of US$114 million. Management has actively been engaged in the process of disposing of FSE in 2022.
The disposal process proved unsuccessful and no offers were received. Management’s assessment is that it is unlikely
the investment could be sold for any value and wrote off the investment by US$114 million to a carrying value of US$nil.
The impairment of US$42 million in 2021 comprised of:
•US$2 million impairment of redundant assets at Peru;
•US$10 million impairment of capitalised exploration costs at St Ives based on technical and economic parameters of
various studies; and
•Impairment of FSE of US$31 million based on the fair value less cost of disposal of the investment which was indirectly
derived from the market value of Lepanto Consolidated Mining Company.
Ghana expected credit loss
Ghana expected credit loss (“ECL”) decreased by 56% from US$41 million in 2021 to US$18 million in 2022.
The ECL of US$18 million in 2022 comprises US$4 million raised against a contractor loan receivable and US$14 million
raised against a Tarkwa receivable at 31 December 2022. Due to issues with fleet availability at both Tarkwa and Damang,
an agreement was entered into between Gold Fields and Engineers and Planners (“E&P”) to provide financial assistance
to E&P in order to procure new fleet in 2020. The initial contractor loan receivable amounted to US$68 million and at
31 December 2022 a cumulative impairment of US$45 million (2022: US$4 million and 2021: US$41 million) was raised,
resulting in a net balance of US$23 million.
Profit on disposal of assets
Profit on disposal of assets increased by 11% from US$9 million in 2021 to US$10 million in 2022. The profits in 2021 and
2022 related mainly to the sale of redundant assets at South Deep and Australia.
Royalties
Royalties decreased by 2% from US$112 million in 2021 to US$110 million in 2022 and are made up as follows:
| | |
| |
Figures in millions unless otherwise stated | | |
| | |
| | |
| | |
| | |
| | |
| | |
The royalty in South Africa remained flat at US$3 million mainly due to the weakening of the South African Rand to the
US Dollar. In South African Rand, the royalty increased by 23% from R39 million in 2021 to R48 million in 2022 in line with
the increase in revenue.
The royalty in Ghana remained flat at US$55 million.
The royalty in Peru decreased by 25% from US$8 million in 2021 to US$6 million in 2022 due to a decrease in operating
profit margin in 2022.
The royalty in Australia remained similar at US$46 million in 2022 mainly due to the weakening of the Australian Dollar to
the US Dollar. In Australian Dollar, the royalty increased by 11% from A$61 million in 2021 to A$68 million in 2022 in line with
the increase in revenue.
Mining and income tax
The mining and income tax charge increased by 4% from US$425 million in 2021 to US$442 million in 2022.
The table below indicates Gold Fields’ effective tax rate in 2022 and 2021:
| | |
| |
Figures in millions unless otherwise stated | | |
| | |
Income and mining tax credit/(charge) (US$ million) | | |
| | |
In 2022, the effective tax rate of 38.0% was higher than the maximum South African mining statutory tax rate of 34% mainly
due to the tax effect of the following:
•US$66 million adjustment to reflect the actual realised company tax rates in South Africa and offshore;
•US$3 million of non-deductible share of results of equity-accounted investees, net of taxation;
•US$18 million exclusion from capital gains tax of Yamana break fee and transaction costs;
•US$4 million deferred tax movement on Peruvian Nuevo Sol devaluation against US Dollar; and
•US$1 million deferred tax assets utilised at Tarkwa and Damang.
The above were offset by the following tax effected charges:
•US$2 million non-deductible share-based payments;
•US$39 million not recognised on FSE impairment;
•US$22 million non-deductible interest paid;
•US$21 million dividend withholding tax;
•US$18 million of net non-deductible expenditure and non-taxable income;
•US$5 million of various Peruvian non-deductible expenses;
•US$14 million deferred tax assets not recognised at Cerro Corona;
•USS$3 million prior year adjustments; and
•US$6 million deferred tax charge on change of tax rate at South Deep.
Management’s discussion and analysis of the financial statements continued
In 2021, the effective tax rate of 33.9% was lower than the maximum South African mining statutory tax rate of 34% mainly
due to the tax effect of the following:
•US$46 million adjustment to reflect the actual realised company tax rates in South Africa and offshore;
•US$16 million deferred tax on unremitted earnings at Tarkwa and Cerro Corona; and
•US$97 million deferred tax assets recognised at Salares Norte.
The above were offset by the following tax effected charges:
•US$4 million non-deductible share-based payments;
•US$10 million non-deductible exploration expense;
•US$11 million not recognised on FSE impairment;
•US$22 million non-deductible interest paid;
•US$11 million of non-taxable share of results of equity-accounted investees, net of taxation;
•US$1 million non-deductible fair value loss on Maverix warrants;
•US$30 million dividend withholding tax;
•US$27 million of net non-deductible expenditure and non-taxable income;
•US$9 million deferred tax movement on Peruvian Nuevo Sol devaluation against US Dollar;
•US$8 million of various Peruvian non-deductible expenses;
•US$12 million deferred tax assets not recognised at Cerro Corona;
•US$7 million deferred tax assets not recognised at Tarkwa and Damang; and
•USS$6 million prior year adjustments.
Profit from continuing operations
As a result of the factors discussed above, the profit decreased by 17% from US$859 million in 2021 to US$709 million
in 2022.
Profit/(loss) from discontinued operation
Loss for the year from discontinued operation of US$29 million in 2021 compared to a profit of US$13 million in 2022. The
profit of US$13 million in 2022 comprises the share of profits realised during the year. The loss of US$29 million in 2021
comprises an impairment of the equity investment in Asanko of US$53 million, partially offset by share of profits realised
during the year of US$24 million.
Profit attributable to owners of the parent from continuing operations
Profit attributable to owners of the parent from continuing operations decreased by 15% from US$819 million in 2021 to
US$698 million in 2022.
Profit attributable to non-controlling interests
Profit attributable to non-controlling interests decreased by 73% from US$40 million in 2021 to US$11 million in 2022.
The non-controlling interest consists of Gold Fields Ghana Limited (Tarkwa) and Abosso Goldfields Limited (Damang) at 10%
each at the end of 2022 and 2021, Gold Fields La Cima S.A. (Cerro Corona) at 0.47% at the end of 2022 and 2021 and
Newshelf 899 (Proprietary) Limited (South Deep) at 3.57% at the end of 2022 and 2021.
The amount making up the non-controlling interest is shown below:
| | | | |
| | | | |
| Non-controlling interest Effective* | Non-controlling interest Effective* | | |
| | | | |
Gold Fields Ghana – Tarkwa | | | | |
Abosso Goldfields – Damang | | | | |
Gold Fields La Cima – Cerro Corona | | | | |
Newshelf 899 – South Deep | | | | |
| | | | |
*Average for the year.
Basic earnings per share
As a result of the above, Gold Fields earnings decreased by 10% from US$0.89 per share in 2021 to US$0.80 per share
in 2022.
Basic earnings per share from continuing operations
As a result of the above, Gold Fields earnings per share from continuing operations decreased by 14% from US$0.92 per
share in 2021 to US$0.79 per share in 2022.
Basic earnings per share from discontinued operation
As a result of the above, Gold Fields earnings per share from discontinued operation was a loss of US$0.03 per share in
2021 compared to an earnings of US$0.01 per share in 2022.
Normalised profit attributable to owners of the parent
Normalised profit attributable to owners of the parent is considered an important measure by Gold Fields of the profit
realised by the Group in the ordinary course of operations. In addition, it forms the basis of the dividend pay-out policy.
Normalised profit is defined as profit excluding gains and losses on foreign exchange, financial instruments and non-
recurring items after taxation and non-controlling interest effect.
Normalised profit attributable to owners of the parent from continuing operations decreased by 7% from US$906 million or
US$1.02 per share in 2021 to US$847 million or US$0.96 per share in 2022.
Normalised profit attributable to owners of the parent from discontinued operations decreased by 43% from US$23 million
or US$0.03 per share in 2021 to US$13 million or US$0.01 per share in 2022.
Normalised profit attributable to owners of the parent from continuing operations reconciliation for the Group is calculated
as follows:
| | |
| |
Figures in millions unless otherwise stated | | |
| | |
Profit for the year attributable to owners of the parent from continuing operations | | |
Adjusted for the following: | | |
| | |
Tax effect of non-recurring items* | | |
Non-controlling interest effect of non-recurring items* | | |
(Gain)/loss on foreign exchange | | |
Tax effect on foreign exchange* | | |
Non-controlling interest effect of gain on foreign exchange* | | |
(Gain)/loss on financial instruments | | |
Tax effect on financial instruments* | | |
Non-controlling interest effect of loss on financial instruments* | | |
South Deep deferred tax change* | | |
Salares Norte deferred tax asset raised | | |
Normalised profit attributable to owners of the parent from continuing operations | | |
1Non-recurring items are considered unusual and not expected during regular business operations and comprise the following:
| | |
| |
Figures in millions unless otherwise stated | | |
| | |
Profit on the sale of assets | | |
| | |
| | |
| | |
| | |
Rehabilitation adjustments | | |
Ghana expected credit losses | | |
Other non-recurring items* | | |
Total non-recurring items | | |
•Based on information underlying the audited consolidated annual financial statements of Gold Fields Limited for the year ended 31 December 2022.
Management’s discussion and analysis of the financial statements continued
Normalised profit attributable to owners of the parent from discontinued operation reconciliation for the Group is calculated
as follows:
| | |
| |
Figures in millions unless otherwise stated | | |
| | |
Profit/(loss) for the year attributable to owners of the parent from discontinued operation | | |
Adjusted for the following: | | |
Impairment of Asanko Gold | | |
Normalised profit attributable to owners of the parent from discontinued operation | | |
Liquidity and capital resources – years ended 31 December 2023 and 31 December 2022
Cash flows from operating activities
Cash inflows from operating activities decreased by 13% from US$1,379 million in 2022 to US$1,193 million in 2023. The
items comprising these are discussed below.
The decrease in inflow of US$186 million was due to:
| |
Figures in millions unless otherwise stated | |
| |
Decrease in cash generated by operations mainly due to the Yamana break fee, net of costs of US$267 million received in 2022 | |
Increase in interest received | |
Increase in investment in working capital mainly due to higher trade and other receivables | |
Increase in interest paid due to higher borrowings | |
Increase in royalties paid | |
| |
Increase in dividends paid due to higher normalised earnings, partially offset by lower dividends paid to non-controlling interest | |
| |
1The higher taxation payment in 2022 included withholding tax of US$75 million on the Yamana break fee, US$65 million tax paid to the South African
Revenue Service on the Yamana break fee, as well as US$23m additional tax payment to the Ghana Revenue Authority related to transfer pricing.
Dividends paid increased by 14% from US$336 million in 2022 to US$383 million in 2023. The dividends paid of
US$383 million in 2023 comprised dividends paid to ordinary shareholders of US$369 million, dividends paid to
non-controlling interests in Ghana of US$13 million and South Deep BEE dividend of US$1 million.
The dividends paid of US$336 million in 2022 comprised dividends paid to ordinary shareholders of US$304 million,
dividends paid to non-controlling interests in Ghana of US$30 million and South Deep BEE dividend of US$1 million.
Cash flows from investing activities
Cash outflows from investing activities increased by 28% from US$1,072 million in 2022 to US$1,370 million in 2023.
The increase in outflow of US$298 million was due to:
| |
Figures in millions unless otherwise stated | |
| |
Decrease in additions to property, plant and equipment | |
Increase in capital expenditure – working capital | |
Increase in purchase of investments | |
Purchase of equity-accounted investee – Windfall Project | |
Windfall Project capital contributions | |
Increase in proceeds on disposal of investments | |
| |
Additions to property, plant and equipment
Capital expenditure decreased by 1% from US$1,069 million in 2022 to US$1,055 million in 2023.
| | | | | | |
| |
| | |
Figures in million unless otherwise stated | | | | | | |
| | | | | | |
| | | | | | |
| | | | | | |
| | | | | | |
| | | | | | |
| | | | | | |
| | | | | | |
| | | | | | |
| | | | | | |
| | | | | | |
| | | | | | |
| | | | | | |
| | | | | | |
| | | | | | |
| | | | | | |
| | | | | | |
| | | | | | |
Continuing and discontinued operation | | | | | | |
1Equity-accounted joint venture. Asanko has been presented as a discontinued operation and an asset held for sale, refer notes 14 and 15 of the AFR for
further details. Asanko capital expenditure not included in the Group capital expenditure per the cash flow statement.
Continuing operations
Capital expenditure at South Deep in South Africa decreased by 12% from R1.9 billion (US$119 million) in 2022 to R1.7 billion
(US$93 million) in 2023. The capital expenditure of R1.7 billion (US$93 million) in 2023 comprised only R1.7 billion
(US$93 million) sustaining capital. The capital expenditure of R1.9 billion (US$119 million) in 2022 comprised R1.6 billion
(US$98 million) sustaining capital and R334 million (US$21 million) growth capital. The increase in sustaining capital was
mainly due to the inclusion of capital development and infrastructure expenditure (reported as non-sustaining capital in
2022), fleet replacement and the upgrade of the South Shaft return water dam which commenced in 2023. These increases
were partially offset by lower capital expenditure on the solar plant in 2023 and the completion of phase 2 of the
Doornpoort tailings facility in 2022. New mine development is now part of normal development, resulting in no growth
capital expenditure during 2023.
Capital expenditure at the Ghanaian region decreased by 24% from US$289 million in 2022 to US$221 million in 2023:
•Tarkwa decreased by 6% from US$229 million in 2022 to US$216 million in 2023 mainly due a decreased waste stripping
cost driven by the 13% reduction in capital waste tonnes mined. All capital related to sustaining capital; and
•Damang decreased by 92% from US$60 million in 2022 to US$5 million in 2023. The capital expenditure of US$5 million
in 2023 comprised US$5 million sustaining capital only. The capital expenditure of US$60 million in 2022 comprised
US$50 million sustaining capital and US$10 million growth capital. The decrease in sustaining capital was mainly due to
no capital waste tonnes mined in 2023.
Management’s discussion and analysis of the financial statements continued
Capital expenditure at the South American region increased by 29% from US$342 million in 2022 to US$442 million in 2023:
•Capital expenditure at Cerro Corona in Peru decreased by 3% from US$46 million in 2022 to US$44 million in 2023. The
capital expenditure of US$44 million in 2023 comprised US$31 million sustaining capital expenditure and US$13 million
non-sustaining capital. The capital expenditure of US$46 million in 2022 comprised US$31 million sustaining capital
expenditure and US$15 million non-sustaining capital. This decrease in non-sustaining capital was mainly due to lower
construction activities during 2023. Construction activities related mainly to the Ana waste storage facility and mine pond
collection infrastructure relocation, which are in line with the life of mine plan; and
•At Salares Norte, capital expenditure increased by 34% from US$296 million in 2022 to US$398 million in 2023. The
capital expenditure of US$398 million in 2023 comprised US$118 million sustaining capital expenditure and
US$280 million non-sustaining capital. The capital expenditure of US$296 million in 2022 comprised US$10 million
sustaining capital expenditure and US$286 million non-sustaining capital. The increase in sustaining capital mainly related
to the capital waste tonnes mined and other ramp-up capital. The capital waste tonnes mined in 2022 related to pre-
stripping activities and were included in the project capital cost and were part of non-sustaining capital.
Capital expenditure at the Australian region decreased by 3% from A$457 million (US$317 million) in 2022 to A$445 million
(US$296 million) in 2023:
•St Ives increased by 1% from A$146 million (US$101 million) in 2022 to A$147 million (US$97 million) in 2023. The capital
expenditure of A$147 million (US$97 million in 2023 comprised A$109 million (US$72 million) sustaining capital
expenditure and A$38 million (US$25 million) growth capital. The capital expenditure of A$146 million (US$101 million) in
2022 comprised A$126 million (US$87 million) sustaining capital expenditure and A$19 million (US$13 million) growth
capital. The decrease in sustaining capital expenditure reflected the pre-stripping at Neptune stage 7 during 2022,
partially offset by increased expenditure on ventilation infrastructure and equipment. The increase in growth capital was
due to increased development at Invincible Deeps mine in 2023;
•Agnew decreased by 4% from A$123 million (US$85 million) in 2022 to A$106 million (US$71 million) in 2023. The capital
expenditure of A$106 million (US$71 million)in 2023 comprised A$82 million (US$55 million) sustaining capital expenditure
and A$24 million (US$16 million) growth capital. The capital expenditure of A$123 million (US$85 million) in 2022
comprised A$79 million (US$54 million) sustaining capital expenditure and A$44 million (US$31 million) growth capital.
The increase in sustaining capital expenditure was mainly due increased capital development at the underground mines.
The decrease in growth capital expenditure was mainly due to a crushing circuit replacement in 2022;
•Granny Smith decreased by 19% from A$141 million (US$98 million) in 2022 to A$115 million (US$76 million) in 2023.
The capital expenditure of A$115 million (US$76 million) in 2023 comprised A$71 million (US$47 million) sustaining capital
expenditure and A$44 million (US$29 million) growth capital. The capital expenditure of A$141 million (US$98 million) in
2022 comprised A$88 million (US$61 million) sustaining capital expenditure and A$53 million (US$37 million) growth
capital. The decrease in sustaining capital expenditure was due to lower capital development in 2023. The decrease in
growth capital expenditure was due the completion of the second decline in 2022; and
•Capital expenditure at Gruyere increased by 64% from A$48 million (US$33 million) in 2022 to A$78 million
(US$52 million) in 2023 due to pre-stripping of stages 4 and 5 of the Gruyere pit and the installation of a new pebble
crusher of A$15 million (US$10 million). The capital expenditure comprised only sustaining capital.
Discontinued operation
Asanko was an equity accounted investee and Asanko's capital expenditure was not included in the Gold Fields capital
expenditure as per the cash flow statement. Asanko capital expenditure (on a 45% basis) increased by 220% from
US$8 million in 2022 to US$25 million in 2023. The capital expenditure of US$25 million in 2023 comprised US$19 million
sustaining capital expenditure and US$6 million growth capital. The capital expenditure of US$8 million in 2022 comprised
US$5 million sustaining capital expenditure and US$3 million growth capital. Sustaining capital expenditure increased due
to expenditure on TSF Stage 7 construction, Abore pre-stripping (3.5Mt) and water treatment plant. Non-sustaining capital
expenditure increased due to higher exploration and Abore development expenditure in 2023.
Proceeds on disposal of property, plant and equipment
Proceeds on the disposal of property, plant and equipment remained flat at US$2 million. In both 2022 and 2023, the
proceeds related mainly to the disposal of various redundant assets at the mines.
Purchase of investments
Investment purchases increased by 41% from US$22 million in 2022 to US$31 million in 2023.
Purchase of investments of US$31 million in 2023 comprised:
| |
Figures in millions unless otherwise stated | |
| |
Hamelin Gold – 12.5 million shares | |
Great Southern Mining Resources – 38.5 million shares | |
| |
| |
Purchase of investments of US$22 million in 2022 comprised:
| |
Figures in millions unless otherwise stated | |
| |
Torq Resources Inc. – 15.0 million shares | |
Tesoro Gold Limited – 163.2 million shares | |
Chakana Copper Corporation – 8.1 million shares | |
| |
| |
Purchase of equity-accounted investee – Windfall Project
During 2023, Gold Fields entered into a partnership agreement with Osisko Mining Incorporated to develop and mine the
world class underground Windfall Project in Québec, Canada. The purchase of equity-accounted investee in 2023
amounted to US$247 million in total. Under the agreement, Gold Fields was required to contribute US$221 million
(C$300 million) for its 50% stake in the joint venture. This payment was made in May 2023. Two further payments of
US$13 million each (C$17 million each) were made in July 2023 and December 2023 in respect of a pre-closing liability.
Windfall Project capital contributions
During 2023, Gold Fields contributed US$69 million (C$93 million) to the Windfall joint venture in terms of its obligation
under the JV agreement.
Proceeds on disposal of investments
Proceeds on the disposal of investments increased by 150% from US$2 million in 2023 to US$5 million in 2023 and related
to the sale of bonds by the insurance cell captive.
Contributions to environmental trust funds
The contributions to environmental trust fund remained flat at US$11 million.
The contributions to environmental trust funds of US$11 million in 2023 comprised:
| |
Figures in millions unless otherwise stated | |
| |
South Deep mine environmental trust fund | |
Tarkwa mine environmental trust fund | |
Damang mine environmental trust fund | |
| |
The contributions to environmental trust funds of US$11 million in 2022 comprised:
| |
Figures in millions unless otherwise stated | |
| |
South Deep mine environmental trust fund | |
Tarkwa mine environmental trust fund | |
Damang mine environmental trust fund | |
| |
Management’s discussion and analysis of the financial statements continued
Cash flows from financing activities
Cash outflows from financing activities of US$57 million in 2022 to compared to an inflow of US$82 million in 2023. The
items comprising these numbers are discussed below.
The decrease in outflow of US$139 million was due to:
| |
Figures in millions unless otherwise stated | |
| |
| |
| |
Increase in payment of lease liability | |
| |
Loans raised
Loans raised increased by 289% or US$598 million from US$207 million in 2022 to US$805 million in 2023.
The US$805 million loans raised in 2023 comprised:
| |
Figures in millions unless otherwise stated | |
| |
A$500 million syndicated revolving credit facility – old1 | |
A$500 million syndicated revolving credit facility – new1 | |
US$1,200 million term loan and revolving credit facilities – old2 | |
US$1,200 million term loan and revolving credit facilities – new2 | |
| |
1On 26 September 2023, the old A$500 million syndicated revolving credit facility was refinanced with the new A$500 million syndicated revolving credit
facility and cancelled.
2On 25 May 2023, the old US$1,200 million revolving credit facilities were refinanced with the new US$1,200 million revolving credit facility and cancelled.
The US$207 million loans raised in 2022 comprised:
| |
Figures in millions unless otherwise stated | |
| |
A$500 million syndicated revolving credit facility | |
US$1,200 million term loan and revolving credit facilities | |
| |
Loans repaid
Loans repaid increased by 229% or US$453 million from US$198 million in 2022 to US$651 million in 2023.
The US$651 million loans repaid in 2023 comprised:
| |
Figures in millions unless otherwise stated | |
| |
A$500 million syndicated revolving credit facility – old | |
A$500 million syndicated revolving credit facility – new | |
US$1,200 million term loan and revolving credit facilities – old | |
| |
The US$198 million loans repaid in 2022 comprised:
| |
Figures in millions unless otherwise stated | |
| |
A$500 million syndicated revolving credit facility | |
US$1,200 million term loan and revolving credit facilities | |
| |
Payment of lease liabilities
Payment of lease liabilities increased by 9% from US$66 million in 2022 to US$72 million in 2023. The increase related
mainly to additional lease liabilities during 2023.
Net cash (utilised)/generated
As a result of the above, net cash generated of US$250 million in 2022 compared with net cash utilised of US$95 million
in 2023.
Cash and cash equivalents decreased by 16% from US$769 million at 31 December 2022 to US$649 million at
31 December 2023.
Adjusted free cash flow1
This is a measure that management uses to measure the cash generated by the core business. Adjusted free cash flow is
defined as net cash from operations adjusted for South Deep BEE dividend, additions to property, plant and equipment,
capital expenditure – working capital, proceeds on disposal of property, plant and equipment, environmental trust funds
payments, payment of principal lease liabilities and redemption of Asanko preference shares per the statement of
cash flows.
The cash inflow decreased by 15% from US$431 million in 2022 to US$367 million in 2023 due to higher spend at Salares
Norte and Windfall Project capital contribution, partially offset by higher adjusted free cash generated by the operations.
Below is a table reconciling the adjusted free cash flow to the statement of cash flows.
| | |
| |
Figures in millions unless otherwise stated | | |
| | |
| | |
| | |
Additions to property, plant and equipment | | |
Capital expenditure – working capital | | |
Proceeds on disposal of property, plant and equipment | | |
Contributions to environmental trust funds | | |
Payment of principal lease liabilities | | |
Windfall Project capital contributions | | |
Contributions for rehabilitation purposes at Peru and Australia* | | |
Yamana break fee, net of costs and taxation | | |
| | |
1For 2022, adjusted free cash flow excludes Yamana break fee and related costs and taxation.
•Based on information underlying the audited consolidated annual financial statements of Gold Fields Limited for the year ended 31 December 2023.
Management’s discussion and analysis of the financial statements continued
Below is a table providing a breakdown of how the cash was generated by the Group:
| | |
| |
Figures in millions unless otherwise stated | | |
| | |
Adjusted free cash flow from operations1,* | | |
| | |
| | |
| | |
| | |
| | |
| | |
| | |
| | |
| | |
| | |
Interest paid by corporate entities3,* | | |
Windfall Project capital contributions | | |
| | |
| | |
1Adjusted free cash flow from operations of US$1,002 million is arrived at as follows: net cash from operations of US$1,576 million plus Salares Norte US$438
million, interest paid by corporate entities of US$66 million and other corporate costs of US$62 million, less additions to property, plant and equipment of
US$1,055 million, payment of principal lease liabilities of US$72 million and other of US$13 million.
2The Salares Norte expenditure of US$438 million (2022: US$329 million) comprises exploration expenditure of US$29 million (2022: US$32 million), capital
expenditure of US$398 million (2022: US$296 million), release of working capital of US$2 million (2022: US$6 million) and other costs of US$13 million
(2022: US$7 million).
3Does not agree to interest paid per the cash flow of US$105 million (2022: US$97 million) due to interest paid by the mines reflected under net cash
generated by mines before growth capital.
*Based on information underlying the audited consolidated annual financial statements of Gold Fields Limited for the year ended 31 December 2023.
Liquidity and capital resources – years ended 31 December 2022 and 31 December 2021
Cash flows from operating activities
Cash inflows from operating activities increased by 12% from US$1,230 million in 2021 to US$1,379 million in 2022. The items
comprising these are discussed below.
The increase in inflow of US$149 million was due to:
| |
Figures in millions unless otherwise stated | |
| |
Increase in cash generated by operations mainly due to higher gold sold and the Yamana break fee, net of cash of US$267 million received in 2022 | |
Increase in interest received | |
Increase in investment in working capital | |
Decrease in silicosis payments | |
Decrease in interest paid due to lower borrowings | |
Increase in royalties paid due to higher gold sold | |
| |
Decrease in dividends paid due to lower normalised earnings and lower dividends paid to non- controlling interest | |
| |
1The higher taxation payment included withholding tax of US$75 million on the Yamana break fee which will be refunded in 2023, US$65 million tax paid to
the South African Revenue Service on the Yamana break fee, as well as US$23m additional tax payment to the Ghana Revenue Authority related to
transfer pricing.
Dividends paid decreased by 9% from US$370 million in 2021 to US$336 million in 2022. The dividends paid of
US$336 million in 2022 comprised dividends paid to ordinary shareholders of US$304 million, dividends paid to non-
controlling interests in Ghana of US$30 million and South Deep BEE dividend of US$1 million.
The dividends paid of US$370 million in 2021 comprised dividends paid to ordinary shareholders of US$322 million,
dividends paid to non-controlling interests in Ghana of US$47 million and South Deep BEE dividend of US$1 million.
Cash flows from investing activities
Cash outflows from investing activities increased marginally from US$1,071 million in 2021 to US$1,072 million in 2022.
The increase in outflow of US$1 million was due to:
| |
Figures in millions unless otherwise stated | |
| |
Decrease in additions to property, plant and equipment | |
Increase in capital expenditure – working capital | |
Decrease in proceeds on disposal of property, plant and equipment | |
Decrease in purchase of investments | |
Decrease in redemption of Asanko preference shares | |
Decrease in proceeds on disposal of investments | |
Increase in environmental trust funds contributions | |
| |
Additions to property, plant and equipment
Capital expenditure decreased by 2% from US$1,089 million in 2021 to US$1,069 million in 2022.
| | | | | | |
| |
| | |
Figures in million unless otherwise stated | | | | | | |
| | | | | | |
| | | | | | |
| | | | | | |
| | | | | | |
| | | | | | |
Ghanaian region (excluding Asanko) | | | | | | |
| | | | | | |
| | | | | | |
| | | | | | |
| | | | | | |
| | | | | | |
| | | | | | |
| | | | | | |
| | | | | | |
| | | | | | |
| | | | | | |
| | | | | | |
Continuing and discontinued operations | | | | | | |
1Equity-accounted joint venture. Asanko has been presented as a discontinued operation and an asset held for sale, refer notes 14 and 15 of the AFR for
further details. Asanko capital expenditure not included in the Group capital expenditure per the cash flow statement.
Management’s discussion and analysis of the financial statements continued
Continuing operations
Capital expenditure at South Deep in South Africa increased by 47% from R1.3 billion (US$89 million) in 2021 to R1.9 billion
(US$119 million) in 2022. The capital expenditure of R1.9 billion (US$119 million) in 2022 comprised R1.6 billion (US$98 million)
sustaining capital and R334 million (US$21 million) growth capital. The capital expenditure of R1.3 billion (US$89 million) in
2021 comprised R1.0 billion (US$69 million) sustaining capital and R301 million (US$20 million) growth capital. The increase in
sustaining capital was mainly due to higher spent on construction of the solar plant of R420 million (R547 million in 2022 vs
R127 million in 2021) and Doornpoort Tailings Storage Facility extension R34 million (R123 million in 2022 vs. R89 million in
2021). This increase in growth capital was mainly due to increased development.
Capital expenditure at the Ghanaian region (excluding Asanko) increased by 25% from US$232 million in 2021 to
US$289 million in 2022:
•Tarkwa increased by 10% from US$209 million in 2021 to US$229 million in 2021 mainly due increased expenditure on
capital waste stripping cost. The increase in capital waste stripping cost is due to higher mining cost driven by higher fuel
price, explosives and contractor rise and fall cost. All capital related to sustaining capital; and
•Damang increased by 157% from US$23 million in 2021 to US$60 million in 2022. The capital expenditure of US$60 million
in 2022 comprised US$50 million sustaining capital and US$10 million growth capital. The capital expenditure of
US$23 million in 2021 comprised US$17 million sustaining capital and US$6 million growth capital. The increase in
sustaining capital was mainly due to the higher capital waste tonnes mined from Huni pit. The increase in non-sustaining
capital was due to Far East Tailings Storage Facility raise.
Capital expenditure at Cerro Corona in Peru decreased by 18% from US$56 million in 2021 to US$46 million in 2022. The
capital expenditure of US$46 million in 2022 comprised US$31 million sustaining capital expenditure and US$15 million non-
sustaining capital. The capital expenditure of US$56 million in 2021 comprised US$28 million sustaining capital expenditure
and US$28 million non-sustaining capital. The increase in sustaining capital was mainly due to the replacement of the two
crushers at the process plant (US$5m) in order to treat harder ore. This increase in non-sustaining capital was mainly due to
lower construction activities at Ana and Arpon waste storage facilities, and infrastructures relocation. During 2022, there
were only activities at Ana waste storage facility and minor infrastructure relocations, all the activities are in line with the life
of mine expansion plan.
At Salares Norte, capital expenditure decreased by 21% from US$375 million in 2021 to US$296 million in 2022 in line with
project progress. At 31 December 2022, total project progress was to 86.7% compared to 62.5% at 31 December 2021.
Capital expenditure at the Australian region increased by 2% from A$447 million (US$336 million) in 2021 to A$457 million
(US$317 million) in 2022:
•St Ives increased by 6% from A$138 million (US$104 million) in 2021 to A$145 million (US$101 million) in 2022. The capital
expenditure of A$145 million (US$101 million) in 2022 comprised A$126 million (US$88 million) sustaining capital
expenditure and A$19 million (US$13 million) growth capital. The capital expenditure of A$138 million (US$104 million) in
2021 comprised A$120 million (US$90 million) sustaining capital expenditure and A$18 million (US$14 million) growth
capital. The increase in sustaining capital expenditure reflected the increased pre-stripping at Neptune stage 7 open pit;
•Agnew increased by 5% from A$117 million (US$88 million) in 2021 to A$123 million (US$85 million) in 2022. The capital
expenditure of A$123 million (US$85 million) in 2022 comprised A$79 million (US$54 million) sustaining capital
expenditure and A$44 million (US$31 million) growth capital. The capital expenditure of A$117 million (US$88 million) in
2021 comprised A$75 million (US$56 million) sustaining capital expenditure and A$43 million (US$32 million) growth
capital. The increase in sustaining capital expenditure was mainly due to a 100-room expansion of the accommodation
village. The increase in growth capital expenditure was mainly due to a crushing circuit replacement included in 2022;
•Granny Smith increased by 6% from A$134 million (US$100 million) in 2021 to A$141 million (US$98 million) in 2022. The
capital expenditure of A$141 million (US$98 million) in 2022 comprised A$88 million (US$61 million) sustaining capital
expenditure and A$53 million (US$37 million) growth capital. The capital expenditure of A$134 million (US$100 million) in
2021 comprised A$86 million (US$64 million) sustaining capital expenditure and A$48 million (US$36 million) growth
capital. The increase in sustaining capital expenditure was due increased expenditure on a new tailings storage facility.
The increase in growth capital expenditure was due increased expenditure on development of the Z135 area; and
•Capital expenditure at Gruyere decreased by 18% from A$58 million (US$44 million) in 2021 to A$48 million (US$33 million)
in 2022. The capital expenditure of A$48 million (US$33 million) in 2022 comprised only sustaining capital. The capital
expenditure of A$58 million (US$44 million) in 2021 comprised A$56 million (US$42 million) sustaining capital and
A$2 million (US$2 million) growth capital. The decrease in sustaining capital reflected the completion of pre-stripping of
stages 2 and 3 of the pit.
Discontinued operation
Asanko is an equity accounted investee and Asanko's capital expenditure is not included in the Gold Fields capital
expenditure as per the cash flow statement. Asanko capital expenditure (on a 45% basis) decreased by 62% from
US$21 million in 2021 to US$8 million in 2022. The capital expenditure of US$8 million in 2022 comprised US$5 million
sustaining capital expenditure and US$3 million growth capital. The capital expenditure of US$21 million in 2021 comprised
US$13 million sustaining capital expenditure and US$8 million growth capital. Non-sustaining capital expenditure decreased
due to delaying the commencement of major capital projects in 2022.
Proceeds on disposal of property, plant and equipment
Proceeds on the disposal of property, plant and equipment decreased by 33% from US$3 million in 2021 to US$2 million
in 2022. In both 2022 and 2022, the proceeds related mainly to the disposal of various redundant assets at the mines.
Purchase of investments
Investment purchases decreased by 19% from US$27 million in 2021 to US$22 million in 2022.
Purchase of investments of US$22 million in 2022 comprised:
| |
Figures in millions unless otherwise stated | |
| |
Torq Resources Inc. – 15.0 million shares | |
Tesoro Gold Limited – 163.2 million shares | |
Chakana Copper Corporation – 8.1 million shares | |
| |
| |
Purchase of investments of US$27 million in 2021 comprised:
| |
Figures in millions unless otherwise stated | |
| |
Conversion of warrants to Maverix shares | |
Chakana Copper Corporation – 6.6 million shares | |
Hamelin Gold Limited – 11 million shares | |
| |
| |
Redemption of Asanko preference shares
Redemption of Asanko preference shares amounted to US$5 million in 2021.
Proceeds on disposal of investments
Proceeds on the disposal of investments decreased by 89% from US$19 million in 2021 to US$2 million in 2022.
The proceeds on disposal of investment of US$2 million in 2022 related to the sale of bonds by the insurance cell captive.
The proceeds on disposal of investment of US$19 million in 2021 related to the disposal of shares in the Toronto-listed gold
and royalty streaming company Maverix.
Contributions to environmental trust funds
The contributions to environmental trust fund increased by 10% from US$10 million in 2021 to US$11 million in 2022.
The contributions to environmental trust funds of US$11 million in 2022 comprised:
| |
Figures in millions unless otherwise stated | |
| |
South Deep mine environmental trust fund | |
Tarkwa mine environmental trust fund | |
Damang mine environmental trust fund | |
| |
Management’s discussion and analysis of the financial statements continued
The contributions to environmental trust funds of US$10 million in 2021 comprised:
| |
Figures in millions unless otherwise stated | |
| |
South Deep mine environmental trust fund | |
Tarkwa mine environmental trust fund | |
Damang mine environmental trust fund | |
| |
Cash flows from financing activities
Cash outflows from financing activities decreased by 89% from US$511 million in 2021 to US$57 million in 2022. The items
comprising these numbers are discussed below.
The decrease in outflow of US$454 million was due to:
| |
Figures in millions unless otherwise stated | |
| |
| |
| |
Decrease in payment of lease liability | |
| |
Loans raised
Loans raised decreased marginally from US$208 million in 2021 to US$207 million in 2022.
The US$207 million loans raised in 2022 comprised:
| |
Figures in millions unless otherwise stated | |
| |
A$500 million syndicated revolving credit facility | |
US$1,200 million term loan and revolving credit facilities | |
| |
The US$208 million loans raised in 2021 comprised:
| |
Figures in millions unless otherwise stated | |
| |
US$150 million revolving senior credit facility – new1 | |
US$1,200 million term loan and revolving credit facilities | |
| |
Loans repaid
Loans repaid decreased by 69% or US$446 million from US$644 million in 2021 to US$198 million in 2022.
The US$198 million loans repaid in 2022 comprised:
| |
Figures in millions unless otherwise stated | |
| |
A$500 million syndicated revolving credit facility | |
US$1,200 million term loan and revolving credit facilities | |
| |
The US$644 million loans repaid in 2021 comprised:
| |
Figures in millions unless otherwise stated | |
| |
US$150 million revolving senior credit facility – old1 | |
A$500 million syndicated revolving credit facility | |
US$1,200 million term loan and revolving credit facility | |
| |
Payment of lease liabilities
Payment of lease liabilities decreased by 11% from US$74 million in 2021 to US$66 million in 2022. The decrease related
mainly to lower lease liabilities during 2022.
Net cash generated/(utilised)
As a result of the above, net cash utilised of US$351 million in 2021 compared to net cash generated of US$250 million
in 2022.
Cash and cash equivalents increased by 46% from US$525 million at 31 December 2021 to US$769 million at 31 December
2022.
Cash flow from operating activities less net capital expenditure, environmental payments, lease payments and
redemption of Asanko preference shares (“adjusted free cash flow”)1
This is a measure that management uses to measure the cash generated by the core business. Adjusted free cash flow
is defined as net cash from operations adjusted for South Deep BEE dividend, additions to property, plant and equipment,
capital expenditure – working capital, proceeds on disposal of property, plant and equipment, environmental trust funds
payments, payment of principal lease liabilities and redemption of Asanko preference shares per the statement of
cash flows.
The cash inflow decreased by 7% from US$463 million in 2021 to US$431 million in 2022.
Below is a table reconciling the adjusted free cash flow to the statement of cash flows.
| | |
| |
Figures in millions unless otherwise stated | | |
| | |
| | |
| | |
Additions to property, plant and equipment | | |
Capital expenditure – working capital | | |
Proceeds on disposal of property, plant and equipment | | |
Contributions to environmental trust funds | | |
Payment of principal lease liabilities | | |
Redemption of Asanko preference shares | | |
Contributions for rehabilitation purposes at Peru and Australia* | | |
Yamana break fee, net of costs and taxation | | |
| | |
1 For 2022, adjusted free cash flow excludes Yamana break fee and related costs and taxation. •Based on information underlying the audited consolidated annual financial statements of Gold Fields Limited for the year ended 31 December 2023. |
Management’s discussion and analysis of the financial statements continued
Below is a table providing a breakdown of how the cash was generated by the Group.
| | |
| |
Figures in millions unless otherwise stated | | |
| | |
Net cash generated by mines* | | |
| | |
| | |
| | |
| | |
| | |
| | |
| | |
| | |
| | |
| | |
Interest paid by corporate entities2,* | | |
Redemption of Asanko preference shares | | |
| | |
| | |
1The Salares Norte expenditure of US$329 million (2021: US$327 million) comprises exploration expenditure of US$32 million (2021: US$27 million), capital
expenditure of US$296 million (2021: US$375 million), release of working capital of US$6 million (2021: US$66 million) and other costs of US$7 million
(2021: income of US$9 million).
2Does not agree to interest paid per the cash flow of US$97 million (2021: US$103 million) due to interest paid by the mines reflected under net cash
generated by mines before growth capital.
*Based on information underlying the audited consolidated annual financial statements of Gold Fields Limited for the year ended 31 December 2023.
Statement of financial position
Borrowings
Total borrowings increased by 15% from US$1,079 million at 31 December 2022 to US$1,237 million at 31 December 2023.
Net debt is defined as total borrowing plus lease liabilities less cash and cash equivalents. Net debt increased by 45% from
US$704 million at 31 December 2022 to US$1,024 million at 31 December 2023 mainly due to the purchase of the Windfall
equity-accounted investee of US$247 million as well as Windfall capital contributions of US$69 million. Net debt (excluding
lease liabilities) increased by 90% from US$310 million at 31 December 2022 to US$588 million at 31 December 2023 for the
same reasons discussed above.
The Group monitors capital using the ratio of net debt to adjusted EBITDA. The definition of adjusted EBITDA and net debt
is defined in the Group's facilities agreements. Adjusted EBITDA is defined as profit or loss for the year adjusted for interest,
taxation, amortisation and depreciation and certain other costs. The bank covenants on external borrowings require a net
debt to adjusted EBITDA ratio of 3.5 or below and EBITDA to net finance charges of 4.1 or above and the ratios are
measured based on amounts in United States Dollar. Net debt to adjusted EBITDA at 31 December 2023 was 0.42x
(2022: 0.29x). Refer to note 42 of the consolidated financial statements for further details including the reconciliation of
profit or the year to adjusted EBITDA.
Provisions
Total provisions increased by 14% from US$401 million in 2022 to US$459 million in 2023 and included the following:
| | |
| |
Figures in millions unless otherwise stated | | |
| | |
Provision for environmental rehabilitation costs | | |
Silicosis settlement costs | | |
| | |
| | |
Current portion of provision1 | | |
Non-current portion of provisions | | |
1Current portion of provision comprises US$47 million (2022: US$18 million) of the current portion of the environmental rehabilitation costs and US$nil
(2022: US$1 million) of the current portion of the silicosis settlement costs.
Provision for environmental rehabilitation costs
The amount provided for environmental rehabilitation costs increased by 17% from US$388 million at 31 December 2022 to
US$453 million at 31 December 2023. The increase is due to the increase in the gross base cases mainly at Cerro Corona
and the Australian operations. This provision represents the present value of closure, rehabilitation and other environmental
obligations up to 31 December 2023. This provision is updated annually to take account of inflation, the time value of money,
any new environmental obligations incurred or rehabilitation performed during the year.
The inflation and range of discount rates applied in 2023 and 2022 for each region are shown in the table below:
The Ghanaian discount rates decreased as a result of decreases in the Ghana country risk premium.
Adjustments for new disturbances and changes in environmental legislation during 2023 and 2022, after applying the above
inflation and discount rates were:
| | |
| |
Figures in millions unless otherwise stated | | |
| | |
| | |
| | |
| | |
| | |
| | |
Management’s discussion and analysis of the financial statements continued
The South African and Ghanaian operations contribute to a dedicated environmental trust fund and a dedicated bank
account, respectively, to provide financing for final closure and rehabilitation costs. The amount invested in the fund is
shown as a non-current asset in the financial statements and increased by 11% from US$99 million at 31 December 2022 to
US$110 million at 31 December 2023. The increase is mainly as a result of contributions amounting to US$11 million and
interest income of US$1 million. The South African and Ghanaian operations are required to contribute annually to the trust
fund over the remaining lives of the mines, to ensure that sufficient funds are available to discharge commitments for future
rehabilitation costs.
At 31 December 2023, Australia and Peru had set aside US$60 million (2022: US$28 million) and US$20 million (2022:
US$10 million), respectively, for future rehabilitation costs. These comprised secured cash deposits and are included in cash
and cash equivalents. The contributions in Australia and Peru are pro-active and not legally required by local legislation.
Silicosis settlement costs provision
The Tshiamiso Trust has been established to carry out the terms of the settlement agreement reached between six gold
mining companies (including Gold Fields) and claimant attorneys in the Silicosis and Tuberculosis class action. The
Tshiamiso Trust is responsible for ensuring that all eligible current and former mineworkers across southern Africa with
Silicosis or work-related Tuberculosis (or their dependents where the mineworker has passed away) are compensated
pursuant to the Silicosis and Tuberculosis Class Action Settlement Agreement.
As of 16 February 2024, 15,277 claimants have received benefits from the Trust in the aggregate amount of R1,288 billion.
Gold Fields has provided for the estimated cost of the above settlement based on actuarial assessments and the provisions
of the Silicosis and Tuberculosis Settlement Agreement. At 31 December 2023, the provision for Gold Fields’ share of the
settlement of the class action claims and related costs amounted to US$5 million (R94 million) (2022: US$11 million
(R179 million)) of which US$nil (R4 million) (2022: US$1 million (R22 million)) was classified as current and US$5 million
(R89 million) (2022: US$11 million (R157 million)) as non-current. The nominal value of this provision is US$7 million
(R132 million) (2022: US$14 million (R245 million)).
The assumptions that were made in the determination of the provision include silicosis prevalence rates, estimated
settlement per claimant, benefit take-up rates and disease progression rates. A discount rate of 9.27% (2022: 9.22%)
was used, based on government bonds with similar terms to the anticipated settlements.
The ultimate outcome of this matter however remains uncertain, with the number of eligible workers successfully submitting
claims and receiving compensation being uncertain. The provision is consequently subject to adjustment in the future. Refer
to notes 28.2 and 38 of the consolidated financial statements for further details.
Other long-term provisions
Other long-term provisions decreased by 50% from US$2 million in 2022 to US$1 million in 2023.
Credit facilities
At 31 December 2023, the Group had unutilised committed banking facilities available under the following facilities, details of
which are discussed in note 27:
•US$1,044 million available under the new US$1,200 million revolving credit facility;
•US$67 million available under the US$150 million revolving senior secured credit facility;
•US$100 million available under the US$100 million senior secured revolving credit facility;
•A$500 million (US$341 million) under the new A$500 million syndicated revolving credit facility;
•R500 million (US$27 million) available under the R500 million Nedbank revolving credit facility;
•R500 million (US$27 million) available under the new R500 million Absa Bank revolving credit facility;
•R1,000 million (US$55 million) available under the R1,500 million Rand Merchant Bank revolving credit facility; and
•R500 million (US$27 million) available under the R500 million Standard Bank revolving credit facility.
Substantial contractual arrangements for uncommitted borrowing facilities are maintained with several banking
counterparties to meet the Group’s normal contingency funding requirements.
As of the date of this report, the Group was not in default under the terms of any of its outstanding credit facilities.
Working capital
Following its going concern assessment performed, which takes into account the 2023 operational plan, net debt position
and unutilised loan facilities, management believes that Gold Fields’ working capital resources, by way of internal sources
and banking facilities, are sufficient to fund Gold Fields’ currently foreseeable future business requirements.
Off-balance sheet items
At 31 December 2023, Gold Fields had no material off-balance sheet items except for as disclosed under guarantees and
capital commitments.
Contractual obligations, commitments and guarantees at 31 December 2023
| | | | |
| |
| |
Figures in millions unless otherwise stated | | | Between one and five years | |
| | | | |
| | | | |
US$500 million 5-year notes issue | | | | |
| | | | |
| | | | |
US$500 million 10-year notes issue | | | | |
| | | | |
| | | | |
US$150 million revolving senior secured credit facility | | | | |
| | | | |
| | | | |
US$1,200 million revolving senior secured credit facility | | | | |
| | | | |
| | | | |
| | | | |
| | | | |
Environmental obligations2 | | | | |
| | | | |
| | | | |
Total contractual obligations | | | | |
1The capital amounts of the US$500 million 5-year notes issue and the US$500 10-year notes issue in the table above represent the principal amounts to be
repaid and differ from the carrying values presented in the statement of financial position due to the unwinding of transaction costs capitalised at inception.
2Gold Fields makes full provision for all environmental obligations based on the net present value of the estimated cost of restoring the environmental
disturbance that has occurred up to the reporting date. Management believes that the provisions made for environmental obligations are adequate to cover
the expected volume of such obligations.
| | | | |
| |
| Amounts of commitments expiring by period |
Figures in millions unless otherwise stated | | | Between one and five years | |
| | | | |
| | | | |
Capital expenditure – contracted for | | | | |
| | | | |
Management’s discussion and analysis of the financial statements continued
Guarantees
Guarantees consist of numerous obligations. Guarantees consisting of US$221 million committed to guarantee Gold Fields’
environmental and other obligations with respect to its South African, Peruvian, Ghanaian and Australian operations are fully
provided for under the provision for environmental rehabilitation and certain lease liabilities and are not included in the
amount above.
Information communication and technology (“ICT”)
Gold Fields ICT remains a critical function of the Gold Fields Group, enabling the day to day business operations by focusing
on ensuring that the latest technology is available and adopted by the Group and its operations whilst simultaneously
managing cybersecurity and related risks across the Group. The ICT digital strategy is aligned with the Group’s business
strategy and sets the foundation for the adoption of business systems, digital infrastructure, processes and technologies
that enable the achievement of the Gold Fields’ purpose and objective.
Gold Fields ICT is responsible for the governance, risk management and ultimately the protection of all information and
technology assets across the Group and consequently maintains comprehensive cybersecurity measures to protect the
Group from cybersecurity-related risks. These include measures in relation to physical infrastructure, applications in use by
the Group, as well the data and personal information hosted on these systems. ICT is also accountable for ensuring that the
relevant guardrails are in place to confirm that the Group adheres to all applicable cybersecurity and protection of
information regulations across the various jurisdictions in it operates.
Gold Fields vision to be the preferred gold mining company delivering sustainable, superior value requires the utilisation
of digital technologies, as well as the agility to respond to the rapidly changing technology environment and its associated
risks. This is achieved through ensuring that the foundational digital infrastructure technology and systems for the mine of
the future are in place across its various operations. The approved ICT digital strategy encompasses the digitisation
elements to enable the digital mine of the future.
During the course of 2023 and aligned to the principles of continuous innovation, ICT delivered on the following key
objectives as guided by the ICT Digital Strategy:
Strategy
•ICT 2.0: Gold Fields ICT operating and delivery model, which is based on industry best practice, has been enhanced to
reposition the ICT function to effectively deliver on the digital strategy. This model enables ICT to focus on business and
strategic imperatives, whilst adopting suitable partnerships for non-core services, creating the capacity to deliver against
key strategic objectives and exposing opportunities to enable the rapid deployment of digital technologies;
•Digital infrastructure: Laying the foundation of a digital infrastructure to enable a connected mine and facilitate the
seamless flow of data. The implementation of advanced digital infrastructure is ongoing across each material operation.
Further, ICT is delivering on the strategic cloud first vision, by adopting resilient and secure cloud technologies with the
migration of certain key systems from legacy on premise infrastructure into the Gold Fields cloud environment;
•Data analytics: Executing on the data strategy, working towards an insights-driven business with key business areas
adopting data driven processes and decisions. Selected data analytics initiatives were concluded with further use cases
planned for implementation. In addition, the adoption of data analytics has been embedded across the control
environment enabling significantly enhanced controls for the Group. The adoption of robotic process automation across
certain repetitive business processes has been executed successfully with significant business process improvements
achieved;
•Cybersecurity: Responding to cyber security threats and dynamically evolving an enhanced and robust cybersecurity
posture continues to remain a key focus, with initiatives in the area of identity and access management, cyber threat
detection and response, vulnerability management and zero trust protocols. Further maintaining a risk management and
compliance discipline that encompasses industry-leading practices has been a key focus.
•Cybersecurity wargames: Gold Fields strategically implemented a cybersecurity simulation to evaluate its global incident
response processes. The simulation involved a cybersecurity attack which allowed Gold Fields to assess its readiness and
response capabilities. The simulation demonstrated effective mitigation of the cybersecurity simulated attack. This
simulation also facilitated collaboration amongst global teams which enhances the communication and co-ordination in
real-time response scenarios. The exercise validated Gold Fields current preparedness and provided valuable insights for
further refining and strengthening of the Gold Fields cybersecurity posture. Although, strong mitigating measures have
been implemented, Gold Fields cannot rule out the possibility of cybersecurity breaches occurring in the future and
therefore, cybersecurity remains one of the Group’s identified critical risks.
•People management: The Digital people platforms that deliver on the future of work and an enhanced employee
experience were improved by the implementation of key functionality including digital learning, remuneration and
extended workforce management;
•Information technology (“IT”) and operational technology (“OT”) convergence: Enabling the convergence of information
and operational technology under a unified architecture, standards, governance and cybersecurity framework has
progressed with a focus on governance and controls during the course of the year; and
Regulatory
During 2023, the Securities and Exchange Commission (“SEC”) finalised amendments to its legislation that dealt with the
disclosure of cybersecurity incidents, as well as cybersecurity risk management strategy and governance. Gold Fields
undertook a review to identify changes that would need to be made within Gold Fields current environment in order to
adapt to the new legislative requirements. The gaps identified during this review were remediated by enhancing Gold Fields
cybersecurity disclosure management processes and procedures. Training was conducted to provide awareness to the
Cybersecurity Disclosure Management Committee (“CDMC”) of the new requirements and enhanced processes were
implemented as a result. These processes were then tested through a simulation exercise, where members of the CDMC
participated and tested their understanding of the SEC regulations and the enhanced cybersecurity disclosure management
processes and procedures as aligned to the new SEC cybersecurity regulations.
The CDMC comprises executives from Finance, Legal and Compliance, Investor Relations, Risk Management and ICT who
are mandated to manage the response and disclosure related to any cybersecurity incident. The CDMC meets on an annual
basis to review the disclosure policy and protocol adopted by the Group as well as on an adhoc basis in response to any
cybersecurity threats or incidents.
Governance
Gold Fields Board of Directors and its committees are focused on ICT and particularly cybersecurity, governance and risk
management. Accordingly, governance is a critical component forming a part of the management of ICT at Gold Fields.
Gold Fields Audit Committee mandates that the ICT Charter is updated and approved annually and that it articulates the ICT
and cybersecurity governance mechanisms adopted within the Group. The ICT Charter is compliant with the King IV Code
of Corporate Governance and provides assurance to the Board that the ICT function is being managed efficiently and
effectively and that ICT risks are adequately mitigated. This Charter is approved annually by the Audit Committee. The
governance structure as outlined in the Charter mandates certain responsibilities and delegations of authority which are
outlined below:
•Board of Directors: The Board of Directors through its relevant subcommittees is responsible for ensuring that an
approved ICT strategy is in place and is being executed effectively as well as ensuring that all ICT risks, specifically
cybersecurity and governance risks are mitigated and managed. Whilst the specific responsibility for cybersecurity risk
is delegated to the Audit Committee, the Board of Directors receives regular reports from management on both the
cybersecurity risks facing the Company and various mitigation and protective measures that are currently being
implemented across the organisation. Additionally, as part of its continuing education initiatives, the Board of Directors
receives training on cybersecurity matters from outside experts in the field;
•Audit Committee: The Audit Committee is specifically tasked with overseeing ICT governance and approving the
technology and information policies of Gold Fields, including in relation to risks from cybersecurity threats. The Board
delegates authority to the Audit Committee to provide leadership and approves the overall direction of ICT through the
Audit Committee’s approval of the ICT Charter;
•Risk Committee: The Risk Committee is responsible for assessing and approving ICT risks, including in relation to risks
from cybersecurity threats and associated controls and mitigating actions to manage these risks. The Risk Committee
provides input into ICT Risk Management and the ICT Control Environment;
•Executive Committee: ICT takes guidance from the Executive Committee in working towards the achievement of the
business objectives through the development and execution of the ICT strategy. The Board and Audit Committee
delegate oversight and accountability of ICT to the Executive Committee. The Executive Committee defines the business
objectives and ICT is required to align and support the achievement of these objectives.
•Chief Financial Officer (“CFO”): The Gold Fields CFO is the executive responsible for ensuring that prudent and
reasonable steps are being taken in the management and governance of ICT. The CFO is responsible for the oversight
and accountability of ICT and approves the ICT budget and financial targets.
Management’s discussion and analysis of the financial statements continued
In achieving this objective, the CFO ensures the strategic alignment of ICT activities to the business objectives and monitors
the delivery of the ICT strategy and performance against ICT key performance indicators. The CFO delegates the
development, execution and delivery of the ICT strategy and goals to the Chief Information Officer (“CIO”) who is ultimately
responsible for managing information and technology across the Group. The CFO together with the CIO reports on ICT and
cybersecurity matters to the audit and risk committees quarterly, as the delegated subcommittees of the board responsible
for the oversight of these functions.
•ICT Management Committee (“ICT MANCO”): Gold Fields ICT MANCO defines and delivers the ICT strategy approved
by the Executive Committee and the Audit Committee. ICT MANCO responds to the direction provided by the Audit
Committee and seeks approval of the goals being targeted in the long-term.
Gold Fields ICT MANCO is led by the CIO and includes the Gold Fields Chief Security Officer who is delegated the
responsibility of maintaining the desired cybersecurity posture across the Group. Through the delivery of the ICT goals
the ICT management committee is responsible for:
▪Strategy Implementation;
▪Financial Management;
▪Service Delivery;
▪Risk Management;
▪Compliance;
▪Cybersecurity;
▪Resilience;
▪Project delivery; and
▪People Management.
Gold Fields ICT MANCO, which is made up of ICT leadership from the regions, convenes monthly to assess the performance
and determine remedial actions for the above focus areas. ICT MANCO reports to the CFO and Audit Committee on
governance, risk, cybersecurity and other strategic matters on a quarterly basis. This quarterly report includes the disclosure
of any cybersecurity risks and incidents and details any responsive actions executed. The ICT quarterly report is tabled at
both the Audit and Risk Committees of the Board on a quarterly basis.
Cybersecurity
Cybersecurity remains one of the key priorities of Gold Fields ICT, and whilst the ICT digital strategy is being executed, the
importance of continuously evolving and enhancing the Group’s cybersecurity posture is a critical component of successfully
achieving ICT’s strategic objectives.
Cybersecurity Strategy
Gold Fields integration of cyber and information security control data, interfacing and augmenting multidisciplinary functions
and risk reduction strategies represents a cornerstone within our cybersecurity framework. By seamlessly uniting people,
processes, and technology, Gold Fields remains fully committed to enhancing its inherent capability to identify, mitigate, and
manage risks associated with ICT systems. This holistic approach ensures a proactive stance against potential threats,
fortifying Gold Fields overall cybersecurity posture.
Cybersecurity Risk Management
Cybersecurity threats and vulnerabilities are identified as critical ICT risks and are included in the Gold Fields ICT Risk
Management processes. These are managed through the Governance, Risk, Architecture, Standards Cybersecurity and
Compliance Committee (“GRASSC”) which is made up of Key ICT executives across the Group. The GRASSC provides
critical ICT input and provides feedback to the Gold Fields Group Risk Management function. Cybersecurity threats and
vulnerabilities are identified through the normal course of business operations and mitigating actions taken are reported
to the CFO and the Audit Committee.
Cyber Security Threats and Incidents
There were no material cybersecurity incidents that materially affected Gold Fields, including its business strategy, results
of operations, or financial condition that occurred during the course of 2023.
Cyber Security Principles
•Governing Principles: The overall principle governing cyber security and cyber risk management at Gold Fields has been
to establish the foundation for adopting an organization-wide cyber risk management process that is integrated into
organisational risk management frameworks, industry best practices and regulatory requirements (ISO, SEC, SOX,
POPIA etc.);
•Protect Principles: Integration and Automation – Gold Fields strives to integrate and automate cyber technologies and
controls to offer a unified view of the cyber estate, safeguarding all Gold Fields digital assets;
•Detect Principles: Continuous Monitoring - Gold Fields adopts continuous, real-time monitoring and detection systems
that analyse network activities and user behaviours for proactive threat identification; and
•Response Principles: Robust Incident Management – Gold Fields have deployed a robust Incident and Threat
management program, aligning communication with business objectives, to respond effectively to cyber risks within an
ever-changing operating landscape.
Cybersecurity incidents, continuous vulnerability assessments and threat intelligence inform the Group’s cybersecurity
posture. The Gold Fields cybersecurity posture is premised on monitoring the prevention, mitigation, detection and
remediation of cybersecurity incidents. This posture incorporates the evolution of policies, procedures and the adoption of
new technologies in response to the changing threat landscape.
The continuous evolution of Gold Fields cybersecurity posture as well as the governance and control environment to
strengthen our resilience against evolving cyber threats includes the following:
•An ICT Governance Framework that incorporates ICT security policies and procedures;
•A Governance, Risk, Compliance, Security, Architecture and Standards Steering Committee that evaluates all components
relevant to cybersecurity and a well-governed ICT environment;
•Continuous Risk Assessments: Regularly evaluating and identifying potential cyber risks and vulnerabilities within the
organisation;
•Technology Adoption: Implementing cutting-edge technologies, tools, and solutions to enhance cybersecurity defences
and ensure the protection of digital assets;
•Policy and Framework Development: Establishing comprehensive cybersecurity policies and frameworks that align with
industry standards and best practices, such as ISO 27001, National Institute of Standards and Technology (“NIST”) and
Centre for Internet Securities, Critical Security Controls frameworks. These policies and frameworks include the
assessment of risks associated with third-party service providers and these risks are continuously monitored and
managed through the Gold Fields cybersecurity operations centre.
•Third-Party Risk Assessment: Maintaining a robust third-party risk assessment capability enabling the Group to
continuously monitor our digital attack surface and implement appropriate risk mitigation strategies within our Security
Operation Center;
•Training and Awareness: Providing ongoing education and training for employees at all levels to foster a security-
conscious culture and minimise the risk of human error;
•Incident Response and Recovery: Developing and maintaining robust incident response plans and recovery strategies,
which detail the processes and procedures to be followed in the event of a cybersecurity incident to minimise the impact
of security breaches and ensure business continuity. These plans are part of the overall Gold Fields ICT business
continuity plans which ensure recoverability of ICT systems with minimal disruptions to the business in the event of a
cybersecurity incident.
•Cybersecurity Simulations: Various cyber security simulations are conducted throughout the year, to test and verify the
effectiveness of the Group’s cybersecurity posture :
–Real time Attack Simulation: A real time cybersecurity attack is simulated on a live production system and mitigation
activities across people, process and technologies are tested and verified.
–Incident Response: The Gold Fields ICT cybersecurity incident response plans and associated procedures are regularly
assessed through tabletop simulations. These plans and procedures are regularly updated based on the outcome of
these simulations to ensure that these remain relevant to the changing threat landscape;
–Disclosure Management Simulation: Various simulations are conducted in order to assess the effectiveness of the
disclosure procedures, relative to the compliance requirements in the regions in which we operate; and
–External Reviews: Independent external reviews are conducted annually by third parties to assess the effectiveness of
the security measures in place across the Group. Gold Fields was recently rated within the 97th percentile in the
category of Information Security/Cybersecurity and System Availability within the mining industry.
Management’s discussion and analysis of the financial statements continued
•Compliance and Regulation: Ensuring that the Group remains compliant to relevant cybersecurity regulations and
compliance requirements, e.g., POPIA and GDPR, and the activities, actions, policies and procedures are continuously
enhanced to maintain compliance as the regulatory landscape changes;
•Continuous Monitoring, Reporting and Improvement: Gold Fields ICT regularly monitors the effectiveness of its
cybersecurity measures, adapting to new threats, and continuously improving the organisation's cybersecurity posture.
The Gold Fields CIO and Chief Information Security Officer (“CISO”) reports on this monitoring, as well cybersecurity
vulnerabilities, incidents and threat intelligence, on a monthly basis to the CFO. The CIO remains responsible for assessing
and managing any material risks emanating from the cybersecurity threats. The CIO relies on the expertise of the CISO
who has over 17 years of cybersecurity experience and holds a Bachelor’s degree in Cyber Forensics, Information Security
& Management and a Masters in Information Security, and Cyber Security Certification from MIT and Harvard. These
reports are further tabled at the Audit Committee as part of the quarterly reporting process;
•Security Operations Centre: A Security Operations Centre has been established and is responsible for monitoring and
addressing cybersecurity, vulnerabilities, threats and incidents; and
•Cloud Migration: The ongoing migration of all critical ICT infrastructure to cyber-resilient cloud platforms.
Gold Fields ICT will continue to adopt and adapt countermeasures in order to strengthen the Group’s cybersecurity
defences against a wide range of threats, spanning from identity theft, corporate espionage and the sabotage of industrial
control systems.
Gold Fields corporate office, regional offices, and operating mines have achieved and continue to maintain the
ISO 27001:2013 Information Security Certification to provide further assurance around the cybersecurity posture adopted
by the Group.
Its activities in 2023 have showcased ICT’s unwavering commitment to cybersecurity. Moving forward, its agile strategies
and commitment to innovation will continue adapting to evolving threats. Safeguarding operations is not just a strategy, but
has been engrained within our ethos to continue securing the trust of our stakeholders.
ICT at Gold Fields remains committed to inculcating and cultivating a security-conscious culture and further embedding
cybersecurity by design whilst modernising the Gold Fields technology assets.
Internal control over financial reporting
Gold Fields’ management is responsible for establishing and maintaining adequate internal control over financial reporting.
The Securities Exchange Act of 1934 defines internal control over financial reporting in Rule 13a-15(f) and 15d-15(f) as a
process designed by, or under the supervision of, the Company’s principal executive and principal financial officers, and
effected by the Company’s Board of Directors, management and other personnel, to provide reasonable assurance
regarding the reliability of financial reporting and the preparation of financial statements for external purposes in accordance
with IFRS Accounting Standards, as issued by the IASB.
It includes those policies and procedures that:
•Pertain to the maintenance of records that in reasonable detail accurately and fairly reflect the transactions and
dispositions of the assets of the Company;
•Provide reasonable assurance that transactions are recorded as necessary to permit preparation of financial statements
in accordance with IFRS Accounting Standards, as issued by the IASB, and that receipts and expenditures of the Company
are being made only in accordance with authorisations of management and Directors of the Company; and
•Provide reasonable assurance regarding prevention or timely detection of unauthorised acquisition, use or disposition
of the Company’s assets that could have a material effect on the consolidated financial statements.
Because of its inherent limitations, internal control over financial reporting may not prevent or detect misstatements. Also,
projections of any evaluation of effectiveness to future periods are subject to risk that controls may become inadequate
because of changes in conditions, or that the degree of compliance with the policies or procedures may deteriorate.
Gold Fields’ management assessed the effectiveness of its internal control over financial reporting as of 31 December 2023.
In making this assessment, Gold Fields’ management used the criteria established in Internal Control-Integrated Framework
(2013) issued by the Committee of Sponsoring Organizations of the Treadway Commission (COSO). Based upon its
assessment, Gold Fields’ management concluded that, as of 31 December 2023, its internal control over financial reporting
is effective based upon those criteria.
Trend outlook
2024 remains another significant capital expenditure year for Gold Fields, given the remaining project capital at Salares
Norte, the renewables microgrid at St Ives as well as the elevated level of sustaining capex across the portfolio, to maintain
the production base of the Group.
Based on the impending sale of our 45% effective interest in Asanko in 2024, no guidance will be provided for the equity-
accounted investee. Consequently, Group guidance excludes our share of the Asanko joint venture.
For 2024, attributable gold equivalent production (excluding Asanko) is expected to be between 2.33Moz and 2.43Moz
(2023 comparable 2.24Moz). AISC is expected to be between US$1,410/oz and US$1,460/oz, and AIC is expected to be
US$1,600/oz to US$1,650/oz. Included in sustaining capital expenditure is A$200m (US$132m) for a St Ives renewable
power project. Excluding this renewable microgrid project which accounts for approximately US$60/oz, the ranges for AISC
will be US$1,350/oz – US$1,400/oz and AIC will be US$1,540/oz to US$1,590/oz.
The exchange rates used for our 2024 guidance are: R/US$18.70, US$/A$0.66 and C$/US$0.75. The metal price
assumptions for the calculation of royalties and copper and silver by-products are: gold price US$2,050/oz (A$3,100/oz,
R1,200,000/kg); copper price US$8,500/t and silver price US$23/oz.
The increase in AIC is due to higher sustaining capital expenditure mainly at Gruyere, St Ives and South Deep and higher
cost of sales before amortisation and depreciation as a result of inflationary increases as well as gold inventory movements
mainly at St Ives, Damang and Tarkwa, partially offset by higher production.
Total capex for the Group for the year is expected to be US$1.130 billion – US$1.190 billion. Sustaining capital is expected to
be US$860 million – US$890 million. The increase in sustaining capital from US$692 million in 2023 is driven largely by:
•A$200 million (US$132 million) to be spent in 2024 on the renewable microgrid project;
•Increased development and infrastructure capital at St Ives;
•Increased capital waste stripping at Gruyere; and
•Mine infrastructure upgrades and fleet replacement at South Deep.
Non-sustaining capex is expected to be US$270 million – US$300 million, with the largest component of this being the
Salares Norte project capital of US$148 million and Windfall Project capital of US$56 million with the balance relating to
various growth projects in the Australia region.
Paul Schmidt
Chief Financial Officer
28 March 2024
Report of Independent Registered Public
Accounting Firm
Report of Independent Registered Public Accounting Firm
To the Board of Directors and Shareholders of Gold Fields Limited
Opinions on the financial statements and internal control over financial reporting
We have audited the accompanying consolidated statements of financial position of Gold Fields Limited and its subsidiaries
(the “Company”) as of 31 December 2023 and 31 December 2022, and the related consolidated income statements,
consolidated statements of comprehensive income, consolidated statements of changes in equity and consolidated
statements of cash flows for each of the three years in the period ended 31 December 2023, including the related notes
(collectively referred to as the “consolidated financial statements”). We also have audited the Company's internal control
over financial reporting as of 31 December 2023, based on criteria established in Internal Control – Integrated Framework
(2013) issued by the Committee of Sponsoring Organizations of the Treadway Commission (COSO).
In our opinion, the consolidated financial statements referred to above present fairly, in all material respects, the financial
position of the Company as of 31 December 2023 and 31 December 2022, and the results of its operations and its cash
flows for each of the three years in the period ended 31 December 2023 in conformity with IFRS Accounting Standards as
issued by the International Accounting Standards Board. Also in our opinion, the Company maintained, in all material
respects, effective internal control over financial reporting as of 31 December 2023, based on criteria established in
Internal Control – Integrated Framework (2013) issued by the COSO.
Basis for opinions
The Company's management is responsible for these consolidated financial statements, for maintaining effective internal
control over financial reporting, and for its assessment of the effectiveness of internal control over financial reporting,
included in Management’s Report on Internal Control over Financial Reporting appearing under Item 15b. Our responsibility
is to express opinions on the Company’s consolidated financial statements and on the Company's internal control over
financial reporting based on our audits. We are a public accounting firm registered with the Public Company Accounting
Oversight Board (United States) (PCAOB) and are required to be independent with respect to the Company in accordance
with the U.S. federal securities laws and the applicable rules and regulations of the Securities and Exchange Commission
and the PCAOB.
We conducted our audits in accordance with the standards of the PCAOB. Those standards require that we plan and
perform the audits to obtain reasonable assurance about whether the consolidated financial statements are free of material
misstatement, whether due to error or fraud, and whether effective internal control over financial reporting was maintained
in all material respects.
Our audits of the consolidated financial statements included performing procedures to assess the risks of material
misstatement of the consolidated financial statements, whether due to error or fraud, and performing procedures that
respond to those risks. Such procedures included examining, on a test basis, evidence regarding the amounts and
disclosures in the consolidated financial statements. Our audits also included evaluating the accounting principles used and
significant estimates made by management, as well as evaluating the overall presentation of the consolidated financial
statements. Our audit of internal control over financial reporting included obtaining an understanding of internal control over
financial reporting, assessing the risk that a material weakness exists, and testing and evaluating the design and operating
effectiveness of internal control based on the assessed risk. Our audits also included performing such other procedures as
we considered necessary in the circumstances. We believe that our audits provide a reasonable basis for our opinions.
Definition and limitations of internal control over financial reporting
A company’s internal control over financial reporting is a process designed to provide reasonable assurance regarding
the reliability of financial reporting and the preparation of financial statements for external purposes in accordance with
generally accepted accounting principles. A company’s internal control over financial reporting includes those policies
and procedures that (i) pertain to the maintenance of records that, in reasonable detail, accurately and fairly reflect the
transactions and dispositions of the assets of the company; (ii) provide reasonable assurance that transactions are recorded
as necessary to permit preparation of financial statements in accordance with generally accepted accounting principles, and
that receipts and expenditures of the company are being made only in accordance with authorisations of management and
directors of the company; and (iii) provide reasonable assurance regarding prevention or timely detection of unauthorised
acquisition, use, or disposition of the company’s assets that could have a material effect on the financial statements.
Because of its inherent limitations, internal control over financial reporting may not prevent or detect misstatements. Also,
projections of any evaluation of effectiveness to future periods are subject to the risk that controls may become inadequate
because of changes in conditions, or that the degree of compliance with the policies or procedures may deteriorate.
Critical audit matters
The critical audit matters communicated below are matters arising from the current period audit of the consolidated financial
statements that were communicated or required to be communicated to the audit committee and that (i) relate to accounts
or disclosures that are material to the consolidated financial statements and (ii) involved our especially challenging,
subjective, or complex judgments. The communication of critical audit matters does not alter in any way our opinion on the
consolidated financial statements, taken as a whole, and we are not, by communicating the critical audit matters below,
providing separate opinions on the critical audit matters or on the accounts or disclosures to which they relate.
Impairment assessment of property, plant and equipment
As described in Note 1 of the accounting policies (Basis of Preparation – Significant accounting judgements and estimates)
and Note 7 to the consolidated financial statements (Impairment, net of reversal of impairment of investments and assets),
the Company reviews and tests the carrying value of property, plant and equipment for impairment annually or when events
or changes in circumstances suggest the carrying amount of each cash-generating unit (“CGU”) may not be recoverable.
The carrying value of property, plant and equipment amounts to US$5.1 billion at 31 December 2023. For the year ended
31 December 2023, the Group recognised an impairment of US$156.2 million in respect of the Peru CGU. The recoverable
amount of the Peru CGU was based on its fair value less cost of disposal (“FVLCOD”) calculated using the income approach
(level 3 of the fair value hierarchy). The impairment was mainly due to a change in the life of mine plan to accommodate the
unloading of the east wall, continued cost pressures and the derecognition of the resource due to the life-of-mine sterilising
the resource through the deposition of in-pit tailings from 2026 onwards.
The principal considerations for our determination that performing procedures relating to the impairment assessment of
property, plant and equipment is a critical audit matter, are that there were significant judgments made by management
when determining the recoverable amount of the property, plant and equipment. This, in turn, led to a high degree of auditor
judgment, subjectivity and effort in evaluating management’s future cash flows and significant assumptions. In addition, the
audit effort involved using professionals with specialised skills and knowledge to assist in performing these procedures and
evaluating the audit evidence obtained from these procedures.
Addressing the matter involved performing procedures and evaluating audit evidence in connection with forming our overall
opinion on the consolidated financial statements. These procedures included testing the operating effectiveness of internal
controls relating to management’s impairment assessment of property, plant and equipment, including controls relating to
management’s identification of CGUs, impairment trigger assessments and the preparation, review and approval of the
impairment calculations. These procedures also included, among others, developing an independent expectation of the
assumptions used by management by using external market and third-party data and comparing this to management’s main
assumptions used in the impairment calculations. Management engaged external and internal specialists to assess the
reserves and resources used in the impairment calculations for reasonability. By inspecting Curriculum Vitaes, membership
certificates from professional bodies and competent persons reports, we assessed the objectivity, competence and
experience of management’s specialists. Using our corporate finance and financial modeling expertise, we assessed the
valuation models used in management’s impairment assessment. We independently recalculated management’s weighted
average cost of capital (“WACC”) with reference to relevant third-party sources. We assessed the mathematical accuracy of
the cash flow models and agreed relevant data to the latest long-term business plans used by management to manage and
monitor the performance of the business whilst also performing a retrospective comparison of forecasted cash flows to
actual past performance and previous forecasts.
Report of Independent Registered Public Accounting Firm continued
Accounting for the acquisition of the Windfall Project
As described in note 17 (Acquisition of Windfall Project) and note 18 (Equity Accounted Investees) to the consolidated
financial statements, the carrying value of the Windfall Project equity accounted investment amounts to US$538.6 million at
31 December 2023. On 2 May 2023, Gold Fields, through a 100% held Canadian subsidiary, acquired a 50% interest in the
Windfall Project in Québec, Canada, which is in the feasibility stage, from Osisko Mining Incorporated (the “Partnership”).
Under the Partnership structure, each of Osisko Mining Incorporated (“Osisko”) and Gold Fields, respectively, hold an
effective 50% partnership interest in the Windfall Project and the Exploration Properties. The management company
(responsible for the operation) is governed by a Board of Directors comprising three directors nominated by Gold Fields and
three directors nominated by Osisko. Decisions over the relevant activities of the Partnership require unanimous consent of
both the parties. Gold Fields and Osisko have joint control over the Windfall Project, the transaction is structured as a
separate vehicle and the Group has a residual interest in the net assets of the Windfall Project. Accordingly, the Group has
classified its interest in the Windfall Project as a joint venture. Key terms of the initial consideration paid by Gold Fields for
the Windfall Project include the following; (1) cash consideration of US$221.5 million (C$300 million) paid on 2 May 2023 for
the 50% interest in the joint venture, (2) Osisko acquired certain assets for the benefit of the Windfall Project during the term
sheet negotiation stage and Gold Fields agreed to refund Osisko 50% of the costs spent on these items in two equal
payments of US$12.8 million (C$16.9 million) on 31 July 2023 and US$12.8 million (C$16.9 million) on 31 December 2023,
respectively, (3) C$300.0 million contingent consideration payable on issuance of an Environmental Impact Assessment
(“EIA”) permit to the Partnership authorising the construction and operation of the Windfall Project and (4) a C$75.0 million
funding commitment for a 50% interest in certain developmental exploration projects and targets over five years
commencing 2025 (“exploration consideration”). The project requires funding from the Partnership in the feasibility and
development stage of the project. During 2023, post the acquisition date, Gold Fields paid cash calls amounting to
US$69.1 million (C$93.0 million) to the Windfall Project which has been capitalised to the cost of the investment. The
Partnership has a 31 December year-end and has been equity accounted since 2 May 2023. The Partnership’s equity
accounting is based on results to 31 December 2023.
The principal considerations for our determination that performing procedures relating to the accounting for the acquisition
of the Windfall Project is a critical audit matter, are the complexity of the transaction from a technical accounting perspective
and the inherent uncertainty, significant judgements, assumptions and estimates applied in determining the fair value of the
contingent consideration and present value of the exploration consideration. This, in turn, led to a high degree of auditor
judgment, subjectivity and effort in evaluating management’s accounting for the transaction, including the valuation of the
fair value of the contingent consideration and present value of the exploration consideration. In addition, the audit effort
involved using professionals with specialised skills and knowledge to assist in performing these procedures and evaluating
the audit evidence obtained from these procedures.
Addressing the matter involved performing procedures and evaluating audit evidence in connection with forming our overall
opinion on the consolidated financial statements. These procedures included testing the operating effectiveness of internal
controls applied by management to ensure that the acquisition was appropriately accounted for, disclosed and reviewed.
These procedures also included, among others, inspecting the relevant agreements, with the assistance of our accounting
technical experts, to evaluate management’s accounting treatment. We obtained and inspected management’s valuations,
benchmarked key assumptions against external market and third-party data and evaluated the objectivity, competence and
capabilities of management’s external valuers. With the assistance of our actuarial experts, using our own independent key
assumptions, we reperformed the valuations for reasonableness. We assessed the disclosures in respect of the acquisition,
including those disclosures related to significant judgements and estimates, in accordance with the prevailing accounting
standards.
/s/ PricewaterhouseCoopers Inc.
Johannesburg, South Africa
28 March 2024
We have served as the Company’s auditor since 2019.
Accounting policies
The principal accounting policies applied in the preparation of these financial statements (referred to as the “consolidated
financial statements” or “financial statements”) are set out below. These policies have been consistently applied to all the
years presented, except for the adoption of new and revised standards and interpretations.
Gold Fields Limited (the “Company” or “Gold Fields”) is a company domiciled in South Africa. The registration number of the
Company is 1968/4880/6. The address of the Company is 150 Helen Road, Sandton, Johannesburg. The consolidated
financial statements of the Company as at 31 December 2023 and 2022 and for each of the years in the three-year periods
ended 31 December 2023, 2022 and 2021 comprise the Company and its subsidiaries (together referred to as the “Group”
and individually as “Group entities”) as well as the Group’s share of the assets, liabilities, income and expenses of its joint
operations and the Group’s interest in associates and its joint ventures. The Group is primarily involved in gold mining.
1.Basis of preparation
The financial statements of the Group have been prepared in accordance with IFRS® Accounting Standards as issued
by the International Accounting Standards Board (“IASB”).
As required by the United States Securities and Exchange Commission, the financial statements include the
consolidated statements of financial position as at 31 December 2023 and 2022 and the consolidated income
statements and statements of comprehensive income, changes in equity and cash flows for the years ended
31 December 2023, 2022 and 2021 and the related notes.
The consolidated financial statements were authorised for issue by the Board of Directors on 28 March 2024.
Standards, interpretations and amendments to published standards effective for the year ended
31 December 2023 or early adopted by the Group
During the financial year, the following new and revised accounting standards, amendments to standards and new
interpretations were adopted by the Group:
| | | | | | |
Standard(s) Amendment(s) Interpretation(s) | | | | Salient features of the changes | | Impact on financial position or performance |
IAS 1 Presentation of Financial Statements and IFRS Practice Statement 2 | | | | •This amendment to IAS 1 requires companies to disclose their material accounting policy information rather than their significant accounting policies; •This amendment also provides a definition of material accounting policy information; •Further, the amendment clarifies that immaterial accounting policy information need not be disclosed; and •To support this amendment, the Board also amended IFRS Practice Statement 2 Making Materiality Judgements, to provide guidance on how to apply the concept of materiality to accounting policy disclosures. | | |
IAS 8 Accounting Policies, Changes in Accounting Estimates and Errors | | | | •This amendment to IAS 8 clarifies how companies should distinguish between changes in accounting policies and changes in accounting estimates. | | |
Accounting policies continued
1.Basis of preparation continued
| | | | | | |
Standard(s) Amendment(s) Interpretation(s) | | | | Salient features of the changes | | Impact on financial position or performance |
| | | | •The amendments to IAS 12 Income Taxes require companies to recognise deferred tax on transactions that, on initial recognition, give rise to equal amounts of taxable and deductible temporary differences. They will typically apply to transactions such as leases of lessees and decommissioning obligations and will require the recognition of additional deferred tax assets and liabilities; •The amendment should be applied to transactions that occur on or after the beginning of the earliest comparative period presented. In addition, entities should recognise deferred tax assets (to the extent that it is probable that they can be utilised) and deferred tax liabilities at the beginning of the earliest comparative period for all deductible and taxable temporary differences associated with: –Right-of-use assets and lease liabilities; and –Decommissioning, restoration and similar liabilities, and the corresponding amounts recognised as part of the cost of the related assets; and •The cumulative effect of recognising these adjustments is recognised in retained earnings, or another component of equity, as appropriate. | | |
IAS 12 Income Taxes (OECD Pillar Two model rules) | | | | •The Group has adopted International Tax Reform – Pillar Two Model Rules (Amendments to IAS 12) upon their release on 23 May 2023. •The additional amendments to IAS 12 Income Taxes give companies temporary relief from accounting for deferred taxes arising from the Organisation for Economic Co-operation’s (“OECD”) international tax reform. The OECD published the Pillar Two model rules in December 2021 to ensure that large multinational companies would be subject to a minimum 15% tax rate. More than 135 countries and jurisdictions representing more than 90% of global gross domestic product have agreed to the Pillar Two model rules; •The amendments introduce the following: –A temporary exception to the accounting for deferred taxes arising from jurisdictions implementing the global tax rules; and –Targeted disclosure requirements to help investors better understand a company's exposure to income taxes arising from the reform, particularly before legislation implementing the rules is in effect. •Companies can benefit from the temporary exception immediately but are required to provide the disclosures to investors for annual reporting periods beginning on or after 1 January 2023; •The adoption of the amendments resulted in the Group not having to account for any deferred tax impact as a result of the tax reform at 31 December 2023; •The mandatory exception applies retrospectively. The retrospective application has no impact on the Group’s consolidated financial statements; and •The Group has performed a preliminary impact assessment of the potential future impact of the tax reform and amendments on its financial statements. Refer note 10 for further details. | | Refer note 10 for further details. |
| | | | | | |
Standard(s) Amendment(s) Interpretation(s) | | | | Salient features of the changes | | Impact on financial position or performance |
IFRS 17 Insurance Contracts | | | | •IFRS 17 supersedes IFRS 4 Insurance Contracts and aims to increase comparability and transparency about profitability. The new standard introduces a new comprehensive model (“general model”) for the recognition and measurement of liabilities arising from insurance contracts; •In addition, it includes a simplified approach and modifications to the general measurement model that can be applied in certain circumstances and to specific contracts, such as: –Reinsurance contracts held; –Direct participating contracts; and –Investment contracts with discretionary participation features. •Under the new standard, investment components are excluded from insurance revenue and service expenses. Entities can also choose to present the effect of changes in discount rates and other financial risks in profit or loss or OCI; and •The new standard includes various new disclosures and requires additional granularity in disclosures to assist users to assess the effects of insurance contracts on the entity’s financial statements. | | |
Standards, interpretations and amendments to published standards that are not yet effective
Certain new standards, amendments and interpretations to existing standards have been published that apply to
the Group’s accounting periods beginning on 1 January 2024 or later periods but have not been early adopted by
the Group.
These standards, amendments and interpretations that are relevant to the Group are:
| | | | | | |
Standard(s) Amendment(s) Interpretation(s) | | | | Salient features of the changes | | |
IAS 1 Presentation of Financial Statements | | | | •The amendments to IAS 1 clarify that liabilities are classified as either current or non-current, depending on the rights that exist at the end of the reporting period. Classification is unaffected by the expectations of the entity or events after the reporting date; •The amendments also clarify what IAS 1 means when it refers to the ‘settlement’ of a liability; and •The amendments are not expected to have a material impact on the Group. | | |
IAS 7 Statement of Cash Flows and IFRS 7 Financial Instruments: Disclosure | | | | •The amendments require disclosures to enhance the transparency of supplier finance arrangement and their effects on an entity's liabilities, cash flows and exposure to liquidity risk; and •The amendments are not expected to have a material impact on the Group. | | |
IAS 21 The Effect of Changes in Foreign Exchange Rates | | | | •The amendment to IAS 21 provides guidance on when a currency is exchangeable and how to determine the exchange rate when it is not; and •The amendment is not expected to have a material impact on the Group. | | |
*Effective date refers to annual period beginning on or after said date.
#On 6 March 2024, the SEC adopted rules covering climate-related disclosures which will result in a significant expansion of required climate-related
disclosures in SEC filings. The required disclosures are included in Regulations S-K and S-X and cover strategy, governance, risk management,
targets and goals, greenhouse gas emissions, and financial statement effects (collectively, the “SEC climate disclosure rules”). The new rules apply
to both domestic and foreign private issuers (FPIs) and create a new “Climate-Related Disclosure” section in annual reports and registration
statements. The new rules also require certain disclosures in the audited financial statements. The effective dates and transition provisions vary by
type of registrant and for certain disclosure provisions. On 15 March 2024, the US Court of Appeals for the Fifth Circuit temporarily stayed the rules
as such uncertainty exists. The Group is currently in the process of assessing the impact of the rules.
Accounting policies continued
1.Basis of preparation continued
Significant accounting judgements and estimates
Use of estimates: The preparation of the financial statements in accordance with IFRS Accounting Standards requires
the Group’s management to make estimates and assumptions that affect the reported amounts of assets and
liabilities and disclosure of contingent assets and liabilities at the date of the financial statements, and the reported
amounts of revenues and expenses during the reporting period. The determination of estimates requires the
exercise of judgement based on various assumptions and other factors such as historical experience, current and
expected economic conditions, and in some cases actuarial techniques. Actual results could differ from those
estimates.
The more significant areas requiring the use of management estimates and assumptions relate to the following:
•Mineral reserves and resources estimates (this forms the basis of future cash flow estimates used for impairment
assessments and units-of-production depreciation and amortisation calculations);
•Carrying value of property, plant and equipment;
•Commencement of commercial levels of production;
•Estimates of recoverable gold and other materials in heap leach and stockpiles, gold in process and product
inventories including write-downs of inventory to net realisable value;
•Carrying value of equity-accounted investees;
•Provision for environmental rehabilitation costs;
•Provision for silicosis settlement costs;
•Income taxes;
•Share-based payments;
•Long-term incentive plan;
•The fair value and accounting treatment of financial instruments; and
•Contingencies.
Estimates and judgements are continually evaluated and are based on historical experience, discount rates and
other factors, including expectations of future events that are believed to be reasonable under the circumstances.
The estimates and assumptions that have a significant risk of causing a material adjustment to the carrying amounts
of assets and liabilities within the financial year are discussed below.
Mineral Reserves and Resources estimates
Mineral Reserves are estimates of the amount of product, inclusive of diluting materials and allowances for losses,
which can be economically and legally extracted from the Group’s properties, as determined by life-of-mine
schedules or pre-feasibility studies.
Mineral Resources are estimates, based on specific geological evidence and knowledge, including sampling, of the
amount of product in situ, for which there is a reasonable prospect for eventual legal and economic extraction.
In order to calculate the reserves and resources, estimates and assumptions are required about a range of
geological, technical and economic factors, including but not limited to quantities, grades, production techniques,
recovery rates, production costs, capital expenditure, transport costs, commodity demand, commodity prices and
exchange rates.
Estimating the quantity and grade of the mineral reserves and resources is based on exploration and sampling
information gathered through appropriate techniques (primarily diamond drilling, reverse circulation drilling, air-core
and sonic drilling), surface three-dimensional reflection seismics, ore body faces modelling, structural modelling,
geological mapping, detailed ore zone wireframes and geostatistical estimation. This process may require complex
and difficult geological judgements and calculations to interpret the data.
The Group is required to determine and report on the Mineral Reserves and Resources in accordance with the South
African Mineral Resource Committee (“SAMREC”) code and the United States Security and Exchange Commission
Rule SK 1300 on an annual basis. The Mineral Reserves and Resources were approved by the Competent Person.
Estimates of Mineral Reserves and Resources may change from year to year due to the change in economic,
regulatory, infrastructural or social assumptions used to estimate ore reserves and resources, and due to additional
geological data becoming available.
Changes in reported proved and probable reserves may affect the Group’s financial results and position in a number
of ways, including the following:
•The recoverable amount used in the impairment calculations may be affected due to changes in estimated cash
flows or timing thereof (refer to note 7);
•Amortisation and depreciation charges to profit or loss may change as these are calculated on the units-of-
production method, or where the useful economic lives of assets change (refer to note 2);
•Provision for environmental rehabilitation costs may change where changes in ore reserves affect expectations
about the timing or cost of these activities (refer to note 28.1); and
•The carrying value of deferred tax assets may change due to changes in estimates of the likely recovery of the tax
benefits (refer to note 26).
Changes in reported measured and indicated resources may affect the Group’s financial results and position in a
number of ways, including the following:
•The recoverable amount used in the impairment calculations may be affected due to changes in estimated market
value of resources exclusive of reserves (refer to note 7); and
•Amortisation and depreciation charges for the mineral rights asset at the Australian operations may change as a
result of the change in the portion of mineral rights asset being transferred from the non-depreciable component
to the depreciable component (refer to note 2).
Carrying value of property, plant and equipment
All mining assets are amortised using the units-of-production method where the mine operating plan calls for
production from proved and probable mineral reserves.
Mobile and other equipment are depreciated over the shorter of the estimated useful life of the asset or the estimate
of mine life based on proved and probable mineral reserves.
The calculation of the units-of-production rate of amortisation could be impacted to the extent that actual production
in the future is different from current forecast production based on proved and probable mineral reserves. This would
generally result from the extent that there are significant changes in any of the factors or assumptions used in
estimating mineral reserves. These factors could include:
•Changes in proved and probable mineral reserves;
•Unforeseen operational issues at mine sites;
•Changes in capital, operating, mining, processing and reclamation costs, discount rates and foreign currency
exchange rates; and
•Changes in mineral reserves could similarly impact the useful lives of assets depreciated on a straight-line basis,
where those lives are limited to the life of the mine.
The Group reviews and tests the carrying value of long-lived assets annually or when events or changes in
circumstances suggest that the carrying amount may not be recoverable by comparing the recoverable amounts to
these carrying values. Assets are grouped at the lowest level for which identifiable cash flows are largely
independent of cash flows of other assets and liabilities. If there are indications that impairment or reversal of
impairment may have occurred, estimates are prepared of recoverable amounts of each group of assets. The
recoverable amounts of cash-generating units (“CGU”) and individual assets have been determined based on the
higher of value in use and fair value less cost of disposal (“FVLCOD”) calculations. Expected future cash flows used
to determine the value in use or FVLCOD of property, plant and equipment and goodwill are inherently uncertain and
could materially change over time. They are significantly affected by a number of factors including reserves and
production estimates, together with economic factors such as the gold and copper prices, discount rates, foreign
currency exchange rates, inflation rates, resource valuations (determined based on comparable market transactions),
estimates of costs to produce reserves and future capital expenditure.
The Group generally used FVLCOD to determine the recoverable amount of each CGU.
Accounting policies continued
1.Basis of preparation continued
Significant assumptions used in the Group’s impairment assessments (FVLCOD calculations) include:
| | | |
| | | |
| | | |
US$ Gold price per ounce – year 1 | | | |
US$ Gold price per ounce – year 2 | | | |
US$ Gold price per ounce – year 3 | | | |
US$ Gold price per ounce – year 4 | | | |
US$ Gold price per ounce – year 5 onwards | | | |
Rand Gold price per kilogram – year 1 | | | |
Rand Gold price per kilogram – year 2 | | | |
Rand Gold price per kilogram – year 3 | | | |
Rand Gold price per kilogram – year 4 | | | |
Rand Gold price per kilogram – year 5 onwards | | | |
A$ Gold price per ounce – year 1 | | | |
A$ Gold price per ounce – year 2 | | | |
A$ Gold price per ounce – year 3 | | | |
A$ Gold price per ounce – year 4 | | | |
A$ Gold price per ounce – year 5 onwards | | | |
US$ Copper price per tonne – year 1 | | | |
US$ Copper price per tonne – year 2 | | | |
US$ Copper price per tonne – year 3 | | | |
US$ Copper price per tonne – year 4 | | | |
US$ Copper price per tonne – year 5 onwards | | | |
Resource value per ounce (used to calculate the value beyond proved and probable reserves) | | | |
•Ghana (with infrastructure) | | | |
•Peru (with infrastructure)1 | | | |
•Chile (without infrastructure) | | | |
| | | |
| | | |
| | | |
| | | |
| | | |
| | | |
Inflation rate – South Africa2 | | | |
| | | |
| | | |
| | | |
| | | |
| | | |
| | | |
| | | |
| | | |
| | | |
| | | |
1 During 2023, the resource in Peru was derecognised as a result of the life-of-mine sterilising the resource through the deposition of in-pit tailings
from 2026 onward. Refer note 7 for further details.
2Due to the availability of unredeemed capital for tax purposes over several years into the life of the South Deep mine, nominal cash flows are used
for South Africa. In order to determine nominal cash flows in South Africa, costs are inflated by the current South African inflation rate. Cash flows
for all other operations are in real terms and as a result are not inflated.
The FVLCOD calculations are sensitive to the gold and copper price assumptions and an increase or decrease in the
gold or copper price could materially change the FVLCOD. Should there be a significant decrease in the gold or
copper price, the Group would take actions to assess the implications on the life-of-mine plans, including the
determination of reserves and resources and the appropriate cost structure for the CGUs. Refer to notes 7 and 16 for
further details.
The carrying amount of property, plant and equipment at 31 December 2023 was US$5,074.4 million (2022:
US$4,815.7 million). An impairment of US$156.2 million (2022: $63.1 million) was recognised in respect of the Cerro
Corona CGU for the year ended 31 December 2023. An impairment of US$nil (2022: $325.2 million) was recognised
in respect of the Tarkwa CGU for the year ended 31 December 2023.
Commencement of commercial levels of production
The Group assesses the stage of each mine construction project to determine when a mine moves into the
production stage. The criteria used to assess the start date are determined based on the unique nature of each mine
construction project. The Group considers various relevant criteria to assess when the mine is substantially complete,
ready for its intended use and moves into the production stage. Some of the criteria would include, but are not
limited to the following:
•The level of capital expenditure compared to the construction cost estimates;
•Ability to produce metal in saleable form (within specifications); and
•Ability to sustain commercial levels of production of metal.
When a mine construction project moves into the production stage, the capitalisation of certain mine construction
costs ceases and costs are either regarded as inventory or expensed, except for capitalisable costs related to mining
asset additions or improvements, underground mine development, deferred stripping activities or ore reserve
development.
Gold may be produced while bringing a mine to the condition necessary for it to be capable of operating as intended
by management. The Group recognises the proceeds from selling gold as revenue and the associated production
cost as cost of sales in profit or loss. The Group measures the cost of gold produced applying the measurement
requirements of IAS 2 at normalised production levels using the life-of-mine planned production. Production costs in
excess of normal production up to reaching commercial levels of production are capitalised as property, plant and
equipment.
Salares Norte was still under construction at 31 December 2023 and first gold is expected to be achieved in April 2024.
Stockpiles, gold in process and product inventories
Costs that are incurred in or benefit the productive process are accumulated as stockpiles, gold in process, ore on
leach pads and product inventories. Net realisable value tests are performed on a monthly basis for short-term
stockpiles, gold in process and product inventories and at least annually for long-term stockpiles and represent the
estimated future sales price of the product based on prevailing spot metals prices at the reporting date, less
estimated costs to complete production and bring the product to sale. If any inventories are expected to be realised
in the long term, estimated future sales prices are used for valuation purposes.
Stockpiles are measured by estimating the number of tonnes added and removed from the stockpile, the number of
contained gold ounces based on assay data, and the estimated recovery percentage based on the expected
processing method. Stockpile tonnages are verified by periodic surveys.
Accounting policies continued
1.Basis of preparation continued
Stockpiles, gold in process and product inventories
Although the quantities of recoverable metal are reconciled by comparing the grades of ore to the quantities of
metals actually recovered (metallurgical balancing), the nature of the process inherently limits the ability to precisely
monitor the recoverability levels. As a result, the metallurgical balancing process is constantly monitored and
engineering estimates are refined based on actual results over time.
Variations between actual and estimated quantities resulting from changes in assumptions and estimates that do not
result in write downs to net realisable value are accounted for on a prospective basis.
Refer to notes 2 and 22 for further details.
The carrying amount of total gold in process and stockpiles (non-current and current) at 31 December 2023 was
US$814.6 million (2022: US$725.7 million).
During 2023, a net realisable value adjustment to stockpiles of US$33.8 million (2022: US$nil and 2021: US$nil) was
processed at Damang.
Carrying value of equity-accounted investees
The Group reviews and tests the carrying value of equity-accounted investees annually or when events or changes
in circumstances suggest that the carrying amount may not be recoverable by comparing the recoverable amounts
to these carrying values. If there are indications that impairment may have occurred, estimates are prepared of the
recoverable amount of the equity-accounted investee. The recoverable amounts are determined based on the
higher of value in use or FVLCOD. The FVLCOD is determined using the following methods:
•Using quoted market prices of other investors in the equity-accounted investee with appropriate adjustments
in order to derive the fair value; and
•A combination of the income and market approach. The income approach is based on the expected future cash
flows of the operations and the market approach is used to determine the value beyond proved and probable
reserves for the operation, using comparable market transactions.
Expected future cash flows used to determine the FVLCOD of equity-accounted investees are inherently uncertain
and could materially change over time. They are significantly impacted by a number of factors including reserves and
production estimates, together with economic factors such as gold and copper prices, discount rates, foreign
currency exchange rates, resource valuations (determined based on comparable market transactions or other
accepted valuation methods), estimates of costs to produce reserves and future capital expenditure. The key
assumptions used in the income and market approach for Asanko are as follows:
| | |
| | |
| | |
US$ Gold price per ounce – year 1 to 3 | | |
US$ Gold price per ounce – year 4 onwards | | |
| | |
| | |
The FVLCOD calculations are sensitive to the gold price assumption and the quoted market prices, a decrease or
increase in these two assumptions could materially change the FVLCOD.
On 21 December 2023, Gold Fields announced the divestment of its 45% shareholding in Asanko Gold (both the
preference shares and equity-accounted investee) to the joint venture partner Galiano Gold. As a result the sale
transaction, the investment in Asanko has been classified as an asset held for sale and the investment is required to
be measured at the lower of carrying value or fair value less costs to sell. Management determined the fair value less
costs to sell based on the consideration to be received per the sale agreement. The fair value has been allocated
first to the Asanko redeemable preference shares based on the fair value of the preference shares using the
expected redemption period. The residual amount after deducting the fair value of the preference shares from the
total fair value of the consideration was allocated to the Asanko equity-accounted investee, which resulted in an
impairment of US$46.9 million (2022: US$nil) for the year ended 31 December 2023. Refer note 14 for the
assumptions used in the determination of the fair values.
On 2 May 2023, Gold Fields, through a 100% held Canadian subsidiary, acquired a 50% interest in the Windfall
Project in Québec, Canada from Osisko Mining Incorporated. The Group has classified its interest in the Windfall
Project as a joint venture. Refer note 17 for key assumptions used in the valuation of the Windfall Project contingent
and exploration considerations.
Carrying value of equity-accounted investees
Refer to notes 14, 15, 17 and 18 for further details.
The carrying amount of equity-accounted investees at 31 December 2023 was US$548.6 million (2022: US$84.9 million)
Provision for environmental rehabilitation costs
The Group’s mining and exploration activities are subject to various laws and regulations governing the protection of
the environment. The Group recognises management’s best estimate for the provision of environmental rehabilitation
costs in the period in which they are incurred. Actual costs incurred in future periods could differ materially from the
estimates. Additionally, future changes to environmental laws and regulations, life-of-mine estimates and discount
rates could affect the carrying amount of this provision.
Refer to note 28.1 for details of key assumptions used to estimate the provision.
The carrying amounts of the provision for environmental rehabilitation costs at 31 December 2023 was
US$452.9 million (2022: US$387.7 million) of which US$46.8 million (2022: US$17.2 million) was classified
as current and US$406.1 million (2022: US$370.5 million) as non-current.
Provision for silicosis settlement costs
The Group has an obligation in respect of a settlement of the silicosis class action claims and related costs. The
Group recognises management’s best estimate for the provision of silicosis settlement costs.
The ultimate outcome of this matter however remains uncertain, with the number of eligible workers successfully
submitting claims and receiving compensation being uncertain. The provision is consequently subject to adjustment
in the future.
Refer to notes 28.3 and 38 for further details.
The carrying amounts of the provision for silicosis settlement costs at 31 December 2023 was US$5.1 million
(2022: US$10.5 million) of which US$0.2 million (2022: US$1.3 million) was classified as current and US$4.9 million
(2022: US$9.2 million) as non-current.
Income taxes
The Group is subject to income taxes in numerous jurisdictions. Significant judgement is required in determining the
liability for income taxes due to the complexity of legislation. There are many transactions and calculations for which
the ultimate tax determination is uncertain during the ordinary course of business. The Group recognises liabilities for
anticipated tax audit issues based on estimates of whether additional taxes will be due. Where the final tax outcome
of these matters is different from the amounts that were initially recorded, such differences will impact income tax and
deferred tax in the period in which such determination is made. Refer note 10 for further details.
The Group recognises the future tax benefits related to deferred income tax assets to the extent that it is probable
that the deductible temporary differences will reverse in the foreseeable future. Assessing the recoverability of
deferred income tax assets requires the Group to make significant estimates related to expectations of future taxable
income. Estimates of future taxable income are based on forecast cash flows from operations and the application of
existing tax laws in each jurisdiction. To the extent that future cash flows and taxable income differ significantly from
estimates, the ability of the Group to realise the net deferred tax assets recorded at the reporting date could be
impacted.
Additionally, future changes in tax laws in the jurisdictions in which the Group operates could limit the ability of the
Group to obtain tax deductions in future periods.
Refer to notes 26 and 34 for further details.
Carrying values at 31 December 2023:
•Deferred taxation liability: US$389.3 million (2022: US$399.8 million);
•Deferred taxation asset: US$172.2 million (2022: US$195.5 million);
•Taxation payable: US$95.7 million (2022: US$53.6 million); and
•Taxation receivable: US$82.1 million (2022: US$76.0 million).
Refer to note 10 for details of unrecognised deferred tax assets.
Accounting policies continued
1.Basis of preparation continued
Share-based payments
The Group issues equity-settled share-based payments to Executive Directors, certain officers and employees. The
fair value of these instruments is measured at grant date, using the Monte Carlo simulation valuation models, which
require assumptions regarding the estimated term of the option, share price volatility and expected dividend yield.
While Gold Fields’ management believes that these assumptions are appropriate, the use of different assumptions
could have an impact on the fair value of the option granted and the related recognition of the share-based
payments expense in the consolidated income statement. Gold Fields’ options have characteristics significantly
different from those of traded options and therefore fair values may also differ.
Refer to note 5 for further details.
The income statement charge for the year ended 31 December 2023 was US$9.1 million (2022: US$6.9 million and
2021: US$12.7 million).
Long-term incentive plan
The Group issues awards relating to its long-term incentive plan to certain employees. These awards are measured
on the date the award is made and re-measured at each reporting period. The portion of the award subject to
judgement is measured using the Monte Carlo simulation valuation model, which requires assumptions regarding the
share price volatility and expected dividend yield. The assumptions, supporting the estimated amount expected to
be paid, are reviewed at each reporting date. While Gold Fields’ management believes that these assumptions are
appropriate, the use of different assumptions could have an impact on the measurement of the awards and the
related recognition of the compensation expense in profit or loss.
Refer to note 29 for inputs used in the Monte Carlo simulation valuation model and for further details.
The charge for the year ended 31 December 2023 was US$55.8 million (2022: US$29.0 million and 2021:
US$28.5 million) and the balance at 31 December 2023 of the long-term cash incentive provision was
US$78.9 million (2022: US$53.0 million) of which US$38.4 million (2022: US$30.6 million) was classified as current
and US$40.5 million (2022: US$22.4 million) as non-current.
Financial instruments
Derivative financial instruments
The estimated fair value of financial instruments is determined at reporting date, based on the relevant market
information. The fair value is calculated with reference to market rates using industry valuation techniques and
appropriate models.
At 31 December 2023 and 2022, the carrying value of derivative financial instruments were US$nil as all hedges
matured. The income statement charge was US$nil (2022: gain of US$24.0 million and 2021: loss of US$100.4 million)
for the year ended 31 December 2023.
Refer note 41 for further details.
Asanko redeemable preference shares
Significant judgement is required in estimating life-of-mine cash flows used in determining the expected timing of the
cash flows for the repayment of the redeemable preference shares.
In order to estimate the life-of-mine model used in the valuation, estimates and assumptions are required about a
range of geological, technical and economic factors, including but not limited to quantities, grades, production
techniques, recovery rates, production costs, capital expenditure, transport costs, commodity demand, commodity
prices and exchange rates. Refer to the gold prices disclosed for the Asanko equity-accounted investee on page 98
and note 20 for key assumptions used.
The life-of-mine cash flows are sensitive to the gold price assumptions and an increase or decrease in the gold price
could materially change the valuations.
During 2023, the fair value of Asanko redeemable preference shares was written-up by US$33.0 million (2022:
written-down by US$37.3 million).
The fair value of the Asanko redeemable preference shares at 31 December 2023 was US$99.7 million (2022:
US$60.3 million). The Asanko redeemable preference shares were classified as held for sale at 31 December 2023.
Refer notes 14 and 15 for further details.
Contingencies
By their nature, contingencies will only be resolved when one or more future events occur or fail to occur. The
assessment of such contingencies inherently involves the exercise of significant judgement and estimates of the
outcome of future events. Such contingencies include, but are not limited to, environmental obligations, litigation,
regulatory proceedings, tax matters and losses resulting from other events and developments.
When a loss is considered probable and reasonably estimable, a liability is recorded based on the best estimate of
the ultimate loss. The likelihood of a loss with respect to a contingency can be difficult to predict and determining a
meaningful estimate of the loss or a range of losses may not always be practicable based on the information
available at the time and the potential effect of future events and decisions by third parties that will determine the
ultimate resolution of the contingency. It is not uncommon for such matters to be resolved over many years, during
which time relevant developments and new information is continuously evaluated to determine both the likelihood of
any potential loss and whether it is possible to reasonably estimate a range of possible losses. When a loss is
probable but a reasonable estimate cannot be made, disclosure is provided.
Refer to note 38 for details on contingent liabilities.
2.Consolidation
2.1Business combinations
The acquisition method of accounting is used to account for business combinations by the Group. The consideration
transferred for the acquisition of a business is the fair value of the assets transferred, the liabilities incurred and the
equity interests issued by the Group. The consideration transferred includes the fair value of any asset or liability
resulting from a contingent consideration arrangement. Acquisition-related costs are expensed as incurred, other
than those associated with the issue of debt or equity securities. Identifiable assets acquired and liabilities and
contingent liabilities assumed in a business combination are measured initially at their fair values at the acquisition
date. On an acquisition-by-acquisition basis, the Group recognises any non-controlling interest in the acquiree either
at fair value or at the non-controlling interest’s proportionate share of the acquiree’s net identifiable assets.
Subsequently, the carrying amount of non-controlling interest is the amount of the interest at initial recognition plus
the non-controlling interest’s share of the subsequent changes in equity.
The excess of the consideration transferred, the amount of any non-controlling interest in the acquiree and the
acquisition date fair value of any previous equity interest in the acquiree over the fair value of the identifiable net
assets acquired is recorded as goodwill. If this is less than the fair value of the net assets of the subsidiary acquired,
the difference is recognised directly in profit or loss.
If a transaction does not meet the definition of a business under IFRS Accounting Standards, the transaction is
recorded as an asset acquisition. Accordingly, the identifiable assets acquired and liabilities assumed are measured
at the fair value of the consideration paid, based on their relative fair values at the acquisition date. Acquisition-
related costs are included in the consideration paid and capitalised. Any contingent consideration payable that is
dependent on the purchaser’s future activity is not included in the consideration paid until the activity requiring the
payment is performed. Any resulting future amounts payable are recognised in profit or loss when incurred. No
goodwill and no deferred tax asset or liability arising from the assets acquired and liabilities assumed are recognised
upon the acquisition of assets.
2.2Subsidiaries
Subsidiaries are all entities controlled by the Group. The Group controls an entity when it is exposed to, or has rights
to, variable returns from its involvement with the entity and has the ability to affect those returns through its power
over the relevant activities of the entity. Subsidiaries are fully consolidated from the date on which control is
transferred to the Group until the date on which control ceases.
Inter-company transactions, balances and unrealised gains and losses on transactions between Group companies
are eliminated. Accounting policies of subsidiaries have been changed where necessary to ensure consistency with
the policies adopted by the Group.
2.3Transactions with non-controlling interests
The Group treats transactions with non-controlling interests that do not result in loss of control as transactions with
equity owners of the Group. For purchases from non-controlling interests, the difference between any consideration
paid and the relevant share acquired of the carrying value of net assets of the subsidiary is recorded in equity. Gains
or losses on disposals to non-controlling interests are also recorded in equity.
Accounting policies continued
1.Basis of preparation continued
2.4Equity-accounted investees
The Group’s interests in equity-accounted investees comprise interests in associates and joint ventures.
Associates are those entities in which the Group has significant influence, but not control or joint control, over the
financial and operating policies. Joint ventures are arrangements in which the Group has joint control, whereby the
Group has rights to the net assets of the arrangement, rather than rights to its assets and obligations for its liabilities.
Interests in associates and joint ventures are accounted for using the equity method. They are recognised initially at
cost, which includes transaction costs and an estimate of any contingent and other considerations. Subsequent to
initial recognition and until the date on which significant influence or joint control ceases, the consolidated financial
statements include the Group’s share of the profit or loss and other comprehensive income of equity-accounted
investees, as well changes in the contingent and other considerations.
Results of associates and joint ventures are equity-accounted using the results of their most recent financial
information. Any losses from associates or joint ventures are brought to account in the consolidated financial
statements until the interest in such associates or joint ventures is written down to zero. Thereafter, losses are
accounted for only insofar as the Group is committed to providing financial support to such associates or joint
ventures.
The carrying value of an investment in associate and joint ventures represents the cost of the investment, including
goodwill where relevant, a share of the post-acquisition retained earnings and losses, any other movements in
reserve, any accumulated impairment losses, changes in value of the contingent and other considerations and other
adjustments to align with Gold Fields accounting policies. The Group applies IFRS 9 to long-term interests in an
associate or joint venture that form part of the net investment in the associate or joint venture but to which the equity
method is not applied. The carrying value is assessed annually for existence of indicators of impairment and if such
exist, the carrying amount is compared to the recoverable amount, being the higher of value in use or fair value less
cost of disposal. If an impairment in value has occurred, it is recognised in profit or loss in the period in which the
impairment arose.
2.5Joint operations
A joint operation is a joint arrangement whereby the parties that have joint control of the arrangement have rights to
the use of assets and obligations for the liabilities of the arrangement. The Group accounts for activities under joint
operations by recognising in relation to the joint operation, the assets it controls and the liabilities it incurs, the
expenses it incurs and the revenue from the sale or use of its share of the joint operations’ output.
3.Foreign currencies
3.1Functional and presentation currency
Items included in the financial statements of each of the Group entities are measured using the currency of the
primary economic environment in which the entity operates (“the functional currency”). The consolidated financial
statements are presented in US Dollar, which is the Group’s presentation currency. The functional currency of the
parent company is South African Rand.
3.2Transactions and balances
Foreign currency transactions are translated into the functional currency using the exchange rates prevailing at the
dates of the transactions. Foreign exchange gains and losses resulting from the settlement of such transactions,
and from the translation of monetary assets and liabilities denominated in foreign currencies, are recognised in profit
or loss.
3.3Foreign operations
The results and financial position of all the Group entities (none of which has the currency of a hyperinflationary
economy) that have a functional currency different from the presentation currency are translated into the
presentation currency as follows:
Assets and liabilities are translated at the exchange rate ruling at the reporting date (ZAR/US$: 18.30; US$/A$: 0.68;
US$/C$: 0.75 (2022: ZAR/US$: 17.02; US$/A$: 0.69 and 2021: ZAR/US$: 15.94; US$/A$: 0.73)). Equity items are
translated at historical rates. The income and expenses are translated at the average exchange rate for the year
(ZAR/US$: 18.45; US$/A$: 0.66; US$/C$: 0.74 (2022: ZAR/US$: 16.37; US$/A$: 0.68 and 2021: ZAR/US$: 14.79; US$/
A$: 0.75)), unless this average was not a reasonable approximation of the rates prevailing on the transaction dates, in
which case these items were translated at the rate prevailing on the date of the transaction. Exchange differences on
translation are accounted for in other comprehensive income. These differences will be recognised in profit or loss
upon realisation of the underlying operation.
3.3Foreign operations continued
On consolidation, exchange differences arising from the translation of the net investment in foreign operations (i.e.
the reporting entity’s interest in the net assets of that operation), and of borrowings and other currency instruments
designated as hedges of such investments, are taken to other comprehensive income. When a foreign operation is
sold, exchange differences that were recorded in other comprehensive income are recognised in profit or loss as
part of the gain or loss on disposal. If the Group disposes of part of its interest in a subsidiary but retains control, then
the relevant proportion of the cumulative amount is re-attributed to non-controlling interests. When the Group
disposes of only part of an associate or joint venture while retaining significant influence or joint control, the relevant
proportion of the cumulative amount is reclassified to profit or loss.
Goodwill and fair value adjustments arising on the acquisition of a foreign operation are treated as assets and
liabilities of the foreign operation and are translated at each reporting date at the closing rate.
4.Property, plant and equipment
4.1Mine development and infrastructure
Mining assets, including mine development and infrastructure costs and mine plant facilities, are recorded at cost less
accumulated depreciation and accumulated impairment losses.
Expenditure incurred to evaluate and develop new orebodies, to define mineralisation in existing orebodies and to
establish or expand productive capacity, is capitalised until commercial levels of production are achieved, at which
times the costs are amortised as set out below.
Development of orebodies includes the development of shaft systems and waste rock removal that allows access to
reserves that are economically recoverable in the future. Subsequent to this, costs are capitalised if the criteria for
recognition as an asset are met.
4.2Borrowing costs
Borrowing costs incurred in respect of assets requiring a substantial period of time to prepare for their intended
future use are capitalised to the date that the assets are substantially completed.
Borrowing costs capitalised are included in finance expense and adjusted for in cash generated from operating
activities in the statement of cash flows.
4.3Mineral and surface rights
Mineral and surface rights are recorded at cost less accumulated amortisation and accumulated impairment losses.
When there is little likelihood of a mineral right being exploited, or the recoverable amount of mineral rights has
diminished below cost, an impairment loss is recognised in profit or loss in the year that such determination is made.
4.4Land
Land is shown at cost and accumulated impairment losses and is not depreciated.
4.5Other assets
Non-mining assets are recorded at cost less accumulated depreciation and accumulated impairment losses. These
assets include the assets of the mining operations not included in mine development and infrastructure, borrowing
costs, mineral and surface rights and land and all the assets of the non-mining operations.
4.6Amortisation and depreciation of mining assets
Amortisation and depreciation is determined to give a fair and systematic charge to profit or loss taking into account
the nature of a particular ore body and the method of mining that ore body. To achieve this, the following calculation
methods are used:
•Mining assets, including mine development and infrastructure costs, mine plant facilities and evaluation costs, are
amortised over the life of the mine using the units-of-production method, based on estimated proved and probable
ore reserves;
•Stripping activity assets are amortised on a units-of-production method, based on the estimated proved and
probable ore reserves of the ore body to which the assets relate; and
•The mineral rights asset at the Australian operations are divided at the respective operations into a depreciable
and a non-depreciable component. The mineral rights asset is initially capitalised to the mineral rights asset as a
non-depreciable component.
Subsequently, and on an annual basis, as part of the preparation of the updated reserve and resource statement and
preparation of the updated life-of-mine plan, a portion of resources will typically be converted to reserves as a result
of ongoing resource definition drilling, resultant geological model updates and subsequent mine planning. Based on
this conversion of resources to reserves a portion of the historic cost is allocated from the non-depreciable
component of the mineral rights asset to the depreciable component of the mineral rights asset. Therefore, the
category of non-depreciable mineral rights asset is expected to reduce and will eventually be fully allocated within
the depreciable component of the mineral rights asset.
Accounting policies continued
1.Basis of preparation continued
4.6Amortisation and depreciation of mining assets continued
Each operation typically comprises a number of mines and the depreciable component of the mineral rights asset is
therefore allocated on a mine-by-mine basis at the operation and is transferred at this point to mine development
and infrastructure and is then amortised over the estimated proved and probable ore reserves of the respective mine
on the units-of-production method. The remaining non-depreciable component of the mineral rights asset is not
amortised but, in combination with the depreciable component of the mineral rights asset and other assets included
in the CGU, is evaluated for impairment when events and changes in circumstances indicate that the carrying amount
may not be recoverable.
Proved and probable ore reserves reflect estimated quantities of economically recoverable reserves, which can be
recovered in future from known mineral deposits.
Certain mining plant and equipment included in mine development and infrastructure is depreciated on a straight-line
basis over the lesser of their estimated useful lives or life-of-mine.
4.7Depreciation of non-mining assets
Non-mining assets are recorded at cost and depreciated on a straight-line basis over their current expected useful
lives to their residual values. The assets’ useful lives, depreciation methods and residual values are reassessed at
each reporting date and adjusted if appropriate.
4.8Depreciation of right-of-use assets
The right-of-use assets are depreciated over the shorter of the lease term and the useful life of the right-of-use asset,
using the straight-line method from the commencement date to the end of the lease term, unless the lease transfers
ownership of the underlying asset to the Group by the end of the lease term or the cost of the right-of-use asset
reflects that the Group will exercise a purchase option. In that case the right-of-use assets are depreciated over the
useful life of the underlying asset. In addition, the right-of-use asset is periodically reduced by impairment losses, if
any, and adjusted for certain re-measurements of the lease liability.
4.9Mining exploration
Expenditure on advances solely for exploration activities is charged against profit or loss until the viability of the
mining venture has been proven. Expenditure incurred on exploration “farm-in” projects is written off until an
ownership interest has vested. Exploration expenditure to define mineralisation at existing ore bodies is considered
mine development costs and is capitalised until commercial levels of production are achieved.
Exploration activities at certain of the Group’s non-South African operations are broken down into defined areas
within the mining lease boundaries. These areas are generally defined by structural and geological continuity.
Exploration costs in these areas are capitalised to the extent that specific exploration programmes have yielded
targets and/or results that warrant further exploration in future years.
4.10Impairment
Recoverability of the carrying values of long-term assets or CGUs of the Group are reviewed annually or whenever
events or changes in circumstances indicate that such carrying values may not be recoverable. To determine
whether a long-term asset or CGU may be impaired, the higher of “value in use” (defined as: “the present value of
future cash flows expected to be derived from an asset or CGU”) or “fair value less costs of disposal” (defined as
“the price that would be received to sell an asset or paid to transfer a liability in an orderly transaction between
market participants at the measurement date”) is compared to the carrying value of the asset/CGU. Impairment losses
are recognised in profit or loss.
A CGU is defined by the Group as the smallest identifiable group of assets that generates cash inflows that are
largely independent of the cash inflows from other assets or groups of assets. Generally for the Group this
represents an individual operating mine, including mines which are part of a larger mine complex. The costs
attributable to individual shafts/pits of a mine are impaired if the shaft/pit is closed/depleted.
Exploration targets in respect of which costs have been capitalised at certain of the Group’s international operations
are evaluated on an annual basis to ensure that these targets continue to support capitalisation of the underlying
costs. Those that do not are impaired.
When any infrastructure is closed down during the year, any carrying value attributable to that infrastructure is
impaired.
4.11Gain or loss on disposal of property, plant and equipment
Any gain or loss on disposal of property, plant and equipment (calculated as the net proceeds from disposal less the
carrying amount of the item) is recognised in profit or loss.
4.12Leases
At inception of a contract, the Group assesses whether a contract is, or contains, a lease. A contract is, or contains,
a lease if the contract conveys the right to control the use of an identified asset for a period of time in exchange for
a consideration.
The Group recognises a right-of-use asset and a lease liability at the lease commencement date. The right-of-use
asset is initially measured at cost, which comprises the initial amount of the lease liability adjusted for any lease
payments made at or before the commencement date, plus any initial direct costs incurred and an estimate of costs
to dismantle and remove the underlying asset or to restore the underlying asset or the site on which it is located, less
any lease incentives received. Subsequent to initial recognition, the right-of-use asset is accounted for in accordance
with the accounting policy applicable to that asset.
The lease liability is initially measured at the present value of the lease payments that are not paid at the
commencement date, discounted using the interest rate implicit in the lease or, if that rate cannot be readily
determined, the Group’s incremental borrowing rate. Generally, the Group uses its incremental borrowing rate as
the discount rate.
The Group determines its incremental borrowing rate by obtaining interest rates from various external financing
sources and makes certain adjustments to reflect the terms of the lease and type of the asset leased.
Subsequent to initial recognition, the lease liability is measured at amortised cost using the effective interest rate
method. It is re-measured when there is a change in future lease payments:
•If there is a change in the Group’s estimate of the amount expected to be payable under a residual value
guarantee;
•If the Group changes its assessment of whether it will exercise a purchase, extension or termination option;
•If there is a revised in-substance fixed lease payment; and
•If there is a change in future lease payments resulting from a change in an index or a rate used to determine these
payments.
When the lease liability is re-measured in this way, a corresponding adjustment is made to the carrying amount of
the right-of-use asset, or is recorded in profit or loss if the carrying amount of the right-of-use asset has been
reduced to zero.
The Group has elected not to recognise right-of-use assets and lease liabilities for leases of low-value assets and
short-term leases. The Group recognises the lease payments associated with these leases as an expense on a
straight-line basis over the lease term. Low-value assets relate mainly to cellphones, computer equipment and
photocopiers.
4.13Deferred stripping
Production stripping costs in a surface mine are capitalised to property, plant and equipment if, and only if, all of the
following criteria are met:
•It is probable that the future economic benefit associated with the stripping activity will flow to the entity;
•The entity can identify the component of the ore body for which access has been improved; and
•The costs relating to the stripping activity associated with that component can be measured reliably.
If the above criteria are not met, the stripping costs are recognised directly in profit or loss.
The Group initially measures the stripping activity asset at cost, this being the accumulation of costs directly incurred
to perform the stripping activity that improves access to the identified component of ore.
After initial recognition, the stripping activity asset is carried at cost less accumulated amortisation and accumulated
impairment losses.
Accounting policies continued
5.Taxation
Income tax expense comprises current and deferred tax. Current tax and deferred tax are recognised in profit or loss
except to the extent that it relates to a business combination, or items recognised directly in equity or in other
comprehensive income.
Current tax is measured on taxable income at the applicable statutory rate substantively enacted at the reporting date.
Interest and penalties are accounted for in current tax.
Deferred taxation is provided on temporary differences existing at each reporting date between the tax values of
assets and liabilities and their carrying amounts. Substantively enacted tax rates are used to determine future
anticipated tax rates which in turn are used in the determination of deferred taxation.
Deferred taxation is not recognised for temporary differences on the initial recognition of assets or liabilities in a
transaction that is not a business combination and that affects neither accounting nor taxable profit or loss and
taxable temporary differences arising on the initial recognition of goodwill.
The measurement of deferred tax reflects the tax consequences that would follow the manner in which the Group
expects, at the end of the reporting period, to recover or settle the carrying amount of its assets and liabilities.
These temporary differences are expected to result in taxable or deductible amounts in determining taxable profits
for future periods when the carrying amount of the asset is recovered or the liability is settled.
Deferred tax liabilities are generally recognised for all taxable temporary differences. Deferred tax liabilities are
recognised for taxable temporary differences arising on investments in subsidiaries and equity-accounted investees
except where the reversal of the temporary difference can be controlled and it is probable that the difference will not
reverse in the foreseeable future.
Deferred tax assets relating to the carry forward of unutilised tax losses and/or deductible temporary differences are
recognised to the extent it is probable that future taxable profit will be available against which the unutilised tax
losses and/or deductible temporary differences can be recovered. Deferred tax assets are reviewed at each
reporting date and are adjusted if recovery is no longer probable.
Deferred tax assets and liabilities are offset if there is a legally enforceable right to offset current tax liabilities and
assets, and they relate to taxes levied by the same tax authority on the same taxable entity, or on different tax
entities, but they intend to settle current tax liabilities and assets on a net basis or their tax assets and liabilities will
be realised simultaneously.
When assessing uncertain tax positions, the Group considers whether it is probable that the relevant authority will
accept each tax treatment, or group of tax treatments, that the Group used or plans to use in its income tax filing.
Except for Tarkwa, Damang and Cerro Corona, no provision is made for any potential taxation liability on the
distribution of retained earnings by Group companies as it is probable that the related taxable temporary differences
will not reverse in the foreseeable future.
6.Inventories
Inventories are valued at the lower of cost and net realisable value. Gold on hand represents production on hand
after the smelting process.
Cost is determined on the following basis:
•Gold on hand and gold in process is valued using weighted average cost. Cost includes production, amortisation
and related administration costs;
•Heap leach and stockpile inventories are valued using weighted average cost. Cost includes production,
amortisation and direct administration costs. The cost of materials on the heap leach and stockpiles, from which
metals are expected to be recovered in a period longer than 12 months is classified as non-current assets; and
•Consumable stores are valued at weighted average cost, after appropriate provision for redundant and slow-
moving items.
Net realisable value is determined with reference to relevant market prices or the estimated future sales price of the
product if it is expected to be realised in the long term.
7.Financial instruments
7.1Non-derivative financial instruments
Recognition and initial measurement
Trade receivables are initially recognised when they are originated. All other financial assets and financial liabilities
are initially recognised when the Group becomes a party to the contractual provisions of the instrument. A financial
asset or financial liability is initially measured at fair value plus, for an item not at fair value through profit or loss
(“FVTPL”), transaction costs that are directly attributable to its acquisition or issue. A trade receivable without a
significant financing component is initially measured at the transaction price.
Classification and subsequent measurement
Financial assets – Classification policy
On initial recognition, an equity instrument is either classified as fair value through other comprehensive income
(“FVOCI”) if an irrevocable election is made or FVTPL.
On initial recognition, a debt instrument is classified as:
•Amortised cost;
•FVOCI; or
•FVTPL.
A financial asset is measured at amortised cost if it meets both of the following conditions and is not designated as
at FVTPL:
•It is held with a business model whose objective is to collect contractual cash flows; and
•Its contractual terms give rise on specified dates to cash flows that are solely payments of principal and interest
on the principal amount outstanding.
An investment is measured at FVOCI if it meets both of the following conditions and is not designated as at FVTPL:
•It is held with a business model whose objective is achieved by both collecting contractual cash flows and selling
financial assets; and
•Its contractual terms give rise on specified dates to cash flows that are solely payments of principal and interest
on the principal amount outstanding.
All financial assets not classified as measured at amortised cost or FVOCI as described above are measured at
FVTPL. This includes all derivative financial assets.
Financial assets – Measurement policy
| | |
| | |
Financial assets at amortised cost | | These assets are subsequently measured at amortised cost using the effective interest method. The amortised cost is reduced by impairment losses. Interest income, foreign exchange gains and losses and impairment are recognised in profit or loss. Any gain or loss on derecognition is recognised in profit or loss. |
Equity investments at FVOCI | | These assets are subsequently measured at fair value. Dividends are recognised as income in profit or loss unless the dividend clearly represents a recovery of part of the cost of the investment. Other net gains and losses are recognised in OCI and are never reclassified to profit or loss. |
| | These assets are subsequently measured at fair value. Net gains and losses, including any interest or dividend income, are recognised in profit or loss. |
Financial assets – Classification of financial assets
The following information is considered by the Group in determining the classification of financial assets:
•The Group’s business model for managing financial assets; and
•The contractual cash flow characteristics of the financial assets.
Accounting policies continued
7.Financial instruments continued
7.1Non-derivative financial instruments continued
Financial assets – Classification of financial assets continued
The business model assessment of the financial assets is based on the Group’s strategy and rationale for holding the
financial assets on a portfolio level. When considering the strategy, the following is considered:
•Whether the financial assets are held to collect contractual cash flows;
•Whether the financial assets are held for sale; and
•Whether the financial assets are held for both collecting contractual cash flows and to be sold.
Financial assets – Assessment of contractual cash flows
In assessing whether the contractual cash flows are solely payments of principal and interest, the Group considers
the contractual terms of the instrument. This includes assessing whether the financial asset contains a contractual
term that could change the timing or amount of contractual cash flows such that it would not meet this condition.
Financial liabilities – Classification, subsequent measurement and gains and losses
Financial liabilities are classified as measured at amortised cost or FVTPL. A financial liability is classified as at FVTPL
if it is classified as held-for-trading, it is a derivative or it is designated as such on initial recognition. Financial liabilities
at FVTPL are measured at fair value and net gains and losses, including any interest expense, are recognised in
profit or loss. Other financial liabilities are subsequently measured at amortised cost using the effective interest
method. Interest expense and foreign exchange gains and losses are recognised in profit or loss. Any gain or loss on
derecognition is also recognised in profit or loss.
Impairment
The Group recognises loss allowances for expected credit losses (“ECLs”) on financial assets measured at amortised
cost. When determining whether the credit risk of a financial asset has increased significantly since initial recognition
and when estimating ECLs, the Group considers reasonable and supportable information that is relevant and
available without undue cost or effort. This includes both quantitative and qualitative information and analysis, based
on the Group’s historical experience and informed credit assessment and including forward-looking information. The
maximum period considered when estimating ECLs is the maximum contractual period over which the Group is
exposed to credit risk.
ECLs are a probability-weighted estimate of credit losses. Credit losses are measured as the present value of all cash
shortfalls (i.e. the difference between the cash flows due to the entity in accordance with the contract and the cash
flows that the Group expects to receive). At each reporting date, the Group assesses whether financial assets carried
at amortised cost are credit impaired. A financial asset is “credit impaired” when one or more events that have a
detrimental impact on the estimated future cash flows of the financial asset have occurred.
Derecognition of financial instruments
The Group derecognises a financial asset when the contractual rights to the cash flows from the financial asset
expire, or it transfers the rights to receive the contractual cash flows in a transaction in which substantially all of the
risks and rewards of ownership of the financial asset are transferred or in which the Group neither transfers nor
retains substantially all of the risks and rewards of ownership and it does not retain control of the financial asset.
The Group derecognises a financial liability when its contractual obligations are discharged or cancelled, or expire.
The Group also derecognises a financial liability when its terms are modified and the cash flows of the modified
liability are substantially different, in which case a new financial liability based on the modified terms is recognised at
fair value. On derecognition of a financial liability, the difference between the carrying amount extinguished and the
consideration paid (including any non-cash assets transferred or liabilities assumed) is recognised in profit or loss.
7.1.1Investments
Investments comprise listed and unlisted equity instruments and listed bonds which are designated at FVOCI and are
accounted for at fair value, with unrealised gains and losses subsequent to initial recognition recognised in other
comprehensive income and included in other reserves. Profit or loss realised when investments are sold or impaired
are never reclassified to profit or loss.
Purchases and sales of investments are recognised on the trade date, which is the date that the Group commits to
purchase or sell the asset. Cost of purchase includes transaction costs. The fair value of listed investments is based
on quoted bid prices.
On disposal or impairment of financial assets classified at FVOCI, cumulative unrealised gains and losses previously
recognised in other comprehensive income are included in determining the profit or loss on disposal, or the
impairment charge relating to, that financial asset, respectively, which is recognised in other comprehensive income.
7.1.2Cash and cash equivalents
Cash comprises cash on hand and demand deposits and cash equivalents are short-term, highly liquid investments
readily convertible to known amounts of cash and subject to insignificant risk of changes in value and are measured
at amortised cost which is deemed to be fair value as they have a short-term maturity.
Bank overdrafts are included within current liabilities in the statement of financial position and within cash and cash
equivalents in the statement of cash flows.
7.1.3Trade receivables
Trade receivables are carried at amortised cost less ECLs using the Group’s business model for managing its
financial assets, except for trade receivables from provisional copper and gold concentrate. The trade receivables
from provisional copper and gold concentrate sales are carried at fair value through profit or loss and are marked-to-
market at the end of each period until final settlement occurs, with changes in fair value classified as provisional price
adjustments and included as a component of revenue.
7.1.4Environmental trust funds
The environmental trust funds comprise mainly term deposits which are recognised at amortised cost less ECLs
using the Group’s business model for managing its financial assets.
7.1.5Trade payables
Trade payables are recognised at amortised cost using the effective interest method.
7.1.6Borrowings
Borrowings are recognised initially at fair value, net of transaction costs incurred, where applicable and subsequently
measured at amortised cost using the effective interest method.
Borrowings are classified as current liabilities unless the Group has an unconditional right to defer settlement of the
liability for at least 12 months after the reporting date.
Interest payable on borrowings is recognised in profit or loss over the term of the borrowings using the effective
interest method. Finance expense comprises interest on borrowings and environmental rehabilitation costs offset by
interest capitalised on qualifying assets.
Cash flows from interest paid are classified under operating activities in the statement of cash flows.
7.2Derivative financial instruments
The Group may from time to time establish currency and/or interest rate and/or commodity financial instruments to
protect underlying cash flows.
Derivative financial instruments are initially recognised at fair value and subsequently re-measured to their fair value
with changes therein recognised in profit or loss.
Accounting policies continued
8.Provisions
Provisions are recognised when the Group has a present legal or constructive obligation resulting from past events
and it is probable that an outflow of resources embodying economic benefits will be required to settle the obligation
and a reliable estimate can be made of the amount of the obligation.
9.Provision for environmental rehabilitation costs
Long-term provisions for environmental rehabilitation costs are based on the Group’s environmental management
plans, in compliance with applicable environmental and regulatory requirements.
Rehabilitation work can include facility decommissioning and dismantling, removal or treatment of waste materials,
site and land rehabilitation, including compliance with and monitoring of environmental regulations, security and
other site-related costs required to perform the rehabilitation work and operations of equipment designed to reduce
or eliminate environmental effects.
Full provision is made based on the net present value of the estimated cost of restoring the environmental
disturbance that has occurred up to the reporting date. The unwinding of the obligation is accounted for in profit
or loss.
The estimated costs of rehabilitation are reviewed annually and adjusted as appropriate for changes in legislation,
technology or other circumstances. Cost estimates are not reduced by the potential proceeds from the sale of assets
or from plant clean up at closure.
Changes in estimates are capitalised or reversed against the relevant asset, except where a reduction in the
provision is greater than the remaining net book value of the related asset, in which case the value is reduced to nil
and the remaining adjustment is recognised in profit or loss. In the case of closed sites, changes in estimates and
assumptions are recognised in profit or loss. Estimates are discounted at the pre-tax risk-free rate in the jurisdiction
of the obligation.
Increases due to additional environmental disturbances are capitalised and amortised over the remaining lives of the
mines. These increases are accounted for on a net present value basis.
For the South African and Ghanaian operations, annual contributions are made to a dedicated rehabilitation trust fund
and dedicated bank account, respectively, to fund the estimated cost of rehabilitation during and at the end of the
life-of-mine. The amounts contributed to this trust fund/bank account are included under non-current assets. Interest
earned on monies paid to rehabilitation trust fund/bank account is accrued on a time proportion basis and is
recorded as interest income.
In respect of the South African, Ghanaian and Peruvian operations, bank and other guarantees are provided for
funding of the environmental rehabilitation obligations. Refer to financial instruments accounting policy 7.1.4
Environmental trust fund and note 37 of the consolidated financial statements.
10.Employee benefits
10.1Short-term employee benefits
Short-term employee benefits are expensed as the related service is provided. A liability is recognised for the
amount expected to be paid if the Group has a present legal or constructive obligation to pay this amount as a result
of past service provided by the employee and the obligation can be estimated reliably.
10.2Pension and provident funds
The Group operates a defined contribution retirement plan and contributes to a number of industry-based defined
contribution retirement plans. The retirement plans are funded by payments from employees and Group companies.
Contributions to defined contribution funds are recognised as an employee benefit expense in profit or loss in the
periods during which related services are rendered by employees.
10.3Share-based payments
The Group operates an equity-settled compensation plan. The fair value of the equity-settled instruments is
measured by reference to the fair value of the equity instrument granted which in turn is determined using Monte
Carlo simulation models on the date of grant.
Fair value is based on market prices of the equity-settled instruments granted, if available, taking into account the
terms and conditions upon which those equity-settled instruments were granted. Fair value of equity-settled
instruments granted is estimated using appropriate valuation models and appropriate assumptions at grant date.
Non-market vesting conditions (service period prior to vesting) are not taken into account when estimating the fair
value of the equity-settled instruments at grant date. Market conditions are taken into account in determining the fair
value at grant date.
The fair value of the equity-settled instruments is recognised as an employee benefit expense over the vesting
period based on the Group’s estimate of the number of instruments that will eventually vest, with a corresponding
increase in equity. Vesting assumptions for non-market conditions are reviewed at each reporting date to ensure
they reflect current expectations.
Where the terms of an equity-settled award are modified, the originally determined expense is recognised as if the
terms had not been modified. In addition, an expense is recognised for any modification, which increases the total
fair value of the share-based payment arrangement, or is otherwise beneficial to the participant as measured at the
date of the modification.
10.4Long-term incentive plan
The Group operates a long-term incentive plan.
The Group’s net obligation in respect of the long-term incentive plan is the amount of future benefit that employees
have earned in return for their services in the current and prior periods. That benefit is estimated using appropriate
assumptions and is discounted to determine its present value at each reporting date. Re-measurements are
recognised in profit or loss in the period in which they arise.
10.5Termination benefits
Termination benefits are payable when employment is terminated by the Group before the normal retirement date,
or whenever an employee accepts voluntary redundancy in exchange for these benefits. Termination benefits are
expensed at the earlier of the date the Group can no longer withdraw the offer of those benefits or the date the
Group recognises costs for a restructuring. Benefits falling due more than 12 months after the reporting date are
discounted to present value.
Accounting policies continued
11.Stated capital
11.1Ordinary share capital
Ordinary shares are classified as equity. Incremental costs directly attributable to the issue of ordinary shares are
recognised as a deduction from equity, net of any tax effects.
11.2Repurchase and reissue of share capital
When share capital recognised as equity is repurchased, the amount of the consideration paid, which includes
directly attributable costs, net of any tax effects, is recognised as a deduction from equity. Repurchased shares are
classified as treasury shares and are deducted from equity. When treasury shares are sold or reissued subsequently,
the amount received is recognised as an increase in equity, and the resulting surplus or deficit on the transaction is
presented in share premium.
12.Revenue from contracts with customers
The Group recognises revenue when control over its gold, copper and silver is transferred to the customer. The price
is determined by market forces (commodity price and exchange rates). Revenue is measured based on the
consideration specified in a contract with the customer.
Customers obtain control of gold, copper and silver on the settlement date. In Peru, customers obtain control of
copper and gold concentrate on the shipment date. Copper and gold concentrate revenue is calculated, net of
refining and treatment charges, on a best estimate basis on shipment date, using forward metal prices to the
estimated final pricing date, adjusted for the specific terms of the agreements. Variations between the price recorded
at the shipment date and the actual final price received are caused by changes in prevailing copper and gold prices.
Changes in the fair value as a result of changes in the forward metal prices are classified as provisional price
adjustments and included as a component of revenue.
13.Investment income
Investment income comprises interest income on funds invested and dividend income from listed and unlisted
investments.
Investment income is recognised to the extent that it is probable that economic benefits will flow to the Group and
the amount of investment income can be reliably measured. Investment income is stated at the fair value of the
consideration received or receivable.
13.1Dividend income
Dividends are recognised in profit or loss when the right to receive payment is established.
13.2Interest income
Interest income is recognised in profit or loss using the effective interest rate method. The effective interest rate is
the rate that exactly discounts estimated future cash payments or receipts through the expected life of the financial
instrument to the gross carrying amount of the financial asset or amortised cost of the financial liability.
Cash flows from dividends and interest received are classified under operating activities in the statement of
cash flows.
14.Dividends declared
Dividends and the related taxation thereon are recognised only when such dividends are declared.
Dividends withholding tax is a tax on shareholders receiving dividends and is applicable to all dividends paid, except
dividends paid to South African resident companies, South African retirement funds and other prescribed exempt
taxpayers. The Group withholds dividends tax on behalf of its shareholders at a rate of 20% on dividends paid.
Amounts withheld are not recognised as part of the Group’s tax charge but rather as part of the dividend paid
recognised directly in equity.
Cash flows from dividends paid are classified under operating activities in the statement of cash flows.
15.Earnings per share
The Group presents basic and diluted earnings per share. Basic earnings per share is calculated based on the profit
attributable to ordinary shareholders divided by the weighted average number of ordinary shares in issue during the
period. Diluted earnings per share is determined by adjusting the profit attributable to ordinary shareholders, if
applicable, and the weighted average number of ordinary shares in issue for ordinary shares that may be issued in
the future.
16.Non-current assets held for sale
Non-current assets (or disposal groups) comprising assets and liabilities, are classified as held for sale if it is highly
probable they will be recovered primarily through sale rather than through continuing use. These assets may be a
component of an entity, a disposal group or an individual non-current asset.
Non-current assets held for sale are stated at the lower of carrying amount and fair value less costs to sell. Once
classified as held for sale or distribution, property, plant and equipment is no longer amortised or depreciated.
17.Discontinued operations
Classification as a discontinued operation occurs on disposal or when the operation meets the criteria to be
classified as held-for-sale (refer accounting policy 16), if earlier. When an operation is classified as a discontinued
operation, the comparative income statement, statement of comprehensive income, statement of changes in equity
and statement of cash flows are re-presented as if the operation had been discontinued from the start of the
comparative period.
18.Segmental reporting
Operating segments are reported in a manner consistent with the internal reporting provided to the chief operating
decision-maker (“CODM”) and is based on individual mining operations. The CODM, who is responsible for allocating
resources and assessing performance of the operating segments, has been identified as the Executive Committee
that makes strategic decisions. The Group’s segmental profit measure is profit for the year.
Consolidated income statement
for the year ended 31 December 2023
| | | | |
| | |
Figures in millions unless otherwise stated | | | | |
| | | | |
| | | | |
| | | | |
| | | | |
| | | | |
| | | | |
Gain/(loss) on financial instruments | | | | |
Foreign exchange (loss)/gain | | | | |
| | | | |
| | | | |
| | | | |
| | | | |
Share of results of equity accounted investees, net of tax | | | | |
| | | | |
| | | | |
| | | | |
Silicosis settlement costs | | | | |
Impairment of investments and assets | | | | |
Ghana expected credit loss | | | | |
Profit on disposal of assets | | | | |
Profit before royalties and taxation | | | | |
| | | | |
| | | | |
Mining and income taxation | | | | |
Profit from continuing operations | | | | |
| | | | |
(Loss)/profit from discontinued operation | | | | |
| | | | |
Profit/(loss) attributable to: | | | | |
| | | | |
| | | | |
| | | | |
Non-controlling interests | | | | |
| | | | |
| | | | |
| | | | |
Earnings/(loss) per share attributable to owners of the parent: | | | |
Basic earnings per share – cents | | | | |
Basic earnings per share from continuing operations – cents | | | | |
Basic (loss)/earnings per share from discontinued operation – cents | | | | |
Diluted earnings per share – cents | | | | |
Diluted earnings per share from continuing operations – cents | | | | |
Diluted (loss)/earnings per share from discontinued operation – cents | | | | |
| | | | |
The accompanying notes form an integral part of these financial statements.
Gold Fields Limited presents its income statement using the function method. Under the function method, investment income would have been disclosed under
other income, gain/(loss) on financial instruments and foreign exchange gain/(loss) under other income/(expenses) and share-based payments, long-term
incentive plan, impairment of investments and assets and Ghana expected credit loss under other expenses.
Consolidated statement of comprehensive income
for the year ended 31 December 2023
| | | | | | | |
| | | |
Figures in millions unless otherwise stated | | | | | | | |
| | | | | | | |
| | | | | | | |
Other comprehensive income, net of tax | | | | | | | |
Items that will not be reclassified to profit or loss | | | | | | | |
Equity investments from continuing operations at FVOCI – Net change in fair value | | | | | | | |
Equity investments from discontinued operation at FVOCI – Net change in fair value | | | | | | | |
| | | | | | | |
Items that may be reclassified subsequently to profit or loss | | | | | | | |
Foreign currency translation adjustments | | | | | | | |
| | | | | | | |
| | | | | | | |
Total comprehensive income for the year | | | | | | | |
| | | | | | | |
| | | | | | | |
| | | | | | | |
– Non-controlling interests | | | | | | | |
| | | | | | | |
The accompanying notes form an integral part of these financial statements.
Consolidated statement of financial position
at 31 December 2023
| | | | | |
| | | |
Figures in millions unless otherwise stated | | | | | |
| | | | | |
| | | | | |
| | | | | |
Property, plant and equipment | | | | | |
| | | | | |
Equity accounted investees | | | | | |
| | | | | |
Environmental trust funds | | | | | |
Loan advanced – contractor | | | | | |
| | | | | |
| | | | | |
| | | | | |
| | | | | |
Trade and other receivables | | | | | |
| | | | | |
Cash and cash equivalents | | | | | |
| | | | | |
| | | | | |
| | | | | |
| | | | | |
Equity attributable to owners of the parent | | | | | |
| | | | | |
| | | | | |
| | | | | |
Non-controlling interests | | | | | |
| | | | | |
| | | | | |
| | | | | |
| | | | | |
| | | | | |
Windfall Project – contingent and exploration considerations | | | | | |
| | | | | |
| | | | | |
| | | | | |
| | | | | |
| | | | | |
| | | | | |
Current portion of borrowings | | | | | |
Current portion of lease liabilities | | | | | |
Current portion of provisions | | | | | |
Current portion of long-term incentive plan | | | | | |
| | | | | |
| | | | | |
Total equity and liabilities | | | | | |
The accompanying notes form an integral part of these financial statements.
Consolidated statement of changes in equity
for the year ended 31 December 2023
| | | | | | | | | | | | | | |
| | |
Figures in millions unless otherwise stated | | | | Accumulated other comprehensive income¹ | | | | | | Equity attributable to owners of the parent | | Non- controlling interests | | |
| | | | | | | | | | | | | | |
Balance at 1 January 2021 | | | | | | | | | | | | | | |
| | | | | | | | | | | | | | |
Total comprehensive income for the year | | | | | | | | | | | | | | |
Profit for the year from continuing operations | | | | | | | | | | | | | | |
Loss for the year from discontinued operation | | | | | | | | | | | | | | |
Other comprehensive income from continuing operations | | | | | | | | | | | | | | |
Other comprehensive income from discontinued operation | | | | | | | | | | | | | | |
Transactions with owners of the Company | | | | | | | | | | | | | | |
| | | | | | | | | | | | | | |
| | | | | | | | | | | | | | |
Balance at 31 December 2021 | | | | | | | | | | | | | | |
| | | | | | | | | | | | | | |
Total comprehensive income for the year | | | | | | | | | | | | | | |
Profit for the year from continuing operations | | | | | | | | | | | | | | |
Profit for the year from discontinued operation | | | | | | | | | | | | | | |
Other comprehensive income from continuing operations | | | | | | | | | | | | | | |
Other comprehensive income from discontinued operation | | | | | | | | | | | | | | |
Transactions with owners of the Company | | | | | | | | | | | | | | |
| | | | | | | | | | | | | | |
| | | | | | | | | | | | | | |
Balance at 31 December 2022 | | | | | | | | | | | | | | |
| | | | | | | | | | | | | | |
Total comprehensive income for the year | | | | | | | | | | | | | | |
Profit for the year from continuing operations | | | | | | | | | | | | | | |
Loss for the year from discontinued operation | | | | | | | | | | | | | | |
Other comprehensive income from continuing operations | | | | | | | | | | | | | | |
Other comprehensive income from discontinued operation | | | | | | | | | | | | | | |
Transactions with owners of the Company | | | | | | | | | | | | | | |
| | | | | | | | | | | | | | |
| | | | | | | | | | | | | | |
Balance at 31 December 2023 | | | | | | | | | | | | | | |
The accompanying notes form an integral part of these financial statements.
1Accumulated other comprehensive income mainly comprises foreign currency translation.
2Other reserves include share-based payments and share of equity-accounted investee’s other comprehensive income. The aggregate of accumulated other
comprehensive income and other reserves in the consolidated statement of changes in equity is disclosed in the Consolidated statement of financial
position as other reserves.
3Refer to note 12 for dividends paid to owners of the parent.
Consolidated statement of cash flows
for the year ended 31 December 2023
| | | | | | | |
| | | |
Figures in millions unless otherwise stated | | | | | | | |
| | | | | | | |
Cash flows from operating activities | | | | | | | |
Cash generated by operations | | | | | | | |
| | | | | | | |
Change in working capital | | | | | | | |
Cash generated by operating activities | | | | | | | |
| | | | | | | |
| | | | | | | |
| | | | | | | |
| | | | | | | |
| | | | | | | |
| | | | | | | |
| | | | | | | |
– Non-controlling interest holders | | | | | | | |
– South Deep BEE dividend | | | | | | | |
| | | | | | | |
Cash flows from investing activities | | | | | | | |
Additions to property, plant and equipment | | | | | | | |
Capital expenditure – working capital | | | | | | | |
Proceeds on disposal of property, plant and equipment | | | | | | | |
| | | | | | | |
Purchase of equity-accounted investee – Windfall Project | | | | | | | |
Windfall Project capital contributions | | | | | | | |
Redemption of Asanko Preference Shares | | | | | | | |
Proceeds on disposal of investments | | | | | | | |
Contributions to environmental trust funds | | | | | | | |
| | | | | | | |
Cash flows from financing activities | | | | | | | |
| | | | | | | |
| | | | | | | |
Payment of principal lease liabilities | | | | | | | |
| | | | | | | |
Net cash (utilised)/generated | | | | | | | |
Effect of exchange rate fluctuation on cash held | | | | | | | |
Cash and cash equivalents at beginning of the year | | | | | | | |
| | | | | | | |
Cash and cash equivalents at end of the year | | | | | | | |
The accompanying notes form an integral part of these financial statements.
Notes to the consolidated financial statements
for the year ended 31 December 2023
1.Revenue
| | | | | |
| |
Figures in millions unless otherwise stated | | | | | |
| | | | | |
Revenue from contracts with customers1 | | | | | |
| | | | | |
| | | | | |
| | | | | |
1 The Group generates revenue primarily from the sale of gold bullion and copper concentrate to refineries and banks. All revenue from contracts
with customers is recognised at a point in time. The Group also produces silver which is an insignificant by-product. The disaggregation of revenue
from contracts with customers by primary geographical market and product is described in the segment note (note 44).
2All regions.
3Only Peru region (Cerro Corona).
2.Cost of sales
| | | | | |
| |
Figures in millions unless otherwise stated | | | | | |
| | | | | |
| | | | | |
| | | | | |
| | | | | |
| | | | | |
| | | | | |
Cost of sales before gold inventory change and amortisation and depreciation | | | | | |
| | | | | |
Cost of sales before amortisation and depreciation | | | | | |
Amortisation and depreciation | | | | | |
| | | | | |
1 Included in the gold inventory change for 2023 is a net realisable value adjustment to stockpiles of US$33.8 million (2022: US$nil and 2021: US$nil)
at Damang.
3.Investment income
| | | | | |
| |
Figures in millions unless otherwise stated | | | | | |
| | | | | |
| | | | | |
Interest received – environmental trust funds | | | | | |
Interest received – cash balances | | | | | |
| | | | | |
4.Finance expense
| | | | | |
| |
Figures in millions unless otherwise stated | | | | | |
| | | | | |
Interest expense – environmental rehabilitation | | | | | |
Unwinding of discount rate on silicosis settlement costs | | | | | |
Interest expense – lease liability | | | | | |
Interest expense – borrowings | | | | | |
Borrowing costs capitalised1 | | | | | |
| | | | | |
1Borrowing costs capitalised of US$64.9 million (2022: US$37.9 million and 2021: US$12.5 million) comprise borrowing costs relating to general
borrowings.
2Interest paid amounts to US$104.8 million (2022: US$97.2 million and 2021: US$103.2 million) and comprises interest expense - lease liability of
US$22.7 million (2022: US$22.5 million and 2021: US$24.1 million), interest expense - borrowings of US$82.4 million (2022: US$75.1 million and
2021: US$79.6 million), partially offset by non-cash interest of US$0.3 million (2022: US$0.4 million and 2021: US$0.5 million).
Notes to the consolidated financial statements continued
for the year ended 31 December 2023
5.Share-based payments
The Group granted equity-settled instruments comprising share options and restricted shares to Executive Directors,
certain officers and employees. During the year ended 31 December 2023, the Gold Fields Limited 2012 share plan
was in place. Allocations under this plan were made during 2021, 2022 and 2023.
Gold Fields Limited 2012 share plan
At the Annual General Meeting on 18 May 2016, shareholders approved the adoption of the revised Gold Fields
Limited 2012 share plan to replace the long-term incentive scheme (“LTIP”). The plan provides for four types of
participation, namely performance shares (“PS”), retention shares (“RS”), restricted shares (“RSS”) and matching
shares (“MS”). This plan is in place to attract, retain, motivate and reward participating employees on a basis which
seeks to align the interests of such employees with those of the Company’s shareholders. Currently, the last vesting
date is 17 February 2026.
The expense is as follows:
| | | | | |
| |
Figures in millions unless otherwise stated | | | | | |
| | | | | |
| | | | | |
Total included in profit or loss for the year | | | | | |
The following table summarises the movement of share options under the Gold Fields Limited 2012 share plan during
the years ended 31 December 2023, 2022 and 2021:
| | | |
| | | |
| | | |
| | | |
Outstanding at beginning of the year | | | |
Movement during the year: | | | |
| | | |
| | | |
| | | |
Outstanding at end of the year | | | |
At 31 December 2023, none of the outstanding options above had vested.
The fair value of equity instruments granted during the year ended 31 December 2023, 2022 and 2021 were valued
using the Monte Carlo simulation model:
| | | |
| | | |
| | | |
| | | |
| | | |
The inputs to the model for options granted during the year were as follows: | | | |
– weighted average historical volatility (based on a statistical analysis of the share price on a weighted moving average basis for the expected term of the option) | | | |
| | | |
| | | |
– average three-year risk free interest rate (based on US interest rates) | | | |
– weighted average fair value (United States dollars) | | | |
| | | |
1There is no dividend yield applied to the Monte Carlo simulation model as the performance conditions follow a total shareholder return method.
5.Share-based payments continued
The weighted average share price for the year ended 31 December 2023 on the Johannesburg Stock Exchange was
R246.56 (US$13.33) (2022: R173.42 (US$10.60) and 2021: R143.62 (US$9.71)).
The compensation costs related to awards not yet recognised under the above plans at 31 December 2023, 2022
and 2021 amount to US$11.1 million, US$7.7 million and US$14.7 million, respectively, and are to be recognised over
3 years.
The Directors were authorised to issue and allot all or any of such shares required for the plans, but in aggregate all
plans may not exceed 44,677,041 of the total issued ordinary stated capital of the Company. An individual participant
may also not be awarded an aggregate of shares from all or any such plans exceeding 4,467,704 of the Company’s
total issued ordinary stated capital. The unexercised options and shares under all plans represented 0.3% of the total
issued stated capital at 31 December 2023.
6.Exploration expense
| | | |
| |
Figures in millions unless otherwise stated | | | |
| | | |
| | | |
| | | |
| | | |
| | | |
| | | |
Total exploration expense | | | |
7.Impairment of investments and assets
| | | | | |
| |
Figures in millions unless otherwise stated | | | | | |
| | | | | |
| | | | | |
Equity accounted investees | | | | | |
– Far Southeast Gold Resources Incorporated (“FSE”)1 | | | | | |
Property, plant and equipment | | | | | |
Peru cash-generating unit2 | | | | | |
Tarkwa cash-generating unit3 | | | | | |
Impairment of property, plant and equipment – other4 | | | | | |
| | | | | |
Impairment of investments and assets | | | | | |
1During 2021, impairment indicators were identified as a result of the reduction in the share price of Lepanto and FSE was impaired by
US$30.8 million to its recoverable amount. The recoverable amount was based on the fair value less cost of disposal (“FVLCOD”) of the investment
(level 2 in the fair value hierarchy). The FVLCOD was indirectly derived from the market value of Lepanto Consolidated Mining Company, being the
60% shareholder of FSE. During 2022, management was actively engaged in the process of disposing of FSE. The disposal process proved
unsuccessful and no offers were received. Management’s assessment was that it was unlikely the investment could be sold for any value and
wrote off the investment by US$113.6 million to a carrying value of US$nil (level 3 of the fair value hierarchy). The impairment was included in the
“Corporate and other” segment.
2For the year ended 31 December 2023, the Group recognised an impairment of US$156.2 million (2022: US$63.1 million) in respect of the Peru cash-
generating unit. The recoverable amount was based on its fair value less cost of disposal (“FVLCOD”) calculated using a combination of the
market (resource value) and the income approach (level 3 of the fair value hierarchy). The impairment in 2023 is mainly due to the increased costs
and capital expenditure as a result of a change in the life-of-mine plan to accommodate the unloading of the east wall and continued cost
pressures, as well as the derecognition of the resource as a result of the life-of-mine sterilising the resource through the deposition of in-pit tailings
from 2026 onwards.The impairment in 2022 was mainly due to the increase in the discount rate from 4.8% to 8.1% as a result of increases in the
risk free rate as well as inflationary cost pressures experienced. The recoverable amount at 31 December 2023 is US$418.8 million (2022:
US$477.1 million). Refer accounting policies pages 96 to 97 for the assumptions used based on the 2023 and 2022 life-of-mine plan.
3For the year ended 31 December 2022, the Group recognised an impairment of US$325.2 million in respect of the Tarkwa cash-generating unit. The
recoverable amount was based on its fair value less cost of disposal (“FVLCOD”) calculated using a combination of the market (resource value)
and the income approach (level 3 of the fair value hierarchy). The impairment was mainly due to the increase in the discount rate from 8.3% to
15.9% as a result of increases in the Ghana country risk premium and the risk free rate as well as inflationary cost pressures experienced in 2022.
The recoverable amount at 31 December 2022 was US$812.4 million. Refer accounting policies pages 96 to 97 for the assumptions used based on
the 2022 life-of-mine plan.
4The US$0.2 million in 2023 comprises US$0.1 million (2022: US$nil and 2021: US$10.0 million) impairment of redundant assets at Agnew (2021:
impairment of capitalised exploration costs at St Ives based on technical and economic parameters of various studies), US$0.1 million (2022:
US$2.5 million and 2021: US$1.6 million) impairment of redundant assets at Cerro Corona and US$nil (2022: US$$0.6 million and 2021: US$nil)
impairment of redundant assets at Salares Norte.
Notes to the consolidated financial statements continued
for the year ended 31 December 2023
7.Impairment of investments and assets continued
Sensitivity analysis on cash-generating units with impairments
The tables below summarise the impact of increases/(decreases) on the recoverable amounts of Peru (2022: Tarkwa
and Peru) in the case of changes in the key inputs used to value the recoverable amounts. The first analysis is based
on the assumption that the long-term gold price increased/(decreased) with all other variables held constant. The
second analysis is based on the assumption that the discount rates increased/(decreased) with all other variables
held constant.
| | | | |
Sensitivity to gold price Figures in millions unless otherwise stated | | (Decrease)/increase in long-term gold price |
| | |
| | | | |
| | | | |
(Decrease)/increase in Peru recoverable amount | | | | |
| | | | |
(Decrease)/increase in Tarkwa recoverable amount | | | | |
(Decrease)/increase in Peru recoverable amount | | | | |
| | | | |
Sensitivity to discount rates Figures in millions unless otherwise stated | | (Decrease)/increase in discount rates |
| | |
| | | | |
| | | | |
(Decrease)/increase in Peru recoverable amount | | | | |
| | | | |
(Decrease)/increase in Tarkwa recoverable amount | | | | |
(Decrease)/increase in Peru recoverable amount | | | | |
8.Included in profit before royalties and taxation are the following:
| | | | | |
| |
Figures in millions unless otherwise stated | | | | | |
| | | | | |
| | | | | |
Rehabilitation (expense)/income1 | | | | | |
Offshore structure costs1 | | | | | |
| | | | | |
| | | | | |
| | | | | |
| | | | | |
Yamana transaction costs3 | | | | | |
1Included under “Other costs, net” in the consolidated income statement.
2The restructuring costs in 2023 comprise mainly separation packages at Tarkwa amounting to US$1.6 million (2022: US$8.7 million and 2021:
US$1.3 million), Damang of US$5.5 million (2022: US$2.6 million and US$nil) and St Ives of US$0.7 million (2022: US$nil and 2021: US$nil million).
3The US$300.0 million income related to the Yamana break fee. As a result of Yamana entering into an arrangement agreement with Pan
American Silver Corp and Agnico Eagle Mines Limited, Gold Fields terminated the agreement in respect of the proposed acquisition of Yamana.
In accordance, within the terms of the arrangement agreement, Yamana was required to pay Gold Fields a termination fee of US$300 million. The
transaction costs of US$33 million related mainly to amounts paid to advisors, bankers, lawyers and accountants in connection with the proposed
acquisition of Yamana.
9.Royalties
| | | | | |
| |
Figures in millions unless otherwise stated | | | | | |
| | | | | |
| | | | | |
| | | | | |
| | | | | |
| | | | | |
| | | | | |
| | | | | |
| | | | | |
South Africa (effective rate)1 | | | | | |
| | | | | |
| | | | | |
| | | | | |
1The Mineral and Petroleum Resource Royalty Act 2008 (“Royalty Act”) was promulgated on 24 November 2008 and became effective from
1 March 2010. The Royalty Act imposes a royalty on refined (mineral resources that have undergone a comprehensive level of beneficiation such
as smelting and refining as defined in Schedule 1 of the Royalty Act) and unrefined (mineral resources that have undergone limited beneficiation
as defined in Schedule 2 of the Royalty Act) minerals payable to the state. The royalty in respect of refined minerals (which include gold refined to
99.5% and above and platinum) is calculated by dividing earnings before interest and taxes (“EBIT”) by the product of 12.5 times gross revenue
calculated as a percentage, plus an additional 0.5%. EBIT refers to taxable mining income (with certain exceptions such as no deduction for
interest payable and foreign exchange losses) before assessed losses but after capital expenditure. A maximum royalty of 5% has been
introduced on refined minerals. The effective rate of royalty tax payable for the year ended 31 December 2023 was 0.5% of mining revenue
(2022: 0.5% and 2021: 0.5%) equalling the minimum charge per the formula.
2The Australian operations are subject to a 2.5% (2022: 2.5% and 2021: 2.5%) gold royalty on revenue as the mineral rights are owned by the state.
3Minerals are owned by the Republic of Ghana and held in trust by the President. Gold Fields signed a Development Agreement (“DA”) with the
government of Ghana for both the Tarkwa and Damang mines. This agreement states that the Ghanaian operations will be subject to a sliding
scale for royalty rates, linked to the prevailing gold price. The sliding scale is as follows:
4The Peruvian operations are subject to a mining royalty calculated on a sliding scale with rates ranging from 1% to 12% of the value of operating profit.
Notes to the consolidated financial statements continued
for the year ended 31 December 2023
10.Mining and income taxation
| | | | | |
| |
Figures in millions unless otherwise stated | | | | | |
| | | | | |
The components of mining and income tax are the following: | | | | | |
| | | | | |
– company and capital gains taxation1 | | | | | |
– dividend withholding tax | | | | | |
– prior year adjustment – current taxation | | | | | |
| | | | | |
– prior year adjustment – deferred taxation | | | | | |
| | | | | |
| | | | | |
– dividend withholding tax | | | | | |
– prior year adjustment – current taxation2 | | | | | |
| | | | | |
Total mining and income taxation | | | | | |
Major items causing the Group's income taxation to differ from the maximum South African statutory mining tax rate of 33.0% (2022: 34.0% and 2021: 34.0%) were: | | | | | |
Taxation on profit before taxation at maximum South African statutory mining tax rate | | | | | |
Rate adjustment to reflect the actual realised company tax rates in South Africa and offshore3 | | | | | |
Non-deductible share-based payments | | | | | |
Non-deductible exploration expense | | | | | |
Deferred tax assets not recognised on impairment of FSE | | | | | |
Non-deductible interest paid | | | | | |
Share of results of equity accounted investees, net of taxation | | | | | |
Non-taxable capital gains portion of Yamana break fee and transaction costs | | | | | |
Non-taxable fair value loss on Maverix warrants | | | | | |
| | | | | |
Net non-deductible expenditure and non-taxable income | | | | | |
Deferred tax on unremitted earnings at Tarkwa and Cerro Corona | | | | | |
Deferred taxation movement on Peruvian Nuevo Sol devaluation against US dollar4 | | | | | |
Various Peruvian non-deductible expenses | | | | | |
Deferred tax assets not recognised at Cerro Corona, net5 | | | | | |
Deferred tax assets utilised/(not recognised) at Damang and Tarkwa6 | | | | | |
Deferred tax recognised at Salares Norte7 | | | | | |
| | | | | |
Deferred tax charge on change of tax rate at South Deep | | | | | |
| | | | | |
Total mining and income taxation | | | | | |
1The US$65.3 million in 2022 includes capital gains taxation of US$65.2 million paid to South African Revenue Services on Yamana break fee.
2The US$5.9 million in 2022 comprises US$19.2 million additional transfer pricing charges at Tarkwa and Damang, partially offset by a refund of
US$13.3 million relating to hedges in Peru.
3Due to different tax rates in various jurisdictions, primarily South Africa, Ghana, Australia and Peru.
4The functional currency of Cerro Corona is US Dollar, however, the Peruvian tax base is based on values in Peruvian Nuevo Sol.
5Deferred tax assets amounting to US$5.1 million (2022: US$14.4 million) were not recognised during the year ended 31 December 2023 at Cerro
Corona to the extent that there is insufficient future taxable income available. Deferred tax assets were not recognised during the year related to
deductible temporary differences on additions to fixed assets in the current financial year that would only reverse after the end of the life-of-mine
(“LoM”) of Cerro Corona. In making this determination, the Group analysed, among others, forecasts of future earnings and the nature and timing
of future deductions and benefits represented by deferred tax assets.
During 2021, deferred tax assets of US$12.2 million were not recognised. This comprised deferred tax assets of US$15.6 million not recognised
relating to losses on financial instruments of US$45.8 million due to uncertainty in the deductibility of these losses, partially offset by deferred tax
assets amounting to US$3.4 million that were previously not recognised, recognised due to the increase in future taxable income available
because of a higher long-term gold price used in the 2021 assessment.
6During 2023, deferred tax assets of US$30.3 million (2022: utilised of $1.2 million and 2021: not recognised of US$6.6 million) were not recognised
the Ghanaian operations. The $30.3 million (2022: utilised of US$1.2 million and 2021: not recognised of US$6.6 million) not recognised in 2023
comprised US$11.0 million (2022: US$6.0 million and 2021: US$14.0 million) relating to the Ghana expected credit loss provision of US$33.2 million
(US$17.5 million and 2021: US$41.1 million), US$11.2 million (2022: US$nil and 2021: US$nil) relating to the net realisable value adjustments to
stockpiles at Damang and US$11.3 million (2022: US$nil and 2021: US$nil) deferred tax not recognised at Damang due to the uncertainty of future
deductibility, partially offset by US$US$3.2 million (2022: US$7.2 million and 2021: US$7.4 million) deferred tax assets recognised relating to the
utilisation of previous losses on financial instruments.
7During 2021, deferred tax assets of US$96.7 million were raised. At 31 December 2021, there had been significant progress with the construction
of the Salares Norte project as indicated by total project progress at 62.5%, construction progress at 55% and the early forecast curve being
aligned with the scheduled finish of 2023. The project is expected to deliver significant value and all tax credits are expected to be fully utilised
before they expire.
10.Mining and income taxation continued
| | | | | |
| |
| | | | | |
| | | | | |
South Africa – current tax rates | | | | | |
| | | | | |
| | | | | |
| | | | | |
International operations – current tax rates | | | | | |
| | | | | |
| | | | | |
| | | | | |
1South African mining tax on mining income is determined according to a formula which takes into account the profit and revenue from mining
operations. South African mining taxable income is determined after the deduction of all mining capital expenditure, with the proviso that this
cannot result in an assessed loss. Capital expenditure amounts not deducted are carried forward as unredeemed capital expenditure to be
deducted from future mining income. Accounting depreciation is ignored for the purpose of calculating South African mining taxation. During June
2022, the South African Revenue Services published the draft 2022 Rates & Monetary Bill, inclusive of an amendment to the gold tax formula from
Y = 34 – 170/X to Y = 33 – 165/X in respect of year assessments ending on or after 31 March 2023 and this amendment was effective for the year
ended 31 December 2023. This resulted in the effective mining tax rate used for deferred tax purposes for Gold Fields Operations Limited ("GFO")
and GFI Joint Venture Holdings (Proprietary) Limited ("GFIJVH"), owners of the South Deep mine, decreasing from 29% at 31 December 2021 to 28%
at 31 December 2022, amounting to a charge of R76.2 million (US$4.6 million) through profit or loss in 2022 (2023: 28.00%, 2022: 28% and 2021:
29%). In the formula above, Y is the percentage rate of tax payable and X is the ratio of mining profit, after the deduction of redeemable capital
expenditure, to mining revenue expressed as a percentage.
2Non-mining income of South African mining operations consists primarily of interest income. The corporate income tax rate was reduced from 28%
to 27% for tax years ended on or after 31 March 2023 and was effective for the year ended 31 December 2023.
In the wake of the Ghanaian fiscal crisis, the Ghanaian government conducted stringent audits on its biggest
corporate taxpayers (many of them multinationals), including Gold Fields, and imposed additional tax liabilities during
2022. In addition, Gold Fields experienced more onerous processes in claiming and renewing rebates and
exemptions under the Development Agreement. The two audits in 2022 by the Ghana Revenue Authority were a
transfer pricing audit covering 2014 to 2019 and a tax audit for 2018 to 2020. Both of these audits were finalised and
settled during 2023.
Deferred tax is provided at the expected future rate for mining operations arising from temporary differences
between the carrying values and tax values of assets and liabilities. In South Africa the tax rate which has been
used for deferred tax purposes for mining assets is Y = 33 – 165/X and for non-mining assets is 27%.
At 31 December 2023, the Group had the following estimated amounts available for set-off against future income:
| | | | | | | | | | | |
| |
| | | |
| Gross unredeemed capital expenditure | | | | Gross tax losses not recognised | | Gross unredeemed capital expenditure | | | | Gross tax losses not recognised |
| | | | | | | | | | | |
| | | | | | | | | | | |
| | | | | | | | | | | |
Gold Fields Operations Limited | | | | | | | | | | | |
GFI Joint Venture Holdings (Pty) Limited | | | | | | | | | | | |
Gold Fields Holdings Company Limited | | | | | | | | | | | |
| | | | | | | | | | | |
1These deductions are available to be utilised against income generated by the relevant tax entity and do not expire unless the tax entity
concerned ceases to operate for a period of longer than one year. Under South African mining tax ring-fencing legislation, each tax entity is
treated separately and as such these deductions can only be utilised by the tax entities in which the deductions have been generated. South
African tax losses and unredeemed capital expenditure have no expiration date.
Notes to the consolidated financial statements continued
for the year ended 31 December 2023
10.Mining and income taxation continued
| | | | | | |
| |
| | |
| Gross unredeemed capital expenditure | | Gross tax losses not recognised | Gross unredeemed capital expenditure | | Gross tax losses not recognised |
| | | | | | |
| | | | | | |
| | | | | | |
Gold Fields Operations Limited | | | | | | |
GFI Joint Venture Holdings (Pty) Limited | | | | | | |
Gold Fields Holdings Company Limited | | | | | | |
| | | | | | |
| | | | | | |
| | | | | | |
Minera Gold Fields Salares Norte3 | | | | | | |
Abosso Goldfields Limited4,5 | | | | | | |
Gold Fields Ghana Limited4,6 | | | | | | |
| | | | | | |
1These deductions are available to be utilised against income generated by the relevant tax entity and do not expire unless the tax entity
concerned ceases to operate for a period of longer than one year. Under South African mining tax ring-fencing legislation, each tax entity is
treated separately and as such these deductions can only be utilised by the tax entities in which the deductions have been generated. South
African tax losses and unredeemed capital expenditure have no expiration date.
2The total tax losses of US$250.3 million (2022: US$219.7 million) comprise US$2.2 million (2022: US$1.1 million) tax losses that expire between one
and two years, US$4.0 million (2022: US$4.0 million) tax losses that expire between two and five years, US$1.1 million (2022: US$0.7 million) tax
losses that expire between five and 10 years, US$194.1 million (2022: US$171.3 million) tax losses that expire after 10 years and US$48.9 million
(2022: US$42.6 million) tax losses that have no expiry date.
3These deductions are available to be utilised against income generated by the relevant tax entity and do not expire.
4Tax losses may be carried forward for five years. These losses expire on a first-in-first-out basis. Tax losses of US$48.1 million (2022: US$51.3 million)
expire in three years and tax losses of US$10.4 million (2022: US$nil) expire in four years.
5At 31 December 2023, tax losses at Damang of US$28.1 million (2022: US$24.9 million) comprise deferred tax assets not recognised relating to
financial instruments losses.
6At 31 December 2023, deferred tax assets at Tarkwa of US$30.4 million (2022: US$26.4 million) not recognised relating to losses on financial
instruments.
Organisation for Economic Co-operation and Development ("OECD") Pillar Two model rules
The Group is within the scope of the OECD Pillar Two model rules. The Group operates in the Netherlands as well
as in Switzerland which have both enacted new legislation to implement the global top-up tax during December
2023. This legislation is effective from 1 January 2024. Since the newly enacted Pillar Two legislation is only effective
from 1 January 2024, the Group has no related current tax impact for the year ended 31 December 2023. The Group
applies a temporary mandatory relief in respect of recognising and disclosing information about deferred tax assets
and liabilities related to Pillar Two income taxes, as provided in the amendments to IAS 12 issued in May 2023.
Under the legislation, the Group may be liable to pay a top-up tax for the difference between its Global Anti-Base
Erosion (“GloBE”) effective tax rate per jurisdiction and the 15% minimum rate. All entities within the Group have a
GloBE effective tax rate that exceeds 15%.
The Group has performed a preliminary impact assessment, based on relevant 2022 financial information, of its
potential exposure in relation to the Pillar Two legislation once it comes into effect. Although the complexities in
applying the legislation and calculating the GloBE effective tax rate create difficulties in determining reasonable
estimates of the quantitative impact of the enacted or substantively enacted legislation, based on the outcome of
the preliminary impact assessment, the Group does not anticipate being subject to the top-up tax in any of the
jurisdictions in which it operates as all the jurisdictions either meet the conditions of one of the transitional safe
harbours or the relevant constituent entity has a GloBE effective tax rate of at least 15%.
11.Earnings per share
| | | | | | |
| | |
| Figures in millions unless otherwise stated | | | | | |
| | | | | | |
| Basic earnings per share – cents | | | | | |
| Basic earnings per share from is calculated by dividing the profit attributable to owners of the parent of US$703.3 million (2022: US$711.0 million and 2021: US$789.3 million) by the weighted average number of ordinary shares in issue during the year of 893,318,864 (2022: 890,968,721 and 2021: 887,306,342). | | | | | |
| | | | | | |
| | |
| Figures in millions unless otherwise stated | | | | | |
| | | | | | |
| Basic earnings per share from continuing operations – cents | | | | | |
| Basic earnings per share from continuing operations is calculated by dividing the profit attributable to owners of the parent from continuing operations of US$722.2 million (2022: US$698.0 million and 2021: US$818.7 million) by the weighted average number of ordinary shares in issue during the year of 893,318,864 (2022: 890,968,721 and 2021: 887,306,342). | | | | | |
| | | | | | |
| | |
| Figures in millions unless otherwise stated | | | | | |
| | | | | | |
| Basic (loss)/earnings per share from discontinued operation – cents | | | | | |
| Basic (loss)/earnings per share from discontinued operation is calculated by dividing the loss attributable to owners of the parent from discontinued operation of US$18.9 million (2022: profit of US$13.0 million and 2021: loss of US$29.4 million ) by the weighted average number of ordinary shares in issue during the year of 893,318,864 (2022: 890,968,721 and 2021: 887,306,342 ). | | | | | |
| | | | | | |
| | |
| Figures in millions unless otherwise stated | | | | | |
| | | | | | |
| Diluted earnings per share – cents | | | | | |
| Diluted earnings per share is calculated by dividing the diluted profit attributable to owners of the parent of US$692.2 million (2022: US$701.3 million and 2021: US$781.9 million) by the diluted weighted average number of ordinary shares in issue during the year of 895,037,887 (2022: 893,916,246 and 2021: 893,497,539). | | | | | |
| Net profit attributable to owners of the parent has been adjusted by the following to arrive at the diluted profit attributable to owners of the parent: | | | | | |
| Profit attributable to owners of the parent | | | | | |
| South Deep minority interest at 10% | | | | | |
| Diluted profit attributable to owners of the parent | | | | | |
| The weighted average number of shares has been adjusted by the following to arrive at the diluted number of ordinary shares: | | | | | |
| Weighted average number of ordinary shares | | | | | |
| Potentially dilutive share options in issue | | | | | |
| Diluted weighted average number of ordinary shares | | | | | |
Notes to the consolidated financial statements continued
for the year ended 31 December 2023
11.Earnings per share continued
| | | | | | |
| | |
| Figures in millions unless otherwise stated | | | | | |
| | | | | | |
| Diluted earnings per share from continuing operations – cents | | | | | |
| Diluted earnings per share from continuing operations is calculated by dividing the diluted profit attributable to owners of the parent from continuing operations of US$711.1 million (2022: US$688.3 million and 2021: US$811.3 million) by the diluted weighted average number of ordinary shares in issue during the year of 895,037,887 (2022: 893,916,246 and 2021: 893,497,539). | | | | | |
| Net profit attributable to owners of the parent from continuing operations has been adjusted by the following to arrive at the diluted profit attributable to owners of the parent from continuing operations: | | | | | |
| Profit attributable to owners of the parent from continuing operations | | | | | |
| South Deep minority interest at 10% | | | | | |
| Diluted profit attributable to owners of the parent from continuing operations | | | | | |
| The weighted average number of shares has been adjusted by the following to arrive at the diluted number of ordinary shares: | | | | | |
| Weighted average number of ordinary shares | | | | | |
| Potentially dilutive share options in issue | | | | | |
| Diluted weighted average number of ordinary shares | | | | | |
| | | | | | |
| | |
| Figures in millions unless otherwise stated | | | | | |
| | | | | | |
| Diluted (loss)/earnings per share from discontinued operation – cents | | | | | |
| Diluted (loss)/earnings per share from discontinued operation is calculated by dividing the loss attributable to owners of the parent from discontinued operation of US$18.9 million (2022: profit of US$13.0 million and 2021: loss of US$29.4 million) by the weighted average number of ordinary shares in issue during the year of 895,037,887 (2022: 893,916,246 and 2021: 893,497,539). | | | | | |
12.Dividend declared
| | | | | |
| |
Figures in millions unless otherwise stated | | | | | |
| | | | | |
2022 final dividend of 445 SA cents per share (2021: 260 SA cents and 2020: 320 SA cents) declared on 23 February 2023. | | | | | |
2023 interim dividend of 325 SA cents was declared during 2023 (2022: 300 SA cents and 2021: 210 SA cents). | | | | | |
A final dividend in respect of the financial year ended 31 December 2023 of 420 SA cents per share was approved by the Board of Directors on 21 February 2024. This dividend payable is not reflected in these financial statements. | | | | | |
Dividends are subject to Dividend Withholding Tax. | | | | | |
| | | | | |
Dividends per share – cents | | | | | |
13.1Ghana expected credit loss
| | | | | |
| |
Figures in millions unless otherwise stated | | | | | |
| | | | | |
Ghana expected credit loss – loan advanced to contractor1 | | | | | |
Damang expected credit loss – receivable2 | | | | | |
Tarkwa expected credit loss – receivable3 | | | | | |
Total expected credit loss | | | | | |
1The expected credit loss provision of US$25.4 million (2022: US$3.9 million and 2021: US$41.1 million) was raised against a contractor loan at
31 December 2023. The total expected credit loss amounted to US$25.4 million of which the interest portion amounting to US$2.0 million was
included in trade and other receivables and the loan portion amounting to US$23.4 million was included in loan advanced – contractor.The
contractor loan (refer note 13.2) related to the financial assistance provided to a contractor at Ghana for the procurement of new fleet. Refer note 41
for further details.
2The expected credit loss provision of US$7.8 million (2022: US$nil and 2021: US$nil) was raised against a receivable at 31 December 2023. The
receivable of US$7.8 million in 2023 related to a payment advanced to a contractor at Damang.
3The expected credit loss provision of US$nil (2022: US$13.6 million and 2021: US$nil ) was raised against a receivable at 31 December 2022. The
receivable of US$13.6 million in 2022 related to a payment advanced to a contractor at Tarkwa.
13.2Loan advanced – contractor
| | | |
| |
Figures in millions unless otherwise stated | | | |
| | | |
Balance at beginning of the year | | | |
| | | |
Total loan advanced to contractor2 | | | |
1The total expected credit loss recognised in the income statement for 2023 amounted to US$25.4 million of which the interest portion amounting
to US$2.0 million was included in trade and other receivables and the loan portion amounting to US$23.4 million was included in loan advanced –
contractor. Refer note 13.1.
2Due to issues with fleet availability at both Tarkwa and Damang, an agreement was entered into between Gold Fields and Engineers and Planners
(“E&P”) to provide financial assistance to E&P in order to procure new fleet. The initial loan amounted to US$68.4 million, bears interest at a market
related - rate and a portion is secured over the fleet purchased in 2020. At 31 December 2023, a cumulative expected credit loss provision of
US$68.4 million (2022:US$45.0 million) was raised against the loan, resulting in a net balance of US$nil (2022: US$23.4 million).
Notes to the consolidated financial statements continued
for the year ended 31 December 2023
14.Discontinued operation
| | | | |
| | |
| Figures in millions unless otherwise stated | | | |
| | | | |
| | | | |
| | | | |
| – Asanko Gold – impairment1 | | | |
| (Loss)/profit from discontinued operation | | | |
1 As a result the sale transaction discussed below, the investment in Asanko has been classified as an asset held for sale and the investment is
required to be measured at the lower of carrying value or fair value less costs to sell. Management determined the fair value less costs to sell
based on the consideration to be received per the sale agreement. The assumptions used in the determination of the fair values of the deferred
and contingent considerations are as follows:
•The share consideration was calculated as 28.5 million Galiano shares at a share price of US$0.92 at 31 December 2023;
•US$25 million and US$30 million deferred consideration discounted using a rate of 7.9%; and
•US$30 million contingent consideration discounted using a rate of 15.1%.
The fair value has been allocated first to the Asanko redeemable preference shares based on the fair value of the preference shares using the
expected redemption period. The residual amount after deducting the fair value of the preference shares from the total fair value of the
consideration was allocated to the Asanko Gold equity-accounted investee, which resulted in an impairment of US$46.9 million (2022: US$nil and
2021: US$52.8 million ) for the year ended 31 December 2023.
On 21 December 2023, Gold Fields announced the divestment of its 45% shareholding in Asanko Gold (both the
preference shares and equity-accounted investee) to the joint venture partner Galiano Gold for a total consideration
of US$170 million. Gold Fields will also receive a 1% net smelter royalty on future production from the Nkran deposit,
the main deposit at the mine.
The Asanko mine is currently owned 45% each by Gold Fields and Galiano Gold, with Galiano managing the mine.
The Government of Ghana holds the remaining 10%.
The transaction will be settled by Galiano to Gold Fields through a combination of upfront, deferred and contingent
consideration as follows:
•US$85 million which will be settled with US$65 million in cash and US$20 million in Galiano shares on completion
of the transaction;
•US$25 million to be paid on 31 December 2025;
•US$30 million to be paid on 31 December 2026; and
•US$30 million plus a 1% net smelter royalty to be paid once more than 100,000 ounces of gold is produced from
the Nkran deposit. The royalty is capped at a volume of 447,000 ounces of gold production from the deposit.
Gold Fields currently has a 9.8% shareholding in Galiano and the share purchase agreement limits the shareholding
that Gold Fields can raise this to 19.9%. Should the market value of Galiano shares be less than the requisite
US$20 million, Galiano will make up the difference with an additional cash payment.
The share of results of equity investee of Asanko Gold have been presented as a discontinued operation in the
consolidated financial statements and the comparative income statement have been presented as if Asanko Gold
had been discontinued from the start of the comparative years. Refer notes 15 and 18 for further details.
The transaction was subject to a number of conditions and was concluded on 4 March 2024 with the receipt of
US$65 million in cash and 28.5 million in Galiano shares.
15.Assets held for sale
| | | |
| | |
| Figures in millions unless otherwise stated | | |
| | | |
| | | |
| – Asanko Gold joint venture | | |
| – Asanko redeemable preference shares | | |
| (b) Rusoro Mining Limited (“Rusoro”) | | |
| | | |
(a)Asanko Gold
On 21 December 2023, Gold Fields announced the divestment of its 45% shareholding in Asanko Gold to the
joint venture partner Galiano Gold for a total consideration of US$170 million. Gold Fields will also receive a 1%
net smelter royalty on future production from the Nkran deposit, the main deposit at the mine. The transaction
was subject to a number of conditions and was concluded on 4 March 2024 with the receipt of US$65 million
in cash and 28.5 million in Galiano shares.
The investment in Asanko Gold, including the Asanko redeemable preference shares, has been presented
as an asset held for sale. Refer notes 14, 18 and 20 for further details.
(b)Rusoro
On 9 January 2024, Gold Fields announced that it has entered into a share purchase agreement
(the “Agreement”) with Fulcrum Global Markets LLC, a Delaware limited liability company (“Fulcrum”), to sell
its 140,000,001 common shares (“Common Shares”) in the capital of Rusoro for an aggregate initial cash
purchase price of US$62.3 million and certain additional contingent consideration upon the occurrence of
specified events described below (the “Transaction”).
Under the Agreement, Gold Fields will be entitled to receive from Fulcrum the following additional contingent
consideration for the Common Shares to be purchased by Fulcrum (the “Purchased Shares”):
•A top-up amount in cash calculated in accordance with the Agreement in the event that, within 18 months
following closing of the Transaction, Fulcrum or any of its affiliates acquires, directly or indirectly, in one or
more transactions, additional Common Shares which collectively result in their aggregate holdings
exceeding 50% of the issued and outstanding Common Shares; and
•An amount in cash equal to 15% of the value of any gross proceeds paid at any time to Fulcrum or any of its
affiliates by Rusoro or third parties in respect of the Purchased Shares (including in connection with any
disposition of the Purchased Shares, or as a dividend, distribution, return of capital, share repurchase or
similar amount), to the extent that the gross amount of such cumulative proceeds exceeds US$210 million.
The Transaction was subject to the following conditions precedent:
•Gold Fields was required to issue Rusoro with a sale notice within three Business Days after the date of
receipt of a purchase offer by Gold Fields. Rusoro could object on reasonable commercial grounds to the
intended sale to Fulcrum within five Business Days after the date of receipt of the notice.
The notice was issued on 9 January 2024 by Gold Fields to Rusoro and the five business day objection
period lapsed on 16 January 2024. The US$62.3 million was received by Gold Fields on 22 January 2024.
The effective date of the Transaction was 16 January 2024, being the date on which all the conditions
precedent of the agreement were met.
The investment in Rusoro has been presented as an asset held for sale as Fulcrum was in advanced
discussions with Gold Fields at 31 December 2023 to purchase the Rusoro shares from Gold Fields. At
31 December 2023, the held for sale investment in Rusoro was valued at the lower of carrying value or fair
value less costs to sell, amounting to US$nil. Refer note 18 for further details.
Notes to the consolidated financial statements continued
for the year ended 31 December 2023
16.Property, plant and equipment
| | | | | | | | | | | | | | |
|
| | | |
Land, mineral rights and rehabilitation assets | | Mine development, infrastructure and other assets | | Right-of-use assets relating to mine development, infrastructure and other assets | | | | | | Right-of-use assets relating to mine development, infrastructure and other assets | | Mine development, infrastructure and other assets | | Land, mineral rights and rehabilitation assets |
| | | | | | | | | | | | | | |
| | | | | | | | | | | | | | |
| | | | | | | Balance at beginning of the year | | | | | | | |
| | | | | | | | | | | | | | |
| | | | | | | | | | | | | | |
| | | | | | | Other Salares Norte non- cash costs capitalised | | | | | | | |
| | | | | | | Right-of-use assets capitalised during the year (refer note 36) | | | | | | | |
| | | | | | | Remeasurements of right-of- use assets capitalised (refer note 36)1 | | | | | | | |
| | | | | | | General borrowing costs capitalised2 | | | | | | | |
| | | | | | | | | | | | | | |
| | | | | | | | | | | | | | |
| | | | | | | Changes in estimates of rehabilitation assets (refer note 28.1) | | | | | | | |
| | | | | | | | | | | | | | |
| | | | | | | Balance at end of the year | | | | | | | |
| | | | | | | Accumulated depreciation and impairment | | | | | | | |
| | | | | | | Balance at beginning of the year | | | | | | | |
| | | | | | | | | | | | | | |
| | | | | | | | | | | | | | |
| | | | | | | Salares Norte depreciation capitalised | | | | | | | |
| | | | | | | | | | | | | | |
| | | | | | | | | | | | | | |
| | | | | | | | | | | | | | |
| | | | | | | | | | | | | | |
| | | | | | | Balance at end of the year | | | | | | | |
| | | | | | | Carrying value at end of the year | | | | | | | |
1The re-measurements in 2023 relate mainly to leases at the Group’s Australian operations that have variable payments linked to the Australian
consumer price index (“CPI”). (2022: Leases at the Group’s Australian operations that have variable payments linked to the Australian CPI).
2General borrowing costs of US$64.9 million (2022: US$37.9 million) arising on Group general borrowings were capitalised during the period and
related to the Salares Norte project. An average interest capitalisation rate of 6.6% (2022: 6.4%) was applied.
17.Acquisition of Windfall Project
Background
On 2 May 2023, Gold Fields, through a 100% held Canadian subsidiary, acquired a 50% interest in the Windfall
Project in Québec, Canada, which is in the feasibility stage, from Osisko Mining Incorporated (the “Partnership”).
•Under the Partnership structure, each of Osisko Mining Incorporated (“Osisko”) and Gold Fields, respectively, hold
an effective 50% partnership interest in the Windfall Project and the Exploration Properties; and
•The management company (responsible for the operation) will be governed by a Board of Directors comprising
three directors nominated by Gold Fields and three directors nominated by Osisko. Decisions over the relevant
activities of the Partnership require unanimous consent of both the parties.
Recognition and measurement
Gold Fields and Osisko have joint control over the Windfall Project, the transaction is structured as a separate vehicle
and the Group has a residual interest in the net assets of the Windfall Project. Accordingly, the Group has classified
its interest in the Windfall Project as a joint venture.
Consideration
The following summarises the consideration and the cost of the Windfall joint venture:
| | | |
| | | |
Figures in millions unless otherwise stated | | |
| | | |
| | |
| | |
| Purchase of equity-accounted investee | | |
| C$300.0 million cash payment | | |
| | | |
| | | |
| | | |
Contingent and exploration considerations | | |
| C$300.0 million contingent consideration – initial fair value | | |
| C$75.0 million exploration consideration – initial present value | | |
| | |
| | |
| Capital contributions – C$93.0 million cash calls | | |
Contingent and exploration considerations | | |
| C$300.0 million contingent consideration – net change in fair value1 | | |
| C$75.0 million exploration consideration – unwinding of discount rate1 | | |
| | |
| | |
Carrying value at 31 December 2023 | | |
1The movements were recognised as part of the equity investment.
(a)C$300 million cash payment
The US$221.5 million (C$300 million) cash payment represents the initial consideration paid on 2 May 2023 for
the 50% interest in the joint venture.
(b)Pre-closing paid amounts
Osisko acquired certain assets for the benefit of the Windfall Project during the term sheet negotiation stage.
Gold Fields agreed to refund Osisko 50% of the costs spent on these items in two equal payments of
US$12.8 million (C$16.9 million) on 31 July 2023 and US$12.8 million (C$16.9 million) on 31 December 2023,
respectively.
(c)C$300 million contingent consideration
The C$300.0 million contingent consideration is payable on issuance of an Environmental Impact Assessment
(“EIA”) permit to the Partnership authorising the construction and operation of the Windfall Project.
The fair value of the contingent consideration was determined using a Monte Carlo valuation model that
considers various scenarios and possibilities around the potential outcome of the EIA permit approval process
and the timing of when the contingent consideration will be paid.
Notes to the consolidated financial statements continued
for the year ended 31 December 2023
17.Acquisition of Windfall Project continued
| | | | |
| | | | Subsequent measurement 31 December 2023 |
| | | | |
| | C$300 million contingent consideration continued | | |
| | Key assumptions of the contingent consideration: | | |
| | – Fair value factor calculated using the Monte-Carlo valuation model using the following inputs: | | |
| | | | |
| | | | |
| | | | |
| | | | |
| | Figures in millions unless otherwise stated | | |
| | | | |
| | Using the above inputs and valuation technique, the fair value of the contingent consideration amounted to: | | |
| | | | |
| | | | |
| | | | |
| | Fair value at 31 December 2023 | | |
(d)C$75 million exploration consideration
As part of the acquisition of the Windfall Project, Gold Fields acquired a 50% interest in certain developmental
exploration projects and targets for a C$75.0 million funding commitment by Gold Fields over 5 years
commencing 2025. The C$75.0 million will be scheduled over the period of the exploration agreement and
discounted using a market related discount rate.
| | | | |
| | | | Subsequent measurement 31 December 2023 |
| | | | |
| | Key assumptions of the exploration consideration: | | |
| | | | |
| | | | |
| | | | |
| | Figures in millions unless otherwise stated | | |
| | | | |
| | Using the above inputs, the value of the exploration consideration amounted to: | | |
| | Present value at 2 May 2023 | | |
| | Unwinding of discount rate | | |
| | | | |
| | Carrying value at 31 December 2023 | | |
(e)Cash calls
The project requires funding from the Partnerships in the feasibility and development stage of the project.
During 2023, post the acquisition date, Gold Fields paid cash calls amounting to US$69.1 million
(C$93.0 million) to the Windfall Project which has been capitalised to the cost of the investment.
18.Equity accounted investees
| | | | | | | |
| | | |
| | Figures in millions unless otherwise stated | | | | | |
| | | | | | | |
| | Investment in joint ventures | | | | | |
| | Far Southeast Gold Resources Incorporated (“FSE”) | | | | | |
| | | | | | | |
| | | | | | | |
| | | | | | | |
| | | | | | | |
| | | | | | | |
| | Total equity accounted investees | | | | | |
| | Share of results of equity accounted investees, net of taxation recognised in the consolidated income statement are made up as follows: | | | | | |
| | Far Southeast Gold Resources Incorporated (“FSE”) | | | | | |
| | | | | | | |
| | | | | | | |
| | | | | | | |
| | | | | | | |
| | Share of results of equity investees, net of taxation | | | | | |
| | Asanko Gold – recognised as a discontinued operation | | | | | |
| | Total share of results of equity investees, net of taxation | | | | | |
(a)FSE
Gold Fields interest in FSE, an unlisted entity incorporated in the Philippines, was 40% (2022: 40% and 2021:
40%) at 31 December 2023. Lepanto Consolidated Mining Company owns the remaining 60% shareholding
in FSE.
A remaining 20% option is not currently exercisable until such time as FSE obtains a Foreign Technical
Assistance Agreement (“FTAA”) which allows for direct majority foreign ownership and control.
FSE has a 31 December year-end and has been equity accounted since 1 April 2012. FSE’s equity accounting
is based on results to 31 December 2023.
Investment in joint venture consists of:
| | |
| |
Figures in millions unless otherwise stated | | |
| | |
| | |
| | |
| | |
| | |
Share of accumulated losses brought forward | | |
Share of loss after taxation2 | | |
Total investment in joint venture3 | | |
1Refer to note 7 for details of impairment.
2Gold Fields’ share of loss after taxation represents exploration and other costs, including work completed on a scoping study, which is fully
funded by Gold Fields as part of their equity contribution.
3FSE has no revenues or significant assets or liabilities. Assets included in FSE represent the rights to explore and eventually mine the
FSE project.
Notes to the consolidated financial statements continued
for the year ended 31 December 2023
18.Equity accounted investees continued
(b)Asanko Gold
The Asanko Gold joint venture entities comprise the following:
•A 45% interest in Asanko Gold Ghana Limited (“AGGL”), incorporated in Ghana, which owns the Asanko
Gold Mine. The government of Ghana continues to retain a 10% free carried interest in AGGL;
•A 50% interest in Adansi Gold Company Limited (“Adansi”), incorporated in Ghana; and
•A 50% interest in Shika Group Finance Limited (“Shika”), incorporated in the Isle of Man.
Gold Fields and Asanko have joint control and the Asanko operation is structured as a separate vehicle and
the Group has a residual interest in the net assets of Asanko. Accordingly, the Group had classified its interest
in Asanko as a joint venture.
On 21 December 2023, Gold Fields announced the divestment of its 45% shareholding in Asanko Gold (both
the preference shares and equity-accounted investee) to the joint venture partner Galiano Gold for a total
consideration of US$170 million. Gold Fields will also receive a 1% net smelter royalty on future production
from the Nkran deposit, the main deposit at the mine. The transaction was subject to a number of conditions
and was concluded on 4 March 2024 with the receipt of US$65 million cash and 28.5 million Galiano shares.
Refer notes 14 and 15 for further details.
The investment in Asanko Gold, including the Asanko redeemable preference shares (refer note 20), have
been presented as an asset held for sale. The share of results of equity investee of Asanko Gold have been
presented as a discontinued operation in the consolidated financial statements and the comparative income
statements have been presented as if Asanko Gold had been discontinued from the start of the comparative
years.
Asanko has a 31 December year-end and has been equity accounted since 31 July 2018. Asanko’s equity
accounting is based on results up to the date it was classified as held for sale.
The following table summarises the financial information and the carrying amount of the Group’s interest in
Asanko:
| | | |
| |
Figures in millions unless otherwise stated | | | |
| | | |
Initial investment at cost | | | |
Share of accumulated profit brought forward | | | |
Share of profit after taxation before impairment | | | |
| | | |
Recognised as an asset held for sale | | | |
Carrying value at 31 December | | | |
18.Equity accounted investees continued
(b)Asanko Gold continued
The Group’s interest in the summarised financial statements of Asanko on a combined basis after fair value
adjustments as determined at acquisition is as follows:
| | | |
| |
Figures in millions unless otherwise stated | | | |
| | | |
Statement of financial position – Asanko | | | |
| | | |
| | | |
| | | |
| | | |
| | | |
Less: Shika redeemable preference shares | | | |
Net assets attributable to ordinary shareholders | | | |
Group's share of net assets | | | |
| | | |
| | | |
Less: Consideration allocated to the redeemable preference shares (note 17) | | | |
| | | |
Consideration paid for equity portion | | | |
| | | |
Share of accumulated losses brought forward | | | |
Share of profit after taxation before impairment | | | |
| | | |
Carrying amount of interest in joint venture | | | |
| | | |
Income statement – Asanko | | | |
| | | |
| | | |
Depreciation and amortisation | | | |
| | | |
| | | |
Profit for the year before impairment | | | |
Group's share of profit before impairment | | | |
Group's share of impairment3 | | | |
Group's share of total comprehensive income after impairment | | | |
1At 31 December 2023, includes impact of fair value adjustment, amounting to US$39.6 million (2022: US$39.6 million), to property, plant
and equipment of the Asanko Gold mine as determined at acquisition and impairment as discussed below.
2Current assets includes cash and cash equivalents amounting of US$138.6 million (2022: US$91.3 million).
3During 2021, the Asanko gold mine demonstrated negative grade reconciliations against the 2021 plan and as a result management
identified an impairment trigger and an impairment of US$52.8 million was recognised. Due to the re-evaluation of the geological modelling
by our JV partner, Galiano, which was not complete at 31 December 2021, Gold Fields was not in a position to provide a reserve and
resource estimate for Asanko as at 31 December 2021. Taking this into consideration, management modelled various scenarios for the
Asanko Life of Mine (“LoM”) in order to determine their best estimates of the future cash flows of the Asanko gold mine. The various LoM
scenario runs were undertaken in an attempt to model Asanko’s future cash flows in the absence of a revised Resource and Reserve at
31 December 2021. These scenarios were based on the pre-feasibility study completed in 2019, in order to declare a Reserve at
31 December 2019, but were modified where appropriate to reflect prevailing circumstances. Subsequent to 31 December 2021, Gold Fields
received additional information in respect of the Asanko gold mine. Gold Fields updated the valuation taking this information into
consideration and this did not have a material impact on the valuation of either the preference shares or the equity accounted investment.
During 2022, there were no changes in status with respect to the completion of the technical and economic work required to generate a
Reserve and Resources estimate based on a LoM. Taking this into consideration, management utilised the LoM developed for the 2022
impairment calculation and this resulted in no impairment for the year ended 31 December 2022. As a result of the sale transaction, the
investment in Asanko has been classified as an asset held for sale at 31 December 2023 and the investment is required to be measured
at the lower of carrying value or fair value less costs to sell. Management determined the fair value less costs to sell based on the
consideration to be received per the sale agreement, which resulted in an impairment of US$46.9m for the year ended 31 December 2023.
Refer notes 14 and 15 for further details.
Notes to the consolidated financial statements continued
for the year ended 31 December 2023
18.Equity accounted investees continued
(c)Windfall Project
On 2 May 2023, Gold Fields, through a 100% held Canadian subsidiary, acquired a 50% interest in the
Windfall Project in Québec, Canada, which is in the feasibility stage, from Osisko Mining Incorporated
(the “Partnership”).
Gold Fields and Osisko have joint control over the Windfall Project, the transaction is structured as a separate
vehicle and the Group has a residual interest in the net assets of the Windfall Project. Accordingly, the Group
has classified its interest in the Windfall Project as a joint venture. Refer note 17 for further details.
The Partnership has a 31 December year-end and has been equity accounted since 2 May 2023. The
Partnership’s equity accounting is based on results to 31 December 2023.
The following table summarises the financial information and the carrying amount of the Group’s interest in
the Partnership:
| | | | | | |
| | |
Figures in millions unless otherwise stated | | | | | | |
| | | | | | |
| | | | | | |
C$300.0 million cash payment | | | | | | |
C$33.8 million pre-closing paid amounts | | | | | | |
C$93.0 million cash calls | | | | | | |
Contingent and exploration considerations | | | | | | |
C$300.0 million contingent consideration | | | | | | |
| | | | | | |
– Net change in fair value | | | | | | |
C$75.0 million exploration consideration | | | | | | |
| | | | | | |
– Unwinding of discount rate | | | | | | |
| | | | | | |
| | | | | | |
Carrying value at 31 December | | | | | | |
1The Windfall Project share of loss for 2023 relates mainly to exploration expense.
The Group’s interest in the summarised financial statements of the Windfall Project on a combined basis after
fair value adjustments as determined at acquisition is as follows:
| | | | | | |
| | |
Figures in millions unless otherwise stated | | | | | | |
| | | | | | |
Statement of financial position – Windfall Project | | | | | | |
| | | | | | |
| | | | | | |
| | | | | | |
| | | | | | |
Group’s share of net assets | | | | | | |
1At 31 December 2023, includes impact of fair value adjustment to the exploration property as determined at acquisition.
2Non-current assets comprised mainly property, plant and equipment and exploration assets.
3Current assets include cash and cash equivalents amounting of US$20.4 million (C$27.0 million).
18.Equity accounted investees continued
| | | | | |
| | | |
| | Figures in millions unless otherwise stated | | | |
| | | | | |
| | | | | |
| | | | | |
| | Lunnon Metals Limited (“Lunnon”)1 | | | |
| | Rusoro Mining Limited (“Rusoro”) – recognised as an asset held for sale2 | | | |
| | | | | |
1During 2023, Gold Fields recognised a share of loss for the year of U$2.9 million (2022: US$1.9 million). Gold Fields’ interest in Lunnon was
31.06% (2022: 33.96%) at 31 December 2023.
2Represented a holding of 24.4% (2022: 24.8%) in Rusoro.
The carrying value of Rusoro was written down to US$nil at 31 December 2023 due to losses incurred by the entity. The fair value, based on
the quoted market price of the investment, in Rusoro at 31 December 2023 is US$64.5 million (2022: US$5.2 million).The unrecognised
share of loss of Rusoro for the year amounted to US$7.1 million (2022: US$3.8 million). The cumulative unrecognised share of losses of
Rusoro at 31 December 2023 amounted to US$221.8 million (2022: US$214.7 million).
On 22 August 2016, the Arbitration Tribunal, operating under the Additional Facility Rules of the World Bank’s International Centre for the
Settlement of Investment Disputes, awarded Rusoro damages of US$967.8 million plus pre- and post-award interest which currently equates
to in excess of US$1.7 billion in the arbitration brought by Rusoro against the Bolivarian Republic of Venezuela (“Venezuela”).
Venezuela has not complied with the arbitration award terms, which were issued on 22 August 2016. On 6 December 2017, Rusoro obtained
a judgment against Venezuela in the Superior Court of Justice in Ontario, Canada, in excess of US$1.3 billion at the time. The judgment,
which was issued on default as a result of Venezuela’s failure to appear before the Ontario court, arose out of Rusoro’s ongoing dispute
with Venezuela over the South American nation’s seizure of its gold mining properties in the country. The Canadian judgment, which
confirmed an arbitration award issued in Rusoro’s favour in the same amount, was issued on 25 April 2017. Venezuela did not appeal or
seek to vacate the judgment, and its time to do so expired.
Rusoro further filed a suit in the Supreme Court of the State of New York, seeking recognition of the Canadian judgment. Rusoro brought the
New York lawsuit in addition to an action it filed in the U.S. District Court for the District of Columbia, which seeks recognition of and the entry
of judgment on the original arbitration award. A favourable ruling from either the New York or D.C. court will entitle Rusoro to use all legal
procedures – including broad discovery from both Venezuela and third parties – that U.S. law provides judgment creditors. Any judgment
issued in New York will also accrue interest at 9% per annum until the judgment is fully paid. On 19 October 2018, Rusoro announced that it
had reached a settlement agreement with Venezuela by which the Venezuela government agreed to pay Rusoro US$1.28 billion to acquire
the Company’s mining data and full release of the judgment issued in favour of the Company. In a decision dated 29 January 2019, the Paris
Court of Appeals partially annulled the arbitral award issued in favour of the Company in August 2016. This annulment was overturned by
the French Supreme Court in March 2021. On 7 June 2022, the Paris Court of Appeal rejected a second application of the Bolivarian
Republic of Venezuela to annul the award of 22 August 2016.
On 10 July 2023, the U.S. Court of Appeals for the Third Circuit, which is based in Philadelphia, affirmed that Venezuala's state-owned oil
company is the country's alter ego and that its property may be seized in satisfaction of the Republic's judgment debt. Although the Court
has not issued a final determination on the relative priority of the various judgements, based on the guidelines set forth by the Court on
27 July 2023, Rusoro is seventh in order of priority behind approximately US$3.5 billion in claims from other claimants.
Management have not recognised this amount due to the uncertainty over its recoverability.
On 9 January 2024, Gold Fields announced that it has entered into a share purchase agreement with Fulcrum Global Markets LLC, a
Delaware limited liability company (“Fulcrum”), to sell its 140,000,001 common shares (“Common Shares”) in the capital of Rusoro for an
aggregate initial cash purchase price of US$62.3 million and additional contingent consideration upon the occurrence of specified events.
Refer note 15 for further details.
The investment in Rusoro have been presented as an asset held for sale as Fulcrum was in advanced discussions with Gold Fields at
31 December 2023 to purchase the Rusoro shares from Gold Fields. Refer note 14 for further details.
Notes to the consolidated financial statements continued
for the year ended 31 December 2023
19.Interest in joint operation
On 13 December 2016, Gold Fields purchased 50% of the Gruyere Gold Project and entered into a 50:50
unincorporated joint operation with Gold Road Resources Limited (“Gold Road”) for the development and operation
of the Gruyere Gold Project in Western Australia, which comprises the Gruyere gold deposit as well as additional
resources including Central Bore and Attila/Alaric.
The Gruyere project was successfully completed during 2019, with first gold produced in June 2019. Commercial
levels of production were achieved at the end of September 2019.
Below is a summary of Gold Fields’ share of the joint operation and includes inter-company transactions and
balances:
| | | | | | | |
| | | |
Figures in millions unless otherwise stated | | | | | | | |
| | | | | | | |
Statement of financial position | | | | | | | |
| | | | | | | |
Property, plant and equipment | | | | | | | |
| | | | | | | |
| | | | | | | |
Cash and cash equivalents | | | | | | | |
| | | | | | | |
| | | | | | | |
| | | | | | | |
| | | | | | | |
| | | | | | | |
| | | | | | | |
| | | | | | | |
| | | | | | | |
Finance lease liabilities | | | | | | | |
Environmental rehabilitation costs | | | | | | | |
| | | | | | | |
| | | | | | | |
Related entity loans payable | | | | | | | |
| | | | | | | |
Current portion of finance lease liabilities | | | | | | | |
| | | | | | | |
Total equity and liabilities | | | | | | | |
20.Investments
| | |
| |
Figures in millions unless otherwise stated | | |
| | |
| | |
At fair value through OCI1 | | |
| | |
Asanko redeemable preference shares2 | | |
| | |
| | |
Asanko redeemable preference shares – recognised as an asset held for sale2 | | |
| | |
1The listed investments comprise mainly investments in Galiano Gold Inc. (formerly Asanko Gold Inc.) of US$20.2 million (2022: US$11.7 million),
Magmatic Resources Limited of US$0.7 million (2022: US$1.2 million), Chakana Copper Corp of US$1.5 million (2022: US$2.0 million), Lefroy
Exploration Limited of US$2.6 million (2022: US$3.8 million,) Torq Resources Inc of US$2.5 million (2022: US$8.4 million), Tesoro Gold Limited of
US$4.1 million (2022: US$4.4 million) and Mineral Resources Limited of $31.2 million (2022: US$nil). Refer note 45 for further details of listed
investments.
2Consists of 132,439,999 (2022: 132,439,999) redeemable preference shares at par value for US$132,439,999 (2022: US$132,439,999).
3Other comprises bonds.
The following table shows a reconciliation from the fair value at the beginning of the year to the fair value of the redeemable preference shares at the
end of the year (level 3 financial instrument):
| | |
| |
Asanko redeemable preference shares | | |
| | |
Fair value at beginning of the year | | |
Net change in fair value (recognised in OCI) | | |
Fair value at end of the year | | |
The fair value is based on the expected cash flows of the Asanko Gold Mine and this resulted in a upward fair value adjustment through other
comprehensive income of US$39.4 million (2022: downward adjustment of US$34.2 million) in 2023, both years due to the change in the timing of the
expected cash flows.
The key inputs used in the valuation of the fair value are the discount rate of 19.9% (2022: 16.7%), the timing of the cash flows and gold price
assumptions.
Any reasonable change in the timing of the cash flows or market related discount rate could materially change the fair value of the redeemable
preference shares (refer to note 41 for sensitivity analysis performed).
On 21 December 2023, Gold Fields announced the divestment of its 45% shareholding in Asanko Gold (both the preference shares and equity-accounted
investee). The Asanko redeemable preference shares have been presented as an asset held for sale. Refer to notes 15 and 18 for further details.
21.Environmental trust funds
| | |
| |
Figures in millions unless otherwise stated | | |
| | |
Balance at beginning of the year | | |
| | |
| | |
| | |
Balance at end of the year1 | | |
1The trust funds consist of term deposits amounting to US$20.7 million (2022: US$20.0 million) in South Africa, as well as secured cash deposits
amounting to US$88.9 million (2022: US$78.8 million) in Ghana.
These funds are intended to fund environmental rehabilitation obligations of the Group’s mines and are not available for general purposes of the
Group. All income earned in these funds is re-invested or spent to meet these obligations. The obligations which these funds are intended to fund are
included in environmental rehabilitation costs under non-current provisions (refer to note 28.1). Refer to note 37 for details on environmental obligation
guarantees.
Notes to the consolidated financial statements continued
for the year ended 31 December 2023
22.Inventories
| | |
| |
Figures in millions unless otherwise stated | | |
| | |
Gold-in-process and stockpiles | | |
| | |
| | |
Heap leach and stockpiles inventories included in non-current assets1 | | |
Total current inventories2,3 | | |
1Heap leach and stockpiles inventories will only be processed at the end of life-of-mine.
2The cost of consumable stores consumed during the year and included in cost of sales amounted to US$400.8 million (2022: US$397.4 million).
3 During 2023, a net realisable value adjustment to stockpiles of US$33.8 million (2022: US$nil and 2021: US$nil) was processed at Damang.
23.Trade and other receivables
| | |
| |
Figures in millions unless otherwise stated | | |
| | |
Trade receivables – gold sales | | |
Trade receivables – copper concentrate | | |
Trade receivables – other | | |
| | |
| | |
Value Added Tax and import duties | | |
| | |
| | |
Trade and other receivables | | |
24.Cash and cash equivalents
| | |
| |
Figures in millions unless otherwise stated | | |
| | |
| | |
Total cash and cash equivalents1 | | |
1Cash and cash equivalents include secured cash deposits of US$59.6 million (2022: US$28.2 million) in Australia and US$20.0 million (2022:
US$10.0 million) in Peru, set aside for future rehabilitation costs. The contributions in Australia and Peru are pro-active and not legally required
by local legislation.
25.Stated capital
| | |
| |
Figures in millions unless otherwise stated | | |
| | |
Balance at beginning of the year | | |
Balance at end of the year | | |
| | |
| Number of shares in issue | Number of shares in issue |
| | |
| | |
Exercise of employee share options | | |
| | |
| | |
Authorised and issued
Holders of shares are entitled to dividends as declared from time to time and are entitled to one vote per share at
general meetings of the Company.
In terms of the general authority granted by shareholders at the AGM on 24 May 2023, the authorised but unissued
ordinary stated capital of the Company representing not more than 5% of the issued stated capital of the Company
from time to time at that date, after setting aside so many ordinary shares as may be required to be allotted and
issued pursuant to the share incentive schemes, was placed under the control of the Directors. This authority expires
at the next Annual General Meeting where shareholders will be asked to place under the control of the Directors the
authorised but unissued ordinary stated capital of the Company representing not more than 5% of the issued stated
capital of the Company from time to time.
In terms of the JSE Listings Requirements, shareholders may, subject to certain conditions, authorise the Directors to
issue the shares held under their control for cash, other than by means of a rights offer, to shareholders. In order that
the Directors of the Company may be placed in a position to take advantage of favourable circumstances which may
arise for the issue of such shares for cash, without restriction, for the benefit of the Company, shareholders will be
asked to consider a special ordinary resolution to this effect at the forthcoming AGM.
Repurchase of shares
The Company has not exercised the general authority granted to buy back shares from its issued ordinary stated
capital granted at the AGM held on 24 May 2023. Currently, the number of ordinary shares that may be bought back
in any one financial year may not exceed 10% of the issued ordinary share capital as of 24 May 2023. At the next
AGM, shareholders will be asked to renew the general authority for the acquisition by the Company, or a subsidiary
of the Company, of its own shares.
Beneficial shareholding
The following beneficial shareholders hold 3% or more of the Company’s listed ordinary shares at 31 December 2023:
| | |
| | % of issued ordinary shares |
| | |
Public Investment Corporation (Government Employees Pension Fund) | | |
VanEck Vectors Gold Miners ETF | | |
Notes to the consolidated financial statements continued
for the year ended 31 December 2023
26.Deferred taxation
The detailed components of the net deferred taxation liability which results from the differences between the
carrying amounts of assets and liabilities recognised for financial reporting and taxation purposes in different
accounting periods are:
| | |
| |
Figures in millions unless otherwise stated | | |
| | |
| | |
| | |
| | |
– Investment in environmental trust funds | | |
| | |
| | |
| | |
| | |
| | |
| | |
– Unredeemed capital expenditure1 | | |
| | |
| | |
Net deferred taxation liabilities | | |
Included in the statement of financial position as follows: | | |
| | |
Deferred taxation liabilities | | |
Net deferred taxation liabilities | | |
Balance at beginning of the year | | |
Recognised in profit or loss | | |
| | |
| | |
Balance at end of the year | | |
1Tax losses and unredeemed capital expenditure have been recognised, as disclosed in note 10, to the extent that the tax paying entities will have
taxable profits in the foreseeable future (per the life-of-mine models of the respective operations) in order to utilise the unused tax losses and
unredeemed capital expenditure before they expire. This was particularly assessed with reference to the South Deep and Damang life-of-mine
models.
27.Borrowings
The terms and conditions of outstanding loans are as follows:
| | | | | | | | | | |
| | | | | | | | |
Facility Figures in millions unless otherwise stated | | | | | | | | | | |
| | | | | | | | | | |
US$500 million 5-year notes issue (the 5-year notes)1 | | | | | | | | | | |
US$500 million 10-year notes issue (the 10-year notes)1 | | | | | | | | | | |
US$150 million revolving senior secured credit facility2 | | | | | | | | | | |
US$100 million revolving credit facility3 | | | | | | | | | | |
A$500 million syndicated revolving credit facility – old4 | | | | | | | | | | |
A$500 million syndicated revolving credit facility – new4 | | | | | | | | | | |
US$1,200 million revolving credit facilities – old5 | | | | | | | | | | |
– Facility A (US$600 million 3-year revolving credit facility) | | | | | | | | | | |
– Facility B (US$600 million 5-year revolving credit facility) | | | | | | | | | | |
US$1,200 million revolving credit facility – new5,6 | | | | | | | | | | |
R1,500 million Nedbank revolving credit facility7 | | | | | | | | | | |
R500 million Nedbank revolving credit facility7 | | | | | | | | | | |
R500 million Rand Merchant Bank revolving credit facility8 | | | | | | | | | | |
R1,000 million Rand Merchant Bank revolving credit facility8 | | | | | | | | | | |
R500 million Absa Bank revolving credit facility – old9 | | | | | | | | | | |
R500 million Absa Bank revolving credit facility – new9 | | | | | | | | | | |
R500 million Standard Bank revolving credit facility10 | | | | | | | | | | |
Short-term Rand uncommitted credit facilities11 | | | | | | | | | | |
| | | | | | | | | | |
| | | | | | | | | | |
| | | | | | | | | | |
1On 9 May 2019, Gold Fields successfully concluded the raising of two new bonds, a US$500 million 5-year notes issue with a coupon of 5.125% and a
US$500 million 10-year notes issue with a coupon of 6.125%, raising a total of US$1 billion at an average coupon of 5.625%.
The balances of the five-year notes and the 10-year notes are net of unamortised transaction costs amounting to US$0.4 million (2022: US$1.2 million) and
US$2.5 million (2022: US$3.0 million), respectively.
The payments of all amounts due in respect of the 5-year and 10-year notes are unconditionally and irrevocably guaranteed by Gold Fields Limited
(“Gold Fields”), Gold Fields Ghana Holdings (BVI) Limited (“GF Ghana”) and Gold Fields Holdings Company (BVI) Limited (“GF Holdings”) (collectively
“the Guarantors”), on a joint and several basis.
2On 15 April 2021, La Cima entered in a US$150 million revolving senior secured credit facility. Borrowings under the revolving senior secured credit facility
are secured by first-ranking assignments of all rights, title and interest in all of La Cima’s concentrate sale agreements. In addition, the offshore and onshore
collection accounts of La Cima are subject to an account control agreement and a first-ranking charge in favour of the lenders. This facility is non-recourse
to the rest of the Group.
3On 27 September 2021, Gold Fields Ghana Limited ("GF Ghana Limited") and Abosso Goldfields Limited ("Abosso") entered into a US$100 million revolving
credit facility. Borrowings under the facility are guaranteed by GF Ghana Limited and Abosso. This facility is non-recourse to the rest of the Group.
4On 19 November 2020, Gruyere Holdings Proprietary Limited entered into a A$500.0 million syndicated revolving credit facility.
On 26 September 2023, the old A$500 million syndicated revolving credit facility was refinanced with the new A$500 million syndicated revolving credit
facility and cancelled.
The new A$500 million syndicated revolving credit facility has a A$100 million accordion option (at the discretion of the lenders) and is a sustainability
linked facility. The new facility is linked to the achievement of three of Gold Fields’ key ESG priorities namely gender diversity, decarbonisation and water
stewardship. The achievement of the ESG metrics could impact the interest rate by up to a 0.05% decrease in rate to a 0.05% increase in rate.
Borrowings under the new facility are guaranteed by Gold Fields, GF Holdings, Orogen and Gruyere.
5On 25 July 2019, Gold Fields Orogen Holding (BVI) Limited and Gold Fields Ghana Holdings (BVI) Limited entered into a US$1,200 million revolving credit
facilities agreement which became effective on the same day, with a syndicate of international banks and financial institutions. The facilities comprised two
tranches, a US$600 million 3 year revolving credit facility (with an option to extend to up to 2 years subject to lender consent) and a US$600 million 5 year
revolving credit facility (with an option to extend to up to 2 years subject to lender consent).
In July 2020, US$870 million of the US$1,200 million revolving credit facilities were extended by one year as follows:
•Facility A: US$600 million up to 25 July 2022 then US$435 million from 26 July 2022 to 25 July 2023;
•Facility B: US$600 million up to 25 July 2024 then US$435 million from 26 July 2024 to 25 July 2025.
In July 2021, US$1,055 million of the US$1,200 million revolving credit facilities were extended, US$960 million by one year and US$95 million by two years
as follows:
•Facility A: USUS$600 million up to 25 July 2022 then US$550 million from 26 July 2022 to 25 July 2024;
•Facility B: US$600 million up to 25 July 2024 then US$505 million from 26 July 2024 to 25 July 2026.
On 25 May 2023, the old US$1,200 million revolving credit facilities were refinanced with the new US$1,200 million revolving credit facility and cancelled.
Refer footnote 6 for further details regarding the new facility.
6The new US$1,200 million revolving credit facility is a sustainability linked facility which is linked to the achievement of three of Gold Fields’ key ESG
priorities namely gender diversity, decarbonisation and water stewardship. The achievement of the ESG metrics could impact the interest rate by up to a
0.05% decrease in rate to a 0.05% increase in rate.
The key terms of the new facility are:
•A principal loan amounting to US$1,200 million, with an option subject to lender consent, to increase the facility by up to US$400.0 million;
•Maturity of five years, with an option to extend the tenor through two one-year extensions;
•A competitive margin, subject to rating margin achievements and sustainability margin adjustments. The rating margin achievements and sustainability
margin adjustments could impact the interest rates.
During October 2023, the facility was amended to include Gold Fields Windfall Holding Inc ("Windfall") as a borrower that may borrow up to C$800 million.
As a result, the facility became a multi-currency (US$ and C$) facility from this date. Borrowings under this facility are guaranteed by Gold Fields, GF
Holdings, Orogen and Windfall.
7On 8 May 2023, the R1,500 million Nedbank revolving credit facility matured and was replaced with the R500 million Nedbank revolving credit facility.
Borrowings under the new facility are guaranteed by Gold Fields, GF Holdings, Orogen, GFO and GFIJVH.
8On 19 April 2023 the R500 million Rand Merchant Bank revolving credit facility matured and was replaced with the R1,000 million Rand Merchant Bank
revolving credit facility. Borrowings under the new facility are guaranteed by Gold Fields, GF Holdings, Orogen, GFO and GFIJVH.
9On 5 May 2023, the old R500 million Absa Bank revolving credit facility matured and was replaced with the new R500 million Absa Bank revolving credit
facility. Borrowings under the new facility are guaranteed by Gold Fields, GF Holdings, Orogen, GFO and GFIJVH.
10On 8 May 2023, GFO and GFIJVH entered into a R500 million Standard Bank revolving credit facility.
Borrowings under the facility are guaranteed by Gold Fields, GF Holdings, Orogen, GFO and GFIJVH.
11The Group has access to uncommitted loan facilities from some of the major banks. These facilities have no fixed terms, are short-term in nature and
interest rates are market related. Borrowings under these facilities are guaranteed by Gold Fields.
Notes to the consolidated financial statements continued
for the year ended 31 December 2023
27.Borrowings continued
| | | | |
| | | |
| | Figures in millions unless otherwise stated | | |
| | | | |
| | US$500 million 5-year notes issue | | |
| | Balance at beginning of the year | | |
| | Unwinding of transaction costs | | |
| | Balance at end of the year | | |
| | US$500 million 10-year notes issue | | |
| | Balance at beginning of the year | | |
| | Unwinding of transaction costs | | |
| | Balance at end of the year | | |
| | US$150 million revolving senior secured credit facility | | |
| | Balance at beginning of the year | | |
| | Balance at end of the year | | |
| | A$500 million syndicated revolving credit facility – old | | |
| | | | |
| | | | |
| | | | |
| | Balance at end of the year | | |
| | A$500 million syndicated revolving credit facility – new | | |
| | | | |
| | | | |
| | | | |
| | Balance at end of the year | | |
| | US$1,200 million revolving credit facilities – old | | |
| | | | |
| | | | |
| | Balance at end of the year | | |
| | A$1,200 million revolving credit facility – new | | |
| | | | |
| | Balance at end of the year | | |
| | | | |
1The US$155.9 million includes Canadian dollar drawdowns by Windfall amounting to US$23.9 million (C$31.6 million) in 2023.
27.Borrowings continued
| | | |
| | |
| Figures in millions unless otherwise stated | | |
| | | |
| The exposure of the Group’s borrowings to interest rate changes and the contractual repricing dates at the reporting dates are as follows: | | |
| Variable rate with exposure to repricing (six months or less) | | |
| Fixed rate with no exposure to repricing | | |
| | | |
| The carrying amounts of the Group’s borrowings are denominated in the following currencies: | | |
| | | |
| | | |
| | | |
| The Group has the following undrawn borrowing facilities: | | |
| | | |
| | | |
| | | |
| All of the above undrawn committed facilities have floating rates. The uncommitted facilities have no expiry dates and are open ended. Undrawn committed facilities have the following expiry dates: | | |
| | | |
| – later than one year and not later than two years | | |
| – later than two years and not later than three years | | |
| – later than three years and not later than five years | | |
| | | |
Notes to the consolidated financial statements continued
for the year ended 31 December 2023
28.Provisions
| | | |
| | |
| Figures in millions unless otherwise stated | | |
| | | |
| Environmental rehabilitation costs | | |
| Silicosis settlement costs | | |
| | | |
| | | |
| Current portion of provisions | | |
| Non-current portion of provisions | | |
| Environmental rehabilitation costs | | |
| Balance at beginning of the year | | |
| Changes in estimates – capitalised1 | | |
| Changes in estimates – recognised in profit or loss1 | | |
| | | |
| | | |
| | | |
| Balance at end of the year2 | | |
| Current portion of environmental rehabilitation costs | | |
| Non-current portion of environmental rehabilitation costs | | |
| The provision is calculated using the following gross closure cost estimates: | | |
| | | |
| | | |
| | | |
| | | |
| | | |
| Total gross closure cost estimates | | |
| | | | | | |
| The provision is calculated using the following assumptions: | | | | Inflation rate Year 4 onwards | |
| | | | | | |
| | | | | | |
| | | | | | |
| | | | | | |
| | | | | | |
| | | | | | |
| | | | | | |
| | | | | | |
| | | | | | |
| | | | | | |
| | | | | | |
| | | | | | |
| | | | | | |
1Changes in estimates are defined as changes in reserves and corresponding changes in life of mine as well as changes in laws and regulations
governing environmental matters, closure cost estimates and discount rates. The increase is mainly due to higher gross closure cost estimates.
2South African, Ghanaian, Australian and Peruvian mining companies are required by law to undertake rehabilitation as part of their ongoing
operations. These environmental rehabilitation costs are funded as follows:
•Ghana – reclamation bonds underwritten by banks and restricted cash (refer to note 21);
•South Africa – contributions into environmental trust funds (refer to note 21) and guarantees (refer to note 37);
•Australia – mine rehabilitation fund levy and restricted cash (refer note 21); and
•Peru – bank guarantees (refer note 37) and restricted cash (refer to note 21).
28.Provisions continued
| | | |
| | |
| Figures in millions unless otherwise stated | | |
| | | |
| Silicosis settlement costs1 | | |
| Balance at the beginning of the year | | |
| | | |
| Unwinding of provision recognised as finance expense | | |
| | | |
| | | |
| Balance at end of the year | | |
| Current portion of silicosis settlement costs | | |
| Non-current portion of silicosis settlement costs | | |
1The principal health risks associated with Gold Fields’ mining operations in South Africa arise from occupational exposure to silica dust, noise, heat
and certain hazardous chemicals. The most significant occupational diseases affecting Gold Fields’ workforce include lung diseases (such as
silicosis, tuberculosis, a combination of the two and chronic obstructive airways disease (“COAD”) as well as noise induced hearing loss (“NIHL”)).
A consolidated application was brought against several South African mining companies, including Gold Fields, for certification of a class action on
behalf of current or former mineworkers (and their dependants) who have allegedly contracted silicosis and/or tuberculosis while working for one
or more of the mining companies listed in the application.
This matter was previously disclosed as a contingent liability as the amount could not be estimated reliably. As a result of the ongoing work of the
Gold Working Group (comprising African Rainbow Minerals, Anglo American SA, AngloGold Ashanti, Gold Fields, Harmony and Sibanye-Stillwater)
(the “GWG Parties”) and engagements with affected stakeholders since 31 December 2016, Gold Fields was able to reliably estimate its share in
the estimated cost in relation to the GWG Parties of a possible settlement of the class action claims and related costs during 2017. As a result,
Gold Fields provided an amount of US$5.1 million (R93.8 million) (2022: US$10.5 million (R178.9 million)) for this obligation in the statement of
financial position at 31 December 2023. The nominal amount of this provision is US$7.2 million (R131.6 million). Gold Fields believes that this remains
a reasonable estimate of its share of the settlement of the class action claims and related costs.
The assumptions that were made in the determination of the provision include silicosis prevalence rates, estimated settlement per claimant, benefit
take-up rates and disease progression rates. A discount rate of 9.27% (2022: 9.22%) was used, based on government bonds with similar terms to
the anticipated settlements. Refer to note 38 for further details.
29.Long-term incentive plan
| | | |
| | |
| Figures in millions unless otherwise stated | | |
| | | |
| | | |
| Charge to income statement | | |
| Salares Norte project costs capitalised | | |
| | | |
| | | |
| Balance at end of the year1,2 | | |
| Current portion of long-term incentive plan | | |
| Non-current portion of long-term incentive plan | | |
1Senior and middle management receive awards under the LTIP. The performance conditions of the LTIP are approved annually by the
Remuneration Committee. Performance conditions are based on the same conditions as the share-based payments plan. The expected timing of
the cash outflows in respect of each grant is at the end of three years after the original award was made. The higher charge in 2023 was mainly
due to the improved vesting percentages on the absolute and relative Gold Fields share price performance.
2The value of instruments granted during the year ended 31 December 2023, 2022 and 2021 were valued using the Monte Carlo simulation model:
| | | |
| | | |
| | | |
The inputs to the model for instruments granted during the year were as follows: | | | |
– weighted average historical volatility (based on a statistical analysis of the share price on a weighted moving average basis for the expected term of the option) | | | |
| | | |
| | | |
– average three-year risk free interest rate (based on US interest rates) | | | |
– weighted average fair value (United States dollars) | | | |
| | | |
*There is no dividend yield applied to the Monte Carlo simulation model as the performance conditions follow a total shareholder return method.
Notes to the consolidated financial statements continued
for the year ended 31 December 2023
30.Trade and other payables
| | | | |
| | |
| Figures in millions unless otherwise stated | | | |
| | | | |
| | | | |
| Accruals and other payables | | | |
| | | | |
| | | | |
| Interest payable on loans | | | |
| Damang – contract termination | | | |
| | | | |
31.Cash generated by operations
| | | | | | |
| | |
| Figures in millions unless otherwise stated | | | | | |
| | | | | | |
| Profit from continuing operations1 | | | | | |
| Adjusted for non-cash items: | | | | | |
| – Mining and income taxation | | | | | |
| | | | | | |
| – Amortisation and depreciation | | | | | |
| – Interest expense – environmental rehabilitation | | | | | |
| – Non-cash rehabilitation expense/(income) | | | | | |
| – Interest received – environmental trust funds | | | | | |
| – Impairment of investments and assets | | | | | |
| – Write-off of exploration and evaluation assets | | | | | |
| – Profit on disposal of assets | | | | | |
| – Unrealised (gain)/loss and prior year mark-to-market reversals on derivative contracts | | | | | |
| – Fair value gain on Maverix warrants | | | | | |
| – Silicosis settlement costs | | | | | |
| | | | | | |
| – Long-term incentive plan expense | | | | | |
| – Borrowing costs capitalised | | | | | |
| – Share of results of equity-accounted investees, net of taxation | | | | | |
| – Ghana expected credit loss | | | | | |
| – Net realisable value adjustment to Damang stockpiles | | | | | |
| | | | | | |
| | | | | | |
| | | | | | |
| | | | | | |
| – Payment of long-term incentive plan | | | | | |
| – Environmental rehabilitation payments | | | | | |
| Total cash generated by operations | | | | | |
1Profit for the year of US$708.7 million in 2022 includes the Yamana break fee of US$300.0 million and Yamana related costs of US$33.0 million.
32.Change in working capital
| | | |
| |
Figures in millions unless otherwise stated | | | |
| | | |
| | | |
Trade and other receivables | | | |
| | | |
Total change in working capital | | | |
33.Royalties paid
| | | |
| |
Figures in millions unless otherwise stated | | | |
| | | |
Amount owing at beginning of the year | | | |
| | | |
Amount owing at end of the year | | | |
| | | |
| | | |
34.Taxation paid
| | | |
| |
Figures in millions unless otherwise stated | | | |
| | | |
Amount payable/(receivable) at beginning of the year | | | |
SA and foreign current taxation recognised in profit or loss | | | |
Amount (receivable)/payable at end of the year1 | | | |
| | | |
| | | |
1Amount (receivable)/payable comprises as follows:
| | | |
| |
Figures in millions unless otherwise stated | | | |
| | | |
Non-current taxation receivable* | | | |
Current taxation receivable | | | |
| | | |
Taxation (receivable)/payable at the end of the year | | | |
*The non-current taxation receivable of US$75.7 million (CAD100.3 million) (2022: current taxation receivable of US$76.0 million (CAD100.3 million)) at
31 December 2023 relates to the withholding tax deducted and paid to the Canadian tax authority in 2022 on the Yamana break fee which has been
classified as non-current in 2023. Gold Fields continues to believe that it will recover the withholding tax from the Canadian tax authority.
35.Retirement benefits
| | | |
| |
Figures in millions unless otherwise stated | | | |
| | | |
All employees are members of various defined contribution retirement schemes. | | | |
Contributions to the various retirement schemes are fully expensed during the period in which they are incurred. | | | |
| | | |
Notes to the consolidated financial statements continued
for the year ended 31 December 2023
36.Lease liabilities
| | |
| |
Figures in millions unless otherwise stated | | |
| | |
Balance at the beginning of the year1 | | |
Additions during the year2 | | |
Remeasurements of leases during the year3 | | |
| | |
Repayments of principal amount | | |
Repayments of interest expense | | |
| | |
Balance at the end of the year | | |
Current portion of lease liability | | |
Non-current portion of lease liability | | |
Lease liabilities are payable as follows: | | |
Future minimum lease payments | | |
| | |
– later than one and not later than five years | | |
| | |
| | |
| | |
| | |
– later than one and not later than five years | | |
| | |
| | |
Present value of minimum lease payments | | |
| | |
– later than one and not later than five years | | |
| | |
| | |
1Leases entered into related mainly to power purchase agreements, rental of gas pipelines, ore haulage and site services, mining equipment hire,
transportation contracts, property rentals and other equipment rentals.
2The additions in 2023 relate mainly to additional assets in terms of mining contracts and power purchase agreements at Australia (2022:
additional assets in terms of mining contracts and power purchase agreements at Australia).
3The remeasurements in 2023 relate mainly to leases at the Group’s Australian operations that have variable payments linked to the Australian
consumer price index (“CPI”) (2022: Leases at the Group’s Australian operations that have variable payments linked to the Australian CPI).
37.Commitments
| | |
| |
Figures in millions unless otherwise stated | | |
| | |
| | |
| | |
1Contracted for capital expenditure of US$161.6 million (2022: US$78.1 million) includes US$115.2 million (2022: US$31.6 million) for Salares Norte.
Lease contracts
| | | | |
| |
Lease contracts1 Figures in millions unless otherwise stated | Undiscounted lease liabilities2 | | Fully variable lease payments4 | |
| | | | |
| | | | |
| | | | |
– later than one and not later than five years | | | | |
| | | | |
| | | | |
| | | | |
| | | | |
– later than one and not later than five years | | | | |
| | | | |
| | | | |
1No leases were entered into during 2023 or 2022 for which the use of the assets has not yet commenced at year-end.
2The undiscounted lease liabilities relate to the gross cash flows used to determine the lease liabilities in terms of IFRS 16 Leases and will not agree
to the leases recognised in note 36.
3The non-lease elements are the amounts in the lease contracts relating mainly to contractor mining and power purchase agreements that are not
accounted for as part of the lease liabilities.
4These are the total commitments per lease contracts relating mainly to contractor mining and power purchase agreements where the payments
have been determined to be fully variable, as a result no lease liability has been recorded. Included in these amounts are payment for non-lease
elements of the arrangement.
Guarantees
The Group provides environmental obligation guarantees and other guarantees with respect to its South African,
Peruvian, Ghanaian and Australian operations. These guarantees amounted to US$221.0 million at 31 December
2023 (2022: US$213.6 million) (refer note 28.1).
Notes to the consolidated financial statements continued
for the year ended 31 December 2023
38.Contingent liabilities
Randgold and Exploration summons
On 21 August 2008, Gold Fields Operations Limited (“GFO”) formerly known as Western Areas Limited, a subsidiary
of Gold Fields, received a summons from Randgold and Exploration Company Limited (“R&E”) and African Strategic
Investment (Holdings) Limited. The summons claims that during the period that GFO was under the control of Brett
Kebble, Roger Kebble and others, GFO assisted in the unlawful disposal of shares owned by R&E in Randgold
Resources Limited (“Resources”) and Afrikander Lease Limited, now Uranium One.
The claims have been computed in various ways. The highest value of the claims, as they currently stand, equates to
approximately R43.7 billion (US$2.4 billion).
Simultaneously with delivering its plea, GFO joined certain third parties to the action in order to enable it to claim
compensation against such third parties in the event that the plaintiffs are successful in one or more of their claims.
In addition, notices in terms of section 2(2)(b) of the Apportionment of Damages Act, 1956 were served on various
parties by GFO, in order to enable it to make a claim for a contribution against such parties in terms of the
Apportionment of Damages Act, should the plaintiffs be successful in one or more of its claims.
GFO’s assessment is that it has sustainable defences to these claims and, accordingly, GFO’s attorneys have been
instructed to vigorously defend the claims.
The ultimate outcome of the claims cannot presently be determined and, accordingly, no adjustment for any effects
on the Group that may result from these claims, if any, has been made in the consolidated financial statements.
Silicosis and Tuberculosis
Class Action Settlement
The Tshiamiso Trust has been established to carry out the terms of the settlement agreement reached between six
gold mining companies (including Gold Fields) and claimant attorneys in the Silicosis and Tuberculosis class action.
The Tshiamiso Trust is responsible for ensuring that all eligible current and former mineworkers across southern
Africa with Silicosis or work-related Tuberculosis (or their dependents where the mineworker has passed away) are
compensated pursuant to the Silicosis and Tuberculosis Class Action Settlement Agreement.
Financial provision raised
Gold Fields has provided for the estimated cost of the above settlement based on actuarial assessments and the provisions
of the Silicosis and Tuberculosis Settlement Agreement. At 31 December 2023, the provision for Gold Fields’ share of the
settlement of the class action claims and related costs amounted to US$5.1 million (R93.8 million) (2022: US$10.5 million
(R178.9 million)). The nominal value of this provision is US$7.2 million (R131.6 million).
Compared to previous years, we now have more reasonably developed and reliable claims data available from the
Trust, which can be used to support the actuarial model methods and assumptions. The main reasons for the
significant decrease in Gold Fields’ share of the estimated cost are:
•A decrease in the estimated take-up rate: based on the Trust’s claims data, longer-term estimates indicate that
lodgements and eligibility rates will continue to decrease, which will result in the estimated take-up rate (i.e. the
proportion of all eligible claimants that will claim and be paid) being decreased from 70% to a more reasonable
estimated take-up rate of 66%;
•Change in actuarial method and assumptions based on the more reasonably developed and reliable claims data
(particularly in relation to paid claims) available from the Trust;
•A decrease in Gold Fields’s share of the total estimated cost of the class action settlement from 6.1% in 2022 to
5.1% in 2023; and
•The contributions paid during 2023 by Gold Fields to the Trust of R19.5 million (US$1.1 million) (2022: R6.1 million
(US$0.4 million)) (Benefit and Administration contributions) which is a settlement of the previous year's current
portion.
The ultimate outcome of this matter however remains uncertain, with the number of eligible workers successfully
submitting claims and receiving compensation being uncertain. The provision is consequently subject to adjustment
in the future.
38.Contingent liabilities continued
Acid mine drainage
Acid mine drainage (“AMD”) or acid rock drainage (“ARD”), collectively called acid drainage (“AD”) is formed when
certain sulphide minerals in rocks are exposed to oxidising conditions (such as the presence of oxygen, combined
with water). AD can occur under natural conditions or as a result of the sulphide minerals that are encountered and
exposed to oxidation during mining or during storage in waste rock dumps, ore stockpiles or tailings storage
facilities. The acidic water that forms usually contains iron and other metals if they are contained in the host rock.
Gold Fields has identified incidences of AD, and the risk of potential short-term and long-term AD issues, specifically
at its Cerro Corona, South Deep and St Ives mines.
Gold Fields commissioned technical studies at Cerro Corona, starting in 2015 to 2022, to investigate technical
solutions, to better inform appropriate short- and long-term mitigation strategies for AD management and to work
towards a reasonable cost estimate of potential issues. While progress has been made in addressing potential long-
term AD risks, Gold Fields is not able to generate a reliable estimate of the total potential impact on the Group. Cerro
Corona continues to investigate technical solutions to better inform appropriate short and long-term mitigation
strategies for ARD management and to work towards a reasonable cost estimate of these potential issues.
South Deep has concluded technical studies which have indicated that, subject to the implementation of targeted
mitigation measures and no regional hydrogeological changes, AD generation will be mitigated and/or contained,
thus resulting in no potential residual environmental risk. South Deep continues to implement required mitigation
measures to prevent AD. Due to the inherent uncertainty on the outcome of the cessation of dewatering of Cooke 4
(Ezulwini) over which South Deep does not have control, together with the application made by Rand Uranium
(a subsidiary of Sibanye Stillwater) for the closure of Cooke 3, 2 and 1 shafts, which would result in the re-watering
of these shafts, along with other possible hydrogeological influences unrelated to South Deep in the future, the post
closure water liability continues to be a contingent liability.
St Ives has undertaken material characterisation at the Cave Rocks project since 2006. Physical, chemical and
geochemical assessments have been undertaken during this time to assess both cover material properties and
propensity for AD.
No adjustment for any effects on the Group that may result from AD, if any, has been made in the consolidated
financial statements other than through the Group’s normal environmental rehabilitation costs provision (refer
note 28.1).
39.Events after the reporting date
Final dividend
On 22 February 2024, Gold Fields declared a final dividend of 420 SA cents per share.
Rusoro
On 9 January 2024, Gold Fields announced that it has entered into a share purchase agreement with Fulcrum Global
Markets LLC, a Delaware limited liability company, to sell its 140,000,001 common shares in the capital of Rusoro for
an aggregate initial cash purchase price of US$62.3 million and certain additional contingent consideration upon the
occurrence of specified events. Refer note 15 for further details.
The transaction was concluded on 22 January 2024 when the US$62.3 million was received by Gold Fields.
Asanko Gold
On 21 December 2023, Gold Fields announced the divestment of its 45% shareholding in Asanko Gold to the joint
venture partner Galiano Gold for a total consideration of US$170 million. Gold Fields will also receive a 1% net smelter
royalty on future production from the Nkran deposit, the main deposit at the mine. The transaction was subject to a
number of conditions and was concluded on 4 March 2024 with the receipt of US$65 million in cash and 28.5 million
in Galiano shares.
The investment in Asanko Gold, including the Asanko redeemable preference shares, has been presented as an
asset held for sale. The share of results of equity investee of Asanko Gold have been presented as a discontinued
operation in the consolidated financial statements and the comparative income statement have been presented as
if Asanko Gold had been discontinued from the start of the comparative years. Refer notes 14, 15, 18 and 20 for
further details.
Notes to the consolidated financial statements continued
for the year ended 31 December 2023
40.Financial instruments
Accounting classifications and fair values
The following tables show the carrying amounts and fair values of financial assets and financial liabilities.
| | | | | | |
| |
| | | |
Figures in millions unless otherwise stated | Fair value through profit or loss | | Financial assets measured at amortised cost | Other financial liabilities measured at amortised cost | | |
| | | | | | |
| | | | | | |
Financial assets measured at fair value | | | | | | |
– Trade receivables from provisional copper sales | | | | | | |
| | | | | | |
– Asanko redeemable preference shares | | | | | | |
| | | | | | |
Financial assets not measured at fair value | | | | | | |
– Environmental trust funds | | | | | | |
– Trade and other receivables | | | | | | |
– Cash and cash equivalents | | | | | | |
| | | | | | |
Financial liabilities measured at fair value | | | | | | |
– Windfall Project – contingent consideration1 | | | | | | |
| | | | | | |
Financial liabilities not measured at fair value | | | | | | |
| | | | | | |
– Windfall Project – exploration consideration | | | | | | |
– Trade and other payables | | | | | | |
| | | | | | |
| | | | | | |
1 The Group elected to capitalise fair value movements in the contingent consideration to the equity accounted investee. Refer note 17. |
| |
| | | |
Figures in millions unless otherwise stated | Fair value through profit or loss | | Financial assets measured at amortised cost | Other financial liabilities measured at amortised cost | | |
| | | | | | |
| | | | | | |
Financial assets measured at fair value | | | | | | |
– Environmental trust funds | | | | | | |
– Trade receivables from provisional copper sales | | | | | | |
| | | | | | |
– Asanko redeemable preference shares | | | | | | |
| | | | | | |
Financial assets not measured at fair value | | | | | | |
– Environmental trust funds | | | | | | |
– Loan advanced – contractor | | | | | | |
– Trade and other receivables | | | | | | |
– Cash and cash equivalents | | | | | | |
| | | | | | |
Financial liabilities not measured at fair value | | | | | | |
| | | | | | |
– Trade and other payables | | | | | | |
| | | | | | |
| | | | | | |
40.Financial instruments continued
The following methods and assumptions were used to estimate the fair value of each class of financial instrument:
Trade and other receivables, trade and other payables and cash and cash equivalents
The carrying amounts approximate fair values due to the short maturity of these instruments.
Loan advanced – contractor
The fair value of the loan advanced to contractor approximates the carrying amount, determined using the
discounted cash flow method using market related interest rates.
Investments and redeemable preference shares
The fair value of publicly traded instruments (listed investments) is based on quoted market values. Asanko
redeemable preference shares are accounted for at fair value based on the expected cash flows set out in note 17.
Oil, gold, copper and foreign exchange derivative contracts
The fair values of these contracts are determined by using the applicable valuation models for each instrument type
with the key inputs being forward prices, interest rates and volatilities.
Environmental trust funds
The environmental trust funds are measured at fair value through profit or loss and amortised cost which
approximates fair value based on the nature of the fund’s underlying investments.
Borrowings
The five-year notes and the 10-year notes (2022: the five-year notes and the 10-year notes) are issued at a fixed
interest rate. The fair values of these notes are based on listed market prices. The fair value of the remaining
borrowings approximates their carrying amount, determined using the discounted cash flow method using market
related interest rates.
Windfall Project – contingent and exploration considerations n
The values are based on the expected cash flows of the respective considerations. Refer notes 17(c) and (d) for the
key inputs used in the valuation of the values.
Fair value hierarchy
The Group has the following hierarchy for measuring the fair value of assets and liabilities at the reporting date:
Level 1
Unadjusted quoted prices in active markets for identical assets or liabilities;
Level 2
Inputs other than quoted prices in level 1 that are observable for the asset or liability, either directly (as prices) or
indirectly (derived from prices); and
Level 3
Inputs for the asset or liability that are not based on observable market data (unobservable inputs).
The Group recognises transfers between levels of the fair value hierarchy at the end of the reporting period during
which the change has occurred. There were no transfers during the years ended 31 December 2023 and 2022.
Notes to the consolidated financial statements continued
for the year ended 31 December 2023
40.Financial instruments continued
The following table sets out the Group’s financial assets and financial liabilities by level within the fair value hierarchy
at the reporting date:
| | | | | | | | |
| |
| | |
Figures in millions unless otherwise stated | | | | | | | | |
| | | | | | | | |
Financial assets measured at fair value | | | | | | | | |
Environmental trust funds | | | | | | | | |
Trade receivables from provisional copper sales | | | | | | | | |
| | | | | | | | |
Asanko redeemable preference shares | | | | | | | | |
Financial assets not measured at fair value | | | | | | | | |
Environmental trust funds | | | | | | | | |
Loan advanced – contractor | | | | | | | | |
Financial liabilities measured at fair value | | | | | | | | |
Windfall Project – contingent consideration | | | | | | | | |
Financial liabilities not measured at fair value | | | | | | | | |
| | | | | | | | |
Environmental trust funds
The environmental trust funds are measured at fair value through profit or loss and amortised cost which
approximates fair value based on the nature of the fund’s underlying investments.
Trade receivables from provisional copper sales
Valued using quoted market prices based on the forward London Metal Exchange (“LME”) and, as such, is classified
within level 2 of the fair value hierarchy.
Listed investments
Comprise equity investments in listed entities and are therefore valued using quoted market prices in active markets.
Asanko redeemable preference shares
The fair value is based on the expected cash flows of the Asanko Gold Mine based on the life-of-mine model. Refer
to note 20 for key inputs.
Windfall Project – contingent consideration
The fair values are based on the expected cash flows of the respective considerations. Refer note 17 for the key
inputs used in the valuation of the fair values.
Borrowings
The 5-year notes and the 10-year notes (2022: the 5-year notes and the 10-year notes) are issued at a fixed interest
rate. The fair values of these notes are based on listed market prices and are classified within level 1 of the fair value
hierarchy. The fair value of the remaining borrowings approximates their carrying amount, determined using the
discounted cash flow method and market related interest rates and are classified within level 3 of the fair value
hierarchy.
Loan advanced – contractor
The fair value of the contractor loan approximates its carrying amount, determined using the discounted cash flow
method and market related interest rates and is classified within level 3 of the fair value hierarchy.
41.Risk management activities
In the normal course of its operations, the Group is exposed to commodity price, currency, interest rate, liquidity,
equity price and credit risk. In order to manage these risks, the Group has developed a comprehensive risk
management process to facilitate control and monitoring of these risks.
Controlling and managing risk in the Group
Gold Fields has policies in areas such as counterparty exposure, hedging practices and prudential limits which have
been approved by Gold Fields’ Board of Directors. Management of financial risk is centralised at Gold Fields’ treasury
department (“Treasury”), which acts as the interface between Gold Fields’ operations and counterparty banks.
Treasury manages financial risk in accordance with the policies and procedures established by the Gold Fields’
Board of Directors and Executive Committee.
Gold Fields’ Board of Directors has approved dealing limits for money market, foreign exchange and commodity
transactions, which Gold Fields’ Treasury is required to adhere to. Among other restrictions, these limits describe
which instruments may be traded and demarcate open position limits for each category as well as indicating
counterparty credit related limits. The dealing exposure and limits are checked and controlled each day and reported
to the Chief Financial Officer.
The objective of Treasury is to manage all financial risks arising from the Group’s business activities in order to
protect profit and cash flows. Treasury activities of Gold Fields Limited and its subsidiaries are guided by the
Treasury Framework and the Treasury Process Control Manual, as well as domestic and international financial market
regulations. Treasury activities are currently performed within the Treasury Framework with appropriate resolutions
from the Board of Gold Fields Limited, which are reviewed and approved annually by the Audit Committee.
The financial risk management objectives of the Group are defined as follows:
| | |
Risk management objectives | | |
| | |
| | |
| | The objective is to only deal with approved counterparts that are of a sound financial standing. The Group is limited to a maximum investment of 2.5% of the financial institutions’ equity, which is dependent on the institutions’ national credit rating. The credit rating used is Fitch Ratings’ short-term credit rating for financial institutions. |
Investment risk management | | The objective is to achieve optimal returns on surplus funds. |
| | |
Liquidity risk management | | The objective is to ensure that the Group is able to meet its short-term commitments through the effective and efficient usage of credit facilities and cash resources. |
| | The objective is to meet funding requirements timeously and at competitive rates by adopting reliable liquidity management procedures. |
| | |
| | The objective is to manage the adverse effect of the currency fluctuations on the Group’s results. |
Interest rate risk management | | The objective is to identify opportunities to prudently manage interest rate exposures. |
Commodity price risk management | | The Group’s policy is to remain unhedged to the gold price. However, hedges are sometimes undertaken as follows: •to protect cash flows at times of significant expenditure; •for specific debt servicing requirements; and •to safeguard the viability of higher cost operations. |
| | |
Operational risk management | | The objective is to implement controls to adequately mitigate the risk of error and/or fraud to an acceptable level. |
Banking relations management | | The objective is to maintain relationships with credible financial institutions and ensure that all contracts and agreements related to risk management activities are coordinated and consistent throughout the Group and that they comply where necessary with all relevant regulatory and statutory requirements. |
Notes to the consolidated financial statements continued
for the year ended 31 December 2023
41.Risk management activities continued
Credit risk
Credit risk is the risk of financial loss to the Group if a customer or counterparty to a financial instrument fails to meet
its contractual obligations, and arises principally from the Group’s receivables from customers, cash and cash
equivalents as well as environmental trust funds.
The Group has reduced its credit exposure by dealing with a number of counterparties. The Group approves these
counterparties according to its risk management policy and ensures that they are of good credit quality.
The combined maximum credit risk exposure of the Group is as follows:
| | |
| |
Figures in millions unless otherwise stated | | |
| | |
Environmental trust funds | | |
Trade and other receivables1 | | |
Loan advanced – contractor | | |
Cash and cash equivalents | | |
1Trade and other receivables above exclude VAT, prepayments, payroll receivables and diesel rebates amounting to US$159.9 million (2022:
US$126.2 million).
Expected credit loss assessment for customers
The Group determines each exposure to credit risk based on data that is determined to be predictive of the risk of
loss and past experienced credit judgement.
Trade and other receivables
The Group’s exposure to credit risk is influenced mainly by the individual characteristics of each customer. The
Group also considers other factors that might impact on the credit risk of its customer base including default risk and
the country in which the customer operates.
Impairment of trade receivables, carried at amortised cost, has been determined using the simplified expected credit
loss (“ECL”) approach and reflects the short term maturities of the exposures. Gold revenue is recognised at the
same time as receipt of the cash, except in Ghana where the cash is received one day after revenue recognition.
In Peru, for the sale of copper concentrate, 90% of the cash is received when the revenue is recognised and the
remaining 10% cash is received at the end of the quotational period.
Receivables due from the sale of the Tarkwa mining fleet were assessed using the simplified approach using the
lifetime ECL. The ECL was based on the Group’s understanding of the financial position of the counterparty, including
the consideration of their credit risk grade. Refer note 13.1 for further details.
Concentration risk
At 31 December 2023, the exposure to credit risk for trade receivables by geographic region was as follows:
| | |
| |
Figures in millions unless otherwise stated | | |
| | |
| | |
| | |
| | |
| | |
41.Risk management activities continued
Loan advanced – contractor
The loan advanced to contractor of US$68.4 million was assessed at stage 2 in 2020 using the lifetime ECL
approach as a result of an increase in credit risk since initial recognition. The ECL was based on the Group’s
understanding of the financial position of the counterparty, including the consideration of their credit risk grade. The
credit risk is managed through Gold Fields’ offsetting rights of invoices against the loan advanced to the contractor.
During 2023 and 2022, management was unable to offset invoices against the loan as per the agreement, resulting
in an increased credit risk and a recognised ECL of US$23.4 million (2022: US$3.9 million) at 31 December 2023.
Refer note 13.1 and 13.2 for further details. The loan advanced to contractor was moved from stage 2 to stage 3
during 2023 due to a further deterioration in the credit worthiness of the contractor.
Derivative financial assets
The derivative financial assets are held with reputable banks and financial institutions. The Group considers that its
derivate financial assets have low credit risk based on the external credit ratings of the counterparties.
Cash and cash equivalents
The Group held cash and cash equivalents of US$648.7 million (2022: US$769.4 million).
The cash and cash equivalents are held with reputable banks and financial institutions. The loss allowance for cash
and cash equivalents is measured at an amount equal to the 12-month ECL. The Group considers that its cash and
cash equivalents have low credit risk based on the external credit ratings of the counterparties.
Environmental trust funds
The Group held environmental trust funds of US$109.6 million (2022: US$98.8 million).
The environmental trust funds are held with reputable banks and financial institutions. The loss allowance for
environmental trust funds is measured at an amount equal to the 12-month ECL. The Group considers that its
environmental trust funds have low credit risk based on the external credit ratings of the counterparties with which
the funds are deposited.
Concentration of credit risk on cash and cash equivalents and environmental trust funds is considered minimal due to
the Group’s investment risk management and counterparty exposure risk management policies.
Liquidity risk
In the ordinary course of business, the Group receives cash proceeds from its operations and is required to fund
working capital and capital expenditure requirements. The cash is managed to ensure surplus funds are invested to
maximise returns while ensuring that capital is safeguarded to the maximum extent possible by investing only with
top financial institutions.
Uncommitted borrowing facilities are maintained with several banking counterparties to meet the Group’s normal and
contingency funding requirements.
The following are the contractually due undiscounted cash flows resulting from maturities of all financial liabilities,
including interest payments:
Notes to the consolidated financial statements continued
for the year ended 31 December 2023
41.Risk management activities continued
| | | | |
| |
Figures in millions unless otherwise stated | | Between one and five years | | |
| | | | |
| | | | |
| | | | |
| | | | |
| | | | |
| | | | |
| | | | |
| | | | |
| | | | |
| | | | |
Environmental rehabilitation costs5 | | | | |
| | | | |
| | | | |
| | | | |
| | | | |
| | | | |
| | | | |
| | | | |
| | | | |
| | | | |
Environmental rehabilitation costs4 | | | | |
| | | | |
| | | | |
| | | | |
1Spot Rate: R18.30 = US$1.00 (2022: R17.02 = US$1.00).
2US$ borrowings – Spot SOFR (one month fix) rate adjusted by specific facility agreement: 5.330% (2022: LIBOR 4.392% (one month fix)).
3The capital amounts of the US$500 million five-year notes issue and the US$500 million 10-year notes issue (2022: US$500 million five-year notes
issue and the US$500 million 10-year notes issue) in the table above represent the principal amounts to be repaid and differ from the carrying
values presented in the statement of financial position due to the unwinding of transaction costs capitalised at inception.
4C$ borrowings – Spot CDOR (one month fix) rate adjusted by specific facility agreement: 5.455%.
5Although environmental rehabilitation costs do not meet the definition of a financial liability, the Group included the gross closure cost estimate in the
undiscounted cash flows as it represents a future cash outflow (refer to note 28.1). In South Africa and Ghana, US$109.6 million (2022: US$98.8 million)
of the environmental rehabilitation costs are funded through the environmental trust funds.
Market risk
Gold Fields is exposed to market risks, including foreign currency, commodity price, equity securities price and
interest rate risk associated with underlying assets, liabilities and anticipated transactions. Following periodic
evaluation of these exposures, Gold Fields may enter into derivative financial instruments to manage some of these
exposures.
The table on the following page summarises the (loss)/gain on financial instruments recognised in profit or loss for
the derivative financial instruments entered into by Gold Fields:
41.Risk management activities continued
Market risk
Gold Fields is exposed to market risks, including foreign currency, commodity price, equity securities price and
interest rate risk associated with underlying assets, liabilities and anticipated transactions. Following periodic
evaluation of these exposures, Gold Fields may enter into derivative financial instruments to manage some of these
exposures.
The following table summarises the (loss)/gain on financial instruments recognised in profit or loss for the derivative
financial instruments entered into by Gold Fields:
| | | |
| |
Figures in millions unless otherwise stated | | | |
| | | |
| | | |
| | | |
| | | |
| | | |
Salares Norte foreign currency hedge | | | |
Maverix warrants – gain on fair value | | | |
Gain/(loss) on financial instruments | | | |
| | | |
Unrealised gain/(loss) and prior year mark-to-market reversals on derivative contracts | | | |
Realised gain/(loss) on derivative contracts | | | |
Maverix warrants – loss on fair value | | | |
Gain/(loss) on financial instruments | | | |
Outstanding hedges
At 31 December 2023 and 2022, there were no outstanding hedges.
Foreign currency sensitivity
General and policy
In the ordinary course of business, Gold Fields enters into transactions, such as gold sales, denominated in foreign
currencies, primarily US Dollars. In addition, Gold Fields has investments and indebtedness in US Dollars, South
African Rands, Australian Dollars and Canadian Dollars.
Gold Fields may from time to time establish currency financial instruments to protect underlying cash flows.
Gold Fields’ revenues and costs are very sensitive to the Australian Dollar/US Dollar and South African Rand/US
Dollar exchange rates because revenues are generated using a gold price denominated in US Dollars, while costs
of the Australian and South African operations are incurred principally in Australian Dollar and South African Rand,
respectively. Depreciation of the Australian Dollar and/or South African Rand against the US Dollar reduces
Gold Fields’ average costs when they are translated into US Dollars, thereby increasing the operating margin of the
Australian and/or South African operations. Conversely, appreciation of the Australian Dollar and/or South African
Rand results in Australian and/or South African operating costs increasing when translated into US Dollars, resulting
in lower operating margins. The impact on profitability of changes in the value of the Australian Dollar and South
African Rand against the US Dollar could be substantial.
A portion of the Salares Norte project’s capital expenditure is denominated in Chilean pesos. Depreciation or
appreciation of the Chilean peso against the US dollar will decrease or increase their capital expenditure when
translating into US Dollars.
Although this exposes Gold Fields to transaction and translation exposure from fluctuations in foreign currency
exchange rates, Gold Fields does not generally hedge its foreign currency exposure, although it may do so in
specific circumstances, such as financing projects or acquisitions. Also, Gold Fields on occasion undertakes currency
hedging to take advantage of favourable short-term fluctuations in exchange rates when management believes
exchange rates are at unsustainable levels.
Notes to the consolidated financial statements continued
for the year ended 31 December 2023
41.Risk management activities continued
Currency risk only exists on account of financial instruments being denominated in a currency that is not the
functional currency and being of a monetary nature. The Group had no significant exposure to currency risk relating
to financial instruments at 31 December 2023 and 31 December 2022. Differences resulting from the translation of
financial statements into the Group’s presentation currency are not taken into account.
Commodity price hedging policy
Gold and copper
The market prices of gold and to a lesser extent copper have a significant effect on the results of operations of
Gold Fields, the ability of Gold Fields to pay dividends and undertake capital expenditures, and the market price
of Gold Fields’ ordinary shares. Gold and copper prices have historically fluctuated widely and are affected by
numerous industry factors over which Gold Fields does not have any control. The aggregate effect of these factors
on the gold and copper price, all of which are beyond the control of Gold Fields, is impossible for Gold Fields
to predict.
Oil
The market price of oil has a significant effect on the results of the offshore operations of Gold Fields. The offshore
operations consume large quantities of diesel in the running of their mining fleets. Oil prices have historically
fluctuated widely and are affected by numerous factors over which Gold Fields does not have any control.
Commodity price hedging experience
The Group’s policy is to remain unhedged to the gold and copper price. However, hedges are sometimes
undertaken as follows:
•to protect cash flows at times of significant expenditure;
•for specific debt servicing requirements; and
•to safeguard the viability of higher cost operations.
To the extent that it enters into commodity hedging arrangements, Gold Fields seeks to use different counterparty
banks consisting of local and international banks to spread risk. None of the counterparties is affiliated with, or
related parties of, Gold Fields.
Hedge accounting
The gains and losses on the all hedges were recognised in profit or loss and are included in the gain on financial
instruments line item. The Group has not designated the instruments for hedge accounting.
IFRS 7 sensitivity analysis
IFRS 7 requires sensitivity analysis that shows the effects of reasonably possible changes of relevant risk variables on
profit or loss or shareholders’ equity. The Group is exposed to commodity price, currency, interest rate and equity
price risks. The effects are determined by relating the reasonably possible change in the risk variable to the balance
of financial instruments at reporting date.
The amounts generated from the sensitivity analysis on the next page are forward-looking estimates of market risks
assuming certain adverse or favourable market conditions occur. Actual results in the future may differ materially from
those projected results and therefore should not be considered a projection of likely future events and gains/losses.
Hedging sensitivity
No hedge sensitivities are presented as the effect of changes in the financial instruments was not material to profit
or loss.
Equity securities price risk
The Group is exposed to equity securities price risk because of investments held by the Group which are designated
at fair value through OCI. To manage its price risk arising from investments in equity securities, the Group diversifies
its portfolio. Diversification of the portfolio is done in accordance with limits set by the Group.
The Group’s equity investments are publicly traded and are listed on one of the following exchanges:
•JSE Limited;
•Toronto Stock Exchange; and
•Australian Stock Exchange.
The table on the following page summarises the impact of increases/decreases of the equity prices of listed
investments at fair value through OCI on the Group’s shareholders’ equity. The analysis is based on the assumption
that the share prices quoted on the exchange have increased/decreased with all other variables held constant and
the Group’s investments moved according to the historical correlation with the index.
41.Risk management activities continued
Equity securities price risk
The Group is exposed to equity securities price risk because of investments held by the Group which are designated
at fair value through OCI. To manage its price risk arising from investments in equity securities, the Group diversifies
its portfolio. Diversification of the portfolio is done in accordance with limits set by the Group.
The Group’s equity investments are publicly traded and are listed on one of the following exchanges:
•JSE Limited;
•Toronto Stock Exchange; and
•Australian Stock Exchange.
The table on the following page summarises the impact of increases/decreases of the equity prices of listed
investments at fair value through OCI on the Group’s shareholders’ equity. The analysis is based on the assumption
that the share prices quoted on the exchange have increased/decreased with all other variables held constant and
the Group’s investments moved according to the historical correlation with the index.
| | | | |
| |
Sensitivity to equity security price | (Decrease)/increase in equity price |
Figures in millions unless otherwise stated | | | | |
| | | | |
| | | | |
(Decrease)/increase in OCI1 | | | | |
| | | | |
(Decrease)/increase in OCI1 | | | | |
1Spot rate: R18.30 = US$1.00 (2022: R17.02 = US$1.00)
Preference shares price risk
The Group is exposed to preference shares price risk because of the Asanko preference shares which are
designated at fair value through OCI. The fair value of the redeemable preference shares is based on the expected
cash flows of the Asanko Gold Mine based on the life-of-mine model. Refer to note 20 for further details.
The tables below summarise the impact of increases/decreases on the Group’s shareholders’ equity in case of
changes in the key inputs used to value the preference shares. The first analysis is based on the assumption that
the market related discount rate have increased/decreased with all other variables held constant. The second
analysis is based on the assumption that the timing of the cash flows used in the life-of-mine model increased/
decreased with all other variables held constant.
| | | | |
| |
Sensitivity to preference share price risk | (Decrease)/increase in discount rate |
Figures in millions unless otherwise stated | | | | |
| | | | |
| | | | |
Increase/(decrease) in OCI | | | | |
| | | | |
Increase/(decrease) in OCI | | | | |
| |
| | | |
Sensitivity to preference share price risk Figures in millions unless otherwise stated | | (Decrease)/increase in timing of cash flows |
| | |
| | | | |
| | | | |
Increase/(decrease) in OCI | | | | |
| | | | |
Increase/(decrease) in OCI | | | | |
Notes to the consolidated financial statements continued
for the year ended 31 December 2023
41.Risk management activities continued
Windfall Project contingent consideration
The Group is exposed to price risk because of the Windfall contingent consideration which is designated at fair value
through profit or loss. The Group elected to capitalise fair value movements in the contingent consideration. The fair
value of the contingent consideration is based on the expected cash flows and timing. Refer to note 17 for further
details.
The tables below summarise the impact of increases/decreases on the carrying value of the equity accounted
investee in case of changes in the key inputs used to value the contingent consideration. The first analysis is based
on the assumption that the market related discount rate have increased/decreased with all other variables held
constant. The second analysis is based on the assumption that the timing of the cash flows increased/decreased
with all other variables held constant.
| | | |
| |
Sensitivity to price risk | | (Decrease)/increase in discount rate |
Figures in millions unless otherwise stated | | | |
| | | |
| | | |
Increase/(decrease) in equity accounted investee | | | |
| |
| | |
Sensitivity to price risk | | (Decrease)/increase in timing of cash flows |
Figures in millions unless otherwise stated | | | |
| | | |
| | | |
Increase/(decrease) in equity accounted investee | | | |
41.Risk management activities continued
Interest rate sensitivity
General
As Gold Fields has no significant interest-bearing assets, the Group’s income and operating cash flows are
substantially independent of changes in market interest rates. Gold Fields’ interest rate risk arises from borrowings.
As of 31 December 2023, Gold Fields’ borrowings amounted to US$1,236.5 million (2022: US$1,079.3 million).
Gold Fields generally does not undertake any specific action to cover its exposure to interest rate risk, although it
may do so in specific circumstances.
LIBOR/SOFR developments
During 2023, Gold Fields either replaced or transitioned all the loan facilities using LIBOR to SOFR. This did not have
a material impact on the Group’s finance cost.
CDOR/CORRA developments
Changes to the interest rate benchmark will be considered in conjunction with the surrounding facts and
circumstances at the time and appropriate changes and resetting/replacement of rates with counterparties will be
negotiated and agreed. Gold Fields has negotiated a fall back provision for the Canadian Dollar portion of the
U$1,200 million revolving credit facility that state the rate will revert to CORRA on cessation of CDOR. Gold Fields
does not believe that CORRA reform will have a material impact on the Group’s finance cost.
JIBAR/ZARONIA developments
The South African Reserve Bank (“SARB”) has indicated their intention to move away from JIBAR and to create an
alternative reference rate for South Africa. In November 2023, SARB designated the South African Rand Overnight
Index Average (“ZARONIA”) as the successor rate to replace JIBAR. The observation period for ZARONIA ended on
3 November 2023 and SARB has indicated that market participants may use the published ZARONIA as a reference
rate in pricing financial contracts going forward. SARB has indicated that the transition from JIBAR to ZARONIA is a
multi-year initiative and has not yet communicated a cessation date for JIBAR. Accordingly, there is still uncertainty
surrounding the timing and manner in which the transition would occur. Gold Fields does not believe that the
ZARONIA transition will have a material impact on the Group’s finance cost.
Interest rate sensitivity analysis
The portion of Gold Fields’ interest-bearing borrowings at year-end that is exposed to interest rate fluctuations in
the SOFR/LIBOR rate is US$215.5 million (2022: US$83.5 million) and CDOR rate is US$23.9 million (C$31.6 million).
These borrowings are normally rolled for periods between one and three months and are therefore exposed to the
rate changes in this period. The remainder of the borrowings bear interest at a fixed rate.
Interest rate sensitivity analysis
The table below summarises the effect of a change in finance expense on the Group’s profit or loss had LIBOR,
SOFR, BBSY and CDOR differed as indicated. The analysis is based on the assumption that the applicable interest
rate increased/decreased with all other variables held constant and is calculated on the weighted average
borrowings for the year. All financial instruments with fixed interest rates that are carried at amortised cost are not
subject to the interest rate sensitivity analysis.
| | | | | | |
| |
Sensitivity to interest rates | Change in interest expense for a nominal change in interest rates |
Figures in millions unless otherwise stated | | | | | | |
| | | | | | |
| | | | | | |
Sensitivity to LIBOR/SOFR/CDOR interest rates | | | | | | |
Sensitivity to BBSY interest rates1 | | | | | | |
Change in finance expense | | | | | | |
| | | | | | |
Sensitivity to LIBOR interest rates | | | | | | |
Sensitivity to BBSY interest rates1 | | | | | | |
Change in finance expense | | | | | | |
1Average rate: A$0.68= US$1.00 (2022: A$0.69 = US$1.00).
Notes to the consolidated financial statements continued
for the year ended 31 December 2023
42.Capital management
The primary objective of managing the Group’s capital is to ensure that there is sufficient capital available to support
the funding requirements of the Group, including capital expenditure, in a way that:
•optimises the cost of capital
•maximises shareholders’ returns, and
•ensures that the Group remains in a sound financial position.
There were no changes to the Group’s overall capital management approach during the current year. The Group
manages and makes adjustments to the capital structure as and when borrowings mature or as and when funding is
required. This may take the form of raising equity, market or bank debt or hybrids thereof. Opportunities in the
market are also monitored closely to ensure that the most efficient funding solutions are implemented.
The Group monitors capital using the ratio of net debt to adjusted EBITDA. The definition of adjusted EBITDA and net
debt is defined in the Group's facilities agreements. Adjusted EBITDA is defined as profit or loss for the year adjusted
for interest, taxation, amortisation and depreciation and certain other costs. Net debt is defined as total borrowing
plus lease liabilities less cash and cash equivalents. The bank covenants on external borrowings require a net debt
to adjusted EBITDA ratio of 3.5 or below and EBITDA to net finance charges ratio of 4 or above and the ratios are
measured based on amounts in United States Dollar. At the date of this report, the Group was not in default under
the terms of any of its outstanding credit facilities.
| | | |
| | |
Figures in millions unless otherwise stated | | | |
| | | |
| | | |
| | | |
Less: Cash and cash equivalents | | | |
| | | |
| | | |
Net debt to adjusted EBITDA ratio | | | |
Adjusted EBITDA to net finance charges ratio | | | |
Reconciliation of profit for the year to adjusted EBITDA: | | | |
Profit for the year from continuing operations | | | |
Mining and income taxation | | | |
| | | |
| | | |
| | | |
Gain on financial instruments | | | |
Foreign exchange loss/(gain) | | | |
Amortisation and depreciation | | | |
| | | |
| | | |
| | | |
Silicosis settlement costs | | | |
Impairment of investments and assets | | | |
Profit on disposal of assets | | | |
Share of results of equity accounted investees, net of taxation | | | |
| | | |
| | | |
Rehabilitation expense/(income) | | | |
Realised gain on derivative contracts | | | |
Ghana expected credit loss | | | |
| | | |
| | | |
43.Related parties
(a)Subsidiaries, associates and joint ventures
The subsidiaries, associates and joint ventures of the Company are disclosed in note 45.
All transactions and balances with these related parties have been eliminated in accordance with and to the extent
required by IFRS 10 Consolidated Financial Statements, IFRS 11 Joint Arrangements and IAS 28 Investments in
Associates and Joint Ventures.
(b)Key management remuneration
Key management personnel include Executive Directors and prescribed officers (“Executive Committee”). The total
key management remuneration amounted to US$15.6 million (2022: US$19.6 million) for 2023.
The details of key management personnel, including remuneration and participation in the Gold Fields Limited share
scheme and LTIP are disclosed in note 43 (c).
(c)Directors’ and prescribed officers’ remuneration
None of the Directors and officers of Gold Fields or, to the knowledge of Gold Fields, their families, had any interest,
direct or indirect, in any transaction during the last three fiscal periods or in any proposed transaction which has
affected or will materially affect Gold Fields or its investment interests or subsidiaries, other than as stated below.
None of the Directors or officers of Gold Fields or any associate of such Director or officer is currently or has been at
any time during the past three fiscal periods indebted to Gold Fields.
At 31 December 2023, the Executive Committee and Non-executive Directors’ beneficial interest in the issued and
listed stated capital of the Company was 0.1% (2022: 0.1% and 2021: 0.1%). No one Director’s interest individually
exceeds 1% of the issued stated capital or voting control of the Company.
Non-executive Directors (“NEDs”)
NEDs’ fees reflect their services as Directors and services on various subcommittees on which they serve.
NEDs do not participate in any of the short- or long-term incentive plans and there are no arrangements in place for
compensation to be awarded in the case of loss of office.
The Remuneration Committee seeks to align NEDs’ fees to the median of an appropriate peer group and reviews fee
structures for NEDs on an annual basis. Approval is sought from shareholders after recommendation by the Board at
the Annual General Meeting.
Notes to the consolidated financial statements continued
for the year ended 31 December 2023
43.Related parties continued
The following table summarises the remuneration for NEDs for the years ended 31 December 2023 and 2022:
| | | |
| | Board fees Committee Fees US$’000 | |
| | | |
| | | |
| | | |
| | | |
| | | |
| | | |
| | | |
| | | |
| | | |
| | | |
| | | |
| | | |
| | | |
| | | |
| | | |
| | | |
| | | |
| | | |
| | | |
| | | |
| | | |
| | | |
1Y Suleman receives an all-inclusive fee as Chairperson of the Board.
2P Bacchus received a delta payment in March 2023 for ad hoc Investment Committee fees paid between June 2022 and December 2022 as
Chairperson of the Committee, as reflected in the 2022 single figure of remuneration for 2022. Attended ad hoc Investment Committee meeting
held on 21 February 2023 and remunerated in March 2023, which is reflected in the single figure of remuneration for 2023.
3S Reid is an independent director and receives an all-inclusive fee. S Reid is a director of various subsidiaries in the Netherlands and Isle of Man.
Fees are paid by Gold Fields Netherlands Services and Gold Field Orogen Holding (BVI) Limited, respectively.
4A Andani is a director of subsidiaries Gold Fields Ghana Limited and Abosso Goldfields Limited. The fees for these subsidiary boards are not
determined by Gold Fields. Attended ad hoc Investment Committee meeting held on 21 February 2023 and remunerated in March 2023. Recovery
of additional payment made in January 2023 also processed during March 2023.
5P Sibiya attended an ad hoc Investment Committee meeting held on 21 February 2023. She was remunerated in March 2023 and recovery of
additional payment made in January 2023 was also processed during March 2023.
6J McGill was appointed to the Nominating and Governance Committee effective 22 February 2023. She received a pro-rata payment in March
2023 for this appointment, which is included in the single figure of remuneration for 2023.
7C Bitar was appointed to the Remuneration Committee effective 22 February 2023. She received a pro-rata payment in March 2023 for this
appointment, which is included in the single figure of remuneration for 2023.
8C Smit was appointed as a director of the Board and a member of the Audit Committee on 1 June 2023. He was also appointed to the Risk; Capital
Projects, Control and Review; and Strategy and Investment (previously ad hoc Investment) Committees on 1 December 2023.
9C Carolus resigned from the Board on 31 May 2022.
43.Related parties continued
Executive Committee
The following table summarises the remuneration for Executive Directors and prescribed officers:
| | | | | | |
| | Pension fund contribution US$'000 | | | Share-based payment expense4 US$'000 | |
| | | | | | |
| | | | | | |
| | | | | | |
| | | | | | |
| | | | | | |
| | | | | | |
| | | | | | |
| | | | | | |
| | | | | | |
| | | | | | |
| | | | | | |
| | | | | | |
| | | | | | |
| | | | | | |
| | | | | | |
| | | | | | |
| | | | | | |
| | | | | | |
| | | | | | |
| | | | | | |
| | | | | | |
1The total US$ amounts paid for 2023 and included in salary were as follows: P Schmidt US$142,750 and B Mattison US$26,367.
2The annual bonuses for the year ended 31 December 2023 were paid in February/March 2024.
3Other payments include business related reimbursements and incidental payments unless otherwise stated.
4The share-based payment expense is calculated in terms of IFRS Accounting Standards and is not the cash amounts paid.
5M Preece was EVP for the South Africa region until 31 December 2022 and took over as interim CEO on 1 January 2023.
6B Mokoatle was appointed as EVP South Africa effective 1 June 2023.
7Other payments for 2023 include advance payment of portion of estimated Peru Utilidades.
8B Mattison resigned as at 6 April 2023. “Other” includes payment for Confidentiality Non-Compete and Intellectual Property ("CNCIP"), sundry
reimbursements and leave payout.
9T Leishman resigned as at 6 April 2023. “Other” includes payment for CNCIP, sundry reimbursements and leave payout.
10A Nagaser resigned as at 30 June 2023. “Other” includes payment for CNCIP, sundry reimbursements and leave payout.
11J Mortoti was appointed on 1 July 2022.
12K Carter was appointed as EVP Group Legal and Compliance effective 1 March 2023. Values are included from this appointment date.
13J Magagula was appointed as EVP Investor Relations effective 1 August 2023. Values are included from this appointment date. “Other” payments
include a sign-on bonus received during her first month of employment with a service obligation agreement of 36 months.
14F Swanepoel was appointed as Chief Technical Officer effective 1 June 2023. Values are included from this appointment date. “Other” payments
include education scholarship for children.
Notes to the consolidated financial statements continued
for the year ended 31 December 2023
43.Related parties continued
| | | | | | |
| | Pension fund contribution US$'000 | | | Share-based payment expense4 US$'000 | |
| | | | | | |
| | | | | | |
| | | | | | |
| | | | | | |
| | | | | | |
| | | | | | |
| | | | | | |
| | | | | | |
| | | | | | |
| | | | | | |
| | | | | | |
| | | | | | |
| | | | | | |
| | | | | | |
| | | | | | |
| | | | | | |
| | | | | | |
| | | | | | |
| | | | | | |
1The total US$ amounts paid for 2022 and included in salary were as follows: C Griffith US$$336,501, P Schmidt US$135,300 and B Mattison US
US$96,200.
2The annual bonuses for the year ended 31 December 2022 were paid in February/March 2023.
3Other payments include business related reimbursements and incidental payments unless otherwise stated.
4The share-based payment expense is calculated in terms of IFRS Accounting Standards and is not the cash amounts paid.
5C Griffith stepped down as CEO and exited the Company with effect from 31 December 2022. Other payments for 2022 include termination
payments in line with his separation agreement.
6M Preece was EVP for the South Africa region until 31 December 2022 and took over as interim CEO on 1 January 2023.
7Other payments for 2022 include advance payment of portion of estimated Peru Utilidades.
8 R Butcher resigned effective 30 September 2022. His cash incentive payment for 2022 was negotiated and approved by Remco and the Board.
9J Mortoti was appointed on 1 July 2022.
44.Segmental report
Financial summary
| | | | | | | | | | | | | | | | |
| | | | | | | | | | | | Group (continuing and discontinued operations) |
Figures in millions unless otherwise stated | | | | | | | | | | | | | | | Asanko – discontinued operations3 |
| | | | | | | | | | | | | | | | |
| | | | | | | | | | | | | | | | |
for the year ended 31 December 2023 | | | | | | | | | | | | | | | | |
| | | | | | | | | | | | | | | | |
| | | | | | | | | | | | | | | | |
Cost of sales before gold inventory change and amortisation and depreciation | | | | | | | | | | | | | | | | |
| | | | | | | | | | | | | | | | |
Amortisation and depreciation | | | | | | | | | | | | | | | | |
| | | | | | | | | | | | | | | | |
| | | | | | | | | | | | | | | | |
| | | | | | | | | | | | | | | | |
| | | | | | | | | | | | | | | | |
| | | | | | | | | | | | | | | | |
| | | | | | | | | | | | | | | | |
| | | | | | | | | | | | | | | | |
| | | | | | | | | | | | | | | | |
Silicosis settlement costs | | | | | | | | | | | | | | | | |
Impairment of investments and assets | | | | | | | | | | | | | | | | |
Profit/(loss) on disposal of assets | | | | | | | | | | | | | | | | |
| | | | | | | | | | | | | | | | |
| | | | | | | | | | | | | | | | |
| | | | | | | | | | | | | | | | |
| | | | | | | | | | | | | | | | |
| | | | | | | | | | | | | | | | |
| | | | | | | | | | | | | | | | |
| | | | | | | | | | | | | | | | |
– Non-controlling interest holders | | | | | | | | | | | | | | | | |
| | | | | | | | | | | | | | | | |
STATEMENT OF FINANCIAL POSITION | | | | | | | | | | | | | | | | |
| | | | | | | | | | | | | | | | |
Total assets (excluding deferred taxation) | | | | | | | | | | | | | | | | |
Total liabilities (excluding deferred taxation) | | | | | | | | | | | | | | | | |
Net deferred taxation (assets)/liabilities | | | | | | | | | | | | | | | | |
| | | | | | | | | | | | | | | | |
The above is a geographical analysis presented by location of assets.
The Group’s operations are primarily involved in gold mining, exploration and related activities. Activities are conducted and investments held both inside and outside South Africa. The segment results have been prepared and presented based
on management’s reporting format. Gold mining operations are managed and internally reported based on the following geographical areas: in South Africa, South Deep mine, in Ghana, Tarkwa and Damang mines, in Australia, St Ives, Agnew,
Granny Smith and Gruyere, in Peru, the Cerro Corona mine and in Chile, the Salares Norte Project. Asanko Gold has been presented as a discontinued operation and an asset held for sale as a result of the sale transaction. Refer notes 14 and 15
for further details.The Group also has exploration interests which are included in the “Corporate and other” segment. Refer to accounting policies on segment reporting on page 113.
Figures may not add as they are rounded independently.
1The income statement and statement of financial position of South Deep is that of the operating mine and does not include any of the adjustments made in respect of the purchase price allocation relating to the acquisition of South Deep.
South Deep Gold mine, being an unincorporated joint venture, is not liable for taxation. Taxation included in South Deep is indicative, as tax is provided in the holding companies at a rate of 28%.
2“Corporate and other” represents the items to reconcile segment data to consolidated financial statement totals, including the elimination of intercompany transactions and balances as well as the Group’s exploration interests. This does not
represent a separate segment as it does not generate revenue. Included in “Corporate and other” is the adjustment made in respect of the purchase price allocation of South Deep.
3For the purpose of the review of the segment by the CODM, Asanko’s income statement is proportionately consolidated as a discontinued operation. The proportionately consolidated income of US$34.0 million above is reconciled to
Asanko's equity-accounted loss of US$18.9 million by deducting the purchase price allocation fair value adjustment amounting to US$6.0 million and impairment amounting to US$46.9 million. The profit for the year from continuing operations
of US$745.2 million reconciles to the total profit for the year of US$726.3 million by deducting the loss from discontinued operation of US$18.9 million.The asset held for sale amounted to US$153.3 million.
4Other costs “Corporate and other” comprise share of losses of equity-accounted investees, net of taxation of US$32.6 million and the balance of US$6.0 million expenses which consists mainly of corporate related costs.
5The Australian operations are entitled to transfer and off-set profits and losses from one company to another, therefore it is not meaningful to split the royalties, income or deferred taxation.
6Capital expenditure for the year ended 31 December 2023.
7Includes revenue from the sale of copper amounting to US$207.6 million.
Notes to the consolidated financial statements continued
for the year ended 31 December 2023
44.Segmental report continued
Financial summary
| | | | | | | | | | | | | | | | |
| | | | | | | | | | | | Group (continuing and discontinued operations) |
Figures in millions unless otherwise stated | | | | | | | | | | | | | | | Asanko – discontinued operations3 |
| | | | | | | | | | | | | | | | |
| | | | | | | | | | | | | | | | |
for the year ended 31 December 2022 | | | | | | | | | | | | | | | | |
| | | | | | | | | | | | | | | | |
| | | | | | | | | | | | | | | | |
Cost of sales before gold inventory change and amortisation and depreciation | | | | | | | | | | | | | | | | |
| | | | | | | | | | | | | | | | |
Amortisation and depreciation | | | | | | | | | | | | | | | | |
| | | | | | | | | | | | | | | | |
| | | | | | | | | | | | | | | | |
| | | | | | | | | | | | | | | | |
Gain/(loss) on financial instruments | | | | | | | | | | | | | | | | |
| | | | | | | | | | | | | | | | |
| | | | | | | | | | | | | | | | |
| | | | | | | | | | | | | | | | |
| | | | | | | | | | | | | | | | |
Ghana expected credit loss | | | | | | | | | | | | | | | | |
Silicosis settlement costs | | | | | | | | | | | | | | | | |
Impairment of impairment of investments and assets | | | | | | | | | | | | | | | | |
| | | | | | | | | | | | | | | | |
| | | | | | | | | | | | | | | | |
Profit/(loss) on disposal of assets | | | | | | | | | | | | | | | | |
| | | | | | | | | | | | | | | | |
| | | | | | | | | | | | | | | | |
| | | | | | | | | | | | | | | | |
| | | | | | | | | | | | | | | | |
Profit/(loss) for the year | | | | | | | | | | | | | | | | |
Profit/(loss) attributable to: | | | | | | | | | | | | | | | | |
| | | | | | | | | | | | | | | | |
– Non-controlling interest holders | | | | | | | | | | | | | | | | |
| | | | | | | | | | | | | | | | |
STATEMENT OF FINANCIAL POSITION | | | | | | | | | | | | | | | | |
| | | | | | | | | | | | | | | | |
Total assets (excluding deferred taxation) | | | | | | | | | | | | | | | | |
Total liabilities (excluding deferred taxation) | | | | | | | | | | | | | | | | |
Net deferred taxation (assets)/liabilities | | | | | | | | | | | | | | | | |
| | | | | | | | | | | | | | | | |
The above is a geographical analysis presented by location of assets.
The Group’s operations are primarily involved in gold mining, exploration and related activities. Activities are conducted and investments held both inside and outside South Africa. The segment results have been prepared and presented based
on management’s reporting format. Gold mining operations are managed and internally reported based on the following geographical areas: in South Africa, South Deep mine, in Ghana, Tarkwa and Damang mines, in Australia, St Ives, Agnew,
Granny Smith and Gruyere, in Peru, the Cerro Corona mine and in Chile, the Salares Norte Project. Asanko Gold has been presented as a discontinued operation. Refer note 14 for further details. The Group also has exploration interests which are
included in the “Corporate and other” segment. Refer to accounting policies on segment reporting on page 113.
Figures may not add as they are rounded independently.
1The income statement and statement of financial position of South Deep is that of the operating mine and does not include any of the adjustments made in respect of the purchase price allocation relating to the acquisition of South Deep.
South Deep Gold mine, being an unincorporated joint venture, is not liable for taxation. Taxation included in South Deep is indicative, as tax is provided in the holding companies at a rate of 28%.
2“Corporate and other” represents the items to reconcile segment data to consolidated financial statement totals, including the elimination of intercompany transactions and balances as well as the Group’s exploration interests. This does not represent a
separate segment as it does not generate revenue. Included in “Corporate and other” is the adjustment made in respect of the purchase price allocation of South Deep.
3For the purpose of the review of the segment by the CODM, Asanko’s income statement is proportionately consolidated as a discontinued operation. The proportionately consolidated income of US$18.8 million above is reconciled to
Asanko's equity-accounted income of US$13.0 million by deducting the purchase price allocation fair value adjustment amounting to US$5.8 million. The profit for the year from continuing operations of US$708.7 million reconciles to the total
profit for the year of US$721.7 million by deducting the income from discontinued operation of US$13.0 million. The Equity Accounted Joint Venture was carried at US$72.5 million.
4Other costs “Corporate and other” comprise share of losses of equity-accounted investees, net of taxation of US$2.9 million and the balance of US$8.7 million consists mainly of corporate related costs.
5The Australian operations are entitled to transfer and off-set profits and losses from one company to another, therefore it is not meaningful to split the royalties, income or deferred taxation.
6Capital expenditure for the year ended 31 December 2022.
7Includes revenue from the sale of copper amounting to US$201.6 million.
44.Segmental report continued
Financial summary
| | | | | | | | | | | | | | | | |
| | | | | | | | | | | | Group (continuing and discontinued operations) |
Figures in millions unless otherwise stated | | | | | | | | | | | | | | | Asanko – discontinued operations3 |
| | | | | | | | | | | | | | | | |
| | | | | | | | | | | | | | | | |
for the year ended 31 December 2021 | | | | | | | | | | | | | | | | |
| | | | | | | | | | | | | | | | |
| | | | | | | | | | | | | | | | |
Cost of sales before gold inventory change and amortisation and depreciation | | | | | | | | | | | | | | | | |
| | | | | | | | | | | | | | | | |
Amortisation and depreciation | | | | | | | | | | | | | | | | |
| | | | | | | | | | | | | | | | |
| | | | | | | | | | | | | | | | |
| | | | | | | | | | | | | | | | |
Gain/(loss) on financial instruments | | | | | | | | | | | | | | | | |
| | | | | | | | | | | | | | | | |
| | | | | | | | | | | | | | | | |
| | | | | | | | | | | | | | | | |
| | | | | | | | | | | | | | | | |
Silicosis settlement costs | | | | | | | | | | | | | | | | |
Ghana expected credit loss | | | | | | | | | | | | | | | | |
Impairment of investments and assets | | | | | | | | | | | | | | | | |
Profit/(loss) on disposal of assets | | | | | | | | | | | | | | | | |
| | | | | | | | | | | | | | | | |
| | | | | | | | | | | | | | | | |
| | | | | | | | | | | | | | | | |
| | | | | | | | | | | | | | | | |
Profit/(loss) for the year | | | | | | | | | | | | | | | | |
Profit/(loss) attributable to: | | | | | | | | | | | | | | | | |
| | | | | | | | | | | | | | | | |
– Non-controlling interest holders | | | | | | | | | | | | | | | | |
| | | | | | | | | | | | | | | | |
STATEMENT OF FINANCIAL POSITION | | | | | | | | | | | | | | | | |
| | | | | | | | | | | | | | | | |
Total assets (excluding deferred taxation) | | | | | | | | | | | | | | | | |
Total liabilities (excluding deferred taxation) | | | | | | | | | | | | | | | | |
Net deferred taxation (assets)/liabilities | | | | | | | | | | | | | | | | |
| | | | | | | | | | | | | | | | |
The above is a geographical analysis presented by location of assets.
The Group's operations are primarily involved in gold mining, exploration and related activities. Activities are conducted and investments held both inside and outside South Africa. The segment results have been prepared and presented based
on management's reporting format. Gold mining operations are managed and internally reported based on the following geographical areas: in South Africa, South Deep mine, in Ghana, Tarkwa and Damang mines, in Australia, St Ives, Agnew,
Granny Smith and Gruyere Gold project and in Peru, the Cerro Corona mine and in Chile, the Salares Norte project. Asanko Gold has been presented as a discontinued operation. Refer note 14 for further details. The Group also has exploration
interests which are included in the "Corporate and other" segment. Refer to accounting policies on segment reporting on page 113.
Figures may not add as they are rounded independently.
1The income statement and statement of financial position of South Deep is that of the operating mine and does not include any of the adjustments made in respect of the purchase price allocation relating to the acquisition of South Deep.
South Deep Gold mine, being an unincorporated joint venture, is not liable for taxation. Taxation included in South Deep is indicative, as tax is provided in the holding companies at a rate of 29%.
2“Corporate and other” represents the items to reconcile segment data to consolidated financial statement totals, including the elimination of intercompany transactions and balances as well as the Group’s exploration interests. This does not represent a
separate segment as it does not generate revenue. Included in “Corporate and other” is the adjustment made in respect of the purchase price allocation of South Deep.
3For the purpose of the review of the segment by the CODM, Asanko’s income statement is proportionately consolidated as a discontinued operation. The proportionately consolidated income of US$27.0 million above is reconciled to
Asanko's equity-accounted loss of US$29.4 million by deducting the purchase price allocation fair value adjustment amounting to US$3.6 million and impairment amounting to US$52.8 million. The profit for the year from continuing operations
of US$858.9 million reconciles to the total profit for the year of US$829.5 million by deducting the loss from discontinued operation of US$29.4 million. The Equity Accounted Joint Venture was carried at US$72.5 million.
4Other costs “Corporate and other” comprise share of losses of equity-accounted investees, net of taxation of US$2.6 million and the balance of US$11.7 million consists mainly of corporate-related costs.
5The Australian operations are entitled to transfer and off-set profits and losses from one company to another, therefore it is not meaningful to split the royalties, income or deferred taxation.
6Capital expenditure for the year ended 31 December 2021.
7Includes revenue from the sale of copper amounting to US$232.3 million.
Notes to the consolidated financial statements continued
for the year ended 31 December 2023
45.Major Group investments – direct and indirect
| | | | | |
| | | Group beneficial interest |
| | | | | |
| | | | | |
| | | | | |
| | | | | |
| | | | | |
| | | | | |
| | | | | |
Agnew Gold Mining Company Pty Ltd | | | | | |
Darlot Mining Company Pty Ltd | | | | | |
GFI Joint Venture Holdings (Pty) Ltd | | | | | |
| | | | | |
| | | | | |
Gold Fields Group Services (Pty) Ltd | | | | | |
Gold Fields Holdings Company Ltd | | | | | |
Gold Fields La Cima S.A.9 | | | | | |
Gold Fields Operations Ltd | | | | | |
Gold Fields Orogen Holding (BVI) Ltd | | | | | |
Gruyere Mining Company Pty Ltd | | | | | |
GSM Mining Company Pty Ltd | | | | | |
Minera Gold Fields Salares Norte SpA | | | | | |
| | | | | |
| | | | | |
| | | | | |
St Ives Gold Mining Company Pty Ltd | | | | | |
1Incorporated in Ghana.
2Incorporated in Australia.
3Incorporated in the Republic of South Africa.
4Incorporated in Peru.
5Incorporated in the British Virgin Islands.
6Incorporated in Chile.
7Abosso Goldfields Ltd (“Abosso”) owns the Damang operation in Ghana. The accumulated non-controlling interest of Abosso at 31 December 2023
amounts to US$21.0 million (2022: US$22.2 million). A dividend of USnil was declared to non-controlling interest during 2023 (2022: US$4.1 million).
Refer to the segment reporting, note 41, for summarised financial information of Damang.
8Gold Fields Ghana Ltd (“GFG”) owns the Tarkwa operation in Ghana. The accumulated non-controlling interest of GFG at 31 December 2023
amounts to US$95.0 million (2022: US$84.4 million). A dividend of US$12.0 million was advanced to non-controlling interest during 2023 (2022:
US$29.9 million). Refer to the segment reporting, note 41, for summarised financial information of Tarkwa.
9Gold Fields La Cima S.A. (“La Cima”) owns the Cerro Corona operation in Peru. The accumulated non-controlling interest of La Cima at
31 December 2023 amounts to US$1.1 million (2022: US$1.8 million). A dividend of US$0.5 million was paid to non-controlling interest during 2023
(2022: US$0.4 million). Refer to the segment reporting, note 41, financial information of Cerro Corona.
10The South Deep Joint Venture (“SDJV”) owns and operates the South Deep Gold Mine. The SDJV is an unincorporated joint venture between Gold
Fields Operations Limited (“GFO”) and GFI Joint Venture Holdings Proprietary Limited (“GFIJVH”). GFO and GFIJVH are wholly owned subsidiaries
of Newshelf 899 Proprietary Limited (“Newshelf”). The share capital of Newshelf comprises of:
90,000,000 “A” shares, representing 90% of Newshelf’s equity. Gold Fields Limited is the holder of the “A” shares; and
10,000,000 “B” shares, representing 10% of Newshelf’s equity. South Deep’s BEE shareholders are the holders of the “B” shares.
11The “B” shares entitle the BEE shareholders to a cumulative preferential dividend of R20.0 million per annum for the first 10 years (expired in
December 2020), R13.3 million per annum for the next five years and R6.7 million for the five years thereafter. After 20 years, this preferential
dividend will cease. The “B” shares’ rights to participate in the profits of Newshelf over and above the cumulative preferred dividend were initially
suspended. The suspension will be lifted over a 20 years period on a phased-in basis as follows:
after 10 years, in respect of one-third of the “B” shares;
after 15 years, in respect of another one-third of the “B” shares; and
after 20 years, in respect of the remaining one-third of the “B” shares.
After 20 years, all of the “B” shares will substantially have the same rights as the “A” shares. The BEE shareholders must retain ownership of the
“B” shares for 30 years.
45.Major Group investments – direct and indirect continued
| | | | |
| | Group beneficial interest |
| | | | |
| | | | |
| | | | |
| | | | |
| | | | |
| | | | |
| | | | |
Far Southeast Gold Resources Incorporated | | | | |
Asanko Gold Ghana Limited | | | | |
Adansi Gold Company Limited | | | | |
Shika Group Finance Limited | | | | |
Windfall Mining Group (Partnership) | | | | |
Listed equity investments | | | | |
Galiano Gold Inc. (formerly Asanko Gold Inc.) | | | | |
| | | | |
| | | | |
| | | | |
| | | | |
Vizsla Copper Corporation | | | | |
Lefroy Exploration Limited2 | | | | |
Magmatic Resources Limited | | | | |
| | | | |
| | | | |
| | | | |
| | | | |
1Only major investments are listed individually.
2An assessment has been performed and the Group does not have significant influence.
Operating and financial information by mine
(unaudited)
for the year ended 31 December 2023
South African region
| | | | | | | |
| South Deep - total managed |
| | Net earnings (before minorities) |
| | | | | | | |
| | | | | | | |
| | | | | | | |
| | | | | | | |
| | | | | | | |
| | | | | | | |
| | | | | | | |
Six months to December 2010 | | | | | | | |
| | | | | | | |
| | | | | | | |
| | | | | | | |
| | | | | | | |
| | | | | | | |
| | | | | | | |
| | | | | | | |
| | | | | | | |
| | | | | | | |
| | | | | | | |
| | | | | | | |
| | | | | | | |
| | | | | | | |
| | | | | | | |
| | | | | | | |
#For the seven months ended 30 June 2007, since acquisition control.
*Combined surface and underground yield
**All-in costs: as from 2014 per the new World Gold Council Standard issued on 27 June 2013. Up to 2014, cash cost was the key metric.
West African region
| | | | | | |
| Tarkwa mine – total managed |
| | Net earnings (before minorities) |
| | | | | | |
| | | | | | |
| | | | | | |
| | | | | | |
| | | | | | |
| | | | | | |
| | | | | | |
| | | | | | |
| | | | | | |
Six months to December 2010 | | | | | | |
| | | | | | |
| | | | | | |
| | | | | | |
| | | | | | |
| | | | | | |
| | | | | | |
| | | | | | |
| | | | | | |
| | | | | | |
| | | | | | |
| | | | | | |
| | | | | | |
| | | | | | |
| | | | | | |
| | | | | | |
Surface operation from F1999.
**All-in costs: as from 2014 per the new World Gold Council Standard issued on 27 June 2013. Up to 2014, cash cost was the key metric.
Operating and financial information by mine (unaudited) continued
for the year ended 31 December 2023
| | | | | | |
| Damang mine – total managed |
| | Net earnings (before minorities) |
| | | | | | |
| | | | | | |
| | | | | | |
| | | | | | |
| | | | | | |
| | | | | | |
| | | | | | |
| | | | | | |
| | | | | | |
Six months to December 2010 | | | | | | |
| | | | | | |
| | | | | | |
| | | | | | |
| | | | | | |
| | | | | | |
| | | | | | |
| | | | | | |
| | | | | | |
| | | | | | |
| | | | | | |
| | | | | | |
| | | | | | |
| | | | | | |
| | | | | | |
| | | | | | |
#F2002 – For the five months ended 30 June, since acquisition.
**All-in costs: as from 2014 per the new World Gold Council Standard issued on 27 June 2013. Up to 2014, cash cost was the key metric.
| | | | | | |
| |
| | Net earnings (before minorities) |
| | | | | | |
| | | | | | |
| | | | | | |
| | | | | | |
| | | | | | |
| | | | | | |
| | | | | | |
| | | | | | |
| | | | | | |
| | | | | | |
#Asanko is an equity accounted joint venture and has been equity accounted since 31 July 2018. On 21 December 2023, Gold Fields announced the
divestment of its 45% shareholding in Asanko Gold to the joint venture partner Galiano Gold. The investment in Asanko Gold, including the Asanko
redeemable preference shares, has been presented as an asset held for sale. The share of results of equity investee of Asanko Gold have been presented
as a discontinued operation in the consolidated financial statements. For the purpose of the review of the Group results up to the date of classification as an
asset held for sale by the Chief Operating Decision Maker (“CODM”), in terms of IFRS 8 Operating Segments, Asanko is proportionately consolidated. As a
result, the operating and financial information by mine includes analysis of Asanko’s results.
**All-in costs per the new World Gold Council Standard issued on 27 June 2013.
Australia region
| | | | | | |
| |
| |
| | | | | | |
| | | | | | |
| | | | | | |
| | | | | | |
| | | | | | |
| | | | | | |
| | | | | | |
| | | | | | |
| | | | | | |
Six months to December 2010 | | | | | | |
| | | | | | |
| | | | | | |
| | | | | | |
| | | | | | |
| | | | | | |
| | | | | | |
| | | | | | |
| | | | | | |
| | | | | | |
| | | | | | |
| | | | | | |
| | | | | | |
| | | | | | |
| | | | | | |
| | | | | | |
#F2002 – For the seven months ended 30 June, since acquisition.
**All-in costs: as from 2014 per the new World Gold Council Standard issued on 27 June 2013. Up to 2014, cash cost was the key metric.
Operating and financial information by mine (unaudited) continued
for the year ended 31 December 2023
| | | | | | |
| |
| |
| | | | | | |
| | | | | | |
| | | | | | |
| | | | | | |
| | | | | | |
| | | | | | |
| | | | | | |
| | | | | | |
| | | | | | |
Six months to December 2010 | | | | | | |
| | | | | | |
| | | | | | |
| | | | | | |
| | | | | | |
| | | | | | |
| | | | | | |
| | | | | | |
| | | | | | |
| | | | | | |
| | | | | | |
| | | | | | |
| | | | | | |
| | | | | | |
| | | | | | |
| | | | | | |
#For the seven months ended 30 June, since acquisition.
**All-in costs: as from 2014 per the new World Gold Council Standard issued on 27 June 2013. Up to 2014, cash cost was the key metric.
**All-in costs: as from 2014 per the new World Gold Council Standard issued on 27 June 2013. Up to 2014, cash cost was the key metric.
#The Gruyere project was successfully completed during 2019, with first gold produced in June 2019. Commercial levels of production were achieved at the
end of September 2019.
**All-in costs: as from 2014 per the new World Gold Council Standard issued on 27 June 2013. Up to 2014, cash cost was the key metric.
| | |
| |
| |
| | |
| | |
| | |
| | |
| | |
| | |
| | |
| | |
| | |
Six months to December 2010 | | |
| | |
| | |
| | |
| | |
| | |
| | |
| | |
| | |
| | |
| | |
| | |
| | |
| | |
| | |
| | |
#F2002 – For the seven months ended 30 June 2002, since acquisition.
Operating and financial information by mine (unaudited) continued
for the year ended 31 December 2023
South American region
| | | | | | |
| Cerro Corona mine – total managed |
| |
| | | | | | Net earnings (before minorities) US$ million |
| | | | | | |
| | | | | | |
| | | | | | |
| | | | | | |
Six months to December 2010 | | | | | | |
| | | | | | |
| | | | | | |
| | | | | | |
| | | | | | |
| | | | | | |
| | | | | | |
| | | | | | |
| | | | | | |
| | | | | | |
| | | | | | |
| | | | | | |
| | | | | | |
| | | | | | |
| | | | | | |
| | | | | | |
#Transition from project to operation from September 2008.
*Cerro Corona is a gold and copper mine. As such, gold produced and all-in costs are based on gold equivalent ounces.
**All-in costs: as from 2014 per the new World Gold Council Standard issued on 27 June 2013. Up to 2014, cash cost was the key metric.
Shareholders’ information (unaudited)
Register date: 31 December 2023
Issued Share Capital: 893,540,813 shares
| | | | |
| | | | |
| | | | |
| | | | |
| | | | |
| | | | |
| | | | |
100 001 – 1 000 000 shares | | | | |
| | | | |
| | | | |
| | | | |
Distribution of shareholders | | | | |
American Depositary Receipts | | | | |
| | | | |
| | | | |
| | | | |
| | | | |
| | | | |
| | | | |
| | | | |
| | | | |
| | | | |
| | | | |
| | | | |
| | | | |
| | | | |
| | | | |
| | | | |
| | | | |
| | | | |
| | | | |
| | | | |
Public/Non-public Shareholders | | | | |
| | | | |
Directors of the Company1 | | | | |
| | | | |
| | | | |
| | | | |
| | | | |
1A breakdown of the directors' and prescribed officers' shareholding is provided on page 12 of this report.
Shareholders’ information (unaudited) continued
| | |
Beneficial shareholders holding of 3% or more | | |
| | |
Public Investment Corporation (Government Employees Pension Fund) | | |
VanEck Vectors Gold Miners ETF | | |
| | |
| | |
Fund managers holding of 3% or more | | |
| | |
Public Investment Corporation | | |
| | |
| | |
| | |
| | |
| | |
| | |
Foreign custodian holding of 3% or more | | |
| | |
State Street Bank And Trust | | |
JPMorgan Chase Bank, National Association | | |
| | |
The Bank of New York Mellon | | |
| | |
Glossary of terms
| | |
|
| | |
| | Adult Basic Education and Training |
| | All-in sustaining costs. AISC comprises on-site mining costs (on a sales basis); on-site general and administrative costs; royalties and production taxes; realised gains/losses on hedges due to operating costs; community costs related to current operations; permitting costs related to current operations; third-party smelting, refining and transport costs; non-cash remuneration (site-based); stock-piles/product inventory write-down; operational stripping costs; by-product credits; corporate general and administrative costs (including share-based remuneration); reclamation and remediation – accretion and amortisation (operating sites); exploration and study costs (sustaining); and capital exploration (sustaining) |
| | All-in costs. AIC is AISC plus community costs not related to current operations; community costs not related to current operations; reclamation and remediation costs not related to current operations; exploration and study costs (non-sustaining); capital exploration (non-sustaining); capitalised stripping & underground mine development (non-sustaining); and capital expenditure (non-sustaining) |
| | Australian occupational health and safety management standards |
| | Material generally sourced from processing plant mine residues and utilised for the filling of mined voids, to ensure long-term stability of excavations and minimise the effects of seismic activity |
| | Black Economic Empowerment. BEE seeks to ensure that black persons within South Africa gain a significant degree of control in the economy through the possession of equity stakes and the holding of management positions within an institution |
| | The hole into which a blasting charge is inserted in order to blast loose a quantity of rock |
| | Hole bored or drilled in rock, usually to obtain representative samples (see diamond drill) |
| | A cross raise, normally from the access cross-cut to the reef horizon, for the purpose of drawing broken rock and ore from the reef horizon into a conveyance in the cross-cut |
| | Any large-scale, mechanised method of mining involving many thousands of tonnes of ore being blasted or caved and transported to a processing plant |
| | Bureau Veritas Quality International is a leading global and independent certification body that audits and certifies whether company systems meet the requirements of ISO standards |
| | The recovery process in which gold is leached from gold-bearing ore pulp by cyanide and simultaneously adsorbed onto activated carbon granules in the same tanks. The loaded carbon is then separated from the pulp for subsequent gold removal by elution. |
Capital expenditure (or capex) | | Specific project or ongoing expenditure for replacement or additional equipment, materials or infrastructure |
| | The recovery process in which gold is first leached to close to maximum extent from gold-bearing ore pulp by cyanide and then adsorbed onto activated carbon granules in separate and subsequent tanks. The loaded carbon is then separated from the pulp for subsequent gold removal by elution |
| | Historic water course into which sediments consisting of gravel and sand are/have been deposited |
Collective Bargaining Agreement | | Collective Bargaining Agreement means a written agreement concerning terms and conditions of employment or any other matter of mutual interest concluded by a trade union(s) and the Company |
| | The term used to describe the process by which ore is reduced in size in order to liberate the desired mineral from the gangue material in preparation for further processing |
| | Medical term for diseases that commonly co-exist, which increase the risk of morbidity |
| | A metal-rich product resulting from a mineral enrichment process such as gravity concentration or flotation, in which most of the desired mineral has been separated from the waste material in the ore |
| | Sedimentary rocks comprising eroded subangular to rounded pebbles within a finer-grained matrix |
| | A horizontal underground drive developed perpendicular to the strike direction of the stratigraphy and reef |
Glossary of terms continued
| | |
|
| | |
| | The lowest grade of mineralised ore, which determines whether or not it is economic to mine and send to the processing plant |
| | An excavation from surface or subsurface, in the form of a tunnel, which is developed downwards |
| | The decrease in quantity of ore, in a deposit or property resulting from extraction or mining |
| | Is any tunnelling operation that is developed for either exploration, exploitation or both |
| | A rotary type of rock drill that cuts a core of rock by diamond bits and is recovered in long cylindrical sections |
| | Waste or material below the cut-off grade that contaminates the ore during the course of mining operations and thereby reduces the average grade mined |
| | Angle of inclination (of a geological feature/rock) from the horizontal |
| | Tabular, vertical or near vertical body of igneous rock formed by the intrusion of magma generally into planar structural zones of weakness |
| | The chemical process of desorbing gold from activated carbon |
| | The characteristics of a rock unit defined by its composition, lithology, physical properties and geochemical parameters, usually reflecting the conditions of its origin |
| | Number of deaths normally expressed as a ratio per million man-hours worked |
| | The surface or plane of a fracture along which movement has occurred |
| | A comprehensive design and costing study of the selected option for the development of a mineral project in which appropriate assessments have been made of realistically assumed geological, mining, metallurgical, economic, marketing, legal, environmental, social, governmental, engineering, operational and all other modifying factors, which are considered in sufficient detail to demonstrate at the time of reporting that extraction is reasonably justified (economically mineable) and the factors reasonably serve as the basis for a final decision by a proponent or financial institution to proceed with, or finance, the development of the project. The overall confidence of the study should be stated |
| | Process of separating usually valuable solid material from a liquid |
| | The process by which the surface chemistry of the desired mineral particles is chemically modified such that they preferentially attach themselves to bubbles and float to the surface of the pulp in specially designed aerated and agitated vessels. The gangue or waste minerals may be chemically depressed to not float, thus allowing the valuable minerals to be concentrated and separated from the undesired material |
| | The underlying side of an ore body or stope |
| | The free cash flow (“FCF”) margin is revenue less cash outflow divided by revenue expressed as a percentage |
| | A quantity of metal (such as copper) converted to an amount of gold in ounces, based on accepted gold and other metal prices, i.e. the accepted total value of the metal based on its weight and value thereof divided by the accepted value of one troy ounce of gold |
| | The quantity of gold or other metal contained within a unit weight of one metric tonne, generally expressed in grams per metric tonne (“g/t”) or percent metal per metric tonne (%) |
| | The overlying side of an ore body or slope |
| | A horizontal underground excavation which is used to transport mined ore |
| | The grade of the material delivered to the processing facility (such as heap leach pad, mill, etc.) The Mineral Reserve declaration is for material as delivered to the processing facility |
| | Taking a buy or sell position in futures market opposite to a position held in the cash/spot market to minimise the risk of financial loss from an adverse price change |
| | Process of injection of hot, aqueous, generally mineral-rich solutions into existing rocks or geological features |
| | Informed Consented Voluntary Counselling and Testing |
| | |
|
| | |
Indicated Mineral Resources | | That part of a Mineral Resource for which tonnage, densities, shape, physical characteristics, grade and mineral content can be estimated with a reasonable level of confidence. It is based on exploration, sampling and testing information gathered through appropriate techniques from locations such as outcrops, trenches, pits, workings and drill holes. The locations are too widely or inappropriately spaced to confirm geological and/or grade continuity but are spaced closely enough for continuity to be assumed |
Inferred Mineral Resource | | That part of a Mineral Resource for which tonnage, grade and mineral content can be estimated with a low level of confidence. It is inferred from geological evidence and assumed but not verified geological and/or grade continuity. It is based on information gathered through appropriate techniques from locations such as outcrops, trenches, pits, workings and drill-holes which may be limited or of uncertain quality and reliability |
| | International standards for organisations to implement sound environmental management systems |
| | Gold trapped as a temporary inventory within a processing plant, or sections thereof, typically milling circuits |
| | Lost-Time Injury Frequency Rate, expressed in million man-hours worked |
Measured Mineral Resource | | That part of a Mineral Resource for which tonnage, densities, shape, physical characteristics, grade and mineral content can be estimated with a high level of confidence. It is based on detailed and reliable exploration, sampling and testing information gathered through appropriate techniques from locations such as outcrops, trenches, pits, workings and drill holes. The locations are spaced closely enough to confirm geological and grade continuity |
| | A general term used to describe the material size reduction process in which crushed ore is ground in a rotating grinding mill, using some form of grinding media (e.g. steel balls) prior to being subjected to physical or chemical treatment to extract the valuable metals to a concentrate or finished product |
Mine Health and Safety Act (“MHSA”) | | The South African Mine Health and Safety Act, No 29 of 1996 |
| | Rock in which minerals have been naturally introduced |
| | A ‘‘Mineral Reserve’’ is the economically mineable material derived from a Measured or Indicated Mineral Resource or both. It includes diluting and contaminating materials and allows for losses that are expected to occur when the material is mined. Appropriate assessments to a minimum of a pre-feasibility study for a project and a life-of-mine plan for an operation must have been completed, including consideration of, and modification by, realistically assumed mining, metallurgical, economic, marketing, legal, environmental, social and governmental factors (the modifying factors). Such modifying factors must be disclosed |
| | A ‘Mineral Resource’ is a concentration or occurrence of material of economic interest in or on the earth’s crust in such form, quality and quantity that there are reasonable and realistic prospects for eventual economic extraction. The location, quantity, grade, continuity and other geological characteristics of a Mineral Resource are known, or estimated from specific geological evidence, sampling and knowledge interpreted from an appropriately constrained and portrayed geological model. Mineral Resources are subdivided, and must be so reported, in order of increasing confidence in respect of geoscientific evidence, into Inferred, Indicated or Measured categories |
| | The end of a development end, drift, cross-cut or stope at which work is taking place |
| | Cash flow from operating activities less net capital expenditure and environmental payments |
| | Fault in which the hanging wall moves downward relative to the footwall, under extensional tectonic conditions |
| | A measure of the randomness of the grade distribution within a mineralised zone |
| | National Union of Mine Workers |
| | Management system standards, developed in order to facilitate the integration of quality and occupational health and safety management systems by organisations |
| | Linear to sublinear zone within a reef for which gold grades or accumulations are predominantly above the cut-off grade |
Glossary of terms continued
| | |
|
| | |
| | Rock left behind to help support the excavations in an underground mine |
| | A preliminary design and costing study of the short-listed preferred mining and processing option(s) for the development of a mineral project in which appropriate assessments have been made of realistically assumed geological, mining, metallurgical, economic, marketing, legal, environmental, social, governmental, engineering, operational and all other modifying factors, which are considered in sufficient detail to demonstrate at the time of reporting that extraction is reasonably justified (economically mineable) and the determined assumptions and parameters reasonably serve as the basis for potential declaration of Mineral Reserves |
| | The economically mineable material derived from a Measured and/or Indicated Mineral Resource. It is estimated with a lower level of confidence than a Proved Mineral Reserve. It is inclusive of diluting materials and allows for losses that may occur when the material is mined. Appropriate assessments, to a minimum of a Pre-feasibility Study (PFS) for a project, have typically been carried out, including consideration of and modification by realistically assumed mining, metallurgical, economic, marketing, legal, environmental, social and governmental factors. These assessments demonstrate at the time of reporting that extraction is reasonably justified |
| | Capital expenditure that is associated with specific projects |
| | The economically mineable material derived from a Measured Mineral Resource. It is estimated with a high level of confidence. It is inclusive of diluting materials and allows for losses that may occur when the material is mined. Appropriate assessments, to a minimum of a Pre-Feasibility Study (PFS) for a project, have been typically carried out, including consideration of and modification by realistically assumed mining, metallurgical, economic, marketing, legal, environmental, social and governmental factors. These assessments demonstrate at the time of reporting that extraction is reasonably justified |
| | A general term for metalliferous mineral deposit (gold) within a geological zone or unit |
| | The term Executive Directors refers to the CEO and the CFO, who are members of the Board of Gold Fields Limited The term Executive Committee or Executives refers to the Gold Fields Limited Executive Committee, which for purposes of King IV™ is the executive management of the Company. The Executive Committee is made up of the CEO, CFO, the Corporate Executive Vice Presidents (“EVPs”) and the Regional EVPs Corporate EVPs refers to those members of the Executive Committee who are based at the Corporate Office of the Company based in Sandton, Johannesburg, South Africa Regional EVPs are those members of the Executive Committee who are heads of their respective regions, namely South Africa, West Africa, Americas and Australia LTIP – Long-Term Incentive Plan LTI – Long-Term Incentive MSR – Minimum Shareholding Requirements STI – Short-Term Incentive Plan RemCo – Remuneration Committee BSC – Balance Scorecard GRP – Gross Remuneration Package BRP – Base Rate of Pay MSR – Minimum Shareholding Requirement RexCo – Regional Executive Committee EVP – Executive Vice President ROE – Rate of exchange CEO – Chief Executive Officer CFO – Chief Financial Officer TSR – Absolute and Relative Total Shareholder Return FCFM – Free Cash-Flow Margin ExCo – Executive Committee NED – Non-Executive Director |
| | Southern African Development Community |
| | The South African code for the Reporting of Exploration results, Mineral Resources and Mineral Reserves (the SAMREC Code) 2016 Edition |
| | Earthquake or earth vibration including from sources occurring naturally and artificially induced by mining operations |
| | An opening cut downwards from the surface for transporting personnel, equipment, supplies, ore and waste |
| | A deformation resulting from stresses that cause contiguous parts of a body of rock to slide relative to each other in a direction parallel to their plane of contact |
| | |
|
| | |
| | |
| | |
| | |
| | SAG Milling (with pebble crushing) followed by Ball Milling (with hydrocyclones) |
| | |
| | South African code for Reporting of Exploration Results, Mineral Resources and Mineral Reserves |
| | United States Securities Exchange Commission |
| | Sexually transmitted infection |
| | |
| | |
| | United Association of South Africa (a labour organisation) |
| | Voluntary counselling and testing (for HIV) |
| | Weak acid dissociable cyanide |
| | |
| | |
| | |
| | grams per metric tonne – gold or silver grade |
| | |
| | |
| | |
| | |
| | |
| | thousand metric tonnes per annum |
| | thousand metric tonnes per month |
| | |
| | |
| | fine troy ounce equalling 31.10348 grams |
| | |
| | South African Rand per kilogram |
| | million South African Rand |
| | South African Rand per metric tonne |
| | |
| | |
| | million United States Dollar |
| | United States Dollar per ounce |
Glossary of terms – Sustainable development
SUSTAINABLE DEVELOPMENT
•United Nations Global Compact – is a United Nations initiative to encourage businesses worldwide to adopt sustainable
and socially responsible policies, and to report on their implementation. The Global Compact is a principle-based
framework for businesses, stating 10 principles in the areas of human rights, labour, the environment and anti-corruption.
www.unglobalcompact.org
•Global Reporting Initiative (“GRI”) – produces one of the world’s most prevalent standards for sustainability reporting.
www.globalreporting.org
•International Council on Mining and Metals (“ICMM”) – CEO-led organisation of mining companies that seeks to
continually entrench best practice with regard to sustainable development and to provide a platform for member
companies to share experiences. www.icmm.com
•Dow Jones Sustainability Indices (“DJSI”) – are a family of benchmarks for investors who have recognised that
sustainable business practices are critical to generating long-term shareholder value and who wish to reflect their
sustainability convictions in their investment portfolios. www.robecosam.com/csa/indices/djsi-index-family.html
•Johannesburg Stock Exchange (“JSE”) – was formed in 1887. It offers five financial markets: Equities, Bonds, Financial,
Commodity and Interest Rate Derivatives. web.jse.co.za
HEALTH, SAFETY AND WELLBEING
•Total Recordable Injury Frequency Rate (“TRIFR”) TRIFR = (Fatalities + Lost Time Injuries + Restricted Work Injuries +
Medically Treated Injuries) x 1,000,000/number of hours worked.
•A Lost Time Injury (“LTI”) is a work-related injury resulting in the employee or contractor being unable to attend work for
a period of one or more days after the day of the injury. The employee or contractor is unable to perform any of his/her
duties.
•A Restricted Work Injury (“RWI”) is a work-related injury sustained by an employee or contractor which requires medical
treatment and results in the employee or contractor being unable to perform one or more of their routine functions for a
full working day, from the day after the injury occurred. The employee or contractor can still perform some of his/her
duties.
•A Medically Treated Injury (“MTI”) is a work-related injury sustained by an employee or contractor which does not
incapacitate that employee and who, after having received medical treatment, is deemed fit to immediately resume his/her
normal duties on the next calendar day, immediately following the treatment or re-treatment.
•A Serious Injury is an injury that incurs 14 or more days lost and results in:
–A fracture of any bone (excluding hairline fractures and fractures of fingers, toes or nose);
–Internal haemorrhage;
–Head trauma (including concussion, loss of consciousness) requiring hospitalisation;
–Loss of all or part of a limb (excluding bone dressing to facilitate medical treatment of injured fingers and toes);
–Permanent loss of function and/or permanent disability such as hearing loss or damage to lung function;
–Permanent disfigurement where the injury has resulted in the appearance of a person being deeply and persistently
harmed medically and that is likely to lead to psychosocial problems
•A Serious Potential Incident (“SPI”) is any workplace related incident that has the potential for the maximum credible
outcome to result in:
–a Fatality, or
–is Reportable to the Regulator, or
–is a Serious Injury, or
–a Chronic Illness.
•Duration Rate is the average days lost per LTI. Duration Rate = Days Lost / Number of Lost Time Injuries.
•Severity Rate is a measure of the severity of LTIs. Severity Rate = (Days lost to LTIs) * 1,000,000/hours worked
•Safety Engagement Rate (“SER”) is the number of safety engagements per 1,000 hours worked. Safety engagements
are defined by each region and include defined safety conversations between a leader and a worker or a group of
workers in the workplace and observation and testing in the field of a system or process designed to prevent fatalities.
•OHSAS 18001 is an international voluntary standard for occupational health and safety management systems. As with
other standards, it is based on the identification and control of risks and monitoring of business performance against
these.
•ISO 45001 is an international standard for occupational health and safety management systems. It is replacing
OHSAS 18001 over the period 2018-2021.
•Noise-Induced Hearing Loss (“NIHL”) is a disorder that results from exposure to high-intensity sound, especially over a
long period of time.
Glossary of terms – Sustainable development continued
•Diesel particulate matter (“DPM”) is a complex mixture of solids and liquids. The particles in diesel exhaust are of special
concern because, due to their respirable size, they can penetrate deep into human lungs. The composition of DPM
includes many species that are known for their adverse health effects, including several carcinogens. There is no global
consensus on diesel particulate exposure regulations.
•Silicosis is a form of occupational lung disease caused by inhalation of crystalline silica dust, and is marked by
inflammation and scarring in the form of nodular lesions in the upper lobes of the lungs.
•Chronic Obstructive Airway Disease (“COAD”) refers to chronic bronchitis and emphysema, a pair of commonly co-
existing diseases of the lungs in which the airways become narrowed.
•Highly active antiretroviral therapy (“HAART”) – Treatment of people infected with HIV, to suppress the growth of HIV,
the retrovirus responsible for AIDS. The standard treatment consists of a combination of at least three drugs.
Environment
•ISO 14001 is an international voluntary standard for environmental management systems. This is one standard in the
ISO 14000 series of international standards on environmental management.
•ISO 50001 is an international standard for energy management systems.
•Environmental incidents – these are incidents that are classified in accordance with a system designed by Gold Fields
(based on the GRI definition) that classifies the incident based on its severity. Incidents are classified as follows:
–Not classified – Incidents below the level 1 classification threshold and with no environmental impact: No classification
or administrative action required, but it can be logged.
–Level 1 environmental incident – Incident that involves minor non-conformance that results in minimal or no
environmental impact.
–Level 2 environmental incident – Incident that involves minor non-conformance that results in short-term, limited and
non-ongoing adverse environmental impacts.
–Level 3 environmental incident – Incident that results in limited non-conformance or non-compliance. The non-
compliance results in ongoing (as per the timeframes defined in Gold Fields Guidelines), but limited environmental
impact.
–Level 4 environmental incident – Incident resulting in significant non-conformance or non-compliance with significant
short-term or medium-term environmental impact. Such events are likely to be operation-threatening in isolation and
cumulatively (i.e. if the incidents are repeated) is very likely to threaten a licence to operate or social licence to operate.
In addition, such incidents also have the potential to cause reputational damage.
–Level 5 environmental incident – Incident that results in major non-conformance or non-compliance. The non-
compliance or non-conformance results in either catastrophic short-term impact or medium to long-term environmental
impact. Company or operation threatening implications and potential major damage to the Company’s reputation are
almost inevitable.
Water management
•Water withdrawal: The sum of all water drawn into Gold Fields’ operations from all sources for any use/impact.
•Recycled water: Processing used water/waste water through the same or another cycle at the same facility. The water/
waste water is treated before being recycled and reused.
•Reused water: Water/waste water that is reused without treatment at the same facility or at another of Gold Fields’
operations.
•Percentage of water recycled or reused: Water recycled/reused/total water used in process 5 x 100.
•Total water used in process: Water withdrawal + water recycled/reused.
•Acid mine drainage (“AMD”) or acid rock drainage (“ARD”), collectively called acid drainage (“AD”) is formed when certain
sulphide minerals in rocks are exposed to oxidising conditions, such as the presence of oxygen, combined with water.
AD can occur under natural conditions or as a result of the sulphide minerals that are exposed to oxidation during mining
or during storage in waste rock dumps, ore stockpiles or tailings dams. The acidic water that forms usually contains iron
and other metals if they are contained in the host rock.
Supply chain management and material stewardship
International Cyanide Management Code (“ICMC”) – is a voluntary industry programme for the manufacture, transport and
use of cyanide in gold production. It focuses on the safe management of cyanide and cyanidation mill tailings and leach
solutions. Companies that adopt the Code must have their mining operations that use cyanide to recover gold audited by an
independent third party to determine the status of Code implementation, and must use certified manufacturers and
transporters.
Social responsibilities
Socio-economic development spend (“SED”) – Payments made to communities and community investments that are not
inherent to the functioning of the operation. This may include payments related to infrastructure, health and well-being,
education and training, local environment, scholarships and donations. This definition is aligned to the World Gold Council
(“WGC”) definition.
Host communities – are identified by each operation for the purpose of securing our mining licences – both legal and social.
These communities are directly affected by and have an expectation regarding our activities.
Local Economic Development (“LED”) – refers to initiatives and monies disbursed to uplift socio-economic conditions in the
communities in which we operate, in particular job creation and enterprise development.
Our people
HDSA – Historically disadvantaged South Africans.
Energy and carbon management
Greenhouse gas emission (“GHG emission”) – Gas which absorbs outgoing terrestrial radiation, such as methane, CFCs
and carbon dioxide.
Scope 1 carbon dioxide equivalent (“CO2e”) emissions – are those directly occurring from sources that are owned or
controlled by the institution, including: on-site stationary combustion of fossil fuels; mobile combustion of fossil fuels by
company-owned/controlled vehicles; and fugitive emissions. Fugitive emissions result from intentional or unintentional
releases of GHGs.
Scope 2 CO2e emissions – are indirect emissions generated in the production of electricity purchased by the Company.
Scope 3 CO2e emissions – are all the other indirect emissions that are a consequence of the activities of the institution,
but occur from sources not owned or controlled by the institution such as commuting, air travel, waste disposal; embodied
emissions from extraction, production and transportation of purchased goods; outsourced activities; contractor-owned
vehicles; and line loss from electricity transmission and distribution.
Equivalent carbon dioxide (“CO2e”) – measures for describing how much global warming a given type and amount
of greenhouse gas may cause, using the functionally equivalent amount or concentration of carbon dioxide (“CO2”) as
the reference.
Administration and corporate information
Corporate Secretary
Anré Weststrate
Tel: +27 11 562 9719
Fax: +086 720 2704
email: anré.weststrate@goldfields.com
Registered Office
Johannesburg
Gold Fields Limited
150 Helen Road
Sandown
Sandton
2196
Postnet Suite 252
Private Bag X30500
Houghton
2041
Tel: +27 11 562 9700
Fax: +27 11 562 9829
Office of the United Kingdom Secretaries
London
St James’s Corporate Services Limited
Suite 31, Second Floor
107 Cheapside
London
EC2V 6DN
United Kingdom
Tel: +44 (0) 20 7796 8644
email: general@corpserv.co.uk
American depository receipts transfer agent
Shareholder correspondence should be mailed to:
BNY Mellon
PO Box 505000
Louisville, KY 40233 – 5000
Overnight correspondence should be sent to:
BNY Mellon
462 South 4th Street, Suite 1600
Louisville, KY40202
email: shrrelations@cpushareownerservices.com
Phone numbers
Tel: 888 269 2377 Domestic
Tel: 201 680 6825 Foreign
Sponsor
J.P. Morgan Equities South Africa Proprietary Limited
1 Fricker Road
Illovo, Johannesburg 2196
South Africa
Gold Fields Limited
Incorporated in the Republic of South Africa
Registration number 1968/004880/06
Share code: GFI
Issuer code: GOGOF
ISIN: ZAE 000018123
Investor enquiries
Jongisa Magagula
Tel: +27 11 562 9775
Mobile: +27 82 562 5288
email: jongisa.magagula@goldfields.com
Thomas Mengel
Tel: +27 11 562 9849
Mobile: +27 72 493 5170
email: thomas.mengel@goldfields.com
Media enquiries
Sven Lunsche
Tel: +27 11 562 9763
Mobile: +27 83 260 9279
email: sven.lunsche@goldfields.com
Transfer secretaries
South Africa
Computershare Investor Services (Proprietary) Limited
Rosebank Towers
15 Biermann Avenue
Rosebank
Johannesburg
2196
Private Bag X9000
Saxonwold
2132
Tel: +27 11 370 5000
Fax: +27 11 688 5248
United Kingdom
Link Asset Services
The Registry
34 Beckenham Road
Beckenham
Kent BR3 4TU
England
Tel: 0871 664 0300
If you are outside the United Kingdom please call
(0) 371 664 0300.
Calls are charged at the standard geographic rate and will
vary by provider. Calls outside the United Kingdom will be
charged at the applicable international rate. Business is
open between 09:00 – 17:30, Monday to Friday excluding
public holidays in England and Wales.
email: shareholderenquiries@linkgroup.co.uk
Listings
JSE/NYSE/GFI
Directors: YGH Suleman (Chair), MJ Fraser ** (Chief Executive Officer), PA Schmidt** (Chief Financial Officer), A Andani#,
PJ Bacchus†, MC Bitar@, TP Goodlace, JE McGill^, SP Reid^, PG Sibiya, CAT Smit
South African unless stated, ^Australian, †British, @Chilean, #Ghanaian, ** Executive Director
www.goldfields.com
Creating enduring value beyond mining
Gold Fields Limited Governance and Remuneration Report 2023 Gold Fields GRR-1
Contents 3 About this report 4 Reflections from our Lead Independent Director and Chairperson of the Remuneration Committee 5 Governance review 6 How good governance creates value 7 Ensuring we do business ethically 8 Material standards and principles guiding our governance 9 Key Board focus areas for 2023 12 Our governance structure 17 Our Board of Directors 19 Board committees 29 Application of King IV within Gold Fields 33 Application of section 3.84 of the JSE Listings Requirements 35 Remuneration Report 36 Introduction to the Remuneration Report 37 Section 1: Background statement 40 Section 2: Remuneration Policy 51 Section 3: Implementation Report 70 Administration and corporate information Leadership report Governance review Remuneration Report Administration and corporate information Gold Fields GRR-2 Welcome to our Governance and Remuneration Report for the year ended 31 December 2023 Delivering value in partnerships with our stakeholders Gold Fields is a globally diversified gold producer with nine operating mines in Australia, South Africa, Ghana, Chile and Peru, and one project in Canada. We have total attributable annual gold-equivalent production of 2.40Moz, Proved and Probable gold Mineral Reserves of 44.6Moz, Measured and Indicated Mineral Resources of 30.3Moz (excluding Mineral Reserves (EMR)) and Inferred Mineral Resources EMR of 10.2Moz. Our shares are listed on the Johannesburg Stock Exchange (JSE) and our American depositary shares trade on the New York Stock Exchange (NYSE). About our cover The cover photo of our 2023 Governance and Remuneration Report shows a gold pour at one of Gold Fields’ mines. CREATING ENDURING VALUE BEYOND MINING Send us your feedback We value your feedback on our reporting suite. To support our efforts to report on the issues our stakeholders care about, please provide any feedback and questions to investors@goldfields.com or sustainability@goldfields.com. You can also visit www.goldfields.com and download the feedback form. Further reading available within this report Further information available online linkedin.com/company/gold-fields business.facebook.com/GoldFieldsLTD @GoldFields_LTD instagram.com/goldfields_ltd/
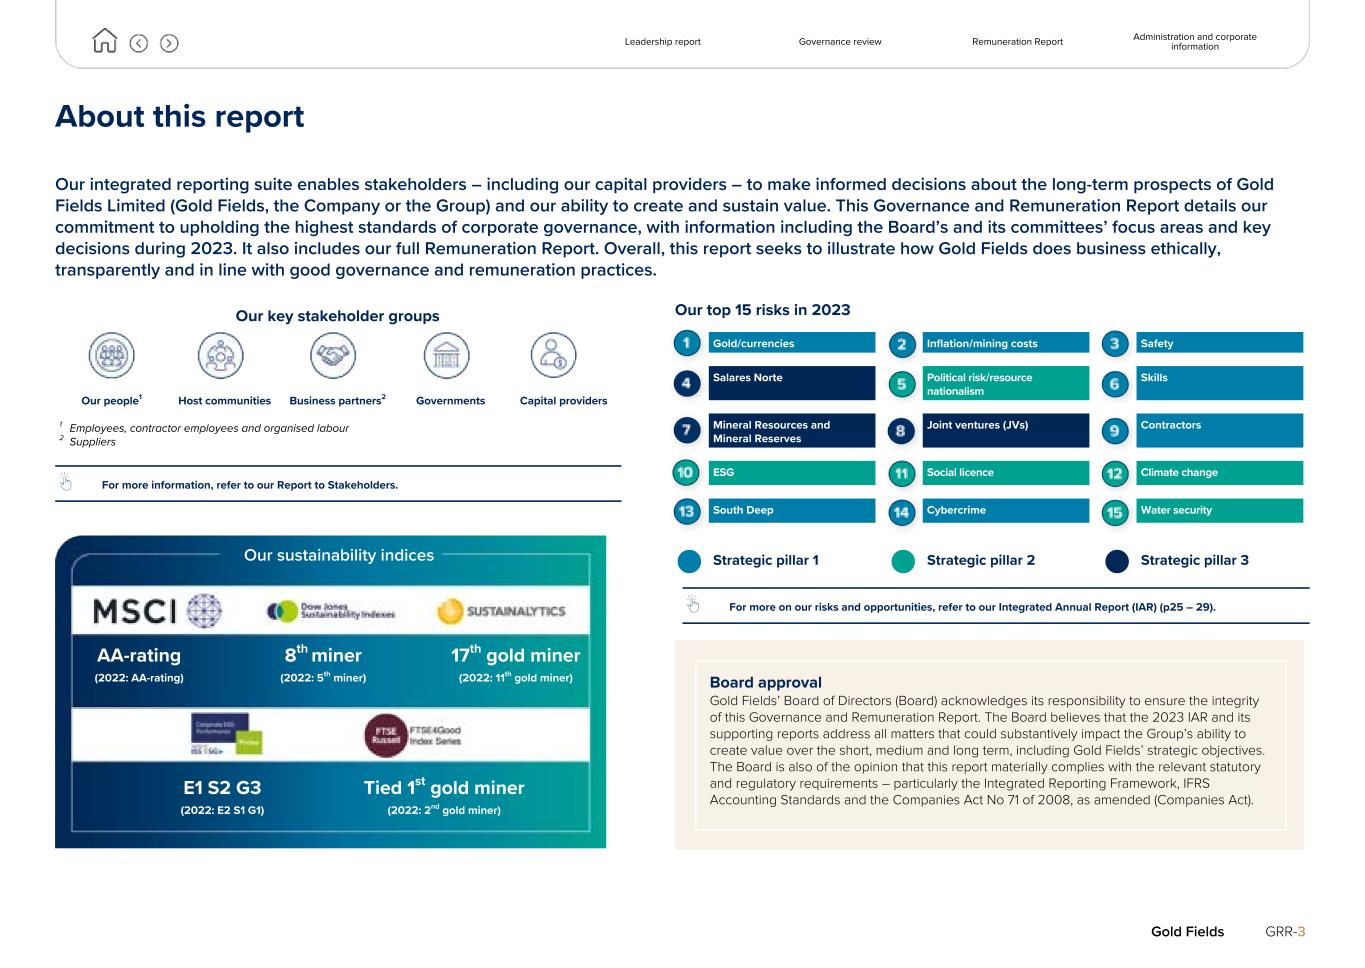
About this report Our integrated reporting suite enables stakeholders – including our capital providers – to make informed decisions about the long-term prospects of Gold Fields Limited (Gold Fields, the Company or the Group) and our ability to create and sustain value. This Governance and Remuneration Report details our commitment to upholding the highest standards of corporate governance, with information including the Board’s and its committees’ focus areas and key decisions during 2023. It also includes our full Remuneration Report. Overall, this report seeks to illustrate how Gold Fields does business ethically, transparently and in line with good governance and remuneration practices. Our key stakeholder groups Our people1 Host communities Business partners2 Governments Capital providers 1 Employees, contractor employees and organised labour 2 Suppliers For more information, refer to our Report to Stakeholders. Our top 15 risks in 2023 For more on our risks and opportunities, refer to our Integrated Annual Report (IAR) (p25 – 29). Leadership report Governance review Remuneration Report Administration and corporate information Gold Fields GRR-3 Board approval Gold Fields’ Board of Directors (Board) acknowledges its responsibility to ensure the integrity of this Governance and Remuneration Report. The Board believes that the 2023 IAR and its supporting reports address all matters that could substantively impact the Group’s ability to create value over the short, medium and long term, including Gold Fields’ strategic objectives. The Board is also of the opinion that this report materially complies with the relevant statutory and regulatory requirements – particularly the Integrated Reporting Framework, IFRS Accounting Standards and the Companies Act No 71 of 2008, as amended (Companies Act). AA-rating 8th miner 17th gold miner (2022: AA-rating) (2022: 5th miner) (2022: 11th gold miner) E1 S2 G3 Tied 1st gold miner (2022: E2 S1 G1) (2022: 2nd gold miner) Our sustainability indices Gold/currencies Inflation/mining costs Safety Salares Norte Political risk/resource nationalism Skills Mineral Resources and Mineral Reserves Joint ventures (JVs) Contractors ESG Social licence Climate change South Deep Cybercrime Water security l Strategic pillar 1 l Strategic pillar 2 l Strategic pillar 3
Reflections from our Lead Independent Director and Chairperson of the Remuneration Committee Welcome to Gold Fields’ inaugural standalone Governance and Remuneration Report. While we have historically incorporated discussions on governance and remuneration matters in our Annual Financial Report (AFR) and IAR, this year, we present these in a separate report to enhance the transparency and accountability of these critical issues. This dedicated report serves as a focused and comprehensive presentation of Gold Fields’ governance and remuneration practices, policies and performance, providing stakeholders with clear insight into the Company’s commitment to upholding the highest standards of ethical conduct, regulatory compliance and sustainability. Separating the discussion on the Company’s governance and remuneration information emphasises the significance of these matters, allowing investors, regulators and other stakeholders to make an informed assessment of Gold Fields’ governance framework. This approach also facilitates more detailed exploration of the Company’s governance metrics, ensuring a thorough understanding of our efforts to achieve the highest standards of corporate governance necessary to create sustainable value for all of our stakeholders, consistent with our commitments to best practice in the management of environmental, social and governance (ESG) matters. Pillar 2 of our strategy refers to Gold Fields building on its leading commitment to ESG. While our reporting focus thus far has been on the environmental (E) and social (S) components of ESG, we recognise the need to emphasise governance (G) in our reporting as a critical component underpinning how we create value for our stakeholders. We believe good governance directly contributes to the sustainability of our business and our ability to create shared value for our stakeholders. This report outlines how our commitment to good governance underpins the way we do business – from our Board to our operations – through: • Formulating our strategy, including setting goals, approving performance targets and monitoring implementation, because what we tell our people is important and how we reward performance will drive our performance • Creating physically and psychologically safe, healthy and inclusive workplaces that support our people to speak up and raise concerns • Delivering on our commitment to ESG, with an emphasis on employee safety and wellbeing, community impact and environmental stewardship as overseen by the Board’s committees • Rigorously ensuring compliance with all applicable laws, regulations and the frameworks and standards the Company has committed to • Advancing fair remuneration by aligning executive pay with the achievement of strategic objectives, shareholder interests and sustainable business practices, as well as approving a transparent Remuneration Policy to promote employee motivation and retention Refer to our 2023 Remuneration Report from p35 of this report • Engaging with stakeholders transparently and constructively, facilitating collaborative decision- making and transparent reporting while balancing stakeholder interests Above all, the Board has numerous mechanisms in place to ensure ethical business conduct, compliance with regulatory requirements and good governance within the business. These include our governance framework, policies and various governance structures, among others. Our Board and its committees are responsible for setting an ethical tone that cultivates a culture of integrity and transparent reporting to our stakeholders. Succession planning is a key focus area to ensure the Board has the necessary skills to guide the Company through an evolving governance landscape. Furthermore, the Board’s skills composition must ensure the Company is equipped to play a meaningful role in addressing pressing societal issues. We bolster our governance approach by aligning our processes, practices and structures with the King IV Report on Corporate Governance, 2016 (King IV)*. The Board continually reviews and refines the Company’s approach to ensure and enhance compliance with King IV. * Copyright and trademarks are owned by the Institute of Directors in South Africa NPC and all of its rights are reserved A full register of the King IV principles and the Company’s compliance is available on p29 – 32. Steven Reid Lead Independent Director and Chairperson of the Remuneration Committee Leadership report Governance review Remuneration Report Administration and corporate information Gold Fields GRR-4 “Our Board and its committees are responsible for setting an ethical tone that cultivates a culture of integrity and transparent reporting to our stakeholders.” Steven Reid
Leadership report Governance review Remuneration Report Administration and corporate information Gold Fields GRR-5 Governance review IN THIS SECTION 6 How good governance creates value ¢ 7 Ensuring we do business ethically ¢ 8 Material standards and principles guiding our governance ¢ 9 Key Board focus areas for 2023 ¢ 12 Our governance structure ¢ 17 Our Board of Directors ¢ 19 Board committees ¢ 29 Application of King IV within Gold Fields ¢ 33 Application of section 3.84 of the JSE Listings Requirements ¢ A front-end loader at our Tarkwa mine in Ghana
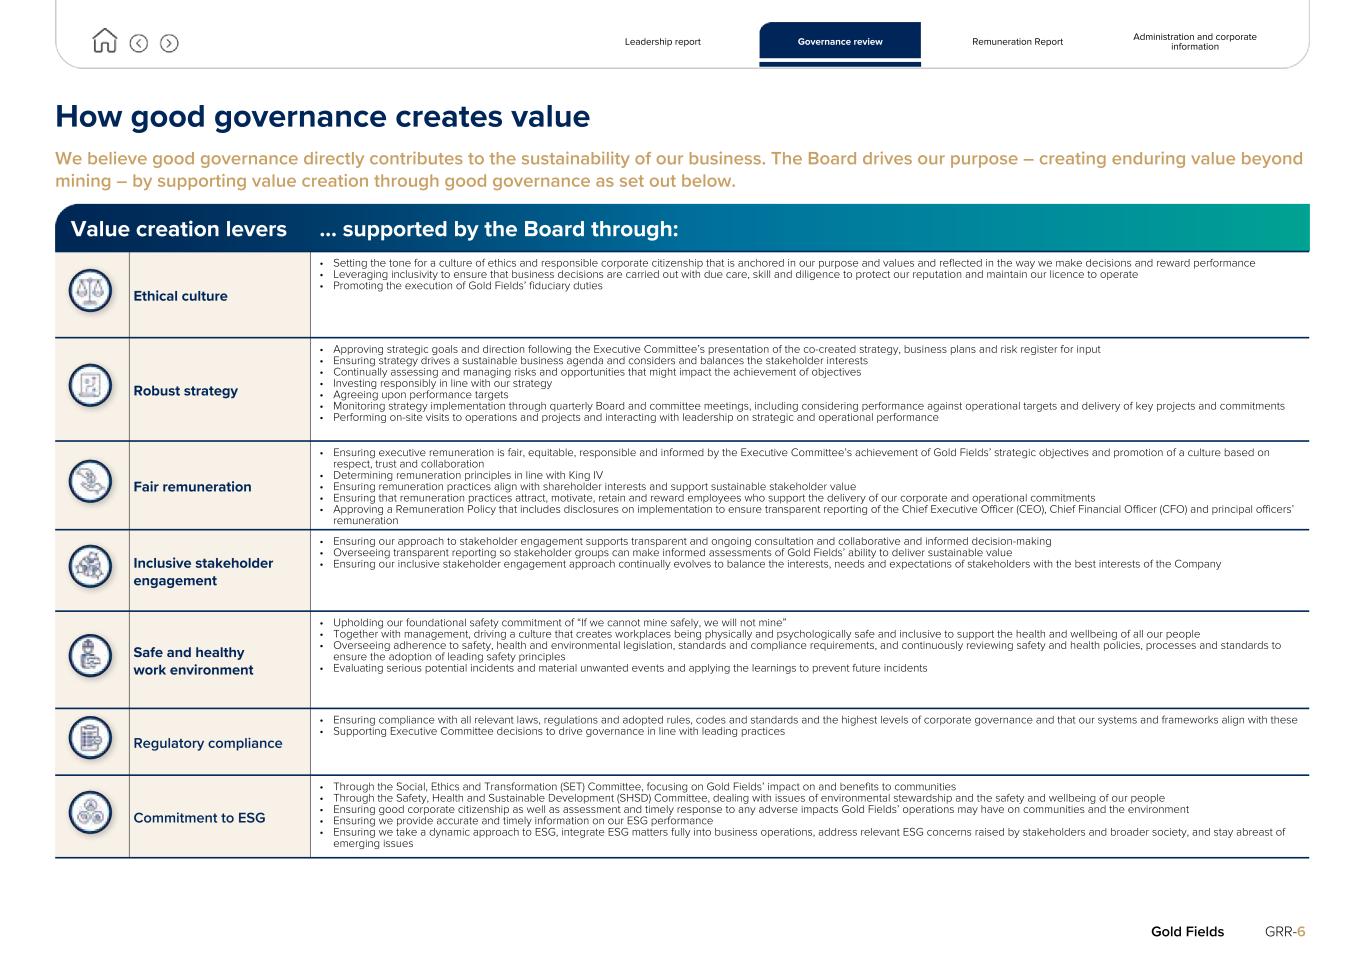
How good governance creates value We believe good governance directly contributes to the sustainability of our business. The Board drives our purpose – creating enduring value beyond mining – by supporting value creation through good governance as set out below. Value creation levers … supported by the Board through: Ethical culture • Setting the tone for a culture of ethics and responsible corporate citizenship that is anchored in our purpose and values and reflected in the way we make decisions and reward performance • Leveraging inclusivity to ensure that business decisions are carried out with due care, skill and diligence to protect our reputation and maintain our licence to operate • Promoting the execution of Gold Fields’ fiduciary duties Robust strategy • Approving strategic goals and direction following the Executive Committee’s presentation of the co-created strategy, business plans and risk register for input • Ensuring strategy drives a sustainable business agenda and considers and balances the stakeholder interests • Continually assessing and managing risks and opportunities that might impact the achievement of objectives • Investing responsibly in line with our strategy • Agreeing upon performance targets • Monitoring strategy implementation through quarterly Board and committee meetings, including considering performance against operational targets and delivery of key projects and commitments • Performing on-site visits to operations and projects and interacting with leadership on strategic and operational performance Fair remuneration • Ensuring executive remuneration is fair, equitable, responsible and informed by the Executive Committee’s achievement of Gold Fields’ strategic objectives and promotion of a culture based on respect, trust and collaboration • Determining remuneration principles in line with King IV • Ensuring remuneration practices align with shareholder interests and support sustainable stakeholder value • Ensuring that remuneration practices attract, motivate, retain and reward employees who support the delivery of our corporate and operational commitments • Approving a Remuneration Policy that includes disclosures on implementation to ensure transparent reporting of the Chief Executive Officer (CEO), Chief Financial Officer (CFO) and principal officers’ remuneration Inclusive stakeholder engagement • Ensuring our approach to stakeholder engagement supports transparent and ongoing consultation and collaborative and informed decision-making • Overseeing transparent reporting so stakeholder groups can make informed assessments of Gold Fields’ ability to deliver sustainable value • Ensuring our inclusive stakeholder engagement approach continually evolves to balance the interests, needs and expectations of stakeholders with the best interests of the Company Safe and healthy work environment • Upholding our foundational safety commitment of “If we cannot mine safely, we will not mine” • Together with management, driving a culture that creates workplaces being physically and psychologically safe and inclusive to support the health and wellbeing of all our people • Overseeing adherence to safety, health and environmental legislation, standards and compliance requirements, and continuously reviewing safety and health policies, processes and standards to ensure the adoption of leading safety principles • Evaluating serious potential incidents and material unwanted events and applying the learnings to prevent future incidents Regulatory compliance • Ensuring compliance with all relevant laws, regulations and adopted rules, codes and standards and the highest levels of corporate governance and that our systems and frameworks align with these • Supporting Executive Committee decisions to drive governance in line with leading practices Commitment to ESG • Through the Social, Ethics and Transformation (SET) Committee, focusing on Gold Fields’ impact on and benefits to communities • Through the Safety, Health and Sustainable Development (SHSD) Committee, dealing with issues of environmental stewardship and the safety and wellbeing of our people • Ensuring good corporate citizenship as well as assessment and timely response to any adverse impacts Gold Fields’ operations may have on communities and the environment • Ensuring we provide accurate and timely information on our ESG performance • Ensuring we take a dynamic approach to ESG, integrate ESG matters fully into business operations, address relevant ESG concerns raised by stakeholders and broader society, and stay abreast of emerging issues Leadership report Governance review Remuneration Report Administration and corporate information Gold Fields GRR-6
Ensuring we do business ethically Structures and mechanisms that drive and support ethical and sustainable business practices Strong ethics form the foundation of our business. Our Board and its committees are responsible for setting the ethical tone which, in turn, cultivates a culture of ethical decision-making, and integrity and transparency in our reporting to stakeholders. From this foundation, we build trust with our stakeholders, allowing us to strengthen our relationships, build our reputation and create sustainable value. We have numerous mechanisms in place to ensure we conduct business ethically, comply with applicable regulatory and other requirements and entrench good governance principles and practices within the business. 1. Legal and compliance We identify and assess any legal and regulatory non-compliance (and resultant reputational) risks facing the Company and manage or mitigate these by enacting an effective governance and compliance framework, which follows a systematic and integrated approach and pivots on robust mitigating control structures. During 2023, the Company: • Maintained our ongoing profiling and assessment of applicable laws, regulations, policies, codes and standards • Enhanced the internal assurance process to more effectively align inherent and residual risk, controls and obligations • Ensured ongoing training on key governance areas, including the Code of Conduct and Group Anti-Bribery and Corruption Policy • Updated the Group governance and compliance portal to enhance understanding of data protection and privacy rights and obligations • Risk-screened 100% of all new and existing suppliers and contractors for a range of pre-defined risk categories, including human rights compliance and political exposure • Analysed engagements with and commitments made to all external stakeholders, as well as declarations filed under our Code of Conduct • Extended our combined assurance process to assess the efficacy of compliance-related operational controls as part of operational business process review 2. Audit and risk The Risk Committee examines the current and emerging key risks and opportunities facing the business and reports these to the Board twice a year. The Board supports management in ensuring an effective control environment and, where required, that corrective measures are implemented to manage and mitigate these risks. The Audit Committee has direct oversight over the combined assurance process implemented by the Risk and Internal Audit teams, who ensure that the necessary internal controls are in place to mitigate potential risks in all regions. Our operations receive an internal audit ranking and, where necessary, corrective measures are put in place and monitored. Furthermore, the Audit Committee seeks to ensure the integrity of Gold Fields’ accounting records. It is supported by the Company’s external auditors, who assure the adequacy and accuracy of accounting records and corporate reporting. PwC have been the Company’s auditors since 2019. For more information on our Audit Committee and Risk Committee, refer to p21 and p26. 3. Commitment to leading practice We support and promote the continuous improvement required to ensure that the global gold mining industry (as well as the resources industry more broadly) is ethical and responsible towards our stakeholders. Gold Fields is committed to and guided by a range of standards and commitments underpinning our approach to responsible corporate citizenship, including: • The legislation and regulations of the countries in which we operate • The requirements of the JSE and the NYSE • King IV • The United Nations (UN) Guiding Principles on Business and Human Rights • Voluntary Principles on Security and Human Rights • The 10 principles of the UN Global Compact • The ICMM Mining Principles on Sustainable Development and Position Statements • World Gold Council – Conflict-Free Gold Standard and Responsible Gold Mining Principles • UN Convention Against Corruption • Organisation for Economic Co-operation and Development (OECD) Convention on Combating Bribery of Foreign Public Officials in International Business Transactions (Anti-Bribery Convention) • Extractive Industry Transparency Initiative • Task Force on Climate-related Financial Disclosures (TCFD) 4. Code of Conduct and hotline Our Code of Conduct is guided by our values and informs the way we conduct ourselves – from our operations to our Board. Its principles also extend to our supply chain business partners. Our Code of Conduct is distributed to all employees during their onboarding process, and they also conduct online training regarding its key principles and requirements. As at end-2023, 91% of our employees – 5,724 people – had undergone training on the Code of Conduct. Key principles of our Code of Conduct: • The standards of ethical behaviour required of our Board, leadership and workforce, and their relationship to our values • Transparent and ethical dealings with all stakeholders and declaring all gifts and entertainment, as well as any conflicts of interest • Protection of Company assets and information, including personal information of our workforce and stakeholders • Preventing and eliminating bribery and corruption • Political activity and government interactions • Safeguarding the business against potential reputational harm and litigation • Accurate and transparent recording, reporting and accounting • Safeguarding against insider trading • Supporting a safe and fair environment for speaking up – where concerns are raised and investigated and whistleblowers are protected from any form of retaliation We have a confidential hotline, which is available to our workforce and stakeholders in all regions. It is supported by our Whistleblower Policy, providing a comprehensive process for the reporting of concerns and whistleblowers’ rights and protections. Leadership report Governance review Remuneration Report Administration and corporate information Gold Fields GRR-7
Material standards and principles guiding our governance Internal standards and principles Listings requirements Sustainability standards Business ethics standards Gold Fields’ comprehensive set of internal standards and principles form the foundation of how we do business. These include: Our purpose: Our purpose is the reason we exist – Creating enduring value beyond mining. Our vision and values: Our values inform everything we do in pursuit of our vision to be the preferred gold mining company delivering sustainable, superior value. These values apply across every level of the Group, from directors to employees. Board Charter: The Charter describes the Board and its committees’ terms of reference, articulates the objectives, powers and responsibilities of the Board and ensures that directors meet their fiduciary duties. Each Board committee operates in terms of its terms of reference, which are reviewed at least annually to align with the provisions of applicable statutory and regulatory requirements. Code of Conduct: Gold Fields’ Code of Conduct commits and binds every Company employee, officer and director to conduct business ethically and fairly. The Audit and SET Committees are tasked with ensuring the consistent application of, and adherence to, the Code. Values and Code of Conduct for Suppliers and Contractors: The Code outlines our expectations of suppliers and contractors in their dealings with us and with others. Our primary listing is on the JSE, and we are therefore subject to the provisions of the JSE Listings Requirements. Gold Fields has a secondary listing on the NYSE and, as a foreign private issuer, is subject to the provisions of the NYSE Listings Requirements, certain provisions of the US Securities and Exchange Commission (US SEC), as well as the terms of the Sarbanes-Oxley Act of 2002. The Board is committed to the principles and recommended practices of King IV that are entrenched across the Group. The Board is satisfied that every effort was made to comply with all aspects of King IV and, to this end, ensured compliance during 2023. As per King IV, applicable, non-binding rules, codes and standards have been adopted by the Audit Committee, and management monitors ongoing compliance. Our Sustainable Development Framework is guided by the ICMM Mining Principles, the supporting Performance Expectations, and external assurance of our compliance. Despite not being a direct participant in the UN Global Compact, we are guided by and adhere to its 10 principles. As members of the World Gold Council from 1 January 2022, we subscribe to the Responsible Gold Mining Principles and the Conflict-Free Gold Standard. Our reporting is guided by the Integrated Reporting Framework and the Global Reporting Initiative (GRI) standards. All our eligible operations are certified to the International Cyanide Management Code – except our Cerro Corona mine in Peru, which does not use cyanide in its processes – the ISO 45001 occupational health and safety management systems standard and the ISO 14001 environmental management systems standard. All our mines – except South Deep – are certified to the ISO 50001 energy management system standard. South Deep will follow suit in early 2024. All our operations and regional offices – except those in Chile – are certified against the ISO 27001 information security management systems standard. Our Code of Conduct is aligned with national and international business ethics and anti-corruption standards, including the UN Convention against Corruption and the OECD Anti-Bribery Convention. We support the principles and processes of the Extractive Industry Transparency Initiative through our membership of the ICMM. Canada, Ghana and Peru are the compliant countries in which we operate. Through our membership of the ICMM, we are aligned with the UN Global Compact and the Voluntary Principles on Human Rights. We annually review, assess and maintain a regulatory risk profile of all identified laws, regulations and adopted rules, codes and standards. Leadership report Governance review Remuneration Report Administration and corporate information Gold Fields GRR-8 The Group has developed a range of policy statements that direct business conduct, available online at www.goldfields.com/policies.php Read more on p7. Read more on our purpose, vision and values on p8 of our IAR. The Code is available on our website at www.goldfields.com/code-of-conduct.php View our Conflict-Free Gold Report and Statement of Conformance (with the limited assurance opinion) online at www.goldfields.com/ sustainability-reporting.php View our 2023 GRI submission online at www.goldfields.com/sustainability-reporting.php
Key Board focus areas for 2023 Safety, health and environment Gold Fields’ culture journey Leadership Optimising our operations Decarbonisation and environmental impact Growing the Gold Fields portfolio Safety, health and environment Tragically, we recorded two fatal operational incidents at our Tarkwa mine in Ghana and six serious injuries throughout the Group during 2023. Furthermore, a contracted worker for the Gold Fields Ghana Foundation (the Foundation) was fatally injured during the renovation of the Tarkwa and Aboso Stadium in Tarkwa, a project funded by the Foundation. Subsequent to year-end, on 2 January 2024, a South Deep supervisor was killed in a tramming incident underground. The Board expresses its heartfelt condolences to the families, friends and colleagues of those who have lost their lives or have been injured at our operations and in activities associated with our operations. The SHSD Committee reviewed these incidents and is continuing to work with management to ensure that the failures (both technical and behavioural) are not repeated. While we have improved on many lagging safety indicators since introducing our current strategy, serious injuries and fatalities continue to occur across the Group. Gold Fields has made substantial progress – reducing serious injuries by 65% since 2018. However, we have reported at least one fatal incident annually over the past five years. This performance, together with the 2023 outcomes, is unacceptable to the Board and management, and has strengthened our resolve to do all that is required to continue improving and strengthening our safety systems, standards and behaviours. To further support and drive our safety efforts across the Group, the Board has approved a comprehensive external diagnostic review of our safety culture, approach, systems and processes during the first half of 2024. The findings will allow us to identify gaps, high-risk areas and opportunities to keep our people safe. With regards to occupational health, the Company formed a Health Working Group to consolidate and align occupational health management practices and develop consistent approaches to occupational wellbeing, mental health and psychosocial risk assessments across the Group. The SHSD Committee is kept abreast of potential impacts of our operations on people and the environment and efforts by our teams to prevent them. In 2023, the Committee focused on several issues in this regard: it approved the Global Industry Standard on Tailings Management (GISTM)-aligned reports for our high-consequence tailings storage facilities (TSFs) at Tarkwa and Cerro Corona and supported the Company in rolling out further renewable energy projects. It also monitors the Group’s catastrophic risk register to ensure appropriate mitigation strategies are in place to avoid environmental incidents. Furthermore, we are encouraged by the progress our operations are making in recycling water and limiting freshwater withdrawal, as this is a resource we share with many of our host communities. Refer to p39 of our IAR for more information. Gold Fields’ culture journey In recent years, we extended our understanding of safety beyond the physical and occupational wellbeing of our workforce and ensure our people are protected from all forms of harm – both physical and psychological. The Board fully supports this approach amid increased awareness of harassment and bullying in the mining industry. During the year, the Board oversaw the conclusion and publication of the independent review of our workplace culture undertaken by Elizabeth Broderick & Co (EB&Co). The review aimed to identify strengths, opportunities and actions for Gold Fields to build a safer, more inclusive and respectful work environment, and gave all employees and contractors the opportunity to voice their thoughts and concerns. Based on EB&Co’s recommendations, our leadership committed to 21 actions to be implemented and monitored. The Board will review the implementation and progress of these actions, programmes and initiatives. During the year, the Board approved the Respectful Workplace and Diversity, Equity, Inclusion and Belonging Policy Statements to provide a framework for our work in this regard. Refer to our Building a Respectful Workplace microsite for more information. EB&Co’s review and the planned safety review form an integral part of our transformational culture journey, which started in early 2022 and continues from the launch of our updated strategy, purpose, vision and values in 2021. The Gold Fields Way – which outlines and shapes our culture – has Safety and Respectful Workplace as two of its priority themes, and is supported by our focus on physical and psychological safety as critical to ensuring the overall safety and wellbeing of our people. Refer to p12 of our Report to Stakeholders for more information. Leadership report Governance review Remuneration Report Administration and corporate information Gold Fields GRR-9
Key Board focus areas for 2023 continued Leadership Several critical leadership changes took place during 2023 and subsequent to year-end. On 1 January 2024, Mike Fraser assumed the role of CEO, succeeding Martin Preece, who served as Interim CEO in 2023 following the resignation of Chris Griffith in 2022. Mike’s appointment follows a rigorous and comprehensive selection process to identify an individual with the necessary skills, experience and vision to guide Gold Fields into the future. The Board was supported in this process by the Nominating and Governance Committee. Martin ensured a seamless leadership transition by remaining in the Interim CEO position until 31 December 2023 and remains with the Company as Chief Operating Officer. The Board has commenced the search for a CFO to replace Paul Schmidt after announcing his early retirement during the year. The Board mandated the Nominating and Governance Committee to commence a search process to find and appoint a suitable candidate for the position. Refer to p14 of our IAR for details on CEO and CFO changes in 2023. Since 1 January 2023, one additional non-executive director (NED) was appointed. Among the executive team, four EVPs left the Company, and three new EVPs were appointed. Two of these appointments are internal promotions, reflecting Gold Fields’ ability to identify and nurture leaders within the organisation. The Board is confident that the leadership team in place is fully equipped to lead Gold Fields for many years to come and successfully implement its strategy. The changes in our leadership have been due to the resignations of long-serving executives for personal reasons or age-related retirements. It is worth noting that our mines’ operational performances remained strong throughout this period, which reflects the depth of leadership within the Company. Refer to p28 of this report for details on leadership changes in 2023. Succession planning for Board members is an important responsibility of the Board, overseen by the Nominating and Governance Committee. The Board is working on succession planning for NEDs and identifying candidates who offer a range of relevant knowledge, expertise, technical and business experience, enabling them to exercise independent judgement. In searching for appropriate directors, the Board looks for individuals who are not only exceptional in their respective fields and have great leadership capabilities, but also represent the global demographic, cultural fabric and diversity we value at Gold Fields. Refer to p14 of this report for more on Board expertise and succession planning. Optimising our operations Asset optimisation is a key initiative for Gold Fields under strategic pillar 1 and will enable the Company to maximise the potential of its current assets. This initiative will also be integrated into the Gold Fields Way as one of the Group’s priority areas of Working Smarter Together. Management is analysing ways to safely improve the Group’s operational efficiency and performance through ore and metal recoveries; efficient use of energy and renewables; and modernisation and deployment of appropriate technologies. Asset reviews will be staggered over two years, and management expects benefits from the programme from 2024 onwards. As the mines accelerate their innovation programmes through mechanisation, automation and digitisation programmes, it is essential that Gold Fields develops and employs people who are appropriately skilled to implement and embrace the required technological changes. As such, leadership and talent development – as well as skills management – have become even more important at Gold Fields. The Board will also ensure these skills programmes are aligned with other human resource priority areas, such as diversity and inclusivity, and prioritise the employment of members of our host communities. We are well positioned in terms of our jurisdictional footprint, asset quality and profitability per ounce produced. Our production base is set to increase by 20% over the next 24 months as Salares Norte and South Deep ramp-up. Importantly, this incremental production comes with competitive All-in costs (AIC) and will improve the overall quality of the portfolio and enhance cash generation. The Group delivered sound operational performance in 2023 despite adverse external impacts, which included high mining inflation and critical skills shortages at all our operations. The Group achieved its original 2023 cost guidance for production and both cost metrics – AIC and all-in sustaining costs (AISC). AISC at US$1,295/oz is less than the guided range of US$1,300/oz – US$1,340/oz, and AIC at US$1,512/oz falls within the guided range of US$1,480/oz – US$1,520/oz. Group attributable production for the year at 2.244Moz was marginally below the guided range of 2.250Moz – 2.300Moz. The Group reported steady normalised earnings at US$900m (2022: US$860m) and generated free cash-flow from operations of US$1,002m (2022: US$855m). The balance sheet remained in a sound position, with a net debt:equity ratio of 0.42x despite significant capital expenditure at Salares Norte and the Windfall project and high dividend payments. Refer to p79 of our IAR for more information. Leadership report Governance review Remuneration Report Administration and corporate information Gold Fields GRR-10
Key Board focus areas for 2023 continued Decarbonisation and environmental impact Gold Fields is considered a leader in decarbonisation in the mining sector and was an early signatory to the Paris Agreement on climate change. The Company, fully supported by the Board, first embarked on a focused climate change and energy strategy in 2016, with a firm emphasis on energy efficiency initiatives and renewable energy roll-out. This emphasis was soon supported by an extensive investment in renewable energy plants at our operations in Western Australia and South Africa, with solar plants coming on stream at South Deep and Gruyere during 2023. As such, renewables now account for around 17% of Gold Fields’ electricity mix. In February 2024, the Board approved the construction of a US$195m solar and wind microgrid at St Ives in Australia. Through this microgrid, 73% of the mine’s electricity is expected to be sourced from renewables – significantly reducing the Group’s future Scope 1 and 2 emissions by approximately 6% a year. These investments have given the Board confidence that Gold Fields is progressing well to meeting its decarbonisation target of a 30% net reduction in carbon emissions (from a 2016 baseline) by 2030. Our longer-term target of achieving net zero by 2050 depends on additional strategies: cost- effective energy storage solutions, replacing the diesel fleet at our mines with lower emission vehicles and machinery – a programme that is only in its early stages – and including suppliers and other business partners in our decarbonisation efforts through Scope 3 targets. In November, the Board approved Gold Fields’ 2030 target to reduce Scope 3 carbon emissions by a net 10% from a 2022 baseline. The Company arrived at this target after working with key suppliers over 18 months to establish a baseline of its emissions profile in line with the ICMM Scope 3 guidelines, which were released in December 2023. Meeting Gold Fields’ Scope 3 emissions reduction target will require further collaborative engagement and, ultimately, our suppliers’ successful implementation of decarbonisation initiatives. As such, Gold Fields will intensify our engagement with our key suppliers to reassess our decarbonisation progress and status and, possibly, announce a combined Scope 1 – 3 emissions target by 2025. While the public ESG focus is firmly on companies’ decarbonisation performance, the Board monitors Gold Fields’ journey to achieving all the 2030 targets it has set in terms of its six ESG priority areas that are key to the Group’s stakeholders and investors. Refer to p70 of our IAR and p18 – 19 of our Climate Change Report for more information. Growing the Gold Fields portfolio The Board plays a critical role in ensuring Gold Fields’ portfolio of assets is structured to not only drive competitive returns for its shareholders but also provide long-term growth. In particular, the Capital Projects, Control and Review Committee is tasked with evaluating proposals put forward by management in this respect and, ultimately, approving investments when appropriate. During 2023, the Board reaffirmed its support for the Company’s growth strategy. We remain committed to exploring alternative replacement and growth options in our existing jurisdictions and other top-tier mining countries. Looking forward, in addition to our existing focus on near-mine (brownfields) and district exploration, we will consider greenfields exploration, development projects, bolt-on acquisitions of producing assets and JV projects with industry peers. To this end, several positive developments during 2023 will significantly impact the quality of our portfolio going forward. In March, the Board approved the proposed Tarkwa/Iduapriem JV in Ghana with AngloGold Ashanti which, once approved by the government of Ghana, will result in a material increase in production and reduction in costs. Gold Fields will have majority ownership and management control of the JV. The approval process has been delayed, partly due to government elections in Ghana. In May, the Board approved the equal partnership with Osisko Mining to develop the Windfall project in Canada. The teams have started working together and have aligned processes and systems. The project’s Environmental Impact Assessment was submitted in March (with amendments submitted in December) and is expected to take approximately 18 months to be approved. Most critically, the Board monitored the development of the Salares Norte project in Chile and was briefed in late December on the delays in the project scheduled start-up. The Capital Projects, Control and Review Committee considered the delay and revised project capital cost and reviewed management’s interventions to address the challenges that had resulted in the delay. While the delays will impact Gold Fields’ production outlook for 2024, the Board and management look forward to the positive impact that Salares Norte’s will have on the Group’s long-term production and cost performance, which will be material. The Board continues to monitor progress on the project, with first gold expected to be delivered in April 2024.. The Board also reviewed and endorsed management’s strategy in selling its 45% holding in the Asanko gold mine in Ghana to our JV partner and managers of the mine, Galiano Gold. A decision on the Damang mine (also in Ghana), which is nearing closure, is also expected during 2024. As part of the growth outlook for the Company, the Board also monitored the investment in brownfields exploration at its Australian mines, which continues to ensure life-of-mine extensions at these mines. Gold Fields has also taken minor – but strategic – investments in junior exploration companies to investigate promising greenfields gold discoveries in Australia, Chile and Peru. Refer to p79 of our IAR for more information. Leadership report Governance review Remuneration Report Administration and corporate information Gold Fields GRR-11
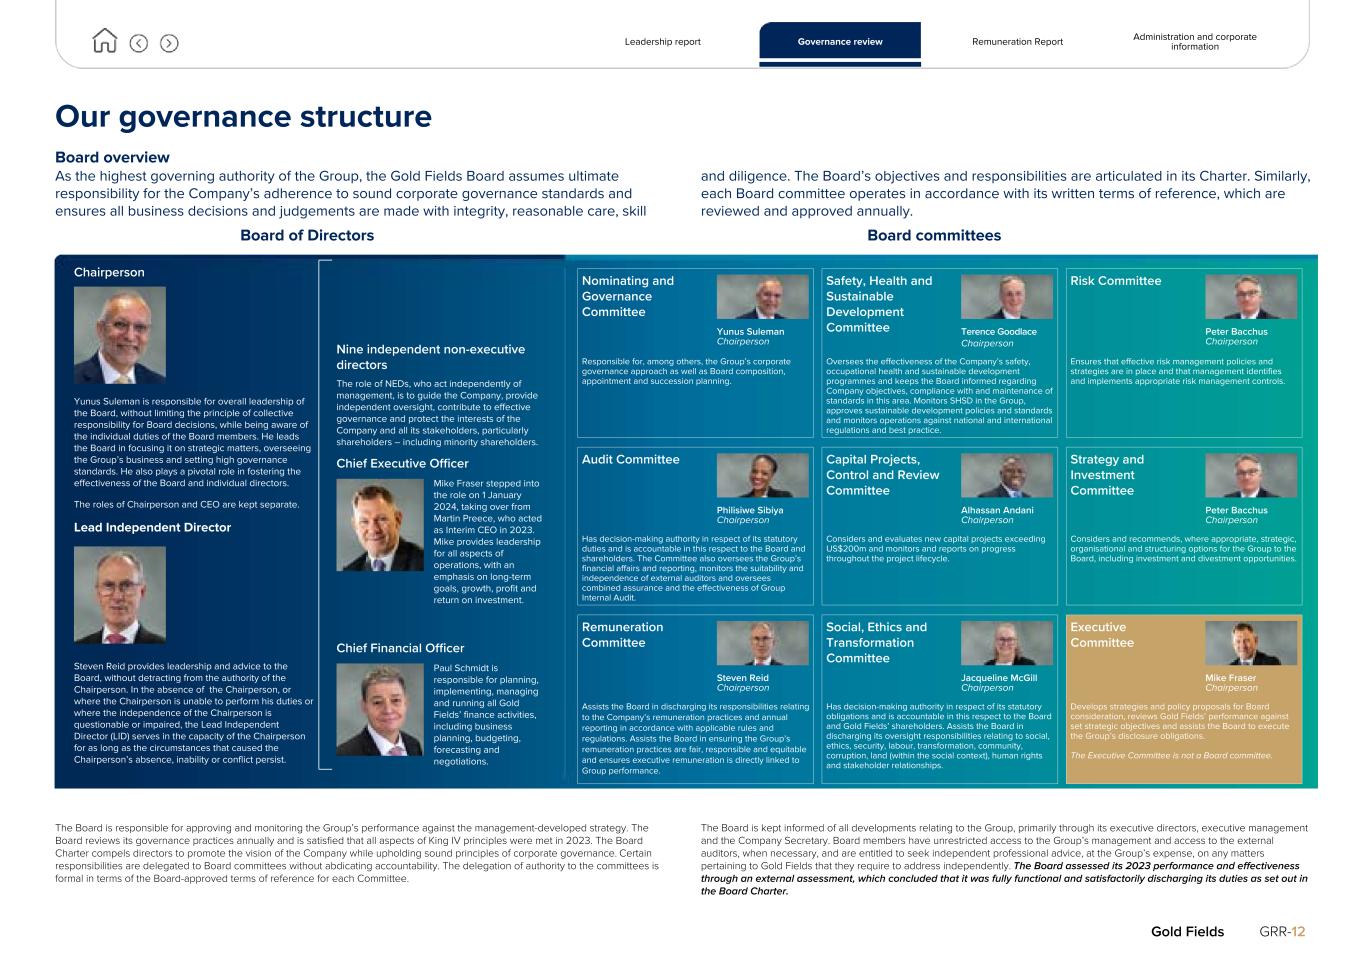
Our governance structure Board overview As the highest governing authority of the Group, the Gold Fields Board assumes ultimate responsibility for the Company’s adherence to sound corporate governance standards and ensures all business decisions and judgements are made with integrity, reasonable care, skill and diligence. The Board’s objectives and responsibilities are articulated in its Charter. Similarly, each Board committee operates in accordance with its written terms of reference, which are reviewed and approved annually. Board of Directors Board committees Chairperson Yunus Suleman is responsible for overall leadership of the Board, without limiting the principle of collective responsibility for Board decisions, while being aware of the individual duties of the Board members. He leads the Board in focusing it on strategic matters, overseeing the Group’s business and setting high governance standards. He also plays a pivotal role in fostering the effectiveness of the Board and individual directors. The roles of Chairperson and CEO are kept separate. Lead Independent Director Steven Reid provides leadership and advice to the Board, without detracting from the authority of the Chairperson. In the absence of the Chairperson, or where the Chairperson is unable to perform his duties or where the independence of the Chairperson is questionable or impaired, the Lead Independent Director (LID) serves in the capacity of the Chairperson for as long as the circumstances that caused the Chairperson’s absence, inability or conflict persist. Nine independent non-executive directors The role of NEDs, who act independently of management, is to guide the Company, provide independent oversight, contribute to effective governance and protect the interests of the Company and all its stakeholders, particularly shareholders – including minority shareholders. Chief Executive Officer Mike Fraser stepped into the role on 1 January 2024, taking over from Martin Preece, who acted as Interim CEO in 2023. Mike provides leadership for all aspects of operations, with an emphasis on long-term goals, growth, profit and return on investment. Chief Financial Officer Paul Schmidt is responsible for planning, implementing, managing and running all Gold Fields’ finance activities, including business planning, budgeting, forecasting and negotiations. The Board is responsible for approving and monitoring the Group’s performance against the management-developed strategy. The Board reviews its governance practices annually and is satisfied that all aspects of King IV principles were met in 2023. The Board Charter compels directors to promote the vision of the Company while upholding sound principles of corporate governance. Certain responsibilities are delegated to Board committees without abdicating accountability. The delegation of authority to the committees is formal in terms of the Board-approved terms of reference for each Committee. The Board is kept informed of all developments relating to the Group, primarily through its executive directors, executive management and the Company Secretary. Board members have unrestricted access to the Group’s management and access to the external auditors, when necessary, and are entitled to seek independent professional advice, at the Group’s expense, on any matters pertaining to Gold Fields that they require to address independently. The Board assessed its 2023 performance and effectiveness through an external assessment, which concluded that it was fully functional and satisfactorily discharging its duties as set out in the Board Charter. Leadership report Governance review Remuneration Report Administration and corporate information Gold Fields GRR-12 Nominating and Governance Committee Yunus Suleman Chairperson Safety, Health and Sustainable Development Committee Terence Goodlace Chairperson Risk Committee Peter Bacchus Chairperson Responsible for, among others, the Group’s corporate governance approach as well as Board composition, appointment and succession planning. Oversees the effectiveness of the Company’s safety, occupational health and sustainable development programmes and keeps the Board informed regarding Company objectives, compliance with and maintenance of standards in this area. Monitors SHSD in the Group, approves sustainable development policies and standards and monitors operations against national and international regulations and best practice. Ensures that effective risk management policies and strategies are in place and that management identifies and implements appropriate risk management controls. Audit Committee Philisiwe Sibiya Chairperson Capital Projects, Control and Review Committee Alhassan Andani Chairperson Strategy and Investment Committee Peter Bacchus Chairperson Has decision-making authority in respect of its statutory duties and is accountable in this respect to the Board and shareholders. The Committee also oversees the Group’s financial affairs and reporting, monitors the suitability and independence of external auditors and oversees combined assurance and the effectiveness of Group Internal Audit. Considers and evaluates new capital projects exceeding US$200m and monitors and reports on progress throughout the project lifecycle. Considers and recommends, where appropriate, strategic, organisational and structuring options for the Group to the Board, including investment and divestment opportunities. Remuneration Committee Steven Reid Chairperson Social, Ethics and Transformation Committee Jacqueline McGill Chairperson Executive Committee Mike Fraser Chairperson Assists the Board in discharging its responsibilities relating to the Company’s remuneration practices and annual reporting in accordance with applicable rules and regulations. Assists the Board in ensuring the Group’s remuneration practices are fair, responsible and equitable and ensures executive remuneration is directly linked to Group performance. Has decision-making authority in respect of its statutory obligations and is accountable in this respect to the Board and Gold Fields’ shareholders. Assists the Board in discharging its oversight responsibilities relating to social, ethics, security, labour, transformation, community, corruption, land (within the social context), human rights and stakeholder relationships. Develops strategies and policy proposals for Board consideration, reviews Gold Fields’ performance against set strategic objectives and assists the Board to execute the Group’s disclosure obligations. The Executive Committee is not a Board committee.
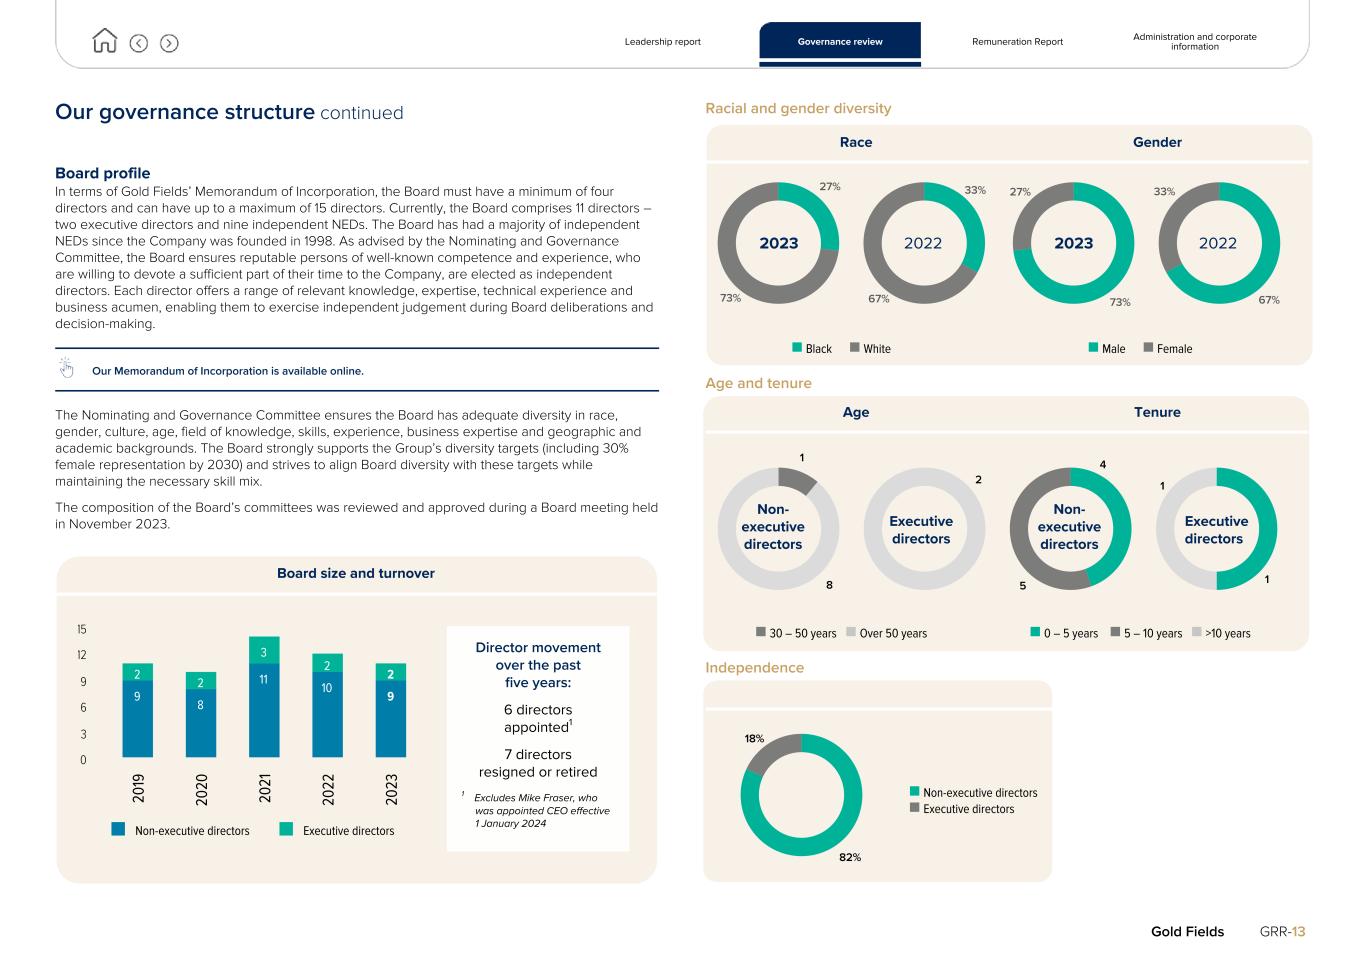
Our governance structure continued Board profile In terms of Gold Fields’ Memorandum of Incorporation, the Board must have a minimum of four directors and can have up to a maximum of 15 directors. Currently, the Board comprises 11 directors – two executive directors and nine independent NEDs. The Board has had a majority of independent NEDs since the Company was founded in 1998. As advised by the Nominating and Governance Committee, the Board ensures reputable persons of well-known competence and experience, who are willing to devote a sufficient part of their time to the Company, are elected as independent directors. Each director offers a range of relevant knowledge, expertise, technical experience and business acumen, enabling them to exercise independent judgement during Board deliberations and decision-making. Our Memorandum of Incorporation is available online. The Nominating and Governance Committee ensures the Board has adequate diversity in race, gender, culture, age, field of knowledge, skills, experience, business expertise and geographic and academic backgrounds. The Board strongly supports the Group’s diversity targets (including 30% female representation by 2030) and strives to align Board diversity with these targets while maintaining the necessary skill mix. The composition of the Board’s committees was reviewed and approved during a Board meeting held in November 2023. Board size and turnover 9 8 11 10 9 2 2 3 2 2 Non-executive directors Executive directors 20 19 20 20 20 21 20 22 20 23 0 3 6 9 12 15 Racial and gender diversity Race Gender 27% 73% 33% 67% 73% 27% 67% 33% n Black n White n Male n Female Age and tenure Age Tenure 1 8 2 4 5 1 1 n 30 – 50 years n Over 50 years n 0 – 5 years n 5 – 10 years n >10 years Independence 82% 18% Leadership report Governance review Remuneration Report Administration and corporate information Gold Fields GRR-13 Director movement over the past five years: 6 directors appointed1 7 directors resigned or retired 1 Excludes Mike Fraser, who was appointed CEO effective 1 January 2024 n Non-executive directors n Executive directors 2023 20232022 2022 Non- executive directors Executive directors Executive directors Non- executive directors
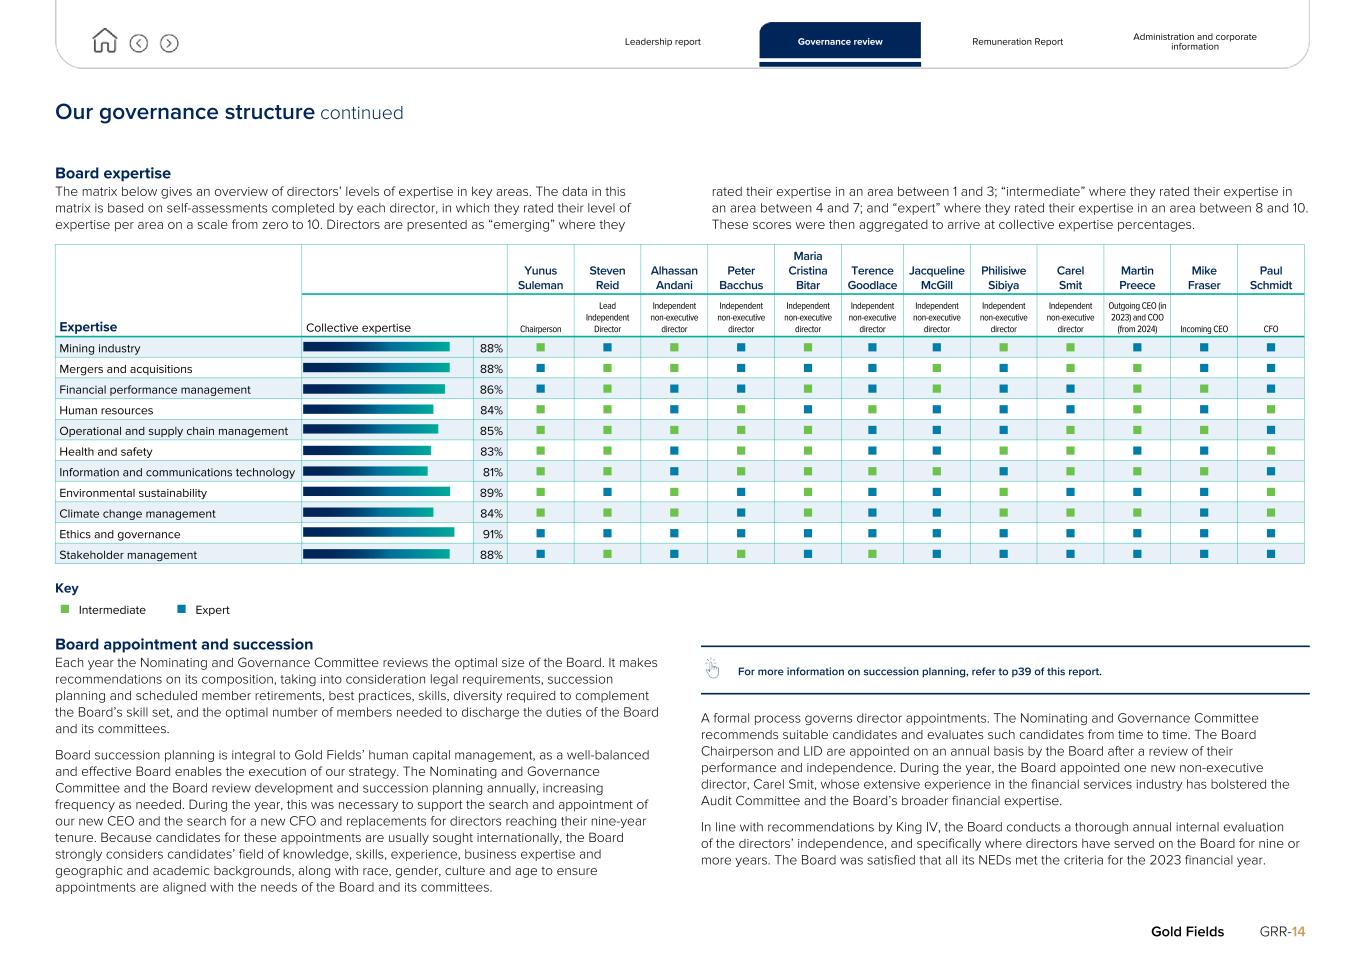
Our governance structure continued Board expertise The matrix below gives an overview of directors’ levels of expertise in key areas. The data in this matrix is based on self-assessments completed by each director, in which they rated their level of expertise per area on a scale from zero to 10. Directors are presented as “emerging” where they rated their expertise in an area between 1 and 3; “intermediate” where they rated their expertise in an area between 4 and 7; and “expert” where they rated their expertise in an area between 8 and 10. These scores were then aggregated to arrive at collective expertise percentages. Expertise Yunus Suleman Steven Reid Alhassan Andani Peter Bacchus Maria Cristina Bitar Terence Goodlace Jacqueline McGill Philisiwe Sibiya Carel Smit Martin Preece Mike Fraser Paul Schmidt Collective expertise Chairperson Lead Independent Director Independent non-executive director Independent non-executive director Independent non-executive director Independent non-executive director Independent non-executive director Independent non-executive director Independent non-executive director Outgoing CEO (in 2023) and COO (from 2024) Incoming CEO CFO Mining industry 88% ¢ ¢ ¢ ¢ ¢ ¢ ¢ ¢ ¢ ¢ ¢ ¢ Mergers and acquisitions 88% ¢ ¢ ¢ ¢ ¢ ¢ ¢ ¢ ¢ ¢ ¢ ¢ Financial performance management 86% ¢ ¢ ¢ ¢ ¢ ¢ ¢ ¢ ¢ ¢ ¢ ¢ Human resources 84% ¢ ¢ ¢ ¢ ¢ ¢ ¢ ¢ ¢ ¢ ¢ ¢ Operational and supply chain management 85% ¢ ¢ ¢ ¢ ¢ ¢ ¢ ¢ ¢ ¢ ¢ ¢ Health and safety 83% ¢ ¢ ¢ ¢ ¢ ¢ ¢ ¢ ¢ ¢ ¢ ¢ Information and communications technology 81% ¢ ¢ ¢ ¢ ¢ ¢ ¢ ¢ ¢ ¢ ¢ ¢ Environmental sustainability 89% ¢ ¢ ¢ ¢ ¢ ¢ ¢ ¢ ¢ ¢ ¢ ¢ Climate change management 84% ¢ ¢ ¢ ¢ ¢ ¢ ¢ ¢ ¢ ¢ ¢ ¢ Ethics and governance 91% ¢ ¢ ¢ ¢ ¢ ¢ ¢ ¢ ¢ ¢ ¢ ¢ Stakeholder management 88% ¢ ¢ ¢ ¢ ¢ ¢ ¢ ¢ ¢ ¢ ¢ ¢ Key ¢ Intermediate ¢ Expert Board appointment and succession Each year the Nominating and Governance Committee reviews the optimal size of the Board. It makes recommendations on its composition, taking into consideration legal requirements, succession planning and scheduled member retirements, best practices, skills, diversity required to complement the Board’s skill set, and the optimal number of members needed to discharge the duties of the Board and its committees. Board succession planning is integral to Gold Fields’ human capital management, as a well-balanced and effective Board enables the execution of our strategy. The Nominating and Governance Committee and the Board review development and succession planning annually, increasing frequency as needed. During the year, this was necessary to support the search and appointment of our new CEO and the search for a new CFO and replacements for directors reaching their nine-year tenure. Because candidates for these appointments are usually sought internationally, the Board strongly considers candidates’ field of knowledge, skills, experience, business expertise and geographic and academic backgrounds, along with race, gender, culture and age to ensure appointments are aligned with the needs of the Board and its committees. For more information on succession planning, refer to p39 of this report. A formal process governs director appointments. The Nominating and Governance Committee recommends suitable candidates and evaluates such candidates from time to time. The Board Chairperson and LID are appointed on an annual basis by the Board after a review of their performance and independence. During the year, the Board appointed one new non-executive director, Carel Smit, whose extensive experience in the financial services industry has bolstered the Audit Committee and the Board’s broader financial expertise. In line with recommendations by King IV, the Board conducts a thorough annual internal evaluation of the directors’ independence, and specifically where directors have served on the Board for nine or more years. The Board was satisfied that all its NEDs met the criteria for the 2023 financial year. Leadership report Governance review Remuneration Report Administration and corporate information Gold Fields GRR-14
Our governance structure continued Board appointment and succession continued Together with management, the Nominating and Governance Committee develops and facilitates an induction programme for new Board members to ensure their understanding of Gold Fields and the business environment in which it operates. Once per year, the Board aims to hold sessions in one of our jurisdictions, enabling directors to visit all our operations and meet the teams. As part of continuing Board training and development, we ensure directors remain abreast of developments in their areas of expertise and our industry. This includes informal sessions where publications on relevant matters are shared and formal sessions where topics of interest are discussed. Board meetings begin with compliance updates, providing directors with relevant regulatory landscape developments. In 2023, the Board received extensive briefings on US SEC regulatory changes, imminent Companies Act amendments, and discussed artificial intelligence and cybersecurity, which are increasingly relevant to directors’ fiduciary duty. The Committee also assesses the commitments of non-executive candidates to ensure their availability to fulfil their responsibilities. Board meeting attendance is listed on p16. In accordance with Gold Fields’ Memorandum of Incorporation, one-third of all directors (including executive directors) shall retire from office at each Annual General Meeting (AGM). The first to retire are those directors appointed during the year, followed by the longest-serving members. The Board, assisted by the Nominating and Governance Committee, recommends the eligibility of retiring directors (subject to availability and their contribution to the business) for reappointment. Retiring directors can be re-elected immediately by the shareholders at the AGM. Term limit of non-executive directors In terms of the Board Charter, a director is required to retire at the AGM after the year in which they turn 70 years old, unless the retirement age is extended by a fixed period at the discretion of the Board. In accordance with the recommendations of King IV, a director may continue to serve longer than nine years, provided the Board in its discretion and unanimous decision determines it is in the Company’s and shareholders’ best interest to extend the director’s service for an additional period. Board of Directors’ Charter During the year, the Board reviewed the Board Charter and committees’ terms of reference to ensure they align with the recommendations of King IV. A summary of how Gold Fields applied the principles of King IV is detailed and explained on p29 – 32. Conflicts of interest To our knowledge, there are no undisclosed conflicts of interest between Gold Fields and our directors or officers, taking into consideration that some directors serve on other public company boards. This could potentially create conflicts between their duties to Gold Fields and their duties to those companies. Our directors and officers understand the laws governing their accountability and must disclose any conflicts to the Chairperson of the Board and the Nominating and Governance Committee. They are expected to comply with the law and disclose any conflicts that may arise. The Board ensures independent judgement in considering transactions and agreements. Directors with a material interest must recuse themselves from relevant parts of Board and committee meeting discussions to allow the remaining directors to discuss the matter openly. Chief Financial Officer Paul Schmidt has served as Gold Fields’ CFO since his appointment to the position on 1 January 2009. In accordance with the JSE Listings Requirements, the Audit Committee considered and unanimously agreed that Paul executed his duties satisfactorily and with the required levels of expertise and experience during 2023. The Audit Committee is of the opinion that Paul, together with other members of his financial management team, managed the Group’s financial affairs effectively during the 2023 financial year. In August 2023, we announced Paul’s decision to proceed to early retirement by 30 April 2024. The process to appoint a new CFO is underway. Company Secretary The Company Secretary provides company secretarial services and oversees Board governance processes in accordance with applicable regulation, including the Companies Act, King IV, and the JSE and NYSE Listings Requirements. The Company Secretary attends all meetings held by the Board and its committees. The Board has direct access to the Company Secretary, who guides the directors in the execution of their duties and responsibilities. The Company Secretary is not a director of the Group, has an arm’s length relationship with the Board and is an employee of the Company. The Company Secretary oversaw relevant Board governance matters and assisted the Board and its committees with annual plans, agendas, minutes and terms of reference during 2023. Anré Weststrate held the position of Company Secretary in 2023. The Board is satisfied that Anré is competent, qualified and has the necessary expertise and experience to fulfil the role. Leadership report Governance review Remuneration Report Administration and corporate information Gold Fields GRR-15
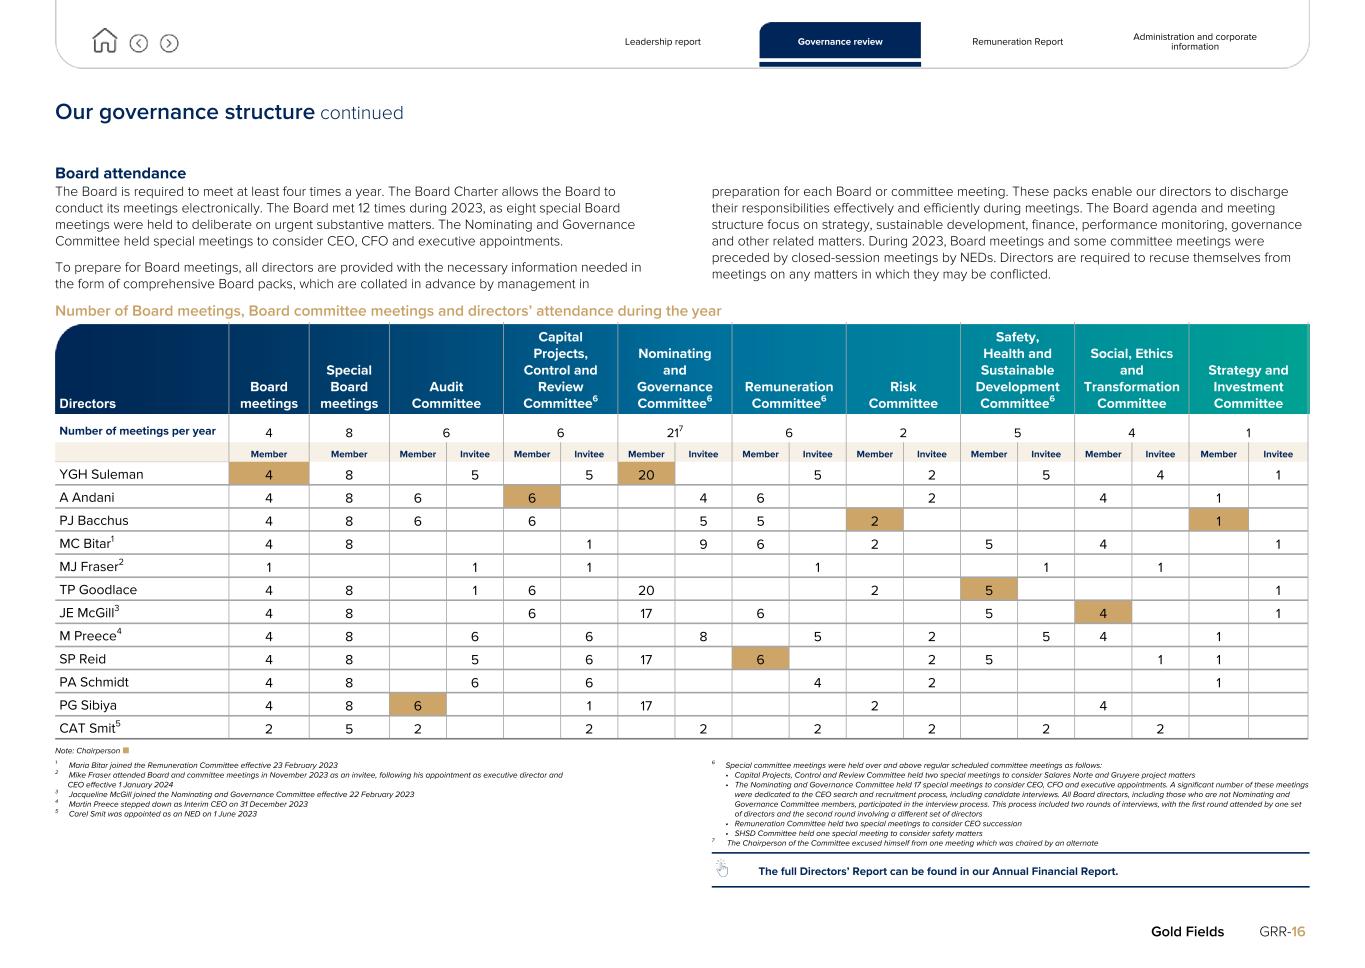
Our governance structure continued Board attendance The Board is required to meet at least four times a year. The Board Charter allows the Board to conduct its meetings electronically. The Board met 12 times during 2023, as eight special Board meetings were held to deliberate on urgent substantive matters. The Nominating and Governance Committee held special meetings to consider CEO, CFO and executive appointments. To prepare for Board meetings, all directors are provided with the necessary information needed in the form of comprehensive Board packs, which are collated in advance by management in preparation for each Board or committee meeting. These packs enable our directors to discharge their responsibilities effectively and efficiently during meetings. The Board agenda and meeting structure focus on strategy, sustainable development, finance, performance monitoring, governance and other related matters. During 2023, Board meetings and some committee meetings were preceded by closed-session meetings by NEDs. Directors are required to recuse themselves from meetings on any matters in which they may be conflicted. Number of Board meetings, Board committee meetings and directors’ attendance during the year Directors Board meetings Special Board meetings Audit Committee Capital Projects, Control and Review Committee6 Nominating and Governance Committee6 Remuneration Committee6 Risk Committee Safety, Health and Sustainable Development Committee6 Social, Ethics and Transformation Committee Strategy and Investment Committee Number of meetings per year 4 8 6 6 217 6 2 5 4 1 Member Member Member Invitee Member Invitee Member Invitee Member Invitee Member Invitee Member Invitee Member Invitee Member Invitee YGH Suleman 4 8 5 5 20 5 2 5 4 1 A Andani 4 8 6 6 4 6 2 4 1 PJ Bacchus 4 8 6 6 5 5 2 1 MC Bitar1 4 8 1 9 6 2 5 4 1 MJ Fraser2 1 1 1 1 1 1 TP Goodlace 4 8 1 6 20 2 5 1 JE McGill3 4 8 6 17 6 5 4 1 M Preece4 4 8 6 6 8 5 2 5 4 1 SP Reid 4 8 5 6 17 6 2 5 1 1 PA Schmidt 4 8 6 6 4 2 1 PG Sibiya 4 8 6 1 17 2 4 CAT Smit5 2 5 2 2 2 2 2 2 2 Note: Chairperson ¢ 1 Maria Bitar joined the Remuneration Committee effective 23 February 2023 2 Mike Fraser attended Board and committee meetings in November 2023 as an invitee, following his appointment as executive director and CEO effective 1 January 2024 3 Jacqueline McGill joined the Nominating and Governance Committee effective 22 February 2023 4 Martin Preece stepped down as Interim CEO on 31 December 2023 5 Carel Smit was appointed as an NED on 1 June 2023 6 Special committee meetings were held over and above regular scheduled committee meetings as follows: • Capital Projects, Control and Review Committee held two special meetings to consider Salares Norte and Gruyere project matters • The Nominating and Governance Committee held 17 special meetings to consider CEO, CFO and executive appointments. A significant number of these meetings were dedicated to the CEO search and recruitment process, including candidate interviews. All Board directors, including those who are not Nominating and Governance Committee members, participated in the interview process. This process included two rounds of interviews, with the first round attended by one set of directors and the second round involving a different set of directors • Remuneration Committee held two special meetings to consider CEO succession • SHSD Committee held one special meeting to consider safety matters 7 The Chairperson of the Committee excused himself from one meeting which was chaired by an alternate The full Directors’ Report can be found in our Annual Financial Report. Leadership report Governance review Remuneration Report Administration and corporate information Gold Fields GRR-16
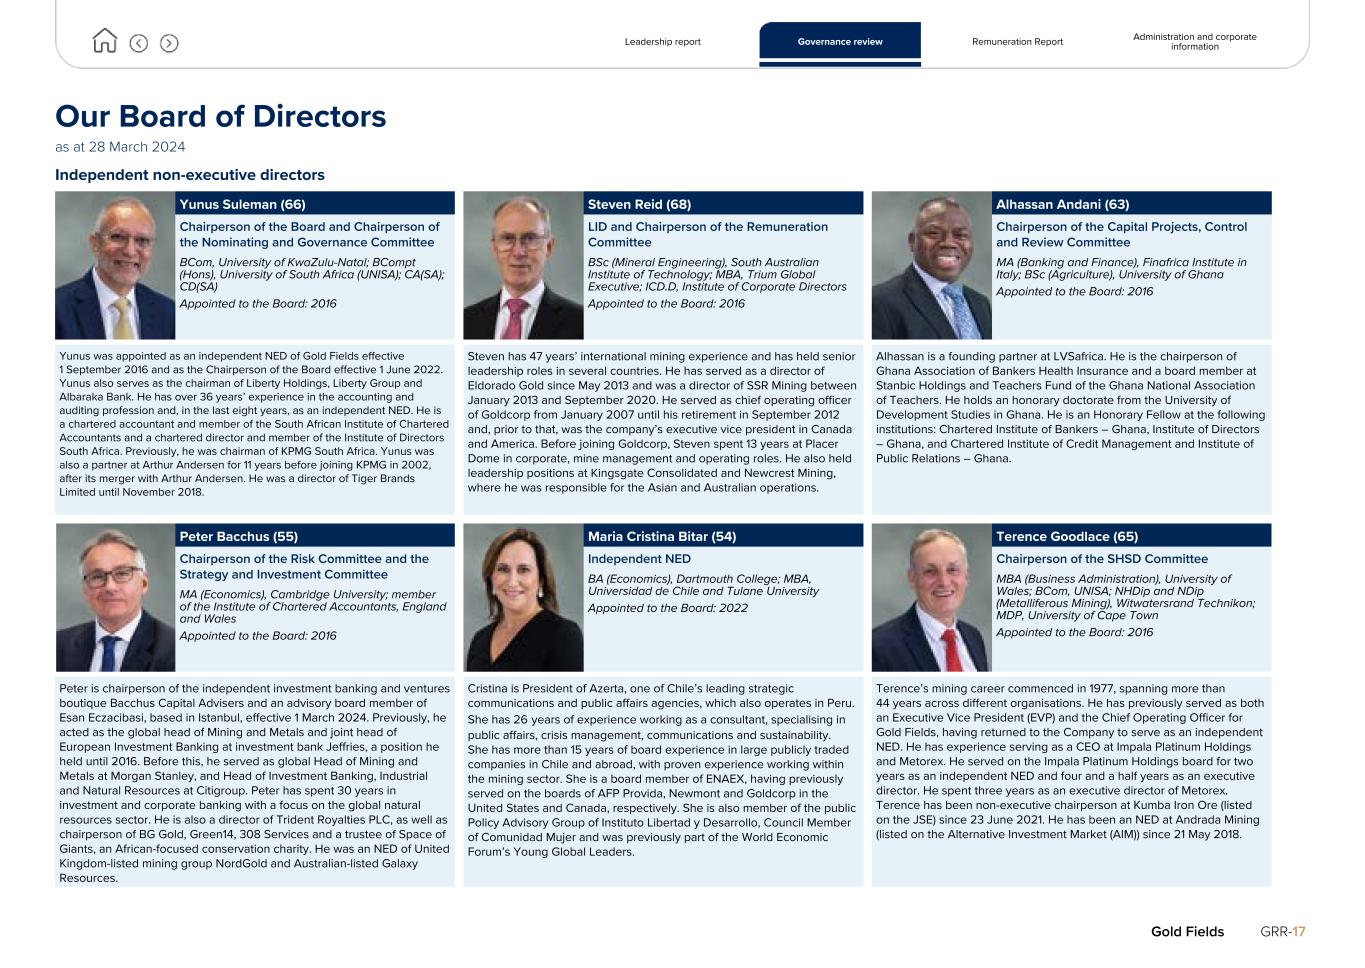
Our Board of Directors as at 28 March 2024 Independent non-executive directors Yunus Suleman (66) Chairperson of the Board and Chairperson of the Nominating and Governance Committee BCom, University of KwaZulu-Natal; BCompt (Hons), University of South Africa (UNISA); CA(SA); CD(SA) Appointed to the Board: 2016 Yunus was appointed as an independent NED of Gold Fields effective 1 September 2016 and as the Chairperson of the Board effective 1 June 2022. Yunus also serves as the chairman of Liberty Holdings, Liberty Group and Albaraka Bank. He has over 36 years’ experience in the accounting and auditing profession and, in the last eight years, as an independent NED. He is a chartered accountant and member of the South African Institute of Chartered Accountants and a chartered director and member of the Institute of Directors South Africa. Previously, he was chairman of KPMG South Africa. Yunus was also a partner at Arthur Andersen for 11 years before joining KPMG in 2002, after its merger with Arthur Andersen. He was a director of Tiger Brands Limited until November 2018. Steven Reid (68) LID and Chairperson of the Remuneration Committee BSc (Mineral Engineering), South Australian Institute of Technology; MBA, Trium Global Executive; ICD.D, Institute of Corporate Directors Appointed to the Board: 2016 Steven has 47 years’ international mining experience and has held senior leadership roles in several countries. He has served as a director of Eldorado Gold since May 2013 and was a director of SSR Mining between January 2013 and September 2020. He served as chief operating officer of Goldcorp from January 2007 until his retirement in September 2012 and, prior to that, was the company’s executive vice president in Canada and America. Before joining Goldcorp, Steven spent 13 years at Placer Dome in corporate, mine management and operating roles. He also held leadership positions at Kingsgate Consolidated and Newcrest Mining, where he was responsible for the Asian and Australian operations. Alhassan Andani (63) Chairperson of the Capital Projects, Control and Review Committee MA (Banking and Finance), Finafrica Institute in Italy; BSc (Agriculture), University of Ghana Appointed to the Board: 2016 Alhassan is a founding partner at LVSafrica. He is the chairperson of Ghana Association of Bankers Health Insurance and a board member at Stanbic Holdings and Teachers Fund of the Ghana National Association of Teachers. He holds an honorary doctorate from the University of Development Studies in Ghana. He is an Honorary Fellow at the following institutions: Chartered Institute of Bankers – Ghana, Institute of Directors – Ghana, and Chartered Institute of Credit Management and Institute of Public Relations – Ghana. Peter Bacchus (55) Chairperson of the Risk Committee and the Strategy and Investment Committee MA (Economics), Cambridge University; member of the Institute of Chartered Accountants, England and Wales Appointed to the Board: 2016 Peter is chairperson of the independent investment banking and ventures boutique Bacchus Capital Advisers and an advisory board member of Esan Eczacibasi, based in Istanbul, effective 1 March 2024. Previously, he acted as the global head of Mining and Metals and joint head of European Investment Banking at investment bank Jeffries, a position he held until 2016. Before this, he served as global Head of Mining and Metals at Morgan Stanley, and Head of Investment Banking, Industrial and Natural Resources at Citigroup. Peter has spent 30 years in investment and corporate banking with a focus on the global natural resources sector. He is also a director of Trident Royalties PLC, as well as chairperson of BG Gold, Green14, 308 Services and a trustee of Space of Giants, an African-focused conservation charity. He was an NED of United Kingdom-listed mining group NordGold and Australian-listed Galaxy Resources. Maria Cristina Bitar (54) Independent NED BA (Economics), Dartmouth College; MBA, Universidad de Chile and Tulane University Appointed to the Board: 2022 Cristina is President of Azerta, one of Chile’s leading strategic communications and public affairs agencies, which also operates in Peru. She has 26 years of experience working as a consultant, specialising in public affairs, crisis management, communications and sustainability. She has more than 15 years of board experience in large publicly traded companies in Chile and abroad, with proven experience working within the mining sector. She is a board member of ENAEX, having previously served on the boards of AFP Provida, Newmont and Goldcorp in the United States and Canada, respectively. She is also member of the public Policy Advisory Group of Instituto Libertad y Desarrollo, Council Member of Comunidad Mujer and was previously part of the World Economic Forum’s Young Global Leaders. Terence Goodlace (65) Chairperson of the SHSD Committee MBA (Business Administration), University of Wales; BCom, UNISA; NHDip and NDip (Metalliferous Mining), Witwatersrand Technikon; MDP, University of Cape Town Appointed to the Board: 2016 Terence’s mining career commenced in 1977, spanning more than 44 years across different organisations. He has previously served as both an Executive Vice President (EVP) and the Chief Operating Officer for Gold Fields, having returned to the Company to serve as an independent NED. He has experience serving as a CEO at Impala Platinum Holdings and Metorex. He served on the Impala Platinum Holdings board for two years as an independent NED and four and a half years as an executive director. He spent three years as an executive director of Metorex. Terence has been non-executive chairperson at Kumba Iron Ore (listed on the JSE) since 23 June 2021. He has been an NED at Andrada Mining (listed on the Alternative Investment Market (AIM)) since 21 May 2018. Leadership report Governance review Remuneration Report Administration and corporate information Gold Fields GRR-17

Our Board of Directors continued Independent non-executive directors continued Jacqueline McGill (56) Chairperson of the SET Committee MBA, La Trobe University; BSc (Ext Metallurgy), Murdoch University; honorary doctorate, Adelaide University Appointed to the Board: 2021 Jacqueline has more than 31 years of operational leadership experience in the mining resource sectors. She currently serves on the boards of ASX-listed New Hope Corporation and 29Metals, where she serves as chair of sustainability committees. Jacqueline also held chief executive level roles within BHP for both BHP Mitsui Coal and Olympic Dam Corporation. She has an honorary doctorate for her work in gender equity in the resources sector. Philisiwe Sibiya (47) Chairperson of the Audit Committee BCom (Hons), University of KwaZulu-Natal; CA(SA) Appointed to the Board: 2021 As a seasoned business executive, Philisiwe has nearly 21 years of management experience across Africa. After holding various senior financial roles, including CFO at MTN South Africa, she successfully transitioned into the role of CEO at MTN Cameroon – the first female appointed into a CEO position within the MTN Group – where she played a pivotal role in steering the business through a period of significant change as part of its turnaround strategy. She is the founder and CEO of Shingai Group and non-executive board member of JSE-listed AECI Limited, Investec plc and Investec Limited. Her accolades include Global Telecom’s Top 50 Women to Watch as well as Top 50 Businesswoman in Africa by Jeune Afrique. Carel Smit (61) Independent NED Higher Diploma in Tax Law, University of the Witwatersrand; BCompt and CTA, University of the Free State; CA(SA) Appointed to the Board: 2023 Carel was appointed as director of Gold Fields on 1 June 2023. He spent 35 years with KPMG and has extensive experience in audit, tax and advisory services with a strong focus on the mining sector across Africa, South America, and Australia. Carel was KPMG’s Head of Energy and Natural Resources in Africa and also lead partner on the Gold Fields audit from 2010 to 2017. He retired from KPMG in 2019 and has since been working as an independent consultant. Executive directors Michael (Mike) Fraser (58) CEO (effective 1 January 2024) BCom, MBL (Unisa), AMP (Harvard) GAICD Appointed to the Board: executive director and CEO – 1 January 2023 Mike joined Gold Fields as CEO on 1 January 2024. Following an early career in industrial services, Mike joined the mining sector in 2001 in BHP’s human resources department. He rose through the ranks at BHP to head Mozal Aluminium Smelter project in Mozambique in 2009 and thereafter was appointed the group’s president human resources, based in Melbourne. When BHP created South32 in 2015, Mike became president and chief operating officer of its global aluminium, nickel and South African manganese and energy coal business. In 2022, he was appointed CEO of Chaarat Gold, an AIM-listed junior gold miner. Paul Schmidt (56) CFO BCom, University of the Witwatersrand; BCompt (Hons), UNISA; CA(SA) Appointed to the Board: executive director and CFO – 2009 Paul was appointed CFO on 1 January 2009 and joined the Board on 6 November 2009. Prior to this appointment, he was acting CFO from 1 May 2008. Prior to this appointment, Paul was financial controller for Gold Fields from 1 April 2003. He has more than 27 years’ experience in the mining industry. Paul announced his intention to resign in August 2023 and will leave the Company once the new CFO takes up their role. Martin Preece (59) Chief Operating Officer BTech (Mining), Witwatersrand Technicon; Executive Development Programme, GIBS; Accelerated Development Programme, London Business School Appointed to the Board: executive director and Interim CEO – 1 January 2023 to 31 December 2023 Martin was the Interim CEO of Gold Fields in 2023, a position he held since January 2023. He joined Gold Fields as EVP South Africa in May 2017, leading the successful ramp-up of the South Deep mine since then. Prior to joining Gold Fields, he was chief operating officer at De Beers, South Africa. Martin has 38 years of mining experience, starting his career as a learner miner and holding a number of operational and technical roles before taking up mine manager positions at various operations across De Beers. After moving to Group level at De Beers, he held positions as mine strategist and business development manager before being appointed chief operating officer in 2011. Leadership report Governance review Remuneration Report Administration and corporate information Gold Fields GRR-18
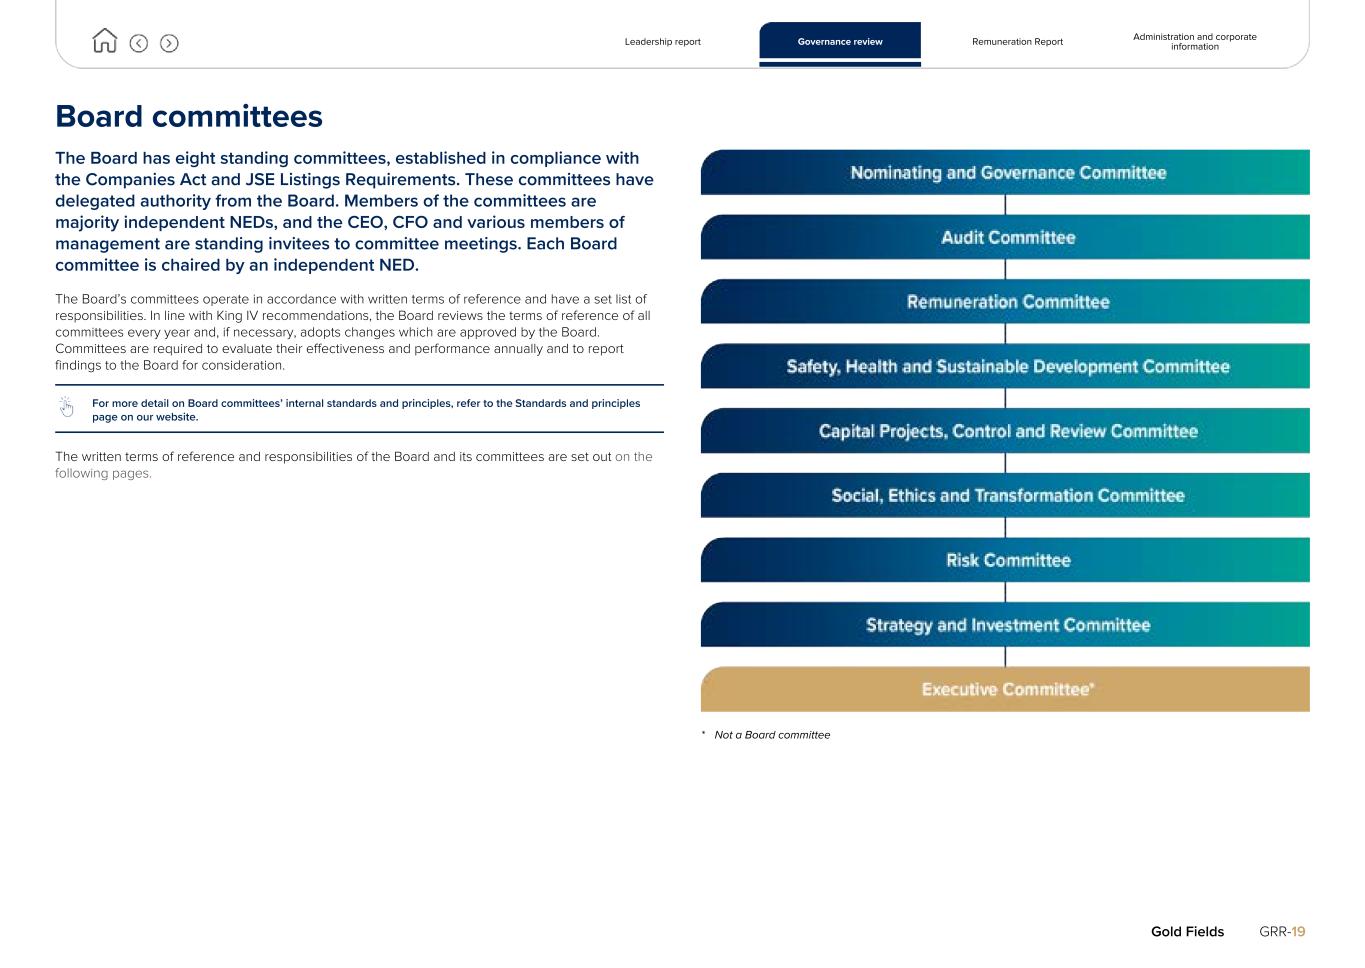
Board committees The Board has eight standing committees, established in compliance with the Companies Act and JSE Listings Requirements. These committees have delegated authority from the Board. Members of the committees are majority independent NEDs, and the CEO, CFO and various members of management are standing invitees to committee meetings. Each Board committee is chaired by an independent NED. The Board’s committees operate in accordance with written terms of reference and have a set list of responsibilities. In line with King IV recommendations, the Board reviews the terms of reference of all committees every year and, if necessary, adopts changes which are approved by the Board. Committees are required to evaluate their effectiveness and performance annually and to report findings to the Board for consideration. For more detail on Board committees’ internal standards and principles, refer to the Standards and principles page on our website. The written terms of reference and responsibilities of the Board and its committees are set out on the following pages. * Not a Board committee Leadership report Governance review Remuneration Report Administration and corporate information Gold Fields GRR-19
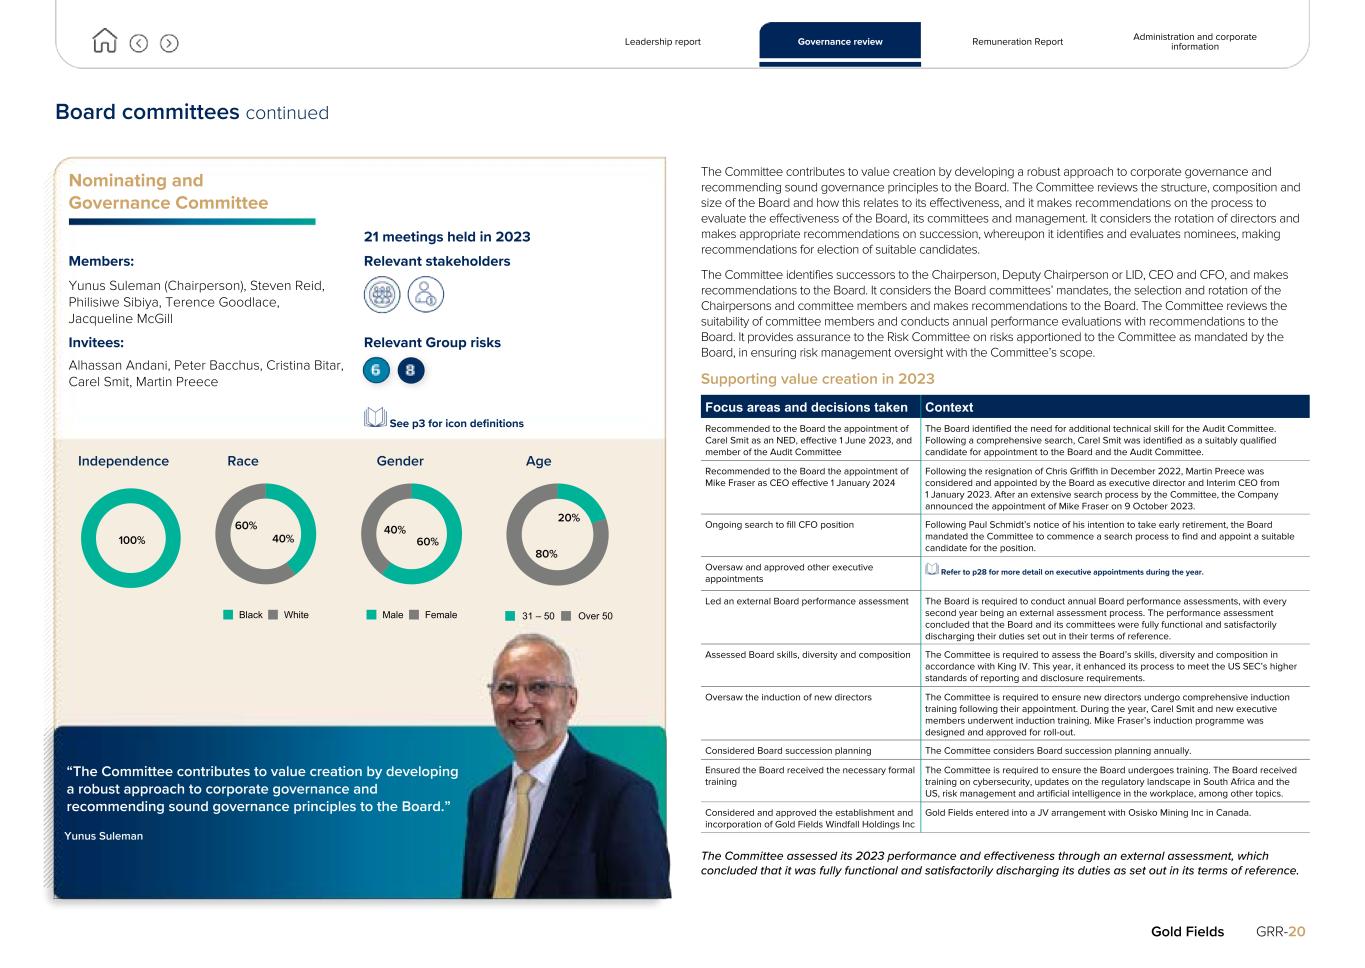
Board committees continued Nominating and Governance Committee 21 meetings held in 2023 Members: Relevant stakeholders Yunus Suleman (Chairperson), Steven Reid, Philisiwe Sibiya, Terence Goodlace, Jacqueline McGill Invitees: Relevant Group risks Alhassan Andani, Peter Bacchus, Cristina Bitar, Carel Smit, Martin Preece See p3 for icon definitions Independence Race Gender Age 100% 40% 60% Black White 60% 40% Male Female 20% 80% 31 – 50 Over 50 “The Committee contributes to value creation by developing a robust approach to corporate governance and recommending sound governance principles to the Board.” Yunus Suleman The Committee contributes to value creation by developing a robust approach to corporate governance and recommending sound governance principles to the Board. The Committee reviews the structure, composition and size of the Board and how this relates to its effectiveness, and it makes recommendations on the process to evaluate the effectiveness of the Board, its committees and management. It considers the rotation of directors and makes appropriate recommendations on succession, whereupon it identifies and evaluates nominees, making recommendations for election of suitable candidates. The Committee identifies successors to the Chairperson, Deputy Chairperson or LID, CEO and CFO, and makes recommendations to the Board. It considers the Board committees’ mandates, the selection and rotation of the Chairpersons and committee members and makes recommendations to the Board. The Committee reviews the suitability of committee members and conducts annual performance evaluations with recommendations to the Board. It provides assurance to the Risk Committee on risks apportioned to the Committee as mandated by the Board, in ensuring risk management oversight with the Committee’s scope. Supporting value creation in 2023 Focus areas and decisions taken Context Recommended to the Board the appointment of Carel Smit as an NED, effective 1 June 2023, and member of the Audit Committee The Board identified the need for additional technical skill for the Audit Committee. Following a comprehensive search, Carel Smit was identified as a suitably qualified candidate for appointment to the Board and the Audit Committee. Recommended to the Board the appointment of Mike Fraser as CEO effective 1 January 2024 Following the resignation of Chris Griffith in December 2022, Martin Preece was considered and appointed by the Board as executive director and Interim CEO from 1 January 2023. After an extensive search process by the Committee, the Company announced the appointment of Mike Fraser on 9 October 2023. Ongoing search to fill CFO position Following Paul Schmidt’s notice of his intention to take early retirement, the Board mandated the Committee to commence a search process to find and appoint a suitable candidate for the position. Oversaw and approved other executive appointments Refer to p28 for more detail on executive appointments during the year. Led an external Board performance assessment The Board is required to conduct annual Board performance assessments, with every second year being an external assessment process. The performance assessment concluded that the Board and its committees were fully functional and satisfactorily discharging their duties set out in their terms of reference. Assessed Board skills, diversity and composition The Committee is required to assess the Board’s skills, diversity and composition in accordance with King IV. This year, it enhanced its process to meet the US SEC’s higher standards of reporting and disclosure requirements. Oversaw the induction of new directors The Committee is required to ensure new directors undergo comprehensive induction training following their appointment. During the year, Carel Smit and new executive members underwent induction training. Mike Fraser’s induction programme was designed and approved for roll-out. Considered Board succession planning The Committee considers Board succession planning annually. Ensured the Board received the necessary formal training The Committee is required to ensure the Board undergoes training. The Board received training on cybersecurity, updates on the regulatory landscape in South Africa and the US, risk management and artificial intelligence in the workplace, among other topics. Considered and approved the establishment and incorporation of Gold Fields Windfall Holdings Inc Gold Fields entered into a JV arrangement with Osisko Mining Inc in Canada. The Committee assessed its 2023 performance and effectiveness through an external assessment, which concluded that it was fully functional and satisfactorily discharging its duties as set out in its terms of reference. Leadership report Governance review Remuneration Report Administration and corporate information Gold Fields GRR-20
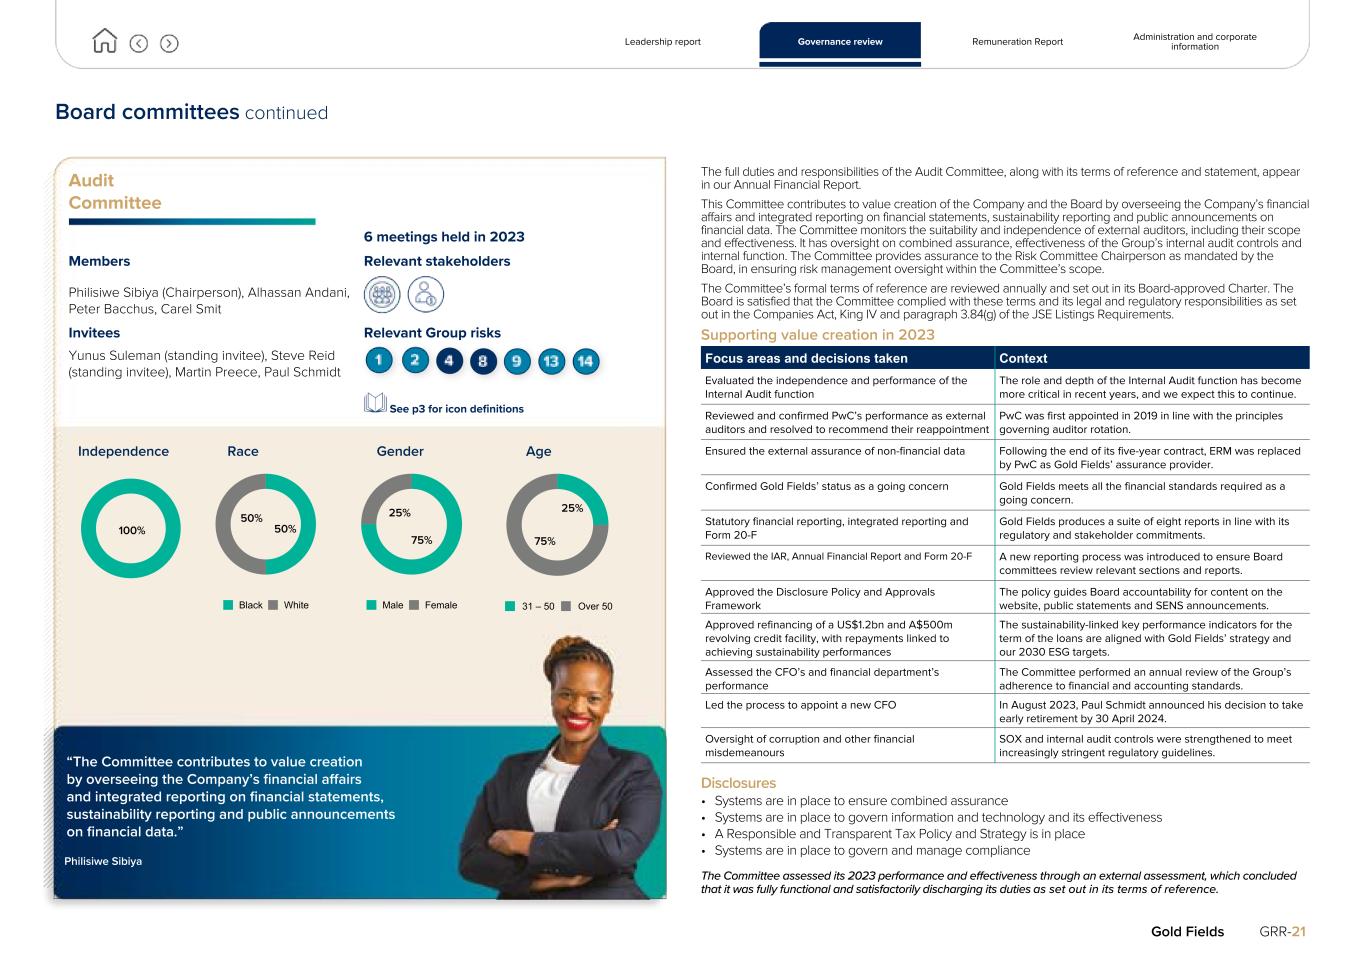
Board committees continued Audit Committee 6 meetings held in 2023 Members Relevant stakeholders Philisiwe Sibiya (Chairperson), Alhassan Andani, Peter Bacchus, Carel Smit Invitees Relevant Group risks Yunus Suleman (standing invitee), Steve Reid (standing invitee), Martin Preece, Paul Schmidt See p3 for icon definitions Independence Race Gender Age 100% 50% 50% Black White 75% 25% Male Female 25% 75% 31 – 50 Over 50 “The Committee contributes to value creation by overseeing the Company’s financial affairs and integrated reporting on financial statements, sustainability reporting and public announcements on financial data.” Philisiwe Sibiya The full duties and responsibilities of the Audit Committee, along with its terms of reference and statement, appear in our Annual Financial Report. This Committee contributes to value creation of the Company and the Board by overseeing the Company’s financial affairs and integrated reporting on financial statements, sustainability reporting and public announcements on financial data. The Committee monitors the suitability and independence of external auditors, including their scope and effectiveness. It has oversight on combined assurance, effectiveness of the Group’s internal audit controls and internal function. The Committee provides assurance to the Risk Committee Chairperson as mandated by the Board, in ensuring risk management oversight within the Committee’s scope. The Committee’s formal terms of reference are reviewed annually and set out in its Board-approved Charter. The Board is satisfied that the Committee complied with these terms and its legal and regulatory responsibilities as set out in the Companies Act, King IV and paragraph 3.84(g) of the JSE Listings Requirements. Supporting value creation in 2023 Focus areas and decisions taken Context Evaluated the independence and performance of the Internal Audit function The role and depth of the Internal Audit function has become more critical in recent years, and we expect this to continue. Reviewed and confirmed PwC’s performance as external auditors and resolved to recommend their reappointment PwC was first appointed in 2019 in line with the principles governing auditor rotation. Ensured the external assurance of non-financial data Following the end of its five-year contract, ERM was replaced by PwC as Gold Fields’ assurance provider. Confirmed Gold Fields’ status as a going concern Gold Fields meets all the financial standards required as a going concern. Statutory financial reporting, integrated reporting and Form 20-F Gold Fields produces a suite of eight reports in line with its regulatory and stakeholder commitments. Reviewed the IAR, Annual Financial Report and Form 20-F A new reporting process was introduced to ensure Board committees review relevant sections and reports. Approved the Disclosure Policy and Approvals Framework The policy guides Board accountability for content on the website, public statements and SENS announcements. Approved refinancing of a US$1.2bn and A$500m revolving credit facility, with repayments linked to achieving sustainability performances The sustainability-linked key performance indicators for the term of the loans are aligned with Gold Fields’ strategy and our 2030 ESG targets. Assessed the CFO’s and financial department’s performance The Committee performed an annual review of the Group’s adherence to financial and accounting standards. Led the process to appoint a new CFO In August 2023, Paul Schmidt announced his decision to take early retirement by 30 April 2024. Oversight of corruption and other financial misdemeanours SOX and internal audit controls were strengthened to meet increasingly stringent regulatory guidelines. Disclosures • Systems are in place to ensure combined assurance • Systems are in place to govern information and technology and its effectiveness • A Responsible and Transparent Tax Policy and Strategy is in place • Systems are in place to govern and manage compliance The Committee assessed its 2023 performance and effectiveness through an external assessment, which concluded that it was fully functional and satisfactorily discharging its duties as set out in its terms of reference. Leadership report Governance review Remuneration Report Administration and corporate information Gold Fields GRR-21
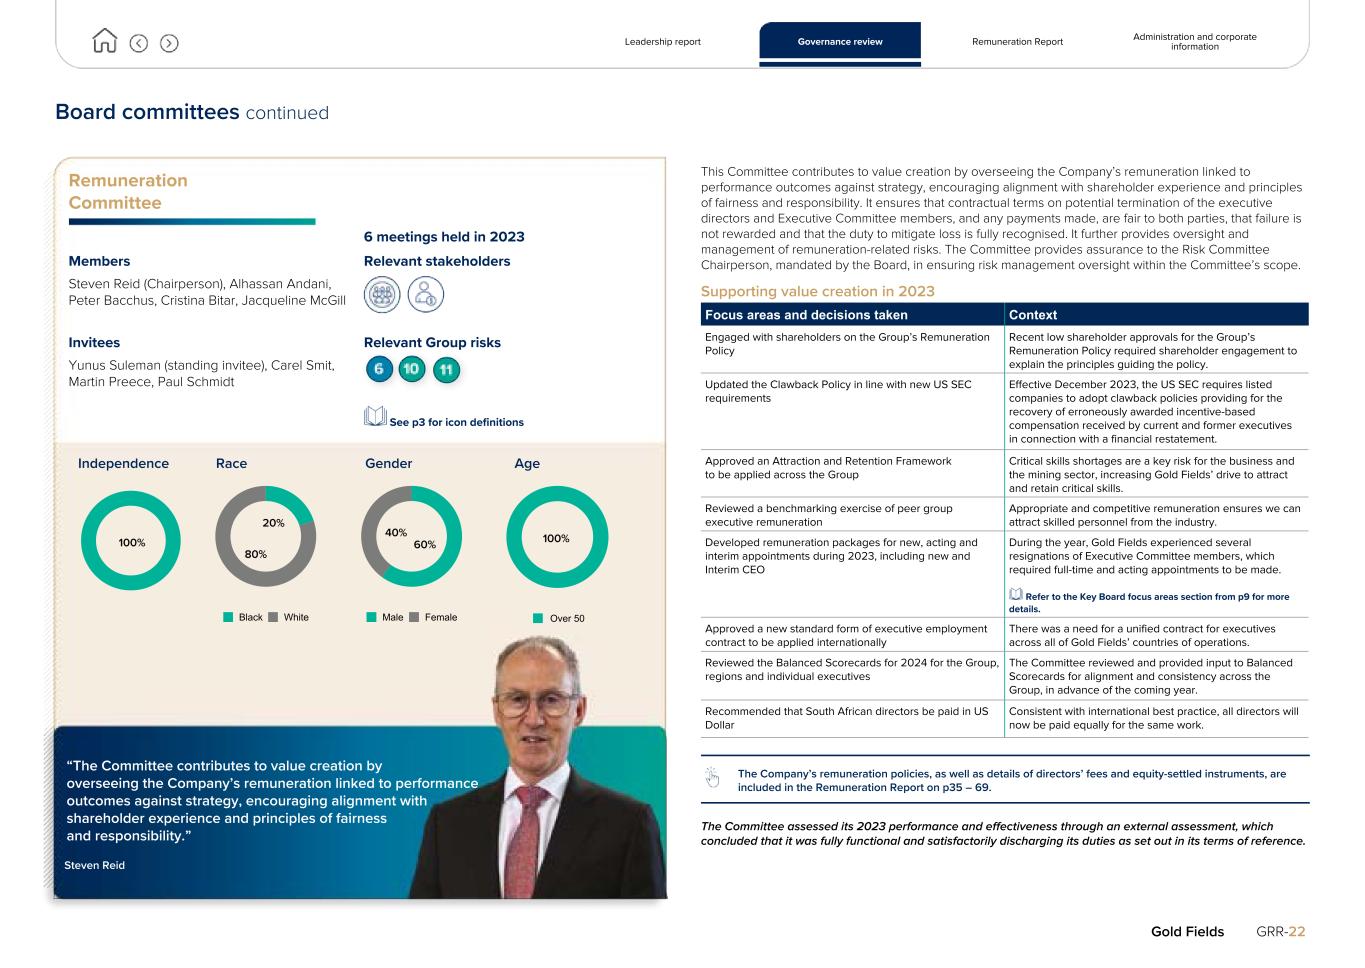
Board committees continued Remuneration Committee 6 meetings held in 2023 Members Relevant stakeholders Steven Reid (Chairperson), Alhassan Andani, Peter Bacchus, Cristina Bitar, Jacqueline McGill Invitees Relevant Group risks Yunus Suleman (standing invitee), Carel Smit, Martin Preece, Paul Schmidt See p3 for icon definitions Independence Race Gender Age 100% 20% 80% Black White 60% 40% Male Female 100% Over 50 “The Committee contributes to value creation by overseeing the Company’s remuneration linked to performance outcomes against strategy, encouraging alignment with shareholder experience and principles of fairness and responsibility.” Steven Reid This Committee contributes to value creation by overseeing the Company’s remuneration linked to performance outcomes against strategy, encouraging alignment with shareholder experience and principles of fairness and responsibility. It ensures that contractual terms on potential termination of the executive directors and Executive Committee members, and any payments made, are fair to both parties, that failure is not rewarded and that the duty to mitigate loss is fully recognised. It further provides oversight and management of remuneration-related risks. The Committee provides assurance to the Risk Committee Chairperson, mandated by the Board, in ensuring risk management oversight within the Committee’s scope. Supporting value creation in 2023 Focus areas and decisions taken Context Engaged with shareholders on the Group’s Remuneration Policy Recent low shareholder approvals for the Group’s Remuneration Policy required shareholder engagement to explain the principles guiding the policy. Updated the Clawback Policy in line with new US SEC requirements Effective December 2023, the US SEC requires listed companies to adopt clawback policies providing for the recovery of erroneously awarded incentive-based compensation received by current and former executives in connection with a financial restatement. Approved an Attraction and Retention Framework to be applied across the Group Critical skills shortages are a key risk for the business and the mining sector, increasing Gold Fields’ drive to attract and retain critical skills. Reviewed a benchmarking exercise of peer group executive remuneration Appropriate and competitive remuneration ensures we can attract skilled personnel from the industry. Developed remuneration packages for new, acting and interim appointments during 2023, including new and Interim CEO During the year, Gold Fields experienced several resignations of Executive Committee members, which required full-time and acting appointments to be made. Refer to the Key Board focus areas section from p9 for more details. Approved a new standard form of executive employment contract to be applied internationally There was a need for a unified contract for executives across all of Gold Fields’ countries of operations. Reviewed the Balanced Scorecards for 2024 for the Group, regions and individual executives The Committee reviewed and provided input to Balanced Scorecards for alignment and consistency across the Group, in advance of the coming year. Recommended that South African directors be paid in US Dollar Consistent with international best practice, all directors will now be paid equally for the same work. The Company’s remuneration policies, as well as details of directors’ fees and equity-settled instruments, are included in the Remuneration Report on p35 – 69. The Committee assessed its 2023 performance and effectiveness through an external assessment, which concluded that it was fully functional and satisfactorily discharging its duties as set out in its terms of reference. Leadership report Governance review Remuneration Report Administration and corporate information Gold Fields GRR-22
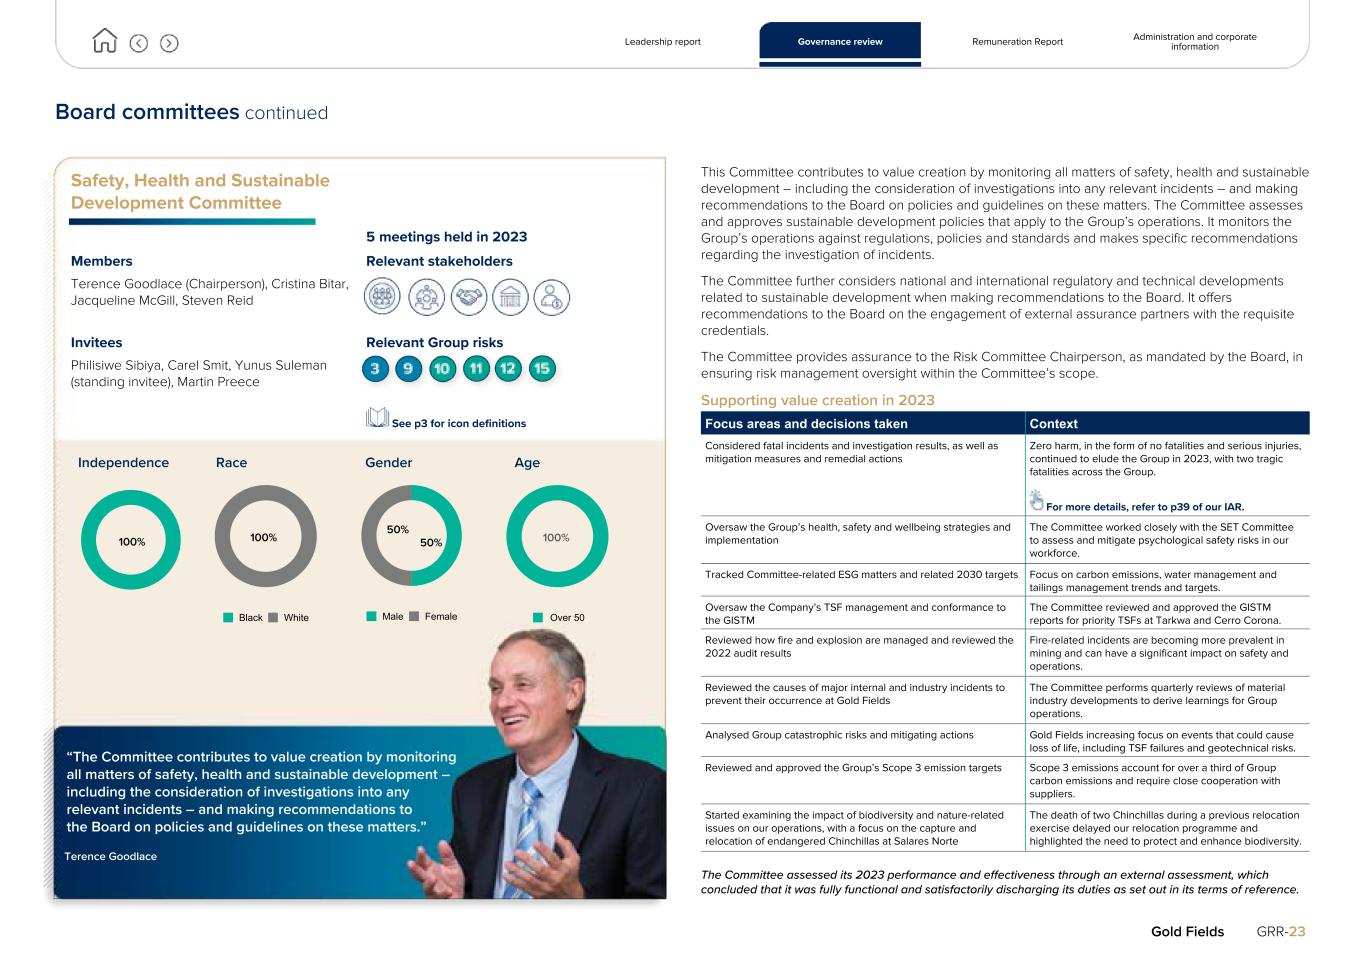
Board committees continued Safety, Health and Sustainable Development Committee 5 meetings held in 2023 Members Relevant stakeholders Terence Goodlace (Chairperson), Cristina Bitar, Jacqueline McGill, Steven Reid Invitees Relevant Group risks Philisiwe Sibiya, Carel Smit, Yunus Suleman (standing invitee), Martin Preece See p3 for icon definitions Independence Race Gender Age 100% 100% Black White 50% 50% Male Female 100% Over 50 “The Committee contributes to value creation by monitoring all matters of safety, health and sustainable development – including the consideration of investigations into any relevant incidents – and making recommendations to the Board on policies and guidelines on these matters.” Terence Goodlace This Committee contributes to value creation by monitoring all matters of safety, health and sustainable development – including the consideration of investigations into any relevant incidents – and making recommendations to the Board on policies and guidelines on these matters. The Committee assesses and approves sustainable development policies that apply to the Group’s operations. It monitors the Group’s operations against regulations, policies and standards and makes specific recommendations regarding the investigation of incidents. The Committee further considers national and international regulatory and technical developments related to sustainable development when making recommendations to the Board. It offers recommendations to the Board on the engagement of external assurance partners with the requisite credentials. The Committee provides assurance to the Risk Committee Chairperson, as mandated by the Board, in ensuring risk management oversight within the Committee’s scope. Supporting value creation in 2023 Focus areas and decisions taken Context Considered fatal incidents and investigation results, as well as mitigation measures and remedial actions Zero harm, in the form of no fatalities and serious injuries, continued to elude the Group in 2023, with two tragic fatalities across the Group. For more details, refer to p39 of our IAR. Oversaw the Group’s health, safety and wellbeing strategies and implementation The Committee worked closely with the SET Committee to assess and mitigate psychological safety risks in our workforce. Tracked Committee-related ESG matters and related 2030 targets Focus on carbon emissions, water management and tailings management trends and targets. Oversaw the Company’s TSF management and conformance to the GISTM The Committee reviewed and approved the GISTM reports for priority TSFs at Tarkwa and Cerro Corona. Reviewed how fire and explosion are managed and reviewed the 2022 audit results Fire-related incidents are becoming more prevalent in mining and can have a significant impact on safety and operations. Reviewed the causes of major internal and industry incidents to prevent their occurrence at Gold Fields The Committee performs quarterly reviews of material industry developments to derive learnings for Group operations. Analysed Group catastrophic risks and mitigating actions Gold Fields increasing focus on events that could cause loss of life, including TSF failures and geotechnical risks. Reviewed and approved the Group’s Scope 3 emission targets Scope 3 emissions account for over a third of Group carbon emissions and require close cooperation with suppliers. Started examining the impact of biodiversity and nature-related issues on our operations, with a focus on the capture and relocation of endangered Chinchillas at Salares Norte The death of two Chinchillas during a previous relocation exercise delayed our relocation programme and highlighted the need to protect and enhance biodiversity. The Committee assessed its 2023 performance and effectiveness through an external assessment, which concluded that it was fully functional and satisfactorily discharging its duties as set out in its terms of reference. Leadership report Governance review Remuneration Report Administration and corporate information Gold Fields GRR-23
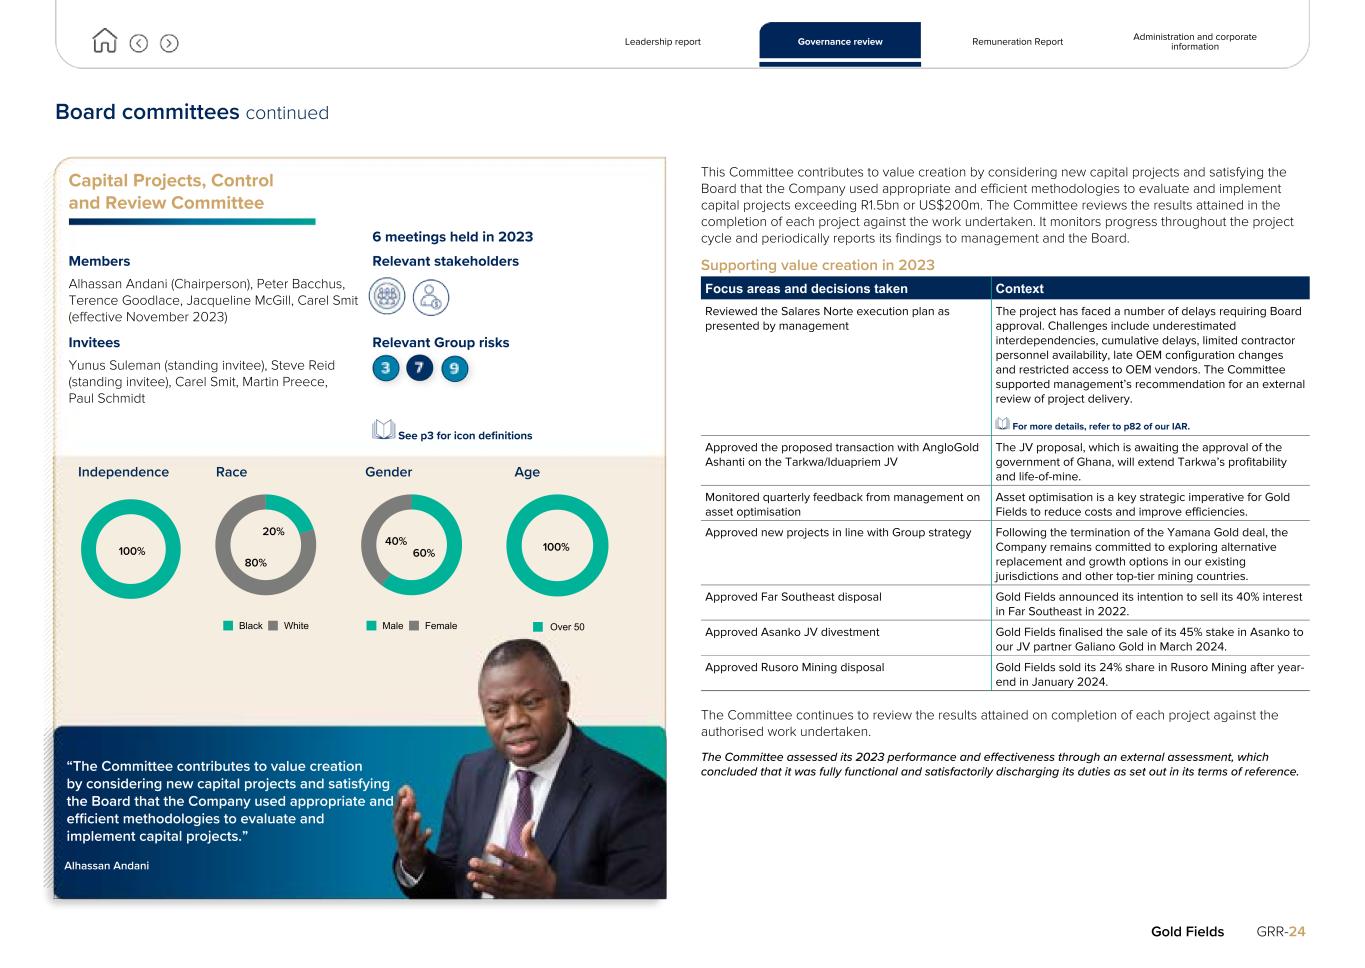
Board committees continued Capital Projects, Control and Review Committee 6 meetings held in 2023 Members Relevant stakeholders Alhassan Andani (Chairperson), Peter Bacchus, Terence Goodlace, Jacqueline McGill, Carel Smit (effective November 2023) Invitees Relevant Group risks Yunus Suleman (standing invitee), Steve Reid (standing invitee), Carel Smit, Martin Preece, Paul Schmidt See p3 for icon definitions Independence Race Gender Age 100% 20% 80% Black White 60% 40% Male Female 100% Over 50 “The Committee contributes to value creation by considering new capital projects and satisfying the Board that the Company used appropriate and efficient methodologies to evaluate and implement capital projects.” Alhassan Andani This Committee contributes to value creation by considering new capital projects and satisfying the Board that the Company used appropriate and efficient methodologies to evaluate and implement capital projects exceeding R1.5bn or US$200m. The Committee reviews the results attained in the completion of each project against the work undertaken. It monitors progress throughout the project cycle and periodically reports its findings to management and the Board. Supporting value creation in 2023 Focus areas and decisions taken Context Reviewed the Salares Norte execution plan as presented by management The project has faced a number of delays requiring Board approval. Challenges include underestimated interdependencies, cumulative delays, limited contractor personnel availability, late OEM configuration changes and restricted access to OEM vendors. The Committee supported management’s recommendation for an external review of project delivery. For more details, refer to p82 of our IAR. Approved the proposed transaction with AngloGold Ashanti on the Tarkwa/Iduapriem JV The JV proposal, which is awaiting the approval of the government of Ghana, will extend Tarkwa’s profitability and life-of-mine. Monitored quarterly feedback from management on asset optimisation Asset optimisation is a key strategic imperative for Gold Fields to reduce costs and improve efficiencies. Approved new projects in line with Group strategy Following the termination of the Yamana Gold deal, the Company remains committed to exploring alternative replacement and growth options in our existing jurisdictions and other top-tier mining countries. Approved Far Southeast disposal Gold Fields announced its intention to sell its 40% interest in Far Southeast in 2022. Approved Asanko JV divestment Gold Fields finalised the sale of its 45% stake in Asanko to our JV partner Galiano Gold in March 2024. Approved Rusoro Mining disposal Gold Fields sold its 24% share in Rusoro Mining after year- end in January 2024. The Committee continues to review the results attained on completion of each project against the authorised work undertaken. The Committee assessed its 2023 performance and effectiveness through an external assessment, which concluded that it was fully functional and satisfactorily discharging its duties as set out in its terms of reference. Leadership report Governance review Remuneration Report Administration and corporate information Gold Fields GRR-24
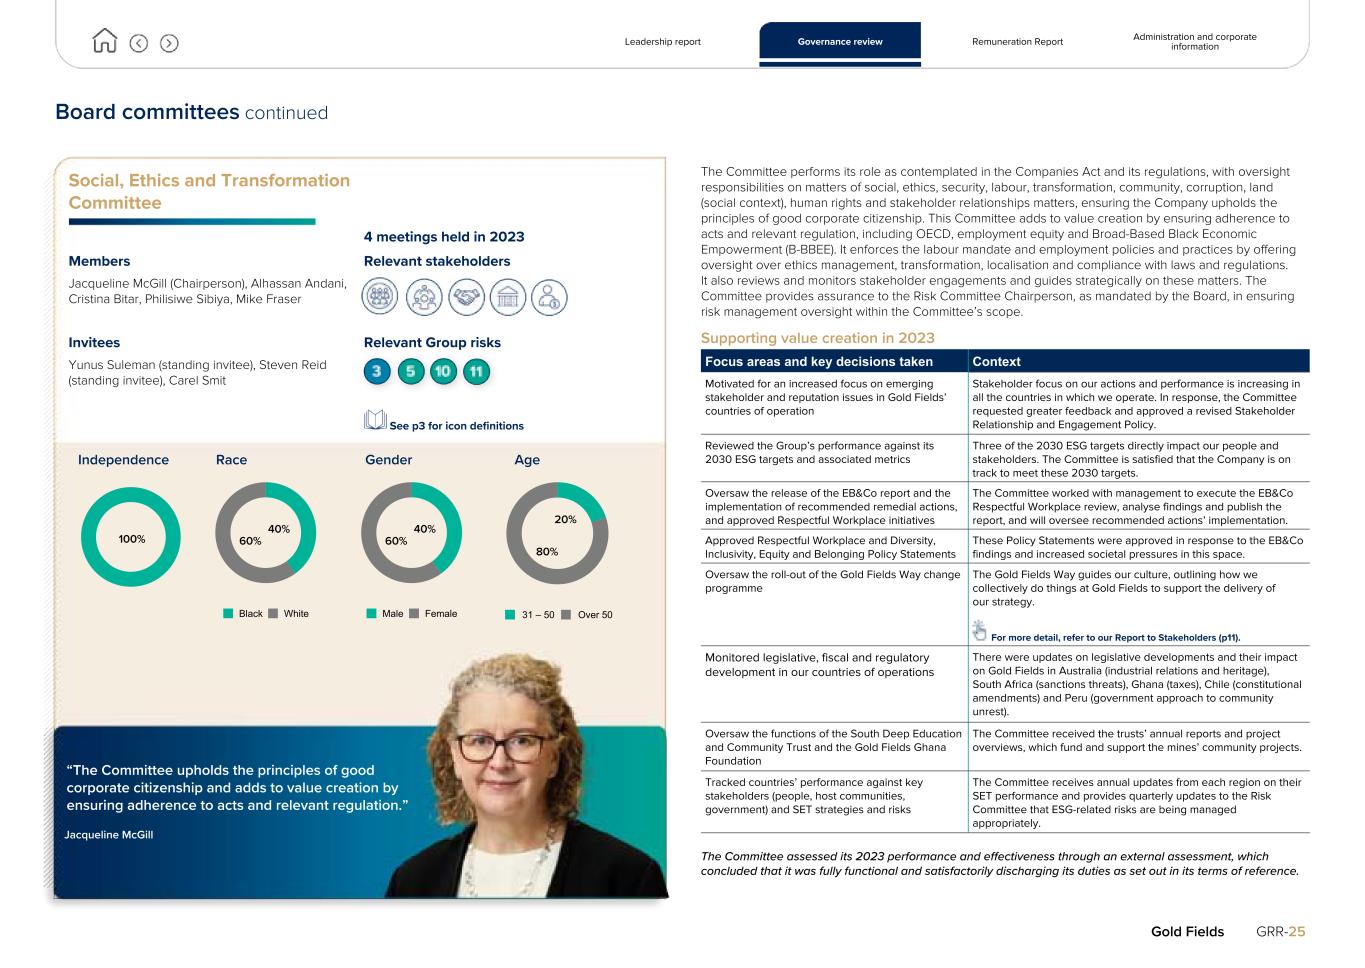
Board committees continued Social, Ethics and Transformation Committee 4 meetings held in 2023 Members Relevant stakeholders Jacqueline McGill (Chairperson), Alhassan Andani, Cristina Bitar, Philisiwe Sibiya, Mike Fraser Invitees Relevant Group risks Yunus Suleman (standing invitee), Steven Reid (standing invitee), Carel Smit See p3 for icon definitions Independence Race Gender Age 100% 40% 60% Black White 40% 60% Male Female 20% 80% 31 – 50 Over 50 “The Committee upholds the principles of good corporate citizenship and adds to value creation by ensuring adherence to acts and relevant regulation.” Jacqueline McGill The Committee performs its role as contemplated in the Companies Act and its regulations, with oversight responsibilities on matters of social, ethics, security, labour, transformation, community, corruption, land (social context), human rights and stakeholder relationships matters, ensuring the Company upholds the principles of good corporate citizenship. This Committee adds to value creation by ensuring adherence to acts and relevant regulation, including OECD, employment equity and Broad-Based Black Economic Empowerment (B-BBEE). It enforces the labour mandate and employment policies and practices by offering oversight over ethics management, transformation, localisation and compliance with laws and regulations. It also reviews and monitors stakeholder engagements and guides strategically on these matters. The Committee provides assurance to the Risk Committee Chairperson, as mandated by the Board, in ensuring risk management oversight within the Committee’s scope. Supporting value creation in 2023 Focus areas and key decisions taken Context Motivated for an increased focus on emerging stakeholder and reputation issues in Gold Fields’ countries of operation Stakeholder focus on our actions and performance is increasing in all the countries in which we operate. In response, the Committee requested greater feedback and approved a revised Stakeholder Relationship and Engagement Policy. Reviewed the Group’s performance against its 2030 ESG targets and associated metrics Three of the 2030 ESG targets directly impact our people and stakeholders. The Committee is satisfied that the Company is on track to meet these 2030 targets. Oversaw the release of the EB&Co report and the implementation of recommended remedial actions, and approved Respectful Workplace initiatives The Committee worked with management to execute the EB&Co Respectful Workplace review, analyse findings and publish the report, and will oversee recommended actions’ implementation. Approved Respectful Workplace and Diversity, Inclusivity, Equity and Belonging Policy Statements These Policy Statements were approved in response to the EB&Co findings and increased societal pressures in this space. Oversaw the roll-out of the Gold Fields Way change programme The Gold Fields Way guides our culture, outlining how we collectively do things at Gold Fields to support the delivery of our strategy. For more detail, refer to our Report to Stakeholders (p11). Monitored legislative, fiscal and regulatory development in our countries of operations There were updates on legislative developments and their impact on Gold Fields in Australia (industrial relations and heritage), South Africa (sanctions threats), Ghana (taxes), Chile (constitutional amendments) and Peru (government approach to community unrest). Oversaw the functions of the South Deep Education and Community Trust and the Gold Fields Ghana Foundation The Committee received the trusts’ annual reports and project overviews, which fund and support the mines’ community projects. Tracked countries’ performance against key stakeholders (people, host communities, government) and SET strategies and risks The Committee receives annual updates from each region on their SET performance and provides quarterly updates to the Risk Committee that ESG-related risks are being managed appropriately. The Committee assessed its 2023 performance and effectiveness through an external assessment, which concluded that it was fully functional and satisfactorily discharging its duties as set out in its terms of reference. Leadership report Governance review Remuneration Report Administration and corporate information Gold Fields GRR-25
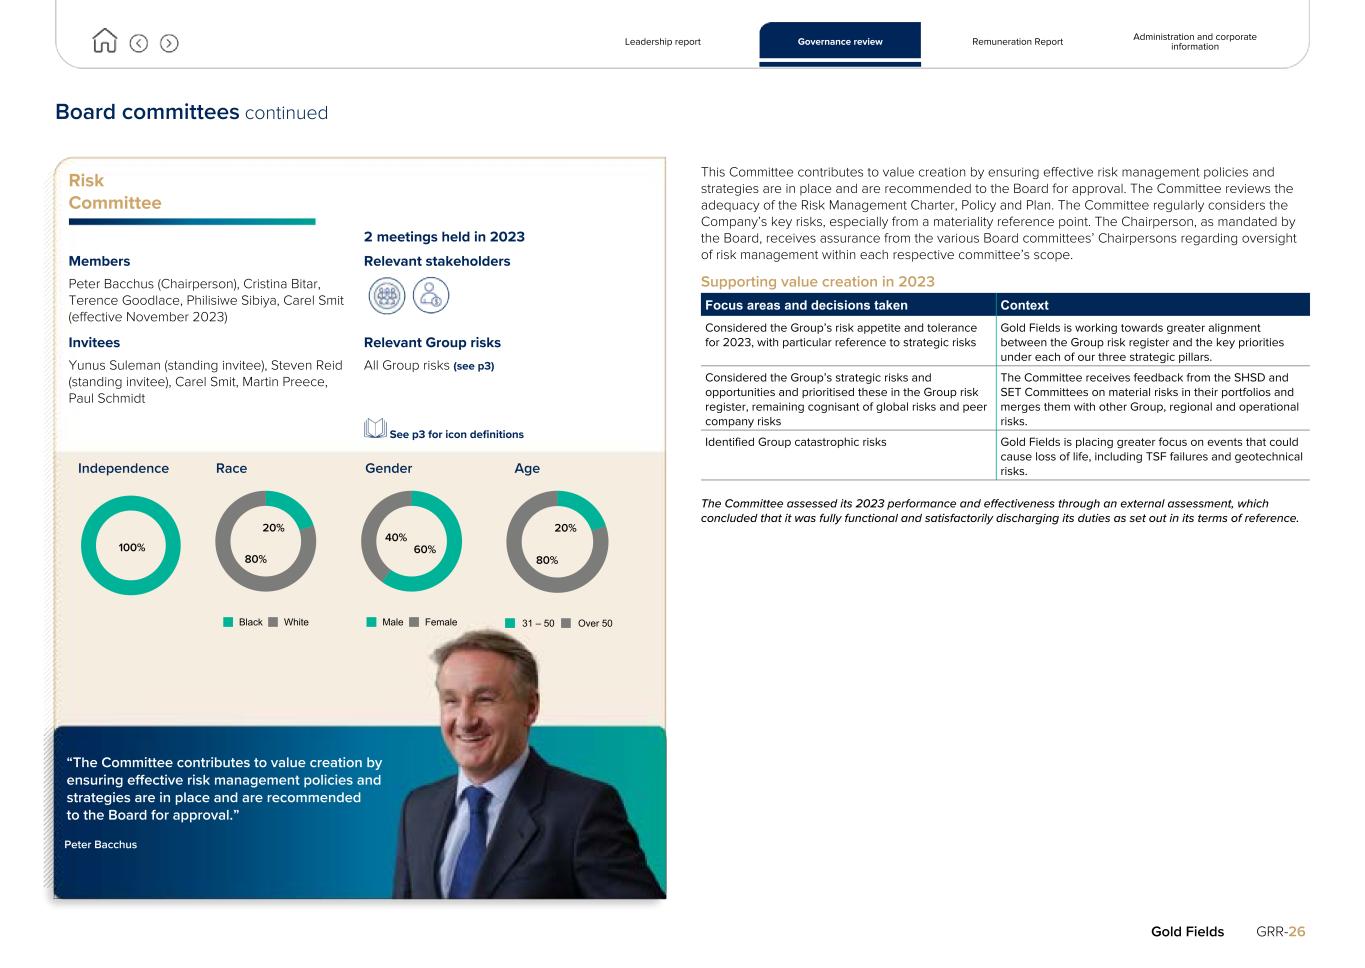
Board committees continued Risk Committee 2 meetings held in 2023 Members Relevant stakeholders Peter Bacchus (Chairperson), Cristina Bitar, Terence Goodlace, Philisiwe Sibiya, Carel Smit (effective November 2023) Invitees Relevant Group risks Yunus Suleman (standing invitee), Steven Reid (standing invitee), Carel Smit, Martin Preece, Paul Schmidt All Group risks (see p3) See p3 for icon definitions Independence Race Gender Age 100% 20% 80% Black White 60% 40% Male Female 20% 80% 31 – 50 Over 50 “The Committee contributes to value creation by ensuring effective risk management policies and strategies are in place and are recommended to the Board for approval.” Peter Bacchus This Committee contributes to value creation by ensuring effective risk management policies and strategies are in place and are recommended to the Board for approval. The Committee reviews the adequacy of the Risk Management Charter, Policy and Plan. The Committee regularly considers the Company’s key risks, especially from a materiality reference point. The Chairperson, as mandated by the Board, receives assurance from the various Board committees’ Chairpersons regarding oversight of risk management within each respective committee’s scope. Supporting value creation in 2023 Focus areas and decisions taken Context Considered the Group’s risk appetite and tolerance for 2023, with particular reference to strategic risks Gold Fields is working towards greater alignment between the Group risk register and the key priorities under each of our three strategic pillars. Considered the Group’s strategic risks and opportunities and prioritised these in the Group risk register, remaining cognisant of global risks and peer company risks The Committee receives feedback from the SHSD and SET Committees on material risks in their portfolios and merges them with other Group, regional and operational risks. Identified Group catastrophic risks Gold Fields is placing greater focus on events that could cause loss of life, including TSF failures and geotechnical risks. The Committee assessed its 2023 performance and effectiveness through an external assessment, which concluded that it was fully functional and satisfactorily discharging its duties as set out in its terms of reference. Leadership report Governance review Remuneration Report Administration and corporate information Gold Fields GRR-26
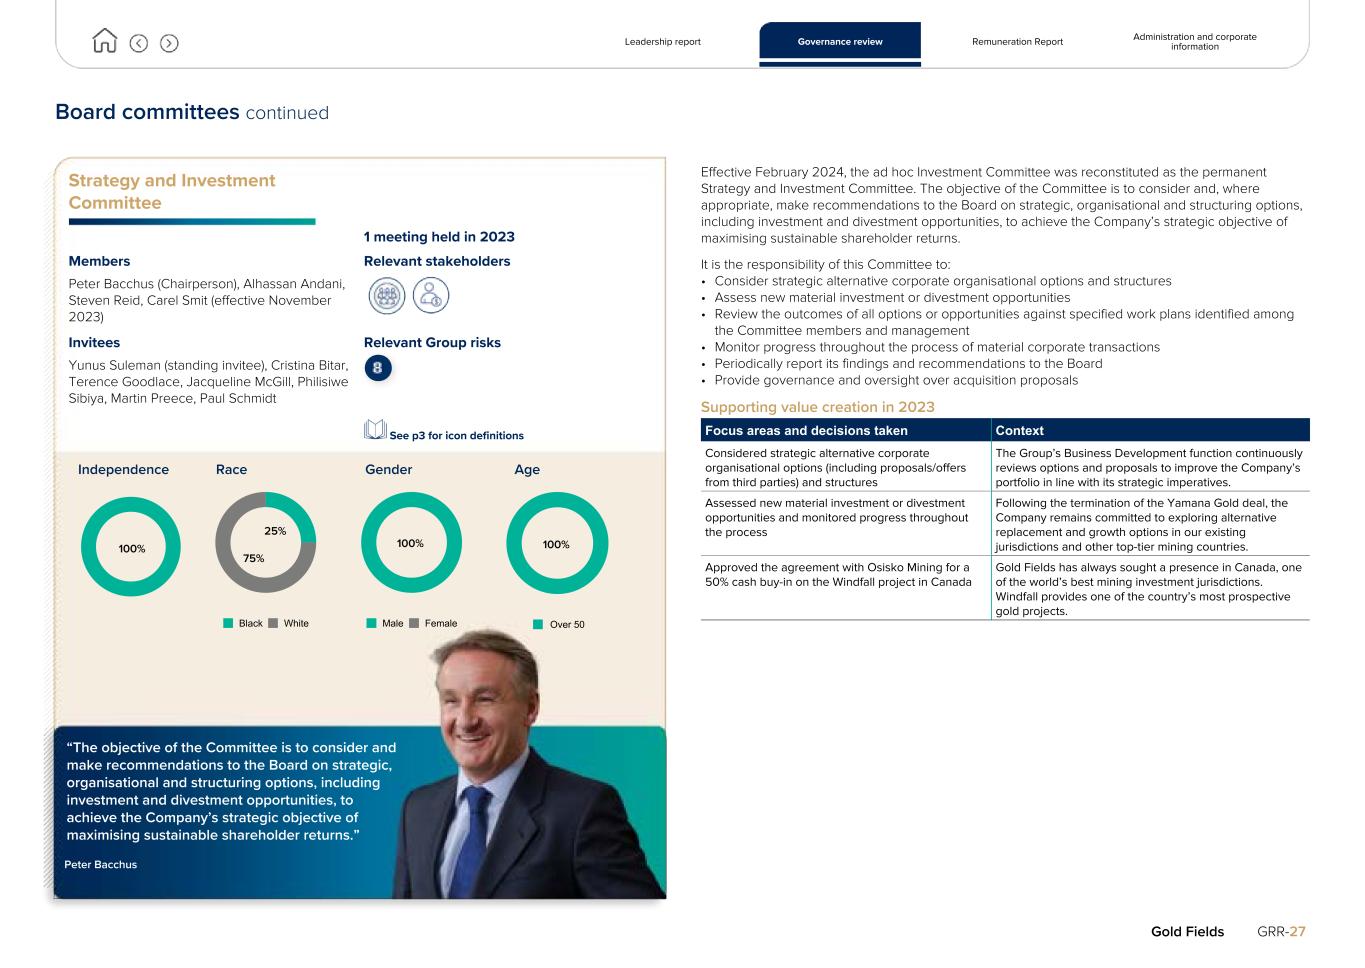
Board committees continued Strategy and Investment Committee 1 meeting held in 2023 Members Relevant stakeholders Peter Bacchus (Chairperson), Alhassan Andani, Steven Reid, Carel Smit (effective November 2023) Invitees Relevant Group risks Yunus Suleman (standing invitee), Cristina Bitar, Terence Goodlace, Jacqueline McGill, Philisiwe Sibiya, Martin Preece, Paul Schmidt See p3 for icon definitions Independence Race Gender Age 100% 25% 75% Black White 100% Male Female 100% Over 50 “The objective of the Committee is to consider and make recommendations to the Board on strategic, organisational and structuring options, including investment and divestment opportunities, to achieve the Company’s strategic objective of maximising sustainable shareholder returns.” Peter Bacchus Effective February 2024, the ad hoc Investment Committee was reconstituted as the permanent Strategy and Investment Committee. The objective of the Committee is to consider and, where appropriate, make recommendations to the Board on strategic, organisational and structuring options, including investment and divestment opportunities, to achieve the Company’s strategic objective of maximising sustainable shareholder returns. It is the responsibility of this Committee to: • Consider strategic alternative corporate organisational options and structures • Assess new material investment or divestment opportunities • Review the outcomes of all options or opportunities against specified work plans identified among the Committee members and management • Monitor progress throughout the process of material corporate transactions • Periodically report its findings and recommendations to the Board • Provide governance and oversight over acquisition proposals Supporting value creation in 2023 Focus areas and decisions taken Context Considered strategic alternative corporate organisational options (including proposals/offers from third parties) and structures The Group’s Business Development function continuously reviews options and proposals to improve the Company’s portfolio in line with its strategic imperatives. Assessed new material investment or divestment opportunities and monitored progress throughout the process Following the termination of the Yamana Gold deal, the Company remains committed to exploring alternative replacement and growth options in our existing jurisdictions and other top-tier mining countries. Approved the agreement with Osisko Mining for a 50% cash buy-in on the Windfall project in Canada Gold Fields has always sought a presence in Canada, one of the world’s best mining investment jurisdictions. Windfall provides one of the country’s most prospective gold projects. Leadership report Governance review Remuneration Report Administration and corporate information Gold Fields GRR-27
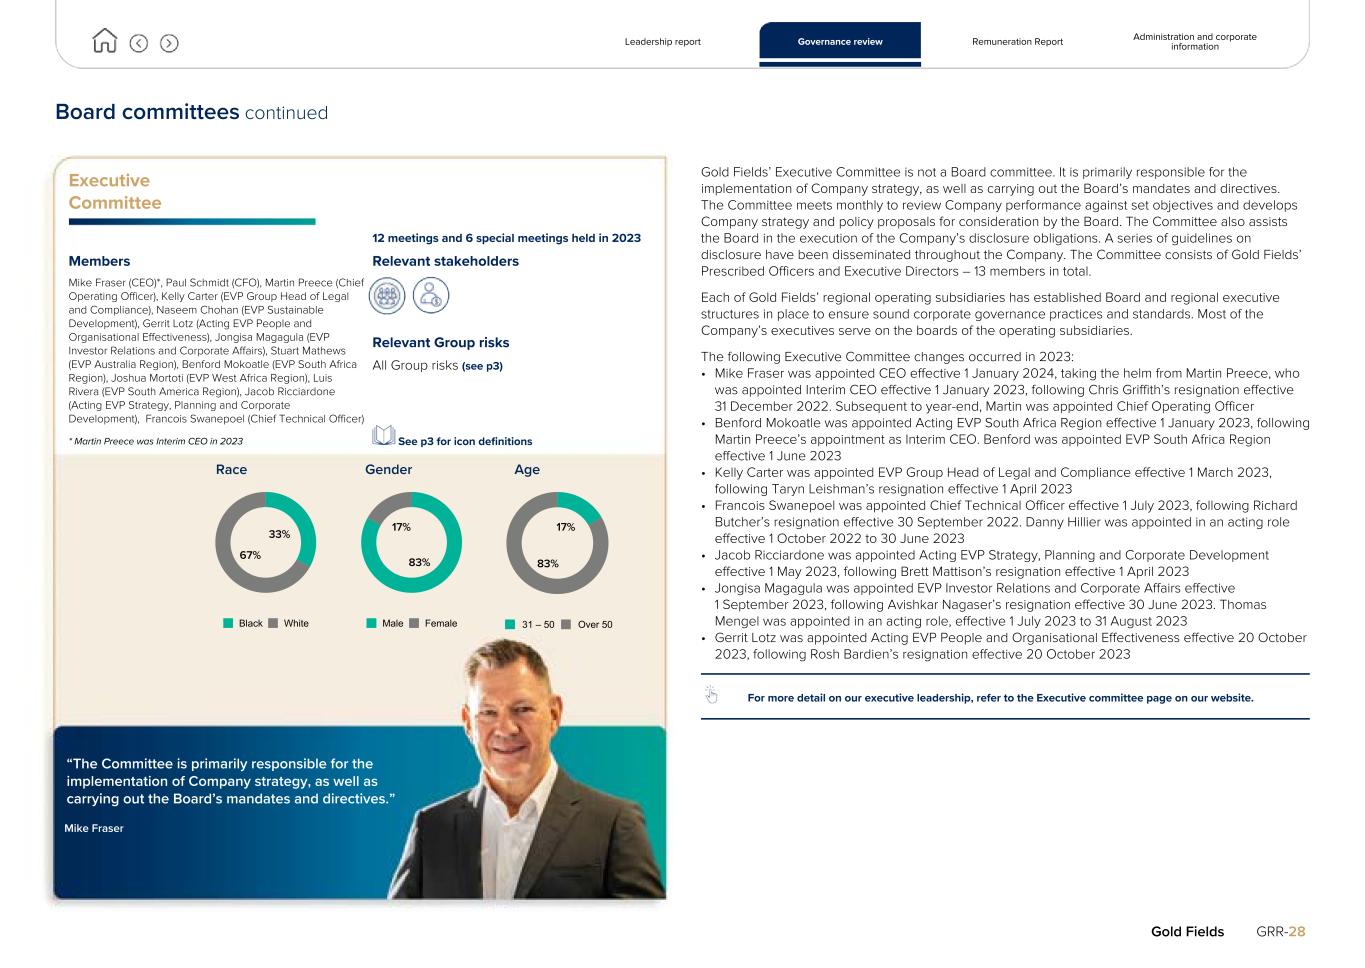
Board committees continued Executive Committee 12 meetings and 6 special meetings held in 2023 Members Relevant stakeholders Mike Fraser (CEO)*, Paul Schmidt (CFO), Martin Preece (Chief Operating Officer), Kelly Carter (EVP Group Head of Legal and Compliance), Naseem Chohan (EVP Sustainable Development), Gerrit Lotz (Acting EVP People and Organisational Effectiveness), Jongisa Magagula (EVP Investor Relations and Corporate Affairs), Stuart Mathews (EVP Australia Region), Benford Mokoatle (EVP South Africa Region), Joshua Mortoti (EVP West Africa Region), Luis Rivera (EVP South America Region), Jacob Ricciardone (Acting EVP Strategy, Planning and Corporate Development), Francois Swanepoel (Chief Technical Officer) * Martin Preece was Interim CEO in 2023 Relevant Group risks All Group risks (see p3) See p3 for icon definitions Race Gender Age 33% 67% Black White 83% 17% Male Female 17% 83% 31 – 50 Over 50 “The Committee is primarily responsible for the implementation of Company strategy, as well as carrying out the Board’s mandates and directives.” Mike Fraser Gold Fields’ Executive Committee is not a Board committee. It is primarily responsible for the implementation of Company strategy, as well as carrying out the Board’s mandates and directives. The Committee meets monthly to review Company performance against set objectives and develops Company strategy and policy proposals for consideration by the Board. The Committee also assists the Board in the execution of the Company’s disclosure obligations. A series of guidelines on disclosure have been disseminated throughout the Company. The Committee consists of Gold Fields’ Prescribed Officers and Executive Directors – 13 members in total. Each of Gold Fields’ regional operating subsidiaries has established Board and regional executive structures in place to ensure sound corporate governance practices and standards. Most of the Company’s executives serve on the boards of the operating subsidiaries. The following Executive Committee changes occurred in 2023: • Mike Fraser was appointed CEO effective 1 January 2024, taking the helm from Martin Preece, who was appointed Interim CEO effective 1 January 2023, following Chris Griffith’s resignation effective 31 December 2022. Subsequent to year-end, Martin was appointed Chief Operating Officer • Benford Mokoatle was appointed Acting EVP South Africa Region effective 1 January 2023, following Martin Preece’s appointment as Interim CEO. Benford was appointed EVP South Africa Region effective 1 June 2023 • Kelly Carter was appointed EVP Group Head of Legal and Compliance effective 1 March 2023, following Taryn Leishman’s resignation effective 1 April 2023 • Francois Swanepoel was appointed Chief Technical Officer effective 1 July 2023, following Richard Butcher’s resignation effective 30 September 2022. Danny Hillier was appointed in an acting role effective 1 October 2022 to 30 June 2023 • Jacob Ricciardone was appointed Acting EVP Strategy, Planning and Corporate Development effective 1 May 2023, following Brett Mattison’s resignation effective 1 April 2023 • Jongisa Magagula was appointed EVP Investor Relations and Corporate Affairs effective 1 September 2023, following Avishkar Nagaser’s resignation effective 30 June 2023. Thomas Mengel was appointed in an acting role, effective 1 July 2023 to 31 August 2023 • Gerrit Lotz was appointed Acting EVP People and Organisational Effectiveness effective 20 October 2023, following Rosh Bardien’s resignation effective 20 October 2023 For more detail on our executive leadership, refer to the Executive committee page on our website. Leadership report Governance review Remuneration Report Administration and corporate information Gold Fields GRR-28
Application of King IV within Gold Fields The Board is committed to the principles and recommended practices of King IV and, to this end, ensured material compliance during 2023. The table below provides an overview of Gold Fields’ compliance with the principles. Should gaps be identified, the Board instructs management to address these as work in progress. Leadership, ethics and corporate citizenship Leadership Principle 1: The governing body should lead ethically and effectively. The Board, Gold Fields’ governing body, through its various committees, is confident on a prospective basis that the combined inputs of its committees produce conformity with this principle. The Board exhibits the requisite levels of integrity, responsibility, accountability, fairness and transparency. The Board steers and oversees the strategic direction and acts in the best interest of the Group. Furthermore, the Board members sign the Code of Ethics upon onboarding and complete declarations of interest at each Board cycle and any other interim meeting. Gaps, if any arise, are addressed under the guidance and management of the Executive Committee through management plans. The Executive Committee reports to the Board on progress and execution of these matters. Organisational ethics Principle 2: The governing body should govern the ethics of the organisation in a way that supports the establishment of an ethical culture. The SET Committee comprises independent non-executive members, and one executive member. The Committee ensures conformity with this principle through the Code of Ethics and the Group Disciplinary Code that set out sanctions to be followed. The implementation and execution of the Code of Ethics and related policies are delegated to management. Responsible corporate citizenship Principle 3: The governing body should ensure that the organisation is and is seen to be a responsible corporate citizen. The Board, through the SET Committee and the SHSD Committee, ensures conformity with this principle. The SHSD Committee is committed to the 10 principles of the ICMM and the UN Global Compact’s 10 sustainable development principles, and ensures compliance therewith. All internal policies are aligned with the relevant legislation from time to time. Principle application Leadership report Governance review Remuneration Report Administration and corporate information Gold Fields GRR-29
Application of King IV within Gold Fields continued Principle application Strategy performance and reporting Strategy and performance Principle 4: The governing body should appreciate that the organisation’s core purposes, its risks and opportunities, strategy and business model, performance and sustainable development are all inseparable elements of the value creation process. The Board conforms to this principle. The Board oversees strategy formulation and execution, and sets performance targets, which are agreed upon with management. Standing committees are established to assist the Board in discharging its duties and responsibilities. Together with management, the Board reviews the strategy on an annual basis. The Board has oversight responsibility on strategy implementation through quarterly reports and the IAR that the Board approves. Reporting Principle 5: The governing body should ensure that reports issued by the organisation enable stakeholders to make informed assessments of the organisation’s performance, and short, medium and long-term prospects. The Board keeps its shareholders updated in line with the JSE Listings Requirements and ensures integrity of external reports in so far as dealing with assurance of external reports. Prior to the AGM, the Board engages major shareholders to address any concerns they may have. Gold Fields’ full suite of reports are published on the website. Primary role and responsibilities of the governing body Principle 6: The governing body should serve as the focal point and custodian of corporate governance in the organisation. The Board is the custodian of corporate governance in the Group. The approval of the IAR and associated reports is delegated to the Audit Committee. The Board receives external advice as and when required or necessary, and it keeps abreast of corporate governance practices both locally and abroad, making recommendations where appropriate, for Board participation in continuing education programmes. The Board Charter also sets out the Board’s responsibilities, duties and accountability towards the Group. The Charter is reviewed annually. Composition of the governing body Principle 7: The governing body should comprise the appropriate balance of knowledge, skills, experience, diversity and independence for it to discharge its governance role and responsibilities objectively and effectively. The Board delegates to the Nominating and Governance Committee the nomination, election and the appointment processes, having set the criteria for the selection of candidates to serve on the Board. The Board, through the Nominating and Governance Committee, ensures that the composition of the Board comprises the appropriate mix of knowledge, skills and experience sufficient to deliver on strategies and create long-term shareholder value. The Nominating and Governance Committee is the custodian of the Diversity Policy as it pertains to the appointment of NEDs. Leadership report Governance review Remuneration Report Administration and corporate information Gold Fields GRR-30
Application of King IV within Gold Fields continued Principle application Strategy performance and reporting continued Committees of the governing body Principle 8: The governing body should ensure that its arrangements for delegation within its own structures promote independent judgement, and assist with balance of power and the effective discharge of its duties. The Board delegates particular roles to the committees of the Board. The committees operate under Board-approved terms of reference, which set out the nature and extent of the responsibilities delegated and decision-making authority. Through the Nominating and Governance Committee, the Board ensures that these committees are well resourced with a balance of skills and expertise. The committees of the Board, which meet independently of each other, include the following: Audit Committee; Risk Committee; Nominating and Governance Committee; SET Committee; Remuneration Committee; SHSD Committee; Capital Projects, Control and Review Committee; and Strategy and Investment Committee. Evaluations of the performance of the governing body Principle 9: The governing body should ensure that the evaluation of its own performance and that of its committees, its Chairperson and its individual members support continued improvement in its performance and effectiveness. The Board regularly monitors and appraises its own performance, those of its committees and individual NEDs. The Board further evaluates the independence of its independent NEDs, which is rigorously tested in respect of the independent NEDs who have served on the Board for an aggregate term exceeding nine years. The Board schedules in its yearly work plan an opportunity for consideration, reflection and discussion of its performance and that of its committees, its Chairperson and its members as a whole. During 2022, an internal Board and committee evaluation process was conducted. The key strengths and areas of improvement were identified, and the Board is updated regularly regarding the progress in addressing gaps identified at previous evaluations. Appointment and delegation to management Principle 10: The governing body should ensure that the appointment of, and delegation to, management contribute to role clarity and the effective exercise of authority and responsibilities. The Board authority is conferred on management through the CEO. The approval of the Board is required to the levels of the subdelegation immediately below the CEO. Governance functional areas Principle 11: The governing body should govern risk in a way that supports the organisation in setting and achieving its strategic objectives. The Board delegates this authority to the Risk Committee. The Risk Committee has oversight of the integrity and effectiveness of the risk management processes. A comprehensive strategic and operational risk management process is in place throughout the Group. Technology and information governance Principle 12: The governing body should govern technology and information in a way that supports the organisation setting and achieving its strategic objectives. The Board delegates this authority to the Audit Committee. The Audit Committee and Risk Committee ensure the IT framework is in place and that the IT Charter and policies are established and implemented. A detailed information, communication and technology risk assessment is performed annually across the Group, with key strategic risk themes highlighted in the risk enterprise register. The Chief Information Officer reports directly to executive management on cybersecurity issues, which, if material, are reported to the Audit Committee. Leadership report Governance review Remuneration Report Administration and corporate information Gold Fields GRR-31
Application of King IV within Gold Fields continued Principle application Governance functional areas continued Compliance governance Principle 13: The governing body should govern compliance with applicable laws and adopted, non-binding rules, codes and standards in a way that supports the organisation being ethical and a good corporate citizen. The Board delegates this authority to the Audit Committee. The Board approves policies that articulate and give effect to its direction on compliance. The following policies are applicable: anti-bribery and corruption governance framework, and management guidelines in relation to the Group governance and compliance framework. Remuneration governance Principle 14: The governing body should ensure that the organisation remunerates fairly, responsibly and transparently so as to promote the achievement of strategic objectives and positive outcomes in the short, medium and long term. The Board delegates this authority to the Remuneration Committee. The Remuneration Committee assists the Board in overseeing all aspects of remuneration practices for the Group to ensure employees are remunerated fairly, responsibly and transparently. Fair and competitive reward processes are embedded in the organisation. These processes encourage and result in the achievement of the Group’s strategic objectives and positive outcomes in the short, medium and long term. Assurance Principle 15: The governing body should ensure that assurance services and functions enable an effective control environment, and that these support the integrity of information for internal decision-making and of the organisation’s external reports. The combined assurance guideline for the Group provides an analysis of all the assurance activities within the Group. The Board, executive management and senior management identify additional areas that may require assurance on an ongoing basis. Stakeholders Principle 16: In the execution of its governance roles and responsibilities, the governing body should adopt a stakeholder inclusive approach that balances the needs, interests and expectations of material stakeholders in the best interests of the organisation over time. The Group’s Stakeholder Relationship and Engagement Policy Statement is aligned with King IV and approved by the Board. The policy was revised to be inclusive of business-wide stakeholders that are material and not just those relevant to sustainable development, particularly employees and shareholders. The governance framework addresses relationships within the Group’s companies and shareholder relationships. Leadership report Governance review Remuneration Report Administration and corporate information Gold Fields GRR-32
Application of section 3.84 of the JSE Listings Requirements 3.84(a) There must be a policy evidencing a clear balance of power and authority at Board of Directors’ level to ensure that no one director has unfettered powers of decision-making. The Board Charter ensures that there is clear balance of power and authority at Board level and that no one director has unfettered decision-making powers. The Board Charter also incorporates principles that ensure that there is a clear balance of power. 3.84(b) Issuers must have an appointed CEO and a Chairperson, and the same person must not hold these positions. The Chairperson must either be an independent director, or the issuer must appoint a lead director in accordance with King IV. Gold Fields’ CEO and Chairperson positions are held by different people, and the Chairperson is an independent NED. The Board has also appointed an LID, who performs the role and functions of the Chairperson in the absence of the Chairperson for any reason. 3.84(c) All issuers must, in compliance with King IV, appoint an Audit Committee. Issuers must appoint a Remuneration Committee, and issuers must appoint a Social and Ethics Committee. The composition of such committees, a brief description of their mandate, the number of meetings held and any other relevant information must be disclosed in the annual report. The Board appointed an Audit Committee that is chaired by an independent NED. Audit Committee members are all independent NEDs. Gold Fields’ Remuneration Committee comprises independent NEDs and has an independent Chairperson that is not the Chairperson of the Board. Gold Fields’ SET Committee is aligned with King IV and the Companies Act. The Committee comprises majority independent NEDs and one executive director. Each Committee provides a brief description in the IAR of its mandate, number of meetings held in a year and any other relevant information. 3.84(d) Brief CVs of each director standing for election or re-election must accompany the relevant notice of the meeting. Brief CVs of our directors are listed on p17 – 18. 3.84(e) The capacity of each director must be categorised as executive, non- executive or independent. The CVs of our directors include information on whether a director is an independent NED or an executive director. The composition of committees is in accordance with the requirements of the Companies Act and King IV. 3. 84(f) Issuers must have a full-time executive Financial Director. Gold Fields has a full-time Financial Director. 3.84(g) The Audit Committee must, on an annual basis, consider and satisfy itself of the appropriateness of the expertise and experience of the Financial Director and report same in the annual report. The Audit Committee must ensure that the issuer has established appropriate financial reporting procedures and that those procedures are operating. The Audit Committee has executed its responsibilities in terms of section 3.84(g) of the JSE Listings Requirements. See more details in the Audit Committee Report in our Annual Financial Report. The Audit Committee considers and satisfies itself of the appropriateness of the expertise and experience of Gold Fields’ Financial Director on an annual basis and reports the findings to the Board. The Audit Committee has established appropriate financial reporting procedures that are operational throughout the Group. These are reviewed from time to time to ensure that they are operating effectively and remain appropriate for all entities within the Group. Information detailed in paragraphs 3.84(g)(iii), 3.86 and 3.87 in the assessment of suitability appointment is requested from the audit firm. The Audit Committee ensures that the appointment of the auditor is presented and included as a resolution at the AGM. Principle Gold Fields’ approach and compliance Leadership report Governance review Remuneration Report Administration and corporate information Gold Fields GRR-33
Application of section 3.84 of the JSE Listings Requirements continued Principle Gold Fields’ approach and compliance 3.84(h) The Board of Directors appoints the Company Secretary in accordance with the Companies Act and applies the recommended practices in King IV. The Board must consider and satisfy itself, on an annual basis, on the competence, qualifications and experience of the Company Secretary. The Company Secretary is appointed in accordance with the Companies Act. The Board considered the Company Secretary’s competence, qualifications and experience at its meeting held in November 2023 and is satisfied that she is competent and has the appropriate qualifications and experience to serve as the Company Secretary. 3.84(i) The Board of Directors or the Nominating Committee must have a policy on the promotion of broader diversity at Board level, specifically focusing on the promotion of the diversity attributes of gender, race, culture, age, field of knowledge, skills and experience. The issuer must confirm this by reporting to shareholders in its annual report on how the Board of Directors or the Nominating Committee have considered and applied the policy of broader diversity in the nomination and appointment of directors and if applicable, must further report progress in respect thereof on agreed voluntary targets. The Board approved a Company-wide Diversity Policy in November 2017. This policy is reviewed and updated as and when necessary. The Board takes the policy into account with all instances of director succession. Diversity and inclusion remain high on the Board’s agenda for director succession. 3.84(j) The Remuneration Policy and Implementation Report must be tabled every year for separate non-binding advisory votes by shareholders of the issuer at the AGM. The Remuneration Policy must record the measures that the Board of Directors of the issuer commits to take if either the Remuneration Policy or the Implementation Report, or both, are voted against by 25% or more of the votes exercised. If either the Remuneration Policy or the Implementation Report, or both, are voted against by shareholders exercising 25% or more of the voting rights exercised, the issuer must in its voting results announcement provide for the following: • An invitation to dissenting shareholders to engage with the issuer • The manner and timing of such engagement The Board approved the Group Remuneration Policy and Implementation Report as presented at the AGM for a non-binding advisory vote. Leadership report Governance review Remuneration Report Administration and corporate information Gold Fields GRR-34
Leadership report Governance review Remuneration Report Administration and corporate information Gold Fields GRR-35 Remuneration Report IN THIS SECTION 36 Introduction to the Remuneration Report ¢ 37 Section 1: Background statement ¢ 40 Section 2: Remuneration Policy ¢ 51 Section 3: Implementation Report ¢ Underground mine workers at our South Deep mine in South Africa
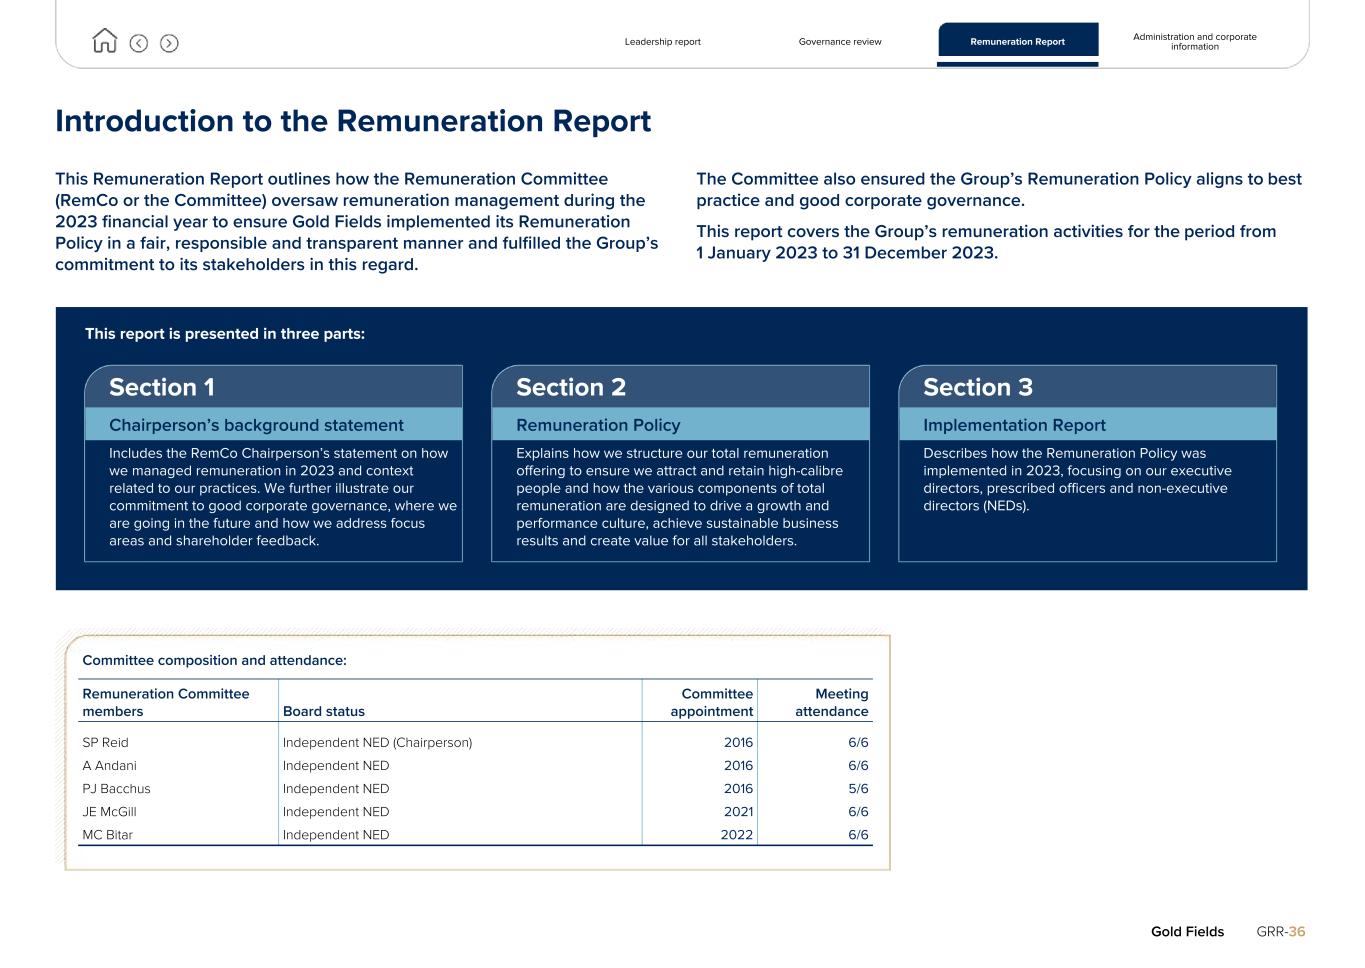
Introduction to the Remuneration Report This Remuneration Report outlines how the Remuneration Committee (RemCo or the Committee) oversaw remuneration management during the 2023 financial year to ensure Gold Fields implemented its Remuneration Policy in a fair, responsible and transparent manner and fulfilled the Group’s commitment to its stakeholders in this regard. The Committee also ensured the Group’s Remuneration Policy aligns to best practice and good corporate governance. This report covers the Group’s remuneration activities for the period from 1 January 2023 to 31 December 2023. This report is presented in three parts: Section 1 Section 2 Section 3 Chairperson’s background statement Remuneration Policy Implementation Report Includes the RemCo Chairperson’s statement on how we managed remuneration in 2023 and context related to our practices. We further illustrate our commitment to good corporate governance, where we are going in the future and how we address focus areas and shareholder feedback. Explains how we structure our total remuneration offering to ensure we attract and retain high-calibre people and how the various components of total remuneration are designed to drive a growth and performance culture, achieve sustainable business results and create value for all stakeholders. Describes how the Remuneration Policy was implemented in 2023, focusing on our executive directors, prescribed officers and non-executive directors (NEDs). Committee composition and attendance: Remuneration Committee members Board status Committee appointment Meeting attendance SP Reid Independent NED (Chairperson) 2016 6/6 A Andani Independent NED 2016 6/6 PJ Bacchus Independent NED 2016 5/6 JE McGill Independent NED 2021 6/6 MC Bitar Independent NED 2022 6/6 Leadership report Governance review Remuneration Report Administration and corporate information Gold Fields GRR-36
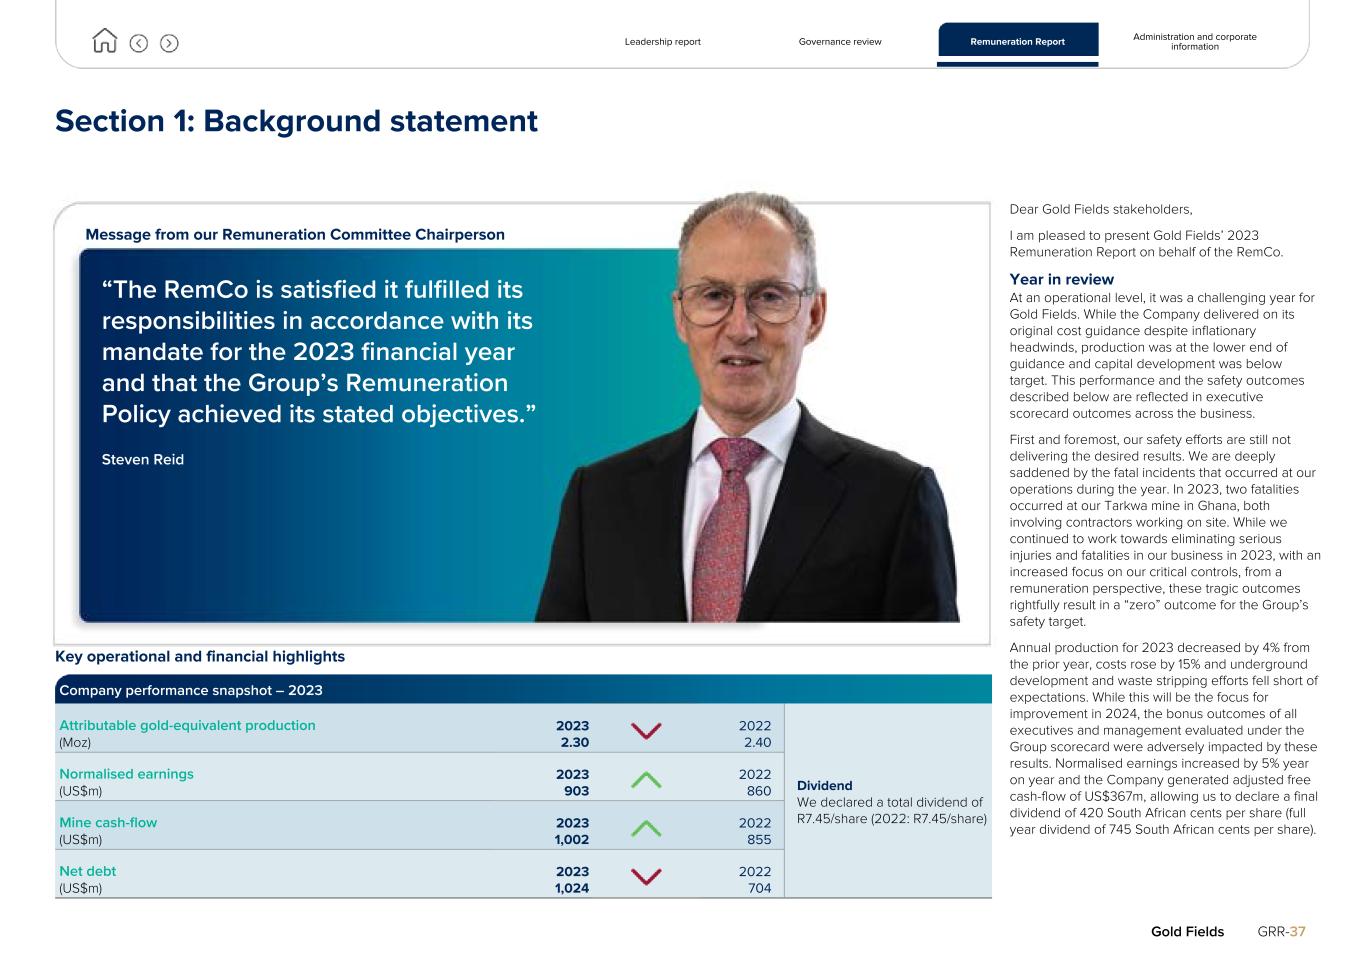
Section 1: Background statement Message from our Remuneration Committee Chairperson Key operational and financial highlights Leadership report Governance review Remuneration Report Administration and corporate information Gold Fields GRR-37 “The RemCo is satisfied it fulfilled its responsibilities in accordance with its mandate for the 2023 financial year and that the Group’s Remuneration Policy achieved its stated objectives.” Steven Reid Company performance snapshot – 2023 Attributable gold-equivalent production (Moz) 2023 2.30 2022 2.40 Dividend We declared a total dividend of R7.45/share (2022: R7.45/share) Normalised earnings (US$m) 2023 903 2022 860 Mine cash-flow (US$m) 2023 1,002 2022 855 Net debt (US$m) 2023 1,024 2022 704 Dear Gold Fields stakeholders, I am pleased to present Gold Fields’ 2023 Remuneration Report on behalf of the RemCo. Year in review At an operational level, it was a challenging year for Gold Fields. While the Company delivered on its original cost guidance despite inflationary headwinds, production was at the lower end of guidance and capital development was below target. This performance and the safety outcomes described below are reflected in executive scorecard outcomes across the business. First and foremost, our safety efforts are still not delivering the desired results. We are deeply saddened by the fatal incidents that occurred at our operations during the year. In 2023, two fatalities occurred at our Tarkwa mine in Ghana, both involving contractors working on site. While we continued to work towards eliminating serious injuries and fatalities in our business in 2023, with an increased focus on our critical controls, from a remuneration perspective, these tragic outcomes rightfully result in a “zero” outcome for the Group’s safety target. Annual production for 2023 decreased by 4% from the prior year, costs rose by 15% and underground development and waste stripping efforts fell short of expectations. While this will be the focus for improvement in 2024, the bonus outcomes of all executives and management evaluated under the Group scorecard were adversely impacted by these results. Normalised earnings increased by 5% year on year and the Company generated adjusted free cash-flow of US$367m, allowing us to declare a final dividend of 420 South African cents per share (full year dividend of 745 South African cents per share).
Section 1: Background statement continued In non-operational matters, Gold Fields continued to build momentum in implementing its strategy by positively advancing a number of strategic initiatives in 2023. The Group announced two corporate actions in line with our strategic imperative of pursuing value-accretive deals to grow the value and quality of our portfolio: the proposed Tarkwa/Iduapriem JV in Ghana on 16 March 2023 and the completed Windfall JV with Osisko Mining in Canada on 2 May 2023. Additionally, throughout 2023, the Group made noticeable progress in our environmental, social and governance (ESG) initiatives, two of which have been established as performance criteria in our long- term incentives (LTIs): • Female employee representation increased from 23% in 2022 to 25% in 2023, with over 50% of these women occupying core mining roles, exceeding our target and maintaining consistent progression towards our 2030 target of 30% female representation across Gold Fields • Gold Fields made significant strides in its decarbonisation journey: Scope 1 and 2 CO₂ emissions in 2023 decreased by 5% on 2022 levels, a significant reduction enabled by our investments in renewable electricity projects over the past four years. Furthermore: • Renewable energy accounted for 17% (2022: 13%) of electricity consumption at Group level in 2023 • In November 2023, Gold Fields announced its 2030 target of reducing Scope 3 emissions by a net 10% from a 2022 base The RemCo oversaw the completion of the following during the year: • A new Executive Remuneration Clawback Policy to align to the New York Stock Exchange (NYSE) compensation clawback listing rules • Clarification of certain administrative aspects of the Minimum Shareholding Requirements (MSR) Policy • Approval of an Attraction and Retention Framework to be applied across the Group • Review of a peer group executive remuneration benchmarking exercise • Review of gender pay equity investigations • Remuneration of the new CEO and new Executive Committee members • Approval of a new form of executive employment contract to be applied internationally – including standardised change-of-control provisions • Review of the initial 2024 balanced scorecards (BSCs) for the Group, regions and individual executives • Inclusion of robust cultural components in the Group and individual scorecards in accordance with the Group’s commitment to promoting a positive and respectful workplace culture, in response to the findings of the Elizabeth Broderick and Co (EB&Co) workplace review • Reappointment of Khokhela Remuneration Advisors as the Committee’s independent advisors The RemCo is looking forward to 2024 under the leadership of the Group’s new CEO, Mike Fraser, with the following key priorities for the business to achieve during the year: • Ensuring the physical and psychological safety of our people • Safely delivering on our production and cost targets • Delivering the ramp-up in production at Salares Norte • Continuing meaningful progress towards meeting our 2030 ESG targets • Monitoring the implementation of Gold Fields’ operating model to ensure greater focus on each function’s key responsibility, streamline processes, improve role clarity and adapt to evolving business needs • Continuing to improve the value and quality of our portfolio Governance and advisors The Committee holds closed sessions, where all invitees are excused, before and after the open session components of its meetings. This allows for the NEDs to discuss the agenda in advance and consider the outcomes and/or finalise items for which invitees should not be present. The Committee is satisfied it fulfilled its responsibilities in accordance with its mandate for the 2023 financial year and that the Group’s Remuneration Policy achieved its stated objectives. It has worked in conjunction with management and external advisors to continue improving the Group’s remuneration practices. The Committee believes its efforts not only meet its own objectives but ensure the alignment of interests across Gold Fields’ diverse set of stakeholders. Overall, we are satisfied that Group executives’ performance-linked pay aligns with the approved framework for linking variable pay with performance. Khokhela Remuneration Advisors were the RemCo’s independent external remuneration advisors during 2023 and, as per our standard practice, were present at all regular committee meetings. Leadership report Governance review Remuneration Report Administration and corporate information Gold Fields GRR-38
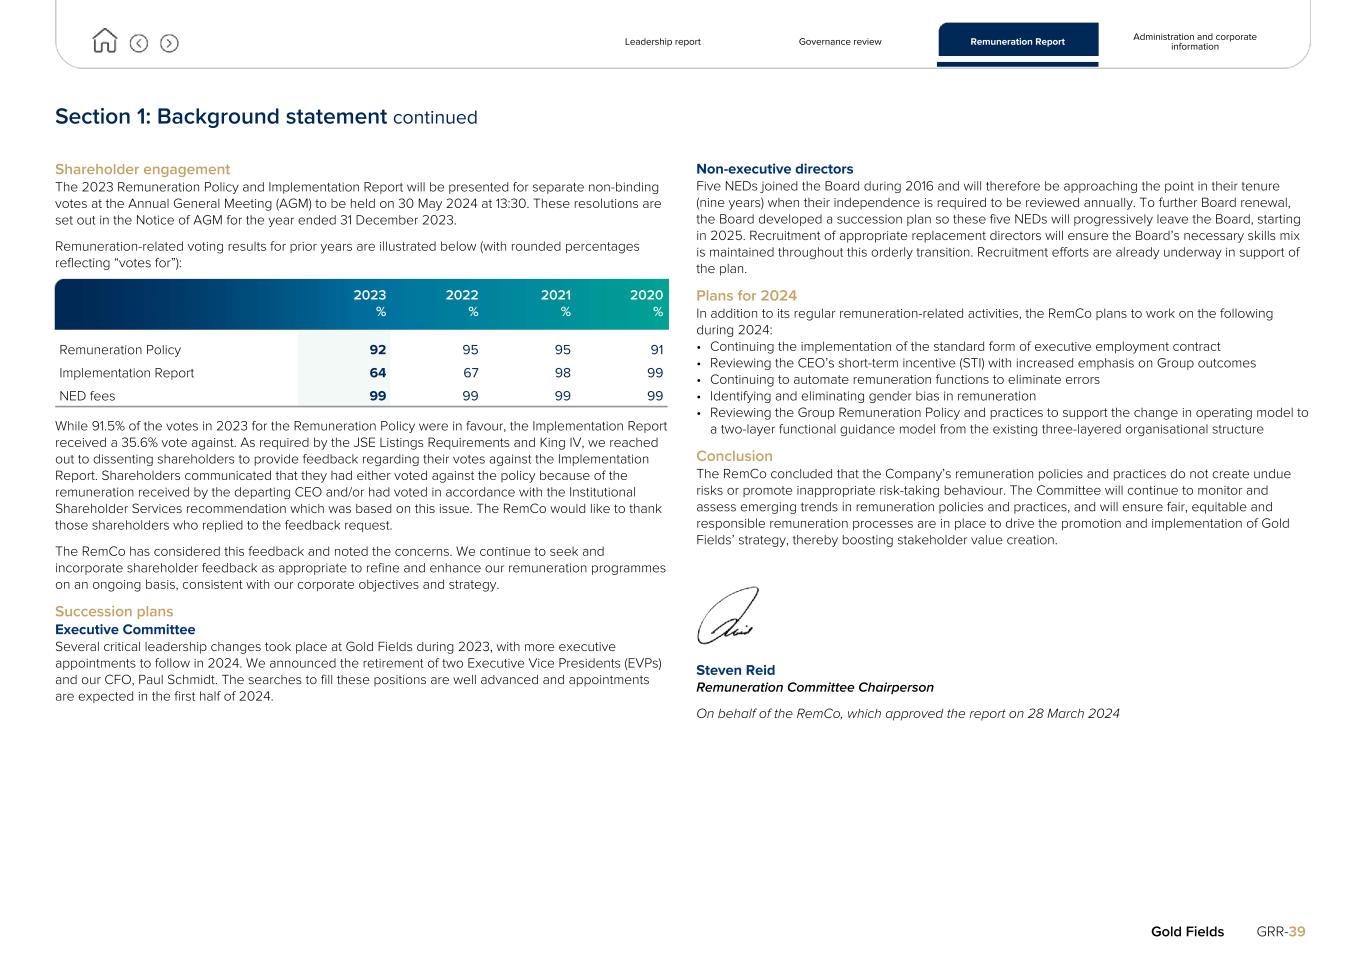
Section 1: Background statement continued Shareholder engagement The 2023 Remuneration Policy and Implementation Report will be presented for separate non-binding votes at the Annual General Meeting (AGM) to be held on 30 May 2024 at 13:30. These resolutions are set out in the Notice of AGM for the year ended 31 December 2023. Remuneration-related voting results for prior years are illustrated below (with rounded percentages reflecting “votes for”): 2023 % 2022 % 2021 % 2020 % Remuneration Policy 92 95 95 91 Implementation Report 64 67 98 99 NED fees 99 99 99 99 While 91.5% of the votes in 2023 for the Remuneration Policy were in favour, the Implementation Report received a 35.6% vote against. As required by the JSE Listings Requirements and King IV, we reached out to dissenting shareholders to provide feedback regarding their votes against the Implementation Report. Shareholders communicated that they had either voted against the policy because of the remuneration received by the departing CEO and/or had voted in accordance with the Institutional Shareholder Services recommendation which was based on this issue. The RemCo would like to thank those shareholders who replied to the feedback request. The RemCo has considered this feedback and noted the concerns. We continue to seek and incorporate shareholder feedback as appropriate to refine and enhance our remuneration programmes on an ongoing basis, consistent with our corporate objectives and strategy. Succession plans Executive Committee Several critical leadership changes took place at Gold Fields during 2023, with more executive appointments to follow in 2024. We announced the retirement of two Executive Vice Presidents (EVPs) and our CFO, Paul Schmidt. The searches to fill these positions are well advanced and appointments are expected in the first half of 2024. Non-executive directors Five NEDs joined the Board during 2016 and will therefore be approaching the point in their tenure (nine years) when their independence is required to be reviewed annually. To further Board renewal, the Board developed a succession plan so these five NEDs will progressively leave the Board, starting in 2025. Recruitment of appropriate replacement directors will ensure the Board’s necessary skills mix is maintained throughout this orderly transition. Recruitment efforts are already underway in support of the plan. Plans for 2024 In addition to its regular remuneration-related activities, the RemCo plans to work on the following during 2024: • Continuing the implementation of the standard form of executive employment contract • Reviewing the CEO’s short-term incentive (STI) with increased emphasis on Group outcomes • Continuing to automate remuneration functions to eliminate errors • Identifying and eliminating gender bias in remuneration • Reviewing the Group Remuneration Policy and practices to support the change in operating model to a two-layer functional guidance model from the existing three-layered organisational structure Conclusion The RemCo concluded that the Company’s remuneration policies and practices do not create undue risks or promote inappropriate risk-taking behaviour. The Committee will continue to monitor and assess emerging trends in remuneration policies and practices, and will ensure fair, equitable and responsible remuneration processes are in place to drive the promotion and implementation of Gold Fields’ strategy, thereby boosting stakeholder value creation. Steven Reid Remuneration Committee Chairperson On behalf of the RemCo, which approved the report on 28 March 2024 Leadership report Governance review Remuneration Report Administration and corporate information Gold Fields GRR-39
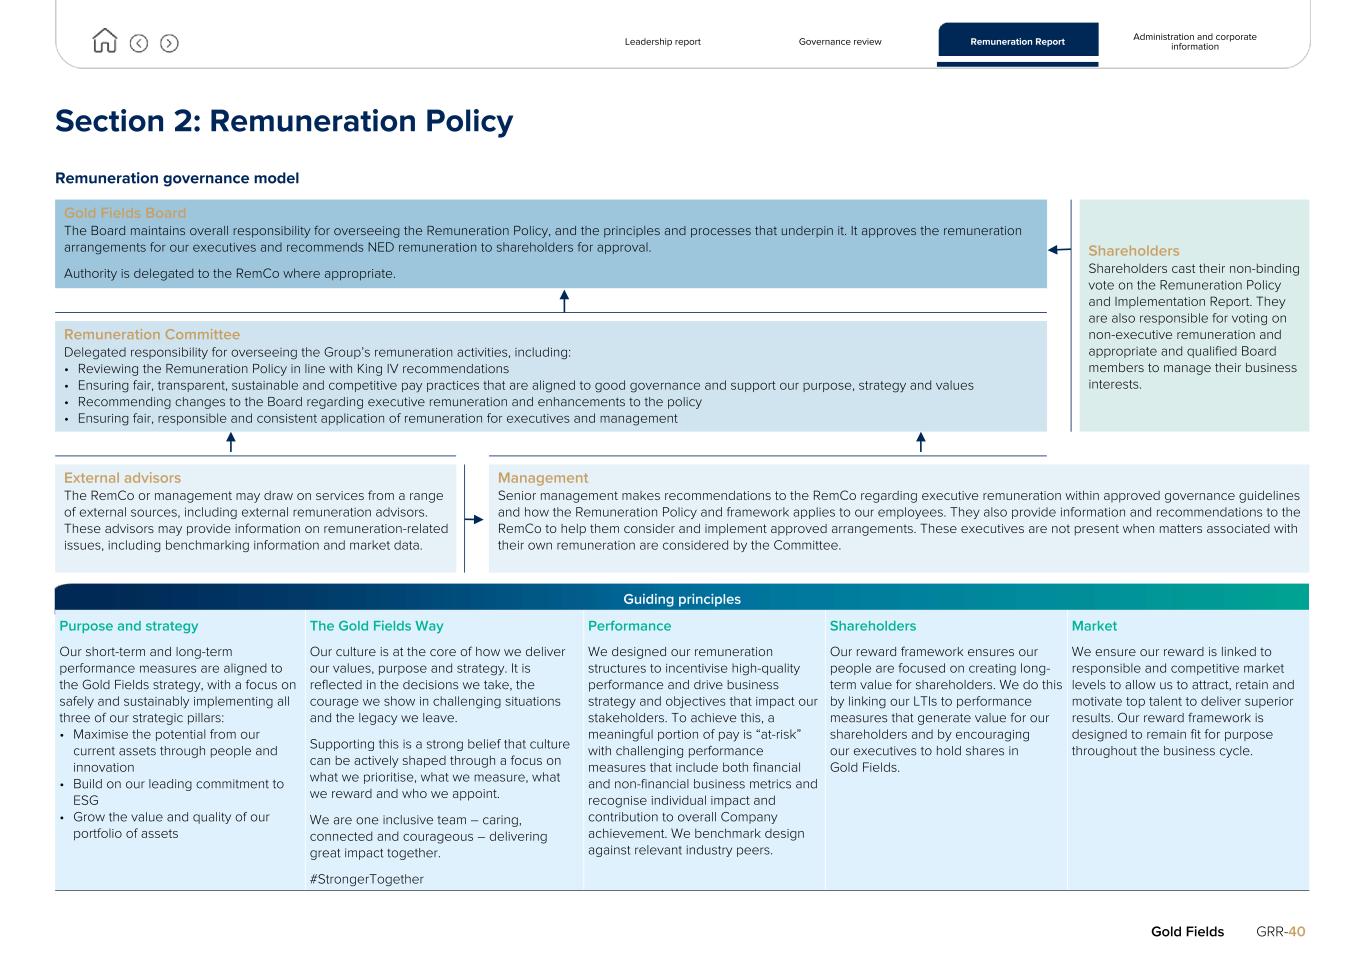
Section 2: Remuneration Policy Remuneration governance model Gold Fields Board The Board maintains overall responsibility for overseeing the Remuneration Policy, and the principles and processes that underpin it. It approves the remuneration arrangements for our executives and recommends NED remuneration to shareholders for approval. Authority is delegated to the RemCo where appropriate. Shareholders Shareholders cast their non-binding vote on the Remuneration Policy and Implementation Report. They are also responsible for voting on non-executive remuneration and appropriate and qualified Board members to manage their business interests. Remuneration Committee Delegated responsibility for overseeing the Group’s remuneration activities, including: • Reviewing the Remuneration Policy in line with King IV recommendations • Ensuring fair, transparent, sustainable and competitive pay practices that are aligned to good governance and support our purpose, strategy and values • Recommending changes to the Board regarding executive remuneration and enhancements to the policy • Ensuring fair, responsible and consistent application of remuneration for executives and management External advisors The RemCo or management may draw on services from a range of external sources, including external remuneration advisors. These advisors may provide information on remuneration-related issues, including benchmarking information and market data. Management Senior management makes recommendations to the RemCo regarding executive remuneration within approved governance guidelines and how the Remuneration Policy and framework applies to our employees. They also provide information and recommendations to the RemCo to help them consider and implement approved arrangements. These executives are not present when matters associated with their own remuneration are considered by the Committee. Guiding principles Purpose and strategy The Gold Fields Way Performance Shareholders Market Our short-term and long-term performance measures are aligned to the Gold Fields strategy, with a focus on safely and sustainably implementing all three of our strategic pillars: • Maximise the potential from our current assets through people and innovation • Build on our leading commitment to ESG • Grow the value and quality of our portfolio of assets Our culture is at the core of how we deliver our values, purpose and strategy. It is reflected in the decisions we take, the courage we show in challenging situations and the legacy we leave. Supporting this is a strong belief that culture can be actively shaped through a focus on what we prioritise, what we measure, what we reward and who we appoint. We are one inclusive team – caring, connected and courageous – delivering great impact together. #StrongerTogether We designed our remuneration structures to incentivise high-quality performance and drive business strategy and objectives that impact our stakeholders. To achieve this, a meaningful portion of pay is “at-risk” with challenging performance measures that include both financial and non-financial business metrics and recognise individual impact and contribution to overall Company achievement. We benchmark design against relevant industry peers. Our reward framework ensures our people are focused on creating long- term value for shareholders. We do this by linking our LTIs to performance measures that generate value for our shareholders and by encouraging our executives to hold shares in Gold Fields. We ensure our reward is linked to responsible and competitive market levels to allow us to attract, retain and motivate top talent to deliver superior results. Our reward framework is designed to remain fit for purpose throughout the business cycle. Leadership report Governance review Remuneration Report Administration and corporate information Gold Fields GRR-40
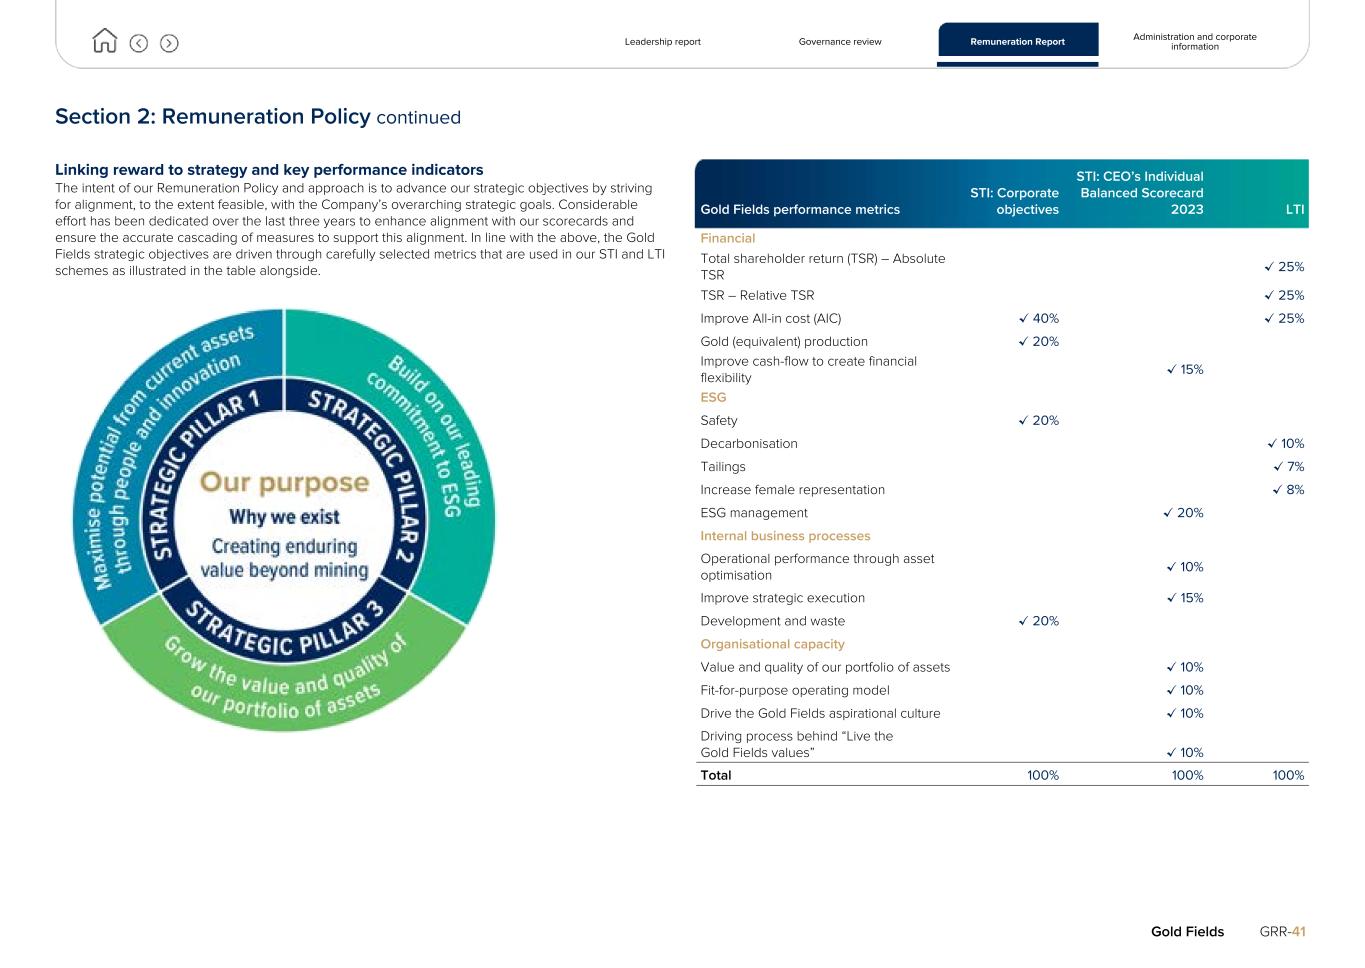
Section 2: Remuneration Policy continued Linking reward to strategy and key performance indicators The intent of our Remuneration Policy and approach is to advance our strategic objectives by striving for alignment, to the extent feasible, with the Company’s overarching strategic goals. Considerable effort has been dedicated over the last three years to enhance alignment with our scorecards and ensure the accurate cascading of measures to support this alignment. In line with the above, the Gold Fields strategic objectives are driven through carefully selected metrics that are used in our STI and LTI schemes as illustrated in the table alongside. Gold Fields performance metrics STI: Corporate objectives STI: CEO’s Individual Balanced Scorecard 2023 LTI Financial Total shareholder return (TSR) – Absolute TSR ✔ 25% TSR – Relative TSR ✔ 25% Improve All-in cost (AIC) ✔ 40% ✔ 25% Gold (equivalent) production ✔ 20% Improve cash-flow to create financial flexibility ✔ 15% ESG Safety ✔ 20% Decarbonisation ✔ 10% Tailings ✔ 7% Increase female representation ✔ 8% ESG management ✔ 20% Internal business processes Operational performance through asset optimisation ✔ 10% Improve strategic execution ✔ 15% Development and waste ✔ 20% Organisational capacity Value and quality of our portfolio of assets ✔ 10% Fit-for-purpose operating model ✔ 10% Drive the Gold Fields aspirational culture ✔ 10% Driving process behind “Live the Gold Fields values” ✔ 10% Total 100% 100% 100% Leadership report Governance review Remuneration Report Administration and corporate information Gold Fields GRR-41
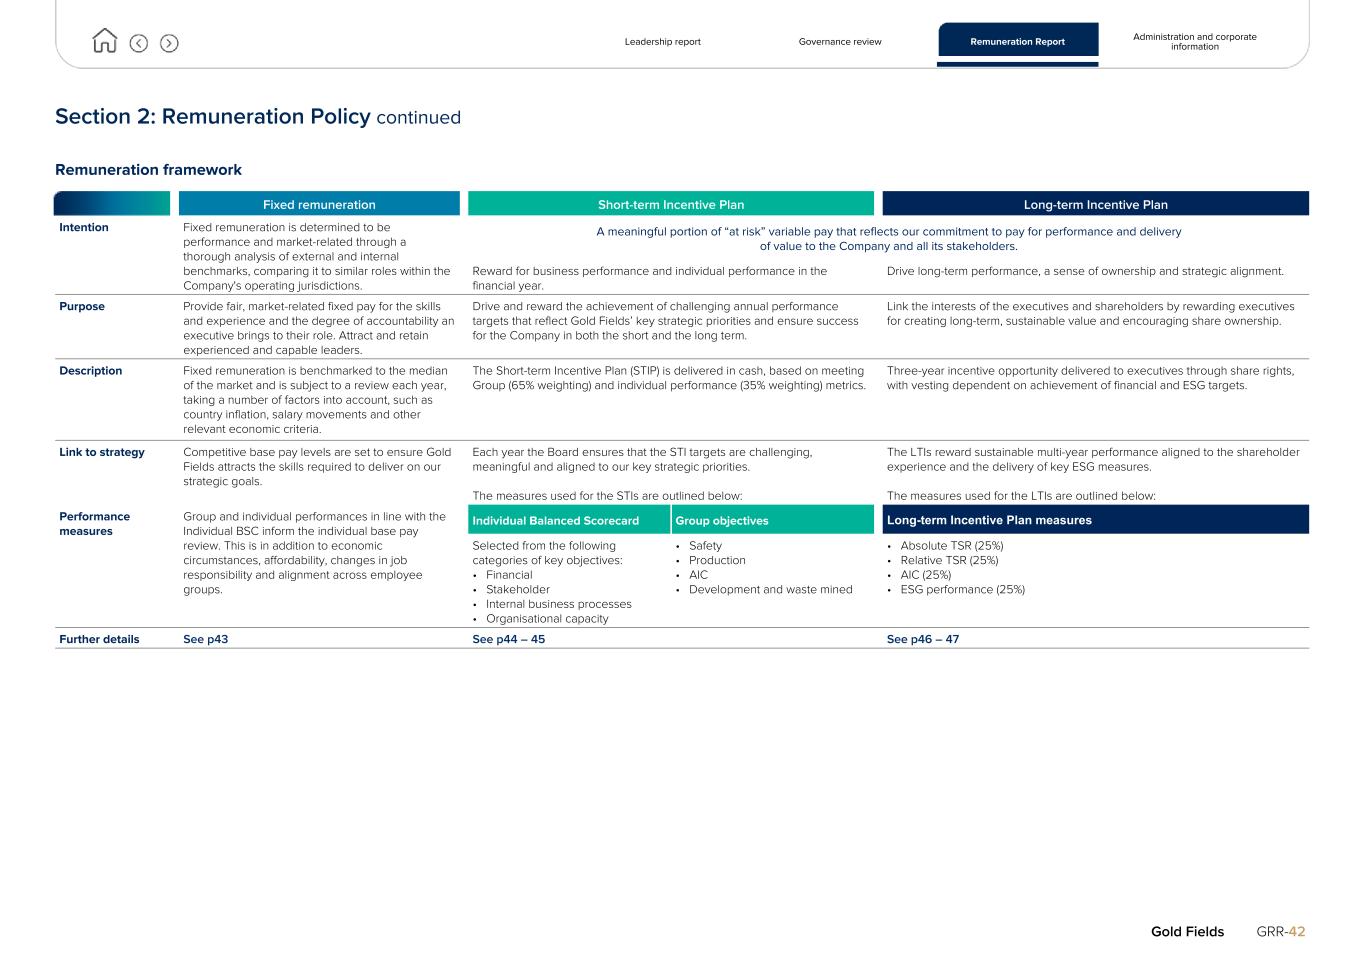
Section 2: Remuneration Policy continued Remuneration framework Fixed remuneration Short-term Incentive Plan Long-term Incentive Plan Intention Fixed remuneration is determined to be performance and market-related through a thorough analysis of external and internal benchmarks, comparing it to similar roles within the Company's operating jurisdictions. A meaningful portion of “at risk” variable pay that reflects our commitment to pay for performance and delivery of value to the Company and all its stakeholders. Reward for business performance and individual performance in the financial year. Drive long-term performance, a sense of ownership and strategic alignment. Purpose Provide fair, market-related fixed pay for the skills and experience and the degree of accountability an executive brings to their role. Attract and retain experienced and capable leaders. Drive and reward the achievement of challenging annual performance targets that reflect Gold Fields’ key strategic priorities and ensure success for the Company in both the short and the long term. Link the interests of the executives and shareholders by rewarding executives for creating long-term, sustainable value and encouraging share ownership. Description Fixed remuneration is benchmarked to the median of the market and is subject to a review each year, taking a number of factors into account, such as country inflation, salary movements and other relevant economic criteria. The Short-term Incentive Plan (STIP) is delivered in cash, based on meeting Group (65% weighting) and individual performance (35% weighting) metrics. Three-year incentive opportunity delivered to executives through share rights, with vesting dependent on achievement of financial and ESG targets. Link to strategy Competitive base pay levels are set to ensure Gold Fields attracts the skills required to deliver on our strategic goals. Each year the Board ensures that the STI targets are challenging, meaningful and aligned to our key strategic priorities. The measures used for the STIs are outlined below: The LTIs reward sustainable multi-year performance aligned to the shareholder experience and the delivery of key ESG measures. The measures used for the LTIs are outlined below: Performance measures Group and individual performances in line with the Individual BSC inform the individual base pay review. This is in addition to economic circumstances, affordability, changes in job responsibility and alignment across employee groups. Individual Balanced Scorecard Group objectives Long-term Incentive Plan measures Selected from the following categories of key objectives: • Financial • Stakeholder • Internal business processes • Organisational capacity • Safety • Production • AIC • Development and waste mined • Absolute TSR (25%) • Relative TSR (25%) • AIC (25%) • ESG performance (25%) Further details See p43 See p44 – 45 See p46 – 47 Leadership report Governance review Remuneration Report Administration and corporate information Gold Fields GRR-42
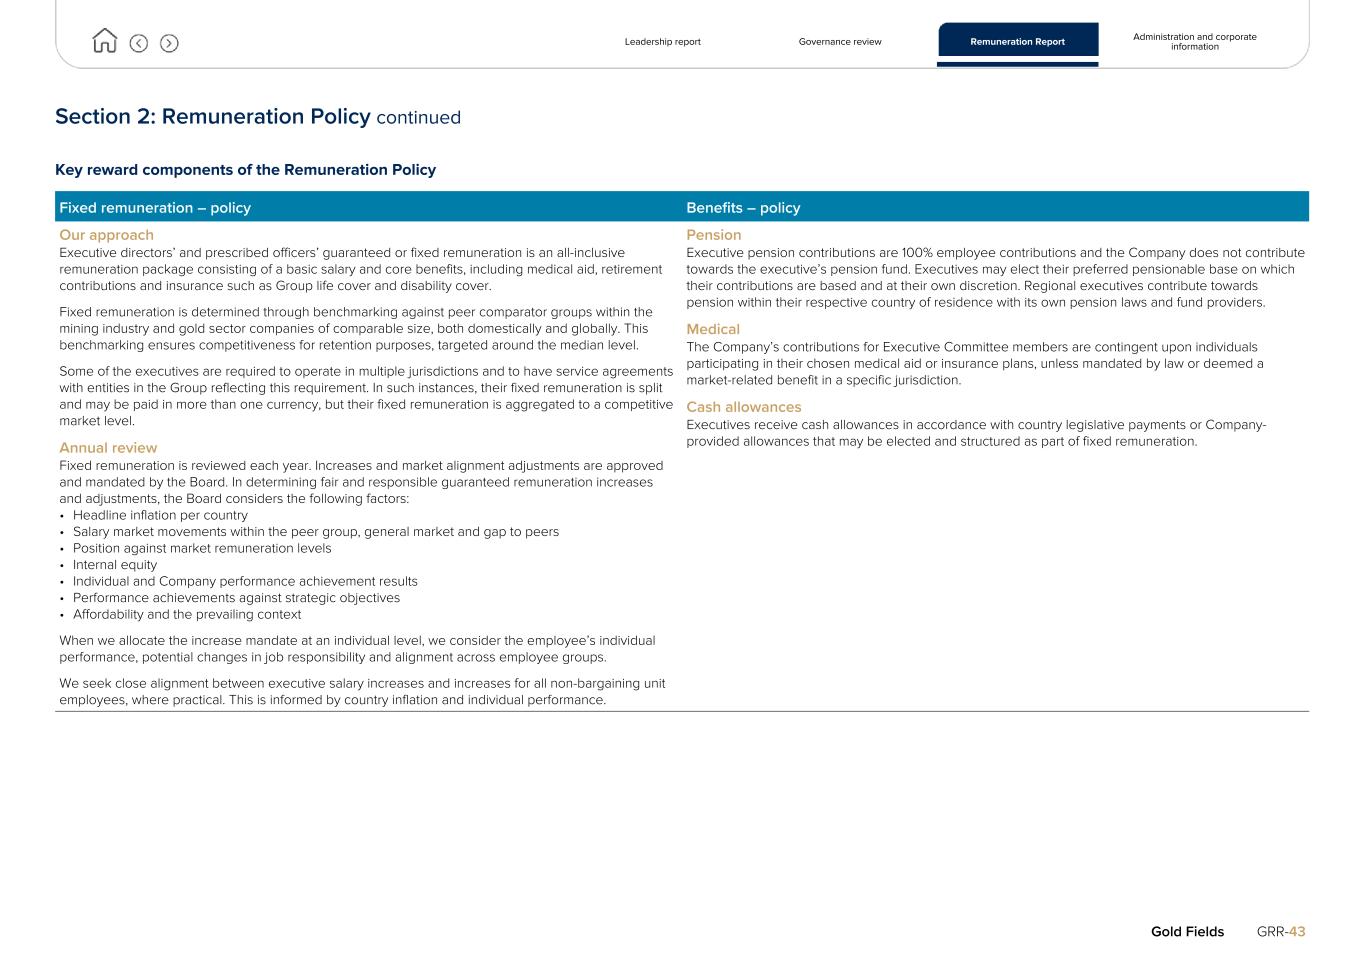
Section 2: Remuneration Policy continued Key reward components of the Remuneration Policy Fixed remuneration – policy Benefits – policy Our approach Executive directors’ and prescribed officers’ guaranteed or fixed remuneration is an all-inclusive remuneration package consisting of a basic salary and core benefits, including medical aid, retirement contributions and insurance such as Group life cover and disability cover. Fixed remuneration is determined through benchmarking against peer comparator groups within the mining industry and gold sector companies of comparable size, both domestically and globally. This benchmarking ensures competitiveness for retention purposes, targeted around the median level. Some of the executives are required to operate in multiple jurisdictions and to have service agreements with entities in the Group reflecting this requirement. In such instances, their fixed remuneration is split and may be paid in more than one currency, but their fixed remuneration is aggregated to a competitive market level. Annual review Fixed remuneration is reviewed each year. Increases and market alignment adjustments are approved and mandated by the Board. In determining fair and responsible guaranteed remuneration increases and adjustments, the Board considers the following factors: • Headline inflation per country • Salary market movements within the peer group, general market and gap to peers • Position against market remuneration levels • Internal equity • Individual and Company performance achievement results • Performance achievements against strategic objectives • Affordability and the prevailing context When we allocate the increase mandate at an individual level, we consider the employee’s individual performance, potential changes in job responsibility and alignment across employee groups. We seek close alignment between executive salary increases and increases for all non-bargaining unit employees, where practical. This is informed by country inflation and individual performance. Pension Executive pension contributions are 100% employee contributions and the Company does not contribute towards the executive’s pension fund. Executives may elect their preferred pensionable base on which their contributions are based and at their own discretion. Regional executives contribute towards pension within their respective country of residence with its own pension laws and fund providers. Medical The Company’s contributions for Executive Committee members are contingent upon individuals participating in their chosen medical aid or insurance plans, unless mandated by law or deemed a market-related benefit in a specific jurisdiction. Cash allowances Executives receive cash allowances in accordance with country legislative payments or Company- provided allowances that may be elected and structured as part of fixed remuneration. Leadership report Governance review Remuneration Report Administration and corporate information Gold Fields GRR-43
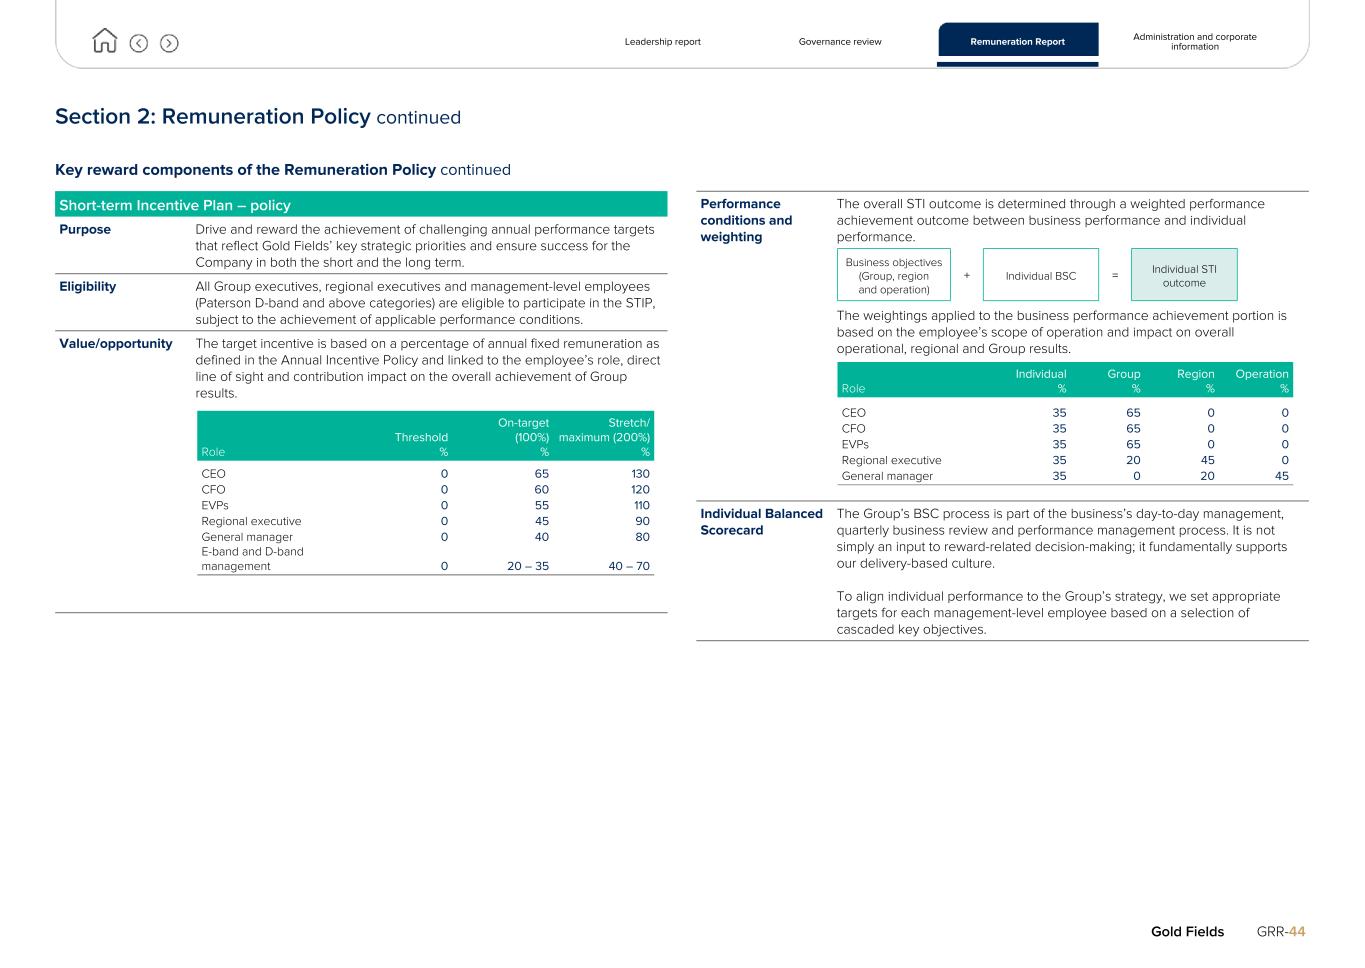
Section 2: Remuneration Policy continued Key reward components of the Remuneration Policy continued Short-term Incentive Plan – policy Purpose Drive and reward the achievement of challenging annual performance targets that reflect Gold Fields’ key strategic priorities and ensure success for the Company in both the short and the long term. Eligibility All Group executives, regional executives and management-level employees (Paterson D-band and above categories) are eligible to participate in the STIP, subject to the achievement of applicable performance conditions. Value/opportunity The target incentive is based on a percentage of annual fixed remuneration as defined in the Annual Incentive Policy and linked to the employee’s role, direct line of sight and contribution impact on the overall achievement of Group results. Performance conditions and weighting The overall STI outcome is determined through a weighted performance achievement outcome between business performance and individual performance. The weightings applied to the business performance achievement portion is based on the employee’s scope of operation and impact on overall operational, regional and Group results. Individual Balanced Scorecard The Group’s BSC process is part of the business’s day-to-day management, quarterly business review and performance management process. It is not simply an input to reward-related decision-making; it fundamentally supports our delivery-based culture. To align individual performance to the Group’s strategy, we set appropriate targets for each management-level employee based on a selection of cascaded key objectives. Leadership report Governance review Remuneration Report Administration and corporate information Gold Fields GRR-44 Role Threshold % On-target (100%) % Stretch/ maximum (200%) % CEO 0 65 130 CFO 0 60 120 EVPs 0 55 110 Regional executive 0 45 90 General manager 0 40 80 E-band and D-band management 0 20 – 35 40 – 70 Business objectives (Group, region and operation) + Individual BSC = Individual STI outcome Role Individual % Group % Region % Operation % CEO 35 65 0 0 CFO 35 65 0 0 EVPs 35 65 0 0 Regional executive 35 20 45 0 General manager 35 0 20 45
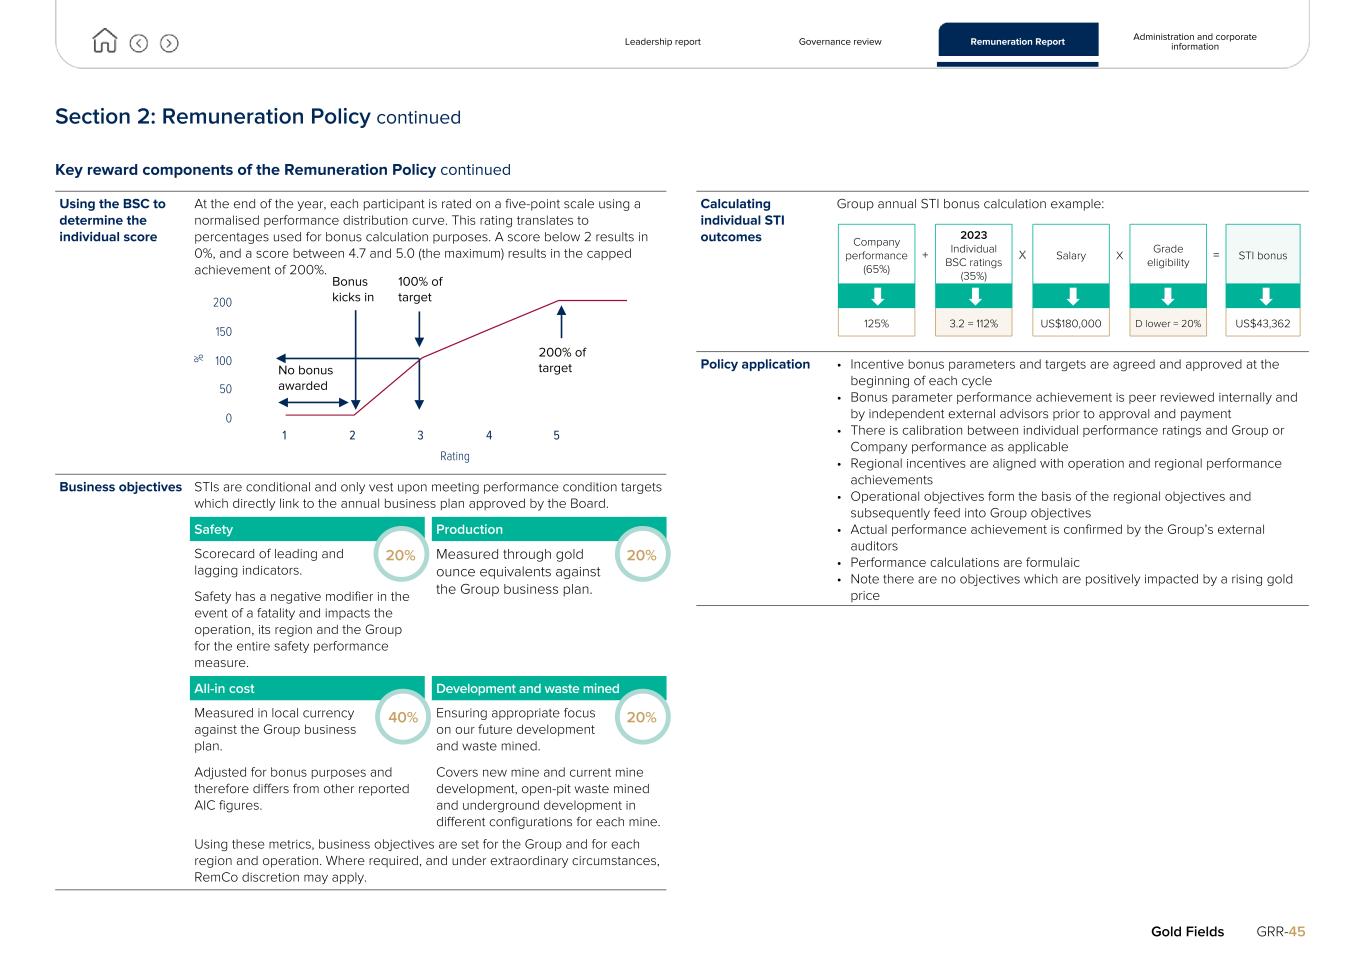
Section 2: Remuneration Policy continued Key reward components of the Remuneration Policy continued Using the BSC to determine the individual score At the end of the year, each participant is rated on a five-point scale using a normalised performance distribution curve. This rating translates to percentages used for bonus calculation purposes. A score below 2 results in 0%, and a score between 4.7 and 5.0 (the maximum) results in the capped achievement of 200%. Business objectives STIs are conditional and only vest upon meeting performance condition targets which directly link to the annual business plan approved by the Board. Safety Production Scorecard of leading and lagging indicators. Safety has a negative modifier in the event of a fatality and impacts the operation, its region and the Group for the entire safety performance measure. Measured through gold ounce equivalents against the Group business plan. All-in cost Development and waste mined Measured in local currency against the Group business plan. Adjusted for bonus purposes and therefore differs from other reported AIC figures. Ensuring appropriate focus on our future development and waste mined. Covers new mine and current mine development, open-pit waste mined and underground development in different configurations for each mine. Using these metrics, business objectives are set for the Group and for each region and operation. Where required, and under extraordinary circumstances, RemCo discretion may apply. Calculating individual STI outcomes Group annual STI bonus calculation example: Policy application • Incentive bonus parameters and targets are agreed and approved at the beginning of each cycle • Bonus parameter performance achievement is peer reviewed internally and by independent external advisors prior to approval and payment • There is calibration between individual performance ratings and Group or Company performance as applicable • Regional incentives are aligned with operation and regional performance achievements • Operational objectives form the basis of the regional objectives and subsequently feed into Group objectives • Actual performance achievement is confirmed by the Group’s external auditors • Performance calculations are formulaic • Note there are no objectives which are positively impacted by a rising gold price Leadership report Governance review Remuneration Report Administration and corporate information Gold Fields GRR-45 20% 20% 20%40% Company performance (65%) + 2023 Individual BSC ratings (35%) X Salary X Grade eligibility = STI bonus 125% 3.2 = 112% US$180,000 D lower = 20% US$43,362 Rating % 1 2 3 4 5 0 50 100 150 200 No bonus awarded Bonus kicks in 100% of target 200% of target
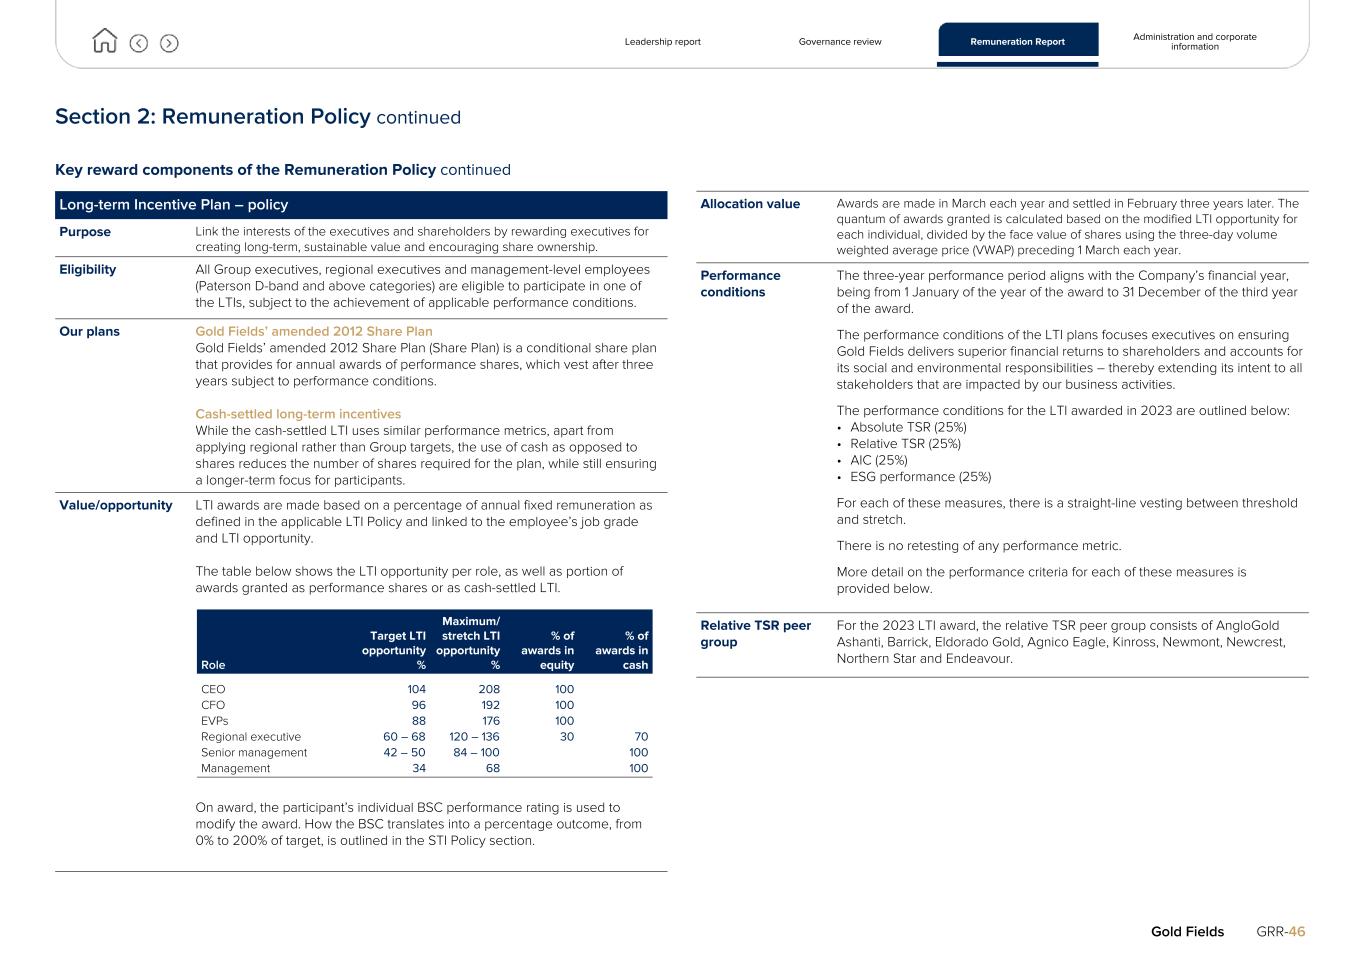
Section 2: Remuneration Policy continued Key reward components of the Remuneration Policy continued Long-term Incentive Plan – policy Purpose Link the interests of the executives and shareholders by rewarding executives for creating long-term, sustainable value and encouraging share ownership. Eligibility All Group executives, regional executives and management-level employees (Paterson D-band and above categories) are eligible to participate in one of the LTIs, subject to the achievement of applicable performance conditions. Our plans Gold Fields’ amended 2012 Share Plan Gold Fields’ amended 2012 Share Plan (Share Plan) is a conditional share plan that provides for annual awards of performance shares, which vest after three years subject to performance conditions. Cash-settled long-term incentives While the cash-settled LTI uses similar performance metrics, apart from applying regional rather than Group targets, the use of cash as opposed to shares reduces the number of shares required for the plan, while still ensuring a longer-term focus for participants. Value/opportunity LTI awards are made based on a percentage of annual fixed remuneration as defined in the applicable LTI Policy and linked to the employee’s job grade and LTI opportunity. The table below shows the LTI opportunity per role, as well as portion of awards granted as performance shares or as cash-settled LTI. On award, the participant’s individual BSC performance rating is used to modify the award. How the BSC translates into a percentage outcome, from 0% to 200% of target, is outlined in the STI Policy section. Allocation value Awards are made in March each year and settled in February three years later. The quantum of awards granted is calculated based on the modified LTI opportunity for each individual, divided by the face value of shares using the three-day volume weighted average price (VWAP) preceding 1 March each year. Performance conditions The three-year performance period aligns with the Company’s financial year, being from 1 January of the year of the award to 31 December of the third year of the award. The performance conditions of the LTI plans focuses executives on ensuring Gold Fields delivers superior financial returns to shareholders and accounts for its social and environmental responsibilities – thereby extending its intent to all stakeholders that are impacted by our business activities. The performance conditions for the LTI awarded in 2023 are outlined below: • Absolute TSR (25%) • Relative TSR (25%) • AIC (25%) • ESG performance (25%) For each of these measures, there is a straight-line vesting between threshold and stretch. There is no retesting of any performance metric. More detail on the performance criteria for each of these measures is provided below. Relative TSR peer group For the 2023 LTI award, the relative TSR peer group consists of AngloGold Ashanti, Barrick, Eldorado Gold, Agnico Eagle, Kinross, Newmont, Newcrest, Northern Star and Endeavour. Leadership report Governance review Remuneration Report Administration and corporate information Gold Fields GRR-46 Role Target LTI opportunity % Maximum/ stretch LTI opportunity % % of awards in equity % of awards in cash CEO 104 208 100 CFO 96 192 100 EVPs 88 176 100 Regional executive 60 – 68 120 – 136 30 70 Senior management 42 – 50 84 – 100 100 Management 34 68 100
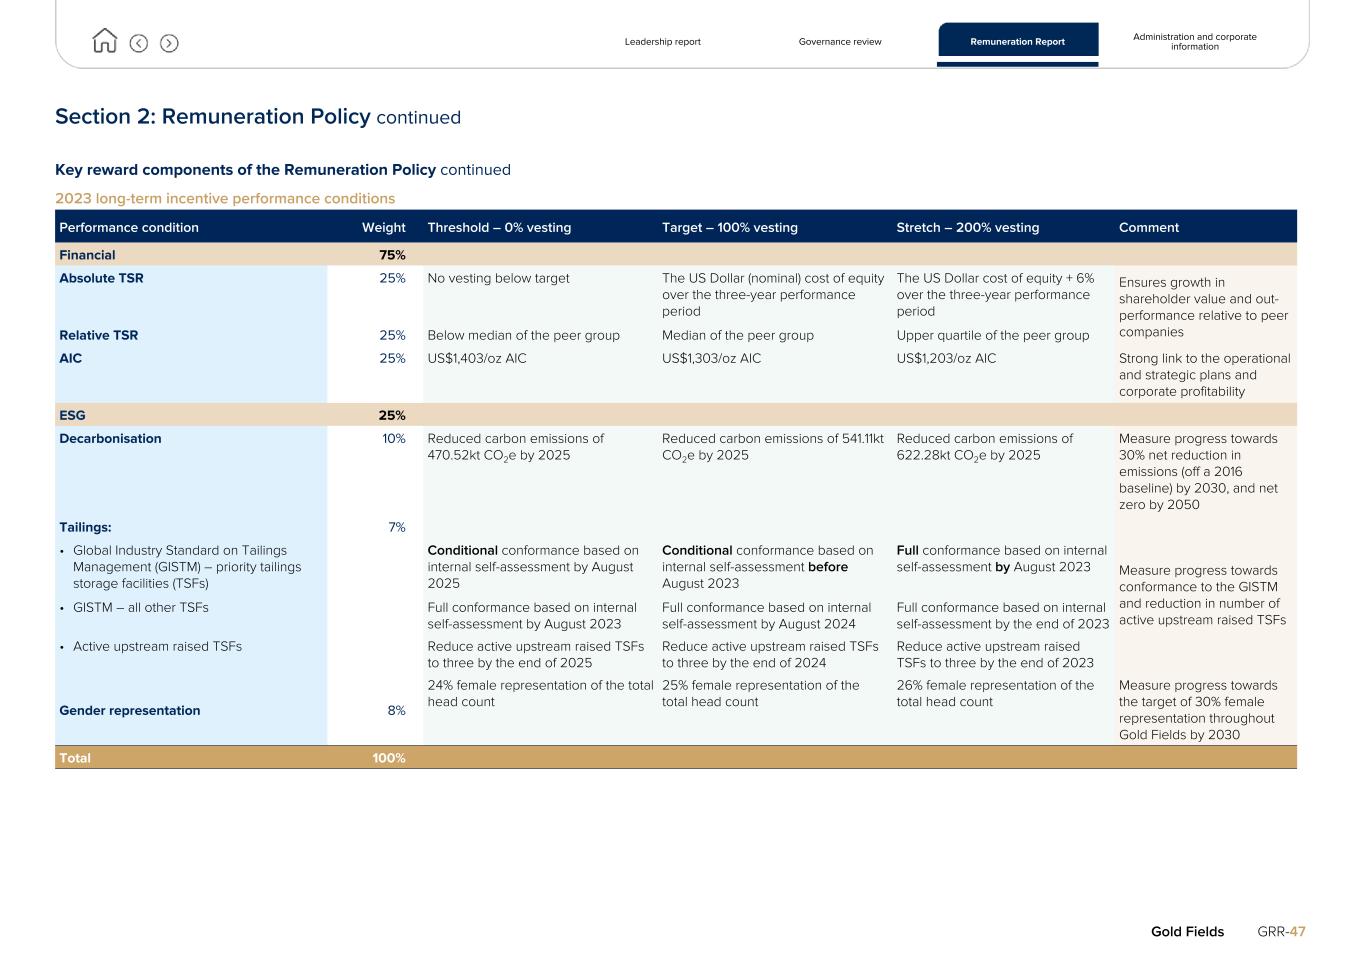
Section 2: Remuneration Policy continued Key reward components of the Remuneration Policy continued 2023 long-term incentive performance conditions Performance condition Weight Threshold – 0% vesting Target – 100% vesting Stretch – 200% vesting Comment Financial 75% Absolute TSR 25% No vesting below target The US Dollar (nominal) cost of equity over the three-year performance period The US Dollar cost of equity + 6% over the three-year performance period Ensures growth in shareholder value and out- performance relative to peer companiesRelative TSR 25% Below median of the peer group Median of the peer group Upper quartile of the peer group AIC 25% US$1,403/oz AIC US$1,303/oz AIC US$1,203/oz AIC Strong link to the operational and strategic plans and corporate profitability ESG 25% Decarbonisation 10% Reduced carbon emissions of 470.52kt CO2e by 2025 Reduced carbon emissions of 541.11kt CO2e by 2025 Reduced carbon emissions of 622.28kt CO2e by 2025 Measure progress towards 30% net reduction in emissions (off a 2016 baseline) by 2030, and net zero by 2050 Tailings: 7% Measure progress towards conformance to the GISTM and reduction in number of active upstream raised TSFs • Global Industry Standard on Tailings Management (GISTM) – priority tailings storage facilities (TSFs) Conditional conformance based on internal self-assessment by August 2025 Conditional conformance based on internal self-assessment before August 2023 Full conformance based on internal self-assessment by August 2023 • GISTM – all other TSFs Full conformance based on internal self-assessment by August 2023 Full conformance based on internal self-assessment by August 2024 Full conformance based on internal self-assessment by the end of 2023 • Active upstream raised TSFs Reduce active upstream raised TSFs to three by the end of 2025 Reduce active upstream raised TSFs to three by the end of 2024 Reduce active upstream raised TSFs to three by the end of 2023 Gender representation 8% 24% female representation of the total head count 25% female representation of the total head count 26% female representation of the total head count Measure progress towards the target of 30% female representation throughout Gold Fields by 2030 Total 100% Leadership report Governance review Remuneration Report Administration and corporate information Gold Fields GRR-47
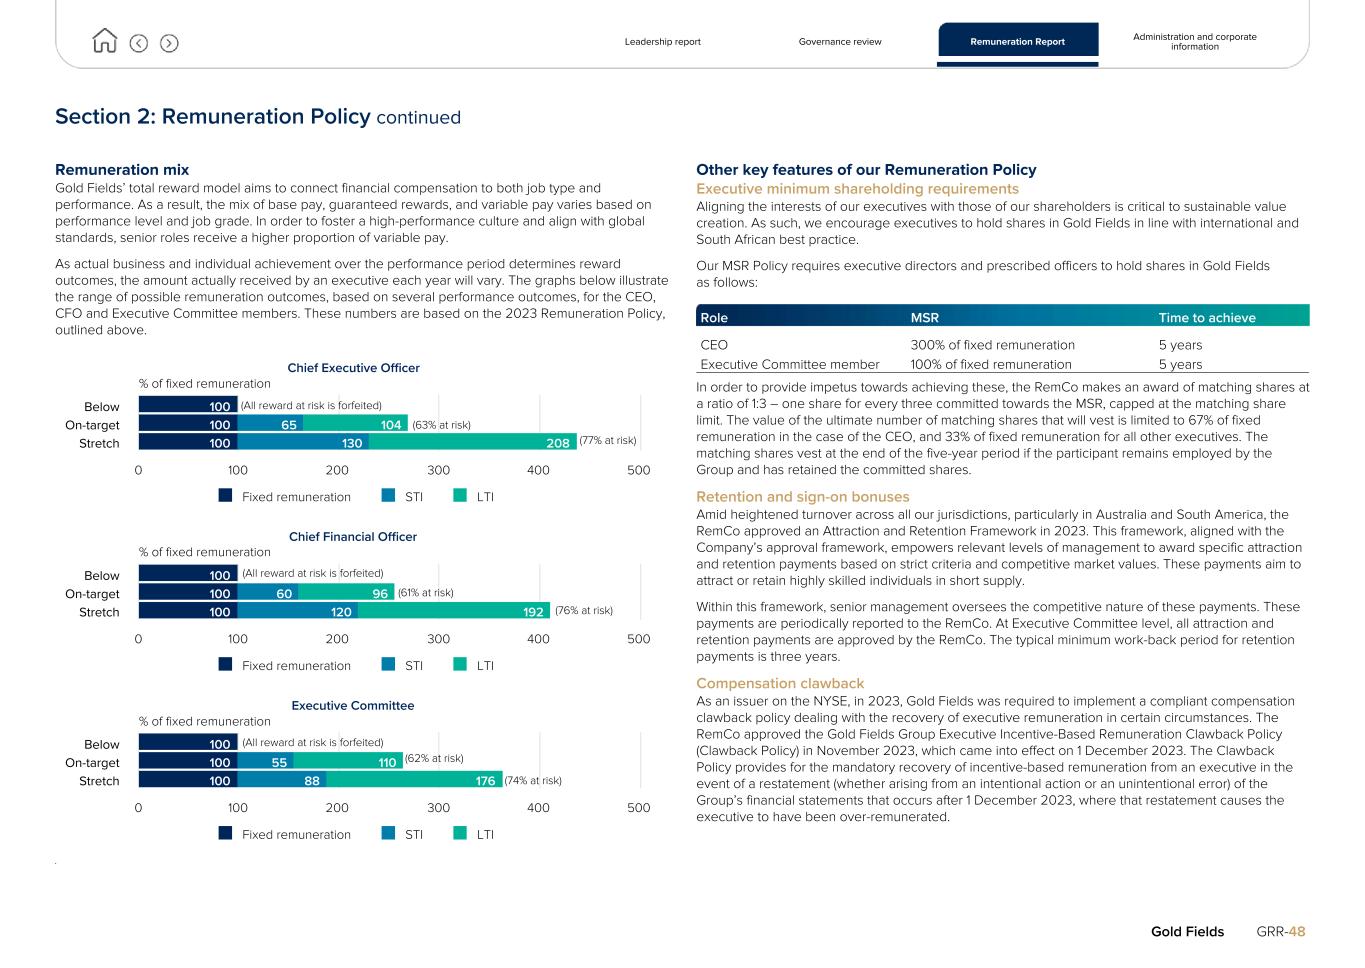
Section 2: Remuneration Policy continued Remuneration mix Gold Fields’ total reward model aims to connect financial compensation to both job type and performance. As a result, the mix of base pay, guaranteed rewards, and variable pay varies based on performance level and job grade. In order to foster a high-performance culture and align with global standards, senior roles receive a higher proportion of variable pay. As actual business and individual achievement over the performance period determines reward outcomes, the amount actually received by an executive each year will vary. The graphs below illustrate the range of possible remuneration outcomes, based on several performance outcomes, for the CEO, CFO and Executive Committee members. These numbers are based on the 2023 Remuneration Policy, outlined above. Chief Executive Officer 100 100 100 65 130 104 208 Fixed remuneration STI LTI Below On-target Stretch 0 100 200 300 400 500 Chief Financial Officer 100 100 100 60 120 96 192 Fixed remuneration STI LTI Below On-target Stretch 0 100 200 300 400 500 Executive Committee 100 100 100 55 88 110 176 Fixed remuneration STI LTI Below On-target Stretch 0 100 200 300 400 500 . Other key features of our Remuneration Policy Executive minimum shareholding requirements Aligning the interests of our executives with those of our shareholders is critical to sustainable value creation. As such, we encourage executives to hold shares in Gold Fields in line with international and South African best practice. Our MSR Policy requires executive directors and prescribed officers to hold shares in Gold Fields as follows: Role MSR Time to achieve CEO 300% of fixed remuneration 5 years Executive Committee member 100% of fixed remuneration 5 years In order to provide impetus towards achieving these, the RemCo makes an award of matching shares at a ratio of 1:3 – one share for every three committed towards the MSR, capped at the matching share limit. The value of the ultimate number of matching shares that will vest is limited to 67% of fixed remuneration in the case of the CEO, and 33% of fixed remuneration for all other executives. The matching shares vest at the end of the five-year period if the participant remains employed by the Group and has retained the committed shares. Retention and sign-on bonuses Amid heightened turnover across all our jurisdictions, particularly in Australia and South America, the RemCo approved an Attraction and Retention Framework in 2023. This framework, aligned with the Company’s approval framework, empowers relevant levels of management to award specific attraction and retention payments based on strict criteria and competitive market values. These payments aim to attract or retain highly skilled individuals in short supply. Within this framework, senior management oversees the competitive nature of these payments. These payments are periodically reported to the RemCo. At Executive Committee level, all attraction and retention payments are approved by the RemCo. The typical minimum work-back period for retention payments is three years. Compensation clawback As an issuer on the NYSE, in 2023, Gold Fields was required to implement a compliant compensation clawback policy dealing with the recovery of executive remuneration in certain circumstances. The RemCo approved the Gold Fields Group Executive Incentive-Based Remuneration Clawback Policy (Clawback Policy) in November 2023, which came into effect on 1 December 2023. The Clawback Policy provides for the mandatory recovery of incentive-based remuneration from an executive in the event of a restatement (whether arising from an intentional action or an unintentional error) of the Group’s financial statements that occurs after 1 December 2023, where that restatement causes the executive to have been over-remunerated. Leadership report Governance review Remuneration Report Administration and corporate information Gold Fields GRR-48 % of fixed remuneration % of fixed remuneration % of fixed remuneration (All reward at risk is forfeited) (63% at risk) (77% at risk) (61% at risk) (76% at risk) (74% at risk) (62% at risk) (All reward at risk is forfeited) (All reward at risk is forfeited)
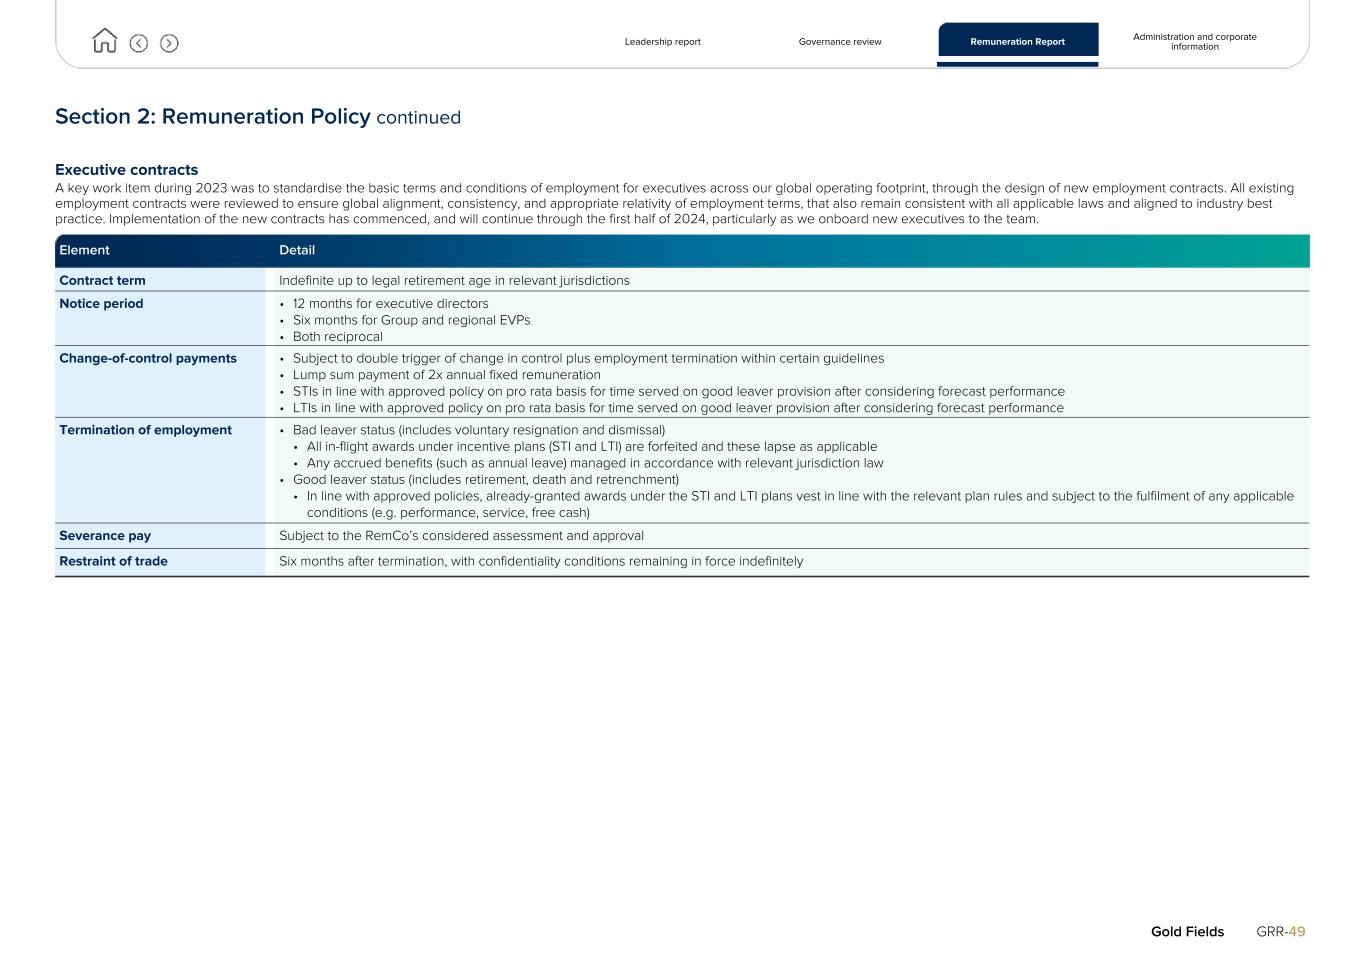
Section 2: Remuneration Policy continued Executive contracts A key work item during 2023 was to standardise the basic terms and conditions of employment for executives across our global operating footprint, through the design of new employment contracts. All existing employment contracts were reviewed to ensure global alignment, consistency, and appropriate relativity of employment terms, that also remain consistent with all applicable laws and aligned to industry best practice. Implementation of the new contracts has commenced, and will continue through the first half of 2024, particularly as we onboard new executives to the team. Element Detail Contract term Indefinite up to legal retirement age in relevant jurisdictions Notice period • 12 months for executive directors • Six months for Group and regional EVPs • Both reciprocal Change-of-control payments • Subject to double trigger of change in control plus employment termination within certain guidelines • Lump sum payment of 2x annual fixed remuneration • STIs in line with approved policy on pro rata basis for time served on good leaver provision after considering forecast performance • LTIs in line with approved policy on pro rata basis for time served on good leaver provision after considering forecast performance Termination of employment • Bad leaver status (includes voluntary resignation and dismissal) • All in-flight awards under incentive plans (STI and LTI) are forfeited and these lapse as applicable • Any accrued benefits (such as annual leave) managed in accordance with relevant jurisdiction law • Good leaver status (includes retirement, death and retrenchment) • In line with approved policies, already-granted awards under the STI and LTI plans vest in line with the relevant plan rules and subject to the fulfilment of any applicable conditions (e.g. performance, service, free cash) Severance pay Subject to the RemCo’s considered assessment and approval Restraint of trade Six months after termination, with confidentiality conditions remaining in force indefinitely Leadership report Governance review Remuneration Report Administration and corporate information Gold Fields GRR-49
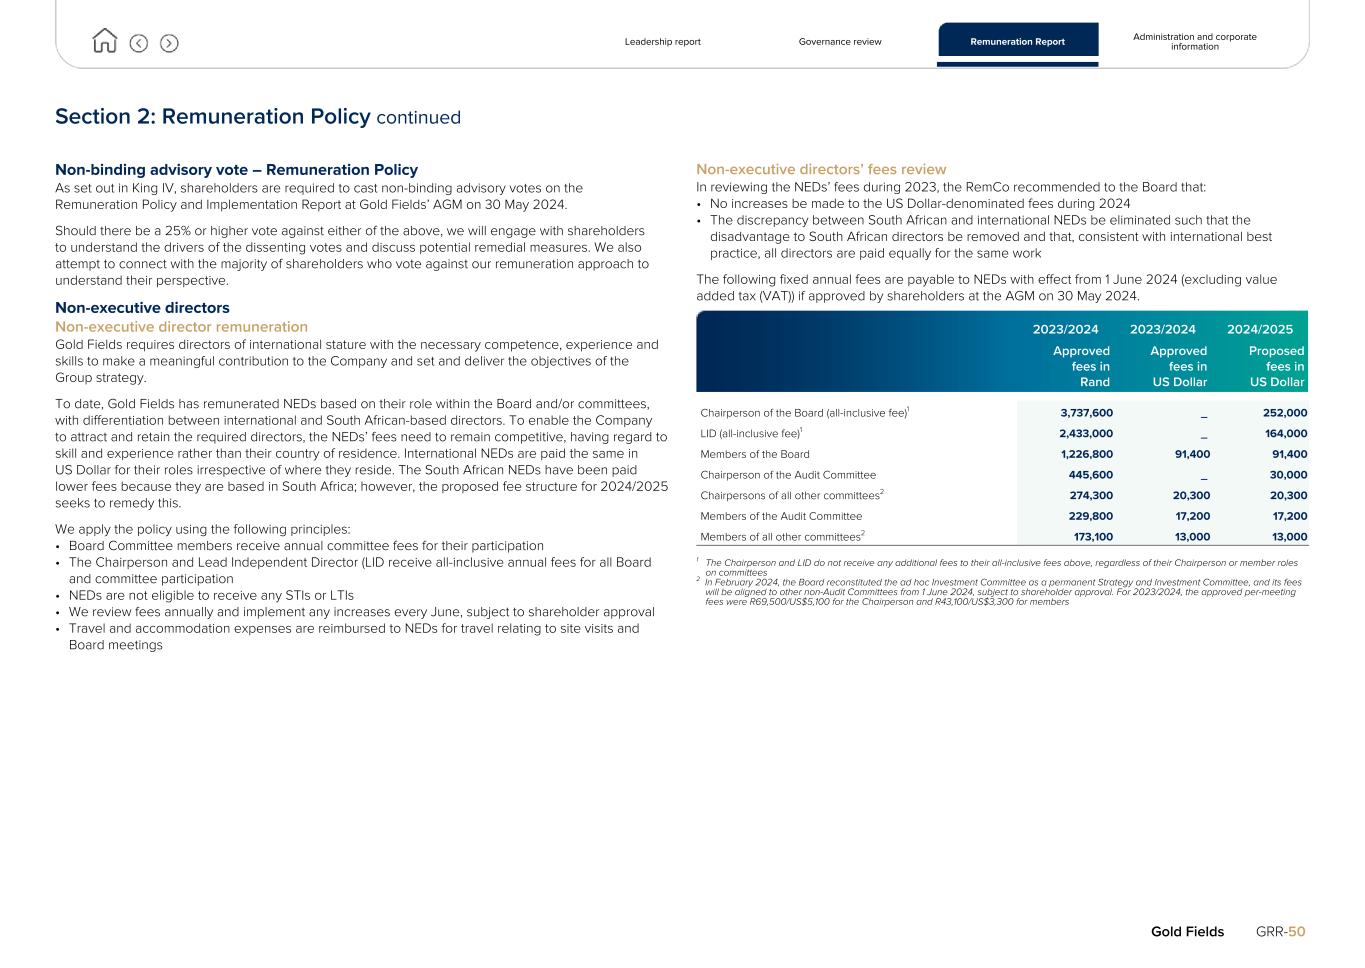
Section 2: Remuneration Policy continued Non-binding advisory vote – Remuneration Policy As set out in King IV, shareholders are required to cast non-binding advisory votes on the Remuneration Policy and Implementation Report at Gold Fields’ AGM on 30 May 2024. Should there be a 25% or higher vote against either of the above, we will engage with shareholders to understand the drivers of the dissenting votes and discuss potential remedial measures. We also attempt to connect with the majority of shareholders who vote against our remuneration approach to understand their perspective. Non-executive directors Non-executive director remuneration Gold Fields requires directors of international stature with the necessary competence, experience and skills to make a meaningful contribution to the Company and set and deliver the objectives of the Group strategy. To date, Gold Fields has remunerated NEDs based on their role within the Board and/or committees, with differentiation between international and South African-based directors. To enable the Company to attract and retain the required directors, the NEDs’ fees need to remain competitive, having regard to skill and experience rather than their country of residence. International NEDs are paid the same in US Dollar for their roles irrespective of where they reside. The South African NEDs have been paid lower fees because they are based in South Africa; however, the proposed fee structure for 2024/2025 seeks to remedy this. We apply the policy using the following principles: • Board Committee members receive annual committee fees for their participation • The Chairperson and Lead Independent Director (LID receive all-inclusive annual fees for all Board and committee participation • NEDs are not eligible to receive any STIs or LTIs • We review fees annually and implement any increases every June, subject to shareholder approval • Travel and accommodation expenses are reimbursed to NEDs for travel relating to site visits and Board meetings Non-executive directors’ fees review In reviewing the NEDs’ fees during 2023, the RemCo recommended to the Board that: • No increases be made to the US Dollar-denominated fees during 2024 • The discrepancy between South African and international NEDs be eliminated such that the disadvantage to South African directors be removed and that, consistent with international best practice, all directors are paid equally for the same work The following fixed annual fees are payable to NEDs with effect from 1 June 2024 (excluding value added tax (VAT)) if approved by shareholders at the AGM on 30 May 2024. 2023/2024 2023/2024 2024/2025 Approved fees in Rand Approved fees in US Dollar Proposed fees in US Dollar Chairperson of the Board (all-inclusive fee)1 3,737,600 _ 252,000 LID (all-inclusive fee)1 2,433,000 _ 164,000 Members of the Board 1,226,800 91,400 91,400 Chairperson of the Audit Committee 445,600 _ 30,000 Chairpersons of all other committees2 274,300 20,300 20,300 Members of the Audit Committee 229,800 17,200 17,200 Members of all other committees2 173,100 13,000 13,000 1 The Chairperson and LID do not receive any additional fees to their all-inclusive fees above, regardless of their Chairperson or member roles on committees 2 In February 2024, the Board reconstituted the ad hoc Investment Committee as a permanent Strategy and Investment Committee, and its fees will be aligned to other non-Audit Committees from 1 June 2024, subject to shareholder approval. For 2023/2024, the approved per-meeting fees were R69,500/US$5,100 for the Chairperson and R43,100/US$3,300 for members Leadership report Governance review Remuneration Report Administration and corporate information Gold Fields GRR-50
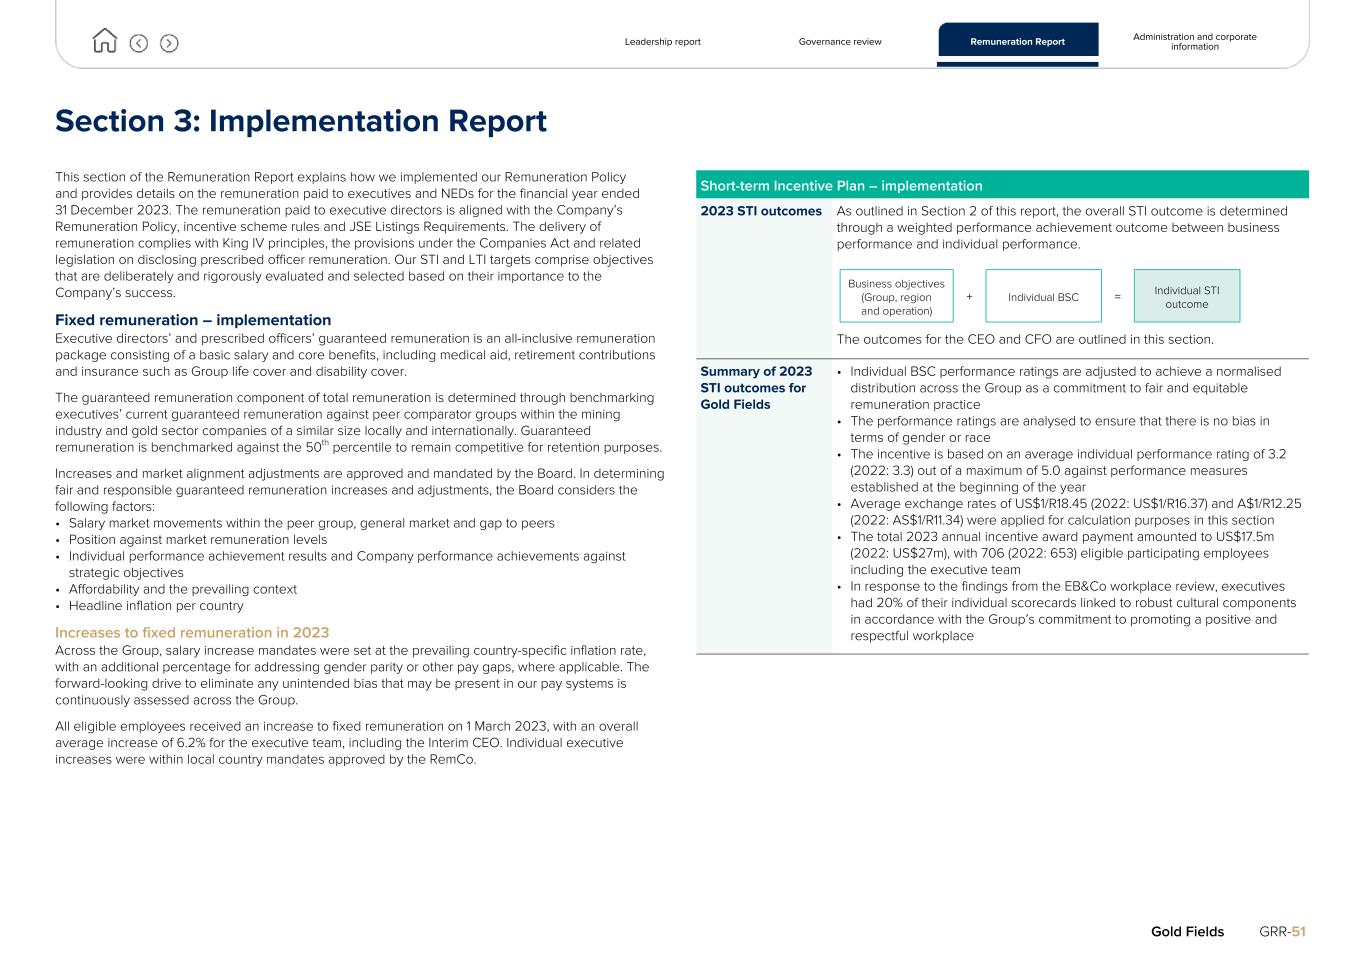
Section 3: Implementation Report This section of the Remuneration Report explains how we implemented our Remuneration Policy and provides details on the remuneration paid to executives and NEDs for the financial year ended 31 December 2023. The remuneration paid to executive directors is aligned with the Company’s Remuneration Policy, incentive scheme rules and JSE Listings Requirements. The delivery of remuneration complies with King IV principles, the provisions under the Companies Act and related legislation on disclosing prescribed officer remuneration. Our STI and LTI targets comprise objectives that are deliberately and rigorously evaluated and selected based on their importance to the Company’s success. Fixed remuneration – implementation Executive directors’ and prescribed officers’ guaranteed remuneration is an all-inclusive remuneration package consisting of a basic salary and core benefits, including medical aid, retirement contributions and insurance such as Group life cover and disability cover. The guaranteed remuneration component of total remuneration is determined through benchmarking executives’ current guaranteed remuneration against peer comparator groups within the mining industry and gold sector companies of a similar size locally and internationally. Guaranteed remuneration is benchmarked against the 50th percentile to remain competitive for retention purposes. Increases and market alignment adjustments are approved and mandated by the Board. In determining fair and responsible guaranteed remuneration increases and adjustments, the Board considers the following factors: • Salary market movements within the peer group, general market and gap to peers • Position against market remuneration levels • Individual performance achievement results and Company performance achievements against strategic objectives • Affordability and the prevailing context • Headline inflation per country Increases to fixed remuneration in 2023 Across the Group, salary increase mandates were set at the prevailing country-specific inflation rate, with an additional percentage for addressing gender parity or other pay gaps, where applicable. The forward-looking drive to eliminate any unintended bias that may be present in our pay systems is continuously assessed across the Group. All eligible employees received an increase to fixed remuneration on 1 March 2023, with an overall average increase of 6.2% for the executive team, including the Interim CEO. Individual executive increases were within local country mandates approved by the RemCo. Short-term Incentive Plan – implementation 2023 STI outcomes As outlined in Section 2 of this report, the overall STI outcome is determined through a weighted performance achievement outcome between business performance and individual performance. The outcomes for the CEO and CFO are outlined in this section. Summary of 2023 STI outcomes for Gold Fields • Individual BSC performance ratings are adjusted to achieve a normalised distribution across the Group as a commitment to fair and equitable remuneration practice • The performance ratings are analysed to ensure that there is no bias in terms of gender or race • The incentive is based on an average individual performance rating of 3.2 (2022: 3.3) out of a maximum of 5.0 against performance measures established at the beginning of the year • Average exchange rates of US$1/R18.45 (2022: US$1/R16.37) and A$1/R12.25 (2022: AS$1/R11.34) were applied for calculation purposes in this section • The total 2023 annual incentive award payment amounted to US$17.5m (2022: US$27m), with 706 (2022: 653) eligible participating employees including the executive team • In response to the findings from the EB&Co workplace review, executives had 20% of their individual scorecards linked to robust cultural components in accordance with the Group’s commitment to promoting a positive and respectful workplace Leadership report Governance review Remuneration Report Administration and corporate information Gold Fields GRR-51 Business objectives (Group, region and operation) + Individual BSC = Individual STI outcome
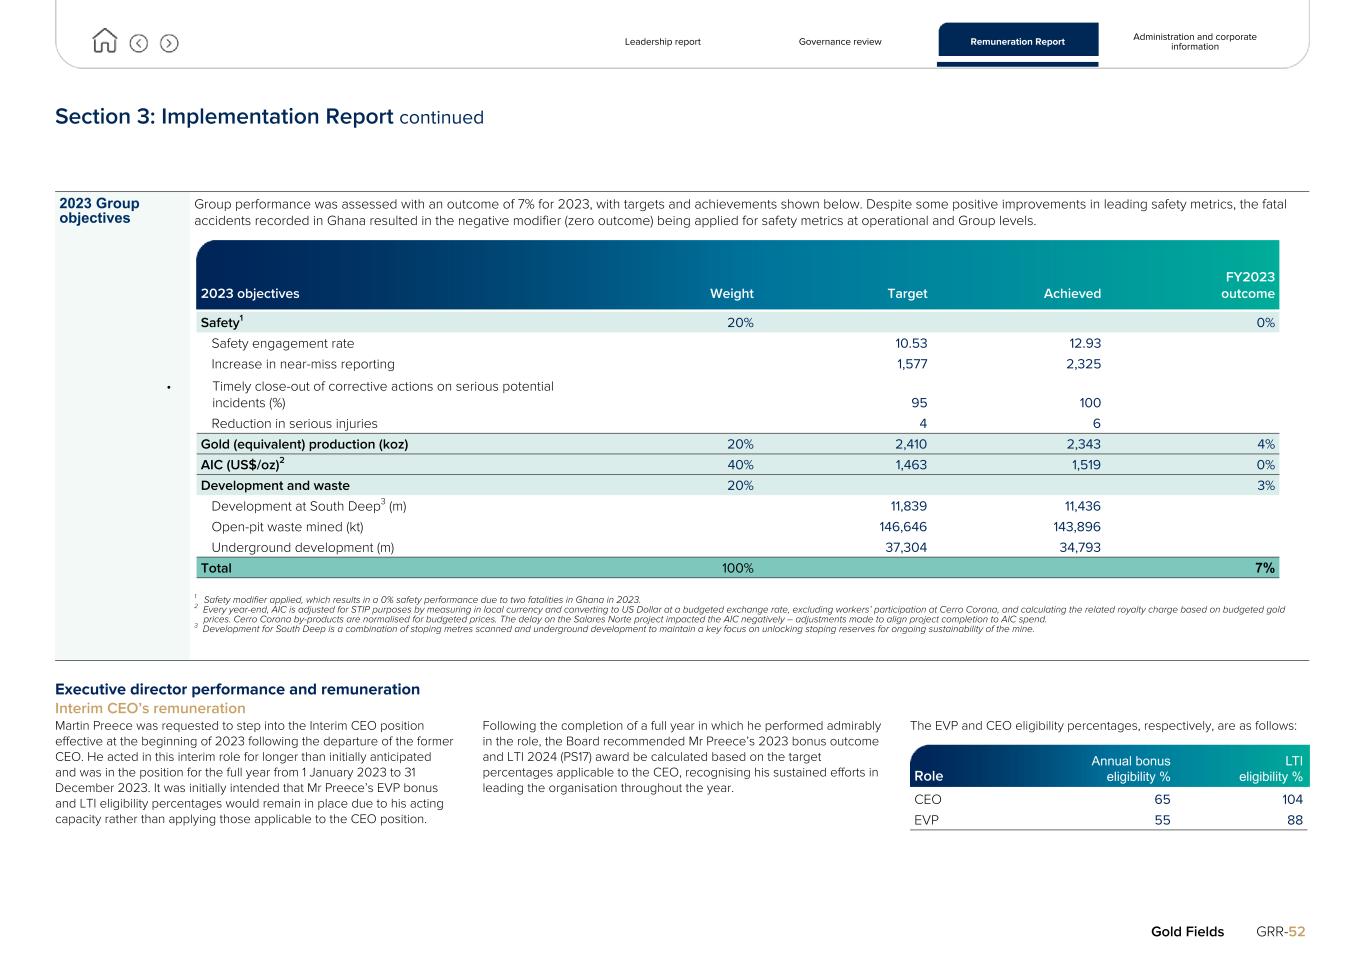
Section 3: Implementation Report continued 2023 Group objectives Group performance was assessed with an outcome of 7% for 2023, with targets and achievements shown below. Despite some positive improvements in leading safety metrics, the fatal accidents recorded in Ghana resulted in the negative modifier (zero outcome) being applied for safety metrics at operational and Group levels. 1 Safety modifier applied, which results in a 0% safety performance due to two fatalities in Ghana in 2023. 2 Every year-end, AIC is adjusted for STIP purposes by measuring in local currency and converting to US Dollar at a budgeted exchange rate, excluding workers’ participation at Cerro Corona, and calculating the related royalty charge based on budgeted gold prices. Cerro Corona by-products are normalised for budgeted prices. The delay on the Salares Norte project impacted the AIC negatively – adjustments made to align project completion to AIC spend. 3 Development for South Deep is a combination of stoping metres scanned and underground development to maintain a key focus on unlocking stoping reserves for ongoing sustainability of the mine. Executive director performance and remuneration Interim CEO’s remuneration Martin Preece was requested to step into the Interim CEO position effective at the beginning of 2023 following the departure of the former CEO. He acted in this interim role for longer than initially anticipated and was in the position for the full year from 1 January 2023 to 31 December 2023. It was initially intended that Mr Preece’s EVP bonus and LTI eligibility percentages would remain in place due to his acting capacity rather than applying those applicable to the CEO position. Following the completion of a full year in which he performed admirably in the role, the Board recommended Mr Preece’s 2023 bonus outcome and LTI 2024 (PS17) award be calculated based on the target percentages applicable to the CEO, recognising his sustained efforts in leading the organisation throughout the year. The EVP and CEO eligibility percentages, respectively, are as follows: Annual bonus eligibility % LTI eligibility %Role CEO 65 104 EVP 55 88 Leadership report Governance review Remuneration Report Administration and corporate information Gold Fields GRR-52 2023 objectives Weight Target Achieved FY2023 outcome Safety1 20% 0% Safety engagement rate 10.53 12.93 Increase in near-miss reporting 1,577 2,325 • Timely close-out of corrective actions on serious potential incidents (%) 95 100 Reduction in serious injuries 4 6 Gold (equivalent) production (koz) 20% 2,410 2,343 4% AIC (US$/oz)2 40% 1,463 1,519 0% Development and waste 20% 3% Development at South Deep3 (m) 11,839 11,436 Open-pit waste mined (kt) 146,646 143,896 Underground development (m) 37,304 34,793 Total 100% 7%
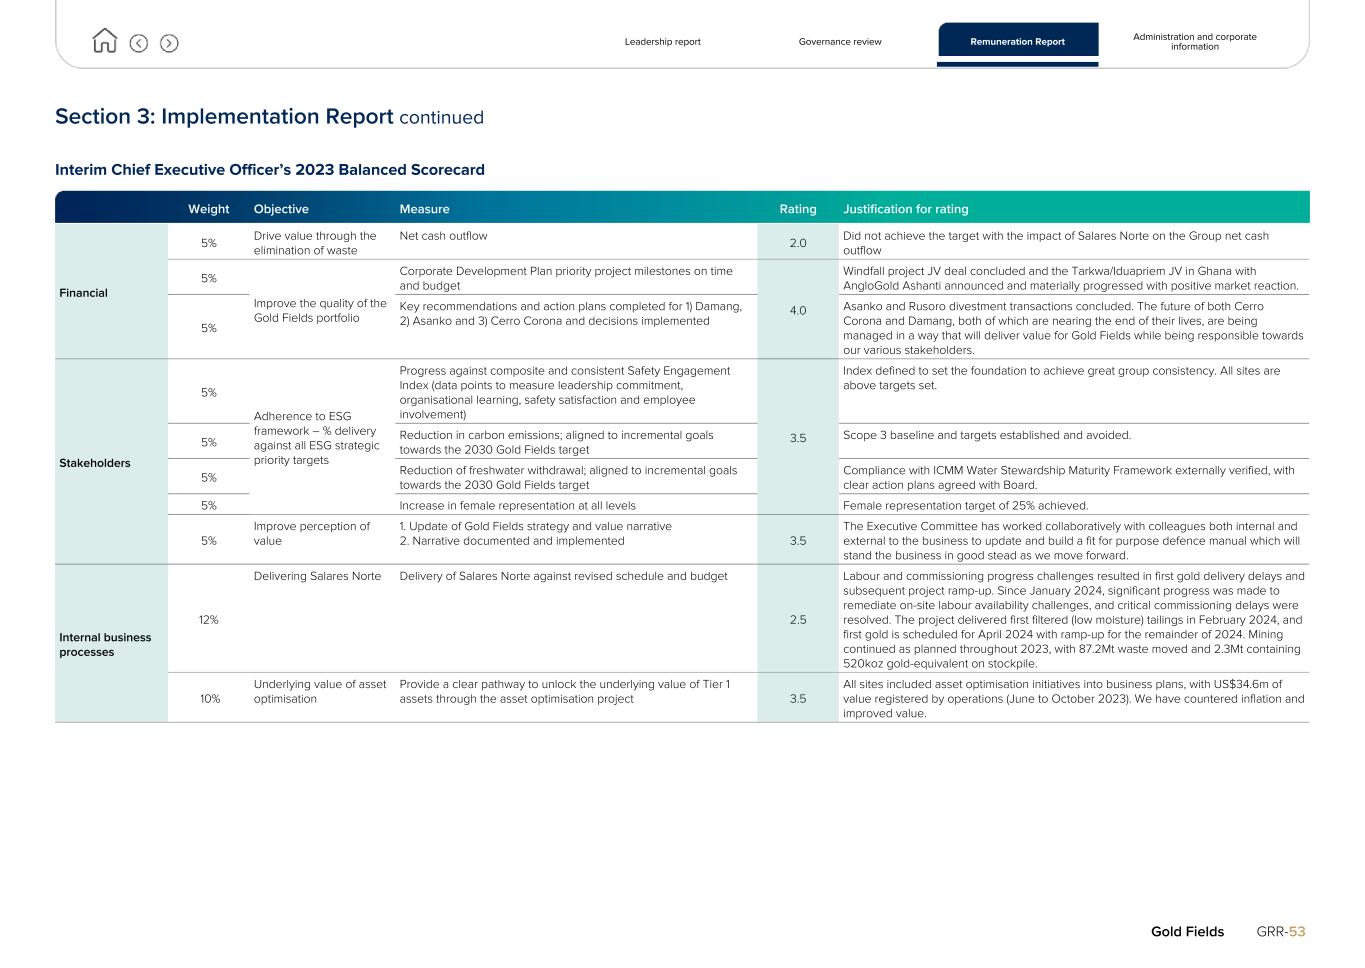
Section 3: Implementation Report continued Interim Chief Executive Officer’s 2023 Balanced Scorecard Weight Objective Measure Rating Justification for rating Financial 5% Drive value through the elimination of waste Net cash outflow 2.0 Did not achieve the target with the impact of Salares Norte on the Group net cash outflow 5% Improve the quality of the Gold Fields portfolio Corporate Development Plan priority project milestones on time and budget 4.0 Windfall project JV deal concluded and the Tarkwa/Iduapriem JV in Ghana with AngloGold Ashanti announced and materially progressed with positive market reaction. 5% Key recommendations and action plans completed for 1) Damang, 2) Asanko and 3) Cerro Corona and decisions implemented Asanko and Rusoro divestment transactions concluded. The future of both Cerro Corona and Damang, both of which are nearing the end of their lives, are being managed in a way that will deliver value for Gold Fields while being responsible towards our various stakeholders. Stakeholders 5% Adherence to ESG framework – % delivery against all ESG strategic priority targets Progress against composite and consistent Safety Engagement Index (data points to measure leadership commitment, organisational learning, safety satisfaction and employee involvement) 3.5 Index defined to set the foundation to achieve great group consistency. All sites are above targets set. 5% Reduction in carbon emissions; aligned to incremental goals towards the 2030 Gold Fields target Scope 3 baseline and targets established and avoided. 5% Reduction of freshwater withdrawal; aligned to incremental goals towards the 2030 Gold Fields target Compliance with ICMM Water Stewardship Maturity Framework externally verified, with clear action plans agreed with Board. 5% Increase in female representation at all levels Female representation target of 25% achieved. 5% Improve perception of value 1. Update of Gold Fields strategy and value narrative 2. Narrative documented and implemented 3.5 The Executive Committee has worked collaboratively with colleagues both internal and external to the business to update and build a fit for purpose defence manual which will stand the business in good stead as we move forward. Internal business processes 12% Delivering Salares Norte Delivery of Salares Norte against revised schedule and budget 2.5 Labour and commissioning progress challenges resulted in first gold delivery delays and subsequent project ramp-up. Since January 2024, significant progress was made to remediate on-site labour availability challenges, and critical commissioning delays were resolved. The project delivered first filtered (low moisture) tailings in February 2024, and first gold is scheduled for April 2024 with ramp-up for the remainder of 2024. Mining continued as planned throughout 2023, with 87.2Mt waste moved and 2.3Mt containing 520koz gold-equivalent on stockpile. 10% Underlying value of asset optimisation Provide a clear pathway to unlock the underlying value of Tier 1 assets through the asset optimisation project 3.5 All sites included asset optimisation initiatives into business plans, with US$34.6m of value registered by operations (June to October 2023). We have countered inflation and improved value. Leadership report Governance review Remuneration Report Administration and corporate information Gold Fields GRR-53
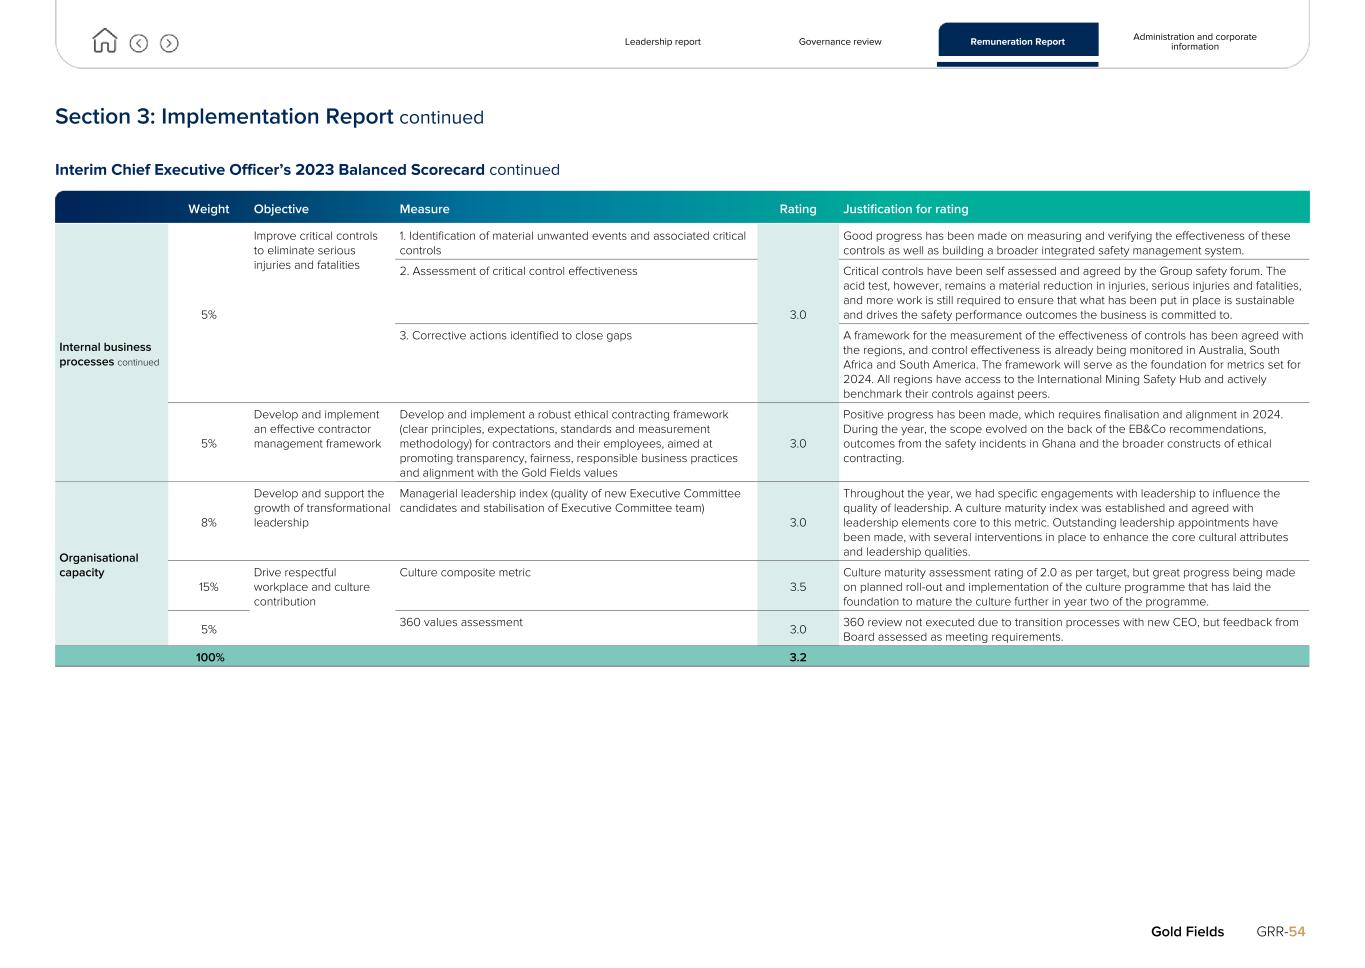
Section 3: Implementation Report continued Interim Chief Executive Officer’s 2023 Balanced Scorecard continued Weight Objective Measure Rating Justification for rating Internal business processes continued 5% Improve critical controls to eliminate serious injuries and fatalities 1. Identification of material unwanted events and associated critical controls 3.0 Good progress has been made on measuring and verifying the effectiveness of these controls as well as building a broader integrated safety management system. 2. Assessment of critical control effectiveness Critical controls have been self assessed and agreed by the Group safety forum. The acid test, however, remains a material reduction in injuries, serious injuries and fatalities, and more work is still required to ensure that what has been put in place is sustainable and drives the safety performance outcomes the business is committed to. 3. Corrective actions identified to close gaps A framework for the measurement of the effectiveness of controls has been agreed with the regions, and control effectiveness is already being monitored in Australia, South Africa and South America. The framework will serve as the foundation for metrics set for 2024. All regions have access to the International Mining Safety Hub and actively benchmark their controls against peers. 5% Develop and implement an effective contractor management framework Develop and implement a robust ethical contracting framework (clear principles, expectations, standards and measurement methodology) for contractors and their employees, aimed at promoting transparency, fairness, responsible business practices and alignment with the Gold Fields values 3.0 Positive progress has been made, which requires finalisation and alignment in 2024. During the year, the scope evolved on the back of the EB&Co recommendations, outcomes from the safety incidents in Ghana and the broader constructs of ethical contracting. Organisational capacity 8% Develop and support the growth of transformational leadership Managerial leadership index (quality of new Executive Committee candidates and stabilisation of Executive Committee team) 3.0 Throughout the year, we had specific engagements with leadership to influence the quality of leadership. A culture maturity index was established and agreed with leadership elements core to this metric. Outstanding leadership appointments have been made, with several interventions in place to enhance the core cultural attributes and leadership qualities. 15% Drive respectful workplace and culture contribution Culture composite metric 3.5 Culture maturity assessment rating of 2.0 as per target, but great progress being made on planned roll-out and implementation of the culture programme that has laid the foundation to mature the culture further in year two of the programme. 5% 360 values assessment 3.0 360 review not executed due to transition processes with new CEO, but feedback from Board assessed as meeting requirements. 100% 3.2 Leadership report Governance review Remuneration Report Administration and corporate information Gold Fields GRR-54
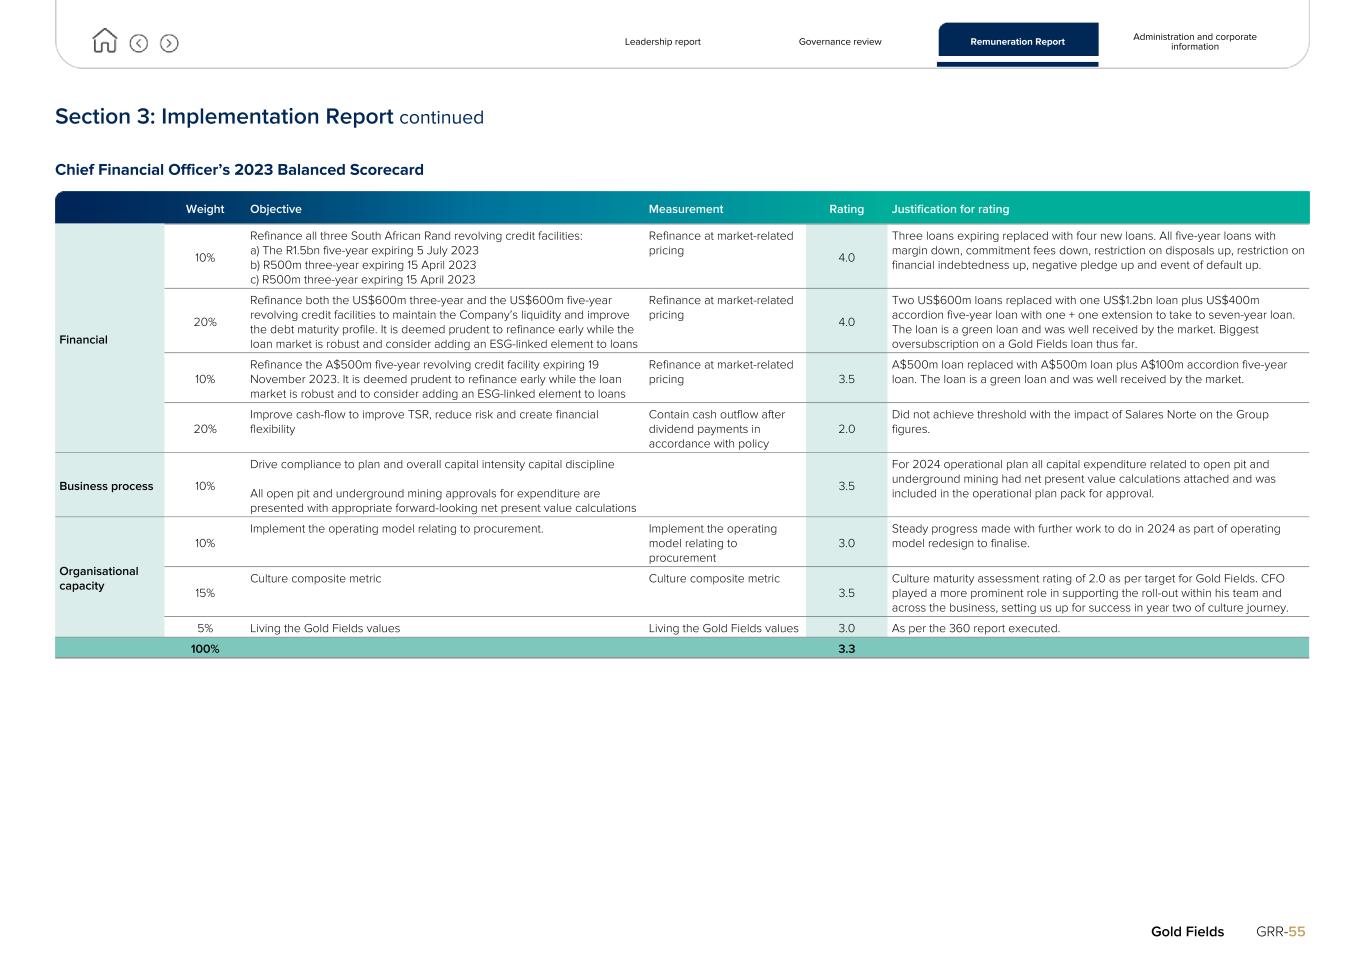
Section 3: Implementation Report continued Chief Financial Officer’s 2023 Balanced Scorecard Weight Objective Measurement Rating Justification for rating Financial 10% Refinance all three South African Rand revolving credit facilities: a) The R1.5bn five-year expiring 5 July 2023 b) R500m three-year expiring 15 April 2023 c) R500m three-year expiring 15 April 2023 Refinance at market-related pricing 4.0 Three loans expiring replaced with four new loans. All five-year loans with margin down, commitment fees down, restriction on disposals up, restriction on financial indebtedness up, negative pledge up and event of default up. 20% Refinance both the US$600m three-year and the US$600m five-year revolving credit facilities to maintain the Company’s liquidity and improve the debt maturity profile. It is deemed prudent to refinance early while the loan market is robust and consider adding an ESG-linked element to loans Refinance at market-related pricing 4.0 Two US$600m loans replaced with one US$1.2bn loan plus US$400m accordion five-year loan with one + one extension to take to seven-year loan. The loan is a green loan and was well received by the market. Biggest oversubscription on a Gold Fields loan thus far. 10% Refinance the A$500m five-year revolving credit facility expiring 19 November 2023. It is deemed prudent to refinance early while the loan market is robust and to consider adding an ESG-linked element to loans Refinance at market-related pricing 3.5 A$500m loan replaced with A$500m loan plus A$100m accordion five-year loan. The loan is a green loan and was well received by the market. 20% Improve cash-flow to improve TSR, reduce risk and create financial flexibility Contain cash outflow after dividend payments in accordance with policy 2.0 Did not achieve threshold with the impact of Salares Norte on the Group figures. Business process 10% Drive compliance to plan and overall capital intensity capital discipline All open pit and underground mining approvals for expenditure are presented with appropriate forward-looking net present value calculations 3.5 For 2024 operational plan all capital expenditure related to open pit and underground mining had net present value calculations attached and was included in the operational plan pack for approval. Organisational capacity 10% Implement the operating model relating to procurement. Implement the operating model relating to procurement 3.0 Steady progress made with further work to do in 2024 as part of operating model redesign to finalise. 15% Culture composite metric Culture composite metric 3.5 Culture maturity assessment rating of 2.0 as per target for Gold Fields. CFO played a more prominent role in supporting the roll-out within his team and across the business, setting us up for success in year two of culture journey. 5% Living the Gold Fields values Living the Gold Fields values 3.0 As per the 360 report executed. 100% 3.3 Leadership report Governance review Remuneration Report Administration and corporate information Gold Fields GRR-55
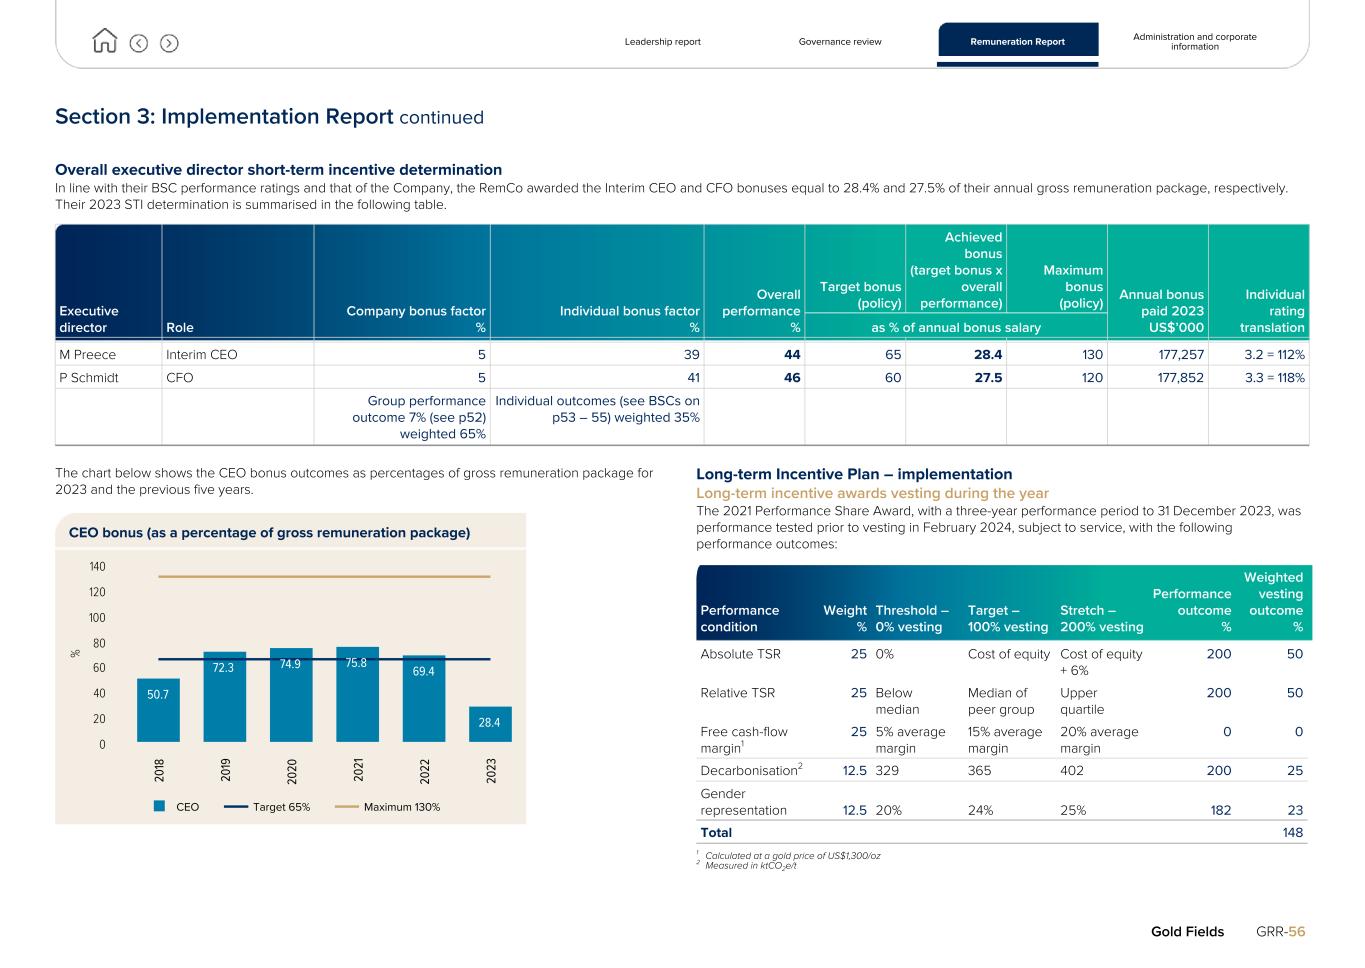
Section 3: Implementation Report continued Overall executive director short-term incentive determination In line with their BSC performance ratings and that of the Company, the RemCo awarded the Interim CEO and CFO bonuses equal to 28.4% and 27.5% of their annual gross remuneration package, respectively. Their 2023 STI determination is summarised in the following table. Executive director Role Company bonus factor % Individual bonus factor % Overall performance % Target bonus (policy) Achieved bonus (target bonus x overall performance) Maximum bonus (policy) Annual bonus paid 2023 US$’000 Individual rating translationas % of annual bonus salary M Preece Interim CEO 5 39 44 65 28.4 130 177,257 3.2 = 112% P Schmidt CFO 5 41 46 60 27.5 120 177,852 3.3 = 118% Group performance outcome 7% (see p52) weighted 65% Individual outcomes (see BSCs on p53 – 55) weighted 35% The chart below shows the CEO bonus outcomes as percentages of gross remuneration package for 2023 and the previous five years. CEO bonus (as a percentage of gross remuneration package) % 50.7 72.3 74.9 75.8 69.4 28.4 CEO Target 65% Maximum 130% 20 18 20 19 20 20 20 21 20 22 20 23 0 20 40 60 80 100 120 140 Long-term Incentive Plan – implementation Long-term incentive awards vesting during the year The 2021 Performance Share Award, with a three-year performance period to 31 December 2023, was performance tested prior to vesting in February 2024, subject to service, with the following performance outcomes: Performance condition Weight % Threshold – 0% vesting Target – 100% vesting Stretch – 200% vesting Performance outcome % Weighted vesting outcome % Absolute TSR 25 0% Cost of equity Cost of equity + 6% 200 50 Relative TSR 25 Below median Median of peer group Upper quartile 200 50 Free cash-flow margin1 25 5% average margin 15% average margin 20% average margin 0 0 Decarbonisation2 12.5 329 365 402 200 25 Gender representation 12.5 20% 24% 25% 182 23 Total 148 1 Calculated at a gold price of US$1,300/oz 2 Measured in ktCO2e/t Leadership report Governance review Remuneration Report Administration and corporate information Gold Fields GRR-56
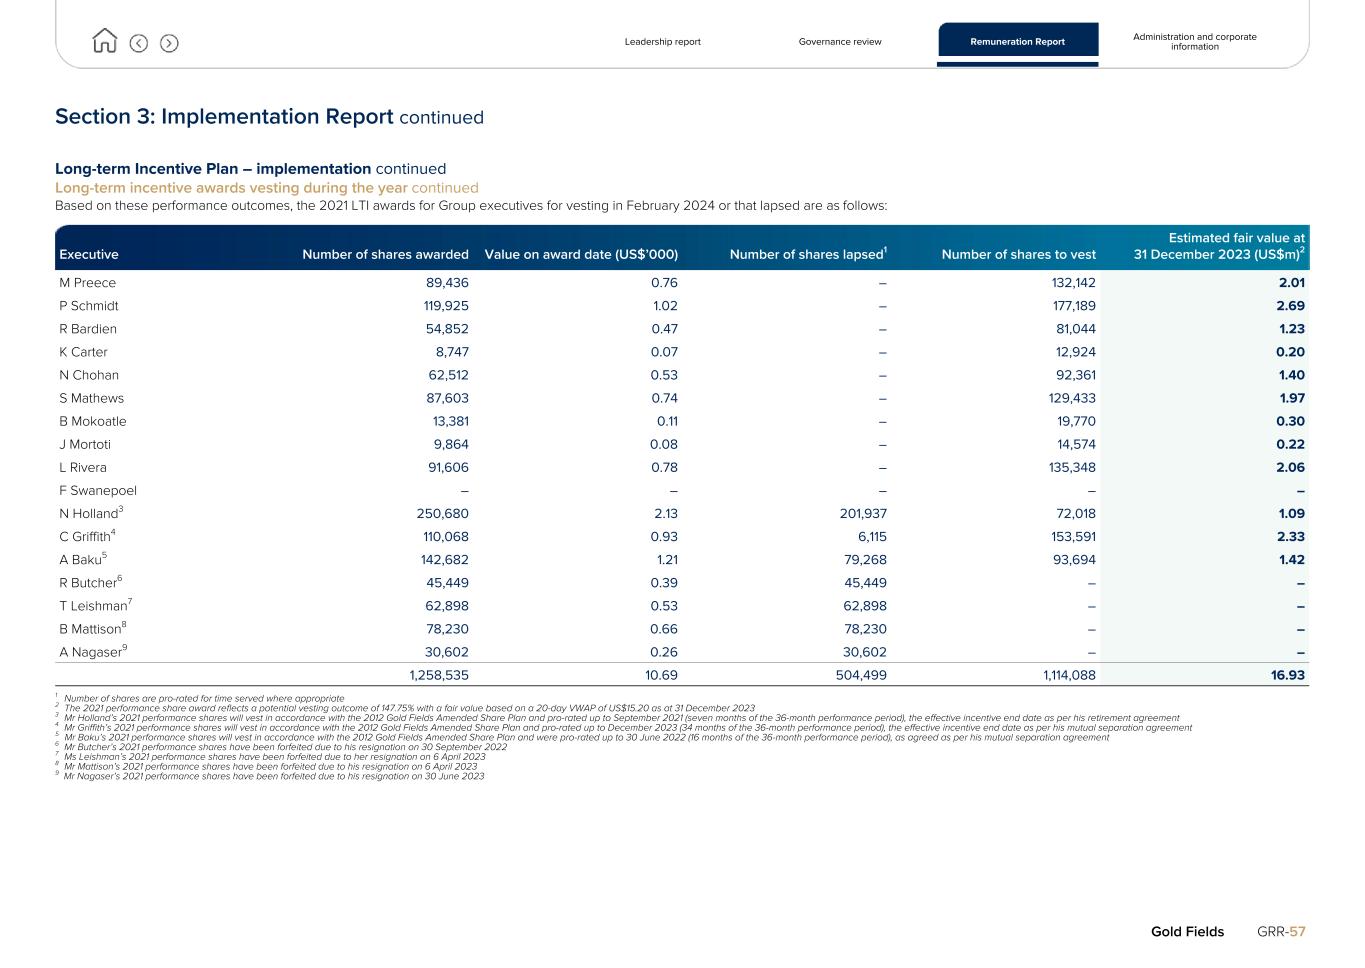
Section 3: Implementation Report continued Long-term Incentive Plan – implementation continued Long-term incentive awards vesting during the year continued Based on these performance outcomes, the 2021 LTI awards for Group executives for vesting in February 2024 or that lapsed are as follows: Executive Number of shares awarded Value on award date (US$’000) Number of shares lapsed1 Number of shares to vest Estimated fair value at 31 December 2023 (US$m)2 M Preece 89,436 0.76 – 132,142 2.01 P Schmidt 119,925 1.02 – 177,189 2.69 R Bardien 54,852 0.47 – 81,044 1.23 K Carter 8,747 0.07 – 12,924 0.20 N Chohan 62,512 0.53 – 92,361 1.40 S Mathews 87,603 0.74 – 129,433 1.97 B Mokoatle 13,381 0.11 – 19,770 0.30 J Mortoti 9,864 0.08 – 14,574 0.22 L Rivera 91,606 0.78 – 135,348 2.06 F Swanepoel – – – – – N Holland3 250,680 2.13 201,937 72,018 1.09 C Griffith4 110,068 0.93 6,115 153,591 2.33 A Baku5 142,682 1.21 79,268 93,694 1.42 R Butcher6 45,449 0.39 45,449 – – T Leishman7 62,898 0.53 62,898 – – B Mattison8 78,230 0.66 78,230 – – A Nagaser9 30,602 0.26 30,602 – – 1,258,535 10.69 504,499 1,114,088 16.93 1 Number of shares are pro-rated for time served where appropriate 2 The 2021 performance share award reflects a potential vesting outcome of 147.75% with a fair value based on a 20-day VWAP of US$15.20 as at 31 December 2023 3 Mr Holland’s 2021 performance shares will vest in accordance with the 2012 Gold Fields Amended Share Plan and pro-rated up to September 2021 (seven months of the 36-month performance period), the effective incentive end date as per his retirement agreement 4 Mr Griffith’s 2021 performance shares will vest in accordance with the 2012 Gold Fields Amended Share Plan and pro-rated up to December 2023 (34 months of the 36-month performance period), the effective incentive end date as per his mutual separation agreement 5 Mr Baku’s 2021 performance shares will vest in accordance with the 2012 Gold Fields Amended Share Plan and were pro-rated up to 30 June 2022 (16 months of the 36-month performance period), as agreed as per his mutual separation agreement 6 Mr Butcher’s 2021 performance shares have been forfeited due to his resignation on 30 September 2022 7 Ms Leishman’s 2021 performance shares have been forfeited due to her resignation on 6 April 2023 8 Mr Mattison’s 2021 performance shares have been forfeited due to his resignation on 6 April 2023 9 Mr Nagaser’s 2021 performance shares have been forfeited due to his resignation on 30 June 2023 Leadership report Governance review Remuneration Report Administration and corporate information Gold Fields GRR-57
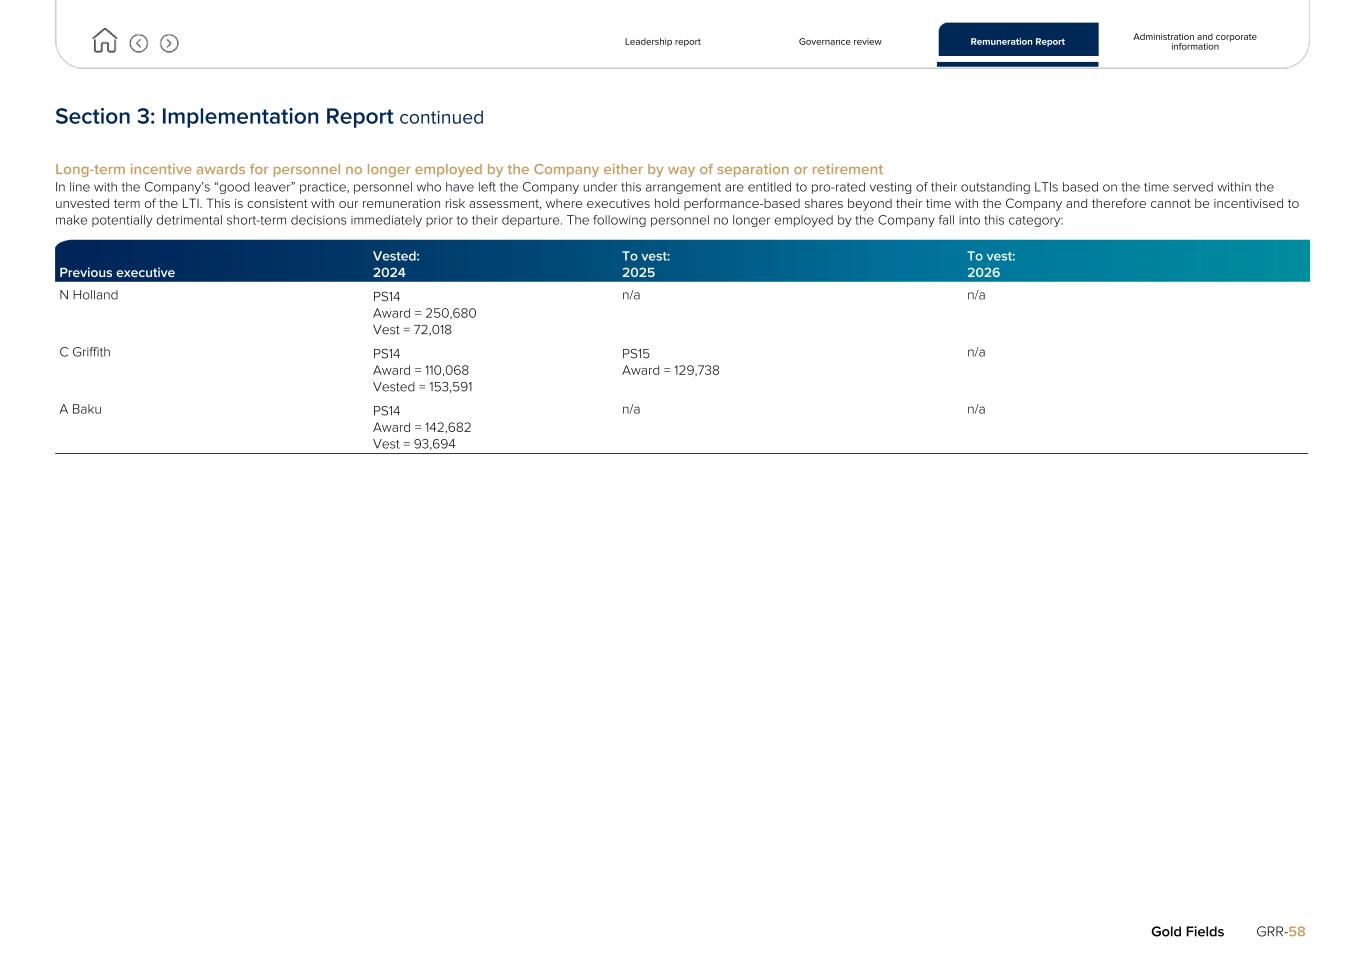
Section 3: Implementation Report continued Long-term incentive awards for personnel no longer employed by the Company either by way of separation or retirement In line with the Company’s “good leaver” practice, personnel who have left the Company under this arrangement are entitled to pro-rated vesting of their outstanding LTIs based on the time served within the unvested term of the LTI. This is consistent with our remuneration risk assessment, where executives hold performance-based shares beyond their time with the Company and therefore cannot be incentivised to make potentially detrimental short-term decisions immediately prior to their departure. The following personnel no longer employed by the Company fall into this category: Previous executive Vested: 2024 To vest: 2025 To vest: 2026 N Holland PS14 Award = 250,680 Vest = 72,018 n/a n/a C Griffith PS14 Award = 110,068 Vested = 153,591 PS15 Award = 129,738 n/a A Baku PS14 Award = 142,682 Vest = 93,694 n/a n/a Leadership report Governance review Remuneration Report Administration and corporate information Gold Fields GRR-58
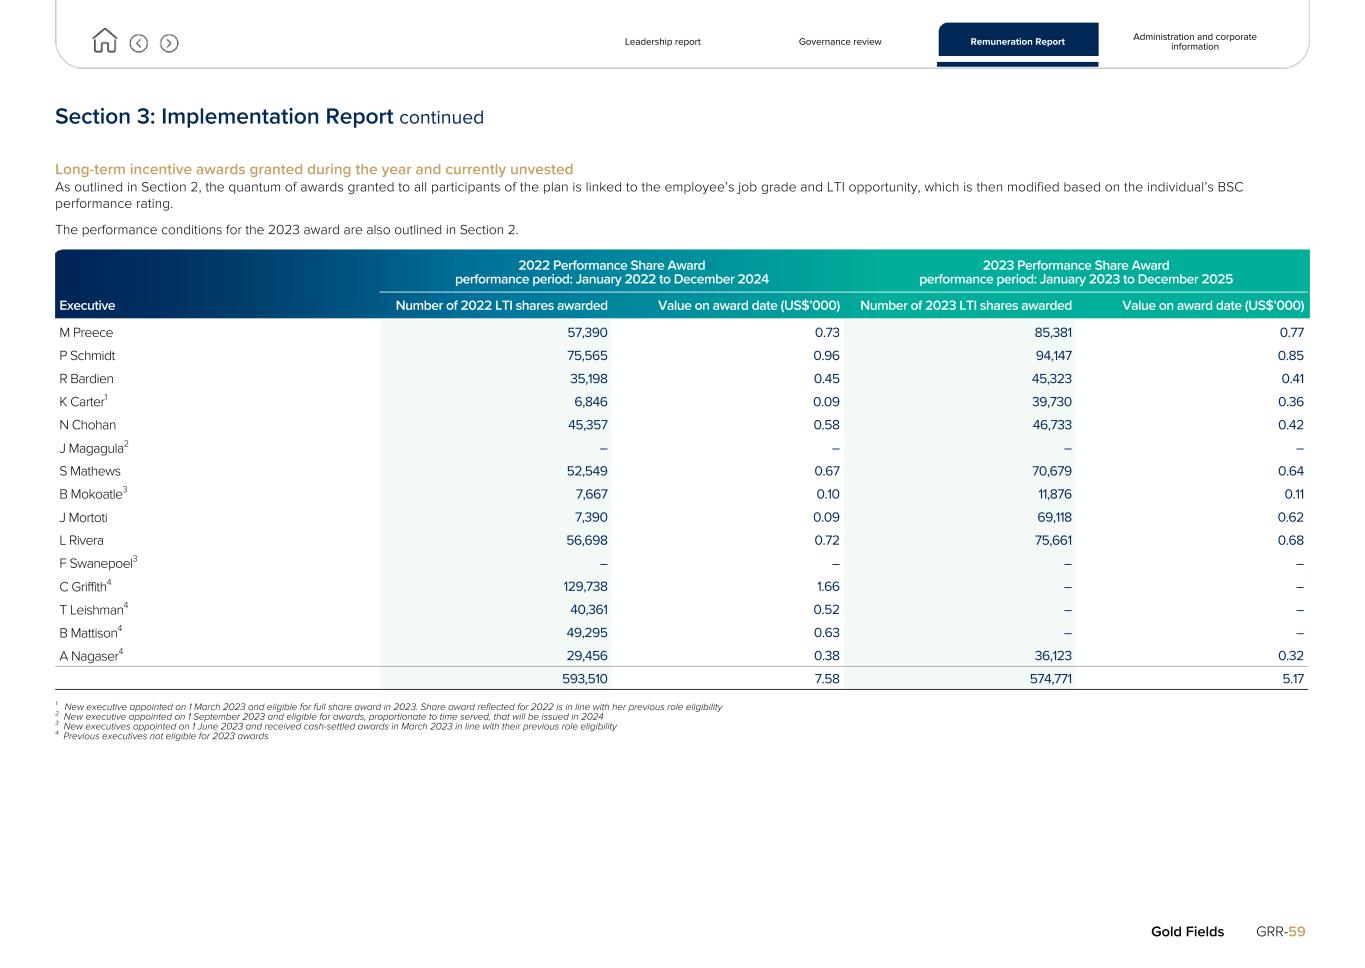
Section 3: Implementation Report continued Long-term incentive awards granted during the year and currently unvested As outlined in Section 2, the quantum of awards granted to all participants of the plan is linked to the employee’s job grade and LTI opportunity, which is then modified based on the individual’s BSC performance rating. The performance conditions for the 2023 award are also outlined in Section 2. Executive 2022 Performance Share Award performance period: January 2022 to December 2024 2023 Performance Share Award performance period: January 2023 to December 2025 Number of 2022 LTI shares awarded Value on award date (US$’000) Number of 2023 LTI shares awarded Value on award date (US$’000) M Preece 57,390 0.73 85,381 0.77 P Schmidt 75,565 0.96 94,147 0.85 R Bardien 35,198 0.45 45,323 0.41 K Carter1 6,846 0.09 39,730 0.36 N Chohan 45,357 0.58 46,733 0.42 J Magagula2 – – – – S Mathews 52,549 0.67 70,679 0.64 B Mokoatle3 7,667 0.10 11,876 0.11 J Mortoti 7,390 0.09 69,118 0.62 L Rivera 56,698 0.72 75,661 0.68 F Swanepoel3 – – – – C Griffith4 129,738 1.66 – – T Leishman4 40,361 0.52 – – B Mattison4 49,295 0.63 – – A Nagaser4 29,456 0.38 36,123 0.32 593,510 7.58 574,771 5.17 1 New executive appointed on 1 March 2023 and eligible for full share award in 2023. Share award reflected for 2022 is in line with her previous role eligibility 2 New executive appointed on 1 September 2023 and eligible for awards, proportionate to time served, that will be issued in 2024 3 New executives appointed on 1 June 2023 and received cash-settled awards in March 2023 in line with their previous role eligibility 4 Previous executives not eligible for 2023 awards Leadership report Governance review Remuneration Report Administration and corporate information Gold Fields GRR-59
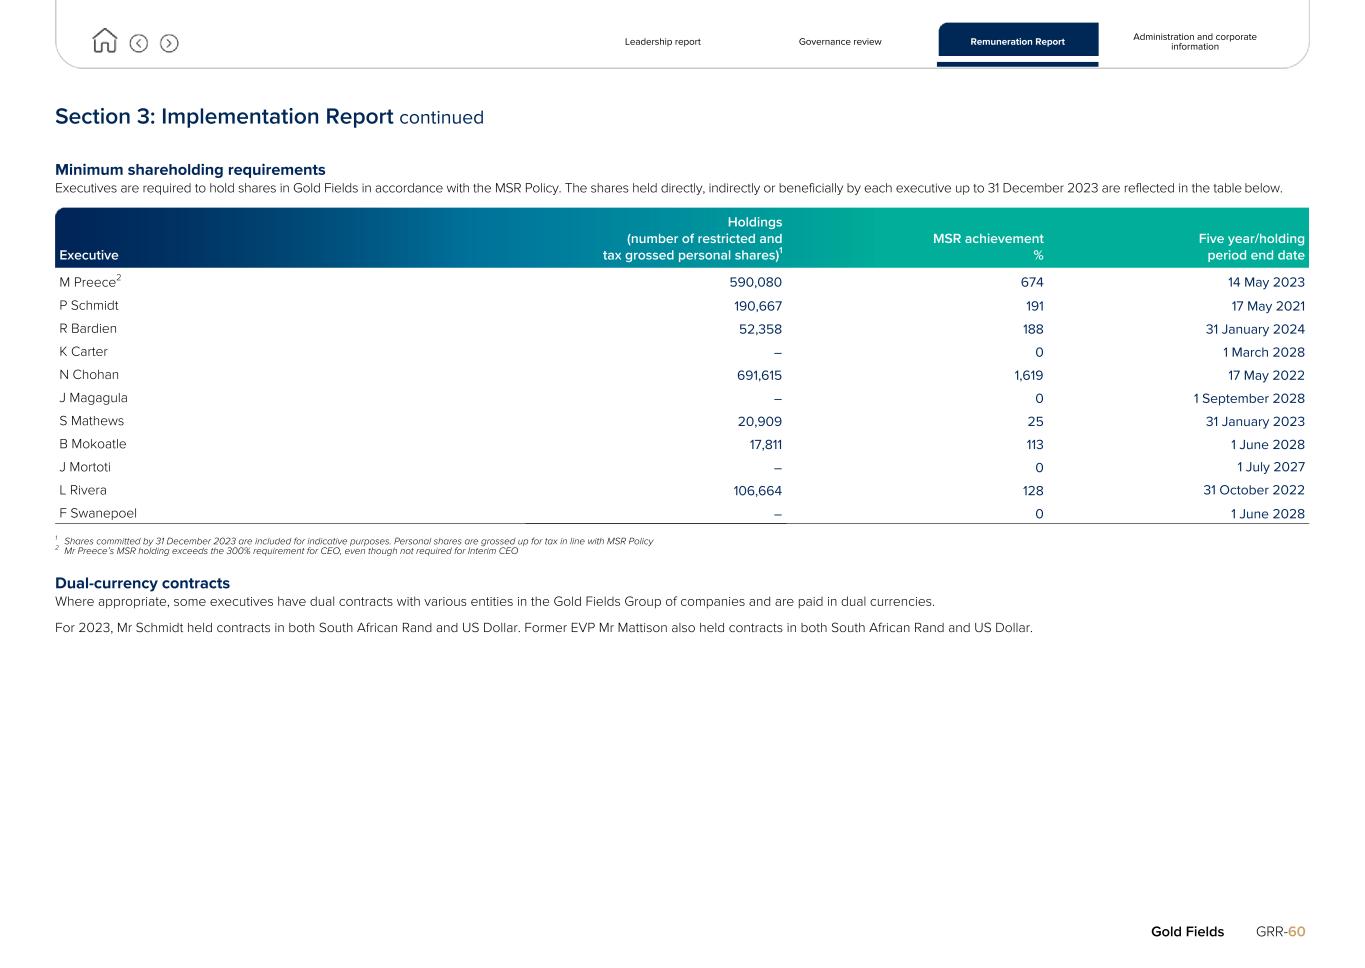
Section 3: Implementation Report continued Minimum shareholding requirements Executives are required to hold shares in Gold Fields in accordance with the MSR Policy. The shares held directly, indirectly or beneficially by each executive up to 31 December 2023 are reflected in the table below. Executive Holdings (number of restricted and tax grossed personal shares)1 MSR achievement % Five year/holding period end date M Preece2 590,080 674 14 May 2023 P Schmidt 190,667 191 17 May 2021 R Bardien 52,358 188 31 January 2024 K Carter – 0 1 March 2028 N Chohan 691,615 1,619 17 May 2022 J Magagula – 0 1 September 2028 S Mathews 20,909 25 31 January 2023 B Mokoatle 17,811 113 1 June 2028 J Mortoti – 0 1 July 2027 L Rivera 106,664 128 31 October 2022 F Swanepoel – 0 1 June 2028 1 Shares committed by 31 December 2023 are included for indicative purposes. Personal shares are grossed up for tax in line with MSR Policy 2 Mr Preece’s MSR holding exceeds the 300% requirement for CEO, even though not required for Interim CEO Dual-currency contracts Where appropriate, some executives have dual contracts with various entities in the Gold Fields Group of companies and are paid in dual currencies. For 2023, Mr Schmidt held contracts in both South African Rand and US Dollar. Former EVP Mr Mattison also held contracts in both South African Rand and US Dollar. Leadership report Governance review Remuneration Report Administration and corporate information Gold Fields GRR-60
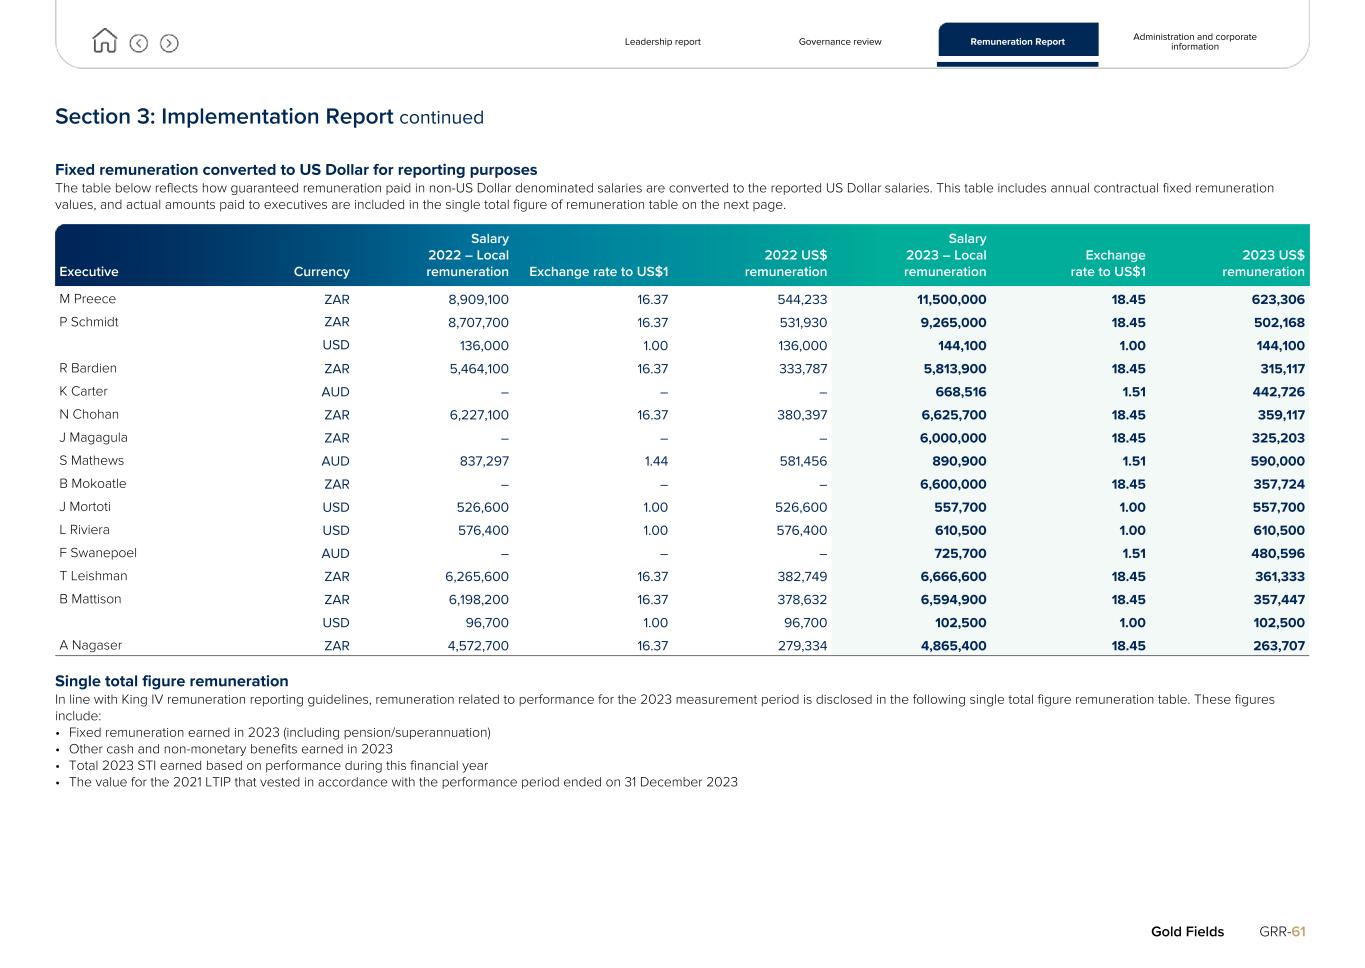
Section 3: Implementation Report continued Fixed remuneration converted to US Dollar for reporting purposes The table below reflects how guaranteed remuneration paid in non-US Dollar denominated salaries are converted to the reported US Dollar salaries. This table includes annual contractual fixed remuneration values, and actual amounts paid to executives are included in the single total figure of remuneration table on the next page. Executive Currency Salary 2022 – Local remuneration Exchange rate to US$1 2022 US$ remuneration Salary 2023 – Local remuneration Exchange rate to US$1 2023 US$ remuneration M Preece ZAR 8,909,100 16.37 544,233 11,500,000 18.45 623,306 P Schmidt ZAR 8,707,700 16.37 531,930 9,265,000 18.45 502,168 USD 136,000 1.00 136,000 144,100 1.00 144,100 R Bardien ZAR 5,464,100 16.37 333,787 5,813,900 18.45 315,117 K Carter AUD – – – 668,516 1.51 442,726 N Chohan ZAR 6,227,100 16.37 380,397 6,625,700 18.45 359,117 J Magagula ZAR – – – 6,000,000 18.45 325,203 S Mathews AUD 837,297 1.44 581,456 890,900 1.51 590,000 B Mokoatle ZAR – – – 6,600,000 18.45 357,724 J Mortoti USD 526,600 1.00 526,600 557,700 1.00 557,700 L Riviera USD 576,400 1.00 576,400 610,500 1.00 610,500 F Swanepoel AUD – – – 725,700 1.51 480,596 T Leishman ZAR 6,265,600 16.37 382,749 6,666,600 18.45 361,333 B Mattison ZAR 6,198,200 16.37 378,632 6,594,900 18.45 357,447 USD 96,700 1.00 96,700 102,500 1.00 102,500 A Nagaser ZAR 4,572,700 16.37 279,334 4,865,400 18.45 263,707 Single total figure remuneration In line with King IV remuneration reporting guidelines, remuneration related to performance for the 2023 measurement period is disclosed in the following single total figure remuneration table. These figures include: • Fixed remuneration earned in 2023 (including pension/superannuation) • Other cash and non-monetary benefits earned in 2023 • Total 2023 STI earned based on performance during this financial year • The value for the 2021 LTIP that vested in accordance with the performance period ended on 31 December 2023 Leadership report Governance review Remuneration Report Administration and corporate information Gold Fields GRR-61
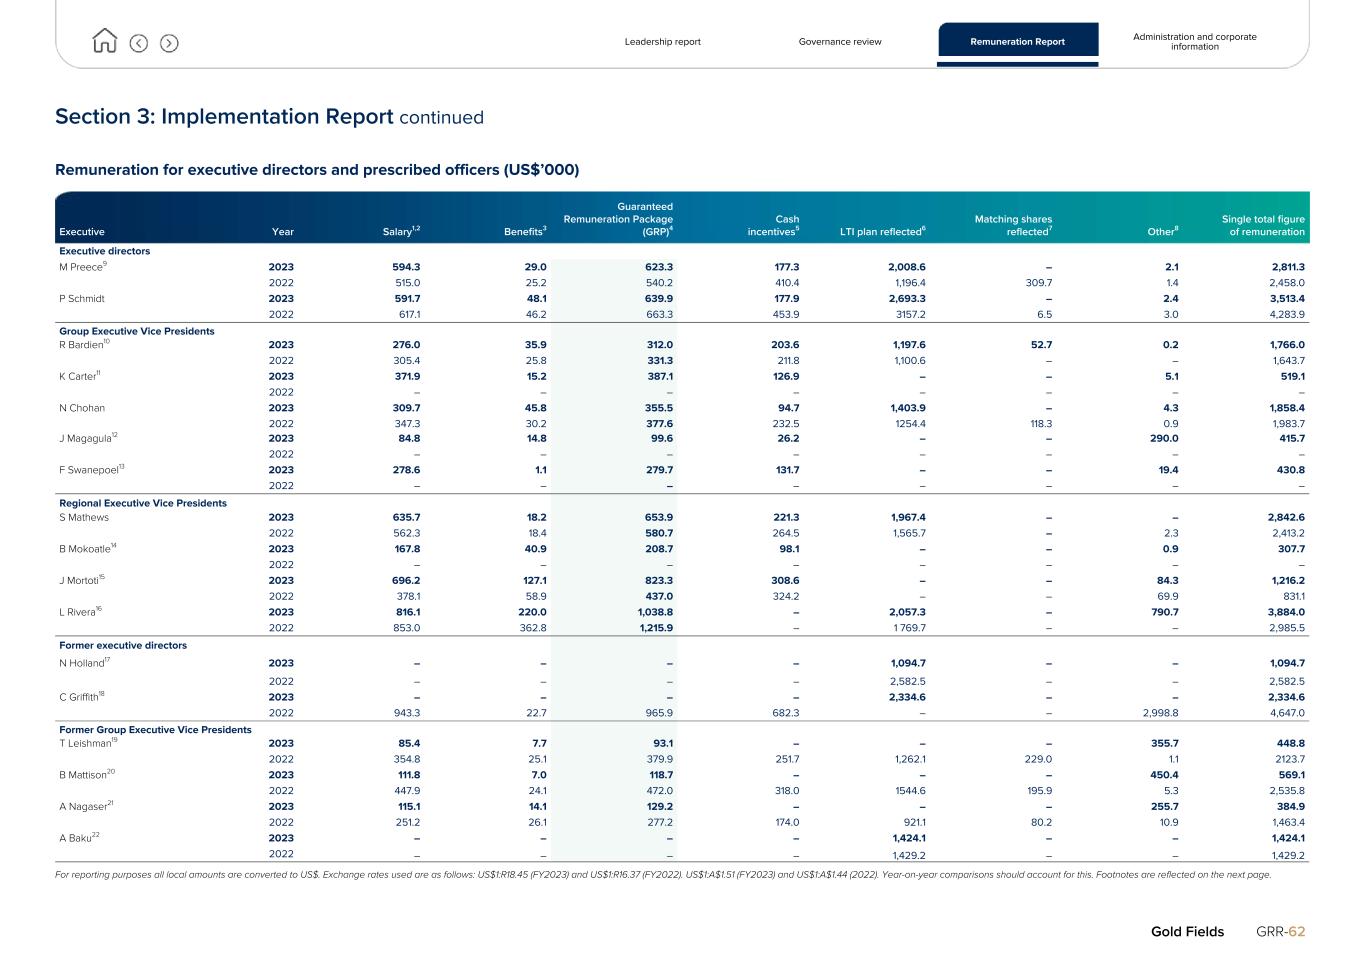
Section 3: Implementation Report continued Remuneration for executive directors and prescribed officers (US$’000) Executive Year Salary1,2 Benefits3 Guaranteed Remuneration Package (GRP)4 Cash incentives5 LTI plan reflected6 Matching shares reflected7 Other8 Single total figure of remuneration Executive directors M Preece9 2023 594.3 29.0 623.3 177.3 2,008.6 – 2.1 2,811.3 2022 515.0 25.2 540.2 410.4 1,196.4 309.7 1.4 2,458.0 P Schmidt 2023 591.7 48.1 639.9 177.9 2,693.3 – 2.4 3,513.4 2022 617.1 46.2 663.3 453.9 3157.2 6.5 3.0 4,283.9 Group Executive Vice Presidents R Bardien10 2023 276.0 35.9 312.0 203.6 1,197.6 52.7 0.2 1,766.0 2022 305.4 25.8 331.3 211.8 1,100.6 – – 1,643.7 K Carter11 2023 371.9 15.2 387.1 126.9 – – 5.1 519.1 2022 – – – – – – – – N Chohan 2023 309.7 45.8 355.5 94.7 1,403.9 – 4.3 1,858.4 2022 347.3 30.2 377.6 232.5 1254.4 118.3 0.9 1,983.7 J Magagula12 2023 84.8 14.8 99.6 26.2 – – 290.0 415.7 2022 – – – – – – – – F Swanepoel13 2023 278.6 1.1 279.7 131.7 – – 19.4 430.8 2022 – – – – – – – – Regional Executive Vice Presidents S Mathews 2023 635.7 18.2 653.9 221.3 1,967.4 – – 2,842.6 2022 562.3 18.4 580.7 264.5 1,565.7 – 2.3 2,413.2 B Mokoatle14 2023 167.8 40.9 208.7 98.1 – – 0.9 307.7 2022 – – – – – – – – J Mortoti15 2023 696.2 127.1 823.3 308.6 – – 84.3 1,216.2 2022 378.1 58.9 437.0 324.2 – – 69.9 831.1 L Rivera16 2023 816.1 220.0 1,038.8 – 2,057.3 – 790.7 3,884.0 2022 853.0 362.8 1,215.9 – 1 769.7 – – 2,985.5 Former executive directors N Holland17 2023 – – – – 1,094.7 – – 1,094.7 2022 – – – – 2,582.5 – – 2,582.5 C Griffith18 2023 – – – – 2,334.6 – – 2,334.6 2022 943.3 22.7 965.9 682.3 – – 2,998.8 4,647.0 Former Group Executive Vice Presidents T Leishman19 2023 85.4 7.7 93.1 – – – 355.7 448.8 2022 354.8 25.1 379.9 251.7 1,262.1 229.0 1.1 2123.7 B Mattison20 2023 111.8 7.0 118.7 – – – 450.4 569.1 2022 447.9 24.1 472.0 318.0 1544.6 195.9 5.3 2,535.8 A Nagaser21 2023 115.1 14.1 129.2 – – – 255.7 384.9 2022 251.2 26.1 277.2 174.0 921.1 80.2 10.9 1,463.4 A Baku22 2023 – – – – 1,424.1 – – 1,424.1 2022 – – – – 1,429.2 – – 1,429.2 For reporting purposes all local amounts are converted to US$. Exchange rates used are as follows: US$1:R18.45 (FY2023) and US$1:R16.37 (FY2022). US$1:A$1.51 (FY2023) and US$1:A$1.44 (2022). Year-on-year comparisons should account for this. Footnotes are reflected on the next page. Leadership report Governance review Remuneration Report Administration and corporate information Gold Fields GRR-62
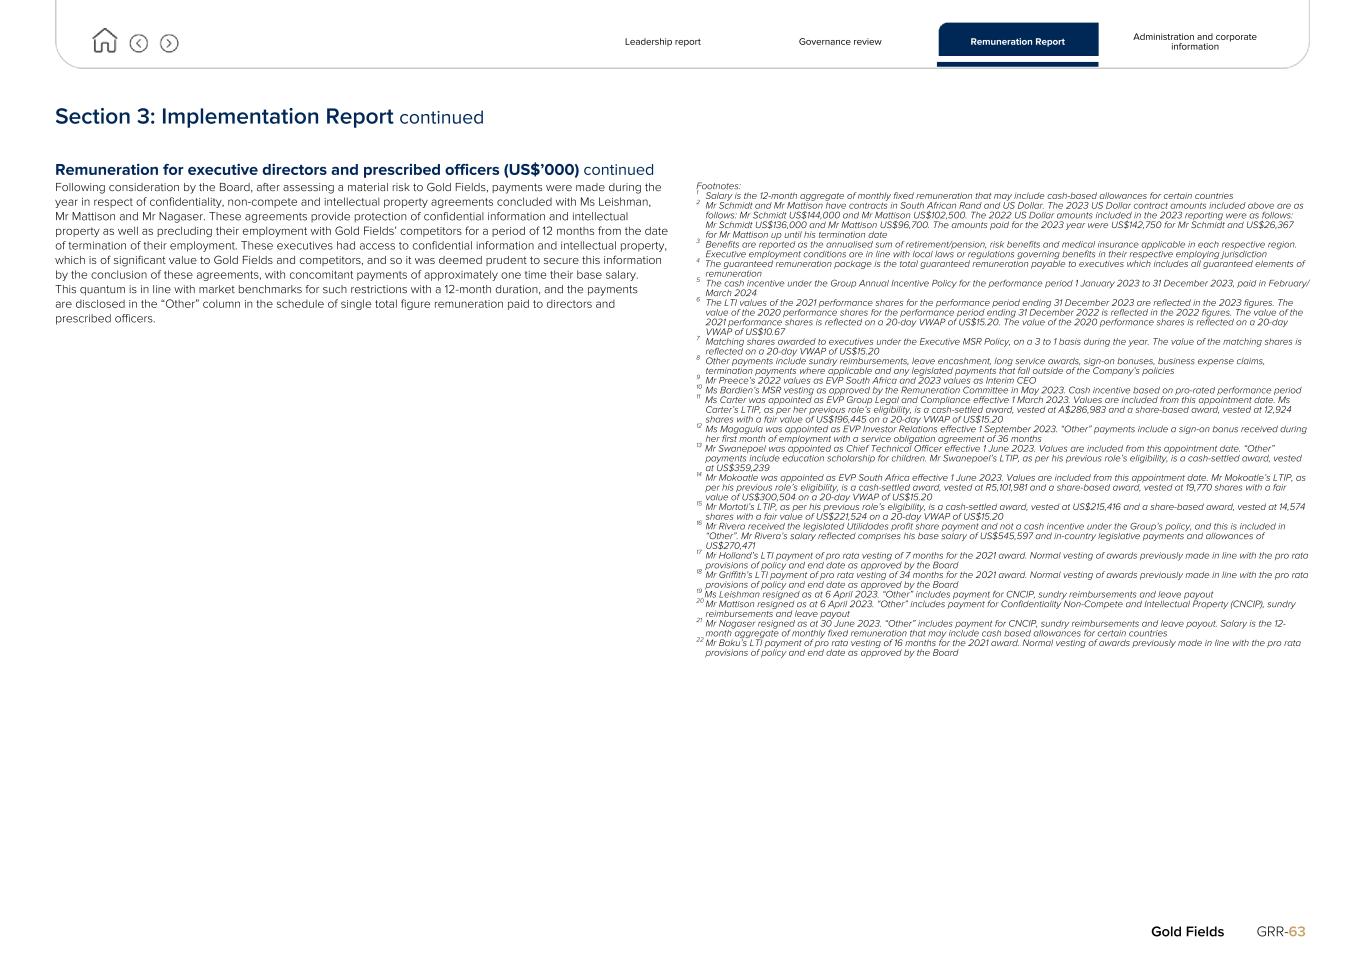
Section 3: Implementation Report continued Remuneration for executive directors and prescribed officers (US$’000) continued Following consideration by the Board, after assessing a material risk to Gold Fields, payments were made during the year in respect of confidentiality, non-compete and intellectual property agreements concluded with Ms Leishman, Mr Mattison and Mr Nagaser. These agreements provide protection of confidential information and intellectual property as well as precluding their employment with Gold Fields’ competitors for a period of 12 months from the date of termination of their employment. These executives had access to confidential information and intellectual property, which is of significant value to Gold Fields and competitors, and so it was deemed prudent to secure this information by the conclusion of these agreements, with concomitant payments of approximately one time their base salary. This quantum is in line with market benchmarks for such restrictions with a 12-month duration, and the payments are disclosed in the “Other” column in the schedule of single total figure remuneration paid to directors and prescribed officers. Footnotes: 1 Salary is the 12-month aggregate of monthly fixed remuneration that may include cash-based allowances for certain countries 2 Mr Schmidt and Mr Mattison have contracts in South African Rand and US Dollar. The 2023 US Dollar contract amounts included above are as follows: Mr Schmidt US$144,000 and Mr Mattison US$102,500. The 2022 US Dollar amounts included in the 2023 reporting were as follows: Mr Schmidt US$136,000 and Mr Mattison US$96,700. The amounts paid for the 2023 year were US$142,750 for Mr Schmidt and US$26,367 for Mr Mattison up until his termination date 3 Benefits are reported as the annualised sum of retirement/pension, risk benefits and medical insurance applicable in each respective region. Executive employment conditions are in line with local laws or regulations governing benefits in their respective employing jurisdiction 4 The guaranteed remuneration package is the total guaranteed remuneration payable to executives which includes all guaranteed elements of remuneration 5 The cash incentive under the Group Annual Incentive Policy for the performance period 1 January 2023 to 31 December 2023, paid in February/ March 2024 6 The LTI values of the 2021 performance shares for the performance period ending 31 December 2023 are reflected in the 2023 figures. The value of the 2020 performance shares for the performance period ending 31 December 2022 is reflected in the 2022 figures. The value of the 2021 performance shares is reflected on a 20-day VWAP of US$15.20. The value of the 2020 performance shares is reflected on a 20-day VWAP of US$10.67 7 Matching shares awarded to executives under the Executive MSR Policy, on a 3 to 1 basis during the year. The value of the matching shares is reflected on a 20-day VWAP of US$15.20 8 Other payments include sundry reimbursements, leave encashment, long service awards, sign-on bonuses, business expense claims, termination payments where applicable and any legislated payments that fall outside of the Company’s policies 9 Mr Preece’s 2022 values as EVP South Africa and 2023 values as Interim CEO 10 Ms Bardien’s MSR vesting as approved by the Remuneration Committee in May 2023. Cash incentive based on pro-rated performance period 11 Ms Carter was appointed as EVP Group Legal and Compliance effective 1 March 2023. Values are included from this appointment date. Ms Carter’s LTIP, as per her previous role’s eligibility, is a cash-settled award, vested at A$286,983 and a share-based award, vested at 12,924 shares with a fair value of US$196,445 on a 20-day VWAP of US$15.20 12 Ms Magagula was appointed as EVP Investor Relations effective 1 September 2023. “Other” payments include a sign-on bonus received during her first month of employment with a service obligation agreement of 36 months 13 Mr Swanepoel was appointed as Chief Technical Officer effective 1 June 2023. Values are included from this appointment date. “Other” payments include education scholarship for children. Mr Swanepoel’s LTIP, as per his previous role’s eligibility, is a cash-settled award, vested at US$359,239 14 Mr Mokoatle was appointed as EVP South Africa effective 1 June 2023. Values are included from this appointment date. Mr Mokoatle’s LTIP, as per his previous role’s eligibility, is a cash-settled award, vested at R5,101,981 and a share-based award, vested at 19,770 shares with a fair value of US$300,504 on a 20-day VWAP of US$15.20 15 Mr Mortoti’s LTIP, as per his previous role’s eligibility, is a cash-settled award, vested at US$215,416 and a share-based award, vested at 14,574 shares with a fair value of US$221,524 on a 20-day VWAP of US$15.20 16 Mr Rivera received the legislated Utilidades profit share payment and not a cash incentive under the Group’s policy, and this is included in “Other”. Mr Rivera’s salary reflected comprises his base salary of US$545,597 and in-country legislative payments and allowances of US$270,471 17 Mr Holland’s LTI payment of pro rata vesting of 7 months for the 2021 award. Normal vesting of awards previously made in line with the pro rata provisions of policy and end date as approved by the Board 18 Mr Griffith’s LTI payment of pro rata vesting of 34 months for the 2021 award. Normal vesting of awards previously made in line with the pro rata provisions of policy and end date as approved by the Board 19 Ms Leishman resigned as at 6 April 2023. “Other” includes payment for CNCIP, sundry reimbursements and leave payout 20 Mr Mattison resigned as at 6 April 2023. “Other” includes payment for Confidentiality Non-Compete and Intellectual Property (CNCIP), sundry reimbursements and leave payout 21 Mr Nagaser resigned as at 30 June 2023. “Other” includes payment for CNCIP, sundry reimbursements and leave payout. Salary is the 12- month aggregate of monthly fixed remuneration that may include cash based allowances for certain countries 22 Mr Baku’s LTI payment of pro rata vesting of 16 months for the 2021 award. Normal vesting of awards previously made in line with the pro rata provisions of policy and end date as approved by the Board Leadership report Governance review Remuneration Report Administration and corporate information Gold Fields GRR-63
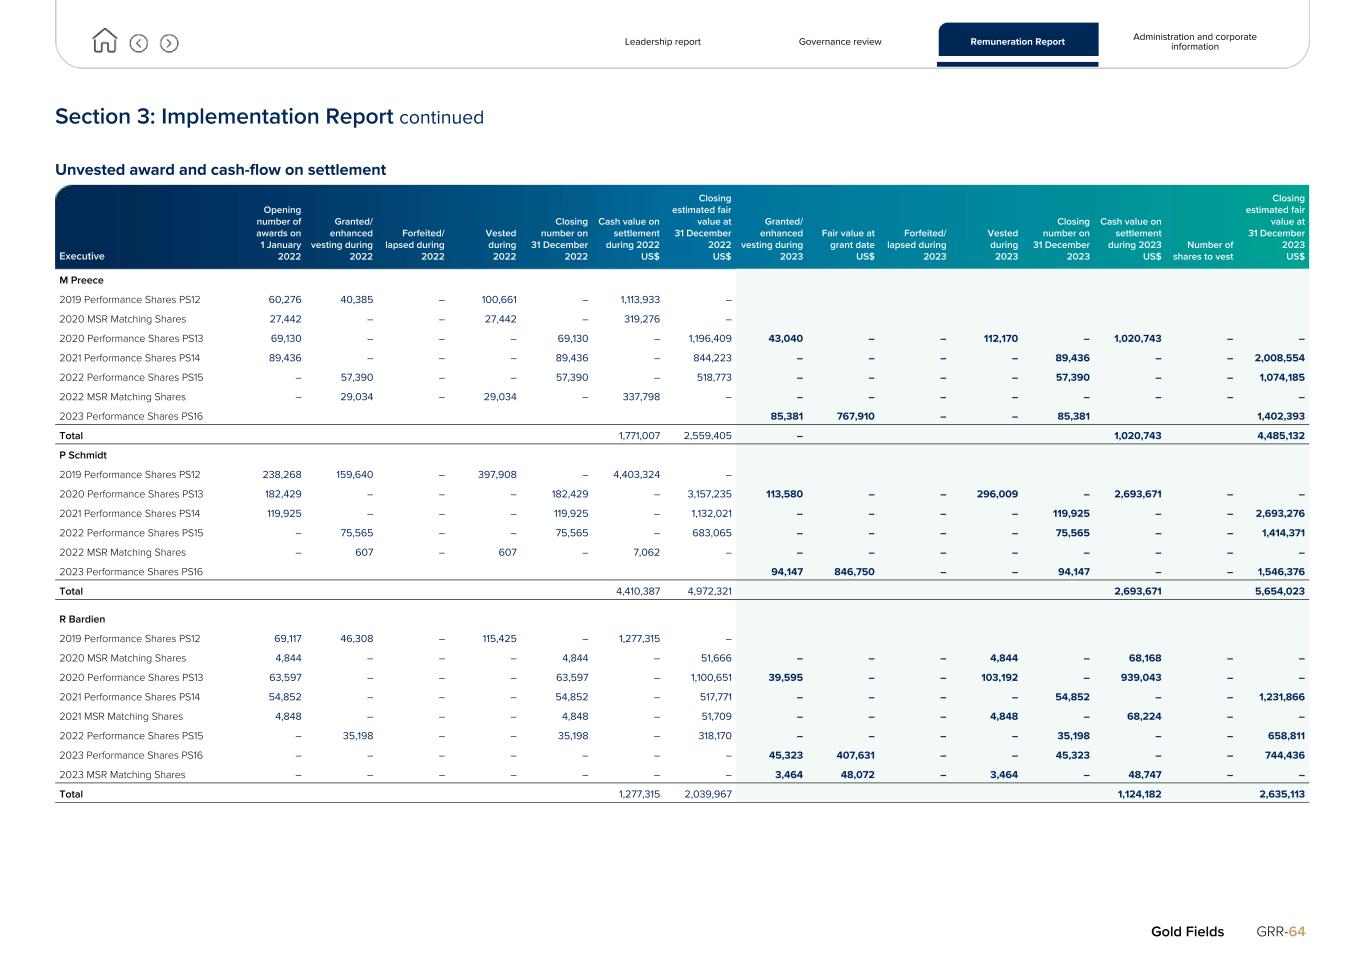
Section 3: Implementation Report continued Unvested award and cash-flow on settlement Executive Opening number of awards on 1 January 2022 Granted/ enhanced vesting during 2022 Forfeited/ lapsed during 2022 Vested during 2022 Closing number on 31 December 2022 Cash value on settlement during 2022 US$ Closing estimated fair value at 31 December 2022 US$ Granted/ enhanced vesting during 2023 Fair value at grant date US$ Forfeited/ lapsed during 2023 Vested during 2023 Closing number on 31 December 2023 Cash value on settlement during 2023 US$ Number of shares to vest Closing estimated fair value at 31 December 2023 US$ M Preece 2019 Performance Shares PS12 60,276 40,385 – 100,661 – 1,113,933 – 2020 MSR Matching Shares 27,442 – – 27,442 – 319,276 – 2020 Performance Shares PS13 69,130 – – – 69,130 – 1,196,409 43,040 – – 112,170 – 1,020,743 – – 2021 Performance Shares PS14 89,436 – – – 89,436 – 844,223 – – – – 89,436 – – 2,008,554 2022 Performance Shares PS15 – 57,390 – – 57,390 – 518,773 – – – – 57,390 – – 1,074,185 2022 MSR Matching Shares – 29,034 – 29,034 – 337,798 – – – – – – – – – 2023 Performance Shares PS16 85,381 767,910 – – 85,381 1,402,393 Total 1,771,007 2,559,405 – 1,020,743 4,485,132 P Schmidt 2019 Performance Shares PS12 238,268 159,640 – 397,908 – 4,403,324 – 2020 Performance Shares PS13 182,429 – – – 182,429 – 3,157,235 113,580 – – 296,009 – 2,693,671 – – 2021 Performance Shares PS14 119,925 – – – 119,925 – 1,132,021 – – – – 119,925 – – 2,693,276 2022 Performance Shares PS15 – 75,565 – – 75,565 – 683,065 – – – – 75,565 – – 1,414,371 2022 MSR Matching Shares – 607 – 607 – 7,062 – – – – – – – – – 2023 Performance Shares PS16 94,147 846,750 – – 94,147 – – 1,546,376 Total 4,410,387 4,972,321 2,693,671 5,654,023 R Bardien 2019 Performance Shares PS12 69,117 46,308 – 115,425 – 1,277,315 – 2020 MSR Matching Shares 4,844 – – – 4,844 – 51,666 – – – 4,844 – 68,168 – – 2020 Performance Shares PS13 63,597 – – – 63,597 – 1,100,651 39,595 – – 103,192 – 939,043 – – 2021 Performance Shares PS14 54,852 – – – 54,852 – 517,771 – – – – 54,852 – – 1,231,866 2021 MSR Matching Shares 4,848 – – – 4,848 – 51,709 – – – 4,848 – 68,224 – – 2022 Performance Shares PS15 – 35,198 – – 35,198 – 318,170 – – – – 35,198 – – 658,811 2023 Performance Shares PS16 – – – – – – – 45,323 407,631 – – 45,323 – – 744,436 2023 MSR Matching Shares – – – – – – – 3,464 48,072 – 3,464 – 48,747 – – Total 1,277,315 2,039,967 1,124,182 2,635,113 Leadership report Governance review Remuneration Report Administration and corporate information Gold Fields GRR-64
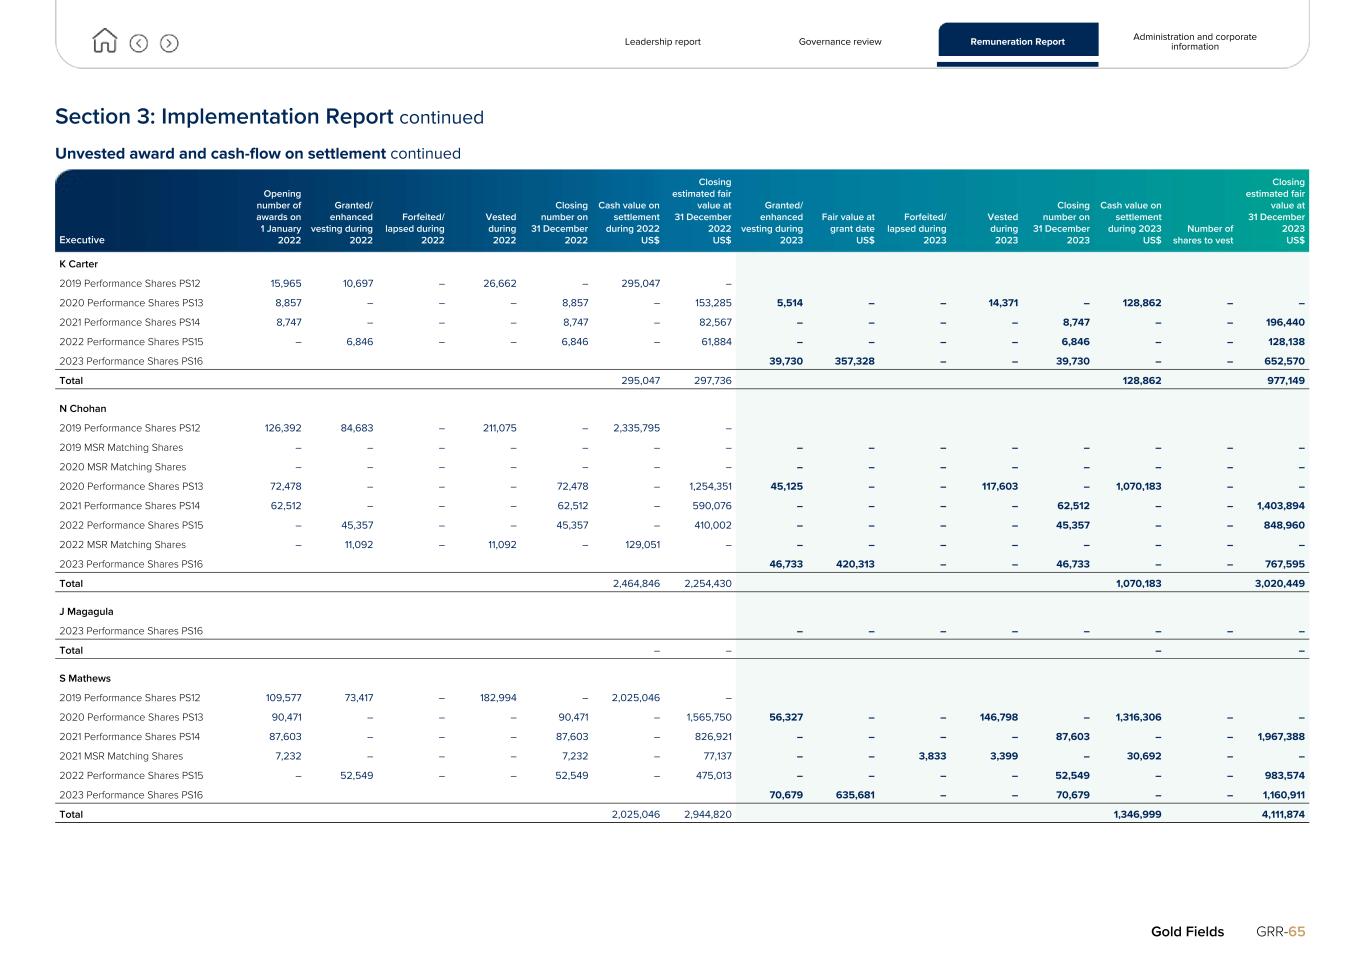
Section 3: Implementation Report continued Unvested award and cash-flow on settlement continued Executive Opening number of awards on 1 January 2022 Granted/ enhanced vesting during 2022 Forfeited/ lapsed during 2022 Vested during 2022 Closing number on 31 December 2022 Cash value on settlement during 2022 US$ Closing estimated fair value at 31 December 2022 US$ Granted/ enhanced vesting during 2023 Fair value at grant date US$ Forfeited/ lapsed during 2023 Vested during 2023 Closing number on 31 December 2023 Cash value on settlement during 2023 US$ Number of shares to vest Closing estimated fair value at 31 December 2023 US$ K Carter 2019 Performance Shares PS12 15,965 10,697 – 26,662 – 295,047 – 2020 Performance Shares PS13 8,857 – – – 8,857 – 153,285 5,514 – – 14,371 – 128,862 – – 2021 Performance Shares PS14 8,747 – – – 8,747 – 82,567 – – – – 8,747 – – 196,440 2022 Performance Shares PS15 – 6,846 – – 6,846 – 61,884 – – – – 6,846 – – 128,138 2023 Performance Shares PS16 39,730 357,328 – – 39,730 – – 652,570 Total 295,047 297,736 128,862 977,149 N Chohan 2019 Performance Shares PS12 126,392 84,683 – 211,075 – 2,335,795 – 2019 MSR Matching Shares – – – – – – – – – – – – – – – 2020 MSR Matching Shares – – – – – – – – – – – – – – – 2020 Performance Shares PS13 72,478 – – – 72,478 – 1,254,351 45,125 – – 117,603 – 1,070,183 – – 2021 Performance Shares PS14 62,512 – – – 62,512 – 590,076 – – – – 62,512 – – 1,403,894 2022 Performance Shares PS15 – 45,357 – – 45,357 – 410,002 – – – – 45,357 – – 848,960 2022 MSR Matching Shares – 11,092 – 11,092 – 129,051 – – – – – – – – – 2023 Performance Shares PS16 46,733 420,313 – – 46,733 – – 767,595 Total 2,464,846 2,254,430 1,070,183 3,020,449 J Magagula 2023 Performance Shares PS16 – – – – – – – – Total – – – – S Mathews 2019 Performance Shares PS12 109,577 73,417 – 182,994 – 2,025,046 – 2020 Performance Shares PS13 90,471 – – – 90,471 – 1,565,750 56,327 – – 146,798 – 1,316,306 – – 2021 Performance Shares PS14 87,603 – – – 87,603 – 826,921 – – – – 87,603 – – 1,967,388 2021 MSR Matching Shares 7,232 – – – 7,232 – 77,137 – – 3,833 3,399 – 30,692 – – 2022 Performance Shares PS15 – 52,549 – – 52,549 – 475,013 – – – – 52,549 – – 983,574 2023 Performance Shares PS16 70,679 635,681 – – 70,679 – – 1,160,911 Total 2,025,046 2,944,820 1,346,999 4,111,874 Leadership report Governance review Remuneration Report Administration and corporate information Gold Fields GRR-65
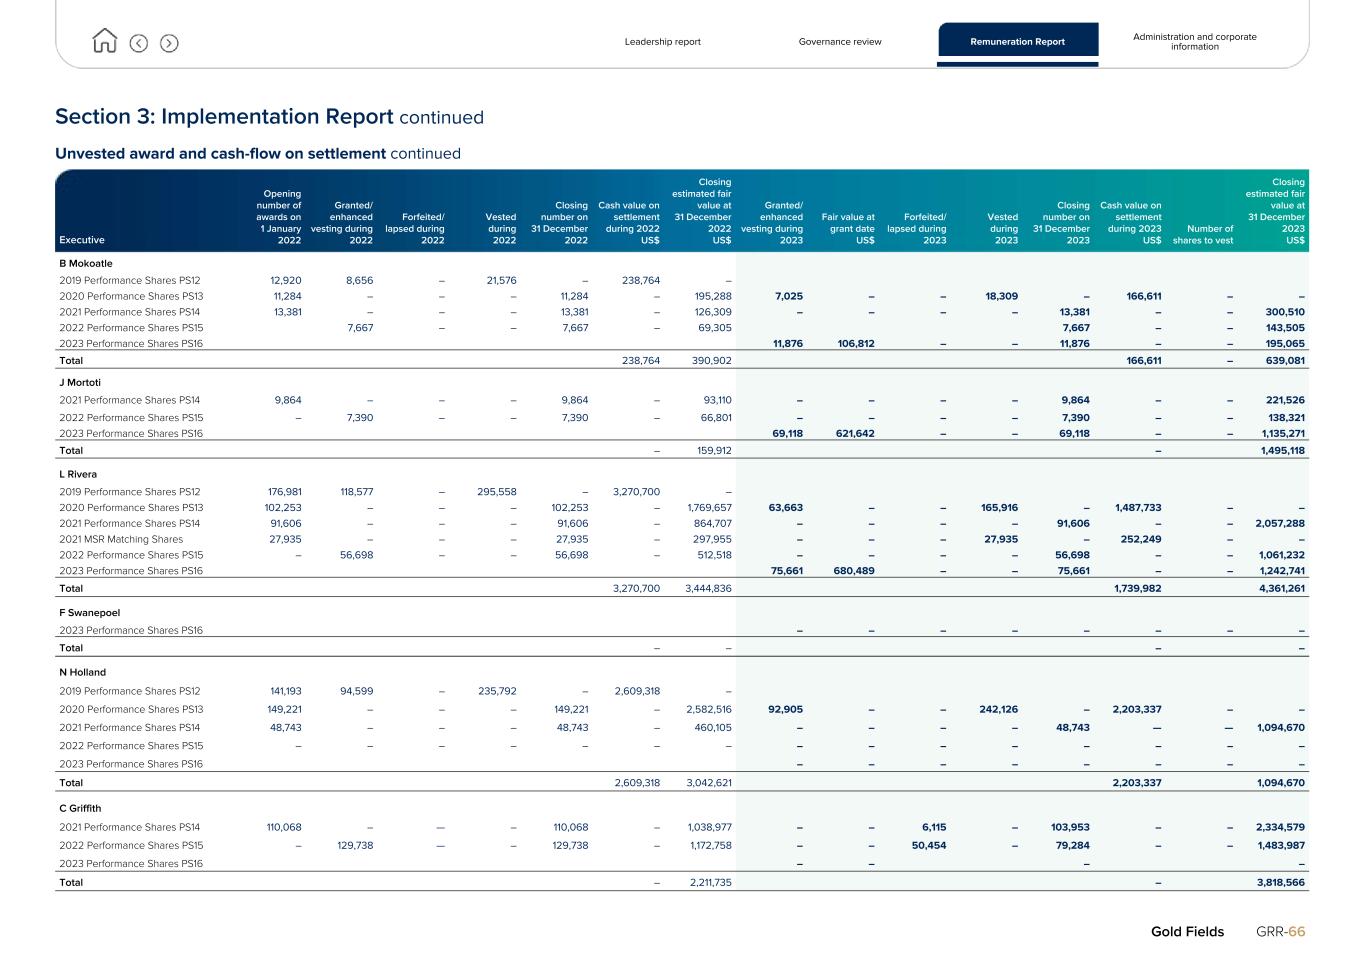
Section 3: Implementation Report continued Unvested award and cash-flow on settlement continued Executive Opening number of awards on 1 January 2022 Granted/ enhanced vesting during 2022 Forfeited/ lapsed during 2022 Vested during 2022 Closing number on 31 December 2022 Cash value on settlement during 2022 US$ Closing estimated fair value at 31 December 2022 US$ Granted/ enhanced vesting during 2023 Fair value at grant date US$ Forfeited/ lapsed during 2023 Vested during 2023 Closing number on 31 December 2023 Cash value on settlement during 2023 US$ Number of shares to vest Closing estimated fair value at 31 December 2023 US$ B Mokoatle 2019 Performance Shares PS12 12,920 8,656 – 21,576 – 238,764 – 2020 Performance Shares PS13 11,284 – – – 11,284 – 195,288 7,025 – – 18,309 – 166,611 – – 2021 Performance Shares PS14 13,381 – – – 13,381 – 126,309 – – – – 13,381 – – 300,510 2022 Performance Shares PS15 7,667 – – 7,667 – 69,305 7,667 – – 143,505 2023 Performance Shares PS16 11,876 106,812 – – 11,876 – – 195,065 Total 238,764 390,902 166,611 – 639,081 J Mortoti 2021 Performance Shares PS14 9,864 – – – 9,864 – 93,110 – – – – 9,864 – – 221,526 2022 Performance Shares PS15 – 7,390 – – 7,390 – 66,801 – – – – 7,390 – – 138,321 2023 Performance Shares PS16 69,118 621,642 – – 69,118 – – 1,135,271 Total – 159,912 – 1,495,118 L Rivera 2019 Performance Shares PS12 176,981 118,577 – 295,558 – 3,270,700 – 2020 Performance Shares PS13 102,253 – – – 102,253 – 1,769,657 63,663 – – 165,916 – 1,487,733 – – 2021 Performance Shares PS14 91,606 – – – 91,606 – 864,707 – – – – 91,606 – – 2,057,288 2021 MSR Matching Shares 27,935 – – – 27,935 – 297,955 – – – 27,935 – 252,249 – – 2022 Performance Shares PS15 – 56,698 – – 56,698 – 512,518 – – – – 56,698 – – 1,061,232 2023 Performance Shares PS16 75,661 680,489 – – 75,661 – – 1,242,741 Total 3,270,700 3,444,836 1,739,982 4,361,261 F Swanepoel 2023 Performance Shares PS16 – – – – – – – – Total – – – – N Holland 2019 Performance Shares PS12 141,193 94,599 – 235,792 – 2,609,318 – 2020 Performance Shares PS13 149,221 – – – 149,221 – 2,582,516 92,905 – – 242,126 – 2,203,337 – – 2021 Performance Shares PS14 48,743 – – – 48,743 – 460,105 – – – – 48,743 — — 1,094,670 2022 Performance Shares PS15 – – – – – – – – – – – – – – – 2023 Performance Shares PS16 – – – – – – – – Total 2,609,318 3,042,621 2,203,337 1,094,670 C Griffith 2021 Performance Shares PS14 110,068 – — – 110,068 – 1,038,977 – – 6,115 – 103,953 – – 2,334,579 2022 Performance Shares PS15 – 129,738 — – 129,738 – 1,172,758 – – 50,454 – 79,284 – – 1,483,987 2023 Performance Shares PS16 – – – – Total – 2,211,735 – 3,818,566 Leadership report Governance review Remuneration Report Administration and corporate information Gold Fields GRR-66
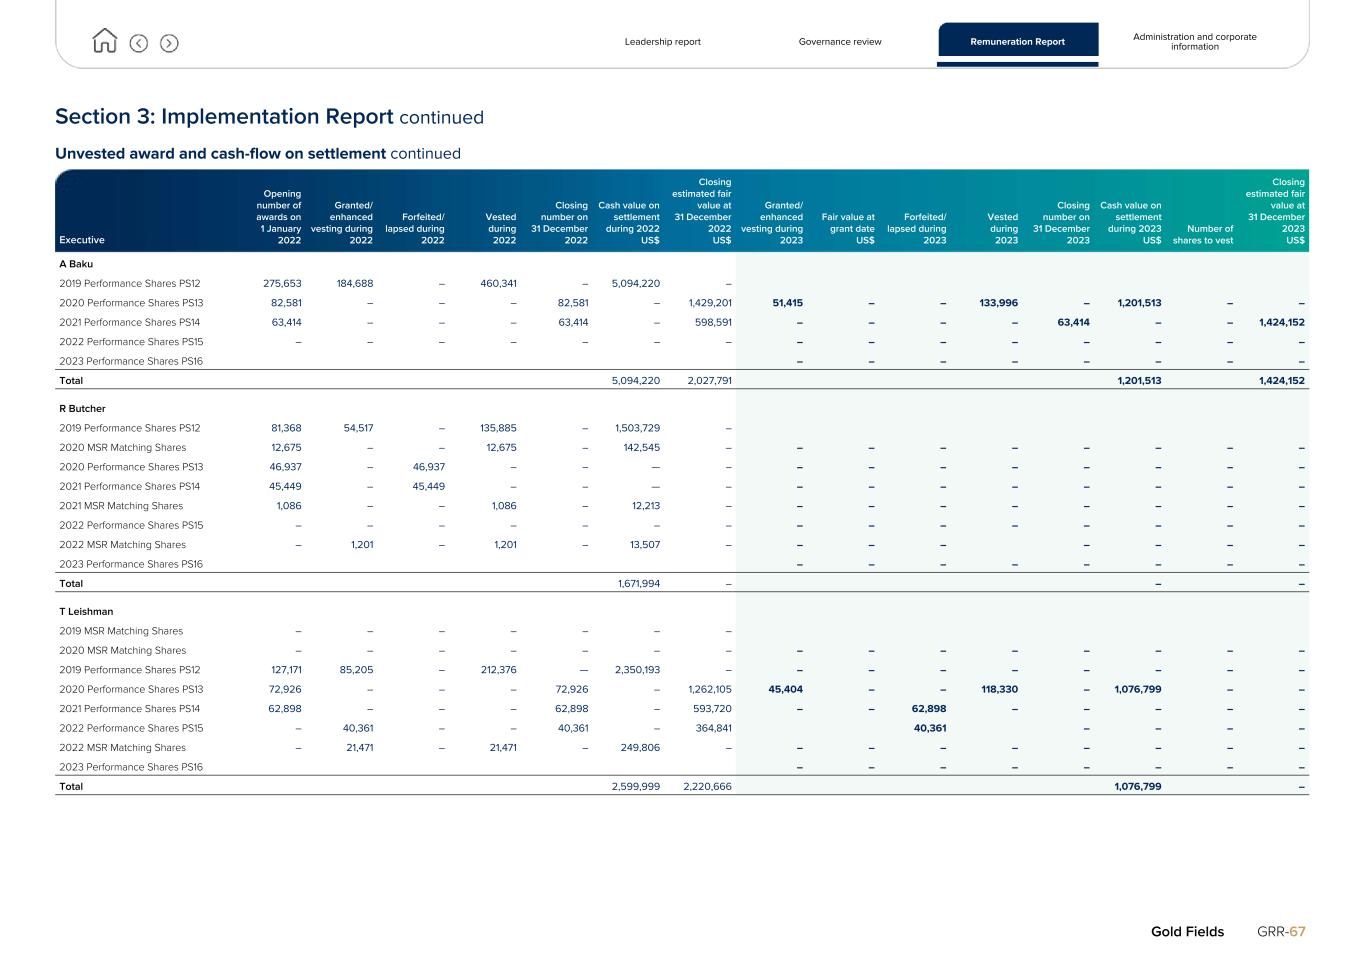
Section 3: Implementation Report continued Unvested award and cash-flow on settlement continued Executive Opening number of awards on 1 January 2022 Granted/ enhanced vesting during 2022 Forfeited/ lapsed during 2022 Vested during 2022 Closing number on 31 December 2022 Cash value on settlement during 2022 US$ Closing estimated fair value at 31 December 2022 US$ Granted/ enhanced vesting during 2023 Fair value at grant date US$ Forfeited/ lapsed during 2023 Vested during 2023 Closing number on 31 December 2023 Cash value on settlement during 2023 US$ Number of shares to vest Closing estimated fair value at 31 December 2023 US$ A Baku 2019 Performance Shares PS12 275,653 184,688 – 460,341 – 5,094,220 – 2020 Performance Shares PS13 82,581 – – – 82,581 – 1,429,201 51,415 – – 133,996 – 1,201,513 – – 2021 Performance Shares PS14 63,414 – – – 63,414 – 598,591 – – – – 63,414 – – 1,424,152 2022 Performance Shares PS15 – – – – – – – – – – – – – – – 2023 Performance Shares PS16 – – – – – – – – Total 5,094,220 2,027,791 1,201,513 1,424,152 R Butcher 2019 Performance Shares PS12 81,368 54,517 – 135,885 – 1,503,729 – 2020 MSR Matching Shares 12,675 – – 12,675 – 142,545 – – – – – – – – – 2020 Performance Shares PS13 46,937 – 46,937 – – — – – – – – – – – – 2021 Performance Shares PS14 45,449 – 45,449 – – — – – – – – – – – – 2021 MSR Matching Shares 1,086 – – 1,086 – 12,213 – – – – – – – – – 2022 Performance Shares PS15 – – – – – – – – – – – – – – – 2022 MSR Matching Shares – 1,201 – 1,201 – 13,507 – – – – – – – – 2023 Performance Shares PS16 – – – – – – – – Total 1,671,994 – – – T Leishman 2019 MSR Matching Shares – – – – – – – 2020 MSR Matching Shares – – – – – – – – – – – – – – – 2019 Performance Shares PS12 127,171 85,205 – 212,376 — 2,350,193 – – – – – – – – – 2020 Performance Shares PS13 72,926 – – – 72,926 – 1,262,105 45,404 – – 118,330 – 1,076,799 – – 2021 Performance Shares PS14 62,898 – – – 62,898 – 593,720 – – 62,898 – – – – – 2022 Performance Shares PS15 – 40,361 – – 40,361 – 364,841 40,361 – – – – 2022 MSR Matching Shares – 21,471 – 21,471 – 249,806 – – – – – – – – – 2023 Performance Shares PS16 – – – – – – – – Total 2,599,999 2,220,666 1,076,799 – Leadership report Governance review Remuneration Report Administration and corporate information Gold Fields GRR-67
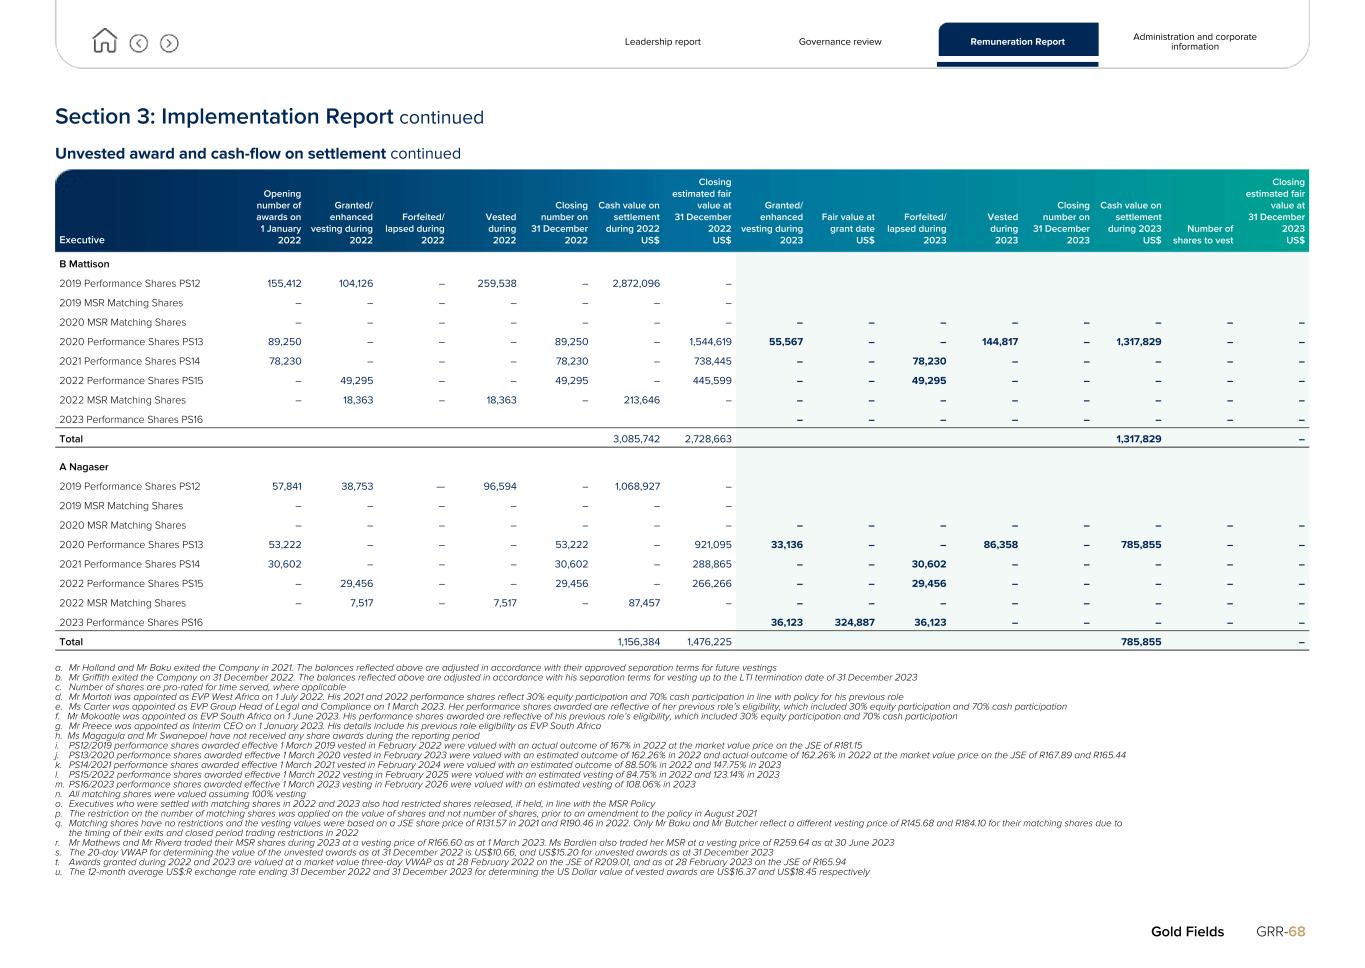
Section 3: Implementation Report continued Unvested award and cash-flow on settlement continued Executive Opening number of awards on 1 January 2022 Granted/ enhanced vesting during 2022 Forfeited/ lapsed during 2022 Vested during 2022 Closing number on 31 December 2022 Cash value on settlement during 2022 US$ Closing estimated fair value at 31 December 2022 US$ Granted/ enhanced vesting during 2023 Fair value at grant date US$ Forfeited/ lapsed during 2023 Vested during 2023 Closing number on 31 December 2023 Cash value on settlement during 2023 US$ Number of shares to vest Closing estimated fair value at 31 December 2023 US$ B Mattison 2019 Performance Shares PS12 155,412 104,126 – 259,538 – 2,872,096 – 2019 MSR Matching Shares – – – – – – – 2020 MSR Matching Shares – – – – – – – – – – – – – – – 2020 Performance Shares PS13 89,250 – – – 89,250 – 1,544,619 55,567 – – 144,817 – 1,317,829 – – 2021 Performance Shares PS14 78,230 – – – 78,230 – 738,445 – – 78,230 – – – – – 2022 Performance Shares PS15 – 49,295 – – 49,295 – 445,599 – – 49,295 – – – – – 2022 MSR Matching Shares – 18,363 – 18,363 – 213,646 – – – – – – – – – 2023 Performance Shares PS16 – – – – – – – – Total 3,085,742 2,728,663 1,317,829 – A Nagaser 2019 Performance Shares PS12 57,841 38,753 — 96,594 – 1,068,927 – 2019 MSR Matching Shares – – – – – – – 2020 MSR Matching Shares – – – – – – – – – – – – – – – 2020 Performance Shares PS13 53,222 – – – 53,222 – 921,095 33,136 – – 86,358 – 785,855 – – 2021 Performance Shares PS14 30,602 – – – 30,602 – 288,865 – – 30,602 – – – – – 2022 Performance Shares PS15 – 29,456 – – 29,456 – 266,266 – – 29,456 – – – – – 2022 MSR Matching Shares – 7,517 – 7,517 – 87,457 – – – – – – – – – 2023 Performance Shares PS16 36,123 324,887 36,123 – – – – – Total 1,156,384 1,476,225 785,855 – a. Mr Holland and Mr Baku exited the Company in 2021. The balances reflected above are adjusted in accordance with their approved separation terms for future vestings b. Mr Griffith exited the Company on 31 December 2022. The balances reflected above are adjusted in accordance with his separation terms for vesting up to the LTI termination date of 31 December 2023 c. Number of shares are pro-rated for time served, where applicable d. Mr Mortoti was appointed as EVP West Africa on 1 July 2022. His 2021 and 2022 performance shares reflect 30% equity participation and 70% cash participation in line with policy for his previous role e. Ms Carter was appointed as EVP Group Head of Legal and Compliance on 1 March 2023. Her performance shares awarded are reflective of her previous role’s eligibility, which included 30% equity participation and 70% cash participation f. Mr Mokoatle was appointed as EVP South Africa on 1 June 2023. His performance shares awarded are reflective of his previous role’s eligibility, which included 30% equity participation and 70% cash participation g. Mr Preece was appointed as Interim CEO on 1 January 2023. His details include his previous role eligibility as EVP South Africa h. Ms Magagula and Mr Swanepoel have not received any share awards during the reporting period i. PS12/2019 performance shares awarded effective 1 March 2019 vested in February 2022 were valued with an actual outcome of 167% in 2022 at the market value price on the JSE of R181.15 j. PS13/2020 performance shares awarded effective 1 March 2020 vested in February 2023 were valued with an estimated outcome of 162.26% in 2022 and actual outcome of 162.26% in 2022 at the market value price on the JSE of R167.89 and R165.44 k. PS14/2021 performance shares awarded effective 1 March 2021 vested in February 2024 were valued with an estimated outcome of 88.50% in 2022 and 147.75% in 2023 l. PS15/2022 performance shares awarded effective 1 March 2022 vesting in February 2025 were valued with an estimated vesting of 84.75% in 2022 and 123.14% in 2023 m. PS16/2023 performance shares awarded effective 1 March 2023 vesting in February 2026 were valued with an estimated vesting of 108.06% in 2023 n. All matching shares were valued assuming 100% vesting o. Executives who were settled with matching shares in 2022 and 2023 also had restricted shares released, if held, in line with the MSR Policy p. The restriction on the number of matching shares was applied on the value of shares and not number of shares, prior to an amendment to the policy in August 2021 q. Matching shares have no restrictions and the vesting values were based on a JSE share price of R131.57 in 2021 and R190.46 in 2022. Only Mr Baku and Mr Butcher reflect a different vesting price of R145.68 and R184.10 for their matching shares due to the timing of their exits and closed period trading restrictions in 2022 r. Mr Mathews and Mr Rivera traded their MSR shares during 2023 at a vesting price of R166.60 as at 1 March 2023. Ms Bardien also traded her MSR at a vesting price of R259.64 as at 30 June 2023 s. The 20-day VWAP for determining the value of the unvested awards as at 31 December 2022 is US$10.66, and US$15.20 for unvested awards as at 31 December 2023 t. Awards granted during 2022 and 2023 are valued at a market value three-day VWAP as at 28 February 2022 on the JSE of R209.01, and as at 28 February 2023 on the JSE of R165.94 u. The 12-month average US$:R exchange rate ending 31 December 2022 and 31 December 2023 for determining the US Dollar value of vested awards are US$16.37 and US$18.45 respectively Leadership report Governance review Remuneration Report Administration and corporate information Gold Fields GRR-68
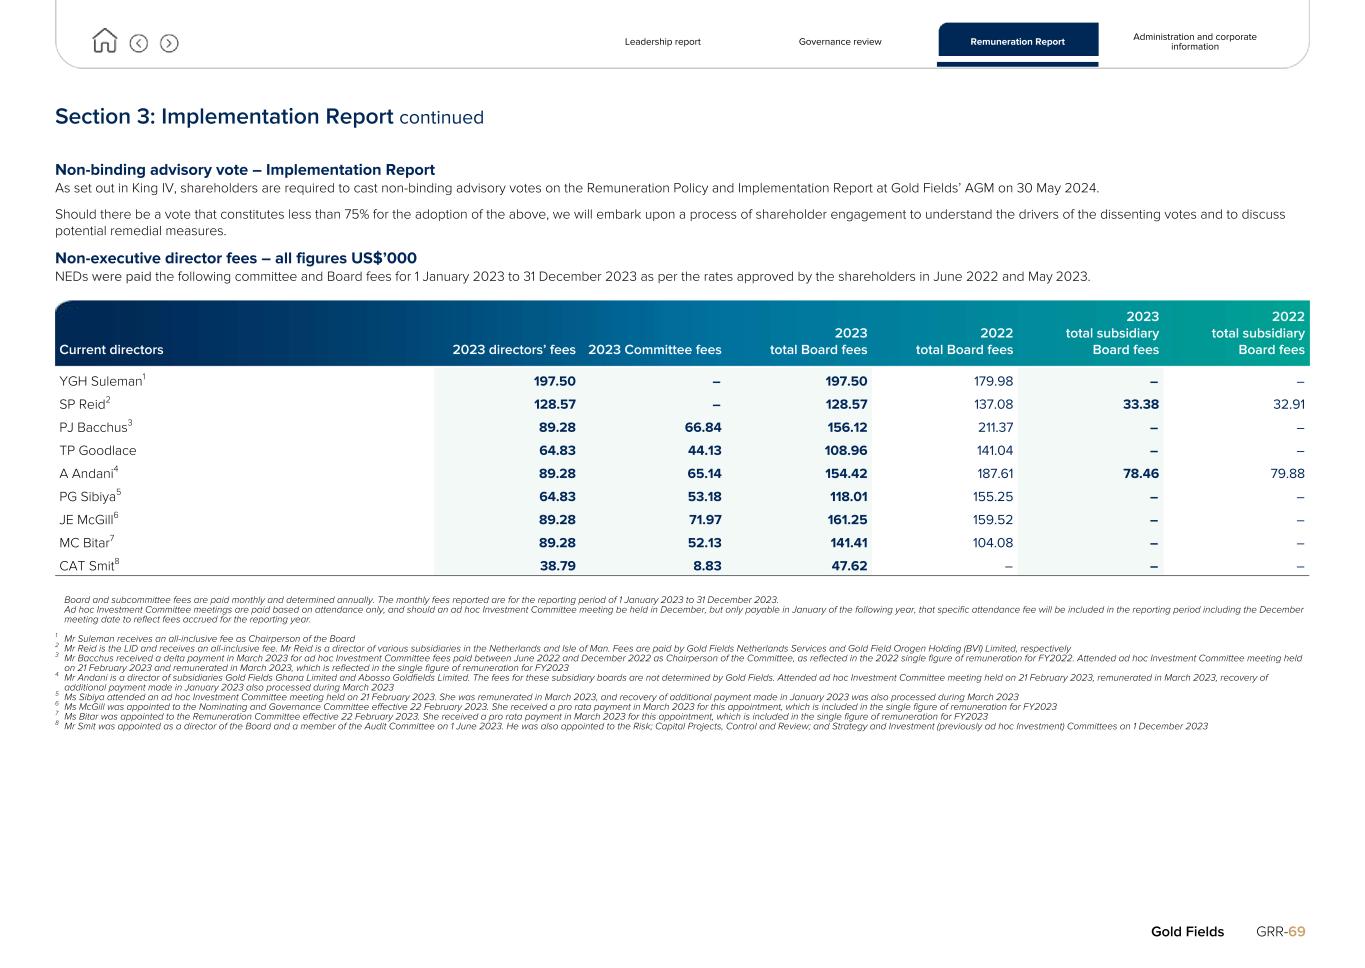
Section 3: Implementation Report continued Non-binding advisory vote – Implementation Report As set out in King IV, shareholders are required to cast non-binding advisory votes on the Remuneration Policy and Implementation Report at Gold Fields’ AGM on 30 May 2024. Should there be a vote that constitutes less than 75% for the adoption of the above, we will embark upon a process of shareholder engagement to understand the drivers of the dissenting votes and to discuss potential remedial measures. Non-executive director fees – all figures US$’000 NEDs were paid the following committee and Board fees for 1 January 2023 to 31 December 2023 as per the rates approved by the shareholders in June 2022 and May 2023. Current directors 2023 directors’ fees 2023 Committee fees 2023 total Board fees 2022 total Board fees 2023 total subsidiary Board fees 2022 total subsidiary Board fees YGH Suleman1 197.50 – 197.50 179.98 – – SP Reid2 128.57 – 128.57 137.08 33.38 32.91 PJ Bacchus3 89.28 66.84 156.12 211.37 – – TP Goodlace 64.83 44.13 108.96 141.04 – – A Andani4 89.28 65.14 154.42 187.61 78.46 79.88 PG Sibiya5 64.83 53.18 118.01 155.25 – – JE McGill6 89.28 71.97 161.25 159.52 – – MC Bitar7 89.28 52.13 141.41 104.08 – – CAT Smit8 38.79 8.83 47.62 – – – Board and subcommittee fees are paid monthly and determined annually. The monthly fees reported are for the reporting period of 1 January 2023 to 31 December 2023. Ad hoc Investment Committee meetings are paid based on attendance only, and should an ad hoc Investment Committee meeting be held in December, but only payable in January of the following year, that specific attendance fee will be included in the reporting period including the December meeting date to reflect fees accrued for the reporting year. 1 Mr Suleman receives an all-inclusive fee as Chairperson of the Board 2 Mr Reid is the LID and receives an all-inclusive fee. Mr Reid is a director of various subsidiaries in the Netherlands and Isle of Man. Fees are paid by Gold Fields Netherlands Services and Gold Field Orogen Holding (BVI) Limited, respectively 3 Mr Bacchus received a delta payment in March 2023 for ad hoc Investment Committee fees paid between June 2022 and December 2022 as Chairperson of the Committee, as reflected in the 2022 single figure of remuneration for FY2022. Attended ad hoc Investment Committee meeting held on 21 February 2023 and remunerated in March 2023, which is reflected in the single figure of remuneration for FY2023 4 Mr Andani is a director of subsidiaries Gold Fields Ghana Limited and Abosso Goldfields Limited. The fees for these subsidiary boards are not determined by Gold Fields. Attended ad hoc Investment Committee meeting held on 21 February 2023, remunerated in March 2023, recovery of additional payment made in January 2023 also processed during March 2023 5 Ms Sibiya attended an ad hoc Investment Committee meeting held on 21 February 2023. She was remunerated in March 2023, and recovery of additional payment made in January 2023 was also processed during March 2023 6 Ms McGill was appointed to the Nominating and Governance Committee effective 22 February 2023. She received a pro rata payment in March 2023 for this appointment, which is included in the single figure of remuneration for FY2023 7 Ms Bitar was appointed to the Remuneration Committee effective 22 February 2023. She received a pro rata payment in March 2023 for this appointment, which is included in the single figure of remuneration for FY2023 8 Mr Smit was appointed as a director of the Board and a member of the Audit Committee on 1 June 2023. He was also appointed to the Risk; Capital Projects, Control and Review; and Strategy and Investment (previously ad hoc Investment) Committees on 1 December 2023 Leadership report Governance review Remuneration Report Administration and corporate information Gold Fields GRR-69
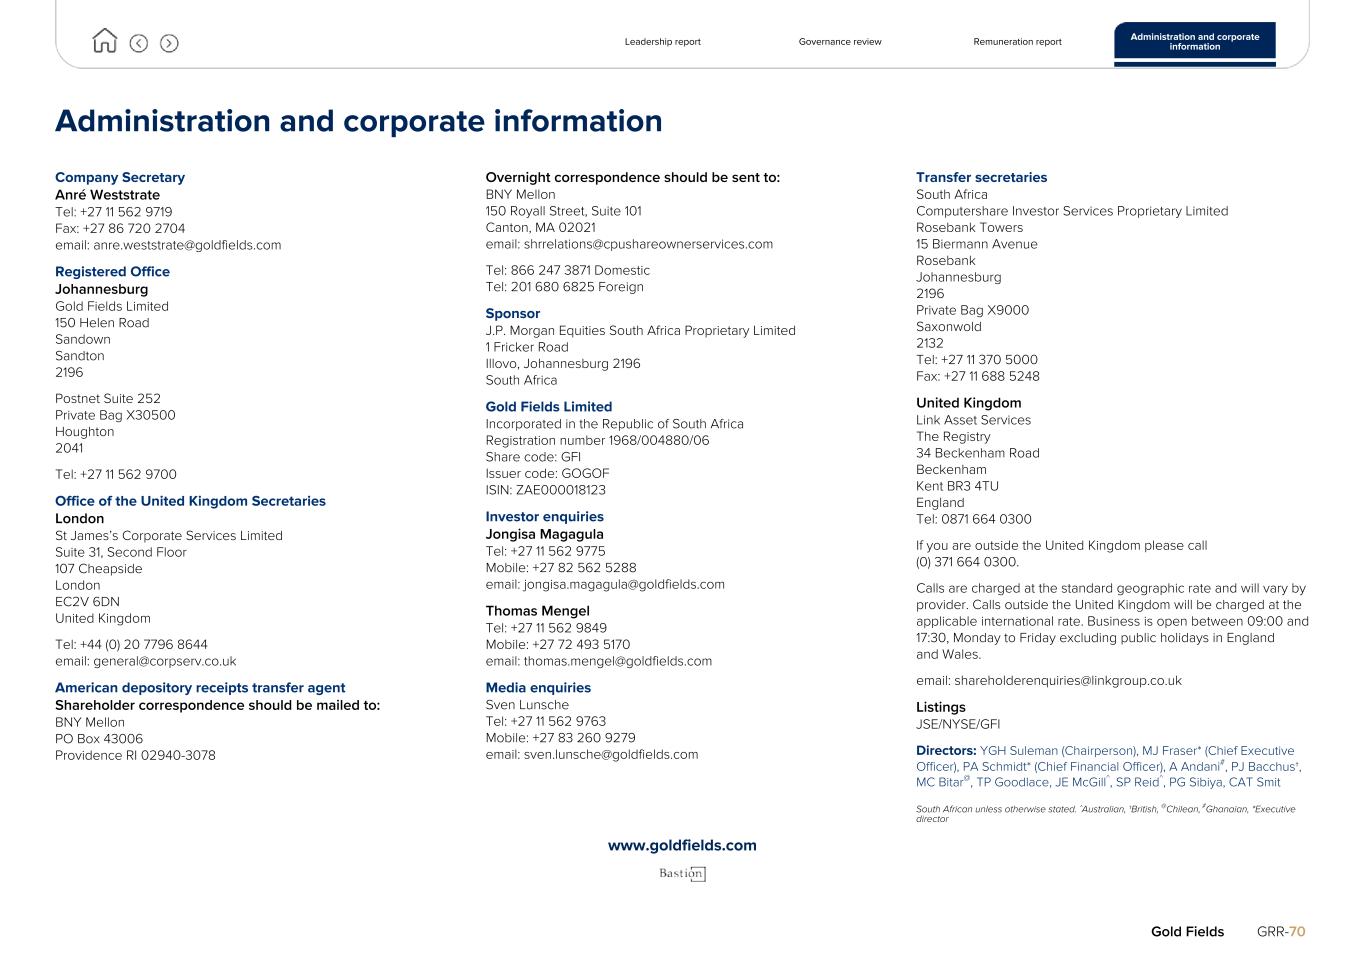
Administration and corporate information Company Secretary Anré Weststrate Tel: +27 11 562 9719 Fax: +27 86 720 2704 email: anre.weststrate@goldfields.com Registered Office Johannesburg Gold Fields Limited 150 Helen Road Sandown Sandton 2196 Postnet Suite 252 Private Bag X30500 Houghton 2041 Tel: +27 11 562 9700 Office of the United Kingdom Secretaries London St James’s Corporate Services Limited Suite 31, Second Floor 107 Cheapside London EC2V 6DN United Kingdom Tel: +44 (0) 20 7796 8644 email: general@corpserv.co.uk American depository receipts transfer agent Shareholder correspondence should be mailed to: BNY Mellon PO Box 43006 Providence RI 02940-3078 Overnight correspondence should be sent to: BNY Mellon 150 Royall Street, Suite 101 Canton, MA 02021 email: shrrelations@cpushareownerservices.com Tel: 866 247 3871 Domestic Tel: 201 680 6825 Foreign Sponsor J.P. Morgan Equities South Africa Proprietary Limited 1 Fricker Road Illovo, Johannesburg 2196 South Africa Gold Fields Limited Incorporated in the Republic of South Africa Registration number 1968/004880/06 Share code: GFI Issuer code: GOGOF ISIN: ZAE000018123 Investor enquiries Jongisa Magagula Tel: +27 11 562 9775 Mobile: +27 82 562 5288 email: jongisa.magagula@goldfields.com Thomas Mengel Tel: +27 11 562 9849 Mobile: +27 72 493 5170 email: thomas.mengel@goldfields.com Media enquiries Sven Lunsche Tel: +27 11 562 9763 Mobile: +27 83 260 9279 email: sven.lunsche@goldfields.com Transfer secretaries South Africa Computershare Investor Services Proprietary Limited Rosebank Towers 15 Biermann Avenue Rosebank Johannesburg 2196 Private Bag X9000 Saxonwold 2132 Tel: +27 11 370 5000 Fax: +27 11 688 5248 United Kingdom Link Asset Services The Registry 34 Beckenham Road Beckenham Kent BR3 4TU England Tel: 0871 664 0300 If you are outside the United Kingdom please call (0) 371 664 0300. Calls are charged at the standard geographic rate and will vary by provider. Calls outside the United Kingdom will be charged at the applicable international rate. Business is open between 09:00 and 17:30, Monday to Friday excluding public holidays in England and Wales. email: shareholderenquiries@linkgroup.co.uk Listings JSE/NYSE/GFI Directors: YGH Suleman (Chairperson), MJ Fraser* (Chief Executive Officer), PA Schmidt* (Chief Financial Officer), A Andani#, PJ Bacchus†, MC Bitar@, TP Goodlace, JE McGill^, SP Reid^, PG Sibiya, CAT Smit South African unless otherwise stated. ˆAustralian, †British, @Chilean, #Ghanaian, *Executive director www.goldfields.com Leadership report Governance review Remuneration report Administration and corporate information Gold Fields GRR-70

Creating enduring value beyond mining
Gold Fields Limited Climate Change Report 2023 Creating enduring value beyond mining Gold Fields CCR-1
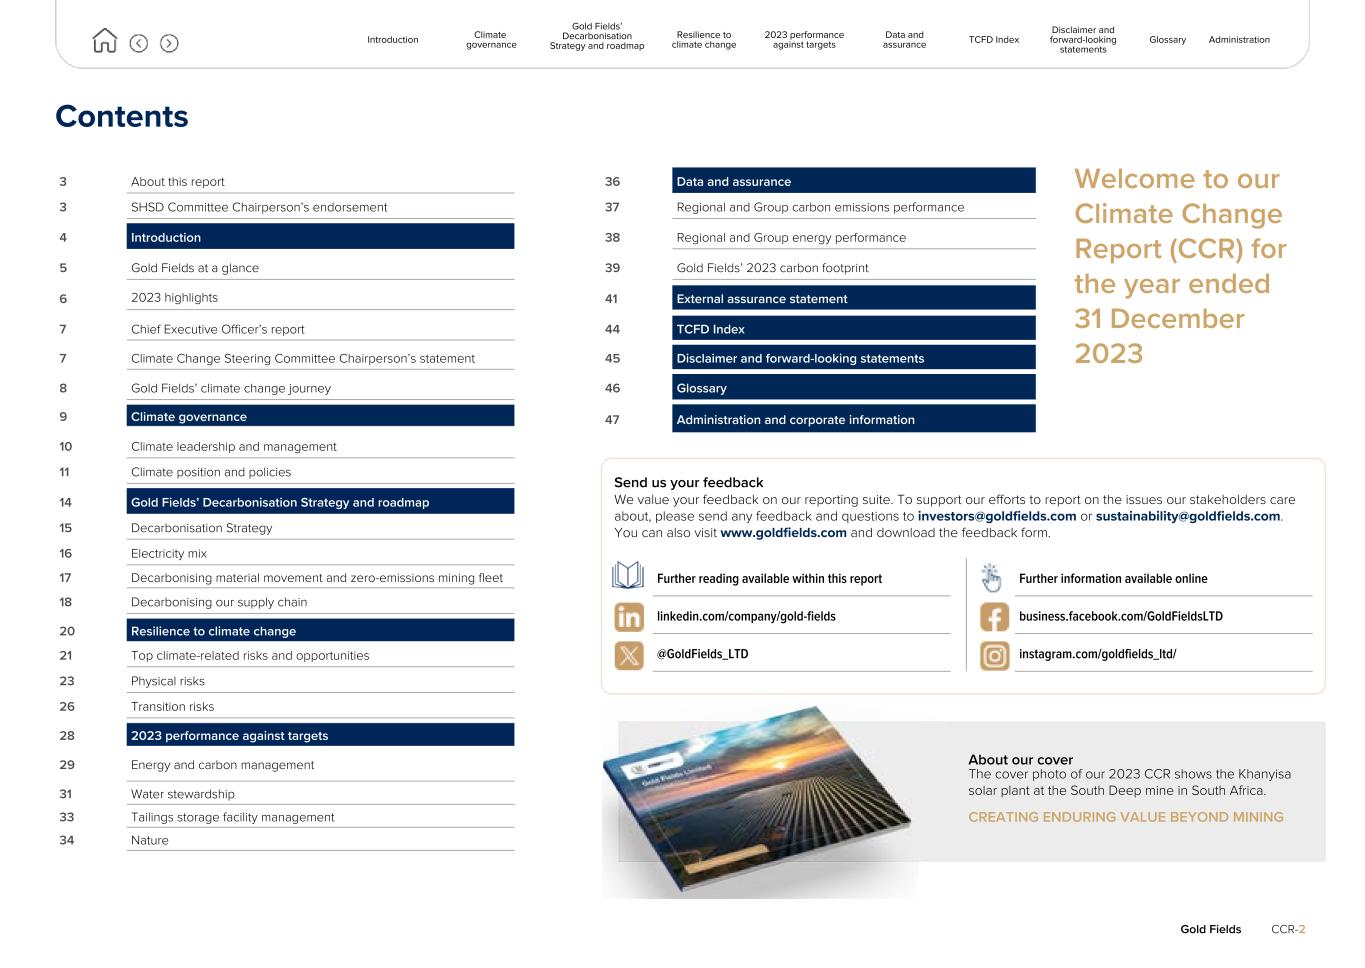
Contents 3 About this report 36 Data and assurance 3 SHSD Committee Chairperson’s endorsement 37 Regional and Group carbon emissions performance 4 Introduction 38 Regional and Group energy performance 5 Gold Fields at a glance 39 Gold Fields’ 2023 carbon footprint 6 2023 highlights 41 External assurance statement 7 Chief Executive Officer’s report 44 TCFD Index 7 Climate Change Steering Committee Chairperson’s statement 45 Disclaimer and forward-looking statements 8 Gold Fields’ climate change journey 46 Glossary 9 Climate governance 47 Administration and corporate information 10 Climate leadership and management 11 Climate position and policies Send us your feedback We value your feedback on our reporting suite. To support our efforts to report on the issues our stakeholders care about, please send any feedback and questions to investors@goldfields.com or sustainability@goldfields.com. You can also visit www.goldfields.com and download the feedback form. 14 Gold Fields’ Decarbonisation Strategy and roadmap 15 Decarbonisation Strategy 16 Electricity mix 17 Decarbonising material movement and zero-emissions mining fleet 18 Decarbonising our supply chain 20 Resilience to climate change 21 Top climate-related risks and opportunities 23 Physical risks 26 Transition risks 28 2023 performance against targets 29 Energy and carbon management About our cover The cover photo of our 2023 CCR shows the Khanyisa solar plant at the South Deep mine in South Africa. CREATING ENDURING VALUE BEYOND MINING 31 Water stewardship 33 Tailings storage facility management 34 Nature Gold Fields CCR-2 Further reading available within this report Further information available online linkedin.com/company/gold-fields business.facebook.com/GoldFieldsLTD @GoldFields_LTD instagram.com/goldfields_ltd/ Introduction Climate governance Gold Fields’ Decarbonisation Strategy and roadmap Resilience to climate change 2023 performance against targets Data and assurance TCFD Index Disclaimer and forward-looking statements Glossary Administration Welcome to our Climate Change Report (CCR) for the year ended 31 December 2023
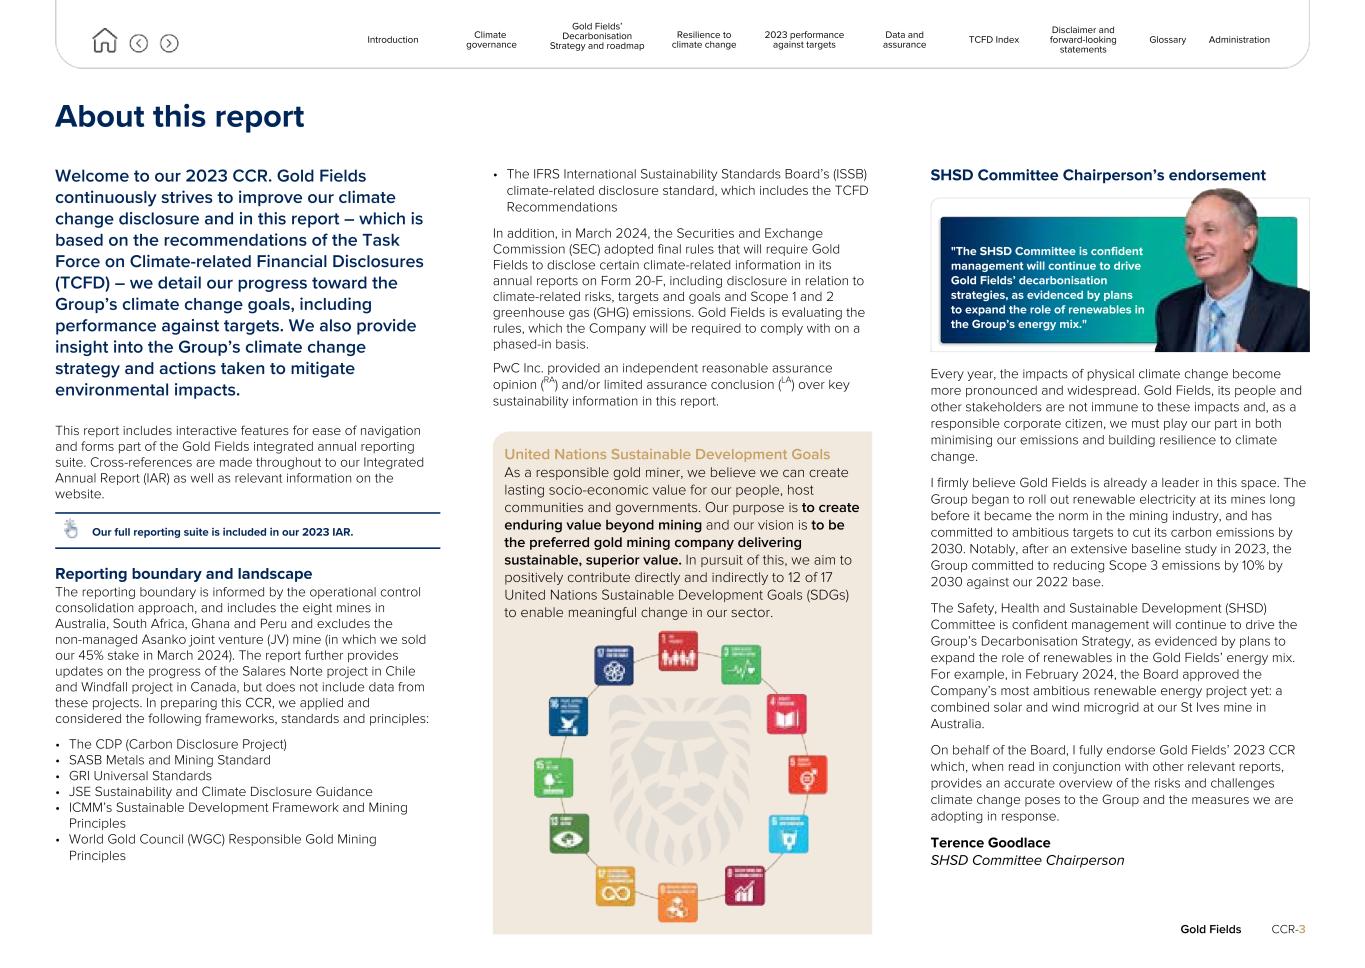
About this report Welcome to our 2023 CCR. Gold Fields continuously strives to improve our climate change disclosure and in this report – which is based on the recommendations of the Task Force on Climate-related Financial Disclosures (TCFD) – we detail our progress toward the Group’s climate change goals, including performance against targets. We also provide insight into the Group’s climate change strategy and actions taken to mitigate environmental impacts. This report includes interactive features for ease of navigation and forms part of the Gold Fields integrated annual reporting suite. Cross-references are made throughout to our Integrated Annual Report (IAR) as well as relevant information on the website. Our full reporting suite is included in our 2023 IAR. Reporting boundary and landscape The reporting boundary is informed by the operational control consolidation approach, and includes the eight mines in Australia, South Africa, Ghana and Peru and excludes the non-managed Asanko joint venture (JV) mine (in which we sold our 45% stake in March 2024). The report further provides updates on the progress of the Salares Norte project in Chile and Windfall project in Canada, but does not include data from these projects. In preparing this CCR, we applied and considered the following frameworks, standards and principles: • The CDP (Carbon Disclosure Project) • SASB Metals and Mining Standard • GRI Universal Standards • JSE Sustainability and Climate Disclosure Guidance • ICMM’s Sustainable Development Framework and Mining Principles • World Gold Council (WGC) Responsible Gold Mining Principles • The IFRS International Sustainability Standards Board’s (ISSB) climate-related disclosure standard, which includes the TCFD Recommendations In addition, in March 2024, the Securities and Exchange Commission (SEC) adopted final rules that will require Gold Fields to disclose certain climate-related information in its annual reports on Form 20-F, including disclosure in relation to climate-related risks, targets and goals and Scope 1 and 2 greenhouse gas (GHG) emissions. Gold Fields is evaluating the rules, which the Company will be required to comply with on a phased-in basis. PwC Inc. provided an independent reasonable assurance opinion (RA) and/or limited assurance conclusion (LA) over key sustainability information in this report. United Nations Sustainable Development Goals As a responsible gold miner, we believe we can create lasting socio-economic value for our people, host communities and governments. Our purpose is to create enduring value beyond mining and our vision is to be the preferred gold mining company delivering sustainable, superior value. In pursuit of this, we aim to positively contribute directly and indirectly to 12 of 17 United Nations Sustainable Development Goals (SDGs) to enable meaningful change in our sector. SHSD Committee Chairperson’s endorsement "The SHSD Committee is confident management will continue to drive Gold Fields’ decarbonisation strategies, as evidenced by plans to expand the role of renewables in the Group’s energy mix." Every year, the impacts of physical climate change become more pronounced and widespread. Gold Fields, its people and other stakeholders are not immune to these impacts and, as a responsible corporate citizen, we must play our part in both minimising our emissions and building resilience to climate change. I firmly believe Gold Fields is already a leader in this space. The Group began to roll out renewable electricity at its mines long before it became the norm in the mining industry, and has committed to ambitious targets to cut its carbon emissions by 2030. Notably, after an extensive baseline study in 2023, the Group committed to reducing Scope 3 emissions by 10% by 2030 against our 2022 base. The Safety, Health and Sustainable Development (SHSD) Committee is confident management will continue to drive the Group’s Decarbonisation Strategy, as evidenced by plans to expand the role of renewables in the Gold Fields’ energy mix. For example, in February 2024, the Board approved the Company’s most ambitious renewable energy project yet: a combined solar and wind microgrid at our St Ives mine in Australia. On behalf of the Board, I fully endorse Gold Fields’ 2023 CCR which, when read in conjunction with other relevant reports, provides an accurate overview of the risks and challenges climate change poses to the Group and the measures we are adopting in response. Terence Goodlace SHSD Committee Chairperson Gold Fields CCR-3 Introduction Climate governance Gold Fields’ Decarbonisation Strategy and roadmap Resilience to climate change 2023 performance against targets Data and assurance TCFD Index Disclaimer and forward-looking statements Glossary Administration
Introduction IN THIS SECTION 5 Gold Fields at a glance " 6 2023 highlights " 7 Chief Executive Officer’s report " 7 Climate Change Steering Committee Chairperson’s statement " 8 Gold Fields’ climate change journey " Gold Fields CCR-4 Introduction Climate governance Gold Fields’ Decarbonisation Strategy and roadmap Resilience to climate change 2023 performance against targets Data and assurance TCFD Index Disclaimer and forward-looking statements Glossary Administration One of the five wind turbines at the Agnew mine in Western Australia
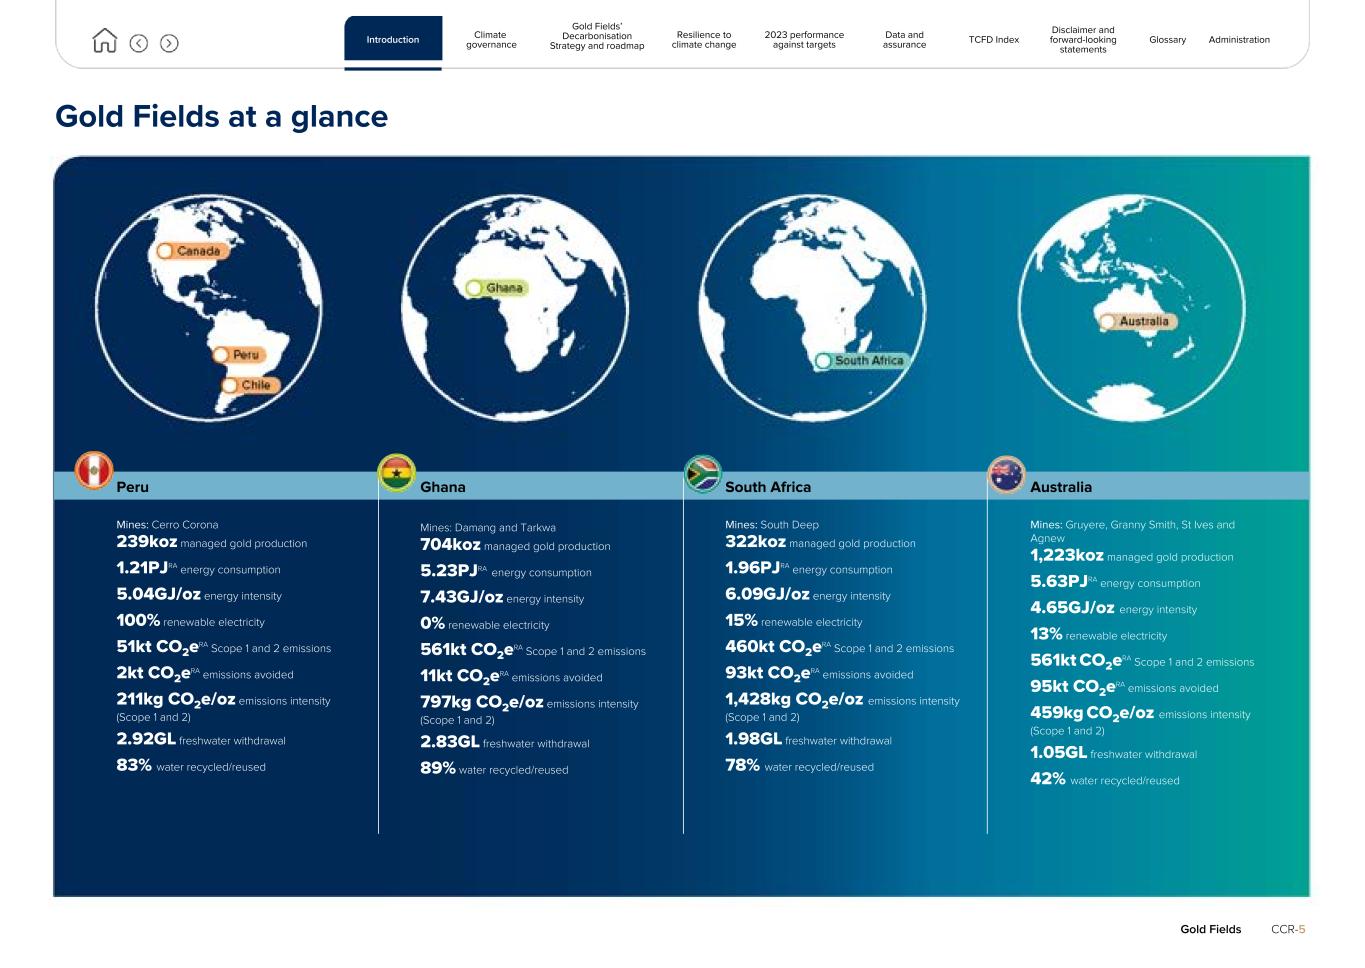
Gold Fields at a glance Peru Ghana South Africa Australia Mines: Cerro Corona 239koz managed gold production 1.21PJRA energy consumption 5.04GJ/oz energy intensity 100% renewable electricity 51kt CO2eRA Scope 1 and 2 emissions 2kt CO2eRA emissions avoided 211kg CO2e/oz emissions intensity (Scope 1 and 2) 2.92GL freshwater withdrawal 83% water recycled/reused Mines: Damang and Tarkwa 704koz managed gold production 5.23PJRA energy consumption 7.43GJ/oz energy intensity 0% renewable electricity 561kt CO2eRA Scope 1 and 2 emissions 11kt CO2eRA emissions avoided 797kg CO2e/oz emissions intensity (Scope 1 and 2) 2.83GL freshwater withdrawal 89% water recycled/reused Mines: South Deep 322koz managed gold production 1.96PJRA energy consumption 6.09GJ/oz energy intensity 15% renewable electricity 460kt CO2eRA Scope 1 and 2 emissions 93kt CO2eRA emissions avoided 1,428kg CO2e/oz emissions intensity (Scope 1 and 2) 1.98GL freshwater withdrawal 78% water recycled/reused Mines: Gruyere, Granny Smith, St Ives and Agnew 1,223koz managed gold production 5.63PJRA energy consumption 4.65GJ/oz energy intensity 13% renewable electricity 561kt CO2eRA Scope 1 and 2 emissions 95kt CO2eRA emissions avoided 459kg CO2e/oz emissions intensity (Scope 1 and 2) 1.05GL freshwater withdrawal 42% water recycled/reused Gold Fields CCR-5 Introduction Climate governance Gold Fields’ Decarbonisation Strategy and roadmap Resilience to climate change 2023 performance against targets Data and assurance TCFD Index Disclaimer and forward-looking statements Glossary Administration
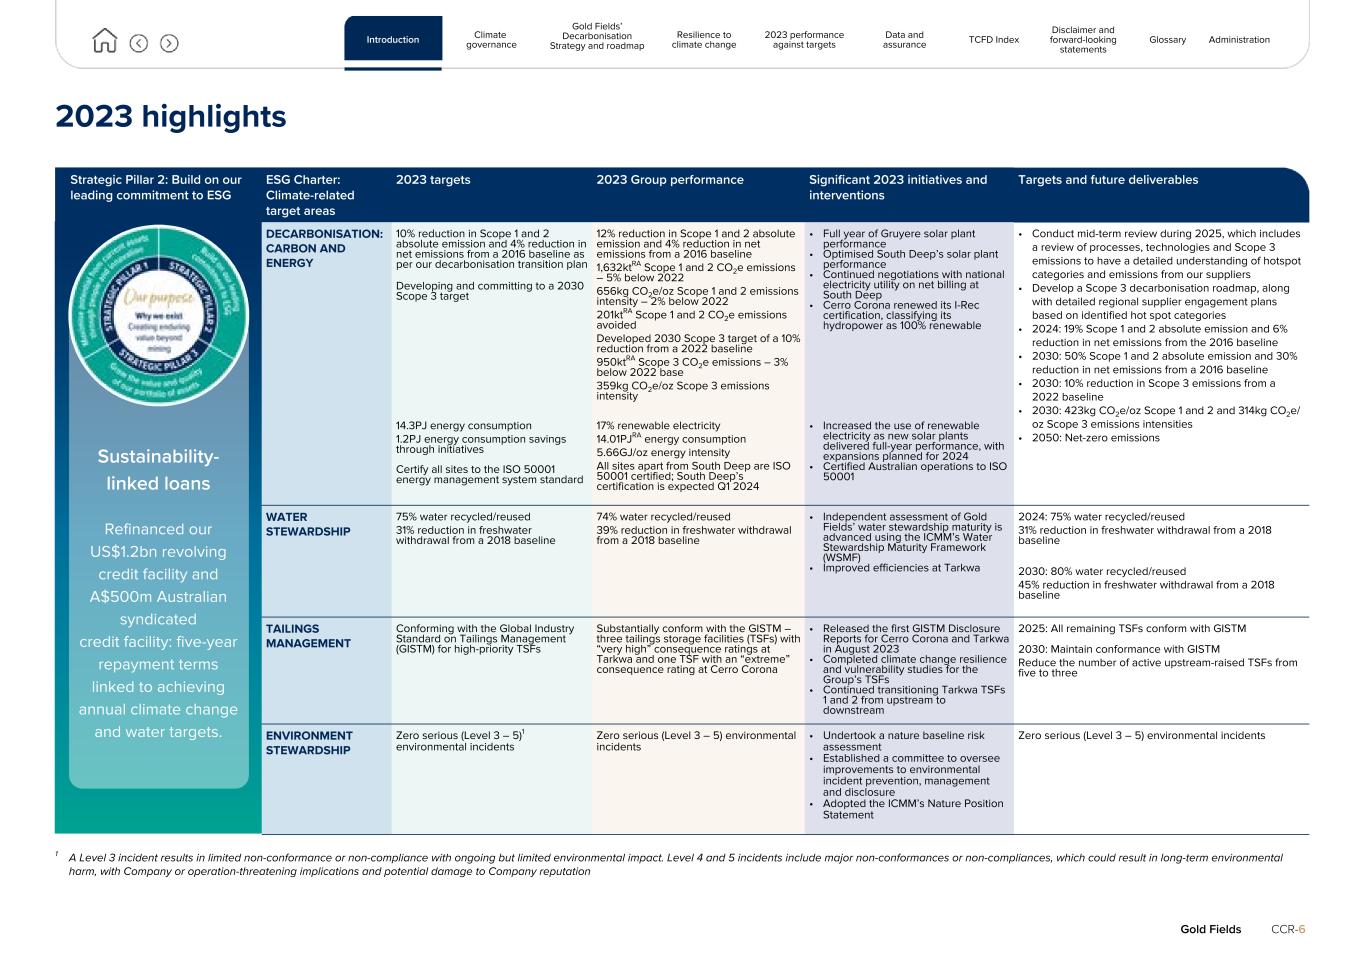
2023 highlights Strategic Pillar 2: Build on our leading commitment to ESG ESG Charter: Climate-related target areas 2023 targets 2023 Group performance Significant 2023 initiatives and interventions Targets and future deliverables DECARBONISATION: CARBON AND ENERGY 10% reduction in Scope 1 and 2 absolute emission and 4% reduction in net emissions from a 2016 baseline as per our decarbonisation transition plan 12% reduction in Scope 1 and 2 absolute emission and 4% reduction in net emissions from a 2016 baseline 1,632ktRA Scope 1 and 2 CO2e emissions – 5% below 2022 656kg CO2e/oz Scope 1 and 2 emissions intensity – 2% below 2022 201ktRA Scope 1 and 2 CO2e emissions avoided Developed 2030 Scope 3 target of a 10% reduction from a 2022 baseline 950ktRA Scope 3 CO2e emissions – 3% below 2022 base 359kg CO2e/oz Scope 3 emissions intensity • Full year of Gruyere solar plant performance • Optimised South Deep’s solar plant performance • Continued negotiations with national electricity utility on net billing at South Deep • Cerro Corona renewed its I-Rec certification, classifying its hydropower as 100% renewable • Conduct mid-term review during 2025, which includes a review of processes, technologies and Scope 3 emissions to have a detailed understanding of hotspot categories and emissions from our suppliers • Develop a Scope 3 decarbonisation roadmap, along with detailed regional supplier engagement plans based on identified hot spot categories • 2024: 19% Scope 1 and 2 absolute emission and 6% reduction in net emissions from the 2016 baseline • 2030: 50% Scope 1 and 2 absolute emission and 30% reduction in net emissions from a 2016 baseline • 2030: 10% reduction in Scope 3 emissions from a 2022 baseline • 2030: 423kg CO2e/oz Scope 1 and 2 and 314kg CO2e/ oz Scope 3 emissions intensities • 2050: Net-zero emissions Developing and committing to a 2030 Scope 3 target Sustainability- linked loans Refinanced our US$1.2bn revolving credit facility and A$500m Australian syndicated credit facility: five-year repayment terms linked to achieving annual climate change and water targets. 14.3PJ energy consumption 1.2PJ energy consumption savings through initiatives 17% renewable electricity 14.01PJRA energy consumption 5.66GJ/oz energy intensity All sites apart from South Deep are ISO 50001 certified; South Deep’s certification is expected Q1 2024 • Increased the use of renewable electricity as new solar plants delivered full-year performance, with expansions planned for 2024 • Certified Australian operations to ISO 50001 Certify all sites to the ISO 50001 energy management system standard WATER STEWARDSHIP 75% water recycled/reused 31% reduction in freshwater withdrawal from a 2018 baseline 74% water recycled/reused 39% reduction in freshwater withdrawal from a 2018 baseline • Independent assessment of Gold Fields’ water stewardship maturity is advanced using the ICMM’s Water Stewardship Maturity Framework (WSMF) • Improved efficiencies at Tarkwa 2024: 75% water recycled/reused 31% reduction in freshwater withdrawal from a 2018 baseline 2030: 80% water recycled/reused 45% reduction in freshwater withdrawal from a 2018 baseline TAILINGS MANAGEMENT Conforming with the Global Industry Standard on Tailings Management (GISTM) for high-priority TSFs Substantially conform with the GISTM – three tailings storage facilities (TSFs) with “very high” consequence ratings at Tarkwa and one TSF with an “extreme” consequence rating at Cerro Corona • Released the first GISTM Disclosure Reports for Cerro Corona and Tarkwa in August 2023 • Completed climate change resilience and vulnerability studies for the Group’s TSFs • Continued transitioning Tarkwa TSFs 1 and 2 from upstream to downstream 2025: All remaining TSFs conform with GISTM 2030: Maintain conformance with GISTM Reduce the number of active upstream-raised TSFs from five to three ENVIRONMENT STEWARDSHIP Zero serious (Level 3 – 5)1 environmental incidents Zero serious (Level 3 – 5) environmental incidents • Undertook a nature baseline risk assessment • Established a committee to oversee improvements to environmental incident prevention, management and disclosure • Adopted the ICMM’s Nature Position Statement Zero serious (Level 3 – 5) environmental incidents 1 A Level 3 incident results in limited non-conformance or non-compliance with ongoing but limited environmental impact. Level 4 and 5 incidents include major non-conformances or non-compliances, which could result in long-term environmental harm, with Company or operation-threatening implications and potential damage to Company reputation Gold Fields CCR-6 Introduction Climate governance Gold Fields’ Decarbonisation Strategy and roadmap Resilience to climate change 2023 performance against targets Data and assurance TCFD Index Disclaimer and forward-looking statements Glossary Administration
Chief Executive Officer’s report “We have a long way to go, but I am confident that, based on Gold Fields’ track record and the commitment of our people, the Company will play its part to address climate change and its impacts.” 2023 was a defining year in Gold Fields’ journey to ensure we have net-zero emissions by 2050. While this is some years away, it is vital to lay the foundations now and for Gold Fields to deliver on its 2030 ESG decarbonisation targets. Our decarbonisation journey has taken on greater importance given the position the world now finds itself in. The EU’s Copernicus Climate Change Service confirmed that the period February 2023 to January 2024 had the first year-long breach of the critical threshold of 1.5°C above pre-industrial levels. The only way to halt the rise in global temperatures is to rapidly reduce GHG emissions, and Gold Fields aims to play its part in achieving net zero by no later than 2050. It is not only the physical risks of climate change that have become more pronounced, but also the transition risks. In this regard, we are committed to respond to the dynamic reporting landscape, including the US Securities and Exchange Commission’s recent release of the climate-related disclosure final rule and the IFRS ISSB S1 and S2 standards. The Group’s journey started in 2016, driven by the need to secure our operations’ electricity supply and mitigate rapidly rising energy costs. Our investment in renewable energy microgrids proved the right solution while, at the same time, addressed one of the most critical challenges facing society: climate change. Gold Fields signed the Paris Agreement in 2015. In the five years that followed, we invested approximately A$121m (US$91m) in renewable electricity at three of our Australian mines and, in 2022, R715m (US$46m) in the 50MW Khanyisa solar plant at South Deep in South Africa. We also installed low-carbon gas turbines at our Ghanaian mines, while Cerro Corona in Peru is completely supplied by hydropower. We saw the benefits of these investments in 2023: 17% of our electricity was derived from renewable sources, compared to 13% in 2022. As a result, our Scope 1 and 2 emissions decreased by 5% in 2023 to 4% below our 2016 baseline, while our energy spend per ounce reduced by 1%. In February 2024, the Board approved the construction of a US$195m solar and wind microgrid at St Ives in Australia. Through this microgrid, 73% of the mine’s electricity will be sourced from renewables – reducing the Group’s future Scope 1 and 2 emissions by approximately 6% a year. Our other operations continue to investigate the possibility of adding further renewable electricity sources where it makes technical and economic sense to do so. Our commitment to renewables is critical to achieving our 2030 target of reducing our net Scope 1 and 2 emissions by 30% from our 2016 baseline. The remaining third of this target will depend on achieving further energy efficiencies and, importantly, displacing diesel as the energy source for moving bulk material underground and on the surface. This was given renewed impetus at COP 28, with the agreement to transition away from fossil fuels. Work in this area is still at relatively early stages, but we expect that zero-emission vehicles and other technologies will operate in the future. The interest payments of two sustainability-linked loans we signed in 2023 are linked to gradually reducing our emissions and improving total water reused or recycled. The long-term incentives paid to our executives are also tied, in part, to meeting our emissions reduction targets. While Scope 1 and 2 emissions are largely within our control, we would be remiss if we did not address the carbon emissions from our supply chain – that is, Scope 3 emissions. Our baseline study indicated Scope 3 emissions made up 36% of our overall emissions in 2022. In November 2023, we announced our 2030 target to reduce Scope 3 emissions by 10% from our 2022 baseline. Achieving this target will require extensive collaboration with our main suppliers. This report outlines our climate journey to date, as well as our future strategies, policies and programmes. I am confident that, based on Gold Fields’ track record and the commitment and expertise of our people, the Company will play its part to address climate change and its impacts. Mike Fraser Chief Executive Officer Climate Change Steering Committee Chairperson’s statement “As a responsible corporate citizen, we play our part in creating the low-carbon future we need.” Climate governance is the foundation of Gold Fields’ Climate Change Strategy. In 2022, we established a Group Climate Change Steering Committee to drive the formulation and implementation of our Climate Change Strategy. The Committee encompasses all climate-related functions within Gold Fields as well as the majority of the Group’s executive leaders. Its mandate has three focuses: decarbonisation to net-zero, risk management and enablers. Decarbonisation was the Committee’s primary focus in 2023. Scope 1 and 2 decarbonisation work focused on full operationalisation of the South Deep solar plant and studies on renewables projects at St Ives, South Deep and Salares Norte. We gave significant attention to calculating our Scope 3 emissions baseline, which was critical for setting our Scope 3 target. The recently approved St Ives renewable project serves as an example of how we have incorporated our climate targets into our business strategy. The project will provide 73% of St Ives’ electricity requirements and reduce power costs by approximately 30% a year from the projected 2025 grid costs. Although the return on investment period is calculated at a relatively long 10 years, based on conservative gas price assumptions and no carbon tax savings, the overall supply security and environmental benefits mitigate future energy price risk. The Committee considers climate change risk and vulnerability, including risks relating to host communities, water security, tailings management and business interruption. Climate finance and communications, investor relations and transparent reporting serve as material enablers to reach net zero by 2050. Addressing climate change is an imperative for Gold Fields and is embedded in our strategic objectives. The benefits of doing so include a lower carbon footprint, improved energy security and reduced energy costs, as well as enhanced risk mitigation and improved overall resilience. As a responsible corporate citizen, we strive to play our part in creating the low-carbon future we need. This would not be possible without the committed input of all my colleagues, especially our dedicated operational teams, who make it all happen. Paul Schmidt Climate Change Steering Committee Chairperson Gold Fields CCR-7 Introduction Climate governance Gold Fields’ Decarbonisation Strategy and roadmap Resilience to climate change 2023 performance against targets Data and assurance TCFD Index Disclaimer and forward-looking statements Glossary Administration
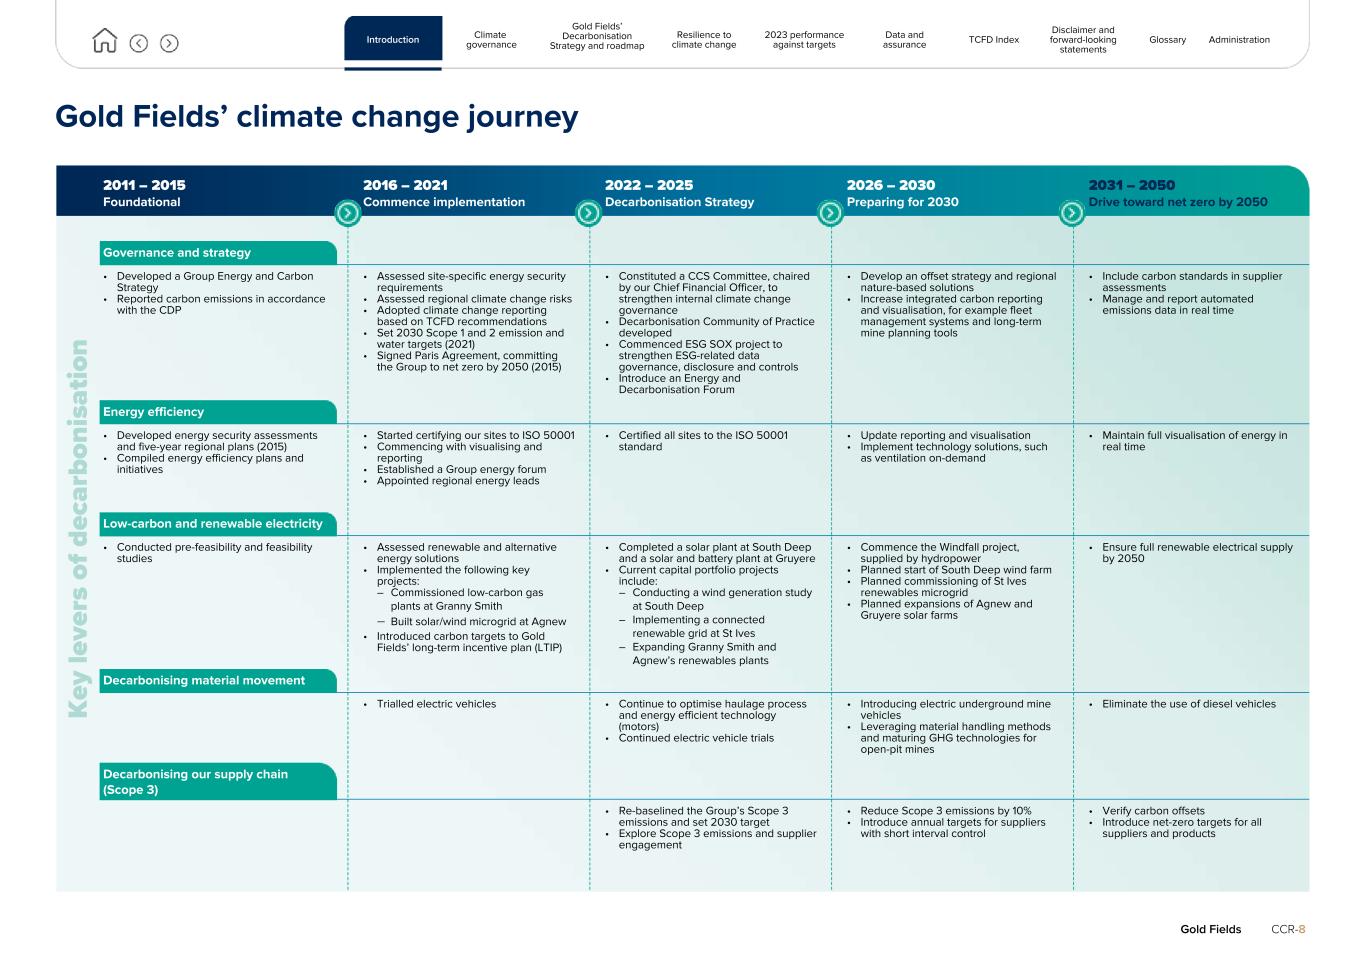
Gold Fields’ climate change journey K ey le ve rs o f d ec ar bo ni sa tio n 2011 – 2015 Foundational 2016 – 2021 Commence implementation 2022 – 2025 Decarbonisation Strategy 2026 – 2030 Preparing for 2030 2031 – 2050 Drive toward net zero by 2050 Governance and strategy • Developed a Group Energy and Carbon Strategy • Reported carbon emissions in accordance with the CDP • Assessed site-specific energy security requirements • Assessed regional climate change risks • Adopted climate change reporting based on TCFD recommendations • Set 2030 Scope 1 and 2 emission and water targets (2021) • Signed Paris Agreement, committing the Group to net zero by 2050 (2015) • Constituted a CCS Committee, chaired by our Chief Financial Officer, to strengthen internal climate change governance • Decarbonisation Community of Practice developed • Commenced ESG SOX project to strengthen ESG-related data governance, disclosure and controls • Introduce an Energy and Decarbonisation Forum • Develop an offset strategy and regional nature-based solutions • Increase integrated carbon reporting and visualisation, for example fleet management systems and long-term mine planning tools • Include carbon standards in supplier assessments • Manage and report automated emissions data in real time Energy efficiency • Developed energy security assessments and five-year regional plans (2015) • Compiled energy efficiency plans and initiatives • Started certifying our sites to ISO 50001 • Commencing with visualising and reporting • Established a Group energy forum • Appointed regional energy leads • Certified all sites to the ISO 50001 standard • Update reporting and visualisation • Implement technology solutions, such as ventilation on-demand • Maintain full visualisation of energy in real time Low-carbon and renewable electricity • Conducted pre-feasibility and feasibility studies • Assessed renewable and alternative energy solutions • Implemented the following key projects: – Commissioned low-carbon gas plants at Granny Smith – Built solar/wind microgrid at Agnew • Introduced carbon targets to Gold Fields’ long-term incentive plan (LTIP) • Completed a solar plant at South Deep and a solar and battery plant at Gruyere • Current capital portfolio projects include: – Conducting a wind generation study at South Deep – Implementing a connected renewable grid at St Ives – Expanding Granny Smith and Agnew’s renewables plants • Commence the Windfall project, supplied by hydropower • Planned start of South Deep wind farm • Planned commissioning of St Ives renewables microgrid • Planned expansions of Agnew and Gruyere solar farms • Ensure full renewable electrical supply by 2050 Decarbonising material movement • Trialled electric vehicles • Continue to optimise haulage process and energy efficient technology (motors) • Continued electric vehicle trials • Introducing electric underground mine vehicles • Leveraging material handling methods and maturing GHG technologies for open-pit mines • Eliminate the use of diesel vehicles Decarbonising our supply chain (Scope 3) • Re-baselined the Group’s Scope 3 emissions and set 2030 target • Explore Scope 3 emissions and supplier engagement • Reduce Scope 3 emissions by 10% • Introduce annual targets for suppliers with short interval control • Verify carbon offsets • Introduce net-zero targets for all suppliers and products Gold Fields CCR-8 Introduction Climate governance Gold Fields’ Decarbonisation Strategy and roadmap Resilience to climate change 2023 performance against targets Data and assurance TCFD Index Disclaimer and forward-looking statements Glossary Administration
Climate governance IN THIS SECTION 10 Climate leadership and management " 11 Climate position and policies " Gold Fields CCR-9 Introduction Climate governance Gold Fields’ Decarbonisation Strategy and roadmap Resilience to climate change 2023 performance against targets Data and assurance TCFD Index Disclaimer and forward-looking statements Glossary Administration Employees at the Granny Smith mine’s solar plant in Western Australia
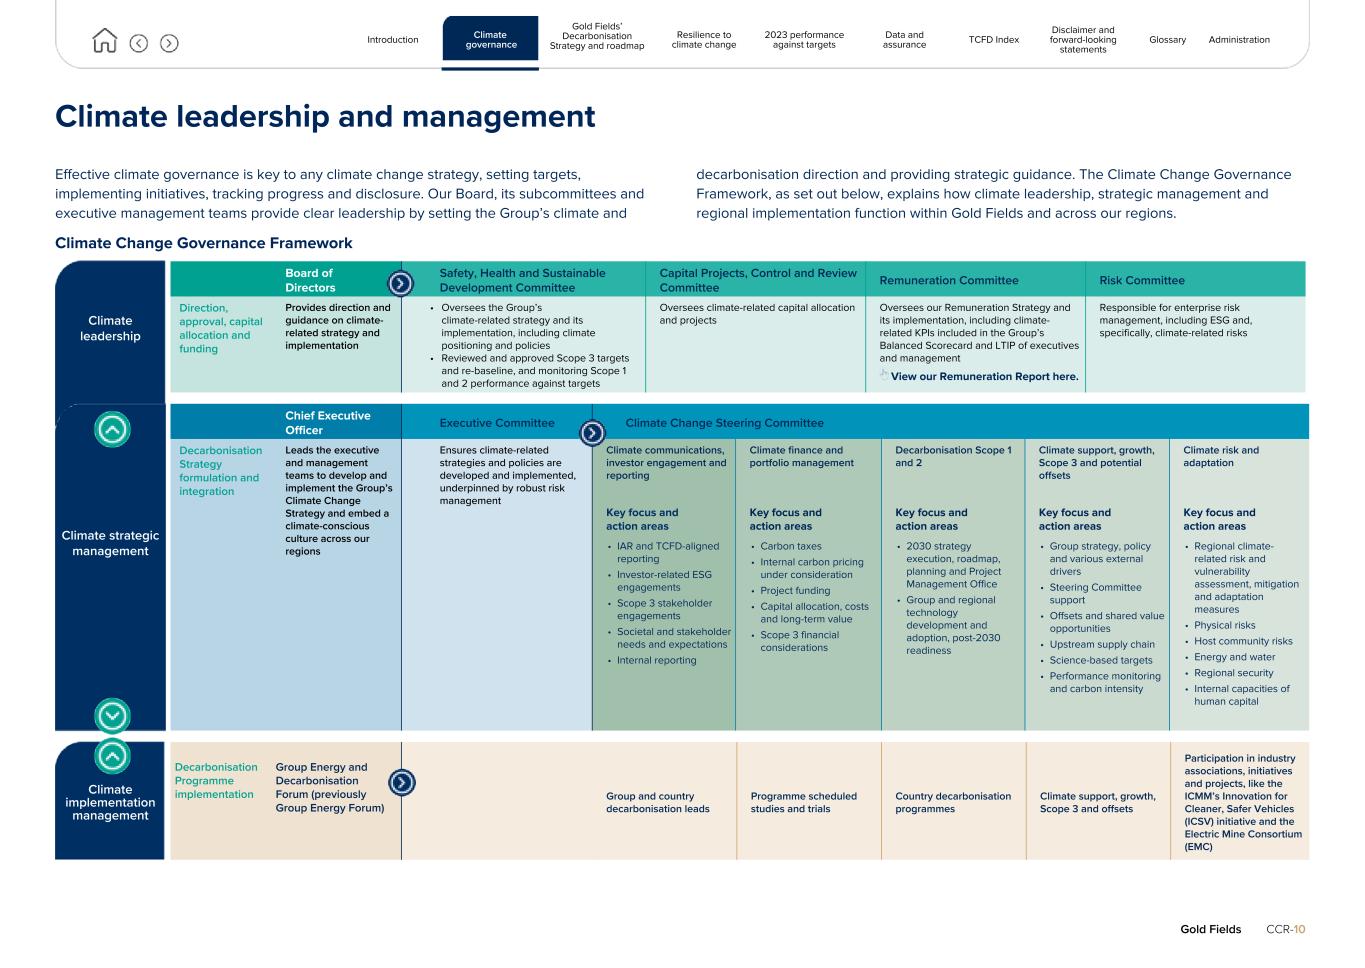
Climate leadership and management Effective climate governance is key to any climate change strategy, setting targets, implementing initiatives, tracking progress and disclosure. Our Board, its subcommittees and executive management teams provide clear leadership by setting the Group’s climate and decarbonisation direction and providing strategic guidance. The Climate Change Governance Framework, as set out below, explains how climate leadership, strategic management and regional implementation function within Gold Fields and across our regions. Climate Change Governance Framework Climate leadership Board of Directors Safety, Health and Sustainable Development Committee Capital Projects, Control and Review Committee Remuneration Committee Risk Committee Direction, approval, capital allocation and funding Provides direction and guidance on climate- related strategy and implementation • Oversees the Group’s climate-related strategy and its implementation, including climate positioning and policies • Reviewed and approved Scope 3 targets and re-baseline, and monitoring Scope 1 and 2 performance against targets Oversees climate-related capital allocation and projects Oversees our Remuneration Strategy and its implementation, including climate- related KPIs included in the Group’s Balanced Scorecard and LTIP of executives and management View our Remuneration Report here. Responsible for enterprise risk management, including ESG and, specifically, climate-related risks Climate strategic management Chief Executive Officer Executive Committee Climate Change Steering Committee Decarbonisation Strategy formulation and integration Leads the executive and management teams to develop and implement the Group’s Climate Change Strategy and embed a climate-conscious culture across our regions Ensures climate-related strategies and policies are developed and implemented, underpinned by robust risk management Climate communications, investor engagement and reporting Climate finance and portfolio management Decarbonisation Scope 1 and 2 Climate support, growth, Scope 3 and potential offsets Climate risk and adaptation Key focus and action areas Key focus and action areas Key focus and action areas Key focus and action areas Key focus and action areas • IAR and TCFD-aligned reporting • Investor-related ESG engagements • Scope 3 stakeholder engagements • Societal and stakeholder needs and expectations • Internal reporting • Carbon taxes • Internal carbon pricing under consideration • Project funding • Capital allocation, costs and long-term value • Scope 3 financial considerations • 2030 strategy execution, roadmap, planning and Project Management Office • Group and regional technology development and adoption, post-2030 readiness • Group strategy, policy and various external drivers • Steering Committee support • Offsets and shared value opportunities • Upstream supply chain • Science-based targets • Performance monitoring and carbon intensity • Regional climate- related risk and vulnerability assessment, mitigation and adaptation measures • Physical risks • Host community risks • Energy and water • Regional security • Internal capacities of human capital Climate implementation management Decarbonisation Programme implementation Group Energy and Decarbonisation Forum (previously Group Energy Forum) Group and country decarbonisation leads Programme scheduled studies and trials Country decarbonisation programmes Climate support, growth, Scope 3 and offsets Participation in industry associations, initiatives and projects, like the ICMM’s Innovation for Cleaner, Safer Vehicles (ICSV) initiative and the Electric Mine Consortium (EMC) Gold Fields CCR-10 Introduction Climate governance Gold Fields’ Decarbonisation Strategy and roadmap Resilience to climate change 2023 performance against targets Data and assurance TCFD Index Disclaimer and forward-looking statements Glossary Administration
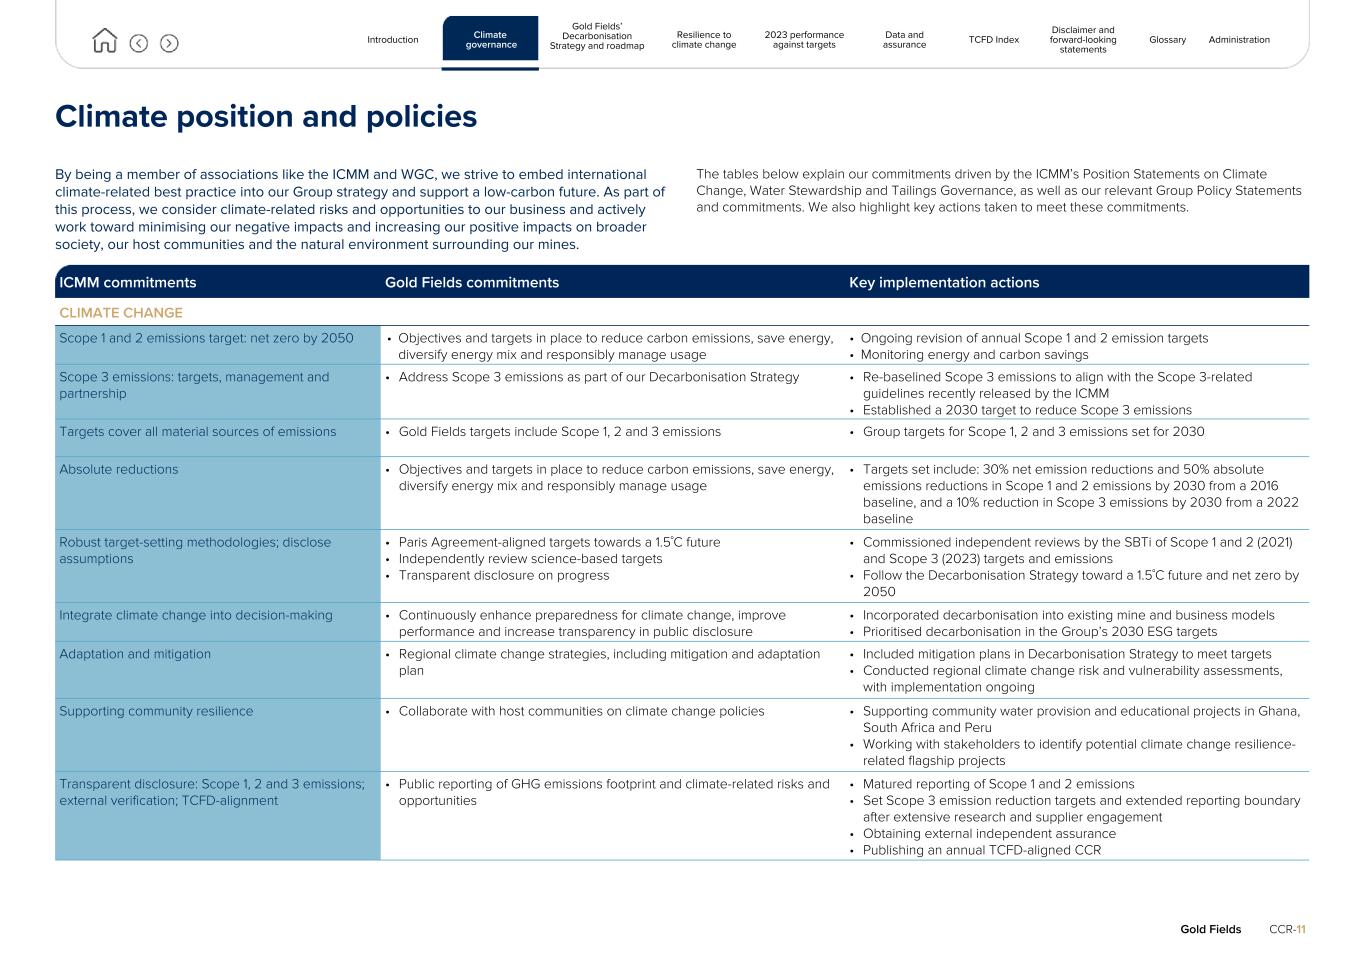
Climate position and policies By being a member of associations like the ICMM and WGC, we strive to embed international climate-related best practice into our Group strategy and support a low-carbon future. As part of this process, we consider climate-related risks and opportunities to our business and actively work toward minimising our negative impacts and increasing our positive impacts on broader society, our host communities and the natural environment surrounding our mines. The tables below explain our commitments driven by the ICMM’s Position Statements on Climate Change, Water Stewardship and Tailings Governance, as well as our relevant Group Policy Statements and commitments. We also highlight key actions taken to meet these commitments. ICMM commitments Gold Fields commitments Key implementation actions CLIMATE CHANGE Scope 1 and 2 emissions target: net zero by 2050 • Objectives and targets in place to reduce carbon emissions, save energy, diversify energy mix and responsibly manage usage • Ongoing revision of annual Scope 1 and 2 emission targets • Monitoring energy and carbon savings Scope 3 emissions: targets, management and partnership • Address Scope 3 emissions as part of our Decarbonisation Strategy • Re-baselined Scope 3 emissions to align with the Scope 3-related guidelines recently released by the ICMM • Established a 2030 target to reduce Scope 3 emissions Targets cover all material sources of emissions • Gold Fields targets include Scope 1, 2 and 3 emissions • Group targets for Scope 1, 2 and 3 emissions set for 2030 Absolute reductions • Objectives and targets in place to reduce carbon emissions, save energy, diversify energy mix and responsibly manage usage • Targets set include: 30% net emission reductions and 50% absolute emissions reductions in Scope 1 and 2 emissions by 2030 from a 2016 baseline, and a 10% reduction in Scope 3 emissions by 2030 from a 2022 baseline Robust target-setting methodologies; disclose assumptions • Paris Agreement-aligned targets towards a 1.5˚C future • Independently review science-based targets • Transparent disclosure on progress • Commissioned independent reviews by the SBTi of Scope 1 and 2 (2021) and Scope 3 (2023) targets and emissions • Follow the Decarbonisation Strategy toward a 1.5˚C future and net zero by 2050 Integrate climate change into decision-making • Continuously enhance preparedness for climate change, improve performance and increase transparency in public disclosure • Incorporated decarbonisation into existing mine and business models • Prioritised decarbonisation in the Group’s 2030 ESG targets Adaptation and mitigation • Regional climate change strategies, including mitigation and adaptation plan • Included mitigation plans in Decarbonisation Strategy to meet targets • Conducted regional climate change risk and vulnerability assessments, with implementation ongoing Supporting community resilience • Collaborate with host communities on climate change policies • Supporting community water provision and educational projects in Ghana, South Africa and Peru • Working with stakeholders to identify potential climate change resilience- related flagship projects Transparent disclosure: Scope 1, 2 and 3 emissions; external verification; TCFD-alignment • Public reporting of GHG emissions footprint and climate-related risks and opportunities • Matured reporting of Scope 1 and 2 emissions • Set Scope 3 emission reduction targets and extended reporting boundary after extensive research and supplier engagement • Obtaining external independent assurance • Publishing an annual TCFD-aligned CCR Gold Fields CCR-11 Introduction Climate governance Gold Fields’ Decarbonisation Strategy and roadmap Resilience to climate change 2023 performance against targets Data and assurance TCFD Index Disclaimer and forward-looking statements Glossary Administration
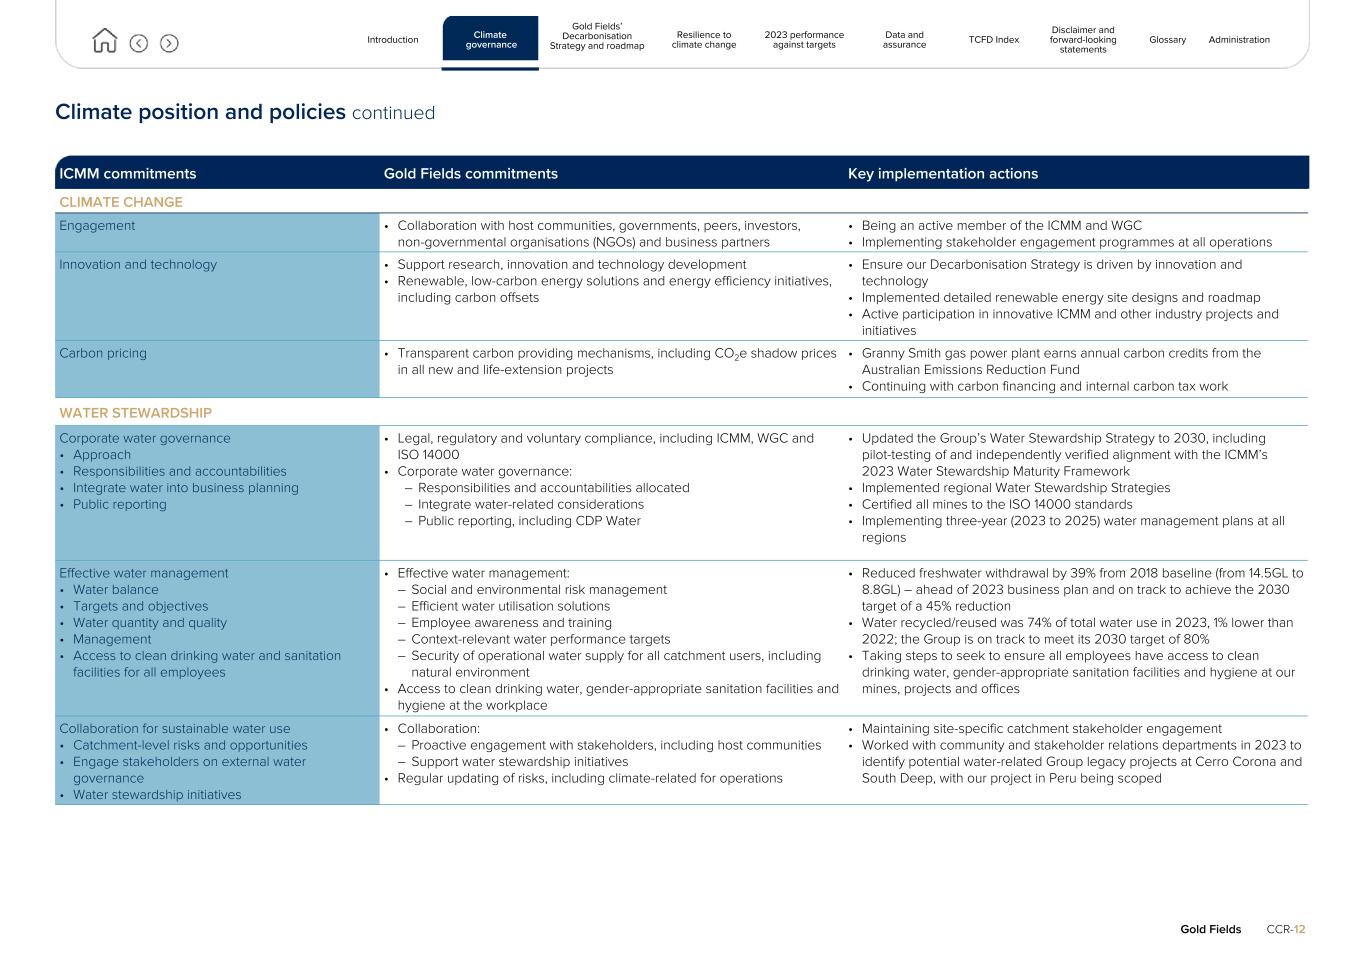
Climate position and policies continued ICMM commitments Gold Fields commitments Key implementation actions CLIMATE CHANGE Engagement • Collaboration with host communities, governments, peers, investors, non-governmental organisations (NGOs) and business partners • Being an active member of the ICMM and WGC • Implementing stakeholder engagement programmes at all operations Innovation and technology • Support research, innovation and technology development • Renewable, low-carbon energy solutions and energy efficiency initiatives, including carbon offsets • Ensure our Decarbonisation Strategy is driven by innovation and technology • Implemented detailed renewable energy site designs and roadmap • Active participation in innovative ICMM and other industry projects and initiatives Carbon pricing • Transparent carbon providing mechanisms, including CO2e shadow prices in all new and life-extension projects • Granny Smith gas power plant earns annual carbon credits from the Australian Emissions Reduction Fund • Continuing with carbon financing and internal carbon tax work WATER STEWARDSHIP Corporate water governance • Approach • Responsibilities and accountabilities • Integrate water into business planning • Public reporting • Legal, regulatory and voluntary compliance, including ICMM, WGC and ISO 14000 • Corporate water governance: – Responsibilities and accountabilities allocated – Integrate water-related considerations – Public reporting, including CDP Water • Updated the Group’s Water Stewardship Strategy to 2030, including pilot-testing of and independently verified alignment with the ICMM’s 2023 Water Stewardship Maturity Framework • Implemented regional Water Stewardship Strategies • Certified all mines to the ISO 14000 standards • Implementing three-year (2023 to 2025) water management plans at all regions Effective water management • Water balance • Targets and objectives • Water quantity and quality • Management • Access to clean drinking water and sanitation facilities for all employees • Effective water management: – Social and environmental risk management – Efficient water utilisation solutions – Employee awareness and training – Context-relevant water performance targets – Security of operational water supply for all catchment users, including natural environment • Access to clean drinking water, gender-appropriate sanitation facilities and hygiene at the workplace • Reduced freshwater withdrawal by 39% from 2018 baseline (from 14.5GL to 8.8GL) – ahead of 2023 business plan and on track to achieve the 2030 target of a 45% reduction • Water recycled/reused was 74% of total water use in 2023, 1% lower than 2022; the Group is on track to meet its 2030 target of 80% • Taking steps to seek to ensure all employees have access to clean drinking water, gender-appropriate sanitation facilities and hygiene at our mines, projects and offices Collaboration for sustainable water use • Catchment-level risks and opportunities • Engage stakeholders on external water governance • Water stewardship initiatives • Collaboration: – Proactive engagement with stakeholders, including host communities – Support water stewardship initiatives • Regular updating of risks, including climate-related for operations • Maintaining site-specific catchment stakeholder engagement • Worked with community and stakeholder relations departments in 2023 to identify potential water-related Group legacy projects at Cerro Corona and South Deep, with our project in Peru being scoped Gold Fields CCR-12 Introduction Climate governance Gold Fields’ Decarbonisation Strategy and roadmap Resilience to climate change 2023 performance against targets Data and assurance TCFD Index Disclaimer and forward-looking statements Glossary Administration
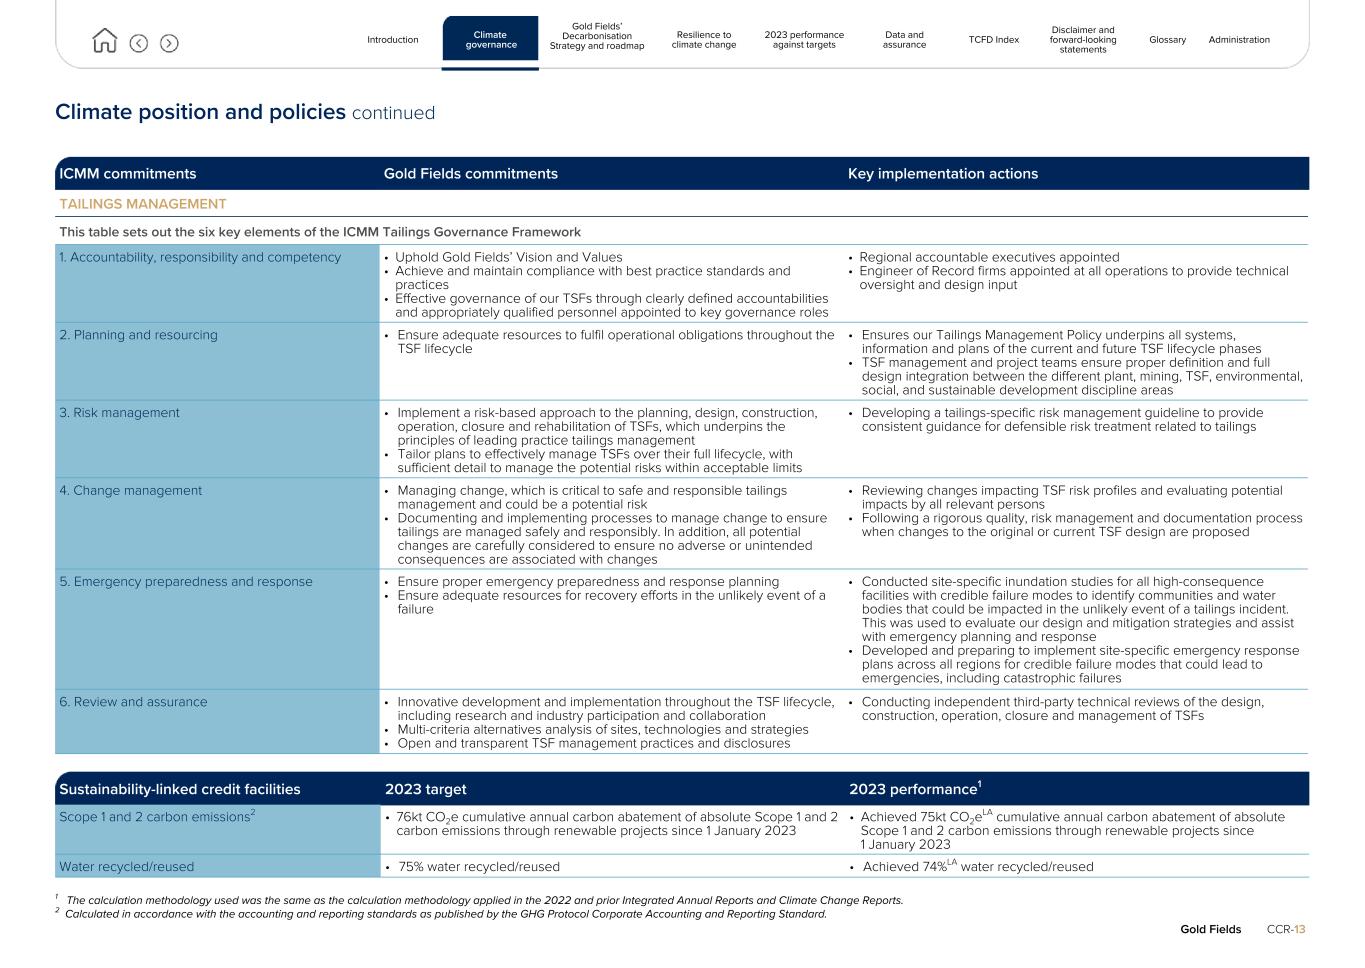
Climate position and policies continued ICMM commitments Gold Fields commitments Key implementation actions TAILINGS MANAGEMENT This table sets out the six key elements of the ICMM Tailings Governance Framework 1. Accountability, responsibility and competency • Uphold Gold Fields’ Vision and Values • Achieve and maintain compliance with best practice standards and practices • Effective governance of our TSFs through clearly defined accountabilities and appropriately qualified personnel appointed to key governance roles • Regional accountable executives appointed • Engineer of Record firms appointed at all operations to provide technical oversight and design input 2. Planning and resourcing • Ensure adequate resources to fulfil operational obligations throughout the TSF lifecycle • Ensures our Tailings Management Policy underpins all systems, information and plans of the current and future TSF lifecycle phases • TSF management and project teams ensure proper definition and full design integration between the different plant, mining, TSF, environmental, social, and sustainable development discipline areas 3. Risk management • Implement a risk-based approach to the planning, design, construction, operation, closure and rehabilitation of TSFs, which underpins the principles of leading practice tailings management • Tailor plans to effectively manage TSFs over their full lifecycle, with sufficient detail to manage the potential risks within acceptable limits • Developing a tailings-specific risk management guideline to provide consistent guidance for defensible risk treatment related to tailings 4. Change management • Managing change, which is critical to safe and responsible tailings management and could be a potential risk • Documenting and implementing processes to manage change to ensure tailings are managed safely and responsibly. In addition, all potential changes are carefully considered to ensure no adverse or unintended consequences are associated with changes • Reviewing changes impacting TSF risk profiles and evaluating potential impacts by all relevant persons • Following a rigorous quality, risk management and documentation process when changes to the original or current TSF design are proposed 5. Emergency preparedness and response • Ensure proper emergency preparedness and response planning • Ensure adequate resources for recovery efforts in the unlikely event of a failure • Conducted site-specific inundation studies for all high-consequence facilities with credible failure modes to identify communities and water bodies that could be impacted in the unlikely event of a tailings incident. This was used to evaluate our design and mitigation strategies and assist with emergency planning and response • Developed and preparing to implement site-specific emergency response plans across all regions for credible failure modes that could lead to emergencies, including catastrophic failures 6. Review and assurance • Innovative development and implementation throughout the TSF lifecycle, including research and industry participation and collaboration • Multi-criteria alternatives analysis of sites, technologies and strategies • Open and transparent TSF management practices and disclosures • Conducting independent third-party technical reviews of the design, construction, operation, closure and management of TSFs Sustainability-linked credit facilities 2023 target 2023 performance1 Scope 1 and 2 carbon emissions2 • 76kt CO2e cumulative annual carbon abatement of absolute Scope 1 and 2 carbon emissions through renewable projects since 1 January 2023 • Achieved 75kt CO2eLA cumulative annual carbon abatement of absolute Scope 1 and 2 carbon emissions through renewable projects since 1 January 2023 Water recycled/reused • 75% water recycled/reused • Achieved 74%LA water recycled/reused 1 The calculation methodology used was the same as the calculation methodology applied in the 2022 and prior Integrated Annual Reports and Climate Change Reports. 2 Calculated in accordance with the accounting and reporting standards as published by the GHG Protocol Corporate Accounting and Reporting Standard. Gold Fields CCR-13 Introduction Climate governance Gold Fields’ Decarbonisation Strategy and roadmap Resilience to climate change 2023 performance against targets Data and assurance TCFD Index Disclaimer and forward-looking statements Glossary Administration
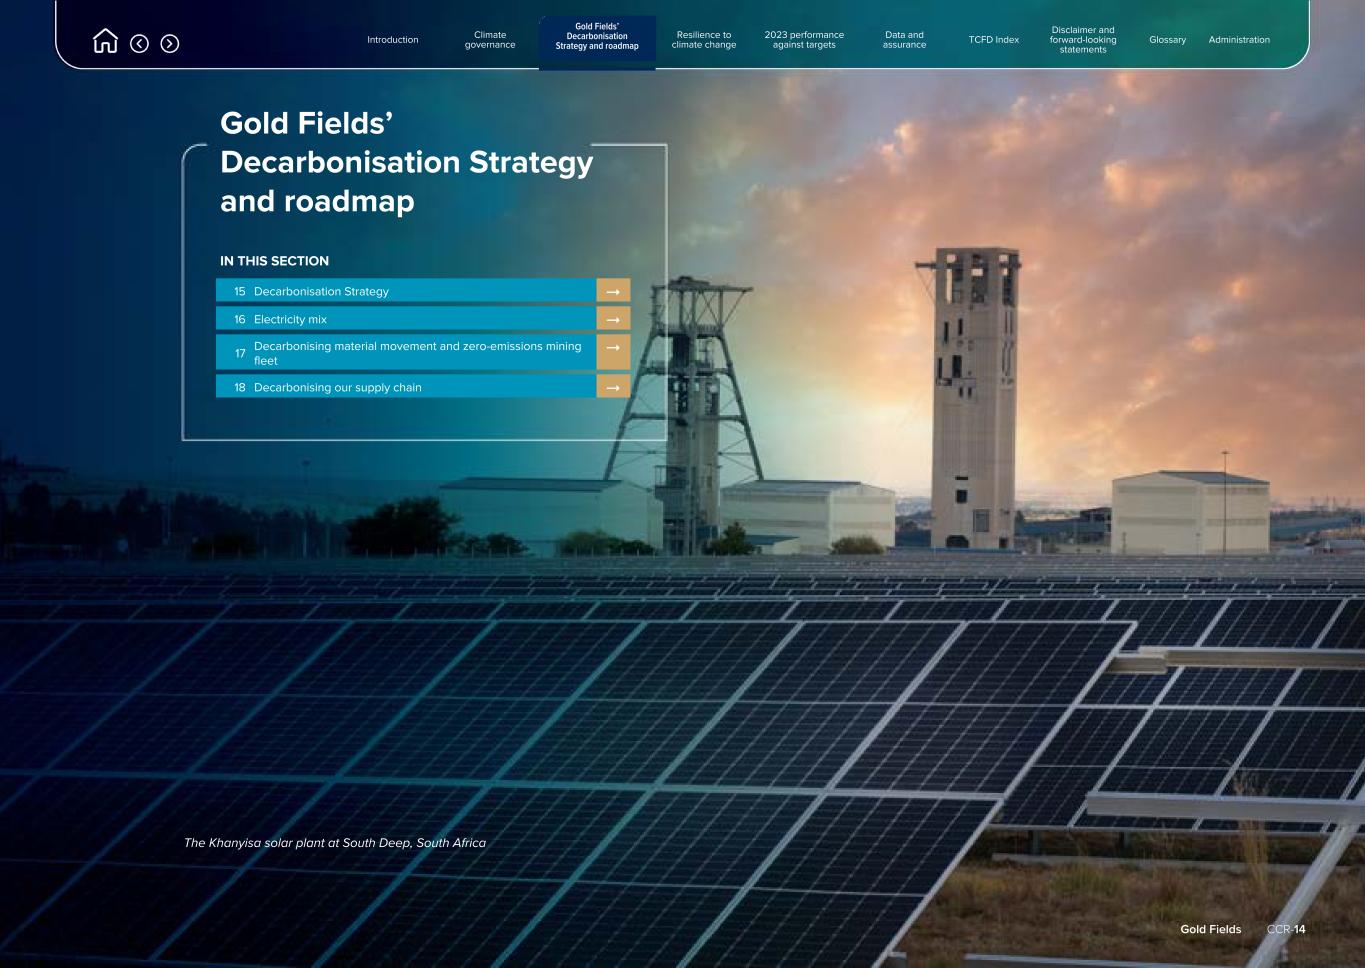
Gold Fields’ Decarbonisation Strategy and roadmap IN THIS SECTION 15 Decarbonisation Strategy " 16 Electricity mix " 17 Decarbonising material movement and zero-emissions mining fleet " 18 Decarbonising our supply chain " Gold Fields CCR-14 Introduction Climate governance Gold Fields’ Decarbonisation Strategy and roadmap Resilience to climate change 2023 performance against targets Data and assurance TCFD Index Disclaimer and forward-looking statements Glossary Administration The Khanyisa solar plant at South Deep, South Africa
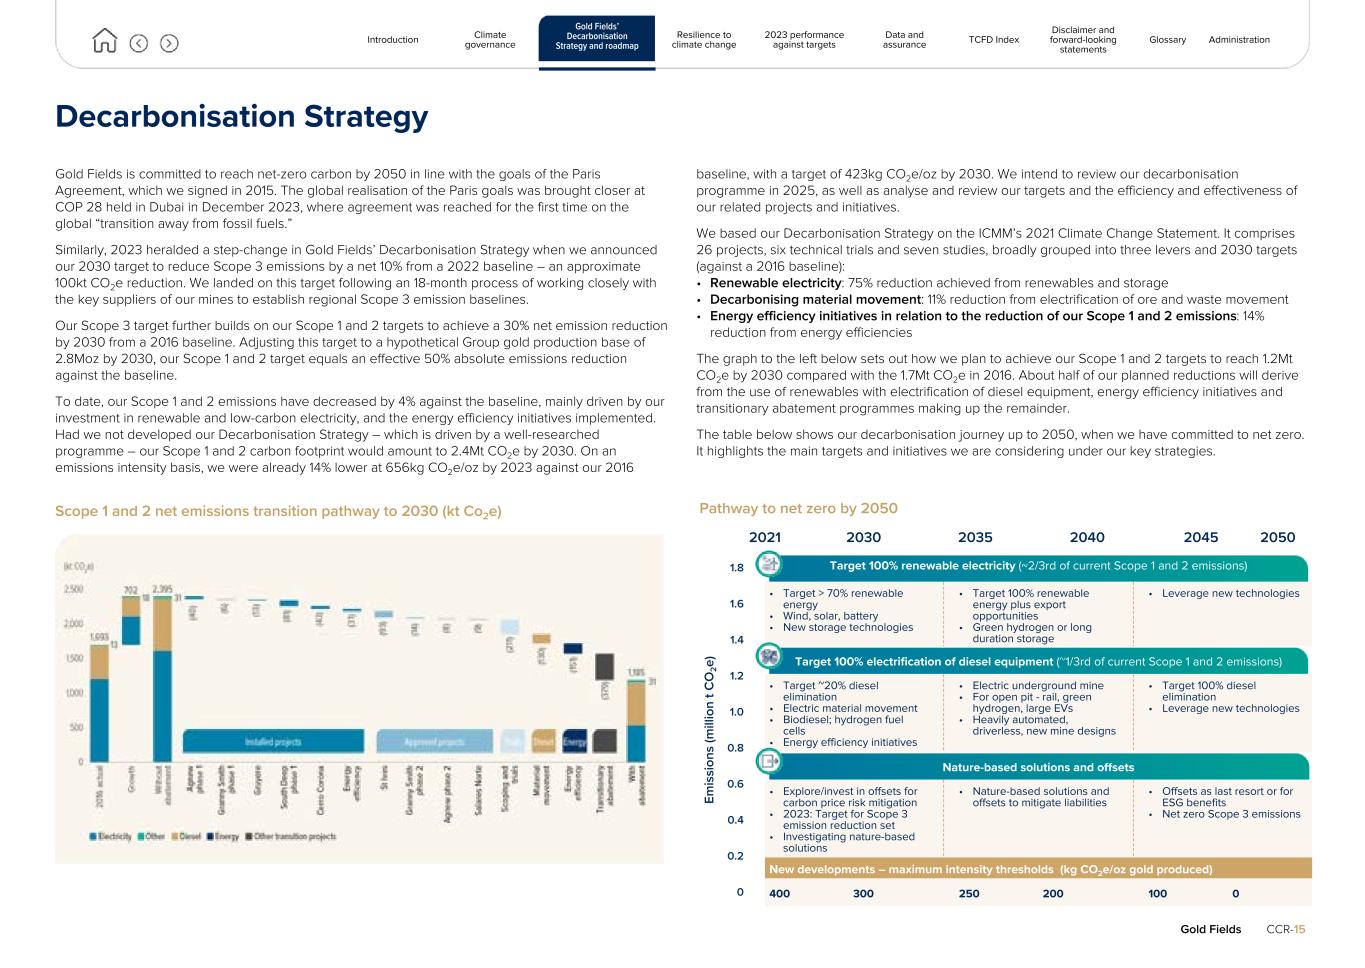
Decarbonisation Strategy Gold Fields is committed to reach net-zero carbon by 2050 in line with the goals of the Paris Agreement, which we signed in 2015. The global realisation of the Paris goals was brought closer at COP 28 held in Dubai in December 2023, where agreement was reached for the first time on the global “transition away from fossil fuels.” Similarly, 2023 heralded a step-change in Gold Fields’ Decarbonisation Strategy when we announced our 2030 target to reduce Scope 3 emissions by a net 10% from a 2022 baseline – an approximate 100kt CO2e reduction. We landed on this target following an 18-month process of working closely with the key suppliers of our mines to establish regional Scope 3 emission baselines. Our Scope 3 target further builds on our Scope 1 and 2 targets to achieve a 30% net emission reduction by 2030 from a 2016 baseline. Adjusting this target to a hypothetical Group gold production base of 2.8Moz by 2030, our Scope 1 and 2 target equals an effective 50% absolute emissions reduction against the baseline. To date, our Scope 1 and 2 emissions have decreased by 4% against the baseline, mainly driven by our investment in renewable and low-carbon electricity, and the energy efficiency initiatives implemented. Had we not developed our Decarbonisation Strategy – which is driven by a well-researched programme – our Scope 1 and 2 carbon footprint would amount to 2.4Mt CO2e by 2030. On an emissions intensity basis, we were already 14% lower at 656kg CO2e/oz by 2023 against our 2016 baseline, with a target of 423kg CO2e/oz by 2030. We intend to review our decarbonisation programme in 2025, as well as analyse and review our targets and the efficiency and effectiveness of our related projects and initiatives. We based our Decarbonisation Strategy on the ICMM’s 2021 Climate Change Statement. It comprises 26 projects, six technical trials and seven studies, broadly grouped into three levers and 2030 targets (against a 2016 baseline): • Renewable electricity: 75% reduction achieved from renewables and storage • Decarbonising material movement: 11% reduction from electrification of ore and waste movement • Energy efficiency initiatives in relation to the reduction of our Scope 1 and 2 emissions: 14% reduction from energy efficiencies The graph to the left below sets out how we plan to achieve our Scope 1 and 2 targets to reach 1.2Mt CO2e by 2030 compared with the 1.7Mt CO2e in 2016. About half of our planned reductions will derive from the use of renewables with electrification of diesel equipment, energy efficiency initiatives and transitionary abatement programmes making up the remainder. The table below shows our decarbonisation journey up to 2050, when we have committed to net zero. It highlights the main targets and initiatives we are considering under our key strategies. Scope 1 and 2 net emissions transition pathway to 2030 (kt Co2e) Gold Fields CCR-15 Em is si on s (m ill io n t C O 2e ) Target 100% renewable electricity (~2/3rd of current Scope 1 and 2 emissions) • Target > 70% renewable energy • Wind, solar, battery • New storage technologies • Target 100% renewable energy plus export opportunities • Green hydrogen or long duration storage • Leverage new technologies Target 100% electrification of diesel equipment (~1/3rd of current Scope 1 and 2 emissions) • Target ~20% diesel elimination • Electric material movement • Biodiesel; hydrogen fuel cells • Energy efficiency initiatives • Electric underground mine • For open pit - rail, green hydrogen, large EVs • Heavily automated, driverless, new mine designs • Target 100% diesel elimination • Leverage new technologies Nature-based solutions and offsets • Explore/invest in offsets for carbon price risk mitigation • 2023: Target for Scope 3 emission reduction set • Investigating nature-based solutions • Nature-based solutions and offsets to mitigate liabilities • Offsets as last resort or for ESG benefits • Net zero Scope 3 emissions New developments – maximum intensity thresholds (kg CO2e/oz gold produced) 400 300 250 200 100 0 2021 2030 2035 2040 2045 2050 1.8 1.6 1.4 1.2 1.0 0.8 0.6 0.4 0.2 0 Pathway to net zero by 2050 Introduction Climate governance Gold Fields’ Decarbonisation Strategy and roadmap Resilience to climate change 2023 performance against targets Data and assurance TCFD Index Disclaimer and forward-looking statements Glossary Administration
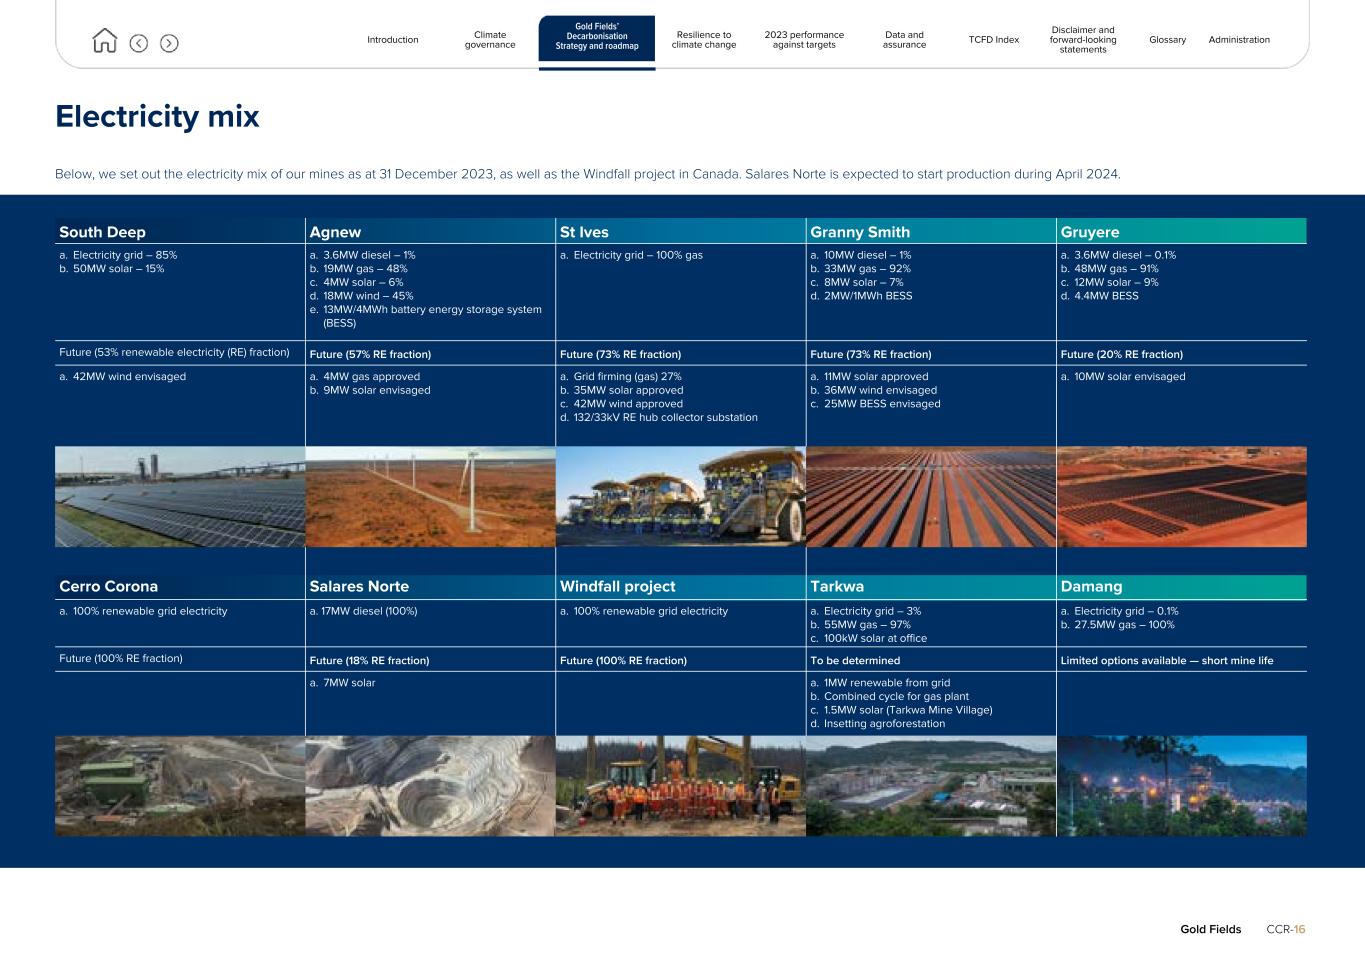
Electricity mix Below, we set out the electricity mix of our mines as at 31 December 2023, as well as the Windfall project in Canada. Salares Norte is expected to start production during April 2024. South Deep Agnew St Ives Granny Smith Gruyere a. Electricity grid – 85% b. 50MW solar – 15% a. 3.6MW diesel – 1% b. 19MW gas – 48% c. 4MW solar – 6% d. 18MW wind – 45% e. 13MW/4MWh battery energy storage system (BESS) a. Electricity grid – 100% gas a. 10MW diesel – 1% b. 33MW gas – 92% c. 8MW solar – 7% d. 2MW/1MWh BESS a. 3.6MW diesel – 0.1% b. 48MW gas – 91% c. 12MW solar – 9% d. 4.4MW BESS Future (53% renewable electricity (RE) fraction) Future (57% RE fraction) Future (73% RE fraction) Future (73% RE fraction) Future (20% RE fraction) a. 42MW wind envisaged a. 4MW gas approved b. 9MW solar envisaged a. Grid firming (gas) 27% b. 35MW solar approved c. 42MW wind approved d. 132/33kV RE hub collector substation a. 11MW solar approved b. 36MW wind envisaged c. 25MW BESS envisaged a. 10MW solar envisaged Cerro Corona Salares Norte Windfall project Tarkwa Damang a. 100% renewable grid electricity a. 17MW diesel (100%) a. 100% renewable grid electricity a. Electricity grid – 3% b. 55MW gas – 97% c. 100kW solar at office a. Electricity grid – 0.1% b. 27.5MW gas – 100% Future (100% RE fraction) Future (18% RE fraction) Future (100% RE fraction) To be determined Limited options available — short mine life a. 7MW solar a. 1MW renewable from grid b. Combined cycle for gas plant c. 1.5MW solar (Tarkwa Mine Village) d. Insetting agroforestation Gold Fields CCR-16 Introduction Climate governance Gold Fields’ Decarbonisation Strategy and roadmap Resilience to climate change 2023 performance against targets Data and assurance TCFD Index Disclaimer and forward-looking statements Glossary Administration
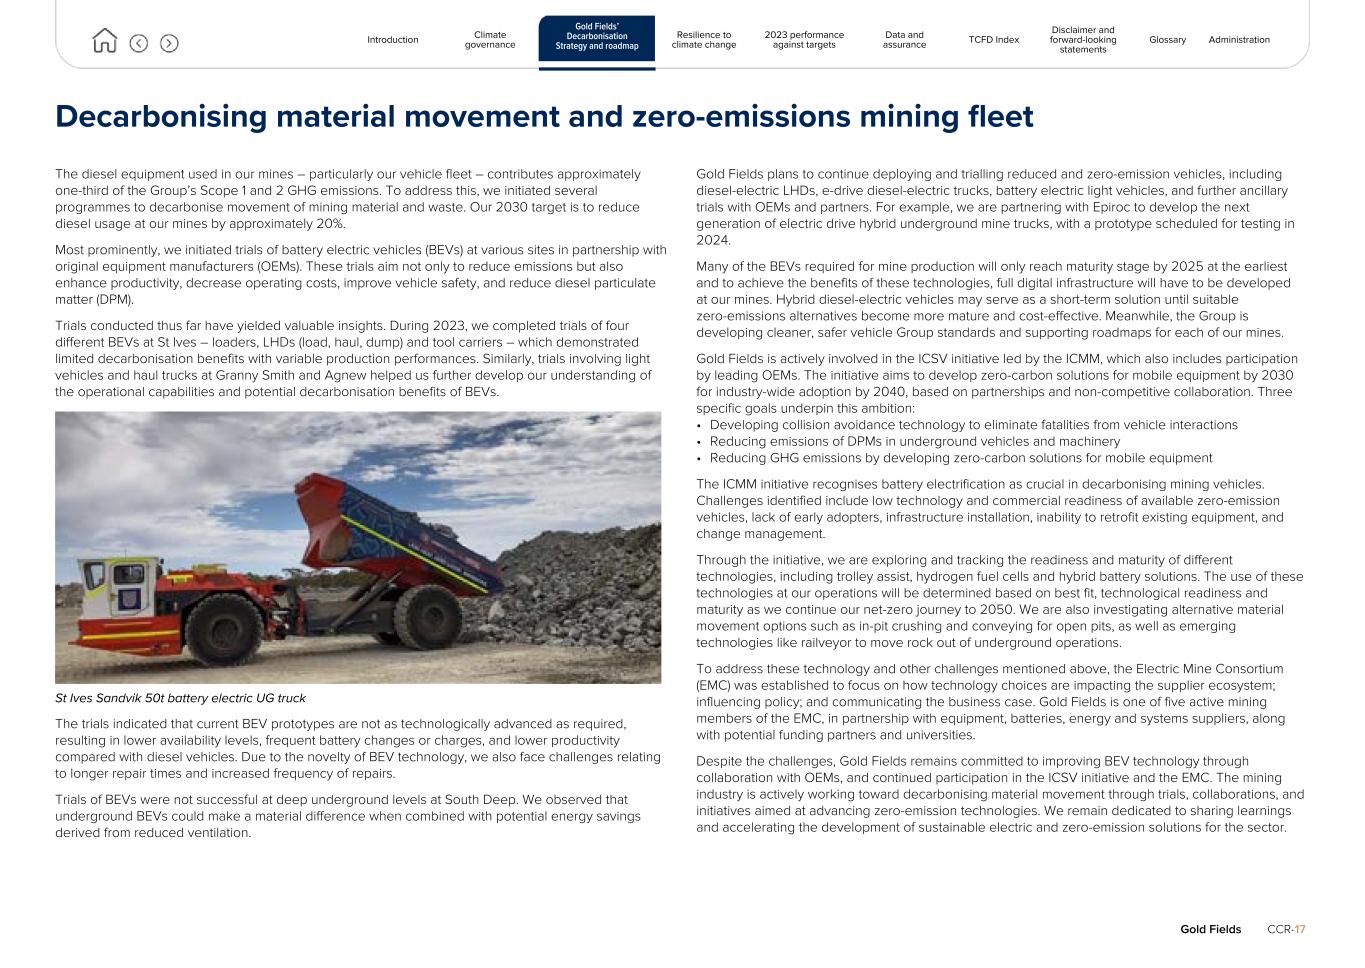
Decarbonising material movement and zero-emissions mining fleet The diesel equipment used in our mines – particularly our vehicle fleet – contributes approximately one-third of the Group’s Scope 1 and 2 GHG emissions. To address this, we initiated several programmes to decarbonise movement of mining material and waste. Our 2030 target is to reduce diesel usage at our mines by approximately 20%. Most prominently, we initiated trials of battery electric vehicles (BEVs) at various sites in partnership with original equipment manufacturers (OEMs). These trials aim not only to reduce emissions but also enhance productivity, decrease operating costs, improve vehicle safety, and reduce diesel particulate matter (DPM). Trials conducted thus far have yielded valuable insights. During 2023, we completed trials of four different BEVs at St Ives – loaders, LHDs (load, haul, dump) and tool carriers – which demonstrated limited decarbonisation benefits with variable production performances. Similarly, trials involving light vehicles and haul trucks at Granny Smith and Agnew helped us further develop our understanding of the operational capabilities and potential decarbonisation benefits of BEVs. St Ives Sandvik 50t battery electric UG truck The trials indicated that current BEV prototypes are not as technologically advanced as required, resulting in lower availability levels, frequent battery changes or charges, and lower productivity compared with diesel vehicles. Due to the novelty of BEV technology, we also face challenges relating to longer repair times and increased frequency of repairs. Trials of BEVs were not successful at deep underground levels at South Deep. We observed that underground BEVs could make a material difference when combined with potential energy savings derived from reduced ventilation. Gold Fields plans to continue deploying and trialling reduced and zero-emission vehicles, including diesel-electric LHDs, e-drive diesel-electric trucks, battery electric light vehicles, and further ancillary trials with OEMs and partners. For example, we are partnering with Epiroc to develop the next generation of electric drive hybrid underground mine trucks, with a prototype scheduled for testing in 2024. Many of the BEVs required for mine production will only reach maturity stage by 2025 at the earliest and to achieve the benefits of these technologies, full digital infrastructure will have to be developed at our mines. Hybrid diesel-electric vehicles may serve as a short-term solution until suitable zero-emissions alternatives become more mature and cost-effective. Meanwhile, the Group is developing cleaner, safer vehicle Group standards and supporting roadmaps for each of our mines. Gold Fields is actively involved in the ICSV initiative led by the ICMM, which also includes participation by leading OEMs. The initiative aims to develop zero-carbon solutions for mobile equipment by 2030 for industry-wide adoption by 2040, based on partnerships and non-competitive collaboration. Three specific goals underpin this ambition: • Developing collision avoidance technology to eliminate fatalities from vehicle interactions • Reducing emissions of DPMs in underground vehicles and machinery • Reducing GHG emissions by developing zero-carbon solutions for mobile equipment The ICMM initiative recognises battery electrification as crucial in decarbonising mining vehicles. Challenges identified include low technology and commercial readiness of available zero-emission vehicles, lack of early adopters, infrastructure installation, inability to retrofit existing equipment, and change management. Through the initiative, we are exploring and tracking the readiness and maturity of different technologies, including trolley assist, hydrogen fuel cells and hybrid battery solutions. The use of these technologies at our operations will be determined based on best fit, technological readiness and maturity as we continue our net-zero journey to 2050. We are also investigating alternative material movement options such as in-pit crushing and conveying for open pits, as well as emerging technologies like railveyor to move rock out of underground operations. To address these technology and other challenges mentioned above, the Electric Mine Consortium (EMC) was established to focus on how technology choices are impacting the supplier ecosystem; influencing policy; and communicating the business case. Gold Fields is one of five active mining members of the EMC, in partnership with equipment, batteries, energy and systems suppliers, along with potential funding partners and universities. Despite the challenges, Gold Fields remains committed to improving BEV technology through collaboration with OEMs, and continued participation in the ICSV initiative and the EMC. The mining industry is actively working toward decarbonising material movement through trials, collaborations, and initiatives aimed at advancing zero-emission technologies. We remain dedicated to sharing learnings and accelerating the development of sustainable electric and zero-emission solutions for the sector. Gold Fields CCR-17 Introduction Climate governance Gold Fields’ Decarbonisation Strategy and roadmap Resilience to climate change 2023 performance against targets Data and assurance TCFD Index Disclaimer and forward-looking statements Glossary Administration
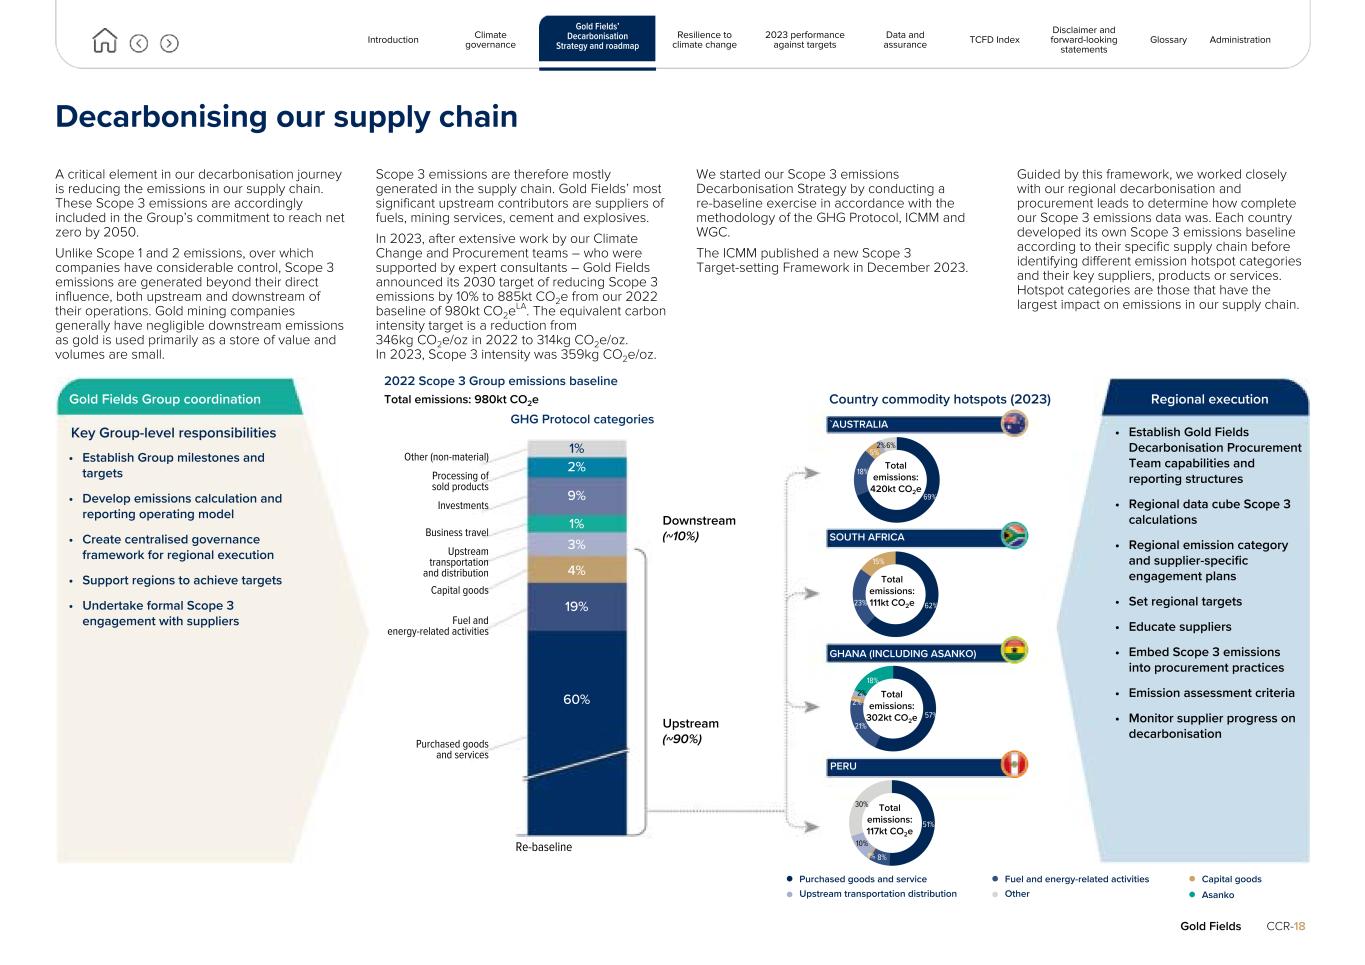
Decarbonising our supply chain A critical element in our decarbonisation journey is reducing the emissions in our supply chain. These Scope 3 emissions are accordingly included in the Group’s commitment to reach net zero by 2050. Unlike Scope 1 and 2 emissions, over which companies have considerable control, Scope 3 emissions are generated beyond their direct influence, both upstream and downstream of their operations. Gold mining companies generally have negligible downstream emissions as gold is used primarily as a store of value and volumes are small. Scope 3 emissions are therefore mostly generated in the supply chain. Gold Fields’ most significant upstream contributors are suppliers of fuels, mining services, cement and explosives. In 2023, after extensive work by our Climate Change and Procurement teams – who were supported by expert consultants – Gold Fields announced its 2030 target of reducing Scope 3 emissions by 10% to 885kt CO2e from our 2022 baseline of 980kt CO2eLA. The equivalent carbon intensity target is a reduction from 346kg CO2e/oz in 2022 to 314kg CO2e/oz. In 2023, Scope 3 intensity was 359kg CO2e/oz. We started our Scope 3 emissions Decarbonisation Strategy by conducting a re-baseline exercise in accordance with the methodology of the GHG Protocol, ICMM and WGC. The ICMM published a new Scope 3 Target-setting Framework in December 2023. Guided by this framework, we worked closely with our regional decarbonisation and procurement leads to determine how complete our Scope 3 emissions data was. Each country developed its own Scope 3 emissions baseline according to their specific supply chain before identifying different emission hotspot categories and their key suppliers, products or services. Hotspot categories are those that have the largest impact on emissions in our supply chain. Gold Fields Group coordination 2022 Scope 3 Group emissions baseline Total emissions: 980kt CO2e GHG Protocol categories Country commodity hotspots (2023) Regional execution Key Group-level responsibilities • Establish Gold Fields Decarbonisation Procurement Team capabilities and reporting structures • Regional data cube Scope 3 calculations • Regional emission category and supplier-specific engagement plans • Set regional targets • Educate suppliers • Embed Scope 3 emissions into procurement practices • Emission assessment criteria • Monitor supplier progress on decarbonisation «« • Establish Group milestones and targets • Develop emissions calculation and reporting operating model • Create centralised governance framework for regional execution • Support regions to achieve targets • Undertake formal Scope 3 engagement with suppliers Other (non-material) Processing of sold products Investments Business travel Upstream transportation and distribution Capital goods Fuel and energy-related activities Purchased goods and services Downstream (~10%) Upstream (~90%) AUSTRALIA Re-baseline Gold Fields CCR-18 PERU GHANA (INCLUDING ASANKO) SOUTH AFRICA `AUSTRALIA 51% 8%1% 10% 30% Total emissions: 117kt CO2e 57% 21% 2% 2% 18% Total emissions: 302kt CO2e 62%23% 15% Total emissions: 111kt CO2e 69% 18% 5% 2%6% Total emissions: 420kt CO2e Ÿ Purchased goods and service Ÿ Fuel and energy-related activities Ÿ Capital goods Ÿ Upstream transportation distribution Ÿ Other Ÿ Asanko Introduction Climate governance Gold Fields’ Decarbonisation Strategy and roadmap Resilience to climate change 2023 performance against targets Data and assurance TCFD Index Disclaimer and forward-looking statements Glossary Administration 1% 2% 9% 1% 3% 4% 19% 60%
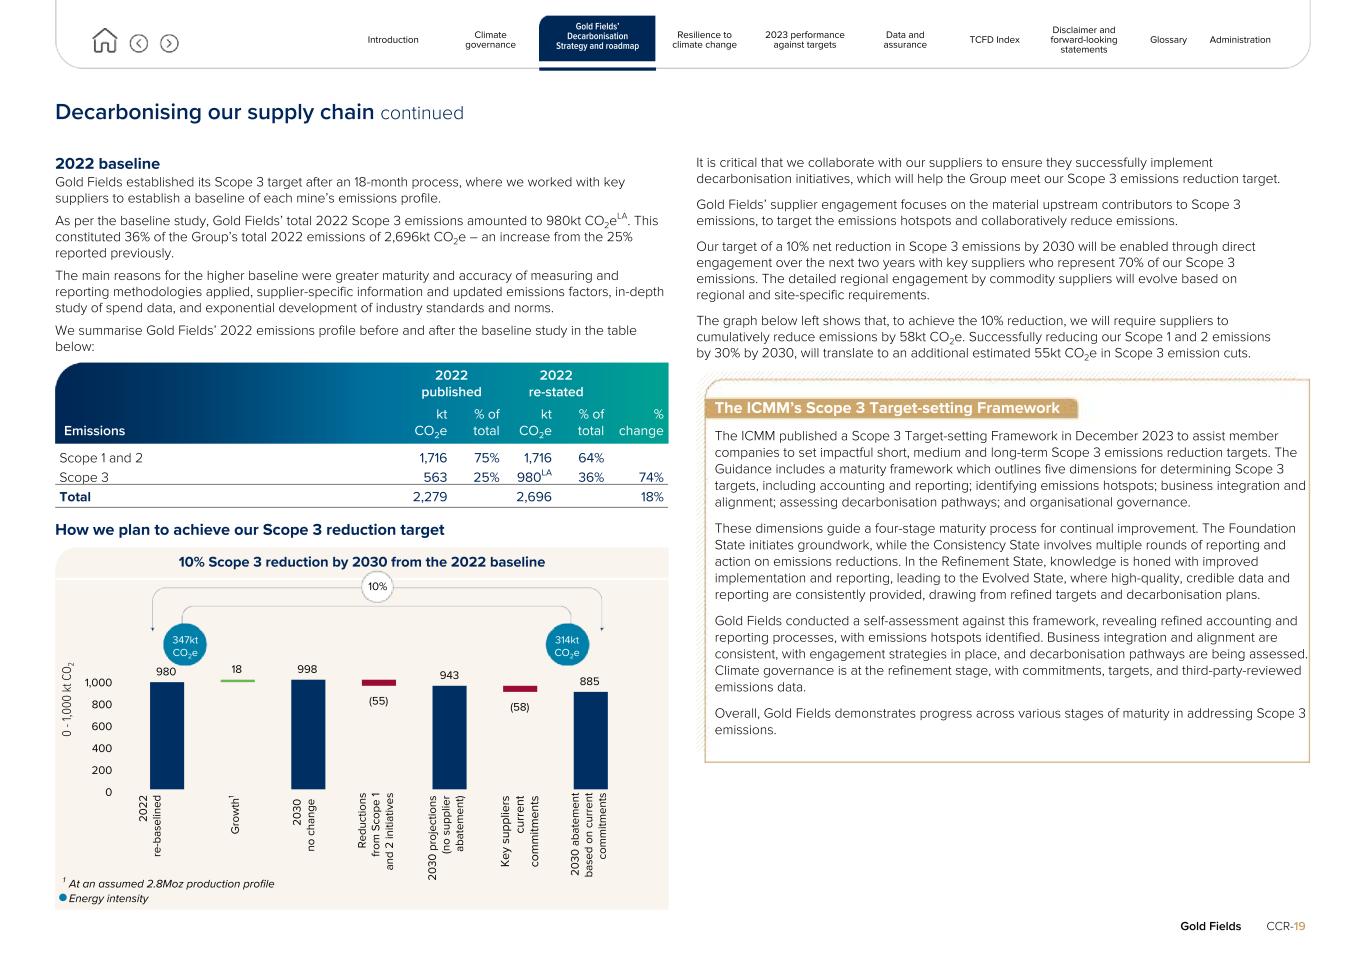
Decarbonising our supply chain continued 2022 baseline Gold Fields established its Scope 3 target after an 18-month process, where we worked with key suppliers to establish a baseline of each mine’s emissions profile. As per the baseline study, Gold Fields’ total 2022 Scope 3 emissions amounted to 980kt CO2eLA. This constituted 36% of the Group’s total 2022 emissions of 2,696kt CO2e – an increase from the 25% reported previously. The main reasons for the higher baseline were greater maturity and accuracy of measuring and reporting methodologies applied, supplier-specific information and updated emissions factors, in-depth study of spend data, and exponential development of industry standards and norms. We summarise Gold Fields’ 2022 emissions profile before and after the baseline study in the table below: 2022 published 2022 re-stated Emissions kt CO2e % of total kt CO2e % of total % change Scope 1 and 2 1,716 75% 1,716 64% Scope 3 563 25% 980LA 36% 74% Total 2,279 2,696 18% How we plan to achieve our Scope 3 reduction target 10% Scope 3 reduction by 2030 from the 2022 baseline 980 18 998 (55) 943 (58) 885 0 200 400 600 800 1,000 1 At an assumed 2.8Moz production profile l Energy intensity It is critical that we collaborate with our suppliers to ensure they successfully implement decarbonisation initiatives, which will help the Group meet our Scope 3 emissions reduction target. Gold Fields’ supplier engagement focuses on the material upstream contributors to Scope 3 emissions, to target the emissions hotspots and collaboratively reduce emissions. Our target of a 10% net reduction in Scope 3 emissions by 2030 will be enabled through direct engagement over the next two years with key suppliers who represent 70% of our Scope 3 emissions. The detailed regional engagement by commodity suppliers will evolve based on regional and site-specific requirements. The graph below left shows that, to achieve the 10% reduction, we will require suppliers to cumulatively reduce emissions by 58kt CO2e. Successfully reducing our Scope 1 and 2 emissions by 30% by 2030, will translate to an additional estimated 55kt CO2e in Scope 3 emission cuts. The ICMM’s Scope 3 Target-setting Framework The ICMM published a Scope 3 Target-setting Framework in December 2023 to assist member companies to set impactful short, medium and long-term Scope 3 emissions reduction targets. The Guidance includes a maturity framework which outlines five dimensions for determining Scope 3 targets, including accounting and reporting; identifying emissions hotspots; business integration and alignment; assessing decarbonisation pathways; and organisational governance. These dimensions guide a four-stage maturity process for continual improvement. The Foundation State initiates groundwork, while the Consistency State involves multiple rounds of reporting and action on emissions reductions. In the Refinement State, knowledge is honed with improved implementation and reporting, leading to the Evolved State, where high-quality, credible data and reporting are consistently provided, drawing from refined targets and decarbonisation plans. Gold Fields conducted a self-assessment against this framework, revealing refined accounting and reporting processes, with emissions hotspots identified. Business integration and alignment are consistent, with engagement strategies in place, and decarbonisation pathways are being assessed. Climate governance is at the refinement stage, with commitments, targets, and third-party-reviewed emissions data. Overall, Gold Fields demonstrates progress across various stages of maturity in addressing Scope 3 emissions. Gold Fields CCR-19 10% 0 - 1 ,0 00 k t C O 2 20 22 re -b as el in ed G ro w th 1 20 30 no c ha ng e R ed uc tio ns fr om S co pe 1 an d 2 in iti at iv es 20 3 0 p ro je ct io ns (n o su pp lie r ab at em en t) K ey s up pl ie rs cu rr en t co m m itm en ts 20 30 a ba te m en t ba se d on c ur re nt co m m itm en ts 347kt CO2e 314kt CO2e Introduction Climate governance Gold Fields’ Decarbonisation Strategy and roadmap Resilience to climate change 2023 performance against targets Data and assurance TCFD Index Disclaimer and forward-looking statements Glossary Administration
Resilience to climate change IN THIS SECTION 21 Top climate-related risks and opportunities " 23 Physical risks " 26 Transition risks " Gold Fields CCR-20 Introduction Climate governance Gold Fields’ Decarbonisation Strategy and roadmap Resilience to climate change 2023 performance against targets Data and assurance TCFD Index Disclaimer and forward-looking statements Glossary Administration The reverse osmosis water plant at South Deep in South Africa
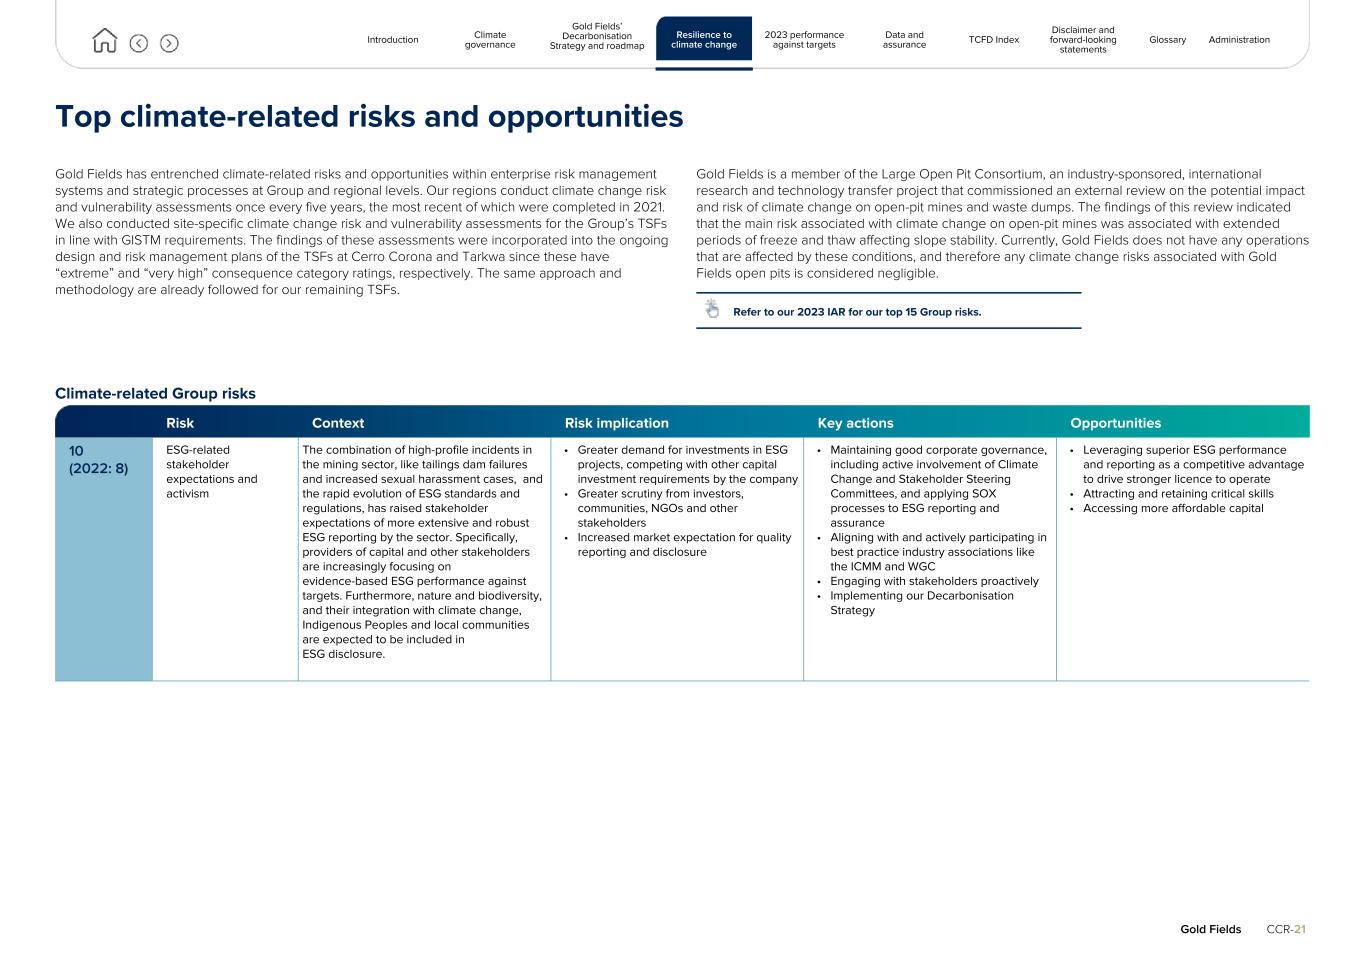
Top climate-related risks and opportunities Gold Fields has entrenched climate-related risks and opportunities within enterprise risk management systems and strategic processes at Group and regional levels. Our regions conduct climate change risk and vulnerability assessments once every five years, the most recent of which were completed in 2021. We also conducted site-specific climate change risk and vulnerability assessments for the Group’s TSFs in line with GISTM requirements. The findings of these assessments were incorporated into the ongoing design and risk management plans of the TSFs at Cerro Corona and Tarkwa since these have “extreme” and “very high” consequence category ratings, respectively. The same approach and methodology are already followed for our remaining TSFs. Gold Fields is a member of the Large Open Pit Consortium, an industry-sponsored, international research and technology transfer project that commissioned an external review on the potential impact and risk of climate change on open-pit mines and waste dumps. The findings of this review indicated that the main risk associated with climate change on open-pit mines was associated with extended periods of freeze and thaw affecting slope stability. Currently, Gold Fields does not have any operations that are affected by these conditions, and therefore any climate change risks associated with Gold Fields open pits is considered negligible. Refer to our 2023 IAR for our top 15 Group risks. Climate-related Group risks Risk Context Risk implication Key actions Opportunities 10 (2022: 8) ESG-related stakeholder expectations and activism The combination of high-profile incidents in the mining sector, like tailings dam failures and increased sexual harassment cases, and the rapid evolution of ESG standards and regulations, has raised stakeholder expectations of more extensive and robust ESG reporting by the sector. Specifically, providers of capital and other stakeholders are increasingly focusing on evidence-based ESG performance against targets. Furthermore, nature and biodiversity, and their integration with climate change, Indigenous Peoples and local communities are expected to be included in ESG disclosure. • Greater demand for investments in ESG projects, competing with other capital investment requirements by the company • Greater scrutiny from investors, communities, NGOs and other stakeholders • Increased market expectation for quality reporting and disclosure • Maintaining good corporate governance, including active involvement of Climate Change and Stakeholder Steering Committees, and applying SOX processes to ESG reporting and assurance • Aligning with and actively participating in best practice industry associations like the ICMM and WGC • Engaging with stakeholders proactively • Implementing our Decarbonisation Strategy • Leveraging superior ESG performance and reporting as a competitive advantage to drive stronger licence to operate • Attracting and retaining critical skills • Accessing more affordable capital Gold Fields CCR-21 Introduction Climate governance Gold Fields’ Decarbonisation Strategy and roadmap Resilience to climate change 2023 performance against targets Data and assurance TCFD Index Disclaimer and forward-looking statements Glossary Administration
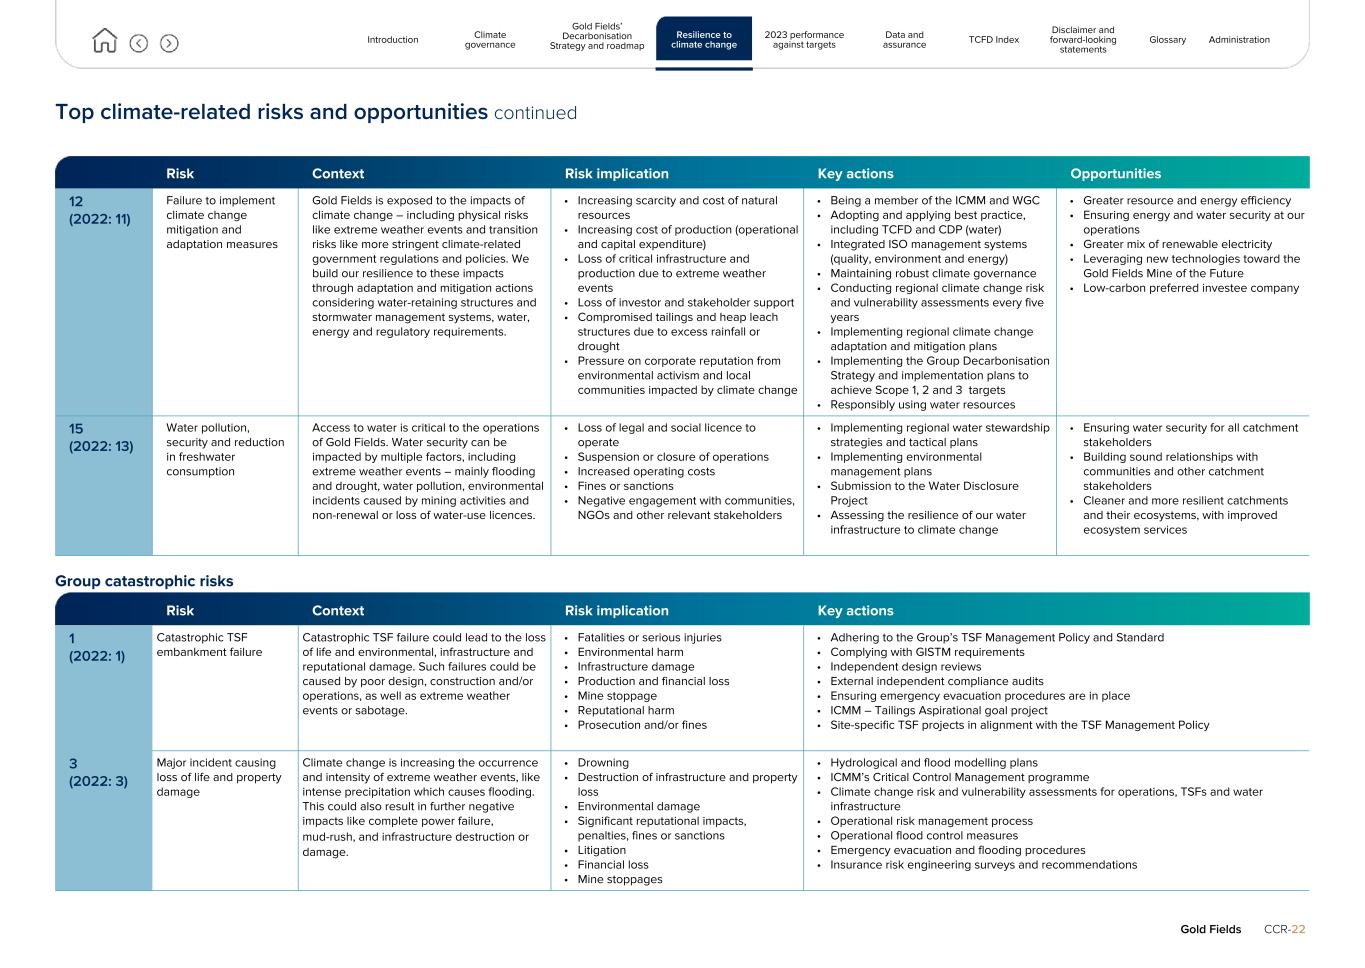
Top climate-related risks and opportunities continued Risk Context Risk implication Key actions Opportunities 12 (2022: 11) Failure to implement climate change mitigation and adaptation measures Gold Fields is exposed to the impacts of climate change – including physical risks like extreme weather events and transition risks like more stringent climate-related government regulations and policies. We build our resilience to these impacts through adaptation and mitigation actions considering water-retaining structures and stormwater management systems, water, energy and regulatory requirements. • Increasing scarcity and cost of natural resources • Increasing cost of production (operational and capital expenditure) • Loss of critical infrastructure and production due to extreme weather events • Loss of investor and stakeholder support • Compromised tailings and heap leach structures due to excess rainfall or drought • Pressure on corporate reputation from environmental activism and local communities impacted by climate change • Being a member of the ICMM and WGC • Adopting and applying best practice, including TCFD and CDP (water) • Integrated ISO management systems (quality, environment and energy) • Maintaining robust climate governance • Conducting regional climate change risk and vulnerability assessments every five years • Implementing regional climate change adaptation and mitigation plans • Implementing the Group Decarbonisation Strategy and implementation plans to achieve Scope 1, 2 and 3 targets • Responsibly using water resources • Greater resource and energy efficiency • Ensuring energy and water security at our operations • Greater mix of renewable electricity • Leveraging new technologies toward the Gold Fields Mine of the Future • Low-carbon preferred investee company 15 (2022: 13) Water pollution, security and reduction in freshwater consumption Access to water is critical to the operations of Gold Fields. Water security can be impacted by multiple factors, including extreme weather events – mainly flooding and drought, water pollution, environmental incidents caused by mining activities and non-renewal or loss of water-use licences. • Loss of legal and social licence to operate • Suspension or closure of operations • Increased operating costs • Fines or sanctions • Negative engagement with communities, NGOs and other relevant stakeholders • Implementing regional water stewardship strategies and tactical plans • Implementing environmental management plans • Submission to the Water Disclosure Project • Assessing the resilience of our water infrastructure to climate change • Ensuring water security for all catchment stakeholders • Building sound relationships with communities and other catchment stakeholders • Cleaner and more resilient catchments and their ecosystems, with improved ecosystem services Group catastrophic risks Risk Context Risk implication Key actions 1 (2022: 1) Catastrophic TSF embankment failure Catastrophic TSF failure could lead to the loss of life and environmental, infrastructure and reputational damage. Such failures could be caused by poor design, construction and/or operations, as well as extreme weather events or sabotage. • Fatalities or serious injuries • Environmental harm • Infrastructure damage • Production and financial loss • Mine stoppage • Reputational harm • Prosecution and/or fines • Adhering to the Group’s TSF Management Policy and Standard • Complying with GISTM requirements • Independent design reviews • External independent compliance audits • Ensuring emergency evacuation procedures are in place • ICMM – Tailings Aspirational goal project • Site-specific TSF projects in alignment with the TSF Management Policy 3 (2022: 3) Major incident causing loss of life and property damage Climate change is increasing the occurrence and intensity of extreme weather events, like intense precipitation which causes flooding. This could also result in further negative impacts like complete power failure, mud-rush, and infrastructure destruction or damage. • Drowning • Destruction of infrastructure and property loss • Environmental damage • Significant reputational impacts, penalties, fines or sanctions • Litigation • Financial loss • Mine stoppages • Hydrological and flood modelling plans • ICMM’s Critical Control Management programme • Climate change risk and vulnerability assessments for operations, TSFs and water infrastructure • Operational risk management process • Operational flood control measures • Emergency evacuation and flooding procedures • Insurance risk engineering surveys and recommendations Gold Fields CCR-22 Introduction Climate governance Gold Fields’ Decarbonisation Strategy and roadmap Resilience to climate change 2023 performance against targets Data and assurance TCFD Index Disclaimer and forward-looking statements Glossary Administration
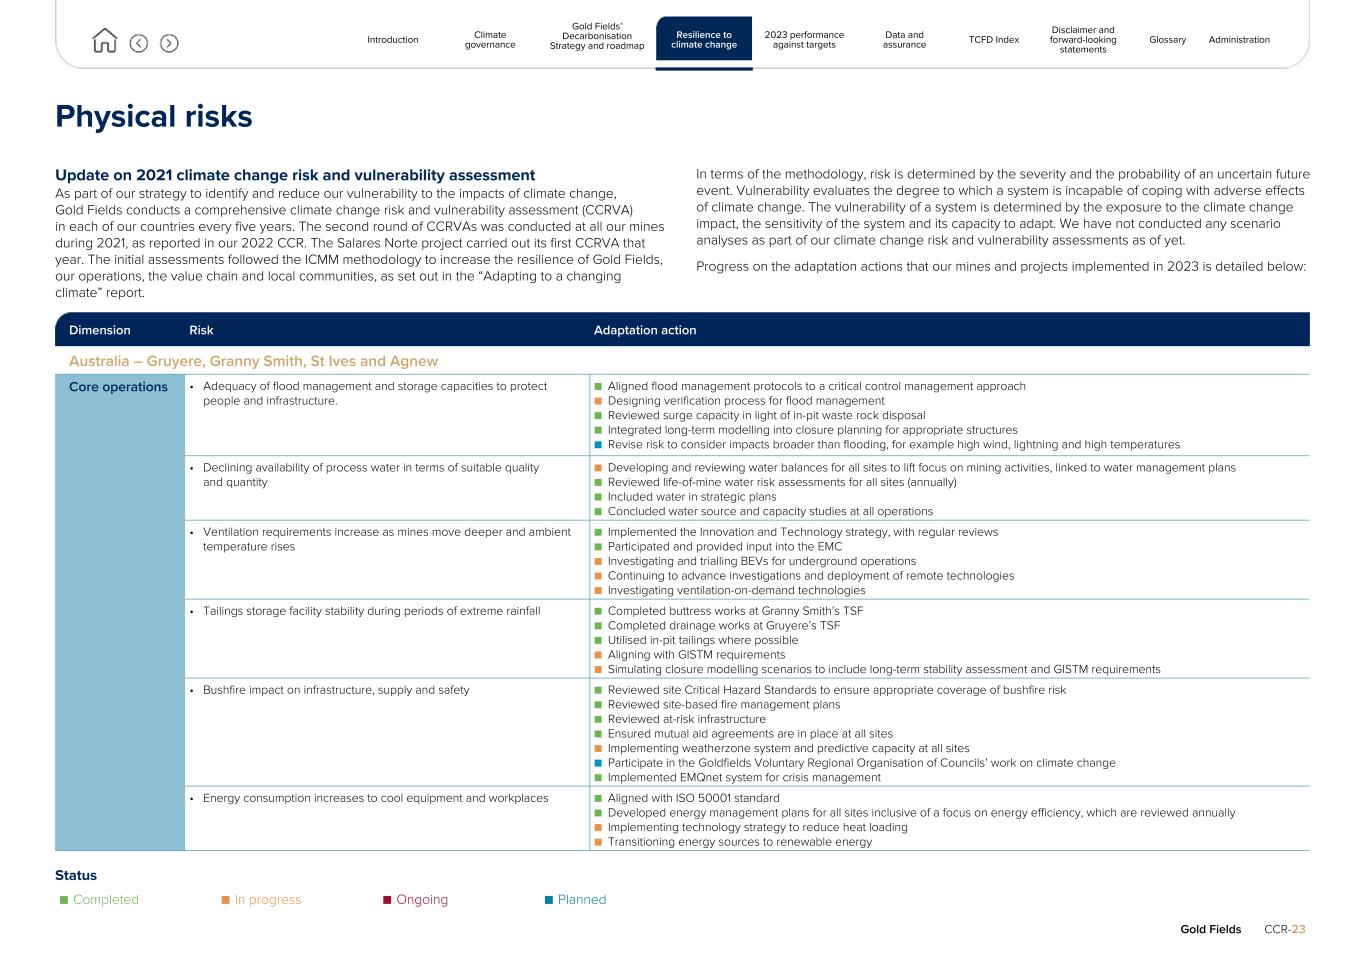
Physical risks Update on 2021 climate change risk and vulnerability assessment As part of our strategy to identify and reduce our vulnerability to the impacts of climate change, Gold Fields conducts a comprehensive climate change risk and vulnerability assessment (CCRVA) in each of our countries every five years. The second round of CCRVAs was conducted at all our mines during 2021, as reported in our 2022 CCR. The Salares Norte project carried out its first CCRVA that year. The initial assessments followed the ICMM methodology to increase the resilience of Gold Fields, our operations, the value chain and local communities, as set out in the “Adapting to a changing climate” report. In terms of the methodology, risk is determined by the severity and the probability of an uncertain future event. Vulnerability evaluates the degree to which a system is incapable of coping with adverse effects of climate change. The vulnerability of a system is determined by the exposure to the climate change impact, the sensitivity of the system and its capacity to adapt. We have not conducted any scenario analyses as part of our climate change risk and vulnerability assessments as of yet. Progress on the adaptation actions that our mines and projects implemented in 2023 is detailed below: Dimension Risk Adaptation action Australia – Gruyere, Granny Smith, St Ives and Agnew Core operations • Adequacy of flood management and storage capacities to protect people and infrastructure. ■ Aligned flood management protocols to a critical control management approach ■ Designing verification process for flood management ■ Reviewed surge capacity in light of in-pit waste rock disposal ■ Integrated long-term modelling into closure planning for appropriate structures ■ Revise risk to consider impacts broader than flooding, for example high wind, lightning and high temperatures • Declining availability of process water in terms of suitable quality and quantity ■ Developing and reviewing water balances for all sites to lift focus on mining activities, linked to water management plans ■ Reviewed life-of-mine water risk assessments for all sites (annually) ■ Included water in strategic plans ■ Concluded water source and capacity studies at all operations • Ventilation requirements increase as mines move deeper and ambient temperature rises ■ Implemented the Innovation and Technology strategy, with regular reviews ■ Participated and provided input into the EMC ■ Investigating and trialling BEVs for underground operations ■ Continuing to advance investigations and deployment of remote technologies ■ Investigating ventilation-on-demand technologies • Tailings storage facility stability during periods of extreme rainfall ■ Completed buttress works at Granny Smith’s TSF ■ Completed drainage works at Gruyere’s TSF ■ Utilised in-pit tailings where possible ■ Aligning with GISTM requirements ■ Simulating closure modelling scenarios to include long-term stability assessment and GISTM requirements • Bushfire impact on infrastructure, supply and safety ■ Reviewed site Critical Hazard Standards to ensure appropriate coverage of bushfire risk ■ Reviewed site-based fire management plans ■ Reviewed at-risk infrastructure ■ Ensured mutual aid agreements are in place at all sites ■ Implementing weatherzone system and predictive capacity at all sites ■ Participate in the Goldfields Voluntary Regional Organisation of Councils’ work on climate change ■ Implemented EMQnet system for crisis management • Energy consumption increases to cool equipment and workplaces ■ Aligned with ISO 50001 standard ■ Developed energy management plans for all sites inclusive of a focus on energy efficiency, which are reviewed annually ■ Implementing technology strategy to reduce heat loading ■ Transitioning energy sources to renewable energy Status ■ Completed ■ In progress ■ Ongoing ■ Planned Gold Fields CCR-23 Introduction Climate governance Gold Fields’ Decarbonisation Strategy and roadmap Resilience to climate change 2023 performance against targets Data and assurance TCFD Index Disclaimer and forward-looking statements Glossary Administration
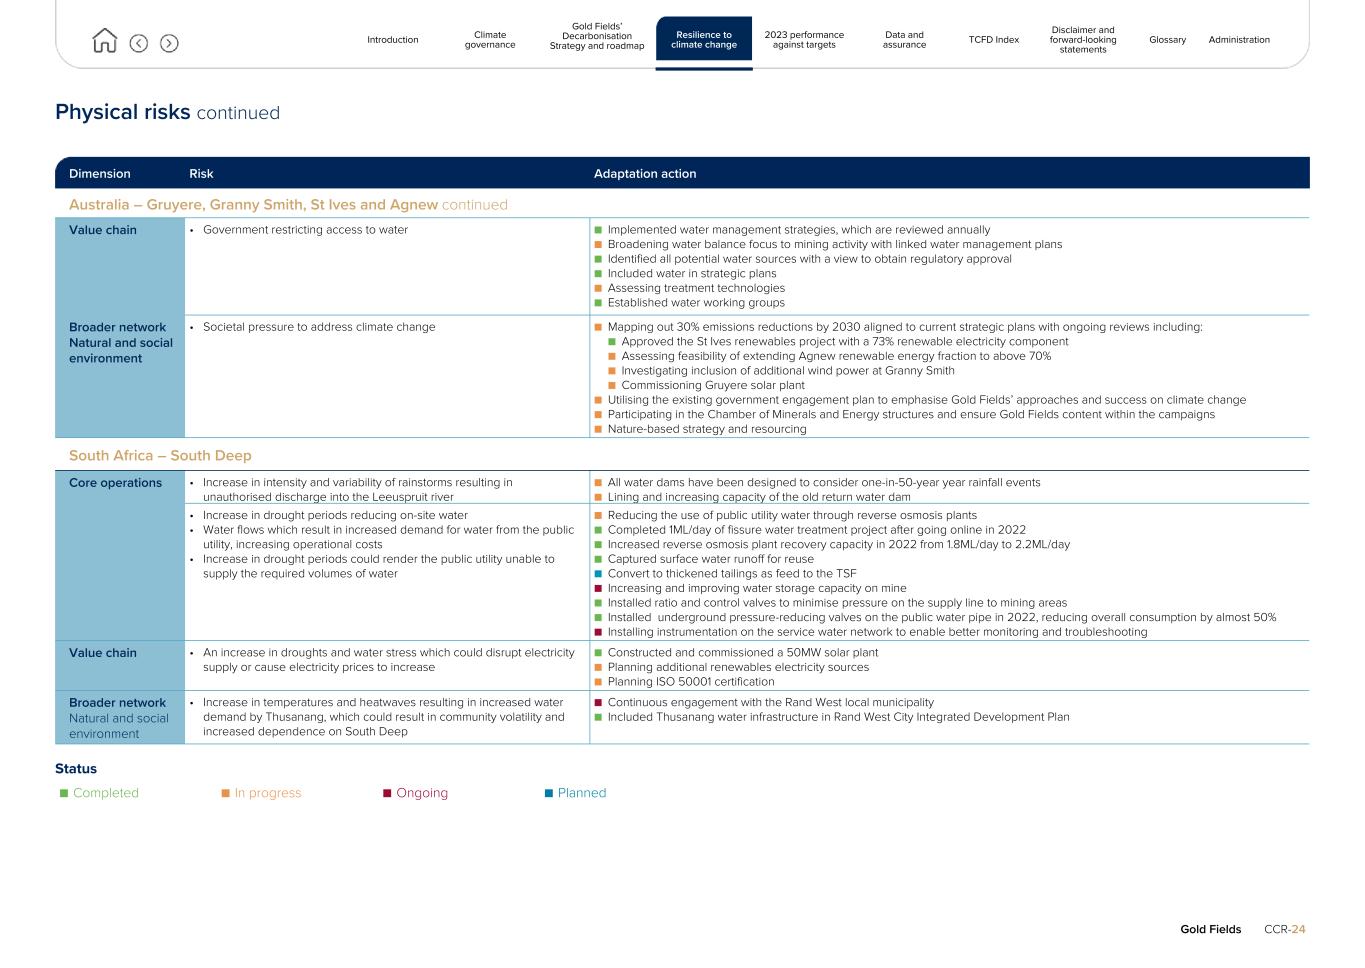
Physical risks continued Dimension Risk Adaptation action Australia – Gruyere, Granny Smith, St Ives and Agnew continued Value chain • Government restricting access to water ■ Implemented water management strategies, which are reviewed annually ■ Broadening water balance focus to mining activity with linked water management plans ■ Identified all potential water sources with a view to obtain regulatory approval ■ Included water in strategic plans ■ Assessing treatment technologies ■ Established water working groups Broader network Natural and social environment • Societal pressure to address climate change ■ Mapping out 30% emissions reductions by 2030 aligned to current strategic plans with ongoing reviews including: ■ Approved the St Ives renewables project with a 73% renewable electricity component ■ Assessing feasibility of extending Agnew renewable energy fraction to above 70% ■ Investigating inclusion of additional wind power at Granny Smith ■ Commissioning Gruyere solar plant ■ Utilising the existing government engagement plan to emphasise Gold Fields’ approaches and success on climate change ■ Participating in the Chamber of Minerals and Energy structures and ensure Gold Fields content within the campaigns ■ Nature-based strategy and resourcing South Africa – South Deep Core operations • Increase in intensity and variability of rainstorms resulting in unauthorised discharge into the Leeuspruit river ■ All water dams have been designed to consider one-in-50-year year rainfall events ■ Lining and increasing capacity of the old return water dam • Increase in drought periods reducing on-site water • Water flows which result in increased demand for water from the public utility, increasing operational costs • Increase in drought periods could render the public utility unable to supply the required volumes of water ■ Reducing the use of public utility water through reverse osmosis plants ■ Completed 1ML/day of fissure water treatment project after going online in 2022 ■ Increased reverse osmosis plant recovery capacity in 2022 from 1.8ML/day to 2.2ML/day ■ Captured surface water runoff for reuse ■ Convert to thickened tailings as feed to the TSF ■ Increasing and improving water storage capacity on mine ■ Installed ratio and control valves to minimise pressure on the supply line to mining areas ■ Installed underground pressure-reducing valves on the public water pipe in 2022, reducing overall consumption by almost 50% ■ Installing instrumentation on the service water network to enable better monitoring and troubleshooting Value chain • An increase in droughts and water stress which could disrupt electricity supply or cause electricity prices to increase ■ Constructed and commissioned a 50MW solar plant ■ Planning additional renewables electricity sources ■ Planning ISO 50001 certification Broader network Natural and social environment • Increase in temperatures and heatwaves resulting in increased water demand by Thusanang, which could result in community volatility and increased dependence on South Deep ■ Continuous engagement with the Rand West local municipality ■ Included Thusanang water infrastructure in Rand West City Integrated Development Plan Status ■ Completed ■ In progress ■ Ongoing ■ Planned Gold Fields CCR-24 Introduction Climate governance Gold Fields’ Decarbonisation Strategy and roadmap Resilience to climate change 2023 performance against targets Data and assurance TCFD Index Disclaimer and forward-looking statements Glossary Administration
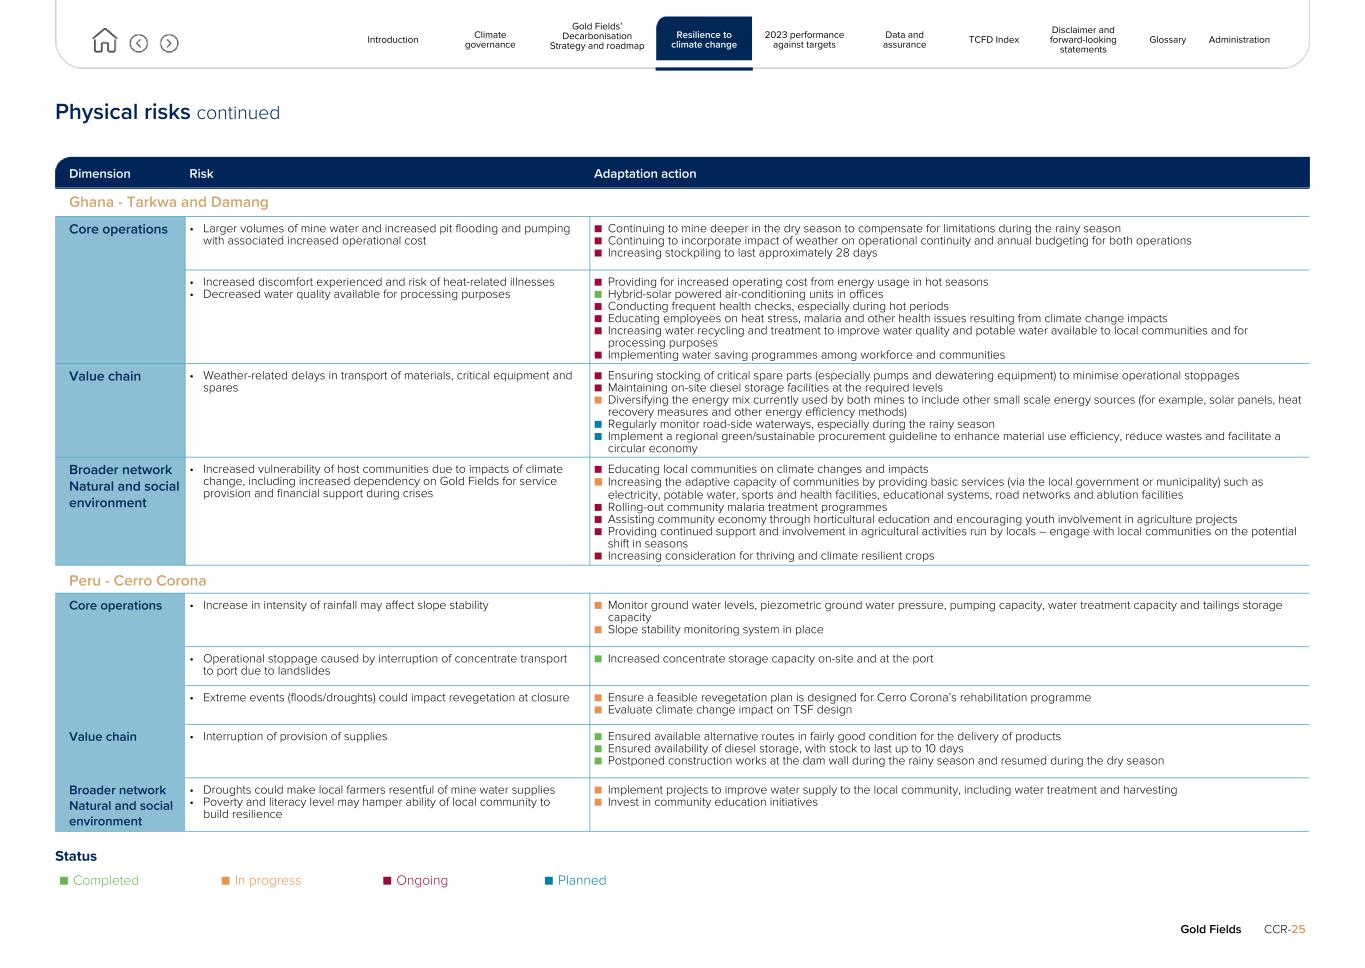
Physical risks continued Dimension Risk Adaptation action Ghana - Tarkwa and Damang Core operations • Larger volumes of mine water and increased pit flooding and pumping with associated increased operational cost ■ Continuing to mine deeper in the dry season to compensate for limitations during the rainy season ■ Continuing to incorporate impact of weather on operational continuity and annual budgeting for both operations ■ Increasing stockpiling to last approximately 28 days • Increased discomfort experienced and risk of heat-related illnesses • Decreased water quality available for processing purposes ■ Providing for increased operating cost from energy usage in hot seasons ■ Hybrid-solar powered air-conditioning units in offices ■ Conducting frequent health checks, especially during hot periods ■ Educating employees on heat stress, malaria and other health issues resulting from climate change impacts ■ Increasing water recycling and treatment to improve water quality and potable water available to local communities and for processing purposes ■ Implementing water saving programmes among workforce and communities Value chain • Weather-related delays in transport of materials, critical equipment and spares ■ Ensuring stocking of critical spare parts (especially pumps and dewatering equipment) to minimise operational stoppages ■ Maintaining on-site diesel storage facilities at the required levels ■ Diversifying the energy mix currently used by both mines to include other small scale energy sources (for example, solar panels, heat recovery measures and other energy efficiency methods) ■ Regularly monitor road-side waterways, especially during the rainy season ■ Implement a regional green/sustainable procurement guideline to enhance material use efficiency, reduce wastes and facilitate a circular economy Broader network Natural and social environment • Increased vulnerability of host communities due to impacts of climate change, including increased dependency on Gold Fields for service provision and financial support during crises ■ Educating local communities on climate changes and impacts ■ Increasing the adaptive capacity of communities by providing basic services (via the local government or municipality) such as electricity, potable water, sports and health facilities, educational systems, road networks and ablution facilities ■ Rolling-out community malaria treatment programmes ■ Assisting community economy through horticultural education and encouraging youth involvement in agriculture projects ■ Providing continued support and involvement in agricultural activities run by locals – engage with local communities on the potential shift in seasons ■ Increasing consideration for thriving and climate resilient crops Peru - Cerro Corona Core operations • Increase in intensity of rainfall may affect slope stability ■ Monitor ground water levels, piezometric ground water pressure, pumping capacity, water treatment capacity and tailings storage capacity ■ Slope stability monitoring system in place • Operational stoppage caused by interruption of concentrate transport to port due to landslides ■ Increased concentrate storage capacity on-site and at the port • Extreme events (floods/droughts) could impact revegetation at closure ■ Ensure a feasible revegetation plan is designed for Cerro Corona’s rehabilitation programme ■ Evaluate climate change impact on TSF design Value chain • Interruption of provision of supplies ■ Ensured available alternative routes in fairly good condition for the delivery of products ■ Ensured availability of diesel storage, with stock to last up to 10 days ■ Postponed construction works at the dam wall during the rainy season and resumed during the dry season Broader network Natural and social environment • Droughts could make local farmers resentful of mine water supplies • Poverty and literacy level may hamper ability of local community to build resilience ■ Implement projects to improve water supply to the local community, including water treatment and harvesting ■ Invest in community education initiatives Status ■ Completed ■ In progress ■ Ongoing ■ Planned Gold Fields CCR-25 Introduction Climate governance Gold Fields’ Decarbonisation Strategy and roadmap Resilience to climate change 2023 performance against targets Data and assurance TCFD Index Disclaimer and forward-looking statements Glossary Administration
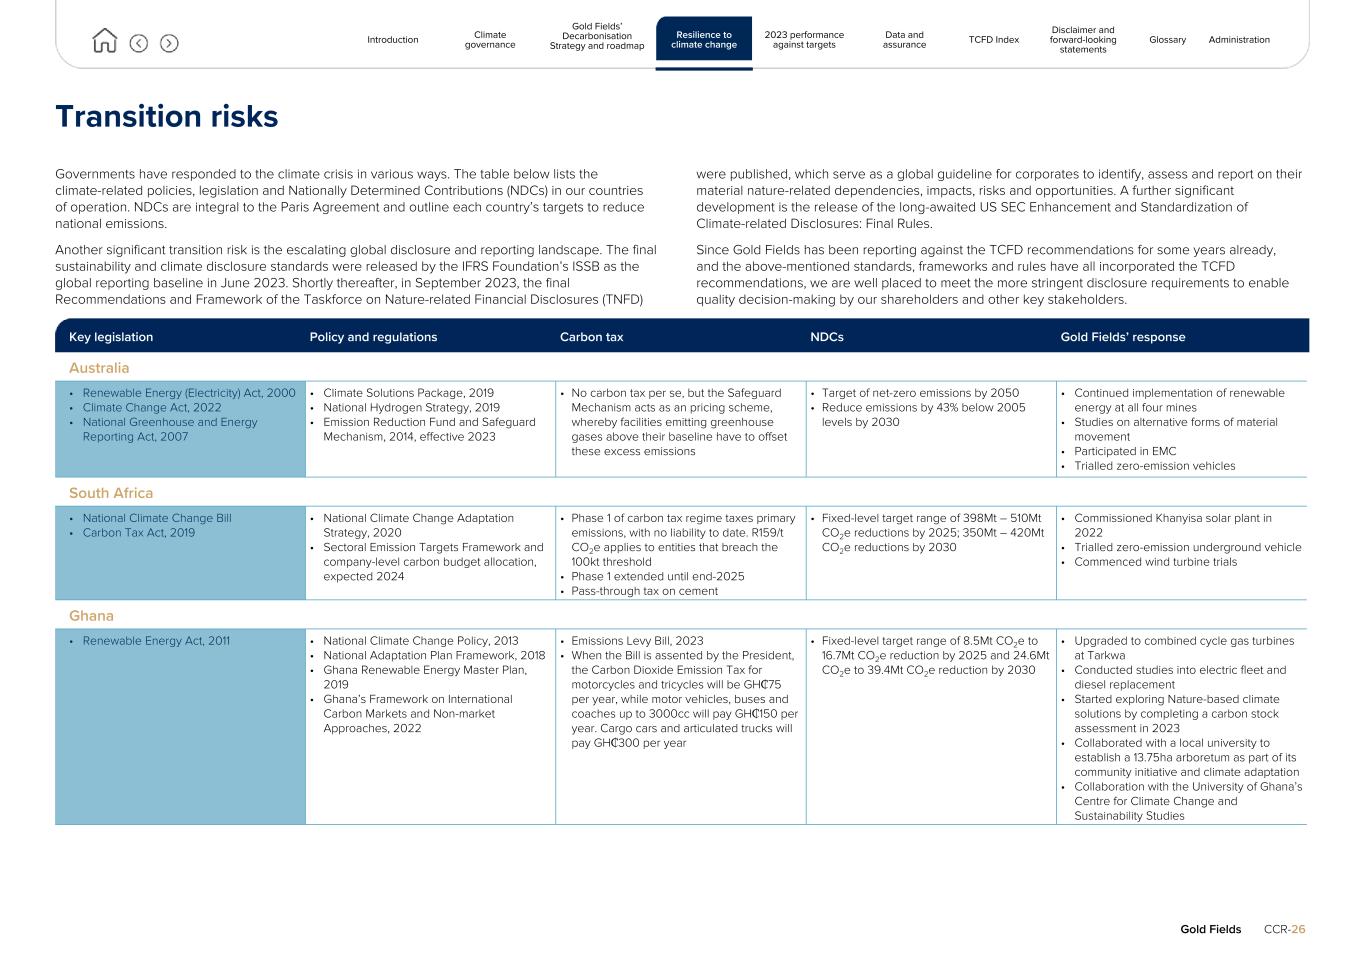
Transition risks Governments have responded to the climate crisis in various ways. The table below lists the climate-related policies, legislation and Nationally Determined Contributions (NDCs) in our countries of operation. NDCs are integral to the Paris Agreement and outline each country’s targets to reduce national emissions. Another significant transition risk is the escalating global disclosure and reporting landscape. The final sustainability and climate disclosure standards were released by the IFRS Foundation’s ISSB as the global reporting baseline in June 2023. Shortly thereafter, in September 2023, the final Recommendations and Framework of the Taskforce on Nature-related Financial Disclosures (TNFD) were published, which serve as a global guideline for corporates to identify, assess and report on their material nature-related dependencies, impacts, risks and opportunities. A further significant development is the release of the long-awaited US SEC Enhancement and Standardization of Climate-related Disclosures: Final Rules. Since Gold Fields has been reporting against the TCFD recommendations for some years already, and the above-mentioned standards, frameworks and rules have all incorporated the TCFD recommendations, we are well placed to meet the more stringent disclosure requirements to enable quality decision-making by our shareholders and other key stakeholders. Key legislation Policy and regulations Carbon tax NDCs Gold Fields’ response Australia • Renewable Energy (Electricity) Act, 2000 • Climate Change Act, 2022 • National Greenhouse and Energy Reporting Act, 2007 • Climate Solutions Package, 2019 • National Hydrogen Strategy, 2019 • Emission Reduction Fund and Safeguard Mechanism, 2014, effective 2023 • No carbon tax per se, but the Safeguard Mechanism acts as an pricing scheme, whereby facilities emitting greenhouse gases above their baseline have to offset these excess emissions • Target of net-zero emissions by 2050 • Reduce emissions by 43% below 2005 levels by 2030 • Continued implementation of renewable energy at all four mines • Studies on alternative forms of material movement • Participated in EMC • Trialled zero-emission vehicles South Africa • National Climate Change Bill • Carbon Tax Act, 2019 • National Climate Change Adaptation Strategy, 2020 • Sectoral Emission Targets Framework and company-level carbon budget allocation, expected 2024 • Phase 1 of carbon tax regime taxes primary emissions, with no liability to date. R159/t CO2e applies to entities that breach the 100kt threshold • Phase 1 extended until end-2025 • Pass-through tax on cement • Fixed-level target range of 398Mt – 510Mt CO2e reductions by 2025; 350Mt – 420Mt CO2e reductions by 2030 • Commissioned Khanyisa solar plant in 2022 • Trialled zero-emission underground vehicle • Commenced wind turbine trials Ghana • Renewable Energy Act, 2011 • National Climate Change Policy, 2013 • National Adaptation Plan Framework, 2018 • Ghana Renewable Energy Master Plan, 2019 • Ghana’s Framework on International Carbon Markets and Non-market Approaches, 2022 • Emissions Levy Bill, 2023 • When the Bill is assented by the President, the Carbon Dioxide Emission Tax for motorcycles and tricycles will be GH₵75 per year, while motor vehicles, buses and coaches up to 3000cc will pay GH₵150 per year. Cargo cars and articulated trucks will pay GH₵300 per year • Fixed-level target range of 8.5Mt CO2e to 16.7Mt CO2e reduction by 2025 and 24.6Mt CO2e to 39.4Mt CO2e reduction by 2030 • Upgraded to combined cycle gas turbines at Tarkwa • Conducted studies into electric fleet and diesel replacement • Started exploring Nature-based climate solutions by completing a carbon stock assessment in 2023 • Collaborated with a local university to establish a 13.75ha arboretum as part of its community initiative and climate adaptation • Collaboration with the University of Ghana’s Centre for Climate Change and Sustainability Studies Gold Fields CCR-26 Introduction Climate governance Gold Fields’ Decarbonisation Strategy and roadmap Resilience to climate change 2023 performance against targets Data and assurance TCFD Index Disclaimer and forward-looking statements Glossary Administration
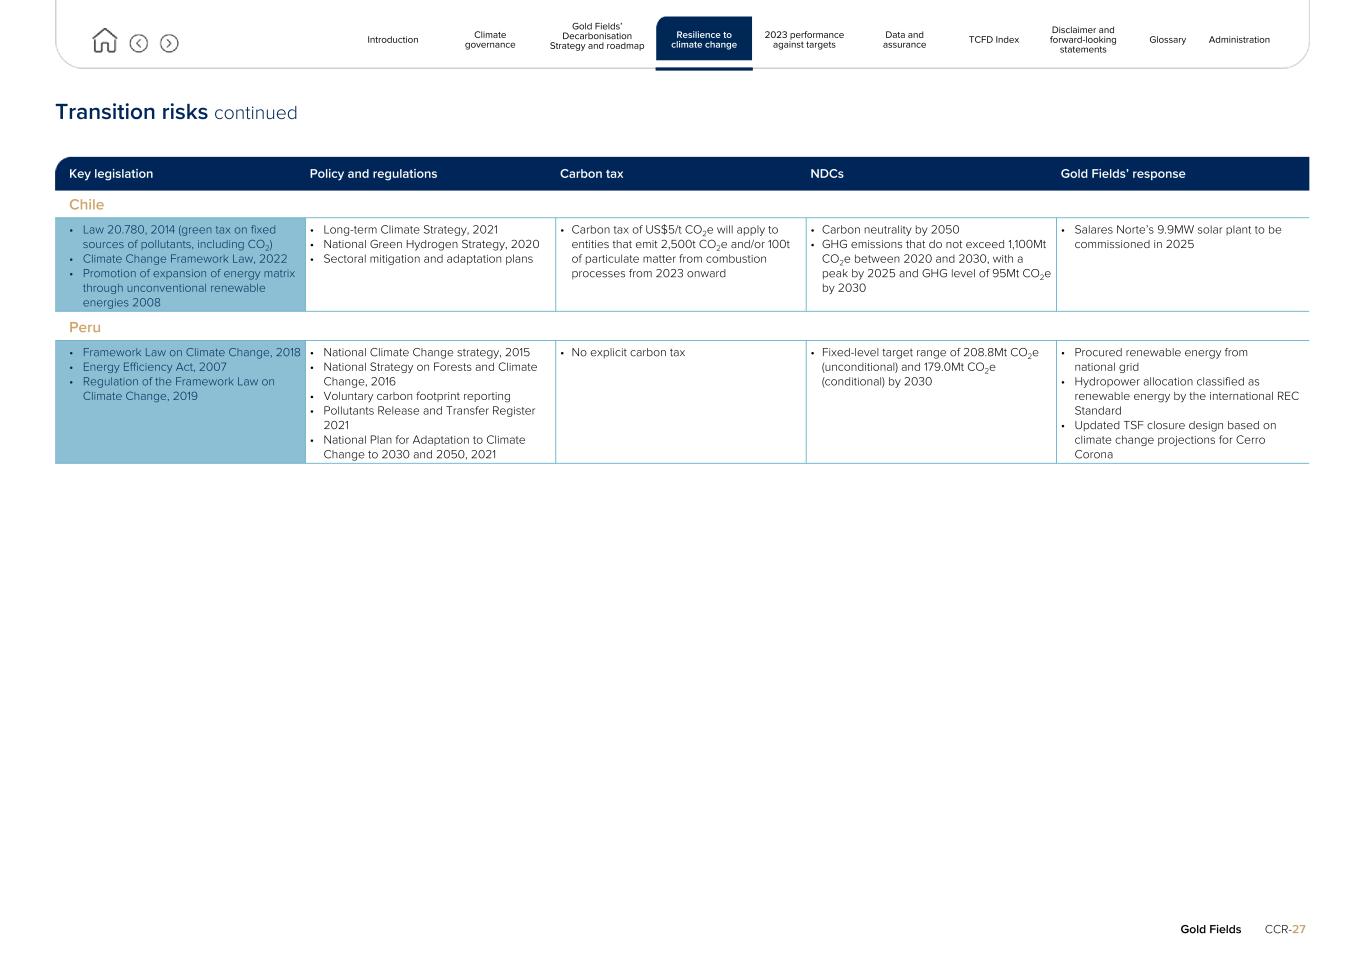
Transition risks continued Key legislation Policy and regulations Carbon tax NDCs Gold Fields’ response Chile • Law 20.780, 2014 (green tax on fixed sources of pollutants, including CO2) • Climate Change Framework Law, 2022 • Promotion of expansion of energy matrix through unconventional renewable energies 2008 • Long-term Climate Strategy, 2021 • National Green Hydrogen Strategy, 2020 • Sectoral mitigation and adaptation plans • Carbon tax of US$5/t CO2e will apply to entities that emit 2,500t CO2e and/or 100t of particulate matter from combustion processes from 2023 onward • Carbon neutrality by 2050 • GHG emissions that do not exceed 1,100Mt CO2e between 2020 and 2030, with a peak by 2025 and GHG level of 95Mt CO2e by 2030 • Salares Norte’s 9.9MW solar plant to be commissioned in 2025 Peru • Framework Law on Climate Change, 2018 • Energy Efficiency Act, 2007 • Regulation of the Framework Law on Climate Change, 2019 • National Climate Change strategy, 2015 • National Strategy on Forests and Climate Change, 2016 • Voluntary carbon footprint reporting • Pollutants Release and Transfer Register 2021 • National Plan for Adaptation to Climate Change to 2030 and 2050, 2021 • No explicit carbon tax • Fixed-level target range of 208.8Mt CO2e (unconditional) and 179.0Mt CO2e (conditional) by 2030 • Procured renewable energy from national grid • Hydropower allocation classified as renewable energy by the international REC Standard • Updated TSF closure design based on climate change projections for Cerro Corona Gold Fields CCR-27 Introduction Climate governance Gold Fields’ Decarbonisation Strategy and roadmap Resilience to climate change 2023 performance against targets Data and assurance TCFD Index Disclaimer and forward-looking statements Glossary Administration
2023 performance against targets IN THIS SECTION 29 Energy and carbon management " 31 Water stewardship " 33 TSF management " 34 Nature " Gold Fields CCR-28 Introduction Climate governance Gold Fields’ Decarbonisation Strategy and roadmap Resilience to climate change 2023 performance against targets Data and assurance TCFD Index Disclaimer and forward-looking statements Glossary Administration The tailings dam at our Cerro Corona mine in Peru
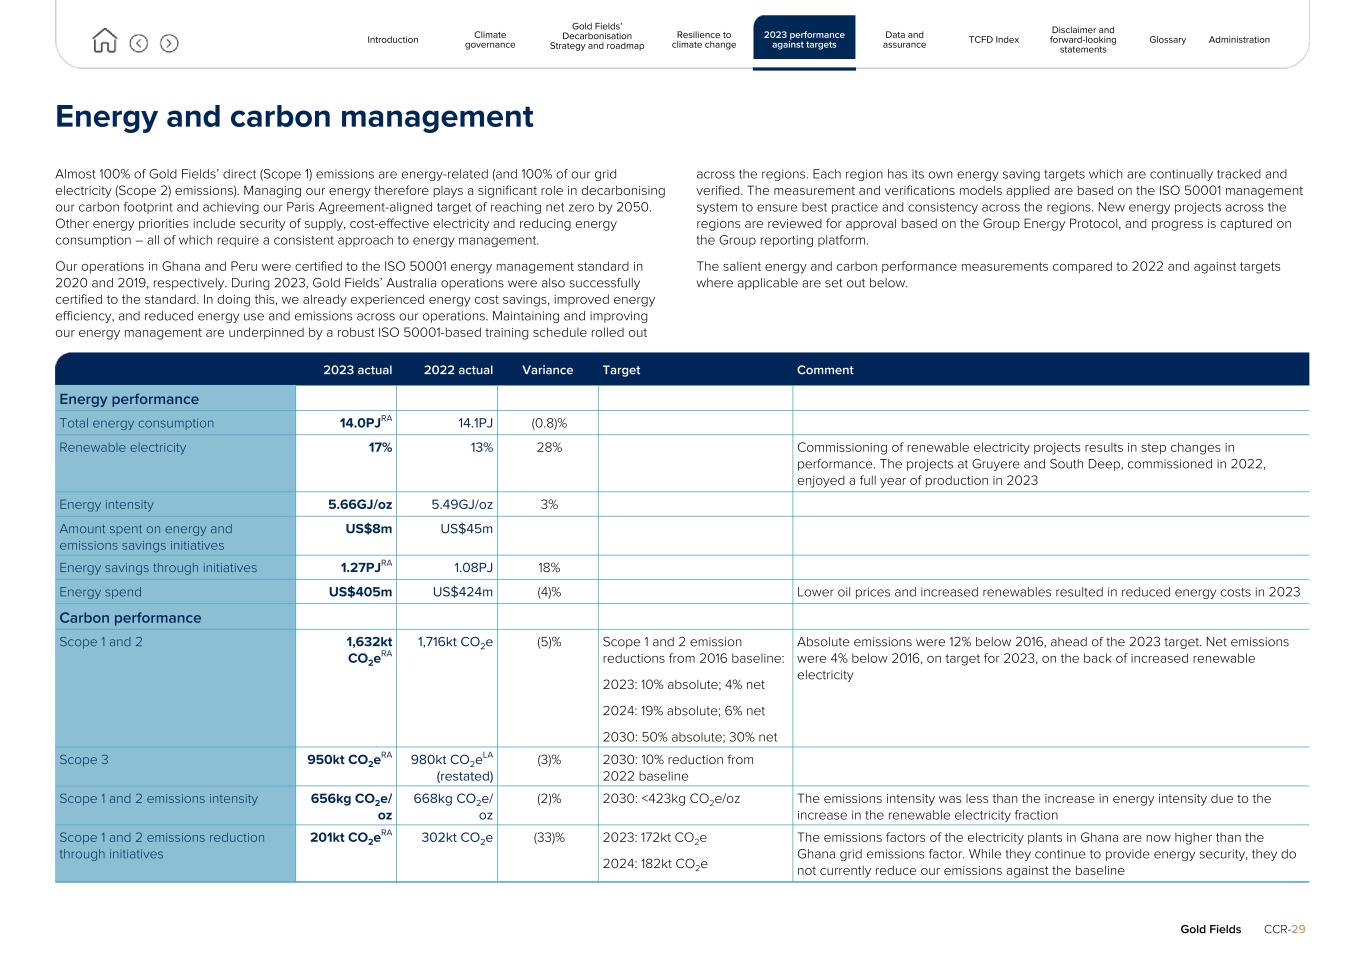
Energy and carbon management Almost 100% of Gold Fields’ direct (Scope 1) emissions are energy-related (and 100% of our grid electricity (Scope 2) emissions). Managing our energy therefore plays a significant role in decarbonising our carbon footprint and achieving our Paris Agreement-aligned target of reaching net zero by 2050. Other energy priorities include security of supply, cost-effective electricity and reducing energy consumption – all of which require a consistent approach to energy management. Our operations in Ghana and Peru were certified to the ISO 50001 energy management standard in 2020 and 2019, respectively. During 2023, Gold Fields’ Australia operations were also successfully certified to the standard. In doing this, we already experienced energy cost savings, improved energy efficiency, and reduced energy use and emissions across our operations. Maintaining and improving our energy management are underpinned by a robust ISO 50001-based training schedule rolled out across the regions. Each region has its own energy saving targets which are continually tracked and verified. The measurement and verifications models applied are based on the ISO 50001 management system to ensure best practice and consistency across the regions. New energy projects across the regions are reviewed for approval based on the Group Energy Protocol, and progress is captured on the Group reporting platform. The salient energy and carbon performance measurements compared to 2022 and against targets where applicable are set out below. 2023 actual 2022 actual Variance Target Comment Energy performance Total energy consumption 14.0PJRA 14.1PJ (0.8)% Renewable electricity 17% 13% 28% Commissioning of renewable electricity projects results in step changes in performance. The projects at Gruyere and South Deep, commissioned in 2022, enjoyed a full year of production in 2023 Energy intensity 5.66GJ/oz 5.49GJ/oz 3% Amount spent on energy and emissions savings initiatives US$8m US$45m Energy savings through initiatives 1.27PJRA 1.08PJ 18% Energy spend US$405m US$424m (4)% Lower oil prices and increased renewables resulted in reduced energy costs in 2023 Carbon performance Scope 1 and 2 1,632kt CO2eRA 1,716kt CO2e (5)% Scope 1 and 2 emission reductions from 2016 baseline: 2023: 10% absolute; 4% net 2024: 19% absolute; 6% net 2030: 50% absolute; 30% net Absolute emissions were 12% below 2016, ahead of the 2023 target. Net emissions were 4% below 2016, on target for 2023, on the back of increased renewable electricity Scope 3 950kt CO2eRA 980kt CO2eLA (restated) (3)% 2030: 10% reduction from 2022 baseline Scope 1 and 2 emissions intensity 656kg CO2e/ oz 668kg CO2e/ oz (2)% 2030: <423kg CO2e/oz The emissions intensity was less than the increase in energy intensity due to the increase in the renewable electricity fraction Scope 1 and 2 emissions reduction through initiatives 201kt CO2eRA 302kt CO2e (33)% 2023: 172kt CO2e 2024: 182kt CO2e The emissions factors of the electricity plants in Ghana are now higher than the Ghana grid emissions factor. While they continue to provide energy security, they do not currently reduce our emissions against the baseline Gold Fields CCR-29 Introduction Climate governance Gold Fields’ Decarbonisation Strategy and roadmap Resilience to climate change 2023 performance against targets Data and assurance TCFD Index Disclaimer and forward-looking statements Glossary Administration
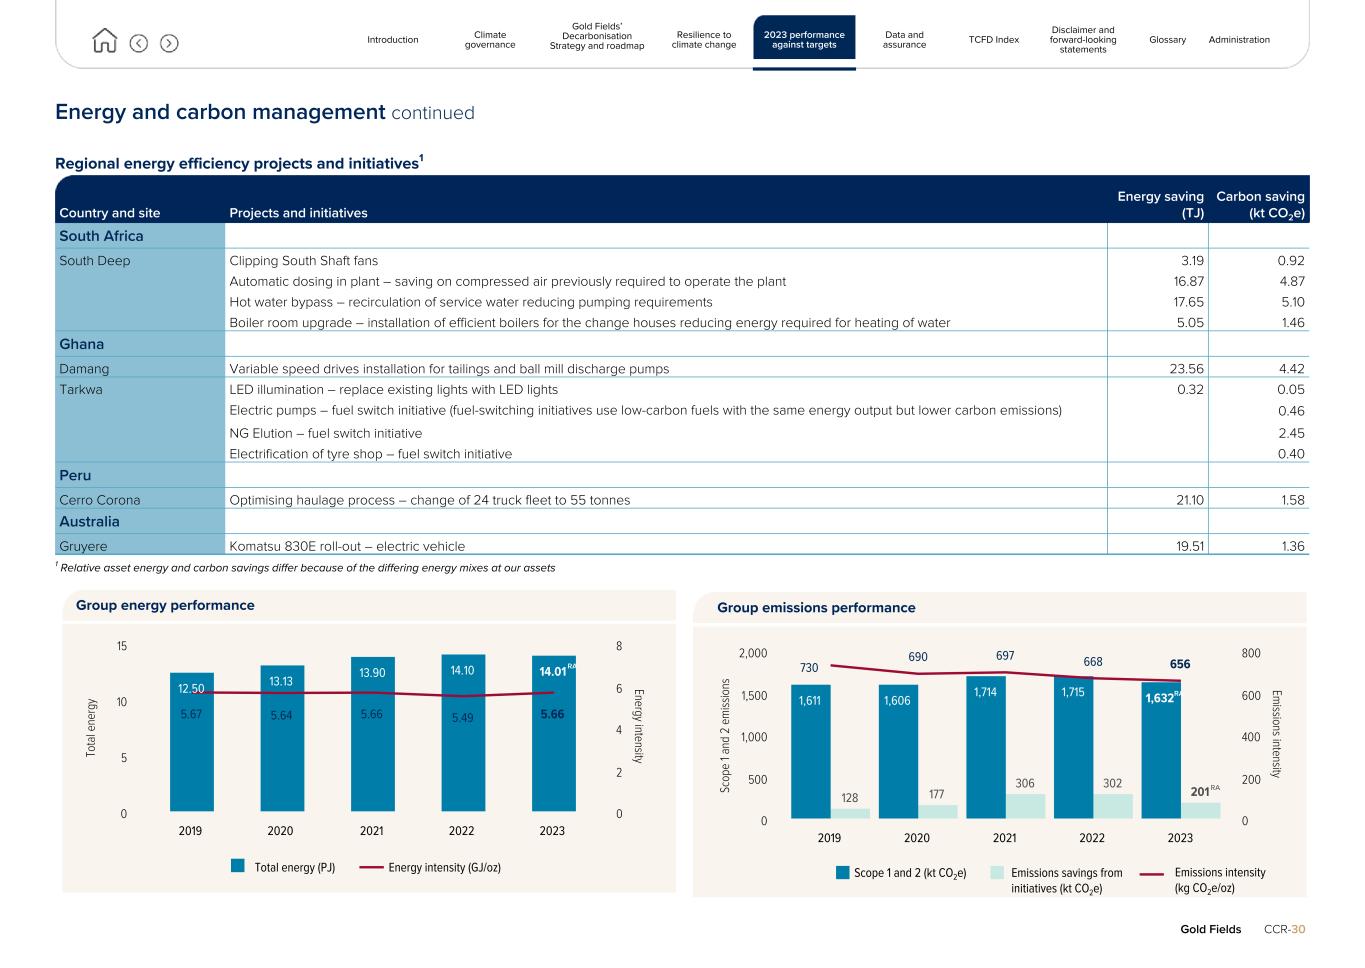
Energy and carbon management continued Regional energy efficiency projects and initiatives1 Country and site Projects and initiatives Energy saving (TJ) Carbon saving (kt CO2e) South Africa South Deep Clipping South Shaft fans 3.19 0.92 Automatic dosing in plant – saving on compressed air previously required to operate the plant 16.87 4.87 Hot water bypass – recirculation of service water reducing pumping requirements 17.65 5.10 Boiler room upgrade – installation of efficient boilers for the change houses reducing energy required for heating of water 5.05 1.46 Ghana Damang Variable speed drives installation for tailings and ball mill discharge pumps 23.56 4.42 Tarkwa LED illumination – replace existing lights with LED lights 0.32 0.05 Electric pumps – fuel switch initiative (fuel-switching initiatives use low-carbon fuels with the same energy output but lower carbon emissions) 0.46 NG Elution – fuel switch initiative 2.45 Electrification of tyre shop – fuel switch initiative 0.40 Peru Cerro Corona Optimising haulage process – change of 24 truck fleet to 55 tonnes 21.10 1.58 Australia Gruyere Komatsu 830E roll-out – electric vehicle 19.51 1.36 1 Relative asset energy and carbon savings differ because of the differing energy mixes at our assets Gold Fields CCR-30 To ta l e ne rg y Energy intensity 12.50 13.13 13.90 14.10 14.01 5.67 5.64 5.66 5.49 5.66 Total energy (PJ) Energy intensity (GJ/oz) 2019 2020 2021 2022 2023 0 5 10 15 0 2 4 6 8 Group energy performance Sc op e 1 a nd 2 e m iss io ns Em issions intensity 1,611 1,606 1,714 1,715 1,632 128 177 306 302 201 730 690 697 668 656 2019 2020 2021 2022 2023 0 500 1,000 1,500 2,000 0 200 400 600 800 Group emissions performance Scope 1 and 2 (kt CO2e) Emissions savings from initiatives (kt CO2e) Emissions intensity (kg CO2e/oz) RA RA RA Introduction Climate governance Gold Fields’ Decarbonisation Strategy and roadmap Resilience to climate change 2023 performance against targets Data and assurance TCFD Index Disclaimer and forward-looking statements Glossary Administration
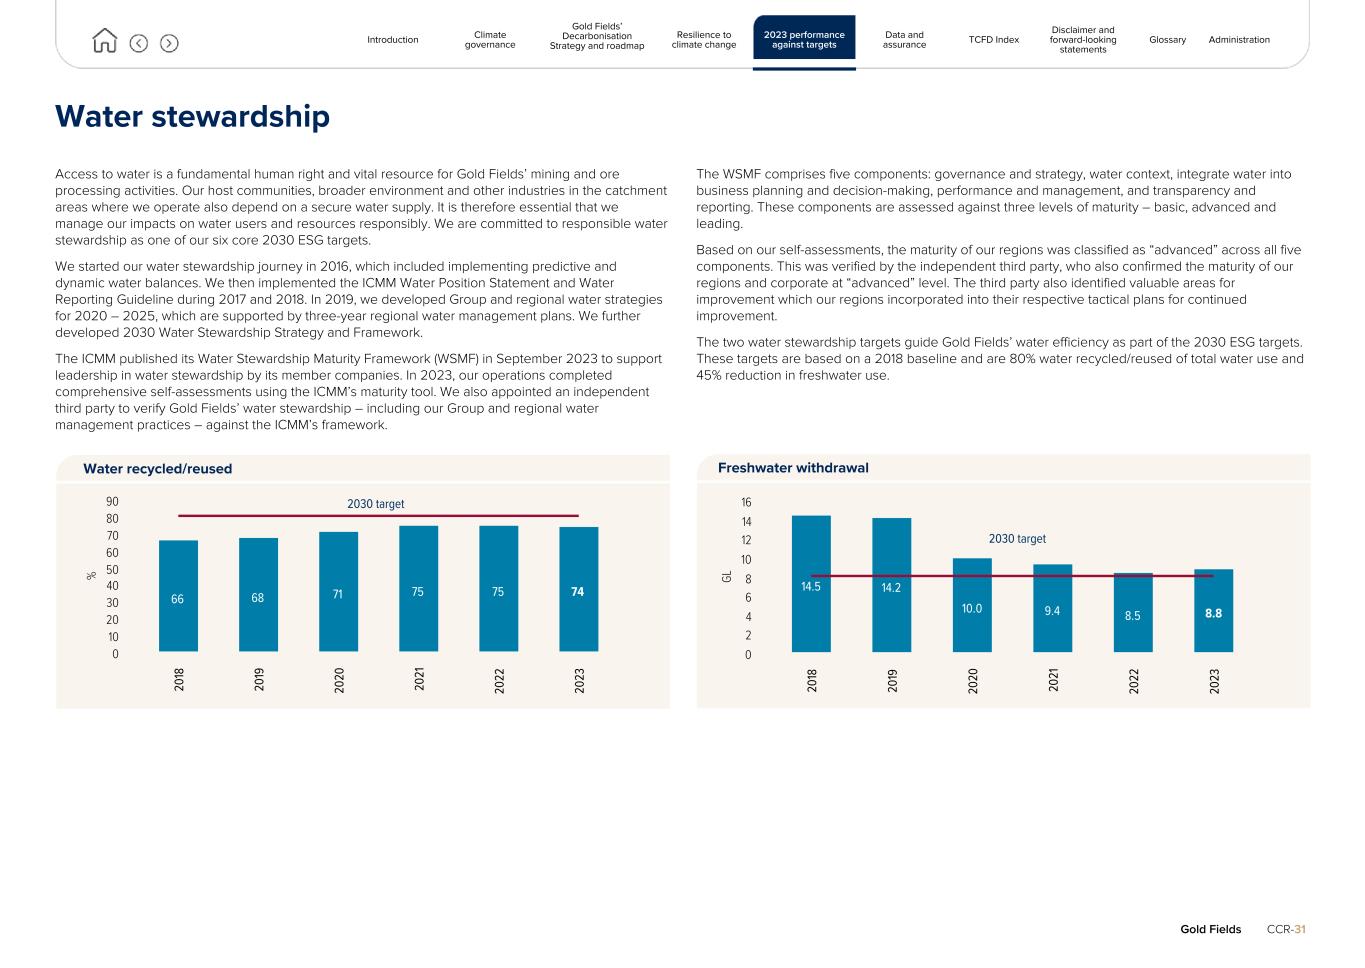
Water stewardship Access to water is a fundamental human right and vital resource for Gold Fields’ mining and ore processing activities. Our host communities, broader environment and other industries in the catchment areas where we operate also depend on a secure water supply. It is therefore essential that we manage our impacts on water users and resources responsibly. We are committed to responsible water stewardship as one of our six core 2030 ESG targets. We started our water stewardship journey in 2016, which included implementing predictive and dynamic water balances. We then implemented the ICMM Water Position Statement and Water Reporting Guideline during 2017 and 2018. In 2019, we developed Group and regional water strategies for 2020 – 2025, which are supported by three-year regional water management plans. We further developed 2030 Water Stewardship Strategy and Framework. The ICMM published its Water Stewardship Maturity Framework (WSMF) in September 2023 to support leadership in water stewardship by its member companies. In 2023, our operations completed comprehensive self-assessments using the ICMM’s maturity tool. We also appointed an independent third party to verify Gold Fields’ water stewardship – including our Group and regional water management practices – against the ICMM’s framework. The WSMF comprises five components: governance and strategy, water context, integrate water into business planning and decision-making, performance and management, and transparency and reporting. These components are assessed against three levels of maturity – basic, advanced and leading. Based on our self-assessments, the maturity of our regions was classified as “advanced” across all five components. This was verified by the independent third party, who also confirmed the maturity of our regions and corporate at “advanced” level. The third party also identified valuable areas for improvement which our regions incorporated into their respective tactical plans for continued improvement. The two water stewardship targets guide Gold Fields’ water efficiency as part of the 2030 ESG targets. These targets are based on a 2018 baseline and are 80% water recycled/reused of total water use and 45% reduction in freshwater use. Gold Fields CCR-31 % 66 68 71 75 75 74 20 18 20 19 20 20 20 21 20 22 20 23 0 10 20 30 40 50 60 70 80 90 Water recycled/reused GL 14.5 14.2 10.0 9.4 8.5 8.8 20 18 20 19 20 20 20 21 20 22 20 23 0 2 4 6 8 10 12 14 16 Freshwater withdrawal 2030 target 2030 target Introduction Climate governance Gold Fields’ Decarbonisation Strategy and roadmap Resilience to climate change 2023 performance against targets Data and assurance TCFD Index Disclaimer and forward-looking statements Glossary Administration
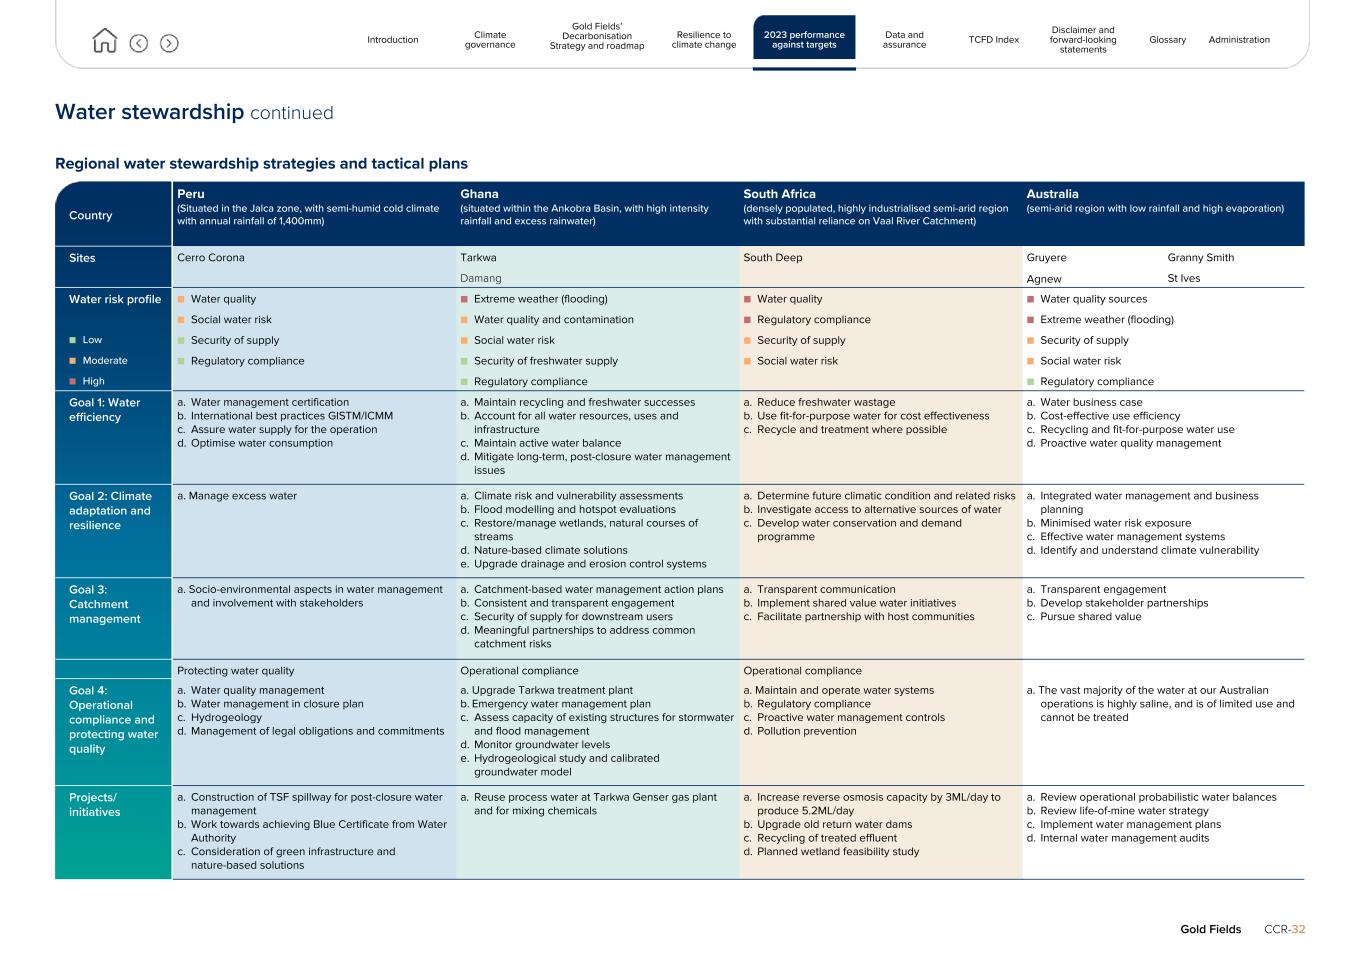
Water stewardship continued Regional water stewardship strategies and tactical plans Country Peru (Situated in the Jalca zone, with semi-humid cold climate with annual rainfall of 1,400mm) Ghana (situated within the Ankobra Basin, with high intensity rainfall and excess rainwater) South Africa (densely populated, highly industrialised semi-arid region with substantial reliance on Vaal River Catchment) Australia (semi-arid region with low rainfall and high evaporation) Sites Cerro Corona Tarkwa South Deep Gruyere Granny Smith Damang Agnew St Ives Water risk profile ■ Water quality ■ Extreme weather (flooding) ■ Water quality ■ Water quality sources ■ Social water risk ■ Water quality and contamination ■ Regulatory compliance ■ Extreme weather (flooding) ■ Low ■ Security of supply ■ Social water risk ■ Security of supply ■ Security of supply ■ Moderate ■ Regulatory compliance ■ Security of freshwater supply ■ Social water risk ■ Social water risk ■ High ■ Regulatory compliance ■ Regulatory compliance Goal 1: Water efficiency a. Water management certification b. International best practices GISTM/ICMM c. Assure water supply for the operation d. Optimise water consumption a. Maintain recycling and freshwater successes b. Account for all water resources, uses and infrastructure c. Maintain active water balance d. Mitigate long-term, post-closure water management issues a. Reduce freshwater wastage b. Use fit-for-purpose water for cost effectiveness c. Recycle and treatment where possible a. Water business case b. Cost-effective use efficiency c. Recycling and fit-for-purpose water use d. Proactive water quality management Goal 2: Climate adaptation and resilience a. Manage excess water a. Climate risk and vulnerability assessments b. Flood modelling and hotspot evaluations c. Restore/manage wetlands, natural courses of streams d. Nature-based climate solutions e. Upgrade drainage and erosion control systems a. Determine future climatic condition and related risks b. Investigate access to alternative sources of water c. Develop water conservation and demand programme a. Integrated water management and business planning b. Minimised water risk exposure c. Effective water management systems d. Identify and understand climate vulnerability Goal 3: Catchment management a. Socio-environmental aspects in water management and involvement with stakeholders a. Catchment-based water management action plans b. Consistent and transparent engagement c. Security of supply for downstream users d. Meaningful partnerships to address common catchment risks a. Transparent communication b. Implement shared value water initiatives c. Facilitate partnership with host communities a. Transparent engagement b. Develop stakeholder partnerships c. Pursue shared value Protecting water quality Operational compliance Operational compliance Goal 4: Operational compliance and protecting water quality a. Water quality management b. Water management in closure plan c. Hydrogeology d. Management of legal obligations and commitments a. Upgrade Tarkwa treatment plant b. Emergency water management plan c. Assess capacity of existing structures for stormwater and flood management d. Monitor groundwater levels e. Hydrogeological study and calibrated groundwater model a. Maintain and operate water systems b. Regulatory compliance c. Proactive water management controls d. Pollution prevention a. The vast majority of the water at our Australian operations is highly saline, and is of limited use and cannot be treated Projects/ initiatives a. Construction of TSF spillway for post-closure water management b. Work towards achieving Blue Certificate from Water Authority c. Consideration of green infrastructure and nature-based solutions a. Reuse process water at Tarkwa Genser gas plant and for mixing chemicals a. Increase reverse osmosis capacity by 3ML/day to produce 5.2ML/day b. Upgrade old return water dams c. Recycling of treated effluent d. Planned wetland feasibility study a. Review operational probabilistic water balances b. Review life-of-mine water strategy c. Implement water management plans d. Internal water management audits Gold Fields CCR-32 Introduction Climate governance Gold Fields’ Decarbonisation Strategy and roadmap Resilience to climate change 2023 performance against targets Data and assurance TCFD Index Disclaimer and forward-looking statements Glossary Administration
Tailings storage facility management 2030 targets: • All remaining TSFs conform with the GISTM by 2025 • Maintain conformance with the GISTM • Reduce the number of active upstream-raised TSFs from five to three Conformance with the GISTM The ICMM launched the GISTM in August 2020 as part of its vision to improve sustainable development in the mining and metals industry. The GISTM provides a new, international best practice for governance, engineering, environmental and social aspects of tailings management and emphasises the importance of proper and meaningful engagement with affected stakeholders throughout the lifecycle of the tailings facility. Member companies had until August 2023 to fully comply with the requirements for tailings facilities classified as having “extreme” or “very high” potential consequences, and August 2025 for all other facilities. The GISTM framework comprises six key topics to assist companies in achieving and maintaining safe and stable TSFs throughout their lifecycle, including the design, operation, closure and post-closure. Golds Fields played an active part in the conceptualisation of the GISTM and fully embraces the step-change in tailings safety that the GISTM will bring about. Our Cerro Corona TSF has an “extreme” consequence category rating, and Tarkwa’s TSFs 1, 2 and 3 are "very high” consequence classification facilities. Consequently, the teams at Cerro Corona and Tarkwa spent the last three years working diligently to conform with the GISTM requirements. Achieving full conformance requires the completion of over 220 physical deliverables and documents, each of which constitutes an independent project. Tarkwa and Cerro Corona achieved 85% conformance with the 219 requirement parts of the GISTM. It is key to note is that all significant dam safety and environmental-related requirements were identified, addressed and effectively managed. For Tarkwa’s GISTM Annual Disclosure Report, refer to https://www.goldfields.com/pdf/sustainbility/ sustainability-reporting/gistm/tarkwa-gistm-disclosure-report-2023.pdf and, for Cerro Corona, refer to https://www.goldfields.com/pdf/sustainbility/sustainability-reporting/gistm/cerro-corona-2023-disclosure- report-2023.pdf. Future GISTM disclosures will be made in March each year as part of our annual reporting. Climate change risk assessment Gold Fields appointed an independent third party to conduct a baseline meteorological and projected climate change study in 2023, including the development of a climate change risk assessment framework for consistent, but site-specific, application. Data was sourced from site-specific meteorological stations and bolstered with regional and national meteorological data. These records were augmented with climatic gridded models and worldwide physical/mathematical models for the whole planet or a specific region. The baseline study and resulting data modelling included a few parameters, namely total precipitation, air temperature and dew point temperature, relative humidity, wind speed, short-wave solar radiation and evaporation. The framework enabled Gold Fields to identify and evaluate potential hazards associated with climate change, which could impact existing or planned TSFs and related infrastructure. Since the Cerro Corona and Tarkwa TSFs are unique in their consequence category classifications, these climate change risk assessment findings were incorporated into the ongoing design and design and risk management plans of the TSFs in accordance with GISTM requirements. Likewise, the vulnerability (risk) or resilience (margin) in terms of TSF dam safety will be assessed for all remaining TSFs, the findings of which will be incorporated into all new designs and further studies to meet the GISTM deadline of August 2025. During 2023, Gold Fields commissioned a review of the impact of severe weather on our TSFs and how we can improve them to prevent possible catastrophic failures. The study comprised two phases, namely: • Phase 1: Developing a framework for evaluating climate change risk that can be applied across all Gold Fields’ operations and projects • Phase 2: Developing a climate baseline and evaluating the effects of climate change on the different sites and infrastructure. New TSF studies and designs are already considering the latest climate change predictions Gold Fields CCR-33 Introduction Climate governance Gold Fields’ Decarbonisation Strategy and roadmap Resilience to climate change 2023 performance against targets Data and assurance TCFD Index Disclaimer and forward-looking statements Glossary Administration
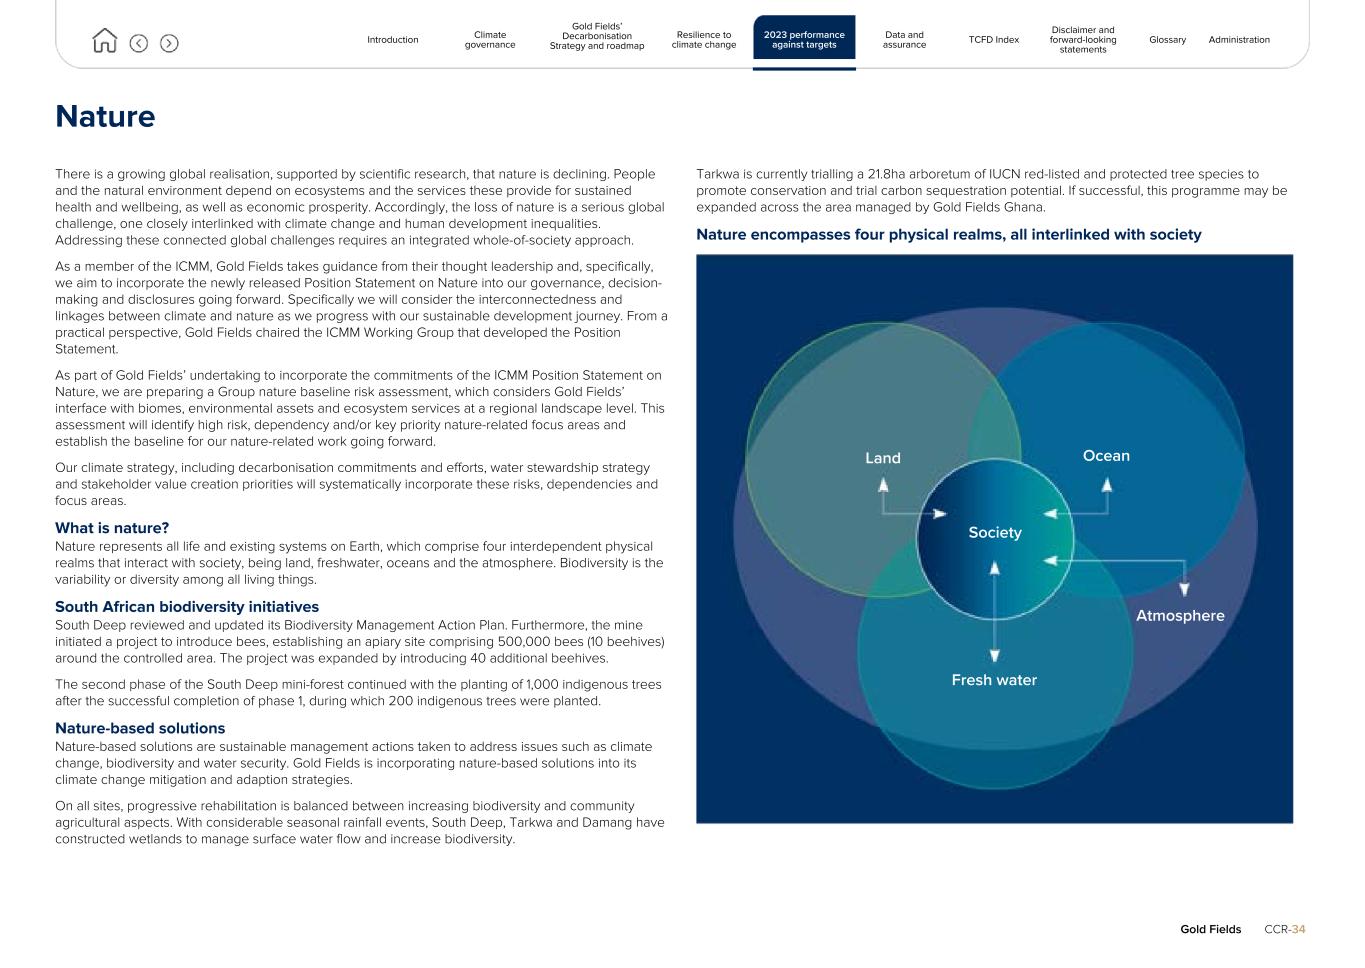
Nature There is a growing global realisation, supported by scientific research, that nature is declining. People and the natural environment depend on ecosystems and the services these provide for sustained health and wellbeing, as well as economic prosperity. Accordingly, the loss of nature is a serious global challenge, one closely interlinked with climate change and human development inequalities. Addressing these connected global challenges requires an integrated whole-of-society approach. As a member of the ICMM, Gold Fields takes guidance from their thought leadership and, specifically, we aim to incorporate the newly released Position Statement on Nature into our governance, decision- making and disclosures going forward. Specifically we will consider the interconnectedness and linkages between climate and nature as we progress with our sustainable development journey. From a practical perspective, Gold Fields chaired the ICMM Working Group that developed the Position Statement. As part of Gold Fields’ undertaking to incorporate the commitments of the ICMM Position Statement on Nature, we are preparing a Group nature baseline risk assessment, which considers Gold Fields’ interface with biomes, environmental assets and ecosystem services at a regional landscape level. This assessment will identify high risk, dependency and/or key priority nature-related focus areas and establish the baseline for our nature-related work going forward. Our climate strategy, including decarbonisation commitments and efforts, water stewardship strategy and stakeholder value creation priorities will systematically incorporate these risks, dependencies and focus areas. What is nature? Nature represents all life and existing systems on Earth, which comprise four interdependent physical realms that interact with society, being land, freshwater, oceans and the atmosphere. Biodiversity is the variability or diversity among all living things. South African biodiversity initiatives South Deep reviewed and updated its Biodiversity Management Action Plan. Furthermore, the mine initiated a project to introduce bees, establishing an apiary site comprising 500,000 bees (10 beehives) around the controlled area. The project was expanded by introducing 40 additional beehives. The second phase of the South Deep mini-forest continued with the planting of 1,000 indigenous trees after the successful completion of phase 1, during which 200 indigenous trees were planted. Nature-based solutions Nature-based solutions are sustainable management actions taken to address issues such as climate change, biodiversity and water security. Gold Fields is incorporating nature-based solutions into its climate change mitigation and adaption strategies. On all sites, progressive rehabilitation is balanced between increasing biodiversity and community agricultural aspects. With considerable seasonal rainfall events, South Deep, Tarkwa and Damang have constructed wetlands to manage surface water flow and increase biodiversity. Tarkwa is currently trialling a 21.8ha arboretum of IUCN red-listed and protected tree species to promote conservation and trial carbon sequestration potential. If successful, this programme may be expanded across the area managed by Gold Fields Ghana. Nature encompasses four physical realms, all interlinked with society Gold Fields CCR-34 Land Ocean Society Fresh water Atmosphere Introduction Climate governance Gold Fields’ Decarbonisation Strategy and roadmap Resilience to climate change 2023 performance against targets Data and assurance TCFD Index Disclaimer and forward-looking statements Glossary Administration
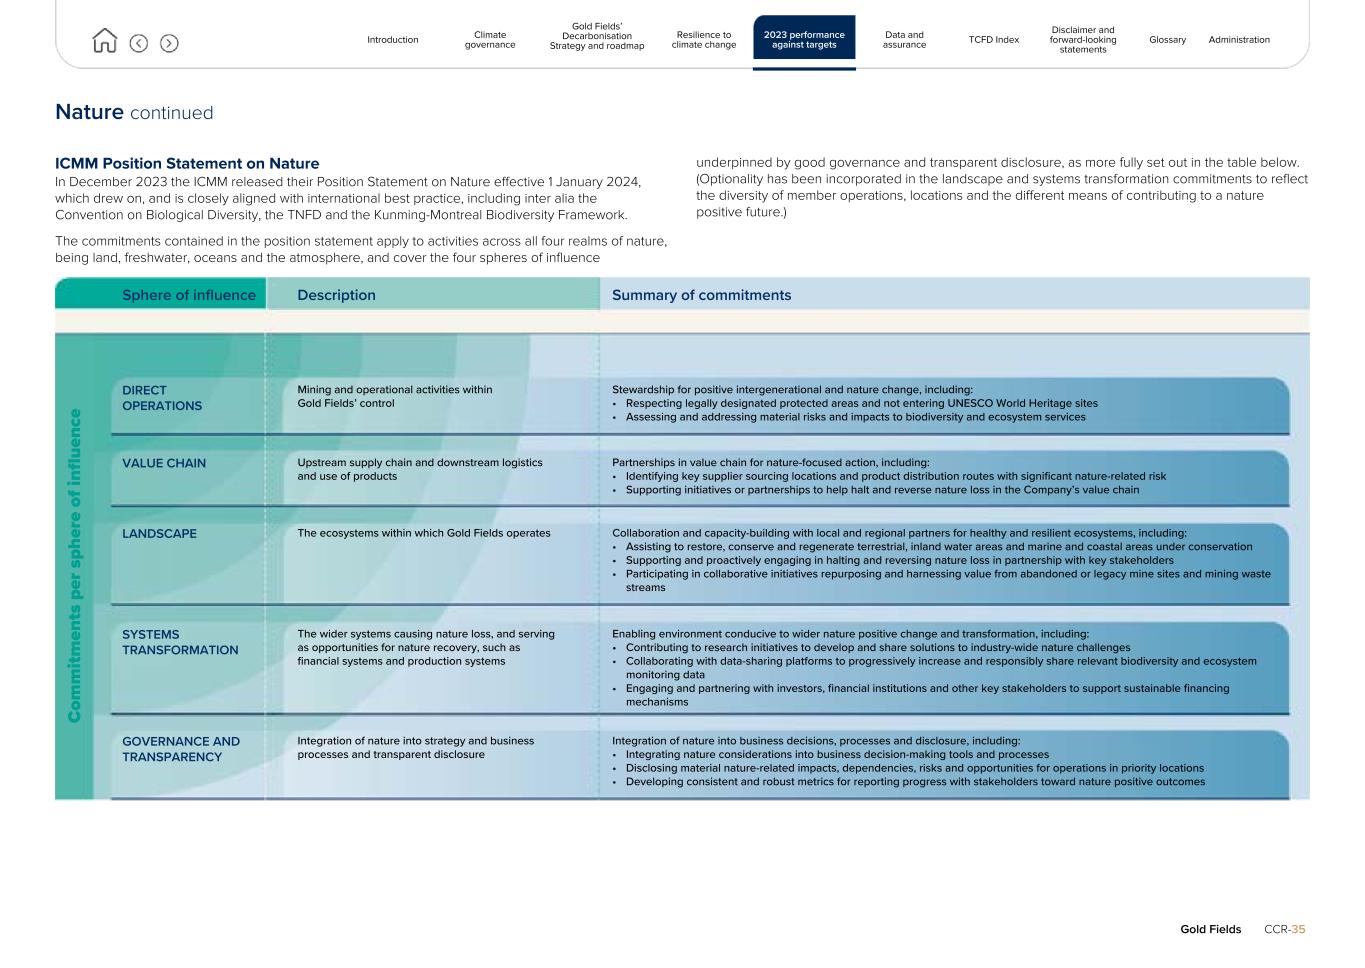
Nature continued ICMM Position Statement on Nature In December 2023 the ICMM released their Position Statement on Nature effective 1 January 2024, which drew on, and is closely aligned with international best practice, including inter alia the Convention on Biological Diversity, the TNFD and the Kunming-Montreal Biodiversity Framework. The commitments contained in the position statement apply to activities across all four realms of nature, being land, freshwater, oceans and the atmosphere, and cover the four spheres of influence underpinned by good governance and transparent disclosure, as more fully set out in the table below. (Optionality has been incorporated in the landscape and systems transformation commitments to reflect the diversity of member operations, locations and the different means of contributing to a nature positive future.) Sphere of influence Description Summary of commitments C om m itm en ts p er s ph er e of in flu en ce DIRECT OPERATIONS Mining and operational activities within Gold Fields’ control Stewardship for positive intergenerational and nature change, including: • Respecting legally designated protected areas and not entering UNESCO World Heritage sites • Assessing and addressing material risks and impacts to biodiversity and ecosystem services VALUE CHAIN Upstream supply chain and downstream logistics and use of products Partnerships in value chain for nature-focused action, including: • Identifying key supplier sourcing locations and product distribution routes with significant nature-related risk • Supporting initiatives or partnerships to help halt and reverse nature loss in the Company’s value chain LANDSCAPE The ecosystems within which Gold Fields operates Collaboration and capacity-building with local and regional partners for healthy and resilient ecosystems, including: • Assisting to restore, conserve and regenerate terrestrial, inland water areas and marine and coastal areas under conservation • Supporting and proactively engaging in halting and reversing nature loss in partnership with key stakeholders • Participating in collaborative initiatives repurposing and harnessing value from abandoned or legacy mine sites and mining waste streams SYSTEMS TRANSFORMATION The wider systems causing nature loss, and serving as opportunities for nature recovery, such as financial systems and production systems Enabling environment conducive to wider nature positive change and transformation, including: • Contributing to research initiatives to develop and share solutions to industry-wide nature challenges • Collaborating with data-sharing platforms to progressively increase and responsibly share relevant biodiversity and ecosystem monitoring data • Engaging and partnering with investors, financial institutions and other key stakeholders to support sustainable financing mechanisms GOVERNANCE AND TRANSPARENCY Integration of nature into strategy and business processes and transparent disclosure Integration of nature into business decisions, processes and disclosure, including: • Integrating nature considerations into business decision-making tools and processes • Disclosing material nature-related impacts, dependencies, risks and opportunities for operations in priority locations • Developing consistent and robust metrics for reporting progress with stakeholders toward nature positive outcomes Gold Fields CCR-35 Introduction Climate governance Gold Fields’ Decarbonisation Strategy and roadmap Resilience to climate change 2023 performance against targets Data and assurance TCFD Index Disclaimer and forward-looking statements Glossary Administration
Data and assurance IN THIS SECTION 37 Regional and Group carbon emissions performance " 38 Regional and Group energy performance " 39 Gold Fields’ 2023 carbon footprint " 41 External assurance statement " 44 TCFD Index " 45 Disclaimer and forward-looking statements " 46 Glossary " Gold Fields CCR-36 Introduction Climate governance Gold Fields’ Decarbonisation Strategy and roadmap Resilience to climate change 2023 performance against targets Data and assurance TCFD Index Disclaimer and forward-looking statements Glossary Administration Solar panels at one of our renewable projects in Western Australia
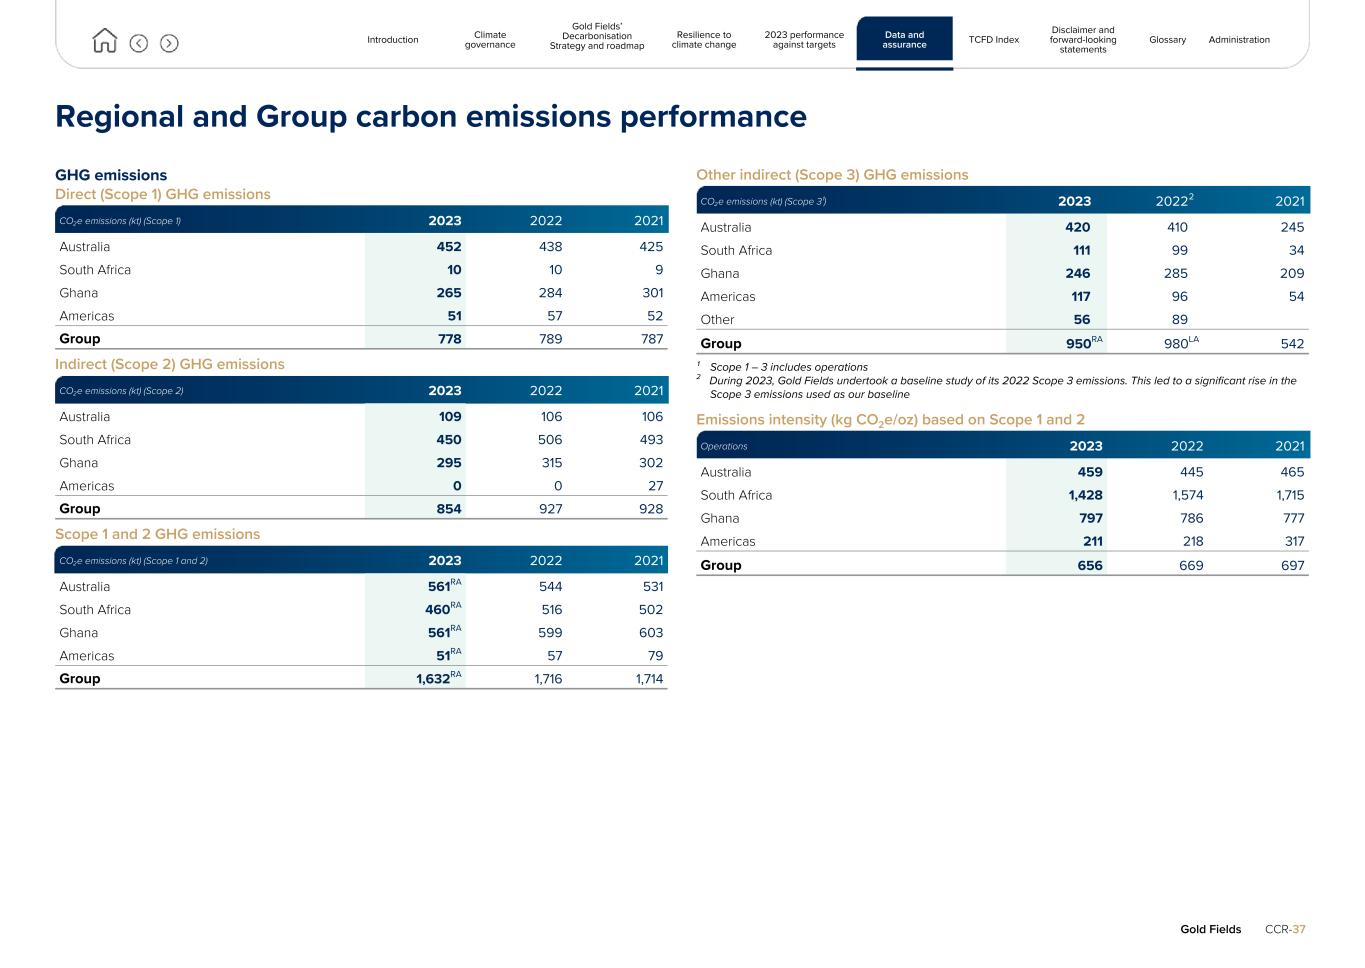
Regional and Group carbon emissions performance GHG emissions Direct (Scope 1) GHG emissions CO₂e emissions (kt) (Scope 1) 2023 2022 2021 Australia 452 438 425 South Africa 10 10 9 Ghana 265 284 301 Americas 51 57 52 Group 778 789 787 Indirect (Scope 2) GHG emissions CO₂e emissions (kt) (Scope 2) 2023 2022 2021 Australia 109 106 106 South Africa 450 506 493 Ghana 295 315 302 Americas 0 0 27 Group 854 927 928 Scope 1 and 2 GHG emissions CO₂e emissions (kt) (Scope 1 and 2) 2023 2022 2021 Australia 561RA 544 531 South Africa 460RA 516 502 Ghana 561RA 599 603 Americas 51RA 57 79 Group 1,632RA 1,716 1,714 Other indirect (Scope 3) GHG emissions CO₂e emissions (kt) (Scope 3¹) 2023 2022 2 2021 Australia 420 410 245 South Africa 111 99 34 Ghana 246 285 209 Americas 117 96 54 Other 56 89 Group 950RA 980LA 542 ¹ Scope 1 – 3 includes operations 2 During 2023, Gold Fields undertook a baseline study of its 2022 Scope 3 emissions. This led to a significant rise in the Scope 3 emissions used as our baseline Emissions intensity (kg CO2e/oz) based on Scope 1 and 2 Operations 2023 2022 2021 Australia 459 445 465 South Africa 1,428 1,574 1,715 Ghana 797 786 777 Americas 211 218 317 Group 656 669 697 Gold Fields CCR-37 Introduction Climate governance Gold Fields’ Decarbonisation Strategy and roadmap Resilience to climate change 2023 performance against targets Data and assurance TCFD Index Disclaimer and forward-looking statements Glossary Administration
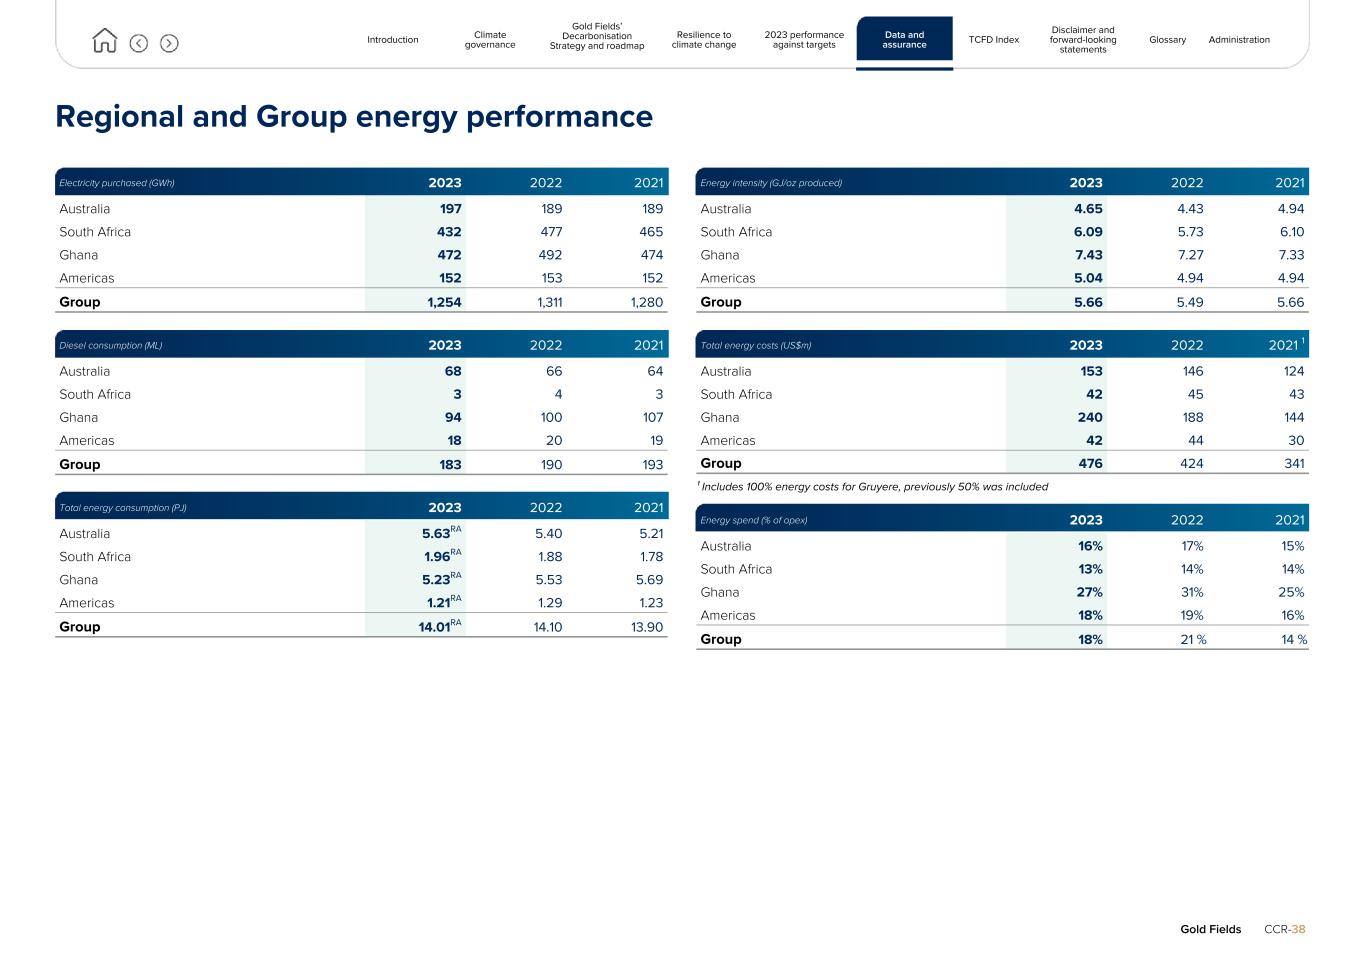
Regional and Group energy performance Electricity purchased (GWh) 2023 2022 2021 Australia 197 189 189 South Africa 432 477 465 Ghana 472 492 474 Americas 152 153 152 Group 1,254 1,311 1,280 Diesel consumption (ML) 2023 2022 2021 Australia 68 66 64 South Africa 3 4 3 Ghana 94 100 107 Americas 18 20 19 Group 183 190 193 Total energy consumption (PJ) 2023 2022 2021 Australia 5.63RA 5.40 5.21 South Africa 1.96RA 1.88 1.78 Ghana 5.23RA 5.53 5.69 Americas 1.21RA 1.29 1.23 Group 14.01RA 14.10 13.90 Energy intensity (GJ/oz produced) 2023 2022 2021 Australia 4.65 4.43 4.94 South Africa 6.09 5.73 6.10 Ghana 7.43 7.27 7.33 Americas 5.04 4.94 4.94 Group 5.66 5.49 5.66 Total energy costs (US$m) 2023 2022 2021 1 Australia 153 146 124 South Africa 42 45 43 Ghana 240 188 144 Americas 42 44 30 Group 476 424 341 ¹ Includes 100% energy costs for Gruyere, previously 50% was included Energy spend (% of opex) 2023 2022 2021 Australia 16% 17% 15% South Africa 13% 14% 14% Ghana 27% 31% 25% Americas 18% 19% 16% Group 18% 21 % 14 % Gold Fields CCR-38 Introduction Climate governance Gold Fields’ Decarbonisation Strategy and roadmap Resilience to climate change 2023 performance against targets Data and assurance TCFD Index Disclaimer and forward-looking statements Glossary Administration
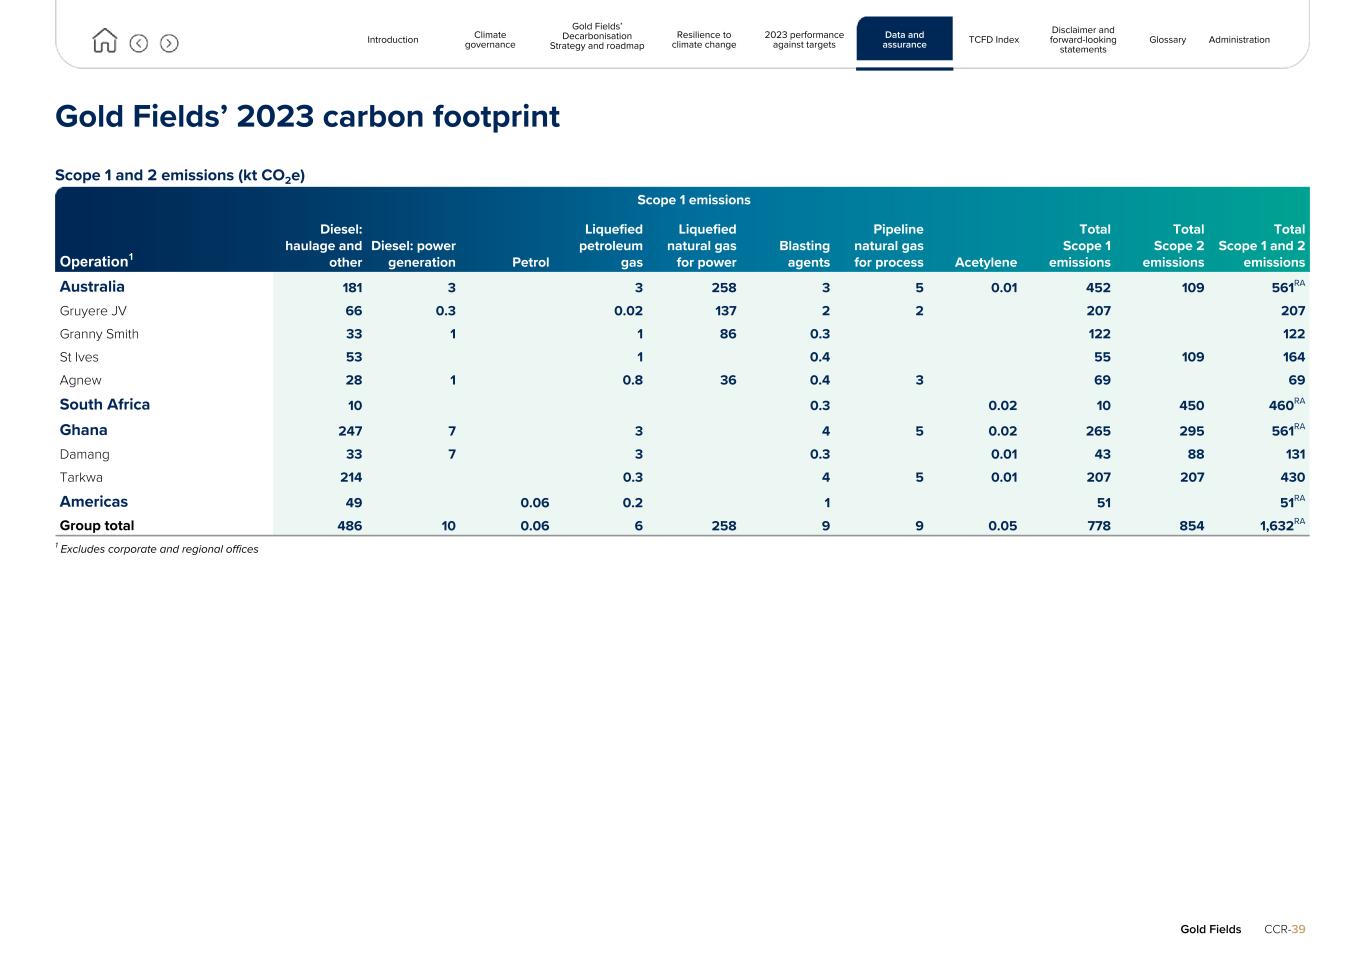
Gold Fields’ 2023 carbon footprint Scope 1 and 2 emissions (kt CO2e) Scope 1 emissions Operation1 Diesel: haulage and other Diesel: power generation Petrol Liquefied petroleum gas Liquefied natural gas for power Blasting agents Pipeline natural gas for process Acetylene Total Scope 1 emissions Total Scope 2 emissions Total Scope 1 and 2 emissions Australia 181 3 3 258 3 5 0.01 452 109 561RA Gruyere JV 66 0.3 0.02 137 2 2 207 207 Granny Smith 33 1 1 86 0.3 122 122 St Ives 53 1 0.4 55 109 164 Agnew 28 1 0.8 36 0.4 3 69 69 South Africa 10 0.3 0.02 10 450 460RA Ghana 247 7 3 4 5 0.02 265 295 561RA Damang 33 7 3 0.3 0.01 43 88 131 Tarkwa 214 0.3 4 5 0.01 207 207 430 Americas 49 0.06 0.2 1 51 51RA Group total 486 10 0.06 6 258 9 9 0.05 778 854 1,632RA 1 Excludes corporate and regional offices Gold Fields CCR-39 Introduction Climate governance Gold Fields’ Decarbonisation Strategy and roadmap Resilience to climate change 2023 performance against targets Data and assurance TCFD Index Disclaimer and forward-looking statements Glossary Administration
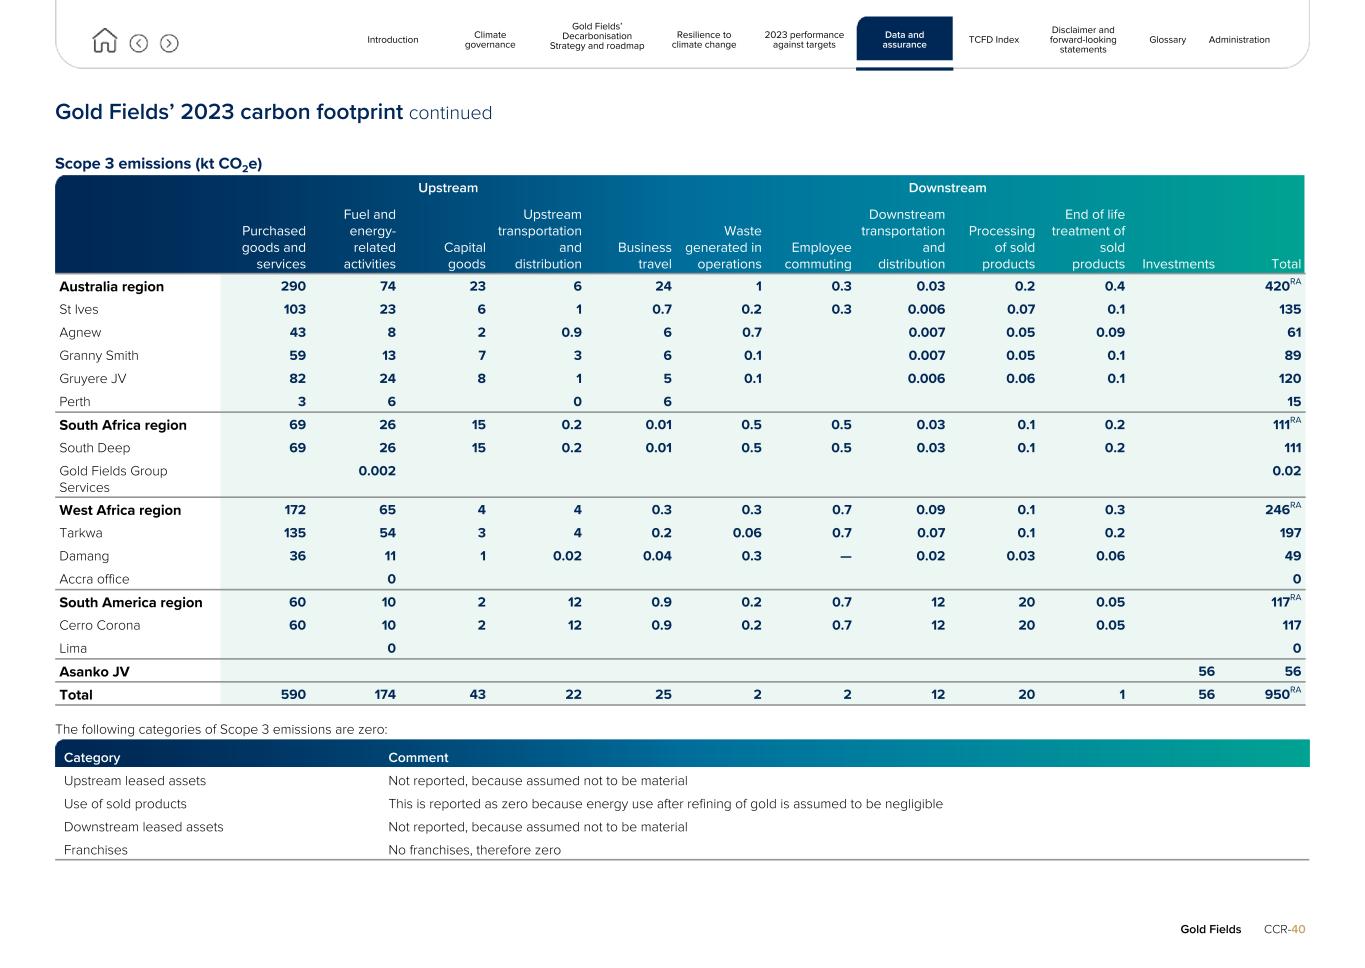
Gold Fields’ 2023 carbon footprint continued Scope 3 emissions (kt CO2e) Upstream Downstream Purchased goods and services Fuel and energy- related activities Capital goods Upstream transportation and distribution Business travel Waste generated in operations Employee commuting Downstream transportation and distribution Processing of sold products End of life treatment of sold products Investments Total Australia region 290 74 23 6 24 1 0.3 0.03 0.2 0.4 420RA St Ives 103 23 6 1 0.7 0.2 0.3 0.006 0.07 0.1 135 Agnew 43 8 2 0.9 6 0.7 0.007 0.05 0.09 61 Granny Smith 59 13 7 3 6 0.1 0.007 0.05 0.1 89 Gruyere JV 82 24 8 1 5 0.1 0.006 0.06 0.1 120 Perth 3 6 0 6 15 South Africa region 69 26 15 0.2 0.01 0.5 0.5 0.03 0.1 0.2 111RA South Deep 69 26 15 0.2 0.01 0.5 0.5 0.03 0.1 0.2 111 Gold Fields Group Services 0.002 0.02 West Africa region 172 65 4 4 0.3 0.3 0.7 0.09 0.1 0.3 246RA Tarkwa 135 54 3 4 0.2 0.06 0.7 0.07 0.1 0.2 197 Damang 36 11 1 0.02 0.04 0.3 — 0.02 0.03 0.06 49 Accra office 0 0 South America region 60 10 2 12 0.9 0.2 0.7 12 20 0.05 117RA Cerro Corona 60 10 2 12 0.9 0.2 0.7 12 20 0.05 117 Lima 0 0 Asanko JV 56 56 Total 590 174 43 22 25 2 2 12 20 1 56 950RA The following categories of Scope 3 emissions are zero: Category Comment Upstream leased assets Not reported, because assumed not to be material Use of sold products This is reported as zero because energy use after refining of gold is assumed to be negligible Downstream leased assets Not reported, because assumed not to be material Franchises No franchises, therefore zero Gold Fields CCR-40 Introduction Climate governance Gold Fields’ Decarbonisation Strategy and roadmap Resilience to climate change 2023 performance against targets Data and assurance TCFD Index Disclaimer and forward-looking statements Glossary Administration
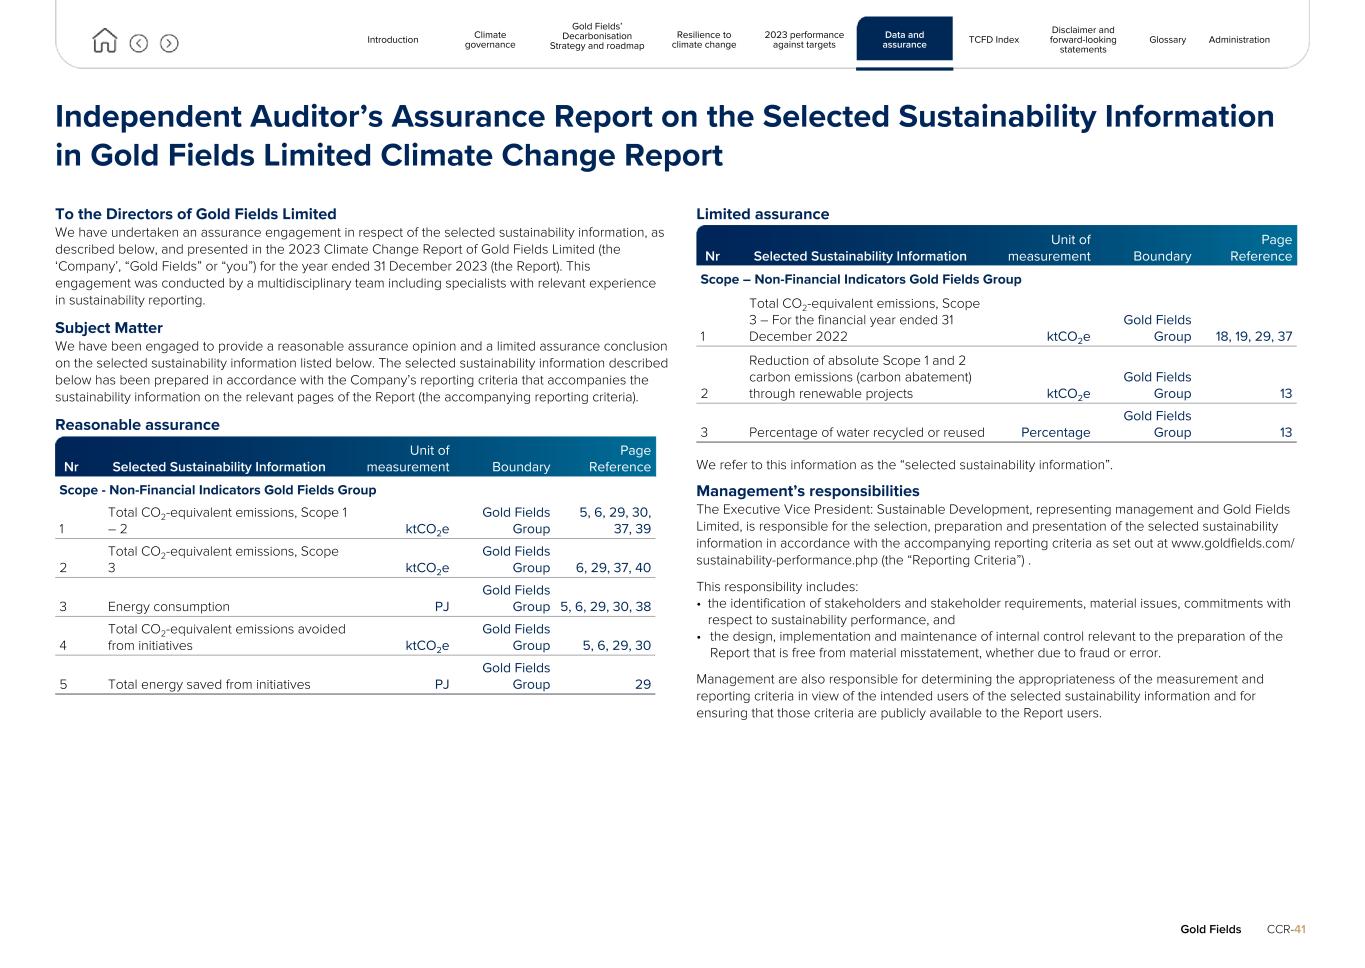
Independent Auditor’s Assurance Report on the Selected Sustainability Information in Gold Fields Limited Climate Change Report To the Directors of Gold Fields Limited We have undertaken an assurance engagement in respect of the selected sustainability information, as described below, and presented in the 2023 Climate Change Report of Gold Fields Limited (the ‘Company’, “Gold Fields” or “you”) for the year ended 31 December 2023 (the Report). This engagement was conducted by a multidisciplinary team including specialists with relevant experience in sustainability reporting. Subject Matter We have been engaged to provide a reasonable assurance opinion and a limited assurance conclusion on the selected sustainability information listed below. The selected sustainability information described below has been prepared in accordance with the Company’s reporting criteria that accompanies the sustainability information on the relevant pages of the Report (the accompanying reporting criteria). Reasonable assurance Nr Selected Sustainability Information Unit of measurement Boundary Page Reference Scope - Non-Financial Indicators Gold Fields Group 1 Total CO2-equivalent emissions, Scope 1 – 2 ktCO2e Gold Fields Group 5, 6, 29, 30, 37, 39 2 Total CO2-equivalent emissions, Scope 3 ktCO2e Gold Fields Group 6, 29, 37, 40 3 Energy consumption PJ Gold Fields Group 5, 6, 29, 30, 38 4 Total CO2-equivalent emissions avoided from initiatives ktCO2e Gold Fields Group 5, 6, 29, 30 5 Total energy saved from initiatives PJ Gold Fields Group 29 Limited assurance Nr Selected Sustainability Information Unit of measurement Boundary Page Reference Scope – Non-Financial Indicators Gold Fields Group 1 Total CO2-equivalent emissions, Scope 3 – For the financial year ended 31 December 2022 ktCO2e Gold Fields Group 18, 19, 29, 37 2 Reduction of absolute Scope 1 and 2 carbon emissions (carbon abatement) through renewable projects ktCO2e Gold Fields Group 13 3 Percentage of water recycled or reused Percentage Gold Fields Group 13 We refer to this information as the “selected sustainability information”. Management’s responsibilities The Executive Vice President: Sustainable Development, representing management and Gold Fields Limited, is responsible for the selection, preparation and presentation of the selected sustainability information in accordance with the accompanying reporting criteria as set out at www.goldfields.com/ sustainability-performance.php (the “Reporting Criteria”) . This responsibility includes: • the identification of stakeholders and stakeholder requirements, material issues, commitments with respect to sustainability performance, and • the design, implementation and maintenance of internal control relevant to the preparation of the Report that is free from material misstatement, whether due to fraud or error. Management are also responsible for determining the appropriateness of the measurement and reporting criteria in view of the intended users of the selected sustainability information and for ensuring that those criteria are publicly available to the Report users. Gold Fields CCR-41 Introduction Climate governance Gold Fields’ Decarbonisation Strategy and roadmap Resilience to climate change 2023 performance against targets Data and assurance TCFD Index Disclaimer and forward-looking statements Glossary Administration
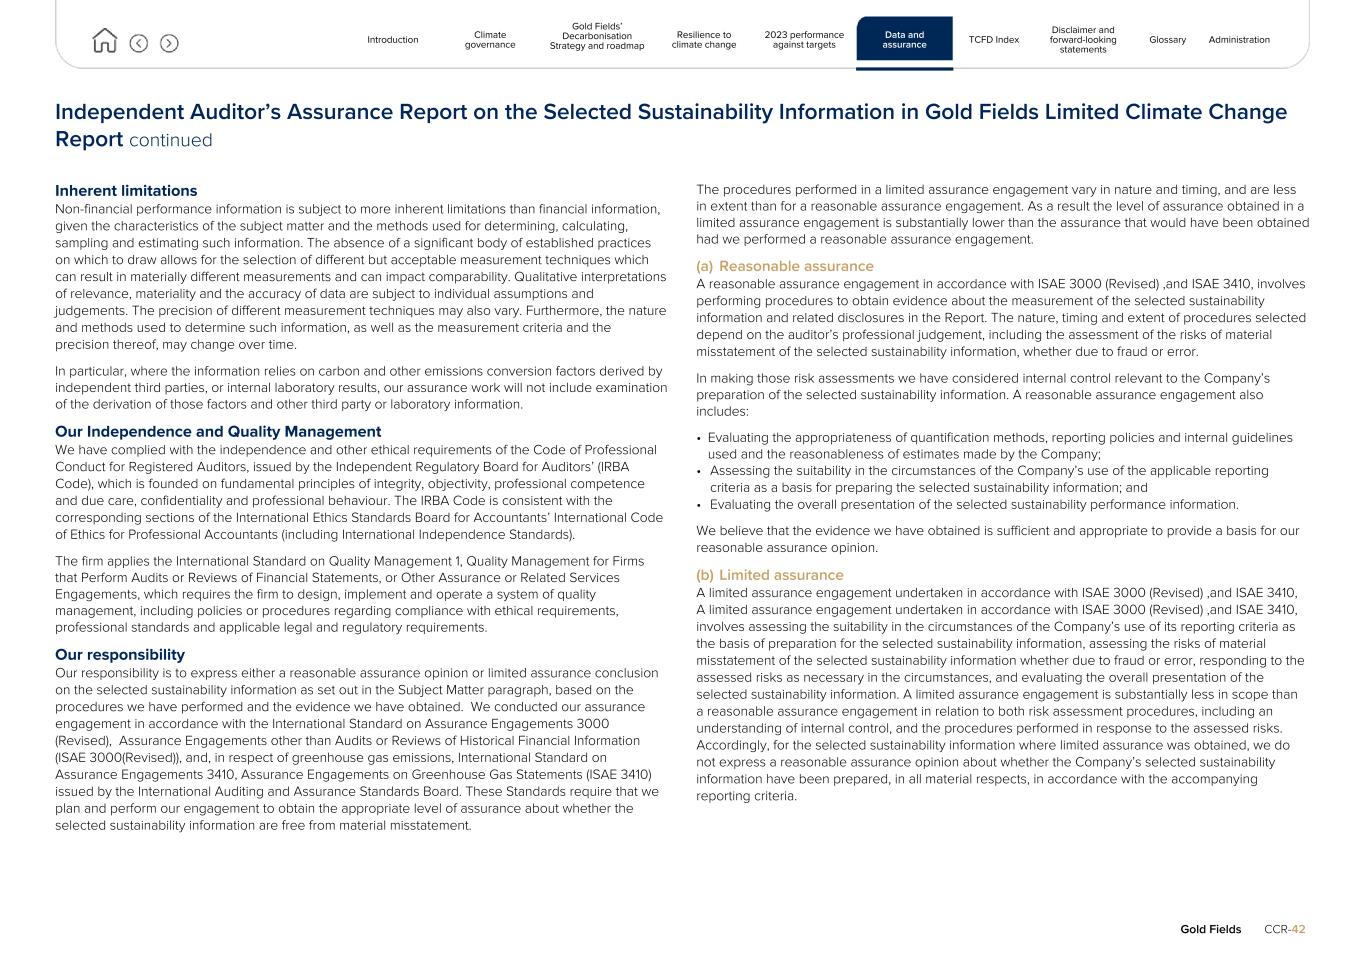
Independent Auditor’s Assurance Report on the Selected Sustainability Information in Gold Fields Limited Climate Change Report continued Inherent limitations Non-financial performance information is subject to more inherent limitations than financial information, given the characteristics of the subject matter and the methods used for determining, calculating, sampling and estimating such information. The absence of a significant body of established practices on which to draw allows for the selection of different but acceptable measurement techniques which can result in materially different measurements and can impact comparability. Qualitative interpretations of relevance, materiality and the accuracy of data are subject to individual assumptions and judgements. The precision of different measurement techniques may also vary. Furthermore, the nature and methods used to determine such information, as well as the measurement criteria and the precision thereof, may change over time. In particular, where the information relies on carbon and other emissions conversion factors derived by independent third parties, or internal laboratory results, our assurance work will not include examination of the derivation of those factors and other third party or laboratory information. Our Independence and Quality Management We have complied with the independence and other ethical requirements of the Code of Professional Conduct for Registered Auditors, issued by the Independent Regulatory Board for Auditors’ (IRBA Code), which is founded on fundamental principles of integrity, objectivity, professional competence and due care, confidentiality and professional behaviour. The IRBA Code is consistent with the corresponding sections of the International Ethics Standards Board for Accountants’ International Code of Ethics for Professional Accountants (including International Independence Standards). The firm applies the International Standard on Quality Management 1, Quality Management for Firms that Perform Audits or Reviews of Financial Statements, or Other Assurance or Related Services Engagements, which requires the firm to design, implement and operate a system of quality management, including policies or procedures regarding compliance with ethical requirements, professional standards and applicable legal and regulatory requirements. Our responsibility Our responsibility is to express either a reasonable assurance opinion or limited assurance conclusion on the selected sustainability information as set out in the Subject Matter paragraph, based on the procedures we have performed and the evidence we have obtained. We conducted our assurance engagement in accordance with the International Standard on Assurance Engagements 3000 (Revised), Assurance Engagements other than Audits or Reviews of Historical Financial Information (ISAE 3000(Revised)), and, in respect of greenhouse gas emissions, International Standard on Assurance Engagements 3410, Assurance Engagements on Greenhouse Gas Statements (ISAE 3410) issued by the International Auditing and Assurance Standards Board. These Standards require that we plan and perform our engagement to obtain the appropriate level of assurance about whether the selected sustainability information are free from material misstatement. The procedures performed in a limited assurance engagement vary in nature and timing, and are less in extent than for a reasonable assurance engagement. As a result the level of assurance obtained in a limited assurance engagement is substantially lower than the assurance that would have been obtained had we performed a reasonable assurance engagement. (a) Reasonable assurance A reasonable assurance engagement in accordance with ISAE 3000 (Revised) ,and ISAE 3410, involves performing procedures to obtain evidence about the measurement of the selected sustainability information and related disclosures in the Report. The nature, timing and extent of procedures selected depend on the auditor’s professional judgement, including the assessment of the risks of material misstatement of the selected sustainability information, whether due to fraud or error. In making those risk assessments we have considered internal control relevant to the Company’s preparation of the selected sustainability information. A reasonable assurance engagement also includes: • Evaluating the appropriateness of quantification methods, reporting policies and internal guidelines used and the reasonableness of estimates made by the Company; • Assessing the suitability in the circumstances of the Company’s use of the applicable reporting criteria as a basis for preparing the selected sustainability information; and • Evaluating the overall presentation of the selected sustainability performance information. We believe that the evidence we have obtained is sufficient and appropriate to provide a basis for our reasonable assurance opinion. (b) Limited assurance A limited assurance engagement undertaken in accordance with ISAE 3000 (Revised) ,and ISAE 3410, A limited assurance engagement undertaken in accordance with ISAE 3000 (Revised) ,and ISAE 3410, involves assessing the suitability in the circumstances of the Company’s use of its reporting criteria as the basis of preparation for the selected sustainability information, assessing the risks of material misstatement of the selected sustainability information whether due to fraud or error, responding to the assessed risks as necessary in the circumstances, and evaluating the overall presentation of the selected sustainability information. A limited assurance engagement is substantially less in scope than a reasonable assurance engagement in relation to both risk assessment procedures, including an understanding of internal control, and the procedures performed in response to the assessed risks. Accordingly, for the selected sustainability information where limited assurance was obtained, we do not express a reasonable assurance opinion about whether the Company’s selected sustainability information have been prepared, in all material respects, in accordance with the accompanying reporting criteria. Gold Fields CCR-42 Introduction Climate governance Gold Fields’ Decarbonisation Strategy and roadmap Resilience to climate change 2023 performance against targets Data and assurance TCFD Index Disclaimer and forward-looking statements Glossary Administration
Independent Auditor’s Assurance Report on the Selected Sustainability Information in Gold Fields Limited Climate Change Report continued The procedures we performed were based on our professional judgement and included inquiries, observation of processes followed, inspection of documents, analytical procedures, evaluating the appropriateness of quantification methods and reporting policies, and agreeing or reconciling with underlying records. Given the circumstances of the engagement, in performing the procedures listed above we: • Interviewed management to obtain an understanding of the internal control environment, risk assessment process and information systems relevant to the sustainability reporting process; • Inspected documentation to corroborate the statements of management in our interviews; • Tested the processes and systems to generate, collate, aggregate, monitor and report the selected sustainability information; • Performed a controls walkthrough of identified key controls; • Inspected supporting documentation on a sample basis and performed analytical procedures to evaluate the data generation and reporting processes against the reporting criteria; • Evaluated the reasonableness and appropriateness of significant estimates and judgments made by management in the preparation of the selected sustainability information; and • Evaluated whether the selected sustainability information presented in the Report are consistent with our overall knowledge and experience of sustainability management and performance at the Company. Reasonable Assurance Opinion and Limited Assurance Conclusion (a) Reasonable assurance opinion In our opinion and subject to the inherent limitations outlined elsewhere in this report, the selected sustainability information set out in the Subject Matter paragraph above for the year ended 31 December 2023 are prepared, in all material respects, in accordance with the reporting criteria. (b) Limited assurance conclusion Based on the procedures we have performed and the evidence we have obtained, and subject to the inherent limitations outlined elsewhere in this report, nothing has come to our attention that causes us to believe that the selected sustainability information as set out the Subject Matter paragraph above for the year ended 31 December 2023 are not prepared, in all material respects, in accordance with the reporting criteria. Other Matter The maintenance and integrity of Gold Fields Limited’s website is the responsibility of Gold Fields Limited’s management. Our procedures did not involve consideration of these matters and, accordingly we accept no responsibility for any changes to either the information in the Report or our independent assurance report that may have occurred since the initial date of presentation on Gold Fields Limited’s website. Restriction of liability Our work has been undertaken to enable us to express a reasonable assurance opinion and limited assurance conclusion on the selected sustainability information to the directors of the Company in accordance with the terms of our engagement, and for no other purpose. We do not accept or assume liability to any party other than the Company, for our work, for this report, or for the conclusion we have reached. PricewaterhouseCoopers Inc. Director: Oswald Wentworth Registered Auditor Johannesburg, South Africa 28 March 2024 Gold Fields CCR-43 Introduction Climate governance Gold Fields’ Decarbonisation Strategy and roadmap Resilience to climate change 2023 performance against targets Data and assurance TCFD Index Disclaimer and forward-looking statements Glossary Administration
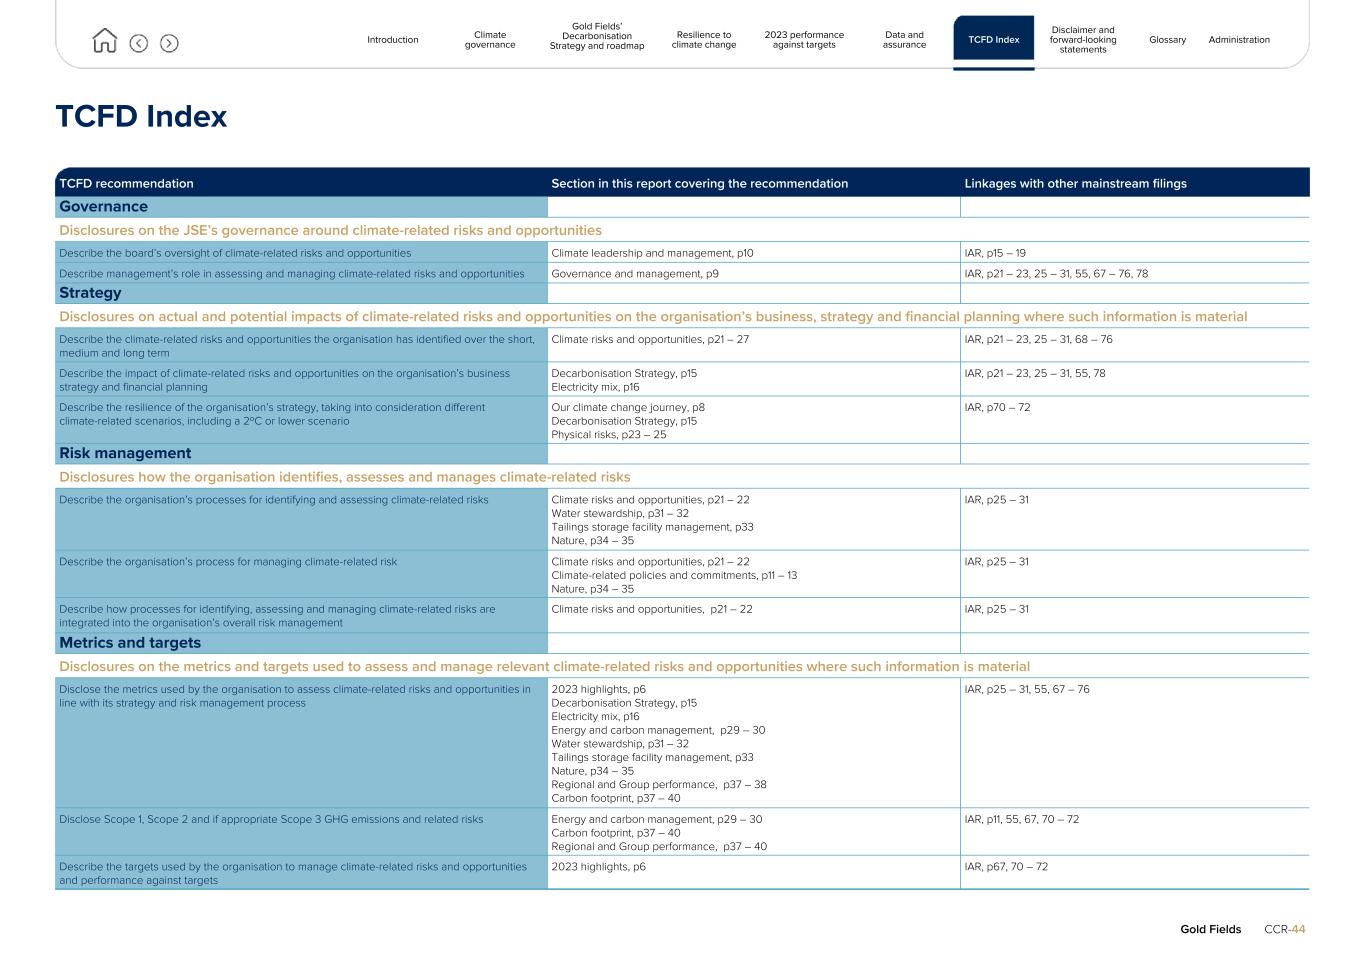
TCFD Index TCFD recommendation Section in this report covering the recommendation Linkages with other mainstream filings Governance Disclosures on the JSE’s governance around climate-related risks and opportunities Describe the board’s oversight of climate-related risks and opportunities Climate leadership and management, p10 IAR, p15 – 19 Describe management’s role in assessing and managing climate-related risks and opportunities Governance and management, p9 IAR, p21 – 23, 25 – 31, 55, 67 – 76, 78 Strategy Disclosures on actual and potential impacts of climate-related risks and opportunities on the organisation’s business, strategy and financial planning where such information is material Describe the climate-related risks and opportunities the organisation has identified over the short, medium and long term Climate risks and opportunities, p21 – 27 IAR, p21 – 23, 25 – 31, 68 – 76 Describe the impact of climate-related risks and opportunities on the organisation’s business strategy and financial planning Decarbonisation Strategy, p15 Electricity mix, p16 IAR, p21 – 23, 25 – 31, 55, 78 Describe the resilience of the organisation’s strategy, taking into consideration different climate-related scenarios, including a 2ºC or lower scenario Our climate change journey, p8 Decarbonisation Strategy, p15 Physical risks, p23 – 25 IAR, p70 – 72 Risk management Disclosures how the organisation identifies, assesses and manages climate-related risks Describe the organisation’s processes for identifying and assessing climate-related risks Climate risks and opportunities, p21 – 22 Water stewardship, p31 – 32 Tailings storage facility management, p33 Nature, p34 – 35 IAR, p25 – 31 Describe the organisation’s process for managing climate-related risk Climate risks and opportunities, p21 – 22 Climate-related policies and commitments, p11 – 13 Nature, p34 – 35 IAR, p25 – 31 Describe how processes for identifying, assessing and managing climate-related risks are integrated into the organisation’s overall risk management Climate risks and opportunities, p21 – 22 IAR, p25 – 31 Metrics and targets Disclosures on the metrics and targets used to assess and manage relevant climate-related risks and opportunities where such information is material Disclose the metrics used by the organisation to assess climate-related risks and opportunities in line with its strategy and risk management process 2023 highlights, p6 Decarbonisation Strategy, p15 Electricity mix, p16 Energy and carbon management, p29 – 30 Water stewardship, p31 – 32 Tailings storage facility management, p33 Nature, p34 – 35 Regional and Group performance, p37 – 38 Carbon footprint, p37 – 40 IAR, p25 – 31, 55, 67 – 76 Disclose Scope 1, Scope 2 and if appropriate Scope 3 GHG emissions and related risks Energy and carbon management, p29 – 30 Carbon footprint, p37 – 40 Regional and Group performance, p37 – 40 IAR, p11, 55, 67, 70 – 72 Describe the targets used by the organisation to manage climate-related risks and opportunities and performance against targets 2023 highlights, p6 IAR, p67, 70 – 72 Gold Fields CCR-44 Introduction Climate governance Gold Fields’ Decarbonisation Strategy and roadmap Resilience to climate change 2023 performance against targets Data and assurance TCFD Index Disclaimer and forward-looking statements Glossary Administration
Disclaimer and forward-looking statements Disclaimer This CCR contains data on Gold Fields’ Scope 1, 2 and 3 GHG emissions. Data for Scope 1 and 2 emissions relates to Gold Fields’ own activities and supplied heat, power and cooling, which are measured using data from its own systems and independently assured. Scope 3 emissions relate to other organisations’ emissions and are therefore subject to a range of uncertainties and challenges. At present, Scope 3 data is not yet consistently available in many value chains and is calculated, collected or estimated in different ways. Gold Fields’ Scope 3 emissions data is determined using the ISO 14064 part 1 standard. As value chain emissions data advances over time, Gold Fields expects to improve the quality of its Scope 3 data and data reporting. Forward-looking statements This CCR contains forward-looking statements within the meaning of section 27A of the US Securities Act of 1933 (the Securities Act) and section 21E of the US Securities Exchange Act of 1934 (the Exchange Act) with respect to Gold Fields’ environmental (including climate change), social and governance targets, commitments, ambitions and the methodologies we use to assess our progress in relation to these. Such forward-looking statements can be identified by the use of forward-looking terminology, including the terms “believes”, “estimates”, “plans”, “anticipates”, “aims”, “continues”, “expects”, “hopes”, “may”, “will”, “would” or “could” or, in each case, their negative or other various or comparable terminology. Forward-looking statements can be made in writing but may also be made verbally by directors, officers and employees of Gold Fields (including during presentations) in connection with this document. Forward-looking statements involve risk and uncertainty because they relate to events and depend on circumstances that will occur in the future. These forward-looking statements, wherever they may occur in this CCR, are necessary estimates reflecting the best judgement of Gold Fields’ senior management and involve a number of risks and uncertainties that could cause actual results to differ materially from those suggested by the forward- looking statements. Consequently, these forward-looking statements should be considered in light of various important factors, including those outlined in this CCR and other filings with the US Securities and Exchange Commission, including in our Annual Report on Form 20-F for the year ended 31 December 2023. In preparing the climate change-related information contained in this document, Gold Fields has made a number of key judgements, estimations and assumptions, and the processes and issues involved are complex. The climate data, models and methodologies used are often relatively new, are rapidly evolving and are not of the same standard as those available in the context of other financial information, nor are they subject to the same or equivalent disclosure standards, historical reference points, benchmarks or globally accepted accounting principles. In particular, it is not possible to rely on historical data as a strong indicator of future trajectories, in the case of climate change and its evolution. Outputs of models, processed data and methodologies are also likely to be affected by underlying data quality, which can be hard to assess and we expect industry guidance, market practice and regulations in this field to continue to change. There are also challenges faced in relation to the ability to access data on a timely basis and the lack of consistency and comparability between data that is available This means the climate change-related forward-looking statements and climate change-related information discussed in this document carry an additional degree of inherent risk and uncertainty. In light of uncertainty as to the nature of future policy and market response to climate change, including between regions, and the effectiveness of any such response, Gold Fields may have to re-evaluate its progress towards its climate change ambitions, commitments and targets in the future, update the methodologies it uses or alter its approach to climate analysis and may be required to amend, update and recalculate its climate change disclosures and assessments in the future, as market practice, data quality and availability develop rapidly. Gold Fields undertakes no obligation to publicly update or release any revisions to these forward- looking statements to reflect events or circumstances after the date of this report or to reflect the occurrence of unanticipated events. Refer to Gold Fields’ comprehensive forward-looking statements on www.goldfields.com Gold Fields CCR-45 Introduction Climate governance Gold Fields’ Decarbonisation Strategy and roadmap Resilience to climate change 2023 performance against targets Data and assurance TCFD Index Disclaimer and forward-looking statements Glossary Administration
Glossary This glossary contains key definitions based on the IPCC’s Working Group II Report, Summary for Policymakers as contribution to the Sixth Assessment Report (IPCC 2022), the TCFD glossary and the recommendations of the TNFD, September 2023. Adaptation Human systems adapt by adjusting to actual or expected climate and its effects to lessen harm or take advantage of beneficial opportunities. Ecological systems adapt by adjusting to the actual climate and its effects, which may be facilitated by human intervention. Adaptation limits The point at which the needs of human or ecological systems can no longer be secured from intolerable risks through adaptive actions. Two limits can be distinguished: • Hard adaptation limit: the intolerable risks can no longer be avoided through adaptation actions • Soft adaptation limit: intolerable risk can be avoided through options, but these are currently not available Atmosphere The atmosphere is the four realms of nature, and includes the gaseous medium and its suspended particulate liquids and solids above land. Biodiversity The variability of living organisms from all sources, which includes the diversity within species, between species and of ecosystems. Biome Zones on a global scale, generally determined by the type of plant life they support as a result of average precipitation and temperature patterns, such as savannas or tundras. Dependencies (on nature) Those aspects relating to environmental assets and ecosystem services that a person or an organisation relies on to function properly, such as water flow and the regulation of hazards like floods and fires. Ecosystem A functional interconnected unit comprising a dynamic system of plant, animal and micro-organism communities and the non-living environment. Ecosystem services The services or contributions made by ecosystems that benefit economic and other human activities. Exposure The existence of people, economic, social or cultural assets, infrastructure, livelihoods, ecosystems and their functions and the like, in places and settings that could be negatively affected. Hazard The potential for the occurrence of a natural or human-induced physical event or trend with adverse effects, such as loss of life, injury or health impacts, loss and damage to property, ecosystems and environmental resources. Impacts (on nature) The impact or changes to the state of nature, whether in quality or quantity, and which may lead to changes to nature’s capacity to provide social and economic functions. Land One of the realms of nature which includes all dry land, and its vegetation cover, nearby atmosphere and substrate, and associated animals and microbes. Mitigation The action(s) implemented to reduce the extent of a negative impact. Nature Nature comprises all life of Earth, including the geology, water, climate and all other inanimate components of Earth, that is made of four physical realms – land, ocean, freshwater and the atmosphere. Each of these interact with people and society. Ocean All connected saline ocean waters, characterised by waves, tides and currents. Resilience Any system’s ability to bounce back, cope and return to a previous state after a disturbance to maintain its essential function, identity and structure and to still be able to adapt, learn and transform. Risk Risk can be used as a valuable framework to understand the interlinked and increasingly severe impacts of climate change on human systems, ecosystems and biodiversity. Risk is the potential for negative consequences for human or ecological systems, cognisant of the array of values and objectives underlying these systems. The interactions between climate-related hazards, and the exposure and vulnerability of affected human and ecological systems gives rise to risk. Scope 1 GHG emissions All direct GHG emissions. Scope 2 GHG emissions Indirect GHG emissions from the consumption of purchased electricity, heat or steam. Scope 3 GHG emissions Other indirect emissions not covered in Scope 2, that occur in the value chain of a reporting company, including both upstream and downstream emissions. Vulnerability The tendency, or exposure to be negatively affected, determined by a system’s level of sensitivity to harm and its lack of capacity to cope and adapt. Gold Fields CCR-46 Introduction Climate governance Gold Fields’ Decarbonisation Strategy and roadmap Resilience to climate change 2023 performance against targets Data and assurance TCFD Index Disclaimer and forward-looking statements Glossary Administration
Administration and corporate information Company Secretary Anré Weststrate Tel: +27 11 562 9719 Fax: +27 86 720 2704 email: anre.weststrate@goldfields.com Registered Office Johannesburg Gold Fields Limited 150 Helen Road Sandown Sandton 2196 Postnet Suite 252 Private Bag X30500 Houghton 2041 Tel: +27 11 562 9700 Office of the United Kingdom Secretaries London St James’s Corporate Services Limited Suite 31, Second Floor 107 Cheapside London EC2V 6DN United Kingdom Tel: +44 (0) 20 7796 8644 email: general@corpserv.co.uk American depository receipts transfer agent Shareholder correspondence should be mailed to: BNY Mellon PO Box 43006 Providence RI 02940-3078 Overnight correspondence should be sent to: BNY Mellon 150 Royall Street, Suite 101 Canton, MA 02021 email: shrrelations@cpushareownerservices.com Tel: 866 247 3871 Domestic Tel: 201 680 6825 Foreign Sponsor J.P. Morgan Equities South Africa Proprietary Limited 1 Fricker Road Illovo, Johannesburg 2196 South Africa Gold Fields Limited Incorporated in the Republic of South Africa Registration number 1968/004880/06 Share code: GFI Issuer code: GOGOF ISIN: ZAE000018123 Investor enquiries Jongisa Magagula Tel: +27 11 562 9775 Mobile: +27 82 562 5288 email: jongisa.magagula@goldfields.com Thomas Mengel Tel: +27 11 562 9849 Mobile: +27 72 493 5170 email: thomas.mengel@goldfields.com Media enquiries Sven Lunsche Tel: +27 11 562 9763 Mobile: +27 83 260 9279 email: sven.lunsche@goldfields.com Transfer secretaries South Africa Computershare Investor Services Proprietary Limited Rosebank Towers 15 Biermann Avenue Rosebank Johannesburg 2196 Private Bag X9000 Saxonwold 2132 Tel: +27 11 370 5000 Fax: +27 11 688 5248 United Kingdom Link Asset Services The Registry 34 Beckenham Road Beckenham Kent BR3 4TU England Tel: 0871 664 0300 If you are outside the United Kingdom please call (0) 371 664 0300. Calls are charged at the standard geographic rate and will vary by provider. Calls outside the United Kingdom will be charged at the applicable international rate. Business is open between 09:00 and 17:30, Monday to Friday excluding public holidays in England and Wales. email: shareholderenquiries@linkgroup.co.uk Listings JSE/NYSE/GFI Directors: YGH Suleman (Chairperson), MJ Fraser* (Chief Executive Officer), PA Schmidt* (Chief Financial Officer), A Andani#, PJ Bacchus†, MC Bitar@, TP Goodlace, JE McGill^, SP Reid^, PG Sibiya, CAT Smit South African unless otherwise stated. ˆAustralian, †British, @Chilean, #Ghanaian, *Executive director www.goldfields.com Gold Fields CCR-47 Introduction Climate governance Gold Fields’ Decarbonisation Strategy and roadmap Resilience to climate change 2023 performance against targets Data and assurance TCFD Index Disclaimer and forward-looking statements Glossary Administration
Creating enduring value beyond mining
Further information
Risk factors summary
There are four categories of risks which could have a material effect on Gold Fields. The following is an outline of the key risks within
the four categories:
Risks related to Gold Fields’ operations and industry
•Changes in the market price for gold, and to a lesser extent copper and silver, which in the past have fluctuated widely, affect the
profitability of Gold Fields’ operations and the cash flows generated by those operations.
•Because gold is sold in U.S. dollars, while a significant portion of Gold Fields’ production costs are in Australian dollars, Rand and
other non-U.S. dollar currencies, Gold Fields’ operating results and financial condition could be materially harmed by a material
change in the value of these non-U.S. dollar currencies.
•High and rising inflation may have a material adverse effect on Gold Fields’ business, operating results and financial condition.
•Gold Fields has experienced, and may continue to experience, difficulties, operational delays, cost pressures and impact associated
with the mine ramp-up at the Salares Norte operation in Chile and the South Deep operation in South Africa.
•To the extent that Gold Fields seeks to replace its annual Mineral Reserve and Mineral Resource depletion and grow its Mineral
Reserve and Mineral Resource base to extend the life of operations through exploration and project development, it may experience
challenges associated with its exploration activities and mining projects.
•Gold Fields’ Mineral Resources and Mineral Reserves are estimates based on a number of technical and economic assumptions,
which, if proven inaccurate or changed, may require Gold Fields to lower its estimated Mineral Resources and Mineral Reserves.
•Gold Fields may experience unforeseen difficulties, delays or costs in implementing its business strategy and projects, particularly at
Salares Norte, and any such strategy or project may not result in the anticipated benefits.
•To the extent that Gold Fields enters into acquisitions, combinations, or joint ventures, it may experience problems in executing the
transactions or managing and integrating the acquisitions, combinations or joint ventures with its existing operations.
•Gold Fields may suffer material adverse consequences as a result of its reliance on outside contractors to conduct some of its
operations.
•Failure of Gold Fields’ information, communication and technology systems, or the failure to protect personal information, could
significantly impact Gold Fields’ operations and business, may lead to public and private censure, regulatory penalties, fines and/or
sanctions and may damage Gold Fields’ reputation.
•The failure to optimise and modernise operations may have a material adverse effect on Gold Fields’ business.
•Actual and potential supply chain shortages and increases in the prices of production inputs may have a material adverse effect on
Gold Fields operations and profits.
•Power cost increases and unreliability of power supply may adversely affect Gold Fields’ business, operating results and financial
condition.
•Power deficits, potential total power failure in South Africa, fluctuations and usage constraints may force Gold Fields to halt or curtail
operations.
•Gold Fields’ current debt levels may pose risks to its viability and may make it more vulnerable to adverse economic and competitive
conditions, as well as other adverse developments.
•Gold Fields faces continued geotechnical challenges, which could adversely impact its production and profitability.
•The continued status of South Africa’s credit rating as non-investment grade may have an adverse effect on Gold Fields’ ability to
secure financing.
•Theft of gold and copper bearing materials and production inputs, as well as illegal and artisanal mining, occur on some of Gold
Fields’ properties, are difficult to control, can disrupt Gold Fields’ business and can expose Gold Fields to liability.
•Occupational diseases pose risks to Gold Fields in terms of lost productivity and increased costs.
Risks related to environmental, social and corporate governance
•Gold Fields may not be able to operate successfully if its employees are not able to perform their roles in a safe, inclusive and
respectful work environment.
•Economic, political or social instability in the countries or regions where Gold Fields operates may have a material adverse effect on
Gold Fields’ operations and profits.
•If Gold Fields is unable to appoint, hire and retain qualified Board members, senior leadership, technically skilled employees that
make up its workforce or attain sufficient representation among marginalised or underrepresented persons in management positions
or sufficient gender diversity in its workforce, in particular Board and senior leadership-level positions, its business may be materially
adversely affected.
•Gold Fields may not be able to meet its environmental, social and corporate governance targets or disclosure requirements.
•Gold Fields’ operations are subject to extensive environmental, health and safety regulations, which could impose additional costs
and compliance requirements and Gold Fields may face operational disruptions, claims and liability for breaches, or alleged
breaches, of such regulations and other applicable laws.
•Mining companies are increasingly expected to provide benefits to affected communities. Failure to comply with these requirements
can result in legal suits, additional operational costs, reputational damage, investor divestment and impact Gold Fields’ “social licence
to operate”, which could adversely impact Gold Fields’ business, operating results and financial condition.
•Gold Fields’ tenements in Australia are subject to native title claims and determinations and include Aboriginal cultural heritage sites,
which could impose significant costs and burdens, or limit or prevent access to certain areas which could materially adversely affect
Gold Fields’ operations.
•Compensation may be payable to native title holders in respect of Gold Fields’ Australian operations.
•Due to the nature of mining and the extensive environmental footprint of operations, environmental and industrial accidents and
pollution may result in operational disruptions such as stoppages which could result in increased production costs as well as financial
and regulatory liabilities.
•Increasing regulation of environmental and sustainability matters such as greenhouse gas emissions and climate change issues may
materially adversely affect Gold Fields’ operations.
•Climate change may present physical risks to Gold Fields’ operations, including from extreme weather events and increased risk of
wildfires.
•Gold Fields’ operations are subject to water use licences, which could impose significant costs and burdens.
•Gold Fields has experienced and may experience further acid mine drainage related pollution, which may compromise its ability to
comply with legislative requirements or result in additional operating or closure cost liabilities.
•The failure of a tailings storage facility could result in legal suits, additional operational costs and production delays, investor
divestment and impact Gold Fields’ “social licence to operate”, which could adversely impact Gold Fields’ business, reputation,
operating results and financial condition.
•Due to ageing infrastructure at Gold Fields’ operations, unplanned breakdowns and stoppages may result in production delays,
increased costs and industrial incidents.
•The effects of the regional cessation of dewatering may have a material adverse effect on Gold Fields’ South Deep operation.
Legal, regulatory and compliance risks
•Gold Fields is subject to various regulatory costs, such as taxes and royalties, the imposition of which may have a material adverse
effect on Gold Fields’ operations and profits.
•Gold Fields’ mineral rights are subject to legislation, which could impose significant costs and burdens, certain ownership
requirements and possible penalties or forfeiture for non-compliance, the interpretation of which is the subject of dispute.
•An actual or alleged breach or breaches of law or applicable governance processes, or fraud, bribery, corruption and money-
laundering may lead to public and private censure, regulatory penalties, fines and/or sanctions and loss of licences or permits and
may impact negatively upon Gold Fields’ empowerment status and may damage Gold Fields’ reputation.
•Gold Fields’ operations and profits have been and may continue to be adversely affected by trade union activity and new and
existing labour laws.
•Fluctuations in insurance cost, market conditions and availability could adversely affect Gold Fields’ operating results and its
insurance coverage may not adequately satisfy all potential claims in the future.
•Gold Fields’ financial flexibility could be materially constrained by South African exchange control regulations.
Risks related to Gold Fields’ shares and ADSs
•Shareholders outside South Africa face risks related to participating in future issues of shares, enforcing judgments and currency
exchange rate fluctuations
•Investors in the United States and other jurisdictions outside South Africa may have difficulty bringing actions, and enforcing
judgments, against Gold Fields, its directors and its executive officers based on the civil liabilities provisions of the federal securities
laws or other laws of the United States or any state thereof or under the laws of other jurisdictions outside South Africa.
•Investors may face liquidity risk in trading Gold Fields’ ordinary shares on JSE Limited.
•Gold Fields may not pay dividends in the future and any dividend payment may be subject to withholding tax.
•Gold Fields’ non-South African shareholders face additional investment risk from currency exchange rate fluctuations since any
dividends will be paid in Rand.
•Gold Fields’ ordinary shares are subject to dilution upon the vesting of Gold Fields’ outstanding share awards.
Risk factors
In addition to the other information included in this annual report, the considerations listed below could have a material adverse effect
on Gold Fields’ business, financial condition or results of operations, resulting in a decline in the trading price of Gold Fields’ ordinary
shares or ADSs. The risks set forth below comprise all material risks currently known to Gold Fields. These factors should be
considered carefully, together with the information and financial data set forth in this document.
Risks related to Gold Fields’ operations and industry
Changes in the market price for gold, and to a lesser extent copper and silver, which in the past have fluctuated
widely, affect the profitability of Gold Fields’ operations and the cash flows generated by those operations.
Gold Fields’ revenues are primarily derived from the sale of gold that it produces. Where no hedges are in place, Gold Fields is
exposed to changes in the gold price, which could lead to reduced revenue should the gold price decline. The market price for gold
has historically been volatile and is affected by numerous factors over which Gold Fields has no control, such as general supply and
demand, speculative trading activity, political uncertainties and global economic drivers. In fiscal 2023, the price of gold averaged U.S.
$1,942.95 per ounce. As at 20 March 2024, it was U.S.$2,157.45 per ounce, as trading in the metal remains volatile amid global political,
social, health-related (such as the COVID-19 pandemic, which significantly impacted China and resulted in poor demand) and economic
uncertainties. See “Annual Financial Report—Management’s Discussion and Analysis of the Financial Statements—Revenues”.
The Group’s policy is not to engage in long-term systemic gold price hedging, though hedges are sometimes undertaken to protect
cash flows at times of significant expenditure, for specific debt servicing requirements and to safeguard the viability of higher cost
operations. For example, the Company continued its gold hedging policies in Australia, South Africa and Ghana during 2021, primarily
due to the high levels of project capital expenditure incurred and the volatility experienced in commodity prices and exchange rates.
Altogether, approximately 1 million oz of gold production were hedged in 2021 and all gold hedging instruments have since matured.
There can be no assurance that the use of hedging techniques will always be to Gold Fields’ benefit. Hedging instruments that protect
against the market price volatility of commodities, such as, oil, may prevent Gold Fields from realising the full benefit from subsequent
decreases in market prices with respect to oil, which would cause it to record a mark-to-market loss, thus decreasing profits. Similarly,
gold hedging instruments may prevent the Company from realising the full benefit of subsequent increases in the gold price, which
would cause it to record a mark-to-market loss, thereby decreasing Gold Fields’ profits. In addition, hedging contracts are subject to the
risk that the other party may be unable or unwilling to perform its obligations under these contracts. Any significant non-performance
could have a material adverse effect on Gold Fields’ financial condition, results of operations and cash flows.
Should the gold price decline below Gold Fields’ production costs, it may experience losses and should this situation continue for
an extended period, Gold Fields may be forced to curtail or suspend some or all of its growth projects, operations and/or reduce
operational capital expenditures. Gold Fields might not be able to recover any losses it incurred during, or after, such events.
A sustained period of significant gold price volatility may impact Gold Fields’ ability to continue with existing operations or make other
long-term strategic decisions. Furthermore, while depressed gold prices generally provide an opportunity to acquire assets at lower
prices, the few quality in-production assets then demand premium prices, adversely affecting Gold Fields’ ability to undertake new
capital projects. The use of lower gold prices in Reserve calculations and life of mine (LOM) plans could also result in material
impairments of Gold Fields’ investment in mining properties or a reduction in its Reserve estimates and corresponding restatements
of its Reserves and increased amortisation, reclamation and closure charges.
In Peru, copper accounts for a significant proportion of the revenues at Gold Fields’ Cerro Corona mine, although copper is not a major
element of Gold Fields’ overall revenues. Over the period from 2020 to 2023, the price of copper increased from an average price of
U.S.$6,197.21 per tonne to an average price of U.S.$8,536.05 per tonne in 2023. As at 20 March 2024, the price of copper was U.S.
$8,790.00 per tonne. In addition, when Gold Fields’ Salares Norte project becomes operational, silver will be expected to contribute
approximately 10% of the revenues at the Salares Norte project, despite silver not being expected to become a major contributor to
Gold Fields’ overall revenues. Between 2020 and 2023, the price of silver increased from an average of U.S.$20.53 per ounce to an
average of U.S.$23.31 per ounce in 2023. As at 20 March 2024, the price of silver was U.S.$24.86 per ounce. A variety of factors have
and may depress global copper and silver prices and a decline in copper and silver prices, which have also fluctuated widely, would
adversely affect the revenues, profit and cash flows of the Cerro Corona mine and the Salares Norte project, respectively.
Because gold is sold in U.S. dollars, while a significant portion of Gold Fields’ production costs are in Australian
dollars, Rand and other non-U.S. dollar currencies, Gold Fields’ operating results and financial condition could be
materially harmed by a material change in the value of these non-U.S. dollar currencies.
Gold is sold throughout the world in U.S. dollars. Gold Fields’ costs of production are incurred principally in U.S. dollars, Australian
dollars, Rand and other currencies. Recent volatility in the Australian dollar against the U.S. dollar (including strengthening in fiscal 2020,
a slight weakening in fiscal 2021, strengthening in fiscal 2022 and weakening in 2023) and the Rand (including weakening in the earlier
part of fiscal 2020, strengthening from mid-2020 to fiscal 2021, relative stability in fiscal 2022 and weakening in 2023) made Gold
Fields’ reported costs in Australia and South Africa and results of operations less predictable than when exchange rates are more
stable. As a result, any significant and sustained appreciation of any of these non-U.S. dollar currencies against the U.S. dollar may
materially increase Gold Fields’ costs in U.S. dollar terms, which could materially adversely affect Gold Fields’ business, operating
results and financial condition.
High and rising inflation may have a material adverse effect on Gold Fields’ business, operating results and financial
condition.
Gold Fields’ business has been, and may continue to be, directly affected by volatile commodity costs and other inflationary pressures.
Inflation began to increase significantly in the countries in which Gold Fields operates in the latter half of 2021 and into 2022 and 2023,
with inflation increasing to 7% in Australia, 7.1% in South Africa, 45% in Ghana (Cedi-based inflation), 11.1% in Chile and 8.7% in Peru in
2023. Effective mining inflation for 2023 was 4.4% in Australia, 6.9% in South Africa, 7.3% in Ghana, 5.3% in Chile and 0.6% in Peru.
Global inflation is expected to continue affecting Gold Fields’ operations significantly. Prolonged periods of inflation may impact
Gold Fields’ profitability by negatively impacting its fixed costs and expenses, including raw materials, transportation and labour costs.
If these increased costs are not offset by an increase in gold prices, they could have a material adverse effect on Gold Fields’ business,
operating results and financial condition.
Geopolitical risks and conflicts around the world could further disrupt supply chains and create additional inflationary pressures. For
example, Russia’s invasion of Ukraine led to economic sanctions and other measures, which had a significant impact on commodity
prices, including increased oil, gas and gold prices. The oil price is a driver of several input costs for the Group, including diesel and
transport costs, while gas prices have an impact on power costs, and other commodity prices drive direct mining and processing costs.
Additionally, ongoing conflicts in the Middle East may cause increased inflationary pressures and could further cause general global
economic conditions to deteriorate. These inflationary pressures could also cause interest rates and the cost of borrowing to increase
and could have a material adverse effect on the financial markets and economic conditions throughout the world. The extent and
duration of the war, sanctions and resulting market disruptions are impossible to predict. Any inflationary impacts or disruptions caused
by the war or resulting sanctions may have a material adverse effect on Gold Fields’ business, operating results and financial condition,
and may magnify the impact of other risks described in this annual report.
Gold Fields has experienced, and may continue to experience, difficulties, operational delays, cost pressures and
impacts associated with the mine ramp-up at the Salares Norte operation in Chile and the South Deep operation in
South Africa.
Delays to the Salares Norte mine in Chile during 2023 has adversely impacted the Group’s cost and production guidance. As a result,
Gold Fields’ revised expectation of project completion has been delayed until mid-April 2024.
Gold Fields’ South Deep mine in South Africa has had a number of operational challenges since it was acquired in 2006. The key
challenge has been transitioning the mine from a conventional mining operation to a safe, low grade, bulk, deep level mechanised
mining operation. In addition, structural inflation and, in particular, electricity tariffs and supply in South Africa continue to increase
operating costs.
South Deep (which represented 64.9% of Gold Fields’ managed gold Mineral Reserves as at 31 December 2023) is a complex and
unique mine, with issues that need to be addressed in a holistic manner. Since Gold Fields acquired South Deep, the mine has
undergone various interventions to overcome its operational and financial challenges, including an organisational restructuring and
the deployment of various improvement initiatives and technology. These initiatives underpin a seven-year ramp-up plan, in which
Gold Fields seeks to improve overall output, productivity and reduce unit costs at South Deep. The initial ramp-up plan was further
embedded between 2021 and 2023, incorporating the establishment of enabling mining infrastructure, changes in the mining layouts,
productivity improvements, a reduced workforce and mobile equipment levels in line with the overall mining activity which increased
focus on core productivity and supported cost improvements. The ramp-up has also been enabled by the establishment of a training
facility that deploys immersive technology simulators to improve operator skills, knowledge, increase operator safety and improve
productivity. Sustaining traction on the mine’s core strategic project themes, key performance indicators and enablers are integral to
facilitating delivery on the production ramp-up over the medium-term and delivering life of mine steady state volumes and projected
financial metrics.
Failure by South Deep to maintain focus on the key issues for the mine in increasingly complex, ongoing and unpredictable changes
in the socio-political landscape may result in the operation not achieving its expected production levels or the reduced unit costs
contemplated by the organisational restructuring in a timely manner, or at all. The actions taken by South Deep to address these issues,
including the organisational restructuring, may not yield the expected results. In addition, further labour destabilisation, poor labour
relations, and a growing trend of core technical professionals leaving South Africa for U.S. dollar-based packages offered by mining
companies in Australia and in Central Africa may have a negative impact on production levels and costs. Any of the above could have
a material adverse effect on Gold Fields’ business, operating results and financial condition.
To the extent that Gold Fields seeks to replace its annual Mineral Reserve and Mineral Resource depletion and grow
its Mineral Reserve and Mineral Resource base to extend the life of operations through exploration and project
development, it may experience challenges associated with its mining projects.
In fiscal 2023, only one out of Gold Fields’ eight non-South African mines (excluding the Salares Norte project (as defined below))
disclosed higher Mineral Reserves after accounting for annual production depletion and all other influencing factors. The aggregated
decrease in attributable Mineral Reserves was 1.48 Moz. of gold, mainly due to depletion and higher costs due to ongoing global
inflation. It is expected that fiscal 2024 will see a decline in production at Damang, with the cessation of mining in 2023 followed by
treatment of lower grade stockpiles. Furthermore, not all of Gold Fields’ mines have open ended Mineral Resources and Mineral
Reserves, for example, Cerro Corona will deplete the open pit by 2026 and will continue to process lower grade stockpiles post mining
the open pit. The materiality to the financial position of a Gold Fields’ operation is expected to diminish towards the conclusion of the
operation, notwithstanding closure liability. Additionally, Gold Fields reduced the time for Mineral Reserve and Mineral Resource
conversion in 2023 by aligning the Mineral Reserve and Mineral Resource estimation with the business planning process. The result of
this reduced timeframe is a one-off reduction in Mineral Resource and Mineral Reserve replacement in 2023. Furthermore, Gold Fields’
portfolio management may also include future divestments, which could lead to reductions in Mineral Resources and Mineral Reserves.
To replace its Mineral Resources and Mineral Reserves at its operations or to expand its operations and Mineral Reserve and Mineral
Resource base, Gold Fields expects to rely, in part, on discovery from exploration for gold, and other metals associated with gold, as
well as its ability to develop mining projects. Exploration for gold and other metals associated with gold is speculative in nature, involves
many risks, requires screening and testing multiple prospects and may be unsuccessful. The replacement and expansion of the Mineral
Reserve and Mineral Resource base is a multi-year process that occurs on a multi-year rolling basis, rather than in each year of
operation. In some locations such as Western Australia, the rights to explore nearby locations are held by other mining companies, and
therefore, exploration may be significantly restricted, or not possible. In addition, the existence of Aboriginal cultural heritage sites
within the Gold Fields controlled leases may restrict or prevent access to certain areas or require lengthy consultation, negotiations
and/or approval processes to be undertaken. Gold Fields’ exploration strategy is based on maintaining exploration momentum at
relevant operations with appropriate annual funding, which ensures programmes retain traction and that high potential targets are
advanced timeously. To the extent that ore bodies are to be developed, it can take a number of years and substantial expenditures
from the initial phases of drilling and discovery until production commences, during which time the economic feasibility of production
may change. Additionally, some Gold Fields operations, such as Cerro Corona, are not expected to expand Mineral Reserve and
Mineral Resource estimates from exploration programmes.
In addition, to the extent Gold Fields participates in the development or operation of a project through a joint venture or any other multi-
party commercial structure, such as Gruyere and Windfall, there could be disagreements (including in relation to Mineral Resources and
Mineral Reserves), technical, legal or otherwise, or divergent interests or goals among the parties, which could jeopardise the success
of the project. Furthermore, significant capital investment is required to achieve commercial production from exploration efforts. There is
no assurance that Gold Fields will have, or be able to raise, the required funds to engage in these activities or to meet its obligations
with respect to the exploration properties in which it has or may acquire an interest. There can be no assurances that Gold Fields will be
able to replace its Mineral Resources and Mineral Reserves through exploration, project development or otherwise and, if Gold Fields is
unable to replace its Mineral Resources and Mineral Reserves, this could erode future planned cash flow and have a material adverse
effect on its business, operating results and financial condition.
Gold Fields’ Mineral Resources and Mineral Reserves are estimates based on a number of technical and economic
assumptions, which, if proven inaccurate or changed, may require Gold Fields to lower its estimated Mineral
Resources and Mineral Reserves.
The Mineral Resources and Mineral Reserves disclosed in this annual report are estimates based on modifying factor assumptions
regarding, among other things, Gold Fields’ costs, expenditures, commodity prices, fuel and energy prices, exchange rates, geology
models, resource estimation models, mining methods, mining equipment, mining rates and metallurgical and mining recovery
assumptions, which may prove inaccurate or change due to a number of factors, many of which are beyond Gold Fields’ control. The
Mineral Resources and Mineral Reserves are also based on reasonable assumptions related to the availability of power and water, as
well as the ability to maintain the licensing and permitting, including cultural heritage permissions, required to support the LOM mineral
reserve plans. In the event Gold Fields adversely revises any of the assumptions that underlie its Mineral Resources and Mineral
Reserves disclosure, Gold Fields may need to revise its Mineral Resources and Mineral Reserves. See “—Additional Information on the
Company—Summary Disclosure of Mining Operations Pursuant to Item 1303 of Regulation S-K under the Securities Act—Summary of
Mineral Resources and Mineral Reserves”.
In 2023, South Deep was unable to fully execute its short-term plans of driving forward key productivity and asset optimisation projects
aimed at sustainably increasing production output and offsetting inflationary pressures and mining constraints. In 2024, South Deep’s
performance will continue to be assessed on the same criteria to enable productivity and cost improvements. See “—Additional
Information on the Company—Individual Property Disclosure Pursuant to Item 1304 of Regulation S-K under the Securities Act—South
Africa Operations—South Deep Mine”. The volatile nature of the operating environment, combined with the technical challenges
associated with deep level mining, continues to pose risks to the technical and economic assumptions contained in South Deep’s short
and medium-term plans. Despite the modernisation and implementation of the initiatives supporting the key improvement themes for
the mine, there can be no assurance that the ongoing modernisation implementation will not result in lower than expected longer-term
steady state production volumes, cost fluctuations, reductions in disclosed Mineral Resources and LOM mineral reserves, or other
associated issues at South Deep, including the long life disclosed.
The reduction of Mineral Reserves held by the Company, including due to any of the above, could have a material adverse effect on
Gold Fields’ business, operating results and financial condition.
Gold Fields may experience unforeseen difficulties, delays or costs in implementing its business strategy and
projects, particularly at Salares Norte, and any such strategy or project may not result in the anticipated benefits.
The ability to grow the business will depend on the successful implementation of Gold Fields’ existing and proposed strategic
initiatives, including through the three pillars of its strategy:
•Pillar 1: Maximising the potential of Gold Fields’ current assets through people and innovation;
•Pillar 2: Building on Gold Fields’ leading commitment to ESG; and
•Pillar 3: Growing the value and quality of Gold Fields’ portfolio of assets.
To deliver against its strategic pillars, Gold Fields will continue to prioritise the health and safety of its people (including psychological
health and wellbeing), the successful commissioning and ramping up of the Salares Norte project, the build-up of production at South
Deep over the next three years and, over a slightly longer time frame, the development of the Windfall project in Canada. See
“Integrated Annual Report—Chief Executive Officer’s Report”.
Gold Fields may also fail to realise the anticipated benefits of its strategy. It may be unable to successfully implement its strategic
initiatives or deliver on its production targets due to, among other things, unforeseen difficulties, delays or costs, or a significant
reduction of the price of gold. Any such difficulties, delays or costs could prevent Gold Fields from fully implementing its business
strategy, which could have a material adverse effect on its business, operating results and financial condition.
Gold Fields has experienced delays with the Salares Norte project, and it now expects to produce its first gold in April 2024 instead of
the fourth quarter of 2023, as it had originally indicated. The project was initially impacted by COVID-19, and subsequently by serious
skills shortages and suboptimal performance by the main construction contractor. The delays have adversely impacted Gold Fields’
cost and production guidance for 2024. Gold Fields may face further cost overruns at the Salares Norte project, including costs relating
to environmental approvals, continued delays, including those due to extreme weather conditions, labour availability or difficulties in
achieving the expected technical parameters once operational, any of which could have a material adverse effect on Gold Fields’
business, operating results and financial condition.
Gold Fields is also in the process of implementing initiatives, which include adjustments to the operating model, asset optimisation and
cost-efficiency initiatives. The Company intends to transition to a functional leadership model that will be delivered through a two-tier
structure, and the Company is in the process of appointing new members to its Executive Committee in line with this structure. See
“Integrated Annual Report—Chief Executive Officer’s Report” and “—If Gold Fields is unable to appoint, hire and retain qualified Board
members, senior leadership, technically skilled employees and contractors that make up its workforce or attain sufficient
representation among marginalised or underrepresented persons in management positions or sufficient gender diversity in its
workforce, in particular in Board and senior leadership-level positions, its business may be materially adversely affected”. These
initiatives may not be implemented as planned, may be less effective than anticipated, or not be effective at all.
As part of its strategy, Gold Fields has also disposed of certain exploration and development assets. With respect to any further
dispositions, Gold Fields may not be able to obtain prices that it expects for any assets it seeks to dispose of or to complete the
contemplated disposals in the timeframe contemplated or at all.
To the extent that Gold Fields enters into acquisitions, combinations or joint ventures, it may experience problems in
executing the transactions or managing and integrating the acquisitions, combinations or joint ventures with its
existing operations.
In order to maintain or expand its operations and Mineral Reserve and Mineral Resource base, Gold Fields may seek to enter into joint
ventures, other business combination transactions or to make acquisitions of selected precious metal producing companies or assets.
For example, in March 2023, Gold Fields announced that it agreed on the key terms of a proposed joint venture in Ghana with
AngloGold Ashanti which would combine the Tarkwa mine with AngloGold Ashanti’s adjacent Iduapriem mine into a single operation,
which is subject to regulatory approval by the government of Ghana. If approved, Gold Fields will hold 60%, AngloGold Ashanti will hold
30% and the Government of Ghana will hold 10% of the proposed joint venture and it will be operated by Gold Fields. Additionally, in
May 2023, Gold Fields entered into a joint venture with Osisko Mining Inc. for a 50/50 joint ownership and development of Osisko's
Windfall gold project. See “—Additional Information on the Company—Projects—Windfall project”.
Proposed acquisitions, combinations or joint ventures (including the proposed joint venture with AngloGold Ashanti and the Windfall
project) may fail to materialise due to closing conditions, regulatory approvals, such as securing an Environmental Impact Assessment
(EIA) approval for Windfall, or other factors that may be outside of Gold Fields’ control. Such transactions may not be timely completed, if
at all.
Completed acquisitions, combinations or joint ventures may change the scale of the Company’s business and operations and may
expose it to new geographic, geological, political, social, strategic, operating, financial, legal, third party, counterparty, regulatory and
contractual risks. In Australia, on 1 July 2023, a new Register of Foreign Ownership of Australian assets pursuant to the Foreign
Acquisitions and Takeovers Act 1975 (Cth) (FATA) commenced. This new register placed additional post-completion and ongoing
administrative reporting obligations on Gold Fields in respect of non-land, land and water acquisitions. Civil penalties may be applied if
Gold Fields fails to give notice to the Register when required to do so and the Commonwealth Government of Australia may also issue
infringement notices in relation to alleged contraventions. Gold Fields could also be subject to termination and/or buy-out rights in the
event that it breaches its joint venture contractual obligations. Completion of joint ventures may also increase disclosure obligations on
additional stock exchanges. There can be no assurance that any proposed or completed acquisition, combination or joint venture will
achieve the results intended, and, as such, could have a material adverse effect on Gold Fields’ business, operating results and
financial condition.
Gold Fields may suffer material adverse consequences as a result of its reliance on outside contractors to conduct
some of its operations.
A portion of Gold Fields’ core mining activities in Australia, South Africa, Chile and Peru and project developments are currently
conducted by outside contractors, and in Ghana, Gold Fields wholly relies on contract mining at the Tarkwa mine. Gold Fields’
operations at sites utilising contractors or contract mining are subject to a number of risks, some of which are outside Gold Fields’
control, including contract, execution, dispute and litigation, regulatory and labour risks, which could result in additional costs and
liabilities, particularly in the stressed labour markets, such as Australia. In addition, inflation began to increase significantly in the
countries in which Gold Fields operates in the latter half of 2021 and into 2022 and 2023, further resulting in out of contract requests for
support from affected contractors, including in Gold Fields’ Australian operations. Additionally, in December 2019, Gold Fields
terminated its contract with BCM Ghana Limited (BCM) in respect of mining services at the Damang mine, and the termination became
the subject of a dispute between BCM and Gold Fields. As at 31 December 2023, the amount recognised in trade and other payables
was U.S.$10.1 million in line with Gold Fields’ assessment of potential liability in respect of the dispute. The U.S.$29.4 million held for
sale asset and related payable was de-recognised in the financial statements for fiscal 2021. See “Annual Financial Report—Notes to
the Consolidated Financial Statements—Note 30. Trade and other payables”. The BCM dispute may result in a protracted dispute
resolution process. Gold Fields could incur significant costs as a result of such potential lengthy dispute process. Gold Fields initiated
arbitration proceedings at the Ghana Arbitration Centre, which have been suspended to allow settlement discussions to occur.
However, these discussions have also been suspended pending the resolution of issues relating to the scope of the court appointed
Interim Management Committee, which follows an internal shareholder dispute at BCM.
Mining contractors are also vulnerable to issues relating to commerciality, liquidity and solvency, which may result in mining operators
such as Gold Fields providing additional financial support to mining contractors. Such issues may be particularly acute in volatile
macroeconomic or hyperinflationary environments. For example, in February 2020, Gold Fields approved an advance payment,
recoverable over 36 months (which was extended in 2021 to 60 months), of approximately U.S.$68.0 million (which has been
accounted as an expected credit loss adjustment in Gold Fields’ consolidated financial statements) to one of the mining contractors at
its operations in Ghana for the purchase of mining equipment. In addition, U.S.$13.6 million was advanced to one of the mining
contractors which is recoverable over 12 months (short-term) mainly from monthly progress claims. As at the end of fiscal 2022, an
additional U.S.$3.9 million of the loan amount and U.S.$13.6 million receivable (short-term) was provided, resulting in a total expected
credit loss of approximately U.S.$58.6 million. As at the end of fiscal 2023, an additional U.S.$25.4 million of the loan amount and U.S.
$7.8 million receivable (short-term) was provided, resulting in total expected credit loss of approximately U.S.$91.8 million (U.S.$29.4
million for Damang and U.S.$62.4 million for Tarkwa). The local mining contractors in Ghana continue to experience financial difficulties.
In addition to being less expensive than owner mining, the current contract mining model is still preferred to owner mining in Ghana due
to several factors, including the large capital outlay for fleet replacement as well as the labour inflexibility and liabilities associated with
owner mining. While Gold Fields has taken steps to implement a comprehensive strategy establishing contract mining sustainability in
its West Africa operations, including signing an amended mining contract with a mining contractor incorporating additional financial
safeguards, these measures have had limited success and further support in the form of mining unit rate increases and further contract
renegotiations remain ongoing. There is no guarantee that these negotiations will be concluded, or if they will ultimately be successful.
In 2022, new provisions applicable to labour outsourcing were introduced in Peru. These provisions prohibited the outsourcing of core
business activities, when carried out with displacement on a permanent basis. Gold Fields filed a court application to declare such
provisions inapplicable to it, as well as a complaint against the Peru Ministry of Labour with the National Institute for the Defence of
Competition and the Protection of Intellectual Property (INDECOPI) for having established bureaucratic barriers, challenging the legality
and reasonableness of the prohibitions and obligations imposed by the new provisions. INDECOPI granted Gold Fields a precautionary
measure, thus temporarily suspending the effects of these provisions until the issuance of a final judgement. Additionally, in connection
with a similar procedure initiated by a third party, INDECOPI published a resolution declaring the non-application of the aforementioned
provisions, which has general effects for all entities, including those that did not initiate a claim against the provisions.
INDECOPI has suspended the procedure that Gold Fields initiated until the judicial action (acción popular) that was initiated by the third
party is resolved. This has created a situation of uncertainty because it is not clear what effect the procedure initiated by the third party
would have on the procedure initiated by Gold Fields, if the third party procedure is ultimately resolved in favour of the validity of the
provisions. There can be no guarantee that Gold Fields’ challenges will be successful in the final instance.
The occurrence, or prolonged continuation, of one or more of these risks could have a material adverse effect on Gold Fields’ business,
operating results and financial condition.
Failure of Gold Fields’ information, communication and technology systems, or the failure to protect personal
information, could significantly impact Gold Fields’ operations and business, may lead to public and private censure,
regulatory penalties, fines and/or sanctions and may damage Gold Fields’ reputation.
Gold Fields utilises and is reliant on various internal and external information, communication and technology system applications to
support its business activities, in particular SAP, mining activity applications and other applications. Damage to or interruption of Gold
Fields’ information, communication and technology systems, whether due to incidents, human error, natural events or malicious acts,
may lead to important data being irretrievably lost, exposed or damaged, or may otherwise impact the operation of all or part of Gold
Fields’ mining assets, thereby adversely affecting Gold Fields’ business, prospects and operating results. As part of Gold Fields’
ongoing efforts to enhance operational efficiency and improve cybersecurity and data management, it is in the process of migrating
significant portions of its information technology infrastructure to the cloud. This could lead to several risks, such as, higher than
projected initial migration and ongoing operational costs, increased exposure to cybersecurity threats, difficulty complying with various
data protection regimes and operational impacts due to unstable or insufficient internet infrastructure where operations are located in
remote areas.
The information security management system protecting Gold Fields’ information, communication and technology infrastructure and
network may be subject to security breaches (e.g., cyber-crime or activists) or other incidents that can result in misappropriation of
funds, increased health and safety risks to people, disruption to Gold Fields’ operations (as a result of the increasing interface between
operational technology and information technology), environmental damage, loss of intellectual property, disclosure of commercially or
personally sensitive information, legal or regulatory breaches and liability, other costs and reputational damage.
While Gold Fields follows the established best practices in relation to cyber security (e.g., having attained the ISO 27001 cyber security
re-certification for corporate, regional offices and mining operations in 2023), the increasing sophistication and evolving nature of cyber
security threats may lead to future cyber security breaches. This is particularly the case with new and evolving technologies such as
artificial intelligence (AI), including generative AI. As these technologies continue to improve and gain widespread use, Gold Fields may
experience cyber security attacks created using AI, which may be difficult to detect and defend against. For further discussion on
management’s approach to cybersecurity, see “Annual Financial Report—Management’s Discussion and Analysis of the Financial
Statements—Information Communication and Technology (ICT)”. An extended failure of critical system components, caused by
accidental, or malicious actions, including those resulting from a cyber security attack, could result in a significant environmental
incident, commercial loss or interruption to operations.
Gold Fields may also adopt AI and other emerging technologies into its own IT systems or integrate AI within its mining operations.
Such tools may additionally be utilised by Gold Fields’ contractors and third parties that the Company conducts business with. The use
of AI may not meet the existing and rapidly evolving regulatory standards and could introduce security risks that may expose
confidential data, lead to the loss of competitive information and result in operational failures. Limited expertise and skills shortages
could prevent Gold Fields from effectively using or promptly implementing AI and other technologies.
In addition, Gold Fields is also subject to risks relating to the interpretation and application of evolving consumer, privacy and data
protection laws and regulations in the jurisdictions in which Gold Fields operates, including Australia, South Africa, Ghana, Chile, Peru,
the European Union (EU) and the United States. Regulators may interpret and apply these laws and regulations in a manner that is
inconsistent with Gold Fields’ current data processes and practices.
Complying with these various laws and regulations is complex and could cause Gold Fields to incur substantial costs or require it to
change its business practices, processes and information, communication and technology system platforms in a manner adverse to its
business. This includes legislation such as the General Data Protection Regulation (GDPR), an EU-wide framework that sets out rules
relating to the protection of personal data being processed in, or outside, the EU, and which applies to Gold Fields through its storage
of employee information in data centres located in the EU. Other applicable laws include, but are not limited to, Australia’s Privacy Act
1988 and South Africa’s comprehensive privacy law, the Protection of Personal Information Act, 2013 (POPIA). In Australia, following a
series of recent high profile data breaches, the Privacy Legislation Amendment (Enforcement and Other Measures) Act 2022 was
passed, which introduced significantly increased penalties for serious and/or repeated privacy breaches and increased the Office of the
Australian Information Commissioner’s ability to resolve breaches.
The mining sector has historically and may in the future continue to experience confidentiality breaches, and failure to comply with data
protection legislation, such as the GDPR, the Australian Privacy Act or POPIA may lead to public and private censure, regulatory
penalties, fines and/or imprisonment, depending on the severity of the breach, which could have a material adverse effect on Gold
Fields’ business, operating results and financial condition.
The failure to optimise and modernise operations may have a material adverse effect on Gold Fields’ business.
Gold Fields’ business is increasingly dependent on its ability to modernise its operations, including through changes to its operating
model, implementation of digital and other operational technology (such as remotely operated and battery electric vehicles and
equipment) and IT systems. Improvements to these systems are necessary for Gold Fields to increase its Mineral Resource to Mineral
Reserve conversion, improve productivity and efficiency, reduce costs, decrease power consumption, improve safety and reduce
environmental impact, among other things.
Modernisation of its operations require Gold Fields to adopt new technologies, new organisational structures and new skills. These
changes could result in the loss of key personnel and failure to realise efficiencies. Modernisation of operations also requires Gold
Fields to manage its technology development and costs. Among other things, Gold Fields will likely have to form partnerships with
original equipment manufacturers over whom Gold Fields does not have operational control. Implementation of new technologies and
systems is capital intensive and there is no guarantee that the use of new technologies and systems will deliver the intended benefits
within the anticipated timeframes, or at all. In addition, the implementation and operation of new technologies and systems may require
new or additional skills which Gold Fields may not have, or may not be able to secure, particularly as many of these skills are in high
demand from competitors. Initiatives to modernise Gold Fields’ operations may cause operational disruptions, IT failures, safety system
failures, increased costs, lower productivity and other challenges.
Gold Fields’ competitors are also undertaking modernisation initiatives which may result in it becoming more difficult for Gold Fields to
compete if it fails to update its operations. Failure to modernise its operations may also make it more difficult for Gold Fields to
effectively convert Mineral Resources to Mineral Reserves, reduce costs and attract employees with critical skills. This may also have
negative effects on the reputation of the company. Any of the above could have a material adverse effect on Gold Fields’ business,
operating results or financial condition.
Actual and potential supply chain shortages, availability and increases in the prices of production inputs may have a
material adverse effect on Gold Fields operations and profits.
Gold Fields’ operating results have and may continue to be affected by general cost increases, including due to the availability and
pricing of raw materials and other essential production inputs, such as fuel, steel, cyanide and other reagents. The price and quality of
raw materials may be substantially affected by changes in global supply and demand, sustained and lingering impacts and large-scale
trend changes from the COVID-19 pandemic, along with weather conditions, governmental controls, the war in Ukraine and related
economic sanctions and other factors. A sustained interruption in the supply of any of these materials would require Gold Fields to find
acceptable substitute suppliers and could require it to pay higher prices for such materials. Any significant increase in the prices of
these materials will increase the Company’s operating costs and affect production considerations. Gold Fields expects cost increases to
continue in fiscal 2024 and possibly 2025 across its operations, including as a result of other factors such as the price of oil, inflationary
increases and labour costs. See “—High and rising inflation may have a material adverse effect on Gold Fields’ business, operating
results and financial condition”.
The price of oil has been volatile, fluctuating between U.S.$51.68 and U.S.$79.32 per barrel of Brent Crude in 2021, between U.S.
$78.69 and U.S.$85.65 per barrel of Brent Crude in 2022 and between U.S.$70.84 and U.S.$92.41 per barrel of Brent Crude in 2023.
This volatility has and is expected to continue following the imposition of sanctions and embargoes on natural gas and oil resulting from
the war in Ukraine. As at 20 March 2024, the price of oil was at U.S.$85.95 per barrel of Brent Crude. Changes in the cost or availability
of oil could increase Gold Fields’ cost of operations and cause production stoppages, which could impact existing profit margins and
have a material adverse effect on Gold Fields’ business, operating results and financial condition.
Gold Fields may, from time to time, enter fixed price swaps for the purchase of oil. There can be no assurance that the use of hedging
techniques will always be to Gold Fields’ benefit. Hedging instruments that protect against the market price volatility of commodities
may prevent Gold Fields from realising the full benefit from subsequent decreases in market prices, which would cause it to record a
mark-to-market loss, thus decreasing Gold Fields’ profits. Hedging contracts also are subject to the risk that the other party may be
unable or unwilling to perform its obligations under these contracts. Any significant non-performance could have a material adverse
effect on Gold Fields’ financial condition, results of operations and cash flows.
Furthermore, the price of steel has also been volatile. Steel is used in the manufacture of most forms of fixed and mobile mining
equipment and much of the support material used underground, which is a relatively large contributor to the operating costs and capital
expenditure of a mine. In addition, there has been a recent significant increase in the price of explosives, a key input for mining activity,
driven by heightened ammonium nitrate prices.
Fluctuations in oil, steel and explosives prices may have a significant impact on operating costs and capital expenditure estimates and,
in the absence of other economic fluctuations, could result in significant changes in the total expenditure estimates for new mining
projects or render certain projects non-viable. Any of the above may have a material adverse effect on Gold Fields’ business, operating
results and financial condition.
Power cost increases and unreliability of power supply may adversely affect Gold Fields’ business, operating results
and financial condition.
In Australia, Gold Fields’ Gruyere, Granny Smith and Agnew mines receive electricity from various combinations of gas, wind and solar
power, battery storage and diesel. The St. Ives operation obtains electricity pursuant to a contract with BHP-Nickel West that has been
extended to 1 July 2025, which requires St. Ives to procure its own supply of natural gas. The approval of a renewable microgrid to
replace a proportion of this supply was secured in February 2024, and the project is expected to be completed in 2025. Gold Fields
will need to renegotiate and execute a new electricity supply contract with BHP-Nickel West to provide St. Ives mine its base electricity
supply, which is approximately 25% of its total requirement. Failure to successfully execute the construction and commissioning of the
St. Ives microgrid and/or the negotiation of the new electricity supply agreement with BHP-Nickel West could result in an increase in
costs and/or the cessation or interruption of mining at St. Ives. Considering the reliance on gas transmission pipelines, if any of Gold
Fields’ Australian operations were to lose their supply, including through failure to secure gas pipeline capacity or renewed supply
contracts when the current arrangements come to an end over the next two years, replacement of this supply at the quantities required
(through alternatives such as diesel or greater reliance on existing renewable energy infrastructure) may not be possible in its entirety,
or at the very least may entail a significant increase in costs in the medium and long term given the rising price of gas in Western
Australia, which is forecasted to continue due to lack of new supply. While Gold Fields is considering options for gas supply beyond
current contractual arrangements and will be commencing negotiations for renewed supply contract over the course of 2024, there is
no guarantee that these alternative options will be successful in lowering costs. Any such increase in costs could have a material
adverse impact on Gold Fields’ business and operating results.
Gold Fields’ South Deep mining operation depends, in large part, upon electrical power generated by the state-owned power utility,
Eskom Limited (Eskom). See “Annual Financial Report—Management’s Discussion and Analysis of the Financial Statements—Overview
—Costs—South Africa Region”. Eskom holds a monopoly on power supply in the South African market, supplying nearly 95% of the
country’s electricity needs. Eskom has historically experienced financial difficulties caused by various factors. For example, during
certain periods of supply-constraint, Eskom utilised significant amounts of diesel to run its gas turbines while concurrently losing
electricity sales because of load shedding or curtailment, which has contributed to above inflation tariff applications.
Eskom’s tariffs are regulated by the National Energy Regulator of South Africa (NERSA) and are determined through a consultative multi-
year price determination (MYPD) process, with occasional tariff increase adjustments under the Regulatory Clearing Account (RCA)
mechanism. Pursuant to the MYPD process, NERSA granted Eskom tariff increases of 9.61% for the period 2022/2023 and 18.65% for
the period 2023/2024, which includes an RCA amount of R15 billion. In January 2023, NERSA granted Eskom a 12.74% tariff increase for
the period 2024/2025, which will take effect in April 2024. It is likely that Eskom’s electricity tariffs will continue to increase significantly,
despite the South African Government’s announcement in 2023 that it would provide Eskom with debt relief of R254 billion over a three
year period.
Eskom is currently undergoing a vertical unbundling to separate the company’s generation, transmission and distribution functions. The
exact timing and impact of the vertical unbundling is not known but it may result in tariff increases, price instability and/or poor reliability
in the supply of electricity. In July 2023, NERSA approved a 25-year transmission licence for the National Transmission Company of
South Africa (NTCSA), which is a wholly owned subsidiary of Eskom Holdings, and further approved the trading licence and import/
export licence in September 2023. Eskom has reported that the transmission company will be operational by 2025. Integrity of
transmission lines are also at risk due to poor maintenance and criminal interventions resulting in failure. Gold Fields has taken
measures to reduce South Deep’s reliance on Eskom. For example, South Deep has completed the construction on a 50MW solar
power plant with studies underway to expand the renewable energy base load with wind turbines. A surveillance programme has also
been implemented at South Deep to proactively detect anomalies, conduct repairs and restore the integrity of the transmission line.
Despite such measures, Gold Fields will continue to be reliant on Eskom, and should Gold Fields experience further power tariff
increases and disruptions to its supply, its business, operating results and financial condition may be adversely impacted.
In Ghana, Gold Fields’ mines are supplied primarily by power plants operated by Genser Energy Ghana Limited (Genser Energy), which
supplies Damang’s total power requirements from a 27.5MW power plant and approximately 95% of Tarkwa’s power requirements from
a 57MW power plant. If either of these plants fail or supply insufficient power, Damang and Tarkwa may be required to source additional
power from the national grid providers Volta River Authority (VRA) and the Electricity Company of Ghana (ECG), respectively, and may
be subject to power disruptions.
Changes in the cost or availability of electricity could increase Gold Fields’ cost of operations and cause production stoppages, which
could impact existing profit margins and have a material adverse effect on Gold Fields’ business, operating results and financial
condition. See “—Environmental and Regulatory Matters”.
Power deficits, potential total power failure in South Africa, fluctuations and usage constraints may force Gold Fields
to halt or curtail operations.
In South Africa, Eskom reintroduced national rotational power cuts (load shedding and load curtailment for industrial customers with
formal agreements) in December 2018. Load shedding and curtailment continued throughout 2023 and into 2024, with various stages
being implemented, from Stage 1 to Stage 6 for approximately 335 days in 2023. Eskom has forecasted that load shedding is expected
to continue until 2027 and reported that it aims to limit load shedding levels to below Stage 4. Eskom’s inability to fully meet the
country’s demand has led to, and is expected to continue to lead to, rolling blackouts and unscheduled power cuts. There is no
assurance that Eskom’s efforts to protect the national electrical grid will prevent a complete national blackout. Further, despite
preparing plans for the South Deep mine in case of a national blackout, such events would have a material adverse effect on
South Deep.
Gold Fields has a load curtailment agreement with Eskom. Under this agreement, Gold Fields is required to reduce demand by up to
50% of load, depending on the severity of the shortage, for a specified period during which the national grid is unable to maintain
supply demand. During 2023, Gold Fields was required to reduce demand by 10% 63 times, by 15% two times and by 20% 35 times.
Any further disruption or decrease in the electrical power supply available to Gold Fields’ South Deep operation, or a total power failure
in South Africa, could severely impact the South Deep operation and, in turn, have a material adverse effect on Gold Fields’ business,
operating results and financial condition.
In Ghana, approximately 95% of Tarkwa’s electricity is supplied by an independent power producer. However, there can be no
guarantee that Damang’s and Tarkwa’s sources of power will not fail or be interrupted. While Gold Fields has taken steps to source
power from an independent power producer through on-site gas turbines to complement its self-generated sources, any gas supply
chain-related risk specific to the regions where Gold Fields operates could affect Gold Fields’ business, operating results and financial
condition.
Should Gold Fields continue to experience power fluctuations or usage constraints at any of its operations, then its business, operating
results and financial condition may be materially adversely impacted.
Gold Fields’ current debt levels may pose risks to its viability and may make it more vulnerable to adverse economic
and competitive conditions, as well as other adverse developments.
As of 31 December 2023, Gold Fields’ consolidated gross debt was approximately U.S.$1.2 billion (of which U.S.$583.1 million becomes
due over the 12 months following 31 December 2023).
Gold Fields’ current levels of debt can adversely affect it in several respects, including:
•limiting its ability to access the capital markets;
•exposing it to the risk of credit rating downgrades, which would raise its borrowing costs and could limit its access to capital;
•hindering its flexibility to plan for or react to changing market, industry or economic conditions;
•making it more vulnerable to economic or industry downturns, including interest rate increases;
•increasing the risk that it will need to sell assets, possibly on unfavourable terms, to meet payment obligations;
•increasing the risk that it may not meet the financial covenants contained in its debt agreements or timely make all required debt
payments; or
•affecting its ability to service the interest on its debt.
The effects of each of these factors could be further intensified if Gold Fields increases its borrowings. As Gold Fields continuously
reviews its funding and maturity profile, it expects to consider additional opportunities to access the international U.S. dollar bond
markets in the future. A sustained and negative movement in the price of gold will negatively impact Gold Fields’ ability to repay its
debt. Any failure to make required debt payments could, among other things, adversely affect Gold Fields’ ability to conduct operations
or raise capital, which could have a material adverse effect on Gold Fields’ business, operating results or financial condition.
Gold Fields faces continued geotechnical challenges, which could adversely impact its production and profitability.
Gold Fields and others in the mining industry are facing continued geotechnical challenges due to ageing of certain mines and a trend
toward mining deeper pits and more complex, often deeper underground deposits. This leads to higher pit walls, more complex
underground environments, increased exposure to geotechnical instability, and increased propensity for seismic damage and
hydrological impacts. As Gold Fields’ operations are maturing, the open pits at many of its sites are becoming deeper and it has
experienced certain geotechnical failures at some of its mines. Additionally, primary access and shafts require increased maintenance
and rehabilitation which may result in down time that may affect production.
For Gold Fields’ open pit operations, no assurances can be given that unanticipated adverse geotechnical and hydrological conditions,
such as landslides and pit wall failures, which could result in potential ore loss and/or prevent or limit pit access, will not occur in the
future or that such events will be detected in advance. Further, Gold Fields’ underground operations are also maturing, and mining is
at deeper levels which may be more prone to seismicity. This is of particular concern at the Wallaby underground operation at Granny
Smith, the Waroonga underground at Agnew and South Deep. Gold Fields had 19 damaging seismic events in 2023, compared to
38 damaging seismic events in 2022. South Deep accounted for 15 of these seismic incidents in 2023. All of Gold Fields’ underground
operations now have stress-related mining issues. Gold Fields endeavours to use industry best practices in seismological monitoring
and analysis in addition to the use of dynamic capable ground support in these operations. However, in Gold Fields’ underground
operations, no assurances can be given that unanticipated adverse geotechnical and hydrological conditions, such as mine seismicity
and inrushes, will not occur in the future or that such events will be detected in advance.
Gold Fields has appointed external geotechnical review boards (the Geotechnical Review Boards) to help implement industry best
practice geotechnical design, monitoring, mine design, extraction sequencing, and ground support implementation, specifically at the
Wallaby mine at Granny Smith, South Deep and Cerro Corona. Gold Fields also cannot guarantee that any recommendations by the
Geotechnical Review Boards will be implemented effectively or that the ongoing monitoring of Gold Fields’ mines will not be
interrupted. Geotechnical instabilities can be difficult to predict and are often affected by risks and hazards outside of Gold Fields’
control, such as severe weather and rainfall, which may lead to periodic floods, mudslides, and wall instability, which may result in
slippage of material with respect to geotechnical conditions. In relation to mine induced seismicity, uncontrollable changes in the
regional extraction rate or mining on the same geological structure as the neighbouring mine, as well as changes in the mining
extraction rate or sequence, may lead to higher than anticipated seismic activity, which may result in damage to infrastructure and
prevent access to the affected mining areas.
Geotechnical failures and seismic activity could result in limited or restricted access to mine sites, suspension of operations, regulatory
investigations, increased monitoring costs, remediation costs, loss of ore and other impacts, which could have a material adverse
impact on Gold Fields’ reputation, business, operating results and financial condition.
The continued status of South Africa’s credit rating as non-investment grade, as well as the grey listing of South
Africa by the Financial Action Task Force, may have an adverse effect on Gold Fields’ ability to secure financing.
After South Africa’s sovereign credit rating was downgraded to non-investment grade by Standard & Poor’s and Fitch Ratings Inc. (Fitch)
in 2017 and by Moody’s in 2020, in 2022, Moody’s changed South Africa’s sovereign credit rating outlook to stable from negative due
to the likelihood of the South African Government’s debt burden stabilising over the medium term. Moody’s also changed the outlook
for ten corporates, including Gold Fields, to stable from negative due to a credit rating linkage with the South African sovereign rating.
South Africa’s current sovereign credit ratings are BB- (stable outlook), Ba2 (stable outlook) and BB- (stable outlook) from Standard &
Poor’s, Moody’s and Fitch, respectively.
The continued status of South Africa’s sovereign credit rating as non-investment grade by Standard & Poor’s, Moody’s or Fitch Ratings
may adversely affect the South African gold mining industry and Gold Fields’ business, operating results and financial condition,
particularly given the linkage and direct consequence of Moody’s credit ratings, by making it more difficult to obtain external financing
or could result in any such financing being available only at greater cost or on more restrictive terms than might otherwise be available.
Downgrades of South Africa’s sovereign credit rating could also have a material adverse effect on the South African economy as many
pension funds and other large investors are required by internal rules to sell bonds once two separate agencies rate them as non-
investment grade. Additionally, in February 2023, South Africa was “grey listed” by the Financial Action Task Force, which subjects it to
increased monitoring and may have a negative impact on South Africa’s financial growth and discourage foreign investment. Any such
negative impact on the South African economy may adversely affect the South African gold mining industry and Gold Fields’ business,
operating results and financial condition.
Theft of gold and copper bearing materials and production inputs, as well as illegal and artisanal mining, occurring on
some of Gold Fields’ properties, are difficult to control, can disrupt Gold Fields’ business and can expose Gold Fields
to liability.
A number of Gold Fields’ properties have experienced illegal and artisanal mining activities and theft of gold and copper bearing
materials and copper cables (which may be by employees or third parties). These activities could lead to interference with Gold Fields’
operations and result in conflict situations that present a threat to human life and property. Perimeter security processes are being
strengthened to ensure that critical infrastructure is adequately protected, however there is no guarantee that these measures will be
effective, particularly as the nature of these criminal activities become more sophisticated.
Illegal and artisanal mining is associated with several negative impacts, including safety incidents, environmental degradation and
human rights abuse. Effective government administration is often lacking in the locations where illegal and artisanal miners operate
because of rapid population growth and the lack of functioning structures which can create a complex and unstable social environment.
In Ghana, the government lifted its ban on small scale mining in 2018. The government also indicated its intention to withdraw military
personnel who were deployed to mining concessions to provide security and help prevent encroachment by illegal miners. To address
this gap, the Ghanaian Chamber of Mines (the Chamber) is currently negotiating a security agreement with the Ghana Police Service, on
behalf of its members. The security agreement is yet to be signed and there is no guarantee that this will occur.
The activities of illegal and artisanal miners could lead to depletion of Mineral Resources and Reserves, potentially affecting the
economic viability of mining certain areas and shortening the lives of the operations as well as causing possible operational disruption,
project delays, disputes with illegal miners and communities, pollution, damage to property, personal injury or death. It is possible that
mine owners may be held responsible for the actions of such illegal miners or for any damages, injuries or fatalities that occur due to
their actions.
Furthermore, the environmental, social, safety and health impacts of illegal and artisanal mining are frequently attributed to formal
mining activities, and it is often assumed that illegal and artisanal-mined gold is channelled through large-scale mining operators. These
misconceptions negatively impact the reputation of Gold Fields and of the industry. The occurrence of any of these events could have a
material adverse effect on Gold Fields’ “social licence to operate”, as well as its business, operating results and financial condition. See
“Integrated Annual Report—Strategic Pillar 2: Building on Our Leading Commitment to ESG—Host Communities—Managing Host
Community Impact and Risks—Artisanal, Small-scale and Illegal Mining in Ghana”.
Occupational diseases pose risks to Gold Fields in terms of lost productivity and increased costs.
Gold Fields faces risks related to occupational diseases, such as noise-induced hearing loss, silicosis and tuberculosis, as well as health
epidemics, which could significantly impact its people, operations and surrounding areas. The degree of exposure risk varies between
its sites due to the nature of its operations. For example, the prevalence of HIV/AIDS in South Africa poses risks to Gold Fields in terms
of potentially reduced productivity and increased medical and other costs. Gold Fields supports its employees living with HIV through
health plans and other measures to manage their conditions. If there is a significant increase in the incidence of occupational diseases
among the workforce or health epidemics, this may have a material adverse effect on Gold Fields’ business, operating results and
financial condition. See “Integrated Annual Report—Strategic Pillar 1: Maximise Potential From Current Assets Through People and
Innovation—Building a Safe and Respectful Workplace—Health and Wellness—Occupational Diseases”.
Risks related to environmental, social and corporate governance
Gold Fields may not be able to operate successfully if its employees and contractors that make up its workforce are
not able to perform their roles in a safe and respectful work environment.
Gold Fields’ success is dependent on the contributions of its people. Gold Fields’ ability to achieve its operating goals depends upon
its ability to recruit, hire, retain and develop qualified and diverse personnel. Gold Fields is fundamentally committed to creating and
maintaining a physically and psychologically safe work environment in which employees are treated fairly, with dignity, decency,
respect and in accordance with the company’s values and all applicable laws. Gold Fields recognises that bullying, sexual harassment
and harassment based on other protected categories, including race, have been prevalent in every industry, including the mining
industry. Features of the mining industry, such as being a historically hierarchical and male-dominated culture, create risk factors for
harmful workplace behaviour. For example, in 2021, an inquiry was held by the Parliament of Western Australia into the sexual
harassment and assault of women in the Western Australian mining industry. Over the course of the inquiry, a large number of
submissions were made, resulting in significant adverse media for the industry. In June 2022, the inquiry published its findings, to which
the Western Australian government responded in September 2022 by accepting, or accepting in principle, all recommendations
pertaining to government.
Gold Fields does not tolerate discrimination and/or harassment of any kind (including in relation to sexual orientation, gender identity,
race, religion, ethnicity, age, or disability, among others). In 2022, Gold Fields engaged Elizabeth Broderick & Co to carry out an
independent review examining its workplace culture, and findings of which were published in August 2023. The findings revealed half
of the respondents had experienced harmful behaviour at work, such as bullying, sexual discrimination, and/or racism, during the last
five years, and many reported having little confidence in Gold Fields’ reporting mechanisms. As a result, actions have been taken to
reduce the incidence of harmful behaviours and to improve reporting mechanisms, with progress tracked on a quarterly basis. Despite
these measures, Gold Fields’ policies and processes may not prevent or detect all potential harmful workplace behaviours. Gold Fields
occasionally identifies or is apprised of information or allegations that certain employees, affiliates, contractor workers, agents or
associated persons may have engaged in harmful behaviours and improper, inappropriate or unlawful conduct, including but not limited
to bullying, discrimination and/or harassment. If Gold Fields fails to maintain a safe, respectful and inclusive work environment, it could
adversely impact employee attraction, engagement, performance, productivity and retention; result in potential legal claims, regulatory
action, and/or adverse media and/or otherwise damage the Company’s reputation, which could have a material adverse effect on Gold
Fields’ business, results of operations and financial condition.
Economic, political or social instability in the countries or regions where Gold Fields operates may have a material
adverse effect on Gold Fields’ operations and profits.
In fiscal 2023, 45%, 13%, 32% and 10% of Gold Fields’ managed gold-equivalent production was in Australia, South Africa, Ghana and
Peru, respectively. Changes or instability in the economic, political or social environment in any of these countries or in neighbouring
countries could affect investment in Gold Fields.
In 2022, Australia held a federal election which resulted in the election of a new government, led by Prime Minister Anthony Albanese.
The next federal elections in Australia are due to be held in 2025. Western Australia held state elections in 2021, and the WA Labour
Party (led by State Premier Roger Cook) was re-elected for a second term. The next state election is due to be held in 2025.
Following a general election in 2019, Cyril Ramaphosa was re-elected as President of South Africa, with the next election taking place in
2024. Furthermore, while the South African Government has stated that it does not intend to nationalise mining assets or mining
companies, certain political parties have stated publicly and in the media that the government should embark on a programme of
nationalisation. Any threats of, or actual proceedings to, nationalise any of Gold Fields’ assets, could halt or curtail operations, resulting
in a material adverse effect on Gold Fields’ business, operating results and financial condition and could cause the value of Gold Fields’
securities to decline rapidly and dramatically, possibly causing investors to lose the entirety of their respective investments.
Further, high levels of unemployment, particularly among the youth, and a shortage of critical skills in South Africa, despite increased
government expenditure on education and training, exacerbated by ongoing loadshedding and degradation of infrastructure, remain
issues and deterrents to foreign investment. The volatile and uncertain labour and political environments, which severely impact the
local economy and investor confidence, have led, and may lead, to further downgrades in national credit ratings, making investment
more expensive and difficult to secure. See “—Gold Fields’ operations and profits have been and may continue to be adversely
affected by trade union activity and new and existing labour laws” and “—The continued status of South Africa’s credit rating as non-
investment grade, as well as grey listing of South Africa by the Financial Action Task Force, may have an adverse effect on Gold
Fields’ ability to secure financing”. This may restrict Gold Fields’ future access to international financing and could have a material
adverse effect on Gold Fields’ business, operating results and financial condition.
In Ghana, Nana Akufo-Addo was re-elected for a second four-year term as president in 2020. Ghana continues to see high levels of
unemployment, particularly among the youth, degradation of infrastructure, uncertain political environments and tariff increases. Tax
hikes and debt exchange programmes pursued by the government led to pockets of protests in Accra in 2023. In addition to an
International Monetary Fund payout in January 2024, Ghana continues to extend existing levies and impose new ones. These socio-
economic trends continue to be issues of concern that deter foreign investment and weaken investor confidence. The next general
election is due to be held in October 2024.
Since Chile’s constitutional referendum in October 2020, civil unrest in Chile has declined considerably and is confined to the
Araucanía region, located in the southern part of Chile. Chile held general elections in 2021, and Gabriel Boric was elected as President
for a four-year term. In February 2022, the constitutional convention’s environmental committee submitted a proposal to nationalise
Chile’s copper, lithium and gold mines. This proposal, which required two thirds of the full constitutional convention, was rejected and
was therefore not included in the constitutional text that was submitted to popular vote. The new constitution was put to voters on
4 September 2022 and was rejected. Following the rejection, another new constitution was drafted in 2023 and was rejected by voters
in a referendum held on 17 December 2023. Following these two failed attempts to agree on a new constitution, the Chilean
government has ruled out initiating a new constitutional process during the current presidential term, which will extend to 2025. It is
unclear if the next government will institute a new constitutional process. As Gold Fields moves into production ramp-up at the Salares
Norte project in Chile, any unrest, or any unforeseen or unfavourable changes stemming from any future new constitution, such as a
proposal to nationalise Chile’s gold mines, may delay or halt such production ramp-up, which could have a material adverse effect on
Gold Fields’ business, operating results and financial condition.
In 2021, Peru held a general election and Pedro Castillo was elected President for a five-year term. However, he was impeached in
December 2022. As a result, Vice President Dina Boluarte was sworn into office. Subsequently, social unrest increased and protests
broke out across the country, which eventually diminished over the course of 2023.
Peru’s local authorities (the regional governor, the provincial mayor and the district mayor) have previously expressed concern
regarding a perceived lack of values-based mining within their communities and the new central government of Peru has expressed
concern that social instability has increased in the communities surrounding Cerro Corona. In addition, engagement with community
stakeholders, including in Peru and South Africa, can pose challenges to local management and any inability to properly manage these
relationships may have a negative impact on Gold Fields’ production or associated costs. There is also the potential for social instability,
protests or organised criminal activity in the communities near Gold Fields’ South Deep, Damang, Tarkwa and Cerro Corona mines
relating to, among other things, community investment, unemployment, community mining, environmental concerns, service delivery
by local government or other issues. To date, the protests near Cerro Corona relating to the social unrest following Pedro Castillo’s
removal have been peaceful.
It is not certain what, if any, political, economic or social impacts the newly elected, appointed or re-elected governments will have on
Australia, South Africa, Ghana, Chile or Peru, respectively, or on Gold Fields specifically. In addition, economic and political instability in
regions outside of the jurisdictions where Gold Fields operates and geopolitical events, such as the war in Ukraine and its related
economic sanctions, may result in unavoidable uncertainties and events. These uncertainties and events could negatively affect costs
of business, cause volatility in commodity prices, currency exchange rates, interest rates and worldwide political, regulatory, economic
or market conditions. They could also cause instability in political institutions, regulatory agencies and financial markets.
Occurrence of any such developments could result in Gold Fields experiencing opposition or disruptions in connection with any of its
operations. Such opposition or disruptions to any of Gold Fields’ operations, in particular if it has an adverse impact or costs or causes
any stoppages (including as a result of any protests aimed at government and other mining operations that affect operations), could
have a material adverse effect on Gold Fields’ business, operating results and financial condition.
If Gold Fields is unable to appoint, hire and retain qualified Board members, senior leadership, technically skilled
employees and contractors that make up its workforce or attain sufficient representation among marginalised or
underrepresented persons in management positions or sufficient gender diversity in its workforce, in particular in
Board and senior leadership-level positions, its business may be materially adversely affected.
Gold Fields’ ability to operate effectively and to meet its strategic objectives depends on the experience, skills and performance of its
Board members, senior leadership and technically skilled employees.
Various members of Gold Fields’ Board of Directors are expected to depart in the near future, including many long-serving Non-
Executive Directors. The Board is working on succession planning and identifying diverse candidates. However, the anticipated
transition period could last longer than expected and there may be difficulties with recruiting qualified candidates, which could require
expending additional resources and disrupting the continuity of the Board’s decision-making process.
Furthermore, the Company has experienced significant changes to its senior leadership team between 2023 and 2024. In January
2024, Mike Fraser was appointed as CEO, which followed the departure of four members of the Executive Committee in 2023. A further
three members of the Executive Committee, including the CFO, Executive Vice President of Australia and Executive Vice President of
Sustainable Development announced their retirements in 2023. The Company is in the process of appointing new members to its
Executive Committee, and is in advanced stages in its searches to fill the CFO and EVP of Sustainable Development positions. The
mining industry continues to experience a global shortage of qualified senior leadership, which may have a negative impact on Gold
Fields’ ability to fill the vacant positions on its Executive Committee. Changes to the senior leadership team and the Board could impact
Gold Fields’ strategy and strategic direction. In 2023, Gold Fields announced that it would change its operation model from a three-
layered organisation to a two-layer functional guidance model. However, due to the various changes in the senior leadership team, the
implementation of this new model may not be achieved within the timeframe initially contemplated or at all. See “—Gold Fields may
experience unforeseen difficulties, delays or costs in implementing its business strategy and projects, particularly at Salares Norte, and
any such strategy or project may not result in the anticipated benefits”.
Furthermore, the mining industry, including Gold Fields, is experiencing shortages of sufficiently skilled employees. There are shortages
of mechanised mining skills in the Australian, South African and Ghanaian gold mining industries and a shortage of technically qualified
employees in the Peruvian and Chilean gold mining industries. Gold Fields is also experiencing a shortage of skilled workers including
operators and artisans at South Deep. The ability of Gold Fields to secure a future pipeline of appropriately skilled employees is also
uncertain due to a decline in those seeking to train in the technical areas relevant to the mining industry and even more scare female
talent entering those careers. Gold Fields may be unable to appoint, hire or retain qualified Board members, senior leadership,
technically skilled employees or other management personnel, or may have to pay higher levels of remuneration than it currently
intends in order to do so.
In Australia, the Workplace Gender Equality Amendment (Closing the Gender Pay Gap) Act 2023 (Cth) was passed in March 2023,
which requires Gold Fields to lodge annual reports relating to six gender equality indicators. Additionally, Gold Fields takes proactive
steps to ensure participation among marginalised or underrepresented persons (including, such as in South Africa, Historically
Disadvantaged Persons (as defined in the Mineral and Petroleum Resources Development Act, No. 28 of 2002 (MPRDA) (HDSAs)),
women and people with disabilities) at all levels within the Group, including at the Board and other relevant management levels, and at
all occupational levels. In some instances, including in South Africa, Gold Fields must ensure that there is sufficient participation of
marginalised or underrepresented persons (including HDSAs, women and people with disabilities) as a condition of its mining rights.
See “—Gold Fields’ mineral rights are subject to legislation, which could impose significant costs and burdens, certain ownership
requirements and possible penalties or forfeiture for non-compliance, the interpretation of which is the subject of dispute”. If Gold
Fields is unable to appoint, hire and retain qualified Board members, senior leadership and technically skilled personnel or is unable to
attain sufficient representation of marginalised or underrepresented persons (including HDSAs, women and people with disabilities) at
the board level and in management positions, or if there are not sufficient succession plans in place, this could have a material adverse
effect on its business (including resulting in the imposition of fines and having a negative effect on production levels), operating results
and financial position.
Gold Fields may not be able to meet its environmental, social and corporate governance targets or disclosure
requirements.
Gold Fields has announced a range of environment, social and governance (ESG)-related targets for 2030 and beyond, including: (i)
safety, health, wellbeing and environment targets of zero fatalities, serious injuries or serious environmental incidents; (ii) increased
gender diversity, including 30% female representation; (iii) tailings management; (iv) water stewardship to achieve a 80% reuse and
recycling of water and 45% reduction in freshwater use from a 2018 baseline; (v) decarbonisation targets to achieve a 50% absolute and
30% net emissions (Scope 1 and 2) reduction against a 2016 baseline, a 10% Scope 3 emissions reduction from a 2022 baseline and net
zero emissions by 2050; and (vi) stakeholder value creation, including 30% of stakeholder value creation and six legacy programmes
benefiting host communities under implementation by 2030. Gold Fields cannot guarantee that it will meet all these targets. The climate
crisis and socio-political challenges cannot be addressed by Gold Fields, or any organisation, on its own. Gold Fields’ progress is
dependent not only on its own actions but on the governments of its countries of operation, providing clear, early regulatory policy to
help drive the change needed to meet its targets as well as the actions of those in Gold Fields’ value chain and wider society. Further,
several jurisdictions have or are contemplating the introduction of mandatory climate-related financial disclosure. For example, the
Australian Government is consulting on a mandatory climate-related financial disclosure regime which would impose reporting
obligations on the first cohort of entities from 1 July 2024. As currently proposed, Gold Fields’ mine entities would be included in the first
cohort with reporting obligations applying from the 2024-2025 financial year onwards. Among other things, required disclosures are
expected to include these entities’ transition plans, including decarbonisation targets, and material Scope 3 emissions. Civil penalties
are also expected to apply for non-compliance. Such rules would place an additional compliance and audit burden on Gold Fields.
Failure to meet its targets could have a material adverse effect on Gold Fields’ business, operating results and financial condition as
well as posing reputational and litigation risks.
Gold Fields’ operations are subject to extensive environmental, health and safety regulations, which could impose
additional costs and compliance requirements and Gold Fields may face claims and liability for breaches, or alleged
breaches, of such regulations and other applicable laws.
Gold Fields’ operations are subject to extensive environmental, health and safety laws, regulations, permitting requirements and
standards. These regulations oversee, among other things, the protection of the environment, pollution, water management, waste
disposal, occupational health, safety and wellbeing, including mine safety, toxic substances, cultural heritage, the management and
sustainable closure of operations, and the protection of endangered and other special status species.
In addition to compliance with local laws and regulations, Gold Fields’ operations are also increasingly subject to stakeholder
expectations concerning the application of stringent internationally recognised environmental, health, safety, wellbeing and social
standards and benchmarks. Such standards include the ICMM Mining Principles, Position Statements and Performance Expectations,
the WGC Responsible Gold Mining Principles, IFC Performance Standards, World Bank guidelines, as well as other national and
financing lender institute guidelines. The application of such standards could impose significant compliance costs on Gold Fields.
Certain financial institutions from whom the Company borrows money may also require compliance with any of these standards, the
subsequent deviation from which could prevent or adversely affect Gold Fields’ financial condition, existing financing arrangements and
ability to secure future financing. For example, in 2023 Gold Fields entered into a U.S.$1.2 billion revolving credit facility and a A$500
syndicated credit facility, both of which offer the benefit of a lower margin depending on the fulfilment of certain sustainability-linked
key performance indicators.
The environmental and health and safety laws and regulations applicable to Gold Fields impose significant compliance costs and
subject the Company to enforcement actions, which may result in suspension of all or part of an operation and/or significant financial
penalties and remedial actions, and potential litigation.
Compliance costs
Gold Fields has incurred and may in the future incur significant costs to comply with environmental, social, health, safety and wellbeing
requirements imposed under existing or new legislation, regulations or permit requirements, or to comply with changes in existing laws
and regulations or the way they are applied. For example, Gold Fields is required to secure estimated mine closure liabilities. In 2023,
Gold Fields’ total gross mine closure liability was approximately U.S.$598 million. The funding methods used to make provision for the
required portion of these mine closure cost liabilities, in accordance with in-country legislation, are as follows:
•Australia: while there is an annual levy payable to the state of Western Australia of 1.0% of the total mine closure liability, this goes into
a State-administered fund known as the Mine Rehabilitation Fund, which is used to rehabilitate legacy sites or sites that have been
prematurely closed or abandoned. Consequently, Gold Fields’ Australian operations self-fund all mine closure liabilities;
•South Africa: contributions to environmental trust funds and guarantees;
•Ghana: reclamation bonds underwritten by banks, and restricted cash;
•Chile: bank guarantees; and
•Peru: bank guarantees and restricted cash.
Enforcement Actions
Regulators are increasingly focusing on the enforcement of applicable environmental, social, health and safety laws and regulations and
permitting requirements, including in the jurisdictions where Gold Fields operates. Enforcement actions may cause Gold Fields’
operations to cease or to be curtailed, and may include corrective measures requiring capital expenditures, installation of additional
equipment or remedial actions. Non-renewal or suspension of permits, the inability to secure new permits, or the imposition of
additional conditions could eliminate or severely restrict Gold Fields’ ability to conduct its operations.
Regulators can and do issue instructions following safety incidents to either partially or completely halt operations at affected mines.
It is Gold Fields’ policy to halt production at its operations when serious incidents occur in order to rectify hazardous situations and, if
necessary, retrain workers. During 2023, Gold Fields was issued two prohibition notices in relation to operational activities (one at
Gruyere and another at Agnew), both of which were subsequently rectified and lifted. In 2023, the South African Department of Mineral
Resources and Energy (DMRE) conducted site visits, audits and inspections, none of which resulted in issuing section 54 notices (where
the mine may have to stop operations). However, three section 55 notices were issued, which have been subsequently closed out.
A section 93 notice was also issued in contravention of the MPRDA that related to non-compliance with the approved Social and
Labour Plan of 2018 to 2022, of which Gold Fields is awaiting the outcome. Additionally, in January 2024 South Deep recorded one
fatality. In 2023, Tarkwa recorded two occupational fatalities. After the first incident in March 2023, the regulator imposed U.S.$10,000
fines on each of AECI, AngloGold Iduapriem and Gold Fields Tarkwa for breach of the mining regulations. The regulator then imposed a
penalty of U.S.$20,000 for the second incident in August 2023. In addition, there can be no assurance that trade unions will not take
industrial action in response to such incidents which could lead to production losses. Any additional stoppages in production, or
increased costs associated with such incidents, or other safety related matters, could have a material adverse effect on Gold Fields’
business, operating results and financial condition. Such incidents may also negatively affect Gold Fields’ reputation with, among others,
employees, trade unions and regulators.
In Western Australia, the Work Health and Safety Act 2020 (WA) (the WHS Act) became operational in 2022, replacing the existing
occupational safety legislation and with new legislation and regulations which imposed more extensive workplace health and safety
obligations on Gold Fields’ operations in Western Australia. These obligations included imposing personal responsibility obligations
upon officers of companies such as Gold Fields in relation to compliance with health and safety obligations, as well as extensive
obligations in relation to the representation and consultation of workers and contractors. The legislation also brought the identification
and management of psychosocial hazards in line with the treatment of physical risks. Breaches of any such obligations by Gold Fields
or its officers may result in criminal liability. The WHS Act also introduced the new offence of industrial manslaughter for certain
workplace fatalities, which may carry significant penalties and fines applicable to individuals and companies.
Litigation
Gold Fields has been, and may in the future also be, subject to litigation and other costs as well as actions by authorities relating to
environmental, social, climate change, and health, safety and wellbeing matters, including mine closures, the suspension of operations,
legal representation during incident inquiries and prosecution for mining incidents as well as significant penalties and fines for non-
compliance. South African legislation grants legal standing to a wide range of interest groups to institute legal proceedings to enforce
their environmental rights, which are enforceable against private entities. In the future, Gold Fields may also be subject to litigation in
South Africa brought by members of the community affected by environmental-related impacts, as well as non-governmental
organisations (NGOs) and public bodies. In this regard, recent case law in South Africa has provided a precedent for private prosecution
by environmental NGOs for environmental infringements and non-compliance with key environmental legislation. South African
legislation also provides for potential director, shareholder and lender liability for environmental damage in certain circumstances.
Similarly, legislation in Peru allows for the disqualification and joint liability of directors and majority shareholders for certain
environmental damages. Any closure of a mine in violation of an approved mine closure plan is an aggravating factor to the
environment contamination crime regulated under article 305 of the Peruvian Criminal Code. Further, contravention of environmental
and health and safety laws and regulations may also constitute a criminal offence and result in a fine or imprisonment, or both in
addition to administrative penalties.
The principal health risks associated with Gold Fields’ mining operation in South Africa arise from occupational exposure and potential
community environmental exposure to silica dust, noise and certain hazardous substances, including toxic gases and radioactive
particles. The most significant occupational diseases affecting Gold Fields’ workforce include lung diseases, such as silicosis,
tuberculosis, a combination of the two and chronic obstructive airways disease, as well as noise-induced hearing loss. Employees have
sought and may continue to seek compensation for certain illnesses, such as silicosis, from their employer under workers’
compensation legislation and, at the same time, in civil actions under common law (either as individuals or as a class) as is the case with
the silicosis individual and class action lawsuits. Such actions may also arise in connection with the alleged incidence of such diseases
in communities proximate to Gold Fields’ mines.
In 2018, a group of six South African mining companies, including Gold Fields, concluded a settlement agreement with the attorneys
representing claimants in a silicosis and tuberculosis class action. See “—Environmental and Regulatory Matters—South Africa—Health
and Safety—Silicosis and Tuberculosis Settlement”. Gold Fields has provided for the estimated cost of the above settlement based on
actuarial assessments and the provisions of the settlement agreement. As at 31 December 2023, the provision for Gold Fields’ share of
the settlement of the class action claims and related costs amounts to U.S.$5.1 million (R93.8 million). The nominal value of this provision
is U.S.$7.2 million (R131.6 million). However, the ultimate outcome of this matter remains uncertain, with the number of eligible workers
(or their dependents) successfully submitting claims and receiving compensation being uncertain. The provision is consequently subject
to adjustment in the future. See “Annual Financial Report—Notes to the Consolidated Financial Statements—Note 38. Contingent
liabilities”. The payment of compensation for the claims could have a material adverse effect on Gold Fields’ business, reputation,
results of operations and financial condition. In addition, Gold Fields may incur significant additional costs arising out of these issues,
including costs relating to the payment of fees, increased levies or other contributions in respect of statutory compensation funds or
other funds established and expenditures arising out of its efforts to remediate these matters or to resolve any outstanding claims or
other potential action.
On 26 November 2021, Gold Fields was notified of Resolution No 1 Rol D-246-2021, which ordered the temporary suspension of the
authorised relocation plan of two Chinchilla species. In December 2021, Gold Fields applied to the Superintendence of Environment
(SMA), seeking approval of the measures proposed to address the ongoing restrictions on the Chinchilla relocation activities. On
28 June 2023, Gold Fields was notified by the SMA of the approval of the updated environmental compliance programme, and the
suspension of the sanctioning process, subject to the technical criteria and the other measures proposed by Gold Fields. Gold Fields is
currently working on the implementation of the measures to successfully relocate the Chinchillas. In case of any failure related with the
relocation process Gold Fields may be exposed to serious sanctions.
As environmental, social, health and safety laws and regulations expand in scope and become more complex and stringent, Gold Fields
may face increased regulatory and stakeholder scrutiny, which may lead to increased capital expenditures and subject Gold Fields to
potential enforcement actions and litigation proceedings. Any significant cost increases, potential enforcement actions or litigation
relating to environmental, social, health and safety laws and regulations could have a material adverse effect on Gold Fields’ business,
results of operations and financial condition.
Mining companies are increasingly expected to provide benefits to affected communities. Failure to comply with
these requirements can result in legal suits, additional operational costs, reputational damage, investor divestment
and impact Gold Fields’ “social licence to operate”, which could adversely impact Gold Fields’ business, operating
results and financial condition.
Gold Fields, like many mining companies, faces increasing pressure over the “social licence to operate”, meaning the acceptance by
local stakeholders of a company and its operations and activities. While formal permission to operate is ultimately controlled by host
governments, many mining activities require social permission from host communities and influential stakeholders to carry out
operations effectively, sustainably and profitably.
There is increasing pressure to demonstrate that, while a satisfactory return on investment for shareholders is sought, the
environmental, human rights (including resettlement, diversity, equity and inclusion, modern slavery and workplace respect) and other
key sustainability issues must be proactively and responsibly managed (including through supply chains), and that all stakeholders,
such as employees and contractors, host communities (including Indigenous Peoples) and the governments of the countries in which
Gold Fields operates, also benefit from Gold Fields’ commercial activities. In some countries, such as Australia, there are also
obligations to report on modern slavery risks that may exist in a company’s operations and supply chains and to outline the actions
being taken to address these. There is also increasing action by members of the general financial and investment communities, such as
asset managers, sovereign wealth funds, public pension funds, universities, civil society and other groups, to promote improvements in
ESG performance by Gold Fields and others.
The potential consequences of these pressures and the adverse publicity in cases where companies are believed not to be creating
sufficient social and economic benefit or are perceived to not be responsibly managing other sustainability issues may result in
additional operating costs, higher capital expenditures, reputational damage, active stakeholder opposition (possibly resulting in delays,
disruptions and stoppages), allegations of human rights abuses, legal suits, regulatory intervention and investor withdrawal.
In order to maintain its social licence to operate, and prevent reputational damage, Gold Fields may need to design or redesign parts of
its mining operations to minimise their impact on such stakeholders and the environment, either by changing mining plans to avoid such
impact, by modifying operations, by changing planned capital expenditures or by relocating the affected people to an agreed location.
Anti-mining sentiments in some of the communities in which Gold Fields operates have been exacerbated by factors such as high
unemployment and violent crime rates, land acquisition and involuntary resettlement, artisanal and small-scale mining, rights of
indigenous peoples and respect for cultural heritage, government service delivery failure, environmental incidents and blasting
incidents, declining community benefits resulting from operational changes as well as non-mining related socio-political challenges. If
any of Gold Fields’ operations are halted or projects are delayed as a result of Gold Fields failing to attain and maintain community
support, or due to any other community-related disruptions such operations or projects could decrease in value or Gold Fields may be
unable to maintain its operations or bring such projects into production.
Gold Fields may be required to take costly and time-consuming remedial measures, including providing compensation for land and
contributing to the restoration of livelihoods of those impacted. Gold Fields is obliged to comply with the terms and conditions of all the
mining rights it holds in South Africa. To this end, the Social and Labour Plan (SLP) provisions of Gold Fields’ mining rights must consider
local economic development, among other obligations. See “—Gold Fields’ mineral rights are subject to legislation, which could impose
significant costs and burdens,certain ownership requirements and possible penalties or forfeiture for non-compliance, the
interpretation of which is the subject of dispute—South Africa”. Gold Fields also undertakes social and economic development
spending in Australia, Ghana, Chile and Peru, either voluntarily and/or as a condition of its mining rights. See “Integrated Annual Report
—Pillar 2: Building on Our Leading Commitment to ESG—Host Communities—Measuring Host Community Value Creation”. In addition,
as Gold Fields has a long history of mining operations in certain regions or has purchased operations which have a long history, issues
may arise regarding historical, as well as potential future environmental or health impacts in those areas.
The cost of measures and other issues relating to the sustainable development of mining operations has placed significant demands on
Gold Fields’ resources and could increase capital and operating costs and have a material adverse impact on Gold Fields’ reputation,
business, operating results and financial condition.
Gold Fields’ tenements in Australia are subject to native title claims and determinations and include Aboriginal
cultural heritage sites, which could impose significant costs and burdens, or limit or prevent access to certain areas
which could materially adversely affect Gold Fields’ operations.
Native title and Aboriginal cultural heritage legislation aims to protect the claims, determined rights and cultural heritage sites of
Aboriginal and Torres Strait Islander people in relation to land and waters throughout Australia in certain circumstances. To the extent
that agreements are not already in place, native title claims (including any subsequent determinations of such claims) could require
costly negotiations with the registered claimants or native title holders and could have implications for Gold Fields’ access to or use of
its tenements and, as a result, have a material adverse effect on Gold Fields’ business, operating results and financial condition.
Similarly, there are risks that Gold Fields’ exploration and mining activities could be delayed or prevented due to the presence or
potential presence of Aboriginal cultural heritage sites.
Furthermore, if Aboriginal cultural heritage sites are damaged or materially altered due to current or future operations, Gold Fields could
be subject to criminal and/or civil penalties under relevant legislation and may suffer reputational damage. In 2020, despite having
certain authorisations under the relevant legislation, a mining company operating in Western Australia was subject to a federal inquiry
after an Aboriginal cultural heritage site was destroyed on their mining tenure, which also resulted in a significant adverse reaction from
the community and the company’s shareholders and led to extensive reputational damage. Subsequently, an inquiry recommended the
replacement or supplementing of Western Australia’s (then) Aboriginal Heritage Act (AHA), by overarching Commonwealth legislation,
and a moratorium on certain approvals issued under that act. Neither of the latter recommendations have yet to be implemented.
In 2021, the Western Australian Government passed the Aboriginal Cultural Heritage Act 2021 (ACH Act) that replaced the AHA in its
entirety with effect from 1 July 2023. The ACH Act sought to significantly increase the consultation, engagement and authorisation
obligations of mining companies, and impose higher financial penalties for offences involving interference with relevant sites or objects,
all of which was expected to have a material adverse effect on Gold Fields’ business, operating results and/or financial condition.
However, on 15 November 2023, the Western Australian Government repealed the ACH Act and reinstated the AHA with minor
amendments. See “—Environmental and Regulatory Matters—Australia—Cultural Heritage”. The ongoing regulation of this area remains
uncertain, and future changes may have a material adverse effect on Gold Fields’ business, operating results and/or financial condition.
Compensation may be payable to native title holders in respect of Gold Fields’ Australian operations.
The Native Title Act 1993 (Cth) (Native Title Act) allows native title holders (i.e., Aboriginal and Torres Strait Islander people who have
secured a determination of native title) to seek compensation for any extinguishment or impairment of their native title rights and
interests which occurred following the commencement of the Racial Discrimination Act (1975) (Cth). The Commonwealth of Australia, its
states and territories are generally responsible for any native title compensation for acts (such as the granting of land and mining
tenure) attributable to them. However, this liability may be passed on to third parties (including the holders and former holders of mining
tenure) either contractually or by legislation.
Several compensation claims in various states and territories across Australia have resulted following the High Court’s decision in 2019
to award compensation of approximately A$2.5 million to native title holders in Timber Creek in the Northern Territory in connection
with the Timber Creek Decision. However, the Timber Creek Decision did not address how compensation was to be assessed where
the impact on native title is caused by interests (such as mining leases) which impair native title rights without extinguishing them.
With respect to the lands related to Gold Fields’ mines, native title has been recognised in part or in whole over the Gruyere, Granny
Smith, St. Ives and Agnew mines. Consequently, the native title holders for each of these areas are entitled to commence compensation
claims (to the extent that such rights have not been waived). Accordingly, in June 2020, the Tjiwarl People, who have native title claims
over part of the lands upon which the Agnew mine is situated, brought three separate compensation claims against the state of
Western Australia for damage and loss of access to land known as the Tjiwarl Claims. In May 2023, the Western Australian government
entered into an Indigenous Land Use Agreement with the Tjiwarl Aboriginal Corporation in full and final settlement of the State of
Western Australia’s liability for compensation to the Tjiwarl People. The agreement expressly excludes compensation liability that
mining tenement holders, such as Gold Fields, may have for mining tenements granted under the Mining Act 1978 (WA).
The remaining determined native title holders have not yet commenced compensation claims, but there is a reasonable prospect that
this will occur in the future. Similarly, if the native title claims that are currently progressing through the determination process in the
Federal Court in relation to part of the St. Ives mine are determined, or if further claims are made over areas that are yet undetermined
(for example over part of the Agnew operations), and those claimants achieve a determination of their native title rights, those native
title holders would obtain a right to commence a compensation claim.
To the extent that it is ultimately determined that the compensation liability of the State of Western Australia may be passed on to
Gold Fields as a holder (or former holder) of mining tenure in a determined native title claim area, and Gold Fields does not have the
benefit or a release from liability in any contractual agreement, Gold Fields may be liable for any native title compensation determined
in relation to those tenements. However, until a sufficient body of compensation claims have worked their way through the Australian
courts, the allocation, quantum and timing of this liability will remain uncertain. Gold Fields is monitoring this issue and the various
compensation claims being brought by native title holders and will assess any potential risks associated as the claims are resolved in
the various courts.
Due to the nature of mining and the extensive environmental footprint of the operations, environmental and
industrial incidents and pollution may result in operational disruptions such as stoppages which could result in
increased production costs as well as financial and regulatory liabilities.
Gold mining by its nature involves significant risks and hazards, including environmental hazards and industrial and mining incidents.
These may include, for example, seismic events, explosions, fires, cave-ins and blockages, flooding, discharges of gases and toxic
substances, contamination of water, air or soil resources, radioactivity and other incidents or conditions resulting from mining activities
including, among other things, blasting and the transport, storage and handling of hazardous materials. For example, in Australia in
2022, a trailer mounted tank with 33.85 tonnes of ammonium nitrate emulsion (ANE) in transit to Gruyere mine exploded after burning
for approximately two hours. While Gold Fields has not experienced any level 3 (or above) environmental incidents since 2018, there
were 8 and 10 level 2 environmental incidents during 2023 and 2022, respectively. In Peru, the Assessment and Environmental Control
Agency (OEFA) imposed a fine against Gold Fields of approximately U.S.$2.8 million in 2021. Gold Fields elected to pay the fine to
avoid any coercive execution measures while challenging the fine in court. On 29 May 2023, the 17th Court of Lima declared the claim
unfounded. On 6 June 2023, Gold Fields filed an appeal against the judgement before the Superior Court of Justice. A court hearing
has been scheduled for 4 April 2024. There is no guarantee that Gold Fields’ challenge will be successful.
The occurrence of any of these hazards or risks could delay or halt production, increase production costs and result in financial and
regulatory liability for Gold Fields (including because of the occurrence of hazards that took place at operations which were previously
owned by Gold Fields), which could have a material adverse effect on Gold Fields’ business, operating results and financial condition.
In addition to the occurrence of hazards relating to mining activities, a major transportation incident from bus or aircraft travel involving
its management or employees could have a material adverse effect on Gold Fields’ business, operating results and financial condition.
Increasing regulation of environmental and sustainability matters such as greenhouse gas emissions and climate
change may materially adversely affect Gold Fields’ operations.
Energy is a significant input and cost to Gold Fields’ mining and processing operations, with its principal energy sources being
electricity, purchased petroleum products, and increasingly, renewable energy sources. Several governments, or governmental bodies,
have introduced or are contemplating regulatory changes in response to the potential impact of climate change. Many of these
contemplate restricting emissions of greenhouse gases or otherwise imposing a price on those emissions in jurisdictions in which
Gold Fields operates.
The Australian government has committed to reaching net zero emissions by 2050 and, in 2022, announced additional emissions
reduction targets of 43% on 2005 levels by 2030. In 2022, Australia passed the Climate Change Act 2022 (Cth) which enacted the
2030 and 2050 targets in legislation. The Australian government has also progressed reforms in several sectors to align with its climate
targets, including amendments to the Safeguard Mechanism, the primary tool to limit emissions from large emitting facilities. Both the
Gruyere and Granny Smith mines are regulated under the Safeguard Mechanism and as such, are subject to the facility baseline
changes in the amendments that were passed in March 2023. Where a facility’s emissions exceed its baseline, the facility will need to
surrender Australian Carbon Credit Units (ACCUs) for a new instrument called a Safeguard Mechanism Credit (SMC). SMCs will be
created where a facility keeps its emissions below its baseline. If the emissions from the relevant facilities are above their baseline,
Gold Fields will need to procure ACCUs or SMCs on market and will be subject to additional costs and market price fluctuations for
those credits as a result.
The South African Government introduced a carbon tax under the South African Carbon Tax Act No. 15 of 2019 (South African Carbon
Tax Act), which is designed to levy a tax on the person who conducts an activity in South Africa that results in greenhouse gas
emissions equal to or above a certain threshold. The carbon tax framework requires the calculation of liability to be based on the sum
of “scope 1” greenhouse gas emissions, which result from fuel combustion, industrial processes and fugitive emissions. With respect to
South Deep, the applicable greenhouse emitting activities include direct emissions from diesel fired generators and vehicles. The
carbon tax for emissions resulting from liquid fuels such as diesel and petrol is included in the fuel tax regime. Consequently, these
emissions are excluded from the emissions on which carbon tax is calculated. Taxpayers must determine emissions in accordance with
a reporting methodology approved by the Department of Forestry, Fisheries and the Environment (DFFE), or the prescribed formulas in
the South African Carbon Tax Act.
The first phase of the South African Carbon Tax Act applies to “scope 1” emissions from 1 June 2019 to 31 December 2025. Under the
first phase, the carbon tax rate for tax liable entities will be R159, R190 and R235 per tonne of the carbon dioxide equivalent (CO2e) of
their net greenhouse gas emissions for fiscal 2023, fiscal 2024 and fiscal 2025, respectively. However, pursuant to certain allowances
under the South African Carbon Tax Act, the effective carbon tax rate may vary. For example, the effective carbon tax rate varied from
R159 to R120 per tonne of CO2e emitted for fiscal 2023. Such allowances include, a basic tax-free allowance, an increased tax-free
threshold for trade exposed sectors, the recognition of emission reduction efforts, and the use of carbon offsets against a carbon tax
liability. The South African Carbon Tax Act allows mining companies such as Gold Fields to reduce their carbon tax liability by using
offset credits up to a maximum of 10% of their greenhouse gas emissions. The South African Government indicated that a review of the
impact of the carbon tax will be conducted before the second phase of the South African Carbon Tax Act is implemented.
In fiscal 2023, South Deep’s eligible “scope 1” emissions were from liquid fuels and the mine had no carbon tax liability beyond that
which was included in fuel prices. The carbon tax has not had an impact on the price of electricity. However, should Eskom be required
to pass on the cost of the tax from its emissions to customers, electricity tariffs may rise significantly. Further, other commodities that
South Deep consumes may see price increases as the tax is passed through the market.
The Government of Ghana has at various times put in place policies that aim to respond to climate change. Prominent among Ghana’s
adaptation policy initiatives are the National Climate Change Adaptation Strategy (NCCAS), the National Climate Change Policy (NCCP),
the Nationally Determined Contributions (NDC) and the National Climate Change Master Plan Action Programme for Implementation.
The NCCP is Ghana’s integrated response to climate change. The vision is to ensure a climate resilient and climate compatible
economy while achieving sustainable development through equitable low carbon economic growth for Ghana. Additionally, on
1 February 2024, the Ghanaian Parliament passed the Emissions Levy Act, 2023, Act 1112, which imposes a levy on carbon dioxide
equivalent emissions on the mining sector, among others, and combustion emissions from vehicles.
In June 2022, Chile’s Framework Law on Climate Change (LMCC) came into force. This law creates a legal framework to address
climate change in terms of migration and adaptation in the long term and therefore comply with Chile’s international commitments
under the Paris Agreement. To this end, it establishes a national target that aims to achieve carbon neutrality by 2050 at the latest.
In April 2018, Peru released a climate change framework law seeking collaboration between the Peruvian government and the private
sector, which regulation was approved in 2019 (Climate Change Framework). The Climate Change Framework is intended to realise
Peru’s nationally determined contribution by reducing emissions by up to 30% by 2030. The Climate Change Framework also seeks to
meet a 20% carbon reduction goal through the energy, industry, and waste sectors. In July 2020, a climate change committee was
established which is expected to work on proposing actions to implement Peru’s goals. Additionally, in October 2020, Peru launched
the “National Registry of Mitigation Measures”, a virtual platform to register and monitor greenhouse gas emission reductions and
monitor Peru’s compliance under the Paris Agreement, a legally binding international treaty on climate change. These regulations are
expected to be approved in early 2024. Assessments of the potential impact of this and other future climate change regulations are
uncertain, given the wide scope of potential regulatory change in countries in which Gold Fields operates.
In addition, several other regulatory initiatives are underway in countries in which Gold Fields operates that seek to reduce or limit
industrial greenhouse gas emissions. These regulatory initiatives are likely to impact Gold Fields’ operations directly or by affecting the
cost of doing business, for example by increasing the costs of its suppliers. Inconsistency of regulations may affect both Gold Fields’
decision to pursue opportunities in certain countries and its costs of operations. Furthermore, additional, new and/or different
regulations in this area, such as the imposition of stricter limits than those currently contemplated, could be enacted, all of which could
have a material adverse effect on Gold Fields’ business, financial condition, results of operations and prospects.
Climate change may present physical risks to Gold Fields’ operations, including from extreme weather events and
increased risk of wildfires.
Gold Fields’ operations could be exposed to several physical risks posed by climate change, such as changes in rainfall, rising sea
levels, reduced water availability, higher temperatures and more frequent extreme weather events. Events or conditions such as fires,
flooding or inadequate water supplies could disrupt Gold Fields’ mining and transport operations, mineral processing and rehabilitation
efforts, create resource or energy shortages, damage property or equipment and increase health and safety risks. Such events or
conditions could have other adverse effects on its workforce and on the communities around its mines, such as an increased risk of
food insecurity, water scarcity and prevalence of disease. Each of these potential physical impacts of climate change could disrupt
Gold Fields’ operations and have a materially adverse effect on its business, operating results and financial condition.
Gold Fields’ operations are subject to water use licences, which could impose significant costs and burdens.
Gold Fields’ operations are subject to water use licences and regulations that govern each operation’s water usage and that require,
among other things, mining operations to achieve and maintain certain water quality limits regarding all water discharges. Gold Fields
is required to comply with these regulations under its permits and licences and any failure to do so could result in the curtailment or
halting of production at the affected locations.
In Australia, Gold Fields is required to obtain a water licence from the Western Australian Department of Water and Environmental
Regulation (DWER) to enable both the extraction and discharge of water for its mining activities. A water licence is granted subject to
conditions and limitations with which the licence holder must comply. Contravening the conditions of a water licence is an offence and
can lead to the licence being cancelled or suspended. A water licence can also be cancelled or suspended in various other
circumstances, including where the Minister for Water or the Minister for Environment of Western Australia is of the opinion that the
cancellation or suspension is necessary or desirable to protect the water resource or associated environment from unacceptable
damage. Gold Fields has obtained the necessary water extraction and discharge licences (or has alternative supply arrangements in
place) to support its current operations in Australia, but there remains a risk that these licences will become subject to more onerous
conditions in the future or may not continue to meet operational requirements. In addition, there is no guarantee that any current
alternative supply or discharge arrangements will remain in place for the timeframes required, or otherwise continue to meet
operational requirements.
In South Africa, Gold Fields continues to use measures to remove underground water to permit the routine safe functioning of South
Deep. South Deep has implemented a water and environmental management strategy in an effort to satisfy the conditions of its water
use licence and other relevant water and environmental regulatory requirements. However, there can be no assurance that Gold Fields
will be able to meet all its water and environmental regulatory requirements, primarily due to the inherent uncertainties related to
certain requirements of the legislation, which are subject to ongoing discussions between government and the mining industry through
the Minerals Council of South Africa (MCSA). Any constraint on the water supply to South Deep could result in delays on the ramp-up of
that operation.
While Gold Fields continues to conduct diligence to comply with the water use and water quality discharge standards, there is no
guarantee that it will always be compliant. For example, in Ghana, Gold Fields is required to acquire permits for groundwater and
surface water abstraction as well as permits for pit dewatering from the Water Resources Commission of Ghana. These permits also
allow for discharge of water from Gold Fields sites and come with stringent conditions and discharge standards that must be met. While
these permits are due to be renewed every three years, noncompliance can result in heavy fines, withdrawal of the permit and refusal
of the Water Resources Commission to renew the permit on expiration. The Water Resources Commission is looking to issue permits
for all water holding facilities and this could increase costs and the likelihood of noncompliance.
In Chile, inland water is a national asset for public use and private party usage is regulated through a concession for a maximum of
50 years and requires an environmental permit. The environmental permit for the Salares Norte project authorises the extraction and
use of a flow of 30 litres per second during the operation phase of the project. Any abstraction in excess of the authorised flow may
constitute an “illegal water abstraction” and may result in fines, suspensions and/or closures of wells.
In Peru, a water quality discharge standard was introduced, which contained several stringent requirements and mines were given
three years to submit their plans for adaption. La Cima’s plan was approved by the authorities in September 2021, which must be
implemented within three years of approval. See “—Environmental and Regulatory Matters—Peru—Water Quality Standards”. Gold
Fields is currently preparing a detailed technical implementation plan based on the proposed plan approved by the regulators. As part
of its plan, Gold Fields concluded the detailed engineering for a new water treatment plant for the tailings storage facility (TSF) in order
to discharge water to the Tingo river. The construction and ramp-up of the new water treatment plant is planned for 2024. In addition,
Gold Fields is preparing the engineering for the implementation of a low permeability layer in the area of the equipment scale of Cerro
Corona, which is expected to be implemented by 2024. If Gold Fields faces any problems or delays in the implementation of its plan, it
may be subject to fines, sanctions and penalties.
Any failure on Gold Fields’ part to achieve or maintain compliance with the requirements of its water use licences with respect to any
of its operations could result in Gold Fields being subject to substantial claims, penalties, fees and expenses; significant delays in
operations; or the loss of the relevant water use licence, which could curtail or halt production at the affected operation and have a
material adverse effect on Gold Fields’ business, operating results and financial condition.
Gold Fields has experienced and may experience further acid mine drainage related pollution, which may
compromise its ability to comply with legislative requirements or result in additional operating or closure cost
liabilities.
Acid mine drainage (AMD) and acid rock drainage (ARD, together with AMD, Acid Drainage or AD) is formed when certain sulphide
minerals in rocks are exposed to oxidising conditions (such as the presence of oxygen, combined with water). AD can occur under
natural conditions or because of the sulphide minerals that are encountered and exposed to oxidation during mining or during storage
in waste rock dumps, ore stockpiles or TSFs. The acidic water that forms usually contains iron and other metals if they are contained in
the host rock.
Gold Fields has experienced incidences of AD, and the risk of potential short-term and long-term AD issues, specifically at the St. Ives,
South Deep and Cerro Corona mines, with immaterial levels of surface AD generation also occurring at other operations. As a result,
Gold Fields has investigated technical solutions to manage AD impacts, while updating the relevant regulatory authorities on its
progress. Despite undertaking such measures, it is difficult to predict the total impact that the AD-related issues may have on the Group
and there can be no assurance that Gold Fields will be successful in preventing or managing long-term potential AD issues at its
operations.
Gold Fields’ mine closure cost estimate (namely environmental rehabilitation cost provisions) for fiscal 2023 contains those aspects
of AD management (namely tailings facilities, waste rock dumps, ore stockpiles and other surface infrastructure), which management
has been able to reliably estimate. However, there could be no guarantee that Gold Fields’ current cost estimate, including the cost of
AD treatment and other types of post-closure water treatment, reflects all relevant factors and, as such, the actual closure costs may
be higher.
No adjustment for any effects on the Company that may result from potentially material (mainly post-closure) AD impacts at St. Ives,
South Deep and Cerro Corona, has been made in the consolidated financial statements, other than through the Group’s normal
environmental rehabilitation cost provisions.
The existence of material long-term AD issues at any of Gold Fields’ operations could cause it to fail to comply with its water use licence
requirements and could expose Gold Fields to fines, additional operating costs and other liabilities. In certain areas where Gold Fields
operates, AD could also cause scarcity of water which can affect the continued process of mining and cause production curtailment and
mine closures, any of which could have a material adverse effect on Gold Fields’ business, production, operating results and financial
condition.
The failure of a tailings storage facility could result in legal suits, additional operational costs and production delays,
investor divestment and impact Gold Fields’ “social licence to operate”, which could adversely impact Gold Fields’
business, reputation, operating results and financial condition.
Mining companies face inherent risks in their operation of tailings storage facilities. Tailings storage facilities are structures designed
and managed to contain fine mining waste, known as tailings. Tailings are a by-product of mining, consisting of the processed rock or
fine grit left over from separating the commodities of value from the rock within which they occur. However, tailings storage facilities
expose Gold Fields to certain risks that could be detrimental to operations, the environment, public health or safety. Tailings storage
facilities designed as upstream raised facilities may present greater risk, particularly where the facility is in a high seasonal rainfall area
and an area of high seismic activity. When tailings storage facilities fail, the consequences can be catastrophic for communities, local
economies and the surrounding environment. In the event of a failure at one of Gold Fields’ tailings storage facilities, the loss of human
life and/or extensive property and permanent environmental damage can occur, leading to large unforeseen expenditures as a result of
recovering the region, assisting affected people, and through the imposition of penalties, fines and other monetary damages.
Tailings facilities are in a near-constant state of change, from initial construction, during operations and until closure. Gold Fields
maintains measures to manage its dams’ safety in accordance with international guidelines such as the Global Industry Standard on
Tailings Management (GISTM), adopting new deposition technologies, including implementing filtered dry-stacked tailings processes at
its Salares Norte project and undertaking routine operational reviews and audits by independent international consulting companies.
However, despite GISTM requiring a high standard, Gold Fields cannot guarantee the effectiveness of its designs, construction quality
or regular monitoring throughout its operations or that these measures will prevent the failure of one or more of its tailings storage
facilities or that such potential failure will be detected in advance. Gold Fields also cannot guarantee that its operating partners maintain
similar safety precautions or monitoring systems on their tailings storage facilities.
The failure of a tailings storage facility could lead to multiple legal proceedings and investigations, including securities class actions,
criminal proceedings and public civil actions (against the Company and/or individuals) for significant damages. Furthermore, eliminating
the “conventional” practice of storing wet tailings (e.g., alternatively stacking filtered tailings and compacting the tailings) could require
the research, development and deployment of new technologies, which could lead to additional large expenditures. As a result of
recent or future dam failures, other environmental, health and safety laws and regulations may be forthcoming globally, including in
jurisdictions where Gold Field operates, which may ban or curtail any storage of wet tailings or the construction or use of upstream
tailings storage facilities. In addition, changes in industry standards, laws and regulations may impose more stringent conditions in
connection with the licensing process of projects and operations and increase criminal and civil liability for companies, officers and
contractors.
For example, on 5 August 2020, the ICMM, the United Nations Environment Programme (UNEP) and the Principles for Responsible
Investment (PRI) established an international tailings standard, the GISTM. While Gold Fields reported in 2023 that all two of its priority
facilities partially conform to the GISTM, and it has committed to being fully compliant with the GISTM by 2025 for all facilities, there is
no guarantee that Gold Fields will achieve full compliance in this timeframe.
The occurrence of such risks could have a material adverse effect on Gold Fields’ business, operating results and financial condition.
Due to ageing infrastructure at Gold Fields’ operations, unplanned breakdowns and stoppages may result in
production delays, increased costs and industrial incidents.
Once shafts or processing plants approach and reach the end of their planned lifespan and begin operating under extended LOM
mineral reserve conditions, additional maintenance, condition monitoring and care is required. The infrastructure in all of Gold Fields’
operating regions fall into this category. Although Gold Fields has comprehensive strategies in place to address these issues, incidents
resulting in production delays, increased costs or industrial incidents may occur. Such incidents may have a material adverse effect on
Gold Fields’ business, operating results and financial condition.
The effects of the regional cessation of dewatering may have a material adverse effect on Gold Fields’ South Deep
operation.
On 31 August 2016, Sibanye Stillwater Limited (formerly Sibanye Gold Limited) announced that it would be closing its Ezulwini (Cooke 4)
shaft. As a part of this process, Sibanye-Stillwater filed an application for closure and the cessation of dewatering from the mine with the
DMRE. There have been various iterations of Sibanye-Stillwater’s application with and objections thereto. Most recently, on 3 December
2020, the DMRE refused the application for closure and the cessation of dewatering.
Concurrently, in 2019, Sibanye-Stillwater, through its subsidiary, Ezulwini Mining Company (Pty) Ltd, brought an application in a South
African court against seven respondents, including South Deep, in relation to the cessation of dewatering from Ezulwini (Cooke 4).
On 30 May 2023, after a series of court proceedings, the Supreme Court of Appeal (SCA) confirmed that Ezulwini must continue to
operate Ezulwini (Cooke 4) until the DMRE has issued a closure certificate or for such longer period as provided for under section 24R
of the National Environmental Management Act, No. 107 of 1998 (NEMA). Ezulwini brought an application for leave to appeal the
decision of the SCA to the Constitutional Court, which was later dismissed in November 2023. While a legal victory provides a
temporary resolution, it does not eliminate the ongoing risk to Gold Fields. Non-compliance with the court’s decision, whether
intentional or accidental, may lead to severe consequences and continuous engagement with Ezulwini remains imperative to establish
a feasible long-term operational solution.
Furthermore, in early 2020, Rand Uranium, a subsidiary of Sibanye-Stillwater, submitted a basic environmental assessment process to
the DMRE for the closure of the Cooke 3, 2 and 1 shafts, to which Gold Fields objected. In 2021, the DMRE granted the environmental
authorisation to Rand Uranium, which makes provision for the rewatering of the Cooke 3, 2 and 1 shafts. Gold Fields appealed the
DMRE’s decision on 26 January 2022. In October 2023, the Minister of the DFFE handed down a decision in favour of Gold Fields'
appeal and the environmental authorisation issued to Rand Uranium has been set aside, meaning Rand Uranium will not be able to
seize or stop the current activities being performed and may not rewater the mine works. Rand Uranium could bring an application to
try set the Minister's decision aside.
To the extent Sibanye-Stillwater, or any of its subsidiaries, is successful in any of the above proceedings, the closure of the Ezulwini
(Cooke 4) shafts, the cessation of pumping and/or the rewatering of Ezulwini (Cooke 4) could result in an increased risk of fluid induced
seismicity to South Deep posing a risk to the mine’s safety. This, in turn, may have a material adverse effect on Gold Fields’ business,
operating results and financial condition.
Legal, regulatory and compliance risk factors
Gold Fields is subject to various regulatory costs, such as taxes and royalties, the imposition of which may have a
material adverse effect on Gold Fields’ operations and profits.
In recent years, governments (often with support from communities, NGOs and/or trade unions) in several jurisdictions have sought and,
in some cases, have implemented greater cost imposts on the mining industry, including through the imposition of additional taxes
and royalties. Such resource nationalism, whether in the form of cost imposts, interference in project management, mandatory social
investment requirements, local content requirements or creeping expropriation, could impact the global mining industry and
Gold Fields’ business, operating results and financial condition.
Australia operates a state-based royalty regime, and a federal corporate tax regime. Each of Gold Fields’ Australian mines are in the
state of Western Australia, which imposes a 2.5% royalty on the value of gold produced. Despite previous proposals to raise the royalty
rate for gold, the budgets of the state of Western Australia for the period of 2019 to 2024 have not provided for an increase in the
royalty on gold, maintaining the existing rate of 2.5%. While the state government has signalled that it does not intend to further pursue
royalty changes, and had not included any provision for an increase to the royalty on gold in the budget forward estimates (which
covered the period through to 2027), the risk remains that the government of Western Australia will seek to impose royalty increases
in the future.
The state of Western Australia also imposes a payroll tax, which is calculated based on wages paid or payable by Gold Fields to its
employees. The Australian federal government levies corporate income tax at the rate of 30.0% on companies with aggregated
turnover which is more than A$50 million.
In South Africa, the Mineral and Petroleum Resources Royalty Act, No. 28 of 2008 (the Royalty Act) imposes a royalty on refined and
unrefined minerals payable to the South African Government.
The royalty in respect of refined minerals (which include gold and platinum) is calculated by dividing earnings before interest and taxes
(EBIT) by the product of 12.5 times gross sales in respect of refined mineral resources calculated as a percentage, plus an additional
0.5%. EBIT refers to taxable mining income (with certain exceptions such as no deduction for interest payable and foreign exchange
losses) before assessed losses but after capital expenditure. A maximum royalty of 5% of revenue has been introduced for refined
minerals. Gold Fields currently pays a royalty based on the refined minerals royalty calculation as applied to its gross revenue.
Under South African tax legislation, gold mining companies and non-gold mining companies are subject to corporate income tax at
different rates. The corporate income tax rate for non-gold mining companies was reduced from 28% to 27% for years of assessment
ending on or after 31 March 2023. The corporate tax rate for a gold mining company is determined according to a formula which is
affected by the profitability of the applicable mining operation. Accordingly, depending on the profitability of mining operations in
South Africa, the effective tax rate can be significantly different from year to year.
The MPRDA provides a statutory right of access for the mining right holder to the mining area for the purposes of conducting mining
operations and does not require the holder to own the land on which it conducts operations. Once a mining right is granted, a
landowner cannot refuse a lawful mining right holder the right to conduct its mining operations. In addition, the landowner is only
entitled to compensation for loss or damage from the mining right holder for the use of the land for mining operations conducted in
terms of the MPRDA. Recent case law in South Africa has strengthened the rights of communities on mining land, including by requiring
written consent from informal rights holders in certain circumstances.
In 2020, a draft expropriation bill (Expropriation Bill) was introduced by the Minister for Public Works of South Africa. The Expropriation
Bill generally provides for land expropriation exclusively for public purposes and in the public interest, as provided by Section 25 in the
South African Constitution, allowing for expropriation of land with no compensation under certain conditions. The Expropriation Bill was
tabled in the South African parliament on 28 September 2022 and approved by the National Assembly. The Expropriation Bill is now
being considered by the National Council of Provinces, and, if approved, the Expropriation Bill will be sent to the South African
president for assent and published in the South African Government Gazette and proclaimed as law. See “—Environmental and
Regulatory Matters—South Africa—Land Expropriation”.
Any expropriation legislation resulting in the expropriation of land, including the New Draft Expropriation Bill, on which Gold Fields
operates or relies on would disrupt operations, which could have a material adverse effect on Gold Fields’ business, operating results
and financial condition.
In Ghana, the ownership of land on which there are mineral deposits is separate from the ownership of the minerals as minerals are the
property of the Ghanaian Republic and are vested in the president in trust for the people of Ghana. On 1 January 2017, in line with the
development agreements concluded between Gold Fields and the government of Ghana (Development Agreements), Gold Fields’
royalty rate changed from a flat 5.0% of revenue to a sliding scale royalty based on the price of gold, starting at a rate of 3.0% on a gold
price below U.S.$1,300 per ounce up to a rate of 5.0% on a gold price of at least U.S.$2,300 per ounce, and the corporate tax rate was
set at 32.5%. There can be no guarantee, however, that the existing tax and royalty rates will not increase in the future, or that the
government of Ghana will not materially change the terms of the Development Agreements or rescind the agreements altogether.
In March 2023, the government of Ghana passed the Growth and Sustainability Levy Act 2023, (Act 1095), which imposes a levy of 1% of
gross production, irrespective of existing Developing Agreements or tax exemption agreements. Gold Fields and other affected mining
companies have formally objected to paying the levy and discussions with the government of Ghana are ongoing.
The Fees and Charges (Miscellaneous Provisions) Act, 2022 (Act 1080) imposes an annual ground rent on mining concessions of
approximately U.S.$1.27 per acre payable to the government of Ghana. The Chamber is engaging the government to review the rate.
Under the Ghanaian Minerals and Mining Act, 2006 (Act 703) (Minerals and Mining Act), the Ghanaian Minister of Lands and Natural
Resources (Minister of Lands and Natural Resources) has the right of pre-emption over all minerals obtained in Ghana and products
derived from the refining or treatment of these minerals. On 31 July 2018, the Minister of Lands and Natural Resources informed the
Chamber of the government of Ghana’s intention to exercise its right of pre-emption to acquire up to 30% of all gold mined in Ghana for
the benefit of Ghanaian refineries. The Chamber submitted a counter proposal for the government of Ghana’s consideration and a
response remains pending.
The Bank of Ghana announced a domestic gold purchase programme to buy refined gold from gold mining companies to shore up its
reserves and help stabilise the Ghanaian Cedi, which suffered a steep depreciation in its value in 2022. The Bank of Ghana entered
into an agreement with Gold Fields (through an industry initiative with the Chamber) whereby the Bank of Ghana buys a pre-determined
amount of gold directly from Gold Fields’ refining company. In 2023 and 2022, Gold Fields’ Damang and Tarkwa mines sold 136,000
ounces and 26,000 ounces of gold to the Bank of Ghana, respectively. See “—Environmental and Regulatory Matters—Ghana—
Mineral Rights”.
In Chile, in 2019, Gold Fields entered into a stability agreement with the Chilean government, pursuant to which a special investment
regime applies such that Salares Norte is not subject to any new tax, royalty, fee or similar specific encumbrance over mining activities,
but is subject to any changes the government may implement under a general tax regime. Unless there is further taxation reform, the
Salares Norte project is subject to the current 27.0% corporate tax rate in Chile, and any dividends paid by the Salares Norte project to
Gold Fields are subject to the current 35.0% withholding tax rate in Chile. Further, the 27.0% corporate tax paid will fully count as a
credit against the withholding tax levied, resulting in an effective dividend withholding tax rate of approximately 8.0%. As the process for
a new Chilean constitution in 2022 was unsuccessful, a second process for a new constitution began on 12 December 2022 and the
proposed constitution was announced on 7 November 2023. A second constitutional referendum was held on 17 December 2023. The
new constitution was rejected by voters. As such, the 1980 constitution remains in force, which has not undergone significant changes
since Gold Fields decided to invest in Chile in 2007.
In addition, the tax reform bill which proposed to replace the current tax integrated system with a “dual system”, potentially reducing the
corporate tax rate, was rejected by the Chilean congress on 9 March 2023. In August 2023, the Chilean president introduced the main
guidelines of the “Fiscal Pact”, which will likely consist of two separate bills: one relating to combating tax evasion and avoidance and
the other will be focused on tax reforms aimed at increasing revenue. The specific content of each bill has not yet been specified and
parliamentary discussion continues.
In Peru, the general corporate income tax rate is 29.5% and the dividends income tax rate applicable to non-resident shareholders is
5.0%. In addition to the corporate income tax, mining companies are required to pay a statutory mining royalty (Regalía Minera), a
Special Mining Tax (Impuesto Especial a la Minería). Mining companies are also required to pay an annual supervisory contribution to
the Supervisory Body of Investment in Energy and Mining (Organismo Supervisor de la Inversion en Energia y Mineria, or the
OSINERGMIN), as well as to the Assessment and Environment Supervising Agency (Organismo de Evaluacion y Fiscalizacion
Ambiental, or the OEFA). See “—Environmental and Regulatory Matters—Peru—Mining Royalty and Other Special Mining Taxes and
Charges’’. In addition, a consultation law requires the government to consult with indigenous or native populations on legislative or
administrative proposals that may have an impact on their collective rights, including the granting of permits for the development of
mining projects. See “—Environmental and Regulatory Matters—Peru—Mining Royalty and Other Special Mining Taxes and Charges”.
The effect of any further changes to the regulatory system in Peru on Gold Fields cannot be predicted at this stage.
In addition to rising taxes and royalties, Gold Fields may from time to time become involved in disputes with taxing authorities. For
example, Gold Fields is currently in a dispute with the Canadian tax authority in relation to U.S.$75 million of withholding tax that was
deducted from the payment by Yamana Gold (Yamana) of its U.S.$300 million termination fee in connection with the termination of the
arrangement agreement with Yamana in 2022. See “Additional Information—Material Contracts—Yamana Arrangement Agreement”.
While Gold Fields is vigorously pursuing recovery of this withholding tax from the Canadian tax authority, there is no guarantee it will be
successful in this regard.
The effect of these, or impositions of additional restrictions, obligations, operational costs, taxes or royalty payments could have a
material adverse effect on Gold Fields’ business, operating results and financial condition.
Gold Fields’ mineral rights are subject to legislation, which could impose significant costs and burdens, certain
ownership requirements and possible penalties or forfeiture for non-compliance, the interpretation of which is the
subject of dispute.
Gold Fields’ right to own and exploit Mineral Resources and Reserves and deposits is governed by the laws and regulations of the
jurisdictions in which the mineral properties are located. Currently, a significant portion of Gold Fields’ Reserves and deposits are
located in countries where mining rights could be suspended or cancelled should it breach its obligations in respect of the acquisition
and exploitation of these rights.
In all the countries where Gold Fields operates, the formulation or implementation of governmental policies on certain issues may be
unpredictable. This may include changes in laws relating to mineral rights and ownership of mining assets and the right to prospect and
mine, and, in extreme cases, nationalisation, expropriation or nullification of existing rights, concessions, licences, permits, agreements
and contracts.
Australia
Gold Fields’ Australian mining tenements are subject to conditions imposed by the Mining Act 1978 (WA) (Western Australia Mining Act),
including prescribed conditions on prospecting licences, exploration licences and mining leases to meet minimum annual expenditure
commitments. If Gold Fields fails to comply with a condition of a mining tenement, it may be subject to penalties such as fines or
forfeiture of the mining tenement. For example, if Gold Fields fails to work the ground and meet the minimum expenditure commitments
of its tenements, then it may apply for an exemption. However, if no valid ground exists and the application is refused, then there is a
risk the exploration licence may be subject to forfeiture.
To secure the ground for a longer term and to undertake mining activities, exploration licences must be converted to a mining lease.
The Western Australia Mining Act requires that an application for a mining lease be supported by either a mining proposal, a
mineralisation report or a resource report, which must be prepared and submitted in accordance with guidance published by the
Department of Mining, Industry Regulation and Safety (DMIRS). Failure to provide the proper supporting documentation for a mining
lease application may result in the application being refused by the Minister for Mines. For further information, see “—Environmental
and Regulatory Matters—Australia—Environmental” and “—Environmental and Regulatory Matters—Australia—Mineral Rights”.
Additionally, where an application for a mining lease is made within an area that is the subject of a native title claim or determination,
Gold Fields will be required to negotiate with that native title group to secure consent to the grant of the tenement. Such negotiations
can be costly, require significant amounts of time and failure to secure consent may result in the Minister for Mines refusing the mining
lease application. See “—Gold Fields’ tenements in Australia are subject to native title claims and determinations and include
Aboriginal cultural heritage sites, which could impose significant costs and burdens, or limit or prevent access to certain areas which
could materially adversely affect Gold Fields’ operations”.
South Africa
The South Deep mine is subject to legislation regulating the exploitation of mineral resources through the granting of rights required to
prospect and mine for minerals. This includes broad-based black economic empowerment legislation designed to affect the entry of
historically disadvantaged persons (as defined in the legislation), into the mining industry and to increase their participation in the South
African economy.
The MPRDA is the primary legislation regulating the mining industry in South Africa. It requires, among other things, that mining
companies submit social and labour plans, which set out their commitments relating to human resource development, labour planning
and socio-economic development planning to the DMRE. Gold Fields’ SLP for the 2018 to 2022 period has been approved by the
DMRE. Gold Fields resubmitted its new SLP to the DMRE for approval at the beginning of 2023. Due to an administrative misalignment
in the 5-year SLP cycle and the Mining Right granted to South Deep, the Company and the DMRE have agreed to amend the duration
of the newly submitted SLP. Submission of the reconstituted SLP Cycle III is imminent and South Deep is expecting guidance from the
DMRE on the approved submission date. There is uncertainty how the MPRDA will be applied and interpreted in the future, and what
changes, if any, Gold Fields will be required to make in order to comply with this legislation to avoid its mining rights being cancelled or
suspended. Mining rights are linked to compliance with various empowerment obligations, including the Broad-Based Socio-Economic
Empowerment Charter for the South African Mining and Minerals Industry, 2018 (2018 Mining Charter), which was published and
became effective in September 2018. Although the 2018 Mining Charter was intended to bring about legal certainty to the industry, it
was widely considered not to have done so.
In 2021, the High Court of South Africa held that the 2018 Mining Charter was intended to be an instrument of policy and has set aside
certain of its provisions. The judgement also confirmed the “once empowered, always empowered” principal, and that the HDSA
ownership status of existing mining right holders, which wish to renew or transfer their rights, must automatically be recognised by
the DMRE.
The DMRE has instead indicated that it intends to drive transformation in the mining sector by enforcing the terms of existing mining
rights while it works to amend the MPRDA. Although the sanction provisions for non-compliance are now no longer applicable, Gold
Fields may nonetheless incur expenses related to compliance with the 2018 Mining Charter and may in the future be subject to new or
expanded requirements under the amended MPRDA. See “—Environmental and Regulatory Matters—South Africa—Mineral Rights”.
Ghana
Abosso Goldfields Limited (Abosso) holds the mining lease in respect of the Damang mine, which was granted in 1995 and expires in
2025, as well as the mining lease in respect of the Lima South pit that expired in 2017 and was extended on 16 July 2020 for another
ten years by the Minister of Lands and Natural Resources on the recommendation of the Ghanaian Minerals Commission (the Minerals
Commission). Gold Fields Ghana Limited (Gold Fields Ghana) has two major mining leases in respect of its mining operations, namely
the Tarkwa property lease and the Teberebie property lease. There are three mining leases under the Tarkwa property lease, all of
which were granted in 1997 and will expire in 2027, and two mining leases under the Teberebie property lease, which were granted
between 1988 and 1992, and expired in 2018. The Minerals Commission approved Gold Fields Ghana’s application for an extension of
the Teberebie leases to 2036 and the Minister of Lands and Natural Resources approved the extension of the lease to 2036 on
12 November 2018. For further information, see “—Environmental and Regulatory Matters—Ghana—Mineral Rights”.
Chile
In 2020, Chilean voters elected to form a constitutional convention to rewrite Chile’s constitution, and in February 2022, the
constitutional convention’s environmental committee approved a proposal to nationalise Chile’s copper, lithium and gold mines. This
proposal, which required approval by two thirds of the full constitutional convention, was rejected and therefore not included in the
constitutional text that was submitted to popular vote and rejected on 4 September 2022. In 2023, the constitutional convention drafted
a new constitution which was rejected on 17 December 2023. Though the Chilean government has ruled out initiating a new
constitutional process during the current president’s term, in the event a proposal to nationalise Chile’s gold mines becomes part of
Chile’s new constitution in the future, Gold Fields’ operations in Chile may be halted or curtailed, resulting in a material adverse effect
on its business, operating results and financial condition. See “—Economic, political or social instability in the countries or regions
where Gold Fields operates may have a material adverse effect on Gold Fields’ operations and profits”.
Failure by Gold Fields (or others operating on its behalf or with its permission) to comply with the conditions of its mining rights, mineral
rights legislation or to renew mining leases in any of the jurisdictions in which it operates may cause it to lose the right to mine, fail to
acquire new rights to mine and may have a material adverse effect on Gold Fields’ business, operating results and financial condition.
An actual or alleged breach or breaches of law or applicable governance processes, or fraud, bribery, corruption and
money-laundering may lead to public and private censure, regulatory penalties, fines and/or sanctions and loss of
licences or permits and may impact negatively upon Gold Fields’ empowerment status and may damage Gold Fields’
reputation.
Gold Fields operates globally in multiple jurisdictions and with numerous and complex legal frameworks, applicable and adopted rules,
codes and standards, and its governance and compliance framework and implemented processes may not prevent potential breaches
of law or accounting or other governance practices. Gold Fields’ operating and ethical codes facilitate the reporting of internal and
external fraudulent behaviour, dishonesty and unethical conduct. Dedicated reporting mechanisms relating to fraud, bribery and
corruption, money-laundering and unethical conduct pivot on a Group Whistle Blower hotline, under the ambit of a Group Whistle
Blower Policy, internal grievance and disciplinary mechanisms within the Human Resources discipline and a Code of Conduct breach
identification and assessment mechanism in the Legal and Compliance discipline. Gold Fields’ operating and ethical codes, among
other adopted rules, codes, standards and guidance, may not prevent instances of fraudulent behaviour, dishonesty and unethical
conduct (internally or by associated third parties), nor guarantee compliance with legal and regulatory requirements.
To the extent that Gold Fields suffers from any actual or alleged breach or breaches of relevant laws in its operating jurisdictions,
including the U.S. Foreign Corrupt Practices Act of 1977 (the FCPA), under any circumstances, they may lead to investigations and
examinations, regulatory and civil penalties, fines and/or sanctions, litigation, public and private censure and loss of operating licences
or permits and may amount to a breach of Gold Fields’ financial covenants, impact negatively upon Gold Fields’ empowerment status
and may damage Gold Fields’ reputation. The occurrence of any of these events could have a material adverse effect on Gold Fields’
business, operating results and financial condition.
Gold Fields’ operations and profits have been and may continue to be adversely affected by trade union activity and
new and existing labour laws.
Any trade union activity that affects Gold Fields could have a material adverse impact on its operations, production and financial
performance.
In Australia, Gold Fields has an enterprise agreement with the majority of its employees (including all its operational employees) which
is in effect until its expiry date in June 2026, following which it will continue until replaced or terminated. Its senior employees are
engaged under individual contracts of employment. Protected industrial action can only be taken where an enterprise agreement has
passed its expiry date and bargaining for a new (replacement) agreement is failing. However, unlawful industrial action remains a
possibility.
Gold Fields may also be impacted by recently proposed legislation in Australia. It is proposed that eligible “casual” employees will be
afforded the right to request to convert to permanent employment after 12 months. Such requests will only be able to be refused on
reasonable business grounds. It is also proposed that criminal sanctions (i.e., penalties of up to A$7.8 million and ten years’
imprisonment) may be ordered for underpayments of employee entitlements where such underpayments are found to be deliberate
and dishonest. The proposed amendments will also allow labour hire employees and unions to apply for an order that labour hire
employees must be paid at least what they would receive under the host business (i.e., Gold Fields) enterprise agreement. Recent
amendments were also included in this proposed legislation which may extend “equal job equal pay” principles to joint venture
partners. Gold Fields is currently reviewing the potential implications of this proposed amendment. Legislation recently passed in
Australia (but not yet implemented) has created a “right to disconnect”, allowing employees the right to refuse to be contacted by
phone or email after usual working hours (unless it is unreasonable to do so). It is unclear at this stage how this will work in practice, but
it is anticipated that this may affect productivity in Gold Fields’ business in Australia.
In South Africa, a recent increase in labour unrest has resulted in more frequent industrial disputes and extended negotiations that have
negatively affected South Africa’s sovereign debt rating and subsequently the credit ratings of a number of the country’s leading mining
companies, including Gold Fields. See “—Gold Fields has experienced, and may continue to experience, difficulties, operational
delays, cost pressures and impact associated with the mine ramp-up at the Salares Norte operation in Chile and the South Deep
operation in South Africa”. There can be no guarantee that future negotiations will not be accompanied by further strikes, work
stoppages or other disruptions.
Furthermore, guidelines and targets have been provided to facilitate compliance with the open-ended broad- based socio-economic
empowerment requirements set out in the MPRDA and other legislation and policies. See “—Gold Fields’ mineral rights are subject to
legislation, which could impose significant costs and burdens, certain ownership requirements and possible penalties or forfeiture for
non-compliance, the interpretation of which is the subject of dispute”. The ongoing implementation of these requirements may be
contentious.
Gold Fields’ direct employees in Ghana are currently not unionised, however, this may change should employees decide to join a trade
union pursuant to the Ghanaian Labour Act and related labour laws or if Gold Fields shifts its direct employees to a contract mining
model. Approximately 36.0% of its contractors in Ghana are unionised.
In Chile, the mining industry has the highest level of unionisation. At the Salares Norte project, a new labour agreement was signed in
July 2023, which updated the conditions and benefits at the site until July 2025.
In Peru, Gold Fields’ operations recently have been, and may in the future be, impacted by increased trade union activities, often
resulting from restructurings, and new labour laws. In October 2022, a three-year deal labour agreement was concluded for fiscal 2022
to fiscal 2025 at Cerro Corona, which included an average salary increase of 6.0% over the period.
While Gold Fields seeks to strengthen its relationship with the trade unions in the regions where it operates, there can be no guarantee
that trade unions will not undertake strikes or “go-slow” actions during periods of resistance to Gold Fields’ operational decisions,
impacting the Group’s operations and those of other related industries and suppliers.
In the event that Gold Fields experiences further industrial relations related interruptions at any of its operations or in other industries
that impact its operations, or increased employment-related costs due to trade union or employee activity, these may have a material
adverse effect on its business, production levels, operating costs, production targets, operating results, financial condition, reputation
and future prospects. In addition, lower levels of mining activity can have a longer term impact on production levels and operating costs,
which may affect operating life. Mining conditions can deteriorate during extended periods without production, such as during and after
strikes, and Gold Fields will not re-commence mining until health and safety conditions are considered appropriate to do so.
Existing labour laws (including those that impose obligations on Gold Fields regarding worker rights) and any new or amended labour
laws may increase Gold Fields’ labour costs and have a material adverse effect on Gold Fields’ business, operating results and financial
condition.
Fluctuations in insurance cost, market conditions and availability could adversely affect Gold Fields’ operating results
and its insurance coverage may not adequately satisfy all potential claims in the future.
Gold Fields has global insurance policies covering general liability, directors’ and officers’ liability, political violence, accidental loss and/
or material damage to its property, business interruption in the form of fixed operating costs or standing charges and other losses as
stated in the insurance policy. The costs of maintaining adequate insurance coverage have increased significantly during hard market
cycles and thereby adversely affecting Gold Fields’ operating results. If such costs continue to increase, Gold Fields may be forced to
accept lower coverage and higher deductibles, which, in the event of a claim, could require significant, unplanned expenditures of cash
and affect its financial condition.
In addition, Gold Fields may become subject to liability against potential claims which it has not insured, cannot insure or has
insufficiently been insured for, or is unable to insure the amount needed due to lack of capacity by insurers in the market, including
those in respect of past mining activities. Gold Fields’ property and business interruption insurance and general liability may not cover a
particular event at all or be sufficient to fully cover Gold Fields’ losses, including, without limitation, as a result of natural disasters, public
health emergencies, such as a global pandemic, and other events that could disrupt Gold Fields’ operations. Further, Gold Fields’
existing insurance policies contain certain exclusions and limitations on coverage. For example, should Gold Fields be subject to any
regulatory or criminal fines or penalties, these amounts would not be covered under its insurance programme, either due to exclusions
or limitations, or because it is prohibited by legislation in some jurisdiction. Should Gold Fields suffer a major loss, future earnings could
be affected. In addition, Gold Fields’ insurance does not cover loss of profits. As a result, in the future, Gold Fields’ insurance coverage
may not cover the extent of claims against it or any cross-claims made.
Gold Fields’ financial flexibility could be materially constrained by South African exchange control regulations.
South Africa’s exchange control regulations (the Exchange Control Regulations) restrict the export of capital from South Africa, the
Republic of Namibia, and the Kingdoms of Lesotho and Eswatini, known collectively as the Common Monetary Area (the CMA).
Transactions between South African residents (including companies) and non-residents of the CMA are subject to exchange controls
administered by the Financial Surveillance Department of the South African Reserve Bank (SARB). While South African exchange
controls have been relaxed in certain respects in recent years, South African companies remain subject to restrictions on their ability
to deploy capital outside of the CMA. As a result, Gold Fields’ ability to raise and deploy capital outside the CMA is restricted. These
restrictions could hinder Gold Fields’ financial and strategic flexibility, particularly its ability to fund acquisitions, capital expenditures and
exploration projects outside South Africa. See “—Environmental and Regulatory Matters—South Africa—Exchange Controls”.
Risks related to Gold Fields’ shares and ADSs
Shareholders outside South Africa may not be able to participate in future issues of securities (including ordinary
shares) carried out by or on behalf of Gold Fields.
Securities laws of certain jurisdictions may restrict Gold Fields’ ability to allow participation by certain shareholders in future issues of
securities (including ordinary shares) carried out by or on behalf of Gold Fields. In particular, holders of Gold Fields securities who are
located in the United States (including those who hold ordinary shares or ADSs) may not be able to participate in securities offerings by
or on behalf of Gold Fields unless a registration statement under the Securities Act is effective with respect to such securities or an
exemption from the registration requirements of the Securities Act is available thereunder.
Securities laws of certain other jurisdictions may also restrict Gold Fields’ ability to allow the participation of all holders in such
jurisdictions in future issues of securities carried out by Gold Fields. Holders who have a registered address or are resident in, or who
are citizens of, countries other than South Africa should consult their professional advisers as to whether they require any governmental
or other consents or approvals or need to observe any other formalities to enable them to participate in any offering of Gold Fields
securities.
Investors in the United States and other jurisdictions outside South Africa may have difficulty bringing actions, and
enforcing judgments, against Gold Fields, its directors and its executive officers based on the civil liabilities
provisions of the federal securities laws or other laws of the United States or any state thereof or under the laws of
other jurisdictions outside South Africa.
Gold Fields is incorporated in South Africa as a public company. All of Gold Fields’ directors and executive officers reside outside the
United States, and the majority of (i) Gold Fields’ assets and (ii) the Gold Fields directors’ personal assets are located outside the United
States. Accordingly, investors that obtain judgments in the United States or other foreign jurisdictions may face obstacles to enforcing
foreign judgments in South Africa.
There are several conditions to be met for a foreign judgment to be enforced. In particular, South African courts will:
•not enforce foreign revenue laws or claims for punitive, multiple or penal damages;
•not enforce judgments (i) repugnant to then prevailing public policy, or (ii) obtained by fraudulent or similar means; and
•only enforce final judgments by a court or body having competence to decide the matter in the foreign jurisdiction.
South African courts will apply their own procedural rules and the capacity of parties to contract will be determined in accordance with
South African law. Moreover, a plaintiff who is not resident in South Africa may be required to provide security for costs in the event of
proceedings being initiated in South Africa and the Rules of the High Court of South Africa require that documents executed outside
South Africa must be authenticated for the purpose of use in South Africa.
Investors may face liquidity risk in trading Gold Fields’ ordinary shares on JSE Limited.
Historically, trading volumes and liquidity of shares listed on the JSE have been low in comparison with other major markets. The ability
of a holder to sell a substantial number of Gold Fields’ ordinary shares on the JSE in a timely manner, especially in a large block trade,
may be restricted by this limited liquidity.
Gold Fields may not pay dividends or make similar payments to its shareholders in the future and any dividend
payment may be subject to withholding tax.
Gold Fields pays cash dividends only if funds are available for that purpose. Whether funds are available depends on a variety of
factors, including the amount of cash available and Gold Fields’ capital expenditures (on both existing infrastructure, new projects,
exploration and growth opportunities) and other cash requirements existing at the time. Under South African law, Gold Fields will be
entitled to pay a dividend or similar payment to its shareholders only if it meets the solvency and liquidity tests set out in the Companies
Act No. 71 of 2008 and Gold Fields’ Memorandum of Incorporation. Given these factors and the Board of Directors’ discretion to declare
cash dividends or other similar payments, dividends may not be paid in the future. A 20% withholding tax is applicable on dividends
declared by South African resident companies to non-resident shareholders or non-resident ADS holders. The 20% withholding tax can,
however, be reduced under the provisions of an applicable bilateral tax treaty. See “—Additional Information—Taxation—Certain South
African Tax Considerations—Tax on Dividends”.
Gold Fields’ non-South African shareholders face additional investment risk from currency exchange rate fluctuations
since any dividends will be paid in Rand.
Dividends or distributions with respect to Gold Fields’ ordinary shares have historically been paid in Rand. The U.S. dollar or other
currency equivalent of future dividends or distributions with respect to Gold Fields’ ordinary shares, if any, will be adversely affected by
potential future reductions in the value of the Rand against the U.S. dollar or other currencies. While South African exchange controls
have been relaxed in recent years, in the future, it is possible that there will be further changes in South African exchange control
regulations, such that dividends paid out of trading profits will not be freely transferable outside South Africa to shareholders who are
not residents of the CMA. See “—Additional Information—South African Exchange Control Limitations Affecting Security Holders”.
Gold Fields’ ordinary shares are subject to dilution upon the vesting of Gold Fields’ outstanding share awards.
Shareholders’ equity interests in Gold Fields will be diluted to the extent of future vestings or settlements of rights under share plans or
long-term incentive plans. Participants receiving equity awards, which are issued under the Gold Fields 2012 Share Plan (the 2012 Plan),
are issued as ordinary shares. All shares issued and vested under this plan are subject to dilution of the share plan limit, which is 5% of
the issued share capital. The only exclusions with respect to the 2012 Plan limit are: (i) shares allocated by way of awards under the
2012 Plan which had not vested with participants as a result of the lapsing of the award; (ii) awards of Performance Shares which have
been converted into Restricted Shares; and (iii) the Shares which were awarded in terms of the 2012 Plan prior to 2016, and which have
since vested and been settled to employees. Any increase in the 2012 Plan limit is subject to Board recommendation and shareholder
approval at the annual general meeting.
Additional information on the Company
Organisational structure(1),(2)
Gold Fields is a holding company with its significant ownership interests organised as set forth below.
Notes:
(1)As of 28 March 2024, unless otherwise stated, all subsidiaries in this organisational chart are, directly or indirectly, wholly owned by Gold Fields.
(2)Not all other subsidiaries and investments are wholly owned.
(3) Gold Fields has determined that the Asanko operations is not material to its business or financial condition.
Gold Fields is a public limited company incorporated in South Africa, with its registered office located at 150 Helen Road, Sandown,
Sandton, 2196, South Africa, telephone number +27-11-562-9700. Gold Fields was incorporated and registered as a public limited
company in South Africa under registration number 1968/004880/06 on 3 May 1968 and operates under Gold Fields Limited.
Gold Fields is the ultimate holding company of the Gold Fields group.
Summary disclosure of mining operations pursuant to Item 1303 of regulation S-K under the Securities Act
Overview
Gold Fields has nine operating mines located in Australia, South Africa, Ghana, Chile and Peru, as well as a 50% stake in Windfall, which
is an early stage gold and silver development project in the Abitibi greenstone belt, Québec, Canada. Salares Norte is a development
stage property which is near production. Gold Fields conducts underground and surface mining operations at St. Ives, underground-
only operations at Granny Smith, Agnew and South Deep and surface-only open pit mining at Gruyere, Tarkwa, Salares Norte and Cerro
Corona. Windfall is expected to be underground only. Damang has ceased active open pit mining activities and is currently processing
surface ore dump material only, while some tailings material is processed at South Deep to assist with the supply of backfill material for
underground placement and scope support. Material processed intermittently, and as prescribed by a processing schedule, from
production stockpiles occurs at Gruyere, Granny Smith, St. Ives, Agnew, Tarkwa, Salares Norte and Cerro Corona.
The following graphic sets out the geographical distribution of Gold Fields’ mining properties.
For a summary of Gold Fields’ Measured, Indicated and Inferred Mineral Resources by commodity and geographic area, as determined
by a Qualified Person as of 31 December 2023, see “—Summary of Mineral Resources and Mineral Reserves—Mineral Resources of
Gold Fields as at 31 December 2023—Attributable Mineral Resources exclusive of Mineral Reserves as at 31 December 2023”.
For a summary of Gold Fields’ Proven, Probable and total Mineral Reserves by commodity and geographic area, as determined by a
Qualified Person as of 31 December 2023, see “—Summary of Mineral Resources and Mineral Reserves—Attributable Mineral Reserves
as at 31 December 2023”.
The following table sets out the aggregate production of Gold Fields’ mining operations for the years ended 31 December 2023, 2022
and 2021. All production numbers are presented as attributable.
The following table sets out an overview of Gold Fields’ operative mining areas, as of 31 December 2023.
| | | | | | | | | | | | | | | | |
| | | | | | | | | | | | | | | | Processing plants or other facilities |
| | | | | | | | | | | | | | | | |
| | | | | | | | | | | | | | | | |
| | | | 50% JV (50% Gold Road Resources) | | | | | | | | | | Archaean shear hosted orogenic | | |
| | | | | | | | | | | | | | Archaean shear hosted orogenic | | |
| | | | | | | | | | Underground, open pit and stockpile | | | | Archaean shear hosted orogenic | | |
| | | | | | | | | | | | | | Archaean shear hosted orogenic | | |
| | | | | | | | | | | | | | | | |
| | | | | | | | | | | | | | | | |
| | | | | | | | | | | | | | | | |
| | | | | | | | | | | | | | | | |
| | | | | | | | | | | | | | | | |
| | | | | | | | | | | | | | | | |
| | | | | | | | Ramp up towards Production, Development | | | | | | | | Mill/leach/Merrill Crowe/CIP |
| | | | | | | | | | | | | | | | |
| | | | | | | | | | | | | | | | Mill/float/concentrate sales |
| | | | | | | | | | | | | | | | |
| | | | 50% JV (50% Osisko Mining Inc.) | | | | | | | | | | | | |
Notes:
(1)South Deep has a variable Attributable Ownership year on year.
(2) Gold Fields has determined that Asanko is not material to its business or financial condition and is now listed in non-core investments below.
(3)50% partnership stake in Windfall project acquired in May 2023.
Gold Fields leases its corporate headquarters in Sandton, Johannesburg, South Africa.
In Western Australia, land that is the subject of mining rights is leased from the state. West Australian mining leases have an initial term
of 21 years with one automatic 21-year renewal period and thereafter an indefinite number of 21-year renewals with government
approval. In relation to gold produced from the mining leases at Gruyere, Granny Smith, St. Ives and Agnew, Gold Fields pays an annual
royalty to the state of 2.5% of revenue. Pursuant to its joint venture with Gold Road Resources, Gold Fields holds a 100% interest
(through its subsidiary) in Gruyere Mining Co Pty, which has a 50% interest in Gruyere. Gold Road Resources also holds a 50% interest
in Gruyere. Gruyere’s first gold was poured in 2019.
According to the MPRDA, the Mineral Resources of South Africa belong to the nation and to the state (as custodian of the nation’s
resources, which is entitled to grant prospecting and mining rights). The MPRDA provides a statutory right of access for the mining right
holder to the mining area for the purposes of conducting mining operations and does not require the holder to own the land on which it
conducts operations. Once a mining right is granted, a landowner cannot refuse a lawful mining right holder the right to conduct its
mining operations. In addition, the landowner is not entitled to compensation from the mining right holder for the use of the land for
mining operations conducted in terms of the MPRDA. In May 2010, the DMRE approved the conversion of the South Deep old order
mining right into a new order mining right. Included in this approval was an additional area called Uncle Harry’s which is contiguous to
South Deep. The durations of the South Deep and Uncle Harry’s mining rights are both 30 years, with a reasonable expectation of right
of renewal.
Gold Fields owns most of the properties in respect of its South African mining operation, and where it does not own such property, it
does so in accordance with applicable mining and property laws. In addition, Gold Fields owns prospecting and surface rights
contiguous to its operations in South Africa. As required under the MPRDA, Gold Fields has registered its surface rights utilised for
mining purposes. Gold Fields has received prospecting rights on properties which it has identified as being able to contribute, now or in
the future, to its business and will apply to convert those prospecting rights to mining rights under the MPRDA, when appropriate. See
“—Risk Factors—Gold Fields’ mineral rights are subject to legislation, which could impose significant costs and burdens, certain
ownership requirements and possible penalties or forfeiture, the interpretation of which is the subject of dispute—South Africa”.
Gold Fields’ Ghana operations comprise three legally registered entities, namely Damang mine (Abosso), Tarkwa mine (Gold Fields
Ghana) and a 45% stake in the Asanko JV, which holds a 100% interest in Asanko (comprising the Asanko Gold Mine and its associated
properties and exploration rights in Ghana) as of 31 December 2023. In March 2024, Gold Fields disposed of its 45% interest in the
Asanko Gold Mine to Galiano Gold. Gold Fields has determined that its interest in Asanko is not material to its business or financial
condition. See “—Recent Developments”. Abosso holds the right to mine at the Damang property under the Damang and Lima South
mining leases from the government of Ghana. The Damang lease expires in 2025. The Lima South lease, which expired in 2017, has
been extended for another ten years by the Minister of Lands and Natural Resources on the recommendation of the Minerals
Commission. Gold Fields Ghana obtained the mining rights for the Tarkwa property from the government of Ghana in 1993. In August
2000, with the consent of the government of Ghana, Gold Fields Ghana was assigned the mining rights for the northern portion of the
Teberebie property. The Tarkwa rights expire in 2027 and the Minister of Lands and Natural Resources has approved the extension of
the Teberebie Leases to 2036. Gold Fields has a reasonable expectation that the Damang and Tarkwa leases can be extended to
extract planned and future defined Mineral Reserves.
Gold Fields may respectively exploit all surface and underground gold at all its sites until the rights expire, provided that Gold Fields
pays the government of Ghana a quarterly royalty. See “—Environmental and Regulatory Matters—Ghana—Mineral Rights”.
In Chile, the Salares Norte mine is in its final stages of commissioning the process plant and will commence gold and silver production
in April 2024 with all necessary permits in place. The environmental permit requires the protection and relocation of the endangered
short-tailed chinchilla. The Relocation Plan commenced during October 2020, with the capture and relocation of four chinchillas. Two of
the four chinchilla did not survive, whilst two were relocated successfully. The environmental regulator (SMA) issued a suspension
notice for the rescue and relocation plan and subsequently began sanction proceedings against the Salares Norte mine. A compliance
programme was submitted to the SMA in response to sanction proceedings, reviewed by the SMA, and based on the SMA’s response,
an updated programme was timely submitted and approved in late 2023, allowing for rescue and relocation activities to recommence in
the first quarter of 2024.
The compliance programme establishes 35 measures that must be periodically reported to the SMA. In the event of any serious
incident during the execution of the compliance programme, the relocation activities will be required to be stopped. The SMA will
determine whether to allow the resumption of activities or to suspend them and reactivate the sanctioning process. In the latter case,
Gold Fields is exposed to the imposition of fines and may potentially have to suspend mining activities in the areas close to the
remaining rocky areas.
In Peru, exploration and extraction activities can only be performed in duly authorised areas. Authorisation is granted by the Peruvian
government when a mining concession is issued. Mining concessions expire if the titleholder does not exploit the concessions for a
period of 15 years, unless the titleholder demonstrates to the authorities that this was through no fault of its own, in which case the
authorities may allow the titleholder to begin to exploit the concession within the next five years that follow. The titleholder must comply
with specific obligations, such as paying annual fees of U.S.$3.00 per hectare, meeting minimum investment requirements, paying a
monthly royalty according to the value of the produced concentrates and other requirements. See “—Environmental and Regulatory
Matters—Peru—Concessions—Mining Concessions”.
In Peru, the Cerro Corona Mineral Resource exclusive of Mineral Reserves decreased by 100% for Measured and Indicated and Inferred
due to planned sterilisation of Mineral Resources due to in-pit tailings.
In Canada, the Windfall project mining leases are extraction (production) mining titles that give holders the exclusive right to mine
minerals (other than surface minerals, petroleum, natural gas, and brine). A mining lease is granted to the holder of one or several
claims upon proof of the existence of indicators of a workable deposit in the area covered by such claims and compliance with
other requirements prescribed by the Mining Act. A mining lease has an initial term of 20 years but may be renewed for three additional
10-year periods. Under certain conditions, a mining lease may be renewed beyond the three statutory renewal periods. The Windfall
property is 100% owned by the Windfall Mining Group, an incorporated 50/50% joint venture between Gold Fields and Osisko Mining.
Windfall Mining Group will be the operating entity for the project.
The technical description of Windfall contained herein are based on historical estimates derived from the NI 43-101 technical report on
Windfall filed by Osisko Mining on SEDAR (www.sedar.com) on 10 January 2023. As the project remains subject to certain closing
conditions, including EIA approval by Quebec regulators, a qualified person has not done sufficient work to classify the estimate as a
current estimate of mineral resources, mineral reserves or exploration results pursuant to Item 1300 of Regulation S-K. Gold Fields is
currently collecting the data and conducting the test work required to prepare a S-K 1300 compliant technical report summary, and
expects to disclose its results as and when the estimates are completed and the joint venture approval for investment has been
received.
During 2007-2015, several environmental studies, analyses, and reports have been completed for the Project. After Osisko Mining
acquired the Project, additional baseline studies were carried out between 2015 and 2022 to obtain updated data and an accurate
picture of existing conditions within the Project area.
Atmospheric dispersion modelling, greenhouse gas emissions assessment, noise and vibration modelling are required to comply with
the EIA requirements.
Non-core Investments
Over the years, Gold Fields has acquired strategic interests in several smaller mining companies, including in Australia, Ghana, Chile
and Peru. As at 31 December 2023, Gold Fields held minority shareholdings in Great Southern Mining Ltd., Magmatic Resources
Limited, Lefroy Exploration Ltd., Hamelin Gold Ltd., Lunnon Metals Ltd., Mineral Resources Limited Far Southeast Gold Resources,
Galiano Gold Inc. (Asanko Gold Mine), Torq Resources Inc., Tesoro Gold Limited, Chakana Copper Corp., and Rusoro Mining Ltd.
(together, the Non-core Investments).
The following graphic sets out the geographical distribution of the Non-core Investments with the exception of Galiano Gold, the
location of which is disclosed under “—Overview” above. Mineral Resources Limited is a diversified miner and service provider with
operations, offices and activities across Western Australia and the Northern Territory. Given the size of its geographic spread, the
graphic below provides an indication only of its corporate office.
Figure 1. Australia; Great Southern Mining
Figure 2. Australia; Magmatic Resources
Figure 3. Australia; Hamelin Gold, Lefroy Exploration, Lunnon
Metals and Mineral Resources Limited. Mineral Resources
Limited is a diversified miner and service provider with
operations, offices and activities across Western Australia and
the Northern Territory. Due to the number of these, only the
location of the corporate office is indicated.
Figure 4. Philippines; Far South East
Figure 5. Ghana; Galiano – Asanko Gold Mine
Figure 6. Peru and Chile; Chakana Copper, Torque Resources
and Tesoro Gold
Figure 7. Venezuela; Rusoro Mining
The following table sets out an overview of the Non-core Investments.
| | | | | | | | |
| | | | | | | | Mine type and mineralisation styles |
| | | | | | | | |
| | | | Shareholding in listed company and Joint Venture | | | | Epithermal, Intrusion Related Gold |
| | | | Shareholding in listed company | | | | Target open pit and underground, Porphyry |
| | | | | | Target open pit and underground, Orogenic |
| | | | | | Target open pit and underground, Porphyry |
| | | | Shareholding in listed company and Joint Venture | | | | |
| | | | Shareholding in listed company | | | | |
| | | | Shareholding in listed company | | | | Target underground, Nickel sulphide |
Mineral Resources Limited | Multiple projects; Diversified miner and service provider | Lithium, Iron Ore, Energy, Mining Services, Engineering and Construction | | Shareholding in listed company | Minor shareholding with no access to this information | | | Diversified miner and service provider; Multiple projects and mineralisation styles |
Far Southeast Gold Resources | | | | | | | | |
| | | | Shareholding in listed company and Joint Venture (45% JV (Galiano Gold: 45%; Government of Ghana: 10%)) | | | | |
| | | | Shareholding in listed company | | | | Target open pit, Porphyry and Epithermal |
| | | | | | Target open pit, IOCG and Porphyry |
| | | | | | |
| | | | Shareholding in listed company | | | | Target open pit, Intrusion Related Gold |
| | | | Shareholding in listed company | | | | |
| | | | Shareholding in listed company | Claim to a nationalised project |
As at 31 December 2023, the total market value of the Non-core Investments was U.S.$157.3 million. The following table sets out the
value and Gold Fields’ interest in each Non-core Investment.
| | |
| | Market value of shareholding |
| | |
| | |
| | |
| | |
| | |
| | |
| | |
| | |
| | |
| | |
| | |
Minerals Resources Limited | | |
| | |
| | |
| | |
Notes:
1.As of 5 March 2024, Gold Fields’ interest in Galiano increased to 19.9% as part of Gold Fields’ disposal of its joint venture interest in the Asanko Gold mine.
2.On 9 January 2024, Gold Fields announced it entered into a share purchase agreement to sell 100% of its interest in Rusoro Mining.
3.Represents de minimis investments in AngloGold Ashanti Limited, RareX Limited, Australian Gold and Copper Limited, Orsu Metals Corp., Vizsla Copper Corp.
and Amarc Resources Ltd.
Summary of Mineral Resources and Mineral Reserves
Mineral Reserves of Gold Fields as at 31 December 2023
Methodology
Mineral Reserves are divided into categories of proven and probable and are expressed in terms of tonnes to be processed at mill feed
head grades, allowing for application of cut-off grades, estimated mining dilution, ore loss, mining recovery and other modifying factors.
All of Gold Fields’ operations disclose Mineral Reserves using cut-off grades or net smelter return (NSR) cut-offs, in the case of gold/
copper or gold/silver deposits. Cut-off grade is the grade that distinguishes the economic material within an ore body that is to be
extracted and treated from the remaining material. Cut-off grade is typically calculated using an appropriate metal price plus the
development, stoping, processing, general and administration and sustaining capital costs to derive a total cost per tonne. NSR cut-off
is the net revenue (total revenue less production costs) that the owner of a mining property receives from the sale of the mine’s metal
products. Costs include transportation and refining costs. Modifying factors applied in estimating Mineral Reserves are primarily based
on historical empirical information, but commonly incorporate adjustments for planned operational improvements. Tonnage and grade
may include some mineralisation below the selected cut-off grade to ensure that the Mineral Reserve comprises blocks of adequate
size and continuity to facilitate practical mining (dilution) but is limited in extent and typically less than 5% and the entire mining block
would still be above cut-off contribution by metal. Mineral Reserves also take into account operating cost levels as well as necessary
capital and sustaining capital provisions required at each operation and are supported by detailed engineered LOM Mineral
Reserve plans.
Attributable Mineral Reserves as at 31 December 2023
As at 31 December 2023, Gold Fields had aggregate attributable Proven and Probable Mineral Reserves of approximately 44.6 million
ounces of gold, 336 million pounds of copper and 41.9 million ounces of silver. The point of reference for the Mineral Reserve is on the
Run of Mine (ROM).
| | | | | | | | | | | |
| | Attributable Gold Mineral Reserve statement as at 31 December 2023(1) |
| | | Probable Mineral Reserves | | Attributable gold production in fiscal 2023(2) |
| | | | | | | | | | |
| | | | | | | | | | | |
| | | | | | | | | | | |
| | | | | | | | | | | |
| | | | | | | | | | | |
| | | | | | | | | | | |
| | | | | | | | | | | |
| | | | | | | | | | | |
| | | | | | | | | | | |
| | | | | | | | | | | |
| | | | | | | | | | | |
| | | | | | | | | | | |
| | | |
|
| | Disclosed as mill delivered metric tonnes and ROM grades, inclusive of all mining dilutions and gold losses except mill recovery. Metallurgical recovery factors have not been applied to the Reserve figures. |
| | Dilution relates to planned and unplanned waste and/or low-grade material being mined and delivered to the mill. |
| | For the Australian operations, Mineral Reserve figures are based on a gold price of A$2,150 per ounce at an exchange rate of A$0.65 per U.S.$1.00 or A$:U.S.$1.54c. Open pit Mineral Reserves at the Australian operations are based on optimised pits and the underground operations on appropriate mine design and extraction schedules. At South Deep, a gold price of R765,000 per kilogram at an exchange rate of R17.00 per U.S.$1.00 was used. For the Ghana operations, Mineral Reserve figures are based on an optimised pit at a gold price of U.S.$1,400 per ounce. For the Chilean operations, Mineral Reserve used a gold price of U.S.$1,400 per ounce and silver price of U.S.$17.50 per ounce. For the Cerro Corona (Peru) gold reserves, the optimised pit is based on a gold price of U.S.$1,400 per ounce and a copper price of U.S.$3.40 per pound. Due to the nature of the deposit and the importance of net smelter returns, the gold and copper prices need to be considered together. |
| | Totals may not sum due to rounding. Where this occurs, it is not deemed significant. |
| Attributable gold produced after metallurgical recovery. |
| Based on LOM ownership share due to step-up of minority interest over time. |
| In line with other international operations, all South Deep Mineral Reserves are classed as above infrastructure, as the Mineral Reserves will be accessed by means of ongoing declines from current infrastructure. |
| A qualified person has not done sufficient work to classify mineral estimate of Windfall as a current estimate of Mineral Resources, Mineral Reserves or exploration results pursuant to Item 1300 of Regulation S-K. |
The following table sets forth the Proven and Probable copper Mineral Reserves of the Cerro Corona mine as at 31 December 2023
that are attributable to Gold Fields:
| | | | | | | | | | | |
| | Attributable Copper Mineral Reserve statement as at 31 December 2023(1) |
| | | Probable Mineral Reserves | | Attributable copper production in fiscal 2023(1) |
| | | | | | | | | | |
| | | | | | | | | | | |
| | | | | | | | | | | |
| | | | | | | | | | | |
| | | | | | | | | | | |
| | | | | | | | | | | |
| | | |
|
| | Disclosed as mill delivered metric tonnes and ROM grades, inclusive of all mining dilutions and copper losses except mill recovery. Metallurgical recovery factors have not been applied to the Mineral Reserve figures. |
| | Dilution relates to planned and unplanned waste and/or low-grade material being mined and delivered to the mill. |
| | For the Cerro Corona (Peru) gold Mineral Reserves, the optimised pit is based on a gold price of U.S.$1,400 per ounce and a copper price of U.S.$3.40 per pound. Due to the nature of the deposit and the importance of net smelter returns, the gold and copper prices need to be considered together. |
| | Totals may not sum due to rounding. Where this occurs, it is not deemed significant. |
The following table sets forth the Proven and Probable silver Mineral Reserves as at 31 December 2023 that are attributable to
Gold Fields. The point of reference for the Mineral Reserve is on the ROM:
| | | | | | | | | | | |
| | Attributable Silver Mineral Reserve statement as at 31 December 2023(1) |
| | | Probable Mineral Reserves | | Attributable silver production in fiscal 2023(1) |
| | | | | | | | | | |
| | | | | | | | | | | |
| | | | | | | | | | | |
| | | | | | | | | | | |
| | | | | | | | | | | |
| | | | | | | | | | | |
| | | | | | | | | | | |
| | | |
|
| | Disclosed as mill delivered metric tonnes and ROM grades, inclusive of all mining dilutions and silver losses except mill recovery. Metallurgical recovery factors have not been applied to the Mineral Reserve figures. |
| | Dilution relates to planned and unplanned waste and/or low-grade material being mined and delivered to the mill. |
| | For the Chilean operations, Mineral Reserve is based on a gold price of U.S.$1,400 per ounce and silver price of U.S.$17.50 per ounce. Due to the nature of the deposit and the importance of net smelter returns, the gold and silver prices need to be considered together. |
| | Totals may not sum due to rounding. Where this occurs, it is not deemed significant. |
| A qualified person has not done sufficient work to classify mineral estimate of Windfall as a current estimate of Mineral Resources, Mineral Reserves or exploration results pursuant to Item 1300 of Regulation S-K. |
Gold Fields’ methodology for determining its Mineral Reserves is subject to change and is based upon estimates and assumptions
made by management regarding a number of factors as noted above under “—Summary of Mineral Resources and Mineral Reserves—
Mineral Reserves of Gold Fields as at 31 December 2023—Methodology”. Accordingly, the sensitivity analysis of Gold Fields’ Mineral
Reserves provided above should not be relied upon as indicative of what the estimate of Gold Fields’ Mineral Reserves would actually
be or have been at the gold, silver or copper prices indicated, or at any other gold, silver or copper price, and neither should it be relied
upon as a basis for estimating Gold Fields’ Mineral Reserves based on the current gold, silver or copper price or what Gold Fields’
Mineral Reserves will be at any time in the future. See “—Risk Factors—Gold Fields’ Mineral Resources and Mineral Reserves are
estimates based on a number of technical and economic assumptions, which, if proven inaccurate or changed, may require Gold
Fields to lower its estimated Mineral Resources and Mineral Reserves”.
Mineral Resources of Gold Fields as at 31 December 2023
Methodology
S-K 1300, which is substantially similar in its methodology to the SAMREC Code, is used to estimate Mineral Resources. The Mineral
Resources are exclusive of Mineral Reserves and the point of reference is in situ. Open pit Mineral Resources are confined to pit shells
that are defined by the price, costs and relevant modifying factors used for the estimates. The pit shells are used to constrain the
mineralisation to that which is potentially economically and practically extractable under assumed economic conditions. The Mineral
Resources are disclosed at an appropriate in situ cut-off grade. The pit shells take into account selective mining units and may also
include estimates of any material below cut-off grade that needs to be mined to extract the complete pay portion of the Mineral
Resource. Underground estimates follow a similar economic practical extraction methodology based on mining shapes that can be
practically accessed and mined disclosed at an appropriate in situ cut-off grade.
Modifying Factors for Mineral Resources
All of Gold Fields’ operations disclose Mineral Resources using cut-off grades or NSR cut-offs, in the case of multi-metal deposits. Cut-
off grade is the grade that distinguishes the economic material within an ore body that is to be extracted and treated from the remaining
material. Cut-off grade is typically calculated using an appropriate metal price plus the development, stoping, processing, general and
administration and sustaining capital costs to derive a total cost per tonne. NSR cut-off is the net revenue (total revenue less production
costs) that the owner of a mining property receives from the sale of the mine’s metal products. Costs include transportation and refining
costs.
Attributable Mineral Resources exclusive of Mineral Reserves as at 31 December 2023
As at 31 December 2023, Gold Fields had aggregate attributable Measured and Indicated Mineral Resources exclusive of Mineral
Reserves of approximately 30.3 million ounces of gold, 0 million pounds of copper and 2.2 million ounces of silver, as set forth in the
following tables.
Gold Mineral Resources exclusive of Mineral Reserves as at 31 December 2023 that are attributable to Gold Fields. The point of
reference for the Mineral Resource exclusive of Mineral Reserves is diluted in situ.
| | | | | | | | | | | |
| | Attributable Gold Mineral Resources exclusive of Mineral Reserves as at 31 December 2023(1) |
| | Measured Mineral Resources | Indicated Mineral Resources | Inferred Mineral Resources | Attributable gold Total Measured and Indicated Mineral Resource |
| | | | | | | | | | |
| | | | | | | | | | | |
| | | | | | | | | | | |
| | | | | | | | | | | |
| | | | | | | | | | | |
| | | | | | | | | | | |
| | | | | | | | | | | |
| | | | | | | | | | | |
| | | | | | | | | | | |
| | | | | | | | | | | |
| | | | | | | | | | | |
| | | | | | | | | | | |
| | | |
|
| | Disclosed as in situ undiluted. Mining Recovery, Mining dilution MCF and metallurgical recovery factors have not been applied to the Mineral Resource figures. |
| | The metal prices used for the 2023 Mineral Resources were as follows: For the Australian operations, Mineral Resource figures are based on a gold price of A$2,460 per ounce (at an exchange rate of A$1.54 per U.S.$1.00 or A$:U.S.$0.65c). Open pit Mineral Resources at the Australian operations are similarly based on optimised pits and the underground operations on appropriate mine design and extraction schedules. At South Deep, a gold price of R850,000 per kilogram (at an exchange rate of R16.5 per U.S.$1.00) was applied in valuing the Mineral Resource. The gold price used for Mineral Resources is less than but approximates the three-year trailing average (U.S.$1,848 per oz) to end December 2023, calculated on a monthly basis, of the London afternoon fixing price of gold. For the Ghana operations, Mineral Resource figures are based on an optimised pit at a gold price of U.S.$1,600 per ounce. For the Chilean operations, Mineral Resource figures are based on a gold price of U.S.$1,600 per ounce and silver price of U.S.$20.00 per ounce. |
| | Totals may not sum due to rounding. Where this occurs, it is not deemed significant. |
| Based on LOM ownership share due to step-up of minority interest over time. |
| In line with other international operations, all South Deep Mineral Resources exclusive of Mineral Reserve are classed as above infrastructure, as the Mineral Resources could be accessed by means of ongoing declines from current infrastructure. |
| A qualified person has not done sufficient work to classify mineral estimate of Windfall as a current estimate of Mineral Resources, Mineral Reserves or exploration results pursuant to Item 1300 of Regulation S-K. |
Copper Mineral Resources exclusive of Mineral Reserves as at 31 December 2023 that are attributable to Gold Fields. The point of
reference for the Mineral Resource exclusive of Mineral Reserves is diluted in situ:
| | | | | | | | | | | |
| | Attributable Copper Mineral Resources exclusive of Mineral Reserves as at 31 December 2023(1) |
| | Measured Mineral Resources | Indicated Mineral Resources | Inferred Mineral Resources | Attributable copper Total Measured and Indicated Mineral Resource |
| | | | | | | | | | |
| | | | | | | | | | | |
| | | | | | | | | | | |
| | | | | | | | | | | |
| | | | | | | | | | | |
| | | | | | | | | | | |
| | | |
|
| | Disclosed as in situ undiluted. Mining Recovery, Mining dilution MCF and metallurgical recovery factors have not been applied to the Mineral Resource figures. |
| | For the Peru operations, Mineral Resource figures are based on a gold price of U.S.$1,600 per ounce and a copper price of U.S.$3.6 per pound. Due to the nature of the deposit and the importance of net smelter returns, the gold and copper prices need to be considered together. |
| | Totals may not sum due to rounding. Where this occurs, it is not deemed significant. |
Silver Mineral Resources exclusive of Mineral Reserves as at 31 December 2023 that are attributable to Gold Fields. The point of
reference for the Mineral Resource exclusive of Mineral Reserves is diluted in situ:
| | | | | | | | | | | |
| | Attributable Silver Mineral Resources exclusive of Mineral Reserves as at 31 December 2023(1) |
| | Measured Mineral Resources | Indicated Mineral Resources | Inferred Mineral Resources | Attributable silver Total Measured and Indicated Mineral Resource(2) |
| | | | | | | | | | |
| | | | | | | | | | | |
| | | | | | | | | | | |
| | | | | | | | | | | |
| | | | | | | | | | | |
| | | | | | | | | | | |
| | | | | | | | | | | |
| | | |
|
| | Disclosed as in situ undiluted. Mining Recovery, Mining dilution MCF and metallurgical recovery factors have not been applied to the Mineral Resource figures. |
| | For the Chilean operations, Mineral Resource figures are based on a silver price of U.S.$20.00 per ounce. |
| | Totals may not sum due to rounding. Where this occurs, it is not deemed significant. |
| A qualified person has not done sufficient work to classify mineral estimate of Windfall as a current estimate of Mineral Resources, Mineral Reserves or exploration results pursuant to Item 1300 of Regulation S-K. |
Individual property disclosure pursuant to Item 1304 of regulation S-K under the Securities Act
Gold Fields has determined that the Gruyere, Granny Smith, St. Ives, Agnew South Deep, Tarkwa and Salares Norte properties are
material to its business and financial condition based on, among other things, Gold Fields’ consideration of qualitative and quantitative
factors in the context of its overall business and financial condition. As a result, disclosure has been provided below for the
aforementioned properties pursuant to S-K 1300. Furthermore, Gold Fields has filed technical report summary exhibits with the
Securities and Exchange Commission for each of the Gruyere (2021), Granny Smith (2021), St. Ives (2021), Agnew (2021), South Deep
(2021), Damang (2021), Tarkwa (2022) and Salares Norte (2021), which have been incorporated by reference to this annual report on
Form 20-F, and Cerro Corona (2023) properties. Gruyere, Granny Smith, St. Ives, Agnew, South Deep, Tarkwa and Salares Norte
properties have not had a material change to the last technical report summary exhibits filed with the Securities and Exchange
Commission.
In May 2023, Gold Fields announced that it had entered into a 50/50 joint venture agreement with Osisko Mining Inc. for joint
ownership and development of the Windfall project. As the project remains subject to certain closing conditions, including EIA approval
by Quebec regulators, a qualified person has not done sufficient work to classify the estimate as a current estimate of Mineral
Resources, Mineral Reserves or exploration results pursuant to Item 1300 of Regulation S-K. Gold Fields is currently collecting the data
and conducting the test work required to prepare a S-K 1300 technical report summary, and expects to disclose its results as and when
the estimates are completed and the joint venture approval for investment has been received.
Gold Fields has determined that Damang, Cerro Corona and Windfall along with the properties listed under “—Additional Information on
the Company—Summary Disclosure of Mining Operations Pursuant to Item 1303 of Regulation S-K under the Securities Act—Non-Core
Investments,” which includes Asanko, are not considered material to Gold Fields’ business and financial condition at this time.
Australia operations
Gruyere
The following graphic illustrates the location of the Gruyere Gold Mine operations, including mining and exploration tenements,
administrative offices and processing plant.
Introduction
Gruyere is a production stage JV comprising five open pits (one active and four planned) and Mineral Reserve stockpiles. The Gruyere
deposit is located within the Yamarna Terrane of the eastern Yilgarn, Western Australia (latitude 27º59’04”S and longitude 123º50’43”E
or GDA94/MGA Zone 51 coordinates 583,115E and 6,904,206N). Gruyere is located by road 200 kilometres east of Laverton and 1,150
kilometres north-east of Perth and is accessible by road and by air, with a sealed airstrip near the camp. The mine operates on a fly-in
fly-out basis with variable rosters.
The project holds licenses for mining, exploration, prospecting and miscellaneous use of a total area of 142,049 hectares. The Gruyere
mine utilises mining contractors to mine the open pit using conventional drill, blast, load and haul activities.
Operational infrastructure
The Gruyere open pit commenced in 2018 and included the 2019 7.5Mt/a conventional Carbon in leach (CIL) processing plant, and
therefore still comprises modern equipment and surface infrastructure. The recent open pit LOM Mineral Reserve commenced in 2018
with numerous small, short life open pits in the LOM Mineral Reserve. The Gruyere processing plant has an ongoing condition
monitoring programme to focus on reliability and minimise down time and has a comprehensive maintenance strategy that includes
regular equipment refurbishment or replacement. The plant has been progressively de-bottlenecked to achieve a target throughput
rate of 10Mt/a. Gruyere mine design and scheduling include sustainable capital to support the remaining year LOM Mineral Reserve.
Gruyere has contractors that conduct mining operations and who own and are responsible for maintaining and modernising the mining
fleet.
The operation has a processing plant and is supported by a power station with gas pipeline and power distribution lines, borefields and
water supply infrastructure, centralised administrative offices; engineering workshops, accommodation village; airstrip and road
networks. The present condition of the property, and its equipment, facilities and infrastructure is reasonably new, with a newly
commissioned pebble crusher, an expanded village and a 25MW solar farm constructed in 2021.
For information on assets and liabilities (including costs after depreciation) of Gruyere see “Annual Financial Report—Notes to the
Consolidated Financial Statements—Note 44. Segmental Report”. The book value of Gruyere is U.S.$506 million (Gold Fields’
attributable share). As at 31 December 2023, 349 workers were employed at Gruyere, including 253 contractors.
During the year ended 31 December 2023, Gruyere received a fine for breach of mining lease conditions, which totalled U.S.$20,855.
As at 31 December 2023, no significant encumbrances to the property existed.
The Gruyere mining concessions are renewed every 21 years and expire ranging from 2025 to 2037 and have an annual fee of U.S.
$0.3 million.
History
Gold Road Resources (ASX listed) discovered the Gruyere mineralisation in 2013. In November 2016, Gold Road Resources formed a
50/50 joint venture with Gold Fields. Gold Fields holds its 50% interest (through its subsidiary, Gruyere Mining Co Pty) and is the
operator of the mine (through its subsidiary Gruyere Management Co. Pty Ltd.). Gruyere’s first gold was poured in 2019. The LOM
Mineral Reserve extends to 2032.
Geology
Gruyere is an Archaean orogenic gold deposit. Mineralisation is hosted within the Gruyere Monzonite Porphyry. Gold is associated with
varying intensity albite-sericite-chlorite-biotite-calcite alteration of the host rock. The Gruyere deposit is located on a flexure point of the
regional scale Dorothy Hills Greenstone Belt, where the shear zone changes in direction. The entire Gruyere porphyry is variably
altered and gold grade is related to variations in style and intensity of alteration, structure, veining and sulphide content.
Gold mineralisation within the Attila-Alaric trend (Attila, Alaric, Montagne, Argos and Orleans satellite projects), known as the Golden
Highway, comprises steeply dipping shear hosted gold in volcanoclastic sequences, with gold associated with zones of alteration and
pyrite mineralisation.
Mineral Reserves and Mineral Resources
Attributable Mineral Reserves of Gruyere as at 31 December 2023
The following table sets out attributable Mineral Reserves of the Gruyere JV as at 31 December 2023. The Mineral Reserve gold price is
U.S.$1,400/oz and the point of reference is on the ROM.
| | | | | | |
| | |
| | | | | | |
| | | | | | |
| | | | | | |
| | | | | | |
Probable Mineral Reserves | | | | | | |
| | | | | | |
Attributable Mineral Reserves year on year change
| | | |
| | Proven and Probable Mineral Reserves |
| | | |
|
| | | |
| | | |
Production depletion (2023) | | | |
| | | |
| | | |
| | | |
| | | |
| | | |
| | | |
| | | |
| | | |
For the year ended 31 December 2023, changes in Mineral Reserves at Gruyere were primarily driven by depletion, cost and price.
Attributable Mineral Resources exclusive of Mineral Reserves of Gruyere as at 31 December 2023
The following table sets out attributable Mineral Resources exclusive of Mineral Reserves of the Gruyere JV as at 31 December 2023.
The Mineral Resources gold price is U.S.$1,600/oz and the point of reference is diluted in situ.
| | | | | | |
| | |
| | | | | | |
| | | | | | |
| | | | | | |
Measured Mineral Resources | | | | | | |
Indicated Mineral Resources | | | | | | |
Total Measured and Indicated Mineral Resources | | | | | | |
Inferred Mineral Resources | | | | | | |
Attributable Mineral Resource exclusive of Mineral Reserves year on year change
The following table sets out attributable Mineral Resources exclusive of Mineral Reserves of Gruyere as at 31 December 2023
compared to 31 December 2022.
| | | | | |
| | Measured and Indicated Mineral Resources | Inferred Mineral Resources |
| | | | | |
| | | | | |
| | | | | |
Production depletion (2023) | | | | | |
| | | | | |
| | | | | |
| | | | | |
| | | | | |
| | | | | |
| | | | | |
| | | | | |
| | | | | |
| | | | | |
For the year ended 31 December 2023, changes in Mineral Resources exclusive of Mineral Reserves at Gruyere were primarily driven
by cost.
Granny Smith
The following graphic illustrates the location of the Granny Smith operations, including mining and exploration tenements, administrative
offices and processing plant.
Introduction
The Granny Smith Mine (GSM) is a production stage, underground gold mine owned by GSM Mining Company (Pty) Ltd., a wholly owned
subsidiary of Gold Fields. The mine is located 27 kilometres southwest of the town of Laverton in the Northern Goldfields of Western
Australia (latitude 28°51’09” S and longitude 122°18’35” E) and is accessible via the Mt. Weld Road. Laverton has a sealed road to Perth,
965 kilometres to the southwest, and Kalgoorlie, 375 kilometres to the south. Mining methods at Granny Smith include room and pillar,
bulk stopes and long-hole open stoping with paste-filled backfill and some room and pillar mining. The Granny Smith operation obtains
electricity from both a gas fired power station and a solar farm and has access to water, air and road infrastructure.
Granny Smith holds 76 exploration licences, prospecting licences and mining leases covering a total area of 77,353 hectares, including
21 miscellaneous and 54 non-managed tenements.
Operational infrastructure
The Wallaby open pit at Granny Smith commenced in 2001 and has systematically progressed to become an underground mine that
provides approximately 100% of the feed to the 3.5 Mt/a conventional Carbon in leach processing plant, which operates on a campaign
milling basis. Granny Smith has an annual major and critical item condition survey to focus reliability and minimise down time and has a
comprehensive maintenance strategy that includes owned regular equipment refurbishment or replacement. Granny Smith mine design
and scheduling include sustainable capital to support the remaining year LOM Mineral Reserve. Granny Smith has a predominantly
owner mining team that conduct mining operations and who are responsible for maintaining and modernising the mining fleet. Since
2014, the processing plant and critical surface infrastructure underwent a major upgrade post-acquisition. The present condition of the
property, and its equipment, facilities and infrastructure is fair. An 8MW solar farm was installed in 2020 and the village was upgraded
in 2022.
The site operates on a fly-in fly-out basis with variable rosters through Laverton with flights operating throughout the week.
For information on assets and liabilities (including costs after depreciation) of Granny Smith see “Annual Financial Report—Notes to
the Consolidated Financial Statements—Note 44. Segmental Report”. Granny Smith gold mine book value is U.S.$400 million. As at
31 December 2023, 819 workers were employed at Granny Smith, including 209 contractors.
Granny Smith did not receive any fines during the year ended 31 December 2023 and no significant encumbrances on the property exist.
The Granny Smith Norte mining concessions are renewed every 21 years and expire ranging from 2026 to 2045 and have an annual
fee of U.S.$0.4 million.
History
The Granny Smith deposits were discovered in 1979. In 1989, mining at Granny Smith commenced in the Granny Smith pit and
continued in subsequent years, with the development of a series of other open pits. In 1998, the Wallaby deposit was discovered
11 kilometres southwest of Granny Smith. In November 2001, the first Wallaby ore was delivered to the processing plant.
The Wallaby Open Pit was mined from October 2001 until December 2006. Underground mining at Wallaby commenced in December
2005 and is ongoing. Gold Fields acquired the mine in October 2013. Extensional exploration continues to define new Mineral
Reserves. Based on current underground Mineral Reserves from the Wallaby area, the LOM Mineral Reserve extends to 2034. The
attributable value of Gold Field’s ownership at Granny Smith was 100% for 2023.
Geology
Granny Smith is located in the Eastern Yilgarn Craton. At a regional scale, the geological terrain around the Laverton area is dominated
by the Mt. Margaret Dome in the northwest and the Kirgella Dome in the southeast. These domes are flanked to the east and west by
north-northwest-striking shear zones, and the central zone between the two domes is dominated by north to north-northeast-striking
sigmoidal shear zones. These distinctly different strikes to the shear zones developed early in the tectonic evolution of the area and
resulted in a favourable architecture for late-stage orogenic gold mineralisation. The Granny Smith lodes comprise vein stockworks
localised by a northerly trending shear at the margin of a granodiorite. The Wallaby lodes are flat lying alteration zones hosted within
magnetite amphibole altered conglomerate.
Mineral Reserves and Mineral Resources
Attributable Mineral Reserves of Granny Smith as at 31 December 2023
The following table sets out attributable Mineral Reserves of Granny Smith as at 31 December 2023. The Mineral Reserve gold price is
U.S.$1,400/oz and the point of reference is on the ROM.
| | | | | | |
| | |
| | | | | | |
| | | | | | |
| | | | | | |
| | | | | | |
Probable Mineral Reserves | | | | | | |
| | | | | | |
Attributable Mineral Reserve year on year change
The following table sets out attributable Mineral Reserves of Granny Smith as at 31 December 2023 compared to 31 December 2022.
| | | |
| | Proven and Probable Mineral Reserves |
| | | |
|
| | | |
| | | |
Production depletion (2023) | | | |
| | | |
| | | |
| | | |
| | | |
| | | |
| | | |
| | | |
| | | |
For the year ended 31 December 2023, changes in Mineral Reserves at Granny Smith were primarily driven by depletion, cost,
discovery and conversion.
Attributable Mineral Resources exclusive of Mineral Reserves of Granny Smith as at 31 December 2023
The following table sets out attributable Mineral Resources exclusive of Mineral Reserves of Granny Smith as at 31 December 2023.
The Mineral Resources gold price is U.S.$1,600/oz and the point of reference is diluted in situ.
| | | | | | |
| | |
| | | | | | |
| | | | | | |
| | | | | | |
Measured Mineral Resources | | | | | | |
Indicated Mineral Resources | | | | | | |
Total Measured and Indicated Mineral Resources | | | | | | |
Inferred Mineral Resources | | | | | | |
Attributable Mineral Resources exclusive of Mineral Reserves year on year change
The following table sets out attributable Mineral Resources exclusive of Mineral Reserves of Granny Smith as at 31 December 2023
compared to 31 December 2022.
| | | | | |
| | Measured and Indicated Mineral Resources | Inferred Mineral Resources |
| | | | | |
| | | | | |
| | | | | |
Production depletion (2023) | | | | | |
| | | | | |
| | | | | |
| | | | | |
| | | | | |
| | | | | |
| | | | | |
| | | | | |
| | | | | |
| | | | | |
For the year ended 31 December 2023, changes in Mineral Resources exclusive of Mineral Reserves at Granny Smith were primarily
driven by price, cost, discovery, Resource model updates and conversion of Mineral Resources to Mineral Reserves.
St. Ives
The following graphic illustrates the location of the St. Ives operations, including mining and exploration tenements, administrative
offices and processing plant
Introduction
St. Ives is a production stage mine comprising several open pits, two operating underground mines and Mineral Reserves stockpiles.
It is situated straddling Lake Lefroy in Western Australia (latitude 31º 19’ 12.6” S and longitude 121º 44’ 25.5” E) and is located by road
650 kilometres east of Perth, 75 kilometres south of Kalgoorlie and 20 kilometres south of Kambalda.
St. Ives is a production stage mine that currently has both surface and underground operations, with several open pits and two
operating underground mines incorporated into its LOM Mineral Reserve plan. Open pits are mined using conventional drill and blast in
the fresh rock with truck and shovel and the underground mines deploy long-hole stoping and paste/rock fill. St. Ives is transitioning to
becoming a predominantly underground operation, with the majority of the production expected to come from the Invincible
underground mining complex.
It holds exploration licences, prospecting licences, miscellaneous licences and mining leases covering a total area of 173,531 hectares
(including 54 non-managed leases totalling 13,224 hectares).
Operational infrastructure
St. Ives open pit mining and heap leach operation commenced in 1981, with the current processing facility at St. Ives commissioned in
2005. The current processing plant has a gravity circuit and consists of a primary gyratory crusher, followed by a single-stage semi-
autogenous grinding (SAG) mill with pebble crusher, gravity, leaching and carbon in pulp (CIP). The plant has a 4.7Mt/a name plate
throughput capacity. The present condition of the property, and its equipment, facilities and infrastructure is fair. St. Ives has its own
village, and the St. Ives operation obtains electricity pursuant to a contract with BHP Nickel-West and has access to water, air and road
infrastructure. Consumables and supplies are trucked in from both Perth and Kalgoorlie.
Since 1981, numerous open pits and underground mines have been mined with most open pits lasting between three months to
five years. With the exception of Athena-Hamlet mine, all the underground mines that have been mined since St. Ives commenced have
started as open pits before going underground. Current operations as at the 31 December 2023 consist of the Invincible and Hamlet
North underground mines as well as open pit mining in the Neptune – Revenge area.
For information on assets and liabilities (including costs after depreciation) of St. Ives see “Annual Financial Report—Notes to the
Consolidated Financial Statements—Note 44. Segmental Report”. The book value of St. Ives is U.S.$327 million. As at 31 December
2023, 1,129 workers were employed at St. Ives, including 531 contractors.
During the year ended 31 December 2023, St. Ives received fines in respect of three tenements that had not met their minimum
expenditure commitment. The fines totalled U.S.$8,524 and included fines for tenements sold or disposed of during 2023. As at
31 December 2023, no significant encumbrances to the property existed.
The St. Ives mining concessions are renewed every 21 years and expire ranging from 2025 to 2043 and have an annual fee of U.S.
$3.6 million.
History
Gold was discovered in the St. Ives area in 1897, with intermittent production until Western Mining Corporation (WMC) commenced
nickel and gold mining operations at St. Ives. Gold Fields acquired the St. Ives gold mining operation from WMC in November 2001.
Ongoing exploration near the mine and extensional areas continue to replace mining depletion and extend the LOM Mineral Reserve,
which is typical of the Archaean orogenic (shear zone) greenstone gold hosted gold camps, where St. Ives is located. The current LOM
Mineral Reserve extends to 2031.
Geology
The gold deposits of St. Ives are located at the southern end of the Norseman-Wiluna greenstone belt of the West Australian Goldfields
Province. In the St. Ives area, the belt consists of Kalgoorlie Group volcanic rocks, Black Flag group felsic volcanic rocks and sediments
and a variety of intrusive and overlying post-tectonic sediments. The area is structurally complex, with metamorphism ranging from
lower greenschist to lower amphibolite facies. Shear hosted gold mineralisation has been discovered in all stratigraphic units. Deposit
styles and ore controls are varied ranging from minor structures, including vein arrays, breccia zones and central, to quartz-rich and
mylonitic parts of shear zones. There are several styles of mineralisation at St. Ives including lode, supergene and paleoplacer
mineralisation and individual deposits may contain more than one of these styles.
•Lode mineralisation: Archaean lode mineralisation typically between 0.5m – 20m-wide mesothermal vein complexes that may also
have hydraulic breccias and/or mylonites. Mineralisation is typically discontinuous with short-range predictability
•Supergene mineralisation: Broad zones of flat-lying gold mineralisation in weathered Archaean and overlying tertiary sediments
•Palaeoplacer mineralisation: Placer deposits hosted by palaeochannels in the unconsolidated tertiary sediments that overlie the
Archaean basement
Mineral Reserves and Mineral Resources
Attributable Mineral Reserves of St. Ives as at 31 December 2023
The following table sets out attributable Mineral Reserves of St. Ives as at 31 December 2023. The Mineral Reserve gold price is U.S.
$1,400/oz and the point of reference is on the ROM.
| | | | | | |
| | |
| | | | | | |
| | | | | | |
| | | | | | |
| | | | | | |
Probable Mineral Reserves | | | | | | |
| | | | | | |
Attributable Mineral Reserve year on year change
The following table sets out attributable Mineral Reserves of St. Ives as at 31 December 2023 compared to 31 December 2022.
| | | | |
| | | Proven and Probable Mineral Reserves |
| | | | |
| |
| | | | |
| | | | |
Production depletion (2023) | | | | |
| | | | |
| | | | |
| | | | |
| | | | |
| | | | |
| | | | |
| | | | |
| | | | |
For the year ended 31 December 2023, changes in Mineral Reserves at St. Ives were primarily driven by depletion, cost, price and
discovery.
Attributable Mineral Resources exclusive of Mineral Reserves of St. Ives as at 31 December 2023
The following table sets out attributable Mineral Resources exclusive of Mineral Reserves of St. Ives as at 31 December 2023. The
Mineral Resources gold price is U.S.$1,600/oz and the point of reference is diluted in situ.
| | | | | | |
| | |
| | | | | | |
| | | | | | |
| | | | | | |
Measured Mineral Resources | | | | | | |
Indicated Mineral Resources | | | | | | |
Total Measured and Indicated Mineral Resources | | | | | | |
Inferred Mineral Resources | | | | | | |
Attributable Mineral Resources exclusive of Mineral Reserves year on year change
The following table sets out attributable Mineral Resources exclusive of Mineral Reserves of St. Ives as at 31 December 2023 compared
to 31 December 2022.
| | | | | | |
| | | Measured and Indicated Mineral Resources | Inferred Mineral Resources |
| | | | | | |
| | | | | | |
Production depletion (2023) | | | | | | |
| | | | | | |
| | | | | | |
| | | | | | |
| | | | | | |
| | | | | | |
| | | | | | |
| | | | | | |
| | | | | | |
| | | | | | |
For the year ended 31 December 2023, changes in Mineral Resources exclusive of Mineral Reserves at St. Ives were primarily driven by
price, cost and discovery.
Agnew
The following graphic illustrates the location of the Agnew operations, including mining and exploration tenements, administrative
offices and processing plant.
Introduction
Agnew is a production stage property owned by Agnew Gold Mining Company Pty Ltd (AGMC), and comprises the amalgamated
Agnew and (former) Lawlers mines. It is located 23 kilometres west of Leinster, approximately 390 kilometres north of Kalgoorlie and
850 kilometres northeast of Perth, Western Australia (latitude 28º00’39”S and longitude 120º30’59”E) and is accessible road and air.
Agnew currently operates two underground mines, namely Waroonga and New Holland. The primary mining method at Waroonga is
long-hole sub-level stoping with paste fill. The New Holland mining method depends on the geometry of the ore structure, with the
primary method being long-hole open-stoping. Barren Lands and Redeemer are included in this LOM. Extensional and near mine
exploration continues to generate new Mineral Reserves and extend the LOM Mineral Reserve which is currently to 2028.
Agnew holds exploration licences, prospecting licences and mining leases covering a total area of 71,944 hectares.
Operational infrastructure
Agnew East Murchison United (EMU) open pits commenced in 1986 and included the 1989 EMU conventional crushing, milling and
leach/CIP processing plant, and modern surface infrastructure. The processing plant currently has a capacity of approximately 1.3 to
1.5 Mt/a. The recent small, short life Waroonga open pit LOM Mineral Reserve commenced in 2003 and has systematically progressed
to become the predominant underground mine. Agnew has an annual major and critical item condition survey to focus reliability and
minimise down time and a comprehensive maintenance strategy that includes regular equipment refurbishment or replacement. Agnew
mine design and scheduling include sustainable capital to support the remaining years of the LOM Mineral Reserve. Agnew has owner
operator and contractor mining operations and who are responsible for maintaining and modernising the mining fleet. The present
condition of the property, and its equipment, facilities and infrastructure is fair. A new crusher was installed, and the village was
expanded in 2022. Mining of the Barren Lands open pit with underground development began in 2023.
Agnew has one metallurgical plant in operation and is serviced by sealed road infrastructure to the mine gate. Supplies are generally
trucked in from Perth or Kalgoorlie. Agnew is a fly-in fly-out operation with local services and external accommodation including air
transport with a sealed runway. A new mine owned camp was completed in 2019, which accommodates the mine employees and
contractors, which are typically sourced from Perth. The bulk of the water is supplied from the mining operations and recovered from
the in-pit tailings facility and previously mined pits. In 2020, a hybrid renewable power plant was commissioned, including solar, wind
turbine, gas generator, battery power storage and diesel back-up power solutions. This power plant is operational and continues to
supply power to the operation.
For information on assets and liabilities (including costs after depreciation) of Agnew see “Annual Financial Report—Notes to the
Consolidated Financial Statements—Note 44. Segmental Report”. Agnew has a book value is U.S.$294 million. As at 31 December
2023, 800 workers were employed at Agnew, including 486 contractors.
There are no significant encumbrances to the property or Agnew’s ability to execute the LOM plan from a current or future anticipated
permitting perspective. The Agnew mining concessions are renewed every 21 years and expire in ranging from 2026 to 2044 and have
an annual fee of U.S.$1.0 million.
History
Gold was discovered at the Agnew mine in 1895 and production was intermittent until WMC acquired the operation for exploration
purposes in 1976 and commenced mining the EMU open pit in 1986 and constructed the processing plant in the same year. Since
that time, numerous open pits and underground operations have been mined. During 2001, Gold Fields acquired the Agnew mine
from WMC.
Gold was discovered around the same time at the Lawlers mine. In 1984, Forsayth NL purchased the Great Eastern lease and
constructed the Lawlers mine’s processing plant (the Lawlers Mill). Mechanised open pit mining commenced in 1986. The New Holland
open pit commenced in 1995 with underground mining commencing in 1998, and Barrick acquired Lawlers mine in 2001 as part of its
merger with Homestake. In 2013, Gold Fields purchased Lawlers from Barrick and the Lawlers Mill was placed on care and maintenance
and eventually removed and rehabilitated in 2021. The New Holland underground mine has been incorporated into Agnew since the
2013 acquisition. The attributable value of Gold Field’s ownership at Agnew was 100% for 2023.
Geology
Agnew’s gold deposits are located within the northwest portion of the Norseman-Wiluna greenstone belt of the Western Australian
Goldfields. This greenstone belt consists of an older sequence of ultramafic flows, gabbro’s, basalts, felsic volcanic and related
sedimentary rocks. The rocks are folded about the large, moderately north plunging Lawlers Anticline. The Agnew mine’s deposits are
located on the western limb of this anticline, and major deposits discovered to date lie on sheared contacts between stratigraphic units.
The anticline is cut by north-northeast trending faults such as the Waroonga and East Murchison Unit shear zones. The Lawlers mine
deposits occur along the eastern limb of the Lawlers Anticline with the main Genesis-New Holland deposit located within the Scotty
Creek Sediments west of Waroonga.
Mineral Reserves and Mineral Resources
Attributable Mineral Reserves of Agnew as at 31 December 2023
The following table sets out Mineral Reserves of Agnew as at 31 December 2023. The Mineral Reserve gold price is U.S.$1,400/oz and
the point of reference is on the ROM.
| | | | | | |
| | |
| | | | | | |
| | | | | | |
| | | | | | |
| | | | | | |
Probable Mineral Reserves | | | | | | |
| | | | | | |
Attributable Mineral Reserve year on year change
The following table sets out attributable Mineral Reserves of Agnew as at 31 December 2023 compared to 31 December 2022.
| | | | |
| | | Proven and Probable Mineral Reserves |
| | | | |
| |
| | | | |
| | | | |
Production depletion (2023) | | | | |
| | | | |
| | | | |
| | | | |
| | | | |
| | | | |
| | | | |
| | | | |
| | | | |
For the year ended 31 December 2023, changes in Mineral Reserves at Agnew were primarily driven by depletion.
Attributable Mineral Resources exclusive of Mineral Reserves of Agnew as at 31 December 2023
The following table sets out Mineral Resources exclusive of Mineral Reserves of Agnew as at 31 December 2023. The Mineral
Resources gold price is U.S.$1,600/oz and the point of reference is diluted in situ.
| | | | | | |
| | |
| | | | | | |
| | | | | | |
| | | | | | |
Measured Mineral Resources | | | | | | |
Indicated Mineral Resources | | | | | | |
Total Measured and Indicated Mineral Resources | | | | | | |
Inferred Mineral Resources | | | | | | |
Attributable Mineral Resource exclusive of Mineral Reserves year on year change
The following table sets out attributable Mineral Resources exclusive of Mineral Reserves of Agnew as at 31 December 2023 compared
to 31 December 2022.
| | | | | | | |
| | | | Measured and Indicated Mineral Resources | Inferred Mineral Resources |
| | | | | | | |
| | | | | | | |
| | | | | | | |
Production depletion (2023) | | | | | | | |
| | | | | | | |
| | | | | | | |
| | | | | | | |
| | | | | | | |
| | | | | | | |
| | | | | | | |
| | | | | | | |
| | | | | | | |
| | | | | | | |
For the year ended 31 December 2023, changes in Mineral Resources exclusive of Mineral Reserves at Agnew were primarily driven by
price and Resource model updates.
South Africa operations
South Deep Mine
The following graphic illustrates the location of the South Deep operations, including tenements, administrative buildings, security
complex, living quarters, hostel, processing plants and tailings dams.
Introduction
South Deep is a production stage, deep-level underground gold mine. It is situated 70 kilometres southwest of the Johannesburg, in
the Gauteng Province of South Africa (latitude 26˚ 25’ 00” S and longitude 27˚ 39’ 45”E), accessible via the N12 provincial road between
Johannesburg and Potchefstroom. Since 2019, South Deep has recalibrated its operating model via an organisational restructuring and
modernisation focus that has included a reset of the production ramp-up schedule until the late 2020s. The ramp up is expected to
remove constraints and de-bottle necks as production increases. South Deep uses trackless mechanised bulk mining methods
comprising an array of techniques and mobile equipment. All personnel and material conveyance enters the mine via the main
“Twin Shaft”. South Deep converted its old order mining right to new order mining rights in July 2010, which is valid until 2040, as
required by the MPRDA. Under the new order mining rights, South Deep operates under a mining lease with a total area of 4,268
hectares. There is no licence fee payable for the new order mining lease licence.
South Deep’s total Mineral Reserve estimate comprises 2% located in Current Mine, 24% in North of Wrench and 73% in South of
Wrench areas.
Operational infrastructure
South Deep’s twin shafts are the main access to the LOM Mineral Reserve estimate with shaft sinking and underground development
commenced in the early 1990s. The surface infrastructure dates to the early 1990s. South Deep has progressed with modern mining
industry mechanisation and modernisation. South Deep has an annual major and critical item condition survey to focus on reliability and
minimise shaft down time. South Deep has a comprehensive maintenance strategy that includes regular underground support,
equipment refurbishment or replacement. South Deep mine design and scheduling includes sustainable capital to support the
remaining 73-year LOM Mineral Reserve and extends to 2096. The present condition of the property, and its equipment, facilities and
infrastructure is fair.
For information on assets and liabilities (including costs after depreciation) of South Deep see “Annual Financial Report—Notes to the
Consolidated Financial Statements—Note 44. Segmental Report”. The book value of South Deep is U.S.$1,109 million. As at 31
December 2023, 5,156 workers were employed at South Deep, including 2,574 contractors.
South Deep commissioned a 50 MW solar farm in 2022 with a further study underway to increase the renewable energy footprint
through the integration of wind turbines.
South Deep’s workings are at depth and therefore require comprehensive ground support mechanisms to mitigate the risk of
production interruptions from potential seismicity, backfilling to support mined out voids and major cooling infrastructure. The South
Deep mine has access to the national electricity grid, regional water and road infrastructure and is located near regional urban centres
where it can obtain needed supplies and services. South Deep is in the heart of the South African gold mining infrastructure network
with well-established road access.
South Deep is divided into three principal areas, comprising:
•the “Current Mine” (CM) area, which is characterised by selective mining methods scattered over a large area and is accessed from
four active levels from both the South Shaft and Twin Shaft complexes;
•the “North of Wrench” (NOW) area, which is directly south and down dip of the “Current Mine” and comprises six mining corridors
separated by regional pillars. A bulk mining and less selective mining method is applied in this area, resulting in a higher resource to
reserve conversion ratio; and
•the “South of Wrench” (SOW) area, which is situated south and down dip of NOW separated by a major up-dipping Wrench Fault from
SOW, will be mined in the same manner as the NOW,
•All the Mineral Reserves and Mineral Resources are above access infrastructure.
South Deep received no fines during the year ended 31 December 2023 and no significant encumbrances to the property exist. Two
Section 55 instructions were issued with regard to compliance with the Mine Health and Safety Act (as defined below) and no Section
93 notice was issued in 2023 relating to compliance with the MPRDA.
History
The current South Deep operations derive from the Barrick-Western Areas Joint Venture, which Gold Fields acquired in a series of
transactions in the second half of 2007. The Barrick-Western Areas Joint Venture was renamed the South Deep Joint Venture
(South Deep Joint Venture). In 2011, Newshelf 899 (Pty) Ltd (Newshelf) was established as the holding company of the South Deep
Joint Venture. Newshelf is a 90% subsidiary of Gold Fields and the remaining 10% is held by outside shareholders as part of the black
economic empowerment transaction. The LOM Mineral Reserve estimate of South Deep extends to 2096. The attributable value of
Gold Field’s ownership at South Deep was 90.331% for 2023.
Geology
South Deep is located along the northern and western margins of the Witwatersrand Basin, which has been the primary contributor to
South Africa’s production and a significant portion of the world’s recorded gold output since 1886.
Gold mineralisation at South Deep is hosted by conglomerates of the Upper Elsburg reefs and the Ventersdorp Contact Reef (VCR).
The Upper Elsburg reefs sub-crop against the VCR in a north-easterly trend, which defines their western limits. To the east of the sub-
crop, the Upper Elsburg reefs are preserved in an easterly diverging sedimentary wedge attaining a total thickness of approximately
120 metres, which is subdivided into the lower “Individuals” and the overlying “Massives” to the west of the sub-crop, only the VCR is
preserved.
The stratigraphic units at South Deep generally dip southward at approximately 12 to 15 degrees and the gold-bearing reefs occur at
depths of 1,500 metres to 3,500 metres below surface. In general, the gold mineralisation hosted by the conglomerates is laterally
continuous with long range predictability and clear patterns of predictable mineralisation governed by sedimentary characteristics.
Production at South Deep is currently derived from the Upper Elsburg Reefs. In general terms, the Upper Elsburg succession represents
an easterly prograding sedimentary sequence, with the Massives containing higher gold grades and showing more proximal
sedimentological attributes in the eastern sector of the mining authorisation than the underlying individuals. The sedimentary
characteristics of the Upper Elsburg reef units influence the overall tenor of the reefs with gold grade displaying a gradual, but general
decrease toward the east, away from the sub crop.
The North-South trending “normal” West Rand and Panvlakte faults, which converge on the Western side of the lease area, are the
most significant large-scale faults in the area and form the western limit to gold mineralisation for the mine.
Mineral Reserves and Mineral Resources
Attributable Mineral Reserves of South Deep as at 31 December 2023
The following table sets out attributable Mineral Reserves of South Deep as at 31 December 2023. The Mineral Reserve gold price is
U.S.$1,400/oz and the point of reference is on the ROM.
| | | | | | |
| | |
| | | | | | |
| | | | | | |
| | | | | | |
| | | | | | |
Probable Mineral Reserves | | | | | | |
| | | | | | |
Attributable Mineral Reserve year on year change
The following table sets out attributable Mineral Reserves of South Deep as at 31 December 2023 compared to 31 December 2022.
| | | | |
| | | Proven and Probable Mineral Reserves |
| | | | |
| |
| | | | |
As at 31 December 2022(1) | | | | |
Production depletion (2023) | | | | |
| | | | |
| | | | |
| | | | |
| | | | |
| | | | |
| | | | |
| | | | |
As at 31 December 2023(2) | | | | |
Notes:
1.At 90.4439%.
2.At 90.331%.
For the year ended 31 December 2023, changes in Mineral Reserves at South Deep were primarily driven by depletion, price and cost.
Attributable Mineral Resources exclusive of Mineral Reserves of South Deep as at 31 December 2023
The following table sets out attributable Mineral Resources exclusive of Mineral Reserves of South Deep as at 31 December 2023.The
Mineral Resources gold price is U.S.$1,600/oz and the point of reference is diluted in situ.
| | | | | | |
| | |
| | | | | | |
| | | | | | |
| | | | | | |
Measured Mineral Resources | | | | | | |
Indicated Mineral Resources | | | | | | |
Total Measured and Indicated Mineral Resources | | | | | | |
Inferred Mineral Resources | | | | | | |
Attributable Mineral Resource exclusive of Mineral Reserves year on year change
The following table sets out attributable Mineral Resources exclusive of Mineral Reserves of South Deep as at 31 December 2023
compared to 31 December 2022.
| | | | | | |
| | | Measured and Indicated Mineral Resources | Inferred Mineral Resources |
| | | | | | |
| | | | | | |
As at 31 December 2022(1) | | | | | | |
Production depletion (2023) | | | | | | |
| | | | | | |
| | | | | | |
| | | | | | |
| | | | | | |
| | | | | | |
| | | | | | |
| | | | | | |
| | | | | | |
As at 31 December 2023(2) | | | | | | |
Notes:
1.At 90.4439%.
2.At 90.331%.
For the year ended 31 December 2023, changes in Mineral Resources exclusive of Mineral Reserves at South Deep were primarily
driven by price and cost.
Ghana operations
Tarkwa Mine
The following graphic illustrates the location of the Tarkwa Mine operations, including tenements, administrative offices and
processing plant.
Introduction
The Tarkwa mine is a production-stage gold mine located in southwestern Ghana, about 300 kilometres west of Accra, the capital, and
4km west of the town of Tarkwa (latitude 5°19’37” N and longitude 2°01’17” W) with good access roads and established infrastructure.
The Tarkwa mine consists of several open pit operations on the original Tarkwa property and the adjacent southern portion of the
property, which was formerly referred to as the Teberebie property and was acquired by Gold Fields in August 2000. The open pit
mining operations uses conventional drill and blast and truck and shovel methods using contractor mining. Gold Fields operates the
mine with a conventional carbon in leach plant, with two gyratory crushers feeding a SAG mill and ball mill.
The Tarkwa mine operates under mining leases with a total area of 19,866 hectares, the entirety of which are for surface operations and
excluding the overlapping area between Damang and Tarkwa. Adjustments to the licensed area are the result of the cadastral system
revisions.
Operational infrastructure
The Tarkwa open pit commenced in 1999 with south and north heap leach and later included the 13.5 Mtpa CIL processing plant and
modern surface infrastructure. Tarkwa has an annual major and critical item condition survey to focus reliability and minimise down time
and a comprehensive maintenance strategy that includes regular equipment refurbishment or replacement. The Tarkwa mine design
and scheduling include sustainable capital to support the remaining LOM Mineral Reserve. Tarkwa has contractors that conduct mining
operations and who are responsible for maintaining and modernising the mining fleet. The present condition of the property, and its
equipment, facilities and infrastructure is in mid-life condition.
Gold Fields processes the ex-pit mined ores through a conventional gold recovery plant, which consists of two parallel crushing circuits
(a single primary gyratory crusher and a separate gyratory/cone tertiary crushing circuit), both feeding a single SAG, ball mill and pebble
crusher (SABC) grinding circuit, together with gravity and CIL gold recovery circuits. The current plant capacity is 13.5 Mtpa, however,
treatment of 14.0 Mtpa was achieved due to various de-bottlenecking projects.
The Tarkwa mine completed its transition from the national grid to an independent power producer, Genser Energy, during 2018.
Genser Energy commissioned the last of the units at its Tarkwa gas plant in February 2018 and now supplies 42MW of energy at
Tarkwa, which accounts for 95% of its total electricity consumption, with additional capacity available as a back-up. The remaining 5%
is supplied by GRIDCO/VRA. The Tarkwa mine has access to water, road and railway infrastructure, although rail service has been non-
operational for many years. Most supplies are trucked in from either the nearest seaport, which is approximately 90 kilometres away by
road at Takoradi, or from Tema, near Accra, which is approximately 300 kilometres away by road.
For information on assets and liabilities (including costs after depreciation) of Tarkwa see “Annual Financial Report—Notes to the
Consolidated Financial Statements—Note 44. Segmental Report”. The book value of Tarkwa is U.S.$817 million. As at 31 December
2023, 5,119 workers were employed at Tarkwa, including 4,553 contractors.
During the year ended 31 December 2023, Tarkwa received two penalties due to non-compliance in appointing a relieving general
manager and following a fatality incident. The penalties totalled U.S.$30,000. The Tarkwa mining concessions expire from 2027 to
2036 and have a total annual fee of U.S.$946,000.
History
Investment in large-scale mining in the Tarkwa area commenced in the last quarter of the nineteenth century. In 1993, Gold Fields took
over an area previously operated by the State Gold Mining Corporation (SGMC). SGMC had, in turn, acquired the property from private
companies owned by European investors. Mining operations by Gold Fields commenced in 1999 following initial drilling, feasibility
studies and project development (which included the removal of overburden and the resettlement of approximately 22,000 people).
In 2018, Tarkwa reverted to a contractor mining model. The Tarkwa LOM Mineral Reserve extends to 2035.
The attributable value of Gold Field’s ownership at Tarkwa was 90% for 2023. The Government of Ghana has a 10% free carried interest
in the mine.
Geology
Gold mineralisation at Tarkwa is hosted by Proterozoic Tarkwaian metasediments, which unconformity overlie a Birimian greenstone
belt sequence. Gold mineralisation is concentrated in conglomerate reefs and has some similarities to deposits in the Witwatersrand
Basin in South Africa. The deposit comprises a succession of stacked, tabular palaeoplacer units consisting of quartz pebble
conglomerates. Approximately ten such separate economic units occur in the concession area within a sedimentary package ranging
from 40 metres to 110 metres in thickness. Low-grade to barren quartzite units are interlayered between the individual reef units. The
Tarkwaian belt has been subject to moderate folding and at least five episodes of deformation have been recognised.
Mineral Reserves and Mineral Resources
In March 2023, Gold Fields announced it had reached agreement with AngloGold Ashanti to form a joint venture through the
consolidation of the Tarkwa and neighbouring Iduapriem mines. This would result in 60% attributable ownership to Gold Fields of the
combined entity, with AngloGold holding 30% and the Government of Ghana retaining its 10% free carried interest. The joint venture
remains subject to the approval of the Government of Ghana and those negotiations are ongoing. The Mineral Reserves and Mineral
Resources disclosed here are for a standalone Tarkwa mine.
Attributable Mineral Reserves of Tarkwa as at 31 December 2023
The following table sets out attributable Mineral Reserves of Tarkwa as at 31 December 2023. The Mineral Reserve gold price is U.S.
$1,400/oz and the point of reference is on the ROM.
| | | | | |
| |
| | | | | |
| | | | | |
| | | | | |
| | | | | |
Probable Mineral Reserves | | | | | |
| | | | | |
Attributable Mineral Reserve year on year change
The following table sets out attributable Mineral Reserves of Tarkwa as at 31 December 2023 compared to 31 December 2022.
| | | | | |
| | Proven and Probable Mineral Reserves |
| | | | | |
| | | | | |
| | | | | |
Production depletion (2023) | | | | | |
| | | | | |
| | | | | |
| | | | | |
| | | | | |
| | | | | |
| | | | | |
| | | | | |
| | | | | |
For the year ended 31 December 2023, changes in Mineral Reserves at Tarkwa were primarily driven by depletion.
Attributable Mineral Resources exclusive of Mineral Reserves of Tarkwa as at 31 December 2023
The following table sets out attributable Mineral Resources exclusive of Mineral Reserves of Tarkwa as at 31 December 2023.The
Mineral Resources gold price is U.S.$1,600/oz and the point of reference is diluted in situ.
| | | | | | |
| | |
| | | | | | |
| | | | | | |
| | | | | | |
Measured Mineral Resources | | | | | | |
Indicated Mineral Resources | | | | | | |
Total Measured and Indicated Mineral Resources | | | | | | |
Inferred Mineral Resources | | | | | | |
Attributable Mineral Resources exclusive of Mineral Reserves year on year change
The following table sets out attributable Mineral Resources exclusive of Mineral Reserves of Tarkwa as at 31 December 2023 compared
to 31 December 2022.
| | | | | | | |
| | | Measured and Indicated Mineral Resources | Inferred Mineral Resources |
| | | | | | | |
| | | | | | | |
| | | | | | | |
Production depletion (2023) | | | | | | | |
| | | | | | | |
| | | | | | | |
| | | | | | | |
| | | | | | | |
| | | | | | | |
| | | | | | | |
| | | | | | | |
| | | | | | | |
| | | | | | | |
For the year ended 31 December 2023, changes in Mineral Resources exclusive of Mineral Reserves at Tarkwa were primarily driven
by price.
Chile operations
Salares Norte gold and silver mine
The following graphic illustrates the location of the Salares Norte gold and silver mine, including mining and exploration tenements,
administrative offices and processing plant.
Introduction
Salares Norte is a high grade, open pit, gold-silver development stage property (early production-stage) project located in the Atacama
region of northern Chile. The project is at latitude 26°0’42”S and longitude 68°53’35”W, with elevations between 4,200 metres and
4,900 metres above sea level. The nearest town is Diego de Almagro, about 183 kilometres by road to the west of the project.
Mineralisation is contained within a high-sulphidation epithermal system hosted by a breccia complex, and most of the mineralisation
currently constituting Mineral Reserves is oxidised. The construction phase was completed in the second quarter of 2024, after which
the mine will complete commissioning and is expected to commence gold and silver production in April 2024.
Minera Gold Fields Salares Norte SpA (MGFSN) holds 22,800 hectares of exploitation concessions (mining rights) with definitive title
granted including 1,800 hectares covering the project area. MGFSN holds 69,700 hectares of additional exploration concessions and
an option agreement with Pan Pacific Copper Exploration Chile Ltda. covering 2,200 hectares (comprised of 300 hectares of mining
concessions and 1,900 hectares of exploration concessions) to the northwest of Salares Norte. MGFSN also holds an option agreement
with Chilean private owners covering 2,500 hectares. The Salares Norte gold and silver mine comprised of 900 hectares of mining
concessions and 1,600 hectares of exploration concessions 40 km southeast of Salares Norte. This is a total of 97,200 hectares.
Operational infrastructure
Salares Norte open pit waste strip commenced in 2021 and ore was accessed in 2022. Mining continued in 2023 with waste storage at
88.3 Mt and ore stockpiles at 2.3 Mt. Construction of the 2.0 Mt/a cyanide leaching with Merrill-Crowe recovery from pregnant solution
after CCD, followed by a scavenger CIP circuit processing plant, and modern surface infrastructure is currently in its final stages. Salares
Norte has implemented mining industry mechanisation and modernisation techniques and expects to continue utilizing modern
equipment. Salares Norte has an annual major and critical item condition survey to focus reliability and minimise down time. Salares
Norte has a comprehensive maintenance strategy that includes owned regular equipment refurbishment or replacement. Salares Norte
mine design and scheduling include sustainable capital to support the remaining year LOM reserve estimate. Salares Norte has
contractors that conduct mining operations and who are responsible for maintaining and modernising the mining fleet. The present
condition of the property, and its equipment, facilities and infrastructure are new, modern condition, and includes a modern remote
operating centre in Santiago.
Salares Norte is accessed from Caldera on the Pacific coast through a series of sealed and unsealed roads. Caldera has a regional
airport with regular scheduled flights. Personnel working on the operation reside on site in a mining camp. Water is sourced from a local
bore field and power is generated on site using diesel generators.
For information on assets and liabilities (including costs after depreciation) of Salares Norte see “Annual Financial Report—Notes to
the Consolidated Financial Statements—Note 44. Segmental Report”. The book value of Salares Norte is U.S.$1,300 million. As at
31 December 2023, 469 workers were employed at Salares Norte.
Surface properties at Salares Norte are subject to certain concessions to facilitate convenient and unrestricted exploration and
operation. As a result, third-parties may be able to establish mining easements on MGFSN’s concessions at Salares Norte provided that
their objective is to contribute to a convenient exploration and operation. While a third party could legally apply for a mining easement
over Gold Fields’ mining concession, they would have to comply with several requirements and Gold Fields has the right to oppose
such application. MGFSN continues to endeavour to establish a secure area that allows for the protection of the Salares Norte property.
District exploration to identify other deposits in the area with the potential to extend or enhance the LOM plan is ongoing. Other
encumbrances or regulatory requirements include the EIA highlighted the alteration and loss of habitat of the short-tailed chinchilla,
which is a critically endangered species in Chile. To mitigate such impact, a plan was developed and approved by the EIA authorities.
The plan involves establishing a compensation and conservation area outside the mining area, declaring no-go zones and relocating a
small fraction of the chinchilla population that lives in future mining zones.
The Salares Norte mining concessions only expire in the event the annual fee is not paid in a timely manner. This annual fee is
approximately U.S.$15,000.
History
Gold Fields discovered the Salares Norte mineralisation in March 2011. Follow-up diamond drilling in late 2011 confirmed the presence
of a high-grade oxide deposit of sufficient size and quality to warrant aggressive resource delineation drilling. In 2016, a land easement
for 30 years and water rights for the project were both granted.
Between 2017 and 2018, Gold Fields completed pre-feasibility and interim feasibility studies at the Brecha Principal and Agua Amarga
deposits. Preliminary indications suggested the Salares Norte project could be an open pit mine, while metallurgical test work
suggested that hybrid carbon in leach processing could deliver recovery rates of around 91% for gold. A definitive feasibility study was
completed in 2018, including advancement of an optimised mine plan for the combined Brecha Principal and Agua Amarga deposits.
An EIA at Salares Norte was approved in December 2019, together with an environmental mitigation plan, comprising studies and
specific protection measures (relocation programme) of the endangered short-tailed chinchilla in the area. At the end of 2020, the
relocation programme was suspended by the authorities and a sanctioning process was subsequently initiated in 2021, following the
death of two chinchillas relocated under the programme. In response, Salares Norte submitted a compliance programme to the
authorities for approval during December 2021. MGFSN obtained approval of the compliance programme in 2023 in order to resume
relocation activities in the first quarter of 2024.
Salares Norte is 100% owned by Gold Fields through its shareholding in MGFSN.
Geology
The Salares Norte project is located in the northern part of the Maricunga Belt, an area with a predominance of Cenozoic volcanic
rocks, comprising eroded strato-volcanos, volcanic domes and pyroclastic rocks. Mineralisation at the Salares Norte project is
contained in a high-sulphidation epithermal system, hosted mainly by a breccia complex along the contact of two volcanic domes of
andesitic and dacitic composition. Mineral Resources have been delineated by drilling in two separate deposits, Brecha Principal and
Agua Amarga, which are located about 500 metres apart. Most of the mineralisation known to date is oxidised. The sulphide
mineralisation contains mainly pyrite. Gold Fields continues to explore the area around the Salares Norte project for potential new ore
sources to supplement or extend the current LOM Reserve to 2033.
Mineral Reserves and Mineral Resources
Attributable Mineral Reserves of Salares Norte as at 31 December 2023
The following tables set out attributable Mineral Reserves of Salares Norte as at 31 December 2023. The Mineral Reserve gold price is
U.S.$1,400/oz, silver price is U.S.$17.50/oz and the point of reference is on the ROM.
Attributable Gold Reserves as at 31 December 2023
| | | | | | |
| | |
| | | | | | |
| | | | | | |
| | | | | | |
| | | | | | |
Probable Mineral Reserves | | | | | | |
| | | | | | |
Attributable Silver Reserves as at 31 December 2023
| | | | | |
| |
| | | | | |
| | | | | |
| | | | | |
| | | | | |
Probable Mineral Reserves | | | | | |
| | | | | |
Attributable Mineral Reserve estimate year on year change
The following tables set out attributable Mineral Reserves of Salares Norte as at 31 December 2023 compared to 31 December 2022.
Attributable Gold Reserves year on year change
| | | | |
| Proven and Probable Mineral Reserves |
| | | | |
| | | | |
| | | | |
Production depletion (2023) | | | | |
| | | | |
| | | | |
| | | | |
| | | | |
| | | | |
| | | | |
| | | | |
| | | | |
For the year ended 31 December 2023, changes in Gold Mineral Reserves at Salares Norte were primarily driven by conversion of in pit
reserves (depletion) to stockpile reserves (inclusion). Minor differences between depletion and inclusion result from grade control
drilling and updated geological models. No ore was processed in 2023.
Attributable Silver Reserves year on year change
| | | | |
| Proven and Probable Mineral Reserves |
| | | | |
| | | | |
| | | | |
Production depletion (2023) | | | | |
| | | | |
| | | | |
| | | | |
| | | | |
| | | | |
| | | | |
| | | | |
| | | | |
For the year ended 31 December 2023, changes in Silver Mineral Reserves at Salares Norte were primarily driven by conversion of in
pit reserves (depletion) to stockpile reserves (inclusion).
Attributable Mineral Resources exclusive of Mineral Reserves of Salares Norte as at 31 December 2023
The following tables set out attributable Mineral Resources exclusive of Mineral Reserves of Salares Norte as at 31 December 2023.
The Mineral Resources exclusive of Mineral Reserves gold price is U.S.$1,600/oz, silver price is U.S.$20.00/oz and the point of
reference is diluted in situ.
Attributable Gold Resources exclusive of Gold Reserves as at 31 December 2023
| | | | | | |
| | |
| | | | | | |
| | | | | | |
| | | | | | |
Measured Mineral Resources | | | | | | |
Indicated Mineral Resources | | | | | | |
Total Measured and Indicated Mineral Resources | | | | | | |
Inferred Mineral Resources | | | | | | |
Attributable Silver Resources exclusive of Silver Reserves as at 31 December 2023
| | | | | | |
| | |
| | | | | | |
| | | | | | |
| | | | | | |
Measured Mineral Resources | | | | | | |
Indicated Mineral Resources | | | | | | |
Total Measured and Indicated Mineral Resources | | | | | | |
Inferred Mineral Resources | | | | | | |
Attributable Mineral Resource exclusive of Mineral Reserves year on year change
The following tables set out attributable Mineral Resources exclusive of Mineral Reserves of Salares Norte as at 31 December 2023
compared to 31 December 2022.
Attributable Gold Resources exclusive of Gold Reserves year on year change
| | | | | | | |
| | | Measured and Indicated Mineral Resources | Inferred Mineral Resources |
| | | | | | | |
| | | | | | | |
| | | | | | | |
Production depletion (2023) | | | | | | | |
| | | | | | | |
| | | | | | | |
| | | | | | | |
| | | | | | | |
| | | | | | | |
| | | | | | | |
| | | | | | | |
| | | | | | | |
| | | | | | | |
For the year ended 31 December 2023, changes in Gold Mineral Resources at Salares Norte were primarily driven by depletion through
conversion of Mineral Resources to Stockpile Mineral Reserves or placed as waste following evaluation during grade control.
Attributable Silver Resources exclusive of Silver Reserves year on year change
| | | | | | |
| | Measured and Indicated Mineral Resources | Inferred Mineral Resources |
| | | | | | |
| | | | | | |
| | | | | | |
Production depletion (2023) | | | | | | |
| | | | | | |
| | | | | | |
| | | | | | |
| | | | | | |
| | | | | | |
| | | | | | |
| | | | | | |
| | | | | | |
| | | | | | |
For the year ended 31 December 2023, changes in Silver Mineral Resources at Salares Norte were primarily driven by depletion
through conversion of Mineral Resources to Stockpile Mineral Reserves or placed as waste following evaluation during grade control.
Projects
Windfall Project (Not material to Gold Fields)
The following graphic illustrates the location of the Windfall gold and silver project, including tenements, administrative offices and
infrastructure. Windfall is in new, modern condition and is a development stage, gold and silver mining project.
Introduction
In 2023, Gold Fields announced that it had entered into a 50/50 joint venture with Osisko Mining Inc. for the joint ownership and
development of the Windfall project through Windfall Mining Group, an incorporated joint venture. The Windfall project is located in the
Abitibi greenstone belt, Urban Township, Eeyou Istchee James Bay, Québec, Canada. It is located 700 kilometres north-northwest of
Montréal, 200 kilometres northeast of Val-d’Or and 115 kilometres east of Lebel-sur-Quévillon (latitude 49°04’18” N and longitude
75°39’03” W). The Windfall project falls within the traditional territory of the Cree First Nation of Waswanipi.
The Windfall project has existing underground infrastructure based on current exploration activities, with development planned and
budgeted into 2024. However, a decision to proceed with construction has not been made and is subject to the approval of an EIA
by Quebec regulators, as well as final investment decision by the joint venture parties.
Operational Infrastructure
The Windfall project has three primary zones: Lynx (Lynx zone), Main and Underdog (Main zone). The Main zone is the western portion
of the planned mining area and the Lynx zone is the eastern portion. The zones are accessed by three ramp systems, with two surface
portals for transportation and material haulage. The ramps and level accesses (up to the vent raise access) will allow the passage of
haulage trucks as well as secondary ventilation ducting and service piping. The present condition of the property, and its equipment,
facilities and infrastructure is reasonably new.
The Windfall area is serviced by a complete network of well-maintained logging roads and hosts several infrastructure components
at the Windfall property including an exploration camp with a capacity for 300 people. The Windfall site also has surface water
management ditches, ponds, pumping stations, water treatment plants and exhaust raise with primary ventilation fans have been
constructed. Power is supplied via a power line that provides 100% hydroelectric power to the site.
The Windfall project contains three lease agreements, including one industrial lease agreement for the ramp area, another industrial
lease agreement for the camp area and a mine waste storage lease. Windfall is comprised of 325 individual claims covering an
aggregate area of 14,299 hectares.
History
The Windfall project was subject to several grassroots exploration programmes undertaken by various companies from the 1943 to
2009, with no historical resource estimates or production from that period. From 2009 to 2014 Eagle Hill Exploration conducted
renewed exploration activities, producing three Mineral Resource Estimates (MREs) and a preliminary economic assessment (PEA) on
the property. From 2018 to 2022, four MREs and two PEAs were produced based on exploration activities conducted by Osisko.
In 2021, Urban-Barry and Windfall Exploration drilling programme was conducted, which initially visited seven main areas, namely Bank
Extension, Windfall SW, Fold, Fox, Golden Bear (formerly known as Cross Fault), Windfall West and WUDZ. The second part of the
programme focused on the newly discovered Golden Bear prospect.
As of 2 May 2023, the surface drill programme ended and resulted in Osisko completing 1,869,441 meters of drilling on the Windfall
project. Since then, an additional 80,192 meters of drilling has been completed.
Geology
The Urban-Berry greenstone belt contains mixed mafic to felsic volcanic rock with lesser sedimentary deposits cross-cut by several
east and east-northeast trending deformation zones. The Windfall property is located along the Mazères deformation zone, a regional
scale east-northeast trending ductile deformation zone interpreted to be a second-order structure to the east-west Urban
deformation zone.
Mineral Reserves and Mineral Resources
As the project remains subject to certain closing conditions, including EIA approval by Quebec regulators, a qualified person has not
done sufficient work to classify the estimate as a current estimate of mineral resources, mineral reserves or exploration results pursuant
to Item 1300 of Regulation S-K. Gold Fields is currently collecting the data and conducting the test work required to prepare a S-K 1300
compliant technical report summary, and expects to disclose its results as and when the estimates are completed and the joint venture
approval for investment has been received.
Non-material properties
Ghana operations
Damang Mine
The following graphic illustrates the location of the Damang gold mine, including mining and exploration tenements, administrative
offices and processing plant.
Introduction
Damang is a production stage gold mine located in the Wassa West District in southwestern Ghana approximately 270 kilometres
by road west of Accra and approximately 30 kilometres by road northeast of the Tarkwa mine (latitude 5°31’ 21.39’’N and longitude
1°51’ 1.71’’W).
Damang holds mining and prospecting leases with a total area of 24,265 hectares. All necessary statutory mining authorisations and
permits are in place for the Damang and Lima South mining leases. Abosso holds a mining lease in respect of the Damang mine dated
19 April 1995, as amended by an agreement dated 4 April 1996.
Damang submitted a formal application to the Minerals Commission in 2020 for approval for relinquishing the southern portion of the
Damang mining lease in the AGL underground and AGL tailings areas. The relinquished area included the overlap between the
Damang mining lease and one of the Tarkwa mining lease areas. While approval for the relinquishment of the area has been granted in
principle by the Minerals Commission, the application is still pending with final approval from the Minister. The relinquished area has
been considered for inclusion into a government-backed community mining project. The overlap will cease once the process is
finalised and Damang cedes its rights over that area. All relevant statutory mining authorisations, environmental permits, and social
licenses for operation are in place for the Damang and Lima South mining lease.
Damang is no longer considered to be a material operation due to significant EMR changes during 2023 and is moving towards only
producing from stockpiles. However, certain information about the property has been retained in this year’s Form 20-F for continuity
purposes. Gold Fields does not anticipate providing extensive disclosure, or filing technical report summaries, on this property going
forward.
Operational infrastructure
Damang mine commenced in 1997 and included the 4.5 Mt/a conventional crush-grind-leach-CIL processing plant, and modern surface
infrastructure. Damang has an annual major and critical item condition survey to focus reliability and minimise down time and a
comprehensive maintenance strategy that includes regular equipment refurbishment or replacement. The Damang mine design and
scheduling include sustainable capital to support the remaining LOM Mineral Reserves. Damang has contractors that conduct mining
operations and who are responsible for maintaining and modernising the mining fleet. The present condition of the property, and its
equipment, facilities and infrastructure is reasonably mature.
The Damang mine completed its transition from the national grid to an independent power producer, Genser Energy, during 2017.
Genser Energy commissioned the last of the units at its Damang gas plant in February 2017 and now supplies 27.5MW of energy, which
accounts for Damang’s total electricity consumption. The mine still has access to the ECG, a national grid energy provider, as a back-up.
The Damang mine also has access to water and road infrastructure. Most supplies are brought in by road from the nearest seaport,
Takoradi, which is approximately 120 kilometres to the southeast, or from Accra, which is approximately 270 kilometres away by road.
For information on assets and liabilities (including costs after depreciation) of Damang see “Annual Financial Report—Notes to the
Consolidated Financial Statements—Note 44. Segmental Report”. The book value of Damang is U.S.$65 million. As at 31 December
2023, 1,319 workers were employed at Damang, including 1,062 contractors. Following the cessation of mining, 209 workers are
currently employed.
Damang did not incur any fines or penalties for non-compliance during the year ended 31 December 2023 and no significant
encumbrances to the property exist.
The Damang mining concessions expire in April 2025 and December 2029, respectively, with a total annual fee of U.S.$387,000.
History
Mining on the Abosso concession began with underground mining in the early twentieth century. Surface mining at Damang
commenced in August 1997 and Gold Fields assumed control of operations on 23 January 2002. Historically, an underground mine was
in operation from 1878 until 1956.
In 2016, Gold Fields commenced the Damang reinvestment plan to extend the LOM Mineral Reserve of stockpiles to 2025. The
attributable value of Gold Fields’ ownership at Damang was 90% for 2023. The Government of Ghana holds a 10% free carried interest
in the mine.
Geology
Damang is located on the Damang Anticline, which is marked by Tarkwaian metasediments on the east and west limbs, around a core
of Birimian metasediments and volcanics. Gold in the Tarkwaian metasediments and volcanics is predominantly found in the
conglomerates of the Banket Formation and is interpreted to be of palaeoplacer origin. However, at Damang, hydrothermal processes
have enriched this deposit and the adjacent metasediments within the Banket formation. Within the region, the contact between the
Birimian and Tarkwaian metasediments and volcanics is commonly marked by zones of intense shearing and is host to a number of
significant shear hosted gold deposits, including Prestea, Bogoso, and Obuasi.
Palaeoplacer mineralisation occurs on the west limb of the anticline at Abosso, Chida and Tomento, and on the east limb of the anticline
at the Kwesie, Lima South and Bonsa North locations. Hydrothermal enrichment of the Tarkwaian paleoplacer and metasediments also
occurs at the Rex, Amoanda and Nyame areas on the west limb and the Damang and Bonsa areas on the east limb.
Mineral Reserves and Mineral Resources
Attributable Mineral Reserves of Damang as at 31 December 2023
The following table sets out attributable Mineral Reserves of Damang as at 31 December 2023. The Mineral Reserve gold price is U.S.
$1,400/oz and the point of reference is on the ROM.
| | | | | |
| |
| | | | | |
| | | | | |
| | | | | |
| | | | | |
Probable Mineral Reserves | | | | | |
| | | | | |
Attributable Mineral Reserve year on year change
The following table sets out attributable Mineral Reserves of Damang as at 31 December 2023 compared to 31 December 2022.
| | | | |
| Proven and Probable Mineral Reserves |
| | | | |
| | | | |
| | | | |
Production depletion (2023) | | | | |
| | | | |
| | | | |
| | | | |
| | | | |
| | | | |
| | | | |
| | | | |
| | | | |
For the year ended 31 December 2023, changes in Mineral Reserves at Damang were primarily driven by depletion.
Attributable Mineral Resources exclusive of Mineral Reserves of Damang as at 31 December 2023
The following table sets out attributable Mineral Resources exclusive of Mineral Reserves of Damang as at 31 December 2023.The
Mineral Resources gold price is U.S.$1,600/oz and the point of reference is diluted in situ.
| | | | | | |
| | |
| | | | | | |
| | | | | | |
| | | | | | |
Measured Mineral Resources | | | | | | |
Indicated Mineral Resources | | | | | | |
Total Measured and Indicated Mineral | | | | | | |
Inferred Mineral Resources | | | | | | |
Attributable Mineral Resource exclusive of Mineral Reserves year on year change
The following table sets out attributable Mineral Resources exclusive of Mineral Reserves of Damang as at 31 December 2023
compared to 31 December 2022.
| | | | | |
| | Measured and Indicated Mineral Resources | Inferred Mineral Resources |
| | | | | |
| | | | | |
| | | | | |
Production depletion (2023) | | | | | |
| | | | | |
| | | | | |
| | | | | |
| | | | | |
| | | | | |
| | | | | |
| | | | | |
| | | | | |
| | | | | |
For the year ended 31 December 2023, changes in Mineral Resources exclusive of Mineral Reserves at Damang were primarily driven
by Resource model update.
Peru operations
Cerro Corona
The following graphic illustrates the location of the Cerro Corona gold and copper mine, including mining and exploration tenements,
administrative offices and processing plant.
Introduction
Cerro Corona is a production-stage gold and copper mine operating one open pit and one copper-gold plant. It became operational
in 2008. It mines a porphyry copper-gold deposit situated within the Hualgayoc Mining District in northern Peru. It is located in the
Western Cordillera of the Andes, at elevations ranging from 3,600 metres to 4,000 metres above mean sea level, close to the
headwaters of the Atlantic continental basin (longitude 78˚37’17”W and latitude 6˚45’47”S). Cerro Corona is located approximately
80 kilometres by road north of Cajamarca. Access from Cajamarca is by largely sealed roads with a short distance of unsealed road.
Cajamarca has a regional airport with regular scheduled flights. There is no direct rail link to the site. Power is supplied via the regional
power grid and is 100% renewable (hydroelectric). The operation has an on-site camp for personnel.
Contract mining is deployed in the open pit applying conventional drill, blast, load and haul methods. The total property area owned by
Cerro Corona covers 6,208 hectares, comprising 4,805 hectares mining concessions, with the surface rights covering 1,403 hectares.
Cerro Corona is no longer considered to be a material operation due to significant EMR changes during 2023 and is moving towards
only producing from stockpiles. However, certain information about the property has been retained in this year’s Form 20-F for
continuity purposes. In addition, Gold Fields has filed an updated technical report summary for Cerro Corona as exhibit 96.8 to the
Form 20-F to correct minor non-material errors in the Cerro Corona Copper and Gold Mine technical report summary dated
31 December 2022. Gold Fields does not anticipate providing extensive disclosure, or filing technical report summaries, on this property
going forward.
Operational infrastructure
Cerro Corona open pit commenced in 2008 and the mine operates a 6.7 Mt/a flotation processing plant, and modern surface
infrastructure. Cerro Corona has an annual major and critical item condition survey to focus reliability and minimise down time and has
a comprehensive maintenance strategy that includes owned regular equipment refurbishment or replacement. Cerro Corona mine
design and scheduling includes sustainable capital to support the remaining LOM reserve estimate. Cerro Corona has contractors that
undertake all mining activities on site. The present condition of the property, and its equipment, facilities and infrastructure is fair,
modern condition.
Cerro Corona mine operates one open pit and one copper-gold flotation plant. The mining administration and maintenance facilities are
located at the mine. Cerro Corona’s electricity is supplied through a long-term contract with a Peruvian power supplier and transported
through the national power transmission system and a 34-kilometre transmission line constructed by the mine. Cerro Corona’s water
requirements are provided primarily by retention of rainfall and pit dewatering. Water is continuously recycled. While Cerro Corona’s in-
pit tailings application has not yet been approved, Gold Fields does not have any indication that it will be denied.
For information on assets and liabilities (including costs after depreciation) of Cerro Corona see “Annual Financial Report—Notes to the
Consolidated Financial Statements—Note 44. Segmental Report”. The book value of Cerro Corona is U.S.$197 million. As at 31
December 2023, 2,052 workers were employed at Cerro Corona, including 1,678 contractors.
Cerro Corona did not incur any fines for non-compliance or breaches during the year ended 31 December 2023 and no significant
encumbrances to the property exist.
The Cerro Corona gold and copper mining lease expires in 2038 and have an annual fee of U.S.$14,500.
History
In December 2003, Gold Fields, through a subsidiary, signed a definitive agreement to purchase an 80.7% economic and 92% voting
interest in the Cerro Corona deposit and adjoining mining concessions from a Peruvian family-owned company, Sociedad Minera
Corona S.A. The agreement called for a reorganisation whereby the assets of Cerro Corona were transferred to La Cima, in July 2004.
Following the approval of an EIA on 2 December 2005, Gold Fields completed the purchase of the 92% voting interest (80.7%
economic interest) in La Cima in January 2006, for a total consideration of U.S.$40.5 million. In 2011, Gold Fields increased its economic
interest in La Cima to 98.5% and in December 2013, Gold Fields further increased its economic interest in La Cima to 99.53%. The mine
has been in production since 2008 and the current LOM reserve estimate extends to 2030. The current 2030 LOM reserve estimate
for Cerro Corona incorporates the placement of tailing material into the pit void (in-pit tailings disposal) from 2025, when the existing
tailings storage facility reaches design capacity and mining has been completed, after which process plant feed will be sourced from
long-term lower grade reserve stockpiles. The attributable value of Gold Fields’ ownership at Cerro Corona was 99.53% for 2023.
Geology
The Cerro Corona copper-gold deposit is hosted by a 600 to 700-metre diameter sub-vertical cylindrical- shaped quartz diorite
porphyry stock dated at mid-Miocene age emplaced into mid-Cretaceous limestone, marls and siliclastic rocks. There are at least two
phases of diorite placement, only one of which is mineralised. The non-mineralised diorite is generally regarded as the last phase and is
referred to as “barren core”. Within the porphyry, copper-gold mineralisation is primarily hosted by extensive zones of stockwork
veining. The non-mineralised diorite is generally regarded as the last phase and is referred to as “barren core”. The latest geological
modelling suggests that the Cerro Corona porphyry is probably composed of four or five satellite stocks with the last two being barren.
The intrusive has been emplaced at the intersection of Andean-parallel and Andean-normal (trans-Andean) structures. Natural
supergene oxidation and leaching processes at Cerro Corona have led to the development of a weak to moderate copper enrichment
blanket, allowing for the subdivision of the deposit, from the surface downward, into an oxide zone, a mixed oxide-sulphide zone, a
secondary enriched (supergene) sulphide zone and a primary (hypogene) sulphide zone.
Mineral Reserves and Mineral Resources
Attributable Mineral Reserves of Cerro Corona as at 31 December 2023
The following tables set out attributable Mineral Reserves of Cerro Corona as at 31 December 2023. The Mineral Reserve gold price is
U.S.$1,400/oz, copper price is U.S.$3.40/lb and the point of reference is on the ROM.
Attributable Gold Reserves as at 31 December 2023
| | | | | |
| |
| | | | | |
| | | | | |
| | | | | |
| | | | | |
Probable Mineral Reserves | | | | | |
| | | | | |
Attributable Copper Reserves as at 31 December 2023
| | | | | |
| |
| | | | | |
| | | | | |
| | | | | |
| | | | | |
Probable Mineral Reserves | | | | | |
| | | | | |
Attributable Mineral Reserve estimate year on year change
The following tables set out attributable Mineral Reserves of Cerro Corona as at 31 December 2023 compared to 31 December 2022.
Attributable Gold Reserves year on year change
| | | | |
| Proven and Probable Mineral Reserves |
| | | | |
| | | | |
| | | | |
Production depletion (2023) | | | | |
| | | | |
| | | | |
| | | | |
| | | | |
| | | | |
| | | | |
| | | | |
| | | | |
For the year ended 31 December 2023, changes in gold reserves at Cerro Corona were primarily driven by depletion.
Attributable Copper Reserves year on year change
| | | | |
| Proven and Probable Mineral Reserves |
| | | | |
| | | | |
| | | | |
Production depletion (2023) | | | | |
| | | | |
| | | | |
| | | | |
| | | | |
| | | | |
| | | | |
| | | | |
| | | | |
For the year ended 31 December 2023, changes in copper reserves at Cerro Corona were primarily driven by depletion.
Attributable Mineral Resources exclusive of Mineral Reserves of Cerro Corona as at 31 December 2023
The following tables set out attributable Mineral Resources exclusive of Mineral Reserves of Cerro Corona as at 31 December 2023.
The Mineral Resources exclusive of Mineral Reserves gold price is U.S.$1,600/oz, copper price is U.S.$3.60/lb and the point of
reference is diluted in situ. There are no available resources exclusive of reserves due to the in-pit tailings placement commencing
in 2026.
Attributable Gold Resources exclusive of Gold Reserves as at 31 December 2023
| | | | | |
| |
| | | | | |
| | | | | |
| | | | | |
Measured Mineral Resources | | | | | |
Indicated Mineral Resources | | | | | |
Total Measured and Indicated Mineral Resources | | | | | |
Inferred Mineral Resources | | | | | |
Attributable Copper Resources exclusive of Copper Reserves as at 31 December 2023
| | | | | | |
| | |
| | | | | | |
| | | | | | |
| | | | | | |
Measured Mineral Resources | | | | | | |
Indicated Mineral Resources | | | | | | |
Total Measured and Indicated Mineral Resources | | | | | | |
Inferred Mineral Resources | | | | | | |
Attributable Mineral Resource exclusive of Mineral Reserves year on year change
The following tables set out attributable Mineral Resources exclusive of Mineral Reserves of Cerro Corona as at 31 December 2023
compared to 31 December 2022. There is no available EMR after reserves due to the in-pit tailings placement commencing in 2026.
Attributable Gold Resources exclusive of Gold Reserves year on year change
| | | | | | |
| | Measured and Indicated Mineral Resources | Inferred Mineral Resources |
| | | | | | |
| | | | | | |
| | | | | | |
Production depletion (2023) | | | | | | |
| | | | | | |
| | | | | | |
| | | | | | |
| | | | | | |
| | | | | | |
| | | | | | |
| | | | | | |
| | | | | | |
| | | | | | |
For the year ended 31 December 2023, changes in gold resources at Cerro Corona were primarily driven by exclusion. There is no
available EMR after reserves due to the in-pit tailings placement commencing in 2026.
Attributable Copper Resources exclusive of Copper Reserves year on year change
| | | | | | |
| | Measured and Indicated Mineral Resources | Inferred Mineral Resources |
| | | | | | |
| | | | | | |
| | | | | | |
Production depletion (2023) | | | | | | |
| | | | | | |
| | | | | | |
| | | | | | |
| | | | | | |
| | | | | | |
| | | | | | |
| | | | | | |
| | | | | | |
| | | | | | |
For the year ended 31 December 2023, changes in copper resources at Cerro Corona were primarily driven by exclusion. There is no
available EMR after reserves due to the in-pit tailings placement commencing in 2026.
Internal controls disclosure pursuant to Item 1305 of Regulation S-K under the Securities Act
The geometry and continuity of orebodies is interpreted from samples that are often widely spaced compared to the expected
variability of the geometry and continuity of the geological units and structures that control mineralisation. Sometimes the geometry and
continuity are poorly understood and difficult to predict at the scale of drilling.
Mineral Resources and Mineral Reserves are estimated using samples obtained from exposures or drilling that are widely spaced and
of small volume in comparison to the mining blocks that they are used to estimate. Analytical measures are dependent on the ability to
take a representative sample. Sample representativity is especially difficult to achieve when coarse gold is present as in many of the
Gold Fields operations.
Geological and grade variability are commonly estimated using geostatistical measures (the variogram) that indicate large contributions
to structured components of sample variance may be random (the nugget).
As a result, there may be significant uncertainty in the locally estimated grades and geological continuity of resource estimates.
Resource geologists attempt to provide a (usually) qualitative indication of risk to metal contents through the application of
classifications (Measured, Indicated, Inferred Mineral Resources, Proven and Probable Mineral Reserves).
Assumptions are used to define whether portions of resource models are potentially economic to extract. These assumptions or
modifying factors may be measures such as metal price, anticipated mining costs, cost of capital and others. These modifying factors
are applied in a forward-looking fashion and become increasingly uncertain further into the future. Mines with long LOM schedules
therefore carry increased risk in this regard.
In accordance with S-K 1300 guidelines and the SAMREC Code, a comprehensive quality assurance and quality control (QA/QC)
protocol is in place at all the Gold Fields operations and projects. It draws on industry leading practice for data acquisition and utilises
national standards authority accredited laboratories, such as the South African National Accreditation System (SANAS) in South Africa,
which are regularly reviewed both internally and externally. Analytical QA/QC is maintained and monitored through the submission of
blanks, certified reference material and duplicates, and umpire laboratory checks.
Gold Fields’ Mineral Resources and Mineral Reserves estimates are subject to internal Qualified Persons reviews administered by the
Corporate Technical Services team and cyclically by external and independent experts.
Gold Fields follows an embedded process of third-party reviews to provide expert independent assurance regarding the Mineral
Resources and Mineral Reserves estimates and compliance to the appropriate reporting codes.
In line with Gold Fields’ policy that each operation or material project will be reviewed by an independent third party on average no less
than once every three years, or when triggered by a material new Mineral Resource and/or Mineral Reserve declaration, the following
operations were subject to external review during 2023: Gruyere, Granny Smith, St. Ives and Agnew. Auditors certificates have been
issued for all four mines and no material findings have been made. No material issues were identified in the estimation processes and
LOM plans and Compliance Certificates have been issued by the independent consultants for these projects. The certificates state that
the Mineral Resources exclusive of Mineral Reserves and Mineral Reserves have been estimated and reported in accordance with the
SAMREC Code, which is substantially similar in its methodology to S-K 1300, and no material issues have been identified. Importantly,
third-party audits are also configured to assist with continuous improvement regarding leading practice in Mineral Resources and
Mineral Reserves estimation and reporting.
Description of mining business
The discussion below provides a general overview of the mining business as it applies to Gold Fields.
Exploration
Exploration activities are focused on discovery and Mineral Resource development aimed at replacing production depletion and growth
in Mineral Reserves to maintain operational flexibility and sustainability. The Group focuses on the extension of existing ore bodies and
the discovery and delineation of new ore bodies both at existing sites and at undeveloped sites. Once a potential ore body has been
discovered, exploration is extended and intensified in conjunction with comprehensive infill drilling, in order to enable clearer definition
of the ore body and its technical and economic characteristics to profile the potential portions to be mined. Geological, geochemical,
geophysical, geostatistical, geotechnical and geo-metallurgical techniques are constantly refined to improve effectiveness and the
economic viability of prospecting and mining activities. A multi-year budget is established at the respective mining operations to ensure
traction on exploration strategies to secure strong exploration project pipelines.
Mining
Gold Fields currently mines only gold, with copper and silver as by-products. The mining process comprises four principal activities: (i)
constructing infrastructure and processing facilities; (ii) developing access to the ore body; (iii) extracting the ore body once accessed;
and (iv) processing ores to saleable products. These processes apply to both surface and underground mines.
Underground Mining
Developing access to the ore body
For Gold Fields’ Australian operations access is through single or multiple decline haulages extended from surface portals, while at the
South African underground mine, primary access to the ore body is provided through vertical shaft systems. Horizontal and decline
development at various intervals of the shaft or main decline, known as levels, extend laterally and provide access to the ore horizon.
Ore drives open up the ore body for mining.
Extracting the ore body
Once an ore body has been accessed and opened up for mining, production activities consisting of drilling, blasting, cleaning,
supporting and transporting rock are carried out on a daily basis.
At the Australian underground operations, the broken ore is loaded straight from the stope face into trucks, using mechanical loaders,
and hauled to the surface by underground dump trucks via the decline. Application of backfill to the mined-out areas is based on local
conditions and is not always required in shallow underground mining areas.
At South Deep, the broken ore is loaded from either the stope, development or destress excavations into trucks using mechanical
loaders and hauled along drives to ore pass systems which connect the drives to the cross cuts below. The broken ore from the
development ends is loaded and hauled to ore pass systems by means of Load Haul Dumpers. The ore is then transported by rail or
conveyor and tipped into the shaft rock transfer system, after which it is hoisted to surface. Mining methods employed include destress
mining (to provide the appropriate geotechnical conditions for subsequent development stoping), long hole open stoping (for reef
targets greater than 15 metres in height) and drifting and benching (for reef targets less than 15 metres in height). The mining voids
generated once the ore is removed are filled with treated tailings product called backfill, which provides ground support for the mined-
out areas.
Open pit mining
Opening up the ore body
In open pit mining, access to the ore body is achieved by stripping the overburden waste in benches of fixed height to expose the ore
below. This is most typically achieved by drilling and blasting an area, loading the broken waste rock with excavators into dump trucks
and hauling the waste rock and/or soil to dumps. The overburden material is placed on designated waste rock dumps.
Extracting the ore body
Extraction of the ore body in open pit mining involves the same activity as in stripping the overburden waste. Lines are established
on the pit floor demarcating ore from waste material and the rock is then drilled and blasted. Post blasting, the ore is loaded into
dump trucks and hauled to interim stockpiles or directly to the crusher at the metallurgical plant, while the waste is hauled to waste
rock dumps.
Rock dump and production stockpile mining
Gold Fields mines surface rock dumps and production stockpiles using mechanised earth-moving equipment.
Mine planning and management
Operational and longer-term planning management on the mines receives support from regional technical support functions, as well as
from corporate, which includes the corporate technical services, finance and the sustainable development functions. The current
philosophy is one of top-down/bottom-up management, with the operational and commercial objectives at each mine defined by the
personnel at the mine based on parameters, objectives and guidelines provided by Gold Fields’ corporate office. This is based on the
premise that the people on the ground have the best understanding of the local business and what is realistically achievable.
Each operation identifies and confirms a preferred strategic option on an annual basis, which, once approved by Gold Fields’ Executive
Committee (the Executive Committee), is used to inform how the detailed two year operational plan and budget is configured, which is
rolled out into a LOM Mineral Reserve, prior to the commencement of each fiscal year. The plans are based on financial parameters
determined by the Executive Committee. The operational plan is presented to the Executive Committee, which takes it to the Board for
approval before the commencement of each fiscal year. The planning process is anchored by a Group planning calendar, and is
sequential and based upon geological models, evaluation models, resource models, metal prices, mine design, depletion schedules
and, ultimately, financial analysis. Capital planning is formalised pursuant to Gold Fields’ capital investment and approvals process.
Projects are categorised and reviewed in terms of total expenditure, return on investment, net present value and impact on AIC per
ounce and all projects involving amounts exceeding A$40 million (Australia), R360 million (South Africa) and U.S.$40 million (Ghana/
Peru) are submitted to the Board for approval. Material changes to the plans must be referred back to the Executive Committee and the
Board. Post-investment reviews are conducted to assess the effectiveness of the capital approvals process and to leverage continuous
improvement opportunities going forward.
Capital expenditure
Gold Fields spent U.S.$1,054.7 million, U.S.$1,069.3 million and U.S.$1,088.7 million in capital expenditure during fiscal 2023, 2022 and
2021, respectively.
The major expenditure items in fiscal 2023 were U.S.$398.1 million on project construction capital, capital waste tonnes and ramp-up
capital at Salares Norte, U.S.$16.7 million on capital development and U.S.$19.3 million on fleet replacement at the South Deep mine,
U.S.$166.1 million on capital waste stripping at Tarkwa, U.S.$6.3 million on tailings storage facility at Damang, U.S.$18.9 million on the
tailings storage facility at Cerro Corona, U.S.$55.7 million on underground and open pit development at St. Ives, U.S.$46.8 million on
the underground and open pit development at Agnew, U.S.$31.1 million on development of the Wallaby underground mine at Granny
Smith and U.S.$35.2 million on development at Gruyere.
The major expenditure items in fiscal 2022 were U.S.$296.7 million on the construction of Salares Norte, U.S.$33.4 million on the solar
plant at the South Deep mine, U.S.$186.8 million on capital waste stripping at Tarkwa, U.S.$47.1 million on capital waste stripping at
Damang, U.S.$19.6 million on the tailings storage facility at Cerro Corona, U.S.$67.1 million on underground and open pit development
at St. Ives, U.S.$27.1 million on the development of the Waroonga underground complex at Agnew, U.S.$28.5 million on development
of the Wallaby underground mine at Granny Smith and U.S.$23.6 million on capital waste stripping at Gruyere.
The major expenditure items in fiscal 2021 were U.S.$326.5 million on the construction of Salares Norte, U.S.$8.7 million on the solar
plant at the South Deep mine, U.S.$178.3 million on capital waste stripping at Tarkwa, U.S.$6.0 million on the construction of the Far
East Tailings Storage Facility at Damang, U.S.$14.5 million on the Arpon waste storage facility (WSF) at Cerro Corona, U.S.$53.6 million
on underground and open pit development at St. Ives, U.S.$38.0 million on the development of the Waroonga and New Holland
underground complexes at Agnew, U.S.$43.1 million on development of the Wallaby underground mine at Granny Smith and U.S.
$31.1 million on capital waste stripping at Gruyere.
For more information regarding Gold Fields’ capital expenditure, see “Annual Financial Report—Management’s Discussion and
Analysis of the Financial Statements—Capital Expenditures”, “Annual Financial Report—Management’s Discussion and Analysis of the
Financial Statements—Liquidity and Capital Resources—Years Ended 31 December 2023 and 31 December 2022”.
For a discussion of growth and sustaining capital expenditures, please see “Annual Financial Report—Management’s Discussion and
Analysis of the Financial Statements—All-in Sustaining and All-in Costs”.
AIC
Please see “Annual Financial Report—Management’s Discussion and Analysis of the Financial Statements—All-in Sustaining and All-in
Costs” for the Company’s historical AIC.
Processing
Gold Fields has nine active gold processing facilities (four in Australia (including Gruyere), one in South Africa, two in Ghana, one in
Chile and one in Peru). The gold and silver processing facility at Salares Norte will be commissioned, with first gold and silver
production occurring by April 2024. Additionally, the Windfall gold and silver processing plant is in the final detailed engineering stage.
A typical processing plant includes two stages: comminution (crushing and grinding the ore) and then gold recovery (typically flotation,
leaching, carbon adsorption, carbon stripping/EW and/or smelting).
Comminution
Comminution is the process of crushing and breaking up the ore to expose and liberate the gold and make it available for treatment.
Conventionally, this process occurs in multi-stage crushing and milling circuits, which include the use of jaw and gyratory or cone
crushers followed by rod, semi-autogenous grinding and/or ball mills. For the milling step, most of Gold Fields’ processing plants utilise
both SAG and ball mills where the ore itself and steel balls are used as the primary grinding media. Through the comminution process,
ore is ground to a pre-determined size before proceeding to the gold recovery stage.
Gold recovery
All of Gold Fields’ operating gold plants, gold is extracted into solution by leaching with cyanide in agitated slurry tanks. The gold is
then adsorbed onto activated carbon from the solution using either the CIL process or the CIP process. The activated carbon is
removed from the tanks, eluted in pressurised columns and the gold is then recovered by electrowinning. The Salares Norte plant will
include a Merrill Crowe gold recovery circuit prior to CIP, which recovers pregnant leach solution by 2-stage thickening, followed by
zinc precipitation of the gold and silver in the clean solution.
All of Gold Fields’ operating gold plants also utilise gravity recovery circuits that use a centrifugal concentrator to recover coarse free
gold based on density differences. This gravity gold recovery step is usually undertaken within the grinding stage of the processing
plant before the ore progresses to CIL or CIP.
As the final recovery step, the gold recovered by the electrowinning cells is smelted in a furnace to produce gold doré bars. These gold
bars are transported to a refinery that is responsible for further refining.
At Cerro Corona, gold/copper concentrate is recovered using a standard flotation process. The concentrate is shipped to a third-party
smelter for further processing. The Cerro Corona processing plant therefore does not have a CIL or CIP circuit.
At Salares Norte and Windfall, gold and silver is expected to be recovered into doré bars. These gold and silver doré bars will then be
transported to MKS (Switzerland) S.A. (MKS), which is responsible for further refining.
Refining and marketing
Australia
In Australia, all gold produced by Gruyere, Granny Smith, St. Ives and Agnew, each owned by an Australian operating company, is
refined by the Perth Mint in Western Australia. The Perth Mint applies competitive charges for the collection, transport and refining
services. The Perth Mint takes responsibility for the unrefined gold at collection from each of the operations where they engage a sub-
contractor, Brinks Australia. Brinks Australia delivers the unrefined gold to the Perth Mint where it is refined and the refined ounces of
gold and silver are credited to the relevant metal accounts held by each Australian Operating Company with the Perth Mint. The
arrangement with the Perth Mint continues indefinitely until terminated by either party upon 90 days’ written notice.
Gold Fields’ treasury department in the head corporate office in Johannesburg, South Africa sells all the refined gold produced by the
Australian Operating Companies. On collection of the unrefined gold from an Australian Operating Company’s mine site, the relevant
Australian Operating Company will notify Gold Fields’ treasury department of the estimated refined gold content, expressed in troy
ounces, available for sale. After such confirmation, Gold Fields’ treasury department will sell the refined gold to authorised
counterparties at a price benchmarked against the LBMA Gold PM Auction Price. All silver is sold to the Perth Mint at the LBMA silver
price on the last business day of each month.
South Africa
The South Deep Joint Venture entered into a refining agreement with Rand Refinery Proprietary Limited (Rand Refinery) in 2013. Rand
Refinery is a non-listed private company in which Gold Fields holds a 2.8% interest, with the remaining interests held by other South
African gold producers.
This refining agreement superseded and replaced any and all previous refining agreements between the South Deep Joint Venture
and Rand Refinery. Pursuant to this refining agreement, Rand Refinery undertook, among other things, to: (i) refine all unrefined gold
produced by South Deep; (ii) on each delivery date of unrefined gold to Rand Refinery, notify Gold Fields’ treasury department in writing
of the estimated gold and/or silver content of the unrefined gold so delivered, expressed in troy ounces; and (iii) retain the refined gold
and the refined silver for South Deep pending written instructions from Gold Fields’ treasury department that the refined gold and/or
refined silver have been sold and may be delivered to the buyer in accordance with the buyer’s instructions. Risk transfers at the Rand
Refinery helipad once the material is signed for by Rand Refinery Security. Accordingly, the mine insurance policy covers the gold doré
while it is in transit to the Rand Refinery helipad. Rand Refinery invoices South Deep with the refining charges, who then arranges for
direct settlement to Rand Refinery. The refining agreement will continue indefinitely until either party terminates it upon at least 12
months’ written notice.
Gold Fields’ treasury department sells all the refined gold produced by South Deep to authorised counterparties at a price
benchmarked against the LBMA Gold PM Auction Price (or the LBMA Gold AM Auction Price).
Silver is accumulated and sold on a quarterly basis by Gold Fields treasury to either Rand Refinery or to an authorised counterpart at a
price benchmarked against the LBMA silver price.
Ghana
Gold produced at the Damang and Tarkwa mines is refined by MKS pursuant to refining agreements entered into by Abosso (in respect
of the Damang mine) and Gold Fields Ghana (in respect of the Tarkwa mine) with MKS. Under these agreements, MKS collects the gold
from either the Damang or Tarkwa mine and transports it either to its Switzerland refinery or to its Indian refinery where the gold is then
refined. The MKS refinery in India will be the default designated refinery unless either party provides the other party with notice to the
effect that a shipment of gold must be transported to MKS’s refinery in Switzerland, provided that MKS shall only be entitled to provide
Gold Fields Ghana (Damang and Tarkwa operations) with such notice if: (i) the arrival date of the gold at the refinery will fall on a day
other than a business day in India or during a period of weak physical demand for gold in India; or (ii) the Indian import regulations for
the gold have materially and adversely changed. The risk of loss and/or damage passes to MKS on delivery. Delivery is defined under
the agreement as the delivery of the material by Gold Fields to the Delivery Place (which is defined as the gold room of Gold Fields
Ghana Ltd and Abosso Goldfields Ltd.).
Once the gold has been refined, the Damang and Tarkwa operations shall be entitled to (i) sell the refined gold through Gold Fields’
treasury department, acting as agent for and on their behalf; or (ii) require MKS to purchase the refined gold; or (iii) request a
prepayment in respect of the refined gold. All sales are benchmarked against the afternoon LBMA Gold PM Auction Price. The LBMA
Gold Price is operated and administered by an independent third-party provider, ICE Benchmark Administration (the IBA), who was
chosen following consultation with market participants. IBA provides the price platform, methodology, as well as the overall
administration and governance for the LBMA Gold Price. The IBA’s platform provides an electronic, auction-based, tradeable, auditable
and fully IOSCO-compliant solution for the London bullion market. MKS assumes responsibility for the gold upon collection at either the
Damang or Tarkwa mines.
Silver is accumulated and sold on a quarterly basis to MKS, at the LBMA silver price on the date of sale.
The MKS refining agreements were executed on 3 June 2021and automatically renew for 12-month periods, unless either party
terminates the agreements with one month’s notice.
Peru
Gold Fields La Cima S.A. (La Cima) has two main long-term contracts for the sale of approximately 70% of concentrate from the Cerro
Corona mine, one with a Japanese refinery and one with a European refinery. All production in excess of the amounts sold under long-
term contracts is sold locally to global trading entities.
Risk is transferred to the client when the concentrate is loaded at the port of Salaverry, Peru for international sales (cost, insurance and
freight (CIF) intercom) or at a Salaverry warehouse for local sales (based on ex works (EXW) or carriage paid to (CPT) incoterms). Pricing
for copper under each of the contracts is based on the daily LME settlement price for copper. Pricing for gold under each of the
contracts is based on the daily average of the LBMA morning and afternoon fixing price. As in previous years, La Cima’s strategy is
based on building strong business relationships with smelters and traders, which allows for a regular destination for its concentrate.
Uncommitted production is expected to be delivered locally in the spot market to allow for production variances and inventory
management.
The Gold mining industry
Background
Gold is a dense, relatively soft and rare precious metal which occurs in natural form as nuggets or grains in ore, underground veins and
alluvial deposits. Gold mining operations include both underground and open pit operations with gold currently able to be commercially
extracted from ore grades based on cut-off grade or net smelter return calculations updated annually using the planning metal price
deck approved by Gold Fields, the physical and cost base for the mine's respective plans. The majority of gold production is used for
jewellery production and, for investment purposes, in the latter case because some investors view it as a store of value against inflation.
In addition, certain physical properties of gold, including its malleability, ductility, electric conductivity, resistance to corrosion and
reflectivity, make it the metal of choice in a number of industrial applications.
Global markets
Demand
According to the WGC, in 2023 global gold demand decreased by 5% to 4,448 tonnes. Investment demand (excluding OTC) reached
945.1 tonnes in 2023, which was a 15% decrease from the previous year. Demand for gold bars and coins fell 3% to 1,189.5 tonnes, while
holdings for gold ETF’s fell by 244.4 tonnes (2022: -109.5 tonnes), which was a larger amount than in 2022 and further contributed to
total investment growth. Quarterly fluctuations in OTC demand largely netted out over the year. Central bank demand for 2023 was
1,037.4 tonnes. Demand for gold in technology saw a sharp Q4 drop, resulting in a full-year decline of 4%, while deteriorating global
economic conditions also hampered demand for consumer electronics, which was down by 4%.
Jewellery consumption grew by a fraction in 2023, up by 0.19% at 2,092.6 tonnes.
Supply
Supply of gold consists of new production from mining, the recycling of gold scrap and releases from existing stocks of bullion. Mine
production represents the most important source of supply, typically comprising 75% each year. Annual demand requires more gold
than is newly mined and the shortfall is made up from recycling. Management believes that long-term gold supply issues will act to
support a recovery in the gold price. According to the WGC, total annual gold supply increased by 3% in 2023, to 4,898 tonnes. Mine
production inched up to a four-year high of 3,644.4 tonnes.
Price
The market for gold is relatively liquid compared to other commodity markets, with London being the world’s largest gold trading
market. Gold is also actively traded via futures and forward contracts. The price of gold has historically been significantly affected by
macroeconomic factors, particularly in the United States, such as inflation, exchange rates, central banks’ reserves policies and by
global political and economic events, rather than simple supply and demand dynamics. Gold is often purchased as a store of value in
periods of price inflation and weakening currency. The price of gold has historically been less volatile than that of most other
commodities.
In 2021, the price of gold improved by 2%. During 2022, the gold price traded at an average level of U.S.$1,785 an ounce, 0.5% lower
than in 2021. During 2023, the average price of gold was U.S.$1,945, an increase of 9.0%. The gold price closed for 2023 at U.S.
$2,078.40 an ounce, which was the high for the year, while the low was U.S.$1,810.75.
Top Producers
Based on fiscal 2023 production, the first, second, third, fourth and fifth largest gold producers in the world were Newmont (6 Moz),
Barrick Gold (4.4 Moz), Agnico Eagle (3.34 Moz), Polyus (2.85 Moz) and AngloGold Ashanti (2.53 Moz), respectively. In fiscal 2023,
Gold Fields was the sixth largest gold producer in the world with attributable gold production of 2.30 Moz.
Guidance for 2024
2024 remains another significant capital expenditure year for Gold Fields, given the remaining project capital at Salares Norte, the
renewables microgrid at St. Ives as well as the elevated level of sustaining capital expenditure across the portfolio, to maintain the
production base of the Group.
Based on Gold Fields’ sale of its 45% effective interest in Asanko in March 2024, no guidance will be provided for the equity-accounted
investee. Consequently, Group guidance excludes its share of the Asanko joint venture.
For 2024, attributable gold equivalent production (excluding Asanko) is expected to be between 2.33Moz and 2.43Moz (2023
comparable: 2.24Moz). AISC is expected to be between U.S.$1,410/oz and U.S.$1,460/oz, and AIC is expected to be U.S.$1,600/oz to
U.S.$1,650/oz. Included in sustaining capital expenditure is A$200 million (U.S.$132 million) for a St. Ives renewable power project.
Excluding this renewable microgrid project which accounts for approximately U.S.$60/oz, the ranges for AISC will be U.S.$1,350/oz to
U.S.$1,400/oz and AIC will be U.S.$1,540/oz to U.S.$1,590/oz.
The exchange rates used for our 2024 guidance are: U.S.$/A$0.66, R/U.S.$18.70 and C$/US$0.75. The metal price assumptions for the
calculation of royalties and copper and silver by-products are: gold price U.S.$2,050/oz (A$3,100/oz, R1,200,000/kg); copper price U.S.
$8,500/t and silver price U.S.$23/oz.
The increase in AIC is due to higher sustaining capital expenditure mainly at Gruyere, St. Ives and South Deep and higher cost of sales
before amortisation and depreciation as a result of inflationary increases as well as gold inventory movements mainly at St. Ives,
Damang and Tarkwa, partially offset by higher production.
The Group’s total capital expenditure for 2024 is expected to be between U.S.$1.13 billion to U.S.$1.19 billion. Sustaining capital is
expected to be between U.S.$860 million to U.S.$890 million in 2024. The increase in sustaining capital from U.S.$692 million in 2023
is driven largely by:
•A$200 million (U.S.$132 million) to be spent in 2024 on the renewable microgrid project;
•increased development and infrastructure capital at St. Ives;
•increased capital waste stripping at Gruyere; and
•mine infrastructure upgrades and fleet replacement at South Deep.
Non-sustaining capital expenditure is expected to be U.S.$270 million to U.S.$300 million, with the largest component of this being the
Salares Norte project capital of U.S.$148 million and the Windfall project capital of U.S.$56 million with the balance relating to various
growth projects in the Australia region.
Environmental and regulatory matters
Australia
Environmental
Gold Fields’ gold operations in Australia are primarily subject to the environmental laws and regulations of the State of Western
Australia which require, among other things, that Gold Fields obtains necessary environmental approvals, environmental licences, works
approvals and mining approvals to implement and carry out its mining operations. In addition, under the Environment Protection and
Biodiversity Conservation Act 1999 (Cth) (EPBC Act) it may be necessary to obtain separate approval from the federal government if any
new project (including some expansions of existing facilities) has, will have or is likely to have a significant impact on “matters of national
environmental significance” under the EPBC Act.
At the state level, Gold Fields is subject to the Environmental Protection Act 1986 (WA) (EP Act), under which it is obliged to prevent and
abate pollution and environmental harm. The EP Act also prescribes sanctions and penalties for a range of environmental offences,
including orders which may effectively suspend certain operations or activities.
Under Part IV of the EP Act, any proposal (including an expansion of an existing development) that is likely to have a significant effect on
the environment must be referred to the Western Australian Environmental Protection Authority (the Western Australian EPA), which will
determine whether or not to assess the proposal and if so, what level of assessment is required. Where an EIA is required, the Western
Australian EPA will undertake an evaluation of a new proposal and its impact on the environment. After completing its assessment of a
proposal, the Western Australian EPA prepares a report for the Western Australian Minister for the Environment who must decide
whether or not to approve the proposal and, if approved, which conditions are appropriate to regulate the implementation of the
proposal and its impact on the environment.
In addition to this approval, under Part V of the EP Act, a works approval and environmental licence must be obtained from the DWER
for the construction and operation of facilities with significant potential to cause pollution, such as the ore processing facility, tailings
storage facility and the landfill and wastewater treatment plant. Gold Fields is also required to obtain a water licence from DWER to
extract water for its mining activities. Contravening the conditions of a water licence is an offence and can lead to the licence being
cancelled or suspended. A water licence can also be cancelled or suspended in various other circumstances, including where the
Minister for Water of Western Australia is of the opinion that the cancellation or suspension is necessary or desirable to protect the
water resource or associated environment from unacceptable damage. Gold Fields has obtained the necessary water extraction
licences (or has alternative water supply arrangements in place) to support its operations.
The environmental impacts of mining activities are also regulated by conditions imposed on Gold Fields’ mining tenements under the
Western Australia Mining Act. If a tenement holder fails to comply with a condition of a mining tenement, the Minister for Mines or
Warden appointed under the Western Australia Mining Act may impose a fine or order that the relevant mining tenement be subject
to forfeiture.
It is a condition of its mining leases that prior to the commencement or expansion of any mining operations, Gold Fields is obliged to
prepare a mining proposal in accordance with published guidance material and submit the mining proposal to the DMIRS for approval
under the Western Australia Mining Act. Once approved by the DMIRS, the requirement to comply with the mining proposal becomes
a condition of the underlying mining tenement.
Gold Fields is also required to prepare and submit an Annual Environmental Report to DWER and DMIRS under the conditions attached
to its environmental approvals, licences and mining tenements.
During the operational life of its mines, Gold Fields is required by the conditions of its tenements and approvals to prepare a Mine
Closure Plan which is to make provisions for the ongoing rehabilitation of its mines and to estimate the cost of closure obligations and
post-closure rehabilitation and monitoring once mining operations cease. Under the Mining Rehabilitation Fund Act 2012 (WA), Gold
Fields is required to pay an annual levy of 1.0% of an estimate of the cost per hectare to rehabilitate the land disturbed by Gold Fields’
operations into a mining rehabilitation fund administered by the DMIRS. The funds held by DMIRS in the mining rehabilitation fund are
used to rehabilitate abandoned mines and are not refundable or reimbursable to the contributing entities for their own rehabilitation
liabilities, which are expected to be separately funded. In August 2023, the Western Australian Government announced it was
undertaking an independent review of the mining rehabilitation fund to determine its effectiveness.
Under the National Greenhouse and Energy Reporting scheme, Gold Fields has operational control over four Australian operations
which have combined GHG emissions exceeding 50kt CO2e each fiscal year. Accordingly, Gold Fields is required to report as the
registered “controlling corporation” for the purposes of the scheme.
The Emissions Reduction Fund (ERF) is a voluntary scheme that aims to provide financial incentives for emitters to reduce, abate or
sequester greenhouse gas emissions. Gold Fields registered the Granny Smith Gas Power Station Project with the ERF for carbon
abatement in May 2015 under the Industrial Fuel and Energy Efficiency Method. In 2016, Gold Fields entered into a seven-year contract
with the ERF for the sale of its abatement credits. That contract came to an end in August 2023, with all agreed abatement credits being
delivered to the Clean Energy Regulator.
In 2022, Australia passed the Climate Change Act 2022 (Cth) which sets a national emission reduction target of 43% below 2005 levels
by 2030 and net zero by 2050 and establishes processes to review future targets in line with the Paris Agreement goals. In July 2023,
reforms to the Safeguard Mechanisms commenced. The reformed Safeguard Mechanism operates as the Federal Government’s
primary tool to limit emissions from large emitting facilities, to place covered facilities on a pathway of declining emissions. Under the
reforms, covered facilities must be designated with production-adjusted baselines, and the baseline decline rate that applies to most
covered facilities is set at 4.9% per year to 2030. Both the Gruyere and Granny Smith mines are regulated under the Safeguard
Mechanism and as such, are subject to the changes to facility baselines. Where a facility’s emissions exceed its baseline, the facility will
need to surrender ACCUs for a new instrument called a Safeguard Mechanism Credit (SMC). SMCs will be created where a facility
keeps its emissions below its baseline.
The amendments to the Safeguard Mechanism and related ERF Rules remove the ability to undertake future ERF projects that solely
reduce covered emissions at Safeguard Mechanism facilities and prevent existing projects from generating ACCUs from new activities
that reduce covered emissions. Existing projects, such as the registered Granny Smith project will be grandfathered (i.e., will be able to
continue to receive ACCUs during its crediting period), but Gold Fields will be unable to generate ACCUs from future projects or new
activities which solely reduce covered emissions at its Safeguard Mechanism facilities.
Health and safety
The WHS Act and the Work Health and Safety (Mines) Regulations 2022 (WA) (WR), together regulate the duties of employers and
employees in the mining industry with regard to occupational health and safety and outline offences and penalties for breach. The WHS
Act imposes extensive workplace health and safety obligations on Gold Fields’ operations in Western Australia to ensure Gold Fields is
complying with its health and safety obligations.
A violation of the safety laws or failure to comply with the instructions of the relevant health and safety authorities is a regulatory offence
that may result in criminal liabilities and could lead to, among other things, a temporary shutdown of all or a portion of a mine, the
imposition of costly compliance procedures, financial penalties and/or imprisonment for statutory position holders and/or company
officers.
Under the WHS Act and WR, there is an offence of industrial manslaughter for certain workplace fatalities, which, in the event of a
conviction, carries a significant penalty of up to 20 years’ imprisonment for individuals and fines of up to A$10 million for corporate
entities. It is also an offence to insure against penalties and any policy purporting to do so would likely be void to that extent.
Mineral rights
In Australia, the ownership of land is separate from the ownership of most minerals (including gold), which are the property of the states
and are thus regulated by the state governments. The Western Australia Mining Act is the principal piece of legislation governing
exploration and mining on land in Western Australia. Licences and leases for, among other things, prospecting, exploration and mining
must be obtained pursuant to the requirements of the Mining Act before the relevant activity can begin.
The grant of a mining tenement is generally at the discretion of the Minister, or a Mining Registrar or Warden, appointed under the
Mining Act, and the conditions imposed on the grant of tenements relate to matters, including the environment, payment of annual rent
and, for prospecting licences, exploration licences and mining leases, meeting the prescribed minimum annual expenditure
commitments. If a tenement holder fails to comply with a condition of a mining tenement, the Minister or Warden may impose a fine or
order that the relevant mining tenement be subject to forfeiture.
Royalties are payable to the state based on the amount of ore produced or obtained from a mining tenement. A quarterly production
report must be filed, and royalties are calculated ad valorem at a fixed rate of 2.5% of royalty value in respect of gold, and at other rates
(depending on the relevant mineral) in respect of ore produced or obtained from a mining tenement in excess of 2,500 ounces of gold
metal. The royalty value of gold is the amount of gold produced during each month in a relevant quarter multiplied by the average gold
spot price for that month.
Land claims
As a result of a decision by the High Court of Australia, the Native Title Act was enacted to recognise and protect existing native title
rights by providing a mechanism for the determination of native title claims and a statutory right for native title claimants or determined
rights holders to negotiate, object, and/or be consulted when, among other things, certain acts (including the grant of mining tenements)
are proposed, or there is an expansion of, or change to, existing rights and interests in the land which affects those native title rights
and which constitutes a “future act” under the Native Title Act.
Most of Gold Fields’ tenements are currently subject to native title claims and/or a determination of native title. However, most of
Gold Fields’ tenements were granted prior to 1 January 1994 and tenements granted prior to 1 January 1994 are not “future acts” thus
not legally required to comply with the aforementioned consultation or negotiation procedures. As a general rule, tenements granted
after 1 January 1994 do not need to comply with these procedures. Where tenements were granted between 1 January 1994 and
23 December 1996, Gold Fields believes it has complied with the conditions set out by the Native Title Act for those tenements to be
validly granted. Of those tenements granted after 23 December 1996 (or to be applied for in the future), Gold Fields has either entered
into (or will enter into) agreements with native title claimants or determined rights holders which provide the Company with security of
tenure or has utilised or will utilise a valid exemption from the consultation and negotiation process under the Native Title Act.
Therefore, any existing or future recognition of native title over any of these tenements will not have a material effect on Gold Fields’
tenure during the operation of these agreements.
Cultural heritage
Aboriginal cultural heritage sites, which refer to places and objects of cultural and/or spiritual significance, or which have archaeological,
ethnographic or historical significance, were protected under the AHA until 2021, when the Western Australian State Government
passed the ACH Act, which replaced the AHA in its entirety with effect from 1 July 2023. The ACH Act sought to fundamentally shift the
approach and expectations of industry proponents with respect to Aboriginal cultural heritage management, with a focus on
agreement-making with Aboriginal and Torres Strait Islander stakeholders on matters relating to cultural heritage identification and
protection, and to expand criminal offences and increase penalties (up to A$10 million for corporations). However, on 15 November
2023, the Western Australian Government repealed the ACH Act and reinstated the AHA with minor amendments. Additionally, the
Federal Aboriginal and Torres Strait Islander Heritage Protection Act 1984 (Cth) enables government to intervene to preserve and
protect cultural heritage sites of particular significance, but to date, has been rarely used.
Gold Fields is aware of the existence of actual and potential Aboriginal cultural heritage sites throughout its area of operations in
Western Australia. Cultural heritage surveys, conducted with Aboriginal stakeholders and experts, are used by Gold Fields to identify
places that contain cultural heritage values so that disturbance to these places can be avoided where possible. In all other cases,
relevant approvals are obtained from the Minister for Aboriginal Affairs in accordance with the applicable legislation. Gold Fields has no
planned applications for approval under the applicable legislation, or planned activities in areas where approvals have been previously
granted, for the foreseeable future.
South Africa
Environmental
Gold Fields’ South African operation is subject to various laws that relate to the protection of the environment. The South African
Constitution, NEMA and related pieces of legislation, grant legal standing to a wide range of interest groups to bring legal proceedings
to enforce environmental rights against private entities and the South African Government.
The DMRE is the competent authority for the mining industry to grant environmental authorisations under NEMA. The DFFE is the
appeal authority for these authorisations. Moreover, NEMA provides that every holder of a mining right will remain responsible for any
environmental liability due to pollution or ecological degradation. They will also be responsible for the pumping and treatment of
polluted or extraneous water and the management and sustainable closure thereof. If these obligations are contravened, the holder of
a mining right and its directors may be held criminally liable.
South African mining companies are required by law to undertake rehabilitation work as part of their ongoing operations in accordance
with an approved environmental management plan (EMP) approved under NEMA, which includes a mine closure plan. Gold Fields funds
its ongoing environmental rehabilitation costs as part of its operating cash flows. Gold Fields’ long-term closure costs are funded by
making cash contributions into an environmental trust fund, as well as providing financial guarantees. The difference between the cash
closure contributions made to the environmental trust fund to date and the final closure cost estimate are funded through insurance
guarantees. These costs are collectively referred to as the “Financial Provision”. In fiscal 2022, an EMP performance assessment was
undertaken at South Deep, with no major findings raised. Gold Fields achieved an assessment score of 98% as compared to 96%,
which was achieved in the prior performance assessment year. A final report has been submitted to the DMRE.
In 2015, the Minister of Forestry, Fisheries and the Environment published proposed amendments to the Regulations Pertaining to the
Financial Provision for Prospecting, Exploration, Mining or Production Operations (Financial Provision Regulations of 2015). The mining
industry has been engaging the DFFE, through the MCSA, regarding the Financial Provision Regulations of 2015 and such
engagements have resulted in further proposed amendments thereto. On 1 September 2023, the enforceability of the Financial
Provision Regulations of 2015 was again postponed until 19 February 2024 to accommodate further engagements. As such, mining
companies must currently comply with approved EMPs and the MPRDA with respect to the Financial Provision Regulations of 2015.
Through the MCSA, the mining industry continues to work with the regulator on amendments to the Financial Provision Regulations of
2015.
In line with the “One Environmental System”, the National Water Act, No. 36 of 1998 (NWA) requires the Department of Water and
Sanitation to align and integrate the process for consideration of a water use licence with the timeframes of applications for prospecting
and mining rights under the MPRDA and environmental authorisations under NEMA. A water use licence is required before mining
operations can commence and the NWA includes a provision which gives a third party the right to appeal directly to the Minister of
Water and Sanitation regarding an application for such licence. An appeal by a third party may therefore delay a mining project despite
the granting of a mining right and environmental authorisation.
Under the NWA, all water in the hydrological cycle is under the custodianship of the South African Government held in trust for the
people of South Africa. In addition, the NWA governs waste and wastewater discharges that may impact a water resource. Gold Fields
continues to use all reasonable and practical measures to remove underground water to permit the routine safe functioning of South
Deep. The water management systems at South Deep have been reviewed to ensure compliance with the approved 2021 licence
conditions and regulations. Gold Fields maintains water monitoring and audit programmes that align with its 2021 water licence.
Under the National Environment Management: Air Quality Act, No. 39 of 2004 (AQA), the South African Government has established
minimum emission standards for certain activities which result in air emissions and for which Atmospheric Emissions Licences (AELs)
must be held. Non-compliance with these minimum emissions standards is an offence. South Deep mine undertakes activities which
result in atmospheric emissions, as provided for by the AQA. In 2022, the AEL that was granted to South Deep was renewed by the
Rand West City Local Municipality. This AEL authorises South Deep to undertake smelting activities under AQA.
The South African Carbon Tax Act (together with the South African Customs and Excise Act, which contains provisions related to the
administrative arrangements for the collection of carbon tax revenues by the South African Revenue Service) that has been in effect
since 2019 aims to reduce greenhouse gas emissions. For 2022, the rate for carbon tax was R144 per tonne of carbon dioxide-
equivalent emissions. and from January 2023, the carbon tax rate was R159 per tonne of carbon dioxide-equivalent emissions. This tax
rate is set to increase progressively in line with annual inflation in South Africa in order to reach R194 (approximately U.S.$11.08 at an
average projected exchange rate of R17.50/U.S.$1) per tonne of carbon dioxide equivalent by 2025. For more information regarding the
Carbon Tax Act, see “—Risk Factors—Increasing regulation of environmental and sustainability matters such as greenhouse gas
emissions and climate change may materially adversely affect Gold Fields’ operations”.
In South Africa, the National Environmental Management Waste Act, No. 59 of 2008 (Waste Act) is the principal legislation that governs
waste management, including waste management facilities. The Waste Act requires licences for activities relating to the establishment
of waste management facilities and reclamation to be obtained. While residue stockpiles and residue deposits (as defined in the
MPRDA) were historically regulated as part of a mine's approved EMP and specifically excluded from the ambit of the Waste Act, this
exclusion no longer applies. Accordingly, residue stockpiles and residue deposits now fall within the ambit of the Waste Act. In the
future, it is intended that such activities be regulated under NEMA, rather than the Waste Act.
Gold Fields also undertakes activities which are regulated by the National Nuclear Regulator Act, No. 47 of 1999 (NNR Act). The NNR
Act requires Gold Fields to obtain authorisation from the National Nuclear Regulator (NNR) and undertake activities in accordance with
the conditions of such authorisation. Gold Fields’ South African operation possesses and maintains Certificates of Registration issued by
the NNR as required under the NNR Act.
Health and safety
The South African Mine Health and Safety Act No. 29 of 1996 (Mine Health and Safety Act) requires employers and others to ensure
their operating and non-operating mines provide a safe and healthy working environment, as far as reasonably practicable. Every
employer must also ensure, as far as reasonably practicable, that persons who are not employees, but who may be directly affected by
the activities at a mine, are not exposed to any hazards to their health and safety. The Mine Health and Safety Act provides for penalties
and administrative fines for non-compliance with its provisions. The Mine Health and Safety Act authorises the Mine Health and Safety
Inspectorate to restrict or stop work at any mine and requires an employer to take steps to minimise health and safety risks at any mine
and to impose administrative fines on an employer in the event of a breach of the Mine Health and Safety Act. The maximum
administrative fine that may be imposed is R1 million per offence. Any person, which may include an employer, who fails to comply with
a provision of the Mine Health and Safety Act commits an offence and may, if successfully prosecuted, be fined or imprisoned, or both.
In July 2022, the DMRE published a Mine Health and Safety Amendment Bill. The industry and the MCSA commented on this bill, but to
date no further developments have occurred.
The principal health risks associated with Gold Fields’ mining operations in South Africa arise from occupational exposure and
community environmental exposure to silica dust, noise, heat and certain hazardous substances, including toxic gases, water, soil or air
contamination and radioactive particulates. The most significant occupational diseases affecting Gold Fields’ workforce include lung
diseases (such as silicosis, tuberculosis, a combination of the two and chronic obstructive airways disease) as well as noise induced
hearing loss. The Occupational Diseases in Mines and Works Act, No. 78 of 1973 governs the payment of compensation and medical
costs related to certain occupational diseases, such as silicosis, contracted by persons employed in mines or at sites where activities
ancillary to mining are conducted. See “—Risk Factors—Gold Fields’ operations are subject to extensive environmental, health and
safety regulations, which could impose additional costs and compliance requirements and Gold Fields may face claims and liability for
breaches, or alleged breaches, of such regulations and other applicable laws”.
Silicosis and tuberculosis settlement
In 2018, a group of six South African mining companies, including Gold Fields, concluded a settlement agreement with the claimant
attorneys in a Silicosis and Tuberculosis class action. The Tshiamiso Trust has been established to carry out the terms of the settlement
agreement. The Tshiamiso Trust is responsible for ensuring that all eligible current and former mineworkers across southern Africa with
Silicosis or work-related Tuberculosis (or their dependents where the mineworker has passed away) are compensated pursuant to the
Silicosis and Tuberculosis class action settlement. By the end of March 2024, the Trust had paid out over R1.49 billion (U.S.$78.9 million)
to approximately 16,300 industry claimants.
Gold Fields has provided for the estimated cost of the above settlement based on actuarial assessments and the provisions of Silicosis
and Tuberculosis class action settlement agreement. At 31 December 2023, the provision for Gold Fields’ share of the settlement of the
class action claims and related costs amounted to U.S.$5.1 million (R93.8 million). The nominal value of this provision is U.S.$7.2 million
(R131.6 million). The ultimate outcome of this matter, however, remains uncertain, with the number of eligible workers (or their
dependents) successfully submitting claims and receiving compensation being uncertain. The provision is consequently subject to
adjustment in the future. See “Annual Financial Report—Notes to the consolidated financial statements—Note 38. Contingent
liabilities”.
Mineral rights
The MPRDA
The MPRDA, is the primary legislation regulating the mining industry in South Africa. Under the MPRDA, the South African Government
is the custodian of South Africa’s mineral and petroleum resources and has a duty to administer these resources for the benefit of all
South Africans. As a consequence, private ownership of minerals has been extinguished and owners of the surface rights to land have
no claim to the minerals found in, on or under the surface of their land. The DMRE is the government body which implements and
administers the MPRDA.
A company seeking to exploit mineral resources in South Africa is required to first obtain the appropriate right under the MPRDA. The
Minister of Mineral Resources and Energy in South Africa is authorised to grant or refuse applications for rights under the MPRDA. After
a mining right is granted under the MPRDA and registered pursuant to the Mining Titles Registration Act, No. 16 of 1967, the holder has
a limited real right in respect of the mineral and the land to which such right relates.
Under the MPRDA, the holder of a mining right must comply with the terms of the right, the provisions of the MPRDA, the environmental
authorisation (issued under the NEMA), the mining work programme and the SLP approved as part of the right. The SLP places
obligations on the mining right holder to, among other things, train employees of the mine in accordance with prescribed training
methodologies, achieve employment equity and human resource development in the mining company, improve housing and living
conditions of employees and set up local economic development projects. Compliance with each of the provisions of the MPRDA,
environmental authorisation, mining work programme and SLP is monitored by submission of periodic returns and reports by the holder
of the right to the DMRE. A mining right can be suspended or cancelled if the holder operates in breach of the MPRDA, a term or
condition of the right or an environmental authorisation, or if the holder of the right submits false, incorrect or misleading information to
the DMRE.
Gold Fields actively carries out mining activities in South Deep under the MPRDA. Gold Fields’ SLP for the 2018 to 2022 period has
been approved by the DMRE. Gold Fields resubmitted its new SLP to the DMRE for approval at the beginning of 2023. This SLP has not
yet been approved, but engagements are continuing with the DMRE. The issues raised by the DMRE are not material and have been
identified by the DMRE as administrative. The regulator’s concern relates to an administrative misalignment between South Deep’s
submitted SLP cycles and the prescribed five-year SLP cycles calculated since the inception of the South Deep converted Mining Right
in 2010. Submission of the reconstituted SLP Cycle III is imminent and South Deep is expecting guidance from the DMRE on the
approved submission date.
The 2018 Mining Charter
The 2018 Mining Charter (as read with the Implementation Guidelines for the 2018 Mining Charter), among other things, sought to link
mining rights with empowerment obligations. It is widely considered that the 2018 Mining Charter failed to bring about the legal certainty
in the South African mining industry that it was intended to create.
In 2021, following the filing of an application by the MCSA, the Gauteng Division High Court issued a judgement addressing certain key
elements of the MCSA’s application and set aside a number of specific clauses of the 2018 Mining Charter. Following the judgment,
the DMRE indicated that it intends to consider steps to achieve the empowerment objectives through amendments to the MPRDA.
Gold Fields will be required to evidence that it relies on the 2018 Mining Charter as a policy document and that it will use its best
endeavours to comply with the provisions that have not been set aside by the court.
See “—Risk Factors—Gold Fields’ mineral rights are subject to legislation, which could impose significant costs and burdens, certain
ownership requirements and possible penalties or forfeiture for non-compliance, the interpretation of which is the subject of dispute—
South Africa”.
The B-BBEE Act and the B-BBEE Amendment Act
The B-BBEE Act, No. 53 of 2003 (B-BBEE Act) established a national policy on broad-based black economic empowerment with the
objective of increasing the participation of Black people who were historically disadvantaged in South Africa. In 2014, the B-BBEE Act
was amended to, among other things, provide that the B-BBEE Act would trump the provisions of any other law in South Africa,
provided such conflicting law was in force prior to 24 October 2014.
Accordingly, the B-BBEE Act (and the B-BBEE Codes issued in terms thereof) would override the provisions and implementation of the
2018 Mining Charter to the extent of any inconsistency.
The Royalty Act
The Mineral and Petroleum Resources Royalty Act, No. 28 of 2008 imposes a royalty on refined and unrefined minerals payable to the
South African Government.
The royalty in respect of refined minerals (which include gold and platinum) is calculated by dividing EBIT by the product of 12.5 times
gross sales in respect of refined mineral resources calculated as a percentage, plus an additional 0.5%. EBIT refers to taxable mining
income (with certain exceptions such as no deduction for interest payable and foreign exchange losses) before assessed losses but
after capital expenditure. A maximum royalty of 5% of revenue has been introduced for refined minerals. Gold Fields Operations Limited
and GFI Joint Venture Holdings (Pty) Ltd, currently pay a royalty of 0.5% of revenue earned, due to a historical unredeemed capital
expenditure balance that is utilised as a deduction in calculating the royalty. As the mine ramps up production, and reduces the
unredeemed capital balance, the royalties will increase to approximately 3% over the life of mine.
The Income Tax Act
Under South African tax legislation, gold mining companies and non-gold mining companies are subject to corporate income tax at
different rates. The corporate tax rate for a gold mining company is determined according to a formula which is affected by the
profitability of the applicable mining operation. Accordingly, depending on the profitability of mining operations in South Africa, the
effective tax rate can be significantly different from year to year.
Land expropriation
On 28 September 2022, the Expropriation Bill B23-2020 (Expropriation Bill) was tabled in the South African Parliament and approved
by the National Assembly. The Expropriation Bill is currently being considered by the National Council of Provinces, where after, if
approved by a supporting vote of at least six provinces, the Expropriation Bill will be sent to the President for assent and proclaimed
as law.
The Expropriation Bill aims to repeal and replace South Africa's existing Expropriation Act, No. 63 of 1975 (1975 Expropriation Act), which
was enacted prior to the promulgation of the South African Constitution.
Section 25 of the Constitution provides that land may only be expropriated for a public purpose or in the public interest and then only
against payment of “just and equitable” compensation. Market value is only one of several factors that may be considered to determine
the amount of compensation, but the South African Government has historically paid market value compensation for expropriating land.
In response to growing discontent at the pace of land reform, expropriation without compensation (EWC) has been identified by the
South African Government as a “key mechanism” to be used to progress land reform.
The Expropriation Bill provides that EWC may be just and equitable where land is expropriated in the public interest if, amongst other
things:
•the land is held speculatively by the owner;
•the land was acquired for no consideration by an organ of state, and that organ of state is not using the land for its core functions and
will likely not require the land for its future activities;
•the land has been abandoned;
•the market value of the land is equivalent or less than the present value of the direct state investment in the acquisition and beneficial
capital improvement of the land; and
•the nature or condition of the property poses a health, safety or physical risk to persons or other property.
In parallel with the attempt to change South Africa's expropriation laws, an attempt to amend the Constitution was made in 2021. The
aim of the amendment was to introduce an express statement into the Constitution that expropriation could be for no compensation
in certain circumstances. The amendment failed in December 2021 and it is consequently unclear whether the Expropriation Bill, if
proclaimed as law, would be constitutionally effective.
Exchange controls
South African law provides for Exchange Control Regulations which, among other things, restrict the outward flow of capital from the
CMA consisting of South Africa, Namibia, Lesotho and Eswatini. The Exchange Control Regulations are applied throughout the CMA
and regulate international transactions involving South African residents, including companies. The South African Government has
committed itself to gradually relaxing exchange controls and various relaxations have occurred in recent years, but capital movements
are still controlled. Moreover, South African companies are not permitted to maintain foreign bank accounts without an appropriate
exchange control approval.
SARB approval is required for Gold Fields and its South African subsidiaries to receive and/or repay loans to non-residents of the CMA.
Funds raised outside of the CMA by Gold Fields’ non-South African resident subsidiaries (whether through debt or equity) can be used
for overseas expansion. Gold Fields and its South African subsidiaries would, however, require approval from the Financial Surveillance
Department of the South African Reserve Bank in order to provide guarantees for the obligations of any of Gold Fields’ subsidiaries with
regard to funds obtained from non-residents of the CMA. Debt raised outside the CMA by Gold Fields’ non-South African subsidiaries
must be repaid or serviced by those foreign subsidiaries. Absent an appropriate exchange control approval, income earned in South
Africa by Gold Fields and its South African subsidiaries cannot be used to repay or service such foreign debts.
Transfers of funds from South Africa for the purchase of shares in offshore companies or for the creation or expansion of business
ventures offshore require SARB approval. Where the investment is a new outward foreign direct investment where the total cost does
not exceed R5 billion per company per calendar year, the investment application may be approved by an Authorised Dealer, subject to
all existing criteria and annual reporting obligations. If the investment exceeds R5 billion, the Authorised Dealer must refer the request
to the Financial Surveillance Department for approval. Gold Fields must, for statistical purposes, acquire at least 10% of the foreign
target company’s voting rights. Should this reduce to below 10%, such information must be reported to the Financial Surveillance
Department.
A so-called “loop structure” is created where a South African exchange control resident (such as Gold Fields) sets up an offshore
structure which re-invests into the CMA by acquiring shares and/or other interests (e.g., loans) in a CMA company or a CMA asset. From
1 January 2021 and subject to annual reporting requirements, loop structures have been allowed if placed on record with the Financial
Surveillance Department and if the acquisition of the South African assets takes place on an arm’s length basis with an inflow of foreign
currency.
Gold Fields must obtain approval from the Financial Surveillance Department regarding any capital raising of a currency other than the
Rand and conditions may be imposed on Gold Fields’ use of the proceeds of any such capital raising. Such conditions may limit Gold
Fields’ ability to retain the proceeds of the capital raising outside South Africa or require that Gold Fields seeks further approval prior to
applying any such funds for a specific purpose.
Ghana
Environmental
Environmental laws and regulations in Ghana have their roots in the 1992 Constitution (Ghanaian Constitution) which charges both the
state and others with a duty to take appropriate measures to protect and safeguard the environment. Mining companies are required,
under the Environmental Protection Agency Act, 1994 (Act 490) (EPA Act), Environmental Assessment Regulations 1999 (L.I. 1652) and
Water Use Regulations, 2001 (L.I. 1692), to obtain all necessary environmental approvals from the Environmental Protection Agency
(Ghanaian EPA), a body set up under the EPA Act, and, where applicable, a water use permit from the Water Resources Commission
before undertaking mining operations. There are further requirements under the Minerals and Mining (Health, Safety and Technical)
Regulations, 2012 (L.I. 2182) to obtain the necessary operating permits from the Inspectorate Division of the Minerals Commission for the
operation of mines. The Minerals and Mining Act also requires that mining operations in Ghana comply with all other laws for the
protection of the environment. Non-compliance with the provisions of these laws could result in the imposition of fines and in some
cases a term of imprisonment.
Under the relevant environmental laws and regulations, mining operations are required to undergo an environmental and social impact
assessment (ESIA) process and obtain an initial social license to operate from the community and an environmental permit prior to
commencing operations. Environmental Management Plans (EMPs) are prepared and submitted to the Ghanaian EPA 18 months after
the initial issuance of the permit and then every three years thereafter. Approval of the EMP may result in the issuance of an
environmental certificate, subject to any conditions determined by the Ghanaian EPA. Damang submitted its revised EMP to the
Ghanaian EPA in September 2023 (for the 2023-2026 period) and Tarkwa submitted its revised EMP in November 2021 (for the
2022-2024 period). Damang and Tarkwa have paid the requisite processing and permit fees and are yet to receive the environmental
certificates to be issued by the Ghanaian EPA.
The laws also require mining operations to rehabilitate land disturbed as a result of mining operations pursuant to a reclamation security
agreement (RSA) between the mine and the Ghanaian EPA. RSAs typically require mining companies to secure a percentage (typically
between 50% and 100%) of the current estimated rehabilitation costs by posting reclamation bonds underwritten by banks and
restricted cash. Gold Fields’ Damang and Tarkwa mines maintain reclamation bonds underwritten by banks and restricted cash in order
to secure a percentage of their total mine closure liability. RSAs also require mining companies to have an environmental cost
reclamation plan, which includes two cost estimates, namely the cost of rehabilitating the mining area at the end of the life of the mine
as well as the cost of rehabilitating the mine as at the date of the reclamation plan. These estimates are reviewed annually and updated
every two years. Mining companies also must include an update on their rehabilitation completion progress in their annual
environmental reports.
In response to the threats posed by climate change and in line with its obligations as a party to the United Nations Framework
Convention on Climate Change (UNFCCC), the Ghanaian government has at various times implemented climate change policies and
initiatives including the National Climate Change Adaptation Strategy (NCCAS, 2012), the National Climate Change Policy (NCCP, 2013),
the Nationally Determined Contributions (NDC, 2015), and the National Climate Change Master Plan Action Programmes for
Implementation. Ghana has committed to reducing its GHG emissions and climate adaptation in several priority sectors under its NDC,
including mass transit, infrastructure, land use and food production, energy, and forest and water resources management. Ghana’s
present NCCP is Ghana’s integrated response to climate change. It provides a defined pathway for dealing with the challenges of
climate change within the current socio-economic context and looks ahead to the opportunities and benefits of a green economy. The
policy aims to ensure a climate resilient and climate compatible economy, while achieving sustainable development through equitable
low-carbon economic growth.
Health and safety
A mining company is statutorily obliged to, among other things, take steps to ensure that the mine is managed in accordance with
applicable legislation, including the Minerals and Mining (Health, Safety and Technical) Regulations, 2012 (L.I 2182), to ensure the safety
and wellbeing of its employees. Additionally, both the Damang and Tarkwa mines are required, under the terms of their respective
mining leases, to comply with the reasonable instructions of the Chief Inspector of Mines regarding health and safety at the mines.
A violation of the provisions of the health and safety regulations or failure to comply with the reasonable instructions of the Chief
Inspector of Mines could lead to, among other things, an improvement or prohibition notice or a shutdown of all or a portion of the mine.
The Damang and Tarkwa mines have potential liability arising from injuries to, or deaths of, workers, including, in some cases, workers
employed by their contractors. Although Ghanaian law provides statutory workers’ compensation for injuries and fatalities to workers,
it is not the exclusive means by which workers, or their personal representatives, may claim compensation. Both companies’ allotted
insurance for health and safety claims and the relevant workers’ compensation may not fully cover them in respect of all liability arising
from any future health and safety claims, since employees may still resort to other claims through the courts and/or legal system.
Mineral rights
The Minerals and Mining Act came into force on 31 March 2006. Although the Minerals and Mining Act repealed the Minerals and
Mining Law, and the amendments to it, the Minerals and Mining Act provides that leases, permits and licences granted or issued under
the repealed laws will continue under those laws unless the Minister responsible for minerals provides otherwise by regulation. It also
provides that the Minister responsible for minerals shall grant the extension of the term of a lease on conditions specified in writing as
long as the holder of mineral rights has materially complied with its obligations under the Act. Management believes that all of
Gold Fields’ operations in Ghana are materially compliant with the relevant legislative requirements.
The major provisions of the Minerals and Mining Act include:
•the government of Ghana’s right to a free carried interest in mineral operations of 10% and the right to a special share (discussed
below); and
•mining companies which have invested or intend to invest at least U.S.$500 million (as Gold Fields has) may benefit from stability and
development agreements, relating to both existing and new operations, which will serve to protect holders of current and future
mining leases for a period not exceeding 15 years against changes in laws and regulations generally and, in particular, relating to
customs and other duties, levels of payment of taxes, royalties and exchange control provisions, transfer of capital and dividend
remittances. A stability and development agreement may also contain further provisions relating to the mineral operations and
environmental issues and each agreement is subject to the ratification of the Ghanaian Parliament.
In 2010, the Minerals and Mining Act was amended to provide for a fixed royalty rate of 5% of the total revenue earned from minerals
obtained.
In 2012, the Ghanaian Parliament passed an Act that increased taxes on mining companies from 25% to 35% and reduced the capital
allowance regime from 80% for the first year with reductions to a uniform regime of 20% over five years. In 2015, new legislation
prohibited the deferral of unutilised capital allowances if not used in the tax year.
In 2016, the Parliament of Ghana ratified development agreements (Development Agreements) between Abosso, Gold Fields Ghana
and the Government of Ghana. The Development Agreements provide for, among other things, a fixed corporate tax rate of 32.5% and
exemption from certain import duties. In addition, Gold Fields pays royalties on a sliding scale, replacing the fixed rate. Under the
Development Agreements, Gold Fields committed to pay compensation for assets used at Tarkwa since the divestiture of the Ghanaian
State Gold Mining Company and, in years where a dividend is not declared and paid, to make a payment of 5% of profits after tax in the
relevant year to the government (which will be offset against the eventual dividend payment).
Under the Ghanaian Constitution, any transaction, contract or undertaking involving the grant of a right or concession for the
exploitation of any mineral, water or other natural resource of Ghana is subject to ratification by the Ghanaian Parliament. In 2018, two
members of the Ghanaian Parliament filed a lawsuit against the Ghanaian Attorney General, the Minerals Commission and 35 mining
and cement manufacturing companies including Gold Fields (the Ratification Case) seeking a declaration that all transactions, contracts
and undertakings between mining companies and the government of Ghana which have not been ratified by the Ghanaian Parliament
constitute a violation of the Ghanaian Constitution. In addition, the plaintiffs have sought an order for the recovery of such mineral
resources (or their cash equivalent) from mining companies for carrying out mining operations when their transactions with the
government of Ghana had not been ratified by the Ghanaian Parliament.
Gold Fields’ position is that it is the duty of the Minister of Lands and Natural Resources to present mining leases to the Ghanaian
Parliament for ratification, and Gold Fields has complied with all statutory requirements leading to the execution of the mining leases. In
addition, Gold Fields has argued that the economic ramifications of granting the relief sought by the plaintiffs is incalculable and would
impact jobs, community development and revenue. The Supreme Court of Ghana has yet to set a date for the hearing of the case, and
as such, it is difficult to predict the outcome of this litigation, including its impact on Gold Fields, at this stage. However, as noted below,
all of Gold Fields’ existing mining leases have now been ratified by the Ghanaian Parliament.
Abosso holds the mining lease in respect of the Damang mine, which was granted in 1995 and expires in 2025, as well as the mining
lease in respect of the Lima South pit that was granted in 2006 and extended in 2018 to 2036. As with the Tarkwa and Teberebie
mining leases, these leases are renewable under their terms and the provisions of the Minerals and Mining Law by agreement between
Abosso and the Government of Ghana.
Gold Fields Ghana has two major mining leases in respect of its mining operations, namely the Tarkwa property lease and the
Teberebie property lease. There are three mining leases under the Tarkwa property lease, all of which were granted in 1997 and will
expire in 2027, and two mining leases under the Teberebie property lease, which were granted between 1988 and 1992, and have
since been extended by the Minister of Lands and Natural Resources in 2018 to 2036. On 22 December 2020, the Ghanaian
Parliament ratified the Teberebie mining lease. All of Gold Fields’ existing mining leases in Ghana have been ratified by the Ghanaian
government.
Fiscal regime
Several regulatory/statutory changes were made to Ghana’s fiscal regime in 2023, including, among others:
•The Growth and Sustainability Levy Act, 2023 (Act 1095) has replaced the National Fiscal Stabilisation Levy Act, 2013 (Act 162) and a
rate of 1.0% of production revenue will now be applicable to entities operating in the extractive sector.
In April and July 2018, after field audits, the GRA imposed customs penalties of approximately U.S.$14.4 million and U.S.$3.2 million on
Abosso and Gold Fields Ghana, respectively. The GRA alleged that both mines had breached provisions of Ghana’s customs laws by
not giving the GRA notification prior to transferring assets originally imported on concessionary import duty rates. Similar penalties were
imposed on other mining companies.
Gold Fields contested the penalties and assessments on the basis that: (i) there had been no loss of revenue to Ghana; and (ii) there
were no express provisions in Ghana’s customs laws requiring notification prior to transferring assets. Gold Fields received a legal
opinion from external counsel agreeing with Gold Fields’ legal position. An appeal was made to Ghana’s Minister of Finance who
directed the GRA to immediately suspend enforcement while Ghana’s Ministry of Finance reviewed the relevant documents that
Gold Fields and other affected companies agreed to submit.
Ghana’s Deputy Minister for Finance responded to the appeals directing Gold Fields to pay the penalties as they were originally
imposed. However, Ghana’s Deputy Minister of Finance failed to address the audit findings of the GRA. As a result, Abosso and
Gold Fields Ghana appealed this decision. An independent audit firm engaged by Gold Fields has confirmed that, because there were
no express provisions in Ghana’s custom laws requiring notification prior to transferring assets (as noted by Gold Fields in its appeals),
the penalties imposed by the GRA should not be upheld. Given the GRA has conducted subsequent audits without raising this issue,
Gold Fields does not expect the GRA will pursue this matter further.
A negotiated position was reached with the GRA in November 2022 after in 2021, the GRA issued a final Transfer Pricing audit report
for the 2014 – 2019 years of assessment for Abosso and Gold Fields Ghana and assessed total liabilities, including penalties and
interest of U.S.$31.9 million and U.S.$17.3 million, respectively. Gold Fields had objected to the GRA’s findings while paying 30% of
the penalty imposed in accordance with section 42(5)(b) of the Revenue Administration Act, 2016 (Act 915). In December 2022, an
additional payment of U.S.$8.18 million was made for Gold Fields Ghana and Abosso submitted a request to offset the final U.S.
$3 million credit against the corporate income tax due. Additionally, a waiver application for the interest and penalties levied was
submitted under the tax amnesty window which expired at the end of December 2022. Gold Fields does not expect the GRA will
pursue this matter further.
Further, on 10 October 2022, the GRA issued findings following their audits of the Damang and Tarkwa mines for fiscal years 2018 to
2020, which focused primarily on the tax treatment of waste stripping costs. The total imposed liabilities totalled U.S.$124 million,
including interest, with U.S.$32 million for Abosso and U.S.$91.9 million for Gold Fields Ghana. Gold Fields believed imposed liabilities
infringed on the rights conferred under the respective Development Agreements ratified by Ghana’s Parliament. After the submission of
various waiver requests, Gold Fields paid U.S.$15 million (U.S.$1.7 million for Abosso and U.S.$13.3 million for Gold Fields Ghana) in
relation to non-Development Agreement issues only. Following the variation payment, discussions with the GRA have concluded with
the issuance of new audit reports by the GRA in May 2023. The final liability for Abosso including interest was U.S.$4 million. The final
liability for Gold Fields Ghana including interest was U.S.$15.6 million. The liabilities for both Abosso and Gold Fields Ghana were largely
offset by the deposit payments pursuant to the waiver requests. The amnesty filed by Abosso and Gold Fields Ghana catered for the
interest/penalties arising from the audit.
Procurement
Under the Minerals and Mining Regulations 2020 (L.I. 2431), holders of mineral rights are required to comply with specified procurement
rules which require such holders to purchase goods and services from Ghanaian companies and publish a procurement plan setting
out the goods and services that will be procured in Ghana.
Previously, in 2019, the Minerals Commission had imposed additional fines of approximately U.S.$1.2 million and approximately U.S.
$1.9 million on Abosso and Gold Fields Ghana, respectively, for alleged breaches of their procurement plan for 2018. Gold Fields
contested the penalties and is actively engaging with the Minerals Commission in an attempt to overturn the penalties. Gold Fields has
received an independent legal opinion supporting its position under the Minerals and Mining Act.
At an Executive Council meeting of the Ghana Chamber of Mines held in November 2022, the Chief Executive Officer of the Minerals
Commission asked mining companies to pay penalties imposed for alleged breaches of local procurement regulations. Gold Fields paid
a reduced penalty of approximately U.S.$1.7 million. Following representations made by Gold Fields, the Mineral Commission agreed to
reduce the penalties for Tarkwa mine from approximately U.S.$8.7 million to U.S.$1.7 million. Abosso and the Minerals Commission are
yet to conclude a review of the penalties imposed on Abosso.
Government option to acquire shares of mining companies
Under Ghanaian law, the government is entitled to a 10% interest in any Ghanaian company which holds a mining lease in Ghana,
without the payment of consideration for the shares therein. The government of Ghana has already received this 10% interest in each of
Abosso and Gold Fields Ghana. The government also has the option, under PNDCL 153, to acquire an additional 20% interest in the
share capital of mining companies whose rights were granted under PNDCL 153, which it exercised in respect of Gold Fields Ghana and
subsequently transferred the interest back to Gold Fields. The government of Ghana retains the option to purchase an additional 20%
of the share capital of Abosso. As far as management is aware, the government of Ghana has not exercised this option for any other
gold mining company in the past, other than Gold Fields Ghana.
Under the Minerals and Mining Law and the Minerals and Mining Act, the government of Ghana has a further option to acquire a
“special share” in a mining company for no consideration or in exchange for agreed upon consideration. This special share, if acquired,
would entitle the government to attend and speak at any general meeting of shareholders, but does not carry any voting rights. In
addition, the special share does not entitle the government of Ghana to distributions of profits of the company. The written consent of
the government of Ghana is required to make any amendment to a company’s regulations relating to the government of Ghana’s option
to acquire a special share. The government of Ghana has agreed not to exercise this option in respect of Gold Fields Ghana but has
retained this option for Abosso.
Right of pre-emption
Under the Minerals and Mining Act, the Minister of Lands and Natural Resources has the right of pre-emption over all minerals obtained
in Ghana and products derived from the refining or treatment of these minerals. In 2018, the Minister of Lands and Natural Resources
informed the Chamber of the government of Ghana’s intention to exercise its right of pre-emption to acquire up to 30% of all gold
mined in Ghana. However, there has been no further action taken. Notwithstanding the right of pre-emption, the Ghanaian Constitution
provides protection from the deprivation of property and requires the government of Ghana to make prompt payment of fair and
adequate compensation where the government of Ghana acquires private property on a compulsory basis.
Pursuant to the gold purchase programme plan, on 3 November 2022, Gold Fields entered into a supply agreement with the Bank of
Ghana for the sale of 30,000 ounces of gold for 2022. Under the Gold Purchase Agreement, Gold Fields agreed to sell 15,000 ounces
of gold each from Damang and Tarkwa to the Bank of Ghana in 2022, subject to production levels at each mining site. Gold Fields sold
26,000 ounces to the Bank of Ghana due to the delay in concluding the agreement. Gold Fields and the Bank of Ghana signed an
amended Gold Purchase Agreement dated 20 April 2023 by which Abosso and Gold Fields Ghana agreed to sell 27,260 ounces and
109,109 ounces of gold respectively in 2023 to the Bank of Ghana. The sale was subject to production levels at each mining site. Any
subsequent gold purchase will be subject to agreement between the parties. Gold Fields sold 127,397.61 ounces to the Bank of Ghana
in 2023, with Abosso selling 28,444.90 ounces and Gold Fields Ghana selling 98,952.72 ounces.
At the end of November 2022, the Minister of Lands and Natural Resources informed the Minerals Commission and Precious Minerals
Marketing Company Ltd (PMMC) of the Ghanaian government’s directive to exchange gold produced in Ghana for the purchase of oil
products from 1 January 2023, under a programme called “Gold for Oil Programme”.
Local refinement
The government of Ghana has signalled its intention to undertake various interventions in relation to gold mining, including establishing
a gold refinery in Ghana and has plans to locally refine 30% of the gold produced in the country. Further, the government of Ghana
proposed that members of the Chamber contribute part of their production to enable a local refinery to meet a minimum 10-ton
requirement. To date, Ghana’s wholly state-owned PMMC has entered into a joint venture with Rosy Royals Minerals Limited of India to
establish a refinery (Royal Ghana Gold Ltd), which is currently sourcing its gold from small scale gold producers, while it seeks LBMA
certification. The Chamber insists on LBMA certification as a pre-requisite for dealing with any local refinery. The discussions are
ongoing, focusing on ensuring that a move to locally refined gold does not become detrimental to the mining industry.
Exchange controls
Under Ghana’s mining laws, the BoG or the Minister for Finance may permit the holder of a mining lease to retain a percentage of its
foreign exchange earnings for certain expenses in bank accounts in Ghana. Under a foreign exchange retention account agreement
with the government of Ghana, and in line with the Development Agreements, Abosso and Gold Fields Ghana are required to repatriate
30% of their revenues derived from the Damang and Tarkwa mines to Ghana and use the repatriated revenues in Ghana or maintain
them in a Ghanaian bank account.
Other regulatory changes
Other proposed fiscal measures in the 2024 Ghanaian Budget Statement include:
•The use of the Commissioner-General’s certified invoice as the basis for all deductible income tax expenses.
•Review of rates and fees under the Stamp Duty Act 2005 (Act 689) and expanding the bands subject to ad valorem taxes.
•Enactment of a Business Regulatory Reform Bill to enhance quality and transparency of regulatory administration in Ghana.
•Amendment of the GIPC Act to introduce various reforms for foreign investment in Ghana.
•Expansion of environmental excise duty to cover, among others, industrial emission.
Peru
Environmental
The environmental impact of mining activities in Peru is regulated by the Regulation on Environmental Protection and Management for
Mining Exploitation, Beneficiation, General Labour, Transportation and Storage Activities and the Regulation on Environmental
Protection for Mining Exploration. These regulations require the following environmental instruments to be produced in order to perform
mining activities:
•Technical Environmental File (FTA), Environmental Impact Declaration (DIA) and Semi-Detailed Environmental Impact Assessment (SD-
EIA): FTA, DIAs and SD-EIAs are required for mining exploration projects, depending on the magnitude and impact that the activities
intended to be carried out may have on the environment. FTA, DIAs and SD-EIAs contain detailed environmental and social
information on the area where exploration activities will be carried out, on the project and works to be performed, and on the
measures that will be taken to control and mitigate any environmental impacts caused.
•EIA: EIAs are required for new projects, expansions or changes to existing operations and projects moving from the exploration stage
to development. EIAs must evaluate the physical, biological, socio-economic and cultural impacts on the environment resulting from
the operation of mining projects. The initiation of exploitation activities needs to have been previously authorised by the DGM.
In addition, for the modification of mining projects with an insignificant environmental impact, a Supporting Technical Report (STR), which
is a simplified amendment to an EIA with a significantly shorter period of evaluation and approval, must be submitted to the authority.
However, since 2020 it has not been possible to successively modify or expand the same mining component via an STR if the
accumulated impact of the modifications can have significant negative environmental impacts with respect to those that were
contemplated in the EIA. If this is the case, a modification of the EIA is required to be undertaken. In 2022, an STR was approved for
La Cima.
In 2020, Gold Fields commenced the process for the ninth EIA update for Cerro Corona, which, once approved, will officially extend
the LOM from 2026 to 2030. On 31 January 2024, the first favourable technical opinion was issued, with further opinions to follow.
Gold Fields’ additional public participation plan, submitted in accordance with new regulations issued in 2022, was approved in
January 2023. Execution of the plan began in 2023.
Furthermore, the Mine Closure Law regulates mine closure, requiring mining companies to ensure the availability of the resources
necessary for the execution of an adequate mine closure plan, including a mine closure cost estimate. The law obliges holders of
mining concessions to furnish guarantees (such as stand-by letters of credit) in favour of the MEM to ensure that they will carry out their
mine closure plans in accordance with the environmental protection regulations and to ensure that the MEM has the necessary funds to
execute the mine closure plan in the event of non-compliance. The Mine Closure Law requires mining companies to provide yearly
bank guarantees for definitive, final and progressive closure obligations.
La Cima’s mine closure plan for Cerro Corona was approved in 2008 and the seventh update of the mine closure plan was approved
by the MEM in July 2022. This mine closure plan is guaranteed by a bond letter of approximately U.S.$91.19 million, issued by Credit
Bank Peru and Scotiabank Peru.
Water quality standards
Under Supreme Decree No. 15-2015-MINAM, holders of mining activities that were conducting environmental studies had to report to
the MEM on whether such instruments complied with the amended Peruvian ECA, or if they required an adjustment. In line with this
requirement, La Cima reported that its environmental study needed to be adjusted and submitted a response plan to the MEM. The
response plan was approved by the MEM in September 2021. The approved plan must be implemented by La Cima to comply with the
2015 Supreme Decree within three years of approval. A new water treatment plant is being constructed at La Cima as part of this
implementation.
Detailed mine closure activities, including post closure water treatment plans, must be submitted two years before mine closure, as
required by Peruvian legislation. Based on the current LOM for La Cima, the detailed mine closure plan will be submitted in 2028 as
operations are planned to end in 2030. Based on currently available information it has been concluded that Cerro Corona is not in
a position to calculate a reasonable and defensible cost estimate of the post-closure liability in relation to the management and, if
required, treatment, of surface water run-off.
A pilot test was conducted during 2023 to evaluate cover designs for closure of Cerro Corona.
Environmental sanctioning regime
Environmental compliance in Peru is mainly supervised by OEFA, as the governing body of the National System of Environmental
Assessment (Sistema Nacional de Evaluacion y Fiscalizacion Ambiental, or SINEFA) and the Environmental Supervisory Entity (Entidad
de Fiscalización Ambiental, or EFA). According to the current environmental regulation, there can be three types of EFA:
•National EFA: Some ministries and technical specialised organisations exercise functions of environmental supervision through their
departments, areas or environmental offices.
•Regional EFA: The regional governments exercise functions of environmental supervision through the areas of natural resources,
energy, mines and hydrocarbons, environmental health, fish farming and handcrafted fishing.
•Local EFA: The provincial and local municipalities exercise functions of environmental supervision through their environmental units.
In addition, specific licence or permit non-compliance is supervised by other specialised competent EFAs, such as the ANA.
Level 3 environmental incident
In 2018, Gold Fields experienced a level 3 environmental incident in Peru when water containing tailings from the Cerro Corona TSF
flowed through an authorised diversion pipe to La Hierba creek reaching the Tingo river. As a result of the incident, ANA imposed fines
against Gold Fields of approximately U.S.$1.4 million. Gold Fields appealed both fines and received a favourable final result in one of
these procedures with ANA revoking the fine (approximately U.S.$100,000). Therefore, only the fine of approximately U.S.$1.3 million
remains pending. The OEFA imposed a fine against Gold Fields of approximately U.S.$2.8 million. Gold Fields paid the fine imposed by
OEFA and challenged it on 10 August 2022 in a judicial procedure. On 6 June 2023, Gold Fields filed an appeal before the Superior
Court of Justice, which is still being evaluated by the court.
Socio-environmental matters
Peru’s Environmental Act enables individuals to take part in a responsible manner in decision-making processes related to, and in the
establishment and application of, environmental policies and measures. Such participation includes:
•Citizen participation: The mining industry in Peru is governed by citizen participation regulations that ensure the responsible
participation of individuals in the definition and application of measures, actions and decisions made by competent authorities
regarding sustainable operation of mining activities in the country. Mining operators must establish citizen participation mechanisms
throughout the life of their projects from initial exploration to mine closure.
•Right to prior consultation: Certain recognised indigenous or tribal populations have the right to be consulted before the approval of
legislative or administrative measures (through the Law of Prior Consultation of Indigenous or Recognised Tribal Populations).
•Convention 169 of the International Labour Organisation: This law establishes that the Peruvian government must consult in advance
with indigenous or tribal populations on legislative or administrative measures (including pending claims for mining concessions) that
may directly affect the collective rights related to their physical existence, cultural identity, quality of life or development. This duty of
consultation is owed by the Peruvian government, not Gold Fields or investors.
While the final decision to move forward with legislative or administrative measures on which consultation is sought rests with the
Peruvian government, even in the absence of agreement, the Peruvian government still has an obligation to take all necessary
measures to ensure that the collective rights of indigenous or tribal populations are protected. Accordingly, the approval of an EIA
(or an update to an EIA) must take into consideration the indigenous or tribal populations located in a project’s impact area. In
connection with the approval of La Cima’s ninth EIA update for Cerro Corona, a citizen participation mechanism under the
Environmental Act was performed during 2021 and continued in 2022 and 2023.
Climate change regulation
In 2018, the Peruvian Ministry of Environment approved the Climate Change Framework Act, regulating multilevel governmental
measures for Peru’s adaption to and mitigation of climate change impacts. Subsequently, in 2019, through Supreme Decree No.
13-2019-MINAM (the 2019 Supreme Decree), the Peruvian Ministry of Environment approved the Regulation of the Climate Change
Framework Act. Although the 2019 Supreme Decree does not have a material impact on La Cima’s mining operations and
environmental obligations, as a result of this legislation, La Cima is required to consider mitigation and adaptation measures on the
EIAs and mine closure plans presented to MEM and SENACE for assessment, updating, and approval.
In 2021, a previous climate change risk and vulnerability assessment and plan for adaptation to climate change for Cerro Corona were
updated. Gold Fields commissioned SRK consultants to perform a quantitative evaluation of expected long-term rainfall pattern variation
for Cerro Corona, due to the impacts of climate change. The projections concluded there could be an approximate 15% increase in
rainfall at the site by the year 2100. The results of this report will feed TSF and main water management infrastructure designs for
Cerro Corona.
Since 2021, La Cima’s electricity supplier, Kallpa, has been iREC certified and issues annual certificates confirming the electricity
supplied to Cerro Corona is 100% renewable.
Regulatory
The regulatory framework governing the development of mining activities in Peru mainly consists of the General Mining Act
(Ley General de Mineria) (LGM) and regulations relating to mining procedures, health and safety, environmental protection, and mining
investment and guarantees. Mining activities as defined by the LGM include surveying, prospecting, exploration, exploitation, general
workings, beneficiation, trading and transportation of ore.
Regulatory and supervisory entities
In general terms, the principal regulator of mining activities in Peru is the Ministry of Energy and Mines (MEM) through its General Bureau
of Mining (Direccion General de Mineria) (DGM). The MEM also regulates mining exploration activities through its General Bureau of
Mining and Environmental Affairs (Direccion General de Asuntos Ambientales Mineros) (DGAAM).
Additionally, the National Environmental Certification Service for Sustainable Investment (SENACE) is authorised to review and approve
mining activities (through a detailed EIA) for studies of projects that have a national or multi-regional influence, and that may generate
significant environmental impacts. Mine closure plans are still reviewed and approved by MEM.
Other relevant regulatory institutions include:
•the Instituto Geologico, Minero y Metalurgico (INGEMMET), which is responsible for granting the title to concession of mineral rights;
•the Supervisory Agency for Investment in Energy and Mining (OSINERGMIN), which is responsible for health and safety related to
infrastructure of mining activities;
•the OEFA, which is responsible for the supervision of environmental affairs;
•the National Water Authority (ANA), which is responsible for granting water rights;
•the Ministry of Culture, which is responsible for approving archaeological studies and managing the prior consultation process of
Indigenous or Recognised Tribal Populations;
•the National Superintendence of Labour Inspection (SUNAFIL), which is responsible for the oversight of worker health and safety;
•the National Superintendence for the Supervision of Security Services, Weapons, Ammunitions and Explosives for Civil Use
(SUCAMEC), which is responsible for authorising the use of explosives; and
•The General Bureau of Environmental Health (DIGESA), which is responsible for authorising the operation of drinking water treatment plants.
Concessions
In accordance with the LGM, mining activities (except surveying, prospecting and trading) must be performed exclusively under the
concession system. A concession confers upon its holder the exclusive right to develop a specific mining activity within a defined area.
The LGM establishes four types of concessions:
Mining concessions
A mining concession is a real property interest independent and separate from surface land located within the co-ordinates of the
concession. Holders of large and medium scale mining concessions or of any pending claims for mining concessions must comply with
payment of an annual mining good standing fee (Mining Good Standing Fee) of U.S.$3.00 per year per hectare in order to maintain the
concessions in good standing. The payment starts from the year in which the claim was filed and must be paid for as long as the
concessions are held. Holders of mining concessions are also required to meet minimum annual production targets prescribed by law,
by no later than the end of the tenth year from the date of the grant, which have to be filed with the MEM. The minimum annual
production targets are currently set at one fiscal payment unit (the UIT) per hectare per year. The UIT is fixed on a yearly basis and, for
large and medium scale mining holders, it was set to equal S/. 4,950, or approximately U.S.$1,241, in 2023. Titleholders are entitled to
group multiple concessions into administrative economic units to comply with the minimum production requirement, provided certain
conditions are met. Failure to attain the minimum production targets may result in certain penalties ranging from a monetary fine based
on the percentage of minimum production up to the forfeiture of the mining concession.
Beneficiation concessions
Beneficiation or process concessions confer the right to extract or concentrate the valuable substances of an aggregate of minerals
and/or to smelt, purify or refine metals through a set of physical, chemical and/or physicochemical processes. As with mining
concessions, holders of beneficiation concessions are required to pay the Mining Good Standing Fee, which is calculated on the basis
of the production capacity of the processing plant. La Cima has a permit for a processing plant with a capacity of 22,320 tonnes per
day. The current installed capacity of the processing plant is 22,320 tonnes per day. In fiscal 2023, La Cima paid a S/.49,094, or
approximately U.S.$12,920, Mining Good Standing Fee in connection with its beneficiation concessions.
Mining royalty and other special mining taxes and charges
Under Peru’s general taxation regime, the corporate tax rate is 29.5%, and the dividends tax rate applicable to non-resident
shareholders of Peruvian companies is 5.0% In addition to general taxation, mining companies are subject to a special tax regime which
comprises the Mining Royalty Law, the Special Mining Tax Law and the Special Mining Charge Law. The Mining Royalty Law established
payment of a mining royalty by owners of mining concessions for the exploitation of metallic and non-metallic resources. This mining
royalty is determined by applying a sliding scale rate (ranging from 1.0% to 12.0% of sales) based on the quarterly operating profits of
mining companies. Mining royalties are deductible for income tax purposes. The Special Mining Tax is payable by mining companies
that have not executed a Mining Tax Stability Agreement with the MEM and is calculated by applying a sliding scale of rates (ranging
from 2.0% to 8.4%) based on the quarterly operating profits of the mining company and is deductible for income tax purposes. This
Special Mining Tax applies to La Cima as Gold Fields has not executed a Mining Tax Stability Agreement with the MEM. The Special
Mining Charge is similar to the Special Mining Tax but applies to mining companies that have executed a Mining Tax Stability
Agreement with the MEM and the sliding scale of rates ranges from 4.00% to 13.12% based on the quarterly operating profits of mining
companies. The Special Mining Charge does not apply to La Cima.
In addition to the above, mining companies must contribute an amount equivalent to 0.5% of their annual income before taxes to fund
the Complementary Retirement Fund for Mining, Metal and Iron and Steel.
Mining companies are also required to pay an annual supervisory contribution to the OSINERGMIN and the OEFA to fund safety and
environmental inspections. Set by supreme decree, the sum of both contributions may not exceed an amount equivalent to 1.00% of the
total value of annual invoicing for concentrate sales, after deducting VAT. For fiscal years 2023 to 2025, the contributions to
OSINERGMIN and OEFA will be equivalent to 0.12% and 0.07% of the annual invoicing respectively.
Other permits and regulations
Other matters subject to regulation include, but are not limited to, soil quality, transportation of ore or hazardous substances, water use
and discharges, power use and generation, use and storage of explosives, housing and other facilities for workers, reclamation, labour
standards and mine safety and occupational health.
Directors, senior management and employees
Directors
| | | | | | |
| | | | | | |
| | | | | | |
| | | | | | |
| | | | Executive Director and Chief Executive Officer(2) | | |
| | | | Executive Director and Chief Financial Officer | | |
| | | | | | |
| | | | | | |
| | | | | | |
| | | | | | |
| | | | | | |
| | | | | | |
| | | | | | |
| | | | | | |
Notes:
(1)Terms expire on the date of the annual general meeting in that year for newly appointed directors and, the other directors, within a three-year period after
their first election.
(2)Michael J Fraser became an Executive Director and Chief Executive Officer with effect from 1 January 2024.
Executive Directors
Michael Fraser (58) BCom and MBA, University of South Africa, Advanced Management Program, Harvard University
Executive Director and Chief Executive Officer. Mr Fraser joined Gold Fields as CEO on 1 January 2024. Following an early career in industrial
services, Mr Fraser joined the mining sector in 2001 in BHP’s human resources department. He rose through the ranks to head the Mozal Aluminium
Smelter project in Mozambique in 2009 and thereafter was appointed the group’s President Human Resources, based in Melbourne. In 2015, when BHP
created South32, Mr Fraser became President and Chief Operating Officer of its global aluminium, nickel and South African manganese and energy coal
businesses. In 2022, he was appointed CEO of Chaarat Gold, an AIM-listed junior gold miner.
Paul A Schmidt (56) BCom, Witwatersrand; BCompt (Hons), UNISA; CA (SA)
Executive Director and Chief Financial Officer. Mr Schmidt joined Gold Fields in 1996. He was appointed Chief Financial Officer on 1 January 2009
and joined the Board on 6 November 2009. Prior to this, Mr Schmidt was acting Chief Financial Officer from 1 May 2008. Prior to this appointment,
Mr Schmidt was financial controller for Gold Fields from 1 April 2003. He has more than 27 years’ experience in the mining industry. Mr Schmidt holds
no other directorships. Mr. Schmidt announced his retirement in 2023, and with the process of appointing a new CFO currently underway, he will leave
the Company once the new CFO takes up their role.
Non-Executive Directors
Yunus GH Suleman (66) BCom, University of KwaZulu-Natal (formerly Durban Westville); BCompt (Hons), University of South Africa, CA(SA); CD(SA)
Mr Suleman was appointed as an independent non-executive director of Gold Fields with effect from 1 September 2016 and now serves as the Chair of
the Board of Gold Fields Limited, effective 1 June 2022. Mr Suleman also serves as the chairman of Liberty Holdings Ltd and Liberty Group Limited and
the Chair of Albaraka Bank Limited. He has over 35 years’ experience in the accounting and auditing profession and, in the last eight years, as an
independent non-executive director. He is a chartered accountant and member of the South African Institute of Chartered Accountants and a chartered
director and member of the Institute of Directors South Africa. Previously, he has been chairman of KPMG – South Africa. Mr Suleman was also a partner
at Arthur Andersen for 11 years before joining KPMG in 2002, after its merger with Arthur Andersen. Mr Suleman held various roles at Arthur Andersen,
including managing partner of its Audit and Consulting practice in Nigeria and managing partner of South Africa’s audit practice. Mr Suleman was a
director of Tiger Brands Limited until November 2018.
Alhassan Andani (63) MA Banking and Finance, Finafrica Institute, Italy; BSc Agriculture, University of Ghana
Mr Andani was appointed as a director of Gold Fields on 1 August 2016. He is currently a Founding Partner at LVSafrica Limited and a Board member at
Stanbic Holdings and Teachers Fund of the Ghana National Association of Teachers (GNAT). Mr Andani holds an Honorary Doctorate from the University
of Development Studies, Ghana. He is an Honorary Fellow at the following institutions: Chartered Institute of Banking Ghana; Institute of Directors (IOD),
Ghana; Chartered Institute of Credit Management and Institute of Public Relations, Ghana.
Peter J Bacchus (55) MA Economics, Cambridge University, ACA
Mr Bacchus was appointed as a director of Gold Fields with effect from 1 September 2016. Mr Bacchus is chairman of the independent investment
banking and ventures boutique, Bacchus Capital Advisers. He has previously acted as the global head of Mining and Metals and is joint head of European
Investment Banking at investment bank Jefferies, a position he held until 2016. Before this he served as global head of Mining and Metals at Morgan
Stanley, and head of Investment Banking, Industrials and Natural Resources at Citigroup. Mr Bacchus has spent 30 years in investment and corporate
banking with a focus on the global natural resources sector and is a member of the Institute of Chartered Accountants, England and Wales. He has been
appointed an Advisory Board member of Esan Eczacibasi company, based in Istanbul, effective 1 March 2024.
He is also a director of Trident Royalties PLC, as well as Chairman of BG Gold, Green14 Limited, 308 Services Limited and a trustee of Space for Giants,
an African-focused conservation charity. He was a non-executive director of UK-listed mining group NordGold and Australian listed Galaxy Resources.
Maria Cristina Bitar (54) BA (Economics ) Dartmouth College; MBA, Universidad de Chile and Tulane University
Ms Bitar was appointed as a non-executive director of Gold Fields on 1 May 2022. She is President of Azerta, one of Chile’s leading strategic
communications and public affairs agencies, which also operates in Peru. Ms Bitar has 25 years of experience working as a consultant, specialising in
public affairs, crisis management, communications and sustainability. She has more than 15 years of board experience in large publicly traded companies
in Chile and abroad with proven experience working within the mining sector.
Terence P Goodlace (64) MBA, University of Wales; BCom, University of South Africa; NHDip (Metalliferous Mining) Witwatersrand, Witwatersrand
Technikon
Mr Goodlace was appointed as a director of Gold Fields with effect from 1 July 2016. Mr Goodlace’s mining career commenced in 1977, spanning more
than 43 years working with different organisations. He has previously served as both an Executive Vice-President and the Chief Operating Officer for
Gold Fields, having returned to the Company to serve as an independent non-executive director. He has experience serving as chief executive officer
at Impala Platinum Holdings Limited and Metorex Limited. He served on the Impala Platinum Holdings Limited board for two years as an independent
non-executive director and four and a half years as an executive director. He spent three years as an executive director of Metorex Limited. Mr Goodlace
is Chairman at Kumba Iron Ore, effective 23 June 2021. He has been a non-executive director at Andrada Mining Limited (listed on the AIM) since
May 2018.
Jacqueline E McGill (55) BSC Metallurgy, Murdoch University; MBA, La Trobe University; Honorary Doctorate, Adelaide University
Ms McGill was appointed as a director of Gold Fields on 22 November 2021. Ms McGill has more than 30 years of operational leadership experience
in the mining and resource sectors. Ms McGill also held chief executive level roles within BHP for both BHP Mitsui Coal and Olympic Dam Corporation.
She currently serves on the Boards of ASX listed New Hope Corporation, Mineral Resources Limited and 29 Metals, where she serves as Chair of
Sustainability. She has an honorary doctorate for her work in gender equity in the resources sector.
Steven P Reid (67) Bachelor of Applied Science in Mineral Engineering (Mining), South Australian Institute of Technology; MBA, Trium Global
Executive NYU/LSE/HEC; Accredited Director, Institute of Corporate Directors
Mr Reid was appointed as a director of Gold Fields on 1 February 2016. He has 46 years of international mining experience and has held senior
leadership roles in numerous countries. He has served as a director of Eldorado Group since May 2013 and was a director of SSR Mining between
January 2013 and September 2020. Mr Reid served as Chief Operating Officer of Goldcorp from January 2007 until his retirement in September 2012
and, prior to that, was the Company’s Executive Vice President in Canada and the United States. Before joining Goldcorp, Mr Reid spent 13 years at Placer
Dome in numerous corporate, mine management and operating roles. He also held leadership positions at Kingsgate Consolidated and Newcrest Mining,
where he was responsible for the Asian and Australian operations.
Philisiwe Sibiya (46) BCom (Hons), University of Natal CA (SA)
Ms Sibiya was appointed as director of Gold Fields on 1 March 2021. Ms. Sibiya, a seasoned business executive, has nearly 20 years of management
experience within Africa. After holding various senior financial roles, including the role of CFO at MTN South Africa, she successfully transitioned into the
role of CEO for MTN Cameroon, the first female appointed into a CEO position by the MTN Group. During her tenure as CFO at MTN South Africa, she
played a leading role in navigating the business through a time of intense change for the turnaround strategy of the business. As the CEO of MTN
Cameroon, she led the largest network rollout in the history of the company, launching 3G and 4G simultaneously. Ms. Sibiya also led the launch of
Mobile Money in Cameroon, an innovative product that grew from 10,000 users in 2016 to over a million users in 2017. Ms. Sibiya is currently a non-
executive board member of the JSE-listed company AECI Limited, Investec PLC and Investec Ltd. She has received many accolades, including Global
Telecoms Business “Top 50 Women to Watch for 2017”, The Africa Report’s “Top 50 Star Dealmakers 2017”, Jeune Afrique’s “Top 50 businesswomen
in Africa” and Capacity Media “Top 20 to watch in Telecoms 2018”.
Carel AT Smit (61) B.Compt, CTA, University of the Free State; Higher Diploma in Tax Law, University of the Witwatersrand, CA(SA)
Mr Smit was appointed as a director of Gold Fields on 1 June 2023. He spent 35 years with KPMG and has extensive experience in audit, tax and advisory
with a strong focus on the mining sector across Africa, South America, and Australia. Mr Smit was KPMG's Head of Energy and Natural Resources in Africa
and also lead partner on the Gold Fields audit from 2010 to 2017. He retired from KPMG in 2019 and has since been working as an independent
consultant.
Executive Committee
Naseem A Chohan (62) BE (Electronic), University of Limerick
Executive Vice President: Sustainable Development. Mr Chohan was appointed to the position of Senior Vice President: Sustainable Development
on 13 September 2010. Mr Chohan was previously self-employed as a consultant to various companies and, prior to that, spent 25 years in various
management and leadership roles at De Beers. When he left De Beers in 2009, he was acting Group Consultant, Sustainability and ECOHS (Environment,
Community, Occupational Health and Hygiene and Safety). In October 2023, Mr Chohan announced his retirement from Gold Fields, which will come into
effect in August 2024.
Stuart J Mathews (63) Master of Science (Geology) from University of Canterbury, New Zealand
Executive Vice-President: Australasia. Stuart Mathews is an international mining professional with 33 years’ experience having worked in Australia
(Queensland, NSW, WA), Mexico and New Zealand. He has progressed through geology ranks to Geology Manager level and in the last 16 years worked
in project development and general operations management to COO level. Stuart joined Gold Fields in mid-2013 initially at St. Ives, and then General
Manager at Granny Smith Mine after which he became Vice President Operations: Australia. From 1 February 2017, Stuart took over the position of
Executive Vice President: Australasia. Mr. Mathews will retire from his position on 31 March 2024.
Benford Mokoatle (51) BSc (Hons) Geology, University of Cape Town; Graduate Diploma Engineering, Wits University; MBA Wits University;
Sustainable Business Strategy, Harvard University
Executive Vice President: South African Region. Benford is a geologist with over 28 years’ experience in the mining industry. He joined Gold Fields
in October 2017 as Vice President and Head of Operations for South Deep and became acting Executive Vice President for the South African region on
1 July 2022. Prior to joining Gold Fields, Benford spent seven years with AngloGold Ashanti and 15 years with De Beers, where he was the Head of MRM
and Technical Services before taking on the role as a General Manager for the Voorspoed and Venetia mines. He is a trustee for the South Deep
Education Trust, South Deep Community Trust and the South Deep Joint Venture Rehabilitation Trust and an executive director for GFI Joint Venture and
Gold Fields Operations Limited.
Joshua Mortoti (51) MSc Mining Engineering, University of Mines and Technology; BSc (Hons) Mechanical Engineering, Kwame Nkrumah
University of Science and Technology; MBA, Henley Management College, UK; ACMA, CGMA
Executive Vice President: Head of West Africa Region. Mr Mortoti joined Gold Fields in April 2021 as Vice President Operations for the Ghanaian
operations and became Executive Vice President: Head of West Africa Region on 1 July 2022. Prior to joining Gold Fields, Mr Mortoti spent 15 years as
Regional Director – Business Planning, Mine Manager of the Ahafo Mine, General Manager of the Akyem Mine and General Manager Operations Services
of Newmont’s Africa region in addition to stints at the Nevada Mines in the US. Prior to moving to Newmont, he was the Business Development Manager
for AngloGold Ashanti's West Africa operations. Mr Mortoti is the current President of the Ghana Chamber of Mines and had served on several
Committees including the Committees that drafted Ghana’s Mining Law, the Ghana Electricity Regulatory framework among others. Mr Mortoti is a
Chartered Management Accountant (UK) and is a Professional Engineer in both Mechanical and Mining Engineering.
Martin Preece (59) B-Tech in Mining, Witwatersrand Technicon, South Africa; Executive Development Programme, Gordon Institute of Business
Science (GIBS); Accelerated Development Programme, London Business School
Chief Operating Officer. Mr. Preece previously served as an Executive Director and Interim Chief Executive Officer. Mr Preece joined Gold Fields as
Executive Vice President: South Africa in May 2017, leading the successful ramp up of the South Deep mine since then. Prior to joining Gold Fields, he
was Chief Operating Officer at De Beers, South Africa. Mr Preece has 38 years of mining experience, starting his career as a learner miner and holding a
number of operational and technical roles before taking up mine manager positions at various operations across De Beers. After moving to Group level at
De Beers, he held positions as mine strategist and business development manager before being appointed Chief Operating Officer in 2011. Mr Preece
became Executive Director and Interim Chief Executive Officer with effect from 1 January 2023 and stepped down from his role on 31 December 2023.
Luis A Rivera (58) Bachelor’s Degree in Geology, the Title of Geological Engineer, both by the Universidad de San Marcos
Executive Vice-President, Americas. Mr Rivera joined Gold Fields in October 2016. Prior to joining Gold Fields, Mr Rivera was, since 2014, the General
Manager and Vice-President of Operations for MMG Las Bambas and before that, since 2013, was the Executive General Manager of Copper Operations
for Glencore Peru and, since 2012, Executive General Manager for all Xstrata Copper Operations in Peru. His career also includes five years as General
Manager of the large Copper Tintaya and Antapaccay operations, as well as 11 years of experience in the Xstrata Copper Operations of Minera Alumbrera,
a large gold—copper operation in North Argentina, where he became Tech Services Manager after servicing as Chief Engineer and Senior Geologist.
Mr Rivera has over 35 years’ experience in the copper and gold mining industry, in large open pit copper projects and operations in Peru and Argentina,
including his direct involvement and leadership in the merger and acquisition of Falconbridge Inc. and BHP Tintaya S.A. by Xstrata Copper as well as the
sale of Las Bambas Project by Glencore to the Chinese JV led by MMG.
Kelly Carter (45) LLB (Hons), University of Bristol, UK; GAICD
Executive Vice-President: Group Head of Legal and Compliance. Ms Carter is a dual-qualified lawyer with over 20 years’ experience in both the UK
and Australia, with an extensive background across the gold and nickel sectors. With complimentary experience in commercial and corporate affairs
management in the mining sector, she is also currently Chair of the Gold Industry Group, an industry association that seeks to promote the Australian gold
sector, having been a director since 2016. In her 13 years with Gold Fields, Ms Carter has held the roles of Vice President: Legal and Compliance, and
Vice President: Legal & Corporate Affairs as part of the Australian regional executive team.
Jongisa Magagula (41) B Bus Sci (Hons Finance) – Accounting, Economics, Finance from the University of Cape Town
Executive Vice-President: Investor Relations and Corporate Affairs. Ms Magagula joined Gold Fields on 1 September 2023 from African Rainbow
Minerals (ARM), where she was the Executive Director: Investor Relations and New Business Development. Ms Magagula started at ARM in 2009, as the
Head of Investor Relations. Her role expanded over the years as she took on additional responsibilities, including business development. She was
appointed to the ARM Board in December 2019. Prior to ARM, Ms Magagula worked in the mining division at Absa Capital.
Jacob Ricciardone (44) BEng (Mining Engineering), Western Australian School of Mines; Master of Science – Mineral Economics, Curtin University;
Master of Business Administration, Curtin University
Executive Vice-President: Strategy, Planning and Corporate Development (Acting). Mr Ricciardone was appointed Acting Executive Vice-
President: Strategy, Planning and Corporate Development, effective 1 April 2023. He previously held the role of Vice President – Strategic Planning and
has been part of the Gold Fields Corporate Development team for eight years. During his time with Gold Fields, he has been extensively involved with
contribution to strategy development, acquisitions, and portfolio management. Mr Ricciardone has 22 years of mining experience in technical and
operational roles in gold, nickel and iron ore projects, including five years of expatriate experience in Ghana and Papua New Guinea.
Francois Swanepoel (51) BEng (Electrical and Electronic Engineering), University of Johannesburg; BSc (Information Technology), University of
Johannesburg
Group Chief Technical Officer. Mr Swanepoel has 30 years’ experience in mining and processing, obtained at Gold Fields’ operations in South Africa,
Australia, Ghana, Peru and Chile in a range of operational, project and regional consulting roles. Over the past seven years, Mr Swanepoel was integrally
involved in the conceptualisation and development of the Salares Norte project in Chile. As Study Manager he was responsible for delivering all technical
studies and engineering required for the project and later as the Head of the Technical and Improvement Area, for providing strategic direction, technical
oversight, and operational support to the Salares Norte team. As Gold Fields’ Group Chief Technical Officer, he is discipline head of the key mining
technical functions (including geology, mining and metallurgy) across all operations.
Gerrit Lotz (55) Master’s Degree in Performance, Leadership and Change, University of Johannesburg
Executive Vice President: People and Organisational Effectiveness (Acting). Mr Lotz is an accomplished Vice President of People and
Organisational Effectiveness with over three decades of experience in spearheading transformative initiatives within the mining and metals industry.
His expertise extends across a wide range of domains, including HR consulting, change management, coaching, compensation, labour relations, and
organisational effectiveness. Mr Lotz is highly versatile, having successfully led both business improvement and strategic functions, demonstrating his
exceptional adaptability and leadership acumen. Mr Lotz's professional journey is characterised by a deep-rooted passion for driving continuous
improvement and learning, particularly through effective leadership. His career has seen him direct HR and business improvement initiatives across
diverse mining operations, corporate environments, and varied legal jurisdictions.
Former Executive Committee Members
Rosh Bardien (51) BCom (Honours), University of KwaZulu-Natal, Advanced Labour Relations and Strategic Management Diploma, University of
Pretoria
Executive Vice President: People and Organisational Effectiveness. Ms Bardien joined Gold Fields as Executive Vice President, People and
Organisational Effectiveness on 1 February 2018. She has over 24 years’ global experience as a senior human resource professional, both in the public
and private sectors. Prior to joining Gold Fields, Ms Bardien was the General Manager: Human Resources and Transformation at ArcelorMittal South Africa
from April 2016. Prior to that, Ms. Bardien worked for ArcelorMittal in the UK from March 2015. She held the position of Group Head of HR at London
Mining Plc from January 2012 to February 2015. She also held senior and executive positions at Kraft International, First National Bank, Riversdale Mining
Ltd, Mvelaphanda Resources and the South African National Department of Labour. Ms Bardien resigned from Gold Fields effective 20 October 2023.
Taryn L. Leishman (formerly Harmse) (51) BCom & LLB, University of Johannesburg, Advanced Corporate Law, University of Witwatersrand
Executive Vice-President: Group Head of Legal and Compliance. Mrs Leishman was appointed Executive Vice-President: Group General Counsel
and member of Gold Fields’ Executive Committee on 1 May 2014. Mrs Leishman also took on the role of interim Company Secretary following the
resignation of the then Company Secretary on 28 June 2019. This appointment came to an end on 1 April 2020, following the permanent appointment of
Anré Weststrate as the Company Secretary. Mrs. Leishman was appointed as Assistant General Counsel and Company Secretary on 1 August 2013 and
resigned from the position of Company Secretary on 15 September 2014. She previously served as Assistant General Counsel and Vice President, Group
Legal. Before joining Gold Fields, Mrs Leishman worked at Linklaters LLP in London for a number of years having completed her articles at Hofmeyr
Herbstein Gihwala (now Cliffe Dekker Hofmeyr). She was admitted as an attorney to the High Court of South Africa in 2000. Mrs. Leishman resigned from
Gold Fields effective 1 April 2023.
Brett J. Mattison (45) BCom (Hons) Law, BAcc, University of Stellenbosch; Masters in Law, Higher Tax Diploma, University of Johannesburg; Exec.
MBA (PLD), Harvard Business School
Executive Vice-President: Strategy, Planning and Corporate Development. Mr Mattison was appointed Executive Vice-President: Strategy,
Planning and Corporate Development effective 1 May 2013. He began his career with Gold Fields in 2001 as part of the Global Legal team providing
commercial, legal and tax structuring advice in relation to various global transactions. He subsequently joined the Corporate Development team in 2005
where he worked for six years in South Africa, Peru and Australia until 2010. In late 2010, Mr Mattison was appointed as the Country Manager of the
Philippines tasked with the mandate of setting up Gold Fields’ activities in the Philippines. In 2013, he returned to South Africa to take up his current
position and drive growth and strategy for the Group. Mr Mattison resigned from Gold Fields effective 1 April 2023.
Avishkar Nagaser (39) BBusSc Finance and Economics, University of KwaZulu-Natal
Executive Vice President: Investor Relations and Corporate Affairs. Mr Nagaser joined Gold Fields as Executive Vice President: Investor Relations
and Corporate Affairs in January 2015. Before joining Gold Fields, he was with Merrill Lynch from 2012 to 2014 and Macquarie from 2007 to 2012, where
he held the position of gold and platinum equity research analyst. Mr Nagaser resigned from Gold Fields effective 1 August 2023.
Company Secretary
Anré Weststrate (58) BJuris, University of Northwest and LLB degree, University of Northwest
Company Secretary. Ms Weststrate joined the Company on 17 April 2020 and became Company Secretary of Gold Fields on 1 June 2020. Prior to
joining Gold Fields, Ms Weststrate was company secretary for SekelaXabiso CA Inc. from 2016 to 2020, and legal advisor and company secretary for
EVRAZ Highveld Steel and Vanadium Limited from 2006 to 2016. Ms Weststrate is an admitted advocate in the High Court of South Africa and her role as
a Company Secretary and Legal Advisor was preceded by a career in the public sector as public prosecutor in the Departments of Justice and National
Prosecuting Authority of South Africa.
Employees
The total number of employees, excluding employees of outside contractors who are not on Gold Fields’ payroll, as of the end of fiscal
2023 at each of the operations owned by Gold Fields as of those dates was:
Notes:
(1)For the total number of employees as of the end of fiscal 2023 and 2022, see “Integrated Annual Report—Where We Operate”.
(2)The employee numbers presented do not include contractors who are not on the payroll. For the number of contractors at Gold Fields’ operations as of the
end of fiscal 2023 and 2022, see “Integrated Annual Report—Where We Operate”.
(3)Includes the Gold Fields off-shore team reporting to the head corporate office, and excludes nine non-executive directors.
Safety
In fiscal 2023, Gold Fields continued to focus on implementing its Group Safety and Health Strategy, including its Group Safety and
Health Reporting Guideline, which is based on ICMM guidelines. Gold Fields has set targets to reduce fatalities and serious injuries
to zero. Gold Fields’ strategy includes a focus on human elements around safety leadership and behaviours as well as ensuring the
deployment of appropriate systems that are intuitive and easy to use. To support these focal points, Gold Fields monitors a series
of leading and lagging indicators to track progress and encourage the workforce to adopt the behaviours and mindset for a safe
workplace. Each region has defined safety engagements according to its own circumstances, resulting in different rates across
the regions.
The following tables set out the number of fatalities, serious injuries and the safety engagement rate for Gold Fields’ mining operations
for the periods indicated. The safety engagement rate is determined by the number of safety engagements per 1,000 hours worked.
Australia
South Africa
Ghana(1)
Note:
(1)Excludes Asanko.
Peru(1)
Note:
(1)Excludes Salares Norte.
Major shareholders and related party transactions
Major shareholders
To the knowledge of management: (1) Gold Fields is not directly or indirectly owned or controlled (a) by another corporation or (b) by
any foreign government; and (2) there are no arrangements the operation of which may at a subsequent date result in a change in
control of Gold Fields. To the knowledge of Gold Fields’ management, there is no controlling shareholder of Gold Fields.
A list of the individuals and organisations holding, to the knowledge of management, directly or indirectly, 5% or more of its issued
share capital as of 31 December 2023 is set forth below.
| | |
| | |
| | |
| | |
Public Investment Corporation | | |
| | |
| | |
To the knowledge of management, none of the above shareholders hold voting rights which are different from those held by Gold Fields’
other shareholders.
The table below shows the significant changes in the percentage of ownership by Gold Fields’ major shareholders, to the knowledge
of Gold Fields’ management, during the past three fiscal years.
| | | |
| Beneficial ownership as of 31 December |
| | | |
| | | |
| | | |
| | | |
Public Investment Corporation | | | |
| | | |
BlackRock Investment Management – London | | | |
BlackRock Investment Mgt – Index | | | |
As of 1 February 2024, the issued share capital of Gold Fields consisted of 893,540,813 ordinary shares.
As of 23 February 2024, 950 record holders of Gold Fields’ ordinary shares, holding an aggregate of 188,497,815 ordinary shares (21%),
including shares underlying Gold Fields’ ADRs, were listed as having addresses in the United States.
Related party transactions
Between 1 January 2024 and 28 March 2024, none of the directors, officers or major shareholders of Gold Fields or, to the knowledge
of Gold Fields’ management, their families, had any interest, direct or indirect, in any transaction or in any proposed transaction which
has affected or will materially affect Gold Fields or its investment interests or subsidiaries, except as disclosed in “Annual Financial
Report—Notes to the Consolidated Financial Statements—Note 43. Related Parties”, as required by IFRS Accounting Standards as
issued by the International Accounting Standards Board (IASB), including for fiscal 2023.
Recent developments
On 20 December 2023, Gold Fields entered into a share purchase agreement with Galiano for the acquisition of Gold Fields’ joint
venture interest in the Asanko gold mine. As consideration for the acquisition of Gold Fields’ joint venture interest, Galiano and its
subsidiaries agreed to pay Gold Fields an aggregate amount of U.S.$150 million (in several tranches, including as deferred cash
consideration) and U.S.$20 million as share consideration in Galiano. On 5 March 2024, Gold Fields announced that pursuant to the
terms of the share purchase agreement, the associated transactions had closed and the share consideration was issued to Gold Fields,
resulting in them disposing of their interest in the Asanko gold mine and holding 19.9% of the issued and outstanding shares of Galiano.
The listing
The Company’s shares trade on the Johannesburg Stock Exchange Limited (JSE) under the abbreviated name “GFIELDS” and the short
code “GFI”. The Company’s ADSs trade on the New York Stock Exchange (NYSE) under the trading symbol “GFI”.
Additional information
Memorandum of Incorporation
General
Gold Fields is a public company registered in South Africa under the Companies Act, which limits the liability of its shareholders, and is
governed by its memorandum of incorporation, the Companies Act and the JSE Listings Requirements. Gold Fields’ registration number
is 1968/004880/06.
On 8 April 2009, South Africa passed the Companies Act, which came into force on 1 May 2011. At the annual general meeting held on
14 May 2012, Gold Fields adopted a new memorandum of incorporation (the Gold Fields MOI) to replace its memorandum of association
and articles of association adopted under the previous Companies Act 61 of 1973. Gold Fields amended the Gold Fields MOI at its
annual general meetings on 9 May 2013 and on 24 May 2017. The amended Gold Fields MOI conforms to the requirements of the
Companies Act and the amended JSE Listings Requirements.
Clause 4 of the Gold Fields MOI provides that Gold Fields has the powers and capacity of a natural person and is not subject to any
special conditions.
Dividends and payments to shareholders
Gold Fields may make distributions (including the payment of dividends) from time to time in accordance with provisions of the
Companies Act, the JSE Listings Requirements and the Gold Fields MOI. In terms of the Companies Act, a company may only make a
distribution (including the payment of any dividend) if:
•it reasonably appears that the company will satisfy the solvency and liquidity test immediately after completing the proposed
distribution;
•the board of the company, by resolution, has acknowledged that it has applied the solvency and liquidity test and reasonably
concluded that the company will satisfy the solvency and liquidity test immediately after completing the proposed distribution.
In terms of the Companies Act, a company satisfies the solvency and liquidity test at a particular time if, considering all reasonably
foreseeable financial circumstances of the company at that time:
•the assets of the company, fairly valued, equal or exceed the liabilities of the company, as fairly valued; and
•it appears that the company will be able to pay its debts as they become due in the ordinary course of business for a period of:
–12 months after the date on which the test is considered; or
–in the case of a distribution (including the payment of dividends), 12 months following that distribution.
Subject to the above requirements, the directors of Gold Fields may from time to time declare a dividend or any other distribution to
shareholders in proportion to the number of shares held by them.
The Company must hold all monies due to the shareholders in trust indefinitely, subject to the laws of prescription. The Company shall
be entitled at any time to delegate its obligations in respect of unclaimed dividends, or other unclaimed distributions, to any one of the
Company’s bankers.
Voting rights
Every shareholder of Gold Fields, or representative of a shareholder, who is present at a shareholders meeting has one vote on a show
of hands, irrespective of the number of shares he or she holds or represents. At a shareholders meeting, a resolution put to the vote
shall be decided on a show of hands, unless a poll is demanded by not less than five persons having the right to vote on that matter, a
person or persons entitled to exercise not less than one tenth of the total voting rights entitled to vote on that matter or the chairperson.
Every Gold Fields shareholder is, on a poll, entitled to one vote per ordinary share held. Neither the Companies Act nor the Gold Fields
MOI provide for cumulative voting.
A shareholder entitled to attend and vote at a shareholders meeting shall be entitled to appoint a proxy to attend, participate in, speak
and vote at such shareholders meeting in the place of such shareholder. The proxy need not be a shareholder. However, the proxy
may not delegate the authority granted to him or her as a proxy.
Issue of additional shares
In accordance with the provisions of the JSE Listings Requirements and the Gold Fields MOI, the Board shall not have the power to
issue authorised shares other than:
•the issue of capitalisation shares or the offer of a cash payment in lieu of awarding capitalisation shares;
•issues in respect of a rights offer; and
•issues which do not require the approval of shareholders in terms of the Companies Act or the JSE Listings Requirements, without
shareholder approval.
In accordance with the provisions of the Companies Act:
•an issue of shares must be approved by a special resolution of the shareholders of a company if the shares are issued to a director
or officer of the company or any other person related or inter-related to the company, save for certain exceptions, including an issue
pursuant to an employee share scheme; and
•an issue of shares in a transaction requires approval of the shareholders by special resolution if the voting power of the shares that
are issued as a result of the transaction will be equal to or exceed 30% of the voting power of all the shares held by shareholders
immediately before the transaction.
Issues for cash
In accordance with the provisions of the JSE Listings Requirements and the Gold Fields MOI, shareholders may either convey a:
•special authority to issue shares for cash on terms that are specifically approved by shareholders in a shareholders meeting in
respect of a particular issue (Specific Issue for Cash); or
•general authority to issue shares for cash on terms generally approved by shareholders in a shareholders meeting by granting the
Board the authority to issue a specified number of securities for cash, which authority will be valid until the next annual general
meeting or for 15 months from the date on which the resolution was passed, whichever period is shorter (General Issue for Cash).
In terms of the JSE Listings Requirements, a company may only undertake:
•a Specific Issue for Cash or a General Issue for Cash on the basis that a 75% majority of votes cast by shareholders at a shareholders
meeting must approve the granting of such authority to the directors;
•a General Issue for Cash is subject to satisfactory compliance with certain requirements, including:
–the shares that are the subject of a General Issue for Cash may not exceed 5% of the company’s listed shares; and
–the maximum discount at which shares may be issued is 10% of the weighted average traded price of such shares measured over
the 30 business days prior to the date that the price of the issue is agreed between the company and the party subscribing for
the shares.
Pre-emptive rights
The Companies Act, the JSE Listings Requirements and the Gold Fields MOI require that any new issue of shares by Gold Fields must
first be offered to existing shareholders in proportion to their shareholding in the Company, unless, among other things, in respect of
the issuance to new shareholders:
•the necessary shareholder approvals have been obtained;
•a capitalisation issue, an issue for an acquisition of assets (including another company) or an amalgamation or merger is to be
undertaken; or
•the shares are to be issued in terms of option or conversion rights.
At the annual general meeting held on 24 May 2023, Gold Fields’ shareholders authorised, subject to certain conditions, Gold Fields’
directors to allot and issue (as they in their discretion think fit) or grant options over shares representing not more than 5% of the
number of ordinary shares in the issued share capital of the Company, which constituted 44,676,383 ordinary shares (excluding any
shares approved to be allotted and issued by the Company in terms of any share plan or incentive scheme for the benefit of
employees).
Transfer of shares
The transfer of any Gold Fields certificated shares must be implemented in accordance with the provisions of the Companies Act, using
the then common form of transfer. Dematerialised shares, which have been traded on the JSE, are transferred on the STRATE system
and delivered five business days after each trade. The transferor of any share is deemed to remain the holder of that share until the
name of the transferee is entered in Gold Fields’ register for that share. Since Gold Fields shares are traded through STRATE, only
shares that have been dematerialised may be traded on the JSE. Accordingly, Gold Fields shareholders who hold shares in certificated
form must dematerialise their shares in order to trade on the JSE.
Disclosure of beneficial interest in shares
The Companies Act requires a registered holder of Gold Fields shares who is not the beneficial owner of such shares to disclose to
Gold Fields, within five business days of the end of every month during which a change has occurred in the beneficial ownership, the
identity of the beneficial owner and the number and class of securities held on behalf of the beneficial owner. Moreover, Gold Fields
may, by notice in writing, require a person who is a registered shareholder, or whom Gold Fields knows or has reasonable cause to
believe has a beneficial interest in Gold Fields ordinary shares, to confirm or deny whether or not such person holds the ordinary
shares or beneficial interest and, if the ordinary shares are held for another person, to disclose to Gold Fields the identity of the person
on whose behalf the ordinary shares are held. Gold Fields may also require the person to give particulars of the extent of the beneficial
interest held during the three years preceding the date of the notice. Gold Fields is obliged to establish and maintain a register of the
disclosures described above and to publish in its annual financial statements a list of the persons who hold a beneficial interest equal to
or in excess of 5% of the total number of ordinary shares issued by Gold Fields, together with the extent of those beneficial interests.
General meetings of shareholders
The shareholders and/or directors may convene Gold Fields shareholders meetings in accordance with the requirements of the
Companies Act and the Gold Fields MOI. Gold Fields is obliged to hold an annual general meeting for each fiscal year prior to 15
months after the date of the last annual general meeting.
Shareholders meetings, including annual general meetings, require at least 15 business days’ notice in writing of the place, day and
time of the meeting to shareholders.
Business may be transacted at any shareholders meeting only while a quorum of shareholders is present. The quorum for the
commencement of a shareholders meeting shall be sufficient persons present to exercise, in aggregate, at least 25% of all the voting
rights that are entitled to be exercised, but the shareholders meeting may not begin unless, in addition, at least three shareholders
entitled to vote are present at the meeting.
The annual general meeting deals with and disposes of all matters prescribed by the Gold Fields MOI and the Companies Act,
including:
•the presentation of the directors’ report, the audited financial statements for the immediately preceding financial year and the audit
committee report;
•the election of directors; and
•the appointment of an auditor and an audit committee.
Accounting records and financial statements
Gold Fields is required to keep the accounting records and books of accounts as are necessary to present the state of affairs of the
Company and to explain the financial position of the Company as prescribed by the Companies Act.
The directors shall from time to time determine at what times and places and under what conditions, subject to the requirements of the
Companies Act, shareholders are entitled to inspect and take copies of certain documents, including the Gold Fields MOI, accounting
records required to be maintained by the Company and annual financial statements. Apart from the shareholders, no other person shall
be entitled to inspect any of the documents of the Company (other than the share register) unless expressly authorised by the directors
or in accordance with the Promotion of Access to Information Act, No 2 of 2000, as amended.
The directors of Gold Fields will cause to be prepared annual financial statements and an annual report as required by the Companies
Act and the JSE Listings Requirements. Gold Fields will send by mail to the registered address of every shareholder a copy of the
annual report and annual financial statements. Not later than three months after the first six months of its financial year, Gold Fields will
mail to every shareholder an interim report for the previous six-month period.
Amendments to Gold Fields’ Memorandum of Incorporation
The Gold Fields shareholders may, by the passing of a special resolution in accordance with the provisions of the Companies Act and
the Gold Fields MOI, amend the Gold Fields MOI, including:
•the creation of any class of shares;
•the variation of any preferences, rights, limitations and other terms attaching to any class of shares;
•the conversion of one class of shares into one or more other classes;
•an increase in Gold Fields’ authorised share capital;
•a consolidation of Gold Fields’ equity securities;
•a sub-division of Gold Fields’ equity securities; and/or
•the change of Gold Fields’ name.
Variation of rights
All or any of the rights, privileges or conditions attached to Gold Fields’ ordinary shares may be varied by a special resolution of
Gold Fields passed in accordance with the provisions of the Companies Act and the Gold Fields MOI.
Distribution of assets on liquidation
In the event of a voluntary or compulsory liquidation, dissolution or winding-up, the assets remaining after payment of all the debts and
liabilities of Gold Fields, including the costs of liquidation, shall be dealt with by a liquidator who may, with the sanction of a special
resolution, among other things, divide among the shareholders any part of the assets of Gold Fields, and may vest any part of the
assets of Gold Fields as the liquidator deems fit in trust for the benefit of shareholders. The division of assets is not required to be done
in accordance with the legal rights of shareholders of Gold Fields. In particular, any class may be given preferential or special rights or
may be partly or fully excluded.
Employee share scheme
The Companies Act permits the establishment of employee share schemes, whether by means of a trust or otherwise, for the purpose
of offering participation therein solely to employees, including salaried directors, officers and other persons closely involved in the
business of the Company or a subsidiary of the Company, either by means of the issue of shares in the Company or by the grant of
options for shares in the Company.
Purchase of shares
Gold Fields or any subsidiary of Gold Fields may, if authorised by special resolution by way of a general approval, acquire ordinary
shares in the capital of Gold Fields in accordance with the Companies Act and the JSE Listings Requirements, provided among other
things that:
•the number of its own ordinary shares acquired by Gold Fields in any one financial year shall not exceed 10% of the ordinary shares
in issue at the date on which this resolution is passed;
•this authority shall lapse on the earlier of the date of the next annual general meeting or the date 15 months after the date on which
the special resolution is passed;
•the Board has resolved to authorise the acquisition and that the Group will satisfy the solvency and liquidity test immediately after the
acquisition and that since the test was done there have been no material changes to the financial position of the Group;
•the price paid per ordinary share may not be greater than 10% above the weighted average of the market value of the ordinary
shares for the five business days immediately preceding the date on which an acquisition is made;
•the number of shares acquired by subsidiaries of Gold Fields shall not exceed 10% in the aggregate of the number of issued shares
in Gold Fields.
Borrowing powers
In terms of the provisions of Section 19(1) of the Companies Act, read together with Clause 4 of the Gold Fields MOI, the borrowing
powers of the Company are unlimited.
Non-South African shareholders
There are no limitations imposed by South African law or by the Memorandum of Incorporation of Gold Fields on the rights of non-South
African shareholders to hold or vote Gold Fields’ ordinary shares.
Rights of minority shareholders and Directors’ duties
The Companies Act provides instances in which a minority shareholder may seek relief from the courts if he, she or it has been unfairly
prejudiced by the Company.
In South Africa, a director of a company, when acting in that capacity, must exercise the powers and perform the functions of a director:
•in good faith and for a proper purpose;
•in the best interests of the company; and
•with the degree of care, skill and diligence that may reasonably be expected of a person:
–carrying out the same functions in relation to the company as those carried out by that director; and
–having the general knowledge, skill and experience of that director.
Material contracts
2023 U.S.$ Credit Facility Agreement
On 25 May 2023, MUFG Bank, LTD., Gold Fields Limited, Gold Fields Orogen Holding (BVI) Limited and Gold Fields Holdings Company
Limited entered into a U.S.$1.2 billion credit facility agreement (the 2023 Credit Facility Agreement). The purpose of the 2023 Credit
Facility Agreement was firstly to refinance the existing U.S.$1.2 billion credit facilities agreement dated 25 July 2019 and thereafter to
fund general corporate and working capital purposes of the Gold Fields Group.
For the first time, the 2023 Credit Facility Agreement is linked to the achievement of three of Gold Fields’ key ESG priorities of gender
diversity, water stewardship and decarbonisation.
The 2023 Credit Facility Agreement is for a principal loan amount of U.S.$1.2 billion, with an option to increase the facility by up to U.S.
$400 million (at the discretion of the bank)), and will mature in five years, with an option to extend through two one-year extensions.
The 2023 Credit Facility Agreement bears interest at the secured overnight financing rate (SOFR) (compounded in arrears) plus an
applicable credit adjustment spread plus a margin of 1.55% per annum, subject to rating margin adjustments and sustainability margin
adjustments. It has a commitment fee of 35% of the applicable margin accruing on each lender's unused and uncancelled commitment.
Gold Fields will benefit from a lower margin depending on the fulfilment of the sustainability linked key performance indicators (KPIs)
under the 2023 Credit Facility Agreement. Conversely, Gold Fields will pay a premium on its margin if the KPIs are not met.
The sustainability linked KPIs for the five-year term of the loan are aligned with Gold Fields’ strategy as well as its 2030 ESG targets.
They address the most material ESG priorities for Gold Fields and the mining sector in general. These include improving female
representation in the total workforce from Gold Fields’ current 23% level; increasing the amount of reused/recycled water from the 75%
of total water consumption achieved in 2022; and an abatement in Scope 1 and 2 CO2 emissions through renewable energy projects.
The performance by each borrower of its obligations and liabilities under the 2023 Credit Facility Agreement will be guaranteed by
Gold Fields Limited and certain of its subsidiaries.
On 26 October 2023, the parties to the 2023 Credit Facility Agreement entered into an Amendment and Restatement Agreement
relating to the 2023 Credit Facility Agreement. The Amendment and Restatement Agreement provided amendments for purposes of
funding Gold Fields’ deferred acquisition consideration and joint venture commitments in relation to the Windfall project (the Windfall
Amendments). The Windfall Amendments include the accession of Gold Fields Windfall as a new Borrower and Guarantor under the
2023 Credit Facility Agreement, the inclusion of Canadian Dollars as an optional currency under the 2023 Credit Facility Agreement
and other amendments which were consequential.
The outstanding borrowings under the 2023 Credit Facility Agreement were U.S.$155.9 million on 31 December 2023.
2023 A$ Syndicated Facility Agreement
On 26 September 2023, Commonwealth Bank of Australia, Gold Fields Limited, Gruyere Holdings Pty Ltd, Gold Fields Orogen Holding
(BVI) Limited and Gold Fields Holdings Company Limited entered into a A$500 million sustainability-linked revolving credit facility
agreement (the 2023 A$ Syndicated Facility Agreement). The purpose of the 2023 A$ Syndicated Facility Agreement was firstly to
refinance the existing A$500 million syndicated facility agreement dated 19 November 2020 and thereafter to fund general corporate
and working capital purposes of the Gold Fields Group.
The 2023 A$ Syndicated Facility Agreement has the same sustainability-linked loan criteria entered into by Gold Fields under the 2023
Credit Facility Agreement and the KPIs are aligned with Gold Fields’ 2030 ESG targets.
The 2023 A$ Syndicated Facility Agreement has a principal loan amount of A$500 million, with an option to increase the facility by up
to A$100 million (at the discretion of the bank), and a maturity of five years. The 2023 A$ Syndicated Facility Agreement bears interest
at the BBSY Bid plus a margin of 1.75% per annum, subject to rating margin adjustments and sustainability margin adjustments and a
commitment fee of 40% of the applicable margin accruing on each lender's unused and uncancelled commitment. Gold Fields will
benefit from a lower margin depending on the fulfilment of the sustainability linked KPIs under the 2023 A$ Syndicated Facility
Agreement. Conversely, Gold Fields will pay a premium on its margin if the KPIs are not met.
The performance by each borrower of its obligations and liabilities under the 2023 A$ Syndicated Facility Agreement will be
guaranteed by Gold Fields Limited and certain of its subsidiaries.
The outstanding borrowings under the 2023 A$ Syndicated Facility Agreement were nil on 31 December 2023.
2023 ZAR Revolving Credit Facilities
In April and May 2023, Gold Fields Limited, Gold Fields Operations Limited, GFI Joint Venture Holdings Proprietary Limited, Gold Fields
Orogen Holding (BVI) Limited, Gold Fields Holdings Company Limited entered into four five-year revolving credit facility agreements
with, respectively, FirstRand Bank Limited (acting through its Rand Merchant Bank division), ABSA Bank Limited (acting through its
Corporate and Investment Banking Division), Nedbank Limited (acting through its Nedbank Corporate and Investment Banking Division)
and The Standard Bank of South Africa Limited for an aggregate amount of R2.5 billion (the 2023 ZAR RCFs). The 2023 ZAR RCFs shall
be used to fund capital expenditure as well as general corporate and working capital requirements of the Gold Fields Group.
Key terms of the 2023 ZAR RCFs are:
The performance by each borrower of its obligations and liabilities under the 2023 ZAR RCFs will be guaranteed by Gold Fields Limited
and certain of its subsidiaries.
During the last quarter of 2023, the parties to the 2023 ZAR RCFs entered into Amendment and Restatement Agreements relating to
the 2023 ZAR RCFs to permit for the Windfall Amendments under the 2023 U.S.$ Credit Facility Agreement.
The outstanding borrowings under the 2023 ZAR RCFs were nil on 31 December 2023.
Ghana Revolving Credit Facility
Abosso and Gold Fields Ghana (collectively the Ghana Borrowers) entered into a revolving credit facility agreement originally dated
22 December 2010, as amended and restated from on 6 May 2014, 28 October 2016, 12 June 2017, 22 March 2018, 23 November 2018
and 27 September 2021, pursuant to which The Standard Bank of South Africa Limited (Standard Bank) agreed to make available to
the Ghana Borrowers a revolving credit facility in a maximum aggregate principal amount of U.S.$100 million (the Ghana Revolving
Credit Facility).
Borrowings under this facility are guaranteed by the Ghana Borrowers.
The Ghana Revolving Credit Facility bears interest at LIBOR plus a margin between 2.75% per annum and 2.95% per annum, based
on the average outstanding balance of all loans outstanding under the facility during any interest period. The Ghana Borrowers are
required to pay a quarterly commitment fee of 0.90% per annum.
The final maturity date of the Ghana Revolving Credit Facility is 13 October 2024.
On 28 June 2023, the parties to the Ghana Revolving Credit Facility entered into a Seventh Amendment and Restatement Agreement
that provides for the transition from LIBOR to the Compounded Reference Rate as the basis for calculating the interest rate under the
Ghana Revolving Credit Facility.
The outstanding borrowings under the Ghana Revolving Credit Facility were nil on 31 December 2023 and nil on 31 December 2022.
Other credit facilities
For more information on Gold Fields’ other credit facilities, see “Annual Financial Report—Notes to the Consolidated Financial
Statements—Note 27. Borrowings”.
Yamana arrangement agreement
On 31 May 2022, Gold Fields entered into a definitive arrangement agreement with Yamana to acquire all of the issued and outstanding
common shares in the capital of Yamana in a share-for-share exchange transaction (Yamana Transaction) to be implemented by way of
a plan of arrangement of Yamana (Plan of Arrangement) under Section 192 of the Canada Business Corporations Act (the CBCA)
pursuant to an arrangement agreement entered into between Gold Fields and Yamana dated 31 May 2022 (Arrangement Agreement).
The Board of Directors of Yamana (Yamana Board) unanimously approved the Transaction and recommended to Yamana shareholders
that they vote in favour of the Yamana Transaction. The Arrangement Agreement included reciprocal non-solicitation provisions (subject
to provisions allowing the Yamana Board or the Gold Fields Board to exercise their fiduciary duties to change their recommendation
and/or to enter into a permitted acquisition agreement in certain circumstances), and rights to match superior proposals. In addition, the
Arrangement Agreement provided that, under certain circumstances, Gold Fields would be entitled to a U.S.$300 million termination
fee. The Arrangement Agreement contained customary conditions to the obligations of each of Yamana and Gold Fields, and
representations, warranties and covenants made by Yamana and Gold Fields. On 4 November 2022, following the posting of the
respective shareholder circulars to approve the Transaction by each of Yamana and Gold Fields, Yamana issued an announcement
noting that it received a binding proposal from Pan American Silver Corp. and Agnico Eagle Mines Limited to acquire all of the
outstanding common shares of Yamana (the Joint Offer), and that the Yamana Board determined that the Joint Offer constituted a
“Yamana Superior Proposal” (as defined in the Arrangement Agreement). Following an announcement by Yamana of a change in
recommendation, on 8 November 2022, Gold Fields terminated the Arrangement Agreement. In accordance with the terms of the
Arrangement Agreement, Yamana was required to pay Gold Fields a termination fee in the amount of U.S.$300 million. On 11 November
2022, Gold Fields cancelled its general meeting in connection with the Transaction.
Management and other compensatory plans and arrangements
See “Governance and Remuneration Report—Remuneration Policy—Long-term Incentives Plan”, “Governance and Remuneration
Report—Remuneration Policy—Overall Executive Director Short-term Incentive Determination”, “Governance and Remuneration Report
—Remuneration Policy—Other Key Features of our Remuneration Policy—Executive Minimum Shareholding Requirements” and “Annual
Financial Report—Notes to the consolidated financial statements—Note 5. Share-based payments”.
Deposit agreement
Gold Fields has an American Depositary Receipt (ADR) facility. In connection with this facility, Gold Fields is party to a Deposit
Agreement, dated as of 2 February 1998, as amended and restated as of 21 May 2002 among Gold Fields, The Bank of New York
Mellon (The Bank of New York, BNYM, or the Depositary), as Depositary, and all owners and holders from time to time of ADRs issued
thereunder. For more information on the Deposit Agreement, see “Exhibits—2.5 Description of securities registered under Section 12 of
the Exchange Act”.
Fees and expenses
BNYM, as Depositary, will charge any party depositing or withdrawing ordinary shares or any party surrendering ADRs or to whom ADRs
are issued:
| | |
| | Gold Fields ADS holders must pay: |
| | |
each issuance of a Gold Fields American Depositary Shares (ADSs), including as a result of a distribution of ordinary shares or rights or other property or upon exercise of a warrant to purchase an ADS | | U.S.$5.00 or less per 100 Gold Fields ADSs or portion thereof |
each distribution of securities distributed to holders of Gold Fields’ ordinary shares which are distributed by BNYM to Gold Fields’ ADS holders | | any fees that would be payable if the securities had been ordinary shares and those ordinary shares had been deposited for the issuance of ADSs |
each cancellation of a Gold Fields ADS, including if the Deposit Agreement terminates | | U.S.$5.00 or less per 100 Gold Fields ADSs or portion thereof |
each cash distribution pursuant to the Deposit Agreement | | not more than U.S.$0.02 per ADS (or portion thereof) |
annual depositary services | | not more than U.S.$0.02 per ADS (or portion thereof) paid annually, provided that this fee will not be charged if the U.S. $0.02 fee for cash distributions described above was charged during the calendar year |
transfer and registration of ordinary shares on the Gold Fields’ share register from your name to the name BNYM or its agent when you deposit or withdraw ordinary shares | | registration or transfer fees |
conversion of foreign currency to U.S. dollars | | |
cable, telex and facsimile transmission expenses, if expressly provided in the Deposit Agreement | | |
| | certain taxes and governmental charges BNYM or the custodian have to pay on any Gold Fields ADS or ordinary share underlying a Gold Fields ADS |
In fiscal 2023, BNYM paid U.S.$1.9 million to Gold Fields as reimbursement for costs incurred over the year in connection with the ADR
programme.
Payment of taxes
Gold Fields’ ADS holders will be responsible for any taxes or other governmental charges payable on their ADSs or on the deposited
securities underlying their ADSs. BNYM may deduct the amount of any taxes owed from any payments to Gold Fields’ ADS holders.
It may also restrict or refuse the transfer of their ADSs or restrict or refuse the withdrawal of their underlying deposited securities until
Gold Fields’ ADS holders pay any taxes owed on their Gold Fields’ ADSs or underlying securities. It may also sell deposited securities
to pay any taxes owed. Gold Fields’ ADS holders will remain liable if the proceeds of the sale are not enough to pay the taxes. If BNYM
sells deposited securities, it will, if appropriate, reduce the number of Gold Fields ADSs held by Gold Fields’ ADS holders to reflect the
sale and pay to them any proceeds, or send to them any property, remaining after it has paid the taxes.
South African exchange control limitations affecting security holders
The discussion below relates to exchange controls in force as of the date of this annual report. These controls are subject to change
at any time without notice. It is not possible to predict whether existing exchange controls will be abolished, continued or amended by
the South African government in the future. Investors are urged to consult a professional adviser as to the exchange control
implications of their particular investments.
Acquisitions of shares or assets of South African companies by non-South African purchasers solely for a cash consideration equal to
the fair value of the shares or assets will generally be permitted by the SARB pursuant to South African exchange control regulations.
An acquisition of shares or assets of a South African company by a non-South African purchaser for a non-cash consideration, including
shares in a non-South African company, may be refused by the SARB. If SARB approval is refused, the acquisition of the shares or
assets of a South African company may not be implemented.
Subject to the above limitations, there are no restrictions on equity investments in South African companies and a foreign investor may
invest freely in the ordinary shares and ADSs of Gold Fields.
There are no exchange control restrictions on the remittance in full of dividends declared out of trading profits to non-residents of the
CMA by Gold Fields.
Under South African exchange control regulations, the ordinary shares and ADSs of Gold Fields are freely transferable outside
South Africa between persons who are not residents of the CMA. Additionally, where ordinary shares are sold on the JSE on behalf
of shareholders of Gold Fields who are not residents of the CMA, the proceeds of such sales will be freely exchangeable into foreign
currency and remitted to them.
Any share certificates held by non-resident Gold Fields shareholders will be endorsed with the words “non-resident”. The same
endorsement, however, will not be applicable to ADSs of Gold Fields held by non-resident shareholders.
Taxation
Certain South African tax considerations
The discussion in this section sets forth the material South African tax consequences of the purchase, ownership and disposition of
Gold Fields’ ordinary shares or ADSs under current South African law. Changes in the law may alter the tax treatment of Gold Fields’
ordinary shares or ADSs, possibly on a retroactive basis.
The following summary is not a comprehensive description of all of the tax considerations that may be relevant to a decision to
purchase, own or dispose of Gold Fields’ ordinary shares or ADSs and does not cover tax consequences that depend upon your
particular tax circumstances. In particular, the following summary addresses tax consequences for holders of ordinary shares or ADSs
who are not residents of, or who do not carry on business in, South Africa and who hold ordinary shares or ADSs as capital assets
(that is, for investment purposes). For the purposes of the income tax treaty between South Africa and the United States (the Treaty) and
South African tax law, a United States resident that owns Gold Fields ADSs will be treated as the owner of the Gold Fields ordinary
shares represented by such ADSs. Gold Fields recommends that you consult your own tax adviser about the consequences of holding
Gold Fields’ ordinary shares or ADSs, as applicable, in your particular situation.
A non-resident investor generally does not pay any South African taxes other than securities transfer tax when it purchases Gold Fields’
ordinary shares or ADSs. During the period that the non-resident investor owns the Gold Fields’ ordinary shares or ADSs the non-
resident investor may receive dividends. For information on the tax consequences of the receipt of dividends, see “—Additional
Information—Taxation—Certain South African Tax Considerations—Tax on Dividends”. Where the non-resident investor sells the Gold
Fields’ ordinary shares or ADSs then capital gains tax may be applicable. See “—Additional Information—Taxation—Certain South
African Tax Considerations—Capital Gains Tax” and “—Additional Information—Taxation—Certain South African Tax Considerations—
Securities Transfer Tax”.
Tax on dividends
A 20% dividends tax is levied on dividends declared by South African resident companies to non-resident shareholders or non-resident
ADS holders.
Generally, under the Treaty, the dividends tax is reduced to:
•5% of the gross amount of the dividends if the beneficial owner of the shares is a company holding directly at least 10% of the voting
stock of the South African resident company paying the dividends; and
•15% of the gross amount of the dividends in all other cases,
provided that the non-resident shareholder or non-resident ADS holder provides the South African resident company with certain tax
confirmations that it qualifies for the reduced rate of dividends tax.
The above reduced dividends tax rate provisions shall not apply if the beneficial owner of the dividends carries on business in South
Africa through a permanent establishment situated in South Africa or performs in South Africa independent personal services from a
fixed base situated in South Africa, and the dividends are attributable to such permanent establishment or fixed base. In such case, the
provisions of Article 7 (Business Profits) or Article 14 (Independent Personal Services) of the Treaty, as the case may be, shall apply.
Income tax
Non-residents are subject to income tax on any amounts received by or accrued to them from a source within South Africa.
Capital gains tax
Under South African domestic tax law, non-resident holders of ordinary shares or ADSs will not be subject to capital gains tax in South
Africa with respect to any capital gains derived from the disposal of those ordinary shares or ADSs. There are two exceptions to this
rule. The first is that the non-resident holders will be subject to capital gains tax if 80% or more of the market value of the ordinary
shares or ADSs relate to immovable property held in South Africa, but only if they, either alone or together with any connected persons
in relation to them, hold at least 20% of the equity shares of the company. Immovable property includes rights to variable or fixed
payments as consideration for the working of, or the right to work, mineral deposits, sources and other natural resources. The second
exception is if the ordinary shares or ADSs are effectively connected with the non-resident’s permanent establishment in South Africa.
A permanent establishment is generally a fixed place of business in South Africa through which the business of a non-South African
resident’s enterprise is wholly or partly carried on.
Securities transfer tax
No Securities Transfer Tax (STT) is payable in South Africa with respect to the issue of a security.
STT is charged at a rate of 0.25% on the taxable amount of the transfer of every security issued by a company or a close corporation
incorporated in South Africa, or a company incorporated outside South Africa but listed on an exchange in South Africa, subject to
certain exemptions.
The word “transfer” is broadly defined and includes the transfer, sale, assignment or cession or disposal in any other manner of a
security. The cancellation or redemption of a security is also regarded as a transfer unless the company is being liquidated. However,
the issue of a security that does not result in a change in beneficial ownership is not regarded as a transfer.
STT is levied on the taxable amount of a security. The taxable amount of a listed security is the greater of:
•the consideration for the security declared by the transferee; or
•the closing price of that security.
In the case of a transfer of a listed security, either the member or the participant or the person to whom the security is transferred is
liable for the tax. The tax must be paid within a period of 14 days from the end of the month during which the transfer is effected.
U.S. Federal income tax considerations
The following discussion summarises the material U.S. federal income tax consequences of the ownership and disposition of ordinary
shares and ADSs by a U.S. Holder. As used herein, the term “U.S. Holder” means a beneficial owner of ordinary shares or ADSs that is
for U.S. federal income tax purposes:
•a citizen or resident of the United States;
•a corporation created or organised under the laws of the United States, any state within the United States or the District of Columbia;
•an estate the income of which is subject to U.S. federal income tax without regard to its source; or
•a trust if a court within the United States is able to exercise primary supervision over the administration of the trust and one or more
U.S. persons have the authority to control all substantial decisions of the trust, or the trust has validly elected to be treated as a
domestic trust for U.S. federal income tax purposes.
This summary only applies to U.S. Holders that hold ordinary shares or ADSs as capital assets. This summary is based upon:
•the current federal income tax laws of the United States, including the Internal Revenue Code of 1986, as amended (the Code), its
legislative history, and existing and proposed regulations thereunder;
•current U.S. Internal Revenue Service (IRS) practice and applicable U.S. court decisions; and
•the income tax treaty between the United States and South Africa (the Treaty),
all as of the date hereof and all subject to change at any time, possibly with retroactive effect.
This summary assumes that the obligations of the Depositary under the Deposit Agreement and any related agreements will be
performed in accordance with their terms.
This summary is of a general nature and does not address all U.S. federal income tax consequences that may be relevant to you in light
of your particular situation (including consequences under the alternative minimum tax or the net investment income tax), and does not
address state, local, non-U.S. or other tax laws (such as estate and gift tax laws). For example, this summary does not apply to:
•investors that own (directly, indirectly or by attribution) 5% or more of Gold Fields’ stock by vote or value;
•financial institutions;
•insurance companies;
•individual retirement accounts and other tax-deferred accounts;
•tax-exempt organisations;
•dealers in securities or currencies;
•investors that hold ordinary shares or ADSs as part of straddles, hedging transactions or conversion transactions for U.S. federal
income tax purposes;
•investors whose functional currency is not the U.S. dollar;
•persons that have ceased to be U.S. citizens or lawful permanent residents of the United States;
•investors holding the ordinary shares or ADSs in connection with a trade or business conducted outside the United States; and
•U.S. citizens or lawful permanent residents living abroad.
The U.S. federal income tax treatment of a partner in an entity or arrangement treated as a partnership for U.S. federal income tax
purposes that holds ordinary shares or ADSs will depend upon the status of the partner and the activities of the partnership. If you are
an entity or arrangement treated as a partnership for U.S. federal income tax purposes, you should consult your tax adviser concerning
the U.S. federal income tax consequences to you and your partners of the acquisition, ownership and disposition of ordinary shares or
ADSs by you.
Gold Fields does not believe that it was a PFIC within the meaning of Section 1297 of the Code for its 2023 taxable year and does not
expect to be a PFIC for its current taxable year or in the foreseeable future. However, Gold Fields’ possible status as a PFIC must be
determined annually and, therefore, may be subject to change. If Gold Fields were to be treated as a PFIC, U.S. Holders of ordinary
shares or ADSs would be required (i) to pay a special U.S. addition to tax on certain distributions and gains on sale and (ii) to pay tax on
any gain from the sale of ordinary shares or ADSs at ordinary income (rather than capital gains) rates in addition to paying the special
addition to tax on this gain. Additionally, dividends paid by Gold Fields would not be eligible for the special reduced rate of tax for non-
corporate U.S. Holders described below under “—Additional Information—Taxation—U.S. Federal Income Tax Considerations—
Taxation of Dividends” and additional reporting requirements could apply. The remainder of this discussion assumes that Gold Fields is
not a PFIC for U.S. federal income tax purposes. You should consult your own tax advisers regarding the potential application of the
PFIC regime.
The summary of U.S. federal income tax consequences set out below is for general information only. You are urged to consult
your tax advisers as to the particular tax consequences to you of acquiring, owning and disposing of the ordinary shares or ADSs,
including your eligibility for the benefits of the income tax treaty between the United States and South Africa, the applicability and
effect of state, local, non-U.S. and other tax laws and possible changes in tax law.
U.S. holders of ADSs
For U.S. federal income tax purposes, a U.S. Holder of ADSs generally will be treated as the owner of the corresponding number of
underlying ordinary shares held by the Depositary for the ADSs, and references to ordinary shares in the following discussion refer also
to ADSs representing the ordinary shares.
Deposits and withdrawals of ordinary shares by U.S. Holders in exchange for ADSs will not result in the realisation of gain or loss for
U.S. federal income tax purposes. Your tax basis in withdrawn ordinary shares will be the same as your tax basis in the ADSs
surrendered, and your holding period for the ordinary shares will include the holding period of the ADSs.
Taxation of dividends
Distributions paid out of Gold Fields’ current or accumulated earnings and profits (as determined for U.S. federal income tax purposes),
before reduction for any South African withholding tax paid by Gold Fields with respect thereto, will generally be taxable to you as
foreign source dividend income, and will not be eligible for the dividends received deduction allowed to corporations. Distributions that
exceed Gold Fields’ current and accumulated earnings and profits will be treated as a non-taxable return of capital to the extent of your
basis in the ordinary shares and thereafter as capital gain. However, Gold Fields does not maintain calculations of its earnings and
profits in accordance with U.S. federal income tax accounting principles. You should therefore assume that any distribution by Gold
Fields with respect to the ordinary shares will be reported as ordinary dividend income. You should consult your own tax advisers with
respect to the appropriate U.S. federal income tax treatment of any distribution received from Gold Fields. For purposes of determining
limitations on any foreign tax credits, dividends paid by Gold Fields will generally constitute “passive income”.
Dividends paid by Gold Fields generally will be taxable to non-corporate U.S. Holders at the reduced rate normally applicable to long-
term capital gains, provided that either (i) Gold Fields qualifies for the benefits of the Treaty, or (ii) the ADSs are considered to be
“readily tradable” on the NYSE, and, in each case, certain other requirements are met.
For U.S. federal income tax purposes, the amount of any dividend paid in Rand will be included in income in a U.S. dollar amount
calculated by reference to the exchange rate in effect on the date the dividends are received by you (in the case of ordinary shares) or
the Depositary (in the case of ADSs) regardless of whether they are converted into U.S. dollars at that time. If you or the Depositary, as
the case may be, convert dividends received in Rand into U.S. dollars on the day they are received, you generally will not be required
to recognise foreign currency gain or loss in respect of this dividend income.
Effect of South African withholding taxes
As discussed in “—Additional Information—Taxation—Certain South African Tax Considerations—Tax on Dividends”, under current law,
South Africa imposes a withholding tax of 20% on dividends paid by Gold Fields. A U.S. Holder may be entitled, subject to certain
limitations, to a foreign tax credit against its U.S. federal income tax liability, or a deduction in computing its U.S. federal taxable income,
for South African income taxes withheld by Gold Fields (at a rate not exceeding any applicable Treaty rate). The rules governing foreign
tax credits are complex and recently issued final U.S. Treasury Regulations (Final FTC Regulations) have imposed additional
requirements that must be met for a foreign tax to be creditable and Gold Fields does not intend to determine whether such
requirements will be met in the case that non-U.S. taxes are withheld (if any). However, recent notices from the IRS (the Notices) indicate
that the U.S. Treasury and the IRS are considering proposing amendments to the Final FTC Regulations and allow taxpayers, subject to
certain conditions, to defer the application of many aspects of the Final FTC Regulations until the date when a notice or other guidance
withdrawing or modifying this temporary relief is issued (or any later date specified in such notice or other guidance).
U.S. Holders that receive payments subject to South African withholding tax will be treated, for U.S. federal income tax purposes, as
having received the amount of South African taxes withheld by Gold Fields, and as then having paid over the withheld taxes to the
South African taxing authorities. As a result of this rule, the amount of dividend income included in gross income for U.S. federal income
tax purposes by a U.S. Holder with respect to a payment of dividends may be greater than the amount of cash actually received (or
receivable) by the U.S. Holder from Gold Fields with respect to the payment.
The rules governing foreign tax credits are complex. You should consult your tax adviser concerning the applicability of the foreign tax
credit, deductibility and source of income rules to any South African tax withheld, including the impact of any applicable tax treaty.
Taxation of a sale or other disposition
Upon a sale or other disposition of ordinary shares or ADSs, other than an exchange of ADSs for ordinary shares and vice versa, you
will generally recognise capital gain or loss for U.S. federal income tax purposes equal to the difference between the amount realised
and your adjusted tax basis in the ordinary shares or ADSs, in each case as determined in U.S. dollars. This capital gain or loss will be
long-term capital gain or loss if your holding period in the ordinary shares or ADSs exceeds one year. However, regardless of your
actual holding period, any loss may be treated as long-term capital loss to the extent you receive a dividend that qualifies for the
reduced rate described above under “—Additional Information—Taxation—U.S. Federal Income Tax Considerations—Taxation of
Dividends” and also exceeds 10% of your basis in the ordinary shares. Any gain or loss will generally be U.S. source. You should consult
your tax adviser about how to account for proceeds received on the sale or other disposition of ordinary shares that are not paid in
U.S. dollars.
To the extent you incur Securities Transfer Tax in connection with a transfer or withdrawal of ordinary shares as described under “—
Additional Information—Taxation—Certain South African Tax Considerations—Securities Transfer Tax” above, such securities transfer
tax will not be a creditable tax for U.S. foreign tax credit purposes. You should consult your tax adviser regarding the proper U.S. federal
income tax treatment of any Securities Transfer Tax in your particular circumstances.
Backup withholding and information reporting
Payments of dividends and other proceeds with respect to ordinary shares or ADSs by U.S. persons will be reported to you and to the
IRS as may be required under applicable regulations. Backup withholding may apply to these payments if you fail to provide an
accurate taxpayer identification number or certification of exempt status or fail to report all interest and dividends required to be shown
on your U.S. federal income tax returns. Some holders are not subject to backup withholding. You should consult your tax adviser about
these rules and any other reporting obligations that may apply to the ownership and disposition of the ordinary shares, including
requirements relating to the holding of certain “specified foreign financial assets”.
Documents on display
Gold Fields files annual and special reports and other information with the SEC. You may read and copy any reports or other
information on file at the SEC’s public reference room at the following location:
•100 F Street, N.E. Washington, D.C. 20549
Please call the SEC at 1-800-SEC-0330 for further information on the public reference room. The SEC filings are also available to the
public through commercial document retrieval services. Gold Fields’ SEC filings may also be obtained electronically via the EDGAR
system on the website maintained by the SEC at http://www.sec.gov. Gold Fields’ website is http://www.goldfields.com.
Controls and procedures
a.Disclosure controls and procedures
Gold Fields has carried out an evaluation, under the supervision and with the participation of management, including the Chief
Executive Officer and Chief Financial Officer of Gold Fields, of the effectiveness of the design and operation of Gold Fields’ disclosure
controls and procedures (as defined in Exchange Act Rule 13a-15(e)) as of the end of the period covered by this annual report. Based
upon that evaluation, Gold Fields’ Chief Executive Officer and Chief Financial Officer concluded that, as of 31 December 2023,
Gold Fields’ disclosure controls and procedures were effective.
b.Management’s report on internal control over financial reporting
Gold Fields’ management is responsible for establishing and maintaining adequate internal control over financial reporting. The
Securities Exchange Act of 1934 defines internal control over financial reporting in Rule 13a-15(f) and 15d-15(f) as a process designed by,
or under the supervision of, the company’s principal executive and principal financial officers, and effected by the company’s board of
directors, management and other personnel, to provide reasonable assurance regarding the reliability of financial reporting and the
preparation of financial statements for external purposes in accordance with IFRS Accounting Standards as issued by the International
Accounting Standards Board (IASB), and includes those policies and procedures that:
•pertain to the maintenance of records that in reasonable detail accurately and fairly reflect the transactions and dispositions of the
assets of the company;
•provide reasonable assurance that transactions are recorded as necessary to permit preparation of financial statements in
accordance with IFRS Accounting Standards as issued by the International Accounting Standards Board (IASB), and that receipts and
expenditures of the company are being made only in accordance with authorisations of management and directors of the company;
and
•provide reasonable assurance regarding prevention or timely detection of unauthorised acquisition, use or disposition of the
company’s assets that could have a material effect on the consolidated financial statements.
Because of its inherent limitations, internal control over financial reporting may not prevent or detect misstatements. Also, projections of
any evaluation of effectiveness to future periods are subject to risk that controls may become inadequate because of changes in
conditions, or that the degree of compliance with the policies or procedures may deteriorate.
Gold Fields’ management assessed the effectiveness of its internal control over financial reporting as of 31 December 2023. In making
this assessment, Gold Fields’ management used the criteria established in Internal Control-Integrated Framework (2013) issued by the
Committee of Sponsoring Organisations of the Treadway Commission (COSO). Based upon its assessment, Gold Fields’ management
concluded that, as of 31 December 2023, its internal control over financial reporting is effective based upon those criteria.
c.Attestation report of the registered public accounting firm:
PricewaterhouseCoopers, Inc., an independent registered public accounting firm that audited the consolidated financial statements
included in this annual report on Form 20-F, has issued an attestation report on management’s assessment of Gold Fields’ internal
control over financial reporting as of 31 December 2023.
See “Annual Financial Report—Report of Independent Registered Public Accounting Firm”.
d.Changes in internal control over financial reporting
There has been no change in our internal control over financial reporting (as such term is defined in Rules 13a-15(f) and 15d-15(f) under
the Exchange Act) that occurred during fiscal 2023 that has materially affected, or is reasonably likely to materially affect, our internal
control over financial reporting.
Audit Committee financial expert
The Board of Directors has determined that Ms. Philisiwe Sibiya and Mr. Carel Smit are each an “audit committee financial expert”, as
defined in the rules promulgated by the Securities and Exchange Commission. The Board of Directors believes that the remaining
members of the Audit Committee also collectively possess the knowledge and experience to oversee and assess the performance of
Gold Fields’ management and auditors, the quality of Gold Fields’ disclosure controls, the preparation and evaluation of Gold Fields’
financial statements and Gold Fields’ financial reporting. Gold Fields’ Board of Directors also believes that the members of the Audit
Committee collectively possess the understanding of audit committee functions necessary to diligently execute their responsibilities.
For biographical information on each member of the Audit Committee, see “Governance and Remuneration Report—Our Board of
Directors” and “—Directors, Senior Management and Employees—Directors”.
Principal accounting fees and services
PricewaterhouseCoopers, Inc., Johannesburg, South Africa served as Gold Fields’ principal accountant for 2023, 2022 and 2021.
Set forth below are the fees for audit and other services for fiscal 2023, 2022 and 2021.
Audit fees include fees for audit services rendered for Gold Fields’ annual consolidated financial statements filed with regulatory
organisations.
Audit-related fees include fees for related services by the principal accountant that are reasonably related to the performance of the
audit or review of the registrant’s financial statements.
Tax fees include fees for tax compliance, tax advice, tax planning and other tax-related services.
All other fees consist of fees for all other services not included in any of the other categories noted above. All of the above fees were
pre-approved by the Audit Committee.
Audit Committee’s policies and procedures
In accordance with the Securities and Exchange Commission rules regarding auditor independence, the Audit Committee has
established Policies and Procedures for Audit and Non-Audit Services Provided by an Independent Auditor. The rules apply to
Gold Fields and its consolidated subsidiaries engaging any accounting firms for audit services and the auditor who audits the accounts
filed with the Securities and Exchange Commission, or the external auditor, for permissible non-audit services.
When engaging the external auditor for permissible non-audit services (audit-related services, tax services and all other services),
pre-approval is obtained prior to the commencement of the services.
Corporate Governance
Gold Fields’ home country corporate governance practices are regulated by, inter alia, the Companies Act 71 of 2008 (the South African
Companies Act), Listing Requirements of the JSE (the JSE Listing Requirements) and the King IV Code on Corporate Governance
(the King Code). Certain recommended practices in the King Code are incorporated into the JSE Listings Requirements, making it
mandatory for JSE-listed companies to comply with them. The following is a summary of the significant ways in which Gold Fields’ home
country corporate governance standards and its corporate governance practices differ from those followed by domestic companies
under the NYSE Listing Standards.
•The NYSE Listing Standards require that the non-management directors of U.S. listed companies meet at regularly scheduled
non-executive sessions without management. The JSE Listing Requirements do not require such meetings of listed company
non-executive directors. Gold Fields’ non-management directors do however meet regularly without management.
•The NYSE Listing Standards require U.S. listed companies to have a nominating/corporate governance committee composed entirely
of independent directors. The JSE Listing Requirements also require the appointment of such a committee and stipulate that the
majority of the members should be non-executive directors, the majority of whom must be independent. Gold Fields has a
Nominating and Governance Committee which currently comprises five non-executive directors, all of whom are independent
under the NYSE Listing Standards and the JSE Listing Requirements, which is chaired by the Chair of Gold Fields, as required by the
JSE Listing Requirements.
•The NYSE Listing Standards require U.S. listed companies to have a compensation committee composed entirely of independent
directors. The JSE Listing Requirements merely require the appointment of such a committee. Gold Fields has appointed a
Remuneration Committee, currently comprising four board members, all of whom are independent under both the JSE Listing
Requirements and the NYSE Listing Standards.
•The NYSE Listings Standards require U.S. listed companies to have an audit committee composed entirely of independent directors.
The South African Companies Act requires that the audit committee be approved by shareholders on an annual basis at a company’s
annual general meeting. The JSE Listings Requirements also require an audit committee must be composed entirely of independent
non-executive directors and must have a minimum of three members. Gold Fields has appointed an Audit Committee, currently
comprised of four board members, all of whom are non-executive and independent, as defined under both the JSE Listings
Requirements and the NYSE Listing Requirements.
•The South African Companies Act requires South African listed companies to have a Social and Ethics Committee. Gold Fields has
appointed a Social, Ethics and Transformation Committee, which is currently comprised of five directors, the majority of whom are
non-executive and independent, as defined under both the JSE Listings Requirements and the NYSE Listing Requirements.
Exhibits
The following instruments and documents are included as Exhibits to this annual report.
| | |
| | |
| | |
| | |
| | Deposit Agreement among Gold Fields, Gold Fields Limited (f/k/a/Driefontein Consolidated Limited), The Bank of New York, as depositary, and the owners and beneficial owners from time to time of American Depositary Receipts, dated as of 2 February 1998, as amended and restated as of 21 May 2002 (incorporated by reference to Exhibit 2.3 to the annual report on Form 20-F (File No. 1-31318), filed by Gold Fields with the Securities and Exchange Commission on 24 October 2002)(P) |
| | Form of American Depositary Receipt (included in Exhibit 2.2)(P) |
| | |
| | |
| | |
| | |
| | |
| | |
| | |
| | |
| | |
| | |
| | |
| | |
| | |
| | |
| | |
| | |
| | |
| | |
| | |
| | |
| | |
| | |
| | |
| | |
| | |
| | |
| | |
| | |
| | |
| | |
| | |
| | XBRL Taxonomy Extension Schema Linkbase Document |
| | XBRL Taxonomy Extension Calculation Linkbase Document |
| | XBRL Taxonomy Extension Definition Linkbase Document |
| | XBRL Taxonomy Extension Label Linkbase Document |
| | XBRL Taxonomy Extension Presentation Linkbase Document |
Signatures
The registrant hereby certifies that it meets all of the requirements for filing on Form 20-F and that it has duly caused and authorised the
undersigned to sign this annual report on its behalf.
Gold Fields Limited
|
|
|
Title: Chief Executive Officer |
|
Creating enduring value beyond mining